statistical analysis plan for embedding formative assessment
TRANSCRIPT
Statistical Analysis Plan for
Embedding Formative Assessment National Institute of Economic and Social Research Dr Stefan Speckesser
INTERVENTION Embedding Formative Assessment (EFA)
DEVELOPER Dylan Wiliam and SSAT
EVALUATOR National Institute of Economic And Social Research (NIESR)
TRIAL REGISTRATION
NUMBER
ISRCTN ISRCTN10973392, details available at https://www.isrctn.com/ISRCTN10973392.
TRIAL STATISTICIAN
Dr Matthew Bursnall
TRIAL CHIEF INVESTIGATOR
Dr Matthew Bursnall
SAP AUTHOR Dr Matthew Bursnall & Dr Stefan Speckesser
SAP VERSION 1.0
SAP VERSION DATE
30/01/2018
Background
Protocol and SAP changes
No changes made to date.
2
Table of contents
Protocol and SAP changes ..................................................................................................................... 1
Table of contents ..................................................................................................................................... 2
Introduction.............................................................................................................................................. 4
Study design ........................................................................................................................................... 5
Eligible population ............................................................................................................................... 5
Trial design .......................................................................................................................................... 6
Sample size ......................................................................................................................................... 6
Trial arms ............................................................................................................................................. 6
Number and timing of measurement points ........................................................................................ 7
Randomisation ........................................................................................................................................ 7
Unit of randomisation ........................................................................................................................... 7
Blocking/stratification ........................................................................................................................... 7
Number randomised to each arm ........................................................................................................ 8
Timing of randomisation relative to baseline testing ........................................................................... 8
Calculation of sample size ...................................................................................................................... 8
Initial sampling calculation ................................................................... Error! Bookmark not defined.
Over-recruitment .................................................................................. Error! Bookmark not defined.
Follow-up ................................................................................................................................................. 8
Outcome measures ................................................................................................................................. 9
Primary and Secondary outcomes ...................................................... Error! Bookmark not defined.
Primary outcome .............................................................................................................................. 9
Secondary outcomes ....................................................................................................................... 9
Baseline imbalances ........................................................................................................................ 9
Analysis ................................................................................................................................................. 10
Approach ............................................................................................. Error! Bookmark not defined.
Primary intention-to-treat (ITT) analysis ........................................................................................ 10
Model ............................................................................................... Error! Bookmark not defined.
Empirical specification ..................................................................... Error! Bookmark not defined.
Alternatives ...................................................................................... Error! Bookmark not defined.
Interim analyses ............................................................................................................................. 11
Imbalance at baseline for analysed groups ..................................... Error! Bookmark not defined.
Missing data ..................................................................................... Error! Bookmark not defined.
Non-compliance with intervention .................................................... Error! Bookmark not defined.
Secondary outcome analyses ........................................................................................................ 13
Additional analyses ........................................................................................................................ 13
Subgroup analyses ........................................................................................................................ 14
Effect size calculation .................................................................................................................... 15

3
List of variables included in the NPD request ................................................................................ 15
Report tables ......................................................................................................................................... 18

4
Introduction
There is evidence that feedback is effective in improving students' learning. However, existing evidence, as summarised in the EEF toolkit1), suggests that teachers find it hard to implement consistently and in ways that respond to students' individual learning barriers and needs. It is possible that feedback is sometimes effective in helping students to overcome specific learning barriers in the short term, but has little formative impact. A team, or whole school approach, appears to be a key component of successful feedback interventions and was included in this project through a workshop model. The “Embedding Formative Assessment” (EFA) project is a two-year whole school professional development programme on formative assessment, which includes a day’s training and materials to deliver 18 monthly internal workshops (“Teacher Learning Communities”) in schools, in which teachers reflect on the approaches taken to improve the effectiveness of the intervention. A formative assessment is when feedback to students prompts them to do something different as a result and implicitly it will encourage them to reflect on the mistake made so the learning is embedded and they are less likely to make similar mistake or face the same issues in future. The programme operated in the 2015/16 and 2016/17 academic years and will stretch into September 2017 to enable the schools to discuss their public examination results. The idea is that teachers can guide themselves through a pack of materials, to run a carefully structured series of workshops. The pack was developed by the schools, students and teachers network (SSAT) with Dylan Wiliam2 For schools randomly allocated to the intervention group, Dylan Wiliam introduced the concept at a launch event attended by school-nominated “Lead Teachers”. These lead teachers then supported colleagues to run a series of structured workshops (Teacher Learning Communities) throughout a two year period. Support from SSAT was also available.
Aims and Objectives
Project Hypothesis Use by schools of the "Embedding Formative Assessment", a pack that promotes a systematic approach to developing high quality feedback through continuing professional development, will improve children's performance in academic tests at age 16. Primary Research Question How effective are the embedding formative assessment materials compared to usual feedback methods in terms of improving overall GCSE examination performance. Secondary Research Question How effective are the embedding formative assessment materials compared to usual feedback methods in terms of improving examination performance in Maths and English GCSEs, i.e. subjects which are of high importance in terms of progression to employment.
1 https://educationendowmentfoundation.org.uk/resources/teaching-learning-toolkit/feedback/
2 The schools, students and teacher’s Network, and Whole School Embedding Formative Assessment Resource:
https://www.ssatuk.co.uk/cpd/teaching-and-learning/embedding-formative-assessment/
5
Study design
Eligible population
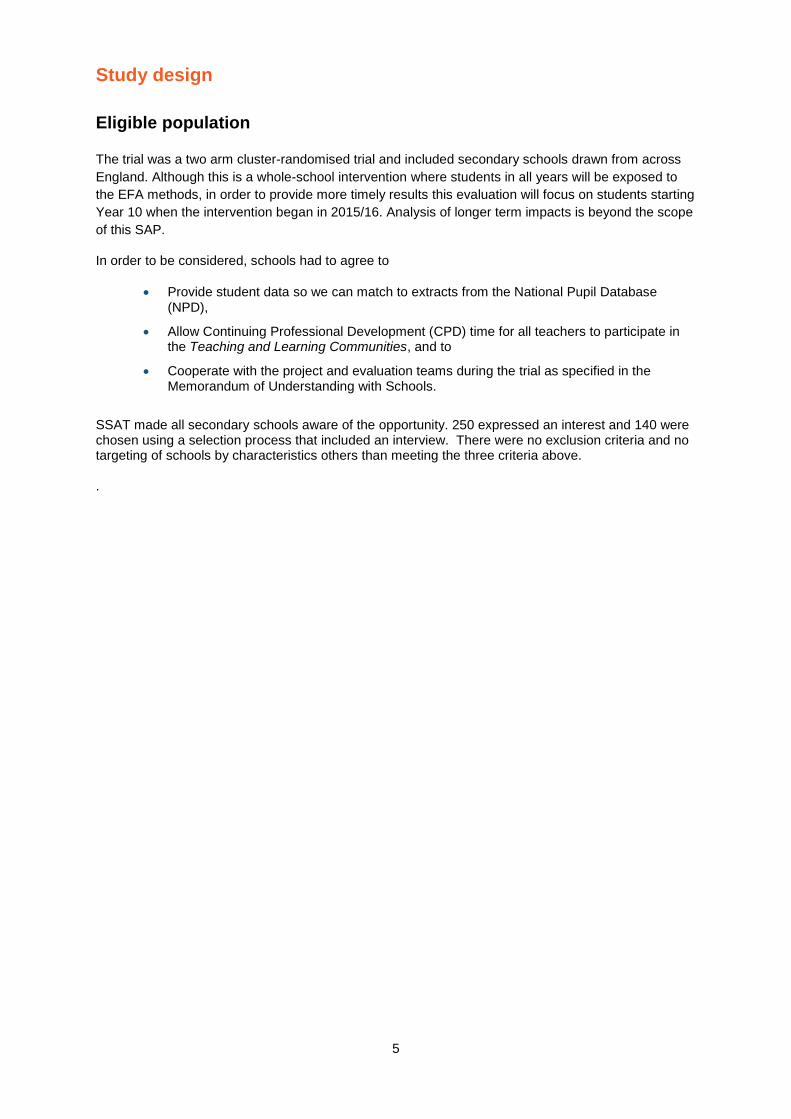
The trial was a two arm cluster-randomised trial and included secondary schools drawn from across
England. Although this is a whole-school intervention where students in all years will be exposed to
the EFA methods, in order to provide more timely results this evaluation will focus on students starting
Year 10 when the intervention began in 2015/16. Analysis of longer term impacts is beyond the scope
of this SAP.
In order to be considered, schools had to agree to
Provide student data so we can match to extracts from the National Pupil Database (NPD),
Allow Continuing Professional Development (CPD) time for all teachers to participate in the Teaching and Learning Communities, and to
Cooperate with the project and evaluation teams during the trial as specified in the Memorandum of Understanding with Schools.
SSAT made all secondary schools aware of the opportunity. 250 expressed an interest and 140 were chosen using a selection process that included an interview. There were no exclusion criteria and no targeting of schools by characteristics others than meeting the three criteria above. .

6
Trial design
Randomisation took place at the school level. Schools participating in the trial were randomly
assigned to either
the intervention group, which received the EFA pack, one day’s training from Dylan Wiliam
(the programme developer) at the launch event, and ongoing support by SSAT or
a control group, which received a one-off payment of £300, the cost of purchasing the EFA
pack from SSAT.
Sample size
A sample size of 120 schools with equal allocation between treatment and control was recommended
by NIESR (see initial sample size calculation section below). A progress report during the second
term of the trial (February 2016 suggests that the total number of schools in the trial increased to
140 following initial over-recruiting. The total number of students affected by the intervention is
currently not known from the quantitative sources available to NIESR.
Trial arms
School level randomisation in two arms (intervention and control groups):
Intervention group: Purchased EFA pack (£300) and received a two-year professional development
programme on formative assessment with SSAT support. This includes a day’s training for a school-
nominated Lead Teacher and a pack of materials. Schools then set up “Teacher Learning
Communities” (TLCs) that operated during the 2015/16 and 2016/17 academic years. TLCs met on a
monthly basis to discuss and refine how they were using the materials in class. Key elements of the
intervention are summarised in the table below at 4 levels, (processes, teachers, students and
overall) and some example techniques are provided below the table. This approach to peer learning is
not new but the extent to which is had been adopted by schools has varied and the EFA programme
aimed to build on previous successes with the approach or, begin to embed the approach in schools
and teachers within schools, who had not actively engaged with the techniques previously.
Process - Monthly TLCs include: promising colleagues will try a technique, feedback on technique used in class since previous meeting, new FA content introduced an discussed - Schools provide feedback to SSAT including any issues encountered and further
advise provided by SSAT
Teachers - Teachers give opportunities for students to take ownership of their learning - Teachers activate students as instructional resources for each other
Students - Students support each other and are more engaged - students take more responsibility for their own learning
Overall - Responsibility for learning shared between teacher and students, students learn more
Example Techniques
Instead of marking each spelling or grammar mistake put a mark in the margin then students
encouraged to find their own mistakes and correct them
Mark students work in relation to their most recent marks (+ if it is better, = if of equal quality
and – if not as good)
Give anonymous feedback and encourage groups of around 4 students to decide which
feedback relates to which piece of work

7
Control group: receives a one-off payment of £300 at the start of the trial (September 2015/16), the
cost of purchasing the EFA pack from SSAT.
Number and timing of measurement points
Table 1 below, summarises the data collection schedule in the context of the project milestones.
Table 1 – Project milestones and data collection schedule
Date Milestone /
Data
Details
Spring 2015 Milestone Recruitment of participating schools
July 2015 Data Names of Participating schools provided to NIESR by SSAT, including school URN
September 2015
Milestone Start of school year and beginning of trial
December 2015
Data Tier 2 NPD extract provided to NIESR by DFE. This included GCSE results for the 14/15 cohort (pre-intervention); KS2 scores and eligibility for free school meals. Used to estimate sample size
January 2016 Milestone Analysis to confirm no systematic bias in the randomisation
September 2015 – July 2017
Data SSAT monitoring data of which schools dropped out and which schools received the related TEEP3 intervention.
July 2017 Milestone End of 2 year trial period
Expected - November 2017
Data Tier 2 NPD National Pupil Database administrative data provided to NIESR by DFE, including KS4 achievement and student and school characteristics (for groups taking GCSE’s in 2015/16 and 2016/17).
January 2018 Milestone Draft Evaluation report provided to EEF by NIESR
Randomisation
Unit of randomisation
Secondary schools, which were recruited by SSAT (N=140) were randomly assigned to intervention
and control groups using econometric software (Stata) within blocks (see below).
Blocking/stratification
Schools were identified as belonging to blocks based on the proportion of students in each school to
achieve 5 A*-C grades in the 2014 GCSE examinations (low, medium, high – where these thresholds
are chosen to achieve equal sized groups), and the proportion of students in each school to be
eligible for Free School Meals (FSM, low, medium, high) using DfE sources; again thresholds were
chosen to achieve equal sized groups4.
3 Teacher Effectiveness Enhancement Programme (TEEP) https://www.ssatuk.co.uk/cpd/teaching-and-learning/teep/ 4 Because of correlation between FSM and GCSE performance, a block with fewer than 6 schools would have been combined with the block with the same level of students achieving 5 A*-C at GCSE, but a higher proportion of FSM students (unless it is the high FSM block, in which case it would be combined with the medium block instead). However, this was not implemented in practice as all blocks were sufficiently populated.
8
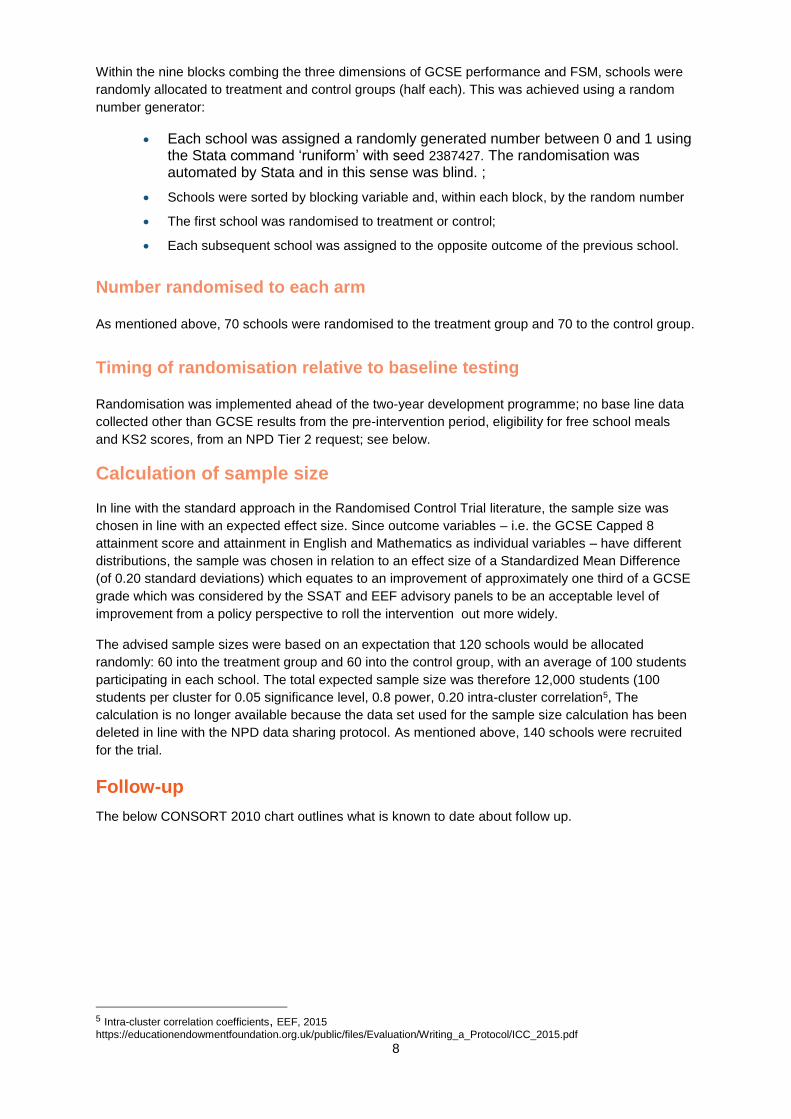
Within the nine blocks combing the three dimensions of GCSE performance and FSM, schools were
randomly allocated to treatment and control groups (half each). This was achieved using a random
number generator:
Each school was assigned a randomly generated number between 0 and 1 using the Stata command ‘runiform’ with seed 2387427. The randomisation was automated by Stata and in this sense was blind. ;
Schools were sorted by blocking variable and, within each block, by the random number
The first school was randomised to treatment or control;
Each subsequent school was assigned to the opposite outcome of the previous school.
Number randomised to each arm
As mentioned above, 70 schools were randomised to the treatment group and 70 to the control group.
Timing of randomisation relative to baseline testing
Randomisation was implemented ahead of the two-year development programme; no base line data
collected other than GCSE results from the pre-intervention period, eligibility for free school meals
and KS2 scores, from an NPD Tier 2 request; see below.
Calculation of sample size
In line with the standard approach in the Randomised Control Trial literature, the sample size was
chosen in line with an expected effect size. Since outcome variables – i.e. the GCSE Capped 8
attainment score and attainment in English and Mathematics as individual variables – have different
distributions, the sample was chosen in relation to an effect size of a Standardized Mean Difference
(of 0.20 standard deviations) which equates to an improvement of approximately one third of a GCSE
grade which was considered by the SSAT and EEF advisory panels to be an acceptable level of
improvement from a policy perspective to roll the intervention out more widely.
The advised sample sizes were based on an expectation that 120 schools would be allocated
randomly: 60 into the treatment group and 60 into the control group, with an average of 100 students
participating in each school. The total expected sample size was therefore 12,000 students (100
students per cluster for 0.05 significance level, 0.8 power, 0.20 intra-cluster correlation5, The
calculation is no longer available because the data set used for the sample size calculation has been
deleted in line with the NPD data sharing protocol. As mentioned above, 140 schools were recruited
for the trial.
Follow-up
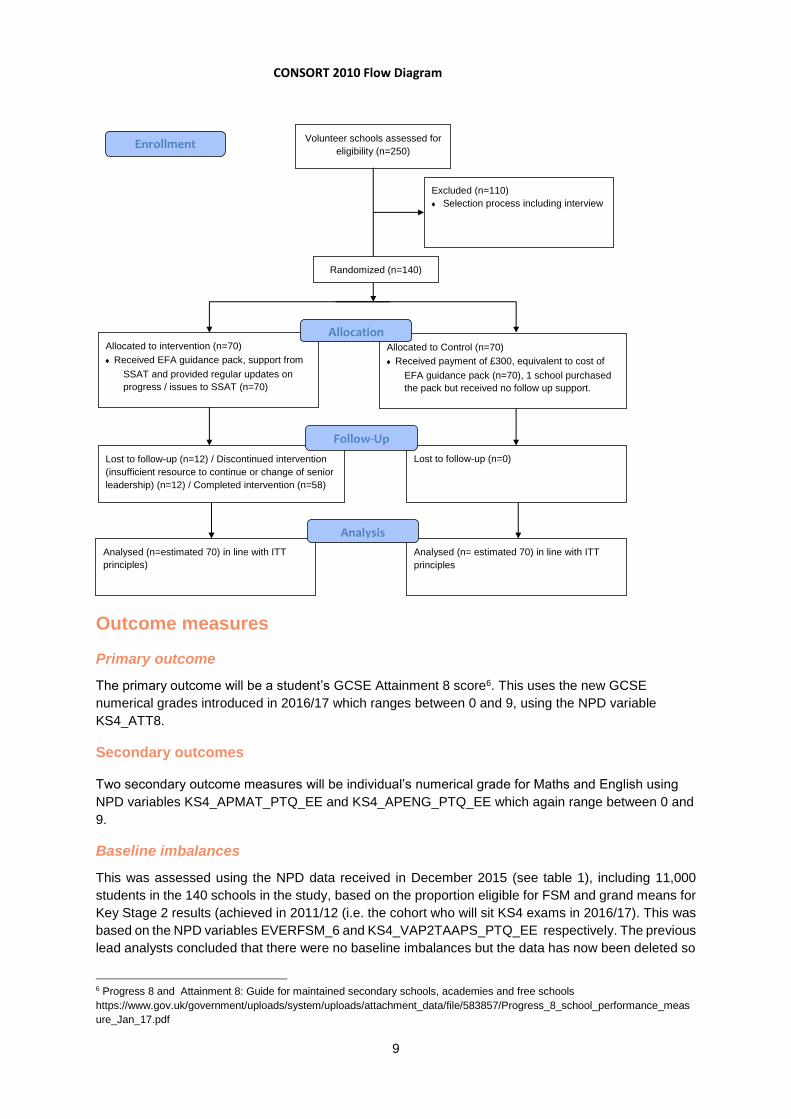
The below CONSORT 2010 chart outlines what is known to date about follow up.
5 Intra-cluster correlation coefficients, EEF, 2015 https://educationendowmentfoundation.org.uk/public/files/Evaluation/Writing_a_Protocol/ICC_2015.pdf
9
Outcome measures
Primary outcome
The primary outcome will be a student’s GCSE Attainment 8 score6. This uses the new GCSE
numerical grades introduced in 2016/17 which ranges between 0 and 9, using the NPD variable
KS4_ATT8.
Secondary outcomes
Two secondary outcome measures will be individual’s numerical grade for Maths and English using
NPD variables KS4_APMAT_PTQ_EE and KS4_APENG_PTQ_EE which again range between 0 and
9.
Baseline imbalances
This was assessed using the NPD data received in December 2015 (see table 1), including 11,000
students in the 140 schools in the study, based on the proportion eligible for FSM and grand means for
Key Stage 2 results (achieved in 2011/12 (i.e. the cohort who will sit KS4 exams in 2016/17). This was
based on the NPD variables EVERFSM_6 and KS4_VAP2TAAPS_PTQ_EE respectively. The previous
lead analysts concluded that there were no baseline imbalances but the data has now been deleted so
6 Progress 8 and Attainment 8: Guide for maintained secondary schools, academies and free schools
https://www.gov.uk/government/uploads/system/uploads/attachment_data/file/583857/Progress_8_school_performance_meas
ure_Jan_17.pdf
CONSORT 2010 Flow Diagram
Volunteer schools assessed for
eligibility (n=250)
Excluded (n=110)
Selection process including interview
Analysed (n=estimated 70) in line with ITT
principles)
Lost to follow-up (n=12) / Discontinued intervention
(insufficient resource to continue or change of senior
leadership) (n=12) / Completed intervention (n=58)
Allocated to intervention (n=70)
Received EFA guidance pack, support from
SSAT and provided regular updates on
progress / issues to SSAT (n=70)
Lost to follow-up (n=0)
Allocated to Control (n=70)
Received payment of £300, equivalent to cost of
EFA guidance pack (n=70), 1 school purchased
the pack but received no follow up support.
Analysed (n= estimated 70) in line with ITT
principles
Allocation
Analysis
Follow-Up
Randomized (n=140)
Enrollment

10
the effect size cannot be reported in the SAP. However effect sizes will be reported for both variables
in the final report.
Analysis
Primary intention-to-treat (ITT) analysis
The two types of schools included in the trial are: a) intervention schools that deliver EFA b) control schools
The estimated impact will be based on the difference in KS4 scores between a) and b) for all schools where data is available, regardless of drop out, but only those schools and pupils who consented to be included. This is in order to estimate the “intention to treat” (ITT) effect. Analysis will be conducted in Stata. In line with the latest EEF guidance, two models will be fitted:
‘Simplest model’: including prior attainment and allocation dummy as fixed covariates, and school as a random effect.
‘Precise model’: including prior attainment, the allocation dummy and indicator variables specifying membership of the randomisation blocks (all fixed effects) and schools as a random effect
Grand and group means will also be reported as exploratory data analysis and the impact of
KS2 scores will be reported as an effect size. In the analysis below, KS4 score will be
standardised using the approach outlined under effect size on page 14. The centring will be
around the (treatment) group means but not around individual school means because we are interested
in the intercept for the treatment but not the separate intercepts for the schools.
Model equation:
𝑦 = 𝑋𝛽 + 𝑍µ + 𝜖
Where:
y=𝛽X + +Z +𝜀
y = vector of outcome scores [KS4]
X = covariate matrix [KS2 scores in ‘simplest’ model and this plus dummies for stratification groups in
the ‘precise’ model)
Z = design matrix identifying which school (or cluster) an individual attended.
= vector of school random effects
β, = fixed effect parameters
εij = residual error term for j-th member of cluster (school) i
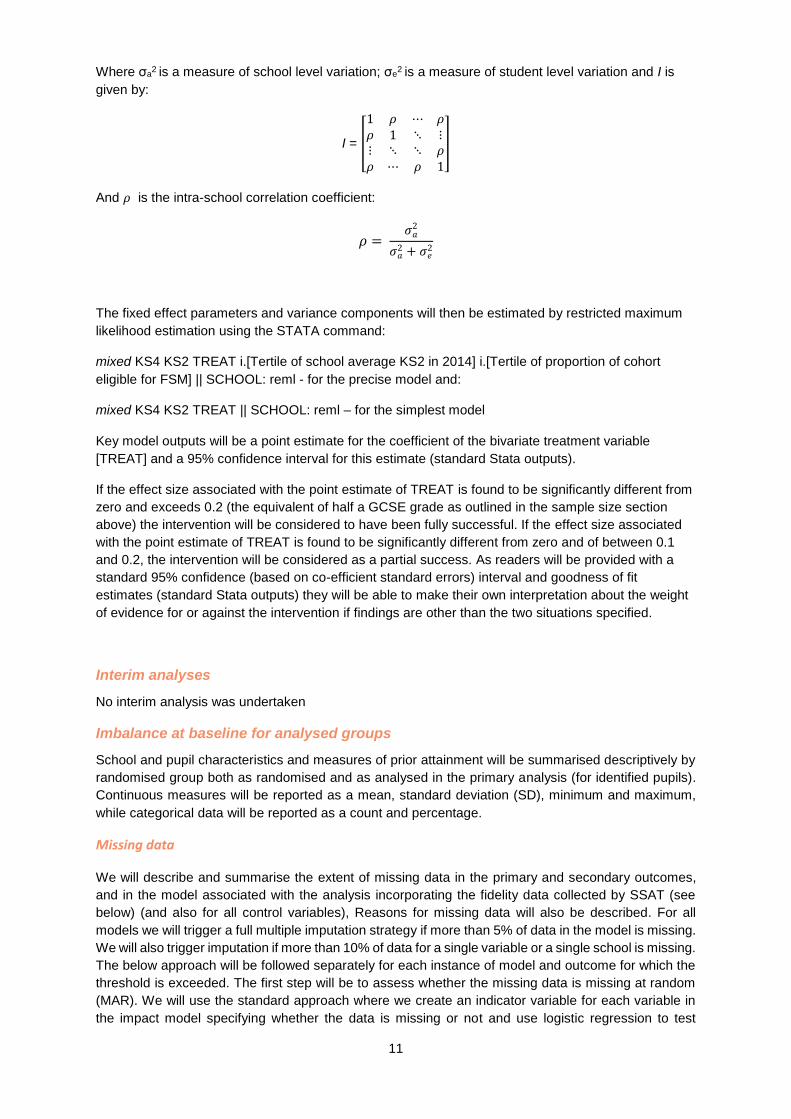
with the covariance structure given by ∑, where:
∑= (σa2 + σe2)[
𝐼 ⋯ 0⋮ ⋱ ⋮0 ⋯ 𝐼
]
11
Where σa2 is a measure of school level variation; σe
2 is a measure of student level variation and I is
given by:
I = [
1 𝜌 ⋯ 𝜌𝜌 1 ⋱ ⋮⋮ ⋱ ⋱ 𝜌𝜌 ⋯ 𝜌 1
]
And 𝜌 is the intra-school correlation coefficient:
𝜌 = 𝜎𝑎
2
𝜎𝑎2 + 𝜎𝑒
2
The fixed effect parameters and variance components will then be estimated by restricted maximum
likelihood estimation using the STATA command:
mixed KS4 KS2 TREAT i.[Tertile of school average KS2 in 2014] i.[Tertile of proportion of cohort
eligible for FSM] || SCHOOL: reml - for the precise model and:
mixed KS4 KS2 TREAT || SCHOOL: reml – for the simplest model
Key model outputs will be a point estimate for the coefficient of the bivariate treatment variable
[TREAT] and a 95% confidence interval for this estimate (standard Stata outputs).
If the effect size associated with the point estimate of TREAT is found to be significantly different from
zero and exceeds 0.2 (the equivalent of half a GCSE grade as outlined in the sample size section
above) the intervention will be considered to have been fully successful. If the effect size associated
with the point estimate of TREAT is found to be significantly different from zero and of between 0.1
and 0.2, the intervention will be considered as a partial success. As readers will be provided with a
standard 95% confidence (based on co-efficient standard errors) interval and goodness of fit
estimates (standard Stata outputs) they will be able to make their own interpretation about the weight
of evidence for or against the intervention if findings are other than the two situations specified.
Interim analyses
No interim analysis was undertaken
Imbalance at baseline for analysed groups
School and pupil characteristics and measures of prior attainment will be summarised descriptively by
randomised group both as randomised and as analysed in the primary analysis (for identified pupils).
Continuous measures will be reported as a mean, standard deviation (SD), minimum and maximum,
while categorical data will be reported as a count and percentage.
Missing data
We will describe and summarise the extent of missing data in the primary and secondary outcomes,
and in the model associated with the analysis incorporating the fidelity data collected by SSAT (see
below) (and also for all control variables), Reasons for missing data will also be described. For all
models we will trigger a full multiple imputation strategy if more than 5% of data in the model is missing.
We will also trigger imputation if more than 10% of data for a single variable or a single school is missing.
The below approach will be followed separately for each instance of model and outcome for which the
threshold is exceeded. The first step will be to assess whether the missing data is missing at random
(MAR). We will use the standard approach where we create an indicator variable for each variable in
the impact model specifying whether the data is missing or not and use logistic regression to test

12
whether the missing status can be predicted from the following variables: all variables in the precise
model plus school average KS2 and eligibility for FSM (continuous variable as opposed tertiles), gender
and ethnicity. Where predictability is confirmed we will proceed with MI. Where the missing-ness cannot
be predicted, we will assume the data is either ‘Missing Completely at Random’ (MCAR) or ‘Missing
Not at Random’ (MNAR). In the first case we are unable to observe data related to randomness and MI
is not feasible. In the second case the only approach would be to adopt a structural modelling approach
which we would not adopt because this would deviate from the principles of transparent reporting as
findings would be assumption rather than data driven.
For the models which meet the thresholds above and for which the MAR assumption holds we will use
all variables in the precise model plus those mentioned above and adopt an MI strategy using a fully
conditional specification, implemented using STATA MI to create 20 imputed data sets. We will re-
estimate the treatment effect using each dataset and take the average and estimate standard error
using Rubin combination rules.
We will base confirmation of the effectiveness of the treatment on complete data points only but assess
the sensitivity of the estimate to missing-ness using the imputed estimates.
If the complete data only model confirms effectiveness but the imputed estimate does not we must
assume that the missing data is missing not as a random to such an extent as to invalidate our
conclusion of effectiveness.
13
Treatment effects in the presence of non-compliance
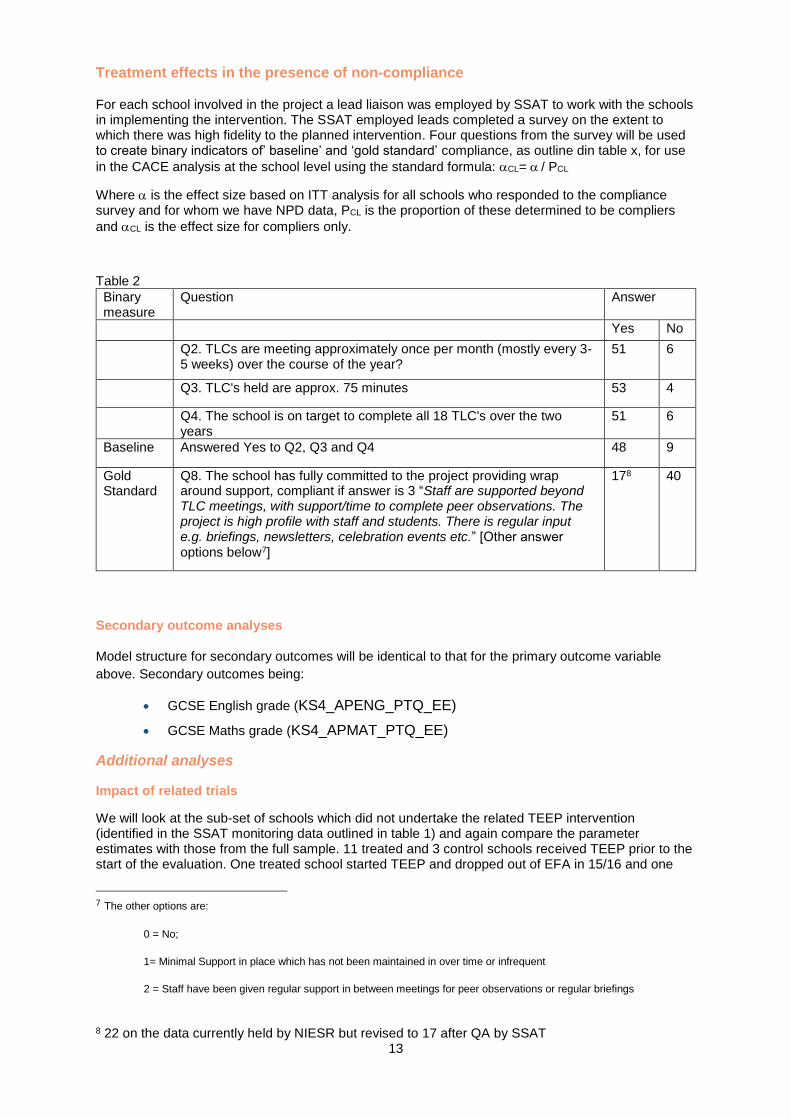
For each school involved in the project a lead liaison was employed by SSAT to work with the schools in implementing the intervention. The SSAT employed leads completed a survey on the extent to which there was high fidelity to the planned intervention. Four questions from the survey will be used to create binary indicators of’ baseline’ and ‘gold standard’ compliance, as outline din table x, for use
in the CACE analysis at the school level using the standard formula: CL= / PCL
Where is the effect size based on ITT analysis for all schools who responded to the compliance survey and for whom we have NPD data, PCL is the proportion of these determined to be compliers
and CL is the effect size for compliers only.
Table 2
Binary measure
Question Answer
Yes No
Q2. TLCs are meeting approximately once per month (mostly every 3-5 weeks) over the course of the year?
51 6
Q3. TLC's held are approx. 75 minutes 53 4
Q4. The school is on target to complete all 18 TLC's over the two years
51 6
Baseline Answered Yes to Q2, Q3 and Q4 48 9
Gold Standard
Q8. The school has fully committed to the project providing wrap around support, compliant if answer is 3 “Staff are supported beyond TLC meetings, with support/time to complete peer observations. The project is high profile with staff and students. There is regular input e.g. briefings, newsletters, celebration events etc.” [Other answer options below7]
178 40
Secondary outcome analyses
Model structure for secondary outcomes will be identical to that for the primary outcome variable
above. Secondary outcomes being:
GCSE English grade (KS4_APENG_PTQ_EE)
GCSE Maths grade (KS4_APMAT_PTQ_EE)
Additional analyses
Impact of related trials
We will look at the sub-set of schools which did not undertake the related TEEP intervention (identified in the SSAT monitoring data outlined in table 1) and again compare the parameter estimates with those from the full sample. 11 treated and 3 control schools received TEEP prior to the start of the evaluation. One treated school started TEEP and dropped out of EFA in 15/16 and one
7 The other options are:
0 = No;
1= Minimal Support in place which has not been maintained in over time or infrequent
2 = Staff have been given regular support in between meetings for peer observations or regular briefings
8 22 on the data currently held by NIESR but revised to 17 after QA by SSAT

14
control school started TEEP in 16/17. We would expect the parameter estimates of impact to be lower for this sub-group analysis because exposure to TEEP is un-balanced (greater in the treatment group) and evidence9 on formative assessment suggests a long lead time between embedding FA techniques and them realising their full benefits.
Subgroup analyses
Estimates will look into differential effects of three subgroups – based on the appropriate sub-samples
of the data rather than additional variables, defined by student characteristics:
Students who have ever received free school meals [NPD variable EVERFSM_6];
Student with low attainment scores in Key Stage 2 attainment tests (bottom third as used for the randomisation) [NPD variable KS4_VAP2TAAPS] ;
Student with high attainment scores in Key Stage 2 attainment tests (top third as used for the randomisation) [NPD variable KS4_VAP2TAAPS] .
In addition, we will undertake two separate subgroup analyses incorporating the measures of
compliance described in the non-compliance with intervention section above.
9 The schools, students and teacher’s Network, and Whole School Embedding Formative Assessment Resource:
https://www.ssatuk.co.uk/cpd/teaching-and-learning/embedding-formative-assessment/
15
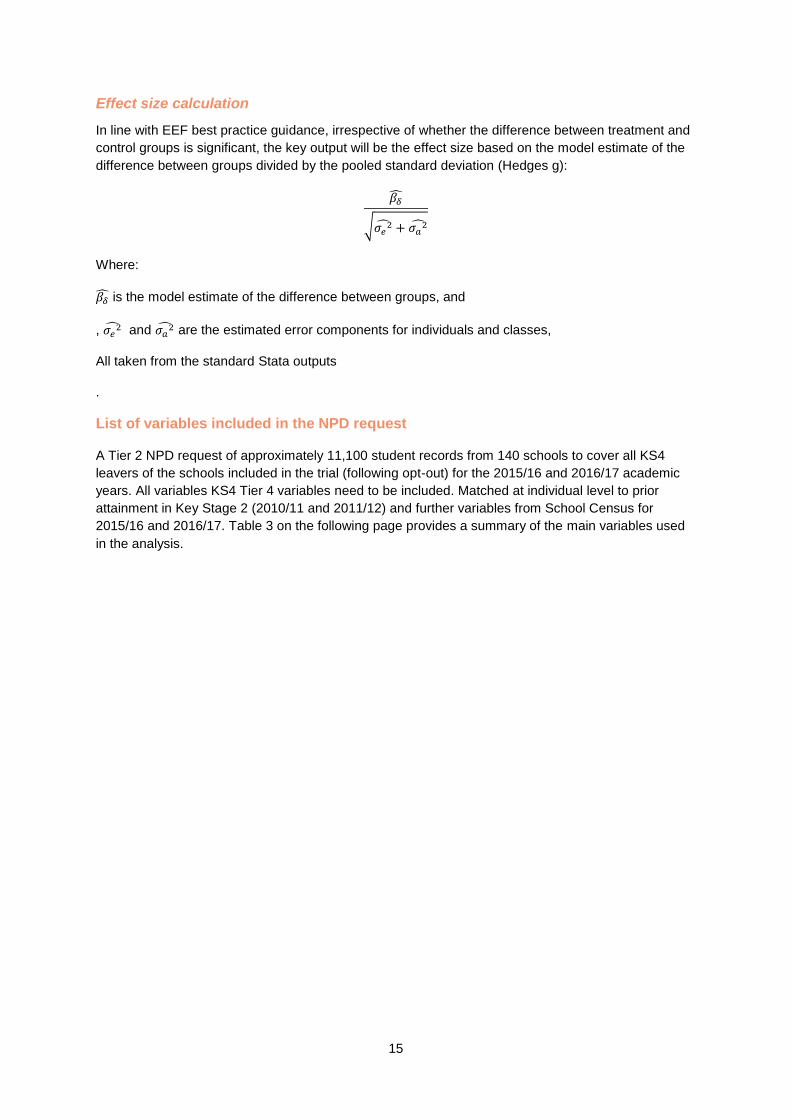
Effect size calculation
In line with EEF best practice guidance, irrespective of whether the difference between treatment and
control groups is significant, the key output will be the effect size based on the model estimate of the
difference between groups divided by the pooled standard deviation (Hedges g):
𝛽�̂�
√𝜎𝑒2̂ + 𝜎𝑎
2̂
Where:
𝛽�̂� is the model estimate of the difference between groups, and
, 𝜎𝑒2̂ and 𝜎𝑎
2̂ are the estimated error components for individuals and classes,
All taken from the standard Stata outputs
.
List of variables included in the NPD request
A Tier 2 NPD request of approximately 11,100 student records from 140 schools to cover all KS4
leavers of the schools included in the trial (following opt-out) for the 2015/16 and 2016/17 academic
years. All variables KS4 Tier 4 variables need to be included. Matched at individual level to prior
attainment in Key Stage 2 (2010/11 and 2011/12) and further variables from School Census for
2015/16 and 2016/17. Table 3 on the following page provides a summary of the main variables used
in the analysis.
Statistical Analysis Plan for
Embedding Formative Assessment National Institute of Economic and Social Research Dr Stefan Speckesser
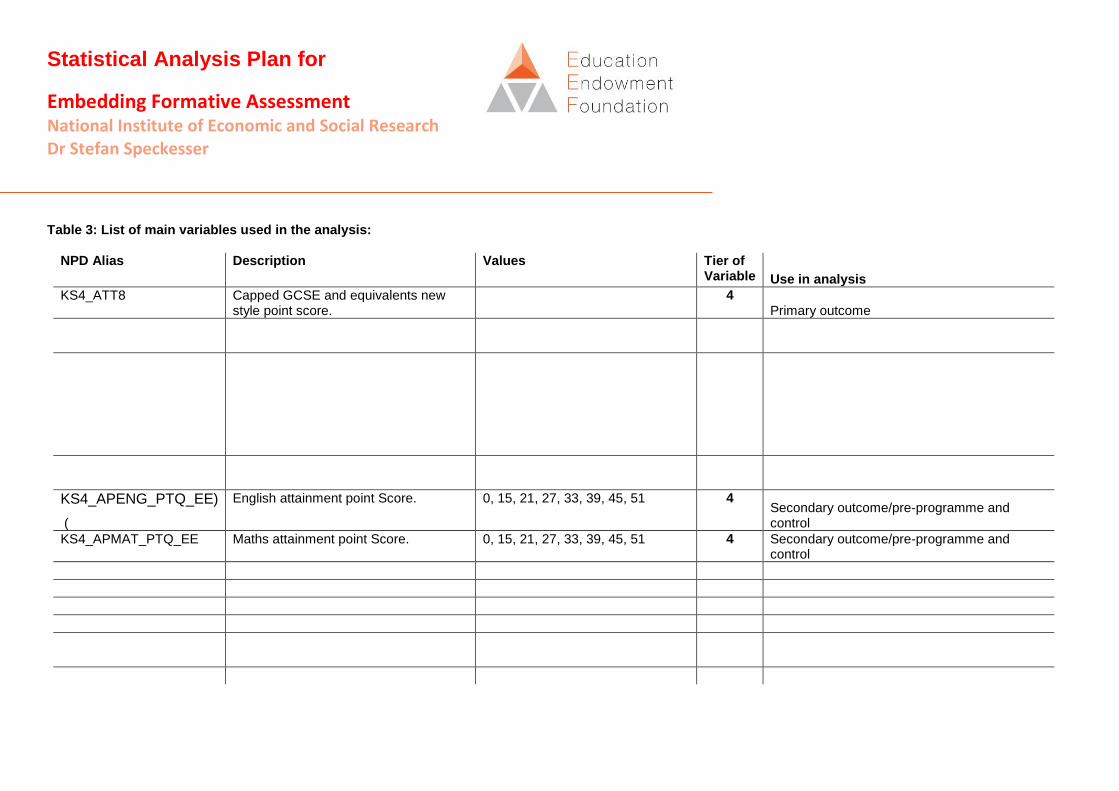
Table 3: List of main variables used in the analysis:
NPD Alias Description Values Tier of Variable Use in analysis
KS4_ATT8 Capped GCSE and equivalents new style point score.
4 Primary outcome
KS4_APENG_PTQ_EE)
(
English attainment point Score. 0, 15, 21, 27, 33, 39, 45, 51 4 Secondary outcome/pre-programme and control
KS4_APMAT_PTQ_EE Maths attainment point Score. 0, 15, 21, 27, 33, 39, 45, 51 4 Secondary outcome/pre-programme and control

17
EVERFSM_6 The student has either been eligible for free school meals at some point in the last 6 years
1 = True 0 = False
2
Control variable Level 1

Statistical Analysis Plan for
Embedding Formative Assessment National Institute of Economic and Social Research Dr Stefan Speckesser
Report tables
We will follow the EEF trial report template10 when reporting the findings from this study.
10 https://educationendowmentfoundation.org.uk/evaluation/resources-centre/writing-a-research-report/