statistical analysis and modeling of ovarian and breast cancer
TRANSCRIPT

University of South FloridaScholar Commons
Graduate Theses and Dissertations Graduate School
September 2017
Statistical Analysis and Modeling of Ovarian andBreast CancerMuditha V. Devamitta PereraUniversity of South Florida, [email protected]
Follow this and additional works at: https://scholarcommons.usf.edu/etd
Part of the Statistics and Probability Commons
This Dissertation is brought to you for free and open access by the Graduate School at Scholar Commons. It has been accepted for inclusion inGraduate Theses and Dissertations by an authorized administrator of Scholar Commons. For more information, please [email protected].
Scholar Commons CitationDevamitta Perera, Muditha V., "Statistical Analysis and Modeling of Ovarian and Breast Cancer" (2017). Graduate Theses andDissertations.https://scholarcommons.usf.edu/etd/7395

Statistical Analysis and Modeling of Ovarian and Breast Cancer
by
Muditha V. Devamitta Perera
A dissertation submitted in partial fulfilment
of the requirements for the degree of
Doctor of Philosophy
with a concentration in Statistics
Department of Mathematics and Statistics
College of Arts and Sciences
University of South Florida
Major Professor: Chris P. Tsokos, Ph.D.
Kandethody M. Ramachandran, Ph.D.
Getachew Dagne, Ph.D.
Lu Lu, Ph.D.
Date of Approval:
September 15, 2017
Keywords: Cox regression model, parametric analysis, racial disparities, survival analysis
Copyright © 2017, Muditha V. Devamitta Perera

DEDICATION
To my mother.

ACKNOWLEDGEMENT
I am truely grateful to my major advisor Dr. Chris Tsokos for the continuous support
throughout my Ph.D research. His suggestions, patience and knowledge was invaluable
throughout . Guidance and support given by Dr.Tsokos helped me to improve my professional
and academic skills.
My sincere gratitude goes to Dr. Kandethody Ramachandran, Dr. Getachew Dagne and
Dr.Lu Lu for being in my supervisory committee of the Ph.D. research and for being very
supportive and very kind throughout my Ph.D. program.
I would like to extend my appreciation for the internship opportunity from the Biostatistics and
Bioinformatics Core at Moffitt Cancer Center, Tampa, FL and the valuable suggestions and
support provided by Dr. Michael Schell.
I am thankful to all the faculty and staff members in the department of Mathematics and
Statistics for their assistance during my time at the USF. Finally, my gratitude goes to my
parents, sister, brother and my husband for always believing and supporting me.

i
TABLE OF CONTENTS
List of Figures ................................................................................................................................ iii
List of Tables ................................................................................................................................. vi
Abstract ........................................................................................................................................ viii
Chapter1 Introduction ......................................................................................................................1
1.1 What is Cancer? .............................................................................................................1
1.2 Ovarian Cancer ..............................................................................................................1
1.3 Breast Cancer .................................................................................................................3
1.4 Survival Analysis ...........................................................................................................4
1.4.1 Product-Limit Estimator of Survival Function ...............................................6
1.4.2 Cox Proportional Hazards Model ...................................................................6
1.4.3 Assessing the Adequacy of Cox PH model ....................................................8
1.4.3.1 Overall Model Adequacy ...............................................................10
1.4.3.2 Assessing the Unusual and Influential Data Values ......................11
1.4.3.3. Checking the Functional Form of the Continuous Covariates ......11
1.4.3.4 Testing the Proportional Hazards Assumption ..............................12
1.5 Motivation to the Current Study ..................................................................................13
Chapter 2 Parametric Analysis of Ovarian Cancer ........................................................................15
2.1 Background and Data ...................................................................................................15
2.2 Testing Significant Differences in Tumor Sizes among Races ...................................16
2.3 Parametric Analysis .....................................................................................................17
2.3.1 Confidence Interval for Expected value of tumor size .................................18
2.3.2 Probability Distribution for Tumor Sizes of Whites .....................................18
2.3.3 Probability Distribution for Tumor Sizes of African Americans..................20
2.3.4 Probability Distribution for Tumor Sizes of Other Races ............................22
2.4 Comparison of Results .................................................................................................23
2.5 Conclusions ..................................................................................................................25
2.6 Contributions................................................................................................................26
Chapter 3 Parametric Survival Analysis of Ovarian Cancer .........................................................27
3.1 Background and Data ...................................................................................................27
3.2 Parametric Analysis of Overall Survival Times ..........................................................29
3.2.1 Probabilistic Behavior of Overall Survival Times of Whites .......................29
3.2.2 Probabilistic Behavior of Overall Survival Times of African Americans ....31
3.2.3 Probabilistic Behavior of Overall Survival Times of Other Races ...............33

ii
3.3 Comparison of Overall Survival Times by Race .........................................................35
3.4 Parametric Analysis of Disease-Free Survival Times .................................................37
3.5 Conclusions ..................................................................................................................40
3.6 Contributions................................................................................................................40
Chapter 4 Statistical Modeling of Ovarian Cancer Survival Times ..............................................42
4.1 Introduction ..................................................................................................................42
4.2 Description of Data ......................................................................................................43
4.3 Cox Proportional Hazards Model for Ovarian Cancer Data ........................................44
4.3.1 Checking the Functional Form of the Continuous Predictors .......................45
4.3.2 Assessing the Proportional Hazards Assumption .........................................48
4.3.3 Checking for Unusual or Influential Values .................................................52
4.4 How to Handle the Model Inadequacies? ....................................................................54
4.5 AFT Model...................................................................................................................55
4.5.1 Identifying a Suitable Probability Distribution for AFT Model ...................56
4.5.2 Model Selection and Goodness-of-Fit of the AFT Model ............................60
4.6 Flexible Parametric Survival Model ............................................................................66
4.6.1 Flexible Parametric Model Formulation .......................................................67
4.6.2 Flexible Parametric Model with Time Dependent Effects ...........................68
4.7 Discussion ....................................................................................................................76
4.8 Contributions................................................................................................................78
Chapter 5 Extended Cox Regression Model to address Non-linear and Non-proportional
Hazards with an Application to Breast Cancer Data ...................................................79
5.1 Introduction ..................................................................................................................79
5.2 Assessing the Model Adequacy ..................................................................................81
5.3 Adjusting Non-linear Effects of the Covariates ...........................................................84
5.3.1 Fractional Polynomials .................................................................................84
5.3.2 Restricted Cubic Splines ...............................................................................86
5.4 Adjusting Non-proportional Hazards- Time Varying Effects Model ..........................88
5.5 Application to Breast Cancer Survival Data ................................................................89
5.6 Discussion ..................................................................................................................130
5.7 Contributions..............................................................................................................133
Chapter 6 Future Research ...........................................................................................................134
References ....................................................................................................................................135
Appendix ......................................................................................................................................141

iii
LIST OF FIGURES
Figure 1.1 Process of Model building for Survival Data .................................................................9
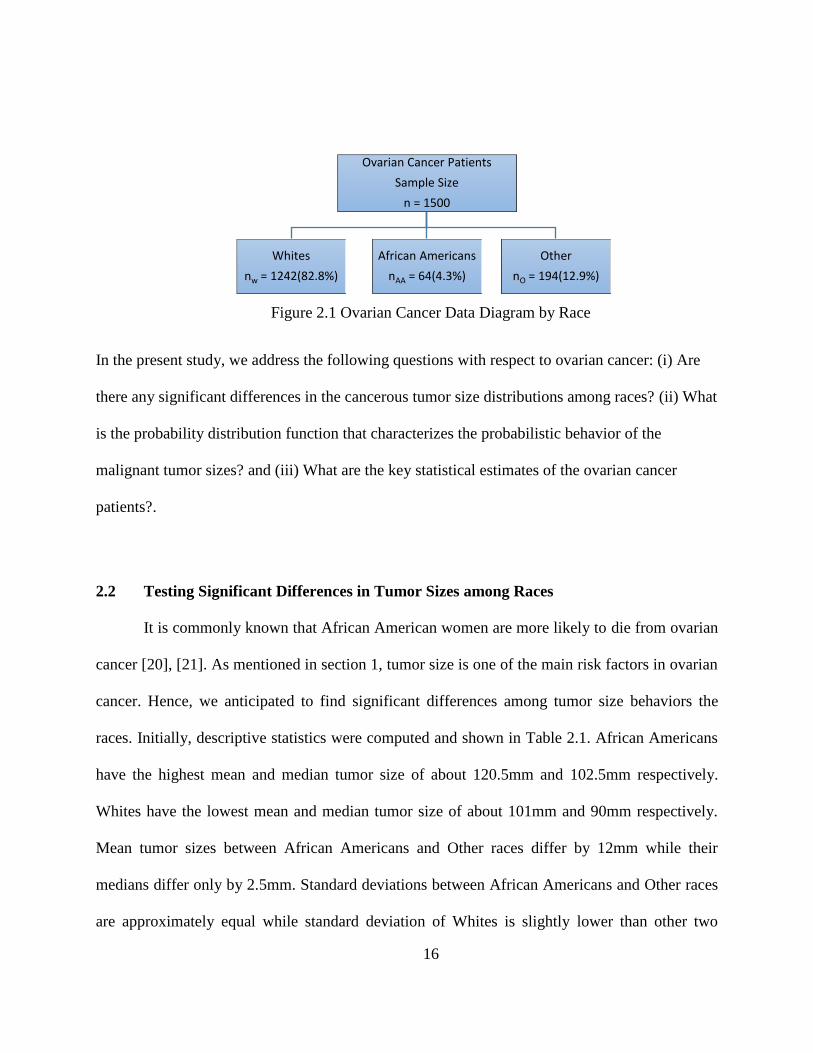
Figure 2.1 Ovarian Cancer Data Diagram by Race .......................................................................16
Figure 2.2 Fitted Weibull Probability Density Function and Cumulative Distribution
Function for Tumor Sizes for Whites ............................................................................................19
Figure 2.3: Fitted lognormal Probability Density Function and Cumulative Density
Function for Tumor Sizes of African American Patients ..............................................................21
Figure 2.4 Fitted Weibull Probability Density Function and Cumulative Density Function
for Tumor Sizes of Other Patients .................................................................................................23
Figure 2.5 Comparisons of Fitted Probability Distribution Functions and Cumulative
Density Functions for Tumor Size for Each Race .........................................................................25
Figure 3.1 Ovarian Cancer Survival Time Data Diagram .............................................................28
Figure 3.2 Survival Plot for Overall Survival Times by Race .......................................................36
Figure 3.3 Estimated Survival Functions for Disease-free Survival Times by Race.....................39
Figure 4.1 Smoothed Martingale Residual Plots for Age (smooth=0.6) .......................................46
Figure 4.2 Cumulative Martingale Residual Plot for Age at Diagnosis – Observed Path
(Solid Line) and Simulated Paths (Dashed Lines) .........................................................................47
Figure 4.3 Log-negative-log Survival Curves for Histology, Grade, Stage and Lymph node
Status ......................................................................................................................................49
Figure 4.4 Smoothed Schoenfeld Residual Plot for Histology (smooth=0.75) .............................50
Figure 4.5 Score Process Plot for Histology ..................................................................................51
Figure 4.6 Plot of Score Residuals versus Age ..............................................................................53
Figure 4.7 Plot of Scaled Score Residuals versus Age ..................................................................53

iv
Figure 4.8(a). Plot of Transformations of Survival Functions for Weibull Distribution ...............58
Figure 4.8(b). Plot of Transformations of Survival Functions for Log-logistic Distribution ........59
Figure 4.8(c). Plot of Transformations of Survival Functions for Lognormal Distribution ..........59
Figure 4.9(a). Cox-Snell Residual Plots for Weibull AFT Model .................................................61
Figure 4.9(b). Cox-Snell Residual Plots for Log-logistic AFT Model ..........................................62
Figure 4.9(c). Cox-Snell Residual Plots for Lognormal AFT Model ............................................62
Figure 4.10 Smoothed Baseline Hazard Function .........................................................................71
Figure 4.11 Estimated Baseline Hazard Function from One Knot Spline Model .........................71
Figure 4.12 Estimated Baseline Hazard Function from Four Knot Spline Model .........................72
Figure 4.13 Observed Survival Estimates and the Flexible Parametric Model Based
Survival Probabilities (smoothed lines) .........................................................................................73
Figure 4.14 Estimated Hazard Rates for Stage under the Flexible Parametric Model ..................75
Figure 4.15 Estimated Differences of Hazard Rates for Histology (CMS-AAC) under the
Flexible Parametric Model .............................................................................................................75
Figure 4.16 Comparison of Hazard Ratios from Standard Cox PH Model and the Flexible
Parametric Model with Time Varying Effects ...............................................................................76
Figure 5.1 Cox-Snell Residual Plot for the Initial Model ..............................................................92
Figure 5.2 Score Residual Plots and dfbeta Plots for Age and Tumor Size at Diagnosis .............94
Figure 5.3a Smoothed Martingale Plot for Age (smooth= 0.615) .................................................95
Figure 5.3b Smoothed Martingale Plot for Tumor Size (smooth=0.529) ......................................96
Figure 5.4a Smoothed Martingale Plot and the Estimated Fractional Polynomial Model for
Age………………………………………………………………………………………………97
Figure 5.4b Smoothed Martingale Plot and the Estimated Fractional Polynomial Model for
Tumor Size .....................................................................................................................................98
Figure 5.5(a) Restricted Cubic Spline Fit with four Knots for Age...............................................99
Figure 5.5(b) Restricted Cubic Spline Fit with Four Knots for Tumor Size ...............................100
v
Figure 5.6(a) Scaled Schoenfeld Residual Plot for Race-Black ..................................................101
Figure 5.6(b) Scaled Schoenfeld Residual Plot for Race-other ...................................................102
Figure 5.6(c) Scaled Schoenfeld Residual Plot for Lymphnode-positive....................................102
Figure 5.6(d) Scaled Schoenfeld Residual Plot for Lymphnode-unknown .................................103
Figure 5.6(e) Scaled Schoenfeld Residual Plot for Stage II ........................................................103
Figure 5.6(f) Scaled Schoenfeld Residual Plot for Stage III .......................................................104
Figure 5.6(g) Scaled Schoenfeld Residual Plot for Stage IV.......................................................104
Figure 5.6(h) Scaled Schoenfeld Residual Plot for PRA-positive ...............................................105
Figure 5.6(i) Scaled Schoenfeld Residual Plot for Age ...............................................................105
Figure 5.6(j) Scaled Schoenfeld Residual Plot for Tumor Size ...................................................106
Figure 5.7(a) Observed and Simulated Score Residual Paths for Race-black .............................108
Figure 5.7(b) Observed and Simulated Score Residual Paths for Race-other .............................109
Figure 5.7(c) Observed and Simulated Score Residual Paths for Lymphnode-positive ..............110
Figure 5.7(d) Observed and Simulated Score Residual Paths for Lymphnode-unknown ...........111
Figure 5.7(e) Observed and Simulated Score Residual Paths for Stage II ..................................112
Figure 5.7(f) Observed and Simulated Score Residual Paths for Stage III .................................113
Figure 5.7(g) Observed and Simulated Score Residual Paths for Stage IV .................................114
Figure 5.7(h) Observed and Simulated Score Residual Paths for PRA-positive .........................115
Figure 5.7(i) Observed and Simulated Score Residual Paths for Age .........................................116
Figure 5.7(j) Observed and Simulated Score Residual Paths for Tumor Size .............................117
Figure 5.8 Hazard Ratio plot for age adjusted for non-linearity and non-proportionality ...........129

vi
LIST OF TABLES
Table 2.1 Descriptive Statistics for Tumor Size Distribution Comparisons among Races ...........17
Table 2.2 Fitted Probability Distribution with Parameter Estimates and Confidence Intervals
for Tumor Size for each Race ........................................................................................................23
Table 2.3 Expected Values and Confidence Intervals for Tumor Size for each Race under
each Fitted Probability Distribution ...............................................................................................24
Table 3.1 Results of Goodness of Fit Tests for the selected Probability Density Function
for the Overall Survival Times of Whites ......................................................................................30
Table 3.2 Results of Goodness of Fit Tests for the selected Probability Density Function
for the Overall Survival Times of African Americans...................................................................32
Table 3.3 Results of Goodness of Fit Tests for the selected Probability Density Function
for the Overall Survival Times of Other Races .............................................................................34
Table 3.4 Parameter Estimates of Fitted Probability Distribution and Expected Overall
Survival Time with Confidence Intervals for each Race ...............................................................36
Table 3.5 Parameter Estimates of Fitted Probability Distribution and Expected Survival Time
with Confidence Intervals for Overall Survival Times of all races ...............................................37
Table 3.6 Results of Goodness of Fit Tests for the selected Probability Density Function for
Disease free survival times of all the Races...................................................................................38
Table 3.7 Parameter Estimates of Fitted Probability Distribution and Expected Survival Time
with Confidence Intervals for Disease-free Survival of all races ..................................................39
Table 4.1 Characteristics of the Ovarian Cancer Data under Study ..............................................44
Table 4.2 A Summary of Initial Cox Proportional Hazards Model Results ..................................46
Table 4.3 Results of the Grambsch and Therneau Proportional Hazards Test .......................... ...50
Table 4.4 Lin, Wei and Ying Test of Proportional Hazards ...................................................... ...52
Table 4.5 Risk Groups with Observed and Estimated Number of Events ................................. ...64

vii
Table 4.6 Results of the Selected AFT Model ........................................................................... ...64
Table 4.7: The Number and the Pre-Specified Position of Knots for Several Flexible
Parametric Models and their Corresponding AIC values .......................................................... ...70
Table 4.8 Summary Results of the Flexible Parametric Model ................................................. ...74
Table 5.1 Univariate Analysis of the Breast Cancer Data ......................................................... ...90
Table 5.2 Results of the Initial Cox Proportional Hazards Model ............................................. ...91
Table 5.3 Test of Proportional Hazards by Grambsch & Therneau, 1994 ................................ .106
Table 5.4 Test of Proportional Hazards Lin et al. (1993) .......................................................... .118
Table 5.5 Dummy variables for PRA in model B (piecewise Cox model) ................................ .119
Table 5.6 Estimated hazard ratios for PRA in model B (piecewise Cox model) ....................... .120
Table 5.7 A Comparison of initial and the extended Cox proportional hazards models on breast
cancer data ...................................................................................................................................123
Table 5.8 Estimated time-varying hazard ratios for PRA-positive ........................................... .127
Table 5.9 Estimated hazard ratios for the Cox model with piecewise time varying effects
(Modified model B) ................................................................................................................... .129
Table A1 Identified Extreme Values for Breast Cancer Data .................................................... .141

viii
ABSTRACT
The objective of the present study is to investigate key aspects of ovarian and breast
cancers, which are two main causes of mortality among women. Identification of the true
behavior of survivorship and influential risk factors is essential in designing treatment protocols,
increasing disease awareness and preventing possible causes of disease. There is a commonly
held belief that African Americans have a higher risk of cancer mortality. We studied racial
disparities of women diagnosed with ovarian cancer on overall and disease-free survival and
found out that there is no significant difference in the survival experience among the three races:
Whites, African Americans and Other races. Tumor sizes at diagnosis among the races were
significantly different, as African American women tend to have larger ovarian tumor sizes at the
diagnosis. Prognostic models play a major role in health data research. They can be used to
estimate adjusted survival probabilities and absolute and relative risks, and to determine
significantly contributing risk factors. A prognostic model will be a valuable tool only if it is
developed carefully, evaluating the underlying model assumptions and inadequacies and
determining if the most relevant model to address the study objectives is selected. In the present
study we developed such statistical models for survival data of ovarian and breast cancers. We
found that the histology of ovarian cancer had risk ratios that vary over time. We built two types
of parametric models to estimate absolute risks and survival probabilities and to adjust the time
dependency of the relative risk of Histology. One parametric model is based on classical
probability distributions and the other is a more flexible parametric model that estimates the

ix
baseline cumulative hazard function using spline functions. In contrast to women diagnosed with
ovarian cancer, women with breast cancer showed significantly different survivorship among
races where Whites had a poorer overall survival rate compared to African Americans and Other
races. In the breast cancer study, we identified that age and progesterone receptor status have
time dependent hazard ratios and age and tumor size display non-linear effects on the hazard. We
adjusted those non-proportional hazards and non-linear effects by using an extended Cox
regression model in order to generate more meaningful interpretations of the data.

1
CHAPTER 1
INTRODUCTION
We begin with an overview of ovarian and breast cancer along with the past statistical
analysis done on the subject matter. Then we discuss the commonly used survival analysis
methods in cancer research. Finally, we introduce the main focus of this dissertation: cancer
survival analysis with emphasize to flexible statistical modeling of time-to-event data. This
focus is critical to treatment protocol decisions, disease awareness, etc. but is not addressed
generally in health data research.
1.1 What is Cancer?
In our bodies, normal cells divide in a systematic way. They die when they are worn out
or damaged, and new cells take their place. Cancer starts when cells grow in an uncontrolled
behavior and crowd out normal cells. This makes it difficult for the body to work in the typical
way. These cancer cells can travel through blood or the lymph system and spread to other areas
of the body [1]. Cancer can start any place in the body and it is usually named for the body part
in which it started. This is called the primary site. Most cancers form a lump called a tumor.
Pathologists take a sample of these lumps to test whether it is cancer (malignant tumors) or not
(benign lumps).
1.2 Ovarian Cancer
According to statistics currently cited by the American Cancer Society, about 22,440
women will receive a new diagnosis of ovarian cancer in 2017 and about 14,080 women will die

2
from ovarian cancer during 2017. Ovarian cancer ranks fifth in cancer deaths among women,
accounting for more deaths than any other cancer of the female reproductive system [1]. Even
with advances in treatment options for ovarian cancer during the past three decades,
improvement in survival for women with ovarian cancer remains challenging [2]. It is difficult to
detect early stage ovarian cancer as it doesn’t have clear symptoms and most of the time they are
mistakenly identified as other conditions such as constipation or irritable bowel syndrome.
However, if it is found earlier, ovarian cancer can be treated successfully using surgery or
radiation. In advanced stage ovarian cancer, symptoms such as abdominal pain, bloating, weight
loss and constipation may occur. Ovarian cancer can start from one of the three tissue types that
comprise the organ. Epithelium tumors begin in the thin layer of tissue that covers the outside of
the ovaries and accounts for the majority of ovarian cancers. Stromal tumors arise from
connective tissue cells that hold the ovary together and produce female hormones. Germ cell
tumors start on the tissues that produce eggs on the inside of the ovary. Initially, diagnosis of
ovarian cancer is usually done with a physical exam followed up by imaging and blood tests.
Surgery may be recommended by the physician. Similar to other common cancer types, ovarian
cancer has four stages, namely, I: cancer is in one or both ovaries, II: cancer has spread to other
parts of the pelvis, III: cancer has spread into the abdomen and IV: cancer has spread to the
outside of the abdomen. Typically, treatment for ovarian cancer is surgery to remove the ovaries
and other affected tissue. Chemotherapy is mostly used after surgery. Some of the risk factors of
ovarian cancer are age, inheritance, race, fertility treatment, and the presence of polycystic
ovarian syndrome [3], [4]. A group of researchers who have studied overall survival and
recurrence-free survival of early stage ovarian cancer patients have identified age, tumor grade
and stage as important pathological prognostic factors. Also, they have found that race and

3
histology were not significantly associated with survival [5]. Another group of researchers who
studied distant metastases of ovarian cancer have found that stage, grade and lymph node
involvement are associated with ovarian cancer [6]. A study on young women who have been
diagnosed with ovarian cancer found that tumor size and grade significantly contribute to
disease-free survival of ovarian cancer [7].
1.3 Breast Cancer
Breast cancer is the second leading cause of cancer death in women. According to the
statistics currently cited by the American Cancer Society, about 252,710 women will receive a
new diagnosis of breast cancer and about 40,610 women will die from breast cancer. Breast
cancer has been studied worldwide to improve survival by focusing on finding causes, reducing
risks, developing new diagnostic tests and creating new treatment protocols [8]. The risk factors
for breast cancer include age, inheritance and lifestyle behaviors such as diet and exercise.
Researchers have constructed statistical models to predict a woman’s risk of getting breast
cancer. These models give a rough estimate of breast cancer risk based on the factors that are
used to develop the model. Among the breast cancer studies that focused on risks of various
factors on survival, [9] shows that incidence of breast cancer in Caucasian women is higher than
African-American women. However, mortality rates for African-Americans are higher than for
Caucasian women. A review study of them reveals that mortality rate adjusted for other factors
explains these racial disparities. They found that African American women diagnosed at similar
disease stage and treated comparatively to Caucasian women, likely to experience similar breast
cancer risks and survival. It is known that stage alone will not estimate the risk of different
outcomes related to cancer, and other biological factors related to the tumor should be used to
assess the risks. Presence of hormone receptors is an important in prognosis nd can help in

4
determining appropriate treatments for breast cancer patients [10]. Age is also an important risk
factor in breast cancer survival rates. The effect of age on mortality may not be linear; other
patterns may occur. According to [11] who compared two age groups (less than 40 years and
greater than equal to 40 years),the younger age group has poorer survival than the older age
group. [11] found that higher proportions of African American and single patients, as well as
those diagnosed at later stages and treated by mastectomy occurred in the younger age group
compared to the older age group.
1.4 Survival Analysis
Survival analysis focuses on time-to-event data, commonly called survival times. In the
healthcare field, survival times can typically be defined as time to death, time to relapse, time to
a side effect, etc. in studies such as clinical trials, retrospective cohort studies, and prospective
cohort studies. Methods other than standard regression analysis are needed to analyze survival
times because they consist of incomplete survival time data sets. That is, for some subjects, the
exact survival time is unknown but some information is available. In survival analysis this is
called censoring. Censoring occurs when a subject doesn’t experience the event before the
follow-up period ends, a person is lost to follow-up during the study period or a subject
withdraws from the study. When true survival time is equal to or greater than observed survival
time, it is called right censored. Most censored data are right censored. When true survival time
is less than the observed survival time it is called left censored.
Let the survival time denoted by the random variable T (≥ 0). Then the probability that a
given subject will have a survival time less than or equal to some given value t is denoted by
𝐹(𝑡) = 𝑃(𝑇 ≤ 𝑡). (1.1)

5
The probability of surviving a time greater than t is given by
𝑆(𝑡) = 𝑃(𝑇 > 𝑡) = 1 − 𝐹(𝑡). (1.2)
Another quantity of interest in survival analysis is the hazard function, ℎ(𝑡). This denotes the
instantaneous potential per unit time for the event to occur, given that the subject has survived up
to time t.
ℎ(𝑡) = lim∆𝑡→0𝑃(𝑡<𝑇≤𝑡+∆𝑡|𝑇>𝑡)
∆𝑡. (1.3)
Relationship between S(t) and h(t):
ℎ(𝑡) = lim∆𝑡→0
𝑃(𝑡 < 𝑇 ≤ 𝑡 + ∆𝑡|𝑇 > 𝑡)
∆𝑡
= lim∆𝑡→0
𝑃(𝑡 < 𝑇 ≤ 𝑡 + ∆𝑡)/𝑃(𝑇 > 𝑡)
∆𝑡
= lim∆𝑡→0
𝑃(𝑡 < 𝑇 ≤ 𝑡 + ∆𝑡)/∆𝑡
𝑃(𝑇 > 𝑡)
ℎ(𝑡) = 𝑓(𝑡)
𝑆(𝑡), (1.4)
where f(t) is the probability density function of T.
Since
ℎ(𝑡) = 𝑓(𝑡)
𝑆(𝑡)=
𝜕𝑆(𝑡)/𝜕𝑡
𝑆(𝑡)= −
𝜕𝑙𝑜𝑔𝑆(𝑡)
𝜕𝑡,
the cumulative hazard function H(t) can be written as
𝐻(𝑡) = ∫ ℎ(𝑢)𝑑𝑢 = −𝑙𝑜𝑔𝑆(𝑡).𝑡
0 (1.5)
It follows that

6
𝑆(𝑡) = exp [−𝐻(𝑡)]. (1.6)
The next step is to estimate the survival function, 𝑆(𝑡). This can be done in different ways. First,
we’ll present a commonly used non-parametric method called product-limit estimator. In Chapter
3, we’ll discuss how it can be estimated using probability distribution functions.
1.4.1 Product-Limit Estimator of the Survival Function
Product limit estimator is used to measure the proportion of patients living for a certain
amount of time after diagnosis. The importance of this estimator is that it takes censoring into
account. Let k denote the total number of failures in the sample and 𝑡1 ≤ 𝑡2 ≤ ⋯ ≤ 𝑡𝑘 denote
the ordered failure times.
Let di be the number of failures at time ti and ni be the number of subjects at risk at time ti. (ni =
number of failure or censoring times greater than ti). Then the product-limit estimator of the
survival function is estimated by
𝑆(𝑡) = ∏𝑛𝑖−𝑑𝑖
𝑛𝑖𝑡𝑖≤𝑡 . (1.7)
1.4.2 Cox Proportional Hazard Model
One of the goals of survival analysis is to assess the relationship between explanatory
variables and survival/hazard. The Cox Proportional Hazard (Cox PH) model [12] is the most
commonly used method of statistical modeling of survival data. It models the hazard of a subject
at time t with a given set of covariate values.
Let ti be the failure time for subject i, where i = 1, 2, ..., n. Then according to the Cox PH model,
the hazard function for subject i at time ti (> 0) conditional on the set of covariates
𝒁𝒊 = (𝑍1𝑖, … . , 𝑍𝑝𝑖) is given by

7
ℎ𝑖(𝑡𝑖|𝒁𝒊) = ℎ0(𝑡)exp (𝛽1𝑍1𝑖, + ⋯ . + 𝛽𝑝𝑍𝑝𝑖). (1.8)
where ℎ0(𝑡) is the baseline hazard function and denotes the hazard function when all covariate
values take zero (reference values) and 𝜷 = (𝛽1, … . , 𝛽𝑝) are the corresponding regression
coefficients for Z, the given covariates.
The reason that this model is appealing is that the knowledge about the baseline hazard function
is not required. The main outcome of this model is the estimated hazard ratios. Since baseline
hazard is unknown, this model is called a semi-parametric model.
Proportional hazards assumption: Let the model given in Equation (1.8) consists of one
explanatory variable Z which takes values 1(say, treatment) and 0 (say, control). Then the hazard
rate ratio for a subject with covariate value 1 versus a subject with covariate value 0 at time t is
given by
𝐻𝑅(𝑡) = ℎ(𝑡|𝑍 = 1)
ℎ(𝑡|𝑍 = 0)
= ℎ0(𝑡)exp (𝛽)
ℎ0(𝑡)
= exp (𝛽). (1.9)
This implies that the ratio of the two hazards is a constant which does not depend on time, t. That
is, the hazards of the two groups remain proportional over time. This is the main assumption in
the Cox PH model.
Parameter estimation of the Cox PH model is done by partial likelihood function [12] given by
𝐿(𝜷) = ∏ [exp (𝛽1𝑍1𝑖 , + ⋯ . + 𝛽𝑝𝑍𝑝𝑖)
∑ exp (𝛽1𝑍1𝑗, + ⋯ . + 𝛽𝑝𝑍𝑝𝑗)𝑗∈𝑅(𝜏𝑖)]
𝛿𝑖𝑛
𝑖=1

8
= ∏ [exp (𝛽1𝑍1𝑖,+ ⋯.+ 𝛽𝑝𝑍𝑝𝑖)
∑ exp (𝛽1𝑍1𝑗+⋯.+ 𝛽𝑝𝑍𝑝𝑗)𝑗∈𝑅(𝜏𝑖)]𝑘
𝑖=1 (1.10)
where 𝑅(𝜏𝑖) is the risk set at the failure time of subject i and 𝛿𝑖 is an event indicator which is one
if failure time is observed (uncensored) and zero otherwise (censored failure time). n is the
number of individuals and k is the number of distinct failure times. This is independent of the
baseline hazard function. Inferences can be made by treating this as regular likelihood. The log
partial likelihood is given by
𝑙(𝜷) = 𝑙𝑜𝑔 {∏ [exp (𝛽1𝑍1𝑗,+ ⋯.+ 𝛽𝑝𝑍𝑝𝑖)
∑ exp (𝛽1𝑍1𝑗+⋯.+ 𝛽𝑝𝑍𝑝𝑗)𝑗∈𝑅(𝜏𝑖)]𝑘
𝑖=1 }
= ∑ {(𝛽1𝑍1𝑖, + ⋯ . + 𝛽𝑝𝑍𝑝𝑖) − 𝑙𝑜𝑔[∑ exp (𝛽1𝑍1𝑗, + ⋯ . + 𝛽𝑝𝑍𝑝𝑗)𝑗∈𝑅(𝜏𝑖) ]}𝑘𝑖=1
= ∑ 𝑙𝑗(𝜷)𝑘𝑖=1 , (1.11)
where 𝑙𝑖(𝜷) is the log partial likelihood contribution at the ith
ordered failure time.
The partial likelihood score equations are given by
𝑈(𝜷) =𝜕
𝜕𝜷𝑙(𝜷), (1.12)
and the maximum partial likelihood estimates can be found by solving 𝑈(𝜷) = 0.
1.4.3 Assessing the Adequacy of Cox PH Model
In some cases, the data will not satisfy the PH assumption and hence use of this model to
describe the data will be misleading. Therefore, once we fit this model to the data we need to
verify the proportional hazards assumption before proceeding to the model interpretations. There
are a few residual-based methods that can be used to evaluate this assumption which we will

9
present in the next section. Similar to standard regression models, the linearity assumption of
continuous covariates and the existence of extreme values should be assessed, too. Figure 1.1
shows the general schematic diagram of statistical model building of survival data. The setting of
the Cox PH model makes it difficult to define a residual that is similar to observed-fitted type
residual as in standard regression models. This has led to development of different types of
residuals which addresses various model features and assumptions. These methods are based on
four residuals, namely Martingale residuals, Schoenfeld residuals, Cox-Snell residuals and score
residuals.
Figure 1.1 Process of Model Building for Survival Data

10
1.4.3.1 Overall Model Adequacy
First, overall goodness-of-fit of the model was assessed using the Cox -Snell residual plot
[13]. The idea is to plot Cox -Snell residuals versus the cumulative hazard function of the Cox-
Snell residuals. Let 𝑟𝐶𝑖 be the Cox-Snell residuals for the ith
individual. If 𝑟𝐶𝑖 ~exponential(1)
then the survival function of 𝑟𝐶𝑖 is
𝑆(𝑟𝐶𝑖) = 𝑒−𝑟𝐶𝑖
and the cumulative hazard function is
𝐻(𝑟𝐶𝑖) = −𝑙𝑜𝑔𝑆(𝑟𝐶𝑖).
The is implies
𝐻(𝑟𝐶𝑖) = 𝑟𝐶𝑖 .
Hence, the plot of 𝑟𝐶𝑖 vs. 𝐻(𝑟𝐶𝑖) should yield a straight line with unit slope if the assumption of
𝑟𝐶𝑖 ~exponential(1) is satisfied. Cox-Snell residual for ith
individual can be estimated by
𝑟𝐶�� = 𝐻(𝑡|𝒁𝒊) = 𝐻0(𝑡) exp (��′𝒁𝒊). (1.13)
where 𝐻0(𝑡) can be approximated by Nelson-Aalen estimate [14] of the baseline cumulative
hazard function.
However, the final decision on the suitability of the model shouldn’t be taken solely on
this plot. In practice it has been found that the Cox-Snell plot is not sensitive to small model
inadequacies and not reliable in small sample sizes. Therefore, along with this overall goodness
of fit test we should proceed to check separately for the situations where model inadequacies can
occur in a Cox PH model. The three main areas are to check for influential observations, non-
linear effects of the continuous covariates and non-proportional hazards of the covariates.

11
1.4.3.2 Assessing Unusual and Influential Data Values
Identification of unusual data values and influential data values on the parameter
estimates can be done using statistics similar to leverage and dfbeta in a standard linear
regression model. Score residuals have properties similar to leverage values in standard
regression. For continuous predictors, the further the value is from the mean, the larger the
absolute value of the score residual is. Graphs of the score residuals and covariates aid in
identifying any subjects with unusual data values. A statistic that is similar to dfbeta that
approximately measures the difference between a particular coefficient value and the new
coefficient if a value is removed from the sample can be computed for Cox PH model using
score residuals and the covariance matrix of the estimated coefficients [15]. This value is
sometimes called scaled score residual and plots of these residuals and continuous covariates are
useful to examine any subjects that influence the parameter estimates.
1.4.3.3 Checking the Functional Form of Continuous Covariates
Assessing the correct functional form of the continuous predictor variables is essential in
developing an accurate predictive model using the Cox PH method. Different methodologies,
including graphical evaluation of residuals plots and formal model-based significance tests can
be used to understand the true form of the relationship between the continuous covariates and the
hazard ratio. Therneau et al. [16] suggests that plotting Martingale residuals against the covariate
of interest may be useful to identify the correct functional form of the covariate. A non-linear
pattern in the graph indicates that a linearity assumption for the covariate is not suitable. Another
method of checking the functional form of continuous covariates is to compare the observed and
expected cumulative Martingale residuals [17]. If the covariate is correctly specified in the
model, then cumulative Martingale residuals should randomly fluctuate around zero and can be
12
approximated by zero mean Gaussian process. Therefore, observed cumulative Martingale
residuals can be compared with the simulations of zero mean Gaussian processes to check any
significant departures and hence to assess the correctness of the linear continuous covariate in the
model.
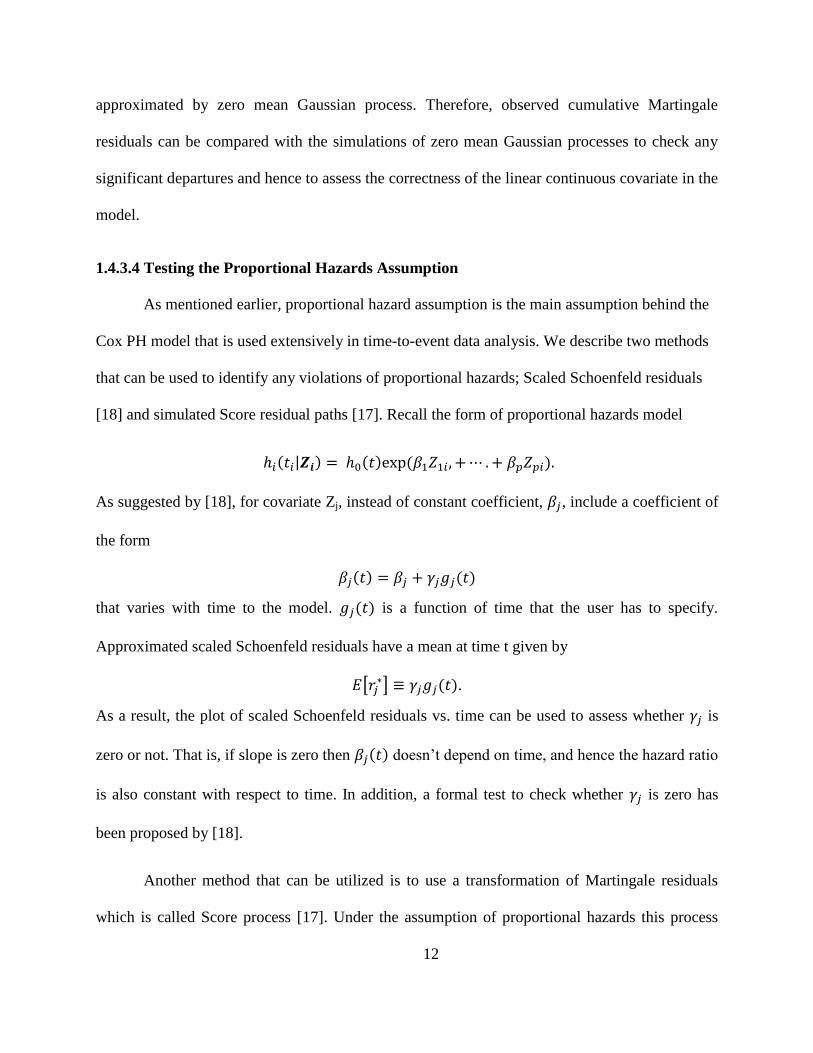
1.4.3.4 Testing the Proportional Hazards Assumption
As mentioned earlier, proportional hazard assumption is the main assumption behind the
Cox PH model that is used extensively in time-to-event data analysis. We describe two methods
that can be used to identify any violations of proportional hazards; Scaled Schoenfeld residuals
[18] and simulated Score residual paths [17]. Recall the form of proportional hazards model
ℎ𝑖(𝑡𝑖|𝒁𝒊) = ℎ0(𝑡)exp (𝛽1𝑍1𝑖, + ⋯ . + 𝛽𝑝𝑍𝑝𝑖).
As suggested by [18], for covariate Zj, instead of constant coefficient, 𝛽𝑗, include a coefficient of
the form
𝛽𝑗(𝑡) = 𝛽𝑗 + 𝛾𝑗𝑔𝑗(𝑡)
that varies with time to the model. 𝑔𝑗(𝑡) is a function of time that the user has to specify.
Approximated scaled Schoenfeld residuals have a mean at time t given by
𝐸[𝑟𝑗∗] ≡ 𝛾𝑗𝑔𝑗(𝑡).
As a result, the plot of scaled Schoenfeld residuals vs. time can be used to assess whether 𝛾𝑗 is
zero or not. That is, if slope is zero then 𝛽𝑗(𝑡) doesn’t depend on time, and hence the hazard ratio
is also constant with respect to time. In addition, a formal test to check whether 𝛾𝑗 is zero has
been proposed by [18].
Another method that can be utilized is to use a transformation of Martingale residuals
which is called Score process [17]. Under the assumption of proportional hazards this process

13
can be approximated by zero mean Gaussian process. Hence, a comparison of observed score
process and simulated score processes under the Cox PH assumption would reveal any
departures from the assumption. The idea is to use one thousand simulations of the score process
and compute the proportion of times that the maximum absolute values of the simulated
processes exceeds the maximum absolute value of the observed score process. This value serves
as the p-value for a supremum type of formal test of PH assumption. If the simulated processes
exceed the observed process relatively few times then it is an indication of the violation of the
assumption. In addition, graphs of these observed and simulated processes can be used to
identify the departures from the proportional hazards.
1.5 Motivation for the current study
When reviewing the literature on breast and ovarian cancer data we found some
limitations in the statistical analyses that were performed. Most of the studies have used non-
parametric methodologies when estimating and comparing survival probabilities and
categorizations of continuous variables [5], [7]. When statistically modeling the survival data a
vast majority of the studies use Cox PH model; however not many of those studies report
whether they evaluated model adequacy, particularly proportional hazard assumption [5] [6], [7],
[11]. Therefore, our main objective was to explore methods to evaluate model adequacy of the
Cox PH model, correct/adjust if there are any inadequacies present and utilize alternative models
that can be used in survival data modeling. We perform these using ovarian and breast cancer
data extracted from Surveillance, Epidemiology and End Results (SEER) program of the
National Cancer Institute. Further details about the selected data are described in the relevant
chapters.

14
The flow of this dissertation is as follows: Chapter 2 performs parametric analysis of
tumor sizes of ovarian cancer by fitting parametric probability distributions. Chapter 3 presents a
parametric analysis of survival times with a comparison of the probability distribution function
among the races. Chapter 4 is devoted to statistical modeling of ovarian cancer data where focus
is given to the flexible parametric model. Chapter 5 is about the statistical modeling of breast
cancer though an extended Cox PH model which takes non-linear effects and non-proportional
hazards into account.
15
CHAPTER 2
PARAMETRIC ANALYSIS OF OVARIAN CANCER
Malignant tumor size is an important factor in all cancers. It is used to evaluate the
severity of the cancer which is helpful to determine the prognosis and help to identify the correct
treatment methods. The main objective of the present study is to perform parametric analysis of
the malignant tumor size of ovarian cancer using data extracted from the Surveillance
Epidemiology and End Results (SEER) database. Further, we assess whether there are any racial
differences that exist among Whites, African Americans and other races.
2.1 Background and Data
According to American Cancer Society, about 22,440 women will receive a new
diagnosis of ovarian cancer and about 14,080 women will die from ovarian cancer in year 2017.
Ovarian cancer ranks fifth in cancer deaths among women, accounting for more deaths than any
other cancer of the female reproductive system [1]. Malignant tumor size is highly related to
prognosis. In most cases, the smaller the tumor, the better the chances are for long-term survival
[19].
Ovarian cancer data extracted from Surveillance Epidemiology and End Results (SEER)
database of the patients diagnosed with ovarian cancer between 2007 and 2010 were used in this
study. We considered a random sample of 1000 patients diagnosed with malignant epithelial
tumors which accounts for about 90% of the ovarian cancer cases. A schematic diagram of the
data used in this study with additional details is shown in Figure 2.1, below.
16
Figure 2.1 Ovarian Cancer Data Diagram by Race
In the present study, we address the following questions with respect to ovarian cancer: (i) Are
there any significant differences in the cancerous tumor size distributions among races? (ii) What
is the probability distribution function that characterizes the probabilistic behavior of the
malignant tumor sizes? and (iii) What are the key statistical estimates of the ovarian cancer
patients?.
2.2 Testing Significant Differences in Tumor Sizes among Races
It is commonly known that African American women are more likely to die from ovarian
cancer [20], [21]. As mentioned in section 1, tumor size is one of the main risk factors in ovarian
cancer. Hence, we anticipated to find significant differences among tumor size behaviors the
races. Initially, descriptive statistics were computed and shown in Table 2.1. African Americans
have the highest mean and median tumor size of about 120.5mm and 102.5mm respectively.
Whites have the lowest mean and median tumor size of about 101mm and 90mm respectively.
Mean tumor sizes between African Americans and Other races differ by 12mm while their
medians differ only by 2.5mm. Standard deviations between African Americans and Other races
are approximately equal while standard deviation of Whites is slightly lower than other two
Ovarian Cancer Patients
Sample Size
n = 1500
Other
nO = 194(12.9%)
African Americans
nAA = 64(4.3%)
Whites
nw = 1242(82.8%)
17
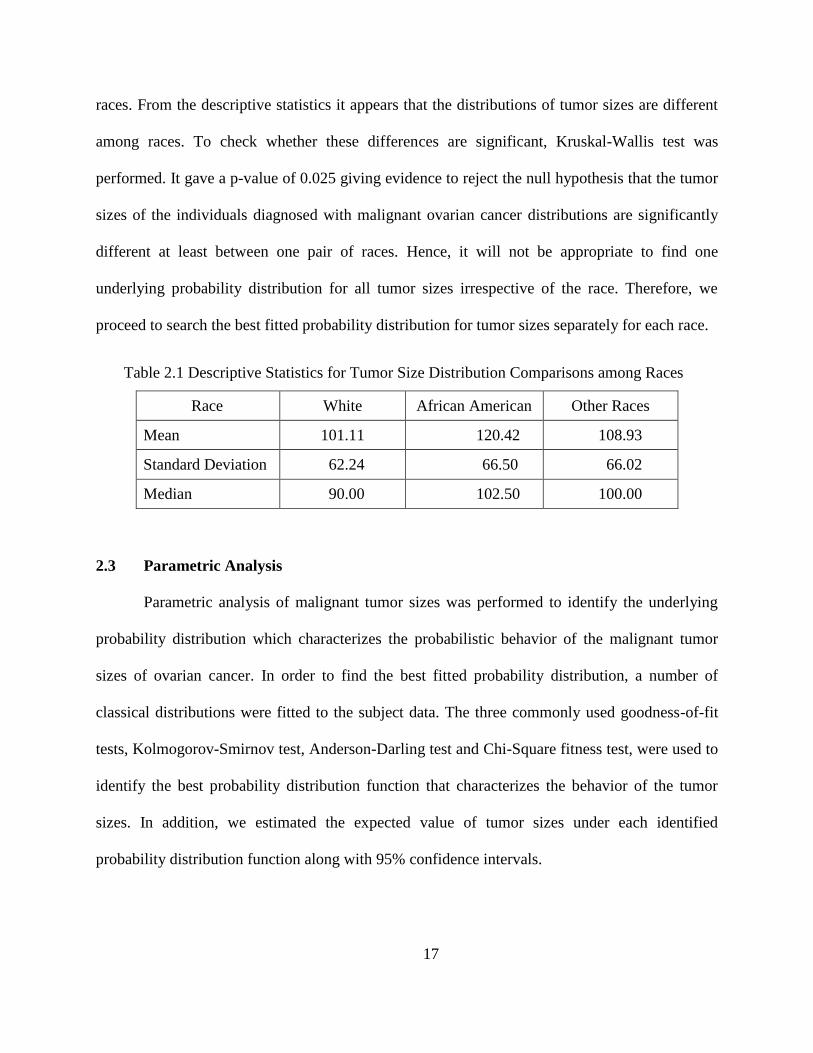
races. From the descriptive statistics it appears that the distributions of tumor sizes are different
among races. To check whether these differences are significant, Kruskal-Wallis test was
performed. It gave a p-value of 0.025 giving evidence to reject the null hypothesis that the tumor
sizes of the individuals diagnosed with malignant ovarian cancer distributions are significantly
different at least between one pair of races. Hence, it will not be appropriate to find one
underlying probability distribution for all tumor sizes irrespective of the race. Therefore, we
proceed to search the best fitted probability distribution for tumor sizes separately for each race.
Table 2.1 Descriptive Statistics for Tumor Size Distribution Comparisons among Races
Race White African American Other Races
Mean 101.11 120.42 108.93
Standard Deviation 62.24 66.50 66.02
Median 90.00 102.50 100.00
2.3 Parametric Analysis
Parametric analysis of malignant tumor sizes was performed to identify the underlying
probability distribution which characterizes the probabilistic behavior of the malignant tumor
sizes of ovarian cancer. In order to find the best fitted probability distribution, a number of
classical distributions were fitted to the subject data. The three commonly used goodness-of-fit
tests, Kolmogorov-Smirnov test, Anderson-Darling test and Chi-Square fitness test, were used to
identify the best probability distribution function that characterizes the behavior of the tumor
sizes. In addition, we estimated the expected value of tumor sizes under each identified
probability distribution function along with 95% confidence intervals.
18
2.3.1 Confidence Interval for Expected Value of Tumor Size
Let X be a random variable which follows a location-scale distribution with parameters
𝜇(location) and 𝜎(scale). Then an approximate confidence interval for the expected value can be
obtained as follows using the delta method. Assume that the expected value of X is a function of
𝜇 and 𝜎, let it denoted by g(𝜇,𝜎).
Then an approximate (1 − 𝛼)100% confidence interval for the expected value of X can be
estimated by
g(��, ��) ± 𝑧𝛼2⁄ 𝑆𝐸g(��, ��), (2.1)
where
𝑆𝐸g(��, ��) = √(𝜕𝑔
𝜕𝜇)
2
𝑉𝑎𝑟(��) + 2𝜕𝑔
𝜕𝜇
𝜕𝑔
𝜕𝜎𝐶𝑜𝑣(��, ��) + (
𝜕𝑔
𝜕𝜎)
2
𝑉𝑎𝑟(��).
Estimates of the 𝑉𝑎𝑟(��), 𝐶𝑜𝑣(��, ��) and 𝑉𝑎𝑟(��) are obtained by the variance-covariance
matrix.
For the log-location-scale probability distributions such as Weibull and lognormal, an
approximate (1 − 𝛼)100% confidence interval can be obtained by exponentiating the limits
given in equation 2.1, such that,
(𝐿𝑜𝑤𝑒𝑟 𝐶𝑙𝑎𝑠𝑠 𝐿𝑖𝑚𝑖𝑡 = 𝑒g(��, ��)−𝑧𝛼
2⁄ 𝑆𝐸g(��, ��) , 𝑈𝑝𝑝𝑒𝑟 𝐶𝑙𝑎𝑠𝑠 𝐿𝑖𝑚𝑖𝑡 = 𝑒g(��, ��)+𝑧𝛼
2⁄ 𝑆𝐸g(��, ��)) (2.2)
2.3.2 Probability Distribution for the Tumor Sizes of Whites
The best fitted probability distribution function that characterizes the malignant tumor
sizes for Whites is the Weibull probability distribution. Let X be a random variable which
follows a Weibull probability distribution with scale parameter (𝛼 > 0) and shape
parameter(𝛽 > 0). Then the analytical form of the probability density function is given by

19
𝑓(𝑥) =𝛽
𝛼(
𝑥
𝛼)
𝛽−1
𝑒𝑥𝑝 [(−𝑥
𝛼)
𝛽
]; 0 ≤ 𝑥 < ∞.
The maximum likelihood estimates of the corresponding distribution parameters are
scale(��)=106.9230 and shape(��)=1.5469. Figure 2.2 shows the fitted Weibull probability density
function and cumulative probability distribution function for tumor sizes of White patients. The
cumulative probability distribution function is useful in finding the probability associated with
different tumor sizes. For example, for a White woman the probability of having a tumor size of
200mm or less is about 0.9.
Figure 2.2 Fitted Weibull Probability Density Function and Cumulative Distribution Function for
Tumor Sizes for Whites
The expected value of a Weibull random variable is given by 𝐸(𝑋) = 𝛼Г (1 +1
𝛽), where
Г (1 +1
𝛽) is the gamma function evaluated at (1 +
1
𝛽). By transforming the Weibull probability
distribution to location-scale probability distribution, expected value of tumor size can be
obtained by 𝑒𝜇Г(1 + 𝜎), where 𝜇 = log (𝛼) and 𝜎 = 1 𝛽⁄ .
Probability Distribution Function

20
Let 𝑔 = log[𝑒𝜇Г(1 + 𝜎)] = 𝜇 + log [Г(1 + 𝜎)]. Then, according to equation (2.2) an
approximate (1 − 𝛼)100% confidence interval for the expected value of the tumor sizes with the
underlying Weibull probability distribution can be estimated by
(𝐿𝑜𝑤𝑒𝑟 𝐶𝑙𝑎𝑠𝑠 𝐿𝑖𝑚𝑖𝑡 = 𝑒log[𝑒��Г(1+��)]−𝑧𝛼
2⁄ 𝑆𝐸�� , 𝑈𝑝𝑝𝑒𝑟 𝐶𝑙𝑎𝑠𝑠 𝐿𝑖𝑚𝑖𝑡 = 𝑒log[𝑒 ��Г(1+��)]+𝑧𝛼
2⁄ 𝑆𝐸�� ).
According to our analysis, a white woman in our study is expected to have a tumor size of
96.1867mm. Furthermore, it can be said that with at least 95% confidence, the expected tumor
size for a given White women is between 94.04mm and 98.38mm. That is,
𝑃(94.04 ≤ 𝜇 ≤ 98.38) ≥ 0.95
where 𝜇 =Expected value of the tumor size of White women.
2.3.3 Probability Distribution for Tumor Sizes of African Americans
The best fitted probability distribution function that characterizes the malignant tumor
sizes for African Americans is the lognormal probability distribution function. Let X be a
random variable which follows a lognormal probability distribution with location parameter (𝜇),
scale parameter (𝜎 > 0) and threshold parameter (𝛾). Then the analytical form of the probability
density function is given by
𝑓(𝑥) =1
√2𝜋(𝑥−𝛾)𝜎𝑒𝑥𝑝 (−
[ln(𝑥−𝛾)−𝜇]2
2𝜎2 ) ; 0 ≤ 𝑥 < ∞.
The maximum likelihood estimates of the corresponding distribution parameters are location (��)
= 5.1776, scale (��) = 0.3703 and threshold (𝛾) = 75.0362. Figure 2.3 shows the fitted lognormal
probability density and cumulative probability distribution function for tumor sizes of African

21
American women. According to the cumulative distribution function, the probability of having a
tumor size of 230mm or less is about 0.9 for African American women with ovarian cancer.
Figure 2.3: Fitted lognormal Probability Density Function and Cumulative Distribution Function
for Tumor Sizes of African American Patients
The expected value of a lognormal random variable is given by
E(𝑋) = 𝛾 + 𝑒𝜇+𝜎2
2 .
According to equation (2.2), an approximate (1 − 𝛼)100% confidence interval for the expected
value of tumor sizes that follows a three parameter lognormal distribution is given by
(𝐿𝑜𝑤𝑒𝑟 𝐶𝑙𝑎𝑠𝑠 𝐿𝑖𝑚𝑖𝑡 = 𝛾 + 𝑒��+
��2
2−𝑧𝛼
2⁄ 𝑆𝐸�� , 𝑈𝑝𝑝𝑒𝑟 𝐶𝑙𝑎𝑠𝑠 𝐿𝑖𝑚𝑖𝑡 = 𝛾 + 𝑒��+
��2
2+𝑧𝛼
2⁄ 𝑆𝐸��).
We have found that an African American woman in our study is expected to have a tumor size of
114.816mm. Furthermore, it can be said that with at least 95% confidence, the expected tumor
size for a given African American women is between 103.872mm and 125.759mm. That is,
𝑃(103.87 ≤ 𝜇 ≤ 125.76) ≥ 0.95,
Probability

22
where 𝜇 =Expected value of tumor size of African American women.
2.3.4 Probability Distribution for Tumor Sizes of Other Races
The best fitted probability distribution function that characterizes the malignant tumor sizes for
other races is the Weibull probability distribution. Figure 2.4 shows the fitted Weibull
probability density and cumulative probability distribution function for tumor sizes of others
patients. The maximum likelihood estimates of the corresponding distribution parameters are
scale (��) = 110.096 and shape (��) = 1.7128. According to the cumulative distribution function,
the probability of having a tumor size of 180mm or less is about 0.9 for patients of other race
with ovarian cancer.
According to our analysis, the expected tumor size for an ovarian cancer patient is about
98.1829mm. Further, it can be said that, with at least 95% confidence, the expected tumor size
for a subject of other race in this study, is between 93.2414mm and 103.386mm. That is,
𝑃(93.24 ≤ 𝜇 ≤ 103.39) ≥ 0.95
where 𝜇 =Expected value of tumor size of women in other races.

23
Figure 2.4 Fitted Weibull Probability Density Function and Cumulative Distribution Function for
Tumor Sizes of Other Races
2.4 Comparison of the Results
The best fitted probability distributions with their parameter estimates for each of the
races are given in Table 2.2 below. The basic statistics along with 95% confidence limits of the
true malignant tumor size for each race is given below in Table 2.3.
Table 2.2 Fitted Probability Density with Parameter Estimates of the Tumor Sizes for each of the
Three Races
Race Probability Density Function
Whites:
Weibull(��=106.9230, ��=1.5469) 𝑓(𝑥) =
1.5469
106.923(
𝑥
106.923)
0.5469
𝑒𝑥𝑝 [(−𝑥
106.923)
1.5469
]
African Americans:
Lognormal(��=5.1776,
�� = 0.3703, �� = 75.0362)
𝑓(𝑥) =1
√2𝜋(𝑥 − 75.036)0.370𝑒𝑥𝑝 (−
[ln(𝑥 − 75.036) − 5.177]2
2(0.370)2)
Other Races:
Weibull(�� =110.096, �� = 1.7128) 𝑓(𝑥) =
1.7128
110.096(
𝑥
110.096)
0.7128
𝑒𝑥𝑝 [(−𝑥
110.096)
1.7128
]
Probability
Distribution Function

24
Table 2.3 Expected Values and Confidence Intervals for Tumor Size for each Race under each
Fitted Probability Distribution
Race Expected
Value
Standard
Error
95% Confidence
Interval
Whites:
Weibull(��=106.9230, ��=1.5469)
96.1867 1.1077 (94.0399, 98.3826)
African Americans:
Lognormal(��=5.1776, �� = 0.3703, �� = 75.0362)
114.816 5.5835 (103.872, 125.759)
Other Races:
Weibull(�� =110.096, �� = 1.7128)
98.1829 2.5868 (93.2414, 103.386)
It can be seen that tumor size of African Americans has the highest expected value of the
tumor size (114mm) among the three races with a 95% confidence interval of (103.872mm,
125.759mm). It is interesting to see that tumor sizes of African Americans have the largest
standard error among the three races and hence the widest confidence range of 22mm. The other
races have an expected tumor size of about 98mm which is comparable to the expected value of
the Whites (96mm). However, other races have a relatively high standard error and a wide
confidence range (12mm) than Whites. Whites have the smallest confidence range of about 4mm
as a result of a low standard error of about 1mm.
Figure 2.5 shows the fitted probability density function and cumulative distribution functions of
all three races. It can be clearly seen that probabilistic behavior of tumor sizes of African
Americans behave differently than the other two races such that there is a higher chance of
having a larger tumor size for African Americans than for other two races. For example, for
Whites or other race, the probability of having a tumor size of 100mm or less is about 0.5.

25
0 100 200 300 400 500 600
0.0
00
0.0
02
0.0
04
0.0
06
Tumor Size (mm)
De
nsi
ty
White
AfricanAmerican
Other
0 100 200 300 400 500 600
0.0
0.2
0.4
0.6
0.8
1.0
Tumor Size (mm)
Cu
mu
lativ
e P
rob
ab
ility
White
African American
Other
However, for African Americans the probability of having a tumor size of 200mm is about 0.5.
Also, by looking at the expected values of the other two races and their best fitted probability
distributions it agrees and explains the significant results of the Kruskal-Wallis test (section 2.2)
between the races which suggests that at least one race is significantly different with respect to
the underlying probability distribution of tumor sizes.
Figure 2.5 Comparisons of Fitted Probability Distribution Functions and Cumulative Density
Functions for Tumor Size for Each Race
2.5 Conclusions
In the parametric analysis of ovarian cancer, we have identified the probabilistic behavior
of the tumor sizes for Whites, African Americans and Other races. We constructed 95%
confidence intervals for the expected value of the tumor sizes under each identified probability
distributions. Tumor sizes of Whites and other races have similar characteristics. However,
African Americans’ tumor sizes behave differently and their expected tumor size are higher than
Whites’ and other races’ tumor sizes. Importance of identifying the racial disparities among

26
underlying probability distributions of tumor sizes is that those differences can be further
examined clinically and socioeconomically so that patients can be catered with better treatments
and care.
2.6 Contributions
In the present chapter we found some important aspects concerning ovarian cancer tumor sizes.
The appropriate probability distribution function that characterizes the behaviors of the
malignant tumor sizes for Whites, African-Americans and other races.
The mean and median of cancerous tumor size for African Americans is significant larger
than Whites
Probabilistic behavior of tumor sizes of African Americans is different from Whites and
other races.
Probabilistic behavior of tumor sizes of Whites and other races are similar.

27
CHAPTER 3
PARAMETRIC SURVIVAL ANALYSIS OF OVARIAN CANCER
The objective of the present study is to perform parametric survival analysis to compare
the survivorship of ovarian cancer patients among their races. Emphasis is given to both overall
survival and disease specific survival. We examine the existence of racial differences among
Whites, African Americans and other races using probabilistic analysis.
3.1 Background and Data
It is commonly known that African Americans have poor survival in ovarian cancer [20],
[21]. The present study is to investigate whether there are any significant differences in the
survival times among the different races. Survival time data of 1500 women diagnosed with
ovarian cancer during the years 2007 to 2010 was extracted from the Surveillance Epidemiology
and End Results (SEER) database for this study. We analyzed patients diagnosed with malignant
epithelial tumors which accounts for about 90% of the ovarian cancer cases. The survival times
were calculated using the date of diagnosis and either the date of the event or the follow up
cutoff date (if the patient survived at the end of the study) or the date last known to be alive. The
follow-up cutoff date used in this study was December 31, 2012. Two types of events were
considered, death from any cause (overall survival) or death from ovarian cancer (disease-free
survival), were investigated separately in this study. The schematic diagram of the data with
additional details is shown in Figure 3.1, below. For all three races percentage of ovarian cancer
subjects ranges between 19% and 26%. About 4% to 5% are non-cancer deaths for each race.

28
About 70% of whites and others races have not experienced death until the follow–up cut-off
date or have lost to follow-up. About 76% of African Americans were alive or lost to follow-up
when the study follow-up period ended.
Figure 3.1 Ovarian Cancer Survival Time Data Diagram
In the present study, we address the following questions with respect to ovarian cancer.
Are there any differences in the underlying probability distributions of overall survival times
among races?
Are there any differences in the underlying probability distributions of disease-free survival
times among races?
Ovarian Cancer Pateints
n=1500
Whites
nw=1242
(82.8%)
Censored=854
(68.7%)
Other Causes of Death=59
(4.8%)
Ovarian Cancer Deaths=329
(26.5%)
African Americans
nAA=64
(4.3%)
Censored=49
(76.5%)
Other Causes of death=3
(4.7%)
Ovarian Cancer Deaths=12
(18.8%)
Other
no=194
(12.9%)
Censored=137
(70.6%)
Other Causes of death=8
(4.1%)
Ovarian Cancer Deaths=49
(25.3%)

29
What are the probability distribution functions that characterize the behavior of the overall
and disease-free survival times for Whites, African Americans and other races?
Are there any differences in overall and disease-free survival probabilities?
3.2 Parametric Analysis of Overall Survival Times
Parametric analysis was performed to determine the best fitted probability distribution
function that characterizes the survival times among races. Over thirty different classical
distributions were fitted to the data. The three goodness-of-fit tests, Kolmogorov-Smirnov,
Anderson-Darling, and Chi-Square were used to determine the best probability distribution
function that characterizes each race. Significance level of 5% was used in all the goodness-of-fit
tests in this section.
3.2.1 Probabilistic Behavior of the Overall Survival Times of Whites
After fitting a number of probability distributions to the subject data to identify the best
fitted probability distribution for the overall survival times of Whites, for each distribution,
goodness-of-fit tests were performed under the null hypothesis that the data fits specific
probability distribution. It has been found that the Weibull probability distribution fits the data
well. The results of the goodness-of-fit tests used to decide the most appropriate probability
distribution are given in Table 3.1. None of the tests have significant evidence to reject the null
hypothesis which suggests that the selected Weibull probability distribution explains the
underlying probabilistic behavior of the survival time of the White women in the study.

30
Table 3.1 Results of Goodness of Fit Tests for the Selected Probability Density Function for
Overall Survival Times of Whites
Test Statistic p-value
Kolmogorov-Smirnov 0.0363 0.1834
Anderson-Darling 1.8625 0.1< p < 0.2
Chi-Square 11.7170 0.2297
Let T be a random variable which follows a Weibull probability distribution with
parameters scale (𝛼) and shape (𝛽). The probability density function 𝑓(𝑡) and the cumulative
distribution function 𝐹(𝑡) are given by
𝑓(𝑡) =1
𝛼𝛽 𝑡𝛽−1𝑒𝑥𝑝 {− (𝑡
𝛼)
𝛽
} (3.2)
and
𝐹(𝑡) = 1 − 𝑒𝑥𝑝 {− (𝑡
𝛼)
𝛽
} (3.3)
respectively.
This yields the survival function
𝑆(𝑡) = 𝑃(𝑇 > 𝑡) = 1 − 𝐹(𝑡) = 𝑒𝑥𝑝 {− (𝑡
𝛼)
𝛽
} (3.4)
and the hazard function
ℎ(𝑡) =1−𝑓(𝑡)
𝐹(𝑡)=
𝛽
𝛼(
𝑡
𝛼)
𝛽−1
. (3.5)

31
The approximate maximum likelihood estimates of the scale parameter (��) is 7.9554 and the
shape parameter (��) is 1.2108. Accordingly, the estimated probability density function and the
cumulative distribution function for Whites are given by
𝑓(𝑡) =1
7.95541.2108 𝑡1.2108−1𝑒𝑥𝑝 {− (𝑡
7.9554)
1.2108
}
and 𝐹(𝑡) = 1 − 𝑒𝑥𝑝 {− (𝑡
7.9554)
1.2108
}
respectively.
In addition, the estimated survival function and the hazard function for the overall survival times
of White women can be given by
𝑆(𝑡) = 𝑒𝑥𝑝 {− (𝑡
7.9554)
1.2108
}
and ℎ(𝑡) =1.2108
7.9554(
𝑡
7.9554)
1.2108−1
respectively.
The expected time to death along with the 95% confidence intervals were computed with respect
to the Weibull probability distribution as given above. White women with ovarian cancer have
an estimated expected overall survival time of about 7.5 years. We are at least 95% confident
that the true expected overall survival time lies between 7 years to 8 years for White patients.
That is,
𝑃(7 ≤ 𝜇 ≤ 8) ≥ 0.95,
where 𝜇 = Expected survival time for White women.
3.2.2 Probabilistic Behavior of the Overall Survival Times of African Americans
Similarly, to the analysis of survival times of Whites, different probability distributions
were used to identify the best fitted probability distribution for the overall survival times of
32
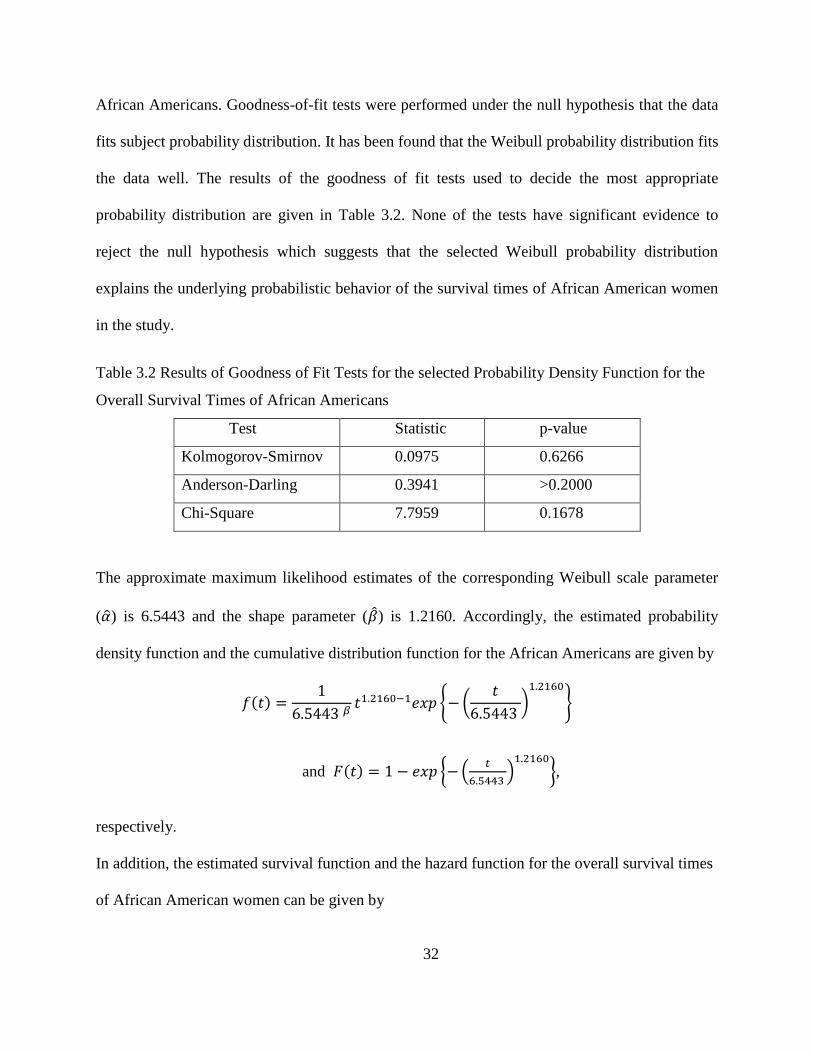
African Americans. Goodness-of-fit tests were performed under the null hypothesis that the data
fits subject probability distribution. It has been found that the Weibull probability distribution fits
the data well. The results of the goodness of fit tests used to decide the most appropriate
probability distribution are given in Table 3.2. None of the tests have significant evidence to
reject the null hypothesis which suggests that the selected Weibull probability distribution
explains the underlying probabilistic behavior of the survival times of African American women
in the study.
Table 3.2 Results of Goodness of Fit Tests for the selected Probability Density Function for the
Overall Survival Times of African Americans
Test Statistic p-value
Kolmogorov-Smirnov 0.0975 0.6266
Anderson-Darling 0.3941 >0.2000
Chi-Square 7.7959 0.1678
The approximate maximum likelihood estimates of the corresponding Weibull scale parameter
(��) is 6.5443 and the shape parameter (��) is 1.2160. Accordingly, the estimated probability
density function and the cumulative distribution function for the African Americans are given by
𝑓(𝑡) =1
6.5443 𝛽𝑡1.2160−1𝑒𝑥𝑝 {− (
𝑡
6.5443 )
1.2160
}
and 𝐹(𝑡) = 1 − 𝑒𝑥𝑝 {− (𝑡
6.5443 )
1.2160
},
respectively.
In addition, the estimated survival function and the hazard function for the overall survival times
of African American women can be given by

33
𝑆(𝑡) = 𝑒𝑥𝑝 {− (𝑡
6.5443)
1.2160
}
and ℎ(𝑡) =1.2160
6.5443(
𝑡
6.5443)
1.2160−1
respectively.
According to the estimated probabilistic behavior, expected overall survival time of African
American women is about 6 years with at least 95% confidence interval of 4.8 years to 7.9 years.
That is,
𝑃(4.8 ≤ 𝜇 ≤ 7.9) ≥ 0.95,
where 𝜇 = Expected survival time for African American women.
3.2.3 Probabilistic Behavior of the Overall Survival Times of Other Races
A number of different probability distributions were used to identify the best fitted
probability distribution for the overall survival times of other races. Goodness-of-fit tests were
performed under the null hypothesis that data fits subject probability distribution. It has been
found that the best fitted probability distribution for other races is also the Weibull probability
distribution but with different parameters than for Whites and African Americans. The results of
the goodness-of-fit tests used to decide the most appropriate probability distribution are given in
Table 3.3. None of the tests have significant evidence to reject the null hypothesis which
suggests that the selected Weibull probability distribution explains the underlying probabilistic
behavior of the overall survival time of women in other races in the study.

34
Table 3.3 Results of Goodness of Fit Tests for the selected Probability Density Function for the
Overall Survival Times of Other Races
Test Statistic p-value
Kolmogorov-Smirnov 0.05184 0.8540
Anderson-Darling 0.2431 0.2431
Chi-Square 2.4726 0.9291
The approximate maximum likelihood estimates of the corresponding Weibull scale parameter
(��) is 9.1748 and the shape parameter (��) is 1.1656.
Accordingly, the estimated probability density function and the cumulative distribution function
for the African Americans are given by
𝑓(𝑡) =1
9.1748 1.1656 𝑡1.1656−1𝑒𝑥𝑝 {− (𝑡
9.1748 )
1.1656
}
and 𝐹(𝑡) = 1 − 𝑒𝑥𝑝 {− (𝑡
9.1748 )
1.1656
}
respectively.
In addition, the estimated survival function and the hazard function for the overall survival times
of African American women can be given by
𝑆(𝑡) = 𝑒𝑥𝑝 {− (𝑡
9.1748)
1.1656
} and
ℎ(𝑡) =1.1656
9.1748(
𝑡
9.1748)
1.1656−1
respectively.

35
According to the probabilistic behavior of the women in other races, estimated expected overall
survival time of the women in other races is 8.7 years. In addition, it can be said with at least
95% confidence that the corresponding true overall survival time lies between 7.2 years to 10.5
years. That is,
𝑃(7.2 ≤ 𝜇 ≤ 10.5) ≥ 0.95,
where 𝜇 = Expected survival time for Other race women.
3.3 Comparison of Overall Survival Times by Race
Parameter estimates of fitted probability distribution and expected overall survival time
with confidence intervals for each of the races is given in Table 3.4. It can be seen that African
American women have the lowest expected overall survival time of about 6 years compared to
other races. Women other than White or African American have the highest overall survival
time. African American women with ovarian cancer have the highest confidence range of about
3 years while White women have the lowest confidence range of about 1 year. Estimates of the
shape parameter of the fitted distributions for each race are approximately the same for Whites
and African Americans and slightly different for other races. However, scale parameter estimates
are different for each race.
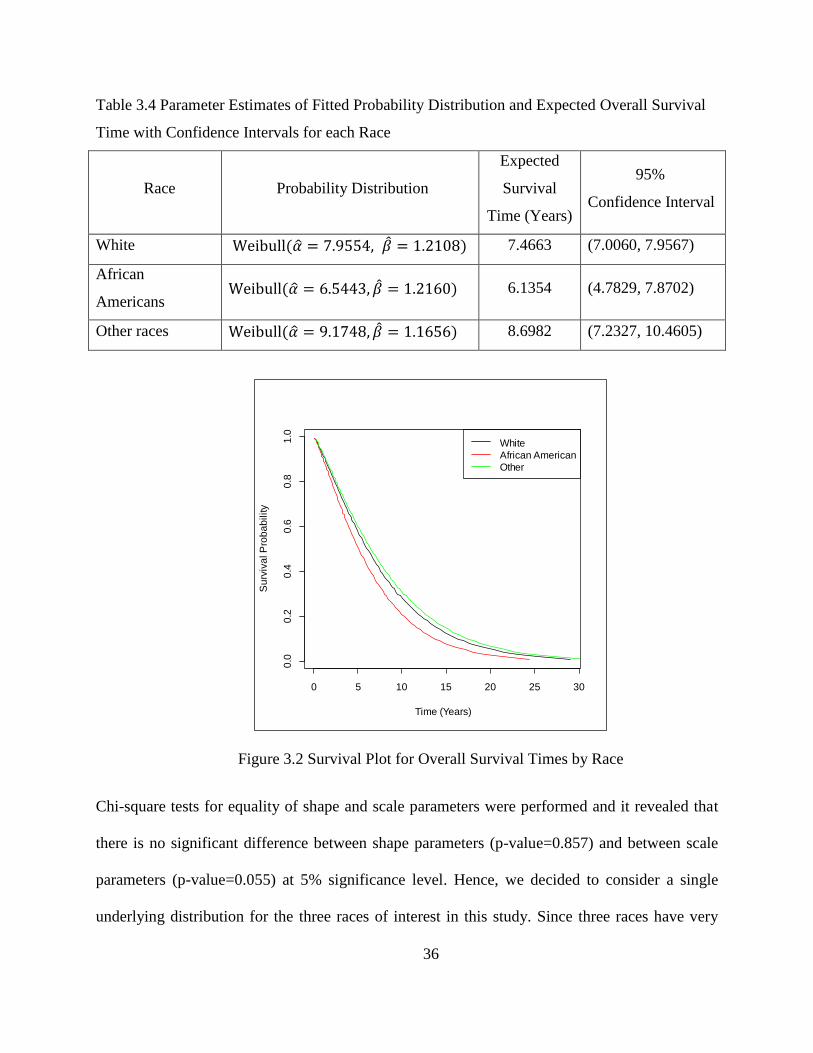
It can be seen from the Figure 3.2 that the estimated survival functions for the three races are not
significantly different from each other. The five-year overall survival probability for African
American is about 0.60 and for Whites and other races are about 0.70. The ten-year overall
survival probability for African Americans is about 0.30 and for Whites and other races about
0.35.
36
Table 3.4 Parameter Estimates of Fitted Probability Distribution and Expected Overall Survival
Time with Confidence Intervals for each Race
Race Probability Distribution
Expected
Survival
Time (Years)
95%
Confidence Interval
White Weibull(�� = 7.9554, �� = 1.2108) 7.4663 (7.0060, 7.9567)
African
Americans Weibull(�� = 6.5443, �� = 1.2160) 6.1354 (4.7829, 7.8702)
Other races Weibull(�� = 9.1748, �� = 1.1656) 8.6982 (7.2327, 10.4605)
Figure 3.2 Survival Plot for Overall Survival Times by Race
Chi-square tests for equality of shape and scale parameters were performed and it revealed that
there is no significant difference between shape parameters (p-value=0.857) and between scale
parameters (p-value=0.055) at 5% significance level. Hence, we decided to consider a single
underlying distribution for the three races of interest in this study. Since three races have very
0 5 10 15 20 25 30
0.0
0.2
0.4
0.6
0.8
1.0
Time (Years)
Su
rviv
al P
rob
ab
ility
White
African American
Other

37
similar survival experience, we can estimate a common probability distribution that describes the
overall survival pattern of the women with ovarian cancer. Table 3.5 shows the summary of
estimated parameters.
Table 3.5 Parameter Estimates of Fitted Probability Distribution and Expected Survival Time
with Confidence Intervals for Overall Survival Times of all races
Race Parameter Estimates Expected
Survival Time
95% Confidence
Interval
All Weibull(�� = 8.1016, �� = 1.2465) 7.5505 (6.7712 8.4195)
3.4 Parametric Analysis of Disease-Free Survival Times
We fitted different probability distributions to the disease-free survival times and
evaluated the fit similarly as in the previous section using the three goodness-of-fit tests,
Kolmogorov-Smirnov, Anderson-Darling, and Chi-Square. It has been found that the best fitted
probability distribution function that characterizes the behavior of the disease-free survival times
for White, African American, and other races is log-logistic probability distribution. Estimated
survival curves for each race are shown in Figure 3.3. It is clear from the graph that survival
curves for Whites and other races is almost the same while for African Americans survival
experience is slightly higher. We found that parameter estimates for each of these three
distributions were similar. Test of equality for the parameters of each distribution revealed that
there is no significant difference in the location parameters (p-value=0.782) and scale parameters
(p-value=0.183) between each race. Hence, it is appropriate to characterize the behavior of the
disease-free survival times of all races using a single probability distribution. We found that the
best fitted probability distribution for disease-free survival time is log-logistic distribution.
Goodness-of-fit tests were performed under the null hypothesis that data fits subject probability

38
distribution. The results of the goodness of fit tests used to decide the most appropriate
probability distribution are given in Table 3.6. None of the tests have significant evidence to
reject the null hypothesis which suggests that the selected log-logistic probability distribution
explains the underlying probabilistic behavior of the disease-free survival time of women in all
races in the study. Therefore, we estimated a common probability distribution function (log-
logistic) for disease-free survival times.
Table 3.6 Results of Goodness of Fit Tests for the Selected Probability Density Function for
Disease-Free Survival Times of all the Races
Test Statistic p-value
Kolmogorov-Smirnov 0.0325 0.1983
Anderson-Darling 1.1537 >0.2000
Chi-Square 14.691 0.1437
Let T be a random variable which follows a log-logistic distribution with parameters location (𝜇)
and scale (𝜎). The probability density function, 𝑓(𝑡) and the cumulative density function 𝐹(𝑡) is
given by
𝑓(𝑡) =exp [(𝑙𝑛𝑡−𝜇)/𝜎]
𝑡𝜎{1+exp [(𝑙𝑛𝑡−𝜇)/𝜎]}2
and 𝐹(𝑡) =1
1+exp [−(𝑙𝑛𝑡−𝜇)/𝜎].
This yields the survival function
𝑆(𝑡) =exp [(𝑙𝑛𝑡 − 𝜇)/𝜎]
1 + exp [(𝑙𝑛𝑡 − 𝜇)/𝜎]
and the hazard function
ℎ(𝑡) =1
𝑡𝜎{1+exp [(𝑙𝑛𝑡−𝜇)/𝜎]}.

39
Figure 3.3 Estimated Survival Functions for Disease-free Survival Times by Race
The approximate maximum likelihood estimates of the parameters of the fitted distribution for
the disease-free survival times, the expected time to death along with the 95% confidence
intervals for all races are given in Table 3.7. The expected disease-free survival time for the
women with ovarian cancer is estimated to be 26 years. Further, it can be said with 95%
confidence that the true expected disease-free survival range is between 21-32 years old.
Table 3.7 Parameter Estimates of Fitted Probability Distribution and Expected Survival Time
with Confidence Intervals for Disease-free Survival of all races
Race Parameter Estimates Expected
Survival Time
95%
Confidence Interval
All Log-logistic(��= 2.0213, ��= 0.7564) 25.8921 (20.8690, 32.1241)
0 50 100 150 200 250
0.0
0.2
0.4
0.6
0.8
1.0
Time (Years)
Su
rviv
al P
rob
ab
ility
White
African American
Other

40
3.5 Conclusions
In this chapter we have studied the overall survival and disease-free survival of ovarian
cancer patients focusing on racial disparities. We have identified the probabilistic behavior of the
survival times along with the 95% confidence intervals for the expected value of the survival
time under the identified probability distributions. Whites and other races have very similar
overall survival pattern. African Americans have a slightly higher overall survival among the
three races. However, evidence has been found that differences between races with respect to the
overall survival probabilities, in particular, African American and White, and African American
and other races are not statistically significant. Also, we have found that there is no significant
difference between the probabilistic behaviors of disease-free survival between races. That is,
race doesn’t play a major role in the probabilistic nature of survival times with respect to death
from ovarian cancer. According to our analysis, some racial disparities with respect to overall
and disease-free survival were observed in the population of women diagnosed with ovarian
cancer that were considered in this study. However, we found that those differences were not
statistically significant.
3.6 Contributions
In the present chapter, we have answered some important questions regarding the survival times
of ovarian cancer patients as below.
Probability distribution functions of overall survival times for Whites, African American and
other races are not significantly different.

41
The most appropriate probability distribution functions that characterize the probabilistic
behavior of the overall survival times of all races irrespective of the race.
The expected value with 95% confidence interval for the overall survival times for Whites,
African American and other races.
Probability distribution functions of disease-free survival times for Whites, African
American and other races are not significantly different.
The most appropriate probability distribution function that characterizes the probabilistic
behavior of the disease-free survival times for all races irrespective of the race.
The expected value with 95% confidence interval of the disease-free survival times for all
races irrespective of the race.

42
CHAPTER 4
STATISTICAL MODELING OF OVARIAN CANCER SURVIVAL TIME
4.1 Introduction
After finding the probabilistic behavior of the disease-specific survival time of ovarian
cancer and comparison with respective to the race in chapter 3, we proceed to investigate the
relationship between survival time and other potential predictor variables. It is important to study
how the various prognostic factors affect the survival probabilities of ovarian cancer in order to
improve the survival of women diagnosed with ovarian cancer. Survival time can be measured
from the diagnosis to death, time from a treatment to relapse of the cancer, etc. Sometimes, the
interested event is not observed or patient drops out before the follow-up time ends where those
cases are considered as the censored times. These censored survival times give rise to the need of
special statistical methodologies to analyze the data other than commonly used linear regression
methods. The purpose of this chapter is to develop a survival model to disease-specific survival
times of ovarian cancer and related risk factors. We utilize standard survival analysis methods as
well as newly developed improved survival analysis techniques on the data of interest to obtain a
better predictive model. Section 4.2 of this chapter presents general characteristics of the data
under study. Section 4.3 is about Cox regression models and section 4.5 presents a parametric
statistical model to survival data. Section 4.6 introduces and applies an advanced but more
flexible parametric survival model which takes spline functions into account.

43
4.2 Description of the Data
Data for this study was extracted from Surveillance Epidemiology and End Results
(SEER) database. Women identified with epithelial histology type were included in this study.
This histology type which accounts for about 90% of the ovarian cancer cases, consists of tumors
which begin in the thin layer of tissue that covers the outside of the ovaries. Women diagnosed
between years 2007 to 2010, age between 20 to 90 years old at the diagnosis, which has
undergone tumor resection and tumor sizes between 10mm to 500mm were included in this
study. Other covariates used in this study are Race, Tumor Grade, Stage, Lymph Node Status.
Race is categorized into Whites, African Americans and Other races. Tumor grade indicates the
cell differentiation (well, moderate and poor/undifferentiated). American Joint Committee on
Cancer (AJCC) staging system was used as the stage variable. Lymph node status describes
whether regional lymph nodes examined by the pathologist found to contain metastases
(positive) or not (negative). The survival times were calculated using the date of diagnosis and
either the date of the event (i.e. if patient died before the end of the study due to ovarian cancer)
or the follow up cutoff date (if the patient survived at the end of the study) or the date last known
to be alive. The follow-up cutoff date used in this study was December 31, 2012. Table 4.1
characterizes the sample of 1500 individuals used in this study. Mean survival time of this study
population is 3.12 years with a standard deviation and a median survival time of 3 years. Largest
and smallest disease specific survival time is about five and half years and about one month.
Table 4.1 displays the ovarian cancer data that we will be studying in the present study.

44
Table 4.1 Characteristics of the Ovarian Cancer Data under Study
Characteristic Count Percentage
Race
White 1242 82.80
Black 64 4.27
Other 194 12.93
Histology
AAC 633 42.20
CMS 867 57.80
Grade
Well Differentiated 190 12.67
Moderately Differentiated 275 18.33
Poorly/Undifferentiated 1035 69.00
Stage
I 507 33.80
II 176 11.73
III 588 39.20
IV 229 15.27
Lymph Node Status
Negative 748 49.87
Positive 285 19.00
No Exam 467 31.13
Mean (SD) Median.
Age at Diagnosis (years) 58.92 (12.13) 58
Tumor Size (cm) 102.95
(63.04) 95
Adenomas & Adenocarcinoma (AAC), Cystic, mucinous and serous neoplasm (CMS)
4.3 Cox Proportional Hazard Model for Ovarian Cancer Survival Data
Cox proportional hazards (Cox PH) model is used to estimate the hazard ratios with
respect to the risk factors associated with the disease. The main advantage of Cox PH regression
is that the survival models can be fitted without knowing the underlying distribution of survival

45
times. This feature makes it a semi-parametric statistical model and most commonly used
survival analysis method in literature. The key underlying assumption of Cox PH model is that
hazard ratio between two levels of a predictor variable is constant with respect to the time. In
addition, generally in practice standard Cox PH model uses linear forms for continuous
predictors and only main effects in the model. Therefore, in the process of the development of a
better predictive model for the survival data, we have to evaluate the underlying assumptions of
the Cox PH model with respect to the data and adjust or correct the model if any violations of the
assumptions were found. More details about the Cox PH model and corresponding methods to
assess the underlying assumptions are given in Chapter 1.
Initial Cox PH model for the data was built using backward elimination method and the
summary results are given in Table 4.2. According to this model, adjusted hazard ratios can be
interpreted as follows. There is 1.6% increase of risk of ovarian cancer death for a particular
subject compared to a subject who is one year younger. A person who has histology-CMS has a
lower risk of ovarian cancer death compared to a person who is in histology-AAC The risk of a
subject who has moderately differentiated grade is 1.76 times of the risk of a subject who has
well differentiated grade. Similarly, a subject who has poorly or undifferentiated grade has about
2.6 higher risk of ovarian cancer death compared to a person with a well differentiated grade.
Also, it can be seen that risks of ovarian cancer death compared to stage-I get higher when the
stage increases. These model interpretations are usable only if this model adequately describes
the data. In the next sections, we present the adequacy checks for the model.
4.3.1 Checking the Functional Form of the Continuous Predictors
We utilized methods of smoothed martingale residual plot and cumulative martingale
residual plot with simulated paths to assess the functional form of the continuous variables in our

46
study. Figure 4.1 shows the smoothed Martingale residual plot that was used to capture the
relationship between age at diagnosis and the log hazard rate. It appears that overall relationship
of log hazard ratio and age is linear.
Table 4.2 A Summary of Initial Cox Proportional Hazards Model Results
Variable Parameter
Estimate
(��)
Standard
Error
Hazard
Ratio
95% Hazard Ratio
Confidence Limits
Age 0.01593 0.00400 1.016 1.007 1.025
Histology-CMS - 0.28142 0.13437 0.755 0.580 0.982
Grade-moderately differentiated 0.56769 0.35966 1.764 0.872 3.570
Grade-poorly/un differentiated 0.96023 0.33840 2.612 1.346 5.071
Lymph node status-positive 0.22394 0.14726 1.251 0.937 1.670
Lymph node status-negative 0.38177 0.13523 1.465 1.124 1.909
Stage II 0.51410 0.28912 1.672 0.949 2.947
Stage III 1.68879 0.21860 5.413 3.527 8.308
Stage IV 2.31746 0.22787 10.150 6.494 15.864
Figure 4.1 Smoothed Martingale Residual Plots for Age (smooth=0.6)

47
Another method to evaluate the functional form of continuous variables is to use the
observed cumulative Martingale residuals with simulated residuals [17]. The corresponding plots
for our data are shown in Figure 4.2 for age. It can be seen that the observed cumulative
Martingale residual paths in the plot lie inside the cloud of the simulated paths which suggests
that the linear age term in the model is appropriate. Test of the null hypothesis that the observed
pattern of martingale residuals is not different from the expected pattern reveals that more than
638 simulated paths out of 1000 have maximum cumulative residual larger than the observed
maximum cumulative residual. This test also suggests that there are no significant departures
from linearity in age.
Figure 4.2 Cumulative Martingale Residual Plot for Age at Diagnosis – Observed Path (Solid
Line) and Simulated Paths (Dashed Lines)

48
4.3.2 Assessing the Proportional Hazards Assumption
After assessing the correct functional form of the continuous variables we proceeded to
evaluate the main assumption of Cox PH model, the proportional hazards assumption. Graphical
methods as well as formal tests were applied to assess the PH assumption of the predictors in our
study. Initially, parallelism of the estimated log-negative-log survival curves was examined with
respect to the categorical predictor variables and the resulting graphs are shown in Figure 4.3.
Estimated log log-negative-log survival curves for histology clearly crosses each other
suggesting non-proportional hazards in the histology type. In contrast, it can be seen that the
estimated log-negative-log survival curves for stage and grade display an approximately parallel
pattern which indicates no evidence of violation of proportional hazards. However, it is not clear
from the curves that lymph node status follows the proportional hazards assumption.
We proceed with alternative tests of proportional hazards to confirm and to further assess
the proportional hazards assumption. As mentioned in Chapter 1, scaled Schoenfeld residual plot
along with Grambsch and Therneau test of proportional hazards was applied on our data. Figure
4.4 shows the smoothed Schoenfeld residual plot for Histology. If the covariate follows
proportional hazard assumption, the smoothed curve should be a horizontal line. As seen from
Figure 4.4 Histology has a non-linear pattern for smoothed residuals which again suggests non-
proportional hazards with respect to time. Results of the corresponding tests for all the variables
are given in Table 4.3. It can be seen that only Histology has significant p-value. It suggests that
there is no significant evidence of non-proportional hazards for other covariates.

49
Figure 4.3 Log-negative-log Survival Curves for Histology, Grade, Stage and Lymph
node Status
Histology Grade
Stage Lymph Node Status
0.1 0.5 2.0 5.0
-6-4
-2
log(Time)
log(-
log(S
(t))
)
AAC
CMS
0.1 0.5 2.0 5.0
-5-4
-3-2
-1
log(Time)
log(-
log(S
(t))
)
Well Dif f erentiated
Moderately Dif f erentiated
Poorly /Undif f erentiated
0.1 0.5 2.0 5.0
-6-4
-20
log(Time)
log(-
log(S
(t))
)
Stage I
Stage II
Stage III
Stage IV
0.1 0.5 2.0 5.0
-6-4
-20
log(Time)
log(-
log(S
(t))
)
Negativ e
Positiv e
No Exam

50
Figure 4.4 Smoothed Schoenfeld Residual Plot for Histology (smooth=0.75)
Table 4.3 Results of the Grambsch and Therneau Proportional Hazards Test [18]
Variable rho Chi-square P-value
Age -0.01093 0.0474 0.827709
Histology 0.19017 14.9656 0.000109
Grade-moderately differentiated -0.03597 0.4964 0.481108
Grade-poorly/un differentiated -0.03076 0.3705 0.542721
Lymph node status-positive -0.00813 0.0256 0.872844
Lymph node status-negative -0.04982 1.0014 0.316973
Stage II 0.01883 0.1372 0.71109
Stage III -0.00818 0.0253 0.873606
Stage IV -0.03393 0.4537 0.50056
We also used score process plots and the corresponding proportional hazards tests
to evaluate to the proportional hazards assumption. The score process plot for Histology is

51
shown in Figure 4.5. It can be clearly seen that observed score residual path deviates far from the
simulated score residual paths suggesting non-proportional hazards for Histology. The
corresponding test results for all the variables shown in Table 4.4 is consistent with the Grambsh
and Therneau test results shown in Table 4.3 giving evidence for proportional hazards violation
for only Histology.
Figure 4.5 Score Process Plot for Histology
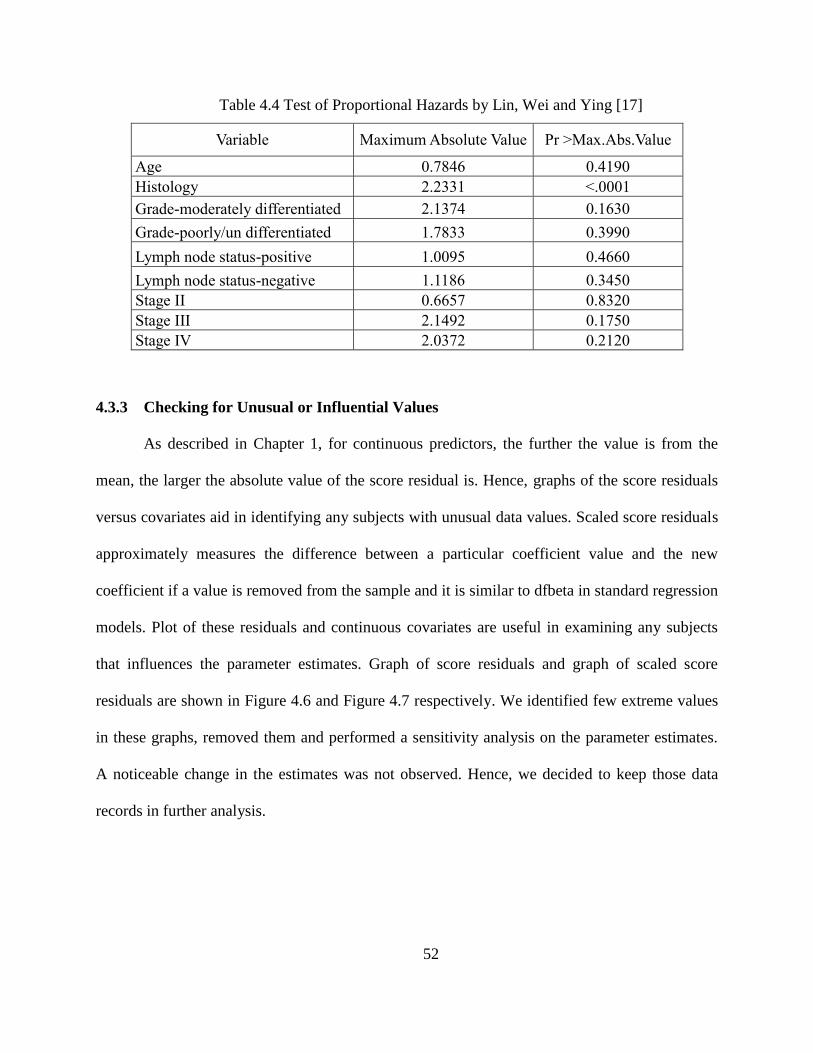
52
Table 4.4 Test of Proportional Hazards by Lin, Wei and Ying [17]
Variable Maximum Absolute Value Pr >Max.Abs.Value
Age 0.7846 0.4190
Histology 2.2331 <.0001
Grade-moderately differentiated 2.1374 0.1630
Grade-poorly/un differentiated 1.7833 0.3990
Lymph node status-positive 1.0095 0.4660
Lymph node status-negative 1.1186 0.3450
Stage II 0.6657 0.8320
Stage III 2.1492 0.1750
Stage IV 2.0372 0.2120
4.3.3 Checking for Unusual or Influential Values
As described in Chapter 1, for continuous predictors, the further the value is from the
mean, the larger the absolute value of the score residual is. Hence, graphs of the score residuals
versus covariates aid in identifying any subjects with unusual data values. Scaled score residuals
approximately measures the difference between a particular coefficient value and the new
coefficient if a value is removed from the sample and it is similar to dfbeta in standard regression
models. Plot of these residuals and continuous covariates are useful in examining any subjects
that influences the parameter estimates. Graph of score residuals and graph of scaled score
residuals are shown in Figure 4.6 and Figure 4.7 respectively. We identified few extreme values
in these graphs, removed them and performed a sensitivity analysis on the parameter estimates.
A noticeable change in the estimates was not observed. Hence, we decided to keep those data
records in further analysis.

53
Figure 4.6 Plot of Score Residuals versus Age
Figure 4.7 Plot of Scaled Score Residuals versus Age

54
4.4 How to Handle the Model Inadequacies?
Because we have identified that our initial Cox PH model is not adequate for the data,
next step is to correct the model for inadequacies or apply alternative models. The simplest
method to correct for the violations of the proportional hazards is to use the stratified Cox model.
Stratified Cox model is the same Cox PH model stratified by the levels of the covariate with non-
proportional hazards and with all the covariates that satisfy the model assumption. That is, for
our data there will be two models for the two histology levels with same covariates and same
parameter estimates and the two models differs by their baseline hazard function. One major
limitation of this model is that risks cannot be estimated for the stratifying covariate. Also, if the
non-proportional hazards exist in a continuous variable, it needed to be categorized before
stratifying. Another limitation is, if most of the variables violate the assumption there will be too
many stratification levels and model interpretations will not be very useful.
Another approach to address non-proportional hazards in Cox model is to extend the
model to have time varying effects so that they will capture the how the hazard ratios change
with time. Time varying effects can be modeled as piecewise constant or continuous functions of
time which is more appropriate to the data. A practical issue is identifying the correct function of
time to include in the time varying effect. Sometimes, smoothed Schoenfeld residual plot may
suggest the time varying nature of the effect or the hazard ratio. As the main focus of this chapter
is parametric survival modeling, stratified or extended Cox models are not presented here.
Parametric survival models assume specific probability distribution functions for survival times.
If the assumed probability distribution is fits well to the data then these parametric survival
models will give more precise inferences about the survival experiences than the semi-parametric
Cox PH model. In particular, it would give relative hazards and median survival time estimates

55
with smaller standard errors. In the following two sections 4.5 and 4.6, such two types of
parametric models, Accelerated Failure Time (AFT) models and flexible parametric models will
be presented for the ovarian cancer survival data of interest.
4.5 The AFT Model
The accelerated failure time model is a regression model for survival data, in which
explanatory variables measured on an individual, are assumed to act multiplicatively on the time
[22]. The parameters in the accelerated failure time models are interpreted as effects of time
which makes it more intuitively appealing to those who are not familiar with survival analysis.
This model works to measure the effect of covariate to “accelerate” or to “decelerate” survival
time. Suppose that we are interested in evaluating the effect of a covariate (with two levels) on
the survival time. Let the survival function for individuals in level 1 and level 2 at time t be 𝑆1(𝑡)
and 𝑆2(𝑡) respectively. Then, under the AFT model,
𝑆1(𝑡) = 𝑆2(𝜙𝑡) (4.1)
where 𝜙 is the acceleration factor (or deceleration factor depending on the value it takes).
One can interpret that survival time of an individual in level 2 is 𝜙 times of the survival time of
an individual in level 1. In the case where event of interest is “death”, then 𝜙 less than one means
that an individual in level 2 has a shorter lifespan than an individual in level 1.
Let T denote a continuous non-negative random variable representing the survival time.
Then we can characterize the distribution of survival time as a function of covariates as given
below.
𝑇 = 𝑒𝑥𝑝{𝛽0 + 𝛽1𝑋1 + ⋯ + 𝛽𝑝𝑋𝑝} × 휀, (4.2)

56
where 𝛽1, . . . , 𝛽𝑝 are unknown coefficients of the p covariates 𝑋1, … , 𝑋𝑝 and they reflect the
effect that each variable has on the survival time. The systematic component,
𝑒𝑥𝑝{𝛽0 + 𝛽1𝑋 + ⋯ + 𝛽𝑝𝑋𝑝},
is written in this form make it positive and the error term also takes positive values.
Equation (4.2) leads to the log-linear form of the model given below.
ln(t) = μ + 𝛽1𝑋1 + ⋯ + 𝛽𝑝𝑋𝑝 + 𝜎 × 휀∗. (4.3)
Parameters 𝜇 and 𝜎 are associated with the probability distribution of survival time T. The
random variable, 휀∗, also follows a particular probability distribution which can be related to the
underlying probability distribution of survival time, T.
4.5.1 Identifying a Suitable Probability Distribution for AFT Model
An exploratory analysis was carried out prior to the model fitting to get guidance on
choosing a suitable probability distribution for the disease specific survival times of interest. One
of the approaches that can be used to identify the underlying distribution of survival times is to
use survival function with some transformation which leads to a straight line plot against log of
time. After examining the transformed survival function plots under several distributions on the
survival times, one can narrow down the potential probability distributions for further analysis.
The underlying methodologies of obtaining the subject plots under Weibull, log-logistic and
lognormal probability distributions are given below. Let T be a random variable that represents
survival time.
Weibull probability distribution: Suppose T follows a Weibull distribution with parameters, 𝜆
and 𝛾. Then the survival function is given by

57
𝑺(𝒕) = 𝒆𝒙𝒑{−(𝝀𝒕)𝜸}.
Rearranging the survival function to obtain a straight line equation will lead the following
𝑙𝑛{−ln(𝑆(𝑡)} = 𝛾 ln(𝜆) + 𝛾ln (𝑡). (4.4)
If the points on the plot of 𝑙𝑛{−𝑙𝑛𝑆(𝑡)} against ln (𝑡) fall on an approximate straight line then it
indicates that a Weibull distribution is appropriate for the survival time data.
Log-logistic probability distribution: Suppose T follows a log-logistic distribution with
parameters, 𝜃 and 𝜅. Then the survival function is given by
𝑆(𝑡) = {1 + exp(𝜃) 𝑡𝜅}−1.
Rearranging the survival function yields the equation shown below which represents a straight
line.
𝑙𝑛 (𝑆(𝑡)
1−𝑆(𝑡)) = −𝜃 − 𝜅ln (𝑡). (4.5)
If we observe an approximate straight line for the plot of 𝑙𝑛[𝑆(𝑡) (1 − 𝑆(𝑡)⁄ ] against ln (𝑡) then
it recommends a log-logistic probability distribution for survival time.
Lognormal probability distribution: Suppose T follows a lognormal distribution with parameters,
𝜇 and 𝜎. Then the survival function is given by
𝑆(𝑡) = 1 − 𝜙 (ln(t)−μ
𝜎),
where 𝜙(. ) is the standard normal cumulative distribution function. Rearranging the survival
function yields the equation shown below which represents a straight line.
𝜙−1[1 − 𝑆(𝑡)] =1
𝜎ln (𝑡) −
𝜇
𝜎 . (4.6)

58
If it results in an approximate straight line for the plot of 𝜙−1[1 − 𝑆(𝑡)] against ln (𝑡) then it is
recommended that a lognormal probability distribution for survival time.
After examining the transformed survival function plots under several distributions on
ovarian cancer survival times, we narrowed down our analysis to Weibull, log-logistic and
lognormal distributions. Plots of transformations of survival functions represented by Equations
(4.4), (4.5) and (4.6) are shown in Figures 4.8(a), 4.8(b) and 4.8(c) respectively. It can be seen
that Weibull and log-logistic distributions fit well to survival time data. Also, lognormal
distribution seems fairly fitting the survival time data. Therefore, we decided to consider all three
of these probability distributions for further analysis of the models.
Figure 4.8(a). Plot of Transformations of Survival Functions for Weibull Distribution

59
Figure 4.8(b). Plot of Transformations of Survival Functions for Log-logistic Distribution
Figure 4.8(c). Plot of Transformations of Survival Functions for Lognormal Distribution

60
4.5.2 Model Selection and Goodness-of-Fit of the AFT Model
Accelerated failure time models are fitted by maximum likelihood procedure using
iterative methods. AFT models under Equation 4.3 were fitted under Weibull, lognormal and
log-logistic probability distributions. Initial models consisted of all the covariates including two
way interactions. Backward elimination procedure with removal probability 0.05 was performed
based on likelihood ratio tests to obtain the most appropriate model under each probability
distribution of interest.
One of the approaches that can be used to select between candidate AFT models is
Akaike’s Information Criteria (AIC). AIC is a goodness of fit statistic that is used compare
statistical models by trading off the complexity of the model against the how well the model fits
the data. The AIC for an AFT model is defined as
𝐴𝐼𝐶 = −2𝐿𝐿 + 2(𝑝 + 𝑘) , (4.7)
where LL is the logarithm of the likelihood of the model, p is the number of coefficients in the
model (excluding the intercept) and k is the number of ancillary parameters (that is, number of
parameters in the underlying probability distribution of survival time). A lower AIC value
indicates a better model compared to the other models of interest.
Cox and Snell residuals [13] described in Chapter 1 can also be used to evaluate the
goodness-of-fit of AFT models. This method assesses whether the data support the particular
parametric form of the hazard function. This method computes cumulative hazard function based
on the fitted model to build Cox-Snell residuals. The Cox and Snell residual, 𝑟𝑗, is defined by
𝑟𝑗 = ��(𝑇𝑗|𝒁𝑗), (4.8)
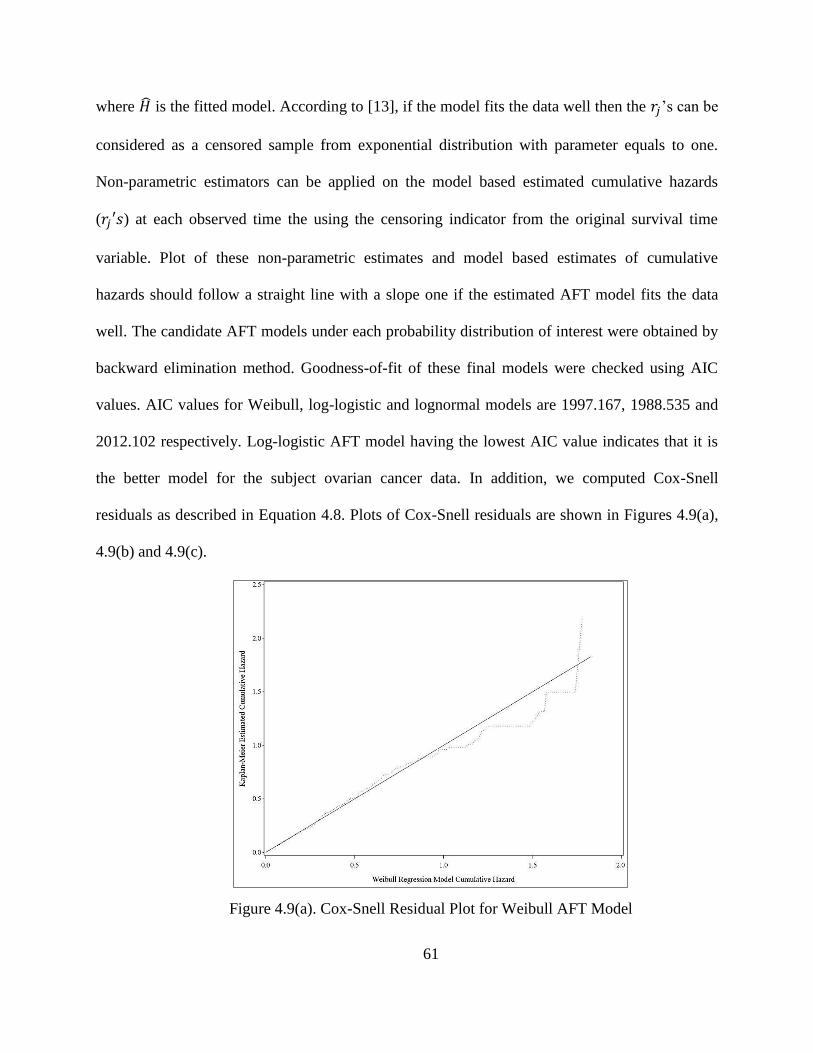
61
where �� is the fitted model. According to [13], if the model fits the data well then the 𝑟𝑗’s can be
considered as a censored sample from exponential distribution with parameter equals to one.
Non-parametric estimators can be applied on the model based estimated cumulative hazards
(𝑟𝑗′𝑠) at each observed time the using the censoring indicator from the original survival time
variable. Plot of these non-parametric estimates and model based estimates of cumulative
hazards should follow a straight line with a slope one if the estimated AFT model fits the data
well. The candidate AFT models under each probability distribution of interest were obtained by
backward elimination method. Goodness-of-fit of these final models were checked using AIC
values. AIC values for Weibull, log-logistic and lognormal models are 1997.167, 1988.535 and
2012.102 respectively. Log-logistic AFT model having the lowest AIC value indicates that it is
the better model for the subject ovarian cancer data. In addition, we computed Cox-Snell
residuals as described in Equation 4.8. Plots of Cox-Snell residuals are shown in Figures 4.9(a),
4.9(b) and 4.9(c).
Figure 4.9(a). Cox-Snell Residual Plot for Weibull AFT Model

62
Figure 4.9(b) Cox-Snell Residual Plot for Log-logistic AFT Model
Figure 4.9(c). Cox-Snell Residual Plot for Lognormal AFT Model
It can be observed that the plotted points in Figures 4.9(a), (b) and (c) deviate from the straight
line with unit slope and zero intercept under all three AFT models. However, compared to
lognormal and Weibull, Cox-Snell residual plot for log-logistic AFT model follow the reference

63
straight line more closely. Hence, this approach also, suggests that the log-logistic AFT model
provides the best fit for the ovarian cancer survival data of interest.
Another methodology that can be used to assess the adequacy of the AFT model is
described below.
Suppose a model has covariates 𝑥1, 𝑥2, … . , 𝑥𝑝 and estimated coefficients, 𝑏1, 𝑏2, … . , 𝑏𝑝. Then,
the prognostic index (PI) can be computed as
𝑃𝐼 = 𝑏1𝑥1 + 𝑏2 𝑥2+. … + 𝑏𝑝 𝑥𝑝. (4.9)
After PI’s are computed for each patient, risk groups can be formed by categorizing the ranked
PIs. As suggested by [23], number of risk groups can be determined by
𝐺 = 𝑖𝑛𝑡{𝑚𝑎𝑥[2, 𝑚𝑖𝑛(10, 𝑛𝑢𝑚𝑏𝑒𝑟 𝑜𝑓 𝑒𝑣𝑒𝑛𝑡𝑠 𝑑𝑖𝑣𝑖𝑒𝑑 𝑏𝑦 40)]}. (4.10)
Then observed and expected counts in each risk group are compared and a score test is applied to
the differences in the counts. We applied this method to our final AFT model based on log-
logistic probability distribution and the results obtained are shown in Table 4.5. It can be seen
that observed and expected counts are close in all the risk groups except for one group. This
evidence also supports that there’s no major problems in the fit of the selected log-logistic AFT
model. Validation by discrimination [24] results that our model has a c-index of 77%. This
provides that this AFT model has good prediction accuracy.
Results from the most appropriate AFT model for ovarian cancer data is shown in Table
4.6. Age was centered at their means for their baseline hazard function to be meaningful. We
found that age at diagnosis has significant interactions with the grade and histology.
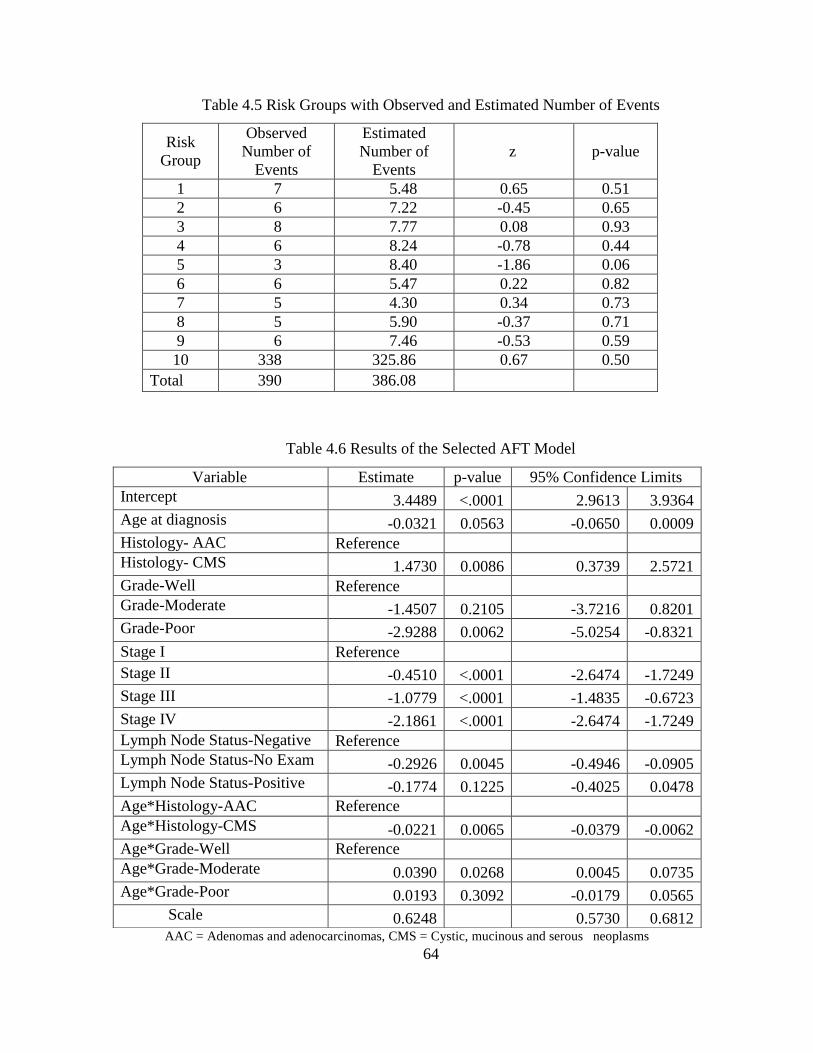
64
Table 4.5 Risk Groups with Observed and Estimated Number of Events
Risk
Group
Observed
Number of
Events
Estimated
Number of
Events
z p-value
1 7 5.48 0.65 0.51
2 6 7.22 -0.45 0.65
3 8 7.77 0.08 0.93
4 6 8.24 -0.78 0.44
5 3 8.40 -1.86 0.06
6 6 5.47 0.22 0.82
7 5 4.30 0.34 0.73
8 5 5.90 -0.37 0.71
9 6 7.46 -0.53 0.59
10 338 325.86 0.67 0.50
Total 390 386.08
Table 4.6 Results of the Selected AFT Model
AAC = Adenomas and adenocarcinomas, CMS = Cystic, mucinous and serous neoplasms
Variable Estimate p-value 95% Confidence Limits
Intercept 3.4489 <.0001 2.9613 3.9364
Age at diagnosis -0.0321 0.0563 -0.0650 0.0009
Histology- AAC Reference
Histology- CMS 1.4730 0.0086 0.3739 2.5721
Grade-Well Reference
Grade-Moderate -1.4507 0.2105 -3.7216 0.8201
Grade-Poor -2.9288 0.0062 -5.0254 -0.8321
Stage I Reference
Stage II -0.4510 <.0001 -2.6474 -1.7249
Stage III -1.0779 <.0001 -1.4835 -0.6723
Stage IV -2.1861 <.0001 -2.6474 -1.7249
Lymph Node Status-Negative Reference
Lymph Node Status-No Exam -0.2926 0.0045 -0.4946 -0.0905
Lymph Node Status-Positive -0.1774 0.1225 -0.4025 0.0478
Age*Histology-AAC Reference
Age*Histology-CMS -0.0221 0.0065 -0.0379 -0.0062
Age*Grade-Well Reference
Age*Grade-Moderate 0.0390 0.0268 0.0045 0.0735
Age*Grade-Poor 0.0193 0.3092 -0.0179 0.0565
Scale 0.6248 0.5730 0.6812

65
Also, age at diagnosis and grade of the cancer has a significant impact on the ovarian cancer
survival. The main effect of lymph node status is significantly contributing to the model. Race
was not a significant factor in this model. Size is also not significant, may be due to stage being
highly significant in this model and size information are included in stage.
In AFT model, exponent of coefficients provides the effect of a covariate on the time
scale rather than on the hazard as in Cox proportional hazard model. This quantity is called
“acceleration/decelerations factor” and gives more easily understood interpretations. For
example, the estimated acceleration factor for lymph node status-positive compared to negative
is 0.84 (= 𝑒−0.1774). That is, controlling for other variables, the expected time to death by
ovarian cancer whose lymph node status positive is about 16% lower than those who have
negative lymph node status. However, this effect is not statistically significant (p-value=0.1225).
Similarly, controlling for other variables, the expected time to death by ovarian cancer is
accelerated by 25% (𝑒(−0.2926) = 0.75) for an individual with lymph node status-not examined
compared to an individual with lymph node status-negative. Estimated time ratio for individuals
in grade-moderate relative to individuals in grade-well is given by, 𝑒𝑥𝑝(−1.4507) = 0.25
adjusted for other covariates at their baseline levels (age 58.92 years, histology- AAC, stage-I
and lymph node status-negative). This means that, survival times of individuals in grade-
moderate are 0.25 times those of individuals in grade-well, adjusted for other covariates at their
baseline levels. Since, we centered age at mean (58.92 years), the coefficient of the age*grade-
moderate term is not counted in this effect computation.

66
4.6 Flexible Parametric Survival Model
This section introduces a more flexible survival model which addresses limitations found
in Cox proportional hazard or parametric accelerated failure time models. Starting point of
statistical modeling of survival data is Cox regression which doesn’t require the knowledge of
the underlying probability distribution function of the survival times more specifically baseline
hazard function. It is mainly focused on hazard ratios rather than the hazard function or survival
function. When the survival predictions or hazard function are more of interest under the study,
underlying probability distribution function can be estimated or assumed and then a parametric
statistical model can be developed for survival data. However, it is always not the case that a
standard probability distribution will capture the underlying probability distribution of the data
well. In such cases, spline functions can be used to estimate the behavior of the survival data and
a more flexible parametric model can be developed. Methodology given in this section follows
the work of [25] and [26]. Before moving on to the model formulation, an introduction to the
spline functions that is to be used in the parametric model is given below.
Restricted cubic splines are spline functions consist of set of piecewise polynomials. The
places where these polynomials are connected are called knots. Mostly used splines in practice
are third degree polynomials that are called cubic splines. Since cubic splines can behave poorly
in tails, it is recommended to constrain at and beyond the lower and upper boundary to be
straight lines. The complexity of the spline function is depends on the number of knots and their
locations.
The restricted cubic spline function on x scale with k knots takes the form
𝑠(𝑥; 𝛾) = 𝛾0 + 𝛾1𝑊1 + 𝛾2𝑊2 + ⋯ + 𝛾𝑘−1𝑊𝑘−1, (4.11)

67
where W’s are basis functions and are defined as
𝑊𝑗 = 𝑥 ; 𝑗 = 1 ,
𝑊𝑗 = (𝑥 − 𝑘𝑗)+3 − 𝜆𝑗(𝑥 − 𝑘𝑗)
+
3− (1 − 𝜆𝑗)(𝑥 − 𝑘𝑗)
+
3; 𝑗 = 2, … , 𝑘 − 1
and (𝑥 − 𝑘𝑗)+
3= 𝑚𝑎𝑥 [0, (𝑥 − 𝑘𝑗)
3] and 𝜆𝑗 =
𝑘𝑘−𝑘𝑗
𝑘𝑘−𝑘1.
4.6.1 Flexible Parametric Model Formulation
We start by the widely used parametric model, the Weibull model for survival times (t).
Then the survival distribution function, 𝑆(𝑡) and the hazard function, ℎ(𝑡) is given by
𝑆(𝑡) = exp (−𝜆𝑡𝛾)
and ℎ(𝑡) = 𝜆𝛾𝑡𝛾−1
respectively,
where 𝛾 is the shape parameter, and hazard function is monotonically decreasing if 𝛾 < 1,
monotonically increasing if 𝛾 > 1 and constant when 𝛾 = 1.
Log cumulative hazard function with respect to the Weibull parametric survival model is given
by
𝑙𝑛𝐻(𝑡) = 𝑙𝑛𝜆 + 𝛾𝑙𝑛𝑡. (4.12)
Equation 4.12 corresponds to a monotonic function which is fitted to log cumulative hazard.
However, in practice monotonically increasing or decreasing function may not capture the true
nature of the cumulative hazard function. In those cases, restricted cubic spline functions defined
in Equation 4.11 will be more suitable and useful in modeling the log cumulative hazard function

68
of the data. Let’s denote right hand side of the Equation 4.12 using a restricted cubic spline
function as shown in Equation 4.11 using scale 𝑙𝑛 𝑡. Then,
𝑙𝑛𝐻(𝑡) = 𝑠(𝑙𝑛 𝑡; 𝛾).
Now incorporating the covariate vector, Z and the corresponding regression parameter vector, 𝜷
we have cumulative hazard form the flexible parametric survival model
𝑙𝑛𝐻(𝑡; 𝒁) = 𝑠(𝑙𝑛 𝑡; 𝛾) + 𝒁 𝜷, (4.13)
where 𝑠(𝑙𝑛 𝑡; 𝛾) is the flexible log cumulative baseline function, modeled by a spline function.
Differentiation and some rearrangements of Equation 4.13 will give the hazard function form of
the flexible parametric model
𝑙𝑛(𝑡; 𝒁) = 𝑙𝑛ℎ0(𝑡) + 𝒁 𝜷, (4.14)
where it can be shown that
𝑙𝑛ℎ0(𝑡) = − ln 𝑡 + ln(𝛾1 + 𝛾2𝑊2′ + ⋯ + 𝛾𝑘−1𝑊𝑘−1
′ ) + 𝛾0 + 𝛾1𝑊1 + 𝛾2𝑊2 + ⋯ + 𝛾𝑘−1𝑊𝑘−1.
4.6.2 Flexible Parametric Model with Time Dependent Effects
When there are covariates with non-proportional hazards then flexible parametric model
in Equation 4.14 have to be adjusted for it as this model is a special case of general class of
proportional hazards (PH) models. These non-proportional hazards can be incorporated to the
flexible parametric model in terms of piecewise or continuous time dependent effects. Suppose
we are denoting time dependent effect by continuous function using splines. Then interaction

69
terms formed with a spline function and the non-proportional hazard covariates can be used to
model the time dependent effects in the model.
The general flexible parametric model with ‘d’ number of time dependent effects can be given as
𝑙𝑛𝐻(𝑡; 𝒁) = 𝑠(𝑙𝑛 𝑡; 𝛾) + ∑ 𝑠(𝑙𝑛 𝑡; 𝛿𝑗)𝑍𝑗 +𝑑𝑗=1 𝒁 𝜷. (4.15)
This approach computes different sets of spline functions one set for the baseline hazard and the
other set for the time dependent effects. Number of knots differs between the two spline
functions.
Parameters of the flexible parametric model are estimated using maximum likelihood
method. Selection of this subject model can be done using the appearance of the fitted
survival/hazard function along with the Akaike’s Information Criteria (AIC). When developing
the flexible parametric model, the following aspects need to be considered. (i) baseline
complexity, (ii) mostly contributing variables along with their correct functional forms and (iii)
time varying effects if exists. It is known that, significance of the covariates in the flexible
parametric model and the Cox PH model are robust [26]. Also, we have found non-proportional
hazards when building Cox PH model. Hence, we will use those known characteristics of the
data, in building the flexible parametric model. That is, we start the initial flexible parametric
model with the covariates found to be mostly contributing and time varying effect for Histology
(an interaction with ln t).
Model selection: We started with finding the appropriate number of knots and the corresponding
spline function which estimates the behavior of the hazard. We explored different knot positions
at percentiles of the uncensored log survival times. AIC along with the estimated hazard
functions graphs was used to select the best model. Table 4.7 shows the AIC values for several
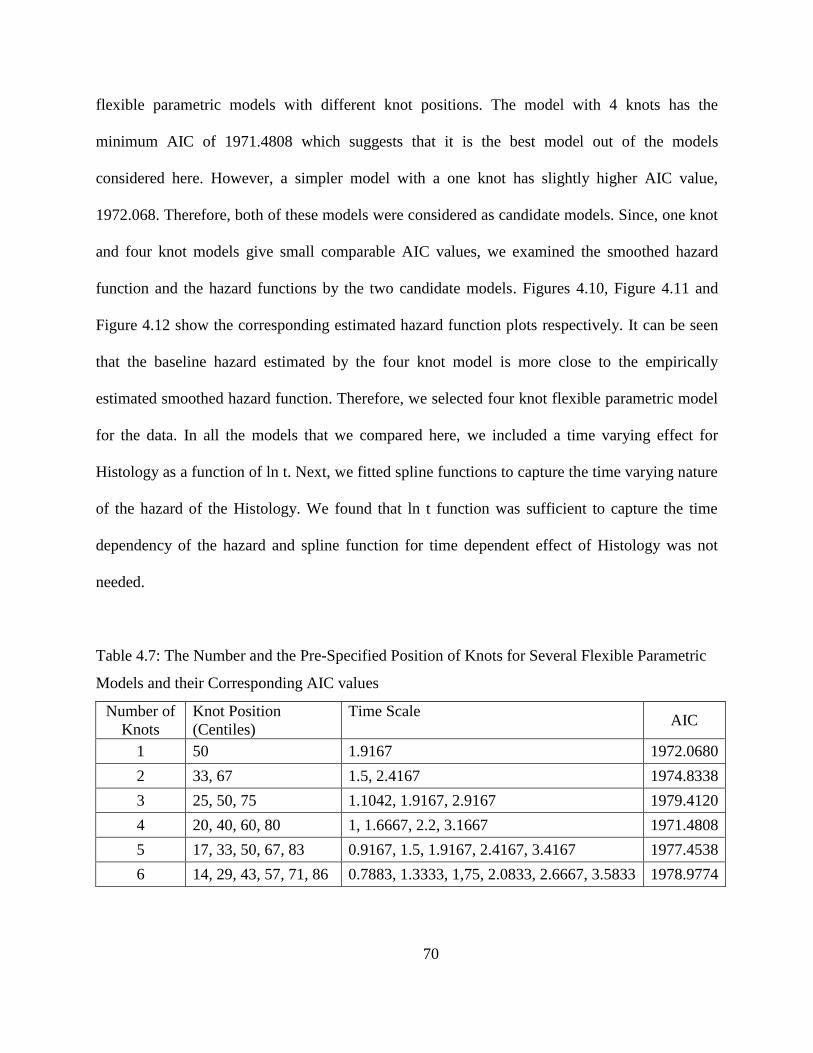
70
flexible parametric models with different knot positions. The model with 4 knots has the
minimum AIC of 1971.4808 which suggests that it is the best model out of the models
considered here. However, a simpler model with a one knot has slightly higher AIC value,
1972.068. Therefore, both of these models were considered as candidate models. Since, one knot
and four knot models give small comparable AIC values, we examined the smoothed hazard
function and the hazard functions by the two candidate models. Figures 4.10, Figure 4.11 and
Figure 4.12 show the corresponding estimated hazard function plots respectively. It can be seen
that the baseline hazard estimated by the four knot model is more close to the empirically
estimated smoothed hazard function. Therefore, we selected four knot flexible parametric model
for the data. In all the models that we compared here, we included a time varying effect for
Histology as a function of ln t. Next, we fitted spline functions to capture the time varying nature
of the hazard of the Histology. We found that ln t function was sufficient to capture the time
dependency of the hazard and spline function for time dependent effect of Histology was not
needed.
Table 4.7: The Number and the Pre-Specified Position of Knots for Several Flexible Parametric
Models and their Corresponding AIC values
Number of
Knots
Knot Position
(Centiles)
Time Scale AIC
1 50 1.9167 1972.0680
2 33, 67 1.5, 2.4167 1974.8338
3 25, 50, 75 1.1042, 1.9167, 2.9167 1979.4120
4 20, 40, 60, 80 1, 1.6667, 2.2, 3.1667 1971.4808
5 17, 33, 50, 67, 83 0.9167, 1.5, 1.9167, 2.4167, 3.4167 1977.4538
6 14, 29, 43, 57, 71, 86 0.7883, 1.3333, 1,75, 2.0833, 2.6667, 3.5833 1978.9774

71
Figure 4.10 Smoothed Baseline Hazard Function
Figure 4.11 Estimated Baseline Hazard Function from One Knot Spline Model
0
.05
.1.1
5.2
Haza
rd F
unctio
n
0 2 4 6Time (years)
Smoothed Hazard Estimate
0.00
0.05
0.10
0.15
0.20
Haza
rd F
unctio
n
0 2 4 6Time (years)
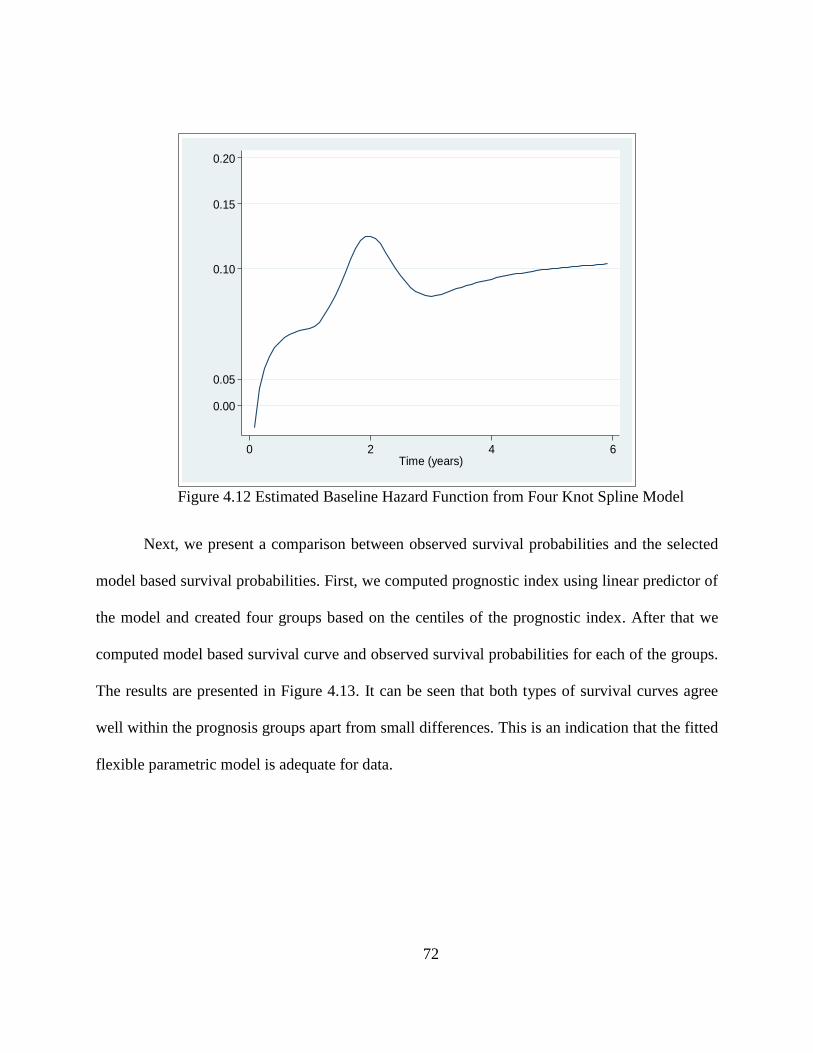
72
Figure 4.12 Estimated Baseline Hazard Function from Four Knot Spline Model
Next, we present a comparison between observed survival probabilities and the selected
model based survival probabilities. First, we computed prognostic index using linear predictor of
the model and created four groups based on the centiles of the prognostic index. After that we
computed model based survival curve and observed survival probabilities for each of the groups.
The results are presented in Figure 4.13. It can be seen that both types of survival curves agree
well within the prognosis groups apart from small differences. This is an indication that the fitted
flexible parametric model is adequate for data.
0.00
0.05
0.10
0.15
0.20
Haza
rd F
unctio
n
0 2 4 6Time (years)

73
Figure 4.13 Observed Survival Probabilities and the Flexible Parametric Model Based
Survival Probabilities (smooth lines)
Parameter estimates of the covariates from selected flexible parametric model are shown
in Table 4.8. The general interpretation of the parameter estimates (��) is that they are equal to
log hazard ratio of the corresponding covariate. If one wants to know the absolute behavior of
the hazard rates it can be computed from using the spline estimates for baseline cumulative
hazard and substituting in Equation 4.15 since this model contains a time varying effect for
Histology otherwise Equation 4.13 can be used. Hazard rates computed for each stage is shown
in Figure 4.14. As expected for early stages hazard rates are low and when stage gets advanced
hazard rates are higher. In addition, survival curves, hazard differences can be computed for the
variable stage. Figure 4.15 presents the differences in hazard rates for Histology-CMS and
Histology-AAC which shows an overall increasing trend. Also, we present the hazard ratios for
the variable Histology estimated from the initial Cox model in Section 4.3 and from the flexible
parametric model (Figure 4.16). It can be seen that if the standard model was used we would

74
force the Histology variable to have a constant hazard ratio. In contrast, we are able to estimate
the time varying nature of the hazard ratio from the flexible parametric model that we have
developed. Similarly, effects of the other covariates can be computed from this model where
additional estimates than the standard Cox regression could be obtained.
Table 4.8 Summary Results of the Flexible Parametric Model
Variable Estimate
(��) p-value 95% Confidence Limits
Age at diagnosis 0.0163 0.6160 -0.0473 0.0799
Histology- AAC Ref
Histology- CMS -1.7547 0.0060 -2.9972 -0.5123
Grade-Well Ref
Grade-Moderate 2.3887 0.1710 -1.0315 5.8088
Grade-Poor 4.2454 0.0080 1.0862 7.4047
Stage I Ref
Stage II 0.5707 0.0500 0.0012 1.1401
Stage III 1.7311 0.0000 1.2999 2.1623
Stage IV 2.3711 0.0000 1.9210 2.8211
Lymph Node Status-Negative Ref
Lymph Node Status-No Exam 0.3637 0.0070 0.0996 0.6279
Lymph Node Status-Positive 0.2142 0.1440 -0.0730 0.5014
Age*Histology-AAC Ref
Age*Histology-CMS 0.0074 0.0310 0.0007 0.0141
Age*Grade-Well Ref
Age*Grade-Moderate -0.0165 0.2440 -0.0444 0.0113
Age*Grade-Poor -0.0192 0.0290 -0.0364 -0.0019
Histology*ln(time) 0.1241 0.0000 0.0696 0.1786
AAC = Adenomas and adenocarcinomas, CMS = Cystic, mucinous and serous neoplasms

75
Figure 4.14 Estimated Hazard Rates for Stage under the Flexible Parametric Model
Figure 4.15 Estimated Differences of Hazard Rates for Histology (CMS-AAC) under the
Flexible Parametric Model
Stage IV
Stage III
Stage II
Stage I
02
46
8
Haza
rd R
ate
s (
pe
r 1
00
0 p
ers
on
yea
rs
0 2 4 6Time (Years)
0.5
11
.52
2.5
Diffe
ren
ce in
Ha
zard
Rate
s (
pe
r 10
00
pers
on y
ea
rs
0 2 4 6Time (Years)

76
Figure 4.16 Comparison of Hazard Ratios from Standard Cox PH Model and the Flexible
Parametric Model with Time Varying Effects
4.7 Discussion
The aim of this chapter was to develop a survival model for ovarian cancer data with
some identified predictor variables, age, tumor size, histology, grade, stage and lymph node
status. Process started with an exploratory analysis where we found that disease-free survival
among the races are not significantly different. Next, the Cox proportional hazard model was
fitted to the data and a thorough model adequacy checking was done where it was found that
histology has a time dependent effect on the hazard. That is, disease-specific risk of death for
subject in Histology-CMS compared to a subject in Histology-AAC is not constant over the
follow-up time. Therefore, Cox PH model was not appropriate for this data. Also, another
limitation of the Cox PH model is that it doesn’t require estimating the baseline hazard function
which consist important information about the data. We considered two parametric survival
models, in order to address the limitations of the standard Cox PH model and to obtain additional
0.5
11
.52
Haza
rd R
atios
0 2 4 6Time (Years)
Cox Proportional Hazard Model
0.5
11
.52
Haza
rd R
atios
0 2 4 6Time (Years)
Flexible Parametric Model with Time Varying Effects

77
information about the survival experience. One of the parametric models is the accelerated
failure time model presented in section 4.5.
AFT model provides the effects of covariate on time scale which can be easily
understood by anyone. The effect of covariate can be interpreted as the acceleration/deceleration
of the time to an event of interest. Relevance of the selected log-logistic AFT model is that
given an individual who satisfies the inclusion criteria and has information about the age,
histology, grade, stage and the lymph node status, we can use our model to predict survival time
or survival probability at specified times. A disadvantage of an AFT model is that we have to
identify the underlying probability distribution for the survival time and it is always not possible
to find the correct distribution as survival experiences in real life could be complex. Therefore, it
is worth of exploring more flexible parametric model which can capture true survival patterns of
data more closely. The flexible parametric survival model that we presented in section 4.6 is
such a model.
Flexible parametric model can be presented as an extension to the standard Cox PH
model. The main difference is that in flexible parametric model, baseline hazard is estimated by
a set of cubic polynomials while in Cox PH model it is unspecified. Also, this model can
accommodate time varying effects to address the non-proportionalities. This flexible parametric
model has more advantages than the Cox PH model and even than the AFT model if the
underlying probability distribution is not properly approximated. We computed Harrell’s c-index
value for the flexible parametric model without time varying effects and it gave an estimate 76%
which is comparable to the AFT model. Due to some computational difficulty it couldn’t be
computed for the time varying model. We believe that predictive ability of the time varying
flexible parametric model would be higher than 76%.

78
4.8 Contributions
In the present chapter, we have identified and estimated some important aspects regarding
ovarian cancer survival time data as below.
Significantly contributing prognostic factors for disease-free survival of ovarian cancer
Histology types Adenomas and adenocarcinoma and Cystic, mucinous and serous neoplasms
has risk ratios that vary with follow up time.
Age has a linear effect on the risk of death by ovarian cancer.
A parametric model that gives effects of risk factors on the time scale than on risk scale
A flexible parametric model which provides more information about data than the standard
Cox regression model.
Absolute hazard and survival functions with respect to the significant risk factors.

79
CHAPTER 5
EXTENDED COX REGRESSION MODEL TO ADDRESS NON-LINEAR
EFFECTS AND NON-PROPORTIONAL HAZARDS WITH AN APPLICATION TO
BREAST CANCER DATA
5.1 Introduction
Cox proportional hazard (CPH) model [27] is a popular method that is being used in studying the
relationship between survival times and explanatory variables. A careful development of a model
and the assessment of model adequacy can result in a powerful, numerically stable and easily
generalizable model. The identification of inadequacies of a model is an important step towards
the development of more reliable and accurate survival time models. The assessment of the
adequacy of statistical models is only possible through the combination of several statistical
analyses and proper investigation regarding the purposes for which the statistical model was
initially conceptualized and developed for [28]. Even though there are many model adequacy
methods that have been developed for the CPH model, usage of these methods does not seem to
be very popular in applications of this model in real life data. Therefore, the goal of this study is
to explore certain methods of assessing the fit of CPH models and to discuss the effects of the
CPH model inadequacies. In the present study of breast cancer data from Surveillance,
Epidemiology, and End Results (SEER) program, we discuss and explore the methods that can
be used to assess non-proportionalities of the covariates and proposes a data driven method to
adjust the Cox model for non-proportionalities. Also, we discuss the methods that can be used to

80
assess the linearity of the continuous covariates and how to include non-linear effects in the CPH
model appropriately.
Female breast cancer patients of age 20 years and above who were diagnosed with
invasive ductal carcinoma during the years 1990 to 2000 were extracted from the SEER breast
cancer database for the present study. Invasive ductal carcinoma means that cancer has grown
out from milk ducts into the nearby breast tissue, and maybe to the lymph nodes and/or other
parts of the body. This is the most common type of breast cancer and accounts for about 70%
breast cancer incidence. The selected study data consists of a random sample of 1000 patients.
Potential prognostic factors, including race and age of the patient, tumor size, lymph node status,
extension of the tumor, tumor stage and outcome of progesterone receptor assay (PRA) were
selected according to the current knowledge about the risks of cancer. Race of the patient is
categorized to white, black and other. Age was measured at the diagnosis. Tumor size is the
largest dimension or diameter of the primary tumor and it is measured at the diagnosis in mm at
the diagnosis. The variable lymph node status represents whether regional lymph nodes
examined pathologically contain metastases (spread of cancer to lymph nodes). Lymph node-
negative means the lymph nodes do not contain cancer and lymph node-positive means the
lymph nodes contain cancer. Cancer cells in regional lymph nodes may mean that cancer is more
likely to spread to other parts of the body. This item codes the farthest documented extension of
tumor away from the primary site, either by contiguous extension or distant metastases [29].
Stage variable in our study represents AJCC stage 3rd edition (1988-2003) and has been derived
by algorithm from extent of disease. It is known that some breast cancer cells need hormones to
grow. These cancer cells have hormone receptors inside which are special proteins that when
hormones attach to those, the cancer cells grow. A pathologist examines the cancer cells and

81
determines whether they have many hormone receptors (hormone receptor-positive) or few or no
hormone receptors (hormone receptor-negative). These hormones are estrogen and progesterone.
Breast cancers that are estrogen-positive also tend to be progesterone positive, vice versa [30].
Our data supports this statement. Hence, we studied only progesterone receptor status (PRA).
Survival time until cancer related death is the response variable of interest and death by other
causes, lost to follow up or alive at the end of the recording period is considered as censored.
5.2 Assessing the Model Adequacy
After an initial model has been developed using backward elimination method at a
removal significance rate of 5%, we moved on to evaluating the model. A detailed theoretical
description of the model adequacy techniques of the CPH model is given in Chapter 1. We used
three types of residuals that can be calculated for the Cox model, namely Cox-Snell, Martingale
and Schoenfeld residuals, to assess the model adequacy, namely overall goodness-of-fit, unusual
and influential data values, correct functional form of the continuous covariates and the
proportional hazard assumption.
First, overall goodness of fit of the model was assessed using Cox-Snell residual plot.
The concept behind this method is to examine whether it is reasonable to accept that Cox-Snell
residuals come from a unit exponential distribution which is true for a well fitted model. As
shown in Chapter 1, the idea is to plot Cox-Snell residuals (𝑟𝐶𝑖) versus cumulative hazard
function of the residuals (𝐻(𝑟𝐶𝑖)). Plot of 𝑟𝐶𝑖 vs. 𝐻(𝑟𝐶𝑖) should yield a straight line with unit
slope if the assumption of 𝑟𝐶𝑖~exp (1) is satisfied, that is if the model fits data well. However,
the final decision of the model shouldn’t be taken solely on this plot. In practice it has been
found that Cox-Snell plot is not sensitive to small model inadequacies and not reliable in small
82
sample sizes. Therefore, along with this overall goodness of check we should proceed to check
separately for the situations where model inadequacies can occur in a CPH model. The three
main areas are to check for influential observations, non-linear effects of the continuous
covariates and non-proportional hazards of the covariates.
Identification of unusual data values and influential data values on the parameter
estimates can be done using statistics similar to leverage and dfbeta in standard linear regression
models. As shown in Chapter 1, score residuals have similar properties as leverage values. For
continuous predictors, the further the value is from the mean, the larger the absolute value of the
score residual is. Graphs of the score residuals and covariates aid in identifying any subjects with
unusual data values. A statistic that is similar to dfbeta that approximately measures the
difference between a particular coefficient value and the new coefficient if a value is removed
from the sample can be computed for CPH model using score residuals and covariance matrix of
the estimated coefficients [15]. This value is sometimes called scaled score residual and plots of
these residuals and continuous covariates are useful to examine any subjects that influence the
parameter estimates.
Identifying the correct functional form of the continuous covariates is a crucial step in
model development even though it is not practiced much in health data analysis. Cumulative
Martingale residual plots with the interested covariates are useful in assessing the linearity of the
variables. The smoothed curve to the plot indicates whether the effect of the variable is linear or
non-linear. In addition, this smoothed curve gives a hint on the functional form of the
relationship of the covariate to the hazard. The smoothing procedure used in these graphs are
developed by [31], [32] Cleveland and [33]. Smoothing parameter is optimized by fitting
multiple models and AICC criterion is used to balance fit of the model between tight and

83
complex. The next two sections describe methods to adjust the Cox model for the non-linear
effects, namely fractional polynomial method [34] and restricted cubic spline method. Also,
these methods can be used to assess the significance of the apparent non-linearity in the
smoothed Martingale residual plots.
As mentioned in Chapter 1, proportional hazard assumption is the main assumption
behind the Cox proportional hazard model that is used extensively in time-to-event data analysis.
We discuss two methods that can be used to identify any violations of proportional hazards:
Scaled Schoenfeld residuals [18] and Simulated Score residual paths [17]. Recall the form of
proportional hazards model
ℎ𝑖(𝑡𝑖|𝒁𝒊) = ℎ0(𝑡)exp (𝛽1𝑍1𝑖, + ⋯ . + 𝛽𝑝𝑍𝑝𝑖).
As suggested by [18], instead of constant coefficient, 𝛽, include a coefficient of the form
𝛽𝑗(𝑡) = 𝛽𝑗 + 𝛾𝑗𝑔𝑗(𝑡)
that varies with time to the model. 𝑔𝑗(𝑡) is a function of time that the user has to specify.
Approximated scaled Schoenfeld residuals have a mean at time t given by 𝛾𝑗𝑔𝑗(𝑡). As a result,
the plot of scaled Schoenfeld residuals vs. time can be used to assess whether 𝛾𝑗 zero is or not.
That is, if slope is zero then 𝛽𝑗(𝑡) doesn’t depend on time and hence the hazard ratio is also
constant with respect to time. In addition, a formal test to check whether 𝛾𝑗 is zero has been
proposed by [18].
Another method that can be used is to use a transformation of Martingale residuals which
is called Score process [17]. Under the assumption of proportional hazards this process can be
approximated by zero mean Gaussian process. Hence, a comparison of observes score process

84
and simulated score processes under the PH assumption would reveal any departures from the
assumption. The idea is to use one thousand simulations of the score process and compute the
proportion of times that the maximum absolute values of the simulated processes exceeds the
maximum absolute value of the observed score process. This value serves as the p-value for a
supremum type of formal test of PH assumption. If the simulated processes exceed the observed
process relatively few times then it is an indication of the violation of the assumption. In
addition, graphs of these observed and simulated processes can be used to identify the departures
from the proportional hazards.
5.3 Adjusting Non-linear Effects of the Covariates
When continuous predictors are present, the common and convenient practice is to
include them as categorical predictors or as linear predictors in the model being studied.
Categorization of a continuous covariate might lead to subjective categorizations and loss of
information. Also, if a continuous predictor is incorrectly included as a linear effect then it might
lead to misleading conclusions from the model. When non-linear effects are detected, we should
attempt to find the correct functional form of the effect or a function that closely follows the non-
linear effect. In practice, most of the time non-linear effects are not parabolic nature. Therefore,
more advanced transformations are needed to approximate the functional form of the covariates.
5.3.1 Fractional Polynomials
Fractional polynomial method can be used to describe the complex relationship between
the outcome and continuous covariates. The procedure is to use one polynomial term model
(FP1) and a two-term polynomial (FP2) to capture the pattern of the relationship between the
covariate and the outcome and through a deviance difference test compare and choose the best

85
model. Assume we have two continuous covariates (X1 and X2) that needed to be included in the
model. The best fractional polynomial model selection procedure is described as below [25].
1. Initially, the best fitting polynomial function for the most significant continuous variable is
found (say, X1) assuming X2 is linear.
a. That is, fit FP2 for X1 and then compare it with the null model on 4 degrees of
freedom significance test (say, at significance level 5%). If the test is not significant
drop X1; otherwise continue to the next step.
b. Compare FP2 model with the linear model with 3 degrees of freedom significance
test. If the test is not significant then keep X1 as a linear term in the model; otherwise
continue to the next step.
c. Compare FP2 with FP1 on 2 degrees of freedom test. If the test is significant, then FP2
is the best fitting polynomial function for X1 otherwise FP1 is chosen as the best
fitting fractional polynomial.
FP1 model for X1: ℎ(𝑿, 𝑡) = ℎ0(𝑡)𝑒𝑥𝑝{𝛽1𝑋1𝑝1 + 𝛽3𝑋2} (5.1)
FP2 model for X1: ℎ(𝑿, 𝑡) = ℎ0(𝑡)𝑒𝑥𝑝{𝛽1𝑋1𝑝1 + 𝛽2𝑋1
𝑝2 + 𝛽3𝑋2} (5.2)
By default, polynomial transformations p1 and p2 are estimated from the set {−2, −1,
−0.5, 0, 0.5, 1, 2, 3} (where 0 corresponds to log(X)).
2. Next, the selected functional form for X1 is kept and the same procedure (a-c) at the step 1 is
repeated for X2. Once the best functional polynomial term for X2 is found, the iteration 1
ends.
86
3. The second iteration starts by repeating step 1 for X1 while keeping the selected functional
form for X2. If this results in the same functional form for X1 as in step 1, the procedure has
entered into convergence and selected polynomial functions for X1 and X2 are included in the
model. Otherwise, repeat step 2 for X2 retaining the newly found polynomial function for X2.
4. This procedure continues until the functional forms converge for X1 and X2.
Default order of entering covariates to this procedure is based on the statistical significance with
respect to p-value. Optionally, we can choose the order that variables enter. Also, we can specify
certain continuous variables of interest in the model to be linear.
5.3.2 Restricted Cubic Splines
Spline functions are piecewise polynomials connected across intervals of a given
continuous covariate. The joint points where these piecewise polynomials are connected are
called knots. The simplest form of the polynomial that can be used is linear function. However,
piecewise linear functions are not effective in modeling sharply curved relationships as they are
not smooth. It has been found that cubic spline functions can approximate functions with
complex shapes. Because restricted cubic splines can behave poorly in the tails, [35] have
proposed constraining the function to be linear before the first knot and after the last knot. We
are applying their proposed method called restricted cubic spline function to estimate the non-
linear relationship between continuous covariates and the hazard function.
Assume we have one continuous covariate (X) we wish to estimate through restricted
cubic splines. Initially, we partition X scale into sections separated by k knots at t1, t2,…., tk. The
relationship between hazard function and partitions of X is then estimated by cubic spline
functions. Then, these functions are joined at k knots. Two more knots are placed at the

87
boundaries of the X scale called tmin and tmax. In restricted cubic splines, the relationship between
X and the hazard function at the section tmin to t1 and tk to tmax are constrained to be linear.
The model takes the form
ℎ(𝑋, 𝑡) = ℎ0(𝑡)𝑒𝑥𝑝{𝛽1𝑋 + ∑ 𝛽𝑗𝑘𝑗=1 [(𝑋 − 𝑡𝑗)+
3 − 𝛾𝑗(𝑋 − 𝑡𝑚𝑖𝑛)+3 − (1 − 𝛾𝑗)(𝑋 − 𝑡𝑚𝑎𝑥)+
3 ]}, (5.3)
where
(𝑋 − 𝑡)+3 = {
(𝑋 − 𝑡)3 ; 𝑖𝑓 𝑋 ≥ 𝑡0 ; 𝑖𝑓 𝑋 < 𝑡
and 𝛾𝑗 =𝑡𝑚𝑎𝑥−𝑡𝑗
𝑡𝑚𝑎𝑥−𝑡𝑚𝑖𝑛.
It has been shown that, in practice 3, 4 or 5 knots placed at percentiles are sufficient to
approximate the relationship of the covariate and outcome well [35]. Therefore, we considered
k = 3, 4 and 5 number of knots placed at percentiles for our analysis.
5.4 Adjusting Non-proportional Hazards - Time Varying Effects Model
The common method that is used to account for non-proportionality in a covariate is
stratification, that is, use of the proportional hazard violated variable as a grouping variable
rather than a regressor in the model. Even though this method is simple and easy to understand it
has some drawbacks. When stratified Cox model is fitted, it is not possible to estimate hazard
ratios associated with the stratifying variable (non-PH variable). This will be a major limitation if
the stratification variable is an important characteristic under the study. In addition, this method
is more suitable for qualitative covariates as there will be loss of information. Also, when the
number of predictor variables that violates the proportional hazard assumption are large,
stratified Cox model is not very useful. Given the limitations of the stratified Cox model, we
want to introduce an extended Cox model with time varying coefficients which can be used to
address those limitations.

88
The idea is to create a time dependent coefficient, 𝛽(𝑡), for the covariate which violates
the proportional hazard assumption. That is, 𝛽(𝑡) = 𝛽𝑓(𝑡); where 𝑓(𝑡) is a function of time to
reflect the time varying nature of the hazard ratio under study. 𝑓(𝑡) could be based on the
theoretical knowledge about the covariate or scaled Schoenfeld residuals with smoothed curves.
The Cox model with time varying coefficients for ith
individual (i = 1, 2, …, n) can be written in
the form
ℎ𝑖(𝑡) = ℎ𝑜(𝑡)𝑒𝑥𝑝{∑ 𝛽𝑗(𝑡)𝑍𝑖𝑗𝑝𝑗=1 }; (5.4)
where ℎ𝑜(𝑡) is the baseline hazard function, i.e. hazard function when all covariates (Zj; j =1, 2,
…, p) takes the reference values at time = 0 (time at origin). Recall that in the Cox PH model
hazard ratio, ℎ𝑖(𝑡)
ℎ𝑜(𝑡) can be obtained by exp (𝛽𝑗) which is constant over the time. In contrast, in the
time varying coefficient Cox model, the hazard ratio is time dependent. That is, exp (𝛽𝑗(𝑡)) is the
relative hazard of two individuals at time t whose Xj variable differs by one unit and the
remaining variables take the same values.
Extending the partial log likelihood function for the Cox PH model given in Chapter 1, for the
time varying coefficient model, it is given by
∑ {∑ 𝛽𝑗(𝑡𝑖)𝑍𝑗𝑖𝑝𝑗=1 − 𝑙𝑜𝑔 ∑ 𝑒𝑥𝑝(∑ 𝛽𝑗(𝑡𝑖)𝑍𝑗𝑙
𝑝𝑗=1 )𝑙𝜖𝑅(𝜏𝑖) }𝑘
𝑖=1 (5.5)
where 𝑅(𝜏𝑖) is the risk set at time 𝑡𝑖, the death time of the ith
individual in the study and is an
event indicator that is zero if the survival time of the ith
individual is censored and unity
otherwise. This partial log-likelihood is maximized to get the estimates for 𝛽(𝑡).
∑ { (𝛽1𝑍1𝑖, + ⋯ . + 𝛽𝑝𝑍𝑝𝑖) − 𝑙𝑜𝑔[∑ exp (𝛽1𝑍1𝑗, + ⋯ . + 𝛽𝑝𝑍𝑝𝑗)𝑗∈𝑅(𝜏𝑖) ]}𝑘𝑖=1 (5.6)
89
5.5 Application to Breast Cancer Survival Data
The data for the present study was taken from the Surveillance, Epidemiology, and End
Results (SEER) program, 2009. The aim was to find an appropriate model which describes the
survival probability of the patients with malignant breast cancer with the use of some important
attributable variables. Special attention was given for the evaluation of model assumptions and
for correction of model assumption violations. Female breast cancer patients of age 20 years and
above who were diagnosed with invasive ductal carcinoma during a decade starting from 1990
were considered from the SEER breast cancer database for the present study. The selected study
data consists of a random sample of 1000 patients. Potential prognostic factors, including age at
diagnosis, race of the patient, tumor size at diagnosis, extension, lymph node status and outcome
of progesterone receptor assay (PRA) were selected according to the current knowledge about
the risk of cancer deaths.
The mean and standard deviation of follow up times of the patients are 10.5 years and 5.2
years respectively and median survival time is 11 years. Sixty five percent of the study sample
were censored observations; that is, alive at the end of the follow up period, lost to follow up or
death by other cause. Overall 5 years and 10 years survival probabilities are 80% and 70%
respectively. Tumor size at diagnosis had a mean of 22mm with a standard deviation of 18.4mm
and age at diagnosis had a mean of 58.2 years with a standard deviation of 13.5 years. Age at
diagnosis was centered at the average for meaningful interpretations for the baseline survival
probability. Table 5.1 displays a summary of the categorical variables of interest along with the
corresponding log-rank test results. Initial evaluation of the covariates was done using the
univariate Cox regression model and all the covariates were significant at 5% significance level.
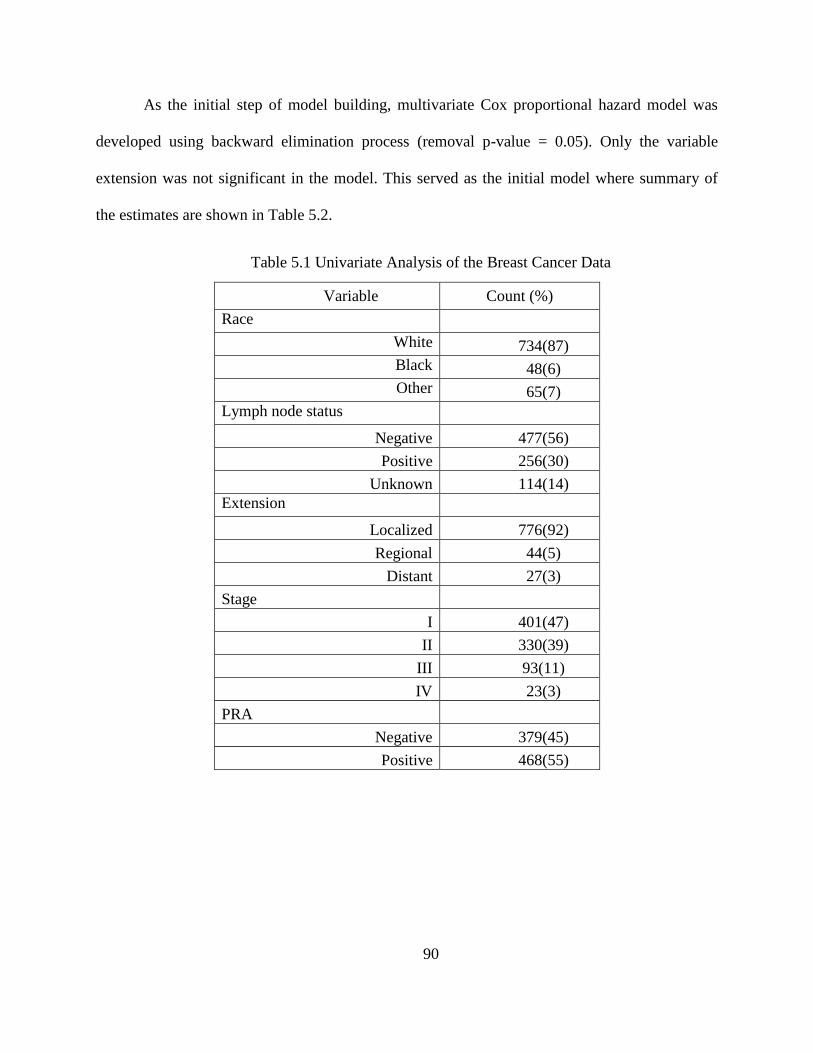
90
As the initial step of model building, multivariate Cox proportional hazard model was
developed using backward elimination process (removal p-value = 0.05). Only the variable
extension was not significant in the model. This served as the initial model where summary of
the estimates are shown in Table 5.2.
Table 5.1 Univariate Analysis of the Breast Cancer Data
Variable Count (%)
Race
White 734(87)
Black 48(6)
Other 65(7)
Lymph node status
Negative 477(56)
Positive 256(30)
Unknown 114(14)
Extension
Localized 776(92)
Regional 44(5)
Distant 27(3)
Stage
I 401(47)
II 330(39)
III 93(11)
IV 23(3)
PRA
Negative 379(45)
Positive 468(55)

91
Table 5.2 Results of the Initial Cox Proportional Hazards Model
Variable Parameter
Estimate p-value
Hazard
Ratio
95% Hazard Ratio
Confidence Limits
Race-black 0.59654 0.0013 1.816 1.261 2.615
Race-other -0.47493 0.1310 0.622 0.336 1.152
Lymphnode-positive 0.72224 <.0001 2.059 1.463 2.898
Lymphnode-unknown 0.79662 <.0001 2.218 1.504 3.271
Stage II 0.59220 0.0018 1.808 1.248 2.620
Stage III 0.84954 0.0003 2.339 1.481 3.692
Stage IV 1.88322 <.0001 6.575 3.709 11.654
PRA-positive 0.42802 0.0004 1.534 1.211 1.943
Age
0.03798 <.0001 1.039 1.029 1.048
Tumor Size 0.00692 0.0065 1.007 1.002 1.012
The next step is to evaluate the adequacy of this initial model in the aim of improving the
model if there are any inadequacies present. First, overall model adequacy was assessed using
Cox-Snell residuals calculated for the initial model. Cox-Snell residual plot is shown in Figure
5.1 where the graph deviates from the reference line which goes through the origin. This
indicates that the model might not fit the data well and it could be improved. Model evaluation
was started with checking the assumption of linearity of the continuous covariates on the log
hazard. It can be seen that the graph does not follow the straight line closely. This suggests that
the model doesn’t adequately fit the data. Since there are some evidence for overall model
inadequacy, the next step was to explore what makes the model inadequate. Three main aspects
of the model were assessed; namely linearity of the continuous covariates, influential data points
and finally the main assumption behind the Cox proportional hazard model, the proportional
hazard assumption.

92
Figure 5.1 Cox-Snell Residual Plot for the Initial Model
First, any unusual values and/or influential values on the parameter estimates were identified.
Score residuals were computed for the initial model and plotted against age and tumor size to
identify whether there are any records that have values that deviate from the rest of the data to a
great degree. Figure 5.2a and Figure 5.2b display the score residual plots for age at diagnosis and
tumor size at diagnosis. It can be seen that there are two values far apart from the other values on
the top right of the score residual plot for age. Also, there are four values that differ from the
other values on the score residual plot for tumor size. Dfbeta and each continuous covariate were
plotted and shown in Figure 5.2c and Figure 5.2d to identify any strong influential values on the
parameter estimates. It appears that two data points in the plot for age and five data points on the
plot for tumor size differ from the rest of data points to a great extent. These identified values
were further assessed to check what subjects correspond to these unusual behaviors and how they
Est
imat
ed C
um
ula
tive
Haz
ard
0
1
2
3
4
Cox-Snell Residual
0 1 2 3 4
93
affect the parameter estimates. A model without these six identified extreme values was fitted
and there was 53% reduction of the coefficient estimate for race-other term. Tumor size change
was more than a 100% change (0.007 to 0.016) which is expected because five of the identified
records had larger tumor sizes, greater than 130mm. Breast tumor sizes are typically less than
50mm and sometimes they can be more than 50mm. However, observance of a tumor size that is
greater than 130mm clinically is possible but it is rare [19]. Also, some inconsistencies of the
values for tumor size, lymph node status and stage can be found in these five data points. For
example, there is a record with negative lymph node status and stage II but with tumor size
151mm. There was another data point identified as a poorly fit record with a distant metastasis
where our knowledge was limited to find the reason for this behavior. Even though it is clinically
plausible we decided to disregard the identified data points from the further analysis as they are
unusual in the study data. The next step was to evaluate whether the effects of the continuous
covariates are linear.

94
Figure 5.2 Score Residual Plots and dfbeta Plots for Age and Tumor Size at Diagnosis
There are two continuous covariates that we aim to identify the correct functional form for the
Cox proportional hazards model, namely age and tumor size at diagnosis. Martingale residuals
for the null model without the predictors were computed and plotted with age and tumor size
along with smoothed curve. Figure 5.3a and Figure 5.3b represent the corresponding smoothed
residual plots for age and tumor size respectively. It is clear that age and tumor size have a non-
linear relationship with estimated log hazard. Both covariates appear to have higher estimated
log hazard as the covariate values increase. We further assessed the non-linear nature of these
Score
Resid
uals
-2.0
-1.5
-1.0
-0.5
0.0
0.5
1.0
1.5
2.0
Age (Years)
15 25 35 45 55 65 75 85 95
dfb
eta
Resid
uals
-0.050
-0.045
-0.040
-0.035
-0.030
-0.025
-0.020
-0.015
-0.010
-0.005
0.000
0.005
0.010
0.015
0.020
0.025
0.030
0.035
0.040
0.045
0.050
Age (Years)
15 25 35 45 55 65 75 85 95
Score
Resid
uals
-2.5
-2.0
-1.5
-1.0
-0.5
0.0
0.5
1.0
1.5
2.0
Size (mm)
0 10 20 30 40 50 60 70 80 90 100 110 120 130 140 150 160 170
dfb
eta
Resid
uals
-0.050
-0.045
-0.040
-0.035
-0.030
-0.025
-0.020
-0.015
-0.010
-0.005
0.000
0.005
0.010
0.015
0.020
0.025
0.030
0.035
0.040
0.045
0.050
Size (mm)
0 10 20 30 40 50 60 70 80 90 100 110 120 130 140 150 160 170
5.2a
5.2c
5.2b
5.2d

95
relationships in the aim of finding the best form of function that describes effects of age and
tumor size on log hazard.
Figure 5.3a Smoothed Martingale Plot for Age (smooth= 0.615)
Mar
tingal
e R
esid
ual
s
-0.50
-0.25
0.00
0.25
0.50
0.75
1.00
1.25
Age (Years)
20 30 40 50 60 70 80 90 100

96
Figure 5.3b Smoothed Martingale Plot for Tumor Size (smooth=0.529)
The first method that we used to capture the non-linear effects is the method of fractional
polynomials. Both age and tumor size revealed significant transformations which confirm the
observation we obtained from Figure 5.3a and Figure 5.3b. The most appropriate transformation
for age is
𝐹𝑃𝑎𝑔𝑒 = (𝑎𝑔𝑒 𝑐𝑒𝑛𝑡𝑒𝑟𝑒𝑑
10)
2
and for tumor size is
𝐹𝑃𝑠𝑖𝑧𝑒 = ln (𝑠𝑖𝑧𝑒
100).
Mar
tingal
e R
esid
ual
s
-0.50
-0.25
0.00
0.25
0.50
0.75
1.00
Tumor Size (mm)
0 10 20 30 40 50 60 70 80 90 100 110 120 130 140 150 160 170

97
We compared the initial model with the fractional polynomial model with non-linear terms for
age and tumor size. Partial likelihood ratio test revealed test statistic of G = 3461.324 - 3380.917
= 80.407 with 2 degrees of freedom p-value of 2.68x10⁻¹⁸
. Hence, the model with fractional
polynomials for the non-linear effects is significantly different from the initial model with linear
terms. To understand how well these identified functional forms describe the true form of age
and tumor size, we used the method suggested by [23], [36] and the corresponding plots are
shown in Figure 5.4a and Figure 5.4b. Except for a small deviation at the end, cubic function for
age seems to describe the relationship with log hazard well. However, the natural logarithm
function doesn’t appear to approximate the functional form of the tumor size well. It follows the
basic shape but seems to overestimate the log hazard with respect to tumor size. We consider this
fractional polynomial model with non-linear effects as a candidate model and explore another
method which would better describe both non-linear effects.
Figure 5.4a Smoothed Martingale Plot and the Estimated Fractional Polynomial Model for for
Age
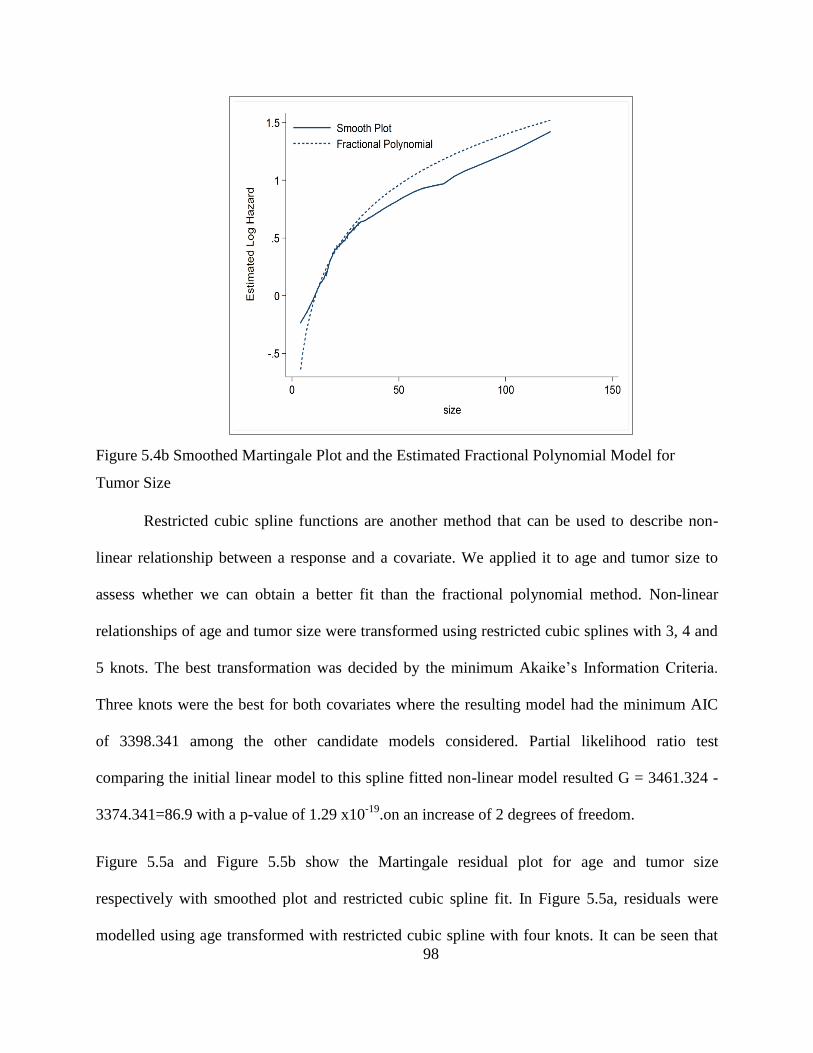
98
Figure 5.4b Smoothed Martingale Plot and the Estimated Fractional Polynomial Model for
Tumor Size
Restricted cubic spline functions are another method that can be used to describe non-
linear relationship between a response and a covariate. We applied it to age and tumor size to
assess whether we can obtain a better fit than the fractional polynomial method. Non-linear
relationships of age and tumor size were transformed using restricted cubic splines with 3, 4 and
5 knots. The best transformation was decided by the minimum Akaike’s Information Criteria.
Three knots were the best for both covariates where the resulting model had the minimum AIC
of 3398.341 among the other candidate models considered. Partial likelihood ratio test
comparing the initial linear model to this spline fitted non-linear model resulted G = 3461.324 -
3374.341=86.9 with a p-value of 1.29 x10⁻¹⁹
.on an increase of 2 degrees of freedom.
Figure 5.5a and Figure 5.5b show the Martingale residual plot for age and tumor size
respectively with smoothed plot and restricted cubic spline fit. In Figure 5.5a, residuals were
modelled using age transformed with restricted cubic spline with four knots. It can be seen that

99
smooth fit and spline fit closely follows. When tumor size was represented with a restricted cubic
spline with 3 knots, predicted values are close to smooth fit with slight under estimation. This
supports our decision that these spline transformations approximate the non-linear behavior of
age and tumor size well.
Figure 5.5a Restricted Cubic Spline Fit with four Knots for Age

100
Figure 5.5b Restricted Cubic Spline Fit with Four Knots for Tumor Size
Since we have two competing non-linear models for our data, we compared those two models
with respect to the AIC of the model and the analytical simplicity. Fractional polynomial model
has an AIC value of 3400.9167 and the restricted cubic spline model has a value of 3398.341.
Therefore, AIC suggests that restricted cubic spline model is slightly better. However, if the
simplicity of the analytical form of these competing models was considered, fractional
polynomial model is preferred as it was found that the non-linear effects of age and tumor size
are well described by the quadratic and logarithm functions. Therefore, we decided to proceed
further with fractional polynomial model.

101
Next step of model adequacy was to check the non-proportional hazards of the model
covariates. We used scaled Schoenfeld residual plots and simulated score residual plots to
graphically assess the proportional hazards assumption of the Cox proportional hazards model
adjusted for non-linear effects using the method fractional polynomials. Figures 5.6(a)-(j) show
the scaled Schoenfeld residuals with smoothed plot. Except for race-other, lymphnode-positive,
age2 and PRA-positive all the other plots don’t display any noticeable deviations from the
horizontal line which supports proportional hazards. Age2 seems to have an upward trend/non-
linear. Almost all of the points in race-other plot lie around the horizontal line. There are isolated
some points on top which might be the reason for the slight upward trend. Lymph node-unknown
and stage III don’t seem to have a big trend or deviation from the horizontal line. The plot of
PRA-positive shows a clear downward trend. Non-linearly it seems like an exponential decay
and then leveling off as time increases.
Figure 5.6(a) Scaled Schoenfeld Residual Plot for Race-Black

102
Figure 5.6(b) Scaled Schoenfeld Residual Plot for Race-other
Figure 5.6(c) Scaled Schoenfeld Residual Plot for Lymphnode-positive

103
Figure 5.6(d) Scaled Schoenfeld Residual Plot for Lymphnode-unknown
Figure 5.6(e) Scaled Schoenfeld Residual Plot for Stage II

104
Figure 5.6(f) Scaled Schoenfeld Residual Plot for Stage III
Figure 5.6(g) Scaled Schoenfeld Residual Plot for Stage IV

105
Figure 5.6(h) Scaled Schoenfeld Residual Plot for PRA-positive
Figure 5.6(i) Scaled Schoenfeld Residual Plot for Age
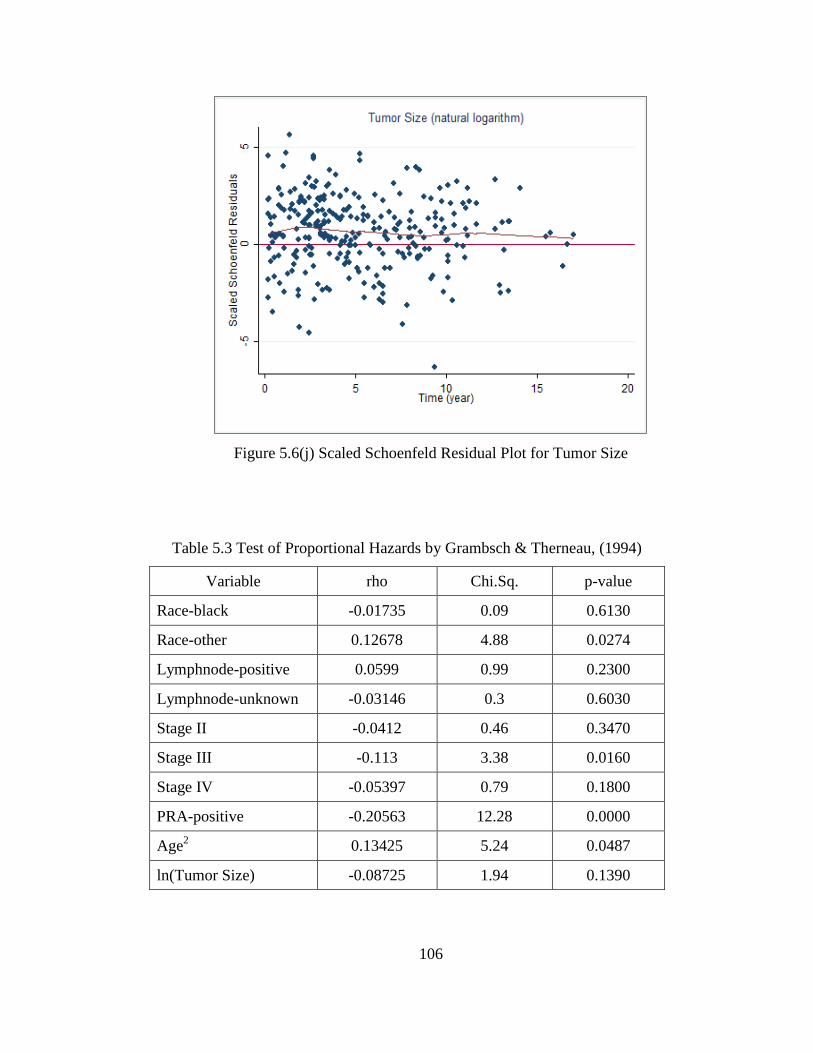
106
Figure 5.6(j) Scaled Schoenfeld Residual Plot for Tumor Size
Table 5.3 Test of Proportional Hazards by Grambsch & Therneau, (1994)
Variable rho Chi.Sq. p-value
Race-black -0.01735 0.09 0.6130
Race-other 0.12678 4.88 0.0274
Lymphnode-positive 0.0599 0.99 0.2300
Lymphnode-unknown -0.03146 0.3 0.6030
Stage II -0.0412 0.46 0.3470
Stage III -0.113 3.38 0.0160
Stage IV -0.05397 0.79 0.1800
PRA-positive -0.20563 12.28 0.0000
Age2
0.13425 5.24 0.0487
ln(Tumor Size) -0.08725 1.94 0.1390

107
We performed the test of proportional hazards by [18] on the covariates with and results
are summarized in Table 5.3. Comparison of the observations from these plots with the test gives
evidence for significant departures from proportional hazards for the variables, race-other, PRA-
postive and age2. Even though we didn’t observe from the smoothed scaled Schoenfeld residual
plots, the test gives a significant result of proportional hazard assumption violation by stage III.
Observed and simulated score residuals plots that also can be used to assess the
proportional hazard assumption are shown in Figure 5.7. Observed paths for PRA-positive and
tumor size clearly deviate from the cloud of simulated paths. Stage III also shows some slight
deviations from the simulated paths. As we can observe only ten simulated paths in the graph
compared to the thousand simulations done for each graph, it is difficult to make strong
observations from these plots. Supremum tests of non-proportionality which consider all the
simulated paths would give more accurate findings. The corresponding supremum test results are
given in Table 5.4. These results confirms the non-proportional hazards observed under scaled
Schoenfeld residuals and plots for PRA and age variable. In addition, this supremum test
suggests that stage III and lymph node-unknown variables do not satisfy the proportional hazards
assumption.
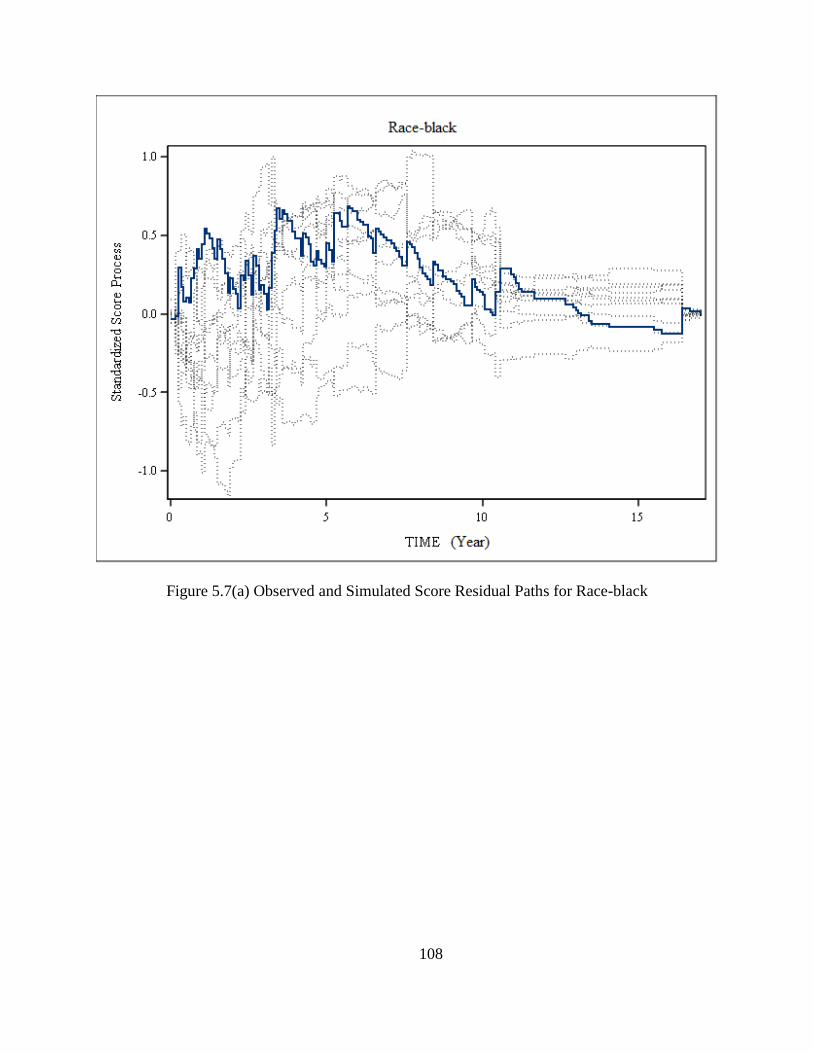
108
Figure 5.7(a) Observed and Simulated Score Residual Paths for Race-black
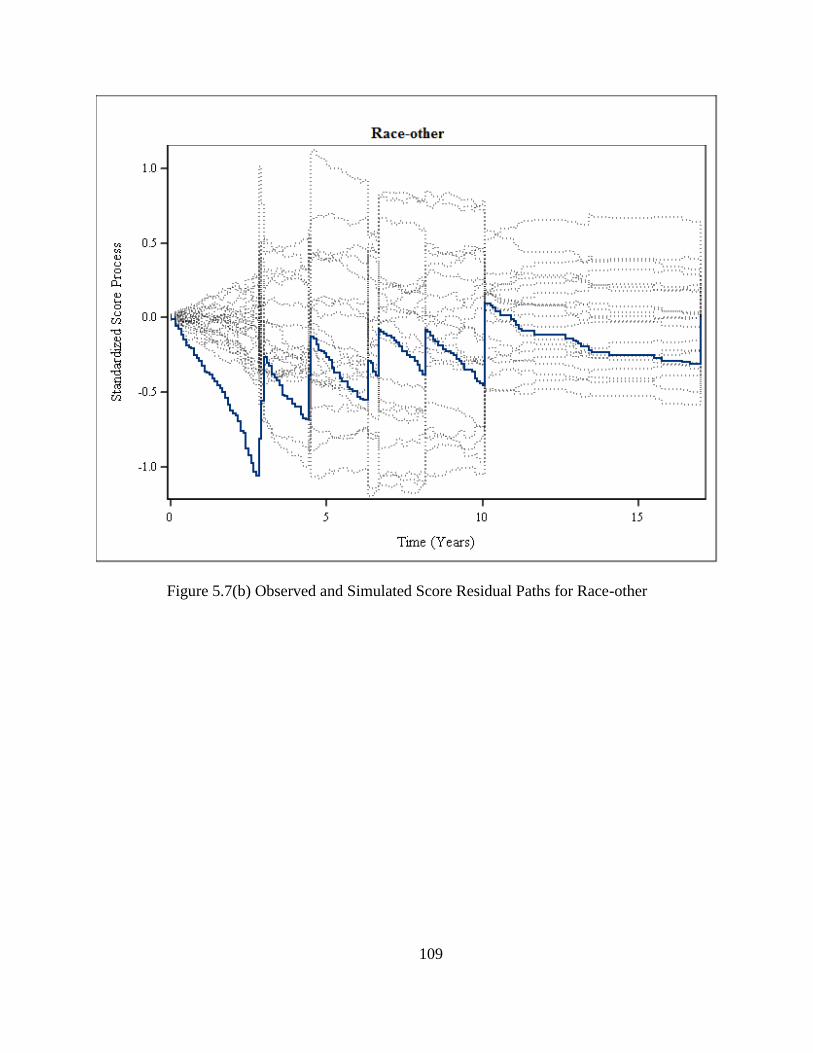
109
Figure 5.7(b) Observed and Simulated Score Residual Paths for Race-other

110
Figure 5.7(c) Observed and Simulated Score Residual Paths for Lymphnode-positive

111
Figure 5.7(d) Observed and Simulated Score Residual Paths for Lymphnode-unknown

112
Figure 5.7(e) Observed and Simulated Score Residual Paths for Stage II

113
Figure 5.7(f) Observed and Simulated Score Residual Paths for Stage III

114
Figure 5.7(g) Observed and Simulated Score Residual Paths for Stage IV
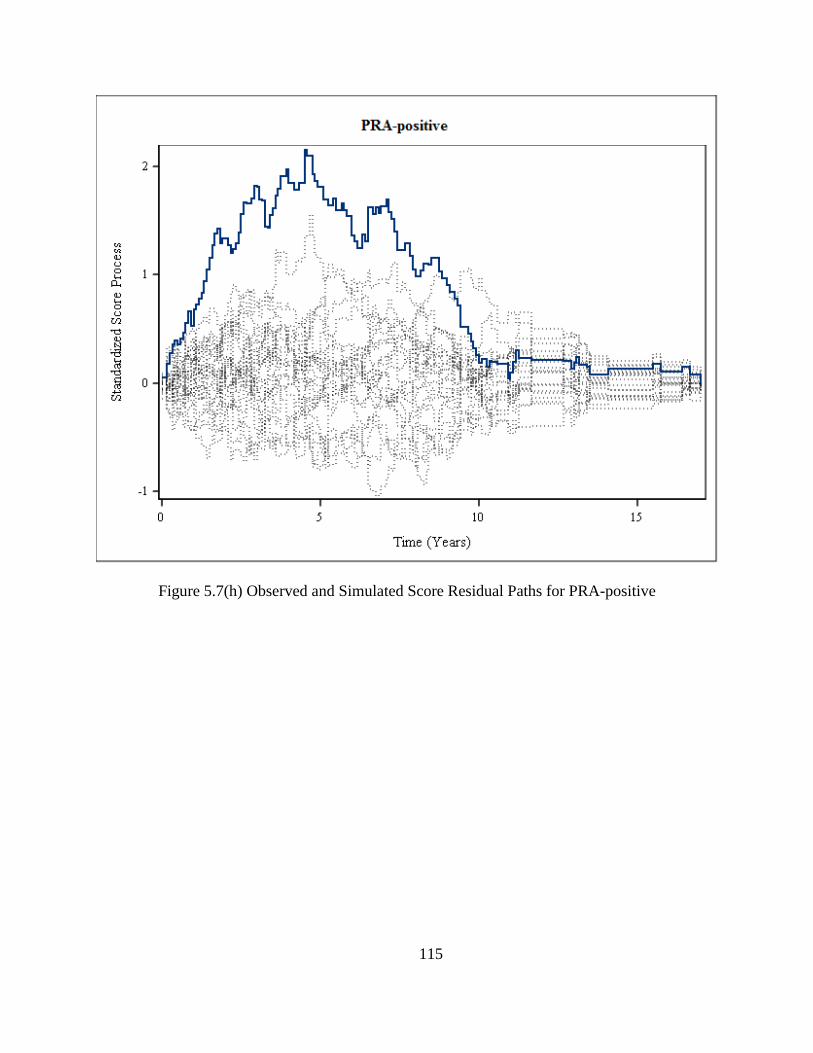
115
Figure 5.7(h) Observed and Simulated Score Residual Paths for PRA-positive
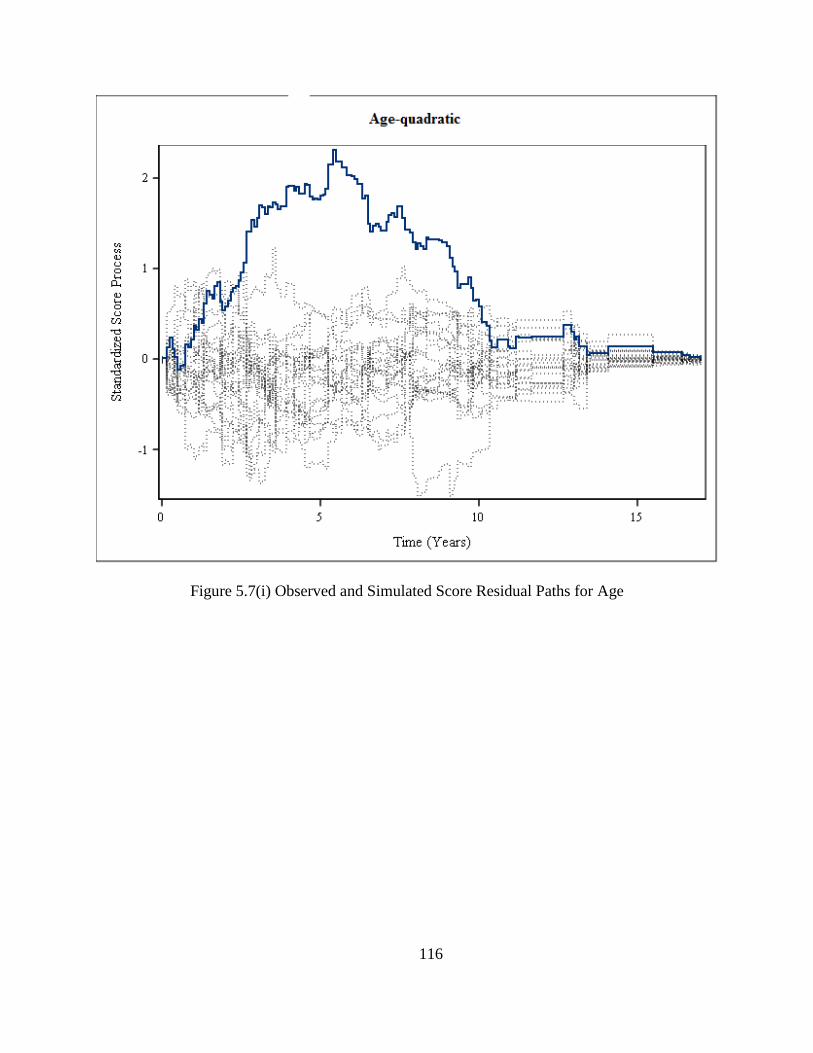
116
Figure 5.7(i) Observed and Simulated Score Residual Paths for Age

117
Figure 5.7(j) Observed and Simulated Score Residual Paths for Tumor Size
The next most important step in the model building is to adjust for any possible non-
proportionalities observed in the covariates. Evidence for proportional hazards assumption
violation was clearly visible in the plots that we examined and tests that we performed for age2
and PRA. Age2 seemed to have a log hazard that has a linear upward trend and PRA-positive
shows an exponential type decay.

118
Table 5.4 Test of Proportional Hazards by Lin et al. (1993)
Variable Maximum Absolute
Value Pr. >Max.Abs. Value
Race-black 0.7521 0.4790
Race-other 1.1417 0.1720
Lymphnode-positive 1.1650 0.3880
Lymphnode-unknown 1.8189 0.0690
Stage II 1.2435 0.4890
Stage III 2.4043 0.0080
Stage IV 1.0565 0.2860
PRA-positive 2.0891 <0.0001
Age2
1.4477 0.0010
ln(Tumor Size) 2.2399 0.4190
In order to develop a model that accounts for these varying hazard ratios, we decided to
incorporate time varying coefficients to age2 and PRA. We included an interaction term for
coefficient of the age2 to vary with time linearly, β𝑎𝑔𝑒(t) = β𝑎𝑔𝑒t. PRA was allowed to vary in
time in two ways, continuously and discretely; we named them model A and model B
respectively. The vector x includes all the time fixed, linear variables including race, lymph node
status and stage and 𝜷 is the corresponding vector of model coefficients. Recall that non-linear
effects of age and tumor size are represented by
𝐹𝑃𝑎𝑔𝑒 = (𝑎𝑔𝑒 𝑐𝑒𝑛𝑡𝑒𝑟𝑒𝑑
10)
2
and 𝐹𝑃𝑠𝑖𝑧𝑒 = ln (𝑠𝑖𝑧𝑒
100).

119
Model A: Exponentially decaying effect for PRA where rate of decay (k) was estimated from the
scaled Schoenfeld smoothed residual plots. β𝑃𝑅𝐴(t) = β𝑃𝑅𝐴e−kt. The model takes the form
ℎ(𝑡, 𝒁(𝑡)) = ℎ0(𝑡){𝑒𝑥𝑝( β𝑎𝑔𝑒(t) × 𝐹𝑃𝑎𝑔𝑒 + β𝑃𝑅𝐴(t) × PRA + 𝜷′𝒁)}
Model B: In addition to the exponential decay form of the non-proportionality of the hazard of
PRA, we developed a piecewise hazard function for PRA. That is, hazard ratio of PRA to vary
discretely with time. That is, time scale was partitioned into 2 year intervals and five dummy
variables were created to represent the piecewise effects of PRA. (See Table 5.5).
Model B takes the form
ℎ(𝑡, 𝒁(𝑡)) = ℎ0(𝑡){𝑒𝑥𝑝( β𝑎𝑔𝑒(t) × 𝑎𝑔𝑒𝐹𝑃 + β𝑃𝑅𝐴1(t) × PRA + β𝑃𝑅𝐴2(t) × PRA + β𝑃𝑅𝐴3(t) × PRA
+ β𝑃𝑅𝐴4(t) × PRA + 𝜷′𝒁)}
Table 5.5 Dummy variables for PRA in model B (piecewise Cox model)
Piecewise time
dependent PRA
0 ≤ 𝑡 < 2 2 ≤ 𝑡 < 4 4 ≤ 𝑡 < 6 6 ≤ 𝑡 < 8 8 ≤ 𝑡
β𝑃𝑅𝐴1(t) 1 0 0 0 0
β𝑃𝑅𝐴2(t) 0 1 0 0 0
β𝑃𝑅𝐴3(t) 0 0 1 0 0
β𝑃𝑅𝐴4(t) 0 0 0 1 0
As mentioned before, ln(tumor size), race-other, lymphnode-unknown and stage III
shows slight pattern as suggested by the residual plots and significance tests. However, these
patterns have very little fluctuations around a horizontal line. Nevertheless, we included these
terms in the both non-proportional hazards models with time varying coefficients (Model A &

120
Model B) that we assessed. We found that time varying coefficients of only age2 and PRA were
statistically significant in both models A and B.
Estimated hazard ratios for PRA from the Model B are given in Table 5.6. It can be seen
that after 4 years hazard ratio for PRA-positive is approximately 1 compared to PRA-negative.
That is the estimated risk for PRA-positive and PRA-negative individuals is the same after 4
years. By observing the p-values, it can be seen that hazard ratios for time intervals 0-2 years and
2- 4 years are statistically significant. Hence, we decided to create three time intervals 0-2, 2 - 4
and >4 years instead of five intervals and refit the piecewise Cox model.
Table 5.6 Estimated hazard ratios for PRA in model B (piecewise Cox model)
Time Interval
(Years) p-value Hazard Ratio
95% Confidence
Interval
0-2 <0.0001 3.725 2.034 6.823
2-4 0.0023 2.051 1.292 3.254
4-6 0.5513 1.191 0.670 2.119
6-8 0.9504 1.021 0.524 1.989
>8 0.9631 0.989 0.611 1.600
Modified Model B: New dummy variables for PRA are defined with two time interaction terms
as below.
β𝑃𝑅𝐴1(t) = {1 ; 0 ≤ 𝑡 < 2
0 ; 𝑡 ≥ 2
and β𝑃𝑅𝐴2(t) = {1 ; 2 ≤ 𝑡 < 4
0 ; 0 ≤ 𝑡 < 2 𝑎𝑛𝑑 𝑡 ≥ 4
Modified model B takes the form
ℎ(𝑡, 𝒁(𝑡)) = ℎ0(𝑡){𝑒𝑥𝑝( β𝑎𝑔𝑒(t) × 𝐹𝑃𝑎𝑔𝑒 + β𝑃𝑅𝐴1(t) × PRA + β𝑃𝑅𝐴2(t) × PRA + 𝜷′𝒁)}
121
We compared the AIC values of the two time varying coefficient models that we fitted where it
was 3386.739 for Model A and 3387.685 for modified Model B. Therefore, according to the
Akaike’s information criteria, both models fits are similar. Hence, both of these models were
considered for our next step.
As the final step in model building we checked the significance of all possible two way
interactions in both Model A and modified Model B. We added all the interaction terms to the
non-linear and non-PH adjusted model and used backward elimination method to remove the
nonsignificant interaction terms. Only PRA(postive) × lymphnode(unknown) term was left
significant in Model A. To compare whether interaction model makes a significant improvement,
we performed likelihood ratio test.
Partial likelihood ratio test statistic is
Model A:
G = −2[− 1681.37 − (−1678.464)] = 2.906
with a p-value of 0.0886 from chi-square distribution with 1 degree of freedom.
Time varying piecewise model with interactions resulted interactions of lymphnode-unknown
with race-other, stage II, PRA-positive and tumor size and also interaction of age with race-
other.
Modified Model B:
G = −2[−1681.37 − (− 1672.95)] = 8.42
with a p-value of 0.2970 from chi-square distribution with 5 degrees of freedom. The
improvement made by the interaction model is not significant at 5% significance level. Hence,

122
considering law of parsimony, we decided to proceed with the models with non-linear terms and
time varying coefficients but without covariate interactions.
A summary of parameter estimates for these two models and the initial Cox PH model is given in
Table 5.7. Estimated coefficients for race and lymphnode are similar in all three models. For the
covariate stage, the parameter estimates are higher in the initial Cox model than in the two
extended Cox models. As seen from the log-likelihood and the AIC values, both extended
models fit the data similarly resulting similar parameter estimates for all the linear and PH
satisfied covariates. Hazard ratios for these linear and PH satisfying covariates can be estimated
as exp (��). Under the piecewise Cox model, hazard of cancer death for a subject in race-black is
about 1.7 times higher than a subject in race-white. In contrast, hazard for a subject in race-other
compared to a subject in race-white is 0.5. That is, race-white breast cancer patient is two times
likely to have a death from cancer than a patient in race-other. Risk of cancer death for breast
cancer patients gets larger as the stage of the disease gets higher as seen from our model where
hazard ratios for stage II, III and IV relative to stage I are 1.3, 1.8 and 6.2 respectively. All these
estimates for the time-fixed variables are close to the estimates of the initial model except for
stage II and III.
For a continuous variable with a linear effect, hazard ratio is interpreted as the relative
risk between two individuals with a unit difference of covariate values and it doesn’t depend on
the actual values that the variables take. When we consider tumor size effect under the initial
Cox model, the estimated hazard ratio for a unit change in tumor size can be obtained as below.
��𝐳 represents the linear predictor for the covariate values that are being held constant (at reference
levels).

123
Table 5.7 A Comparison of initial and the extended Cox proportional hazards models on breast cancer data
Variable
Initial Cox PH model Cox model with continuous time varying
effects (Model A)
Cox model with piecewise time varying
effects (Modified model B)
�� Hazard
Ratio
95% Confidence
Interval ��
Hazard
Ratio
95% Confidence
Interval ��
Hazard
Ratio
95% Confidence
Interval
Race-black 0.600 1.816 1.261 2.615 0.517 1.677 1.162 2.420 0.518 1.678 1.163 2.423
Race-other -0.476 0.622 0.336 1.152 -0.677 0.508 0.272 0.950 -0.673 0.510 0.273 0.954
Lymphnode-positive 0.723 2.059 1.463 2.898 0.759 2.136 1.521 3.000 0.759 2.138 1.522 3.004
Lymphnode-unknown 0.799 2.218 1.504 3.271 0.821 2.272 1.525 3.384 0.819 2.269 1.523 3.381
Stage II 0.593 1.808 1.248 2.620 0.279 1.322 0.895 1.951 0.278 1.321 0.894 1.951
Stage III 0.852 2.339 1.481 3.692 0.574 1.776 1.099 2.870 0.571 1.770 1.095 2.862
Stage IV 1.891 6.575 3.709 11.654 1.818 6.157 3.354 11.303 1.821 6.177 3.363 11.348
Tumor size 0.007 1.007 1.002 1.012
FPsize 0.621 1.860 1.489 2.324 0.618 1.854 1.484 2.317
Age 0.038 1.039 1.029 1.048
FPage 0.042 1.043 1.025 1.062 0.042 1.043 1.024 1.062
FPage x time 0.004
1.004 1.001 1.007 0.004 1.004 1.001 1.007
PRA-positive 0.430 1.534 1.211 1.943 0.054 1.056 0.763 1.461
PRA x β𝑃𝑅𝐴e−kt 1.373 3.946 2.336 6.666
PRA x β𝑃𝑅𝐴1(t) 1.315 3.725 2.034 6.824
PRA x β𝑃𝑅𝐴2(t) 0.718 2.051 1.292 3.254

124
Then the hazard function at tumor size = 10mm is,
ℎ(𝑡, 𝑠𝑖𝑧𝑒 = 10) = ℎ0(t) × exp (0.6176 × 10 + ��𝐳),
and for tumor size = 11mm,
ℎ(𝑡, 𝑠𝑖𝑧𝑒 = 11) = ℎ0(t) × exp (0.6176 × 11 + ��𝐳).
Now, the ratio of the two hazards are
ℎ(𝑡, 𝑠𝑖𝑧𝑒 = 11)
ℎ(𝑡, 𝑠𝑖𝑧𝑒 = 10)
=
ℎ0(t) × exp(0.6176 × 11 + ��𝐳)
ℎ0(t) × exp(0.6176 × 10 + ��𝐳)
= exp(0.6176 × (11 − 10))
= 1.007
Hence, the for 1mm unit difference in tumor size result in only 0.7% increase in the risk of
cancer death. To obtain a more interpretable hazard ratio, let’s consider a 10 unit difference in
tumor size. This will result in a hazard ratio of
ℎ(𝑡, 𝑠𝑖𝑧𝑒 = 20)
ℎ(𝑡, 𝑠𝑖𝑧𝑒 = 10)
=
ℎ0(t) × exp(0.6176 × 20 + ��𝐳)
ℎ0(t) × exp(0.6176 × 10 + ��𝐳)
= exp(0.6176 × (20 − 10))
= 1.07
which indicates a 7% increase in hazard. Under the initial Cox model this ratio stays the same for
any 10 unit increase in tumor size.
In contrast, when there is a non-linear effect present, hazard ratio depend on the covariate values
that we are interested in and not only on the difference. We show below how hazard ratio is

125
computed for the non-linear effect of tumor size under the piecewise Cox model that we have
developed.
The parameter estimate for the ln(tumor size) from the piecewise Cox model is 0.6176. Say we
need to estimate the hazard ratio between two individuals with tumor size 10mm and 20mm
given that other covariate values are the same for both of them. Then the hazard function at
tumor size = 10mm is,
ℎ(𝑡, 𝑠𝑖𝑧𝑒 = 10) = ℎ0(t) × exp (0.6176 × ln(10) + ��𝐳)
and for tumor size = 20mm,
ℎ(𝑡, 𝑠𝑖𝑧𝑒 = 11) = ℎ0(t) × exp (0.6176 × ln(20) + ��𝐳).
Now, the ratio of the two hazards are
ℎ(𝑡, 𝑠𝑖𝑧𝑒 = 20)
ℎ(𝑡, 𝑠𝑖𝑧𝑒 = 10)
=
ℎ0(t) × exp(0.6176 × ln(20) + ��𝐳)
ℎ0(t) × exp(0.6176 × ln(10) + ��𝐳)
= exp (0.6176 × 𝑙𝑛 (20
10))
= 1.53
That means for a 10 unit increase in tumor size from 10mm, the risk of cancer death increases by
about 50%. Unlike the hazard ratio estimated by the initial Cox model, the non-linear effect of
tumor size results different hazard ratios for different tumor sizes that are being compared. It can
be shown that hazard ratio for a 10 unit increase in tumor size from 20mm to 30mm is 1.28 and
from 30mm to 40mm, it is 1.19.
We identified that PRA violates the PH assumption. Therefore, it doesn’t have a hazard ratio
constant over time. For the variable which satisfies the PH assumption, then the hazard ratio can

126
be computed as exp (��) given that it satisfies the linearity assumption if it is a continuous
covariate.
In the initial Cox model where we assumed PH satisfied for PRA, the hazard ratio for an
individual with PRA-positive compared to an individual with PRA-negative is exp(1.3726) =
3.94. We found statistically significant evidence that PRA-positive violated the PH assumption.
Also, according to the literature on PRA status of women with breast cancer, this observation can
be clinically justified [37], [38].
In model A, we fitted a continuous function of time for the effect of PRA. That means at each
point of time it results a different hazard ratio for PRA-positive relative to PRA-negative.
According to Model A, estimated hazard ratio at time t is given by
HR𝑃𝑅𝐴−𝑝𝑜𝑠𝑡𝑖𝑣𝑒 = exp(1.3726 × exp (−0.23 ∗ 𝑡))
In modified model B, we modeled the effect of PRA in a piecewise time varying manner.
For, each 2 year interval from the start, we let the model estimate different coefficient for PRA-
positive. After 4 years the hazards for PRA-positive and PRA-negative was not significantly
different where it was near 1. Using the parameter estimates from Table 5.7, the hazard ratio for
PRA-positive at time t is given by
HR𝑃𝑅𝐴−𝑝𝑜𝑠𝑡𝑖𝑣𝑒 = {
exp(0.0543 + 1.3152) ; 0 ≤ 𝑡 < 2
𝑒𝑥𝑝(0.0543 + 0.7182); 2 ≤ 𝑡 < 4
𝑒𝑥𝑝(0.0543); 4 ≤ 𝑡 < 2.
Table 5.8 presents the estimated time varying hazard ratios for PRA-positive. At the start time,
both models seem to estimate the relative risk similarly. Overall, model A estimates are higher
than the modified Model B estimates. As time increases, the difference between the risks

127
diminishes under both models. Piecewise Cox model approaches to HR=1 faster than the
continuous time varying Cox model. Initially, an individual with PRA-positive has a risk of
cancer death four times higher than an individual with PRA-negative. At time equals to 2 years,
the risk of cancer death for a PRA-positive individual is little more than twice of a PRA-negative
person.
Table 5.8 Estimated time-varying hazard ratios for PRA-positive
Time (t)
Hazard Ratio
Cox model with continuous time
varying effects (Model A)
Cox model with piecewise time
varying effects (Modified model B)
0 3.95 3.93
2 2.38 2.17
4 1.73 1.06
6 1.41 1.06
8 1.24 1.06
Because age has a non-linear effect and non-PH effect, a special attention should be given when
obtaining hazard ratios for age. We present the corresponding computations below for the
piecewise Cox model. Computations and estimates are similar for the continuous time varying
model, so we don’t present it here. Say we need to estimate the hazard ratio between a 68.2 year
old individual and 58.2 year old (mean age) individual given that other covariate values are same
for both of them. Then the hazard function at age=58.2 years is
ℎ((𝑡, 𝑎𝑔𝑒 = 58.2)) = ℎ0(t)exp {0.0422 × (58.2 − 58.2
10)
2
+ 0.0038 (58.2 − 58.2
10)
2
× 𝑡 + ��𝐳}
= ℎ0(t)𝑒𝑥𝑝{��𝐳}
and at age=68.2 years is

128
ℎ((𝑡, 𝑎𝑔𝑒 = 68.2)) = ℎ0(t)exp {0.0422 × (68.2 − 58.2
10)
2
+ 0.0038 (68.2 − 58.2
10)
2
× 𝑡 + ��𝐳}
Now, the ratio of the two hazards is
ℎ(𝑡, 𝑎𝑔𝑒 = 68.2)
ℎ(𝑡, 𝑎𝑔𝑒 = 58.2)
=
ℎ0(t) × exp {0.0422 × (68.2 − 58.2
10 )2
+ 0.0038 (68.2 − 58.2
10 )2
× 𝑡 + ��𝐳}
ℎ0(t) × 𝑒𝑥𝑝{��𝐳}
= exp {0.0422 × (68.2 − 58.2
10)
2
+ 0.0038 (68.2 − 58.2
10)
2
× 𝑡}
= exp{0.0422 + 0.0038 × 𝑡}
Therefore, we get a time dependent expression for the relative hazard for two individuals for a 10
year increase in age from the mean age. Using this expression we computed relative hazards for
different times and the results are given in Table 5.9. It can be seen that as time increases the
hazard ratios are increasing at a slower rate. However, under the initial Cox model, relative risk
for age increase of 10 years from mean age is exp(0.0381 ∗ 10) = 1.46 irrespective of the time.
Therefore, when the model is adjusted for non-linear and non-PH effects we get different risk
ratios than we would get from unadjusted Cox model. To further visualize how the adjustments
to the Cox model make the hazard estimations different, we graph hazard ratios with respect to
the age increments and time as shown in Figure 5.8.

129
Table 5.9 Estimated hazard ratios for the Cox model with piecewise time varying effects
(Modified model B)
Time (t)
Hazard Ratio
10 year increase from
mean age
20 year increase from
mean age
0 1.09 1.18
2 1.10 1.21
4 1.10 1.25
6 1.11 1.28
8 1.12 1.31
Figure 5.8 Hazard Ratio plot for age adjusted for non-linearity and non-proportionality
130
Figure 5.8 shows that at time=0 hazard ratios for age are increased with age. However,
approximately from time = 5 years, lower ages have higher risk than the mean age 58.2 years
(baseline). When age is higher than the mean age, risks are increasing rapidly. Figure 5.8 clearly
shows how hazard ratios for age changes linearly with time and quadratically with age.
Therefore, if we had used the initial model to estimate the hazard ratios for age, it would not
provide a flexible hazard ratio function as our extended Cox model which could explain the risk
of cancer deaths more closely to the true pattern.
5.6 Discussion
The aim of this analysis was to explore how to assess and address model inadequacies
present in Cox proportional hazard model which is used extensively in time-to-event data
analysis. We used two methods to adjust the non-linearities and two methods to address non-
proportionalities present in the data. In addition, our goal was to investigate the effects of the
standard Cox PH model assumption violations using breast cancer survival data. We started the
model development by fitting the standard Cox model to the data and then checked for the model
inadequacies: influential values, non-linear effects and non-proportional hazards. Assumption of
proportional hazards is the major aspect of the Cox PH model which is not an easy task to
evaluate correctly. In some situations, the presence of other model inadequacies such as
influential values and non-linear effects may cause proportional hazards tests to reveal
significant non-proportionalities when actually they are proportional. Therefore, one first should
assess and adjust the model for other inadequacies before performing proportional hazards tests.
Graphical procedures suggested few data points to be possible unusual and influential values
(Table A1). We performed a sensitivity analysis of the parameter estimates with and without
these points and found out that removal of these points changes the estimates of race-other and

131
tumor size by more than 50%. Also, there were some inconsistent values taken by lymph node,
extension and stage variables among the data points in this identified list. Therefore, these data
points were not considered for further analysis of the current study.
Our model building process revealed non-linear effects in both of the continuous
covariates that we considered. The method of fractional polynomials proposed a logarithm effect
for tumor size at diagnosis and quadratic effect for age at diagnosis. The restricted cubic spline
method suggested three knot spline functions for both of the continuous variables. Both models
had nearly equal AIC values and due to the simplicity and interpretability of the functions, we
chose the fractional polynomial model to proceed with. Our finding of a quadratic effect was
consistent with findings of a similar study of breast cancer [39]. This effect suggests higher risk
of cancer death for younger females and older female than middle aged females. We compared
our results with the middle aged women of age 58.2 years which was the average age of the
individuals of the study and also approximately the minimum of the quadratic effect curve.
PRA and age were found to be violating the proportional hazards assumption under all
the evaluation methods that were considered. Non-proportionality of the PRA was modelled
through a continuous time dependent function guided by scaled Schoenfeld residual plot. Also, a
piecewise time dependent function was used to model the time dependency of the PRA effect. In
both of these models effect of age was modelled through a time dependent quadratic effect. Both
of these extended Cox models had very close log-likelihood values and AIC values. However,
the estimated hazard ratios were fairly different for PRA under these two competing models. Up
to 4 years both models gave relative risks of 3.9 and ~2.3 at time = 0 and time = 2. In fact, we
found that under the piecewise Cox model that risk of PRA-positive relative to PRA-negative is
not significant after around 4 years. This finding is consistent with the results of similar studies

132
on breast cancer [37], [40] where they discuss that the difference of the effects of PRA-positive
and PRA-negative diminishes after around 5 years. According to our continuous time model, it
seemed the differences in the risk decrease but at a lower rate and it approach 1 approximately
13 years from the date of diagnosis. Considering this fact, our decision is to prefer the piecewise
Cox model for the data being studied given that estimated effects of all the other covariates are
similar in both models. The effect that we found for age is interesting in that it contained both
non-linear and non-proportional hazards. According to our extended Cox model, age had a linear
effect on hazard ratio up to around 3 years and after that it shows a quadratic effect (Figure 5.8).
It shows that an individual as young as 28.2 years old has a risk of breast cancer of at least the
same risk of an individual 68.2 years old given that time that considered the risk at is more than 6
years from the diagnosis. This result is consistent with similar discussion had in where they
suggested higher risk of breast cancer for younger and older female than the middle aged females
[39].
In conclusion, we have identified that effects of age and tumor size at diagnosis on the
hazard function are quadratic and logarithmic respectively. Also, we found that age and PRA-
positive violate the assumption of proportionality. To address all these inadequacies of the
standard Cox model, we have developed a more flexible extended Cox model with non-linear
effects for age and tumor size and with non-PH effects of PRA and age described by a piecewise
time dependent coefficient and linear time dependent coefficient respectively. This model gives
improved and more accurate estimates of the risks of cancer specific death for women diagnosed
with breast cancer.

133
5.7 Contributions
In the present chapter, we have identified and estimated some important aspects regarding breast
cancer survival data as below.
Significantly contributing prognostic factors for overall survival of breast cancer
The effects of age at diagnosis and tumor size at diagnosis are not linear on the relative risks
The effect of PRA is not constant with respect to the follow-up time
An improved model that takes non-linear and non-proportional hazards in to account and
estimates relative risks

134
CHAPTER 6
FUTURE RESEARCH
The SEER database doesn’t consist of many demographic and life-style variables of the
women diagnosed with cancer. We believe that in the presence of more attributable variables the
predictive accuracy of the developed models can be improved more. For example, we were
interested in exploring and quantifying relationship between survival probabilities, tumor size
and other non-clinical characteristics of patients such as weight, family history of cancer. If we
can quantify such relationships then it would greatly helpful in cancer preventive care. In
addition, the methods applied in the present study can be applied to cancers that have not been
widely studied such as stomach cancer, head, and neck cancers.
Internal and external validation of the models presented here should be performed before
we make generalizations using the developed models. There are computational difficulties in
using the currently available validation and predictive accuracy measurement when there are
time dependent effects present in the model. Addressing this issue and modifying the standard
methods in order to address the time dependent effects would attract health researchers to use
these extended and flexible versions of standard survival analysis and modeling techniques.

135
REFERENCES
[1] "Cancer A-Z," American Cancer Society, 06 January 2017. [Online]. Available:
http://www.cancer.org/cancer/ovariancancer/detailedguide/ovarian-cancer-survival-rates.
[Accessed 14 May 2017].
[2] J. D. Wright, L. Chen, A. I. Tergas, S. Patan, W. M. Burke, J. Y. Hou, A. I. Neugut, C. V.
Ananth and D. L. Hershman, "Trends in Relative Survival for Ovarian Cancer From 1975
to 2011," Obstet Gynecol, 2015.
[3] "Ovarian Cancer," Mayo Clinic, 12 June 2014. [Online]. Available:
http://www.mayoclinic.org/diseases-conditions/ovarian-cancer/basics/risk-factors/con-
20028096. [Accessed 14 May 2017].
[4] "SEER Training Modules, Ovarian Cancer," U. S. National Institutes of Health, National
Cancer Institute. , [Online]. Available:
https://training.seer.cancer.gov/ovarian/intro/risk.html. [Accessed 14 May 2017].
[5] J. K. Chan, C. Tian, B. J. Monk, T. Herzog, D. S. Kapp, J. Bell and R. C. Young,
"Prognostic factors for high-risk early-stage epithelial ovarian cancer," Cancer, 2008.
[6] G. Cormio, C. Rossi, A. Cazzolla, L. Resta, G. Loverro, P. Greco and L. Selvaggi,
"Distant metastases in ovarian carcinoma.," International Journal of Gynecological
Cancer, 2003.

136
[7] L. Tang, M. Zheng, Y. Xiong, H. Ding and F. Liu, "Clinical characteristics and prognosis
of epithelial ovarian cancer in," Chinese Journal of Cancer, 2008.
[8] "Breast Cancer," American Cancer Soceity, 18 August 2016. [Online]. Available:
https://www.cancer.org/cancer/breast-cancer/about/whats-new-in-breast-cancer-
research.html. [Accessed 14 May 2017].
[9] J. J. Dignam, "Differences in breast cancer prognosis among African-American and
Caucasian women," A Cancer Journal for Clinicians, 2000.
[10] S. Joslyn, D. Gesme and C. Lynch, "Estrogen and Progesterone Receptors in Primary
Breast Cancer," The Breast Journal, 1996.
[11] J. Gnerlich, A. Deshpande, D. Jeffe, A. Sweet, N. White and M. J., "Elevated Breast
Cancer Mortality in Women Younger than Age 40 Years Compared with Older Women
Is Attributed to Poorer Survival in Early-Stage Disease," Journal Of The American
College Of Surgeons, 2009.
[12] C. D.R., "Regression Models and Life-Tables," Journal of the Royal Statistical Society,
1972.
[13] D. Cox and J. Snell, Applied Statistics, London: Chapman and Hall, 1986.
[14] A. O., "Nonparametric inference for a family of counting processes," Annals of Statistics,
1978.
[15] K. Cain and N. Lange, "Approximate Case Influence for the Proportional Hazards
137
Regression Model with Censored Data," Biometrics, 1984.
[16] T. Therneau and P. Grambsch, Modeling Survival Data: Extending the Cox Model, New
York: Springer, 2000.
[17] D. Lin, L. Wei and Z. Zing, "Checking the Cox model with cumulative sums of
Martingale-based residuals," Biometrika, 1993.
[18] P. Grambsch and T. Therneau, "Proportional Hazards tests and diagnostics based on
weighted residuals," Biometrika, 1994.
[19] "Breast Cancer Conditions," 25 June 2017. [Online]. Available:
http://www.mayoclinic.org/diseases-conditions/breast-cancer/multimedia/tumor-
size/img-20006260.
[20] G. Chornokur, E. K. Amankwah, J. M. Schildkraut and C. M. Phelan, "Global ovarian
cancer health disparities.," Gynecologic Oncology, 2013.
[21] O. W. Brawley, "Is Race Really a Negative Prognostic Factor for Cancer?," Journal of
the National Cancer Institute, 2009.
[22] D. Collett, Modelling Survival Data in Medical Research, Chapman and Hall, 2003.
[23] D. Hosmer, S. Lemeshow and S. May, Appled Survival Analysis: Regression Modeling
of Time-to-Event Data, John Wiley & Sons, 2008.
[24] F. Harrell, Regression modeling strategies: with applications to linear models, logistic
regression, and survival analysis, New York: Springer, 2001.

138
[25] P. Royston and M. Parmer, "Flexible parametric proportional hazards and proportional
odds models for censored survival data," Statistics in Medicine, 2002.
[26] P. Lambert and P. Royston, "Further Development of Flexible Parametric Models for
Survival Analysis," Stata Journal, 2009.
[27] D. R. Cox, "Regresssion Models and Life Tables," Journal of Royal Statistical Society,
1972.
[28] L. O. Tedeschi, "Assessment of the Adequacy of Mathematical Models.," 2004.
[29] "Seer Data Dictionary," 08 July 2017. [Online]. Available:
https://seer.cancer.gov/data/seerstat/nov2016/TextData.FileDescription.pdf.
[30] S. Komen, "Breast Cancer," 08 July 2017. [Online]. Available: http://ww5.komen.org/.
[31] W. S. Cleveland, S. J. Devlin and E. Grosse, "Regression by Local Fitting," Journal of
Econometrics, 1988.
[32] W. S. Cleveland and E. Grosse, "Computational Methods for Local Regression,"
Statistics and Computing, 1991.
[33] W. S. Cleveland, E. Grosse and M. Shyu, "A Package of C and Fortran Routines for
Fitting Local Regression Models," Unpublished manuscript, 1992.
[34] W. Sauerbrei and P. Royston, "Building multivariable prognostic and diagnostic models:
Transformation of the predictors by fractional polynomials," Journal of the Royal
Statistical Society, Series A, 1999.

139
[35] C. J. Stone and C. Koo, "Additive splines in statistics," in Proceedings of the Statistical
Computing Section ASA, Washington D.C., 1985.
[36] P. Grambsh, T. Therneau and T. Fleming, "Diagnostic plots to reveal functional form for
covariates in multiplicative intensity models.," Biometrics, 1995.
[37] J. Harris, M. Lippman, M. M. and C. Osborne, Diseases of the Breast, Lippincott
Williams & Wilkins, 2014.
[38] G. Lyman, S. Temin and S. Edge, "Sentinel lymph node biopsy for patients with early-
stage breast cancer:American Society of Clinical Oncology clinical practice guideline
update.," Journal of Clinical Oncology, 2014.
[39] P. Wingo, L. Ries, S. Parker and C. Heath, "Long-term Cancer Patient Survival in the
United States," Cancer Epidemiol Biomarkers Prev., 1998.
[40] G. Lyman, S. Temin and E. S., "Sentinel lymph node biopsy for patients with early-stage
breast cancer: American Society of Clinical Oncology clinical practice guideline
update.," Journal of Clinical Oncology, 2014.
[41] S. May and D. Hosmer, "A Simplified Method of Calculating an Overall Goodness-of-Fit
Test for the Cox Proportional Hazards Model," Life Time Data Analysis, 1998.
[42] D. G. Kleinbaum and M. Klein, Survival Analysis: A Self Learning Text, NY: Springer,
2012.
[43] J. K. Gronnesby and O. Borgan, "A method for checking regression models in survival

140
analysis based on the risk score," Life Time Data Analysis, 1996.
[44] P. Grambsch and T. Therneau, Modeling Survival Data: Extending the Cox Model, New
York: Springer, 2000.
[45] R. Christensen, W. Johnson, A. Branscum and T. Hanson, Bayesian Ideas and Data
Analysis, Chapman and Hall, 2011.
[46] J. Chapman, M. Trudeau, K. Pritchard, C. Sawka, B. Mobbs, W. Hanna, H. Kahn, D.
McCready and L. Lickley, "A comparison of all-subset Cox and accelerated failure time
models with Cox step-wise regression for node-positive breast cancer," Breast Cancer
Res Treat, 1992.
[47] F. Aranda-Ordaz, "Onn two families of transformations to additivity for binary response
data," Biometrika, 1981.

141
APPENDIX
Table A1 Identified Extreme Values for Breast Cancer Data
ID Race Lymph
Node Status
Tumor
Extension
Stage Progesterone
Receptor Test
Age at
diagnosis
Tumor Size
at diagnosis
62 White Negative Regional II Negative 47 151
121 Black Unknown Regional III Negative 42 161
149 White Positive Distant IV Negative 83 66
206 White Negative Regional III Negative 60 156
237 White Unknown Localized II Positive 61 131
819 Black Unknown Regional III Negative 87 151