static and dynamic mooring analysis - stability of floating...
TRANSCRIPT

Int. J. Naval Archit. Ocean Eng. (2013) 5:179~187
http://dx.doi.org/10.3744/JNAOE.2013.5.2.179
ⓒSNAK, 2013
Static and dynamic mooring analysis - Stability of floating
production storage and offloading (FPSO) risers for extreme environmental conditions
Yu-Ho Rho1, Kookhyun Kim2, Chul-Hee Jo3 and Do-Youb Kim1 1Graduate School, Department of Naval Architecture and Ocean Engineering, Inha University, Incheon, Korea
2Department of Naval Architecture, Tongmyong University, Busan, Korea 3Division of Aerospace, Naval Architecture and Industrial Engineering, Inha University, Inchon, Korea
ABSTRACT: Floating production storage and offloading (FPSO) facilities are used at most of the offshore oil fields worldwide. FPSO usage is expected to grow as oil fields move to deeper water, thus requiring the reliability and stabi-lity of mooring wires and risers in extreme environmental conditions. Except for the case of predictable attack angles of external loadings, FPSO facilities with turret single point mooring (SPM) systems are in general use. There are two types of turret systems: permanent systems and disconnectable turret mooring systems. Extreme environment criteria for permanent moorings are usually based on a 100-year return period event. It is common to use two or three environ-ments including the 100-year wave with associated wind and current, and the 100-year wind with associated waves and current. When fitted with a disconnectable turret mooring system, FPSOs can be used in areas where it is desirable to remove the production unit from the field temporarily to prevent exposure to extreme events such as cyclones or large icebergs. Static and dynamic mooring analyses were performed to evaluate the stability of a spider buoy after discon-nection from a turret during cyclone environmental conditions.
KEY WORDS: Mooring tension; Riser tension; Extreme environment; Coupled analysis; Mooring-lined tidal current power; Disconnectable turret mooring.
INTRODUCTION
Cyclones occur for a period of about three months in Australia’s Northwest region. However, they approach once or twice in a year in the area. Otherwise, the marine environment is rather mild. Hence, a disconnectable turret mooring (DTM) system is desirable and useful in this environment. The objective of this study is to provide a methodology for numerical modeling of the floating structure, spider buoy, and various components with a focus on disconnect and reconnect operations. The important parameters related to extending mooring-lined tidal current power (TCP) technology to deep water are also discussed.
ENVIRONMENT LOADS
Analysis environment
Fig. 1 shows a Stybarrow field located in Northwestern Australia. This area has extensive gas reserves and, except for the cyclone environment in the early summer, has a mild marine environment. The directions of cyclones are shown in Fig. 1. The cyclones are unpredictable and can last from a few days to two or three weeks.
Corresponding author: Kookhyun Kim e-mail: [email protected]

180 Int. J. Naval Archit. Ocean Eng. (2013) 5:179~187
In the analysis, the marine environments were separated into cyclone and non-cyclone categories. Cyclone data were sel-ected from 100 years of marine environment surveys (Duggal et al., 2007). The cyclone and non-cyclone data for the Stybarrow field are shown in Table 1 (Yang et al., 2010).
Fig. 1 Stybarrow field in Australia.
Table 1 Stybarrow field environmental conditions.
Type Wave data
*Hs (m) **Hmax (m) ***Ts (s) ****Tλ (s)
1 yr cyclone 8.2 13.5 10.4 8.6
10 yr cyclone 13 20.9 13.5 11.1
100 yr cyclone 15.8 24.9 15.4 12.2
1 yr non-cyclone 2.7 4.5 6.6 5.5
10 yr non-cyclone 5.7 8.5 8.8 7.3
100 yr non-cyclone 7.3 12.3 10.4 8.6
Type Wind data Current data
Speed (m/s) Direction Speed (m/s) Direction
1 yr cyclone 35.7 - 1.72 -
10 yr cyclone 55.4 - 2.32 -
100 yr cyclone 65.9 - 2.75 -
1 yr non-cyclone 21.9 - 0.57 -
10 yr non-cyclone 29.8 - 0.85 -
100 yr non-cyclone 33.7 - 1.1 - *Hs : Significan wave height. **Hmax : Maximum wave height. ***Ts : Significant wave period. ****Tλ : Peak wave period.
Wind coefficients
In the modeling process, the floating structure (except for the superstructure) was modeled. Therefore, the wind coefficients of the superstructure were calculated to indicate wind force, depending on the direction of wind. Fig. 2 shows the superstructure conception of the floating structure, and Table 2 gives the projected area of the superstructure.

Int. J. Naval Archit. Ocean Eng. (2013) 5:179~187 181
Fig. 2 Superstructure configuration of the floating structure.
Table 2 Projected area of superstructure.
Area no. Area (m2)) Area no. Area (m2))
A1 2674.7 A9 188.46
A2 303.63 A10 431.74
A3 303.63 A11 15.75
A4 303.63 A12 1160
A5 303.63 A13 454.14
A6 303.63 A14 7005.1
A7 303.63 A15 1287.5
A8 303.63
Mooring line and riser
A four-point mooring concept consists of a combination of four lines of chain and wire. The models of Santos Mutineer-Exeter for a disconnectable FPSO, introduced by Duggal et al. (2007), were used in this study. The chain was modeled as R4-RQ4 studless chain. A mooring line safety factor of 2.0 and a dynamic factor of 1.67 (API, 1998) were used in the numerical analysis. Production riser filled with water and crude oil, and water injection risers filled with sea water were modeled. Fig. 3 shows a layout of the mooring line and riser (the blue line is mooring line and the red line is the riser).
Fig. 3 Mooring and riser, view at horizontal projection. Fig. 4 Floating structure by GeniE.
Floating structure
The floating structure and spider buoy were designed based on the Nanhai Endeavour FPSO that is currently being applied in the South China Sea. Fig. 4 shows a redesigned model based on the standard model, and Table 3 shows standard model data and redesign model data.

182 Int. J. Naval Archit. Ocean Eng. (2013) 5:179~187
Table 3 Hull weight calculation.
Hull weight calculation
Existing ship Design ship
Length 245 m Length 333 m
Breadth 45 m Breadth 58 m
Depth 27 m Depth 30.4 m
Lightship 42425 tons
Steel area 96753 m3
Scale ratio 1.87
Scale lightship 79526 tons
Topside and misc. weight 30780 tons
Scale steel weight 48746 tons
Response amplitude operator (RAO)
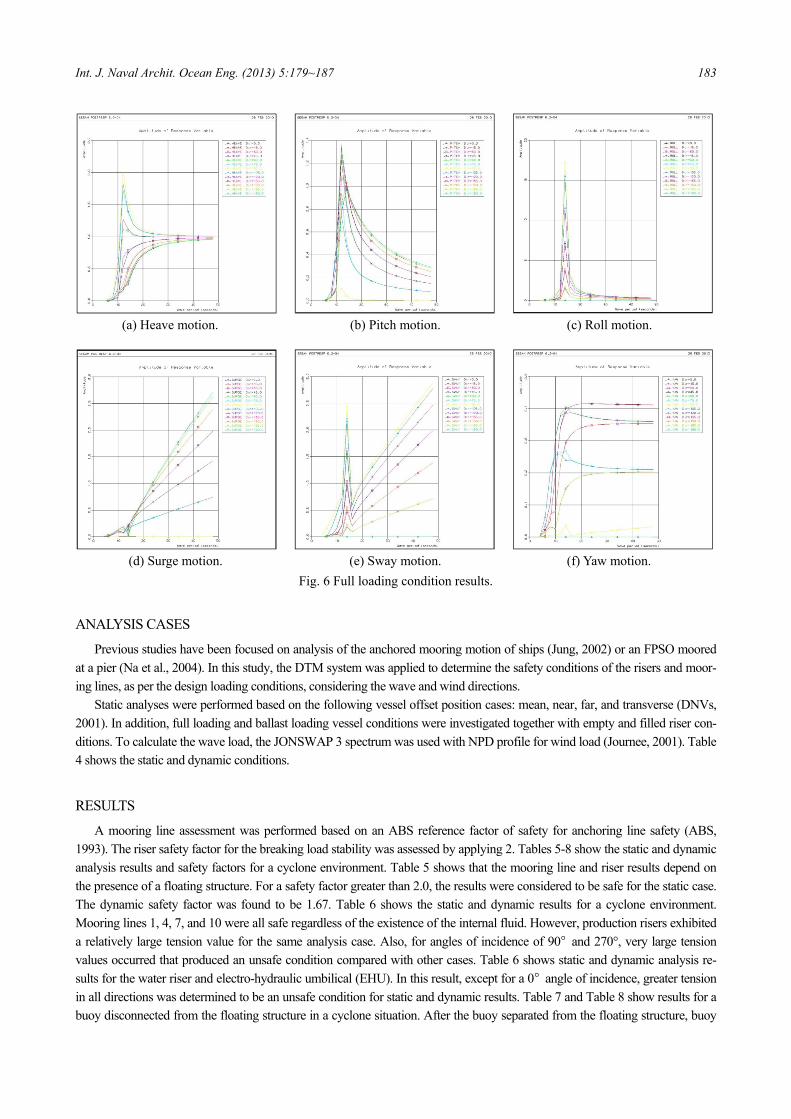
Hydrodynamic analysis was carried out using HydroD wadam from the model, generated using GeniE, HydroD and DeepC commercial software named Sesam™ from Det Norske Veritas (DNVs, 2008). The analysis cases used a 20% loading condi-tion and a full loading condition. Fig. 5 and Fig. 6 indicate the results for heave, pitch, roll, surge, sway, and yaw for the 20% load and full load cases, respectively.
(a) Heave motion. (b) Pitch motion. (c) Roll motion.
(d) Surge motion. (e) Sway motion. (f) Yaw motion.
Fig. 5 20% loading condition results.
Int. J. Naval Archit. Ocean Eng. (2013) 5:179~187 183
(a) Heave motion. (b) Pitch motion. (c) Roll motion.
(d) Surge motion. (e) Sway motion. (f) Yaw motion.
Fig. 6 Full loading condition results.
ANALYSIS CASES
Previous studies have been focused on analysis of the anchored mooring motion of ships (Jung, 2002) or an FPSO moored at a pier (Na et al., 2004). In this study, the DTM system was applied to determine the safety conditions of the risers and moor-ing lines, as per the design loading conditions, considering the wave and wind directions.
Static analyses were performed based on the following vessel offset position cases: mean, near, far, and transverse (DNVs, 2001). In addition, full loading and ballast loading vessel conditions were investigated together with empty and filled riser con-ditions. To calculate the wave load, the JONSWAP 3 spectrum was used with NPD profile for wind load (Journee, 2001). Table 4 shows the static and dynamic conditions.
RESULTS
A mooring line assessment was performed based on an ABS reference factor of safety for anchoring line safety (ABS, 1993). The riser safety factor for the breaking load stability was assessed by applying 2. Tables 5-8 show the static and dynamic analysis results and safety factors for a cyclone environment. Table 5 shows that the mooring line and riser results depend on the presence of a floating structure. For a safety factor greater than 2.0, the results were considered to be safe for the static case. The dynamic safety factor was found to be 1.67. Table 6 shows the static and dynamic results for a cyclone environment. Mooring lines 1, 4, 7, and 10 were all safe regardless of the existence of the internal fluid. However, production risers exhibited a relatively large tension value for the same analysis case. Also, for angles of incidence of 90° and 270°, very large tension values occurred that produced an unsafe condition compared with other cases. Table 6 shows static and dynamic analysis re-sults for the water riser and electro-hydraulic umbilical (EHU). In this result, except for a 0° angle of incidence, greater tension in all directions was determined to be an unsafe condition for static and dynamic results. Table 7 and Table 8 show results for a buoy disconnected from the floating structure in a cyclone situation. After the buoy separated from the floating structure, buoy

184 Int. J. Naval Archit. Ocean Eng. (2013) 5:179~187
sunk to 25 m water depth. Overall, these results show greatly reduced tension in the risers and mooring lines because there were fewer effects from wind, waves, and current loads compared to a sea surface.
Table 4 Analysis load cases.
Loading condition Internal fluid Current direction Wind direction (degrees) Wave direction (degrees)
20% loading condition
Empty
211°
0 0
90 90
180 180
270 270
Filled
0 0
90 90
180 180
270 270
Full loading condition
Empty
0 0
90 90
180 180
270 270
Filled
0 0
90 90
180 180
270 270
Table 5 Results for risers connected with FPSO. Internal
fluid Wave wind (degrees) Analysis Water_1
(kN) Water_2
(kN) S.F EHU (kN) S.F Stability
Empty
0 Static 671.634 620.736 4.97 188.428 10.81 stable
Dynamic 866.194 737.244 3.86 352.664 5.78 stable
90 Static 675.599 615.882 4.94 189.114 10.77 stable
Dynamic 1363.99 2447.45 1.36 401.139 5.08 unstable
180 Static 682.664 590.77 4.89 186.52 10.92 stable
Dynamic 813.769 1977.48 1.69 271.516 7.50 unstable
270 Static 674.742 608.104 4.95 195.711 10.41 stable
Dynamic 885.588 2062.69 1.62 369.602 5.51 unstable
Filled
0 Static 571.394 980.608 3.41 188.527 10.8 stable
Dynamic 763.301 1093.33 3.05 354.318 5.75 stable
90 Static 574.575 973.901 3.43 189.01 10.78 stable
Dynamic 972.383 3007.41 1.11 403.127 5.05 unstable
180 Static 580.194 937.266 3.56 186.628 10.91 stable
Dynamic 719.48 2583.14 1.29 272.09 7.49 unstable
270 Static 574.043 964.072 3.46 195.617 10.41 stable
Dynamic 746.948 2737.5 1.22 369 5.52 unstable

Int. J. Naval Archit. Ocean Eng. (2013) 5:179~187 185
Table 6 Results for mooring line and riser connected with FPSO. Internal
fluid
Wave wind
(degrees)
Analy- sis
Mooring 1 (kN)
Mooring 4 (kN)
Mooring 7 (kN)
Mooring10 (kN)
Safety factor
Sta-bility
Internal fluid
Wavewind
Analy- sis
Prod_1(kN)
Prod_2 (kN)
Prod_3 (kN)
Prod_4 (kN)
Safety factor
Sta- bility
Empty
0 Static 6676.98 6412.82 5515.91 5745.38 2.86 stable
Empty
0 Static 1431.67 1093.34 1469.13 1020.15 4.97 stable
Dynamic 8065.27 8131.83 7097.78 6899.7 2.35 stable Dynamic 1928.22 1341.39 2092.14 1144.48 3.49 stable
90 Static 6744.71 6399.84 5528.88 5821.29 2.83 stable
90 Static 1449.84 1094.65 1463.72 1020.14 4.99 stable
Dynamic 9151.82 8074.67 7034.74 7112.59 2.09 stable Dynamic 2499.11 1570.69 1933.87 1181.66 2.92 stable
180 Static 6906.48 6204.11 5306.07 5926.14 2.76 stable
180Static 1481.7 1089.93 1435.9 1022.15 4.93 stable
Dynamic 7885.99 7503.95 6401.08 6850.14 2.42 stable Dynamic 1884.39 1269.5 1797.76 1110.51 3.88 stable
270 Static 6751.73 6273.39 5889.44 6423.89 2.83 stable
270Static 1535.9 1073.21 1435.81 1038.65 4.76 stable
Dynamic 7717.61 7027.42 7118.66 8337.73 2.29 stable Dynamic 2677.57 1170.37 1698.73 1208.31 2.73 stable
Filled
0 Static 6679.96 6371.42 5509.73 5777.84 2.86 stable
Filled
0 Static 1912.86 1249.87 2084.4 1018.23 3.50 stable
Dynamic 8048.79 8092.79 7100.98 6922.11 2.36 stable Dynamic 2903.93 1713.79 3094.41 1564.14 2.36 stable
90 Static 6745.89 6361.32 5524.05 5852.27 2.83 stable
90 Static 1936.63 1253.74 2072.47 1018.26 3.52 stable
Dynamic 9135.79 8022.42 7015.28 7132.32 2.09 stable Dynamic 4253.49 2570.37 3610.99 1625.91 1.72 unstable
180 Static 6904.03 6174.51 5304.87 5953.01 2.76 stable
180Static 1977.28 1241.17 2009.41 1022.78 3.63 stable
Dynamic 6188.99 5032.25 6832.34 7852.17 2.43 stable Dynamic 3039.52 1894.54 3060.2 1425.6 2.39 stable
270 Static 6757.03 6255.93 5879.37 6436.21 2.83 stable
270Static 2047.5 1199.13 2010.79 1063.47 3.57 stable
Dynamic 7702.28 7027.99 7115.74 8325.3 2.48 stable Dynamic 4291.04 1675.62 2797.69 1642.41 1.70 unstable
Table 7 Results for mooring line and riser connected to spider buoy. Internal
fluid
Wave Wind
(degrees)
Analy- sis
Mooring 1 (kN)
Mooring 4 (kN)
Mooring 7 (kN)
Mooring10 (kN)
Safety factor
Sta- bility
Internal fluid
WaveWind
Analy-sis
Prod_1(kN)
Prod_2 (kN)
Prod_3 (kN)
Prod_4 (kN)
Safety factor
Sta- bility
Filled
0 Static 4429.66 4356.45 4282.03 4381.46 4.31 stable
Filled
0 Static 1281.57 797.31 1383.07 749.96 5.28 stable
Dynamic 4469.66 5207.05 5552.22 4845.86 3.44 stable Dynamic 1470.78 937.96 1756.31 1083.52 4.16 stable
90 Static 4032.91 3737.27 3719.75 4007.85 4.73 stable
90 Static 1217.68 791.09 1344.48 745.37 5.43 stable
Dynamic 4971.20 4103.64 4132.79 4659.34 3.84 stable Dynamic 1504.54 929.48 1615.46 873.33 4.52 stable
180 Static 3810.08 3646.17 3570.40 3724.41 5.01 stable
180 Static 1171.65 788.30 1357.70 743.84 5.38 stable
Dynamic 5031.22 3802.38 3727.07 4316.44 3.79 stable Dynamic 1522.84 896.62 1508.58 830.09 4.80 stable
270 Static 4763.87 4329.94 3964.84 4404.05 4.01 stable
270 Static 1326.69 809.09 1344.15 743.00 5.43 stable
Dynamic 5293.38 4613.46 4233.00 4847.05 3.61 stable Dynamic 1578.49 951.61 1548.02 852.17 4.63 stable
Table 8 Results for mooring line and riser connected to spider buoy.
Internal fluid Wave Wind (degrees) Analysis Water_1 (kN) Water_2 (kN) S.F EHU (kN) S.F Stability
Filled
0 Static 396.30 605.54 5.52 133.24 15.29 stable
Dynamic 407.66 835.60 4.0 231.20 8.81 stable
90 Static 396.18 602.39 5.54 130.01 15.67 stable
Dynamic 418.64 714.21 4.68 139.40 14.61 stable
180 Static 393.32 603.37 5.54 128.32 15.87 stable
Dynamic 423.01 656.75 5.09 132.60 15.36 stable
270 Static 401.95 602.45 5.54 130.79 15.57 stable
Dynamic 419.55 668.09 5.0 139.80 14.57 stable

186 Int. J. Naval Archit. Ocean Eng. (2013) 5:179~187
Fig. 7 Production riser tension results from static analysis (left) and
mooring line tension results from static analysis (right).
Fig. 8 Production riser tension results (left) and water riser tension results (right).
Fig. 7 shows the results of the distribution of tension along the length based on static analysis. Position 0 represents a riser or mooring lines connected to the floating structure, and the end of the x-component represents parts of the riser connection to the well. Fig. 8 confirms the results of the dynamic analysis and shows the change in tension with time. The left side of Fig. 8 shows tension value results for production riser no. 1 for angles of 0, 90, 180, and 270°. The tension value for an angle of inci-dence of 0° was lower than for any other angles. The right side of Fig. 8 shows the results for production riser no. 1 and water risers for an angle of incidence of 0°.
CONCLUSION
The paper suggested a general process of the safety analysis of mooring lines and risers connected to a floating structure using the Sesam program. The direction and combination of external loadings have a significant effect on the tension and stabi-lity of risers, especially when there are a number of risers connected to the structure. It is important to consider the most con-servative environmental condition and configuration. The riser type, size, and length can directly affect the tension and bending moments. The most important factors in mooring line design are the distance to the touch down point, and the diameter of the line that can allow the excursion of a floating structure or buoy within a specified tolerance. A mooring design should satisfy the stability of the riser for various environmental and loading conditions.
Based on the results, a variety of floating marine energy structures mooring lines design and analysis are possible. In addi-tion, having similar essential properties of EHU riser, the present research approaches can be effectively applied to the static and dynamic studies on the power and monitoring cables in the future. Tidal current power, offshore wind, wave energy and etc. that are installed in deep water, so should be performed for the motion analysis of the riser and mooring for ensuring the safety of the floating structure.
Int. J. Naval Archit. Ocean Eng. (2013) 5:179~187 187
ACKNOWLEDGEMENT
This work was supported by the Manpower Development Program for Marine Energy of the Ministry of Land, Transport and Maritime Affairs (MLTM) of the Korean government, and by Inha University. The author is grateful to INHA University for the funding research grant.
REFERENCES
ABS, 1993. Recommended practice for design, analysis and maintenance of mooring for floating production systems. Washington D.C.
API, 1998. Design of risers for floating production systems (FPSs) and tension-leg platforms (TLPs). Washington D.C.: API Publishing.
DNVs, 2001. Dynamic riser. Det Norske Veritas. DNVs, 2008. DeepC user’s manual. DNVs software. Duggal, A., Ryu, S. and Andrade, O.D., 2007. Numerical modeling of disconnectable turret mooring systems. SOFEC
Inc. Journee, J.M.J., 2001. Offshore hydromechanics. Delft University of Technology. Jung, G.S., 2002. Analysis of mooring behavior of a berthed ship. Master’s Thesis. Inha University. Na, J.H., Sim, W.S., Lee, I.H., Moon, J.S., Kim, J.W. and Shin, H.S., 2004. FPSO quay mooring analysis in typhoon
condition. Proceedings of the Annual Autumn Meeting, The Society of Naval Architects of Korea. Sancheong, Korea 20-22 October 2004. pp.646-651.
Yang, C.K., Bae, Y.H., Kim, M.H. and Ward, E.G., 2010. Loads on tie-down systems for floating drilling rigs during hurricane conditions. International offshore and polar engineering conference. 20(2), pp.95-102.