statewide aggregate specialty mental health services ... · the 2016 smhs performance dashboard...
TRANSCRIPT
2016
Statewide Aggregate Specialty Mental Health Services Performance Dashboard
1

2016
Department of Health Care Services 2016 Medi-Cal Specialty Mental Health Performance Dashboard Pursuant to the requirements of the 1915(b) Specialty Mental Health Services (SMHS) Waiver Special Terms and Conditions #1, the SMHS Performance Dashboard makes available to the public data on SMHS provided to Medi-Cal eligible beneficiaries by Mental Health Plans (MHPs) and their contracted organizational providers. To protect patient privacy, all data is published in accordance with the DHCS Public Aggregate Reporting Guidelines. Following publication of the statewide aggregate SMHS Performance Dashboard, DHCS will produce county-specific MHP SMHS Performance Dashboards. These dashboards will be published on the DHCS and MHP websites beginning January 2017. Producing state-level and county-specific dashboards will make information on the performance of California’s SMHS readily available to the public and meets the requirements and intention of the 1915(b) SMHS Waiver Special Terms and Conditions.
The statewide aggregate SMHS Performance Dashboard includes two sets of charts and tables that include demographics of children and youth, and adult and older adult populations by age, gender, race, and ethnicity. The first set of charts and tables focus on demographics and service utilization of children and youth age 0 through 20 and the second set focuses on the same data elements for adults age 21 and older. All reports are based on approved claims data for SMHS provided to Medi-Cal eligible beneficiaries. The charts and tables also include service utilization data that is displayed by dollar amount and units of service. Two types of penetration rate information are provided and categorized by demographic characteristics. Additionally, tables include a point-in-time “snapshot” of populations entering, exiting, and continuing services over a two-year period. Time-to-step-down tables provide data covering the past four years of the time-to-step-down services following psychiatric inpatient discharge. The 2016 SMHS Performance Dashboard includes trend information by displaying information for fiscal years 2011-12, 2012-13, 2013-14, and 2014-15. Subsequent Performance Dashboards will also include updated and additional information as new fiscal year data becomes available. Notations on the chart and tables define measures used, such as the penetration rate, or explain anomalies in the data. Areas where data is suppressed in order to comply with Public Aggregate Reporting Guidelines, to prevent the release of patient health information, is also noted.
2

2016
Performance Outcomes System Children and Youth Reports
3
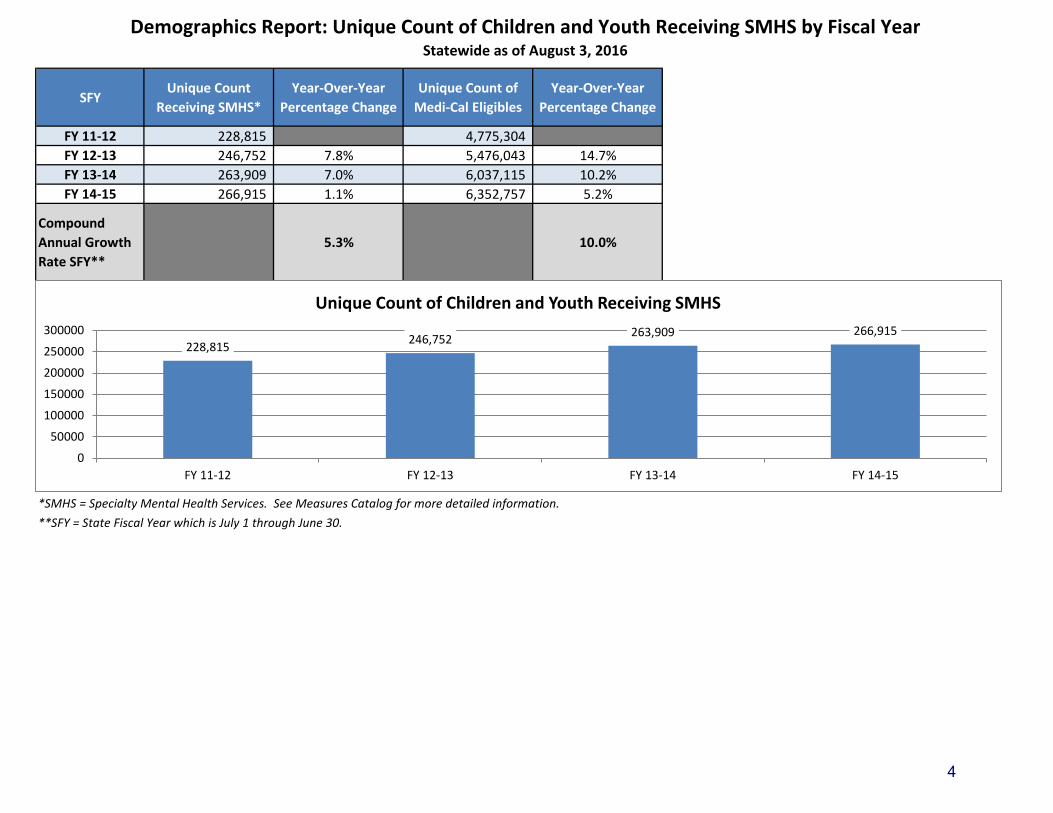
Demographics Report: Unique Count of Children and Youth Receiving SMHS by Fiscal YearStatewide as of August 3, 2016
SFYUnique Count
Receiving SMHS*Year-Over-Year
Percentage ChangeUnique Count of
Medi-Cal EligiblesYear-Over-Year
Percentage Change
FY 11-12 228,815 4,775,304 FY 12-13 246,752 7.8% 5,476,043 14.7%FY 13-14 263,909 7.0% 6,037,115 10.2%FY 14-15 266,915 1.1% 6,352,757 5.2%
Compound Annual Growth Rate SFY**
5.3% 10.0%
*SMHS = Specialty Mental Health Services. See Measures Catalog for more detailed information.**SFY = State Fiscal Year which is July 1 through June 30.
228,815 246,752 263,909 266,915
0
50000
100000
150000
200000
250000
300000
FY 11-12 FY 12-13 FY 13-14 FY 14-15
Unique Count of Children and Youth Receiving SMHS
4

Demographics Report: Unique Count of Children and Youth Receiving SMHS by Fiscal YearStatewide as of August 3, 2016
Fiscal Year
Alaskan Native or American
Indian Count
Alaskan Native or American Indian %
Asian or Pacific
Islander Count
Asian or Pacific
Islander % Black Count Black %
Hispanic Count
Hispanic % White Count White % Other Count Other % Unknown
Count Unknown %
FY 11-12 1,492 0.7% 6,037 2.6% 32,017 14.0% 111,224 48.6% 62,745 27.4% 3,164 1.4% 12,136 5.3%FY 12-13 1,472 0.6% 6,688 2.7% 32,082 13.0% 123,163 49.9% 64,142 26.0% 4,298 1.7% 14,907 6.0%FY 13-14 1,478 0.6% 7,699 2.9% 31,631 12.0% 134,109 50.8% 65,847 25.0% 5,458 2.1% 17,687 6.7%FY 14-15 1,440 0.5% 8,795 3.3% 30,374 11.4% 135,952 50.9% 66,224 24.8% 6,015 2.3% 18,115 6.8%
*FY 13-14 claims are estimated to be 95% complete as of January 1, 2015.
1% 3%
14%
49%
27%
1%5%
Fiscal Year 11-12 Race Distribution
Alaskan Native or AmericanIndianAsian or Pacific Islander
Black
Hispanic
White
Other
Unknown
1% 3%
13%
50%
26%
2%6%
Fiscal Year 12-13 Race Distribution
Alaskan Native or AmericanIndianAsian or Pacific Islander
Black
Hispanic
White
Other
Unknown
1% 3%
12%
51%
25%
2%7%
Fiscal Year 13-14 Race Distribution
Alaskan Native or AmericanIndianAsian or Pacific Islander
Black
Hispanic
White
Other
Unknown
1% 3%
11%
51%
25%
2%7%
Fiscal Year 14-15 Race Distribution
Alaskan Native or AmericanIndianAsian or Pacific Islander
Black
Hispanic
White
Other
Unknown
5

Demographics Report: Unique Count of Children and Youth Receiving SMHS by Fiscal YearStatewide as of August 3, 2016
Fiscal Year
Children 0-5Count
Children 0-5 % Children 6-11
Count Children 6-11 %
Children 12-17Count
Children 12-17 % Youth 18-20
Count Youth 18-20 %
FY 11-12 31,836 13.9% 78,479 34.3% 95,376 41.7% 23,124 10.1%FY 12-13 31,604 12.8% 84,686 34.3% 102,337 41.5% 28,125 11.4%FY 13-14 32,513 12.3% 90,328 34.2% 110,738 42.0% 30,330 11.5%FY 14-15 33,050 12.4% 90,003 33.7% 111,313 41.7% 32,549 12.2%
*FY 13-14 claims are estimated to be 95% complete as of January 1, 2015.
14%
34%42%
10%
Fiscal Year 11-12 Age Group Distribution
Children 0-5
Children 6-11
Children 12-17
Youth 18-20
13%
34%41%
11%
Fiscal Year 12-13 Age Group Distribution
Children 0-5
Children 6-11
Children 12-17
Youth 18-20
12%
34%42%
11%
Fiscal Year 13-14 Age Group Distribution
Children 0-5
Children 6-11
Children 12-17
Youth 18-20
12%
34%42%
12%
Fiscal Year 14-15 Age Group Distribution
Children 0-5
Children 6-11
Children 12-17
Youth 18-20
6

Demographics Report: Unique Count of Children and Youth by Fiscal YearStatewide as of August 3, 2016
Fiscal Year
FemaleCount
Female % MaleCount
Male %
FY 11-12 97,835 42.8% 130,980 57.2%FY 12-13 106,516 43.2% 140,236 56.8%FY 13-14 116,012 44.0% 147,897 56.0%FY 14-15 119,396 44.7% 147,519 55.3%
42.8%
57.2%
Fiscal Year 11-12 Gender Distribution
Female Male43.2%
56.8%
Fiscal Year 12-13 Gender Distribution
Female Male
44.0%
56.0%
Fiscal Year 13-14 Gender Distribution
Female Male44.7%
55.3%
Fiscal Year 14-15 Gender Distribution
Female Male
7

Penetration Rates* Report: Children and Youth With At Least One SMHS Visit**Statewide as of August 3, 2016
Children and Youth with 1
or more SMHS Visits
Certified Eligible
Children and Youth
Penetration Rate
Children and Youth with 1
or more SMHS Visits
Certified Eligible
Children and Youth
Penetration Rate
Children and Youth with 1 or
more SMHS Visits
Certified Eligible
Children and Youth
Penetration Rate
Children and Youth with 1 or
more SMHS Visits
Certified Eligible
Children and Youth
Penetration Rate
All 228,815 4,775,304 4.8% 246,752 5,476,043 4.5% 263,909 6,037,115 4.4% 266,915 6,352,757 4.2%
Children 0-5 31,836 1,768,421 1.8% 31,604 1,845,768 1.7% 32,513 1,889,031 1.7% 33,050 1,899,764 1.7%Children 6-11 78,479 1,287,544 6.1% 84,686 1,582,876 5.4% 90,328 1,759,965 5.1% 90,003 1,838,788 4.9%Children 12-17 95,376 1,134,157 8.4% 102,337 1,388,448 7.4% 110,738 1,556,844 7.1% 111,313 1,622,677 6.9%Youth 18-20 23,124 585,182 4.0% 28,125 658,951 4.3% 30,330 831,275 3.6% 32,549 991,528 3.3%
Alaskan Native or American Indian 1,492 20,046 7.4% 1,472 20,670 7.1% 1,478 21,976 6.7% 1,440 22,848 6.3%Asian or Pacific Islander 6,037 343,039 1.8% 6,688 434,825 1.5% 7,699 518,060 1.5% 8,795 560,523 1.6%Black 32,017 420,454 7.6% 32,082 436,927 7.3% 31,631 451,612 7.0% 30,374 463,333 6.6%Hispanic 111,224 2,807,069 4.0% 123,163 3,217,490 3.8% 134,109 3,450,311 3.9% 135,952 3,573,360 3.8%White 62,745 737,572 8.5% 64,142 820,886 7.8% 65,847 939,222 7.0% 66,224 1,001,776 6.6%Other 3,164 121,838 2.6% 4,298 167,395 2.6% 5,458 213,647 2.6% 6,015 237,756 2.5%Unknown 12,136 325,286 3.7% 14,907 377,850 3.9% 17,687 442,287 4.0% 18,115 493,161 3.7%
Female 97,835 2,366,827 4.1% 106,516 2,711,146 3.9% 116,012 2,981,430 3.9% 119,396 3,133,356 3.8%Male 130,980 2,408,477 5.4% 140,236 2,764,897 5.1% 147,897 3,055,685 4.8% 147,519 3,219,401 4.6%
*Penetration Rate is defined as the percentage of SMHS eligible beneficiaries that have received a SMHS that was claimed via the Short-Doyle/Medi-Cal claiming system. This does not include non-specialty mental health services provided in the Medi-Cal Managed Care system.**Children and Youth that have received at least one SMHS that was claimed through the Short-Doyle/ Medi-Cal claiming system on at least one (1) day in the Fiscal Year.
FY 11-12 FY 12-13 FY 13-14 FY 14-15
1.8% 1.7% 1.7% 1.7%
6.1%5.4% 5.1% 4.9%
8.4%7.4% 7.1% 6.9%
4.0% 4.3%3.6% 3.3%
0%
2%
4%
6%
8%
10%
12%
14%
16%
18%
FY 11-12(n= 1,768,421)
FY 12-13(n= 1,845,768)
FY 13-14(n= 1,889,031)
FY 14-15(n= 1,899,764)
FY 11-12(n= 1,287,544)
FY 12-13(n= 1,582,876)
FY 13-14(n= 1,759,965)
FY 14-15(n= 1,838,788)
FY 11-12(n= 1,134,157)
FY 12-13(n= 1,388,448)
FY 13-14(n= 1,556,844)
FY 14-15(n= 1,622,677)
FY 11-12(n= 585,182)
FY 12-13(n= 658,951)
FY 13-14(n= 831,275)
FY 14-15(n= 991,528)
Children 0-5 Children 6-11 Children 12-17 Youth 18-20
Penetration Rates by AgeChildren and Youth With At Least One SMHS Visit**, By Fiscal Year
8

Penetration Rates* Report: Children and Youth With At Least One SMHS Visit**Statewide as of August 3, 2016
*Penetration Rate is defined as the percentage of SMHS eligible beneficiaries that have received a SMHS that was claimed via the Short-Doyle/Medi-Cal claiming system. This does not include non-specialty mental health services provided in the Medi-Cal Managed Care system.**Children and Youth that have received at least one SMHS that was claimed through the Short-Doyle/ Medi-Cal claiming system on at least one (1) day in the Fiscal Year.
7.4% 7.1% 6.7% 6.3%
1.8% 1.5% 1.5% 1.6%
7.6% 7.3% 7.0% 6.6%
4.0% 3.8% 3.9% 3.8%
8.5%7.8%
7.0% 6.6%
0%
2%
4%
6%
8%
10%
12%
14%
16%
18%
FY 11-12(n= 20,046)
FY 12-13(n= 20,670)
FY 13-14(n= 21,976)
FY 14-15(n= 22,848)
FY 11-12(n=
343,039)
FY 12-13(n=
434,825)
FY 13-14(n=
518,060)
FY 14-15(n=
560,523)
FY 11-12(n=
420,454)
FY 12-13(n=
436,927)
FY 13-14(n=
451,612)
FY 14-15(n=
463,333)
FY 11-12(n=
2,807,069)
FY 12-13(n=
3,217,490)
FY 13-14(n=
3,450,311)
FY 14-15(n=
3,573,360)
FY 11-12(n=
737,572)
FY 12-13(n=
820,886)
FY 13-14(n=
939,222)
FY 14-15(n=
1,001,776)
Alaskan Native or American Indian Asian or Pacific Islander Black Hispanic White
Penetration Rates by RaceChildren and Youth With At Least One SMHS Visit**, By Fiscal Year
4.1% 3.9% 3.9% 3.8%
5.4% 5.1% 4.8% 4.6%
0%
2%
4%
6%
8%
10%
12%
14%
16%
18%
FY 11-12(n= 2,366,827)
FY 12-13(n= 2,711,146)
FY 13-14(n= 2,981,430)
FY 14-15(n= 3,133,356)
FY 11-12(n= 2,408,477)
FY 12-13(n= 2,764,897)
FY 13-14(n= 3,055,685)
FY 14-15(n= 3,219,401)
Female Male
Penetration Rates by GenderChildren and Youth With At Least One SMHS Visit**, By Fiscal Year
9

Penetration Rates* Report: Children and Youth With Five or More SMHS Visits**Statewide as of August 3, 2016
Children and Youth with 5 or
more SMHS Visits
Certified Eligible
Children and Youth
Penetration Rate
Children and Youth with 5 or
more SMHS Visits
Certified Eligible
Children and Youth
Penetration Rate
Children and Youth with 5 or
more SMHS Visits
Certified Eligible
Children and Youth
Penetration Rate
Children and Youth with 5 or
more SMHS Visits
Certified Eligible
Children and Youth
Penetration Rate
All 175,884 4,775,304 3.7% 189,431 5,476,043 3.5% 202,785 6,037,115 3.4% 203,992 6,352,757 3.2%
Children 0-5 21,729 1,768,421 1.2% 21,417 1,845,768 1.2% 21,687 1,889,031 1.1% 22,063 1,899,764 1.2%Children 6-11 62,629 1,287,544 4.9% 67,345 1,582,876 4.3% 72,104 1,759,965 4.1% 71,497 1,838,788 3.9%Children 12-17 75,906 1,134,157 6.7% 81,153 1,388,448 5.8% 87,781 1,556,844 5.6% 88,340 1,622,677 5.4%Youth 18-20 15,620 585,182 2.7% 19,703 658,951 3.0% 21,213 831,275 2.6% 22,092 991,528 2.2%
Alaskan Native or American Indian 1,127 20,046 5.6% 1,110 20,670 5.4% 1,087 21,976 4.9% 1,067 22,848 4.7%Asian or Pacific Islander 4,590 343,039 1.3% 5,153 434,825 1.2% 5,872 518,060 1.1% 6,758 560,523 1.2%Black 24,850 420,454 5.9% 24,864 436,927 5.7% 24,397 451,612 5.4% 23,354 463,333 5.0%Hispanic 84,368 2,807,069 3.0% 93,953 3,217,490 2.9% 102,482 3,450,311 3.0% 103,287 3,573,360 2.9%White 48,943 737,572 6.6% 48,943 820,886 6.0% 50,832 939,222 5.4% 50,912 1,001,776 5.1%Other 2,438 121,838 2.0% 3,266 167,395 2.0% 4,222 213,647 2.0% 4,570 237,756 1.9%Unknown 9,568 325,286 2.9% 11,769 377,850 3.1% 13,893 442,287 3.1% 14,044 493,161 2.8%
Female 74,330 2,366,827 3.1% 81,016 2,711,146 3.0% 88,211 2,981,430 3.0% 90,189 3,133,356 2.9%Male 101,554 2,408,477 4.2% 108,602 2,764,897 3.9% 114,574 3,055,685 3.7% 113,803 3,219,401 3.5%
*Penetration Rate is defined as the percentage of SMHS eligible beneficiaries that have received a SMHS that was claimed via the Short-Doyle/Medi-Cal claiming system. This does not include non-specialty mental health services provided in the Medi-Cal Managed Care system.**Children and Youth that have received at least five SMHS that were claimed through the Short-Doyle/ Medi-Cal claiming system in the Fiscal Year.
FY 11-12 FY 12-13 FY 13-14 FY 14-15
1.2% 1.2% 1.1% 1.2%
4.9%4.3% 4.1% 3.9%
6.7%5.8% 5.6% 5.4%
2.7% 3.0% 2.6% 2.2%
0%
2%
4%
6%
8%
10%
12%
14%
16%
18%
FY 11-12(n= 1,768,421)
FY 12-13(n= 1,845,768)
FY 13-14(n= 1,889,031)
FY 14-15(n= 1,899,764)
FY 11-12(n= 1,287,544)
FY 12-13(n= 1,582,876)
FY 13-14(n= 1,759,965)
FY 14-15(n= 1,838,788)
FY 11-12(n= 1,134,157)
FY 12-13(n= 1,388,448)
FY 13-14(n= 1,556,844)
FY 14-15(n= 1,622,677)
FY 11-12(n= 585,182)
FY 12-13(n= 658,951)
FY 13-14(n= 831,275)
FY 14-15(n= 991,528)
Children 0-5 Children 6-11 Children 12-17 Youth 18-20
Penetration Rates by AgeChildren and Youth With Five or More SMHS Visits**, By Fiscal Year
10

Penetration Rates* Report: Children and Youth With Five or More SMHS Visits**Statewide as of August 3, 2016
*Penetration Rate is defined as the percentage of SMHS eligible beneficiaries that have received a SMHS that was claimed via the Short-Doyle/Medi-Cal claiming system. This does not include non-specialty mental health services provided in the Medi-Cal Managed Care system.**Children and Youth that have received at least five SMHS that were claimed through the Short-Doyle/ Medi-Cal claiming system in the Fiscal Year.
5.6% 5.4% 4.9% 4.7%
1.3% 1.2% 1.1% 1.2%
5.9% 5.7% 5.4% 5.0%
3.0% 2.9% 3.0% 2.9%
6.6%6.0% 5.4% 5.1%
0%
2%
4%
6%
8%
10%
12%
14%
16%
18%
FY 11-12(n= 20,046)
FY 12-13(n= 20,670)
FY 13-14(n= 21,976)
FY 14-15(n= 22,848)
FY 11-12(n= 343,039)
FY 12-13(n= 434,825)
FY 13-14(n= 518,060)
FY 14-15(n= 560,523)
FY 11-12(n= 420,454)
FY 12-13(n= 436,927)
FY 13-14(n= 451,612)
FY 14-15(n= 463,333)
FY 11-12(n=
2,807,069)
FY 12-13(n=
3,217,490)
FY 13-14(n=
3,450,311)
FY 14-15(n=
3,573,360)
FY 11-12(n= 737,572)
FY 12-13(n= 820,886)
FY 13-14(n= 939,222)
FY 14-15(n=
1,001,776)
Alaskan Native or American Indian Asian or Pacific Islander Black Hispanic White
Penetration Rates by RaceChildren and Youth With Five or More SMHS Visits**, By Fiscal Year
3.1% 3.0% 3.0% 2.9%4.2% 3.9% 3.7% 3.5%
0%
2%
4%
6%
8%
10%
12%
14%
16%
18%
FY 11-12(n= 2,366,827)
FY 12-13(n= 2,711,146)
FY 13-14(n= 2,981,430)
FY 14-15(n= 3,133,356)
FY 11-12(n= 2,408,477)
FY 12-13(n= 2,764,897)
FY 13-14(n= 3,055,685)
FY 14-15(n= 3,219,401)
Female Male
Penetration Rates by GenderChildren and Youth With Five or More SMHS Visits**, By Fiscal Year
11

Utilization Report*: Approved Specialty Mental Health Services for Children and YouthMean Expenditures and Mean Service Quantity per Unique Beneficiary by Fiscal Year
Statewide as of August 3, 2016
Fiscal Year SMHS Total
Approved IHBS
(Minutes) ICC
(Minutes)
Case Management/
Brokerage (Minutes)
Mental Health Services
(Minutes)
Therapeutic Behavioral
Services (Minutes)
Medication Support Services
(Minutes)
Crisis Intervention
(Minutes)
Crisis Stabilization
(Hours)
Full Day Treatment Intensive (Hours)
Full Day Rehabilitation
(Hours)
Hospital Inpatient (Days)
Hospital Inpatient Admin
(Days)
Fee for Service Inpatient (Days)
Crisis Residential Treatment
Services (Days)
Adult Residential Treatment
Services (Days)
Psychiatric Health Facility
(Days)
FY 11-12 5,902.68$ 0 0 432 1,856 5,483 317 306 14 526 415 7 12 9 13 70 14FY 12-13 6,347.31$ 825 215 394 1,795 5,227 307 294 15 502 443 7 13 9 19 91 15FY 13-14 6,368.06$ 1,970 1,434 367 1,725 5,116 306 305 16 516 457 8 14 8 18 101 15FY 14-15 6,417.44$ 2,418 1,655 368 1,698 4,906 314 299 16 528 520 7 15 8 20 95 13MEAN 6,258.87$ 1,738 1,101 390 1,768 5,183 311 301 15 518 459 7 14 8 18 89 14
*The graphs are color coded so that those reported in the same unit of analysis (e.g., minutes) are colored similarly.Please note that (n) values listed at the bottom of each bar graph represent the actual number of children/youth that received the SMHS represented in their respective graph by Fiscal Year.
$5,902.68 $6,347.31 $6,368.06 $6,417.44
$-
$1,000.00
$2,000.00
$3,000.00
$4,000.00
$5,000.00
$6,000.00
$7,000.00
FY 11-12(n = 228,799)
FY 12-13(n = 246,748)
FY 13-14(n = 263,906)
FY 14-15(n = 266,912)
Total Approved Per Unique Beneficiary By Service Fiscal Year
0
825
1,970
2,418
-
500
1,000
1,500
2,000
2,500
3,000
FY 11-12(n = )
FY 12-13(n = 110)
FY 13-14(n = 5,310)
FY 14-15(n = 7,822)
IHBS Minutes Per Unique BeneficiaryBy Service Fiscal Year
0
215
1,434
1,655
-
200
400
600
800
1,000
1,200
1,400
1,600
1,800
FY 11-12(n = )
FY 12-13(n = 179)
FY 13-14(n = 6,707)
FY 14-15(n = 10,162)
ICC Minutes Per Unique Beneficiary By Service Fiscal Year
432
394
367 368
320
340
360
380
400
420
440
FY 11-12(n = 94,666)
FY 12-13(n = 96,628)
FY 13-14(n = 101,551)
FY 14-15(n = 99,584)
Case Management/Brokerage Minutes Per Unique Beneficiary
By Service Fiscal Year 1,856 1,795 1,725 1,698
- 200 400 600 800
1,000 1,200 1,400 1,600 1,800 2,000
FY 11-12(n = 213,710)
FY 12-13(n = 231,416)
FY 13-14(n = 246,991)
FY 14-15(n = 248,699)
Mental Health Services Minutes Per Unique Beneficiary By Service Fiscal Year
5,483 5,227 5,116 4,906
-
1,000
2,000
3,000
4,000
5,000
6,000
FY 11-12(n = 7,327)
FY 12-13(n = 7,983)
FY 13-14(n = 8,079)
FY 14-15(n = 8,136)
Therapeutic Behavioral Services Minutes Per Unique Beneficiary
By Service Fiscal Year
317 307 306 314
-
50
100
150
200
250
300
350
FY 11-12(n = 73,153)
FY 12-13(n = 77,965)
FY 13-14(n = 81,640)
FY 14-15(n = 80,309)
Medication Support Services Minutes Per Unique Beneficiary
By Service Fiscal Year306 294 305 299
-
50
100
150
200
250
300
350
FY 11-12(n = 16,821)
FY 12-13(n = 17,704)
FY 13-14(n = 19,417)
FY 14-15(n = 20,545)
Crisis Intervention Minutes Per Unique Beneficiary By Service Fiscal Year
14.0 14.7 15.5 16.2
-
2
4
6
8
10
12
14
16
18
FY 11-12(n = 6,843)
FY 12-13(n = 8,530)
FY 13-14(n = 10,019)
FY 14-15(n = 11,912)
Crisis Stabilization Hours Per Unique BeneficiaryBy Service Fiscal Year
12

Utilization Report*: Approved Specialty Mental Health Services for Children and YouthMean Expenditures and Mean Service Quantity per Unique Beneficiary by Fiscal Year
Statewide as of August 3, 2016
*The graphs are color coded so that those reported in the same unit of analysis (e.g., minutes) are colored similarly.Please note that (n) values listed at the bottom of each bar graph represent the actual number of children/youth that received the SMHS represented in their respective graph by Fiscal Year.
526 502 516 528
-
100
200
300
400
500
600
FY 11-12(n = 2,439)
FY 12-13(n = 1,900)
FY 13-14(n = 1,557)
FY 14-15(n = 675)
Full Day Treatment Intensive Hours Per Unique BeneficiaryBy Service Fiscal Year
415443 457
520
-
100
200
300
400
500
600
FY 11-12(n = 1,835)
FY 12-13(n = 2,006)
FY 13-14(n = 1,771)
FY 14-15(n = 1,405)
Full Day Rehabilitation Hours Per Unique Beneficiary By Service Fiscal Year
70.4
90.9101.2
94.6
-
20
40
60
80
100
120
FY 11-12(n = 100)
FY 12-13(n = 125)
FY 13-14(n = 126)
FY 14-15(n = 100)
Adult Residential Treatment Services Days Per Unique Beneficiary
By Service Fiscal Year13.7
14.6 14.9
12.6
-
2
4
6
8
10
12
14
16
FY 11-12(n = 620)
FY 12-13(n = 781)
FY 13-14(n = 837)
FY 14-15(n = 953)
Psychiatric Health Facility Days Per Unique BeneficiaryBy Service Fiscal Year
7 7 87
-
1
2
3
4
5
6
7
8
9
FY 11-12(n = 1,938)
FY 12-13(n = 2,085)
FY 13-14(n = 2,182)
FY 14-15(n = 2,351)
Hospital Inpatient Days Per Unique BeneficiaryBy Service Fiscal Year
1213
1415
-
2
4
6
8
10
12
14
16
18
FY 11-12(n = 129)
FY 12-13(n = 161)
FY 13-14(n = 141)
FY 14-15(n = 186)
Hospital Inpatient Admin Days Per Unique BeneficiaryBy Service Fiscal Year
9 9 8 8
- 1 2 3 4 5 6 7 8 9
10
FY 11-12(n = 9,475)
FY 12-13(n = 10,530)
FY 13-14(n = 12,346)
FY 14-15(n = 13,112)
Fee for Service Inpatient Days Per Unique BeneficiaryBy Service Fiscal Year
13.2
18.8 18.420.3
-
5
10
15
20
25
FY 11-12(n = 239)
FY 12-13(n = 283)
FY 13-14(n = 376)
FY 14-15(n = 454)
Crisis Residential Treatment Services Days Per Unique Beneficiary
By Service Fiscal Year
13

Snapshot Report: Unique Count of Children and Youth Receiving SMHS
Arriving, Exiting, and with Service Continuance by Fiscal YearStatewide Population as of August 3, 2016
Service
Fiscal Year
Arrivals
Count Arrivals %
Service
Continuance
(>= 2 YR)
Count
Service
Continuance
(>= 2 YR) %
Service
Continuance
(<2 YR) Count
Service
Continuance
(< 2 YR) %
Exiting
Count Exiting %
Arriving &
Exiting
Count
Arriving &
Exiting %
Service
Continuance
(>= 2 YR) &
Exiting Count
Service
Continuance
(>= 2 YR) and
Exiting %
Total
Count Total %
FY 12-13 65,825 26.7% 21,242 8.6% 22,066 8.9% 47,977 19.4% 81,065 32.9% 8,577 3.5% 246,752 100%
FY 13-14 65,197 24.7% 21,454 8.1% 23,620 9.0% 54,840 20.8% 89,579 33.9% 9,219 3.5% 263,909 100%
FY 14-15 65,315 24.5% 21,246 8.0% 22,862 8.6% 56,409 21.1% 91,329 34.2% 9,754 3.7% 266,915 100%
Category
Arrivals
Exiting
Service Continuance
Arriving & Exiting
Service Continuance &
Exiting
Description (Please refer to the Measures Catalog for more detailed descriptions on all Performance Outcomes System measures.)
Children/Youth that did not receive any SMHS within 3 months of their first date of service in the Fiscal Year.
Children/Youth receiving continuous services with no breaks in service greater than 90 days for a period of at least 2 years (>= 2 YR) or a period of 1 to 2 years (< 2 YR).
Children/Youth that did not receive any SMHS within 3 months after their last date of service in the Fiscal Year.
A distinct category in which children/youth met both the criteria for Arrivals and Exiting above for the fiscal year.
A distinct category in which Children/Youth had at least 2 years of Service Continuance going into the Fiscal Year and then Exited within the same Fiscal Year.
26.7%
8.6%
8.9%19.4%
32.9%
3.5%
Fiscal Year 12-13 Arrivals, Service Continuance, & Exits Distribution
Arrivals
Service Continuance(>= 2 YR)
Service Continuance(< 2 YR)
Exiting
Arriving & Exiting
Service Continuance (>= 2 YR) & Exiting
24.7%
8.1%
9.0%
20.8%
33.9%
3.5%
Fiscal Year 13-14 Arrivals, Service Continuance, & Exits Distribution
Arrivals
Service Continuance(>= 2 YR)
Service Continuance(< 2 YR)
Exiting
Arriving & Exiting
Service Continuance (>= 2 YR) & Exiting
24.5%
8.0%
8.6%
21.1%
34.2%
3.7%
Fiscal Year 14-15 Arrivals, Service Continuance, & Exits Distribution
Arrivals
Service Continuance(>= 2 YR)
Service Continuance(< 2 YR)
Exiting
Arriving & Exiting
Service Continuance (>= 2 YR) & Exiting
14

Time to Step Down Report: Children and Youth Stepping Down in SMHS Services Post Inpatient DischargeStatewide as of August 3, 2016
Service FY
Count of Inpatient Discharges with Step Down within 7 Days
of Discharge
Percentage of Inpatient
Discharges with Step Down within
7 Days of Discharge
Count of Inpatient Discharges with
Step Down Between 8 and 30
Days
Percentage of Inpatient
Discharges with Step Down
Between 8 and 30 Days
Count of Inpatient Discharges with a Step Down > 30
Days from Discharge
Percentage of Inpatient
Discharges with a Step Down > 30
Days from Discharge
Count of Inpatient Discharges with No Step Down*
Percentage of Inpatient
Discharges with No Step Down*
Minimum Number of Days between
Discharge and Step Down
Maximum Number of Days
between Discharge and
Step Down
Mean Time to Next Contact Post
Inpatient Discharge
(Days)
Median Time to Next Contact Post
Inpatient Discharge
(Days)
FY 11-12 8,699 59.2% 2,560 17.4% 2,321 15.8% 1,102 7.5% 0 365 30.4 3FY 12-13 9,694 63.1% 2,427 15.8% 2,097 13.6% 1,146 7.5% 0 365 26.1 2FY 13-14 10,764 62.1% 2,844 16.4% 2,224 12.8% 1,512 8.7% 0 365 23.7 2FY 14-15 10,655 58.0% 3,096 16.9% 2,353 12.8% 2,268 12.3% 0 365 21.9 3
* No Step Down is defined as no Medi-Cal eligible service was claimed through Short-Doyle/Medi-Cal after a claimed inpatient service was billed with a discharge date. This category may include data currently unavailable to DHCS, such as beneficiaries that were moved to a community-based program or beneficiaries that were incarcerated.
32 2
3
0123456789
10
FY 11-12 FY 12-13 FY 13-14 FY 14-15
Median Time Between Inpatient Discharge and Step Down Service in Days
30.426.1
23.7 21.9
0
5
10
15
20
25
30
35
FY 11-12 FY 12-13 FY 13-14 FY 14-15
Mean Time Between Inpatient Discharge and Step Down Service in Days
59.2% 63.1% 62.1% 58.0%
17.4% 15.8% 16.4% 16.9%
15.8% 13.6% 12.8% 12.8%7.5% 7.5% 8.7% 12.3%
0%
20%
40%
60%
80%
100%
FY 11-12( 9,338 Unique Beneficiaries with
14,682 Total Inpatient Discharges )
FY 12-13( 10,442 Unique Beneficiaries with 15,364 Total Inpatient Discharges )
FY 13-14( 11,938 Unique Beneficiaries with 17,344 Total Inpatient Discharges )
FY 14-15( 12,909 Unique Beneficiaries with 18,372 Total Inpatient Discharges )
Percentage of Discharges by Time Between Inpatient Discharge and Step Down ServiceWithin 7 Days Within 8 - 30 Days 31 Days + No Step Down
15

2016
Performance Outcomes System Adult Reports
16

Demographics Report: Unique Count of Adults Receiving SMHS by Fiscal Year
SFYUnique Count
Receiving SMHS*Year-Over-Year
Percentage ChangeUnique Count of
Medi-Cal EligiblesYear-Over-Year
Percentage Change
FY 11-12 227,705 3,435,578 FY 12-13 230,815 1.4% 3,525,620 2.6%FY 13-14 293,282 27.1% 5,642,702 60.0%FY 14-15 336,619 14.8% 7,056,451 25.1%
Compound Annual Growth Rate SFY**
13.9% 27.1%
*SMHS = Specialty Mental Health Services. See Measures Catalog for more detailed information.**SFY = State Fiscal Year which is July 1 through June 30.The Measures Catalog may be found at: http://www.dhcs.ca.gov/services/MH/Documents/MedCCC/Library/POSMeasuresCatalog_Sept15Reporting_Final_1.11.15.pdf
227,705 230,815293,282
336,619
0
100,000
200,000
300,000
400,000
FY 11-12 FY 12-13 FY 13-14 FY 14-15
Unique Count of Adults Receiving SMHS
17

Demographics Report: Unique Count of Adults Receiving SMHS by Fiscal Year
Fiscal Year
Alaskan Native or American
Indian Count
Alaskan Native or American Indian %
Asian or Pacific
Islander Count
Asian or Pacific
Islander % Black Count Black %
Hispanic Count
Hispanic % White Count
White % Other Count Other % Unknown
Count Unknown %
FY 11-12 1,653 0.7% 22,322 9.8% 39,397 17.3% 46,052 20.2% 91,881 40.4% 6,077 2.7% 20,323 8.9%FY 12-13 1,838 0.8% 21,430 9.3% 40,376 17.5% 47,964 20.8% 88,983 38.6% 5,925 2.6% 24,299 10.5%FY 13-14 2,227 0.8% 24,586 8.4% 49,657 16.9% 63,464 21.6% 111,031 37.9% 9,090 3.1% 33,227 11.3%FY 14-15 2,601 0.8% 27,688 8.2% 54,788 16.3% 74,294 22.1% 125,389 37.2% 12,784 3.8% 39,075 11.6%
*FY 13-14 claims are estimated to be 95% complete as of January 1, 2015.
1%
10%
17%
20%40%
3%9%
Fiscal Year 11-12 Race Distribution
Alaskan Native or AmericanIndianAsian or Pacific Islander
Black
Hispanic
White
Other
Unknown
1%
9%
17%
21%39%
3% 11%
Fiscal Year 12-13 Race Distribution
Alaskan Native or AmericanIndianAsian or Pacific Islander
Black
Hispanic
White
Other
Unknown
1%
8%
17%
22%38%
3% 11%
Fiscal Year 13-14 Race Distribution
Alaskan Native or AmericanIndianAsian or Pacific Islander
Black
Hispanic
White
Other
Unknown
1%
8%
16%
22%37%
4% 12%
Fiscal Year 14-15 Race Distribution
Alaskan Native or AmericanIndianAsian or Pacific Islander
Black
Hispanic
White
Other
Unknown
18

Demographics Report: Unique Count of Adults Receiving SMHS by Fiscal Year
Fiscal Year
Adults 21-44 Count
Adults 21-44 %Adults 45-64
CountAdults 45-64 %
Adults 65+Count
Adults 65+ %
FY 11-12 98,600 43.3% 113,550 49.9% 15,555 6.8%FY 12-13 100,581 43.6% 113,109 49.0% 17,125 7.4%FY 13-14 134,496 45.9% 140,667 48.0% 18,119 6.2%FY 14-15 162,885 48.4% 154,527 45.9% 19,207 5.7%
*FY 13-14 claims are estimated to be 95% complete as of January 1, 2015.
43.3%
49.9%
6.8%
Fiscal Year 11-12 Age Group Distribution
Adults 21-44
Adults 45-64
Adults 65+
43.6%
49.0%
7.4%
Fiscal Year 12-13 Age Group Distribution
Adults 21-44
Adults 45-64
Adults 65+
45.9%
48.0%
6.2%
Fiscal Year 13-14 Age Group Distribution
Adults 21-44
Adults 45-64
Adults 65+
48.4%
45.9%
5.7%
Fiscal Year 14-15 Age Group Distribution
Adults 21-44
Adults 45-64
Adults 65+
19

Demographics Report: Unique Count of Adults by Fiscal Year
Fiscal Year
FemaleCount
Female % MaleCount
Male %
FY 11-12 132,758 58.3% 94,947 41.7%FY 12-13 134,000 58.1% 96,815 41.9%FY 13-14 162,354 55.4% 130,928 44.6%FY 14-15 179,318 53.3% 157,301 46.7%
58.3%
41.7%
Fiscal Year 11-12 Gender Distribution
Female Male
58.1%
41.9%
Fiscal Year 12-13 Gender Distribution
Female Male
55.4%
44.6%
Fiscal Year 13-14 Gender Distribution
Female Male53.3%
46.7%
Fiscal Year 14-15 Gender Distribution
Female Male
20

Penetration Rates* Report: Adults With At Least One SMHS Visit**
Adults with 1 or more SMHS
Visits
Certified Eligible Adults
Penetration RateAdults with 1
or more SMHS Visits
Certified Eligible Adults
Penetration Rate
Adults with 1 or more SMHS
Visits
Certified Eligible Adults
Penetration Rate
Adults with 1 or more SMHS
Visits
Certified Eligible Adults
Penetration Rate
All 227,705 3,435,578 6.6% 230,815 3,525,620 6.5% 293,282 5,642,702 5.2% 336,619 7,056,451 4.8%
Adults 21-44 98,600 1,454,758 6.8% 100,581 1,509,629 6.7% 134,496 2,626,878 5.1% 162,885 3,515,040 4.6%Adults 45-64 113,550 962,681 11.8% 113,109 974,387 11.6% 140,667 1,930,585 7.3% 154,527 2,381,477 6.5%Adults 65+ 15,555 1,018,139 1.5% 17,125 1,041,604 1.6% 18,119 1,085,239 1.7% 19,207 1,159,934 1.7%
Alaskan Native or American Indian 1,653 20,815 7.9% 1,838 21,060 8.7% 2,227 31,838 7.0% 2,601 38,616 6.7%Asian or Pacific Islander 22,322 520,041 4.3% 21,430 528,892 4.1% 24,586 895,255 2.7% 27,688 1,130,645 2.4%Black 39,397 365,964 10.8% 40,376 373,909 10.8% 49,657 562,212 8.8% 54,788 657,419 8.3%Hispanic 46,052 1,144,963 4.0% 47,964 1,190,155 4.0% 63,464 1,856,796 3.4% 74,294 2,348,111 3.2%White 91,881 973,926 9.4% 88,983 976,019 9.1% 111,031 1,567,524 7.1% 125,389 1,937,800 6.5%Other 6,077 124,253 4.9% 5,925 128,805 4.6% 9,090 252,480 3.6% 12,784 349,162 3.7%Unknown 20,323 285,616 7.1% 24,299 306,780 7.9% 33,227 476,597 7.0% 39,075 594,698 6.6%
Female 132,758 2,150,142 6.2% 134,000 2,211,304 6.1% 162,354 3,259,111 5.0% 179,318 3,949,396 4.5%Male 94,947 1,285,435 7.4% 96,815 1,314,315 7.4% 130,928 2,383,591 5.5% 157,301 3,107,055 5.1%
*Penetration Rate is defined as the percentage of SMHS eligible beneficiaries that have received a SMHS that was claimed via the Short-Doyle/Medi-Cal claiming system. This does not include non-specialty mental health services provided in Medi-Cal Managed Care system. Penetration rates decreased because the number of Affordable Care Act SMHS eligible beneficiaries increased markedly beginning in SFY 2013-14 while claims increased more gradually. **Adults and Older Adults that have received at least one SMHS that was claimed through the Short-Doyle/ Medi-Cal claiming system on at least one (1) day in the Fiscal Year.
FY 11-12 FY 12-13 FY 13-14 FY 14-15
6.8% 6.7%
5.1% 4.6%
11.8% 11.6%
7.3%6.5%
1.5% 1.6% 1.7% 1.7%
0%
2%
4%
6%
8%
10%
12%
14%
16%
18%
FY 11-12(n= 1,454,758)
FY 12-13(n= 1,509,629)
FY 13-14(n= 2,626,878)
FY 14-15(n= 3,515,040)
FY 11-12(n= 962,681)
FY 12-13(n= 974,387)
FY 13-14(n= 1,930,585)
FY 14-15(n= 2,381,477)
FY 11-12(n= 1,018,139)
FY 12-13(n= 1,041,604)
FY 13-14(n= 1,085,239)
FY 14-15(n= 1,159,934)
Adults 21-44 Adults 45-64 Adults 65+
Penetration Rates by AgeAdults With At Least One SMHS Visit**, By Fiscal Year
21

Penetration Rates* Report: Adults With At Least One SMHS Visit**
*Penetration Rate is defined as the percentage of SMHS eligible beneficiaries that have received a SMHS that was claimed via the Short-Doyle/Medi-Cal claiming system. This does not include non-specialty mental health services provided in Medi-Cal Managed Care system. Penetration rates decreased because the number of Affordable Care Act SMHS eligible beneficiaries increased markedly beginning in SFY 2013-14 while claims increased more gradually. **Adults and Older Adults that have received at least one SMHS that was claimed through the Short-Doyle/ Medi-Cal claiming system on at least one (1) day in the Fiscal Year.
7.9%8.7%
7.0% 6.7%
4.3% 4.1%2.7% 2.4%
10.8% 10.8%
8.8% 8.3%
4.0% 4.0%3.4% 3.2%
9.4% 9.1%
7.1%6.5%
0%
2%
4%
6%
8%
10%
12%
14%
16%
18%
FY 11-12(n= 20,815)
FY 12-13(n= 21,060)
FY 13-14(n= 31,838)
FY 14-15(n= 38,616)
FY 11-12(n= 520,041)
FY 12-13(n= 528,892)
FY 13-14(n= 895,255)
FY 14-15(n= 1,130,645)
FY 11-12(n= 365,964)
FY 12-13(n= 373,909)
FY 13-14(n= 562,212)
FY 14-15(n= 657,419)
FY 11-12(n= 1,144,963)
FY 12-13(n= 1,190,155)
FY 13-14(n= 1,856,796)
FY 14-15(n= 2,348,111)
FY 11-12(n= 973,926)
FY 12-13(n= 976,019)
FY 13-14(n= 1,567,524)
FY 14-15(n= 1,937,800)
Alaskan Native or American Indian Asian or Pacific Islander Black Hispanic White
Penetration Rates by RaceAdults With At Least One SMHS Visit**, By Fiscal Year
6.2% 6.1%5.0% 4.5%
7.4% 7.4%
5.5% 5.1%
0%
2%
4%
6%
8%
10%
12%
14%
16%
18%
FY 11-12(n= 2,150,142)
FY 12-13(n= 2,211,304)
FY 13-14(n= 3,259,111)
FY 14-15(n= 3,949,396)
FY 11-12(n= 1,285,435)
FY 12-13(n= 1,314,315)
FY 13-14(n= 2,383,591)
FY 14-15(n= 3,107,055)
Female Male
Penetration Rates by GenderAdults With At Least One SMHS Visit**, By Fiscal Year
22

Penetration Rates* Report: Adults With Five or More SMHS Visits**
FY 13-14Adults with 5 or
more SMHS Visits
Certified Eligible Adults
Penetration Rate
Adults with 5 or more SMHS
Visits
Certified Eligible Adults
Penetration Rate
Adults with 5 or more SMHS
Visits
Certified Eligible Adults
Penetration Rate
Adults with 5 or more SMHS
Visits
Certified Eligible Adults
Penetration Rate
All 161,425 3,435,578 4.7% 163,290 3,525,620 4.6% 197,705 5,642,702 3.5% 225,257 7,056,451 3.2%
Adults 21-44 67,348 1,454,758 4.6% 67,974 1,509,629 4.5% 85,873 2,626,878 3.3% 103,254 3,515,040 2.9%Adults 45-64 83,691 962,681 8.7% 83,388 974,387 8.6% 98,992 1,930,585 5.1% 108,618 2,381,477 4.6%Adults 65+ 10,386 1,018,139 1.0% 11,928 1,041,604 1.1% 12,840 1,085,239 1.2% 13,385 1,159,934 1.2%
Alaskan Native or American Indian 1,148 20,815 5.5% 1,249 21,060 5.9% 1,496 31,838 4.7% 1,666 38,616 4.3%Asian or Pacific Islander 17,375 520,041 3.3% 16,626 528,892 3.1% 18,244 895,255 2.0% 19,660 1,130,645 1.7%Black 27,221 365,964 7.4% 27,619 373,909 7.4% 32,313 562,212 5.7% 35,658 657,419 5.4%Hispanic 31,847 1,144,963 2.8% 32,959 1,190,155 2.8% 41,417 1,856,796 2.2% 48,796 2,348,111 2.1%White 64,620 973,926 6.6% 62,692 976,019 6.4% 74,559 1,567,524 4.8% 83,578 1,937,800 4.3%Other 4,372 124,253 3.5% 4,200 128,805 3.3% 5,930 252,480 2.3% 8,058 349,162 2.3%Unknown 14,842 285,616 5.2% 17,945 306,780 5.8% 23,746 476,597 5.0% 27,841 594,698 4.7%
Female 92,712 2,150,142 4.3% 93,109 2,211,304 4.2% 108,919 3,259,111 3.3% 120,352 3,949,396 3.0%Male 68,713 1,285,435 5.3% 70,181 1,314,315 5.3% 88,786 2,383,591 3.7% 104,905 3,107,055 3.4%
*Penetration Rate is defined as the percentage of SMHS eligible beneficiaries that have received a SMHS that was claimed via the Short-Doyle/Medi-Cal claiming system. This does not include non-specialty mental health services provided in Medi-Cal Managed Care system. Penetration rates decreased because the number of Affordable Care Act SMHS eligible beneficiaries increased markedly beginning in SFY 2013-14 while claims increased more gradually. **Adults and Older Adults that have received at least five SMHS that were claimed through the Short-Doyle/ Medi-Cal claiming system on at least five (5) or more different days in the Fiscal Year.
FY 14-15FY 11-12 FY 12-13
4.6% 4.5%3.3% 2.9%
8.7% 8.6%
5.1% 4.6%
1.0% 1.1% 1.2% 1.2%
0%
2%
4%
6%
8%
10%
12%
14%
16%
18%
FY 11-12(n= 1,454,758)
FY 12-13(n= 1,509,629)
FY 13-14(n= 2,626,878)
FY 14-15(n= 3,515,040)
FY 11-12(n= 962,681)
FY 12-13(n= 974,387)
FY 13-14(n= 1,930,585)
FY 14-15(n= 2,381,477)
FY 11-12(n= 1,018,139)
FY 12-13(n= 1,041,604)
FY 13-14(n= 1,085,239)
FY 14-15(n= 1,159,934)
Adults 21-44 Adults 45-64 Adults 65+
Penetration Rates by AgeAdults With Five or More SMHS Visits**, By Fiscal Year
23

Penetration Rates* Report: Adults With Five or More SMHS Visits**
*Penetration Rate is defined as the percentage of SMHS eligible beneficiaries that have received a SMHS that was claimed via the Short-Doyle/Medi-Cal claiming system. This does not include non-specialty mental health services provided in Medi-Cal Managed Care system.Penetration rates decreased because the number of Affordable Care Act SMHS eligible beneficiaries increased markedly beginning in SFY 2013-14 while claims increased more gradually. **Adults and Older Adults that have received at least five SMHS that were claimed through the Short-Doyle/ Medi-Cal claiming system on at least five (5) or more different days in the Fiscal Year.
5.5% 5.9%
4.7% 4.3%3.3% 3.1%
2.0% 1.7%
7.4% 7.4%
5.7% 5.4%
2.8% 2.8%2.2% 2.1%
6.6% 6.4%
4.8% 4.3%
0%
2%
4%
6%
8%
10%
12%
14%
16%
18%
FY 11-12(n= 20,815)
FY 12-13(n= 21,060)
FY 13-14(n= 31,838)
FY 14-15(n= 38,616)
FY 11-12(n= 520,041)
FY 12-13(n= 528,892)
FY 13-14(n= 895,255)
FY 14-15(n= 1,130,645)
FY 11-12(n= 365,964)
FY 12-13(n= 373,909)
FY 13-14(n= 562,212)
FY 14-15(n= 657,419)
FY 11-12(n= 1,144,963)
FY 12-13(n= 1,190,155)
FY 13-14(n= 1,856,796)
FY 14-15(n= 2,348,111)
FY 11-12(n= 973,926)
FY 12-13(n= 976,019)
FY 13-14(n= 1,567,524)
FY 14-15(n= 1,937,800)
Alaskan Native or American Indian Asian or Pacific Islander Black Hispanic White
Penetration Rates by RaceAdults With Five or More SMHS Visits**, By Fiscal Year
4.3% 4.2%3.3% 3.0%
5.3% 5.3%
3.7% 3.4%
0%
2%
4%
6%
8%
10%
12%
14%
16%
18%
FY 11-12(n= 2,150,142)
FY 12-13(n= 2,211,304)
FY 13-14(n= 3,259,111)
FY 14-15(n= 3,949,396)
FY 11-12(n= 1,285,435)
FY 12-13(n= 1,314,315)
FY 13-14(n= 2,383,591)
FY 14-15(n= 3,107,055)
Female Male
Penetration Rates by GenderAdults With Five or More SMHS Visits**, By Fiscal Year
24

Utilization Report*: Approved Specialty Mental Health Services for AdultsMean Expenditures and Mean Service Quantity per Unique Beneficiary by Fiscal Year**
Fiscal Year SDMC Total
Approved Case Management/Brokerage (Minutes)
Mental Health Services (Minutes)
Medication Support Services (Minutes)
Crisis Intervention (Minutes)
Crisis Stabilization (Hours)
Full Day Treatment Intensive (Hours)
Full Day Rehabilitation
(Hours)
Hospital Inpatient (Days)
Hospital Inpatient Admin (Days)
Fee for Service Inpatient (Days)
Crisis Residential Treatment Services
(Days)
Adult Residential Treatment Services
(Days)
Psychiatric Health Facility (Days)
FY 11-12 3,963 499 933 302 234 21 119 335 8 16 15 18 81 11FY 12-13 4,600 443 840 282 236 23 336 288 8 15 15 19 87 13FY 13-14 4,342 401 771 263 227 23 375 254 7 16 12 17 87 12FY 14-15 4,826 407 792 278 231 24 0 244 7 19 12 17 89 11MEAN 4,432.51$ 437 834 281 232 23 277 280 8 17 13 18 86 12
*The graphs are color coded so that those reported in the same unit of analysis (e.g., minutes) are colored similarly.Please note that (n) values listed at the bottom of each bar graph represent the actual number of Adults and Older Adults that received the SMHS represented in their respective graph by Fiscal Year.
$3,963
$4,600$4,342
$4,826
$-
$1,000.00
$2,000.00
$3,000.00
$4,000.00
$5,000.00
$6,000.00
FY 11-12(n = 226,776)
FY 12-13(n = 230,797)
FY 13-14(n = 293,278)
FY 14-15(n = 336,587)
Total Approved Per Unique Beneficiary By Service Fiscal Year
933840
771 792
- 100 200 300 400 500 600 700 800 900
1,000
FY 11-12(n = 162,655)
FY 12-13(n = 169,581)
FY 13-14(n = 212,006)
FY 14-15(n = 242,320)
Mental Health Services Minutes Per Unique Beneficiary By Service Fiscal Year
302282
263 278
-
50
100
150
200
250
300
350
FY 11-12(n = 160,662)
FY 12-13(n = 162,524)
FY 13-14(n = 200,678)
FY 14-15(n = 223,831)
Medication Support Services Minutes Per Unique Beneficiary
By Service Fiscal Year 234 236 227 231
-
50
100
150
200
250
FY 11-12(n = 29,768)
FY 12-13(n = 28,412)
FY 13-14(n = 35,317)
FY 14-15(n = 45,850)
Crisis Intervention Minutes Per Unique Beneficiary By Service Fiscal Year
21.022.6 22.9 24.0
-
5
10
15
20
25
30
FY 11-12(n = 21,638)
FY 12-13(n = 23,346)
FY 13-14(n = 33,413)
FY 14-15(n = 46,221)
Crisis Stabilization Hours Per Unique BeneficiaryBy Service Fiscal Year
499443
401 407
-
100
200
300
400
500
600
FY 11-12(n = 95,558)
FY 12-13(n = 95,401)
FY 13-14(n = 116,926)
FY 14-15(n = 132,365)
Case Management/Brokerage Minutes Per Unique Beneficiary
By Service Fiscal Year
25

Utilization Report*: Approved Specialty Mental Health Services for AdultsMean Expenditures and Mean Service Quantity per Unique Beneficiary by Fiscal Year**
*The graphs are color coded so that those reported in the same unit of analysis (e.g., minutes) are colored similarly.Please note that (n) values listed at the bottom of each bar graph represent the actual number of Adults and Older Adults that received the SMHS represented in their respective graph by Fiscal Year. ^ Data have been suppressed to protect patient privacy.
119
336375
0 -
50
100
150
200
250
300
350
400
FY 11-12(n = 14)
FY 12-13(n = ^)
FY 13-14(n = ^)
FY 14-15(n = )
Full Day Treatment Intensive Hours Per Unique Beneficiary
By Service Fiscal Year335
288254 244
-
50
100
150
200
250
300
350
400
FY 11-12(n = 1,227)
FY 12-13(n = 1,041)
FY 13-14(n = 1,192)
FY 14-15(n = 1,244)
Full Day Rehabilitation Hours Per Unique Beneficiary By Service Fiscal Year
81.4
86.687.5
88.9
76
78
80
82
84
86
88
90
FY 11-12(n = 1,136)
FY 12-13(n = 1,161)
FY 13-14(n = 1,309)
FY 14-15(n = 1,530)
Adult Residential Treatment Services Days Per Unique Beneficiary
By Service Fiscal Year11.3
13.011.9
11.2
-
2
4
6
8
10
12
14
FY 11-12(n = 2,600)
FY 12-13(n = 2,832)
FY 13-14(n = 4,091)
FY 14-15(n = 5,805)
Psychiatric Health Facility Days Per Unique BeneficiaryBy Service Fiscal Year
8 87 7
-
1
2
3
4
5
6
7
8
9
FY 11-12(n = 5,765)
FY 12-13(n = 5,888)
FY 13-14(n = 7,607)
FY 14-15(n = 9,783)
Hospital Inpatient Days Per Unique BeneficiaryBy Service Fiscal Year
1615 16
19
- 2 4 6 8
10 12 14 16 18 20
FY 11-12(n = 1,163)
FY 12-13(n = 1,171)
FY 13-14(n = 1,258)
FY 14-15(n = 1,817)
Hospital Inpatient Admin Days Per Unique BeneficiaryBy Service Fiscal Year
15 15
1212
-
2
4
6
8
10
12
14
16
FY 11-12(n = 14,628)
FY 12-13(n = 14,544)
FY 13-14(n = 17,942)
FY 14-15(n = 23,221)
Fee for Service Inpatient Days Per Unique BeneficiaryBy Service Fiscal Year
18.3
19.2
16.5
17.2
15 16 16 17 17 18 18 19 19 20
FY 11-12(n = 3,825)
FY 12-13(n = 4,048)
FY 13-14(n = 5,652)
FY 14-15(n = 7,272)
Crisis Residential Treatment Services Days Per Unique Beneficiary
By Service Fiscal Year
26

Snapshot Report: Unique Count of Adults Receiving SMHS Arriving, Exiting, and with Service Continuance by Fiscal Year
Service Fiscal Year
Arrivals Count
Arrivals %
Service Continuance
(>= 2 YR) Count
Service Continuance(>= 2 YR) %
Service Continuance
(<2 YR) Count
Service Continuance
(< 2 YR) %
Exiting Count
Exiting %Arriving &
Exiting Count
Arriving & Exiting %
Service Continuance (>= 2 YR) &
Exiting Count
Service Continuance
(>= 2 YR) and Exiting %
Total Count
Total %
FY 12-13 41,605 18.0% 45,543 19.7% 30,891 13.4% 34,660 15.0% 72,650 31.5% 5,466 2.4% 230,815 100%FY 13-14 72,687 24.8% 45,263 15.4% 30,239 10.3% 36,582 12.5% 102,554 35.0% 5,955 2.0% 293,280 100%FY 14-15 59,939 17.8% 43,229 12.8% 43,401 12.9% 54,763 16.3% 128,467 38.2% 6,796 2.0% 336,595 100%
CategoryArrivals
ExitingService Continuance
Arriving & ExitingService Continuance & Exiting
Description (Please refer to the Measures Catalog for more detailed descriptions on all Performance Outcomes System measures.)Adults that did not receive any SMHS within 3 months of their first date of service in the Fiscal Year.Adults receiving continuous services with no breaks in service greater than 90 days for a period of at least 2 years (>= 2 YR) or a period of 1 to 2 years (< 2 YR).Adults that did not receive any SMHS within 3 months after their last date of service in the Fiscal Year.A distinct category in which adults met both the criteria for Arrivals and Exiting above for the fiscal year.
A distinct category in which adults had at least 2 years of Service Continuance going into the Fiscal Year and then Exited within the same Fiscal Year.
18.0%
19.7%
13.4%15.0%
31.5%
2.4%
Fiscal Year 12-13 Arrivals, Service Continuance, & Exits Distribution
Arrivals
Service Continuance(>= 2 YR)
Service Continuance(< 2 YR)
Exiting
Arriving & Exiting
Service Continuance (>= 2 YR) & Exiting
24.8%
15.4%
10.3%12.5%
35.0%
2.0%
Fiscal Year 13-14 Arrivals, Service Continuance, & Exits Distribution
Arrivals
Service Continuance(>= 2 YR)
Service Continuance(< 2 YR)
Exiting
Arriving & Exiting
Service Continuance (>= 2 YR) & Exiting
17.8%
12.8%
12.9%
16.3%
38.2%
2.0%
Fiscal Year 14-15 Arrivals, Service Continuance, & Exits Distribution
Arrivals
Service Continuance(>= 2 YR)
Service Continuance(< 2 YR)
Exiting
Arriving & Exiting
Service Continuance (>= 2 YR) & Exiting
27

Time to Step Down Report: Adults Stepping Down in SMHS Services Post Inpatient Discharge
Service FY
Count of Inpatient Discharges with Step Down within 7 Days
of Discharge
Percentage of Inpatient
Discharges with Step Down within
7 Days of Discharge
Count of Inpatient Discharges with
Step Down Between 8 and 30
Days
Percentage of Inpatient
Discharges with Step Down
Between 8 and 30 Days
Count of Inpatient Discharges with a Step Down > 30
Days from Discharge
Percentage of Inpatient
Discharges with a Step Down > 30
Days from Discharge
Count of Inpatient Discharges with No Step Down*
Percentage of Inpatient
Discharges with No Step Down*
Minimum Number of Days between
Discharge and Step Down
Maximum Number of Days
between Discharge and
Step Down
Mean Time to Next Contact Post
Inpatient Discharge
(Days)
Median Time to Next Contact Post
Inpatient Discharge
(Days)
FY 11-12 20,500 42.4% 9,949 20.6% 14,259 29.5% 3,634 7.5% 0 365 55.6 10FY 12-13 13,532 44.0% 5,537 18.0% 8,820 28.7% 2,881 9.4% 0 365 57.4 8FY 13-14 14,020 43.7% 5,416 16.9% 8,645 27.0% 3,992 12.4% 0 365 53.0 8FY 14-15 16,575 39.5% 7,133 17.0% 10,411 24.8% 7,896 18.8% 0 365 44.7 8
* No Step Down is defined as no Medi-Cal eligible service was claimed through Short-Doyle/Medi-Cal after a claimed inpatient service was billed with a discharge date. This category may include data currently unavailable to DHCS, such as beneficiaries that were moved to a community-based program or beneficiaries that were incarcerated.
10
8 8 8
0123456789
10
FY 11-12 FY 12-13 FY 13-14 FY 14-15
Median Time Between Inpatient Discharge and Step Down Service in Days
55.6 57.453.0
44.7
0
10
20
30
40
50
60
70
FY 11-12 FY 12-13 FY 13-14 FY 14-15
Mean Time Between Inpatient Discharge and Step Down Service in Days
42.4% 44.0% 43.7% 39.5%
20.6% 18.0% 16.9% 17.0%
29.5% 28.7% 27.0% 24.8%
7.5% 9.4% 12.4% 18.8%
0%
20%
40%
60%
80%
100%
FY 11-12( 16,079 Unique Beneficiaries with 48,342 Total Inpatient Discharges )
FY 12-13( 14,584 Unique Beneficiaries with 30,770 Total Inpatient Discharges )
FY 13-14( 17,501 Unique Beneficiaries with 32,073 Total Inpatient Discharges )
FY 14-15( 23,088 Unique Beneficiaries with 42,015 Total Inpatient Discharges )
Percentage of Discharges by Time Between Inpatient Discharge and Step Down ServiceWithin 7 Days Within 8 - 30 Days 31 Days + No Step Down
28