statement on monetary policy - reserve bank of australia · statmnt on montay policy | august 2017...
TRANSCRIPT

Statement on Monetary
Policy
AUGUS T 2017

Contents
Overview 1
1. International Economic Developments 5 Box A: The Recent Pick-up in Global Merchandise Trade 13
2. International and Foreign Exchange Markets 15 Box B: Recent Developments in Chinese Financial Regulations 27
3. Domestic Economic Conditions 31 Box C: Minimum Wage Decision 42
4. Domestic Financial Markets 45
5. Inflation 55
6. Economic Outlook 59
Statement on Monetary Policy
AUGUS T 2017

The material in this Statement on Monetary Policy was finalised on 3 August 2017. The next Statement is due for release on 10 November 2017.
The Statement is published quarterly in February, May, August and November each year. All the Statements are available at www.rba.gov.au when released. Expected release dates are advised ahead of time on the website. For copyright and disclaimer notices relating to data in the Statement, see the Bank’s website.
The graphs in this publication were generated using Mathematica.
Statement on Monetary Policy enquiries
Secretary’s DepartmentTel: +61 2 9551 8111Fax: +61 2 9551 8033Email: [email protected]
ISSN 1448–5133 (Print) ISSN 1448–5141 (Online)

S TAT E M E N T O N M O N E TA R Y P O L I C Y | AU G U S T 2017 1
The Australian economy is evolving broadly as expected. The Bank’s forecasts are little changed from those published in the May Statement on Monetary Policy. The economy is expected to grow at an annual rate of around 3 per cent over the next couple of years, which is a bit higher than estimates of potential growth. The unemployment rate is accordingly expected to edge lower. Underlying inflation is higher than late last year; it is expected to reach around 2 per cent over the second half of 2017 and increase a little thereafter. The forecast for headline inflation has been revised a little higher, and lies between 2 and 3 per cent over much of the forecast period.
The outlook continues to be supported by accommodative monetary policy and an improvement in the global economy. Recent GDP data for Australia’s major trading partners have been broadly consistent with the Bank’s earlier expectations. Growth in the major advanced economies has been above potential rates for some time, with recent data showing that GDP growth in the June quarter was generally a bit stronger than in the previous quarter. Stronger global activity has been especially evident in international trade, which, along with accommodative policies, has supported growth in much of the Asian region. More recently, business investment growth has picked up in a number of economies.
In China, recent growth was a touch stronger than earlier expected. Conditions have strengthened in the residential construction and manufacturing industries. This has resulted
Overview
in higher demand for steel, and contributed to the recent increases in iron ore and coking coal prices and the improved outlook for these prices. The Bank’s forecast for Australia’s terms of trade has accordingly been revised up slightly since the previous Statement, but still implies a decline from the recent peak.
The outlook for the Chinese economy has a significant bearing on the outlook for Australian exports and the terms of trade. Despite the stronger growth recently, Chinese GDP growth is still expected to slow next year, reflecting longer-term structural factors. There continues to be uncertainty about how the authorities will negotiate the difficult trade-off between growth and the build-up of leverage in the Chinese economy. To address risks in the shadow banking sector, the authorities have recently sought to improve coordination among financial regulators and have announced tighter regulatory measures, but such measures are difficult to calibrate.
Globally, inflation pressures remain subdued. Some increase in inflation is expected over the next couple of years, though, as spare capacity in many advanced economies’ labour markets is absorbed and wage growth picks up. Despite the low inflation outcomes, markets expect monetary policy in a number of advanced economies to be somewhat less accommodative than was anticipated a couple of months ago. Sovereign bond yields have increased in response to these changes in expectations in the advanced economies, but are still low compared with a longer run of history. More

R E S E R V E B A N K O F AU S T R A L I A2
broadly, global financial conditions remain highly accommodative. Market volatility has been low.
The US dollar has experienced a broad-based depreciation and is now lower in trade-weighted terms than it was at the time of the US election. Consistent with that, a number of currencies are close to their highs of the past few years against the US dollar, including the euro, the Canadian dollar and the Australian dollar. On a trade-weighted basis, the Australian dollar has risen to levels last seen in late 2014.
Domestic economic data have been mostly positive in recent months, and consistent with the central forecasts for inflation and the unemployment rate. GDP growth looks to have recovered in the June quarter, following a March quarter outcome that was weaker than expected, partly because of bad weather and other temporary factors.
The forecast pick-up in inflation reflects a number of factors. As spare capacity in the labour market declines, this is expected to lead to a gradual increase in wage growth from its current low rates. Higher utilities inflation will add to overall inflation over the next year, although it is difficult to know exactly how much higher energy costs will be built into the prices of other goods and services. Headline inflation will also be boosted by further tobacco excise increases over the next couple of years. Working in the opposite direction are the effects of the recent exchange rate appreciation, ongoing competition in the retail industry and low rent inflation.
By the end of the forecast period, the unemployment rate is forecast to be a little under 5½ per cent. This forecast is little changed from three months ago, and implies that some spare capacity in the labour market will remain. Recent stronger conditions in the labour market have afforded greater confidence in this forecast. Since the start of the year, around 165 000 full-time
jobs have been created, average hours worked have increased and labour force participation has risen. Employment has increased in every state over this period, including in the mining-exposed states. This suggests that the drag on economic activity from the earlier declines in the terms of trade and falling mining investment is running its course. The unemployment and underemployment rates have both edged lower. Indicators of labour demand point to continued employment growth and little change in the unemployment rate over coming quarters.
Wage growth is expected to remain subdued, but to increase gradually over the forecast period as labour market conditions continue to improve. The increase in minimum and award wages announced by the Fair Work Commission will add a little to wage growth in the September quarter. The experience of some economies that are already close to full employment suggests that declining spare capacity might take some time to flow through to wage and thus price inflation. Inflationary pressures could instead emerge more quickly if workers seek to ‘catch up’ after a long period of low wage growth.
The recent growth in employment is supporting growth in household income and indications are that growth in household consumption increased in the June quarter. Further out, continued employment growth and somewhat faster average household income growth are expected to support consumption growth, which is forecast to be a little above its post-crisis average in the period ahead.
A number of factors could offset the forces supporting stronger consumption growth. Slow real wage growth is likely to weigh on consumption, especially if households expect the slow growth to continue for some time. Some households may also feel constrained from spending more out of their current incomes

S TAT E M E N T O N M O N E TA R Y P O L I C Y | AU G U S T 2017 3
because of elevated levels of household debt. This effect would become more prominent if housing prices and other housing market conditions were to weaken significantly. Household debt is likely to remain elevated for some time: housing credit growth overall has been steady over the past six months, but has continued to outpace income growth. The composition of that debt is changing, however, as lenders respond to regulators’ recent measures to contain risks in the mortgage market. Investor credit growth has moderated and loan approvals data suggest this will continue in coming months. Also, new interest-only lending has declined recently in response to the higher interest rates now applying to these loans and other actions by the banks to tighten lending standards.
Dwelling investment is likely to recover from the partly weather-related weakness of the March quarter and stay at a high level over the next year or so, sustained by the large pipeline of residential building work already approved or underway. However, dwelling investment is not expected to make a material contribution to GDP growth. The number of new residential building approvals has stepped down since last year; if they remain at this level, dwelling investment would be expected to start to decline in a year or so. Conditions in the established housing markets of the two largest cities remain fairly strong, although housing price growth appears to have eased a bit in recent months, more so in Sydney than in Melbourne. Housing prices in Perth have declined a little further, while growth in apartment prices in Brisbane has been weak.
Firms continue to report that business conditions are above average; survey measures are at their highest levels since early 2008 and conditions are above average in all non-mining industries. Export volumes look to have increased in the June quarter; coking coal exports returned to
pre-cyclone levels in May and June, and liquefied natural gas exports continue to increase. Resource exports are forecast to continue to add to GDP growth over the forecast period, while the drag from declining mining investment is close to an end.
Non-mining business investment is expected to increase gradually later in the forecast period as growth in demand increases, although uncertainty remains about the timing of any pick-up. Many of the conditions that would typically be associated with stronger growth in investment are in place, including low interest rates and high capacity utilisation. Some spillover from the large pipeline of public infrastructure activity to private sector investment could also be envisaged. Similarly, the outlook for private non-residential construction has improved a little recently with the level of approvals trending higher. However, other leading indicators of business investment remain mixed.
The forecasts for economic growth and inflation in Australia are based on the technical assumption that the exchange rate will remain around its current level. Further exchange rate appreciation would tend to generate a slower pick-up in economic activity and inflation than currently forecast.
Since August last year, the Board has held the cash rate steady at 1.5 per cent to provide the appropriate support for the economy in an environment of low inflation. The Board has sought to do this while balancing the risks associated with rising household indebtedness. The recent data are consistent with a gradual increase in inflation and a decline in the unemployment rate. Accordingly, at its recent meetings the Board has judged that holding the stance of policy unchanged would be consistent with sustainable growth in the economy and achieving the medium-term inflation target. R

R E S E R V E B A N K O F AU S T R A L I A4

S TAT E M E N T O N M O N E TA R Y P O L I C Y | AU G U S T 2017 5
1. International Economic Developments
Global economic conditions have strengthened over the past year (Graph 1.1). Business investment growth has picked up, particularly in the advanced economies, and consumption growth has been resilient. A range of other indicators of global activity have also increased, including growth in industrial production and merchandise trade, surveyed business conditions, and consumer and business sentiment (Graph 1.2). Accommodative monetary policies and less contractionary fiscal policies have supported growth globally for a few years now.
Graph 1.1
Graph 1.2
Major trading partner growth is forecast to ease slightly in 2018 and 2019. This is largely because of an expected gradual decline in Chinese growth as a result of structural factors, including the decline in the working age population, as well as policies designed to address rising debt. GDP growth in the major advanced economies is also expected to ease slightly, but remain above estimates of potential growth.
Core inflation remains low in many economies and it has declined in recent months in some large advanced economies, partly reflecting temporary idiosyncratic factors (Graph 1.3). Headline inflation has eased recently as the boost from earlier increases in oil and other commodity prices has started to dissipate. However, a range of factors should contribute to a gradual increase in underlying inflationary pressures over the next couple of years: producer price inflation has increased since late 2015; spare capacity in many advanced economies is expected to be absorbed
Global Activity*Year-ended growth
GDP
20122007 2017-5.0
-2.5
0.0
2.5
5.0
%
Global
Major tradingpartners (MTP)
MTP GDP components
20122007 2017-10
-5
0
5
10
%
Consumption
Investment
* Weighted by export shares, except for global GDP, which isPPP-weighted
Sources: CEIC Data; IMF; RBA; Thomson Reuters
Global Survey Indicators*PMIs
20122007 201730
40
50
60
index
Manufacturing
Services
Sentiment
20122007 2017-3.0
-1.5
0.0
1.5
st dev
Consumers
Businesses
* PPP-weightedSources: CEIC Data; IMF; Markit Economics; RBA; Thomson Reuters
By region, GDP growth has edged higher in China, while growth has been above potential in the major advanced economies. In the rest of east Asia, GDP growth has increased partly because of stronger growth in global merchandise trade (see ‘Box A: The Recent Pick-up in Global Merchandise Trade’).

R E S E R V E B A N K O F AU S T R A L I A6
over the next year or so; and unit labour cost growth has been above average in a some large advanced economies.
China and Asia-PacificIn China, GDP growth edged higher in the first half of 2017, supported by expansionary fiscal policy and accommodative financial conditions; this is consistent with the authorities’ desire for stability ahead of the 19th National Congress of the Chinese Communist Party later in the year. The biggest driver of growth continues to be the services (tertiary) sector, although growth in the industrial (secondary) sector has also remained firm this year (Graph 1.4).
Growth in residential construction has remained strong in recent months, despite policy measures to restrain housing price inflation. Demand for consumer goods has grown strongly and the pick-up in exports has continued. Collectively, these developments have supported growth in output across a range of manufacturing industries (Graph 1.5). Ongoing growth in electricity generation has underpinned Chinese demand for thermal coal, which has been met
2014201120082005 20170
4
8
12
16
%
0
4
8
12
16
%
China – GDP Growth by Sector*Year-ended
Primary(9%)
Secondary
Tertiary(52%)
(40%)
* Numbers in parentheses show 2016 shares of GDPSources: CEIC Data; RBA
Graph 1.4
China – Industrial ProductionYear-ended growth
2013 2017-10
0
10
%
Gross output
Value-added
Gross output
2013 2017-15
0
15
%
Crude steel
Electricity
Sources: CEIC Data; RBA
Graph 1.5
largely by domestic production, following the removal of various output restrictions late last year. Crude steel demand has picked up along with strength in infrastructure and residential investment. This has supported imports of iron ore, including from Australia.
Falls in commodity prices placed downward pressure on Chinese producer price inflation over the year to June, despite a pick-up in the prices of manufactured items. Underlying consumer price inflation measures increased a little further, but remain low.
Global Inflation*Year-ended
Consumer pricesAdvanced economies
20122007 2017-1
0
1
2
3
4
%
Headline
Core***
Producer prices**
20122007 2017-8
-4
0
4
8
12
%
* Selected economies; PPP GDP-weighted** Core series is an aggregate of selected advanced economies*** Excludes food and fuelSources: CEIC Data; Eurostat; IMF; RBA; Thomson Reuters
Graph 1.3

S TAT E M E N T O N M O N E TA R Y P O L I C Y | AU G U S T 2017 7
China – Residential Property IndicatorsYear-ended growth
New property prices
0
10
20
% Investment
0
20
40
%
Floor space sold
20142011 2017-50
0
50
100
% Inventory
20142011 2017-25
0
25
50
%
Sources: CEIC Data; RBA
Graph 1.6
Housing price inflation remains elevated, but it has declined following the introduction of a range of policies over the past year, including restrictions on housing purchases and loan-to-value ratios (Graph 1.6). Prices have continued to increase rapidly in cities that have not tightened their local housing market policies. Floor space sold has continued to rise, albeit at a slower rate, and inventories of unsold housing have continued to fall. In recent months, some local authorities have introduced a range of new administrative controls on developer activity to slow housing price growth further.
Business loansHousehold loansOff-balance sheet financingSecurities
2015201320112009 2017-10
0
10
20
30
40
%
-10
0
10
20
30
40
%
China – Total Social FinancingContribution to six-month annualised growth
Debt swapadjustment*
* Upper bound estimate of six-month annualised growth adjusting forimpact of local government bond issuance to pay off debt previouslyincluded in TSF
Sources: CEIC Data; RBA
Graph 1.7
Financial conditions remain accommodative, but they have tightened this year. Since the start of the year, a range of new financial market regulations have been initiated or proposed to constrain riskier forms of non-bank financing (see ‘Box B: Recent Developments in Chinese Financial Regulations’). The five-yearly National Financial Work Conference, held in July, reinforced the authorities’ commitment to address financial risks. The tighter regulatory stance has contributed to a fall in the issuance of securities and, in aggregate, growth in total social financing has eased over the past six months (Graph 1.7). The contribution of business loans
has risen a little, possibly due to a substitution by borrowers in response to the regulations.
In the rest of east Asia, growth has been around estimates of potential in the first half of 2017, supported by the upturn in global trade (Graph 1.8). Merchandise exports and industrial production have picked up since early 2016 across the region, although growth in both has eased more recently. Core inflation has increased but remains low. Across the region, monetary and fiscal policies have been little changed in recent months and remain accommodative.
In the high-income east Asian economies, which are more exposed to trade, the pick-up in trade has started to flow into domestic activity. However, China’s restrictions on Korean trade in response to geopolitical tensions have weighed on Korean service exports. Business investment growth has increased since late 2016. Although consumption growth has remained mostly subdued, timely indicators point to an increase in the period ahead; consumer confidence has increased sharply in Korea since the recent presidential election and retail sales growth has strengthened in Hong Kong. Employment

R E S E R V E B A N K O F AU S T R A L I A8
growth in most of the high-income economies has increased from multi-year lows.
In the middle-income east Asian economies, growth has been driven by strong domestic demand, particularly through investment and public consumption. Consumer confidence remained high in the June quarter, suggesting that consumption should remain strong. The improvement in global economic conditions has been associated with strong growth in merchandise exports and higher growth in visitor arrivals.
In India, economic growth has moderated over the past year to around 6 per cent (Graph 1.9). Investment growth has been weak, exacerbated by excess capacity, high corporate leverage and subdued business confidence. CPI inflation is currently well below the Reserve Bank of India’s (RBI’s) medium-term inflation target of 4 per cent, predominantly reflecting falling food prices, although core inflation has also eased. At its August meeting, the RBI lowered its policy rate for the first time since October 2016, having judged that some of the upside risks to inflation had abated. The RBI expects the introduction of the Goods and Services Tax in July, which
India – GDP Growth and InflationYear-ended
GDP growthGDP growth
20122007 2017-4
0
4
8
12
%
Quarterly*
Inflation
20122007 2017-5
0
5
10
15
%
Excl food and fuel
* Seasonally adjusted by RBASources: CEIC Data; RBA
Graph 1.9
New Zealand – Economic IndicatorsYear-ended
GDP growth
0
3
% Inflation
0
4
%
Tradables
Non-tradables
Employmentgrowth*
20122007 2017-3
0
3
% Wage growth
20122007 20170
2
4
%
* Break adjusted by RBASources: RBA; Statistics NZ; Thomson Reuters
Graph 1.10
replaced numerous existing central and state taxes, to have little effect on inflation.
GDP growth in New Zealand is around its long-run average (Graph 1.10). Growth has been driven by domestic demand, which has been supported by record high net immigration over the past two years and accommodative monetary policy. While housing market conditions remain strong, additional regulatory measures introduced in 2016 have resulted in tighter credit conditions and contributed to an easing in residential investment growth and
East Asia – Economic IndicatorsYear-ended growth
GDP*
0
6
%
High-income**
Industrial productionSmoothed
0
25
%
Middle-income***
Merchandise export volumesSmoothed
20122007 2017-25
0
25
% EmploymentSmoothed
20122007 2017-2
0
2
%
* Estimate for June quarter 2017** Hong Kong, Singapore, South Korea and Taiwan*** Indonesia, Malaysia, Philippines and ThailandSources: CEIC Data; IMF; RBA; UN
Graph 1.8

S TAT E M E N T O N M O N E TA R Y P O L I C Y | AU G U S T 2017 9
Major Advanced Economies –Output Gaps and Inflation*
Central bank forecastsUnited States
-6
-3
0
3%
Output gap**
Euro area Japan
-6
-3
0
3%
2009 2019-4
-2
0
2
4%
(year-ended)Headline inflation
2009 2019
Core inflation(year-ended)
2009 2019-4
-2
0
2
4%
* FOMC and ECB inflation forecasts exclude food and energy; BoJinflation forecast excludes fresh food; Japanese inflation data adjustedfor the 2014 consumption tax increase** Actual GDP relative to estimated potential GDP from CBO, EC and BoJ
Sources: BoJ; ECB; FOMC; RBA; Thomson Reuters
Graph 1.11
housing price inflation. Labour market conditions have been strong, but growth in labour supply due to immigration has constrained wage growth. Headline inflation declined a little in the June quarter to the lower half of the Reserve Bank of New Zealand’s target band, partly because of lower oil prices; non-tradables inflation was unchanged and remains below average.
Major Advanced EconomiesGDP growth in the major advanced economies is above estimates of potential, as has been the case for a number of years now, which has led to a gradual absorption of spare capacity (Graph 1.11). Core inflation remains low across the major advanced economies and, in some instances, idiosyncratic factors have subtracted from core inflation in recent months. Headline inflation has fallen recently as the contribution from earlier increases in oil and other commodity prices has started to dissipate. Nonetheless, inflation in the major advanced economies is expected to increase as the absorption of spare capacity in these economies puts upward pressure on wages and prices.
Major Advanced Economies –GDP and Components
Year-ended growthGDP
-5
0
5
%
Euro area*
Private consumption
-4
0
4
%
Business investment
20132009 2017-20
-10
0
10
%
US
Residential investment
20132009 2017-30
-15
0
15
%
Japan
* For euro area, business investment is public and privatenon-residential investment; data exclude Ireland due to measurementissues
Sources: RBA; Thomson Reuters
Graph 1.12
Year-ended GDP growth increased in the United States and euro area in the first half of 2017, and also looks to have increased in Japan. While private consumption remains the main driver of growth in the major advanced economies, business investment growth has increased since late 2016 (Graph 1.12). Residential investment growth looks to have eased in the June quarter in the United States and Japan, but to have continued at an above-average rate in the euro area.
Consumption growth picked up in the United States after the subdued March quarter outcome. Over the first half of 2017, consumption growth appears to have been around the average rate of recent years in the euro area, and above the average in Japan. The outlook for consumption growth in all three economies is being supported by strong employment growth, above-average consumer confidence and rising asset prices.
Growth in business investment has picked up since late 2016, following several years of weak growth, and has been a significant driver of GDP growth in the past couple of quarters. In the United States, where there is limited spare capacity, the revival of energy sector investment

R E S E R V E B A N K O F AU S T R A L I A1 0
Major Advanced Economies – InvestmentIntentions and Business SentimentUnited States
-2
0
2
st dev
Businesssentiment
Euro area Japan
-2
0
2
st dev
2007 2017-8
-4
0
4
% Investmentintentions*
2007 2017
Investmentgrowth**
2007 2017-8
-4
0
4
%
* Investment intentions mapped to national accounts investment growth** Quarterly growth; euro area excludes Ireland due to measurementissues; smoothed for Japan
Sources: RBA; Thomson Reuters
Graph 1.13
has contributed to the broader increase in business investment in 2017. Spare capacity is also low in the Japanese economy, and business investment growth has increased over the past year alongside a sizable increase in Japanese exports. Business investment growth in the euro area has also started to pick up, but remains well below its pre-crisis level. The outlook for business investment growth in the major advanced economies is being supported by increases in business confidence to multi-year highs and has been accompanied by a sustained period of growth in business credit (Graph 1.13). Investment intentions have increased and remain elevated in the United States, and there has also been a smaller pick-up in the euro area. Indicators of Japanese investment have been mixed, but point to a pick-up by early next year.
Major Advanced Economies –Labour Market and Wages
Employment growth*Year-ended
-3
0
3
%
Euro area
US
Participation rate
58
62
66
%
Japan
Unemployment rate
20122007 20170
4
8
12
% Wage growth**Year-ended
20122007 2017-2
0
2
4
%
Japan part-time
Japan full-time
* Three-month moving average for Japan** Employment cost index for the US; compensation per employee forthe euro area; smoothed average full-time scheduled wages andpart-time hourly wages for Japan
Sources: CEIC Data; Eurostat; RBA; Thomson Reuters
Graph 1.14
the euro area. In the United States and Japan, unemployment rates have declined to levels below estimates of full employment. The euro area unemployment rate has declined to its lowest rate in eight years, although it remains above estimates of full employment. The improvement in the euro area labour market has been broad based, but significant variation remains across the region; Germany and the Netherlands are around full employment, while unemployment rates are still high in countries that saw a larger increase after the financial crisis, such as Spain and Italy.
Wage growth remains relatively low in the United States, but it has picked up a little over the past few years and households expect a further small increase over the coming year. Japanese wage growth in the more flexible part-time sector has been increasing steadily since 2011 and is approaching its highest rate over the past 20 years. Despite some recent volatility, Japanese full-time wage growth has also picked up and has been positive over the past three years. Wage growth in the euro area remains low overall, although it is higher in some economies
Labour markets have improved considerably in the major advanced economies over recent years. Employment growth has been robust. Labour force participation has increased in Japan, while it has been flat in the United States (after a period of decline) and in the euro area (Graph 1.14). Participation rates of the elderly and females have been rising in Japan and

S TAT E M E N T O N M O N E TA R Y P O L I C Y | AU G U S T 2017 1 1
Table 1.1: Commodity Price Growth(a)
SDR, per cent
Since previous Statement Over the past year
Bulk commodities –2 32
– Iron ore 9 15
– Coking coal –21 72
– Thermal coal 12 32
Rural 0 4
Base metals 3 21
Gold 0 –8
Brent crude oil(b) 9 28
RBA ICP –8 13
– Using spot prices for bulk commodities –1 21(a) Prices from the RBA Index of Commodity Prices (ICP); bulk commodities prices are spot prices(b) In US dollars Sources: Bloomberg; IHS; RBA
with stronger labour market conditions, such as Germany. Growth in unit labour costs, which takes into account productivity growth, has been above average over the past couple of years in a number of economies, including the United States, Japan and Germany.
In the United Kingdom, GDP growth had been more resilient than expected following the Brexit vote, supported by stronger-than-expected investment. Growth has eased more recently, however, and uncertainty around Brexit is likely to weigh on future investment. Inflation has increased sharply due to the depreciation of the British pound, and lower real wage growth is dragging on consumption. Consumer confidence has fallen this year to be a little below average.
Commodity PricesGlobal commodity price movements have been varied since the previous Statement, reflecting a number of commodity-specific factors. The spot price of coking coal has declined, while iron ore, thermal coal and oil prices have increased (Table 1.1; Graph 1.15). Over the past year, the prices of wheat, wool and beef have risen,
reflecting a range of idiosyncratic supply and demand side factors. The increase in base metal prices has coincided with the improvement in global economic conditions, although developments in supply and policy decisions in a number of other countries have also contributed. Overall, Australia’s terms of trade are expected to decline over the forecast period, consistent with further increases in low-cost supply of bulk commodities (see the ‘Economic Outlook’ chapter).
Commodity PricesJanuary 2010 average = 100
2013 201725
50
75
100
125
150
index
(spot prices)
Rural*
Base metals*
Bulk*
2013 201720
40
60
80
100
120
US$/b
Brent crude oil
* RBA Index of Commodity Prices (ICP) sub-indices; SDRSources: Bloomberg; RBA
Graph 1.15

R E S E R V E B A N K O F AU S T R A L I A1 2
Coal PricesFree on board basis
Thermal coal
2013 20170
50
100
150
US$/t
Contract
Spot
Hard coking coal
2013 20170
100
200
300
US$/t
Sources: Department of Industry, Innovation and Science; IHS; RBA
The spot price of iron ore has increased since the previous Statement, alongside positive Chinese activity data and positive commentary from Chinese officials (Graph 1.16). More recently, prices have reportedly been supported by elevated Chinese steel margins, as well as more environmental inspections at Chinese iron ore mines that have disrupted production. However, the iron ore spot price remains around 25 per cent below its peak in late February; prices declined sharply in May because more of China’s demand for iron ore was met by Chinese production. The iron ore spot price is still widely expected to decline over the next year or so as low-cost global supply continues to come on line and demand from China is expected to ease.
The spot price of premium hard coking coal has fallen since the previous Statement (Graph 1.17). This was because of a rebound in Australian exports after infrastructure was restored following damage related to Cyclone Debbie in late March. In recent weeks the spot price has rebounded, in line with the positive Chinese economic data and expectations of production cuts in China’s largest coking coal region to address excess capacity. After significant delays,
2015201320112009 20170
50
100
150
US$/t
0
200
400
600
US$/tChinese Steel and Iron Ore Spot Prices
Chinese steel*
Iron ore**
(RHS)
(LHS, fines)
* Average of hot rolled steel sheet and steel rebar prices** Free on board basisSources: Bloomberg; RBA
Graph 1.16
Graph 1.17
the June quarter contract price was set at around US$193 per tonne, almost US$100 below the March quarter contract price.
Meanwhile, the spot price of thermal coal has increased since the previous Statement, following worker strikes at mines in New South Wales and supply disruptions in Indonesia. A benchmark price for the 2017 Japanese fiscal year contract was settled in May at US$85 per tonne, an increase of almost 40 per cent compared with the 2016 contract; less than a quarter of Australia’s thermal coal exports are estimated to be sold on contract.
Oil prices have increased since the previous Statement (Graph 1.15). In late May, the Organization of the Petroleum Exporting Countries (OPEC) and non-OPEC countries agreed to extend the current production cap to March 2018. Declines in oil inventories in the United States and plans from some OPEC nations to limit exports have also supported prices recently. However, oil prices remain around 5 per cent lower than at the start of the year because of earlier increases in crude oil production in the United States and in some OPEC countries that are exempt from the production cap. R

S TAT E M E N T O N M O N E TA R Y P O L I C Y | AU G U S T 2017 13
Box A
The Recent Pick-up in Global Merchandise Trade
Graph A1Growth in global merchandise trade, which includes manufactured goods and commodities, has picked up since last year. Growth in merchandise trade values increased to around 9 per cent over the year to May, while growth in trade volumes increased to around 5 per cent (Graph A1).
Trade is very responsive to changes in global demand: that is, when global demand picks up, trade picks up by more, and likewise when it slows. Some of this reflects the production of goods in global supply chains, where components are traded between economies before the final good reaches its destination. The recent pick-up in merchandise trade growth is consistent with the improvement in global economic conditions since last year. This follows subdued growth in global merchandise trade for much of the period since the global financial crisis, most notably between 2014 and early 2016 when global growth eased and falling commodity prices reduced the value of commodity exports.1
Global imports and exports should in principle be equal, but measurement gaps and timing differences produce deviations in practice. Viewing trade through the lens of imports shows the sources of demand, while export data show where the production is coming from to meet that demand (Graph A2).
1 See Jääskelä J and T Mathews (2015), ‘Explaining the Slowdown in Global Trade’, RBA Bulletin, September, pp 39–46; and International Monetary Fund (2016), ‘Global Trade: What’s Behind the Slowdown?’, World Economic Outlook, October, pp 63–119.
Graph A2World Merchandise Trade Volumes*
Contributions to three-month moving average year-ended growthImportsImports
0
2
4
ppt
0
2
4
ppt
ExportsExports
20162015201420132012 2017-2
0
2
4
ppt
-2
0
2
4
ppt
G3 China Other east AsiaCommodity-exporting emerging economies** Other
* Contributions calculated by weighting year-ended growth rates by2010 fixed nominal share of world exports and imports; euro areaweight includes intra-euro area trade** Aggregate of Central and Eastern European, and Latin Americancountries
Sources: CEIC Data; CPB Netherlands; RBA
World Merchandise TradeYear-ended growth*
Smoothed
20112005 2017-40
-20
0
20
%
Values
Relative to world GDP**Annual
2008199919901981 201710
15
20
25
%
Volumes
* Average of exports and imports; values are in US dollars** Export volumes relative to world real GDP and values relative to worldnominal GDP at market exchange rates; observation for 2017 is Marchquarter only
Sources: CPB Netherlands; IMF; RBA; Thomson Reuters

R E S E R V E B A N K O F AU S T R A L I A14
The increase in demand for capital goods, particularly electronic goods, has been met predominantly by exports from Asia (excluding China and Japan). These economies are an integral part of global supply chains, and so this sharp increase in demand for exports has been accompanied by a pick-up in production activity and import growth. Together with the increase in intraregional trade in east Asia, this emphasises that a considerable part of the global trade pick-up reflects the production of goods in long supply chains rather than just an increase in global final demand. The increase in global trade has also led to a pick-up in investment growth in the region (especially in the more trade-exposed high-income economies). Unlike in other parts of Asia, the significant increase in Japanese exports has not been associated with a strong increase in imports, reflecting the high domestic value- added component of Japanese exports; instead, in recent months import growth has picked up with the strengthening in domestic demand growth.
Several factors are expected to sustain the recent increase in trade growth. Short-term leading indicators of trade – such as manufacturing export orders and shipping rates – remain at high levels after rising over the past year. Global GDP growth over the next few years is expected to remain robust. Business investment growth in the advanced economies has increased lately, and investment intentions have risen, which should support trade in capital goods. R
Chinese demand for imports picked up from mid 2016, partly supported by policy stimulus. The increase in imports to China was broad based by types of goods, although it was particularly pronounced for resource imports (especially imports of mineral fuels). More recently, a number of commodity-exporting emerging economies have also contributed to global import growth. These economies, including Brazil and Russia, have exited recessions caused, in large part, by the sharp declines in commodity prices from mid 2014 to late 2015. The recent pick-up in demand from major advanced economies, particularly from the increase in investment, has also led to an increase in imports.
The increase in merchandise import growth has been met by both commodity and non- commodity exporters, and includes a range of export categories (Graph A3). The increase in demand for fuels and industrial materials has contributed to a sharp pick-up in export prices for commodity-exporting economies, although their export volumes growth has been more muted.
Graph A3World Exports*
Year-ended growth, smoothed
FuelsIndustrialmaterialsCapital goodsTransportConsumer and other
2014 2017-15
-10
-5
0
5
10
% Non-commodity exporters** Emerging marketcommodity exporters***
2014 2017-45
-30
-15
0
15
30
%
Volumes
Values
* Aggregates cover 85 per cent of world trade (excludes intra-EU trade)** Includes China, extra-EU trade, Hong Kong, Japan, Malaysia,Philippines, Singapore, South Korea, Taiwan, Thailand and UnitedStates*** Aggregate of African and Middle Eastern, Central and EasternEuropean, and Latin American countries
Sources: CEIC Data; CPB Netherlands; RBA; Thomson Reuters

S TAT E M E N T O N M O N E TA R Y P O L I C Y | AU G U S T 2017 1 5
2. International and Foreign Exchange Markets
Over the past few months, changes in expectations regarding monetary policy have been a key driver of developments in financial markets. The US Federal Reserve and the Bank of Canada (BoC) have raised their policy rates in recent months. The US Federal Reserve has also indicated that it intends to begin to reduce its balance sheet in the near term. In addition, a number of central banks in advanced economies have indicated that they are more likely to tighten policy in the future or are at least less likely to ease policy (than was previously the case). These changes have occurred against the backdrop of a general improvement in economic conditions, including a further tightening in labour markets, but with some recent declines in inflation (driven in part by lower oil prices). In response to these developments, sovereign bond yields have generally risen, but the increase has been modest in comparison with some earlier episodes, and financial conditions remain favourable. Equity valuations remain high and credit spreads remain narrow. Exchange rates have also responded to changing expectations for monetary policy. The US dollar is now lower than it was at the time of the US election. Consistent with that, a number of currencies are close to highs of the past few years against the US dollar, including the euro, the Canadian dollar and the Australian dollar.
Central Bank PolicyThe US Federal Reserve has increased its policy rate three times since December last year. The most recent increase was in June by 25 basis points to 1–1.25 per cent. The Federal Open
Market Committee (FOMC) expects to raise the policy rate by a further 100 basis points by the end of 2018 (Graph 2.1). It has also recently outlined a plan to gradually reduce the size of its balance sheet, which it expects to start relatively soon. The FOMC has noted that the appropriate size of the balance sheet in the long run is uncertain but that it is likely to be larger than the US$1 trillion it was before the financial crisis. The FOMC expects inflation to remain somewhat below its goal in the near term but to stabilise around its goal over the medium term. Chair Yellen has acknowledged that if inflation continues to undershoot the FOMC’s goal, then the FOMC would adjust the pace of its policy tightening accordingly. Market participants generally expect a substantially slower pace of tightening than that projected by the FOMC.
The BoC increased its policy rate by 25 basis points in July. In the accompanying statement, the BoC observed that the economy is growing
Graph 2.1
20162012200820042000 20200
2
4
6
%
0
2
4
6
%US Policy Rate
Federal fundstarget range
Federal funds target rate*
FOMC median projectionsJune 2017
* Dashed line shows current market expectationsSources: Bloomberg; Board of Governors of the Federal Reserve System

R E S E R V E B A N K O F AU S T R A L I A1 6
quicker than its potential rate and judged that recent softness in inflation will be temporary. Market prices suggest that the BoC is expected to raise its policy rate further in the coming months. In a number of other advanced economies, monetary policy is expected to become less accommodative than had previously been the case. The Bank of England (BoE) has signalled that it may be closer to increasing its policy rate than it was a couple of months ago. It has noted that its tolerance for above-target inflation will decline as spare capacity in the economy lessens. Monetary policy is also expected to be less accommodative in Sweden than previously anticipated, after the central bank stated that it is less likely to lower its policy rate than before. Similarly, in Norway the central bank has indicated that it is less likely to lower its policy rate than previously. It now expects to keep its policy rate unchanged over the next couple of years.
The European Central Bank (ECB) has left its policy settings unchanged in recent months but in June it removed its bias to ease interest rates further. It stated that the risks to the outlook for economic growth had improved and were now broadly balanced. Nonetheless, the ECB noted that very accommodative monetary policy remains appropriate given that inflationary pressures are still subdued. Consistent with this, market prices imply that the ECB is expected to keep the deposit rate at its current level until at least late 2018. The ECB has indicated that it will discuss whether to reduce the pace of asset purchases at one of its forthcoming meetings. Market analysts generally expect that such a reduction will begin in early 2018.
The Bank of Japan (BoJ) has left its policy settings unchanged since announcing its policy of ‘yield curve control’ in September 2016. The BoJ has reiterated its intention to purchase around ¥80 trillion in Japanese government bonds
Table 2.1: Monetary Policy
Policy ratePer cent
Most recent
change
Euro area(a) –0.40 ↓ Mar 16
Japan(a) –0.10 ↓ Jan 16
United States(b) 1.125 ↑ Jun 17
Australia 1.50 ↓ Aug 16
Brazil 9.25 ↓ Jul 17
Canada 0.75 ↑ Jul 17
Chile 2.50 ↓ May 17
India 6.00 ↓ Aug 17
Indonesia 4.75 ↓ Oct 16
Israel 0.10 ↓ Feb 15
Malaysia 3.00 ↓ Jul 16
Mexico 7.00 ↑ Jun 17
New Zealand 1.75 ↓ Nov 16
Norway 0.50 ↓ Mar 16
Russia 9.00 ↓ Jun 17
South Africa 6.75 ↓ Jul 17
South Korea 1.25 ↓ Jun 16
Sweden –0.50 ↓ Feb 16
Switzerland(b) –0.75 ↓ Jan 15
Thailand 1.50 ↓ Apr 15
Turkey 8.00 ↑ Nov 16
United Kingdom 0.25 ↓ Aug 16(a) Marginal rate paid on deposits at the central bank(b) Midpoint of target rangeSources: Central banks; RBA; Thomson Reuters
annually, although its actual purchases have fallen below this pace recently (Graph 2.2). While the BoJ expects inflation to continue to pick up as economic growth remains above potential, inflation is not expected to reach the BoJ’s target within its three-year forecast horizon.
The central bank of Mexico increased its policy rate in recent months, citing the need to anchor inflation expectations (Table 2.1). In contrast, the central banks of Brazil, India, Russia and South Africa have lowered interest rates because inflation has slowed substantially in their economies.

S TAT E M E N T O N M O N E TA R Y P O L I C Y | AU G U S T 2017 1 7
Sovereign Debt MarketsGovernment bond yields in advanced economies have increased as markets have adjusted their expectations regarding the extent of future monetary policy accommodation (Graph 2.3). Nonetheless, yields remain at historically low levels, consistent with the current and prospective low levels of central bank policy rates and the high demand for government bonds, including from central banks under their asset purchase programs.
Notwithstanding their recent increase, yields on 10-year US Treasuries are lower than at the
beginning of the year. This reflects the market’s reduced expectations for US fiscal stimulus and weaker-than-expected inflation data. One of the reasons that longer-term yields remain historically low is the very low level of the term premium – which is the additional return investors require to compensate for the risks of holding long-term bonds. This is at a low level partly because of the Federal Reserve’s large holdings of US dollar securities (Graph 2.4). The Federal Reserve has estimated that if it reduces the size of its balance sheet over the next five years or so, the term premium would increase by about 60 basis points over this period.1
In Europe, yields on 10-year German government bonds increased to their highest level since early 2016 after comments by the ECB President in late June were interpreted by the market as signalling less accommodative monetary policy than previously expected. The spreads between yields on other euro area government bonds and German government bonds have narrowed along with the decline in political uncertainty in the currency union (Graph 2.5). Of particular
1 See Bonis B, J Ihrig and M Wei (2017), ‘The Effect of the Federal Reserve’s Securities Holdings on Longer-term Interest Rates’, FEDS Notes, Washington: Board of Governors of the Federal Reserve System, 20 April. Available at <https://doi.org/10.17016/2380-7172.1977>.
Graph 2.2Bank of Japan Purchases
of Japanese Government BondsNet purchases
6-month ended annualised
40
80
¥tr
40
80
¥tr
Yield curvecontrol
10-year Japanesegovernment bond yield
2016201520142013 2017-0.5
0.0
0.5
%
-0.5
0.0
0.5
%
Sources: Bloomberg; RBA; Thomson Reuters
Graph 2.3
201620152014 2017-0.5
0.0
0.5
1.0
1.5
2.0
2.5
3.0
%
-0.5
0.0
0.5
1.0
1.5
2.0
2.5
3.0
%10-year Government Bond Yields
Germany
Japan
US
Source: Bloomberg
Graph 2.4
2013200920052001 2017-1
0
1
2
3
%
-1
0
1
2
3
%10-year US Treasury Term Premium
Average
Source: Federal Reserve Bank of New York

R E S E R V E B A N K O F AU S T R A L I A1 8
note was the election of Emmanuel Macron, a pro-euro candidate, to the French Presidency and the strong majority gained by his party in the National Assembly. Meanwhile, Greece reached an agreement with its creditors for the disbursement of another tranche of funding that was largely used to meet substantial debt repayments in July. Greece also returned to the bond market for the first time in three years, issuing €3 billion worth of 5-year bonds.
Yields on 10-year Japanese government bonds remain close to the BoJ’s target of around 0 per cent under its policy of ‘yield curve control’. To stem a rise in yields in early July, the BoJ offered to purchase an unlimited quantity of government bonds with maturities of 5–10 years at yields slightly above those prevailing in the market. Although there was no take-up of the offer, the BoJ operation signalled an intention to limit any rise in yields and yields declined modestly in response.
In emerging markets, yields on government bonds that are denominated in local currencies have declined since the beginning of the year (Graph 2.6). The decline in yields is consistent with a decrease in inflation, a lowering of monetary policy rates in many emerging markets and a decline in risk premia as the economic
outlook has improved. This latter change has been accompanied by persistent flows of capital into emerging market bonds, as investors have sought to enhance their returns amid a global environment of low yields.
Credit MarketsFinancial conditions for the corporate sector remain very favourable. Yields on corporate bonds are low in part because spreads to sovereign bonds have continued to narrow (Graph 2.7). Non-financial corporations appear to have good access to funding and have taken advantage of the low yields by increasing their issuance of bonds (Graph 2.8). For firms headquartered in the United States, gross issuance over the year to date has been very strong. Issuance by firms from emerging markets has also been strong relative to recent years. For European firms, issuance of euro-denominated bonds has been supported by continued purchases of these securities by the ECB.
The favourable funding conditions have persisted even as the US Federal Reserve has raised its policy rate and as markets have revised down their expectations regarding the extent of monetary policy accommodation elsewhere. Conditions have been underpinned by the
Graph 2.510-year Euro Area Government Bonds
Yields
2013 2017-2
0
2
4
6
%
Germany
Italy
Spreads to Germany
2013 2017-200
0
200
400
600
bps
France
Spain
Source: Bloomberg
Graph 2.6Emerging Market Bonds
Government bond yieldsLocal currency-denominated
20152013 20174.5
5.5
6.5
7.5
% Flows into bond funds*
20152013 2017-20
-10
0
10
%
* Cumulative since end 2012, per cent of initial assets undermanagement
Sources: EPFR Global; Thomson Reuters

S TAT E M E N T O N M O N E TA R Y P O L I C Y | AU G U S T 2017 1 9
spread) has fallen markedly over the year to date, after rising ahead of the implementation of US money market fund reforms in 2016 (Graph 2.9). In part, the spread has declined because banks have diversified their funding sources to other markets – including by raising deposits – and have reduced their reliance on unsecured short-term debt.
US Dollar Funding Costs3-month maturity
Cross-currency basis*
2013 2017-225
-150
-75
0
bps
Euro
Japanese yen
LIBOR-OIS spread**
2013 20170
15
30
45
bps
* Negative value represents an additional cost to borrow US dollars** Difference between the London Interbank Offered Rate and theOvernight Index Swap rate
Source: Bloomberg
Graph 2.9
Graph 2.7Corporate Bond Yields
Investment gradeLHS
2007 20170
3
6
9
%
Euro
US dollar
High yieldRHS
2007 2017
Emerging marketsRHS, US$ bonds
2007 20170
8
16
24
%
Sources: JP Morgan; Thomson Reuters
Graph 2.8Corporate Bond Issuance
Non-financial corporations, cumulative issuance by calendar year
US
Range 2011-16
M J S D0
250
500
750
US$b
2017
Euro area
M J S D
2016
Emerging marketsExcluding China
M J S D0
250
500
750
US$b
Sources: Dealogic; RBA
improved global economic environment (see ‘International Economic Developments’ chapter), which has supported corporate earnings. At the same time, uncertainty about the future path of earnings has declined in part because economic data have generally evolved largely as expected.
Conditions in short-term US dollar funding markets remain favourable. The additional cost of borrowing US dollars in exchange for foreign currency remains lower than in the second half of 2016, as does the cost of borrowing US dollars in exchange for high-quality collateral. Moreover, the rate on unsecured lending compared with the risk-free rate (as captured by the LIBOR-OIS
Equity MarketsConditions in equity markets also remain favourable for corporations, with valuations historically high on a range of measures (Graph 2.10). Share prices in advanced economies have risen steadily since around the middle of 2016, partly reflecting an improvement in economic conditions and a pick-up in corporate earnings growth. Although earnings growth slowed somewhat in the June quarter, earnings tended to be higher than analysts had expected.
The information technology (IT) sector has experienced the largest increase in share prices this year. This increase, along with the sector’s large and growing share of the overall equity market, has contributed to the relatively high equity valuations more broadly.

R E S E R V E B A N K O F AU S T R A L I A2 0
transferred to Intesa Sanpaolo, which in turn will receive a €5.2 billion capital injection from the government (plus susbstantial government guarantees). In Spain, the Commission approved the resolution of Banco Popular, under which its equity and subordinated debt were written down and the bank was sold to Banco Santander for the notional sum of €1.
Volatility remains low across financial markets, especially in equity markets (Graph 2.12). This appears to reflect a number of factors, including low volatility in global economic growth over recent years and perceptions of greater certainty around central bank policy. Measures of implied volatility, which are derived from option prices, have been further dampened by an increase in the supply of options – or ‘insurance’ – by investors seeking yield enhancement.
Share prices in emerging Asian markets have increased considerably this year (Graph 2.13). The rise in prices has been especially large for IT firms, consistent with the strong growth that has occurred in semiconductor production and trade. Foreign capital has flowed steadily into emerging market equity funds more broadly this year, encouraged by the improving outlook for economic growth in many of these economies.
Graph 2.10Equity Valuations
12-month forward price-earnings ratios
20122007 20170
5
10
15
ratio
US
Euro area
20122007 20170
10
20
30
ratio
Japan
Averagesince 2006
Sources: RBA; Thomson Reuters
Graph 2.11Major Market Bank Share Prices
1 January 2016 = 100US
2016 201750
75
100
125
index
S&P 500
Euro area
2016 2017
Bankingsub-index
EuroSTOXX
Japan
2016 201750
75
100
125
index
Topix
Source: Bloomberg
Bank share prices have recently been supported by the higher yields on long-term government bonds (Graph 2.11). Prices of US bank shares were also buoyed by the results of the Federal Reserve’s annual stress tests. All 34 banks covered by the tests would exceed their minimum capital requirements under the ‘severely adverse’ scenario. The Federal Reserve also approved the capital plans of the 34 banks, which include substantially higher dividend payments and share buybacks than last year.
The June quarter earnings of US and European banks exceeded analysts’ expectations, primarily reflecting higher investment banking revenues and lower provisions for loan losses. However, trading revenues declined amid low volatility in financial markets.
In Europe, recent regulatory actions to deal with a number of troubled banks were viewed positively by the market. The European Commission authorised a ‘precautionary recapitalisation’ of Italy’s Monte dei Paschi di Siena, which will involve the provision of €5.4 billion in state aid. The Commission also approved plans whereby the Italian Government will take ownership of the non-performing assets of two small Italian banks, with their other assets

S TAT E M E N T O N M O N E TA R Y P O L I C Y | AU G U S T 2017 2 1
Chinese Financial MarketsConditions in Chinese financial markets have tightened this year as the Chinese authorities address concerns about financial system stability, particularly the extent of leverage within the financial system (see ‘Box B: Recent Developments in Chinese Financial Regulations’). In particular, the People’s Bank of China (PBC) has facilitated a rise in money market interest rates since late last year (Graph 2.14). This change, combined with the announcement of various regulatory measures, has contributed to tighter financial conditions
Graph 2.12Equity Volatility Indices
Expected volatility over next 30 days, annualised
S&P 500
2013 20170
15
30
45
%
Averagesince 1999
Euro STOXX 50
2013 20170
15
30
45
%
Source: Bloomberg
M MJ JS SD2016 2017
80
90
100
110
120
130
index
80
90
100
110
120
130
index
Emerging Market Share Prices by Region1 January 2016 = 100
MSCI Emerging Europe
MSCI Latin America
MSCI Emerging Asia
Sources: Bloomberg
M MJ JS SD2016 2017
2
3
4
5
%
2
3
4
5
%Chinese Money Market Rates
PBC 7-day dealing rate
7-day repo
3-month SHIBOR*
* SHIBOR is an average of the rate at which large banks say they willlend unsecured funds to other banks
Source: CEIC Data
Graph 2.13
Graph 2.14
for corporations. Yields on bonds issued by Chinese corporations have increased markedly since late 2016 (Graph 2.15). Weaker demand for corporate bonds has weighed on bond issuance by non-financial corporations, which has declined over 2017 to date.
Graph 2.15Chinese Bond Markets
Bond yields
M MJ JS SD2016 2017
2
3
4
5
%
Corporate 5-year AAA
Sovereign 5-year
Cumulative net corporatebond issuance
M J S D-1 500
0
1 500
3 000
CNYb
2014
2015
2017
2016
Sources: Bloomberg; CEIC Data
More recently, conditions in financial markets have eased somewhat following an increase in the supply of liquidity by the PBC in its market operations, which steered money market rates a little lower. Sovereign bond yields declined in response and corporate bond spreads narrowed,

R E S E R V E B A N K O F AU S T R A L I A2 2
to delay receiving their (foreign currency-denominated) export earnings in the expectation that the RMB would depreciate further. The reduction in capital outflows over 2017 to date has contributed to a stabilisation of the value of the PBC’s foreign currency reserves at a little above US$3 trillion, following a marked decline in reserves since mid 2014 (Graph 2.16).
though these remain elevated compared with late last year and corporate bond issuance remains weak.
Chinese share prices have risen in the past few months, partly in response to easing monetary conditions. Global index provider MSCI announced that it would include most Chinese onshore shares (A shares) with a large capitalisation in its Emerging Market Index. Beginning in June 2018 the onshore shares will have a weight of 0.7 per cent in the index, giving fund managers that track the index about one year to buy around US$12 billion of A shares.
China’s Bond Connect became operational last month, allowing most offshore investors to access the Chinese bond market via Hong Kong (in so-called ‘northbound’ trade) without use of a custodian located in mainland China (which would otherwise hold assets on behalf of clients and provide services, such as transaction settlements). While this makes it easier for new investors to access the Chinese bond market, onshore custodians are still required for investors to access some onshore hedging markets. The possibility of ‘southbound’ trading will be explored by the authorities at a later date.
The introduction of China’s Bond Connect is consistent with other actions by the Chinese authorities to encourage capital inflows. Authorities have also been placing greater scrutiny on capital outflows. These changes, combined with some appreciation of the Chinese renminbi (RMB) against the US dollar, have reduced the pace of capital outflows over 2017 to date relative to previous years. Over the March quarter, there were net capital inflows, mostly reflecting an increase in foreigners’ holdings of RMB with Chinese banks and the repayment of trade credit by foreign firms to Chinese firms. Chinese firms had previously extended the time frame over which foreign firms were required to settle invoices so as
Graph 2.16Chinese Foreign Currency Reserves
Stock
1 500
3 000
US$b
1 500
3 000
US$b
Monthly change
2014201120082005 2017-150
-75
0
75
US$b
-150
-75
0
75
US$b
Source: CEIC Data
Following a noticeable depreciation over 2016, the RMB has depreciated further on a trade-weighted (TWI) basis over 2017 to date (Graph 2.17). In contrast, the currency has appreciated by around 3 per cent against the US dollar. The RMB appreciated noticeably against the US dollar around the end of May, in part reflecting the PBC setting the RMB’s daily fixing rate – around which it can trade within a ±2 per cent band – at a more appreciated rate than the previous day’s closing rate. The move coincided with an announcement by the PBC that it had added a discretionary ‘counter-cyclical adjustment factor’ to the mechanism used to set the RMB’s daily fixing rate against the US dollar.
Foreign ExchangeSimilar to recent developments in other financial markets, exchange rates have been affected by market participants’ expectations that monetary

S TAT E M E N T O N M O N E TA R Y P O L I C Y | AU G U S T 2017 2 3
policy will be less accommodative in some advanced economies than earlier anticipated. In particular, the euro and the Canadian dollar appreciated following actions or changes in forward guidance by central banks in those economies, and are close to highs of recent years against the US dollar (Graph 2.18). The euro has also been supported by a reduction in political uncertainty, following the defeat of euro-sceptic parties in a number of elections in the region.
In contrast, the US dollar has depreciated further in recent months, to be a little below its level just prior to the US election (Table 2.2). The broad-based depreciation of the US dollar has occurred despite the Federal Reserve having increased its policy rate further. As in other financial markets, measures of volatility in foreign exchange markets remain at low levels.
Developments in emerging market currencies have been mixed over recent months (Graph 2.19). The Mexican peso has appreciated against the US dollar since the start of the year, to be above its level prior to the US election. This is consistent with recent political developments in Mexico, an easing of concerns about trade relations between Mexico and the United States and a tightening of monetary policy in Mexico.
Graph 2.17 Graph 2.18
20152013201120092007 201790
100
110
120
130
140
index
8.0
7.5
7.0
6.5
6.0
5.5
yuanChinese Exchange Rates
(RHS, inverted scale)Yuan per US$
TWI*(LHS)
* 2007 average = 100Sources: BIS; Bloomberg; RBA
201620152014 201770
80
90
100
110
120
index
70
80
90
100
110
120
index
Nominal Trade-weighted Exchange Rates1 January 2014 = 100
US dollar
Japanese yen
Euro
Canadian dollar
Sources: BIS; Bloomberg; Board of Governors of the Federal Reserve System
Table 2.2: Changes in the US Dollar against Selected Currencies
Per cent
Over 2016
2017 to date
Philippine peso 6 2Indonesian rupiah –2 –1Russian rouble –14 –2Chinese renminbi 7 –3Brazilian real –18 –4Malaysian ringgit 5 –4Swiss franc 2 –5Japanese yen –3 –5Singapore dollar 2 –6Indian rupee 3 –6Canadian dollar –3 –6UK pound sterling 19 –7New Taiwan dollar –1 –7New Zealand dollar –1 –7South Korean won 3 –7Thai baht –1 –7Australian dollar 1 –10Swedish krona 8 –11European euro 3 –11Mexican peso 21 –14Trade-weighted index 4 –7Sources: Bloomberg; Board of Governors of the Federal Reserve System

R E S E R V E B A N K O F AU S T R A L I A2 4
Table 2.3 Gross Foreign Currency Reserves(a)
Percentage change: Level
End June 2016 to latest
End March 2017 to latest
US$ equivalent (billions)
China –5 2 3 057Saudi Arabia –12 –2 491Taiwan(b) 2 1 442Hong Kong 14 3 399South Korea 3 1 371India 8 6 367Brazil 3 3 364Russia 5 4 334Singapore 7 3 264Thailand 4 3 177Mexico –2 –2 166Indonesia 13 1 117Malaysia 4 4 93Turkey –16 –3 84(a) Data to end June for China, Hong Kong, Indonesia, Mexico, Saudi Arabia, Singapore, South Korea, Taiwan, and Thailand; to 14 July
for Malaysia; to 21 July for India, Russia and Turkey; to 1 August for Brazil(b) Foreign exchange reserves (includes foreign currency and other reserve assets)Sources: Bloomberg; CEIC Data; central banks; IMF; RBA
Graph 2.19Asian and Emerging Market Currencies
Against the US dollar, 1 July 2016 = 100
M JS SD2016 2017
70
80
90
100
110
index
Malaysia
South Africa
Argentina
SouthKorea
M JS SD2016 2017
70
80
90
100
110
index
Mexico
Turkey
Russia
Brazil
Source: Bloomberg
The currencies of most emerging European economies have also appreciated against the US dollar over this period, moving broadly in line with the euro. The Argentine peso has depreciated noticeably against the US dollar in recent months, amid uncertainty regarding the
outcome of the upcoming mid-term legislative election.
The gross foreign currency reserves of most emerging market economies have increased since the end of March 2017 (Table 2.3). This is consistent with the depreciation of the US dollar in the June quarter, which increased the US dollar value of reserves held in other currencies.
Australian DollarBetween 2013 and 2015, the Australian dollar depreciated significantly against the US dollar and on a trade-weighted basis, following the decline in commodity prices and mining investment (Graph 2.20). The currency has appreciated since the start of the year and has risen to late-2014 levels on a trade-weighted basis (Table 2.4). Part of that reflects the broad-based depreciation of the US dollar and the fact that the RMB, which has a large weight in the Australian dollar

S TAT E M E N T O N M O N E TA R Y P O L I C Y | AU G U S T 2017 2 5
Graph 2.20
20152013201120092007 201740
60
80
100
index
0.40
0.60
0.80
1.00
US$Australian Dollar
US$ per A$(RHS)
TWI(LHS)
Sources: Bloomberg; RBA
Capital FlowsThe difference between Australia’s saving and investment rates has narrowed markedly in recent years, such that the current account deficit (as a ratio to GDP) is around its lowest level since 1980 (Graph 2.21). The trade surplus increased further in the March quarter, owing to higher resource export revenues from the increase in commodity prices in late 2016 and early 2017. This was partly offset by a widening in the net income deficit (NID), which comprises payments made on Australia’s net foreign liabilities. Some part of the widening of the NID followed the increase in profits of the mining sector – which is majority foreign owned – that led to larger payments to the foreign owners in the form of dividend payments or reinvested earnings.
Consistent with the small current account deficit, there were only modest net capital inflows into Australia in the March quarter relative to history (Graph 2.22). Net inflows to the public sector and to private non-financial corporations were mostly offset by outflows from the financial sector, as banks repaid foreign-held debt. Over recent years, declining net capital flows into
Table 2.4: Changes in the Australian Dollar against Selected Currencies
Per cent
Over 2016
2017 to date
US dollar –1 11Indonesian rupiah –3 9Chinese renminbi 6 7South African rand –12 7Malaysian ringgit 3 6Swiss franc 1 5Japanese yen –4 5Singapore dollar 1 4Indian rupee 1 4Canadian dollar –4 4UK pound sterling 18 3New Zealand dollar –3 3South Korean won 1 3Thai baht –2 3European euro 2 –2Trade-weighted index 2 5Sources: Bloomberg; RBA
trade- weighted index, has moved more closely with the US dollar than have many other currencies this year. Nevertheless, the Australian dollar has appreciated against other currencies as well, with the euro being a notable exception.
Graph 2.21Current Account Balance
Per cent of nominal GDP
-4
0
%
-4
0
%Current account balance
2005199319811969 2017-8
-4
0
%
-8
-4
0
%Trade balance
Income balance
Sources: ABS; RBA

R E S E R V E B A N K O F AU S T R A L I A2 6
Australia have reflected a gradual reduction in inflows to the mining sector. This follows the gradual transition of a number of large liquefied natural gas projects from the investment phase (which had been largely funded offshore) to the production and export phase. R
Graph 2.22
2013200920052001 2017-10
-5
0
5
10
%
-10
-5
0
5
10
%
Australian Capital FlowsNet inflows, per cent of GDP
Net capitalflows
Public sector*
QuarterlyAnnual
Private financial sector**
Private non-financialsector
* Excludes official reserves and other RBA flows** Adjusted for US dollar swap facility in 2008 and 2009Sources: ABS; RBA

S TAT E M E N T O N M O N E TA R Y P O L I C Y | AU G U S T 2017 27
Box B
Recent Developments in Chinese Financial Regulations
Chinese regulators have recently announced a range of measures to reduce leverage, improve transparency and strengthen risk management practices in the financial system. This follows a Chinese Government directive issued late last year to curb financial risks, and builds on earlier efforts to address high-risk activities. The regulatory measures are wide-ranging and entail a degree of coordination across agencies. Consistent with this, President Xi recently announced the establishment of a Financial Stability and Development Committee to improve coordination among financial regulators. Many of the regulatory measures expand on existing rules and enforce them more tightly, although some are yet to be implemented (including because the details are yet to be finalised for some measures).
A key aim of the regulatory agenda is to reduce the extent to which small and medium-sized banks borrow funds in short-term wholesale markets to invest in, or channel funds to, non-bank financial institutions (NBFIs), such as asset management companies.1 NBFIs use the funds to provide loans, which are typically directed towards more risky borrowers than traditional bank loans or to purchase domestic financial assets (Figure B1). Regulators are targeting three aspects of this behaviour, which are interrelated, by: limiting new ‘channel investments’; improving transparency and risk management of some riskier financial products; and discouraging the reliance on short-term wholesale funding.
1 NBFIs operate across the financial sector and tend to face less onerous regulatory requirements than banks.
Limiting New Channel InvestmentsChinese regulators are targeting channel investing because of concerns that it contributes to an increasingly opaque and interconnected financial system. Channel investing refers to the practice whereby banks distribute funds through another financial institution or asset management product (AMP). AMPs capture a broad range of financial products, marketed by, or in coordination with, a bank or NBFI. They offer the holder the right to the income stream from underlying assets. Channel investing enables banks to: (i) circumvent restrictions on providing funding to specific sectors of the economy; (ii) exceed credit growth restrictions; (iii) take speculative positions in financial
Figure B1: Stylised Example of Practice Targeted by Regulators
Short-term wholesale funding
Banks
Non-bank financial institutions
Loans Domestic bonds and equities
Source: RBA

R E S E R V E B A N K O F AU S T R A L I A28
markets; and/or (iv) reduce capital and loan-loss provisioning.2 Channel investing is often complex and lacks transparency. It can involve multiple investments across layers of intermediaries and AMPs are often sold in tranches that have varying levels of subordination (with different credit ratings). Small and medium-sized banks have used this approach to expand their balance sheets significantly in recent years; for example, banking system claims on NBFIs have risen more than six-fold since 2012, to be around 20 per cent of total assets at the end of 2016.
In response, the China Banking Regulatory Commission (CBRC) instructed banks to conduct internal reviews and monitor their existing channel investments in early 2017. Banks were already required to treat loan-like assets as loans for capital and provisioning purposes, but the recent guidance sought to enforce this requirement more rigorously. This stricter enforcement of existing regulations, together with new proposed measures that restrict banks’ off-balance sheet and affiliated entities from investing in other off-balance sheet entities, are expected to reduce the extent of new channel investments. The People’s Bank of China (PBC) has also made its new macroprudential assessment (MPA) framework more stringent by including banks’ off-balance sheet assets in their credit assessment.3
Improving Transparency and Risk Management of AMPsRegulators are also trying to improve the transparency of AMPs and strengthen the risk management practices of NBFIs (which typically
2 For further details, see RBA (2016), ‘Box A: Recent Growth of Small and Medium-sized Chinese Banks’, Financial Stability Review, October, pp 14–16.
3 The MPA groups banks into various risk categories based on capital adequacy ratios, leverage ratios and liquidity coverage; a bank’s risk category affects some prudential requirements and can influence the availability and price of PBC liquidity.
manage AMPs). AMPs have several features that contribute to their underlying risk. In particular, managers of AMPs and their investors have little incentive to ensure that investments are prudent because there is a widespread perception that banks will guarantee returns. The limited visibility of the underlying exposure – exacerbated by the practice of AMPs investing in other AMPs – also means that retail investors would find it difficult to monitor the ultimate investments.
Regulators have proposed that AMPs that are not on a bank’s balance sheet will no longer be able to offer a guarantee that principal and interest will be returned and will have stricter reporting requirements. Other proposals include: imposing a cap on the leverage of the most popular types of AMPs to mitigate regulatory arbitrage (previously different limits had existed depending on the type of sponsor of the AMP); requiring higher provisioning; and banning investment in non-standard assets.
Discouraging Reliance on Wholesale FinanceFinally, regulators have targeted the growing reliance on short-term wholesale financing by small and medium-sized banks (Graph B1). Some of these banks obtain short-term funding from the large state-controlled banks, partly by issuing tradeable debt instruments, such as negotiable certificate of deposits (NCDs). These funds are often used to finance channel investments, resulting in increased rollover risk and interconnectedness among financial institutions.
In response to growing risks in wholesale funding markets, the PBC has facilitated an increase in money market rates since August 2016 in order to dampen activity in these markets. Also, the CBRC is assessing banks’ wholesale (interbank) funding practices more stringently with the interbank liabilities cap of a third of total liabilities

S TAT E M E N T O N M O N E TA R Y P O L I C Y | AU G U S T 2017 29
reportedly expanded to include NCDs from late 2018. On the asset side, the CBRC has restricted interbank lending to less than 50 per cent of Tier 1 capital to limit large banks’ direct exposure to smaller banks. Some of the large state-owned banks appear to have net interbank lending close to, or above, the proposed capital ceiling.
Response to RegulationsBanks have started reducing their use of channel investments ahead of their internal reviews, as shown by the sharp slowdown in the growth of banks’ claims on NBFIs (Graph B2). Reports suggest that with reduced access to funding, NBFIs have responded by reducing their holdings of financial assets, with corporate bond yields increasing and issuance declining as a result.
To date, the regulatory announcements appear to have had only a modest impact on the measured growth of broad credit, as captured by total social financing (TSF) (Graph B3). However, the TSF data do not capture some credit extended through channel investments, so they are likely to understate the slowing in the
growth of financial activity. This is especially the case given that the latest reforms are targeted at loopholes that have allowed these less regulated forms of credit to grow rapidly in recent years. R
Graph B1
Graph B2
Graph B3
Smaller banks*Large banks**
201420122010 20160
10
20
%
0
10
20
%
Wholesale Deposits at Chinese BanksAs a share of liabilities, end of calendar year
* Smaller bank data based on an unbalanced sample; includes onlycity and joint-stock banks** Includes five largest state-owned banks but excludes policy banks
Sources: RBA; S&P Global Market Intelligence
20152013201120092007 2017-20
0
20
40
60
%
-10
0
10
20
30
CNYtrBanks’ Claims on NBFIs
Stock(RHS)
(LHS)Year-ended growth
Sources: CEIC Data; RBA
Business financing*Household loans
2015201320112009 20170
10
20
30
40
%
0
10
20
30
40
%
China – Total Social FinancingContribution to six-month annualised growth
* Business financing is the sum of business loans, securities financingand off-balance sheet financing
Sources: CEIC Data; RBA

R E S E R V E B A N K O F AU S T R A L I A30
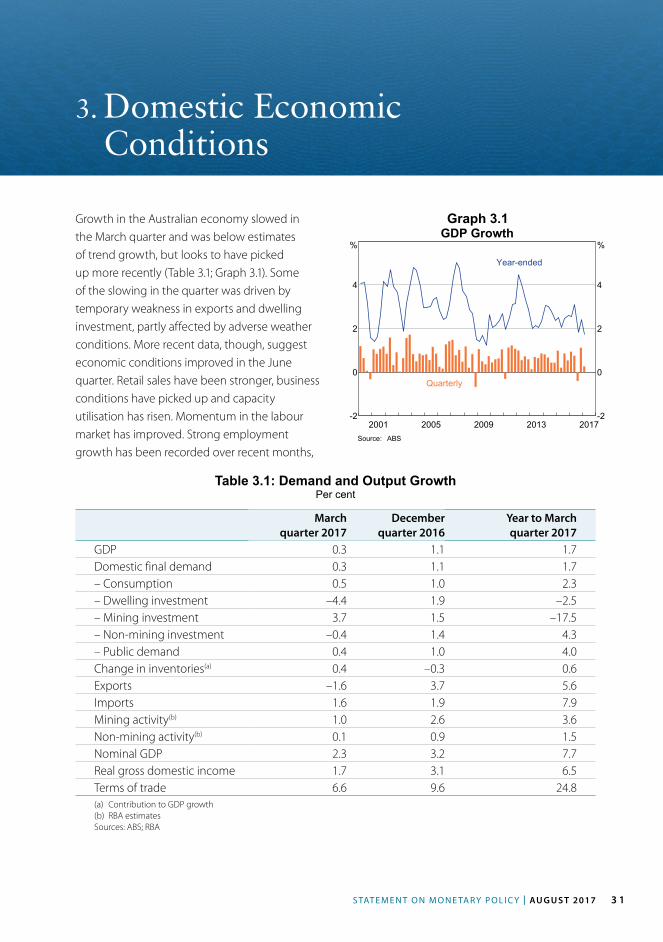
S TAT E M E N T O N M O N E TA R Y P O L I C Y | AU G U S T 2017 3 1
3. Domestic Economic Conditions
Growth in the Australian economy slowed in the March quarter and was below estimates of trend growth, but looks to have picked up more recently (Table 3.1; Graph 3.1). Some of the slowing in the quarter was driven by temporary weakness in exports and dwelling investment, partly affected by adverse weather conditions. More recent data, though, suggest economic conditions improved in the June quarter. Retail sales have been stronger, business conditions have picked up and capacity utilisation has risen. Momentum in the labour market has improved. Strong employment growth has been recorded over recent months,
Table 3.1: Demand and Output GrowthPer cent
March quarter 2017
December quarter 2016
Year to March quarter 2017
GDP 0.3 1.1 1.7Domestic final demand 0.3 1.1 1.7– Consumption 0.5 1.0 2.3– Dwelling investment –4.4 1.9 –2.5– Mining investment 3.7 1.5 –17.5– Non-mining investment –0.4 1.4 4.3– Public demand 0.4 1.0 4.0Change in inventories(a) 0.4 –0.3 0.6Exports –1.6 3.7 5.6Imports 1.6 1.9 7.9Mining activity(b) 1.0 2.6 3.6Non-mining activity(b) 0.1 0.9 1.5Nominal GDP 2.3 3.2 7.7Real gross domestic income 1.7 3.1 6.5Terms of trade 6.6 9.6 24.8(a) Contribution to GDP growth(b) RBA estimates Sources: ABS; RBA
Graph 3.1
2013200920052001 2017-2
0
2
4
%
-2
0
2
4
%GDP Growth
Year-ended
Quarterly
Source: ABS

R E S E R V E B A N K O F AU S T R A L I A3 2
although wage growth remains low by historical standards. Looking ahead, the economy is expected to strengthen, as the drag from mining investment continues to dissipate, supported by the low level of interest rates and the ongoing recovery in the global economy. In turn, the recovery in the domestic economy is expected to reduce the spare capacity in the labour market, which should produce a gradual lift in wage growth and inflation.
Economic conditions continue to vary across the states. The New South Wales and Victorian economies have performed most strongly in recent years, and there are signs that economic conditions are starting to stabilise or improve in the mining-exposed states of Queensland and Western Australia (Graph 3.2). State final demand remains weak in Western Australia, but the pace of contraction has slowed, and demand has been recovering in Queensland since early 2016. Employment has increased in these two states and surveyed measures of business conditions and confidence have risen.
Even though growth in the domestic economy slowed somewhat in the March quarter, nominal income growth was very strong, supported by a sizeable pick-up in the terms of trade.
Graph 3.2
2005199319811969 201720
30
40
50
60
%
20
30
40
50
60
%
Wages and Profits*Share of total factor income
Wages
Private profits
* Private profits include income of unincorporated enterprises; publicsector entity profits and income from ownership of dwellings not shown
Sources: ABS; RBA
Graph 3.3
Business profits increased by 25 per cent over the six months to the March quarter, largely reflecting increased profits in the mining sector. This has seen the share of national income going to profits increase sharply (Graph 3.3). On the other hand, the recent slow growth in wages has contributed to an offsetting fall in the labour share of income, which is around its lowest level in 50 years.
Mining Activity The adjustment after the mining boom to a lower level of mining investment is now well advanced; mining investment is expected to fall further over the next year or so, but the largest declines are in the past (Graph 3.4). Indeed, both the ABS capital expenditure (Capex) survey of investment intentions and Bank liaison point to smaller declines in mining investment over the period ahead. Much of the remaining decline is expected to be in liquefied natural gas (LNG) investment. Mining investment is then expected to stabilise as mining firms make new investments to maintain productive capacity.
The increase in resource export volumes over the past year was largely driven by an increase in LNG production; however, growth in resource
2013200920052001 2017-15
-10
-5
0
5
10
15
%
-15
-10
-5
0
5
10
15
%
State Final DemandYear-ended growth
Rest of Australia
WA
NSW and Vic
Sources: ABS; RBA

S TAT E M E N T O N M O N E TA R Y P O L I C Y | AU G U S T 2017 3 3
Graph 3.4Mining and Non-mining Activity
Year-ended growth, RBA estimatesMining*Mining*
0
10
20
%
0
10
20
%
Resource exports
Mining investment
Non-mining
201320092005 20170
2
4
6
%
0
2
4
6
%
* Net of mining-related imports; components are contributions toyear-ended mining activity growth; contribution from changes ininventories not shown
Sources: ABS; RBA
Graph 3.5Resource Export Volumes
20122007 20170
10
20
$b
Metal oresand minerals
Coke, coal and briquettes
20122007 20170
4
8
$b
Metals
Other mineral fuels(incl LNG)
Non-monetarygold
Source: ABS
exports could be lower than previously reported because of recent revisions to trade data (Graph 3.5). LNG exports are expected to grow strongly over the next couple of years as the productive capacity of existing projects ramps up and projects currently under construction start production; LNG exports are expected to contribute almost ½ percentage point directly to annual GDP growth. This is a little lower than previously expected because some projects are experiencing delays. Iron ore export volumes are expected to rise with further incremental increases in production expected from Australia’s low-cost producers over the next few years. Coal export volumes have also increased strongly over the past year or so. However, coal exports declined in the March quarter and are expected to have declined again in the June quarter after Cyclone Debbie damaged coal rail infrastructure in the Bowen Basin. The damaged infrastructure has since been restored to full capacity and coking coal exports are expected to return to pre- cyclone levels in the second half of 2017.
Although resource export volumes have risen since late 2015, the sizeable increase in bulk
commodity prices has been the main driver of the significant improvement in mining profitability. Information from the Bank’s liaison and company announcements has indicated that firms have generally used the additional income to pay down debt, pay dividends and increase share buybacks, rather than expand productive capacity through new investment. In part, this reflects the earlier expectation that commodity prices would not remain elevated; indeed, prices have declined from their high levels earlier in the year. At the margin, some mining firms have reportedly undertaken small-scale investments in machinery and equipment.
Household SectorAlthough household consumption growth slowed over the year to the March quarter, it is likely to increase somewhat in the period ahead. The slowing was broadly consistent with subdued growth in household income, such that the household saving ratio declined a little over the year (Graph 3.6). Recent indicators suggest a positive outlook for consumption growth over coming quarters (Graph 3.7). The value of retail sales grew in April and May, both across states and categories of spending, and employment growth has picked up recently. When combined

R E S E R V E B A N K O F AU S T R A L I A3 4
2014201120082005 2017-4
0
4
8
%
-4
0
4
8
%Retail Sales Growth
Values
Volume
Values
(year-ended)
(year-ended)
(monthly)
Sources: ABS; RBA
growth in these states. Demand for housing in Victoria has been supported by strong migration flows, both from overseas and from interstate, particularly from New South Wales and Western Australia (Graph 3.21). Nevertheless, there have been some signs that conditions in the Sydney and Melbourne markets have eased a little of late; housing price growth and auction clearance rates have declined from their recent highs, especially in Sydney (Graph 3.8; Graph 3.9). Housing prices have declined a little further in Perth, where population and household income growth remain weak. In Brisbane, ongoing large additions
Household Consumption and Income*Year-ended growth
0
5
10
%
0
5
10
%
Consumption
Real disposable income
Saving ratio
20122007200219971992 2017-5
0
5
10
%
-5
0
5
10
%
* Disposable income is after tax and interest payments; saving ratiois net of depreciation
Sources: ABS; RBA
Graph 3.6
Graph 3.8
Graph 3.9
Graph 3.7
Auction Market IndicatorsSeasonally adjustedClearance rates
60
80
%
60
80
%
Sydney
Melbourne
Volumes
2014201120082005 20170
2
4
’000
0
2
4
’000
Sources: APM; CoreLogic; RBA; REIV
with flat retail prices in the June quarter (see the ‘Inflation’ chapter), this points to solid growth in the volume of retail sales. Employment growth is expected to continue at a solid pace over the forecast period, which should support household income, even if the pick-up in wage growth is as gradual as expected. Low interest rates should continue to provide an impetus for households to spend, as would any further increases in net household wealth.
Conditions in the established housing market remain strongest in Sydney and Melbourne, which is consistent with better economic
2015201320112009 2017-15
0
15
%
-15
0
15
%
Housing Price GrowthSix-month-ended annualised, seasonally adjusted
Other capitalcities*
Sydney andMelbourne*
Perth
* Capital city dwelling stock weightedSources: ABS; APM; RBA

S TAT E M E N T O N M O N E TA R Y P O L I C Y | AU G U S T 2017 3 5
to the supply of new apartments have placed downward pressure on apartment price growth.
The value of housing loan approvals has decreased in the past few months, driven by a decline in investor approvals. The level of approvals is consistent with the easing in aggregate housing credit growth, and investor credit growth having slowed (see ‘Domestic Financial Markets’ chapter).
High housing prices in the largest cities have provided some impetus to both new dwelling construction and alterations and additions. Residential dwelling investment remains high, although it declined a little in the March quarter, primarily in Queensland and in New South Wales where construction activity appears to have been impeded by wet weather (Graph 3.10). High-density construction continues to account for a relatively high share of construction activity. Higher land prices have also supported the shift towards apartment construction over recent years, most notably in Sydney.
Building approvals have been significantly lower over the past nine months than they were over the preceding two years, particularly for higher-density housing in New South Wales and Queensland (Graph 3.11). The decline in building approvals is likely to reflect a number of factors. Liaison with developers indicates that demand for off-the-plan apartments in the major east-coast cities has moderated in recent months, partly reflecting weaker demand from foreign buyers. Developers’ access to bank finance has also tightened over the past year or so, particularly in geographic regions at risk of oversupply, such as the Brisbane apartment market. In contrast, demand for greenfield land, which is usually used for detached housing and medium-density developments, has been robust, particularly in Melbourne. Related to this, demand for new detached homes also
reportedly remains strong in Melbourne and Sydney; reports from Brisbane have been more mixed. In Perth, enquiries about new detached dwellings have picked up recently. Although this has not yet translated into higher sales, it suggests confidence in the Perth market for new detached houses is improving.
Despite the decline in building approvals, the pipeline of work already approved or underway remains close to historically high levels, so dwelling investment is likely to be maintained at a high level for the next year or so, before declining slowly. Assuming that approvals remain
Dwelling InvestmentChain volume
By type
2013 20170
2
4
6
8
$bDetached
Higher-density
Alterations &additions
Mainland states
2013 20170
2
4
6
8
$b
NSW
WA
SA
Vic
Qld
Source: ABS
Graph 3.10
Private Residential Building ApprovalsThree-month moving average
New South Wales
1 000
2 000
3 000
4 000no
Higher-density
Victoria
1 000
2 000
3 000
4 000no
Queensland
20132009 20170
600
1 200
1 800
2 400no Western Australia
20132009 20170
600
1 200
1 800
2 400no
Detached
Sources: ABS; RBA
Graph 3.11

R E S E R V E B A N K O F AU S T R A L I A3 6
around current levels, this implies that the pipeline of work will decline over the forecast period. Given that apartment projects typically take at least three times longer to complete than detached houses, the decline in dwelling investment may be more gradual than has been the case in the past.
Rental vacancy rates in most capital cities have remained around their long-run average levels because stronger population growth has absorbed the significant increase in supply of housing in recent years (Graph 3.12). Rental inflation has stabilised at rates a little lower than suggested by the historical relationship with the vacancy rate. Conditions remain weakest in Perth, where the vacancy rate is more than double the average of other capital cities, population growth has been slow and rents have been falling for the past two years.
broad based across all levels of government. This has been supported by some large infrastructure projects, most notably in New South Wales and Victoria, and these should continue to contribute to economic growth over the forecast period. The amount of work yet to be done on public infrastructure projects (which have commenced construction) has increased steadily over the past two years to be at its highest level in some time (Graph 3.14). Recently released state budgets suggest public investment will be slightly higher over the next financial year than suggested by previous estimates. On top of this, empirical evidence and information from the Bank’s liaison suggests that public infrastructure spending generates positive spillovers to private investment.
Non-mining Business SectorNon-mining business investment has been gradually trending up for a number of years, but was little changed in the March quarter. In New South Wales and Victoria, there has been reasonably robust growth in recent years, consistent with the better economic growth in these states. Economic conditions have generally
20152013201120092007 2017-4
0
4
8
ppt
-4
0
4
8
ppt
Public DemandContributions to year-ended growth
Total(per cent)
Public consumption
Public investment*
* Adjusted for second-hand asset transfers between the public andother sectors
Sources: ABS; RBA
Graph 3.12
Graph 3.13
Rental MarketSeasonally adjusted
CPI rents growth*
20132009 2017-10
0
10
%
Sydney andMelbourne**
Other capitalcities**
Vacancy rates
20132009 20170
3
6
%
Perth
* Six-month-ended annualised** Capital city dwelling stock weighted; vacancy rates exclude Adelaidefrom March 2015, Hobart and Darwin
Sources: ABS; RBA; REIA
Government SectorPublic spending has picked up in recent years, both in terms of consumption and investment expenditures, providing some support to the domestic economy (Graph 3.13). The increase in public investment growth has been relatively

S TAT E M E N T O N M O N E TA R Y P O L I C Y | AU G U S T 2017 3 7
in the past few months. The NAB survey measure of investment intentions for the year ahead has also improved a little over the past year.
Non-resource exports have continued to contribute strongly to economic growth (Graph 3.16). Service exports made a significant contribution to GDP growth over the past year, largely driven by education and tourism exports. Rural exports grew strongly, following the record winter harvest, while manufactured exports declined.
improved recently in the other states, as has been reflected in a marked step-up in survey measures of business conditions (Graph 3.14). The spillover effects of falling mining investment to other sectors of the economy continue to diminish.
Business IndicatorsBusiness conditions*
-18
0
18
index
Rest of Australia
NSW and VicExpected capital expenditure
-20
0
20
ppt
NAB survey**
Non-residential approvals
20122007 20170.0
1.5
3.0
4.5
$b Work yet to be donePer cent of quarterly GDP
20122007 20171.5
3.0
4.5
6.0
%
Public infrastructure
Private building***
* Net balance; three-month moving average** Expectations for the year ahead; deviation from long-run average*** Non-residentialSources: ABS; NAB; RBA
Non-mining Capital Expenditure*Nominal
Machinery & equipmentMachinery & equipment
12 /1307 /08 17 /180
30
60
$b
Capex surveyEstimates
Buildings & structuresBuildings & structures
12 /1307 /08 17 /180
30
60
$b
Nationalaccounts
* Estimates are firms' expected capital expenditure, adjusted for pastaverage differences between expected and realised spending
Sources: ABS; RBA
Graph 3.14
Graph 3.15
Forward-looking indicators of non-mining business investment continue to be mixed. Investment intentions in the ABS Capex survey suggest that non-mining investment is unlikely to pick up substantially over the next year or so (Graph 3.15). The stock of private non- residential building work yet to be done also remains at a low level, following the completion of predominantly office and health-related buildings. But the Capex survey only covers around one-half of non-mining investment captured by the more comprehensive national accounts measure and investment by certain service industries that are not covered by the survey has been rising more strongly recently. In contrast to the Capex survey, survey measures of capacity utilisation have increased over the past year, particularly for goods-producing firms, which could be expected to lead investment, or even coincide with it. Non-residential building approvals have picked up
Graph 3.16Non-mining Exports
Contributions to year-ended GDP growth
20132009 2017-1.0
-0.5
0.0
0.5
ppt
Net services
20132009 2017-1.0
-0.5
0.0
0.5
ppt
Rural
Manufactured
Sources: ABS; RBA

R E S E R V E B A N K O F AU S T R A L I A3 8
Labour MarketConditions in the labour market have improved since late 2016, supporting other evidence of better economic conditions over the past few quarters and pointing to stronger growth in aggregate household incomes. A pronounced pick-up in employment growth was recorded in the June quarter and was driven entirely by full-time employment (Graph 3.17). The increase in full-time employment growth over the first half of 2017 follows no growth over 2016 and has contributed to the recent sharp increase in total and average hours worked. The participation rate has also increased since late 2016 as conditions have strengthened (Graph 3.18). The participation rate remains below its previous peaks, which is partly the result of the gradual ageing of the population.
The unemployment rate fell in the June quarter by a little more than had been anticipated at the time of the previous Statement, to be 5.6 per cent. Despite this improvement in conditions, there is still spare capacity in the labour market that is yet to be absorbed. The unemployment rate remains around ½–¾ percentage point above the Bank’s estimate of full employment.1 Another
1 See Cusbert T (2017), ‘Estimating the NAIRU and the Unemployment Gap’, RBA Bulletin, June, pp 13–22.
Graph 3.18Labour MarketSeasonally adjusted
20132009 20173
5
7
9
%
Underutilisation rate*
Unemployment rate**
20132009 201759
61
63
65
%
Participation rate
Employment to working-agepopulation ratio
* Hours-based measure** Trend unemployment in dark blueSource: ABS
Graph 3.17Labour MarketEmployment growth
Year-ended
0
3
6
%
0
3
6
%Part-time
Full-time
Hours worked2008 average = 100
2015201320112009 201794
100
106
index
94
100
106
index
Total
Average
Sources: ABS; RBA
measure of spare capacity in the labour market is the hours-based underutilisation rate, which measures the additional hours sought by workers (including those currently unemployed) relative to the total number of hours that workers would like to work. This measure tends to show the same pattern as the unemployment rate, although the gap has widened recently as the share of part-time workers has increased.
Employment growth remains strongest in the service industries. In particular, health & social assistance employment has increased notably over recent years and now accounts for around 13 per cent of total employment, up by 3 percentage points from a decade ago (Graph 3.19). The strength in health employment over recent years has largely been in medical & other healthcare services and, to a lesser extent, in aged care. The rollout of the National Disability Insurance Scheme over the next few years will continue to boost employment in the health & social assistance industry. Education employment has also steadily increased in recent years. Major public infrastructure projects and the large pipeline of residential investment continue to support construction employment.

S TAT E M E N T O N M O N E TA R Y P O L I C Y | AU G U S T 2017 3 9
Graph 3.19
Graph 3.20
Graph 3.21Employment by Industry*
Cumulative change since 2007
20132009 2017-200
0
200
400
’000
MiningConstruction
Manufacturing
Retail trade
20132009 2017-200
0
200
400
’000
Health & socialassistance
Professional,scientific & technical
Education
* ABS trend measureSources: ABS; RBA
Employment-to-population Ratio by StateSeasonally adjusted
20112005 201750
55
60
65
%
NSW
Vic
WA
20112005 201750
55
60
65
%
Qld
SA
Tas
Sources: ABS; RBA
Net Interstate MigrationContribution to year-ended state population growth
2006 2016-1.0
-0.5
0.0
0.5
1.0
ppt
NSW
Vic
2006 2016
WA
Qld
2006 2016-1.0
-0.5
0.0
0.5
1.0
ppt
SA
Tas
Sources: ABS; RBA
Employment growth has been strongest in Victoria over the year (Graph 3.20). However, growth in employment has picked up in New South Wales recently following subdued growth over the previous year. Dwelling and infrastructure investment have helped boost employment in these states. Higher migration flows, both from interstate and overseas, have contributed to strong population growth in Victoria (Graph 3.21). This, in turn, has contributed to higher demand for household services such as health. Employment conditions in the mining-exposed states have also improved since
late 2016, with a particularly marked turnaround in full-time employment in Western Australia. As part of the adjustment following the booms in the terms of trade and mining investment, people have migrated out of Western Australia to the eastern states.
Forward-looking indicators of labour demand continue to point to solid growth in employment over the second half of 2017 (Graph 3.22). Job vacancies data suggest that labour demand is strongest in the household services sector.
Graph 3.22Labour Market Indicators
Per cent of labour force
20132009 20170.5
1.0
1.5
2.0
2.5
%
Advertisements
Vacancies*(ABS)
Advertisements(ANZ)
(Department ofEmployment)
Employment intentions**NAB survey
20132009 2017-45
-30
-15
0
15
ppt
3 months ahead
* This survey was suspended between May 2008 and November 2009** Net balance of employment intentions for the following period;deviation from average
Sources: ABS; ANZ; Department of Employment; NAB; RBA

R E S E R V E B A N K O F AU S T R A L I A4 0
growth. That said, business surveys point to some decline in the availability of suitable labour, and liaison evidence suggests that incidences of labour shortages, while not prevalent, are broadening out across some industries in the eastern states.
The Australian experience of low wage growth is common with a number of advanced economies, including some with tight labour markets. This common experience could point to similar factors weighing on wage growth across a range of countries, including reduced
Graph 3.24
20112006200119961991 20164
8
12
%
4
8
12
%
Job MobilityShare of employed who changed employer in past year
Sources: ABS; RBA
Graph 3.23
201320092005200119971993 2017-2
0
2
4
6
8
%
-2
0
2
4
6
8
%
Labour CostsYear-ended growth
Wage price index*
Average earnings per hour
* Total pay excluding bonusesSources: ABS; RBA
Labour CostsWage growth is low across a range of measures. The wage price index (WPI) grew by a little less than 2 per cent over the year to March (Graph 3.23). Growth in average earnings from the national accounts (AENA) is around its lowest level since the early 1990s.2 There has been modest growth in real wages over recent years. Liaison contacts suggest that low outcomes for inflation in recent years have helped employers secure lower wage outcomes. But headline inflation has picked up recently and could therefore feed into higher wage growth as spare capacity diminishes.
There are a number of potential reasons for the low wage growth in Australia. Spare capacity in the labour market may have meant that employees have been more willing to accept lower wage growth. Low wage growth, particularly in mining and mining-exposed industries, has also been part of the adjustment to the earlier decline in the terms of trade and falling mining investment. Measures of perceived job security are relatively low, which may also mean that workers are less inclined to seek larger wage increases.
Data published by the ABS suggest the share of workers changing employers has declined to around its lowest in recent decades (Graph 3.24). Less switching between employers is also likely to be related to lower wage growth. This is because when workers voluntarily move between jobs, they generally receive a higher salary in their new role; indeed, this is likely to be a motivating factor behind much switching. There is also a demand-side effect if fewer firms are attempting to attract workers from other firms. All of this is consistent with subdued wage
2 AENA, which is more volatile than the WPI, is also wider in scope because it includes non-wage costs and the impact of any changes to the composition of the workforce.

S TAT E M E N T O N M O N E TA R Y P O L I C Y | AU G U S T 2017 4 1
bargaining power of workers, for example, as a result of increased global competition in labour and product markets.
Wage growth remains relatively low across all industries and states, although growth is particularly soft in business-service industries and in mining (Graph 3.25). The slowing in wage growth in business-service industries such as professional, scientific & technical and rental, hiring & real estate may partly reflect their exposure to the end of the mining investment boom. Liaison reports suggest there are some signs of stronger wage growth in some occupations within business-service industries that are experiencing labour shortages; these include selected IT roles and some construction-related engineering jobs. Household services wage growth has also slowed in recent years. A relatively large share of workers in these industries have their wages determined in enterprise bargaining agreements (EBAs); the slowing in wage growth is consistent with many of these EBAs rolling over to lower wage increases over the past couple of years, a trend that continued into the March quarter. The slower growth in public sector EBAs is also consistent with the caps placed on public sector wage growth by state governments.
Information from the Bank’s liaison program suggests that private sector wage growth will be broadly unchanged over the year ahead. The Fair Work Commission’s decision to raise minimum and award wages by 3.3 per cent, effective from 1 July, will support wage growth in the September quarter and beyond (see ‘Box C: Minimum Wage Decision’). R
Graph 3.25
2014201120082005 20171
2
3
4
%
1
2
3
4
%
Wage Price Index GrowthYear-ended
Goods-relatedHouseholdservices
Businessservices
Sources: ABS; RBA

R E S E R V E B A N K O F AU S T R A L I A42
In Australia, the Fair Work Commission (FWC) determines the national minimum wage, as well as the minimum wage and entitlements for workers in specific industries and occupations (known as ‘awards’).1 At its recent annual wage review, the FWC announced a 3.3 per cent increase in the national minimum wage (to $18.29 per hour) and minimum wages across all awards (Graph C1).
This increase was higher than in recent years. The FWC noted that there was scope for a larger increase because overall wage growth has been subdued for several years and the unemployment rate has been relatively stable of late. The FWC also noted that the larger increase in award wages would support the relative living standards of low-paid workers. Furthermore, the FWC has strengthened its view that ‘modest and regular’ award wage increases do not reduce the number of existing jobs with award conditions.
Nearly one-quarter of all employees, accounting for around 15 per cent of the national wage bill, are covered by awards (Graph C2). The increase in wages for these workers took effect on 1 July. As a result, the increase in the minimum wage and award wages will directly contribute around 0.5 percentage points to annual growth in the aggregate wage price index (WPI) in the September quarter.
1 In contrast, collective agreements are bargained between an employer and a group of employees or a union on their behalf. Individual arrangements are made directly between the employer and the employee.
Graph C1
Graph C2
Box C
Minimum Wage Decision
201320092005 20170
2
4
%
0
2
4
%Award Wage Increase*
Minimum wage
Average award wages
* RBA calculations; the time period over which each increase appliesvaries
Sources: Australian Fair Pay Commission; Australian Industrial RelationsCommission; FWC; RBA
201220082004 20160
10
20
30
40
%
0
10
20
30
40
%
Wage-setting MethodsShare of employees
Collective agreements
Awards
Individual arrangements*
* Includes owner managers of incorporated businessesSources: ABS; RBA

S TAT E M E N T O N M O N E TA R Y P O L I C Y | AU G U S T 2017 43
This is larger than the average direct contribution of 0.3 percentage points since 2010. The larger contribution in 2017 reflects both the higher wage increase and the higher share of workers whose wages are determined by the FWC’s decision. Since 2010, the share of workers covered by awards has increased steadily and across most industries. Over the same period, collective agreements (primarily Enterprise Bargaining Agreements) have become less prevalent, while the share of workers covered by individual arrangements has remained broadly steady. Award coverage is highest in some service industries and retail trade (Graph C3).
Workers on awards tend to earn less per hour than workers who have their pay set by other methods, both in aggregate and within industries (Graph C4). Non-managerial workers on awards earn around $10 less per hour, on average, than non-managerial workers on collective agreements or individual arrangements. Furthermore, workers on awards make up a large share of part-time and casual employment and, as a result, they often work fewer hours and earn less overall than other workers.
The increase in award wages is also expected to flow on to some other workers who are not covered by awards. Wage increases of close to one-fifth of employees are linked to changes in award wages through conditions specified in their collective agreements or individual arrangements. This could contribute a further ¼–½ percentage point to growth in the WPI over coming quarters, although the size and timing of these effects is highly uncertain. R
Graph C4
Graph C3
0 20 40 60 80 %Information & telecommunications
UtilitiesProfessional, scientific & technicalTransport, postal & warehousing
Wholesale tradeManufacturing
Public administration & safetyConstruction
Education & trainingArts & recreation
Rental, hiring & real estateHealth care & social assistance
Other servicesRetail trade
Administrative & supportAccommodation & food services
Method of Setting Pay*Per cent of industry employees, 2016
Awards Collective agreements Individual arrangements
* Non-managerial employeesSources: ABS; RBA
2012200820042000 201610
20
30
$
10
20
30
$
Average Hourly EarningsBy wage-setting method, non-managerial employees
Collective agreements
AwardsIndividual
arrangements
Sources: ABS; RBA

R E S E R V E B A N K O F AU S T R A L I A44

S TAT E M E N T O N M O N E TA R Y P O L I C Y | AU G U S T 2017 4 5
4. Domestic Financial Markets
Australian financial markets have been relatively stable over recent months. The cash rate target has remained at 1.5 per cent since last August. Financial market prices suggest that it is expected to be unchanged over the remainder of the year, with some expectation of an increase by mid next year. Australian government bond yields have increased a bit but remain at low levels. Conditions for obtaining funding remain very favourable for banks and non-financial corporations, with spreads of corporate bond yields to government bonds remaining at low levels. Growth in business debt has been subdued. Housing credit growth has been stable in recent months; investor credit growth declined, but this was largely offset by an increase in credit extended to owner-occupiers. The major banks have announced further increases to lending rates for interest-only loans, primarily in response to measures introduced by the financial regulators to reinforce sound housing lending practices. The share of new loans that are interest only has declined. Equity prices in Australia have underperformed relative to those in global markets in recent months, driven by the banking sector.
Money Markets and Bond YieldsThe Reserve Bank has maintained the cash rate target at 1.5 per cent since August last year. Rates on overnight indexed swaps (OIS) imply that the cash rate is expected to remain unchanged over the remainder of this year, with some expectation of a 25 basis point increase in the cash rate priced in by mid next year (Graph 4.1).
Graph 4.1
2014201020062002 20181
2
3
4
5
6
7
%
1
2
3
4
5
6
7
%Cash Rate*
* Data from September 2017 onwards are expectations derived frominterbank cash rate futures
Sources: ASX; Bloomberg
Bank bill rates have declined over recent months, with spreads on 3- and 6-month bank bills relative to OIS rates narrowing to their lowest level since 2015 (Graph 4.2). This reduction in the cost of domestic short-term bank funding is likely to partly reflect developments in offshore markets, where the cost of short-term funding has also declined relative to risk-free rates.
Short-term interest rates in the repurchase agreement (repo) market have also declined over recent months, although they remain high relative to OIS rates. The wide spread of repo rates over OIS rates reflects heightened demand for secured funding from market participants, particularly non-residents, and appears to be related to developments in the foreign exchange swap market and the bond futures market.1 In particular, in the foreign exchange swap market, Australian
1 For more information, see Becker C, A Fang and J C Wang (2016), ‘Developments in the Australian Repo Market’, RBA Bulletin, September, pp 41–46.

R E S E R V E B A N K O F AU S T R A L I A4 6
2014 20162015 20170
10
20
30
40
50
bps
0
10
20
30
40
50
bps
Bank Bill SpreadsSpread to overnight indexed swaps
1-month
3-month
6-month
Sources: ASX; Tullett Prebon (Australia)
Graph 4.2
dollars can be lent against yen at a relatively high implied Australian dollar interest rate; as a result, some investors have been borrowing Australian dollars under repo to use them for such foreign exchange swap transactions. The recent decline in the spread of repo rates has coincided with a decline in the Australian dollar interest rate implied by foreign exchange swaps.
Yields on 10-year Australian Government Securities (AGS) have increased over recent months to be back around their levels at the start of the year (Graph 4.3). The spread between the 10-year AGS and US Treasury yields has increased a little but remains close to its lowest level since 2001. Demand for AGS remains strong and recent bond tenders have been well received.
The stock of outstanding semi-government bonds was little changed over 2016/17 at around $240 billion, as issuance by Western Australia was offset by maturities from New South Wales. Over 2017/18, the stock of semi-government bonds outstanding is expected to increase to $250 billion.
After a strong start to the year, the issuance of bonds by non-residents in the domestic market (‘Kangaroo’ issuance) has been subdued over the past few months. Issuance was primarily
Graph 4.3Government Bond Yields
10-year
2
4
6
%
2
4
6
%Australia
United States
2013200920052001 2017-1
0
1
2
ppt
-1
0
1
2
ppt
Differential
Sources: Bloomberg; RBA
from supranational agencies and offshore banks. Secondary market spreads of AAA-rated Kangaroo bonds to AGS have remained stable over the past few years, although they have edged somewhat lower of late.
Financial IntermediariesDomestic deposits account for the largest share of bank funding, with the share rising over the past year to around 60 per cent (Graph 4.4). Growth in deposits has been accounted for by transaction and term deposits. Both of these types of deposits are considered to be relatively stable sources of funding under the Net Stable Funding Ratio (NSFR) requirement, which will take effect from the beginning of 2018. The major banks have indicated that their NSFRs have increased over the past year and are above the regulatory minimum.
The cost of the major banks’ outstanding deposit and wholesale debt funding is estimated to have declined a little this year. Interest rates on term deposits and savings accounts have declined, and the average cost of term deposits is expected to decline a little further, reflecting the maturity of deposits that were entered into at higher interest rates last year. Conditions in

S TAT E M E N T O N M O N E TA R Y P O L I C Y | AU G U S T 2017 4 7
wholesale debt markets remain favourable for banks, with the cost of issuing new long-term debt at historically low levels and the cost of short-term wholesale debt declining in recent months (Graph 4.5). The major banks’ outstanding wholesale debt funding costs have declined over the year, and this is expected to continue as more expensive wholesale debt is replaced by new issuance at a lower cost.
The implied spread between lending rates and debt funding costs for the major banks is estimated to have increased over the past year. Most of this increase was a result of higher interest rates on investor and interest-only housing lending. Lower funding costs have also contributed to the increase in the implied spread.
As has generally been the case in recent years, bond issuance by the banks has replaced maturities so that there has been little net issuance (Graph 4.6). Secondary market yields on bank bonds and spreads to benchmark rates have been little changed in recent months and remain around their lowest levels since 2014 (Graph 4.7). Market conditions remain favourable for bank bond issuance, with some of the major banks recently issuing sizeable 30-year
Graph 4.4
2014201120082005 20170
10
20
30
40
50
60
%
0
10
20
30
40
50
60
%
Funding Composition of Banks in Australia*Share of total funding
Securitisation
Long-term debt
Domestic deposits
Short-term debt**
Equity
* Adjusted for movements in foreign exchange rates; tenor of debt isestimated on a residual maturity basis** Includes deposits and intragroup funding from non-residents
Sources: APRA; RBA; Standard & Poor’s
Graph 4.5Major Banks’ Wholesale Debt Cost*
Short-term
20132009 20170
2
4
6
8
%
Marginal
Outstanding
Long-term
20132009 20170
2
4
6
8
%
* RBA estimates; rates do not include interest rate hedgesSources: Bloomberg; RBA
Graph 4.6Bank Bond Issuance
Gross issuance
M J S D0
40
80
120
$b Net issuance
Range (2010–16)
M J S D-50
-25
0
25
$b
2016
Average (2010–16)
2017
Source: RBA
Graph 4.7Major Banks’ Bond Pricing
3–5 year residual maturity, Australian dollar bonds
Yields
20132009 20171
4
7
%
AGS
Swap
Unsecured
Bank bond spreads
20132009 20170
100
200
bps
Spreadto AGS
Spread to swap
Sources: Bloomberg; UBS AG, Australia Branch

R E S E R V E B A N K O F AU S T R A L I A4 8
bonds into the US market, continuing a trend of lengthening tenors for bond issuance.
Issuance of residential mortgage-backed securities (RMBS) has continued at the pace seen since late last year, which is markedly stronger than in the previous year (Graph 4.8). Spreads on these securities to benchmark rates have declined to around the levels that prevailed in 2015. The characteristics of the mortgages underlying these securities have been of similar quality to previous RMBS deals issued in Australia.
Over recent months, the ratings of many Australian financial institutions have been downgraded by credit rating agencies. Ratings agencies indicated that the accumulation of debt in the household sector was a significant factor in their decisions. In late May, Standard & Poor’s downgraded 23 Australian medium-size and smaller financial institutions, while affirming the ratings of the major banks and Macquarie Bank. In June, Moody’s also downgraded the ratings of 12 Australian banks, including the major banks. This generally moved the bank ratings of the major credit rating agencies into alignment, with all major banks now holding an AA– rating and most regional banks holding a rating in the A or BBB range. These ratings changes appear to have had little effect on bank bond spreads.
In July, the Australian Prudential Regulation Authority (APRA) announced increases in required capital ratios for the Australian banking sector to be considered ‘unquestionably strong’. The four major Australian banks will need to have capital ratios (based on common equity Tier 1 (CET1)) of at least 10.5 per cent by 1 January 2020. APRA reported that the major banks will need to increase their capital ratios, on average, by around 100 basis points from the levels at the end of 2016. APRA estimates that the major banks should be able to generate this additional capital by retaining profits, without
Graph 4.8Australian RMBS
Issuance* Major banksOther banksNon-banks
10
20
$b
10
20
$b
Primary market pricing**
2014201120082005 20170
100
200
300
bps
0
100
200
300
bps
Bank conforming deals
Non-conforming dealsNon-bank conforming deals
* Latest quarter issuance to date** Face-value weighted monthly average of the primary market spreadto bank bill swap rate
Source: RBA
significantly altering their business growth plans or dividend policies, and without undertaking further equity raisings. For other ADIs, the increase in capital requirements will be around 50 basis points, but most of these ADIs already hold well in excess of the new requirements. Later this year, APRA intends to release more details on its implementation of forthcoming Basel III changes to risk weights as well as measures relating to ADIs’ substantial exposures to residential mortgages.
In the 2017/18 budget, the Australian Government announced a Major Bank Levy. ADIs with liabilities of at least $100 billion are now subject to a 6 basis point levy on around three-quarters of their liabilities. The government estimates that the tax will raise around $6.2 billion over four years, which is equivalent to around 5 per cent of current profits of the affected banks.
Financial AggregatesTotal credit grew by around 5 per cent over the past year. Housing credit growth has been steady while business credit has grown modestly (Graph 4.9). Broad money has grown a little faster than total credit (Table 4.1).

S TAT E M E N T O N M O N E TA R Y P O L I C Y | AU G U S T 2017 4 9
Table 4.1: Financial AggregatesPercentage change(a)
Three-month ended Year-endedMar 2017 June 2017 June 2017
Total credit 0.9 1.5 5.4– Housing 1.7 1.6 6.6 – Owner-occupier 1.5 1.6 6.2 – Investor 2.0 1.5 7.4– Personal –0.5 –0.3 –1.4– Business –0.4 1.5 4.4Broad money 1.9 2.1 7.7(a) Growth rates are break adjusted and seasonally adjustedSources: APRA; RBA
Household FinancingHousing credit growth has been stable over recent months. Growth in investor housing credit has declined recently, after accelerating through the second half of 2016. This has been largely offset by slightly faster growth in housing credit extended to owner-occupiers (Graph 4.10).
Some of the decline in investor housing credit growth is likely to reflect the effect of the increases in investor and interest-only interest rates announced by lenders since November. The tightening in lending standards in response to prudential guidance from APRA and ASIC in March and April may also have had some effect.
2013200920052001 2017-10
0
10
20
%
-10
0
10
20
%
Credit Growth by Sector*Six-month-ended annualised
Business
Housing
Total**
* Seasonally adjusted and break-adjusted; including securitisation** Includes housing, personal and business creditSources: ABS; APRA; RBA
Housing Credit Growth*Owner-occupier
4
6
8
10
%
Six-monthannualised
Investor
4
6
8
10
%
20132009 2017-0.5
0.0
0.5
%Monthly
20132009 2017-0.5
0.0
0.5
%
* Seasonally-adjusted and break-adjustedSources: APRA; RBA
Graph 4.10
As part of the guidance, lenders are required to limit the share of interest-only lending to below 30 per cent of new loans from September onward. Consistent with this, large lenders have reported that the interest-only share of loan approvals has declined to around 30 per cent in the June quarter (Graph 4.11). Banks have also reported that existing borrowers are switching from interest-only to principal-and-interest loans in response to differences in interest rates on these products. Overall, it remains too early to assess the full impact of all of these changes in lending standards and interest rates.
Graph 4.9

R E S E R V E B A N K O F AU S T R A L I A5 0
The recent moderation in the growth of investor housing credit is consistent with the reduction seen in the level of investor loan approvals. The decline in investor approvals since the turn of the year has been broadly based across the states, while owner-occupier approvals have increased only in NSW and Victoria (Graph 4.12).
The major banks’ share of housing loan approvals remains around its lowest level since 2012 (Graph 4.13). Slower growth in the major banks’ housing lending over the past six months was partly offset by stronger growth by other authorised deposit-taking institutions (ADIs). There was also strong growth in housing credit extended by non-ADIs, although these institutions account for less than 5 per cent of the stock of housing credit. In general, non-major lenders are running up against constraints in their capacity to process the increased volume of applications in a timely manner.
Since May, most lenders have increased their standard variable reference rates for interest-only loans by around 30 basis points and reduced standard variable rates for principal-and-interest loans to owner-occupiers by around 5 basis points (Graph 4.14; Table 4.2). By themselves,
Graph 4.11Housing Loan ApprovalsIncluding refinancing, quarterly
Owner-occupier
20132009 20170
15
30
45
60
$b
Interest-only
Total
Investor
20132009 20170
15
30
45
60
$b
Principal-and-interest
Sources: APRA; RBA
Graph 4.12Housing Loan Approvals
Excluding refinancingOwner-occupier
20132009 20170
3
6
9
12
15
$b
Total
NSW and Victoria
Total excludingNSW and Victoria
Investor
20132009 20170
2
4
6
8
10
$b
Source: ARPA; RBA
Graph 4.13Housing Loan Approvals*
Share of total
20132009 201760
65
70
75
80
85
%
Major banks
20132009 20170
3
6
9
12
15
%
Other Australianbanks
CUBS
Foreign banks
RFCs
* Seasonally adjusted; CUBS are credit unions and building societies;RFCs are registered financial corporations
Sources: APRA; RBA
the net effect of these changes is estimated to have increased the average outstanding variable interest rate by around 5 basis points. In combination with the increases previously announced since last November, this implies a rise in the average outstanding variable interest rate of 15–20 basis points.

S TAT E M E N T O N M O N E TA R Y P O L I C Y | AU G U S T 2017 5 1
Table 4.2: Intermediaries’ Fixed and Variable Lending Rates
Interest
rateChange since
November 2016Change since
April 2016 Per cent Basis points Basis points
Housing loans – Variable principal-and-interest rate(a) (b)
– Owner-occupier 4.41 –4 –36 – Investor 4.98 29 –3
– Variable interest-only rate(a) (b)
– Owner-occupier 4.98 52 18 – Investor 5.46 73 43
– Fixed principal-and-interest rate (a)(c)(d)
- Owner-occupier 4.14 3 –29- Investor 4.45 20 –21
– Average outstanding rate(d) 4.63 13 –20Personal loans– Variable rate(e) 11.46 18 10Small business– Term loans variable rate(f ) 6.43 4 –32– Overdraft variable rate(f ) 7.31 4 –32– Fixed rate(c) (f ) 5.29 –1 –13– Average outstanding rate(d) 5.36 1 –32Large businessAverage outstanding rate(d) 3.49 0 –48(a) Includes announced changes to new lending to August 2017(b) Average of the major banks’ discounted package rates on new, $500 000 full-doc loans(c) Average of the major banks’ 3-year fixed rates (d) RBA estimates(e) Weighted average of variable rate products(f ) Residentially secured, average of the major banks’ advertised ratesSources: ABS; APRA; Canstar; RBA
Graph 4.14
2014 20162015 20175.10
5.40
5.70
6.00
%
5.10
5.40
5.70
6.00
%
Variable Housing Interest RatesMajor banks’ standard variable reference rates
Interest-only
Interest-only
Owner-occupier
InvestorPrincipal-and-interest
Principal-and-interest
Sources: Banks’ websites; RBA
However, the increase in the average rate for all outstanding housing loans is expected to be less than this estimate for variable rate loans for several reasons. First, it is likely that some existing borrowers will switch their repayment terms from interest-only to principal-and-interest to avoid the interest rate increases on the former. Second, the lowest advertised variable interest rates from the majors and mid-sized lenders have not increased to the same extent as the reference rates. Third, interest rates on new fixed-rate loans remain below those on maturing loans, so as these loans mature, borrowers can roll over their loans at lower interest rates.

R E S E R V E B A N K O F AU S T R A L I A5 2
The major banks’ share of new business loan approvals remains low relative to recent years. In part, this reflects the major banks’ efforts to reduce exposures to selected industries and larger companies. Foreign banks’ share of approvals has been relatively high, partly reflecting increased competition from Asian banks.
Business lending rates on outstanding loans to small and large businesses have been little changed over the past few months (Graph 4.17).
Graph 4.15
2014201120082005 2017-20
0
20
40
%
-20
0
20
40
%
Business Loan Approvals and CreditSix-month annualised
Business credit growth
Loan approvals*(per cent of business credit)
* Net of refinancing and reductionsSources: APRA; RBA
Graph 4.16Business Loan Approvals by Industry
Seasonally adjusted, six-month moving average
10
20
30
$bTotal
3
6
9
$b
Agriculture, mining& manufacturing
Construction & transport/storage
20122007 20170
3
6
9
$b Property & business services
Finance & insurance
20122007 20170
3
6
9
$bUtilities, telecommunications& other services
Wholesale/retail trade
Sources: APRA; RBA
Graph 4.17
201320092005 20172
4
6
8
%
2
4
6
8
%
Average Business Lending Rates*Average interest rate on outstanding lending
Small business
Large business
* RBA estimatesSources: APRA; RBA
Business FinancingBusiness credit growth picked up over the June quarter, following weakness in the March quarter (Table 4.1). Nevertheless, growth in business credit remains modest, consistent with the level of business loan approvals (Graph 4.15).
The recent pick-up in business credit growth partly reflects some stability in the level of lending to the resources sector after an earlier period of deleveraging. This is evident in a stabilisation in the stock of syndicated lending to the resources sector following noticeable declines over the preceding six months.
Outside of the resources sector, demand for credit remains uneven across industries (Graph 4.16). Recent weakness in business loan approvals has been concentrated in industries such as transport and storage, construction, telecommunications and utilities. Looking at the purpose of new loans, approvals for the construction of residential property have remained at relatively elevated levels, following very strong growth through 2016. Loan approvals for the purchase or construction of commercial property have declined in recent months.

S TAT E M E N T O N M O N E TA R Y P O L I C Y | AU G U S T 2017 5 3
The stock of bonds issued by non-financial corporations has remained stable, as new issuance has been offset by maturities. Corporate bond market spreads (relative to yields on AGS) have continued to tighten, with this trend broad based across industries and credit rating bands (Graph 4.18).
Graph 4.18Australian Corporate Bond Pricing
5-year target tenor
Yields
20122007 20170
3
6
9
12
%
AGS
Spread to AGS
20122007 20170
250
500
750
1 000
bps
A rated corporations
BBB ratedcorporations
Sources: Bloomberg; RBA; S&P Capital IQ
Graph 4.19
M M MJ J JS S SD D20162015 2017
70
80
90
100
110
index
70
80
90
100
110
index
Share Price Accumulation IndicesEnd December 2016 = 100
ASX 200
MSCI Worldexcluding US
S&P 500
Sources: MSCI; Thomson Reuters
Banks’ share prices in Australia are little changed from earlier this year but are down from their peak at the beginning of May. Bank share prices fell following the announcement in May of the Major Bank Levy. However, the ratings downgrades of banks by Standard & Poor’s and Moody’s had little apparent impact. Bank share prices have rebounded modestly in recent weeks alongside global banking stocks, and following the announcement of the additional capital requirements by APRA (Graph 4.20).
Graph 4.20
M M MJ J JS S SD D20162015 2017
50
75
100
125
index
50
75
100
125
index
Banks’ Share PricesEnd December 2014 = 100
Australia
Europe
US
Canada
Sources: Bloomberg; RBA
Net equity raisings by non-financial corporations (including real estate companies) have increased following limited activity earlier in the year. The initial public offering (IPO) market had a particularly slow start to 2017, with a number of planned IPOs by retailers being abandoned amid unfavourable equity market conditions. The IPO market picked up a little in the June quarter, though the retail sector remained subdued.
Equity MarketsThe Australian equity market has largely underperformed relative to global share markets in recent months (Graph 4.19). This was a result of declines of share prices in the banking sector, while increases in resource sector share prices provided some offset.

R E S E R V E B A N K O F AU S T R A L I A5 4
Resources sector share prices have increased in recent months, driven by mining material stocks, as iron ore prices recovered some of the falls earlier in the year (Graph 4.21).
Graph 4.21Resources Share Prices
60
100
index
60
100
index
Iron ore
Mining materials sector
M M MJ J JS S SD D20162015 2017
20
60
100
index
20
60
100
index
Brent oil
Energy sector
Sources: Bloomberg; RBA
Graph 4.22ASX 200 Price-earnings Ratios
12-month-ahead earnings forecastsResources
10
15
20
ratio Other
10
15
20
ratio
Averagesince 2003
Financials
20122007 20175
10
15
20
ratio ASX 200
20122007 20175
10
15
20
ratio
Source: Thomson Reuters
Analysts’ expectations for earnings over the coming years have been revised lower, particularly for the resources sector. Nevertheless, resources sector valuations (as measured by forward price-earnings ratios) have remained around their long-term average (Graph 4.22). Valuations across the other sectors have been little changed. R

S TAT E M E N T O N M O N E TA R Y P O L I C Y | AU G U S T 2017 5 5
5. Inflation
Measures of underlying inflation were steady in the June quarter at 0.5 per cent and 1¾ per cent over the year (Graph 5.1; Table 5.1). This was in line with the forecasts in the May Statement and provides further confidence that inflation has increased a little from its 2016 low. Headline inflation was 0.4 per cent in the quarter and 1.9 per cent over the year (Graph 5.2). This was a little lower than expected, in part due to fruit & vegetable inflation being weaker than anticipated in the quarter.
Inflation is low across the economy; over three-quarters of the components of the CPI basket have price growth below their long-run average. In general, this reflects the spare capacity in the economy and low wage growth. Other factors that are weighing on inflation include the low pace of rent growth, and the effect of heightened competition on retail prices. Increases in utilities and fuel inflation and further
Graph 5.1 Graph 5.2
2012200720021997 20170
1
2
3
4
5
%
0
1
2
3
4
5
%Measures of Underlying Inflation*
Weighted median
Trimmed mean
(year-ended)
(year-ended)
(quarterly)Trimmed mean
* Excludes interest charges prior to the September quarter 1998;adjusted for the tax changes of 1999–2000
Sources: ABS; RBA
2012200720021997 2017-1
0
1
2
3
4
%
-1
0
1
2
3
4
%Consumer Price Inflation*
(seasonally adjusted)Quarterly
Year-ended
* Excludes interest charges prior to the September quarter 1998;adjusted for the tax changes of 1999–2000
Sources: ABS; RBA
increases in the tobacco excise partly offset these downward pressures over the year.
Over the past year, non-tradable inflation increased, while prices of tradable items declined (Graph 5.3). Non-tradable goods and services represent around two thirds of the CPI basket and their prices are mainly driven by domestic developments. A noticeable part of the increase in non-tradable inflation over recent quarters has been due to increases in the tobacco excise. However, inflation in other non-tradable components has also started to pick up (Graph 5.4). Inflation in market services (such as domestic household services, financial services and meals out & takeaway) is higher than it was a year ago. However, it remains low because around half of total costs in market services are labour costs. Wage growth remains low and, with productivity growing at around the same pace, there has been little growth in unit labour costs

R E S E R V E B A N K O F AU S T R A L I A5 6
primarily due to a sharp rise in wholesale prices for gas and electricity in recent years, reflecting supply constraints following the closure of coal-powered electricity plants and a lack of industry investment widely attributed to uncertainty over electricity and environmental policies. Gas demand has also increased from the production of LNG for export. The announcement of price increases by a number of electricity and gas providers points to a
over recent years. Prices of telecommunication equipment & services have declined in recent years as a result of increased competition between service providers and technology-driven quality improvements.
Inflation in prices of utilities has picked up considerably in recent quarters (Graph 5.5). This is
Table 5.1: Measures of Consumer Price InflationPer cent
Quarterly(a) Year-ended(b)
June quarter 2017
March quarter 2017
June quarter 2017
March quarter 2017
Consumer Price Index 0.2 0.5 1.9 2.1Seasonally adjusted CPI 0.4 0.6 – Tradables –0.3 0.5 0.4 1.3 – Tradables (excl volatile items)(c) –0.1 –0.1 –0.9 –0.9 – Non-tradables 0.7 0.7 2.7 2.6Selected underlying measures
Trimmed mean 0.5 0.5 1.8 1.8Weighted median 0.5 0.5 1.8 1.7CPI excl volatile items(c) 0.5 0.4 1.5 1.5(a) Except for the headline CPI, quarterly changes are based on seasonally adjusted data; those not published by the ABS are
calculated by the RBA using seasonal factors published by the ABS(b) Year-ended changes are based on non-seasonally adjusted data, except for the trimmed mean and weighted median(c) Volatile items are fruit, vegetables and automotive fuelSources: ABS; RBA
Graph 5.3 Graph 5.4Tradable and Non-tradable Inflation*
Tradables excl volatilesTradables excl volatiles
0
2
4
%
0
2
4
%
Quarterly(seasonally adjusted)
Year-ended
Non-tradables**Non-tradables**
2012200720021997 2017-2
0
2
4
%
-2
0
2
4
%
* Adjusted for the tax changes of 1999–2000** Excludes interest charges and deposit & loan facilitiesSources: ABS; RBA
Non-tradablesMarket servicesTelecommunication
HousingAdminUtilities
Other
201320092005 2017-2
0
2
4
%
-2
0
2
4
%
Non-tradable Inflation*Excluding tobacco, year-ended
* Excludes interest charges and deposit & loan facilitiesSources: ABS; RBA

S TAT E M E N T O N M O N E TA R Y P O L I C Y | AU G U S T 2017 5 7
significant pick-up in utilities inflation in both the September quarter 2017 and the March quarter 2018. Along with the direct effects on household utility bills, there will also be indirect effects on inflation as a result of rising business input costs. Given the small size of utilities in business input costs, these indirect effects are estimated to be fairly small. However, this will vary by industry and there is uncertainty around the extent of the pass-through of higher costs to final prices.
Inflation in the cost of building a new dwelling continued to rise over the year (Graph 5.6). The high level of residential investment, in particular for the construction of apartments, has put upward pressure on the cost of some construction materials. While wage pressures remain fairly contained in the construction industry as a whole, information from the liaison program suggests there are labour shortages for some construction workers in the eastern state capital cities. Rent inflation has stabilised in the last few quarters but remains low. Conditions in rental markets vary considerably across capital cities, reflecting differences in vacancy rates, which in turn depend on housing supply and population growth; rent inflation is around its inflation-targeting average in Sydney and Melbourne, while rents have fallen markedly over the past year in Perth.
Apart from utilities, inflation in administered prices has declined in the past few quarters due to smaller-than-usual increases in childcare fees and private health insurance premia (Graph 5.7). Policy changes in New South Wales have also limited increases in preschool and primary education fees.
The prices of tradable items (excluding volatile items) have declined over the year. The 3 per cent appreciation of the exchange rate over the year to the June quarter led to a small decline in import prices in Australian dollar terms over the period. Prices of consumer durables have been
Graph 5.5 Graph 5.6
Graph 5.7
Utilities Price InflationElectricityElectricity
2010 2017-10
-5
0
5
10
15
%
2010 2017
Gas*
(seasonally adjusted)Quarterly
endedYear-
Water & sewerageWater & sewerage
2010 2017-10
-5
0
5
10
15
%
* Includes other household fuelsSources: ABS; RBA
Housing Cost InflationRentsRents
20122007 2017-2
0
2
4
6
8
%
Year-ended
Quarterly(seasonally adjusted)
New dwellingsNew dwellings
20122007 2017-2
0
2
4
6
8
%
Sources: ABS; RBA
Administered Inflation*Selected items, year-ended
Health
4
5
6
7%
(6%)
Education
4
5
6
7%
(4%)
Childcare
2013 2017-8
-4
0
4
8%
(1%)
Urban transport
2013 2017-8
-4
0
4
8%
(1%)
* Numbers in brackets represent the current effective weight in theCPI basket
Sources: ABS; RBA

R E S E R V E B A N K O F AU S T R A L I A5 8
flat or declined over recent years, as a result of increased competition from new foreign retailers, low wage growth and technological advances (Graph 5.8). The arrival of further new foreign retailers will be an important influence on consumer durable prices over the next few years. Inflation for the food & alcohol component (excluding fruit and vegetables) has declined over recent years as supermarkets have sought to gain market share by competing on prices.
Graph 5.8
Graph 5.9
Graph 5.10
Retail InflationSelected items, year-ended
0
5
% Furniture &household appliances
AVC*
-10
-5
%
Clothing & footwear
20122007 2017-6
-4
-2
0
2% Food & alcohol**
20122007 2017-2
0
2
4
6%
* Includes audio, visual and computing equipment & services** Excludes fruit and vegetablesSources: ABS; RBA
2012200720021997 20170
1
2
3
4
5
%
0
1
2
3
4
5
%
Short-term Inflation ExpectationsOver the next year
Inflation swaps
Unions Marketeconomists
Sources: Australian Council of Trade Unions; Bloomberg; RBA; WorkplaceResearch Centre
Long-term Inflation Expectations
1
2
3
4%
1
2
3
4%
Unions*
Consensus Economics**
20122007200219971992 20170
1
2
3
4%
0
1
2
3
4%
10-year indexed bondsInflation swaps***
* Average over the next five to ten years** Average over six to ten years in the future*** Five-to-ten-year forwardSources: Australian Council of Trade Unions; Bloomberg; Consensus
Economics; RBA; Workplace Research Centre; Yieldbroker
Fruit & vegetable prices were largely unchanged in the June quarter, with the boost to certain fruit and vegetable prices as a result of Cyclone Debbie offset by a decline in other vegetable prices. Cyclone-related supply disruptions are not expected to persist after the September quarter. Fuel prices declined in the June quarter, but contributed around 0.2 percentage points to headline inflation over the past year.
Measures of inflation expectations remain low, though most are a bit higher than in 2016. Both short-term and long-term financial market measures of inflation expectations have fallen slightly since the May Statement, however, these measures remain at higher levels than a year ago
(Graph 5.9; Graph 5.10). Movements in short-term survey-based measures have been mixed. Market economist expectations for inflation over the year ahead have increased, while union expectations have declined. Long-term survey measures have been stable at around 2.5 per cent. R

S TAT E M E N T O N M O N E TA R Y P O L I C Y | AU G U S T 2017 5 9
6. Economic Outlook
Graph 6.1The International EconomyThe outlook for growth in Australia’s major trading partners is little changed since the previous Statement, following upward revisions to the forecasts in late 2016 and early 2017 (Graph 6.1). Global economic conditions have improved over the past year and major trading partner growth is forecast to maintain its current pace over the remainder of this year. Growth in Australia’s trading partners is expected to ease over 2018 and 2019, largely because of longer-run factors, such as the decline in the working-age population in a number of important trading partners, including China, Japan and Korea. Potential growth rates in a number of major trading partners have also been lower than their long-term averages because growth in the capital stock and productivity has been slow. However, investment growth has started to pick up in the major advanced economies and in the high-income economies in Asia, which, if sustained, will add to their productive capacity and potential growth over time.
In China, near-term growth is expected to be supported by accommodative policy settings, although there is considerable uncertainty about how the policy configuration will evolve in the wake of the Chinese Communist Party’s 19th National Congress later this year. The east Asian economies (other than China and Japan) are expected to grow at around potential over the forecast period, supported by the improvement in the global economy and an expected pick-up in domestic demand. GDP growth in the major advanced economies is
likely to continue to be above potential growth over the next couple of years, partly because monetary policies are expected to remain accommodative over the forecast period. Considerable uncertainty remains about the economic policies of the US administration, but the prospect of substantial tax reform in the United States has diminished. As a result, fiscal policy in the United States is likely to be less expansionary than previously expected, although the risk of more restrictive and protectionist trade policies has also lessened.
Although still low, wage growth has increased in some of the major advanced economies that are close to experiencing full employment. Wage pressures are expected to increase gradually as spare capacity in these economies’ labour markets declines further. This should put upward pressure on inflation in the next couple of years. If there is less spare capacity in these
RBA forecast
20132007200119951989 2019-2
0
2
4
6
%
-2
0
2
4
6
%
Australia’s Trading Partner Growth*Year-average
* Aggregated using total export sharesSources: ABS; CEIC Data; RBA; Thomson Reuters

R E S E R V E B A N K O F AU S T R A L I A6 0
economies than projected, inflation could rise more quickly than currently forecast. This could lead to tighter-than-expected monetary policy in some advanced economies and would typically result in a depreciation of the Australian dollar, all else being equal.
Australia’s terms of trade are likely to decline over the forecast period, but to remain above their trough in early 2016 (Graph 6.2). The near-term forecast for the terms of trade is largely unchanged since the previous Statement, but the forecast is slightly higher further out.
Graph 6.2
2009199919891979 201950
75
100
125
index
50
75
100
125
index
Terms of Trade2014/15 average = 100, log scale
Forecast
Sources: ABS; RBA
Graph 6.3
2017201520132011 20190
2
4
%
0
2
4
%
GDP Growth Forecast*Year-ended
90 per cent interval
70 per cent interval
* Confidence intervals reflect RBA forecast errors since 1993Sources: ABS; RBA
Domestic ActivityThe forecast for domestic output growth is little changed from that presented in the May Statement (Graph 6.3; Table 6.1).1 Economic activity grew more slowly than expected in the March quarter, partly reflecting some temporary factors; the outlook for quarterly growth is little changed, suggesting slightly lower year-ended growth in the near term. Recent indicators point to a pick- up in growth in the June quarter 2017. Further out, GDP growth should
1 One way of demonstrating the uncertainty surrounding the central forecasts is to present confidence intervals based on historical forecast errors.
continue to recover as the drag from falling mining investment comes to an end and the ramp-up in resource exports continues. The recent appreciation of the exchange rate has been factored into the forecasts and has had a modest dampening effect on the forecast for growth. Growth in the economy is expected to strengthen gradually to be around 3 per cent in the first half of 2018. Although this is a bit above potential growth, it is expected to take some time for the economy to encounter broad-based capacity constraints.
The domestic forecasts are conditioned on a number of technical assumptions. The cash rate is assumed to move broadly in line with market pricing. This assumption does not represent a commitment by the Reserve Bank Board to any particular path for policy. The exchange rate is assumed to remain at its current level over the forecast period, which is 5 per cent higher on a trade-weighted basis than in the May Statement. The US dollar price of Brent crude oil is also slightly higher than the assumption used in May. The population aged over 15 years is assumed to grow by 1.6 per cent over both 2017/18 and 2018/19.

S TAT E M E N T O N M O N E TA R Y P O L I C Y | AU G U S T 2017 6 1
Table 6.1: Output Growth and Inflation Forecasts(a)
Per cent
Year-ended
Jun 2017 Dec 2017 Jun 2018 Dec 2018 Jun 2019 Dec 2019
GDP growth 1¾ 2−3 2½−3½ 2¾−3¾ 3−4 3−4Unemployment rate(b) 5.6 5−6 5−6 5−6 5−6 5−6CPI inflation 1.9 1½−2½ 1¾−2¾ 1¾−2¾ 2−3 2−3Underlying inflation 1¾ 1½−2½ 1½−2½ 1½−2½ 2−3 2−3
Year-average
2016/17 2017 2017/18 2018 2018/19 2019
GDP growth 2 1¾−2¾ 2¼−3¼ 2½−3½ 2¾−3¾ 2¾−3¾(a) Technical assumptions include A$ at US$0.80, TWI at 67 and Brent crude oil price at US$53 per barrel; shaded regions are historical data(b) Rate at end of periodSources: ABS; RBA
There has been little change to the forecasts for mining investment other than a change in timing. In the March quarter, mining investment was stronger than expected for the second consecutive quarter, but this strength predominantly reflected earlier-than-expected prepayments on existing projects rather than new investment projects. Although mining companies’ profits have been strong over the past year or so, this is not expected to lead to much additional investment spending; information from the Bank’s liaison and company announcements have indicated that firms have generally used the additional income to pay down debt, pay dividends and increase share buybacks. The drag on domestic activity from the falls in investment in the resources sector is expected to have finished by the second half of next year.
Resource export volumes are expected to have increased in the June quarter, despite the disruption to coal exports related to Cyclone Debbie. Further out, resource exports are forecast to continue rising, supported by higher production from Australia’s low-cost iron ore producers and the ramp-up in liquefied natural gas (LNG) production, which is still expected despite some delays with a few projects. LNG exports are expected to contribute
almost ½ percentage point to GDP growth per year between 2017 and 2019. The Australian Domestic Gas Security Mechanism, which seeks to secure domestic gas supply through restrictions on LNG exports, was legislated in July. At this stage, the impact on overall LNG exports remains unclear.
Growth in non-mining activity is forecast to pick up over the next year, supported by stronger growth in household consumption. Timely indicators, including retail sales, suggest that growth in household spending picked up in the June quarter, after growth was weaker than expected in the March quarter. For the remainder of the forecast period, household consumption is forecast to grow at a bit above its average since 2008, as had been expected at the time of the May Statement. Given the recent strength in total hours worked, growth in household disposable income is expected to increase and be in line with growth in consumption, implying little change in the household saving ratio. However, as discussed below, there is considerable uncertainty about a range of important factors, such as future income growth, housing prices and household debt, and how these factors might affect spending decisions.

R E S E R V E B A N K O F AU S T R A L I A6 2
The significant pipeline of residential building work to be done is expected to maintain a high level of dwelling investment over most of the forecast period. Home building approvals have been lower than their recent peaks for some time now, which suggests that the pipeline of work to be done will start to fall over the forecast period. The contribution to GDP growth from dwelling investment over the forecast period is expected to be minimal.
The gradual recovery in non-mining business investment is expected to continue and broaden out beyond Victoria and New South Wales, supported by low interest rates and as the spillover effects from falling mining investment dissipate. Given the gradual recovery to date and mixed signals from surveys of investment intentions, the strength of investment growth is not forecast to match that seen in previous recoveries. But, as discussed below, it is possible that non-mining business investment could, at some point, increase more noticeably than is currently projected. Reasonably strong government spending is factored in over the forecast period, which largely reflects the significant pipeline of public infrastructure work. However, the timing of expenditures on these projects can be hard to predict.
Information from leading indicators, such as job advertisements and vacancies, points to solid employment growth over the second half of 2017, following stronger-than-expected growth over the first half of the year. Further out, employment growth is expected to be broadly consistent with labour force growth. The unemployment rate was a bit lower than expected in the June quarter; it is expected to edge lower over the forecast period, to be just under 5½ per cent at the end of 2019 (Graph 6.4). This forecast suggests that there will still be some spare capacity in the labour market over the next few years. The forecasts
also embody a small pick-up in average hours worked, reflecting an expectation that some of the increase in labour demand will be met with an increase in hours worked by existing workers, rather than new employees. This should lead to a lower underemployment rate over the forecast period because some workers will be closer to their preferred number of hours of work. The participation rate, which has picked up noticeably since late 2016, is assumed to remain around current levels over the forecast period.
The recent improvement in labour market conditions is consistent with the Bank’s forecast for a gradual recovery in wage growth. Information from the Bank’s liaison program and a survey of union wage expectations suggests wage growth is likely to remain steady over the year ahead. However, the larger-than-expected increase in minimum and award wages that has now come into effect will provide a boost to wage growth in the September quarter. Wage growth is then expected to pick up gradually over 2018 and 2019. Although spare capacity in the labour market is expected to continue to weigh on wage growth over the next few years, the drag from the mining-exposed states and industries is expected to dissipate. There
Graph 6.4
2015201120072003 20193
4
5
6
7
%
3
4
5
6
7
%
Unemployment Rate Forecast*Quarterly
90 per cent interval
70 per cent interval
* Confidence intervals reflect RBA forecast errors since 1993Sources: ABS; RBA

S TAT E M E N T O N M O N E TA R Y P O L I C Y | AU G U S T 2017 6 3
is uncertainty about how the improvement in labour market conditions will translate into wage pressures, as discussed below.
InflationThe June quarter underlying inflation outcome was consistent with the Bank’s expectations at the time of the May Statement and there has been little change to the forecast; measures of underlying inflation are expected to reach around 2 per cent over the second half of 2017 and increase a little thereafter (Graph 6.5). Headline inflation is forecast to rise gradually and be between 2 and 3 per cent over much of the forecast period. The outlook for headline inflation is slightly higher than at the time of the May Statement, reflecting an upward revision to expected utilities prices, notwithstanding the exchange rate appreciation that has occurred.
the year ahead. There will also be some indirect effects on inflation because higher utilities prices will raise business input costs, although competitive pressures may limit firms’ ability to pass those cost increases on to consumers. There is considerable uncertainty about when and how the range of factors that contributed to the increases in wholesale utilities prices will be resolved and how large the direct effects on retail utilities prices will be. The legislated tobacco excise increases are expected to add more than ¼ percentage point to headline inflation in each of the next couple of years.
Wage growth is expected to pick up gradually over the next few years. Consistent with this, unit labour costs are forecast to pick up, which will contribute a little to inflationary pressures. At the component level, there are a number of forces weighing on inflation. Food price inflation has been low and prices have declined for clothing & footwear over a number of years, reflecting heightened retail competition. The entry of new foreign retailers into the Australian market over the next few years is also expected to constrain retail price inflation. The exchange rate appreciation since the May Statement, if sustained, will put further downward pressure on retail prices over the year ahead. Large additions to housing supply, both over recent years and over the next year or so, are expected to keep rent inflation low.
The ABS will be updating the weights assigned to each expenditure class in the Consumer Price Index (CPI) in the December quarter 2017 CPI release. In calculating the CPI, the weight assigned to each expenditure class is fixed for a number of years. This means that, during that time, the CPI does not take into account changes in consumer behaviour in response to relative price changes (known as ‘substitution bias’). As a result, the forthcoming re-weighting
Graph 6.5
2017201520132011 20190
1
2
3
%
0
1
2
3
%
Trimmed Mean Inflation Forecast*Year-ended
70 per cent interval
90 per cent interval
* Confidence intervals reflect RBA forecast errors since 1993Sources: ABS; RBA
While the previous forecasts incorporated an increase in utilities inflation over the forecast period, new information suggests that the increase in electricity and gas prices over the next few years is likely to be higher than previously thought. Utilities inflation is expected to make a sizable contribution to headline inflation over

R E S E R V E B A N K O F AU S T R A L I A6 4
is expected to reduce measured inflation. It is currently difficult to estimate the size of this effect on the CPI because past re-weightings are not necessarily a good guide to future episodes. The ABS will re-weight the CPI annually in the future, which will reduce the ongoing effect of substitution bias.
Key UncertaintiesThere are a number of key uncertainties that need to be considered in relation to the forecasts. For the global economy, the current expansion could be more self-sustaining than the Bank, or other forecasters, expect. On the other hand, it remains possible that escalating geopolitical tensions or increased global trade protectionism could derail the ongoing recovery. Domestically, there is the risk that household spending growth could be more constrained than expected by low real wage growth and high debt levels. The potential strength of the recovery in non-mining investment, future exchange rate movements and how quickly wage growth responds to a decline in spare capacity in the labour market are other key sources of uncertainty for the domestic economic and inflation outlook, which are discussed below.
The Chinese economy and commodity prices
The persistence of stronger-than-expected conditions in the Chinese residential property market, combined with accommodative policy settings (including resilient government-led infrastructure activity), has helped sustain growth momentum in the first half of 2017. This momentum is expected to continue in the lead-up to the 19th Party Congress later this year. Continued fiscal and monetary policy support, if pursued more forcefully than expected, poses upside risks to the forecasts for economic activity in China over the coming year. Similarly, if efforts
to restrict housing activity are less effective than expected, this could lead to growth being stronger than forecast. At the same time, there continues to be uncertainty about how the authorities will negotiate the difficult trade-off between growth and the build-up of leverage in the Chinese economy. The adoption of a stricter regulatory approach to managing risks in the ‘shadow banking’ sector over the past year, together with the recent high-level directive to improve coordination among financial supervisors, could lead to tighter-than-expected financial conditions and result in growth being weaker than expected. If appropriately calibrated, however, these measures could also mitigate the longer-run risk of a sharp financial disruption or crisis, which, if it eventuated, would have much more severe outcomes for Chinese growth.
The uncertainty surrounding China’s growth outlook has implications for Australian resource exports and commodity prices. If conditions in the Chinese construction and/or manufacturing sectors ease by more (less) than expected in the next few quarters, growth in demand for steel, and therefore iron ore and coking coal, could be lower (higher) than expected. On the supply side of commodity markets, coal prices have responded particularly strongly to recent supply disruptions as well as the policy changes that have led to fluctuations in China’s domestic production.
Consumer spending and the housing market
Households’ consumption decisions depend on their expectations about growth in their incomes and wealth, and any liquidity or credit constraints that they might face. The recent increase in total hours worked and the rise in award wages have led to some upward revision to the forecast for household income growth. A continuation of recent strong employment growth, which

S TAT E M E N T O N M O N E TA R Y P O L I C Y | AU G U S T 2017 6 5
would imply stronger growth than is currently embodied in the employment forecasts, could provide a boost to consumption growth relative to current forecasts. However, ongoing expectations for low real wage growth remain a key downside risk for household spending. The recent sharp increase in the relative price of utilities poses a further downside risk to the non-energy part of household consumption to the extent that households find it hard to reduce their energy consumption; this is likely to have a larger effect on the consumption decisions of lower-income households.
Household spending has grown by more in New South Wales and Victoria, where housing prices continue to grow briskly despite some tentative signs of slowing growth recently. Large unexpected rises (or falls) in housing prices could lead to changes in the outlook for consumption growth, at least in the short term. Elevated debt levels are likely to amplify any risks to consumption; if indebted households become less confident about their future prospects, they could choose to pay down debt faster, in which case consumption growth could be lower than forecast.
There are a number of uncertainties that could affect housing prices, particularly in the eastern states. The risk of more weakness in apartment prices in some locations where a large amount of supply is coming online remains. This could mean that buildings approved but not commenced do not go ahead, in which case dwelling investment and related household spending would be weaker than expected. Declining housing prices could also cause difficulties for some apartment developers. Recent state and federal budget measures intended to restrain foreign investment have not yet had time to have had their full effects, which are uncertain; however, the effects are likely to be largest in housing markets where foreign buyers
have been most active, particularly inner-city apartments.
Business investment
Non-mining business investment growth has been relatively modest in recent years. This is despite many of the conditions being in place that would normally encourage stronger investment, such as low interest rates, tax incentives for small business and high capacity utilisation rates. This investment cycle has been unusual compared with previous episodes because investment typically picks up quite sharply after a period of weakness. International experience suggests that, as time goes on and the momentum in domestic demand picks up, the probability of a more rapid recovery in business investment increases. There are some signs that this may already be occurring in the major advanced economies; however, it is difficult to forecast exactly when it might happen in Australia. The forecasts have built in a relatively gradual increase in non-mining business investment growth and, as such, there is a risk that investment will pick up by much more than is forecast at some point. If a turning point in non-mining business investment becomes apparent, there could be a substantial upward revision to the forecast profile. On the other hand, a recovery in non-mining investment has been forecast for some time and, given the subdued signals from some leading indicators, it remains possible that a substantial pick-up is still some way off.
Australian dollar exchange rate
The exchange rate is another source of uncertainty for the forecasts. The Australian dollar has appreciated by 5 per cent on a trade-weighted basis since the May Statement, and by 7 per cent against the US dollar. This has been incorporated into the current forecasts.

R E S E R V E B A N K O F AU S T R A L I A6 6
It is possible that the Australian dollar could appreciate further, which if sustained, would be expected to result in a slower pick-up in economic activity and inflation than currently forecast. Based on historical relationships, a 10 per cent appreciation of the trade-weighted exchange rate (that is not associated with higher commodity prices) would be expected to lower year-ended inflation by a little less than ½ percentage point over each of the following two years or so. Output would be expect to be lower by ½–1 per cent in around two years’ time.
Spare capacity and inflation
As discussed in previous Statements, there is some uncertainty about how much slack there is in the labour market currently and how quickly it will decline over the forecast period as growth in the economy picks up. There is also uncertainty about how employment-intensive future GDP growth will be. This is because the sizeable contribution to growth from LNG production is not expected to add to employment growth. However, growth in public infrastructure activity or service industries such as health could be more employment-intensive than assumed.
Another key risk to the forecast profile is how much wage inflation picks up as spare capacity in the labour market declines. It may be the case that, after a period of low wage growth, workers may seek ‘catch-up’ or much stronger wage growth, which would see wage pressures emerge more quickly than forecast. On the other hand, an increased perception of competition among workers, as a result of globalisation and/or technological change, may make workers reluctant to seek higher wage outcomes. Lower productivity growth appears to have constrained the pick-up in wage growth in some advanced economies, although this is less of a factor in Australia than elsewhere.
Core inflation has not picked up by as much as expected in many economies that are close to full employment, even though unit labour cost growth has increased. This raises the possibility that low inflation may turn out to be more persistent, both domestically and globally, than forecast, given estimates of spare capacity. R
