statement on monetary policy - reserve bank of australia · · 2018-02-20statement on monetary...
TRANSCRIPT

Statement on Monetary
Policy
FEBRUARY 2018

Contents
Overview 1
1. International Economic Developments 5
2. International and Foreign Exchange Markets 15 Box A: The Period of Low Volatility in Financial Markets 25
3. Domestic Economic Conditions 27 Box B: The Recent Economic Performance of the States 37
Box C: Spillovers from Public Investment 40
4. Domestic Financial Markets 43 Box D: Measures of Investor and Owner-occupier Housing Credit 52
5. Inflation 55
6. Economic Outlook 61
Copyright and Disclaimer Notices 69
Statement on Monetary Policy
FEBRUARY 2018

The material in this Statement on Monetary Policy was finalised on 8 February 2018. The next Statement is due for release on 4 May 2018.
The Statement is published quarterly in February, May, August and November each year. All the Statements are available at www.rba.gov.au when released. Expected release dates are advised ahead of time on the website. For copyright and disclaimer notices relating to data in the Statement, see the Bank’s website.
The graphs in this publication were generated using Mathematica.
Statement on Monetary Policy enquiries
Secretary’s DepartmentTel: +61 2 9551 8111Fax: +61 2 9551 8033Email: [email protected]
ISSN 1448–5133 (Print) ISSN 1448–5141 (Online)

S TAT E M E N T O N M O N E TA R Y P O L I C Y | F E B R UA R Y 2018 1
Global economic conditions picked up further over the course of 2017. Indications are that this strength has continued into 2018. This upswing has been most pronounced in manufacturing and industrial activity, and has been more synchronised across economies than has been the case for some time. GDP growth is above estimates of potential in a number of economies and labour markets have tightened further. Although commodity prices have generally risen, broader inflationary pressures have been slow to emerge.
The Chinese economy continued to grow solidly over 2017. Government policies to reduce pollution, dampen housing speculation and contain financial risk are likely to constrain output growth somewhat, with conditions in China’s industrial sector already having softened in recent months. Financial conditions continue to be supportive overall, and China is benefiting from the global upswing.
Growth has been stronger than expected in some advanced economies. Labour market conditions have tightened noticeably and unemployment rates have reached low levels in many of these countries. Survey measures of business conditions are at high levels and growth in business investment has picked up. The recently passed tax cuts in the United States are likely to add to demand there. Growth in some economies in east Asia has also picked up, supported by ongoing strong growth in global trade.
The recent synchronised improvement in global growth has boosted commodity prices and other upstream costs in some economies.
Overview
Wage growth and consumer price inflation have responded only a little to date, however, and remain low in most major trading partner economies. Financial market volatility has picked up in recent days, most notably in equity markets as market participants have begun to reassess the outlook for global inflation and the speed of withdrawal of monetary accommodation. Sovereign bond yields have risen, though credit spreads remain narrow and financial conditions expansionary. The run-up in equity prices at the beginning of the year has largely been reversed, but equity prices generally remain significantly higher than a year ago.
While it is possible that geopolitical events or other risks could derail the expansion, overall prospects for global growth remain positive. An important consideration for the outlook is how far inflation picks up as the global economy strengthens. A larger than expected increase in inflation would have implications both for financial market pricing and exchange rates. On a trade-weighted basis, the Australian dollar has remained within a relatively narrow range for the past couple of years. An appreciating exchange rate would be expected to dampen domestic growth and inflation.
Domestically, the recent run of activity data has been in line with, or a little stronger than, expectations at the time of the November Statement on Monetary Policy. The labour market has been particularly strong. GDP growth picked up to 2¾ per cent over the year to the September quarter. The December quarter was affected by temporary declines in some

R E S E R V E B A N K O F AU S T R A L I A2
categories of exports. Beyond that, however, GDP growth is expected to increase over the period ahead, to be a little above 3 per cent over both 2018 and 2019. This expectation is unchanged from the forecasts published in November, and implies that spare capacity will gradually diminish.
Prospects for business investment have improved noticeably over the past few quarters. The drag from mining investment has been waning and is likely to end sometime this year. Incomes in the mining sector have continued to be supported by higher than expected prices for bulk commodities. Non-mining business investment grew more quickly over 2017 than over the previous couple of years, and faster than was expected a year ago. Business conditions are reported to be positive, at least outside the retail sector. Forward indicators of non-residential building activity and investment intentions point to solid growth in non-mining investment in the period ahead. The large pipeline of public infrastructure work to be done is supporting GDP growth as well as conditions in some parts of the private sector. It is also encouraging increased investment spending by the firms undertaking this work on behalf of the public sector.
Household consumption growth was weak in the September quarter but indications are that it recovered in the December quarter. Consumption growth is expected to be a little above its decade average in the period ahead. Growth in household incomes has been slow for some time. If this were to persist, it would be likely to constrain consumption spending, particularly in the context of ongoing high levels of household debt. Some support to incomes will have been provided by recent strong employment growth.
Dwelling investment remains at a high level, supported by the large pipeline of work to be
done in the south-eastern states. This implies ongoing above-average increases in housing supply in these markets. However, this activity has added little to overall GDP growth recently and this is likely to remain the case in the period ahead. Conditions in established housing markets have eased in Sydney and Melbourne; housing prices have declined in Sydney in recent months, especially at the more expensive end of the market. In Perth and Brisbane, housing prices have been little changed recently. Housing credit growth has drifted lower in recent months, particularly investor credit. At the same time, tighter lending standards have been helpful in containing the build-up of risks in household balance sheets but household indebtedness remains high.
Employment growth was strong over 2017, and most of the jobs created were full time. The unemployment rate trended down over the year. Forward indicators of labour demand suggest that employment will continue to expand in coming months, though not at quite as rapid a rate as seen recently. Labour supply has also increased significantly over the past year, largely driven by increased participation by women. It is unclear whether participation rates will increase further and, if so, by how much; this represents an uncertainty around the question of how spare capacity in the labour market is likely to evolve.
Wage growth remains subdued and is forecast to increase gradually. Despite the recent and forecast improvements in labour market conditions, the unemployment rate is likely to remain above estimates of full employment in Australia for some time. Wage growth has also been slow to pick up in some other advanced economies where labour markets are already tighter, suggesting that some structural factors could also be holding wage growth down. In addition, in Australia new enterprise bargaining

S TAT E M E N T O N M O N E TA R Y P O L I C Y | F E B R UA R Y 2018 3
agreements are tending to incorporate smaller wage rises than the agreements they replace. Other things being equal, this will induce some inertia that will limit overall wage growth for a time. Reports of labour shortages have become more common in recent months. In some pockets of the labour market there have also been signs of a pick-up in wage growth.
Inflation remains low and this is likely to continue for a while yet. Both CPI and underlying inflation were a little below 2 per cent over 2017. Slow growth in labour costs has weighed on price growth, particularly for retail goods and some market services. Strong competition among retailers is contributing to ongoing deflation in prices of consumer durables and several other retail categories; food prices (excluding volatile fruit and vegetable prices) have been broadly flat for some time. Inflation in home-building costs has picked up in the eastern capital cities but remains subdued elsewhere, as does rent inflation nationally. Higher fuel prices, electricity charges and ongoing increases in tobacco excise added to headline inflation over 2017. Utility prices will also add to headline inflation in the March quarter.
The forecasts for inflation are similar to those published in the November Statement. Inflation is likely to increase gradually over time, as the economy and labour market strengthen. Underlying inflation is expected to be around 2¼ per cent by mid 2020. Headline inflation is expected to remain a little higher than underlying inflation, boosted by ongoing increases in tobacco excise. A key question shaping the inflation outlook is how quickly wage growth and inflation might pick up as spare capacity is absorbed.
Over the course of 2017, the unemployment rate declined and inflation increased a little. The accommodative setting of monetary policy
has played a role here. Further progress on both fronts is expected over the next couple of years. It will be some time, however, before the economy reaches current estimates of full employment and inflation returns to the midpoint of the target. Accordingly, at its recent meetings the Reserve Bank Board has judged that holding the cash rate at its current level of 1.5 per cent was consistent with sustainable growth in the economy and achieving the medium-term inflation target. R

R E S E R V E B A N K O F AU S T R A L I A4

S TAT E M E N T O N M O N E TA R Y P O L I C Y | F E B R UA R Y 2018 5
1. International Economic Developments
There was a broad-based pick-up in global economic growth in 2017. The Chinese economy continued to grow at a solid rate. GDP growth increased in the major advanced economies, from rates that were already above estimates of potential growth. Global merchandise trade picked up, which contributed to higher growth in the trade-exposed east Asian economies. The strength of the global expansion in 2017 surprised most economic forecasters, and forecasts for 2018 have been revised up over the past year (Graph 1.1). Global growth is expected to be sustained at around recent rates over the next couple of years, supported by accommodative monetary policies as well as more expansionary fiscal policy in the United States. However, most economic forecasters expect growth to ease in the longer term; for example, population ageing is expected to weigh on economic growth in a number of regions. In China, policies to control financial risks could also lead to slower GDP growth through tighter financial conditions.
Investment growth and business confidence were notably stronger in 2017 in many economies, following several years of weakness. Growth in industrial production, merchandise trade and manufacturing business conditions reached their highest levels in a number of years (Graph 1.2). The upswing in industrial activity, driven by the production of capital and intermediate goods, has been broad based across economies. Financial and geopolitical risks in the euro area have eased, which has also contributed to the increase in confidence. Consumer confidence is high and
Graph 1.1
Graph 1.2
20162015 20172.5
3.0
3.5
4.0
%
2.5
3.0
3.5
4.0
%
Consensus GrowthForecasts for Major Economies*
Year-average growth
2017
2018
20192016
2015
6–10 years ahead
* PPP GDP-weighted average of China, Euro area, Japan and USSources: Consensus Economics; RBA
Global Economic ConditionsSurveyed business
conditions
2014 201845
50
55
index
Services PMI
ManufacturingPMI
Industrial production*Industrial production*
China East Asia EUJapan US Other
2013 2017-4
0
4
%
* Smoothed contributions to year-ended growthSources: CEIC Data; CPB; IMF; Markit Economics; RBA; Thomson
Reuters; United Nations
household incomes have been supported by strong employment growth in most advanced economies; consumption growth has been above average for a number of years.

R E S E R V E B A N K O F AU S T R A L I A6
Spare capacity has diminished further, with many economies growing at rates above potential growth. In particular, unemployment rates in a number of advanced economies have declined to multi-decade lows and are a bit lower than most estimates of full employment. Yet wage growth and core consumer price inflation globally have remained subdued to date (Graph 1.3). Some pick-up in inflation is expected over the next year or two. Oil and other commodity prices have increased, which has contributed to a broader build-up of price pressures on the producer side. Inflation expectations have also increased over the past year as spare capacity has diminished further.
Graph 1.4
Graph 1.3Global Inflation*
Year-endedConsumer pricesAdvanced economies
20122007 2017-1
0
1
2
3
4
%
Headline
Core***
Producer prices**
20122007 2017-8
-4
0
4
8
12
%
* Selected economies; PPP GDP-weighted** Core series is an aggregate of selected advanced economies*** Excludes food and fuelSources: CEIC Data; Eurostat; IMF; RBA; Thomson Reuters
China and Asia-PacificIn China, GDP growth remained solid in 2017. Growth was supported by fiscal spending and continued rapid growth in aggregate financing. Consumption continued to be the main driver of growth in the year, and net exports contributed as global economic conditions improved further (Graph 1.4). Growth in investment slowed overall, which reflected a softening in property and manufacturing investment growth, while public
ConsumptionInvestmentNet exports
2013200920052001 2017-5
0
5
10
ppt
-5
0
5
10
pptChina – Contributions to GDP Growth
GDP growth(per cent)
Sources: CEIC Data; RBA
spending on infrastructure was resilient up until the closing months of the year. At the Central Economic Work Conference, which was held in mid December, the Chinese Government signalled continuity in economic policy for 2018. It also reiterated the focus on controlling financial risks and the growth of debt, eliminating excess capacity, supporting industrial upgrading, and reducing pollution.
On the production side of the economy, the services (tertiary) sector continued to be the main contributor to growth. In the industrial sector, overall growth in production has been stable, but a range of other indicators suggest some softening of conditions (Graph 1.5). Output declined for a large number of industrial products towards the end of 2017; growth in revenues and profits has eased in numerous manufacturing sub-industries in recent months. The easing in industrial conditions can be partly attributed to environmental policies that restricted output in a range of heavily polluting industries in 28 cities during China’s winter months. The steel sector experienced noticeably weaker activity as a result of these restrictions, which were implemented from late October; iron ore imports (including from Australia) have been relatively steady in recent months, but Chinese iron ore production has declined significantly.

S TAT E M E N T O N M O N E TA R Y P O L I C Y | F E B R UA R Y 2018 7
Graph 1.5
Graph 1.6
prices, as well as more recent supply cuts due to environmental restrictions on output. Producer price inflation eased towards the end of the year, consistent with slower growth in economic activity.
Housing price inflation in China has continued to ease in recent quarters (Graph 1.6). The authorities have tightened restrictions on housing purchases and loan-to-value ratios over the past year. Indicators of residential activity remain subdued; growth in sales and residential investment have moderated. Recent policy statements suggest that the central government continues to be focused on discouraging speculative real estate investment while supporting investment in rental accommodation and the renovation of unused commercial property for residential rental use.
China – Residential Property IndicatorsYear-ended growth
New property prices
0
10
20
% Investment
0
20
40
%
Floor space sold
20142011 2017-50
0
50
100
% Inventory
20142011 2017-25
0
25
50
%
Sources: CEIC Data; RBA
China – Industrial ProductionYear-ended growth
2013 2017-10
0
10
%
Gross output
Value-added
2013 2017-15
0
15
%
Crude steel
Steel products
Electricitygeneration
Sources: CEIC Data; RBA
To cut pollution and reduce dependence on coal-fired power, the Chinese authorities have also taken measures to encourage firms and households to switch to gas (including by reducing gas prices for business use). Increased gas demand was partly met by strong growth in liquefied natural gas imports in 2017. Subsequent reports of some households experiencing freezing conditions due to gas shortages prompted authorities to relax restrictions on the use of coal for heating in certain locations. In December, the government released a plan to phase out 70 per cent of coal-fired heating systems in northern Chinese cities by 2021 and announced a plan to develop a nationwide carbon trading scheme in the next couple of years.
Inflation in China rose a little over the past few quarters, partly driven by higher fuel prices. Core inflation (which excludes food and energy prices) has edged higher since early 2016 and has been supported by upstream price pressures and continued policy accommodation. However, headline inflation remained below the authorities’ upper bound of 3 per cent in 2017. Producer price inflation was elevated over 2017, partly reflecting the pick-up in commodity
Total social financing grew by 12 per cent in 2017, which is consistent with the target set by the State Council. Estimates of the non-financial sector debt-to-GDP ratio therefore rose over the year (Graph 1.7). Financing for the corporate sector continued to grow broadly in line with GDP over 2017, but corporate borrowers have substituted towards more traditional financing channels

R E S E R V E B A N K O F AU S T R A L I A8
‘shadow banking’ activities, including internet-based loan finance.
GDP growth in east Asia (excluding China and Japan) increased to around its post-crisis average in late 2017, reflecting the recovery in growth of the high-income economies in the region (Graph 1.8). The upturn in global trade over 2017 supported this recovery because many of these economies are closely integrated in global production chains. The electronics sector – particularly the semiconductor industry – has played an important role in the recovery and was buoyed by strong demand from China to meet both Chinese domestic demand and demand for inputs into global production chains. Strong semiconductor demand has also boosted business investment, but has had little effect on employment growth because the industry is not labour intensive and has only weak connections to other domestic industries. Nonetheless, the overall improvement in economic conditions has contributed to stronger consumer confidence and retail sales growth in some of the higher-income economies in the region; this is likely to support consumption and near-term growth more broadly. In the middle- income east Asian
Graph 1.8
Graph 1.7
Corporate debtHousehold debtGovernment debt
201320092005 20170
50
100
150
200
%
0
50
100
150
200
%
China – Non-financial Sector Debt*Per cent of nominal GDP
* Seasonally adjusted by RBASources: CEIC Data; RBA
East Asia – Economic IndicatorsYear-ended
GDP growth*
0
5
10
%
High-income**
Core inflation
2
4
6
%
Middle-income***
Exports growth
20122007 2017-20
-10
0
10
20% Domestic final demand growth
20122007 2017-8
-4
0
4
8%
* Estimate for December quarter 2017** Hong Kong, Singapore, South Korea and Taiwan*** Indonesia, Malaysia, Philippines and ThailandSources: CEIC Data; IMF; RBA; Thomson Reuters
in response to tighter regulation of financing outside the formal banking system. Household credit expanded at a rapid pace over 2017, despite slower growth in mortgage borrowing in response to constraints on property purchases and borrowing. Government debt also grew strongly, reflecting continued support for public investment. Average nominal bank lending rates have remained relatively low, although they did edge higher in 2017.
In recent months, the authorities have taken additional measures to tighten financial regulation and strengthen oversight of ‘shadow banking’ activity (see ‘International and Foreign Exchange Markets’ chapter). Financial regulators jointly published updated rules for the asset management industry (a central part of the ‘shadow banking’ sector). These rules, which are scheduled to be implemented in 2019, aim to make regulations more consistent across financial institutions, reduce opportunities for regulatory arbitrage and improve risk management. Additional measures have also been announced that aim to increase oversight of entrusted lending (a form of inter-company financing in which banks act as agents) and a range of smaller

S TAT E M E N T O N M O N E TA R Y P O L I C Y | F E B R UA R Y 2018 9
Graph 1.9
Graph 1.10
population growth has sustained private consumption growth. However, growth in both residential investment and housing prices eased over 2017. Housing market developments have been influenced by the tightening of loan-to-value and investor housing lending restrictions in 2016 by the Reserve Bank of New Zealand (RBNZ), as well as supply constraints in the construction sector. More recently, the RBNZ announced some easing of its loan-to-value lending restrictions, and there has been a modest pick-up in residential investment growth and building approvals. Accommodative monetary policy, as well as increased government spending announced by the recently elected government, should also support growth in the period ahead.
The supply of labour has grown strongly in New Zealand, driven by high net immigration and a marked rise in the participation rate. Employment growth remains very high and the unemployment rate has declined to its lowest level since 2009. Nominal wage growth remains subdued, however, and growth in labour productivity has been weak. Inflation has increased over the past two years and is close to the RBNZ’s target.
India – GDP Growth and InflationYear-ended
GDP growthGDP growth
20122007 2017-4
0
4
8
12
%
Quarterly*
Inflation
20122007 2017-5
0
5
10
15
%
Excluding foodand fuel
* Seasonally adjusted by RBASources: CEIC Data; RBA
economies, private consumption growth has continued to be resilient. Across the east Asian region, headline and core inflation remain subdued. Overall, monetary and fiscal policies remain accommodative and were little changed over the past year.
In India, GDP growth has moderated over the past couple of years, to around 6 per cent (Graph 1.9). Growth in private investment was subdued; a contributing factor has been weak supply of credit from state-owned banks, which have been constrained by high levels of bad debt in recent years. The Indian Government’s recapitalisation plan for state-owned banks over the next two years is therefore expected to support investment. CPI inflation has picked up since mid 2017 – partly because food price inflation and housing rent allowances for public sector employees have both increased – to be above the Reserve Bank of India’s medium-term inflation target of 4 per cent. Inflation may ease in coming months, however, following a decision by India’s Goods and Services Tax Council to revise down tax rates on a broad range of items.
New Zealand GDP growth was around its long-run average over 2017 (Graph 1.10). Strong
New Zealand – Economic IndicatorsYear-ended
GDP component contributionsGDP component contributions
-3
0
3
6ppt
Consumption
OtherTotal
Residential investment
Housing price growthSmoothed
-8
0
8
16%
Unemployment rate
20122007 20173
4
5
6
7% Inflation
20122007 2017-2
0
2
4
6%
Headline
Trimmed mean
Sources: RBA; REINZ; Statistics NZ; Thomson Reuters

R E S E R V E B A N K O F AU S T R A L I A1 0
Major Advanced EconomiesGDP in the major advanced economies grew faster than estimates of potential growth over 2017, partly driven by stronger business investment growth (Graph 1.11). In the euro area, GDP growth has increased to its highest rate since 2011 and the increase has been broad based across the member countries.
Graph 1.12
Graph 1.11Major Advanced Economies –
GDP and ComponentsYear-ended growth
GDP
0
2
4
%
US
Business investment
0
6
12
%
Euro area*Private consumption
2013 2017-6
-3
0
3
% Residential investment
2013 2017-20
-10
0
10
%
Japan
* Business investment is public and private non-residential investment;excludes Ireland due to data measurement issues
Sources: RBA; Thomson Reuters
Growth in the major advanced economies is expected to continue to exceed potential over the next two years, which should ultimately lead to higher inflation. Monetary policy has been supporting growth for nearly a decade and is expected to remain expansionary even as some central banks move to a less accommodative stance. Fiscal policy has become less contractionary over the past year or two, particularly in the United States, and this has also supported growth (Graph 1.12). The recent tax changes in the United States will boost activity over the next two years, although the expected consumption tax increase in Japan in late 2019 is likely to subtract from growth there in the subsequent year.
Major Advanced Economies –Structural Fiscal DeficitsPer cent of potential GDP, annual
US
2013 20210
3
6
9
%
Incomingadministration**
Tax changes**
Euro area*
2013 2021
IMFforecast***
Japan
2013 20210
3
6
9
%
* RBA potential GDP estimate from 2019** CBO estimate of increase in deficit from theTaxCuts and Jobs Act (2017); adjusted to calendar year*** IMF forecasts from latest WEO; 2017 figures are an estimate
Sources: CBO; RBA; Thomson Reuters
Business investment picked up across the major advanced economies over 2017, to be above long-run average growth rates; however, investment remains below its pre-crisis level in the euro area. Machinery and equipment investment has been the main driver of this growth. A range of indicators point to continued strong business conditions, particularly in manufacturing, and investment intentions are especially elevated in the United States, partly owing to the recent tax changes (Graph 1.13).
Household consumption growth remained at above-average rates in the United States and the euro area over 2017, and recovered somewhat in Japan. It has been supported by robust employment growth as well as a modest pick-up in wage growth. This should continue – and even strengthen – in the period ahead as labour markets tighten further. In the United States, the reduction in personal income taxes should also boost consumption growth over the next couple of years. Residential investment growth has eased across the major advanced economies, although it remains above its long-run average rate in the euro area. In the United States, housing market

S TAT E M E N T O N M O N E TA R Y P O L I C Y | F E B R UA R Y 2018 1 1
Graph 1.13 Graph 1.14
activity picked up in the December quarter, in part reflecting rebuilding after hurricane-related damage in the previous quarter.
Labour markets in the major advanced economies have tightened significantly over recent years. Unemployment rates are at multi-decade lows in the United States, Japan and some European economies (such as Germany and the United Kingdom). For the euro area in aggregate, the unemployment rate has declined to a nine-year low; the decline has been broad based, but unemployment rates vary significantly across the member states. Unemployment rates in the major advanced economies have fallen to below the rates consistent with most estimates of full employment (the non-accelerating inflation rate of unemployment or NAIRU). The NAIRU estimates are subject to significant uncertainty, however, and have been repeatedly revised lower since 2012 for a range of advanced economies as actual unemployment rates have declined without inflation picking up (Graph 1.14). The modest pick-up in wage growth and continuing subdued inflation may indicate that there is more spare capacity than is implied by the current NAIRU estimates.
A range of other measures suggests that labour markets are tight (Graph 1.15). Survey measures of employment conditions have reached record highs across the major advanced economies. Job vacancies (as a ratio to the number of unemployed) have increased strongly in the United States and Japan, where they are around record highs. The vacancy ratio has increased only a little in the euro area, but is high relative to its history. Participation rates have increased in Japan, supported by increasing female
Major Advanced Economies – InvestmentIntentions and Business SentimentUnited States
2008 2018-4
-2
0
2
st dev Euro area
2007 2017
(LHS)
Businesssentiment
Japan
2007 2017-6
-3
0
3
%
Intentions*(RHS)
* Investment intentions mapped to year-ended national accountsinvestment growth
Sources: RBA; Thomson Reuters
Major Advanced Economies –Unemployment Rates*
United StatesLHS
2007 20173
6
9
12
%
Unemploymentrate
Euro areaLHS
2007 2017
2007
2009
JapanRHS
2007 20172
3
4
5
%
2016
2017
20152012
* Line represents NAIRU estimate made that yearSources: CBO; OECD; RBA; Thomson Reuters
Graph 1.15Major Advanced Economies –Labour Market IndicatorsSurveys*
-1.5
0.0
1.5
st dev
US
Euro area
0.5
1.0
1.5
ratio
Japan
Vacancies to unemployedratio
Participation rate
20112005 201754
58
62
66
% Underemployment rate**
20112005 20170
3
6
9
%
* Simple average of multiple employment and labour market surveys** Involuntary part-time and marginally attached workers as a shareof extended labour force
Sources: Eurostat; MIC; OECD; RBA; Thomson Reuters

R E S E R V E B A N K O F AU S T R A L I A1 2
Graph 1.17Major Advanced Economies –Inflation and Expectations
Year-endedHeadline inflation
0
3
%
Euro area
Core inflation
0
3
%
US*
Consumer expectations**
20122007 2017-4
0
4
% Market expectations***
20122007 2017-2
0
2
%
Japan****
* PCE inflation** One year ahead; euro area series is a diffusion index mapped tohistorical inflation*** Monthly average of 5–10 year ahead inflation expectations impliedfrom inflation swaps**** Excludes the effects of the consumption tax increase in April 2014
Sources: Bloomberg; Consensus Economics; ECB; RBA; Thomson Reuters
months in the United States and Japan and has been steady in the euro area. Headline inflation was higher in 2017 in all three economies, driven by higher oil prices. Market measures of inflation expectations are above their post-crisis troughs and have increased a little further recently. Consumer inflation expectations have been steady in the United States and Japan, but have increased in the euro area over the past year. As spare capacity diminishes, central banks in the major advanced economies expect inflation to increase towards the central banks’ targets over the next few years.
Economic developments in the United Kingdom have differed from those in the major advanced economies over the past year or so. GDP growth slowed a little and inflation has picked up strongly due to the depreciation of the pound following the Brexit vote. As a result, real wage growth has fallen sharply and was negative for most of 2017, consumer confidence declined to be below average and consumption growth has slowed. Growth in business investment has
participation, and have been little changed in the euro area and the United States at a time when population aging might have been expected to induce declines. Underemployment rates have also been declining. In the United States and Japan they have fallen to below or around their pre-crisis troughs, but underemployment remains elevated in the euro area suggesting that there may be more spare capacity there than indicated by the unemployment rate.
Wage growth has picked up a little across the major advanced economies over recent years, but it is well below its pre-crisis average in the euro area (Graph 1.16). In Japan, the increase in wage growth has been most pronounced in the more flexible part-time sector. One reason for the limited pick-up in wage growth might be that labour productivity growth has been slow for many years in these economies.
Graph 1.16Major Advanced Economies –Wages and Productivity
Year-ended growth
Wages*
20112004 2018-2
0
2
4
%
Euro area
Japanpart-time
Japan full-time
ProductivitySmoothed
20112005 2017-2
0
2
4
%
US
Japan
* Average hourly earnings for the US; compensation per employee forthe euro area; smoothed average full-time scheduled wages andpart-time hourly wages for Japan
Sources: CEIC Data; ECB; RBA; Thomson Reuters
With significant wage pressures yet to emerge, core inflation has remained low in the major advanced economies (Graph 1.17). Core inflation fell noticeably in the United States in 2017, although this largely reflected temporary factors. Core inflation has increased a little in recent

S TAT E M E N T O N M O N E TA R Y P O L I C Y | F E B R UA R Y 2018 1 3
Graph 1.18Commodity Prices
January 2010 average = 100
20152012 201825
50
75
100
125
150
index
(spot prices)
Rural*
Base metals*
Bulk*
20152012 201820
40
60
80
100
120
US$/b
Brent crude oil
* RBA Index of Commodity Prices (ICP) sub-indices; SDRSources: Bloomberg; RBA
also eased, despite relatively strong conditions in the manufacturing sector owing to the pick-up in global trade and the exchange rate depreciation. Uncertainty about the future EU–UK relationship and the higher cost of imported investment goods are likely to be constraining investment. Despite these developments, the labour market has remained tight and reports of difficulties in recruiting suitable labour are becoming increasingly widespread.
Commodity PricesGlobal commodity prices were generally higher over recent months, led by bulk commodity prices, reflecting continued strength in demand and a range of supply-side factors (Graph 1.18). The spot price of iron ore has rebounded, coking coal prices have increased significantly and oil prices have continued to rise (Table 1.1). Rural prices are slightly higher, while base metals prices continue to be supported by the improvement in global economic conditions and reduced supply following production cuts in China. As discussed in the ‘Economic Outlook’ chapter, Australia’s terms of trade are expected to decline over the forecast period, consistent with lower Chinese demand and further increases in low-cost supply of bulk commodities. However, there is a risk of some near-term volatility given the interplay between demand for steel, environmental restrictions in China and temporary supply disruptions.
The spot price of iron ore has increased sharply since the previous Statement, retracing the decline over the previous quarter (Graph 1.19). Prices have been supported by Chinese import demand, which has remained at a high level despite cuts to steel production in a number of Chinese regions for environmental reasons; constraints on heavily polluting activities are expected to remain in place until mid
2016201420122010 20180
50
100
150
US$/t
0
200
400
600
US$/tChinese Steel and Iron Ore Spot Prices
Chinese steel*
Iron ore**
(RHS)
(LHS, fines)
* Average of hot rolled steel sheet and steel rebar prices** 62% Fe index; free on board basisSources: Bloomberg; RBA
Graph 1.19
March. Elevated Chinese steel prices have also reportedly increased expectations that steel production, and therefore demand for iron ore, may increase after winter. There continues to be a large premium for higher-quality iron ore products, partly because Chinese steel producers are trying to minimise pollution by favouring high-quality iron ore.
The spot price of hard coking coal has also increased notably since the previous Statement, partly because congestion and maintenance at key ports in Queensland has constrained supply (Graph 1.20). The spot price of thermal coal is

R E S E R V E B A N K O F AU S T R A L I A1 4
Table 1.1: Commodity Price Growth(a)
SDR, per cent
Since previous Statement Over the past yearBulk commodities 19 2
– Iron ore 24 –16
– Coking coal 20 24
– Thermal coal 3 24
Rural 2 0
Base metals 1 13
Gold –1 0
Brent crude oil(b) 3 21
RBA ICP 11 –2
– Using spot prices for bulk commodities 11 3(a) Prices from the RBA Index of Commodity Prices (ICP); bulk commodity prices are spot prices(b) In US dollarsSources: Bloomberg; IHS; RBA
Oil prices increased to their highest level in over three years, but have eased recently. Prices were supported by an agreement between the Organization of the Petroleum Exporting Countries (OPEC) and non-OPEC countries to extend the production cap, as well as the improvement in the near-term outlook for global oil demand. R
Coal PricesFree on board basis
Thermal coal
20152012 20180
50
100
150
US$/t
Contract
Spot
Hard coking coal
20152012 20180
100
200
300
US$/t
Sources: Department of Industry, Innovation and Science; IHS; RBA
Graph 1.20
slightly higher since the previous Statement. Prices have been supported by a number of factors over the past few months, including industrial disputes at mines in New South Wales and strong global manufacturing activity. More recently, prices have also been supported by demand from China, after authorities relaxed import restrictions on thermal coal following gas shortages.

S TAT E M E N T O N M O N E TA R Y P O L I C Y | F E B R UA R Y 2018 1 5
2. International and Foreign Exchange Markets
Financing conditions remain accommodative for borrowers amid a broad-based improvement in economic conditions globally. The prices of equities and emerging market assets are considerably higher than a year ago, and credit spreads on corporate bonds have tightened from already narrow levels. More recently, however, the prices of equities have fallen, and measures of market volatility have risen. This has been in part due to an increase in sovereign bond yields, which have risen alongside expectations that some central banks will reduce monetary policy accommodation more quickly than previously thought. Nevertheless, yields remain low by historical standards. This reflects expectations that inflation will remain low in many countries and that the withdrawal of stimulus by central banks will be gradual and limited.
In some advanced economies, central banks have already begun to move to less accommodative monetary policy settings in response to tighter labour markets and the prospect of growth remaining above trend. In particular, some central banks have increased their policy rates and some have ceased or reduced their pace of asset purchases (with further reductions anticipated later in the year). Many central banks in emerging markets have also indicated that their easing cycles are complete. In China, authorities have continued to address risks in the financial system by pursuing tighter regulatory policies that limit credit creation by non-bank entities. This has contributed to a tightening in Chinese financial market conditions.
Most currencies, including the Australian dollar, have appreciated against the US dollar.
Central Bank PolicyThe gradual unwinding of very accommodative monetary policy settings by some central banks has continued in recent months. This has occurred as the global economy has strengthened and spare capacity in labour markets has diminished, prompting expectations that inflationary pressures will eventually build. Market participants expect that policy rates in a number of advanced economies will rise over the coming year and that net asset purchases by central banks will decline substantially (Graph 2.1; Graph 2.5).
Policy Rates*US
1
2
3
%
FOMC medianprojections (Dec)
StatementPrevious
Euro area
-0.4
-0.3
-0.2
%
Current
UK
2017 20210.0
0.5
1.0
1.5
% Canada
2017 20190.0
0.5
1.0
1.5
%
* Dashed lines indicates market expectationsSources: Bloomberg; Board of Governors of the Federal Reserve System;
RBA; Thomson Reuters
Graph 2.1
The US Federal Reserve has continued to remove monetary stimulus gradually. In December, it increased its policy rate by 25 basis points, the third increase in 2017 (Table 2.1). It has also continued to reduce its holdings of US Treasuries and mortgage-backed securities according to its earlier announced plans for a gradual reduction in its balance sheet. The Federal Reserve has noted that the economic outlook remains strong

R E S E R V E B A N K O F AU S T R A L I A1 6
and that the recent reductions in US business and personal taxes are likely to provide a modest boost to demand. The majority of Federal Open Market Committee (FOMC) participants have judged that much of the recent softness in inflation has reflected transitory factors and that tightness in the labour market will spur higher inflation this year. Some FOMC participants have also observed that broader financial conditions remain accommodative, despite the gradual removal of monetary stimulus, and that the persistence of highly accommodative financial conditions could pose risks to financial stability.
FOMC participants expect to increase the policy rate by a further 75 basis points this year. Market participants’ expectations for the level of the policy rate have increased over the past few months, but they remain below the FOMC’s median projections beyond 2018.
The European Central Bank (ECB) has maintained very accommodative policy settings. In January, the ECB reduced its pace of net asset purchases from €60 billion to €30 billion per month, in line with previously announced plans. The ECB has stated that asset purchases will continue until at least September, or longer if needed to support a sustained rise in inflation, and it does not expect to raise its policy rate until well beyond that time. However, the ECB has indicated that its forward guidance could soon be revisited because the broad-based improvement in economic conditions across the euro area has given it greater confidence that inflation will rise towards the target. Market pricing implies that the ECB is expected to begin to raise its policy rate in early 2019.
The Bank of Japan (BoJ) has left its policy settings unchanged since late 2016. It expects inflation to pick up towards its target over the coming years as economic growth remains above potential and the labour market remains tight. Under the BoJ’s policy of ‘yield curve control’, it continues to purchase Japanese government bonds to maintain the yield on 10-year bonds around zero. The volume of bonds the BoJ has needed to buy to meet this target has declined noticeably since the policy was introduced (Graph 2.2). The BoJ has noted that, given its now large holdings of Japanese government bonds, further purchases are likely to have a bigger impact on bond yields than was the case initially. The BoJ has stated that it is too early to discuss the timing of an exit from its extremely accommodative policy settings.
The Bank of Canada (BoC) increased its policy rate by 25 basis points in January to 1.25 per cent. The BoC observed that the economy is operating at
Table 2.1: Monetary Policy
Policy rate
Per cent
Most recent change
Euro area(a) –0.40 ↓ Mar 16Japan(a) –0.10 ↓ Jan 16United States(b) 1.375 ↑ Dec 17
Australia 1.50 ↓ Aug 16Brazil 6.75 ↓ Feb 18Canada 1.25 ↑ Jan 18Chile 2.50 ↓ May 17India 6.00 ↓ Aug 17Indonesia 4.25 ↓ Sep 17Israel 0.10 ↓ Feb 15Malaysia 3.25 ↑ Jan 18Mexico 7.25 ↑ Dec 17New Zealand 1.75 ↓ Nov 16Norway 0.50 ↓ Mar 16Russia 7.75 ↓ Dec 17South Africa 6.75 ↓ Jul 17South Korea 1.50 ↑ Nov 17Sweden –0.50 ↓ Feb 16Switzerland(b) –0.75 ↓ Jan 15Thailand 1.50 ↓ Apr 15Turkey 8.00 ↑ Nov 16United Kingdom 0.50 ↑ Nov 17(a) Marginal rate paid on deposits at the central bank(b) Midpoint of target rateSources: central banks; RBA; Thomson Reuters

S TAT E M E N T O N M O N E TA R Y P O L I C Y | F E B R UA R Y 2018 1 7
around capacity and that inflation is close to target. However, it noted that uncertainty surrounding the future of the North American Free Trade Agreement (NAFTA) is clouding the economic outlook. Market participants expect the BoC to increase the policy rate by a further 50 basis points over 2018.
In Sweden, the Riksbank ended its asset purchase program in December, though reinvestments of maturing assets will continue. The Riksbank noted that expansionary monetary policy settings have supported economic activity and have been necessary to maintain inflation around target. The Riksbank expects to begin to raise the policy rate gradually around the middle of 2018.
Sovereign Debt MarketsGovernment bond yields in advanced economies have risen in recent months (Graph 2.3). The rise has occurred as market participants have increased their expectations for the withdrawal of monetary policy accommodation by central banks and after the US government passed tax cuts. In the United States, a large part of the rise in yields reflects an increase in market-based measures of inflation compensation. This is consistent with the recent modest pick-up in inflation and wage outcomes. It also suggests
Graph 2.2Bank of Japan Purchases
of Japanese Government Bonds
40
80
¥tr
40
80
¥tr
Yield curvecontrol
(six-month annualised)Net purchases
20172016201520142013 2018-0.5
0.0
0.5
%
-0.5
0.0
0.5
%
10-year Japanesegovernment bond yield
Sources: Bloomberg; RBA; Thomson Reuters
2017201620152014 2018-0.5
0.0
0.5
1.0
1.5
2.0
2.5
3.0
%
-0.5
0.0
0.5
1.0
1.5
2.0
2.5
3.0
%10-year Government Bond Yields
US
Japan
GermanyUK
Canada
Source: Bloomberg
that market participants expect that the US tax measures will stimulate demand more so than supply and hence add to inflation more so than to long- term growth.
Over the past year, yield curves have flattened substantially (Graph 2.4). This has been especially evident in Canada, the United States and the United Kingdom, where central banks have increased their policy rates and short-term yields have risen in response. In contrast, long- term yields have risen less and remain at low levels by historical standards. In part this reflects a view that the real neutral interest rate is likely to remain low and the benign outlook that market participants have for inflation, both of which imply lower long- term yields than otherwise. While some analysts note that a flattening yield curve has presaged economic slowdowns in the past, the slope of the yield curve remains positive and around levels that have been consistent with reasonable growth in the past.
There is some risk that government bond yields could rise significantly further over the coming year. One factor that could lead to such a rise in government bond yields is the scaling back of central banks’ purchases and the resulting increase in the net supply of government bonds available to the market (Graph 2.5). Nevertheless,
Graph 2.3

R E S E R V E B A N K O F AU S T R A L I A1 8
Net government issuance**Net purchases (inverted)***
2015201220092006 2018-2 000
-1 000
0
1 000
2 000
3 000
US$b
-2 000
-1 000
0
1 000
2 000
3 000
US$b
Net Issuance of Sovereign Bondsand Central Bank Purchases*
Net new supplyavailable to market
Projection
* Aggregated data for euro area, Japan, UK and US** 2018 projection based on official estimates*** 2018 projections based on central bank guidance; BoJ purchasesprojected to continue at recent pace
Sources: central banks; national sources; RBA; Thomson Reuters
20122006200019941988 2018-100
0
100
200
bps
-100
0
100
200
bps
Slope of US Treasury Yield CurveSpread between 10-year and 2-year yields
Source: Bloomberg
Graph 2.4 and less favourable funding conditions for businesses, households and governments.
Credit MarketsCredit market conditions for corporations remain favourable. In line with the trend of 2017, the spread between yields on corporate and government bonds has declined further in recent months (Graph 2.6). In most market segments, corporate bond spreads are at their lowest levels since the financial crisis. The favourable financial conditions for corporations have been supported by the strengthening global economy, and resulting pick-up in corporate earnings and decline in default rates, as well as a decline in macroeconomic volatility. These conditions encouraged corporate bond issuance over 2017, though issuance slowed into the year end. As noted in the Bank’s October 2017 Financial Stability Review, some investors may be underestimating the downside risks they face.
Conditions in US dollar money markets tightened markedly toward the end of last year. Financial market intermediaries reduced their US dollar lending as they sought to minimise the size of their balance sheets over the year-end period for regulatory purposes (Graph 2.7). Conditions
Graph 2.5
Corporate Bond SpreadsTo equivalent government bonds
Investment grade
20112004 20180
150
300
450
600
bps
Euro
US dollar
Non-investment grade
20112004 20180
500
1 000
1 500
2 000
bps
Sources: Bloomberg; ICE BAML; RBA
Graph 2.6
central banks’ holdings of bonds are likely to remain substantial and the reduction in central bank purchases is generally expected to have only a modest effect on yields. Government bond yields could also rise sharply if inflation increases by more than is expected, which could lead to a rise in inflation risk premia and a larger increase in central bank policy rates than is currently expected. Higher yields on government bonds could lead to a significant repricing of many other assets, resulting in losses for investors

S TAT E M E N T O N M O N E TA R Y P O L I C Y | F E B R UA R Y 2018 1 9
US Dollar Money MarketsCross-currency basis*
Against the US dollar, inverted
20162014 201830
0
-30
-60
-90
bps
Euro
Japanese yen
General collateral repo**Spread to Fed reverse repo
20162014 2018-40
0
40
80
120
bps
* Three-month term** Overnight termSources: Bloomberg; Board of Governors of the Federal Reserve; DTCC
Graph 2.7
2017201520132011 2019-10
0
10
%
-10
0
10
%Global Earnings per Share Growth*
Forecasts
* 2017 is an estimateSource: Thomson Reuters
Graph 2.9
Equity Valuations*12-month forward price-earnings ratio
20092000 20180
10
20
30
40
ratio
US
Euro area
20092000 20180
10
20
30
40
ratio
Japan
Average since1988
* Latest observations estimated by RBASources: RBA; Thomson Reuters
Graph 2.10
in US dollar funding markets have eased in early 2018, particularly in foreign exchange swap and repo markets.
Equity MarketsEquity prices have fallen recently following a rise in sovereign bond yields (Graph 2.8). Market participants have begun to reassess the outlook for global inflation and the speed of withdrawal of monetary accommodation. Measures of market volatility have increased after a prolonged period during which they were very low (see ‘Box A: The Period of Low Volatility in Financial Markets’). Nonetheless, equity prices are much higher than a year ago, reflecting the strengthening global economy and expectations of ongoing strength in corporate earnings over the next few years (Graph 2.9). Increases in equity prices over the past year have outpaced the growth in expected earnings and, as a result, measures of valuation have risen in a number of sharemarkets (Graph 2.10).
In the United States, equity prices have been supported by recent tax cuts which are likely to boost corporate earnings. The corporate tax rate has been lowered from 35 per cent to 21 per cent and there have also been reductions
M M MJ JS SD D20172016 2018
60
80
100
120
140
index
60
80
100
120
140
index
Major Share Price Indices1 January 2016 = 100
Euro area
US
Japan
Source: Bloomberg
Graph 2.8

R E S E R V E B A N K O F AU S T R A L I A2 0
in personal taxes. Market analysts estimate that the tax cuts will increase the after-tax earnings of large US companies by around 7–9 per cent in 2018. The tax measures also implement a territorial tax system whereby the bulk of US companies’ overseas earnings will no longer be subject to US tax. To encourage companies to repatriate some of the estimated US$2–3 trillion of prior overseas earnings that are held offshore, all of these earnings will be subject to a one-off tax (at a lower rate) instead of being taxed upon repatriation as previously occurred.
Despite their recent fall, share prices in Japan have increased considerably since the re-election of Prime Minister Abe in October, which reinforced expectations that stimulatory economic policies would continue. Prices have also been supported by solid growth in the earnings of Japanese companies, boosted by strong demand from east Asia.
European equity prices have increased by less than those in other markets over the past year or so. This is partly due to the appreciation of the euro over the period, which has weighed on the equity prices of exporters and import-competing companies. The sectoral composition of the European market also helps to explain the less vigorous growth of European equity prices. In particular, the technology sector (for which share prices globally increased by more than any other sector over the past year) accounts for a smaller share of the European market than of the US and Asian markets.
Emerging MarketsGlobal demand for emerging market assets has been very strong over the past year. Foreign capital has flowed into these markets, supporting an increase in equity prices over the year, a decline in bond yields and, more recently, an appreciation of a number of emerging market currencies (Graph 2.11). These trends reflect the improved
Emerging Financial Markets
100
200
indexShare prices*
75
150
%Flows into equity funds***
20132008 20185
7
9
%Government bond yields**
20132008 2018-500
0
500
%
Flows into bond funds***
* 1 January 2005 = 100** Local-currency denominated*** Cumulative since end 2004, per cent of initial assets undermanagement
Sources: Bloomberg; EPFR Global; JPMorgan; Thomson Reuters
Graph 2.11
economic outlook for emerging markets, which has been supported by ongoing strength in global growth, a pick-up in global trade flows and an increase in commodity prices. Investors’ ongoing search for yield in the global environment of low interest rates has also contributed to strong demand for emerging market assets.
In some cases, the prices of emerging market assets have also been supported by an easing of monetary conditions, which has encouraged domestic activity. Central banks in many emerging markets lowered their policy rates over the past few years as inflationary pressures abated. In a number of countries, particularly Brazil and Russia, policy rates were lowered significantly in response to substantial falls in inflation from very high levels and weakness in economic growth. In recent months, monetary policy settings in many emerging markets have been held relatively steady as inflation has stabilised around target levels.
Chinese Financial MarketsChinese authorities have continued to implement measures to address risks in the financial system. These measures have focused
S TAT E M E N T O N M O N E TA R Y P O L I C Y | F E B R UA R Y 2018 2 1
201320092005 20170
50
100
150
200
%
0
50
100
150
200
%
China – Total Credit*Per cent of nominal GDP
Total credit
Bank credit
Shadow credit**
* Total credit is the sum of bank credit and shadow credit; seasonallyadjusted** RBA estimate; data available to September 2017
Sources: CEIC Data; RBA; WIND Information
Graph 2.12
M M MJ JS SD D20172016 2018
2
3
4
5
6
%
2
3
4
5
6
%Chinese Money Market Rates
Seven-day repo
Three-month SHIBOR*
PBC seven-day dealing rate
* SHIBOR is an average of the rate at which large banks say they willlend unsecured funds to other banks
Source: CEIC Data
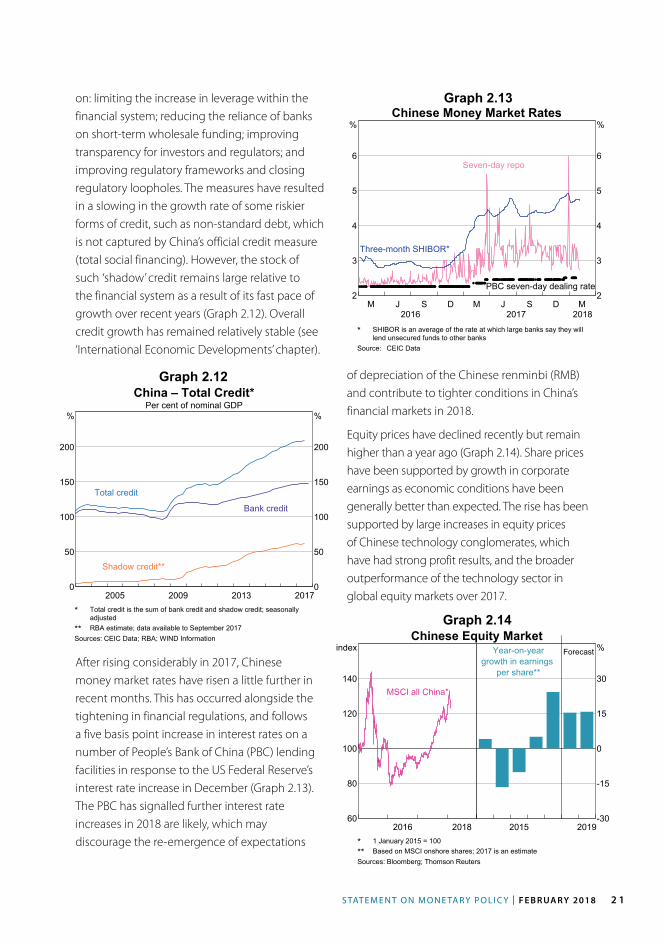
Graph 2.13on: limiting the increase in leverage within the financial system; reducing the reliance of banks on short-term wholesale funding; improving transparency for investors and regulators; and improving regulatory frameworks and closing regulatory loopholes. The measures have resulted in a slowing in the growth rate of some riskier forms of credit, such as non-standard debt, which is not captured by China’s official credit measure (total social financing). However, the stock of such ‘shadow’ credit remains large relative to the financial system as a result of its fast pace of growth over recent years (Graph 2.12). Overall credit growth has remained relatively stable (see ‘International Economic Developments’ chapter).
After rising considerably in 2017, Chinese money market rates have risen a little further in recent months. This has occurred alongside the tightening in financial regulations, and follows a five basis point increase in interest rates on a number of People’s Bank of China (PBC) lending facilities in response to the US Federal Reserve’s interest rate increase in December (Graph 2.13). The PBC has signalled further interest rate increases in 2018 are likely, which may discourage the re-emergence of expectations
of depreciation of the Chinese renminbi (RMB) and contribute to tighter conditions in China’s financial markets in 2018.
Equity prices have declined recently but remain higher than a year ago (Graph 2.14). Share prices have been supported by growth in corporate earnings as economic conditions have been generally better than expected. The rise has been supported by large increases in equity prices of Chinese technology conglomerates, which have had strong profit results, and the broader outperformance of the technology sector in global equity markets over 2017.
Chinese Equity Market
2016 201860
80
100
120
140
index
MSCI all China*
2015 2019-30
-15
0
15
30
%ForecastYear-on-yeargrowth in earnings
per share**
* 1 January 2015 = 100** Based on MSCI onshore shares; 2017 is an estimateSources: Bloomberg; Thomson Reuters
Graph 2.14

R E S E R V E B A N K O F AU S T R A L I A2 2
2017201620152014 201890
95
100
105
110
index
7.0
6.8
6.6
6.4
6.2
yuanChinese Exchange Rates
(RHS, inverted scale)Yuan per US$
(LHS)TWI*
* Indexed to 1 January 2014 = 100Sources: Bloomberg; China Foreign Exchange Trade System; RBA
Graph 2.15
2017201620152014 20180.00
0.15
0.30
0.45
0.60
%
0.00
0.15
0.30
0.45
0.60
%
Foreign Exchange Market VolatilityDaily change; 66-day rolling standard deviation
Majorcurrencies*
Yuan per USdollar
* Average of the euro, Japanese yen, UK pound, Australian dollar andCanadian dollar against the US dollar
Sources: Bloomberg; RBA
Graph 2.16
Graph 2.17
The RMB has appreciated further against the US dollar in recent months, reaching its highest level since late 2015. The recent appreciation reflects the broad-based US dollar depreciation over the period, with the RMB appreciating modestly on a trade-weighted (TWI) basis (Graph 2.15). In January, the PBC changed the way it determines the daily fixing rate for the onshore RMB, suspending the mechanism that had allowed the PBC to apply discretion over the daily fix. The change was interpreted by the market as a step towards a more flexible RMB and could result in greater volatility in the RMB against the US dollar exchange rate; volatility in the exchange rate remains low relative to other currencies against the US dollar (Graph 2.16).
Current accountFDI private capital flowsNon-FDI private capital flowsReservesErrors & omissions
2015201320112009 2017-20
-10
0
10
%
-20
-10
0
10
%
China’s Balance of PaymentsQuarterly, per cent of GDP*
* Positive numbers indicate an inflow to China, negative numbersindicate an outflow from China
Sources: CEIC Data; RBA
depreciation. Also contributing was a pick-up in foreign lending to Chinese entities, a decline in Chinese companies’ extension of trade credit to foreigners, and an increase in foreign investment in Chinese debt instruments. In line with these modest net capital inflows, the value of the PBC’s foreign currency reserves has been little changed, at just above US$3 trillion.
A number of European central banks have noted that they plan to allocate some of their foreign currency reserve holdings to RMB, following
China continues to experience small net private capital inflows, which is in contrast to the large outflows seen in recent years (Graph 2.17). The reversal in private capital flows is consistent with the appreciation of the RMB against the US dollar over 2017 and the tighter enforcement of controls on outbound capital by the Chinese authorities. Non-FDI private capital inflows have been driven by an increase in foreign deposits of RMB with Chinese banks, in part reflecting the unwinding of expectations of RMB

S TAT E M E N T O N M O N E TA R Y P O L I C Y | F E B R UA R Y 2018 2 3
the ECB’s decision to do so last year. RMB assets currently only make up around 1 per cent of total global reserve holdings.
Foreign ExchangeThe US dollar has depreciated against a range of currencies over recent months and is notably lower than at the start of 2017 (Graph 2.18; Graph 2.19). In particular, the euro is around its highest level in recent years against the US dollar
2017201620152014 201870
80
90
100
110
120
index
70
80
90
100
110
120
index
Nominal Trade-weighted Exchange Rates1 January 2014 = 100
US dollar
Japanese yen
Euro
Canadian dollar
Sources: Bank of Canada; BIS; Bloomberg; Board of Governors of theFederal Reserve System
Graph 2.18
US DollarPercentage change over 2017
-10
-5
0
%
-10
-5
0
%
Percentage change since the start of 2018
Brazil
New
Zealand
Japan
Switzerland
Mexico
China
Canada
TWI
Singapore
Australia
Taiwan UK
Thailand
Malaysia
Sweden
SouthKorea
Euroarea
-15
-10
-5
0
%
-15
-10
-5
0
%
Sources: Bloomberg; Board of Governors of the Federal ReserveSystem; RBA
Graph 2.19
and on a trade-weighted basis alongside a broad-based improvement in economic conditions across the region. An improvement in the global economic outlook (see ‘International Economic Developments’ chapter) and evolving market expectations for the withdrawal of monetary policy accommodation in other advanced economies have also contributed to the appreciation of a number of other currencies against the US dollar. Commodity prices have generally increased over recent months, which has provided additional impetus for the appreciation of the currencies of some commodity exporting economies, including Australia.
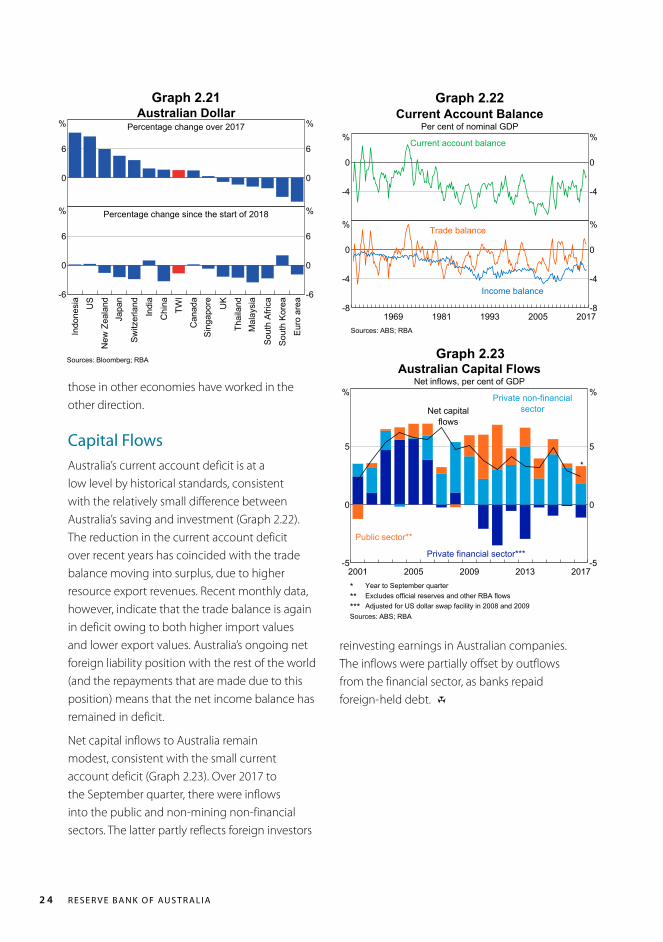
Australian DollarThe Australian dollar has appreciated against the US dollar over recent months, as have most currencies. But on a trade-weighted basis, the Australian dollar has been in a relatively narrow range for the past two years (Graph 2.20; Graph 2.21). Since the start of 2016, the Australian dollar has appreciated against a number of currencies, with the euro and yen being notable exceptions. Increases in commodity prices have supported the Australian dollar over this period, while a narrowing of interest rate differentials between government bonds in Australia and
20162014201220102008 201840
60
80
100
index
0.40
0.60
0.80
1.00
US$Australian Dollar
US$ per A$(RHS)
TWI(LHS)
Sources: Bloomberg; RBA
Graph 2.20
R E S E R V E B A N K O F AU S T R A L I A2 4
those in other economies have worked in the other direction.
Capital FlowsAustralia’s current account deficit is at a low level by historical standards, consistent with the relatively small difference between Australia’s saving and investment (Graph 2.22). The reduction in the current account deficit over recent years has coincided with the trade balance moving into surplus, due to higher resource export revenues. Recent monthly data, however, indicate that the trade balance is again in deficit owing to both higher import values and lower export values. Australia’s ongoing net foreign liability position with the rest of the world (and the repayments that are made due to this position) means that the net income balance has remained in deficit.
Net capital inflows to Australia remain modest, consistent with the small current account deficit (Graph 2.23). Over 2017 to the September quarter, there were inflows into the public and non-mining non-financial sectors. The latter partly reflects foreign investors
Australian DollarPercentage change over 2017
0
6
%
0
6
%
Percentage change since the start of 2018
Indonesia
US
New
Zealand
Japan
Switzerland
India
China
TWI
Canada
Singapore UK
Thailand
Malaysia
SouthAfrica
SouthKorea
Euroarea
-6
0
6
%
-6
0
6
%
Sources: Bloomberg; RBA
Graph 2.21
reinvesting earnings in Australian companies. The inflows were partially offset by outflows from the financial sector, as banks repaid foreign- held debt. R
Current Account BalancePer cent of nominal GDP
-4
0
%
-4
0
%Current account balance
2005199319811969 2017-8
-4
0
%
-8
-4
0
%Trade balance
Income balance
Sources: ABS; RBA
Graph 2.22
2013200920052001 2017-5
0
5
%
-5
0
5
%
Australian Capital FlowsNet inflows, per cent of GDP
Private non-financialsector
Public sector**
Private financial sector***
Net capitalflows
*
* Year to September quarter** Excludes official reserves and other RBA flows*** Adjusted for US dollar swap facility in 2008 and 2009Sources: ABS; RBA
Graph 2.23

S TAT E M E N T O N M O N E TA R Y P O L I C Y | F E B R UA R Y 2018 25
Box A
The Period of Low Volatility in Financial Markets
Graph A1
Volatility in global financial markets had been very low for a few years (Graph A1). This prolonged period of low volatility has come to an end in equity markets, having increased sharply in recent days. Given these developments, it is worth examining what had driven low volatility and what may have changed of late.
Financial Market VolatilityImplied from one-month options prices, annualised
25
50
75
%
Average US equities
25
50
75
%
Australianequities*
20081998 20180
100
200
300
bps
US Treasuries
20081998 20180
10
20
30
%Foreign exchange**
* Implied volatility from at-the-money ASX SPI call options used before2008. ASXVIX data used after 2008.** Average of implied volatility of EUR/USD, USD/JPY, GBP/USD,AUD/USD, USD/CAD, USD/CHF, EUR/JPY, EUR/GBP and EUR/CHFcurrency pairs, weighted by turnover.
Sources: Bloomberg; RBA; Thomson Reuters
Graph A3Realised Volatility in
Selected US Equity SectorsRolling one-month standard deviation of annualised daily price changes
50
100
%Financials
Average50
100
%
Technology
20081998 20180
50
100
%Energy
20081998 20180
50
100
%
Other
Source: Bloomberg
Extended periods of low volatility are not unprecedented, although the recent episode was among the longest for some time (Graph A2). Low levels had been observed for actual (realised) volatility and as expected volatility embedded in options prices (implied volatility). This was true for both short and long time horizons. Also, low volatility had been evident across countries, including Australia, across asset classes, and across individual sectors within markets (Graph A3).
Volatility partly reflects uncertainty about the future. The decline in volatility may have indicated
Graph A2
0 100 200 300 daysMar 94Mar 96Feb 18May 06Apr 05Nov 94Feb 07Oct 14Jun 15Oct 92Jun 07Jan 14Oct 13Jun 16Aug 04Sep 16Jun 92Feb 13Apr 13Oct 96
Periods of Low US Equity Market Volatility*Consecutive working days
below the current historical median; month ending
* Measured by the VIX indexSources: Bloomberg; RBA
that market participants had become more confident in their estimates of future outcomes. This was consistent with the observed reduction in the variability of many macroeconomic indicators, such as GDP and inflation, and a

R E S E R V E B A N K O F AU S T R A L I A26
The low level of implied volatility in global financial markets may also have reflected technical factors. In particular, market reports suggest that there had been a significant increase in the selling of instruments that protect against a rise in volatility by investors in some markets to generate additional returns in the low-yield environment. This included option contracts on equities and futures contracts on indices that track volatility e.g. the ‘VIX’. At the same time, reports suggest that the demand for volatility protection had declined, reflecting a greater willingness by investors to bear financial market risks. This was consistent with other indicators of increased investor appetite for financial market risks, such as the narrowing of credit spreads and the rise in equity valuations. An increase in the supply of, and a reduction in demand for, volatility protection would have reduced its price, and thereby lowered expected volatilities implied by volatility protection instruments.
In recent days, actual and implied volatility in equity markets has risen sharply, particularly in the United States. At least in part, this appeared to have reflected a reappraisal of the prospects for a rise in inflation and consequently the outlook for central bank policies. The increase in implied volatility was particularly pronounced in comparison to the size of movement in other market prices, which is consistent with reports that the increase also reflected technical factors. In particular, there has been a rapid reduction in the supply of, and an increase in demand for, volatility protection. The nature of certain participants’ exposure required them to purchase additional volatility protection in response to the initial rise in volatility and fall in equity prices in order to maintain a hedged position. As others sought to take advantage of this dynamic, there was a rapid increase in demand for volatility protection. Nevertheless, the rise in the price of volatility protection does not appear to have led to a disruption in the broader functioning of financial markets to date. R
decline in the frequency and magnitude of the revisions that analysts have made to their forecasts of such variables (Graph A4). Given the importance of these variables as inputs into the pricing of financial assets, less investor uncertainty about their future values may have contributed to a reduction in implied volatility and smaller fluctuations in asset values.
Graph A4Macroeconomic Volatility
Rolling standard deviation
Global GDP*
20102000199019800
1
2
3
% GDP forecast revisions**
20122006 20180.0
0.1
0.2
0.3
%
* Standard deviation of quarterly year-ended GDP growth over athree-year window.** Standard deviation of weekly changes to analysts’ GDP forecastsover a six-month window.
Sources: JPMorgan; RBA; Thomson Reuters
Monetary policy is also an important input into the pricing of financial assets, so a reduction in the perceived uncertainty around central bank policy settings may also have contributed to low financial market volatility. Monetary policy settings have been relatively stable in recent years, and where central banks have adjusted interest rates or their purchases of assets, these changes have tended to be gradual and clearly signalled in advance. Central banks have also made greater use of forward guidance as a policy tool to attempt to provide more certainty about the path of monetary policy. The longer-term trend towards greater transparency in the decision-making of central banks is also likely to have reduced uncertainty around policy settings.

S TAT E M E N T O N M O N E TA R Y P O L I C Y | F E B R UA R Y 2018 2 7
3. Domestic Economic Conditions
Domestic economic conditions improved during 2017, supported by low interest rates and continued strength in the global economy. Mining activity added to growth, as did private non-mining business investment and spending on public infrastructure. In contrast, consumption grew only modestly, weighed down by slow income growth. Household income growth was weak despite rapid employment growth and a decline in the unemployment rate, because growth in average wages has remained low.
GDP growth was 0.6 per cent in the September quarter, and increased to be close to estimates of potential in year-ended terms (Table 3.1; Graph 3.1).
Table 3.1: Demand and Output GrowthPer cent
September quarter 2017
June quarter 2017
Year to September quarter 2017
GDP 0.6 0.9 2.8Domestic final demand 0.6 0.8 3.2– Consumption 0.1 0.8 2.2– Dwelling investment –1.0 –0.5 –2.3– Mining investment 0.0 –0.7 2.0– Non-mining investment 2.7 0.9 9.5– Public consumption 0.2 1.2 2.4– Public investment 5.0 2.5 12.9Change in inventories(a) 0.2 –0.5 –0.2Exports 1.9 3.3 6.4Imports 1.9 0.5 7.7Mining activity(b) 0.8 1.5 4.4Non-mining activity(b) 0.6 0.9 2.7Nominal GDP 0.6 0.0 5.9Real gross domestic income 0.5 –0.4 5.0Terms of trade –0.4 –6.0 9.7(a) Contribution to GDP growth(b) RBA estimates Sources: ABS; RBA
Graph 3.1
2013200920052001 2017-2
0
2
4
%
-2
0
2
4
%GDP Growth
Year-ended
Quarterly
Source: ABS

R E S E R V E B A N K O F AU S T R A L I A2 8
Growth in business and public investment picked up in the quarter, but consumption growth was weak. The economy looks to have expanded at a broadly similar rate in the December quarter. Current indicators point to a recovery in consumption growth, but mining investment and net exports are expected to decline in the quarter. Over 2018, growth is expected to increase to be above potential. This should further reduce spare capacity in the economy and place some upward pressure on wage growth and inflation.
By industry, the pick-up in year-ended growth was largely attributable to the recovery of growth in goods-related industries, including construction and manufacturing (Graph 3.2). Both the recent increase in public infrastructure spending and stronger global demand for certain manufactured goods played a role here.
Over the past year, the economic performance of the states has tended to converge. In particular, conditions have improved in Western Australia, Queensland, South Australia and Tasmania, narrowing the difference with New South Wales and Victoria (see ‘Box B: The Recent Economic Performance of the States’ for details).
Graph 3.2
Graph 3.3
2014201120082005 2017-4
-2
0
2
4
6
%
-4
-2
0
2
4
6
%
Industry Output GrowthYear-ended
Householdservices
Businessservices
Goods-related(ex mining and agriculture)
Sources: ABS; RBA
Mining and Non-mining ActivityYear-ended growth, RBA estimates
Mining*Mining*
-10
0
10
20%
-10
0
10
20%
Mining investment
Resource exports
Non-mining**
201320092005 20170
2
4
6
%
0
2
4
6
%
* Net of mining-related imports; contribution from changes in inventoriesnot shown** Calculated as GDP less mining activity
Sources: ABS; RBA
Mining ActivityThe mining sector has contributed positively to GDP growth over recent quarters (Graph 3.3). Over the past year, mining investment was not as weak as earlier expected, while resource exports increased further.
The ABS capital expenditure (Capex) survey of investment intentions and Bank liaison both point to declines in mining investment in coming quarters (although much smaller than the declines seen in previous years). Very few new projects are expected to commence in the period ahead and the construction phase of large liquefied natural gas (LNG) projects is close to completion. The level of mining investment is therefore expected to decline in the first half of 2018, before stabilising as major mining firms undertake investment to maintain existing productive capacity.
As more productive capacity has come on line over recent years, resource export volumes have grown strongly (Graph 3.4). The increase over the past year was driven largely by LNG production, and LNG exports are expected to increase

S TAT E M E N T O N M O N E TA R Y P O L I C Y | F E B R UA R Y 2018 2 9
2017/18 reported by firms in the ABS Capex survey were revised higher in the most recent survey and point to solid growth in building & structures investment (Graph 3.6). In the NAB survey, investment intentions and capacity utilisation – particularly for the goods-related sector – have risen and remain above average (Graph 3.7). Similarly, private non-residential building approvals are at a high level in trend terms and the stock of private non-residential building work yet to be done has risen over the
Graph 3.4 Graph 3.5Resource Export Volumes
20122007 20170
7
14
$b
Coal, coke and briquettes
Metal oresand minerals(incl iron ore)
20122007 20170
3
6
$b
Metals
Other mineral fuels(incl LNG)
Non-monetarygold
Sources: ABS; RBA 201520132011 2017-10
-5
0
5
10
%
-10
-5
0
5
10
%
Non-mining Business InvestmentContribution to year-ended growth, RBA estimates
Non-residential construction
Machinery & equipment
Other*
Total
* Includes cultivated biological resources (mainly livestock, vineyardsand orchards), computer software, research & development andartistic originals
Sources: ABS; RBAstrongly again over 2018 as existing projects ramp up production and other projects are completed.
Iron ore export volumes remain at high levels and are expected to increase a little further over the next couple of years as productivity improvements from Australia’s major producers yield incremental increases in production. Coal export volumes have been volatile during the past year reflecting a number of temporary production disruptions, including from Cyclone Debbie. Coal exports are expected to have declined in the December quarter because maintenance shutdowns and industrial action have affected production and export capacity.
Non-mining Business Investment and TradeNon-mining business investment has been rising over the past few years and increased by almost 10 per cent over the year to the September quarter 2017. The pick-up in non-mining investment has been strongest in non-residential construction, while ‘other’ investment (which includes computer software and herd restocking by farmers) has also grown strongly (Graph 3.5).
The outlook for non-mining business investment remains positive. Investment intentions for
Graph 3.6Non-mining Capital Expenditure*
NominalMachinery & equipmentMachinery & equipment
12 / 1307 / 08 17 / 180
30
60
$b
Capex surveyEstimates
Buildings & structuresBuildings & structures
12 / 1307 / 08 17 / 180
30
60
$b
Nationalaccounts
* Estimates are firms' expected capital expenditure; adjusted for pastaverage differences between expected and realised spending
Sources: ABS; RBA
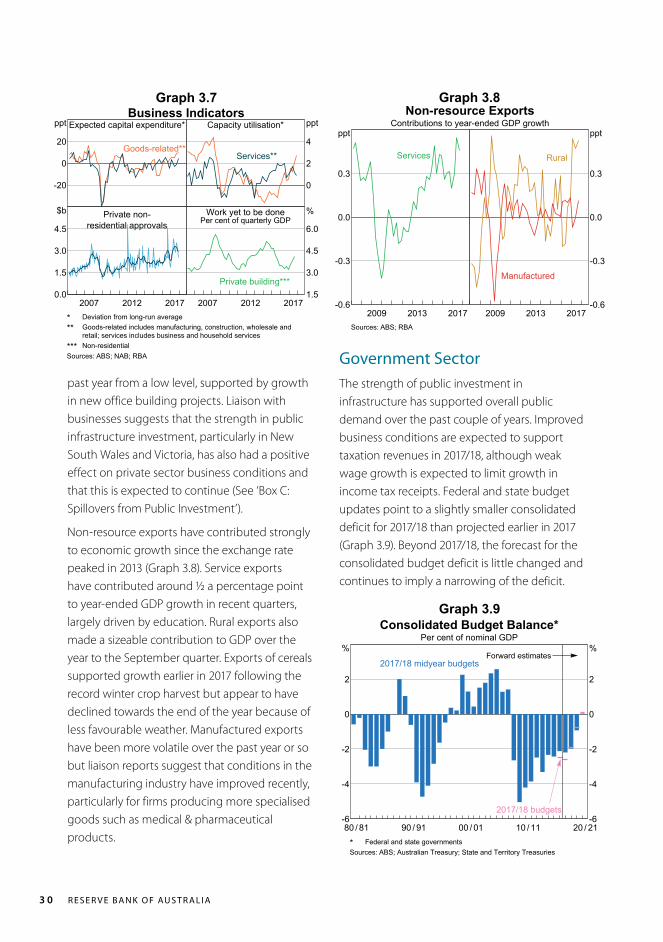
R E S E R V E B A N K O F AU S T R A L I A3 0
Government SectorThe strength of public investment in infrastructure has supported overall public demand over the past couple of years. Improved business conditions are expected to support taxation revenues in 2017/18, although weak wage growth is expected to limit growth in income tax receipts. Federal and state budget updates point to a slightly smaller consolidated deficit for 2017/18 than projected earlier in 2017 (Graph 3.9). Beyond 2017/18, the forecast for the consolidated budget deficit is little changed and continues to imply a narrowing of the deficit.
Graph 3.7 Graph 3.8
Graph 3.9
Business IndicatorsExpected capital expenditure*
-20
0
20
ppt
Goods-related**
Capacity utilisation*
0
2
4
ppt
Services**
Private non-residential approvals
20122007 20170.0
1.5
3.0
4.5
$b Work yet to be donePer cent of quarterly GDP
20122007 20171.5
3.0
4.5
6.0
%
Private building***
* Deviation from long-run average** Goods-related includes manufacturing, construction, wholesale andretail; services includes business and household services*** Non-residential
Sources: ABS; NAB; RBA
Non-resource ExportsContributions to year-ended GDP growth
20132009 2017-0.6
-0.3
0.0
0.3
ppt
Services
20132009 2017-0.6
-0.3
0.0
0.3
ppt
Rural
Manufactured
Sources: ABS; RBA
10 / 1100 / 0190 / 9180 / 81 20 / 21-6
-4
-2
0
2
%
-6
-4
-2
0
2
%
Consolidated Budget Balance*Per cent of nominal GDP
Forward estimates2017/18 midyear budgets
2017/18 budgets
* Federal and state governmentsSources: ABS; Australian Treasury; State and Territory Treasuries
past year from a low level, supported by growth in new office building projects. Liaison with businesses suggests that the strength in public infrastructure investment, particularly in New South Wales and Victoria, has also had a positive effect on private sector business conditions and that this is expected to continue (See ‘Box C: Spillovers from Public Investment’).
Non-resource exports have contributed strongly to economic growth since the exchange rate peaked in 2013 (Graph 3.8). Service exports have contributed around ½ a percentage point to year-ended GDP growth in recent quarters, largely driven by education. Rural exports also made a sizeable contribution to GDP over the year to the September quarter. Exports of cereals supported growth earlier in 2017 following the record winter crop harvest but appear to have declined towards the end of the year because of less favourable weather. Manufactured exports have been more volatile over the past year or so but liaison reports suggest that conditions in the manufacturing industry have improved recently, particularly for firms producing more specialised goods such as medical & pharmaceutical products.
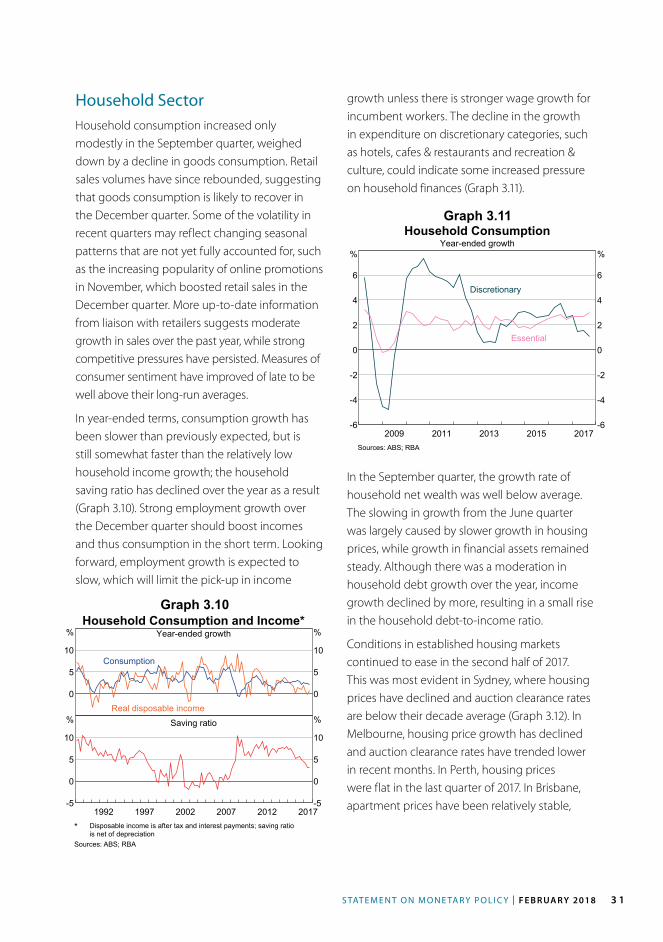
S TAT E M E N T O N M O N E TA R Y P O L I C Y | F E B R UA R Y 2018 3 1
growth unless there is stronger wage growth for incumbent workers. The decline in the growth in expenditure on discretionary categories, such as hotels, cafes & restaurants and recreation & culture, could indicate some increased pressure on household finances (Graph 3.11).
Graph 3.10
Graph 3.11
Household Consumption and Income*Year-ended growth
0
5
10
%
0
5
10
%
Consumption
Real disposable income
Saving ratio
20122007200219971992 2017-5
0
5
10
%
-5
0
5
10
%
* Disposable income is after tax and interest payments; saving ratiois net of depreciation
Sources: ABS; RBA
2015201320112009 2017-6
-4
-2
0
2
4
6
%
-6
-4
-2
0
2
4
6
%
Household ConsumptionYear-ended growth
Discretionary
Essential
Sources: ABS; RBA
Household SectorHousehold consumption increased only modestly in the September quarter, weighed down by a decline in goods consumption. Retail sales volumes have since rebounded, suggesting that goods consumption is likely to recover in the December quarter. Some of the volatility in recent quarters may reflect changing seasonal patterns that are not yet fully accounted for, such as the increasing popularity of online promotions in November, which boosted retail sales in the December quarter. More up-to-date information from liaison with retailers suggests moderate growth in sales over the past year, while strong competitive pressures have persisted. Measures of consumer sentiment have improved of late to be well above their long-run averages.
In year-ended terms, consumption growth has been slower than previously expected, but is still somewhat faster than the relatively low household income growth; the household saving ratio has declined over the year as a result (Graph 3.10). Strong employment growth over the December quarter should boost incomes and thus consumption in the short term. Looking forward, employment growth is expected to slow, which will limit the pick-up in income
In the September quarter, the growth rate of household net wealth was well below average. The slowing in growth from the June quarter was largely caused by slower growth in housing prices, while growth in financial assets remained steady. Although there was a moderation in household debt growth over the year, income growth declined by more, resulting in a small rise in the household debt-to-income ratio.
Conditions in established housing markets continued to ease in the second half of 2017. This was most evident in Sydney, where housing prices have declined and auction clearance rates are below their decade average (Graph 3.12). In Melbourne, housing price growth has declined and auction clearance rates have trended lower in recent months. In Perth, housing prices were flat in the last quarter of 2017. In Brisbane, apartment prices have been relatively stable,

R E S E R V E B A N K O F AU S T R A L I A3 2
Graph 3.12Housing Price Growth by Dwelling Type
Six-month-ended annualisedSydney
0
20
% Melbourne
0
20
%
Houses
Brisbane
20142010 2018-20
0
20
%
Apartments
Perth
20142010 2018-20
0
20
%
Sources: CoreLogic; RBA
following earlier price falls, while detached house prices have increased slightly.
In Sydney and Melbourne, the decline in established housing price growth has been most pronounced for detached houses and for the most expensive properties; prices in both of these categories tend to have larger cycles than other market segments (Graph 3.13). The increased supply of housing and an apparent reduction in demand from foreign buyers for newly built properties are likely to be placing downward pressure on prices in Sydney, Melbourne and Brisbane though this is being offset to some extent by increased population growth, especially in Melbourne. The value of housing loan approvals has been broadly stable in aggregate since the end of 2016, though the composition has shifted towards owner-occupiers and away from investors (see ‘Domestic Financial Markets’ chapter).
Overall, growth in advertised rents picked up in the second half of 2017 due to increases in Sydney and Melbourne. Rents in Brisbane appear to have stabilised following earlier declines. Advertised rents in Perth have continued to decline, consistent with the ongoing high vacancy rate, but to a lesser extent than previously.
Graph 3.13Housing Prices by Dwelling Value
Cumulative growth since January 2013
Sydney
2015 2018-20
0
20
40
60
%
Middle(25th–75th percentile)
Melbourne
2015 2018-20
0
20
40
60
%
Least expensive(5th–25th percentile)
(75th–95thpercentile)
Most expensive
Sources: CoreLogic; RBA
Strong population growth and higher housing prices have encouraged a high level of new dwelling construction in recent years, particularly in the eastern states (Graph 3.14). The increase in residential construction activity has been mainly concentrated in higher-density housing, which differs from previous cycles when most construction was for detached dwellings. Alterations and additions have been less responsive than in previous periods of strong dwelling investment.
Higher-density residential building approvals picked up towards the end of 2017 due to increases in Victoria and New South Wales (Graph 3.15). In Victoria, the increase was underpinned by four large apartment projects and approvals seem unlikely to remain at this level in the coming months. Liaison with developers suggests that demand for new apartments from both domestic investors and foreign buyers has fallen. This suggests that it is likely to take longer for developers to reach a minimum level of pre-sales, which is typically needed before finance for the project is available. Nevertheless, the increase in building approvals has added to the pipeline of work that is already approved or underway, indicating that dwelling

S TAT E M E N T O N M O N E TA R Y P O L I C Y | F E B R UA R Y 2018 3 3
over the year. Full-time employment accounted for three-quarters of the growth over 2017, a strong rebound after declining slightly over 2016 (Graph 3.16). Strong growth in full-time employment over the past year has been accompanied by an increase in the net flow of workers from part-time to full-time employment and from ‘not in the labour force’ to employment. Consistent with the latter, the participation rate has risen sharply this year to be at its highest level since the record high in 2011 (Graph 3.17). Average hours worked were more or less stable over 2017; this went against the usual pattern of declines flowing from the trend towards part-time work and reflects both the particular strength in full-time employment growth and a pause in the trend towards lower average hours for full-time workers. Leading indicators of labour demand continue to point to solid growth in employment over the next six months, though not as strong as seen over the past year.
The unemployment rate has declined by ¼ percentage point over 2017, to 5.5 per cent. Broader measures of labour market underutilisation, which capture the additional hours that underemployed people would like to work as well as hours of work sought by the
Graph 3.14
Graph 3.15
Dwelling Investment*Chain volume
By type
2013 20170
2
4
6
8
$b
Detached
Higher-density
Alterations &additions
Mainland states
2013 20170
2
4
6
8
$b
NSW
Vic
Qld
WA
SA
* Reference year is 2015/16Source: ABS
Residential Building ApprovalsSix-month moving average
Higher-densityNSWVicQldSAWA
20112005 20170
1 000
2 000
3 000
4 000
no Detached
20112005 20170
1 000
2 000
3 000
4 000
no
Sources: ABS; RBA
investment is likely to remain at a high level for some time yet. Approvals for new detached dwellings and alterations and additions also trended up in most states over the past year, most notably in Victoria.
Labour MarketLabour market conditions improved by considerably more than expected over 2017. Employment continued to grow significantly faster than the working-age population over the December quarter, to be 3.3 per cent higher
Graph 3.16
Total Full-time Part-time
2013200920052001 2017-100
0
100
200
300
400
’000s
-100
0
100
200
300
400
’000sAnnual Employment Growth
Source: ABS

R E S E R V E B A N K O F AU S T R A L I A3 4
industry employment has been in hospital jobs. The rollout of the National Disability Insurance Scheme is likely to boost employment in this industry over the next few years.
Construction employment grew rapidly last year, consistent with the elevated level of residential and infrastructure building activity in the eastern states. Construction employment is estimated to have reached its highest share of total employment since the early 1900s. Employment growth was more subdued in other parts of the goods-related sector. In the business services sector, employment has declined over the past
Graph 3.17
Graph 3.19
Graph 3.18Labour MarketSeasonally adjusted
20132009 20173
5
7
9
%
Underutilisation rate*
Unemployment rate**
20132009 201759
61
63
65
%
Participation rate
Employment to working-agepopulation ratio
* Hours-based measure** Trend unemployment in dark blueSources: ABS; RBA
Population GrowthYear-ended
1997 2017-1
0
1
2
3
%
NSW
Vic
1997 2017
Tas
Qld
1997 2017-1
0
1
2
3
%
WA
SA
Source: ABS
Employment-to-population Ratio by StateSeasonally adjusted
20112005 201750
55
60
65
%
NSW
Vic
WA
20112005 201750
55
60
65
%
Qld
SA
Tas
Sources: ABS; RBA
unemployed, have also declined. The Bank’s assessment is that, while conditions improved significantly over 2017, spare capacity remains in the labour market.
The improvement in labour market conditions over 2017 was apparent across the country. In trend terms, employment rose and the unemployment rate declined in all states (Graph 3.18). Participation rates increased in all states. Labour market conditions were strongest in the eastern states. Annual average employment growth in Victoria has been around 3½ per cent over the past two years, and the unemployment rate in New South Wales has reached its lowest level since mid 2008. Consistent with these strong conditions, population growth last year was particularly strong relative to history in Victoria and New South Wales (Graph 3.19). In part, this reflects stronger net overseas migration flows to these states.
Employment growth was strongest in the household services sector over 2017, particularly in the health care & social assistance industry, which alone accounts for around one-quarter of aggregate employment growth over the year. Much of the recent strength in health

S TAT E M E N T O N M O N E TA R Y P O L I C Y | F E B R UA R Y 2018 3 5
year while job vacancies have increased, making it difficult to gauge labour market conditions. Information from the Bank’s liaison program points to strength in demand for workers with specialised IT skills and some other occupations within the business services sector.
Labour CostsWage growth remains low but stable across most aggregate measures (Graph 3.20). Despite strong employment growth over the past year, spare capacity in the labour market continued to weigh on wage growth. Low wage growth was particularly prevalent in the industries and regions adjusting to the decline in mining investment. A number of other factors are also likely to be contributing to subdued wage pressures, including compositional changes in the labour market, changes to employee bargaining power and sluggish productivity growth.
The wage price index (WPI) grew by 0.5 per cent in the September quarter and by 2 per cent over the year. This was a little lower than expected given the boost to wage growth from the 3.3 per cent increase in award and minimum wages in the quarter. Nonetheless, wage growth picked up over the year in a number of industries
Graph 3.20
Graph 3.21
Wage GrowthYear-ended
12345%
12345%
Wage price index
Average earningsper hour*
20152013201120092007 20170
1
2
3
4%
0
1
2
3
4%
Average awardwage increase
New EBAs
* 9-quarter centred moving averageSources: ABS; Department of Jobs and Small Business; FWC; RBA
0 1 2 %Arts & recreation
HealthcareEducation
Other servicesFinancial
Accom & foodManufacturingPublic adminInfo. Media
UtilitiesTransportWholesale
ConstructionAdminRentalRetail
ProfessionalMining
Wage Price Index by Industry*Year-ended growth, September 2017
One yearago
* Vertical line indicates aggregate growthSource: ABS
(Graph 3.21). Wage growth outcomes in household service industries, such as health and education, were higher than in industries such as mining and professional, scientific & technical services. This reflects strong demand for labour in household service industries as well as the higher share of workers on enterprise bargaining agreements (EBAs). Average annualised wage increases for new EBAs have declined notably over the past year. As EBAs have an average duration of a little over three years, it is expected that average wage growth for those on EBAs will slow as current agreements are replaced by new agreements that have lower average wage growth outcomes.
Growth in average earnings from the national accounts (AENA) remains subdued and noticeably weaker than growth in the WPI. AENA includes a broader range of labour earnings than WPI, such as allowances and redundancy payments, and captures any compositional changes in the labour market. The weakness in average earnings was particularly pronounced in goods-related industries such as construction (Graph 3.22).
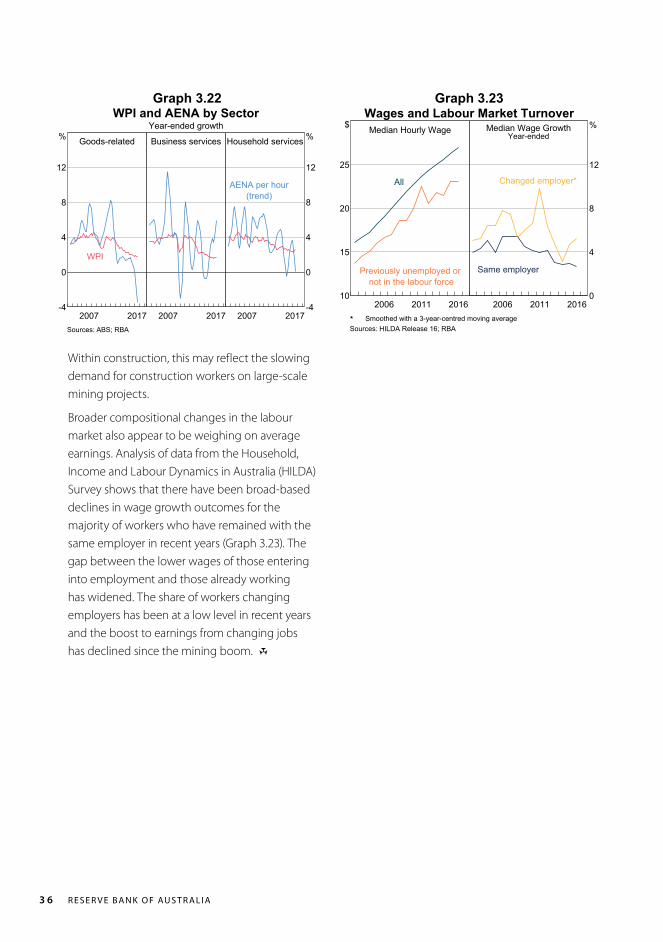
R E S E R V E B A N K O F AU S T R A L I A3 6
Within construction, this may reflect the slowing demand for construction workers on large-scale mining projects.
Broader compositional changes in the labour market also appear to be weighing on average earnings. Analysis of data from the Household, Income and Labour Dynamics in Australia (HILDA) Survey shows that there have been broad-based declines in wage growth outcomes for the majority of workers who have remained with the same employer in recent years (Graph 3.23). The gap between the lower wages of those entering into employment and those already working has widened. The share of workers changing employers has been at a low level in recent years and the boost to earnings from changing jobs has declined since the mining boom. R
Graph 3.22 Graph 3.23WPI and AENA by Sector
Year-ended growth
Goods-related
2007 2017-4
0
4
8
12
%
WPI
Business services
2007 2017
Household services
2007 2017-4
0
4
8
12
%
AENA per hour(trend)
Sources: ABS; RBA
Wages and Labour Market TurnoverMedian Hourly Wage
20112006 201610
15
20
25
$
All
Previously unemployed ornot in the labour force
Median Wage GrowthYear-ended
20112006 20160
4
8
12
%
Same employer
Changed employer*
* Smoothed with a 3-year-centred moving averageSources: HILDA Release 16; RBA

S TAT E M E N T O N M O N E TA R Y P O L I C Y | F E B R UA R Y 2018 37
Box B
The Recent Economic Performance of the States
Over the past decade, large movements in commodity prices and mining investment have driven significant variations in economic outcomes across the states. More recently, the economic performance of the states has tended to converge, as conditions in the parts of the economy that were previously dragging on activity have improved (Graph B1).1 This has supported the improvement in economic conditions nationally. In Western Australia, state final demand – a measure of domestic demand excluding trade – is no longer declining, and
1 See Carr T, Fernandes K and T Rosewall (2017), ‘The Recent Economic Performance of the States’, RBA Bulletin, March, pp 1–12
Graph B2
Graph B1Demand and Employment
Year-ended growth
Final Demand
-6
0
6
12
18
%
-6
0
6
12
18
%
NSW and Vic
WA
Rest of Australia
Employment
201320092005 2017-4
-2
0
2
4
6
%
-4
-2
0
2
4
6
%
Sources: ABS; RBA
Investment by Sector*Chain volume, quarterly
Business(LHS)
2007 20170
10
20
30
$b
WA
SA
Public(RHS)
2007 2017
Qld
Tas
Dwelling(RHS)
2007 20170
3
6
9
$b
NSWVic
* Excludes second-hand asset transfers between the public and privatesector; reference year is 2015/16
Sources: ABS; RBA
demand growth has picked up in Queensland, South Australia and Tasmania. Conditions in New South Wales and Victoria also remain favourable. Labour market outcomes improved across all states over 2017, with most experiencing strong growth in employment over the year.
The decline in variation in economic conditions across states is partially explained by investment cycles (Graph B2). In the resource-rich states, the drag from declining mining investment has eased. This was evident first in Queensland and more recently in Western Australia, but some further drag is expected in Western Australia as the major liquefied natural gas projects are completed. The related increase in output (and exports) from earlier mining investment and the increase in commodity prices over the past year or so have also helped support business activity and reduce the variability in conditions between the states more generally.

R E S E R V E B A N K O F AU S T R A L I A38
Differences in state dwelling investment cycles have also narrowed, and are therefore no longer contributing to variation in demand growth across states. Over the past year, dwelling investment in Queensland, New South Wales and Victoria has been relatively stable following a period of strong growth. This has narrowed the differences in growth rates of overall demand across the states, even though dwelling investment continued to decline in Western Australia. At the same time, the convergence has been supported by stronger non-mining business investment and public demand growth in most states. These trends contributed to growth in state final demand remaining relatively steady in Victoria and New South Wales, and brought growth in Queensland, South Australia and Tasmania up to a similar pace. A large pipeline of public infrastructure projects is expected to continue to contribute to growth and support business activity over the coming few years, particularly in New South Wales and Victoria.
Some convergence in conditions has also been evident in the key labour market data in most states. As the negative spillovers from lower levels of mining investment have started to ease, employment growth turned positive in Western Australia and Queensland in 2017. It picked up in New South Wales, South Australia and Tasmania, while the steady strong growth in employment that has occurred in Victoria for a number of years continued.
By industry, health care has been a major contributor to employment growth over recent years, and this became more widespread across states in 2017 (Graph B3). The higher level of dwelling investment and public infrastructure spending in the eastern states has also been reflected in stronger employment in construction and certain business services, such as professional, scientific & technical services.
The strong growth in employment has occurred alongside large increases in labour force participation rates in most states over 2017 (Graph B4). The increase in participation rates was particularly pronounced in Victoria, and in Queensland and Western Australia, where the increases largely unwound the falls in participation rates in those two states seen through 2016. Over 2017, the unemployment rate in most states edged lower; a number of states recorded their lowest unemployment rates in several years at the end of 2017 (Graph B5). The main exceptions were Victoria and Western Australia. In Victoria, above-average population growth and an elevated participation rate appear to be muting the impact that employment growth would otherwise have on the state’s unemployment rate.
Employment by IndustryNet change in trend employment since August 2012New South WalesNew South Wales
-100
0
100
200
300’000 VictoriaVictoria
-100
0
100
200
300’000
QueenslandQueensland
-50
0
50
100
150’000 Western AustraliaWestern Australia
-50
0
50
100
150’000
South AustraliaSouth Australia
2014 2017-40
-20
0
20
40
60’000 TasmaniaTasmania
2014 2017-40
-20
0
20
40
60’000
Health care & social assistance Construction Education & trainingMining Retail trade Professional, scientific & technicalAccommodation & food services Other* Total* Other refers generically to all remaining ANZSIC industries
Sources: ABS; RBA
Graph B3

S TAT E M E N T O N M O N E TA R Y P O L I C Y | F E B R UA R Y 2018 39
Above-average population growth in Victoria and New South Wales has been reflected in stronger growth in total household consumption spending in those two states. R
Household Consumption per Capita*Chain volume, annualised
20112005 201720
25
30
35
40
$’000NSW
WA
Qld
20112005 201720
25
30
35
40
$’000
Vic
SA
Tas
* Population for September 2017 calculated using average growth overthe four previous quarters; reference year is 2015/16
Sources: ABS; RBA
Unemployment Rates by StateTrend
20122007 20172
4
6
8
%
NSW
Qld
Vic
20122007 20172
4
6
8
%
TasSA
WA
Source: ABS
Participation Rates by StateTrend
20122007 201758
62
66
%
NSW
Vic
Qld
20122007 201758
62
66
%
SA
WA
Tas
Source: ABS
Graph B4
Graph B5
Graph B6
Despite the improvement in employment growth across the country during most of 2017, wage growth remained quite subdued in all states. Growth in household disposable income per capita also remained modest in most states, and was negative in Western Australia. The slower growth in household incomes has weighed on spending by households. Household consumption per capita grew at a below-average pace in all states for much of 2017, most notably in Western Australia and Tasmania (Graph B6). Consumption per capita grew faster than disposable incomes leading to lower household saving rates in most states over 2016/17.

R E S E R V E B A N K O F AU S T R A L I A40
Public investment has grown strongly and has increased its share of GDP over the past couple of years (Graph C1). Investment in infrastructure has driven much of the strength and has been concentrated in transport and telecommunications, which includes the National Broadband Network (Graph C2). Nevertheless, public investment remains low as a share of GDP when compared with history. This is largely because previously government-owned entities in capital-intensive industries, such as utilities, have been privatised over time.
Much of the publicly owned infrastructure built in the past couple of years has been constructed by the private sector. Most of the work done by the private sector for the public sector is constructed under contract rather than through public-private partnership (PPP) projects. For PPPs, the private sector assumes some risk in the project, for example via costs associated with ongoing maintenance.1
Recent Bank liaison and business surveys suggest that the increase in public spending has supported business conditions over the past year or more. There had been spare capacity in the construction sector following the end of the mining investment boom. More recently, though, liaison contacts have reported that firms involved in this type of work have begun to hit capacity constraints, leading to a pick-up in private investment in machinery and equipment as well as employment.
1 For a discussion of infrastructure PPPs, see Heath A and M Read (eds) (2014), Financial Flows and Infrastructure Financing, Proceedings of a Conference, Reserve Bank of Australia, Sydney.
Graph C1
Graph C2
Box C
Spillovers from Public Investment
Public InvestmentPer cent of nominal GDP
Investment
20071997 20170
2
4
6
%
Defence
Total*
Infrastructure work done
20071997 20170
1
2
3
%
Engineering
Buildings
* Adjusted for second-hand asset transfers between the public andother sectors
Sources: ABS; RBA
Public InfrastructureEngineering work done, per cent of nominal GDP
By typeTransportTelecommunication
WaterOther*
20071997 20170.0
0.4
0.8
1.2
% By sector
20071997 20170.0
0.4
0.8
1.2
%
By the private sector
By the public sector
* Includes electricity, harbours and recreationSources: ABS; RBA
Capital expenditure projections from the state and federal budgets indicate that public investment will remain strong for some time as work on infrastructure projects continues

S TAT E M E N T O N M O N E TA R Y P O L I C Y | F E B R UA R Y 2018 41
increases GDP by around $1.1–$1.3 billion after two years.
However, estimates of fiscal multipliers vary a lot and depend on many factors.3 For example, governance arrangements for selecting infrastructure projects are important for realising the potential productivity benefits of public infrastructure spending, as recently highlighted by the Productivity Commission.4 Estimates of fiscal multipliers are also generally larger when there is spare capacity in the economy, as is currently the case in Australia. If there was not spare capacity, the resulting increase in inflation could induce a tightening of monetary conditions and an appreciation of the exchange rate that would potentially ‘crowd out’ private sector activity. Crowding out can be reduced by governments smoothing their spending over time. R
3 Leeper EM, N Traum and TB Walker (2017), ‘Clearing Up the Fiscal Multiplier Morass’, American Economic Review, 107(8), pp 2409–2454.
4 See Productivity Commission (2017), ‘Shifting the Dial: 5 Year Productivity Review’, Inquiry Report, October.
(Graph C3). This is expected to support further growth in investment by private firms that work in this sector.
Graph C3
14 / 1510 / 1106 / 0702 / 03 18 / 190
1
2
3
4
5
6
%
0
1
2
3
4
5
6
%
Public InvestmentPer cent of nominal GDP
Public investment*(national accounts)
Governmentbudget projections
State & federal capital expenditure**(budget concept)
* Adjusted for second-hand asset transfers between the public andother sectors** Excludes spending by local governments and federal publicnon-financial corporations
Sources: ABS; Australian Treasury; State and Territory Treasuries
There are also spillovers to the broader domestic economy from an increase in public investment. The profits earned by firms and the incomes earned by workers involved in infrastructure projects boost business investment and consumption, although the effect of this on GDP is likely to be offset to some extent by higher imports. Potential output is also boosted by the larger capital stock and any productivity benefits, although this is likely to occur gradually.
Fiscal multipliers estimate the total effect of a change in public investment on GDP, relative to the size of the initial increase in public demand. The Organisation for Economic Co-operation and Development (OECD) estimates that an increase in public infrastructure investment in Australia is associated with a fiscal multiplier of between 1.1 and 1.3 after two years.2 This would imply that a $1 billion increase in public investment
2 OECD (2009), ‘Chapter 3: The Effectiveness and Scope of Fiscal Stimulus’, OECD Economic Outlook, Interim Report, March. Available at <https://www.oecd.org/eco/outlook/42421337.pdf>.

R E S E R V E B A N K O F AU S T R A L I A42

S TAT E M E N T O N M O N E TA R Y P O L I C Y | F E B R UA R Y 2018 4 3
4. Domestic Financial Markets
Conditions in domestic financial markets have been relatively stable, although volatility has picked up recently in equity markets. Funding conditions in Australian financial markets are easy for borrowers. The spreads on corporate bond yields relative to government bond yields are around their lowest level in 10 years and equity prices have risen over the past year. Valuations of ‘riskier’ assets increased as investors continued to search for yield. Growth in housing credit has eased, particularly for credit extended to investors. Interest rates on some housing and business loans have declined slightly over recent months. Financial market prices suggest that the cash rate is expected to increase by early next year.
Money Markets and Bond YieldsThe Reserve Bank has maintained the cash rate target at 1.50 per cent since August 2016. Expectations of an increase in the cash rate have been brought forward a little. Financial market prices imply that the cash rate is expected to increase to 1.75 per cent by early next year (Graph 4.1).
Short-term interest rates in the repurchase agreement (repo) market increased significantly for a short period at the end of 2017 before returning to the levels that prevailed for most of the previous year. The increase was related to temporarily tight conditions in offshore funding markets at the end of the year. During this period, large international banks were somewhat reluctant to lend funds because the size of
their balance sheets at the end of the year is used in applying some banking regulations. The tightness was particularly noticeable in the foreign exchange swap market. For instance, Australian dollars could be lent against yen at a relatively high implied Australian dollar interest rate. As a result, some investors borrowed Australian dollars under repo to use them for foreign exchange swap transactions.
Yields on 10-year Australian Government Securities (AGS) have been relatively stable over the past year, around the very low levels of the past few years, and the spread between 10-year AGS and US Treasury yields is around its lowest level since 2001 (Graph 4.2). Recent issuance from the Australian Office of Financial Management and state borrowing authorities has been well received by the markets.
Graph 4.1
2015201120072003 20191
2
3
4
5
6
7
%
1
2
3
4
5
6
7
%Cash Rate*
* Data from March 2018 onwards are expectations derived frominterbank cash rate futures
Sources: ASX; Bloomberg

R E S E R V E B A N K O F AU S T R A L I A4 4
Financial IntermediariesThe funding composition of banks has been little changed over the past year, with domestic deposits continuing to comprise around 60 per cent of banks’ total funding liabilities (Graph 4.3). The Net Stable Funding Ratio (NSFR), which requires banks to hold a minimum level of stable funding for their assets, came into effect on 1 January 2018. In anticipation of this, the banks had adjusted their balance sheets towards more stable sources of funding, such as longer-term securities and deposits. The banks have reported that they are above the regulatory minimum for the NSFR.
Interest rates on deposit products declined over 2017 and growth in deposits slowed; this was particularly the case for term deposits (Graph 4.4; Graph 4.5). There have also been some reductions in advertised deposit rates in recent months, especially for online saver accounts. The slowing in demand from banks for deposits reflects the combination of a decline in the growth in their balance sheets and sufficient stable funding to meet their regulatory requirements.
Graph 4.2
Graph 4.3
Graph 4.4
Graph 4.5
Government Bond Yields10-year
2
4
6
%
2
4
6
%Australia
United States
Differential
2015201220092006 20180
1
2
3
ppt
0
1
2
3
ppt
Sources: Bloomberg; RBA
2014201120082005 20170
10
20
30
40
50
60
%
0
10
20
30
40
50
60
%
Funding Composition of Banks in Australia*Share of total funding
Securitisation
Long-term debt
Domestic deposits
Short-term debt**
Equity
* Adjusted for movements in foreign exchange rates; tenor of debt isestimated on a residual maturity basis** Includes deposits and intragroup funding from non-residents
Sources: APRA; RBA; Standard & Poor’s
2015201220092006 20180
2
4
6
8
%
0
2
4
6
8
%
Major Banks’ Deposit Rates$10 000 deposits
Term deposit specials*
Bonus savers
Cash management accounts***
Onlinesavers**
* Average of 1–12, 24-, 36- and 60-month terms** Excludes temporary bonus rates*** Deposits over $250 000Sources: Canstar; RBA
2014201120082005 2017-10
0
10
20
30
40
%
-10
0
10
20
30
40
%
Deposits by Product Type*Year-ended growth
Term
Transaction and savings
* Break-adjusted; not seasonally adjusted; excludes foreign currency,intragroup and certificates of deposit
Sources: APRA; RBA

S TAT E M E N T O N M O N E TA R Y P O L I C Y | F E B R UA R Y 2018 4 5
Net bond issuance by Australian banks in 2017 was above the average of recent years. Also, the average tenor of bonds issued over 2017 increased to 6 years, the highest in over 20 years (Graph 4.6). These trends reflect strong demand in the bond market, with secondary market spreads of bank bond yields to benchmark rates narrowing to be at their lowest level in 10 years (Graph 4.7).
primary market spreads of RMBS yields to the benchmark rate narrowing over the year.
The cost of issuing short-term wholesale funding increased towards the end of 2017, although this has partially reversed more recently (Graph 4.9). The increase in bank bill rates relative to OIS towards the end of 2017 can be partly explained by a number of factors. These include reduced demand for bank bills from investment funds, and an increase in the cost of short-term offshore funding more generally. The subsequent decline in bank bill rates has been associated with a
Graph 4.6
Graph 4.8
Graph 4.9
Graph 4.7
2013200920052001 20172
3
4
5
6
7
years
2
3
4
5
6
7
years
Bank Bond Issuance TenorWeighted average tenor at issuance
Domestic
Total
Offshore
Source: RBA
Australian RMBSIssuance
Major banksOther banksNon-banks
10
20
$b
10
20
$b
Primary market pricing*
2014201120082005 20170
100
200
300
bps
0
100
200
300
bps
Bank conforming deals
Non-conforming dealsNon-bank conforming deals
* Face-value weighted monthly average of the primary market spreadto bank bill swap rate for AAA rated notes
Source: RBA
2014 201720162015 20180
10
20
30
40
50
bps
0
10
20
30
40
50
bps
Bank Bill SpreadsSpread to overnight indexed swaps
1-month
3-month
6-month
Sources: ASX; Tullett Prebon (Australia)
Major Banks’ Bond Pricing3–5 year residual maturity, Australian dollar bonds
Yields
20132008 20181
4
7
%
AGS
Swap
Unsecured
Bank bond spreads
20132008 20180
100
200
bps
Spreadto AGS
Spread to swap
Sources: Bloomberg; UBS AG, Australia Branch
New issuance of residential mortgage-backed securities (RMBS) in 2017 was its highest in 10 years (Graph 4.8). Issuance was driven by smaller banks and non-bank originators. Market conditions have been relatively strong with

R E S E R V E B A N K O F AU S T R A L I A4 6
broader improvement in conditions in short-term funding markets.
The implied spread between lending rates and debt funding costs for the banks is estimated to have been stable in recent months.
Financial AggregatesTotal credit growth moderated in recent months as housing credit growth eased and business credit growth was little changed (Graph 4.10). Broad money growth has declined recently, with deposit growth slowing (Table 4.1).
Household FinancingGrowth in overall housing credit has edged a little lower, driven largely by a slowing in credit extended to investors (see Box D: ‘Measures of Investor and Owner-occupier Housing Credit’). The slowing in investor credit growth has been mainly due to slower growth in New South Wales and Queensland (Graph 4.11).
Graph 4.10
Graph 4.11
2013200920052001 2017-10
0
10
20
%
-10
0
10
20
%
Credit Growth by Sector*Six-month-ended annualised
Business
Housing
Total**
* Seasonally adjusted and break-adjusted; including securitisation** Includes housing, personal and business creditSources: ABS; APRA; RBA
Housing Loan ApprovalsExcluding refinancing
Owner-occupier
20132009 20170
3
6
9
$b
NSW and Queensland
Other states
Investor
20132009 20170
3
6
9
$b
Sources: APRA; RBA
Table 4.1: Financial AggregatesPercentage change(a)
Three-month ended Year-endedSep 2017 Dec 2017 Dec 2017
Total credit 1.3 1.1 4.8– Housing 1.5 1.4 6.3
– Owner-occupier 2.1 1.8 7.9– Investor 0.5 0.6 3.4
– Personal –0.2 –0.4 –1.1– Business 1.0 0.9 3.2Broad money 0.5 0.1 4.6(a) Growth rates are break adjusted and seasonally adjustedSources: APRA; RBA
New dwelling construction has been at a high level in recent years. Accordingly, lending approvals to households for the purposes of building or purchasing a new dwelling have continued to make a strong contribution to credit growth, despite the easing in total credit growth (Graph 4.12). This is consistent with a slowing in turnover in the market for existing dwellings.

S TAT E M E N T O N M O N E TA R Y P O L I C Y | F E B R UA R Y 2018 4 7
Housing Lending RatesStandard variable reference (SVR) rates on housing loans have remained stable over recent months. At the same time, data on securitised mortgages reported to the RBA indicate that the average interest rate on outstanding variable rate housing loans has declined slightly (Graph 4.14; Table 4.2).1 This has mainly been driven by a decline in the average outstanding interest rate for loans requiring principal and interest payments. This decline, in turn, is likely to have reflected a combination of new loans with rates lower than those of outstanding loans and borrowers refinancing their existing loans at lower rates.
Over the past year, the difference between the variable outstanding housing interest rates offered by authorised deposit-taking
1 The Securitisation Dataset covers a significant share of the market for housing loans and provides useful indicators of developments in home lending, although loans in the dataset may have different characteristics from those not covered by the dataset. See Kent C (2017), ‘Some Innovative Mortgage Data’, Speech at Moody’s Analytics Australia Conference 2017, Sydney, 14 August. Available at <https://www.rba.gov.au/speeches/2017/sp-ag-2017-08-14.html>. See also Kohler M (2017), ‘Mortgage Insights From Securitisation Data’, Speech at Australian Securitisation Forum, Sydney, 20 November. Available at <https://www.rba.gov.au/speeches/2017/sp-so-dm-2017-11-20.html>.
Graph 4.12
Graph 4.13
Housing credit growthNew dwellings*Other
2015201320112009 20170.0
2.5
5.0
7.5
10.0
%
0.0
2.5
5.0
7.5
10.0
%
Contribution to Housing Credit GrowthSix-month annualised
* Estimated using housing loan approvals for the construction andpurchase of new dwellings as a share of housing credit
Sources: APRA; RBA
Housing Loan ApprovalsInterest only; share of total approvals
20132009 20170
20
40
60
%
Total
Owner-occupier
Investor
20132009 20170
20
40
60
%
Other lenders
Major banks
Sources: APRA; RBA
The share of housing loan approvals with interest-only payments has fallen over the past year following the prudential measures focusing on interest-only lending imposed by the Australian Prudential Regulation Authority. The share of interest-only housing loan approvals averaged less than 20 per cent in the December quarter, down from around 35 per cent in 2016. This share has declined most notably for investors, although it remains higher than the share for owner-occupiers (Graph 4.13).
Graph 4.14
2015 2016 20174.0
4.5
5.0
5.5
%
4.0
4.5
5.0
5.5
%Housing Interest Rates*
Outstanding loans
New loans***
Standard variablereference rate**
* Outstanding and new loans series include variable and fixed interestrate loans; data to December 2017** Average across major banks' rates*** All loans originated over the past three months
Sources: RBA; Securitisation database

R E S E R V E B A N K O F AU S T R A L I A4 8
Table 4.2: Intermediaries’ Fixed and Variable Lending Rates
Interest rateChange since
November 2017Change since
November 2016 Per cent Basis points Basis points
Housing loans(a)
– Variable principal-and-interest rate– Owner-occupier 4.29 –2 –11– Investor 4.74 –2 14
– Variable interest-only rate– Owner-occupier 4.74 –2 42– Investor 5.10 –1 61
– Fixed rate– Owner-occupier 4.25 –2 –28– Investor 4.37 –1 –24
– Average outstanding rate 4.51 –2 6Personal loans– Variable rate(b) 11.64 0 14Small business– Term loans variable rate(e) 6.43 0 4– Overdraft variable rate(e) 7.26 –5 –1– Fixed rate(c) (e) 5.18 –6 –13– Average outstanding rate(d) 5.28 0 –8Large businessAverage outstanding rate(d) 3.42 5 –7(a) Average rates from Securitisation Dataset, updated for end December 2017 (b) Weighted average of advertised variable rate products (c) Average of the major banks’ 3-year fixed rates (d) RBA estimates (e) Residentially secured, average of the major banks’ advertised ratesSources: ABS; APRA; Securitisation System; RBA
Graph 4.15
2015 2016 20174.25
4.50
4.75
5.00
5.25
5.50
%
4.25
4.50
4.75
5.00
5.25
5.50
%Variable Outstanding Housing Interest Rates
Non-ADIs
ADIs
Sources: RBA; Securitisation database
institutions (ADIs) and other lenders has declined somewhat (Graph 4.15). Interest rates offered by ADIs increased over the first half of the year, with higher interest rates for investors and interest-only loans. In contrast, the interest rates offered by non-ADIs declined over the year, mainly driven by a decline in the average interest rate charged on principal-and-interest loans for owner-occupiers (Graph 4.16). Although the average rate charged by non-ADIs remains well above the rates charged by ADI lenders, the narrowing of the gap may indicate that non-ADIs are passing through an improvement in funding conditions to their lending rates; RMBS are an important source of funding for non-ADIs and

S TAT E M E N T O N M O N E TA R Y P O L I C Y | F E B R UA R Y 2018 4 9
Graph 4.16 Graph 4.17Variable Outstanding Housing Interest Rates
Owner-occupierPrincipal-and-interest
4.5
5.0
5.5
6.0%
ADIs
Non-ADIs
InvestorPrincipal-and-interest
4.5
5.0
5.5
6.0%
Interest-only
2015 2016 20174.0
4.5
5.0
5.5
6.0% Interest-only
2015 2016 20174.0
4.5
5.0
5.5
6.0%
Sources: RBA; Securitisation database
Business creditNon-intermediated debtOther lending
2014201120082005 2017-10
0
10
20
%
-10
0
10
20
%
Business Debt*Year-ended growth
Business debt
* Break-adjusted; not seasonally adjustedSources: APRA; Bloomberg; RBA; Thomson Reutersspreads on these securities over benchmark rates
have narrowed. It is also possible that as ADI lending growth has slowed, the characteristics of new borrowers serviced by non-ADI lenders could be less risky than their existing borrowers. This has been reflected in a decline in the average rates charged across new and existing borrowers.
The average interest rate on new fixed-rate housing loans has also declined in recent months, reflecting some rate reductions by the major banks. More recently, one major bank has raised interest rates on fixed-term loans, citing an upwardly revised outlook for interest rates.
Business FinancingGrowth in business debt has been moderate in recent years. This is despite interest rates being near historic lows and a pick-up in business investment outside the mining industry (Table 4.1; Graph 4.17). The moderate growth in business debt partly reflects the tendency for businesses to finance investment from internal funding rather than through debt.2 Growth in debt funding appears to be more linked to mergers and acquisitions activity (M&A), which has been relatively modest over recent years,
2 See Kent C (2017), ‘The Availability of Business Finance’, Speech at 30th Australasian Finance and Banking Conference, Sydney, 13 December.
although some large M&A deals were announced in December.
Bond issuance by non-financial corporations in 2017 was around the average of recent years; there was substantial issuance from infrastructure and utilities companies, while issuance by mining companies remained relatively low. This has coincided with strong conditions for issuers; spreads of non-financial corporate bond yields to AGS continued to tighten over 2017 across industries and credit rating bands (Graph 4.18).
Growth in lending to businesses by banks eased slightly in 2017, although lending growth has
Graph 4.18Australian Corporate BondsYield
20132008 20180
3
6
9
%
AGS
Othernon-financialcorporations
Spread to AGS
20132008 20180
200
400
600
bps
Resource-relatedcorporations
Sources: Bloomberg; RBA; S&P Capital IQ
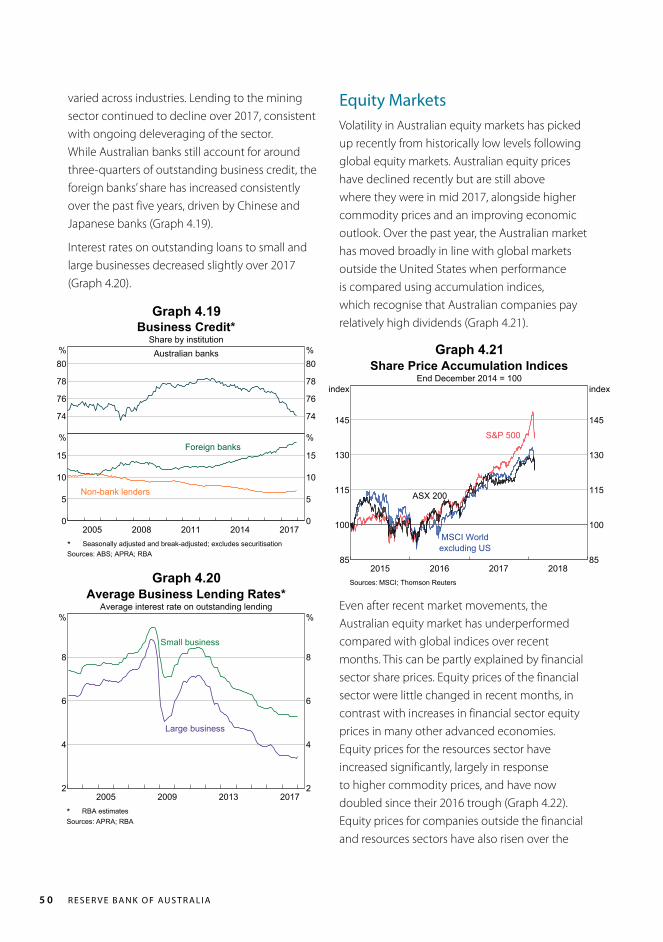
R E S E R V E B A N K O F AU S T R A L I A5 0
varied across industries. Lending to the mining sector continued to decline over 2017, consistent with ongoing deleveraging of the sector. While Australian banks still account for around three-quarters of outstanding business credit, the foreign banks’ share has increased consistently over the past five years, driven by Chinese and Japanese banks (Graph 4.19).
Interest rates on outstanding loans to small and large businesses decreased slightly over 2017 (Graph 4.20).
Equity MarketsVolatility in Australian equity markets has picked up recently from historically low levels following global equity markets. Australian equity prices have declined recently but are still above where they were in mid 2017, alongside higher commodity prices and an improving economic outlook. Over the past year, the Australian market has moved broadly in line with global markets outside the United States when performance is compared using accumulation indices, which recognise that Australian companies pay relatively high dividends (Graph 4.21).
Graph 4.19
Graph 4.20
Graph 4.21Business Credit*Share by institutionAustralian banks
74
76
78
80%
74
76
78
80%
2014201120082005 20170
5
10
15
%
0
5
10
15
%Foreign banks
Non-bank lenders
* Seasonally adjusted and break-adjusted; excludes securitisationSources: ABS; APRA; RBA
201320092005 20172
4
6
8
%
2
4
6
8
%
Average Business Lending Rates*Average interest rate on outstanding lending
Small business
Large business
* RBA estimatesSources: APRA; RBA
201720162015 201885
100
115
130
145
index
85
100
115
130
145
index
Share Price Accumulation IndicesEnd December 2014 = 100
S&P 500
ASX 200
MSCI Worldexcluding US
Sources: MSCI; Thomson Reuters
Even after recent market movements, the Australian equity market has underperformed compared with global indices over recent months. This can be partly explained by financial sector share prices. Equity prices of the financial sector were little changed in recent months, in contrast with increases in financial sector equity prices in many other advanced economies. Equity prices for the resources sector have increased significantly, largely in response to higher commodity prices, and have now doubled since their 2016 trough (Graph 4.22). Equity prices for companies outside the financial and resources sectors have also risen over the

S TAT E M E N T O N M O N E TA R Y P O L I C Y | F E B R UA R Y 2018 5 1
Graph 4.22
Graph 4.23
2017201620152014 201840
60
80
100
120
index
40
60
80
100
120
index
Australian Share Price IndicesEnd December 2013 = 100
Resources
Financials
Other sectors
Source: Bloomberg
ASX 200 Price-earnings Ratios12-month-ahead earnings forecasts
Resources
10
15
20
ratio Other
10
15
20
ratio
Averagesince 2003
Financials
20122006 20185
10
15
20
ratio ASX 200
20122006 20185
10
15
20
ratio
Source: Thomson Reuters
past year, driven by the healthcare and consumer staples sectors.
Analysts’ expectations for listed company earnings have been little changed in recent months. Share price valuations – as measured by price-to-earnings ratios – remain slightly above recent averages for most sectors (Graph 4.23). R

R E S E R V E B A N K O F AU S T R A L I A52
Developments in investor and owner-occupier housing credit have attracted considerable attention in recent years. The RBA publishes these data as part of Australia’s Financial Aggregates on a monthly basis. This box outlines some of the considerations involved in compiling these data.
Measuring the Level and Growth Rate of Housing CreditThe Financial Aggregates statistical release contains data on the levels of credit extended by financial intermediaries to Australian businesses and households, including the levels of investor and owner-occupier housing credit.1 Sometimes, factors other than demand and supply can affect the growth of these series (Graph D1). Examples include changes in the availability of data from lenders, or changes arising from lenders reporting a reclassification of investor and owner-occupier loans at a particular time.2 Each month, based on information provided by institutions, the RBA makes an assessment about whether any of the changes in the unadjusted data are being driven by such reporting changes. The RBA publishes growth rates adjusted to remove the effect of these breaks in order to aid the interpretation of the underlying growth in credit.
1 See RBA statistical tables D1 and D2, available at <https://www.rba.gov.au/statistics/tables/>.
2 See Lowe P (2015), ‘Remarks at FINSIA Regulators Panel’, FINSIA Regulators Panel, Sydney, 5 November for a discussion of the drivers of the volatility observed in this series between 2012 and 2015.
Box D
Measures of Investor and Owner-occupier Housing Credit
Switching Between Investor and Owner-occupier Housing LoansIn mid 2015, some banks decided to introduce interest rate differentials between investor and owner-occupier housing loans in response to regulatory measures. For a few months thereafter, a large amount of outstanding housing credit was reported as having switched from investor to owner-occupier (Graph D2). While the published growth rates for total housing credit were not affected by this switching, it had a substantial effect on the unadjusted growth rates of investor and owner-occupier credit. It was considered likely that many of these loans had switched purpose at some earlier date. But there was a greater incentive to report such switches after the pricing differential came into effect. So a decision was made to adjust the published
Graph D1
2015201320112009 2017-10
-5
0
5
10
15
20
25
%
-10
-5
0
5
10
15
20
25
%
Unadjusted Housing Credit Growth*Six-month annualised
Owner-occupier
Investor
* Seasonally adjusted; non-break adjustedSources: ABS; APRA; RBA

S TAT E M E N T O N M O N E TA R Y P O L I C Y | F E B R UA R Y 2018 53
Graph D2 Graph D3
growth rates for investor and owner-occupier credit to remove the effect of this switching.3
Following the large amount of switching that initially occurred around the second half of 2015, the amount of switching each month has decreased significantly and appears to have been relatively stable for some time now. Indeed, these flows appear to reflect consistent behaviour that occurs from month to month. As a result, it now appears unnecessary to adjust the published growth rates to undo the effect of these regular switching flows. Accordingly, henceforth, adjustments for switching flows will only be applied to the growth figures over the period from mid to late 2015 when reported switching was unusually large, but not thereafter. The resulting break-adjusted growth rates are shown in Graph D3. Additionally, the RBA will publish data on aggregate switching flows to assist with the understanding of this switching behaviour.4 R
3 That is, for the purposes of calculating adjusted growth rates, the loans reported as having been switched from investor to owner-occupier in the month are removed from the flow of owner-occupier credit and added back to the flow of investor credit. The value of switching recorded has been reported in the Financial Aggregates press release since September 2015.
4 Graph D2 shows switching flows at the aggregate level; break adjustments are carried out at the institution level.
2015201320112009 20170
2
4
6
8
10
%
0
2
4
6
8
10
%
Housing Credit Growth*Six-month annualised
Owner-occupier
Investor
* Seasonally and break adjustedSources: ABS; APRA; RBA
M MJ JS S SD D D2016 20172015
0
4
8
12
16
$b
0
4
8
12
16
$bLoan Purpose Switching*
* Net value of loans switching from investor to owner-occupier withinthe same lender
Sources: APRA; RBA

R E S E R V E B A N K O F AU S T R A L I A54
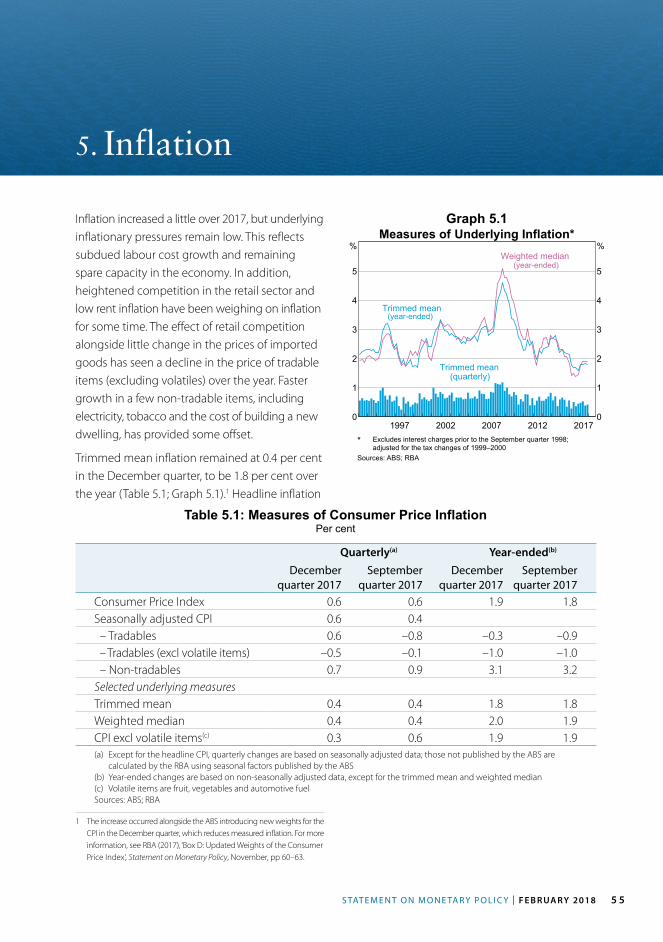
S TAT E M E N T O N M O N E TA R Y P O L I C Y | F E B R UA R Y 2018 5 5
5. Inflation
Inflation increased a little over 2017, but underlying inflationary pressures remain low. This reflects subdued labour cost growth and remaining spare capacity in the economy. In addition, heightened competition in the retail sector and low rent inflation have been weighing on inflation for some time. The effect of retail competition alongside little change in the prices of imported goods has seen a decline in the price of tradable items (excluding volatiles) over the year. Faster growth in a few non-tradable items, including electricity, tobacco and the cost of building a new dwelling, has provided some offset.
Trimmed mean inflation remained at 0.4 per cent in the December quarter, to be 1.8 per cent over the year (Table 5.1; Graph 5.1).1 Headline inflation
1 The increase occurred alongside the ABS introducing new weights for the CPI in the December quarter, which reduces measured inflation. For more information, see RBA (2017), ‘Box D: Updated Weights of the Consumer Price Index’, Statement on Monetary Policy, November, pp 60–63.
Graph 5.1
2012200720021997 20170
1
2
3
4
5
%
0
1
2
3
4
5
%Measures of Underlying Inflation*
(year-ended)Weighted median
Trimmed mean
(quarterly)Trimmed mean
(year-ended)
* Excludes interest charges prior to the September quarter 1998;adjusted for the tax changes of 1999–2000
Sources: ABS; RBA
Table 5.1: Measures of Consumer Price InflationPer cent
Quarterly(a) Year-ended(b)
December quarter 2017
September quarter 2017
December quarter 2017
September quarter 2017
Consumer Price Index 0.6 0.6 1.9 1.8Seasonally adjusted CPI 0.6 0.4 – Tradables 0.6 –0.8 –0.3 –0.9 – Tradables (excl volatile items) –0.5 –0.1 –1.0 –1.0 – Non-tradables 0.7 0.9 3.1 3.2Selected underlying measuresTrimmed mean 0.4 0.4 1.8 1.8Weighted median 0.4 0.4 2.0 1.9CPI excl volatile items(c) 0.3 0.6 1.9 1.9(a) Except for the headline CPI, quarterly changes are based on seasonally adjusted data; those not published by the ABS are
calculated by the RBA using seasonal factors published by the ABS(b) Year-ended changes are based on non-seasonally adjusted data, except for the trimmed mean and weighted median(c) Volatile items are fruit, vegetables and automotive fuelSources: ABS; RBA

R E S E R V E B A N K O F AU S T R A L I A5 6
cities has contributed to rising cost pressures for selected building materials and some shortages of specialised labour. However, there is little evidence of broadening wage pressures across the construction sector. Construction activity in other capital cities remains much weaker than in the eastern capitals. Accordingly, construction
rose to 0.6 per cent in the quarter and to 1.9 per cent over the year (Graph 5.2). The inflation measures were in line with forecasts in the November Statement, and the Bank’s assessment of underlying inflation pressures in the economy is little changed.
Graph 5.3
Graph 5.4
Tradable and Non-tradable Inflation*Tradables excl volatilesTradables excl volatiles
0
2
4
%
0
2
4
%
Year-ended
Quarterly(seasonally adjusted)
Non-tradables**Non-tradables**
2012200720021997 2017-2
0
2
4
%
-2
0
2
4
%
* Adjusted for the tax changes of 1999–2000** Excludes interest charges and deposit & loan facilitiesSources: ABS; RBA
Imports* Net taxes Capital Labour
Food
Consu
mer
durab
les Market
servi
ces**
Admin
excl
utiliti
es Utilitie
s
New
dwell
ings
0
20
40
60
80
100
%
0
20
40
60
80
100
%
Input Structure by Primary InputShare of final consumer prices, 2014/15
* Includes imports consumed by households and those used as inputsto domestic production** Excludes domestic travel and telecommunication services
Sources: ABS; RBA
Graph 5.2
2012200720021997 2017-1
0
1
2
3
4
5
%
-1
0
1
2
3
4
5
%Consumer Price Inflation*
Quarterly
Year-ended
(seasonally adjusted)
* Excludes interest charges prior to the September quarter 1998;adjusted for the tax changes of 1999–2000
Sources: ABS; RBA
Non-tradable inflation picked up over the past year (Graph 5.3). This was led by further large increases in electricity and tobacco prices, while inflation in the cost of building a new dwelling has also risen as construction activity remains strong. However, low wage growth over recent years has contained inflation in the prices of other non-tradable goods and services, which have a relatively high share of labour costs in total input costs, such as administered prices (excluding utilities) and market services (Graph 5.4).
Year-ended inflation in new dwelling costs has increased to its highest level in two years (Graph 5.5). However, inflation rates differ considerably across capital cities, reflecting varying degrees of activity in residential construction. The most notable increases in new dwelling construction costs have been in the eastern capital cities, which is consistent with reports from the Bank’s liaison program that the high level of construction activity in these
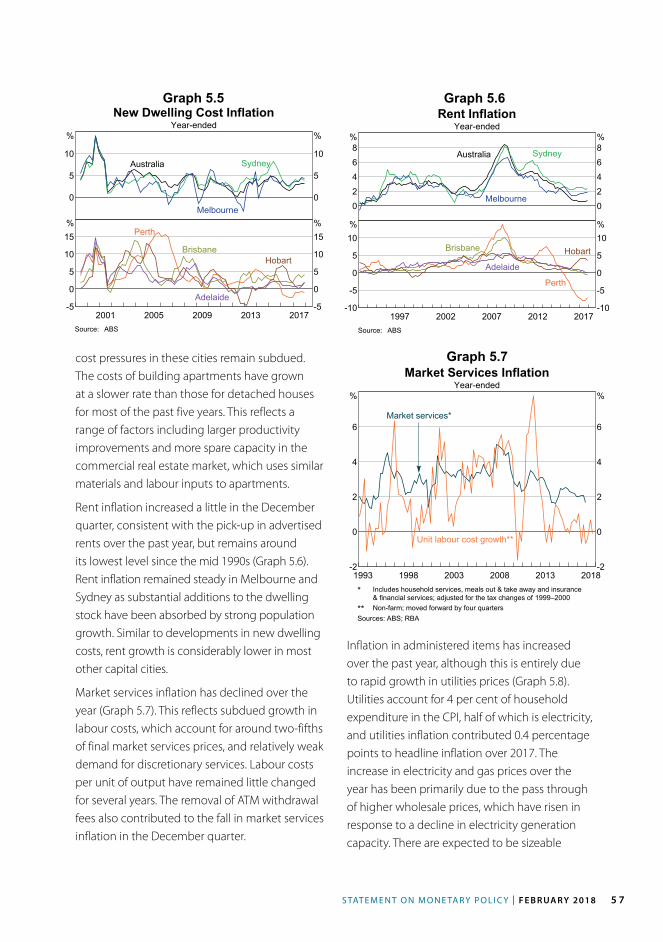
S TAT E M E N T O N M O N E TA R Y P O L I C Y | F E B R UA R Y 2018 5 7
cost pressures in these cities remain subdued. The costs of building apartments have grown at a slower rate than those for detached houses for most of the past five years. This reflects a range of factors including larger productivity improvements and more spare capacity in the commercial real estate market, which uses similar materials and labour inputs to apartments.
Rent inflation increased a little in the December quarter, consistent with the pick-up in advertised rents over the past year, but remains around its lowest level since the mid 1990s (Graph 5.6). Rent inflation remained steady in Melbourne and Sydney as substantial additions to the dwelling stock have been absorbed by strong population growth. Similar to developments in new dwelling costs, rent growth is considerably lower in most other capital cities.
Market services inflation has declined over the year (Graph 5.7). This reflects subdued growth in labour costs, which account for around two-fifths of final market services prices, and relatively weak demand for discretionary services. Labour costs per unit of output have remained little changed for several years. The removal of ATM withdrawal fees also contributed to the fall in market services inflation in the December quarter.
Graph 5.5 Graph 5.6
Graph 5.7
New Dwelling Cost InflationYear-ended
0
5
10
%
0
5
10
%
Sydney
Melbourne
Australia
2013200920052001 2017-5
0
5
10
15%
-5
0
5
10
15%
BrisbaneHobart
Adelaide
Perth
Source: ABS
Rent InflationYear-ended
02468%
02468%
Sydney
Melbourne
Australia
2012200720021997 2017-10
-5
0
5
10%
-10
-5
0
5
10%
Brisbane Hobart
Adelaide
Perth
Source: ABS
20132008200319981993 2018-2
0
2
4
6
%
-2
0
2
4
6
%
Market Services InflationYear-ended
Market services*
Unit labour cost growth**
* Includes household services, meals out & take away and insurance& financial services; adjusted for the tax changes of 1999–2000** Non-farm; moved forward by four quarters
Sources: ABS; RBA
Inflation in administered items has increased over the past year, although this is entirely due to rapid growth in utilities prices (Graph 5.8). Utilities account for 4 per cent of household expenditure in the CPI, half of which is electricity, and utilities inflation contributed 0.4 percentage points to headline inflation over 2017. The increase in electricity and gas prices over the year has been primarily due to the pass through of higher wholesale prices, which have risen in response to a decline in electricity generation capacity. There are expected to be sizeable
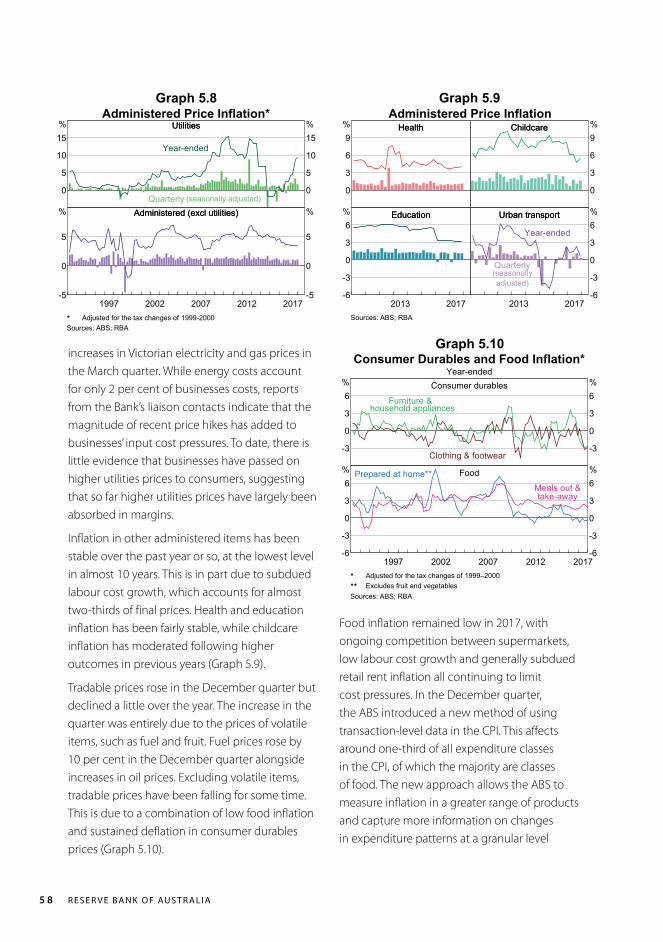
R E S E R V E B A N K O F AU S T R A L I A5 8
increases in Victorian electricity and gas prices in the March quarter. While energy costs account for only 2 per cent of businesses costs, reports from the Bank’s liaison contacts indicate that the magnitude of recent price hikes has added to businesses’ input cost pressures. To date, there is little evidence that businesses have passed on higher utilities prices to consumers, suggesting that so far higher utilities prices have largely been absorbed in margins.
Inflation in other administered items has been stable over the past year or so, at the lowest level in almost 10 years. This is in part due to subdued labour cost growth, which accounts for almost two-thirds of final prices. Health and education inflation has been fairly stable, while childcare inflation has moderated following higher outcomes in previous years (Graph 5.9).
Tradable prices rose in the December quarter but declined a little over the year. The increase in the quarter was entirely due to the prices of volatile items, such as fuel and fruit. Fuel prices rose by 10 per cent in the December quarter alongside increases in oil prices. Excluding volatile items, tradable prices have been falling for some time. This is due to a combination of low food inflation and sustained deflation in consumer durables prices (Graph 5.10).
Graph 5.8 Graph 5.9
Graph 5.10
Administered Price Inflation*UtilitiesUtilities
0
5
10
15%
0
5
10
15%
Year-ended
Quarterly (seasonally adjusted)Administered (excl utilities)Administered (excl utilities)
2012200720021997 2017-5
0
5
%
-5
0
5
%
* Adjusted for the tax changes of 1999-2000Sources: ABS; RBA
Administered Price InflationHealthHealth
0
3
6
9% ChildcareChildcare
0
3
6
9%
EducationEducation
2013 2017-6
-3
0
3
6% Urban transportUrban transport
2013 2017-6
-3
0
3
6%
Year-ended
Quarterly(seasonallyadjusted)
Sources: ABS; RBA
Consumer Durables and Food Inflation*Year-ended
Consumer durables
-3
0
3
6%
-3
0
3
6%
household appliancesFurniture &
Clothing & footwear
Food
2012200720021997 2017-6
-3
0
3
6%
-6
-3
0
3
6%
take-awayMeals out &
Prepared at home**
* Adjusted for the tax changes of 1999–2000** Excludes fruit and vegetablesSources: ABS; RBA
Food inflation remained low in 2017, with ongoing competition between supermarkets, low labour cost growth and generally subdued retail rent inflation all continuing to limit cost pressures. In the December quarter, the ABS introduced a new method of using transaction-level data in the CPI. This affects around one-third of all expenditure classes in the CPI, of which the majority are classes of food. The new approach allows the ABS to measure inflation in a greater range of products and capture more information on changes in expenditure patterns at a granular level

S TAT E M E N T O N M O N E TA R Y P O L I C Y | F E B R UA R Y 2018 5 9
Graph 5.11
Graph 5.12
20132008200319981993 20180
1
2
3
4
5
%
0
1
2
3
4
5
%
Short-term Inflation ExpectationsOver the next year
Inflation swaps
UnionsMarket
economists
Sources: Australian Council of Trade Unions; Bloomberg; RBA; WorkplaceResearch Centre
(for instance substitution between types of fruit). Empirical analysis by the ABS suggests that this methodological change would have slightly lowered food inflation in past quarters, but they note that the change will not necessarily continue to have this effect.2
Price declines in consumer durables have accelerated over the year. This is consistent with soft demand for consumer discretionary goods as well as intense competition in the retail sector. There is little evidence of competitive pressures easing as new foreign retailers continue to enter the market, and retailers engage in strategies to permanently lower prices on an increasing range of items. With the exception of higher utilities prices, increases in most other retail input costs have been subdued. Retail rent growth remains low, except for moderate rises in retail rents in the CBDs of Sydney and Melbourne, and the exchange rate has been little changed over the year. As noted above, the competitive environment limits retailers’ ability to pass on increases in costs to consumers. Business liaison reports suggest that retailers have employed technology to increase efficiency to contain the compression of their margins.
Measures of inflation expectations are generally consistent with the inflation target (Graph 5.11; Graph 5.12). Recently, short-term measures of inflation expectations have increased, while long-term measures have been stable. R
2 ABS (2017), ‘Information Paper: An Implementation Plan to Maximise the Use of Transactions Data in the CPI’, June.
Long-term Inflation Expectations
1
2
3
4%
1
2
3
4%
Unions*
Consensus Economics**
20132008200319981993 20180
1
2
3
4%
0
1
2
3
4%
10-year indexed bondsInflation swaps***
* Average over the next five to ten years** Average over six to ten years in the future*** Five-to-ten-year forwardSources: Australian Council of Trade Unions; Bloomberg; Consensus
Economics; RBA; Workplace Research Centre; Yieldbroker

R E S E R V E B A N K O F AU S T R A L I A6 0

S TAT E M E N T O N M O N E TA R Y P O L I C Y | F E B R UA R Y 2018 6 1
6. Economic Outlook
Graph 6.1The International EconomyGlobal economic conditions strengthened further over 2017. GDP growth increased across a broad range of economies and world GDP growth reached its highest rate since 2011. The near-term outlook for growth in Australia’s major trading partners is a little stronger than at the time of the November Statement, reflecting stronger-than-expected data for some economies and the expected boost to demand from US tax cuts (Graph 6.1). Some indicators are suggesting that wage and inflationary pressures are picking up. While markets have increased their expectations for a withdrawal of monetary policy accommodation, the pace of this withdrawal is still expected to be gradual and the stance of monetary policy is expected to remain accommodative over the forecast period.
The improved outlook for major trading partner growth is being supported by a recovery in investment in the major advanced economies and the high-income economies in Asia. There have also been some tentative signs of an increase in labour productivity growth, which had slowed significantly over the past decade. All these factors should contribute to the productive capacity of these economies.
Growth in China is expected to moderate a little over the coming year. Fiscal policy and solid growth in financing continues to support growth, but weaker property market conditions and environment-related restrictions are expected to have a dampening effect. Policy efforts to rein in ‘shadow banking’ activities and achieve a more
environmentally sustainable pattern of growth are also expected to slow growth over the next year or so, while reducing risks to financial stability. In the longer term, growth in China is expected to slow gradually, reflecting structural factors such as the declining working-age population. The east Asian economies (other than China and Japan) are expected to grow at around potential over the forecast period, supported by the improvement in the global economy and an expected pick-up in domestic demand.
GDP growth in the major advanced economies is expected to remain above potential growth over the next couple of years. This is largely because monetary policies are expected to remain accommodative (although in some cases, less so) and fiscal policies are expected to be more expansionary. The recently enacted tax changes in the United States should provide fiscal stimulus in 2018 and 2019 and lead to higher
RBA forecast
20132007200119951989 2019-2
0
2
4
6
%
-2
0
2
4
6
%
Australia’s Trading Partner Growth*Year-average
* Aggregated using total export sharesSources: ABS; CEIC Data; RBA; Thomson Reuters

R E S E R V E B A N K O F AU S T R A L I A6 2
US consumption and investment growth over the next couple of years. In 2017, the euro area’s economic expansion gained momentum, which is likely to continue in the near term. The Japanese economy has benefited from the pick-up in global demand and investment growth is expected to remain strong in part to address labour shortages.
Although still low, wage growth has increased in some of the major advanced economies that are around full employment. Wage pressures are expected to increase gradually as spare capacity in these economies’ labour markets declines further. This should put upward pressure on inflation in the next couple of years.
Chinese steel demand is expected to weaken over the forecast period and further increases in low-cost supply of bulk commodities are in the pipeline. Consequently, the terms of trade are expected to decline, but to remain above their trough in early 2016 (Graph 6.2). In the near term, however, some volatility in the terms of trade is expected following recent disruptions to Australian coal supply and ongoing uncertainty about the effects of the Chinese authorities’ environmental restrictions on steel production.
Graph 6.2
20102000199019801970 202050
75
100
125
150
index
50
75
100
125
150
index
Terms of Trade2015/16 average = 100
Forecast
Sources: ABS; RBA20182016201420122010 2020
0
1
2
3
4
5
%
0
1
2
3
4
5
%
GDP Growth Forecast*Year-ended
70 per cent interval
90 per cent interval
* Confidence intervals reflect RBA forecast errors since 1993Sources: ABS; RBA
Domestic ActivityThe forecasts for domestic output growth are similar to those presented in the November Statement (Graph 6.3; Table 6.1). September quarter GDP growth was in line with expectations, though there were some differences at the component level; weak consumption growth was offset by strong growth in business investment and public demand. Domestic demand growth looks to have continued at a broadly similar pace in the December quarter; timely indicators point to a recovery of consumption growth in the December quarter. However, exports are likely to have declined because of temporary disruptions at key coal export ports and the effect of unfavourable weather on rural exports.
The domestic forecasts are based on a number of technical assumptions. The cash rate is assumed to move broadly in line with market expectations, although this does not imply a commitment to any particular path for policy by the Reserve Bank Board. The exchange rate and oil prices are assumed to remain at their current levels. This implies an exchange rate that is 2 per cent lower on a trade-weighted basis than assumed in the
Graph 6.3

S TAT E M E N T O N M O N E TA R Y P O L I C Y | F E B R UA R Y 2018 6 3
Table 6.1: Output Growth and Inflation Forecasts(a)
Per cent
Year-ended
Dec 2017 Jun 2018 Dec 2018 Jun 2019 Dec 2019 Jun 2020
GDP growth 2½ 2¾ 3¼ 3½ 3¼ 3Unemployment rate(b) 5.5 5¼ 5¼ 5¼ 5¼ 5¼CPI inflation 1.9 2 2¼ 2¼ 2¼ 2¼Underlying inflation 1¾ 1¾ 1¾ 2 2 2¼
Year-average
2017 2017/18 2018 2018/19 2019 2019/20
GDP growth 2¼ 2¾ 3 3¼ 3¼ 3¼(a) Technical assumptions include A$ at US$0.78, TWI at 64, Brent crude oil price at US$64 per barrel; shaded regions are historical data(b) Average rate in the quarterSources: ABS; RBA
November Statement and a US dollar price of Brent crude oil that is about 2 per cent higher. The population aged over 15 years is assumed to grow by 1.6 per cent over both 2018 and 2019.
GDP growth is forecast to strengthen over 2018 and 2019 as the drag from mining investment comes to an end and accommodative monetary policy provides ongoing support for growth in household income and consumption, and non-mining business investment. The implementation of the National Disability Insurance Scheme (NDIS) and public infrastructure investment are expected to help sustain growth in public demand. Growth is expected to slow a little towards the end of the forecast period because liquefied natural gas (LNG) production will have reached its steady state and LNG exports are not expected to contribute much to growth after 2019. Although year-ended growth is forecast to be above potential by the end of the year, the economy is not expected to encounter broad-based capacity constraints for some time.
One of the important factors behind the gradual pick-up in GDP growth is that most of the decline in mining investment has now passed. Combined with ongoing growth in mining exports, this means that the mining sector should make a positive contribution to GDP growth over the
next few years. The level of mining investment is expected to stabilise in the second half of 2018: while there are very few new large projects scheduled to commence and the construction phase of the remaining large LNG projects is close to completion, major mining firms will need to undertake investment in coming years if they are to maintain their existing productive capacity (although most of this activity is expected to be after 2020). As additional LNG production comes on line over 2018 and 2019, LNG exports are expected to contribute around ¼ percentage point to GDP growth per year. Iron ore export volumes are expected to increase a little further over the next couple of years as productivity improvements from Australia’s major producers yield some increases in production.
The recent momentum in non-mining business investment is expected to continue, supported by an increase in infrastructure activity and the diminishing impact of falling mining investment on other sectors of the economy. Industry liaison suggests that positive flow-on effects from public sector investment are likely to support growth in machinery and equipment investment in coming years. Building approvals data and expectations from the ABS capital expenditure (Capex) survey for 2017/18 both suggest that there will be some

R E S E R V E B A N K O F AU S T R A L I A6 4
strength in non-residential construction in the near term. Whether this strength carries over into 2018/19 will become clearer at the beginning of March, when the next Capex survey is released.
Public demand is also expected to provide impetus to growth for some time. In addition to the positive spillovers from strong public infrastructure investment (See ‘Box C: Spillovers from Public Investment’), growth in public consumption is being supported by the rollout of the NDIS and is forecast to be faster than overall GDP growth.
Household consumption growth is forecast to pick up a little but to a rate that is lower than the average rate seen prior to the onset of the financial crisis. The outlook for household income growth continues to represent a significant uncertainty for the consumption forecasts. Dwelling investment is expected to remain at high levels for some time, supported by a significant pipeline of work still to be done. Even so, dwelling investment is not likely to contribute to GDP growth over the forecast period.
Consistent with the overall GDP growth profile, there has been little change to the employment growth profile since the November Statement. Although employment growth was surprisingly strong throughout 2017, it is expected to moderate over the next few years. Even so, employment growth is expected to remain stronger than growth of the working-age population and support household income and consumer spending. The unemployment rate is forecast to decline gradually to 5¼ per cent as GDP growth picks up pace (Graph 6.4). The profile for the unemployment rate is slightly lower than forecast in the November Statement, reflecting a lower starting point and the information provided by near-term leading indicators. However, the forecasts suggest that there will still be some spare capacity in the labour market at the end of the forecast period. The speed and extent to which
the unemployment rate declines over time will depend on the behaviour of the participation rate and average hours worked. The participation rate has risen quite sharply over the past year as some people delayed retirement and improved labour market conditions encouraged others to join the labour force. The participation rate is expected to increase a little further over the next few years. As discussed below, the uncertainty around the projections for the participation rate translates directly into uncertainty about the unemployment rate and the degree of spare capacity in the labour market.
The September quarter wage data were slightly weaker than expected, although there were temporary factors that may have weighed on wage outcomes in the quarter and are expected to have boosted wage growth slightly in the December quarter. Wage growth is expected to pick up gradually over the year ahead as spare capacity in the labour market declines and the adjustment following the mining boom ends. Implicit in this forecast of a pick-up in wage growth is the assumption that any effects of structural factors that might be currently weighing on wage growth will gradually lessen. The rollover to new enterprise
20162012200820042000 20203
4
5
6
7
%
3
4
5
6
7
%
Unemployment Rate Forecast*Quarterly
90 per cent interval
70 per cent interval
* Confidence intervals reflect RBA forecast errors since 1993Sources: ABS; RBA
Graph 6.4

S TAT E M E N T O N M O N E TA R Y P O L I C Y | F E B R UA R Y 2018 6 5
bargaining agreements with lower wage growth than current agreements will exert downward pressure on overall wage growth for the next couple of years. The size of new wage claims, both in enterprise and individual agreements, will provide an indication of any recovery in wage growth.
InflationThe December quarter inflation data were in line with forecasts in the November Statement. As such, there is little change to the outlook for underlying inflation, apart from a marginal increase to reflect the expectation that spare capacity in the labour market will decline a bit further than previously forecast (Graph 6.5). World export price inflation is likely to pick up a little, which will support tradables prices. Underlying inflation is expected to increase to around 2 per cent in early 2019 and to 2¼ per cent by mid 2020.
20182016201420122010 20200
1
2
3
%
0
1
2
3
%
Trimmed Mean Inflation Forecast*Year-ended
70 per cent interval
90 per cent interval
* Confidence intervals reflect RBA forecast errors since 1993Sources: ABS; RBA
The gradual pick-up in inflation reflects the decline in spare capacity in the economy as GDP growth picks up to be above potential and the economy moves closer to full employment. This is expected to see labour costs put more upward pressure on inflation. On the other
Graph 6.5
hand, there are a number of factors that are likely to weigh on inflation. The combination of weak discretionary consumer spending and continued retail competition has seen a decline in consumer durable prices over recent years. While consumption growth is forecast to pick up this year, it is expected that the arrival of new entrants in the retail sector will continue to put downward pressure on some retail prices over the next few years.
Headline inflation is expected to be around 2¼ per cent from late 2018. In the near term, higher utility prices in Victoria are likely to boost headline inflation in the March quarter. Further out, scheduled increases in the tobacco excise will also add to headline inflation.
The key areas of uncertainty for the inflation outlook are around how labour market conditions will translate into wage growth (see below), the behaviour of inflation expectations, and exchange rate movements. It is also uncertain how long the factors that are contributing to higher utility price inflation will take to resolve.
Key UncertaintiesThere are a number of key uncertainties in relation to the forecasts. They are similar to those discussed in the November Statement. For the global economy, investment growth could have more momentum and positive spillovers to activity could be larger than currently forecast. Some risks, such as escalating geopolitical tensions and increased global trade protectionism, have the potential to derail the current economic expansion, as do the longstanding financial stability risks associated with high levels of debt in the Chinese economy.
Domestically, a key source of uncertainty for the forecasts continues to be the outlook for the labour market. This comes from two sources. First, it is not clear how much spare capacity there is

R E S E R V E B A N K O F AU S T R A L I A6 6
in the labour market and how quickly it might decline, particularly given the recent strength in the participation rate. Second, it is unclear how much any decline in spare capacity will translate into building wage pressures. Both of these factors affect the outlook for inflation and household income growth, which is a key driver of consumption and therefore the GDP growth forecast. Another key source of risk to growth is developments in the housing market that reflect both demand factors, such as population growth, and supply factors. In addition, high levels of indebtedness increase the sensitivity of households to changes in their income or wealth, which has implications for consumption.
The global economy
The outlook for activity in Australia’s major trading partners has been revised up over the past year. There are, in addition, some upside risks to this central forecast. Tight labour markets in the major advanced economies could see wage growth increase faster than expected and labour shortages could induce a larger and more sustained increase in investment as companies face difficulty in expanding their operations by employing more people. In addition, the recent US tax changes could boost consumption and investment by more than currently forecast. The realisation of these upside risks would increase inflationary pressures and could prompt a faster tightening of monetary policy in the major advanced economies.
The effects of stronger global growth on the Australian economy depend on the drivers and the location of that growth. Stronger growth driven by increased demand in the major advanced economies, for example as a result of stronger investment growth, would be expected to increase growth in the Australian economy and result in a lower unemployment rate and more domestic inflation through two main
channels. The direct demand effect would result in higher Australian non-resource exports, and should also support commodity prices, which would raise the incomes of resource exporters relative to current forecasts. The other channel is the exchange rate. Stronger demand and higher inflation would be expected to lead central banks in major advanced economies to tighten monetary policy faster than currently expected, which could result in a depreciation of the Australian dollar, all else being constant. This would provide additional support to the Australian economy by making domestically produced goods and services more competitive and would directly flow through to higher domestic inflation via higher import prices. Given that the financial linkages between Australia and the major advanced economies are generally stronger than our direct trade linkages, the implications for the exchange rate may be the more important factor for determining the effect for the Australian economy.
But the implications of stronger global growth depend on a broad range of factors, which are at this point uncertain. One downside risk in the scenario described above is that a large increase in long-term interest rates in the advanced economies could engender further market volatility, as well as tighten financial conditions in emerging markets and result in financial market disturbances there. This could offset some of the initial boost to economic activity.
The Chinese economy
Although financial conditions tightened a little in China over 2017, growth in aggregate financing and public spending was strong. Residential real estate and infrastructure investment moderated towards the end of the year, but a further easing could lead the authorities to adopt a more accommodative stance of macroeconomic (or housing) policy in 2018, which presents an

S TAT E M E N T O N M O N E TA R Y P O L I C Y | F E B R UA R Y 2018 6 7
upside risk to Chinese growth and the demand for bulk commodities. The full effects of the winter cuts to Chinese steel production remain uncertain, but so far appear to be relatively modest.
The risks of financial disruption in China have also shifted slightly. Recent regulatory and supervisory announcements indicate a strengthening of the authorities’ resolve to reduce financial sector risks through tougher and more coordinated financial oversight. To date, these announcements do not appear to have triggered any material disruption to funding markets. But these policies are likely to constrain growth in the short term. Leverage also remains high, which continues to present risks in the medium term.
Commodity prices and global inflation
Uncertainty about demand in China, particularly in the property and infrastructure sectors, translates directly into uncertainty about demand for bulk commodities and commodity prices. Indeed, the impact of pollution-control policies on Chinese steel production has been more modest than had been anticipated, which has contributed to higher commodity prices in recent months, as have supply-side factors, particularly for coking coal. Because the current production cuts required of heavily polluting industries are expected to be in place until mid March, there remains considerable room for future volatility in Chinese iron ore and coking coal demand and bulk commodity prices. This has implications for the terms of trade.
Movements in oil and other commodity prices also represent an important uncertainty in the forecasts. Oil prices are up by around 20 per cent over the past year. This has directly affected headline inflation both domestically and overseas through higher fuel prices. The weight of automotive fuel in the Australian CPI basket
is around 3 per cent. Higher oil prices are also likely to have boosted business costs, which could be passed on to consumer prices. The size and timing of these indirect effects are difficult to determine. Input-output tables suggest that oil accounts for between 2 and 3 per cent of the prices of non-fuel items in the CPI. In practice, however, movements in oil prices are partly absorbed into margins for these items and any pass-through tends to occur over a long period.
While supply factors have been an important driver of commodity prices over the past year or so, global demand is likely to be an increasingly important influence. Highly correlated increases in commodity prices would be further evidence of strengthening global demand and, given that many economies are operating close to capacity, could signal a more significant increase in global inflation than is currently forecast. In turn, this could lead some central banks to remove their policy accommodation faster than currently expected, which would have consequences for financial market prices, including exchange rates.
The labour market and wages
There is considerable uncertainty about whether the future demand for labour will be met by people entering the labour market, by people who are currently unemployed or by employed people working more hours. Participation rate outcomes will depend on a large range of factors, including the retirement decisions of older workers, the participation decisions of prime-age women and labour market conditions for younger workers. It is hard to gauge whether some of the trends of recent years, such as the sharp increase in the participation of older workers, will continue, or whether they are simply a function of strong employment growth. If the participation rate does not increase as expected, employment growth will probably also be slower than expected, but it could also imply a larger-than-forecast decline in

R E S E R V E B A N K O F AU S T R A L I A6 8
the unemployment rate or an increase in average hours worked.
The sources of the expected growth in total hours – a rise in participation, decline in unemployment or increase in average hours worked – may affect how the decline in spare capacity translates into wage growth pressures and consumption decisions. For example, it may be that the propensity to consume rather than save additional income is higher for those who move from unemployment into employment than it is for incumbent workers increasing their hours. If wage growth does not pick up as expected, and households start viewing lower income growth as being more persistent, consumption growth could be somewhat lower than forecast.
Alongside this, there is always uncertainty around estimates of full employment, the point at which wage growth might start to build. Over recent years, declining unemployment rates accompanied by subdued wage growth have led estimates of the level of the unemployment rate consistent with full employment to be revised down in a number of countries. The experience of low wage growth in those countries with tighter labour markets suggests that structural factors, such as technological change and globalisation, have also had an important bearing on wage outcomes and could continue to do so for some time yet. On the other hand, more firms have been indicating that they are finding it more difficult to find suitable labour, which might lead to wage growth picking up more quickly than anticipated. The annual minimum and award wage decisions will also have an influence on aggregate wage growth over the next few years.
Housing markets and household debt
Conditions in the established housing market have cooled in recent months. Housing prices in Sydney have declined a little, conditions in
Melbourne have eased following several years of strong price growth and conditions in most other capital cities remain subdued. If housing prices were to fall significantly, households might respond by curtailing their consumption expenditure and dwelling investment. Employment in the construction sector would also be weaker. Lower housing market activity would affect state government revenues, which may affect decisions about expenditure on activities such as infrastructure projects. If, on the other hand, population growth were to pick up or the reported reduction in foreign demand for newly constructed properties turns out to be temporary, housing prices may be stronger than expected. In such a scenario, dwelling investment could increase, rather than broadly stabilise, or stay higher for longer than currently forecast.
Household indebtedness is high and debt levels relative to income have edged higher because household credit growth has continued to outpace weak income growth. Steps taken by regulators to address the risks in household balance sheets have seen the growth in riskier types of lending to households moderate, but risks remain. A highly indebted household sector is likely to be more sensitive to changes in income, wealth or interest rates. For example, a highly indebted household facing weaker-than-expected growth in disposable income or wealth may be more likely to respond by reducing consumption. Consumption growth may also be weaker for a time if indebted households choose to pay down debt more quickly rather than consume out of additional income. R

S TAT E M E N T O N M O N E TA R Y P O L I C Y | F E B R UA R Y 2018 6 9
HILDA
Disclaimer
The chapter on ‘Domestic Economic Conditions’ in this issue of the Statement uses unit record data from the Household, Income and Labour Dynamics in Australia (HILDA) Survey. The unit record data from the HILDA Survey were obtained from the Australian Data Archive, which is hosted by The Australian National University. The HILDA Survey was initiated and is funded by the Australian Government Department of Social Services (DSS) and is managed by the Melbourne Institute of Applied Economic and Social Research (Melbourne Institute). The findings and views reported in this chapter, however, are those of the Reserve Bank of Australia and should not be attributed to the Australian Government, DSS, the Melbourne Institute, the Australian Data Archive or The Australian National University and none of those entities bear any responsibility for the analysis or interpretation of the unit record data from the HILDA Survey contained in this paper.
Copyright and Disclaimer Notices

R E S E R V E B A N K O F AU S T R A L I A7 0
