statement of assets and liabilities - asset … · 2014-05-27 · jpmorgan funds semi-annual report...
TRANSCRIPT

www.jpmorganam.com.hk
JPMorgan Funds(Unit Trust Range)
Unaudited Semi-Annual Report31 March 2014
Consolidated(306x210)Co.ai 1 16/05/2014 4:49 PMConsolidated(306x210)Co.ai 1 16/05/2014 4:49 PM

These reports do not constitute an offer of units in any funds forming the subject matter of this document. Subscriptions are only valid if made on the basis of the current explanatory memoranda (or equivalent), supplemented by the most recent financial reports, if available. Notice to U.K. residents: This document is only directed to persons believed by JPMorgan Asset Management (U.K.) Limited to be investment professionals as defined in Article 19 of the Financial Services and Markets Act 2000 (Financial Promotion) Order 2005, high net worth companies, unincorporated associations and other persons as defined in Article 49 of that Order and to others to whom it can lawfully be distributed or given, inside the United Kingdom, without approval by an authorised person. Persons who do not have professional experience in matters relating to investments should not rely on it and any other person should not act on such information. This document is issued in the U.K. by JPMorgan Asset Management (U.K.) Limited and has been approved solely for the purposes of section 21(2)(b) of the Financial Services and Markets Act 2000 by JPMorgan Asset Management (U.K.) Limited which is authorised and regulated in the U.K. by the Financial Conduct Authority. Registered in England No. 01161446. Registered address: 25 Bank Street, Canary Wharf, London, UK, E14 5JP. Although JPMorgan Asset Management (Europe) S.à r.l., under certain administrative services agreements, provides services to the funds covered in this document, the funds are not subject to the laws of Luxembourg nor are they subject to supervision by any supervisory authority in Luxembourg.
Consolidated(306x210)Co.ai 2 16/05/2014 4:49 PMConsolidated(306x210)Co.ai 2 16/05/2014 4:49 PM

JJPMORGAN FUNDS SSemi--aannnual report for the
pperiod eended 311 MMarch 220144
CContents PPage
JPMorgan ASEAN Fund ................................................................................................................................................ 1
JPMorgan Asia Domestic Opportunities Fund ............................................................................................................. 8
JPMorgan Asia Equity Dividend Fund .......................................................................................................................... 15
JPMorgan Asia New Frontiers Fund ............................................................................................................................. 25
JPMorgan Asia Resources Fund ................................................................................................................................... 32
JPMorgan Asian Total Return Bond Fund .................................................................................................................... 39
JPMorgan AsiaOne Fund .............................................................................................................................................. 51
JPMorgan Australia Fund ............................................................................................................................................. 57
JPMorgan China New Generation Fund ....................................................................................................................... 65
JPMorgan China Pioneer A-Share Fund ...................................................................................................................... 73
JPMorgan Eastern Fund ............................................................................................................................................... 81
JPMorgan Eastern Smaller Companies Fund .............................................................................................................. 88
JPMorgan Evergreen Fund ........................................................................................................................................... 96
JPMorgan Global Bond and Currency Fund ................................................................................................................. 102
JPMorgan Global Property Income Fund ..................................................................................................................... 111
JPMorgan Greater China Smaller Companies Fund .................................................................................................... 119
JPMorgan India Fund ................................................................................................................................................... 126
JPMorgan India Smaller Companies Fund ................................................................................................................... 133
JPMorgan Indonesia Fund ............................................................................................................................................ 140
JPMorgan Japan (Yen) Fund ........................................................................................................................................ 147
JPMorgan Japan Smaller Company (Yen) Fund ........................................................................................................... 155
JPMorgan Korea Fund .................................................................................................................................................. 162
JPMorgan Malaysia Fund ............................................................................................................................................. 169
JPMorgan Money Fund ................................................................................................................................................. 176
JPMorgan Multi Income Fund ...................................................................................................................................... 182
JPMorgan Pacific Securities Fund ................................................................................................................................ 221
JPMorgan Pacific Technology Fund ............................................................................................................................. 229
JPMorgan Philippine Fund ........................................................................................................................................... 236
JPMorgan Thailand Fund ............................................................................................................................................. 243
JPMorgan Vietnam Opportunities Fund ...................................................................................................................... 250

JJPMORGAN ASEAN FUND SSemi--aannual report for the
pperiod ended 31 March 2014
DDistributor Status The Fund has been certified by HMRC in the UK as a distributing fund in respect of the period from 1 January 1984 to 30 September 2010. The principal effect of this certification is that for unitholders resident or ordinarily resident in the UK for taxation purposes any gains accruing on the sale, redemption or other disposal of units during the period will be taxed in the UK as a capital gain and not as income. This treatment will continue under the new UK reporting fund regime provided the Fund does not invest more than 5% of its assets in other offshore funds which are not themselves reporting funds. There will be no need to formally apply for reporting fund status as the Fund is transparent for UK tax purposes and therefore considered out of scope of the requirements of this new regime. These are now known as “special category transparent offshore funds”. As noted, the Fund is transparent for UK income tax purposes and UK investors are subject to UK capital gains tax on disposal of their units. UK investors are subject to tax on their share of income of the Fund on an arising basis. Information has been provided to UK investors of the amount of their share of the underlying income, expenses and overseas tax suffered.
Investment Portfolio As at 31 March 2014 (Unaudited)
Holding
Fair value
US$
% of net
assets Listed/Quoted Investments (95.4%) (I) Equities (95.4%) Hong Kong (1.1%) Jardine Matheson Hldgs 357,030 22,521,452 1.1 Indonesia (20.1%) Astra Intl 71,730,500 46,567,996 2.3 Bank Central Asia 59,200,000 55,239,436 2.8 Bank Mandiri (Persero) 53,674,613 44,650,096 2.3 Bank Negara Indonesia
(Persero) 54,527,800 23,807,912 1.2 Bank Rakyat Indonesia
Persero 35,827,000 30,197,493 1.5 Indo Tambangraya Megah 1,837,500 3,938,655 0.2 Indocement Tunggal Prakarsa 3,081,700 6,341,086 0.3 Indofood CBP Sukses Makmur 18,454,300 16,407,432 0.8 Jasa Marga (Persero) 49,928,400 26,370,633 1.3 Kalbe Farma 150,486,000 19,406,865 1.0 Perusahaan Gas Negara 21,435,000 9,670,279 0.5 Semen Indonesia Persero 10,589,500 14,728,354 0.7 Surya Citra Media 68,912,550 19,411,986 1.0 Telekomunikasi Indonesia 'B' 231,255,000 45,090,653 2.3 United Tractors 10,018,600 18,299,819 0.9 Wijaya Karya 94,183,700 19,815,056 1.0 Malaysia (19.2%) CIMB Group Hldgs 12,119,163 26,535,604 1.3 Dialog Group 21,910,800 24,088,125 1.2 Digi.com Bhd 16,545,800 27,310,324 1.4
(Continued)
Holding
Fair value
US$
% of net
assets Gamuda Bhd 7,628,900 11,003,558 0.5 Genting Bhd 8,012,100 24,535,599 1.2 Genting Malaysia 8,933,300 11,489,775 0.6 IOI Corp (CDS) 4,698,800 6,906,826 0.3 Malayan Banking 13,145,763 38,968,301 2.0 Malaysia Airports Hldgs 4,288,100 10,505,221 0.5 Muhibbah Engineering (CDS) 10,218,500 9,043,474 0.5 Petronas Chemicals 6,514,500 13,785,085 0.7 Petronas Gas 3,891,100 28,359,571 1.4 SapuraKencana Petroleum 25,655,300 35,354,111 1.8 Sime Darby 13,434,274 38,301,360 1.9 Telekom Malaysia 5,307,000 9,572,265 0.5 Tenaga Nasional 14,532,500 53,225,754 2.7 UEM Sunrise 5,000,000 3,368,550 0.2 UMW Oil & Gas (IPO-
Cornerstone) 7,970,000 9,933,517 0.5 Philippines (7.3%) ABS-CBN Hldgs PDR 12,335,300 8,802,087 0.4 Ayala Land 26,900,000 17,935,333 0.9 Bank Of Philippine Islands 2,276,060 4,359,763 0.2 BDO Unibank 6,738,930 12,773,086 0.6 Cosco Capital 111,216,500 23,560,191 1.2 GT Capital Hldgs 415,842 7,283,842 0.4 Manila Electric 1,841,280 11,660,687 0.6 Melco Crown (Philippines)
Resorts 50,992,400 14,782,054 0.7 Metropolitan Bank & Trust 7,777,000 13,405,332 0.7 Philippine Long Distance
Telephone 184,650 11,240,818 0.6 Robinsons Retail Hldgs 8,597,290 13,036,363 0.7 SM Investments 400,863 6,301,894 0.3 Singapore (31.8%) Ascendas Real Estate Inv Trust 5,102,000 9,169,035 0.5 CapitaCommercial Trust 5,171,000 6,106,266 0.3 CapitaLand Ltd 9,158,000 21,046,177 1.0 CapitaMall Trust 6,065,000 9,115,224 0.5 CapitaMalls Asia 23,365,000 33,257,803 1.7 DBS Group Hldgs 7,680,377 98,756,865 5.0 Fibrechem Technologies 27,671,000 0 0.0 Genting Singapore 34,553,000 36,681,050 1.8 Global Logistics Properties 18,765,000 39,542,961 2.0 Guocoland Ltd (CDP) 2,935,000 5,111,248 0.3 Keppel Corp 6,432,000 55,699,161 2.8 Keppel Land 4,333,000 11,577,178 0.6 KrisEnergy Ltd 3,572,000 2,116,131 0.1 M1 Ltd 6,563,000 18,109,507 0.9 Noble Group 6,336,000 5,970,466 0.3 Oversea-Chinese Bkg (CDP) 5,483,546 41,468,349 2.1 Pacific Radiance 10,592,308 8,886,235 0.4 Sembcorp Industries (CDP) 3,131,000 13,668,792 0.7 Sembcorp Marine (CDP) 4,376,000 14,093,118 0.7 Singapore Exchange 1,773,000 9,784,597 0.5 Singapore Telecom 23,720,000 68,846,567 3.4 United Overseas Bank 5,856,835 100,831,360 5.1 UOL Group (CDP) 1,670,000 8,313,149 0.4 Wilmar Intl 5,319,000 14,634,599 0.7 Thailand (15.1%) Advanced Information (F) 4,030,500 28,079,316 1.4
- 1 -

JJPMORGAN ASEAN FUND SSemi--aannual report for the
pperiod ended 31 March 2014
IInvestment Portfolio (Continued) As at 31 March 2014 (Unaudited)
Holding
Fair value
US$
% of net
assets Thailand (Continued) Bangkok Bank NVDR 3,545,000 19,506,242 1.0 Banpu Public Co (F) 8,878,700 7,663,490 0.4 Charoen Pokphand Foods (F) 14,817,600 12,789,544 0.6 CP ALL (F) 3,797,000 5,091,538 0.3 Hemaraj Land & Dev (F) 22,001,100 2,116,012 0.1 Kasikornbank Public Co (F) 7,047,200 40,189,026 2.0 Kasikornbank Public Co NVDR 1,444,600 7,926,597 0.4 Krung Thai Bank (F) 23,859,000 13,753,493 0.7 LPN Development (F) 11,652,700 5,747,324 0.3 Namyong Terminal (F) 23,066,200 12,656,546 0.6 PTT Exploration &
Production (F) 4,150,282 20,086,137 1.0 PTT Global Chemical (F) 7,522,100 16,753,136 0.8 PTT Public Co (F) 5,211,200 48,031,714 2.4 Siam Cement (F) 3,572,672 46,035,046 2.3 Siam Commercial Bank (F) 3,202,600 15,548,998 0.8 Vietnam (0.8%) FPT Corp 1,240,000 4,114,232 0.2 Vietnam Dairy Products 1,792,230 11,977,934 0.6 1,900,745,836 95.4 (II) Derivatives (0.0%) Forward foreign exchange ccontracts (0.0%) 306,551 0.0 Total Listed/Quoted Investments 1,901,052,387 95.4 Other net assets 90,965,086 4.6 Net assets attributable to holders of
rredeemable units at 31 March 2014 1,992,017,473 100.0 Total investments, aat cost 1,785,568,898
Statement of Movements in Portfolio Holdings For the period ended 31 March 2014 (Unaudited) % holdings
of net assets 31.3.2014 30.9.2013 Listed/Quoted Investments Equities Singapore 31.8 34.6 Indonesia 20.1 12.3 Malaysia 19.2 16.5 Thailand 15.1 22.8 Philippines 7.3 7.6 Hong Kong 1.1 0.8 Vietnam 0.8 0.5 Derivatives Forward foreign exchange contracts 0.0 0.0 Total Listed/Quoted Investments 95.4 95.1 Other nnet assets 4.6 4.9 Net assets attributable to holders of
rredeemable units 100.0 100.0
- 2 -

JJPMORGAN ASEAN FUND SSemi--aannual report for the
pperiod ended 31 March 2014
SStatement of Financial Position As at 31 March 2014 (Unaudited) 31.3.2014 30.9.2013 US$ US$ Assets Cash at banks 82,503,706 98,681,612 Amounts due from brokers 3,116,110 15,947,355 Amounts receivable on allotment 11,058,789 28,717,516 Derivatives 306,551 406,423 Investments 1,900,745,836 2,033,032,992 Dividend and other accounts
receivable 5,530,736 3,313,673 Total assets 2,003,261,728 2,180,099,571 ---------- ---------- Liabilities Amounts due to brokers 530,005 18,006,220 Amounts payable on redemption 8,097,485 20,843,233 Other accounts payable 2,616,765 3,162,810 Liabilities (excluding net assets
attributable to holders of redeemable units) 11,244,255 42,012,263
---------- ---------- Net assets attributable to holders
oof redeemable units [Note 3] 1,992,017,473 2,138,087,308
Statement of Comprehensive Income For the period ended 31 March 2014 (Unaudited) 1.10.2013
to 31.3.2014
1.10.2012 to
31.3.2013 US$ US$ Income Net gains on investments and
derivatives [Note 4] 28,187,011 326,175,131 Dividend income 15,470,912 15,497,709 Interest on deposits 108,950 25,231 Net foreign currency exchange
losses (787,200) (1,134,777) 42,979,673 340,563,294 ---------- ---------- Expenses Management fee 15,293,871 15,647,318 Transaction costs 2,637,167 3,369,057 Safe custody and bank charges 264,314 214,006 Registrar's fee 225,500 197,021 Trustee's fee 183,637 187,877 Auditor's fee 22,937 22,360 Printing and publication expenses 18,855 10,615 Legal and professional expenses 5,461 129 Other operating expenses 9,343 19,478 18,661,085 19,667,861 ---------- ---------- Net operating profit 24,318,588 320,895,433 Finance costs Interest paid - (44) Profit before taxation 24,318,588 320,895,389 Taxation (1,261,053) (1,232,971) Increase in net assets attributable
to holders of redeemable units and total comprehensive income 23,057,535 319,662,418
Change in cumulative difference
arising from the fair value adjustment of units of the Fund - 12,597,270
Increase in net assets
attributable to holders of redeemable units and total ccomprehensive income 23,057,535 332,259,688
The notes on pages 5 to 7 form part of these financial statements.
- 3 -
JJPMORGAN ASEAN FUND SSemi--aannual report for the
pperiod ended 31 March 2014
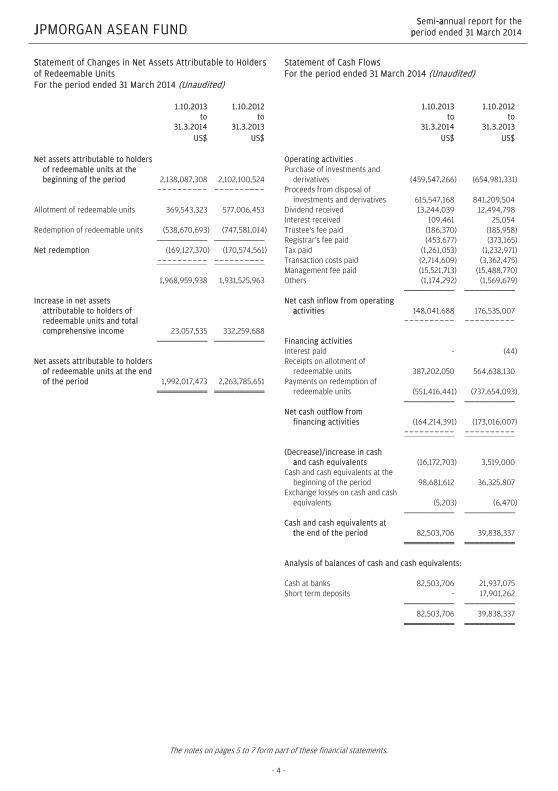
SStatement of Changes in Net Assets Attributable to Holders of Redeemable Units For the period ended 31 March 2014 (Unaudited) 1.10.2013
to 31.3.2014
1.10.2012 to
31.3.2013 US$ US$ Net assets attributable to holders
of redeemable units at the beginning of the period 2,138,087,308 2,102,100,524
---------- ---------- Allotment of redeemable units 369,543,323 577,006,453 Redemption of redeemable units (538,670,693) (747,581,014) Net redemption (169,127,370) (170,574,561) ---------- ---------- 1,968,959,938 1,931,525,963 Increase in net assets
attributable to holders of redeemable units and total comprehensive income 23,057,535 332,259,688
Net assets attributable to holders
oof redeemable units at the end of the period 1,992,017,473 2,263,785,651
Statement of Cash Flows For the period ended 31 March 2014 (Unaudited) 1.10.2013
to 31.3.2014
1.10.2012 to
31.3.2013 US$ US$ Operating activities Purchase of investments and
derivatives (459,547,266) (654,981,331) Proceeds from disposal of
investments and derivatives 615,547,168 841,209,504 Dividend received 13,244,039 12,494,798 Interest received 109,461 25,054 Trustee's fee paid (186,370) (185,958) Registrar's fee paid (453,677) (373,165) Tax paid (1,261,053) (1,232,971) Transaction costs paid (2,714,609) (3,362,475) Management fee paid (15,521,713) (15,488,770) Others (1,174,292) (1,569,679) Net cash inflow from operating
aactivities 148,041,688 176,535,007 ---------- ---------- Financing activities Interest paid - (44) Receipts on allotment of
redeemable units 387,202,050 564,638,130 Payments on redemption of
redeemable units (551,416,441) (737,654,093) Net ccash outflow from
financing activities (164,214,391) (173,016,007) ---------- ---------- (Decrease)/increase in cash
aand cash equivalents (16,172,703) 3,519,000 Cash and cash equivalents at the
beginning of the period 98,681,612 36,325,807 Exchange losses on cash and cash
equivalents (5,203) (6,470) Cash and cash equivalents at
tthe end of the period 82,503,706 39,838,337 Analysis of balances of cash and cash equivalents: Cash at banks 82,503,706 21,937,075 Short term deposits - 17,901,262 82,503,706 39,838,337
The notes on pages 5 to 7 form part of these financial statements.
- 4 -

JJPMORGAN ASEAN FUND SSemi--aannual report for the
pperiod ended 31 March 2014
NNotes to the Financial Statements
1 The Fund
JPMorgan ASEAN Fund (the "Fund") was established under a Trust Deed dated 7 July 1983, as amended, and is governed by the laws of Hong Kong. The Fund is authorized by the Securities and Futures Commission of Hong Kong.
The investment objective of the Fund is to enable investors to participate in a managed portfolio consisting primarily of securities with significant assets in, or significant earnings derived from one or more of the countries comprising the Association of South East Asian Nations.
Pursuant to the Supplemental Trust Deed dated 5 September 2012, the Manager may decide to issue separate classes (each a “Class”) whose assets will be commonly invested but where a specific fee structure, currency or distribution policy may be applied. Each Class may have a different charging structure with the result that the net asset value attributable to each Class may differ.
All unitholders' rights with regard to the convening, voting or otherwise acting at any meeting of unitholders are the same.
2 Summary of principal accounting policies
(a) Accounting policies of interim financial statements
The accounting policies and methods of computation used in the preparation of these unaudited condensed interim financial statements are consistent with those used in the annual financial statements for the year ended 30 September 2013.
(b) Investments and derivatives
Classification
The Fund classifies its investments and derivatives as financial assets or financial liabilities at fair value through profit or loss. These financial assets or financial liabilities are held-for-trading as they are acquired or incurred principally for the purpose of selling or repurchasing in the near term or short-term profit taking.
All derivatives are carried in assets when amounts are receivable by the Fund and in liabilities when amounts are payable by the Fund.
The Fund makes short sales in which a borrowed security is sold in anticipation of a decline in the market value of that security, or it may use short sales for various arbitrage transactions. Short sales are classified as financial liabilities at fair value through profit or loss.
Recognition, derecognition and measurement
Purchases and sales of investments and derivatives are accounted for on the trade date basis. Investments and derivatives are initially recognized at fair value and are subsequently re-measured at fair value. Realized and unrealized gains and losses on investments and derivatives are recognized in the Statement of Comprehensive Income. Investments and derivatives are derecognized when the rights to receive cash flows from the investments and derivatives have expired or the Fund has transferred substantially all risks and rewards of ownership.
Fair value estimation
Fair value is the price that would be received to sell an asset or paid to transfer a liability in an orderly transaction between market participants at the measurement date. The fair value of financial assets and liabilities traded in active markets are based on last traded prices. Prior to 1 October 2012, investments that are listed or traded on an exchange and investments with prices quoted in over-the-counter markets or by market makers, are fair valued based on quoted "bid" prices on long investments and quoted "ask" prices on investments sold short. The Fund early adopted Hong Kong Financial Reporting Standard 13, “Fair Value Measurement”, with effect from 1 October 2012, it changed its fair valuation input to utilize the last traded market price for both financial assets and financial liabilities where the last traded price falls within the bid-ask spread. When trading in the securities of an investee company is suspended, the investment is valued at the Manager's estimate of its fair value.
Debt securities are fair valued based on quoted prices inclusive of accrued interest.
Investments in collective investment schemes are stated at fair value based on the net asset value per unit of the respective funds as determined by the administrators of the relevant funds or stated at last traded prices if the collective investment schemes are listed or traded on an exchange.
Open future and swap contracts are valued at last traded prices for both long and short positions at the valuation date. The differences between the last traded prices and the contract prices are recognized in the Statement of Comprehensive Income.
Open option contracts are valued at last traded prices for both long and short positions at the valuation date. The differences between the last traded prices and the premium amounts/contract prices are recognized in the Statement of Comprehensive Income.
- 5 -

JJPMORGAN ASEAN FUND SSemi--aannual report for the
pperiod ended 31 March 2014
Forward foreign exchange contracts are valued at the forward rates ruling at the valuation date. The differences between the forward rates and the contract rates are recognized in the Statement of Comprehensive Income.
((c) Securities borrowing
The Fund may enter into securities borrowing arrangements for short sale purposes. Short positions represent obligations to deliver securities sold but not yet purchased, and are accounted for as investments and valued at their fair value. Securities borrowed during the period/year are off-balance sheet transactions and are therefore not included in the investment portfolio of the Fund. Collateral placed for the purpose of securities borrowed generally consist of cash collateral and are included in the Statement of Financial Position separately.
(d) Foreign currency translation
Functional and presentation currency
The Fund has adopted United States dollar as its functional and presentation currency.
Transactions and balances
Foreign currency transactions are translated into the functional currency using the exchange rates prevailing at the dates of the transactions.
Foreign exchange gains and losses resulting from the settlement of such transactions and from the translation of assets and liabilities denominated in foreign currencies at period/year exchange rates are recognized in the Statement of Comprehensive Income.
Foreign exchange gains and losses relating to cash and cash equivalents are presented in the Statement of Comprehensive Income within "Net foreign currency exchange gains/losses". Foreign exchange gains and losses relating to the financial assets and liabilities carried at fair value through profit or loss are presented in the Statement of Comprehensive Income within "Net gains/losses on investments and derivatives".
(e) Proceeds and payments on allotment and redemption of units
The net asset value per unit is computed for each dealing day. The price at which units are allotted or redeemed is calculated by reference to the net asset value per unit as at the close of business on the relevant dealing day in accordance with the provisions of the Fund's Trust Deed dated 7 July 1983, as amended, which may be different from the accounting policies stated in the financial statements.
Units of the Fund are redeemable at the option of the holders of redeemable units and are classified as a financial liability in the Statement of Financial Position which represents the net assets attributable to holders of redeemable units (or "net asset value" or "net assets" or "NAV") and is carried at the redemption amount that would be payable at the Statement of Financial Position date if the holders of redeemable units exercised the right to redeem units of the Fund.
3 Number of units in issue and net assets attributable to holders of redeemable units (per unit)
31.3.2014
AUD Hedged Class (acc) HKD Class (acc) USD Class (acc)
Units Units Units Number of units in issue: 737,711.285 4,763,217.208 17,106,570.430 A$ HK$ US$ Net assets attributable to
holders of redeemable units 7,630,913 46,149,832 1,978,995,356
Net assets attributable to
holders of redeemable units (per unit) 10.34 9.69 115.69
- 6 -

JJPMORGAN ASEAN FUND SSemi--aannual report for the
pperiod ended 31 March 2014
30.9.2013
AUD Hedged Class (acc) HKD Class (acc) USD Class (acc)
Units Units Units Number of units in issue: 1,224,533.362 5,272,068.946 18,573,612.702 A$ HK$ US$ Net assets attributable to
holders of redeemable units 12,440,468 50,381,968 2,119,958,267
Net assets attributable to
holders of redeemable units (per unit) 10.16 9.56 114.14
44 Net gains on investments and derivatives
1.10.2013
to 31.3.2014
1.10.2012 to
31.3.2013 US$ US$ Change in unrealized gains/losses in value of investments and derivatives 32,644,331 178,821,220 Realized (losses)/gains on sale of investments and derivatives (4,457,320) 147,353,911 28,187,011 326,175,131
5 Soft commission arrangements
The Investment Manager has entered into soft commission arrangements with brokers under which certain goods and services used to support investment decision making are received by the Investment Manager. The Investment Manager does not make direct payment for these services but transacts an agreed amount of business with the brokers on behalf of the Fund. Commission is paid from the Fund on these transactions.
The goods and services must be of demonstrable benefit to the Fund and may include research and advisory services; economic and political analysis; portfolio analysis, including valuation and performance measurement; market analysis, data and quotation services, computer hardware and software incidental to the above goods and services; clearing and custodian services and investment-related publications.
6 Distribution
No distribution was made during the period (31 March 2013: nil).
- 7 -

JJPMORGAN ASIA DOMESTIC OPPORTUNITIES FUND SSemi--aannual report for the
pperiod ended 31 March 2014
IInvestment Portfolio As at 31 March 2014 (Unaudited)
Holding
Fair value
US$
% of net
assets Listed/Quoted Investments (97.2%) Equities (97.2%) China (30.2%) China Construction Bank 'H' 11,524,000 8,066,897 3.1 China Eastern Airlines 'H' 11,068,000 3,681,224 1.4 China Everbright Intl 1,159,000 1,586,760 0.6 China Minsheng Banking 'H' 4,991,000 5,005,766 1.9 China Overseas Land &
Investment 1,398,000 3,622,485 1.4 China Petroleum &
Chemical 'H' 4,240,000 3,793,401 1.5 China Resources Gas Group 1,768,000 5,629,666 2.2 China Resources Land 760,000 1,667,541 0.6 China Taiping Insurance Hldgs 983,200 1,759,279 0.7 China Vanke 'B' 3,661,809 6,089,601 2.3 CITIC Securities 'H' 911,000 1,900,204 0.7 GCL Poly Energy Hldgs 7,492,000 2,704,327 1.0 Great Wall Motor 'H' 744,000 3,731,006 1.4 Greentown China Hldgs 459,000 495,861 0.2 Honworld Group 899,500 823,309 0.3 Huaneng Renewables 'H' 4,256,000 1,442,982 0.6 Intime Retail (Group) 2,287,500 2,462,357 0.9 Ping An Insurance (Group) 'H' 821,500 6,809,605 2.6 Tencent Hldgs 165,000 11,475,690 4.4 Want Want China Hldgs 4,145,000 6,187,803 2.4 Hong Kong (17.1%) AIA Group 2,193,400 10,405,646 4.0 Galaxy Entertainment Group 479,000 4,165,056 1.6 Hutchison Whampoa 517,000 6,844,857 2.6 Jardine Matheson Hldgs 58,800 3,709,104 1.4 Lifestyle Intl Hldgs 2,380,500 4,842,600 1.8 New World Development Rts
(07-14/04/14) 1,166,328 240,571 0.1 New World Development 3,498,984 3,518,358 1.3 Prada SpA 256,800 2,009,496 0.8 Sands China 524,000 3,914,607 1.5 Wharf (Hldgs) 234,000 1,496,239 0.6 Xinyi Glass Hldgs 4,498,000 3,658,914 1.4 India (8.7%) Ambuja Cements 1,423,919 4,820,904 1.9 Ashok Leyland 3,895,575 1,542,641 0.6 Housing Development Finance 465,963 6,896,307 2.6 Mahindra & Mahindra 222,787 3,658,373 1.4 Maruti Suzuki India 108,031 3,659,755 1.4 Shree Cement 23,256 2,208,273 0.8 Indonesia (3.3%) Bank Mandiri (Persero) 2,431,400 2,022,599 0.8 Bank Negara Indonesia
(Persero) 5,201,000 2,270,859 0.9 Berlian Laju Tanker-SG List 100,000,000 0 0.0 Matahari Department Store 904,100 1,106,249 0.4 Surya Citra Media 6,329,960 1,783,087 0.7 Telekomunikasi Indonesia 'B' 6,784,800 1,322,917 0.5
(Continued)
Holding
Fair value
US$
% of net
assets Korea (16.8%) CJ CheilJedang 10,480 2,825,647 1.1 Hyundai Department Store 32,296 4,308,358 1.7 Hyundai Motor 23,510 5,543,717 2.1 KB Financial Group 209,270 7,323,320 2.8 KIA Motors 81,695 4,551,189 1.7 LG Household & Healthcare 7,443 3,212,982 1.2 Samsung Electronics 5,773 7,283,704 2.8 Samsung Securities 134,850 4,947,055 1.9 Shinsegae Co 18,406 3,985,704 1.5 Philippines (2.0%) Cosco Capital 17,856,300 3,782,693 1.5 Metropolitan Bank & Trust 812,180 1,399,967 0.5 Singapore (4.4%) Courts Asia 4,600,000 2,121,586 0.8 Croesus Retail Trust 2,358,000 1,659,441 0.6 Global Logistics Properties 1,746,000 3,679,297 1.4 Guocoland Ltd (CDP) 911,000 1,586,490 0.6 Overseas Education 3,748,000 2,533,339 1.0 Taiwan (10.1%) Chailease Hldg 574,200 1,378,344 0.5 Cheng Shin Rubber Industry 1,667,100 4,757,277 1.8 China Development Financial 4,455,000 1,274,216 0.5 China Life Insurance 4,742,600 4,352,867 1.7 Depo Auto Parts Industrial 362,000 1,408,653 0.5 Kindom Construction 102,000 105,844 0.1 President Chain Store 434,000 3,064,116 1.2 Ruentex Development 2,151,755 3,935,728 1.5 Uni-President Enterprises 3,491,507 6,076,673 2.3 Thailand (4.6%) Advanced Information (F) 200,500 1,396,825 0.6 Charoen Pokphand Foods (F) 1,163,500 1,004,254 0.4 Hana Microelectronics (F) 1,587,000 1,492,093 0.6 Krung Thai Bank (F) 3,749,000 2,161,107 0.8 LPN Development (F) 4,309,500 2,125,524 0.8 Siam Cement NVDR 288,100 3,712,263 1.4 Total Listed/Quoted Investments 254,023,449 97.2 Other net assets 7,233,116 2.8 Net assets attributable to holders of
rredeemable units at 31 March 2014 261,256,565 100.0 Total investments, at cost 220,099,889
- 8 -

JJPMORGAN ASIA DOMESTIC OPPORTUNITIES FUND SSemi--aannual report for the
pperiod ended 31 March 2014
SStatement of Movements in Portfolio Holdings For the period ended 31 March 2014 (Unaudited) % holdings
of net assets 31.3.2014 30.9.2013 Listed/Quoted Investments Equities China 30.2 27.9 Hong Kong 17.1 19.8 Korea 16.8 18.1 Taiwan 10.1 10.5 India 8.7 6.2 Thailand 4.6 5.7 Singapore 4.4 5.9 Indonesia 3.3 1.4 Philippines 2.0 1.3 Total Listed/Quoted Investments 97.2 96.8 Other nnet assets 2.8 3.2 Net assets attributable to holders of
rredeemable units 100.0 100.0
- 9 -

JJPMORGAN ASIA DOMESTIC OPPORTUNITIES FUND SSemi--aannual report for the
pperiod ended 31 March 2014
SStatement of Financial Position As at 31 March 2014 (Unaudited) 31.3.2014 30.9.2013 US$ US$ Assets Cash at banks 6,557,955 10,164,648 Amounts due from brokers 2,073,377 517,169 Amounts receivable on allotment 23,839 505,137 Investments 254,023,449 291,206,131 Dividend and other accounts
receivable 607,234 305,828 Total assets 263,285,854 302,698,913 ---------- ---------- Liabilities Amounts due to brokers 298,240 203,180 Amounts payable on redemption 1,340,671 1,317,425 Other accounts payable 390,378 499,020 Total liabilities 2,029,289 2,019,625 ---------- ---------- Net assets attributable to holders
oof redeemable units [Note 3] 261,256,565 300,679,288 Equity 261,256,565 300,679,288
Statement of Comprehensive Income For the period ended 31 March 2014 (Unaudited) 1.10.2013
to 31.3.2014
1.10.2012 to
31.3.2013 US$ US$ Income Net gains on investments and
derivatives [Note 4] 7,659,387 42,117,245 Dividend income 1,311,118 1,593,676 Interest on deposits 10,623 183 Net foreign currency exchange
losses (68,312) (210,587) Other income - 255,902 8,912,816 43,756,419 ---------- ---------- Expenses Management fee 2,093,464 2,690,962 Transaction costs 458,517 751,107 Registrar's fee 50,381 52,490 Trustee's fee 44,136 54,603 Safe custody and bank charges 39,394 47,497 Auditor's fee 14,161 13,879 Legal and professional expenses 9,622 10,168 Valuation fee 8,610 8,400 Printing and publication expenses 6,575 3,177 Other operating expenses 8,374 7,123 2,733,234 3,639,406 ---------- ---------- Net operating profit 6,179,582 40,117,013 Finance costs Interest paid - (29,908) Profit before taxation 6,179,582 40,087,105 Taxation (177,660) (188,071) Increase in net assets
attributable to holders of redeemable units and total ccomprehensive income 6,001,922 39,899,034
The notes on pages 12 to 14 form part of these financial statements.
- 10 -

JJPMORGAN ASIA DOMESTIC OPPORTUNITIES FUND SSemi--aannual report for the
pperiod ended 31 March 2014
SStatement of Changes in Net Assets Attributable to Holders of Redeemable Units For the period ended 31 March 2014 (Unaudited) 1.10.2013
to 31.3.2014
1.10.2012 to
31.3.2013 US$ US$ Net assets attributable to holders
of redeemable units at the beginning of the period 300,679,288 362,602,111
---------- ---------- Allotment of redeemable units 7,067,856 16,393,141 Redemption of redeemable units (52,492,501) (63,978,195) Net redemption (45,424,645) (47,585,054) ---------- ---------- 255,254,643 315,017,057 Increase in net aassets
attributable to holders of redeemable units and total comprehensive income 6,001,922 39,899,034
Net assets attributable to holders
oof redeemable units at the end of the period 261,256,565 354,916,091
Statement of Cash Flows For the period ended 31 March 2014 (Unaudited) 1.10.2013
to 31.3.2014
1.10.2012 to
31.3.2013 US$ US$ Operating activities Purchase of investments and
derivatives (68,987,926) (108,150,814) Proceeds from disposal of
investments and derivatives 112,362,868 155,369,456 Dividend received 1,009,697 1,049,877 Interest received 10,637 182 Trustee's fee paid (45,056) (54,452) Registrar's fee paid (97,115) (101,571) Tax paid (193,052) (188,071) Transaction costs paid (454,864) (750,332) Management fee paid (2,148,612) (2,672,036) Others (112,511) (324,870) Net cash inflow from operating
aactivities 41,344,066 44,177,369 ---------- ---------- Financing activities Interest paid - (29,575) Receipts on allotment of
redeemable units 7,549,154 16,284,378 Payments on redemption of
redeemable units (52,469,255) (63,160,687) Net cash outflow from
ffinancing activities (44,920,101) (46,905,884) ---------- ---------- Decrease in cash and cash
eequivalents (3,576,035) (2,728,515) Cash and cash equivalents at the
beginning of the period 10,164,648 (4,190,740) Exchange losses on cash and cash
equivalents (30,658) (85) Cash and cash equivalents at
tthe end of the period 6,557,955 (6,919,340) Analysis of balances of cash and cash equivalents: Cash at banks 6,557,955 69,319 Short term bank loans -
unsecured - (6,988,659) 6,557,955 (6,919,340)
The notes on pages 12 to 14 form part of these financial statements.
- 11 -

JJPMORGAN ASIA DOMESTIC OPPORTUNITIES FUND SSemi--aannual report for the
pperiod ended 31 March 2014
NNotes to the Financial Statements
1 The Fund
JPMorgan Asia Domestic Opportunities Fund (the "Fund") was established under a Trust Deed dated 11 May 2007, as amended, and is governed by the laws of Hong Kong. The Fund is authorized by the Securities and Futures Commission of Hong Kong.
The investment objective of the Fund is to provide investors with long-term capital appreciation by investing primarily in securities of companies whose predominant business will benefit from, or is related to, the domestic growth in Asian economies excluding Japan but including Australia and New Zealand. This may include, but is not limited to, companies predominantly engaged in the production, distribution, marketing or retail sale of staple goods, such as food, beverages, household products, cosmetics, tobacco, automobiles, also companies primarily engaged in the development of properties and infrastructure projects including building materials, building services, property developers, ports/railways/roads builders and operators as well as insurance companies and financial companies.
Pursuant to the supplemental Trust Deed dated 31 August 2012, the Manager may decide to issue separate classes (each a “Class”) whose assets will be commonly invested but where a specific fee structure, currency or distribution policy may be applied. Each class may have a different charging structure with the result that the net asset value attributable to each Class may differ.
All unitholders' rights with regard to the convening, voting or otherwise acting at any meeting of unitholders are the same.
2 Summary of principal accounting policies
(a) Accounting policies of interim financial statements
The accounting policies and methods of computation used in the preparation of these unaudited condensed interim financial statements are consistent with those used in the annual financial statements for the year ended 30 September 2013.
(b) Investments and derivatives
Classification
The Fund classifies its investments and derivatives as financial assets or financial liabilities at fair value through profit or loss. These financial assets or financial liabilities are held-for-trading as they are acquired or incurred principally for the purpose of selling or repurchasing in the near term or short-term profit taking.
All derivatives are carried in assets when amounts are receivable by the Fund and in liabilities when amounts are payable by the Fund.
The Fund makes short sales in which a borrowed security is sold in anticipation of a decline in the market value of that security, or it may use short sales for various arbitrage transactions. Short sales are classified as financial liabilities at fair value through profit or loss.
Recognition, derecognition and measurement
Purchases and sales of investments and derivatives are accounted for on the trade date basis. Investments and derivatives are initially recognized at fair value and are subsequently re-measured at fair value. Realized and unrealized gains and losses on investments and derivatives are recognized in the Statement of Comprehensive Income. Investments and derivatives are derecognized when the rights to receive cash flows from the investments and derivatives have expired or the Fund has transferred substantially all risks and rewards of ownership.
Fair value estimation
Fair value is the price that would be received to sell an asset or paid to transfer a liability in an orderly transaction between market participants at the measurement date. The fair value of financial assets and liabilities traded in active markets are based on last traded prices. Prior to 1 October 2012, investments that are listed or traded on an exchange and investments with prices quoted in over-the-counter markets or by market makers, are fair valued based on quoted "bid" prices on long investments and quoted "ask" prices on investments sold short. The Fund early adopted Hong Kong Financial Reporting Standard 13, “Fair Value Measurement”, with effect from 1 October 2012, it changed its fair valuation input to utilize the last traded market price for both financial assets and financial liabilities where the last traded price falls within the bid-ask spread. When trading in the securities of an investee company is suspended, the investment is valued at the Manager's estimate of its fair value.
Debt securities are fair valued based on quoted prices inclusive of accrued interest.
Investments in collective investment schemes are stated at fair value based on the net asset value per unit of the respective funds as determined by the administrators of the relevant funds or stated at last traded prices if the collective investment schemes are listed or traded on an exchange.
- 12 -

JJPMORGAN ASIA DOMESTIC OPPORTUNITIES FUND SSemi--aannual report for the
pperiod ended 31 March 2014
Open future and swap contracts are valued at last traded prices for both long and short positions at the valuation date. The differences between the last traded prices and the contract prices are recognized in the Statement of Comprehensive Income.
Open option contracts are valued at last traded prices for both long and short positions at the valuation date. The differences between the last traded prices and the premium amounts/contract prices are recognized in the Statement of Comprehensive Income.
Forward foreign exchange contracts are valued at the forward rates ruling at the valuation date. The differences between the forward rates and the contract rates are recognized in the Statement of Comprehensive Income.
((c) Securities borrowing
The Fund may enter into securities borrowing arrangements for short sale purposes. Short positions represent obligations to deliver securities sold but not yet purchased, and are accounted for as investments and valued at their fair value. Securities borrowed during the period/year are off-balance sheet transactions and are therefore not included in the investment portfolio of the Fund. Collateral placed for the purpose of securities borrowed generally consist of cash collateral and are included in the Statement of Financial Position separately.
(d) Foreign currency translation
Functional and presentation currency
The Fund has adopted United States dollar as its functional and presentation currency.
Transactions and balances
Foreign currency transactions are translated into the functional currency using the exchange rates prevailing at the dates of the transactions.
Foreign exchange gains and losses resulting from the settlement of such transactions and from the translation of assets and liabilities denominated in foreign currencies at period/year end exchange rates are recognized in the Statement of Comprehensive Income.
Foreign exchange gains and losses relating to cash and cash equivalents are presented in the Statement of Comprehensive Income within "Net foreign currency exchange gains/losses". Foreign exchange gains and losses relating to the financial assets and liabilities carried at fair value through profit or loss are presented in the Statement of Comprehensive Income within "Net gains/losses on investments and derivatives".
(e) Proceeds and payments on allotment and redemption of units
The net asset value per unit is computed for each dealing day. The price at which units are allotted or redeemed is calculated by reference to the net asset value per unit as at the close of business on the relevant dealing day in accordance with the provisions of the Fund's Trust Deed dated 11 May 2007, as amended, which may be different from the accounting policies stated in the financial statements.
3 Number of units in issue and net assets attributable to holders of redeemable units (per unit)
31.3.2014
USD Class (acc) Units Number of units in issue: 25,700,130.537 US$ Net assets attributable to
holders of redeemable units 261,256,565
Net assets attributable to
holders of redeemable units (per unit) 10.17
- 13 -

JJPMORGAN ASIA DOMESTIC OPPORTUNITIES FUND SSemi--aannual report for the
pperiod ended 31 March 2014
30.9.2013
USD Class (acc) Units Number of units in issue: 30,187,652.464 US$ Net assets attributable to
holders of redeemable units 300,679,288
Net assets attributable to
holders of redeemable units (per unit) 9.96
44 Net gains on investments and derivatives
1.10.2013
to 31.3.2014
1.10.2012 to
31.3.2013 US$ US$ Change in unrealized gains/losses in value of investments and derivatives (9,013,178) 20,895,381 Realized gains on sale of investments and derivatives 16,672,565 21,221,864 7,659,387 42,117,245
5 Soft commission arrangements
The Investment Manager has entered into soft commission arrangements with brokers under which certain goods and services used to support investment decision making are received by the Investment Manager. The Investment Manager does not make direct payment for these services but transacts an agreed amount of business with the brokers on behalf of the Fund. Commission is paid from the Fund on these transactions.
The goods and services must be of demonstrable benefit to the Fund and may include research and advisory services; economic and political analysis; portfolio analysis, including valuation and performance measurement; market analysis, data and quotation services, computer hardware and software incidental to the above goods and services; clearing and custodian services and investment-related publications.
6 Distribution
No distribution was made during the period (31 March 2013: nil).
- 14 -

JJPMORGAN ASIA EQUITY DIVIDEND FUND SSemi--aannual report for the
pperiod ended 31 March 2014
IInvestment Portfolio As at 31 March 2014 (Unaudited)
Holding
Fair value
US$
% of net
assets Listed/Quoted Investments (98.3%) (I) Equities and Warrants (97.2%) Australia (20.0%) Amcor Ltd 341,154 3,285,303 1.0 AMP Ltd-AU List 415,105 1,916,006 0.6 Australia & NZ Bkg Group-AU
List 299,390 9,173,807 2.7 BHP Billiton Ltd 231,805 7,835,523 2.3 Charter Hall Retail REIT 1,204,229 3,995,780 1.2 Goodman Group Stapled Sec 498,730 2,186,433 0.6 Hotel Property Inv Stapled Sec 340,274 627,612 0.2 Insurance Australia Group 1,099,350 5,675,454 1.7 Macquarie Group 54,998 2,952,976 0.9 Mirvac Group Stapled Sec 4,199,328 6,616,650 1.9 Stockland Stapled Sec 1,349,014 4,688,751 1.4 Telstra Corp 361,358 1,701,417 0.5 Westfield Group Stapled Sec 1,372,503 13,039,070 3.9 Westpac Banking 113,850 3,646,836 1.1 China (17.1%) China Construction Bank 'H' 17,012,000 11,908,543 3.5 China Mobile 392,500 3,592,538 1.1 China Petroleum & Chemical
'H' 18,098,600 16,192,275 4.8 China Resources Power Hldgs 1,744,000 4,541,520 1.3 CNOOC Ltd 3,032,000 4,557,547 1.4 Ind & Comm Bank of China 'H' 12,618,000 7,759,117 2.3 Yuexiu Transport
Infrastructure 10,530,000 5,429,899 1.6 Zhejiang Expressway 'H' 3,972,000 3,620,196 1.1 Hong Kong (17.8%) BOC Hong Kong (Hldgs) 5,574,000 15,880,444 4.7 HSBC Hldgs-HK List 1,853,120 18,765,197 5.6 Hutchison Telecom HK 5,762,000 1,916,445 0.6 NWS Hldgs 4,259,422 7,182,272 2.1 PCCW Ltd 6,381,000 3,199,939 1.0 Power Assets Hldgs 460,500 3,992,320 1.2 Wharf (Hldgs) 535,000 3,420,888 1.0 Wynn Macau 1,278,400 5,306,718 1.6 India (0.5%) NTPC Ltd Unified Wts 13/02/17
(UBS) 792,732 1,591,504 0.5 Korea (3.9%) Daishin Securities Pref 85,670 457,948 0.1 Dongsuh Co 174,220 2,586,008 0.8 KT & G 22,906 1,721,528 0.5 Macquarie Korea
Infrastructure Fd 661,110 4,018,396 1.2 SK Telecom 8,430 1,706,670 0.5 S-Oil Corp 44,369 2,567,646 0.8 Malaysia (0.6%) Pavilion REIT 1,700,000 681,978 0.2 Sunway REIT 3,316,500 1,381,240 0.4
(Continued)
Holding
Fair value
US$
% of net
assets New Zealand (3.2%) Genesis Energy 636,516 856,122 0.3 Telecom Corp Of New Zealand 3,935,910 8,333,542 2.5 Z Energy 429,158 1,452,367 0.4 Philippines (1.4%) Philippine Long Distance
Telephone 76,230 4,640,604 1.4 Singapore (16.3%) AIMS AMP Capital Ind REIT 5,449,650 5,806,951 1.7 Ascendas India Trust 2,174,000 1,331,144 0.4 Asian Pay Television Trust 5,546,000 3,263,520 1.0 CapitaMall Trust 2,463,000 3,701,698 1.1 CapitaRetail China Trust 2,149,429 2,392,907 0.7 DBS Group Hldgs 834,000 10,723,852 3.2 M1 Ltd 1,000,000 2,759,334 0.8 Mapletree Commercial Trust 1,793,535 1,739,981 0.5 Mapletree Industrial Trust 3,097,557 3,362,224 1.0 Singapore Exchange 1,258,000 6,942,483 2.1 Singapore Telecom 1,028,000 2,983,738 0.9 United Overseas Bank 564,000 9,709,833 2.9 Taiwan (9.7%) Advanced Semiconductor Eng 2,459,000 2,729,306 0.8 Asustek Computer 96,000 950,464 0.3 Chicony Electronics 433,000 1,123,290 0.3 China Steel Chemical 371,000 2,119,826 0.6 Delta Electronics 291,000 1,796,503 0.6 Huaku Development 442,000 1,082,775 0.3 Kindom Construction 1,696,000 1,759,908 0.5 Lite-On Technology 1,778,613 2,651,639 0.8 MediaTek Inc 65,000 959,445 0.3 Mega Financial Hldg 6,411,280 4,968,597 1.5 Quanta Computer 372,000 1,001,691 0.3 Radiant Opto-Electronics 389,000 1,571,201 0.5 Ruentex Development 838,000 1,532,767 0.5 Synnex Technology 678,000 1,090,945 0.3 Taiwan Semiconductor Mfg 1,553,000 6,043,198 1.8 United Microelectronics 2,562,000 1,081,084 0.3 Thailand (6.7%) Bangkok Bank NVDR 1,422,700 7,828,359 2.3 Bangkok Expressway (F) 1,708,600 1,738,095 0.5 Charoen Pokphand Foods (F) 1,214,000 1,047,842 0.3 PTT Global Chemical (F) 47,800 106,460 0.0 PTT Public Co (F) 1,168,300 10,768,240 3.2 Tesco Lotus Retail Growth
Freehold 1,412,300 557,258 0.2 Ticon Industrial Connection (F) 1,053,600 558,629 0.2 326,388,216 97.2 (II) DDerivatives (1.1%) Forward foreign exchange ccontracts (1.1%) 3,860,767 1.1 Total Listed/Quoted Investments 330,248,983 98.3
- 15 -

JJPMORGAN ASIA EQUITY DIVIDEND FUND SSemi--aannual report for the
pperiod ended 31 March 2014
IInvestment Portfolio (Continued) As at 31 March 2014 (Unaudited)
Holding
Fair value
US$
% oof nnet
aassets Other net assets 5,568,119 1.7 Net assets attributable to holders of
rredeemable units at 31 March 2014 335,817,102 100.0 Total investments, at cost 329,556,417
Statement of Movements in Portfolio Holdings For the period ended 31 March 2014 (Unaudited) % holdings
of net assets 31.3.2014 30.9.2013 Listed/Quoted Investments Equities and Warrants Australia 20.0 22.8 Hong Kong 17.8 14.3 China 17.1 14.0 Singapore 16.3 12.4 Taiwan 9.7 7.5 Thailand 6.7 9.0 Korea 3.9 5.4 New Zealand 3.2 2.7 Philippines 1.4 - Malaysia 0.6 - India 0.5 - Derivatives Forward foreign exchange contracts 1.1 1.0 Futures - (0.0) Total Listed/Quoted Investments 98.3 89.1 Other net assets 1.7 10.9 Net assets attributable to holders of
rredeemable units 100.0 100.0
- 16 -
JJPMORGAN ASIA EQUITY DIVIDEND FUND SSemi--aannual report for the
pperiod ended 31 March 2014
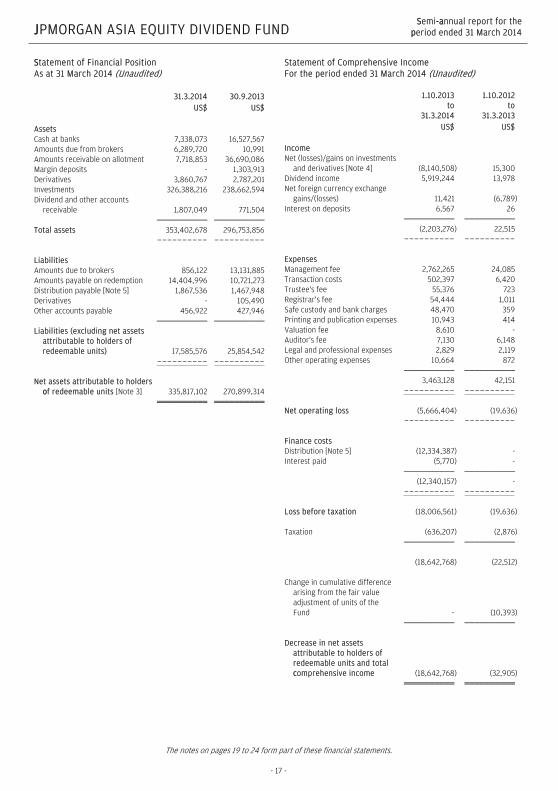
SStatement of Financial Position As at 31 March 2014 (Unaudited) 31.3.2014 30.9.2013 US$ US$ Assets Cash at banks 7,338,073 16,527,567 Amounts due from brokers 6,289,720 10,991 Amounts receivable on allotment 7,718,853 36,690,086 Margin deposits - 1,303,913 Derivatives 3,860,767 2,787,201 Investments 326,388,216 238,662,594 Dividend and other accounts
receivable 1,807,049 771,504 Total assets 353,402,678 296,753,856 ---------- ---------- Liabilities Amounts due to brokers 856,122 13,131,885 Amounts payable on redemption 14,404,996 10,721,273 Distribution payable [Note 5] 1,867,536 1,467,948 Derivatives - 105,490 Other accounts payable 456,922 427,946 Liabilities (excluding net assets
attributable to holders of redeemable units) 17,585,576 25,854,542
---------- ---------- Net assets attributable to holders
oof redeemable units [Note 3] 335,817,102 270,899,314
Statement of Comprehensive Income For the period ended 31 March 2014 (Unaudited) 1.10.2013
to 31.3.2014
1.10.2012 to
31.3.2013 US$ US$ Income Net (losses)/gains on investments
and derivatives [Note 4] (8,140,508) 15,300 Dividend income 5,919,244 13,978 Net foreign currency exchange
gains/(losses) 11,421 (6,789) Interest on deposits 6,567 26 (2,203,276) 22,515 ---------- ---------- Expenses Management fee 2,762,265 24,085 Transaction costs 502,397 6,420 Trustee's fee 55,376 723 Registrar's fee 54,444 1,011 Safe custody and bank charges 48,470 359 Printing and publication expenses 10,943 414 Valuation fee 8,610 - Auditor's fee 7,130 6,148 Legal and professional expenses 2,829 2,119 Other operating expenses 10,664 872 3,463,128 42,151 ---------- ---------- Net operating loss (5,666,404) (19,636) ---------- ---------- Finance costs Distribution [Note 5] (12,334,387) - Interest paid (5,770) - (12,340,157) - ---------- ---------- Loss before taxation (18,006,561) (19,636) Taxation (636,207) (2,876) (18,642,768) (22,512) Change in cumulative difference
arising from the fair value adjustment of units of the Fund - (10,393)
Decrease in net assets
attributable to holders of redeemable units and total ccomprehensive income (18,642,768) (32,905)
The notes on pages 19 to 24 form part of these financial statements.
- 17 -
JJPMORGAN ASIA EQUITY DIVIDEND FUND SSemi--aannual report for the
pperiod ended 31 March 2014
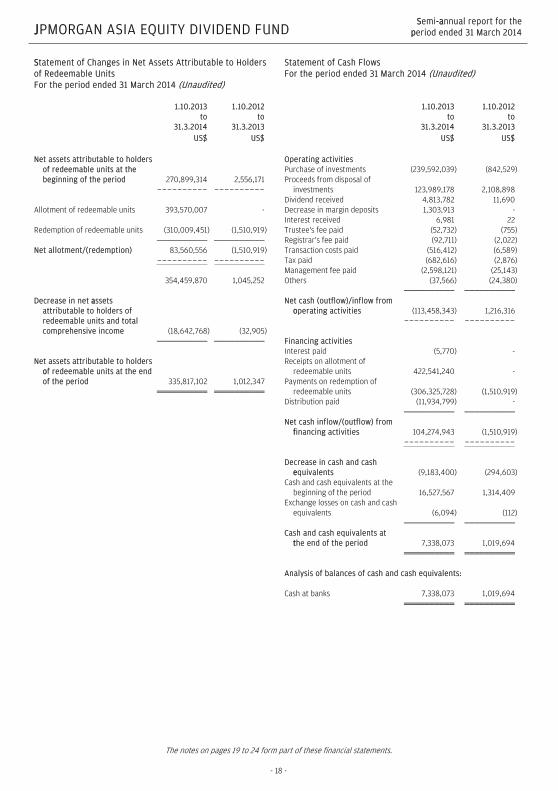
SStatement of Changes in Net Assets Attributable to Holders of Redeemable Units For the period ended 31 March 2014 (Unaudited) 1.10.2013
to 31.3.2014
1.10.2012 to
31.3.2013 US$ US$ Net assets attributable to holders
of redeemable units at the beginning of the period 270,899,314 2,556,171
---------- ---------- Allotment of redeemable units 393,570,007 - Redemption of redeemable units (310,009,451) (1,510,919) Net allotment/(redemption) 83,560,556 (1,510,919) ---------- ---------- 354,459,870 1,045,252 Decrease in net aassets
attributable to holders of redeemable units and total comprehensive income (18,642,768) (32,905)
Net assets attributable to holders
oof redeemable units at the end of the period 335,817,102 1,012,347
Statement of Cash Flows For the period ended 31 March 2014 (Unaudited) 1.10.2013
to 31.3.2014
1.10.2012 to
31.3.2013 US$ US$ Operating activities Purchase of investments (239,592,039) (842,529) Proceeds from disposal of
investments 123,989,178 2,108,898 Dividend received 4,813,782 11,690 Decrease in margin deposits 1,303,913 - Interest received 6,981 22 Trustee's fee paid (52,732) (755) Registrar's fee paid (92,711) (2,022) Transaction costs paid (516,412) (6,589) Tax paid (682,616) (2,876) Management fee paid (2,598,121) (25,143) Others (37,566) (24,380) Net cash (outflow)/inflow from
ooperating activities (113,458,343) 1,216,316 ---------- ---------- Financing activities Interest paid (5,770) - Receipts on allotment of
redeemable units 422,541,240 - Payments on redemption of
redeemable units (306,325,728) (1,510,919) Distribution paid (11,934,799) - Net cash inflow/(outflow) from
ffinancing activities 104,274,943 (1,510,919) ---------- ---------- Decrease in cash and cash
eequivalents (9,183,400) (294,603) Cash and cash equivalents at the
beginning of the period 16,527,567 1,314,409 Exchange losses on cash and cash
equivalents (6,094) (112) Cash and cash equivalents at
tthe end of the period 7,338,073 1,019,694 Analysis of balances of cash and cash equivalents: Cash at banks 7,338,073 1,019,694
The notes on pages 19 to 24 form part of these financial statements.
- 18 -

JJPMORGAN ASIA EQUITY DIVIDEND FUND SSemi--aannual report for the
pperiod ended 31 March 2014
NNotes to the Financial Statements
1 The Fund
JPMorgan Asia Equity Dividend Fund (the “Fund”) was established under a Trust Deed dated 6 May 2011, as amended, and is governed by the laws of Hong Kong. The Fund is authorized by the Securities and Futures Commission of Hong Kong.
The investment objective of the Fund is to aim to provide income and long term capital growth by investing primarily in equity securities of companies in the Asia Pacific region (excluding Japan) that the investment Manager expects to pay dividends. The Fund’s holding of these equity securities will be selected based on historical records and company announcements on dividends, in addition to their potential for long term capital appreciation.
Pursuant to the Trust Deed, the Manager may decide to issue separate classes (each a "Class") whose assets will be commonly invested but where a specific fee structure, currency or distribution policy may be applied. Each Class may have a different charging structure with the result that the net asset value attributable to each Class may differ.
All unitholders' rights with regard to the convening, voting or otherwise acting at any meeting of unitholders are the same.
2 Summary of principal accounting policies
(a) Accounting policies of interim financial statements
The accounting policies and methods of computation used in the preparation of these unaudited condensed interim financial statements are consistent with those used in the annual financial statements for the year ended 30 September 2013.
(b) Investments and derivatives
Classification
The Fund classifies its investments and derivatives as financial assets or financial liabilities at fair value through profit or loss. These financial assets or financial liabilities are held-for-trading as they are acquired or incurred principally for the purpose of selling or repurchasing in the near term or short-term profit taking.
All derivatives are carried in assets when amounts are receivable by the Fund and in liabilities when amounts are payable by the Fund.
The Fund makes short sales in which a borrowed security is sold in anticipation of a decline in the market value of that security, or it may use short sales for various arbitrage transactions. Short sales are classified as financial liabilities at fair value through profit or loss.
Recognition, derecognition and measurement
Purchases and sales of investments and derivatives are accounted for on the trade date basis. Investments and derivatives are initially recognized at fair value and are subsequently re-measured at fair value. Realized and unrealized gains and losses on investments and derivatives are recognized in the Statement of Comprehensive Income. Investments and derivatives are derecognized when the rights to receive cash flows from the investments and derivatives have expired or the Fund has transferred substantially all risks and rewards of ownership.
Fair value estimation
Fair value is the price that would be received to sell an asset or paid to transfer a liability in an orderly transaction between market participants at the measurement date. The fair value of financial assets and liabilities traded in active markets are based on last traded prices. Prior to 1 October 2012, investments that are listed or traded on an exchange and investments with prices quoted in over-the-counter markets or by market makers, are fair valued based on quoted "bid" prices on long investments and quoted "ask" prices on investments sold short. The Fund early adopted Hong Kong Financial Reporting Standard 13, "Fair Value Measurement" with effect from 1 October 2012, it changed its fair valuation input to utilize the last traded market price for both financial assets and financial liabilities where the last traded price falls within the bid-ask spread. When trading in the securities of an investee company is suspended, the investment is valued at the Manager's estimate of its fair value.
Debt securities are fair valued based on quoted prices inclusive of accrued interest.
Investments in collective investment schemes are stated at fair value based on the net asset value per unit of the respective funds as determined by the administrators of the relevant funds or stated at last traded prices if the collective investment schemes are listed or traded on an exchange.
Open future and swap contracts are valued at last traded prices for both long and short positions at the valuation date. The differences between the last traded prices and the contract prices are recognized in the Statement of Comprehensive Income.
- 19 -

JJPMORGAN ASIA EQUITY DIVIDEND FUND SSemi--aannual report for the
pperiod ended 31 March 2014
Open option contracts are valued at last traded prices for both long and short positions at the valuation date. The differences between the last traded prices and the premium amounts/contract prices are recognized in the Statement of Comprehensive Income.
Forward foreign exchange contracts are valued at the forward rates ruling at the valuation date. The differences between the forward rates and the contract rates are recognized in the Statement of Comprehensive Income.
((c) Securities borrowing
The Fund may enter into securities borrowing arrangements for short sale purposes. Short positions represent obligations to deliver securities sold but not yet purchased, and are accounted for as investments and valued at their fair value. Securities borrowed during the period/year are off-balance sheet transactions and are therefore not included in the investment portfolio of the Fund. Collateral placed for the purpose of securities borrowed generally consist of cash collateral and are included in the Statement of Financial Position separately.
(d) Foreign currency translation
Functional and presentation currency
The Fund has adopted United States dollar as its functional and presentation currency.
Transactions and balances
Foreign currency transactions are translated into the functional currency using the exchange rates prevailing at the dates of the transactions.
Foreign exchange gains and losses resulting from the settlement of such transactions and from the translation of assets and liabilities denominated in foreign currencies at period/year end exchange rates are recognized in the Statement of Comprehensive Income.
Foreign exchange gains and losses relating to cash and cash equivalents are presented in the Statement of Comprehensive Income within "Net foreign currency exchange gains/losses". Foreign exchange gains and losses relating to the financial assets and liabilities carried at fair value through profit or loss are presented in the Statement of Comprehensive Income within "Net gains/losses on investments and derivatives".
(e) Proceeds and payments on allotment and redemption of units
The net asset value per unit is computed for each dealing day. The price at which units are allotted or redeemed is calculated by reference to the net asset value per unit as at the close of business on the relevant dealing day in accordance with the provisions of the Fund's Trust Deed dated 6 May 2011, as amended, which may be different from the accounting policies stated in the financial statements.
Units of the Fund are redeemable at the option of the holders of redeemable units and are classified as a financial liability in the Statement of Financial Position which represents the net assets attributable to holders of redeemable units (or "net asset value" or "net assets" or "NAV") and is carried at the redemption amount that would be payable at the Statement of Financial Position date if the holders of redeemable units exercised the right to redeem units of the Fund.
3 Number of units in issue and net assets attributable to holders of redeemable units (per unit)
31.3.2014
AUD Hedged Class (mth)
CAD Hedged Class (mth)
EUR Hedged Class (mth)
GBP Hedged Class (mth) HKD Class (acc)
Units Units Units Units Units Number of units in issue: 14,901,066.809 1,418,267.447 234,819.039 567,599.595 336,983.510 A$ C$ EUR GBP HK$ Net assets attributable to
holders of redeemable units 140,757,856 13,466,218 2,227,459 5,391,935 3,330,233
Net assets attributable to
holders of redeemable units (per unit) 9.45 9.49 9.49 9.50 9.88
- 20 -

JJPMORGAN ASIA EQUITY DIVIDEND FUND SSemi--aannual report for the
pperiod ended 31 March 2014
HKD Class (mth)
NZD Hedged Class (mth)
RMB Hedged Class (mth)
RMB Hedged Class (acc)
SGD Hedged Class (mth)
Units Units Units Units Units Number of units in issue: 57,526,300.868 2,705,351.772 201,323.432 122,520.000 192,114.639 HK$ NZ$ CNY CNY S$ Net assets attributable to
holders of redeemable units 546,053,261 25,677,344 2,058,773 1,252,948 1,823,393
Net assets attributable to
holders of redeemable units (per unit) 9.49 9.49 10.23 10.23 9.49
USD Class (acc) USD Class (mth) Units Units Number of units in issue: 134,990.966 8,909,850.974 US$ US$ Net assets attributable to
holders of redeemable units 1,335,124 84,672,780
Net assets attributable to
holders of redeemable units (per unit) 9.89 9.50
30.9.2013
AUD Hedged Class (mth)
CAD Hedged Class (mth)
EUR Hedged Class (mth)
GBP Hedged Class (mth) HKD Class (acc)
Units Units Units Units Units Number of units in issue: 14,012,327.498 737,831.144 131,612.213 262,052.069 120,658.889 A$ C$ EUR GBP HK$ Net assets attributable to
holders of redeemable units 137,646,209 7,265,255 1,293,608 2,578,485 1,201,692
Net assets attributable to
holders of redeemable units (per unit) 9.82 9.85 9.83 9.84 9.96
- 21 -

JJPMORGAN ASIA EQUITY DIVIDEND FUND SSemi--aannual report for the
pperiod ended 31 March 2014
HKD Class (mth)
NZD Hedged Class (mth)
SGD Hedged Class (mth) USD Class (acc) USD Class (mth)
Units Units Units Units Units Number of units in issue: 43,475,771.874 847,602.894 64,314.281 157,519.976 6,599,571.013 HK$ NZ$ S$ US$ US$ Net assets attributable to
holders of redeemable units 427,159,316 8,346,194 632,890 1,570,219 64,936,637
Net assets attributable to
holders of redeemable units (per unit) 9.83 9.85 9.84 9.97 9.84
44 Net gains/(losses) on investments and derivatives
1.10.2013
to 31.3.2014
1.10.2012 to
31.3.2013 US$ US$ Change in unrealized gains/losses in value of investments and derivatives (6,652,994) 18,150 Realized losses on sale of investments and derivatives (1,487,514) (2,850) (8,140,508) 15,300
5 Distribution
It is the intention of the manager of the Fund to have at least 85% of the income attributable to the distribution class(es) respectively in respect of each accounting period, after charging the expenses attributable to these distribution class(es) respectively, to be distributed to unitholders of these distribution class(es) respectively.
1.10.2013 to
31.3.2014 US$ Net operating loss (5,666,404) Adjustments: Net losses on investments and derivatives 8,140,508 Net foreign currency exchange gains (11,421) Transaction costs 502,397 Interest paid (5,770) Taxation (636,207) Amount available for distribution 2,323,103 Distribution of A$0.0639 per unit on 18,224,112.793 units of AUD Hedged Class (mth) ex on 31 October 2013
and pay on 8 November 2013 (1,102,743)C$0.0508 per unit on 1,098,607.080 units of CAD Hedged Class (mth) ex on 31 October 2013
and pay on 8 November 2013 (53,516)EUR0.0430 per unit on 203,797.744 units of EUR Hedged Class (mth) ex on 31 October 2013
and pay on 8 November 2013 (11,914)
- 22 -

JJPMORGAN ASIA EQUITY DIVIDEND FUND SSemi--aannual report for the
pperiod ended 31 March 2014
1.10.2013 to
31.3.2014 US$ GBP0.0455 per unit on 348,680.861 units of GBP Hedged Class (mth) ex on 31 October 2013
and pay on 8 November 2013 (25,489) HK$0.0430 per unit on 63,802,944.035 units of HKD Class (mth) ex on 31 October 2013
and pay on 8 November 2013 (353,864) NZ$0.0648 per unit on 1,480,113.889 units of NZD Hedged Class (mth) ex on 31 October 2013
and pay on 8 November 2013 (79,391) S$0.0430 per unit on 64,664.454 units of SGD Hedged Class (mth) ex on 31 October 2013
and pay on 8 November 2013 (2,242) US$0.0430 per unit on 8,867,375.193 units of USD Class (mth) ex on 31 October 2013
and pay on 8 November 2013 (381,297) A$0.0631 per unit on 18,907,107.596 units of AUD Hedged Class (mth) ex on 29 November 2013
and pay on 9 December 2013 (1,090,258) C$0.0506 per unit on 1,203,154.092 units of CAD Hedged Class (mth) ex on 29 November 2013
and pay on 9 December 2013 (57,504) EUR0.0423 per unit on 226,646.701 units of EUR Hedged Class (mth) ex on 29 November 2013
and pay on 9 December 2013 (13,054) GBP0.0454 per unit on 503,030.373 units of GBP Hedged Class (mth) ex on 29 November 2013
and pay on 9 December 2013 (37,409) HK$0.0430 per unit on 72,259,302.774 units of HKD Class (mth) ex on 29 November 2013
and pay on 9 December 2013 (400,786) NZ$0.0636 per unit on 2,014,001.166 units of NZD Hedged Class (mth) ex on 29 November 2013
and pay on 9 December 2013 (104,573) S$0.0430 per unit on 81,621.707 units of SGD Hedged Class (mth) ex on 29 November 2013
and pay on 9 December 2013 (2,800) US$0.0430 per unit on 10,838,128.202 units of USD Class (mth) ex on 29 November 2013
and pay on 9 December 2013 (466,040) A$0.0630 per unit on 19,602,730.249 units of AUD Hedged Class (mth) ex on 31 December 2013
and pay on 9 January 2014 (1,104,868) C$0.0503 per unit on 1,259,389.631 units of CAD Hedged Class (mth) ex on 31 December 2013
and pay on 9 January 2014 (59,621) EUR0.0433 per unit on 213,765.303 units of EUR Hedged Class (mth) ex on 31 December 2013
and pay on 9 January 2014 (12,754) GBP0.0448 per unit on 553,037.229 units of GBP Hedged Class (mth) ex on 31 December 2013
and pay on 9 January 2014 (41,035) HK$0.0430 per unit on 68,762,066.487 units of HKD Class (mth) ex on 31 December 2013
and pay on 9 January 2014 (381,334) NZ$0.0642 per unit on 2,423,647.843 units of NZD Hedged Class (mth) ex on 31 December 2013
and pay on 9 January 2014 (128,065) S$0.0430 per unit on 94,023.167 units of SGD Hedged Class (mth) ex on 31 December 2013
and pay on 9 January 2014 (3,202) US$0.0430 per unit on 10,394,813.298 units of USD Class (mth) ex on 31 December 2013
and pay on 9 January 2014 (446,977) A$0.0626 per unit on 17,628,932.179 units of AUD Hedged Class (mth) ex on 30 January 2014
and pay on 11 February 2014 (966,673) C$0.0501 per unit on 1,607,150.277 units of CAD Hedged Class (mth) ex on 30 January 2014
and pay on 11 February 2014 (72,020) EUR0.0433 per unit on 223,330.127 units of EUR Hedged Class (mth) ex on 30 January 2014
and pay on 11 February 2014 (13,116) GBP0.0450 per unit on 577,167.511 units of GBP Hedged Class (mth) ex on 30 January 2014
and pay on 11 February 2014 (42,847) HK$0.0430 per unit on 67,248,739.002 units of HKD Class (mth) ex on 30 January 2014
and pay on 11 February 2014 (372,401) NZ$0.0640 per unit on 3,607,410.531 units of NZD Hedged Class (mth) ex on 30 January 2014
and pay on 11 February 2014 (187,989)
- 23 -

JJPMORGAN ASIA EQUITY DIVIDEND FUND SSemi--aannual report for the
pperiod ended 31 March 2014
1.10.2013 to
31.3.2014 US$ S$0.0430 per unit on 191,837.020 units of SGD Hedged Class (mth) ex on 30 January 2014
and pay on 11 February 2014 (6,471) US$0.0430 per unit on 9,802,518.145 units of USD Class (mth) ex on 30 January 2014
and pay on 11 February 2014 (421,508) A$0.0612 per unit on 17,552,661.431 units of AUD Hedged Class (mth) ex on 28 February 2014
and pay on 10 March 2014 (961,268) C$0.0492 per unit on 1,603,711.450 units of CAD Hedged Class (mth) ex on 28 February 2014
and pay on 10 March 2014 (71,279) EUR0.0430 per unit on 219,265.380 units of EUR Hedged Class (mth) ex on 28 February 2014
and pay on 10 March 2014 (13,022) GBP0.0451 per unit on 578,107.351 units of GBP Hedged Class (mth) ex on 28 February 2014
and pay on 10 March 2014 (43,694) HK$0.0430 per unit on 62,817,783.721 units of HKD Class (mth) ex on 28 February 2014
and pay on 10 March 2014 (348,041) NZ$0.0620 per unit on 3,517,867.640 units of NZD Hedged Class (mth) ex on 28 February 2014
and pay on 10 March 2014 (183,265) S$0.0430 per unit on 191,958.724 units of SGD Hedged Class (mth) ex on 28 February 2014
and pay on 10 March 2014 (6,516) US$0.0430 per unit on 9,209,427.021 units of USD Class (mth) ex on 28 February 2014
and pay on 10 March 2014 (396,005) A$0.0631 per unit on 15,075,910.836 units of AUD Hedged Class (mth) ex on 31 March 2014
and pay on 8 April 2014 (881,703) C$0.0498 per unit on 1,483,534.842 units of CAD Hedged Class (mth) ex on 31 March 2014
and pay on 8 April 2014 (66,935) EUR0.0433 per unit on 234,819.039 units of EUR Hedged Class (mth) ex on 31 March 2014
and pay on 8 April 2014 (14,014) GBP0.0452 per unit on 567,599.595 units of GBP Hedged Class (mth) ex on 31 March 2014
and pay on 8 April 2014 (42,772) HK$0.0430 per unit on 57,397,260.091 units of HKD Class (mth) ex on 31 March 2014
and pay on 8 April 2014 (318,173) NZ$0.0654 per unit on 2,717,207.469 units of NZD Hedged Class (mth) ex on 31 March 2014
and pay on 8 April 2014 (154,204) S$0.0430 per unit on 192,114.639 units of SGD Hedged Class (mth) ex on 31 March 2014
and pay on 8 April 2014 (6,569) US$0.0430 per unit on 8,910,843.526 units of USD Class (mth) ex on 31 March 2014
and pay on 8 April 2014 (383,166) Total distribution to holders of redeemable units (12,334,387)
No distribution was made during the period ended 31 March 2013. In the event that the amount available for distribution is insufficient to pay distributions as the Fund declares, the Manager may in its discretion determine that such distributions be paid from capital.
66 Soft commission arrangements
The Investment Manager has entered into soft commission arrangements with brokers under which certain goods and services used to support investment decision making are received by the Investment Manager. The Investment Manager does not make direct payment for these services but transacts an agreed amount of business with the brokers on behalf of the Fund. Commission is paid from the Fund on these transactions.
The goods and services must be of demonstrable benefit to the Fund and may include research and advisory services; economic and political analysis; portfolio analysis, including valuation and performance measurement; market analysis, data and quotation services, computer hardware and software incidental to the above goods and services; clearing and custodian services and investment-related publications.
- 24 -

JJPMORGAN ASIA NEW FRONTIERS FUND SSemi--aannual report for the
pperiod ended 31 March 2014
IInvestment Portfolio As at 31 March 2014 (Unaudited)
Holding
Fair value
US$
% of net
assets Listed/Quoted Investments (84.1%) Equities and Warrants (84.1%) Australia (1.5%) Oil Search 32,840 257,503 1.5 Bangladesh (10.9%) Bata Shoe (Bangladesh) 47,800 542,185 3.2 British American Tobacco
Bangladesh 25,700 763,416 4.6 Marico Bangladesh 36,100 524,427 3.1 Hong Kong (2.7%) NagaCorp Ltd 429,313 447,187 2.7 Korea (1.3%) Kolao Hldgs 8,833 205,380 1.2 Kolao Hldgs Await Cert 529 12,300 0.1 Malaysia (1.7%) Axiata Group 136,900 279,627 1.7 Pakistan (11.4%) Engro Corp (CDC) 357,600 678,349 4.0 Engro Fertilizer Await Cert 35,760 21,718 0.1 Oil & Gas Development 148,500 364,271 2.2 Pakistan Oil Fields 78,850 436,507 2.6 Pakistan Petroleum 182,900 416,335 2.5 Philippines (8.8%) ABS-CBN Hldgs PDR 181,900 129,798 0.8 Cosco Capital 696,900 147,632 0.9 D&L Industries 368,600 68,303 0.4 Energy Development-PH List 50 6 0.0 GT Capital Hldgs 14,020 245,573 1.4 Megaworld Corp 3,833,000 358,128 2.1 Metropolitan Bank & Trust 106,340 183,300 1.1 Petron Corp-Placing 03/14 148,000 38,745 0.2 Phoenix Petroleum Philippines 2,811,250 313,441 1.9 Sri Lanka (6.9%) Aitken Spence & Co 141,500 105,990 0.6 Commercial Bank of Ceylon 438,451 412,620 2.5 Dialog Axiata 1,900,000 130,834 0.8 John Keells Hldgs 138,845 241,146 1.5 John Keells Hldgs Wts 12/11/15 6,170 3,238 0.0 John Keells Hldgs Wts 12/11/16 6,170 3,394 0.0 National Development Bank 188,400 257,446 1.5 Thailand (1.9%) Mega Lifesciences (F) 476,500 312,868 1.9 United Kingdom (1.2%) Dragon Oil 20,645 194,463 1.2 Vietnam (35.8%) DHG Pharmaceutical 97,950 645,340 3.8 FPT Corp 230,000 763,124 4.6 Hoa Phat Group 197,760 496,802 3.0
(Continued)
Holding
Fair value
US$
% of net
assets Military Commercial JS Bk 450,702 339,669 2.0 Petrovietnam Drilling & Well
Serv 94,948 373,536 2.2 PetroVietnam Gas 143,050 566,165 3.4 Refrigeration Electrical
Engineer 316,000 470,312 2.8 Thien Long Group 139,388 298,630 1.8 Vietnam Dairy Products 148,625 993,299 5.9 Vietnam Sun 262,967 641,915 3.8 Vingroup Joint Stock 120,710 420,533 2.5 Total Listed/Quoted IInvestments 14,105,455 84.1 Other net assets 2,671,919 15.9 Net assets attributable to holders of
rredeemable units at 31 March 2014 16,777,374 100.0 Total investments, at cost 10,630,959
- 25 -
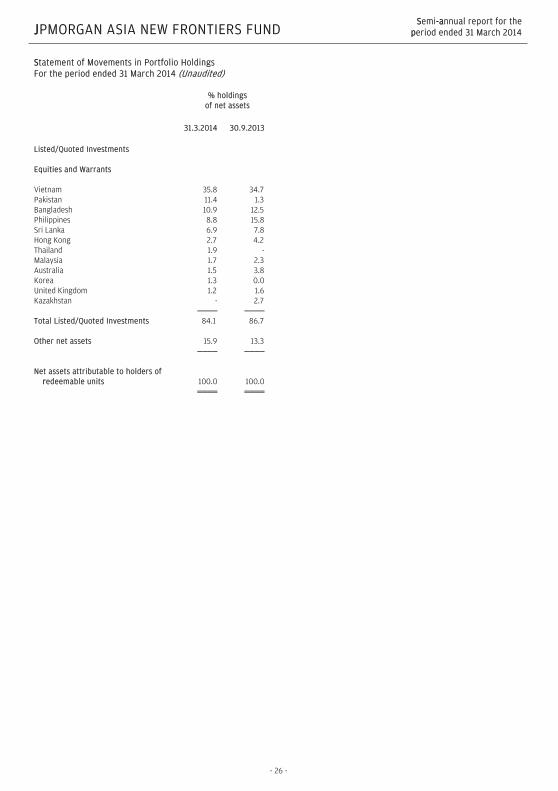
JJPMORGAN ASIA NEW FRONTIERS FUND SSemi--aannual report for the
pperiod ended 31 March 2014
SStatement of Movements in Portfolio Holdings For the period ended 31 March 2014 (Unaudited) % holdings
of net assets 31.3.2014 30.9.2013 Listed/Quoted Investments Equities and Warrants Vietnam 35.8 34.7 Pakistan 11.4 1.3 Bangladesh 10.9 12.5 Philippines 8.8 15.8 Sri Lanka 6.9 7.8 Hong Kong 2.7 4.2 Thailand 1.9 - Malaysia 1.7 2.3 Australia 1.5 3.8 Korea 1.3 0.0 United Kingdom 1.2 1.6 Kazakhstan - 2.7 Total Listed/Quoted Investments 84.1 86.7 Other net assets 15.9 13.3 Net assets attributable to holders of
rredeemable units 100.0 100.0
- 26 -

JJPMORGAN ASIA NEW FRONTIERS FUND SSemi--aannual report for the
pperiod ended 31 March 2014
SStatement of Financial Position As at 31 March 2014 (Unaudited) 31.3.2014 30.9.2013 US$ US$ Assets Cash at banks 1,134,516 1,942,319 Amounts receivable on allotment 1,855,747 10,888 Investments 14,105,455 10,753,388 Dividend and other accounts
receivable 46,930 15,534 Total assets 17,142,648 12,722,129 ---------- ---------- Liabilities Amounts due to brokers 302,087 - Amounts payable on redemption 32,354 288,143 Other accounts payable 30,833 37,102 Total liabilities 365,274 325,245 ---------- ---------- Net assets attributable to holders
oof redeemable units [Note 3] 16,777,374 12,396,884 Equity 16,777,374 12,396,884
Statement of Comprehensive Income For the period ended 31 March 2014 (Unaudited) 1.10.2013
to 31.3.2014
1.10.2012 to
31.3.2013 US$ US$ Income Net gains on investments and
derivatives [Note 4] 2,039,474 2,351,689 Dividend income 186,731 100,654 Interest on deposits 42 23 Net foreign currency exchange
losses (757) (6,432) 2,225,490 2,445,934 ---------- ---------- Expenses Management fee 96,620 100,522 Transaction costs 33,402 34,345 Legal and professional expenses 10,263 8,155 Safe custody and bank charges 7,729 3,914 Auditor's fee 5,585 6,148 Valuation fee 4,720 4,720 Registrar's fee 3,907 3,414 Trustee's fee 3,867 4,023 Printing and publication expenses 1,058 807 Other operating expenses 5,829 714 172,980 166,762 ---------- ---------- Net operating profit 2,052,510 2,279,172 Finance costs Interest paid (895) (380) Profit before taxation 2,051,615 2,278,792 Taxation (18,475) (9,448) Increase in net assets
attributable to holders of redeemable units and total ccomprehensive income 2,033,140 2,269,344
The notes on pages 29 to 31 form part of these financial statements.
- 27 -

JJPMORGAN ASIA NEW FRONTIERS FUND SSemi--aannual report for the
pperiod ended 31 March 2014
SStatement of Changes in Net Assets Attributable to Holders of Redeemable Units For the period ended 31 March 2014 (Unaudited) 1.10.2013
to 31.3.2014
1.10.2012 to
31.3.2013 US$ US$ Net assets attributable to holders
of redeemable units at the beginning of the period 12,396,884 13,483,631
---------- ---------- Allotment of redeemable units 8,339,222 868,904 Redemption of redeemable units (5,991,872) (3,013,883) Net allotment/(redemption) 2,347,350 (2,144,979) ---------- ---------- 14,744,234 11,338,652 Increase in net assets
attributable to holders of redeemable units and total comprehensive income 2,033,140 2,269,344
Net assets attributable to holders
oof redeemable units at the end of the period 16,777,374 13,607,996
Statement of Cash Flows For the period ended 31 March 2014 (Unaudited) 1.10.2013
to 31.3.2014
1.10.2012 to
31.3.2013 US$ US$ Operating activities Purchase of investments and
derivatives (4,057,491) (2,930,741) Proceeds from disposal of
investments and derivatives 3,045,842 3,477,262 Dividend received 155,394 73,992 Interest received 29 20 Trustee's fee paid (3,751) (3,995) Registrar's fee paid (7,706) (6,707) Tax paid (20,385) (11,304) Transaction costs paid (33,814) (36,211) Management fee paid (93,731) (99,836) Others (38,232) (33,013) Net cash ((outflow)/inflow from
operating activities (1,053,845) 429,467 ---------- ---------- Financing activities Interest paid (895) (344) Receipts on allotment of
redeemable units 6,494,363 854,318 Payments on redemption of
redeemable units (6,247,661) (2,899,616) Net cash inflow/(outflow) from
ffinancing activities 245,807 (2,045,642) ---------- ---------- Decrease in cash and cash
eequivalents (808,038) (1,616,175) Cash and cash equivalents at the
beginning of the period 1,942,319 1,563,020 Exchange gains/(losses) on cash
and cash equivalents 235 (558) Cash and cash equivalents at
tthe end of the period 1,134,516 (53,713) Analysis of balances of cash and ccash equivalents: Cash at banks 1,134,516 346,632 Short term bank loans -
unsecured - (400,345) 1,134,516 (53,713)
The notes on pages 29 to 31 form part of these financial statements.
- 28 -

JJPMORGAN ASIA NEW FRONTIERS FUND SSemi--aannual report for the
pperiod ended 31 March 2014
NNotes to the Financial Statements
1 The Fund
JPMorgan Asia New Frontiers Fund (the "Fund") was established under a Trust Deed dated 9 August 2007, as amended, and is governed by the laws of Hong Kong. The Fund is authorized by the Securities and Futures Commission of Hong Kong.
The investment objective of the Fund is to provide investors with long-term capital growth by investing primarily in securities of companies (i) domiciled or listed on a stock exchange in developing countries in Asia ("Asia New Frontiers"), or (ii) with actual or prospective operations, assets or investments, direct or indirect, in Asia New Frontiers in an aggregate amount of not less than either US$50 million or 10 per cent. of the gross assets of the investing company (albeit such operations, assets or investments may at the time of investment be immaterial to the financial results of such company), or (iii) whose performance is linked to the economies of Asia New Frontiers.
Pursuant to the Supplemental Trust Deed dated 31 August 2012, the Manager may decide to issue separate classes (each a "Class") whose assets will be commonly invested but where a specific fee structure, currency or distribution policy may be applied. Each Class may have a different charging structure with the result that the net asset value attributable to each Class may differ.
All unitholders' rights with regard to the convening, voting or otherwise acting at any meeting of unitholders are the same.
2 Summary of principal accounting policies
(a) Accounting policies of interim financial statements
The accounting policies and methods of computation used in the preparation of these unaudited condensed interim financial statements are consistent with those used in the annual financial statements for the year ended 30 September 2013.
(b) Investments and derivatives
Classification
The Fund classifies its investments and derivatives as financial assets or financial liabilities at fair value through profit or loss. These financial assets or financial liabilities are held-for-trading as they are acquired or incurred principally for the purpose of selling or repurchasing in the near term or short-term profit taking.
All derivatives are carried in assets when amounts are receivable by the Fund and in liabilities when amounts are payable by the Fund.
The Fund makes short sales in which a borrowed security is sold in anticipation of a decline in the market value of that security, or it may use short sales for various arbitrage transactions. Short sales are classified as financial liabilities at fair value through profit or loss.
Recognition, derecognition and measurement
Purchases and sales of investments and derivatives are accounted for on the trade date basis. Investments and derivatives are initially recognized at fair value and are subsequently re-measured at fair value. Realized and unrealized gains and losses on investments and derivatives are recognized in the Statement of Comprehensive Income. Investments and derivatives are derecognized when the rights to receive cash flows from the investments and derivatives have expired or the Fund has transferred substantially all risks and rewards of ownership.
Fair value estimation
Fair value is the price that would be received to sell an asset or paid to transfer a liability in an orderly transaction between market participants at the measurement date. The fair value of financial assets and liabilities traded in active markets are based on last traded prices. Prior to 1 October 2012, investments that are listed or traded on an exchange and investments with prices quoted in over-the-counter markets or by market makers, are fair valued based on quoted "bid" prices on long investments and quoted "ask" prices on investments sold short. The Fund early adopted Hong Kong Financial Reporting Standard 13,”Fair Value Measurement” with effect from 1 October 2012, it changed its fair valuation input to utilize the last traded market price for both financial assets and financial liabilities where the last traded price falls within the bid-ask spread. When trading in the securities of an investee company is suspended, the investment is valued at the Manager's estimate of its fair value.
Debt securities are fair valued based on quoted prices inclusive of accrued interest.
Investments in collective investment schemes are stated at fair value based on the net asset value per unit of the respective funds as determined by the administrators of the relevant funds or stated at last traded prices if the collective investment schemes are listed or traded on an exchange.
Open future and swap contracts are valued at last traded prices for both long and short positions at the valuation date. The differences between the last traded prices and the contract prices are recognized in the Statement of Comprehensive Income.
- 29 -

JJPMORGAN ASIA NEW FRONTIERS FUND SSemi--aannual report for the
pperiod ended 31 March 2014
Open option contracts are valued at last traded prices for both long and short positions at the valuation date. The differences between the last traded prices and the premium amounts/contract prices are recognized in the Statement of Comprehensive Income.
Forward foreign exchange contracts are valued at the forward rates ruling at the valuation date. The differences between the forward rates and the contract rates are recognized in the Statement of Comprehensive Income.
((c) Securities lending and borrowing
Securities lenders' agreements are entered into with institutions of appropriate financial standing who engage in such arrangements acceptable to the Trustee and on arm's length commercial terms. Securities lent are included in the investment portfolio of the Fund. Relevant securities lending income entitled by the Fund is accounted for in the Statement of Comprehensive Income. Collateral received for the purpose of securities lent generally consist of non-cash collateral which are off-balance sheet transactions and are therefore not included in the financial statements.
The Fund may enter into securities borrowing arrangements for short sale purposes. Short positions represent obligations to deliver securities sold but not yet purchased, and are accounted for as investments and valued at their fair value. Securities borrowed during the period/year are off-balance sheet transactions and are therefore not included in the investment portfolio of the Fund. Collateral placed for the purpose of securities borrowed generally consist of cash collateral and are included in the Statement of Financial Position separately.
(d) Foreign currency translation
Functional and presentation currency
The Fund has adopted United States dollar as its functional and presentation currency.
Transactions and balances
Foreign currency transactions are translated into the functional currency using the exchange rates prevailing at the dates of the transactions.
Foreign exchange gains and losses resulting from the settlement of such transactions and from the translation of assets and liabilities denominated in foreign currencies at period/year end exchange rates are recognized in the Statement of Comprehensive Income.
Foreign exchange gains and losses relating to cash and cash equivalents are presented in the Statement of Comprehensive Income within "Net foreign currency exchange gains/losses". Foreign exchange gains and losses relating to the financial assets and liabilities carried at fair value through profit or loss are presented in the Statement of Comprehensive Income within "Net gains/losses on investments and derivatives".
(e) Proceeds and payments on allotment and redemption of units
The net asset value per unit is computed for each dealing day. The price at which units are allotted or redeemed is calculated by reference to the net asset value per unit as at the close of business on the relevant dealing day in accordance with the provisions of the Fund's Trust Deed dated 9 August 2007, as amended, which may be different from the accounting policies stated in the financial statements.
3 Number of units in issue and net assets attributable to holders of redeemable units (per unit)
31.3.2014
USD Class (acc) Units Number of units in issue: 1,307,686.871
- 30 -

JJPMORGAN ASIA NEW FRONTIERS FUND SSemi--aannual report for the
pperiod ended 31 March 2014
US$ Net assets attributable to
holders of redeemable units 16,777,374
Net assets attributable to
holders of redeemable units (per unit) 12.83
30.9.2013
USD Class (acc) Units Number of units in issue: 1,130,152.559 US$ Net assets attributable to
holders of redeemable units 12,396,884
Net assets attributable to
holders of redeemable units (per unit) 10.97
44 Net gains on investments and derivatives
1.10.2013
to 31.3.2014
1.10.2012 to
31.3.2013 US$ US$ Change in unrealized gains/losses in value of investments and derivatives 1,168,343 1,968,051 Realized gains on sale of investments and derivatives 871,131 383,638 2,039,474 2,351,689
5 Soft commission arrangements
The Investment Manager has entered into soft commission arrangements with brokers under which certain goods and services used to support investment decision making are received by the Investment Manager. The Investment Manager does not make direct payment for these services but transacts an agreed amount of business with the brokers on behalf of the Fund. Commission is paid from the Fund on these transactions.
The goods and services must be of demonstrable benefit to the Fund and may include research and advisory services; economic and political analysis; portfolio analysis, including valuation and performance measurement; market analysis, data and quotation services, computer hardware and software incidental to the above goods and services; clearing and custodian services and investment-related publications.
6 Distribution
No distribution was made during the period (31 March 2013: nil).
- 31 -

JJPMORGAN ASIA RESOURCES FUND SSemi--aannual report for the
pperiod ended 31 March 2014
IInvestment Portfolio As at 31 March 2014 (Unaudited)
Holding
Fair value
US$
% of net
assets Listed/Quoted Investments (100.1%) (I) Equities (100.2%) Australia (20.9%) Australian Agricultural 374,000 433,302 2.0 BHP Billiton Ltd 9,877 333,865 1.5 Drillsearch Energy 395,147 611,624 2.8 Gold Road Resources 480,000 73,407 0.3 Metals X 52,995 9,824 0.0 Newcrest Mining 41,464 380,082 1.8 Oil Search 43,950 344,619 1.6 Red 5 800,000 57,835 0.3 Sino Gas & Energy Hldgs 1,850,000 274,348 1.3 Syrah Resources 316,500 1,120,588 5.2 Tiger Resources 2,521,225 852,931 3.9 Tigers Realm Coal 350,000 51,904 0.2 Canada (1.4%) St Augustine Gold & Copper 334,020 57,498 0.2 Strata-X Energy CDI 750,000 253,725 1.2 China (35.2%) Anhui Conch Cement 'H' 96,000 411,497 1.9 Beijing Jingneng Clean Energy
'H' 1,876,000 858,548 4.0 China Hongqiao Group 1,383,000 873,618 4.0 China Metal Recycling Hldgs 626,400 808 0.0 China National Bldg Material
'H' 274,000 274,811 1.3 China Oilfield Services 'H' 226,000 530,253 2.4 China Resources Cement Hldgs 324,000 255,205 1.2 China Resources Power Hldgs 256,000 666,645 3.1 China Singyes Solar
Technologies 697,000 1,101,607 5.1 China Suntien Green Energy
'H' 1,854,000 614,252 2.8 Chinalco Mining Corp Intl 3,892,000 506,755 2.3 GCL Poly Energy Hldgs 1,569,000 566,349 2.6 Huadian Fuxin Energy 'H' 1,798,000 980,468 4.5 Hong Kong (9.5%) Hilong Hldg 1,578,000 866,603 4.0 NewOcean Energy Hldgs 1,534,000 1,186,533 5.5 India (7.8%) Hindalco Industries 607,266 1,441,331 6.7 Jindal Steel & Power 49,729 243,514 1.1 Indonesia (1.6%) Gajah Tunggal 1,887,200 353,019 1.6 Korea (4.0%) Hyosung Corp 4,989 359,956 1.7 POSCO 1,827 508,048 2.3 Philippines (3.1%) D&L Industries 607,900 112,647 0.5 Petron Corp-Placing 03/14 212,000 55,500 0.2 Phoenix Petroleum Philippines 4,607,000 513,658 2.4
(Continued)
Holding
Fair value
US$
% of net
assets United States (0.6%) Turquoise Hill Res-US List 36,398 121,205 0.6 Vietnam (16.1%) Hoa Phat Group 435,520 1,094,090 5.1 Petrovietnam Drilling & Well
Serv 155,750 612,739 2.8 PetroVietnam Gas 179,930 712,130 3.3 Refrigeration Electrical
Engineer 253,610 377,455 1.7 Vietnam Dairy Prod PN
24/10/17(JPM)* 105,000 701,742 3.2 21,756,538 100.2 (II) Derivatives (-0.1%) Forward foreign exchange ccontracts (-0.1%) (32,066) (0.1) Total Listed/Quoted Investments 21,724,472 100.1 Other net liabilities (16,709) (0.1) Net assets attributable to holders of
rredeemable units at 31 March 2014 21,707,763 100.0 Total investments, at cost 19,975,012 * Issued by a Connected Person of the Manager
- 32 -

JJPMORGAN ASIA RESOURCES FUND SSemi--aannual report for the
pperiod ended 31 March 2014
SStatement of Movements in Portfolio Holdings For the period ended 31 March 2014 (Unaudited) % holdings
of net assets 31.3.2014 30.9.2013 Listed/Quoted Investments Equities China 35.2 20.9 Australia 20.9 21.0 Vietnam 16.1 20.3 Hong Kong 9.5 - India 7.8 0.6 Korea 4.0 1.6 Philippines 3.1 5.3 Indonesia 1.6 3.0 Canada 1.4 1.9 United States 0.6 0.7 Japan - 11.8 Thailand - 9.3 New Zealand - 0.6 Collective Investment Schemes United States - 2.6 Derivatives Forward foreign exchange contracts (0.1) - Total Listed/Quoted Investments 100.1 99.6 Other net (liabilities)/assets (0.1) 0.4 Net assets aattributable to holders of
redeemable units 100.0 100.0
- 33 -
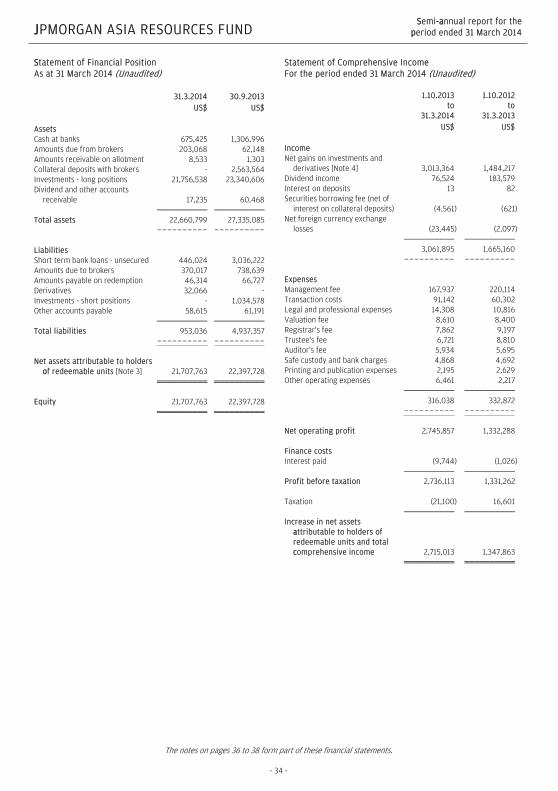
JJPMORGAN ASIA RESOURCES FUND SSemi--aannual report for the
pperiod ended 31 March 2014
SStatement of Financial Position As at 31 March 2014 (Unaudited) 31.3.2014 30.9.2013 US$ US$ Assets Cash at banks 675,425 1,306,996 Amounts due from brokers 203,068 62,148 Amounts receivable on allotment 8,533 1,303 Collateral deposits with brokers - 2,563,564 Investments - long positions 21,756,538 23,340,606 Dividend and other accounts
receivable 17,235 60,468 Total assets 22,660,799 27,335,085 ---------- ---------- Liabilities Short term bank loans - unsecured 446,024 3,036,222 Amounts due to brokers 370,017 738,639 Amounts payable on redemption 46,314 66,727 Derivatives 32,066 - Investments - short positions - 1,034,578 Other accounts payable 58,615 61,191 Total liabilities 953,036 4,937,357 ---------- ---------- Net assets attributable to holders
oof redeemable units [Note 3] 21,707,763 22,397,728 Equity 21,707,763 22,397,728
Statement of Comprehensive Income For the period ended 31 March 2014 (Unaudited) 1.10.2013
to 31.3.2014
1.10.2012 to
31.3.2013 US$ US$ Income Net gains on investments and
derivatives [Note 4] 3,013,364 1,484,217 Dividend income 76,524 183,579 Interest on deposits 13 82 Securities borrowing fee (net of
interest on collateral deposits) (4,561) (621) Net foreign currency exchange
losses (23,445) (2,097) 3,061,895 1,665,160 ---------- ---------- Expenses Management fee 167,937 220,114 Transaction costs 91,142 60,302 Legal and professional expenses 14,308 10,816 Valuation fee 8,610 8,400 Registrar's fee 7,862 9,197 Trustee's fee 6,721 8,810 Auditor's fee 5,934 5,695 Safe custody and bank charges 4,868 4,692 Printing and publication expenses 2,195 2,629 Other operating expenses 6,461 2,217 316,038 332,872 ---------- ---------- Net operating profit 2,745,857 1,332,288 Finance costs Interest paid (9,744) (1,026) Profit before taxation 2,736,113 1,331,262 Taxation (21,100) 16,601 Increase in net assets
aattributable to holders of redeemable units and total ccomprehensive income 2,715,013 1,347,863
The notes on pages 36 to 38 form part of these financial statements.
- 34 -

JJPMORGAN ASIA RESOURCES FUND SSemi--aannual report for the
pperiod ended 31 March 2014
SStatement of Changes in Net Assets Attributable to Holders of Redeemable Units For the period ended 31 March 2014 (Unaudited) 1.10.2013
to 31.3.2014
1.10.2012 to
31.3.2013 US$ US$ Net assets attributable to hholders
of redeemable units at the beginning of the period 22,397,728 28,646,719
---------- ---------- Allotment of redeemable units 1,444,492 11,043,946 Redemption of redeemable units (4,849,470) (11,378,875) Net rredemption (3,404,978) (334,929) ---------- ---------- 18,992,750 28,311,790 Increase in net assets
attributable to holders of redeemable units and total comprehensive income 2,715,013 1,347,863
Net assets aattributable to holders
of redeemable units at the end oof the period 21,707,763 29,659,653
Statement of Cash Flows For the period ended 31 March 2014 (Unaudited) 1.10.2013
to 31.3.2014
1.10.2012 to
31.3.2013 US$ US$ Operating activities Purchase of investments and
derivatives (17,782,131) (13,652,324) Proceeds from disposal of
investments and derivatives 20,867,786 12,116,052 Decrease/(increase) in collateral
deposits with brokers 2,563,564 (746,194) Dividend received 108,315 161,408 Interest received 13 79 Securities borrowing fee paid (net
of interest on collateral deposits) (4,561) (621)
Trustee's fee paid (6,709) (8,741) Registrar's fee paid (15,464) (18,557) Tax (paid)/refund (21,100) 16,601 Transaction costs paid (93,112) (59,949) Management fee paid (167,622) (218,410) Others (48,157) (74,405) Net cash inflow/(outflow) from
ooperating activities 5,400,822 (2,485,061) ---------- ---------- Financing activities Interest paid (9,801) (973) Receipts on allotment of
redeemable units 1,437,262 10,815,053 Payments on redemption of
redeemable units (4,869,883) (11,339,129) Net cash outflow from
ffinancing activities (3,442,422) (525,049) ---------- ---------- Increase/(decrease) in cash and
ccash equivalents 1,958,400 (3,010,110) Cash and cash equivalents at the
beginning of the period (1,729,226) 2,805,988 Exchange gains on cash and cash
equivalents 227 1,116 Cash and cash equivalents at
tthe end of the period 229,401 (203,006) Analysis of balances of cash and cash equivalents: Cash at banks 675,425 397,292 Short term bank loans -
unsecured (446,024) (600,298) 229,401 (203,006)
The notes on pages 36 to 38 form part of these financial statements.
- 35 -

JJPMORGAN ASIA RESOURCES FUND SSemi--aannual report for the
pperiod ended 31 March 2014
NNotes to the Financial Statements
1 The Fund
JPMorgan Asia Resources Fund (the "Fund") was established under a Trust Deed dated 28 February 2008, as amended, and is governed by the laws of Hong Kong. The Fund is authorized by the Securities and Futures Commission of Hong Kong.
The investment objective of the Fund is to provide investors with long-term capital growth by investing primarily in securities of companies in natural resources and commodities sectors in Asia (including Australia and New Zealand). This may include, but is not limited to, companies predominantly engaged in the extraction, refinement, development, production, distribution, marketing or retail sale of natural resources, commodities and their secondary products such as agriculture, energy, forestry, timber, paper, water, metals, basic materials, mining, construction and infrastructure.
Pursuant to the Supplemental Trust Deed dated 31 August 2012, the Manager may also decide to issue separate classes (each a "Class") whose assets will be commonly invested but where a specific fee structure, currency or distribution policy may be applied. Each Class may have a different charging structure with the result that the net asset value attributable to each Class may differ.
All unitholders' rights with regard to the convening, voting or otherwise acting at any meeting of unitholders are the same.
2 Summary of principal accounting policies
(a) Accounting policies of interim financial statements
The accounting policies and methods of computation used in the preparation of these unaudited condensed interim financial statements are consistent with those used in the annual financial statements for the year ended 30 September 2013.
(b) Investments and derivatives
Classification
The Fund classifies its investments and derivatives as financial assets or financial liabilities at fair value through profit or loss. These financial assets or financial liabilities are held-for-trading as they are acquired or incurred principally for the purpose of selling or repurchasing in the near term or short-term profit taking.
All derivatives are carried in assets when amounts are receivable by the Fund and in liabilities when amounts are payable by the Fund.
The Fund makes short sales in which a borrowed security is sold in anticipation of a decline in the market value of that security, or it may use short sales for various arbitrage transactions. Short sales are classified as financial liabilities at fair value through profit or loss.
Recognition, derecognition and measurement
Purchases and sales of investments and derivatives are accounted for on the trade date basis. Investments and derivatives are initially recognized at fair value and are subsequently re-measured at fair value. Realized and unrealized gains and losses on investments and derivatives are recognized in the Statement of Comprehensive Income. Investments and derivatives are derecognized when the rights to receive cash flows from the investments and derivatives have expired or the Fund has transferred substantially all risks and rewards of ownership.
Fair value estimation
Fair value is the price that would be received to sell an asset or paid to transfer a liability in an orderly transaction between market participants at the measurement date. The fair value of financial assets and liabilities traded in active markets are based on last traded prices. Prior to 1 October 2012, investments that are listed or traded on an exchange and investments with prices quoted in over-the-counter markets or by market makers, are fair valued based on quoted "bid" prices on long investments and quoted "ask" prices on investments sold short. The Fund early adopted Hong Kong Financial Reporting Standard 13, "Fair Value Measurement", with effect from 1 October 2012, it changed its fair valuation input to utilize the last traded market price for both financial assets and financial liabilities where the last traded price falls within the bid-ask spread. When trading in the securities of an investee company is suspended, the investment is valued at the Manager's estimate of its fair value.
Debt securities are fair valued based on quoted prices inclusive of accrued interest.
Investments in collective investment schemes are stated at fair value based on the net asset value per unit of the respective funds as determined by the administrators of the relevant funds or stated at last traded prices if the collective investment schemes are listed or traded on an exchange.
Open future and swap contracts are valued at last traded prices for both long and short positions at the valuation date. The differences between the last traded prices and the contract prices are recognized in the Statement of Comprehensive Income.
- 36 -

JJPMORGAN ASIA RESOURCES FUND SSemi--aannual report for the
pperiod ended 31 March 2014
Open option contracts are valued at last traded prices for both long and short positions at the valuation date. The differences between the last traded prices and the premium amounts/contract prices are recognized in the Statement of Comprehensive Income.
Forward foreign exchange contracts are valued at the forward rates ruling at the valuation date. The differences between the forward rates and the contract rates are recognized in the Statement of Comprehensive Income.
((c) Securities lending and borrowing
Securities lenders' agreements are entered into with institutions of appropriate financial standing who engage in such arrangements acceptable to the Trustee and on arm's length commercial terms. Securities lent are included in the investment portfolio of the Fund. Relevant securities lending income entitled by the Fund is accounted for in the Statement of Comprehensive Income. Collateral received for the purpose of securities lent generally consist of non-cash collateral which are off-balance sheet transactions and are therefore not included in the financial statements.
The Fund may enter into securities borrowing arrangements for short sale purposes. Short positions represent obligations to deliver securities sold but not yet purchased, and are accounted for as investments and valued at their fair value. Securities borrowed during the period/year are off-balance sheet transactions and are therefore not included in the investment portfolio of the Fund. Collateral placed for the purpose of securities borrowed generally consist of cash collateral and are included in the Statement of Financial Position separately.
(d) Foreign currency translation
Functional and presentation currency
The Fund has adopted United States dollar as its functional and presentation currency.
Transactions and balances
Foreign currency transactions are translated into the functional currency using the exchange rates prevailing at the dates of the transactions.
Foreign exchange gains and losses resulting from the settlement of such transactions and from the translation of assets and liabilities denominated in foreign currencies at period/year end exchange rates are recognized in the Statement of Comprehensive Income.
Foreign exchange gains and losses relating to cash and cash equivalents are presented in the Statement of Comprehensive Income within "Net foreign currency exchange gains/losses". Foreign exchange gains and losses relating to the financial assets and liabilities carried at fair value through profit or loss are presented in the Statement of Comprehensive Income within "Net gains/losses on investments and derivatives".
(e) Proceeds and payments on allotment and redemption of units
The net asset value per unit is computed for each dealing day. The price at which units are allotted or redeemed is calculated by reference to the net asset value per unit as at the close of business on the relevant dealing day in accordance with the provisions of the Fund's Trust Deed dated 28 February 2008, as amended, which may be different from the accounting policies stated in the financial statements.
3 Number of units in issue and net assets attributable to holders of redeemable units (per unit)
31.3.2014
USD Class (acc) Units Number of units in issue: 2,466,426.515 US$ Net assets attributable to
holders of redeemable units 21,707,763
Net assets attributable to
holders of redeemable units (per unit) 8.80
- 37 -
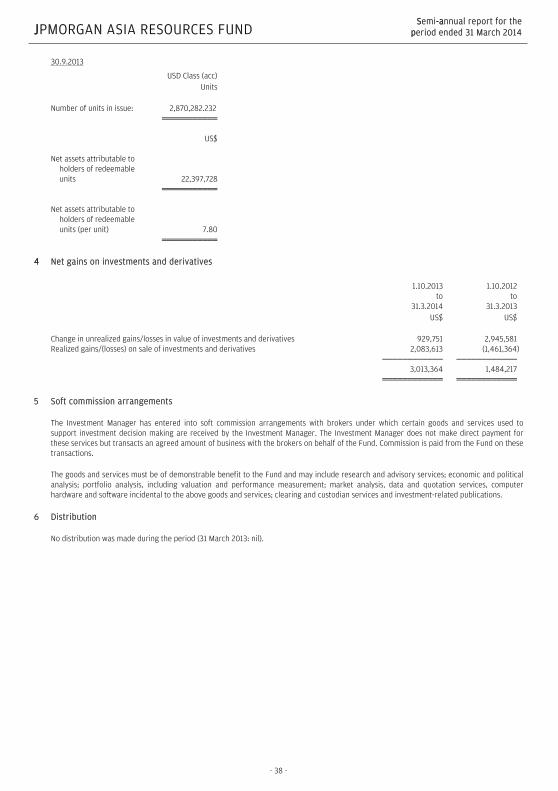
JJPMORGAN ASIA RESOURCES FUND SSemi--aannual report for the
pperiod ended 31 March 2014
30.9.2013
USD Class (acc) Units Number of units in issue: 2,870,282.232 US$ Net assets attributable to
holders of redeemable units 22,397,728
Net assets attributable to
holders of redeemable units (per unit) 7.80
44 Net gains on investments and derivatives
1.10.2013
to 31.3.2014
1.10.2012 to
31.3.2013 US$ US$ Change in unrealized gains/losses in value of investments and derivatives 929,751 2,945,581 Realized gains/(losses) on sale of investments and derivatives 2,083,613 (1,461,364) 3,013,364 1,484,217
5 Soft commission arrangements
The Investment Manager has entered into soft commission arrangements with brokers under which certain goods and services used to support investment decision making are received by the Investment Manager. The Investment Manager does not make direct payment for these services but transacts an agreed amount of business with the brokers on behalf of the Fund. Commission is paid from the Fund on these transactions.
The goods and services must be of demonstrable benefit to the Fund and may include research and advisory services; economic and political analysis; portfolio analysis, including valuation and performance measurement; market analysis, data and quotation services, computer hardware and software incidental to the above goods and services; clearing and custodian services and investment-related publications.
6 Distribution
No distribution was made during the period (31 March 2013: nil).
- 38 -

JJPMORGAN ASIAN TOTAL RETURN BOND FUND SSemi--aannual report for the
pperiod ended 31 March 2014
IInvestment Portfolio As at 31 March 2014 (Unaudited)
Holding
Fair value
US$
% of net
assets Listed/Quoted Investments (94.5%) (I) Convertibles (7.8%) China (4.6%) Agile Property CB 4%
28/4/16-PO3/14 USD1,000,000 1,015,611 0.6 Billion Exp EB(Ch
Unicom)0.75%10/15 USD2,300,000 2,297,853 1.4 Bright North EB 1.25%
4/16-PO 02/14 CNY11,000,000 1,780,627 1.1 China Power Intl CB
2.75% 18/09/17 CNY4,000,000 774,360 0.5 Tong Jie EB (Shanghai
I)0%2/18-RegS HKD12,000,000 1,567,864 1.0 Hong Kong (0.9%) China Daye Non-Fer
CB 0.5% 30/05/18 CNY10,000,000 1,485,302 0.9 India (0.9%) Larsen & Toubro
CB3.5%22/10/14-RegS USD1,300,000 1,334,522 0.9
Japan (0.8%) GS Yuasa CB 0%
13/03/19 (RegS) JPY130,000,000 1,331,747 0.8 Taiwan (0.6%) Asia Cement CB 0%
13/05/18 USD1,000,000 1,008,120 0.6 12,596,006 7.8 --------- ---- (II) Debt Securities (86.2%) Australia (1.5%)Leighton Fin USA
5.95%13/11/22-RegS USD2,400,000 2,450,337 1.5
Bermuda (1.6%) BW Group 6.625%
28/06/17-RegS USD1,000,000 1,074,799 0.7 China Electronics
4.7% 16/1/17-RegS CNY4,800,000 771,238 0.5 China Oil & Gas 5.25%
25/04/18-RegS USD700,000 723,482 0.4 Cayman Islands (8.6%) Central China 6.5%
04/06/18-RegS USD1,200,000 1,126,387 0.7 China Aoyuan 11.25%
17/01/19-RegS USD600,000 611,063 0.4 China Overs Fin
III6.375%10/43-RegS USD300,000 288,553 0.2
(Continued)
Holding
Fair value
US$
% of net
assets China Shanshui Cem
6.5% 22/07/14 CNY6,000,000 979,864 0.6 China Shanshui Cem
8.5%25/5/16-RegS USD1,300,000 1,372,392 0.8 Country Garden 7.5%
10/01/23-RegS USD1,200,000 1,142,380 0.7 Hutchison Wha Int12
VRN6% Perp-RegS USD1,650,000 1,824,185 1.1 Kaisa Group 10.25%
08/01/20-RegS USD1,400,000 1,391,063 0.9 KWG Property 13.25%
22/03/17 USD1,000,000 1,114,281 0.7 Lai Fung Hldgs
6.875% 25/04/18-RegS CNY5,000,000 794,403 0.5
MCE Finance 5% 15/02/21-RegS USD1,400,000 1,414,389 0.9
Texhong Textile 6.5% 18/01/19 USD200,000 199,802 0.1
Yuzhou Prop 11.75% 25/10/17-RegS USD1,400,000 1,555,740 1.0
China (1.9%) Agricult Dev Bk
China3.08%1/16-RegS CNY8,000,000 1,295,595 0.8
China Uranium Dev 3.5% 8/10/18-RegS USD800,000 823,493 0.5
HSBC Bank (China) FRN 10/01/15 CNY5,600,000 923,571 0.6
Hong Kong (14.7%) China CITIC Bank VRN
3.875% 28/9/22 USD1,400,000 1,352,163 0.8 China CITIC Bank VRN
6% 05/24-RegS USD700,000 729,167 0.5 China CITIC Bk 6.875%
24/6/20-RegS USD2,000,000 2,169,231 1.3 Chong Hing Bank 6%
04/11/20 USD1,600,000 1,727,547 1.1 CITIC Pacific 6.875%
21/01/18 USD1,400,000 1,528,183 1.0 CITIC Pacific VRN
8.625% Perp-RegS USD800,000 882,117 0.6 CRCC Yuxiang 3.5%
16/05/23-RegS USD1,200,000 1,127,907 0.7 CTBC Bank
VRN5.625% Perp-RegS USD1,500,000 1,506,966 0.9
Dah Sing Bank VRN 4.875% 02/22-RegS SGD1,750,000 1,447,729 0.9
Dah Sing Bank VRN 5.25%29/1/24-RegS USD634,000 641,251 0.4
Hero Asia Inv Stp 5.25% Perp-RegS USD2,200,000 2,269,236 1.4
Poly Property 4.75% 16/05/18-RegS USD600,000 586,767 0.4
Shandong Intl (HK) 5.8% 07/12/15 CNY10,000,000 1,662,345 1.0
- 39 -

JJPMORGAN ASIAN TOTAL RETURN BOND FUND SSemi--aannual report for the
pperiod ended 31 March 2014
IInvestment Portfolio (Continued) As at 31 March 2014 (Unaudited)
Holding
Fair value
US$
% of net
assets Hong Kong (Continued) Sinochem Global Cap
VRN 5%Perp-RegS USD1,200,000 1,197,940 0.7 Swire Prop MTN Fin
2.75% 03/20-RegS USD1,400,000 1,344,364 0.8 Wheelock Finance 3%
19/03/18-RegS USD1,600,000 1,577,333 1.0 Wing Lung Bank VRN
3.5% 11/22-RegS USD1,000,000 978,597 0.6 Yancoal Intl Res 5.73%
16/5/22-RegS USD1,000,000 905,797 0.6 India (6.2%) ICICI Bank/HK 5.75%
16/11/20-RegS USD2,000,000 2,182,144 1.4 India Govt Bond 7.16
20/05/23 INR125,000,000 1,894,707 1.2 India Govt Bond 8.19%
16/01/20 INR300,000,000 4,916,790 3.0 Power Grid Corp
3.875% 17/1/23-RegS USD1,000,000 918,573 0.6
Indonesia (8.7%) Berau Capital 12.5%
08/07/15-RegS USD2,000,000 2,156,433 1.3 Indonesia Govt
NoFR65 6.625%15/5/33 IDR14,000,000,000 1,036,287 0.7
Indonesia Govt NoFR70 8.375%15/3/24 IDR25,000,000,000 2,280,741 1.4
Pertamina Persero 5.625% 05/43-RegS USD1,800,000 1,567,665 1.0
Pertamina Persero 6% 03/05/42-RegS USD800,000 730,307 0.5
Perusahaan Listrik 5.25% 10/42-RegS USD1,400,000 1,172,418 0.7
Perusahaan Listrik 5.5% 11/21-RegS USD2,000,000 2,074,722 1.3
Rep of Indonesia 4.625% 04/43-RegS USD1,500,000 1,290,457 0.8
Theta Cap 6.125% 14/11/20-RegS USD1,693,000 1,678,828 1.0
Korea (11.0%) GS Caltex 3.25%
01/10/18-RegS USD1,000,000 1,025,150 0.7 Korea Land & Housing
3.5% 27/08/20 KRW5,000,000,000 5,336,466 3.3 Korea Res 2.125%
02/05/18-RegS USD1,500,000 1,501,656 1.0 Korea Treasury
No1703 3.5% 10/03/17 KRW2,200,000,000 2,104,039 1.3
Korea Treasury No2006 5% 10/06/20 KRW3,600,000,000 3,755,573 2.3
(Continued)
Holding
Fair value
US$
% of net
assets Shinhan Bank VRN
6.819%20/9/36-RegS USD1,500,000 1,633,209 1.0
SK Innovation 3.625% 14/08/18-RegS USD600,000 625,880 0.4
Woori Bank VRN 6.208% 02/05/37-RegS USD1,500,000 1,647,400 1.0
Malaysia (5.6%) AMBB Capital VRN
6.77% Perpetual USD1,800,000 1,840,003 1.1 Axiata SPV2 3.75%
18/09/14 CNY7,000,000 1,129,544 0.7 Danga Capital 2.9%
20/10/14-RegS CNY9,000,000 1,463,399 0.9 Malayan Banking VRN
3.8% 28/04/21 SGD1,500,000 1,230,318 0.8 Malaysian Govt
No0311 4.392% 04/26 MYR4,000,000 1,257,720 0.8
Malaysian Govt No0412 4.127% 04/32 MYR1,050,000 308,726 0.2
SSG Resources 4.25% 04/10/22 USD1,800,000 1,817,755 1.1
Mongolia (0.6%) Trade & Dev Bk
Mongolia 8.5% 09/15 USD1,000,000 970,333 0.6
Netherlands (3.1%) Bharti Airtel 5.125%
11/03/23-RegS USD1,000,000 1,001,640 0.6 Indo Energy Fin 7%
07/05/18-RegS USD1,500,000 1,509,125 0.9 Indo Energy Fin II
6.375% 1/23-RegS USD1,000,000 812,642 0.5 Listrindo Capital
6.95%21/2/19-RegS USD1,600,000 1,718,664 1.1 Peru (1.2%) CFG Investment 9.75%
30/07/19-RegS USD2,000,000 1,997,383 1.2 Philippines (0.4%) Dev Bank Of Philip
VRN 8.375% Perp USD600,000 644,566 0.4 Singapore (5.6%) Alam Synergy Pte
6.95% 27/3/20-RegS USD200,000 190,443 0.1
Alam Synergy Pte 9% 29/01/19-RegS USD1,350,000 1,422,765 0.9
Capitaland Try 4.076% 20/09/22 USD2,000,000 1,972,817 1.2
ITNL Offshore 5.75% 26/04/15 CNY16,100,000 2,689,879 1.7
- 40 -
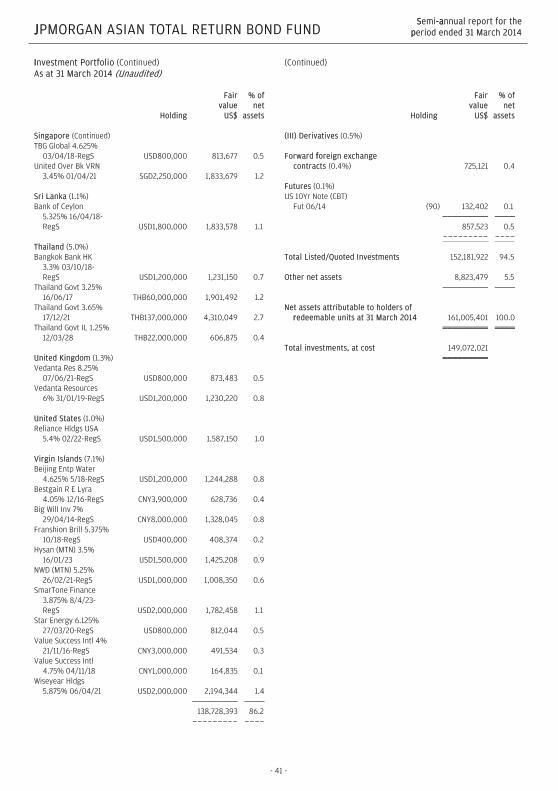
JJPMORGAN ASIAN TOTAL RETURN BOND FUND SSemi--aannual report for the
pperiod ended 31 March 2014
IInvestment Portfolio (Continued) As at 31 March 2014 (Unaudited)
Holding
Fair value
US$
% of net
assets Singapore (Continued) TBG Global 4.625%
03/04/18-RegS USD800,000 813,677 0.5 United Over Bk VRN
3.45% 01/04/21 SGD2,250,000 1,833,679 1.2 Sri Lanka (1.1%) Bank of Ceylon
5.325% 16/04/18-RegS USD1,800,000 1,833,578 1.1
Thailand (5.0%) Bangkok Bank HK
3.3% 03/10/18-RegS USD1,200,000 1,231,150 0.7
Thailand Govt 3.25% 16/06/17 THB60,000,000 1,901,492 1.2
Thailand Govt 3.65% 17/12/21 THB137,000,000 4,310,049 2.7
Thailand Govt IL 1.25% 12/03/28 THB22,000,000 606,875 0.4
United Kingdom (1.3%) Vedanta Res 8.25%
07/06/21-RegS USD800,000 873,483 0.5 Vedanta Resources
6% 31/01/19-RegS USD1,200,000 1,230,220 0.8 United States (1.0%) Reliance Hldgs USA
5.4% 02/22-RegS USD1,500,000 1,587,150 1.0 Virgin Islands (7.1%) Beijing Entp Water
4.625% 5/18-RegS USD1,200,000 1,244,288 0.8 Bestgain R E Lyra
4.05% 12/16-RegS CNY3,900,000 628,736 0.4 Big Will Inv 7%
29/04/14-RegS CNY8,000,000 1,328,045 0.8 Franshion Brill 5.375%
10/18-RegS USD400,000 408,374 0.2 Hysan (MTN) 3.5%
16/01/23 USD1,500,000 1,425,208 0.9 NWD (MTN) 5.25%
26/02/21-RegS USD1,000,000 1,008,350 0.6 SmarTone Finance
3.875% 8/4/23-RegS USD2,000,000 1,782,458 1.1
Star Energy 6.125% 27/03/20-RegS USD800,000 812,044 0.5
Value Success Intl 4% 21/11/16-RegS CNY3,000,000 491,534 0.3
Value Success Intl 4.75% 04/11/18 CNY1,000,000 164,835 0.1
Wiseyear Hldgs 5.875% 06/04/21 USD2,000,000 2,194,344 1.4
138,728,393 86.2 --------- ----
(Continued)
Holding
Fair value
US$
% of net
assets (III) Derivatives (0.5%) Forward fforeign exchange contracts (0.4%) 725,121 0.4 Futures (0.1%) US 10Yr Note (CBT)
Fut 06/14 (90) 132,402 0.1 857,523 0.5 --------- ---- Total Listed/Quoted Investments 152,181,922 94.5 Other net assets 8,823,479 5.5 Net assets attributable to holders of
rredeemable units at 31 March 2014 161,005,401 100.0 Total investments, at cost 149,072,021
- 41 -
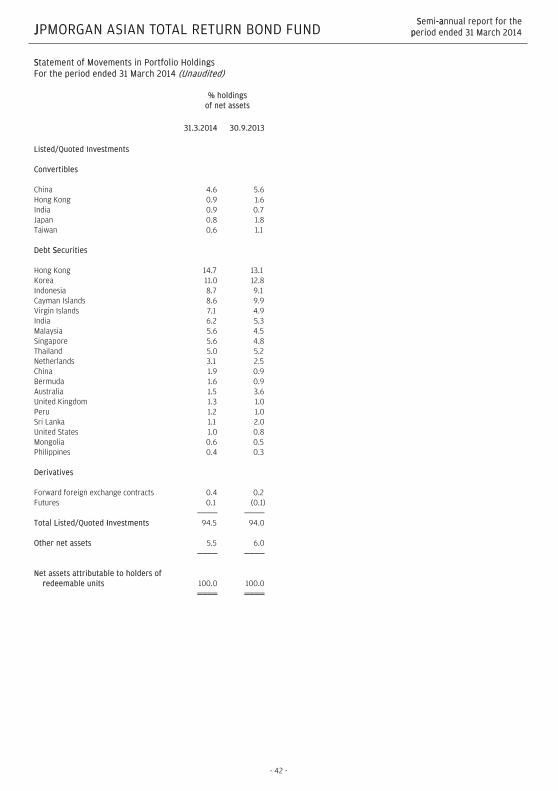
JJPMORGAN ASIAN TOTAL RETURN BOND FUND SSemi--aannual report for the
pperiod ended 31 March 2014
SStatement of Movements in Portfolio Holdings For the period ended 31 March 2014 (Unaudited) % holdings
of net assets 31.3.2014 30.9.2013 Listed/Quoted Investments Convertibles China 4.6 5.6 Hong Kong 0.9 1.6 India 0.9 0.7 Japan 0.8 1.8 Taiwan 0.6 1.1 Debt SSecurities Hong Kong 14.7 13.1 Korea 11.0 12.8 Indonesia 8.7 9.1 Cayman Islands 8.6 9.9 Virgin Islands 7.1 4.9 India 6.2 5.3 Malaysia 5.6 4.5 Singapore 5.6 4.8 Thailand 5.0 5.2 Netherlands 3.1 2.5 China 1.9 0.9 Bermuda 1.6 0.9 Australia 1.5 3.6 United Kingdom 1.3 1.0 Peru 1.2 1.0 Sri Lanka 1.1 2.0 United States 1.0 0.8 Mongolia 0.6 0.5 Philippines 0.4 0.3 Derivatives Forward foreign exchange contracts 0.4 0.2 Futures 0.1 (0.1) Total Listed/Quoted IInvestments 94.5 94.0 Other net assets 5.5 6.0 Net assets attributable to holders of
rredeemable units 100.0 100.0
- 42 -

JJPMORGAN ASIAN TOTAL RETURN BOND FUND SSemi--aannual report for the
pperiod ended 31 March 2014
SStatement of Financial Position As at 31 March 2014 (Unaudited) 31.3.2014 30.9.2013 US$ US$ Assets Cash at banks 9,605,642 7,282,821 Short term deposits - 8,801,258 Amounts due from brokers - 1,851,465 Amounts receivable on allotment 1,039,076 2,714,807 Margin deposits 262,762 318,053 Derivatives 857,523 390,990 Investments 151,324,399 181,857,236 Interest and other accounts
receivable 355 2,435 Total aassets 163,089,757 203,219,065 ---------- ---------- Liabilities Amounts due to brokers - 6,127,890 Amounts payable on redemption 1,228,649 2,242,165 Distribution payable [Note 5] 619,653 754,965 Derivatives - 134,531 Other accounts payable 236,054 261,809 Liabilities (excluding net assets
attributable to holders of redeemable units) 2,084,356 9,521,360
---------- ---------- Net assets attributable to holders
oof redeemable units [Note 3] 161,005,401 193,697,705
Statement of Comprehensive Income For the period ended 31 March 2014 (Unaudited) 1.10.2013
to 31.3.2014
1.10.2012 to
31.3.2013 US$ US$ Income Net gains on investments and
derivatives [Note 4] 6,282,190 8,106,844 Net foreign currency exchange
gains/(losses) 90,583 (180,130) Interest on deposits 45,702 16,205 Other income 60 167,857 6,418,535 8,110,776 ---------- ---------- Expenses Management fee 854,256 1,098,180 Registrar's fee 54,951 69,589 Trustee's fee 30,597 36,644 Safe custody and bank charges 18,035 21,135 Legal and professional expenses 8,629 4,725 Valuation fee 8,610 8,400 Printing and publication expenses 6,360 1,744 Auditor's fee 5,734 5,695 Transaction costs 2,902 5,434 Other operating expenses 2,497 3,433 992,571 1,254,979 ---------- ---------- Net operating profit 5,425,964 6,855,797 ---------- ---------- Finance costs Distribution [Note 5] (3,904,244) (4,312,810) Interest paid - (6) (3,904,244) (4,312,816) ---------- ---------- Profit before taxation 1,521,720 2,542,981 Taxation (58,538) (239,875) 1,463,182 2,303,106 Change in cumulative difference
arising from the fair value adjustment of units of the Fund - 37,105
Increase in net assets
attributable to holders of redeemable units and total ccomprehensive income 1,463,182 2,340,211
The notes on pages 45 to 50 form part of these financial statements.
- 43 -

JJPMORGAN ASIAN TOTAL RETURN BOND FUND SSemi--aannual report for the
pperiod ended 31 March 2014
SStatement of Changes in Net Assets Attributable to Holders of Redeemable Units For the period ended 31 March 2014 (Unaudited) 1.10.2013
to 31.3.2014
1.10.2012 to
31.3.2013 US$ US$ Net assets attributable to holders
of redeemable units at the beginning of the period 193,697,705 203,739,682
---------- ---------- Allotment of redeemable units 23,212,967 86,950,619 Redemption of redeemable units (57,368,453) (74,754,812) Net (redemption)/allotment (34,155,486) 12,195,807 ---------- ---------- 159,542,219 215,935,489 Increase in net assets
attributable to holders of redeemable units and total comprehensive income 1,463,182 2,340,211
Net assets attributable to holders
oof redeemable units at the end of the period 161,005,401 218,275,700
Statement of Cash Flows For the period ended 31 March 2014 (Unaudited) 1.10.2013
to 31.3.2014
1.10.2012 to
31.3.2013 US$ US$ Operating activities Purchase of investments and
derivatives (31,060,658) (129,597,309) Proceeds from disposal of
investments and derivatives 62,998,196 107,934,853 Decrease in margin deposits 55,291 98,746 Interest received 46,011 16,633 Transaction costs paid (3,362) (5,699) Trustee's fee paid (31,234) (36,323) Tax paid (51,865) (246,592) Registrar's fee paid (59,772) (60,815) Management fee paid (879,849) (1,085,367) Others 115,678 (176,207) Net cash inflow/(outflow) from
ooperating activities 31,128,436 (23,158,080) ---------- ---------- Financing activities Interest paid - (6) Receipts on allotment of
redeemable units 24,888,698 87,501,376 Payments on redemption of
redeemable units (58,381,969) (74,184,538) Distribution paid (4,039,556) (4,137,474) Net cash (outflow)/inflow from
ffinancing activities (37,532,827) 9,179,358 ---------- ---------- Decrease in ccash and cash
equivalents (6,404,391) (13,978,722) Cash and cash equivalents at the
beginning of the period 16,084,079 25,064,616 Exchange (losses)/gains on cash
and cash equivalents (74,046) 22,987 Cash and cash equivalents at
tthe end of the period 9,605,642 11,108,881 Analysis of balances of cash and cash equivalents: Cash at banks 9,605,642 2,060,286 Short term deposits - 9,048,595 9,605,642 11,108,881
The notes on pages 45 to 50 form part of these financial statements.
- 44 -

JJPMORGAN ASIAN TOTAL RETURN BOND FUND SSemi--aannual report for the
pperiod ended 31 March 2014
NNotes to the Financial Statements
1 The Fund
JPMorgan Asian Total Return Bond Fund (the "Fund") was established under a Trust Deed dated 30 November 2004, as amended, and is governed by the laws of Hong Kong. The Fund is authorized by the Securities and Futures Commission of Hong Kong.
The investment objective of the Fund is to achieve a competitive total return, consisting of capital growth and regular dividend income, through an actively managed portfolio investing primarily in Asian bonds and other debt securities.
Pursuant to the Supplemental Trust Deed dated 27 February 2012, the Manager may decide to issue separate classes (each a “Class”) whose assets will be commonly invested but where a specific fee structure, currency or distribution policy may be applied. Each Class may have a different charging structure with the result that the net asset value attributable to each Class may differ.
All unitholders' rights with regard to the convening, voting or otherwise acting at any meeting of unitholders are the same.
2 Summary of principal accounting policies
(a) Accounting policies of interim financial statements
The accounting policies and methods of computation used in the preparation of these unaudited condensed interim financial statements are consistent with those used in the annual financial statements for the year ended 30 September 2013.
(b) Investments and derivatives
Classification
The Fund classifies its investments and derivatives as financial assets or financial liabilities at fair value through profit or loss. These financial assets or financial liabilities are held-for-trading as they are acquired or incurred principally for the purpose of selling or repurchasing in the near term or short-term profit taking.
All derivatives are carried in assets when amounts are receivable by the Fund and in liabilities when amounts are payable by the Fund.
Recognition, derecognition and measurement
Purchases and sales of investments and derivatives are accounted for on the trade date basis. Investments and derivatives are initially recognized at fair value and are subsequently re-measured at fair value. Realized and unrealized gains and losses on investments and derivatives are recognized in the Statement of Comprehensive Income. Investments and derivatives are derecognized when the rights to receive cash flows from the investments and derivatives have expired or the Fund has transferred substantially all risks and rewards of ownership.
Fair value estimation
Fair value is the price that would be received to sell an asset or paid to transfer a liability in an orderly transaction between market participants at the measurement date. The fair value of financial assets and liabilities traded in active markets are based on last traded prices. Prior to 1 October 2012, investments that are listed or traded on an exchange and investments with prices quoted in over-the-counter markets or by market makers, are fair valued based on quoted "bid" prices on long investments and quoted "ask" prices on investments sold short. The Fund early adopted Hong Kong Financial Reporting Standard 13, "Fair Value Measurement", with effect from 1 October 2012, it changed its fair valuation input to utilize the last traded market price for both financial assets and financial liabilities where the last traded price falls within the bid-ask spread. When trading in the securities of an investee company is suspended, the investment is valued at the Manager's estimate of its fair value.
Debt securities are fair valued based on quoted prices inclusive of accrued interest.
Investments in collective investment schemes are stated at fair value based on the net asset value per unit of the respective funds as determined by the administrators of the relevant funds or stated at last traded prices if the collective investment schemes are listed or traded on an exchange.
Open future and swap contracts are valued at last traded prices for both long and short positions at the valuation date. The differences between the last traded prices and the contract prices are recognized in the Statement of Comprehensive Income.
Open option contracts are valued at last traded prices for both long and short positions at the valuation date. The differences between the last traded prices and the premium amounts/contract prices are recognized in the Statement of Comprehensive Income.
Credit default swaps are marked to market daily based upon quotations from the market makers and the change in value, if any, is recorded as an unrealized gain or loss in the Statement of Comprehensive Income.
- 45 -

JJPMORGAN ASIAN TOTAL RETURN BOND FUND SSemi--aannual report for the
pperiod ended 31 March 2014
Forward foreign exchange contracts are valued at the forward rates ruling at the valuation date. The differences between the forward rates and the contract rates are recognized in the Statement of Comprehensive Income.
((c) Foreign currency translation
Functional and presentation currency
The Fund has adopted United States dollar as its functional and presentation currency.
Transactions and balances
Foreign currency transactions are translated into the functional currency using the exchange rates prevailing at the dates of the transactions.
Foreign exchange gains and losses resulting from the settlement of such transactions and from the translation of assets and liabilities denominated in foreign currencies at period/year end exchange rates are recognized in the Statement of Comprehensive Income.
Foreign exchange gains and losses relating to cash and cash equivalents are presented in the Statement of Comprehensive Income within "Net foreign currency exchange gains/losses". Foreign exchange gains and losses relating to the financial assets and liabilities carried at fair value through profit or loss are presented in the Statement of Comprehensive Income within "Net gains/losses on investments and derivatives".
(d) Proceeds and payments on allotment and redemption of units
The net asset value per unit is computed for each dealing day. The price at which units are allotted or redeemed is calculated by reference to the net asset value per unit as at the close of business on the relevant dealing day in accordance with the provisions of the Fund's Trust Deed dated 30 November 2004, as amended, which may be different from the accounting policies stated in the financial statements.
Units of the Fund are redeemable at the option of the holders of redeemable units and are classified as a financial liability in the Statement of Financial Position which represents the net assets attributable to holders of redeemable units (or "net asset value" or "net assets" or "NAV") and is carried at the redemption amount that would be payable at the Statement of Financial Position date if the holders of redeemable units exercised the right to redeem units of the Fund.
3 Number of units in issue and net assets attributable to holders of redeemable units (per unit)
31.3.2014
AUD Hedged Class (mth)
CAD Hedged Class (mth) HKD Class (mth)
NZD Hedged Class (mth) USD Class (mth)
Units Units Units Units Units Number of units in issue: 1,196,357.071 350,000.162 3,921,522.947 166,513.102 12,184,013.350 A$ C$ HK$ NZ$ US$ Net assets attributable to
holders of redeemable units 11,371,297 3,333,353 39,169,941 1,574,289 139,975,687
Net assets attributable to
holders of redeemable units (per unit) 9.50 9.52 9.99 9.45 11.49
- 46 -

JJPMORGAN ASIAN TOTAL RETURN BOND FUND SSemi--aannual report for the
pperiod ended 31 March 2014
USD Class (acc) Units Number of units in issue: 97,275.013 US$ Net assets attributable to
holders of redeemable units 1,054,521
Net assets attributable to
holders of redeemable units (per unit) 10.84
30.9.2013
AUD Hedged Class (mth)
CAD Hedged Class (mth) HKD Class (mth)
NZD Hedged Class (mth) USD Class (mth)
Units Units Units Units Units Number of units in issue: 1,875,623.930 112,346.004 5,472,000.581 95,221.378 14,673,653.930 A$ C$ HK$ NZ$ US$ Net assets attributable to
holders of redeemable units 17,707,623 1,061,767 54,170,983 894,737 167,122,708
Net assets attributable to
holders of redeemable units (per unit) 9.44 9.45 9.90 9.40 11.39
USD Class (acc) Units Number of units in issue: 119,325.728 US$ Net assets attributable to
holders of redeemable units 1,254,148
Net assets attributable to
holders of redeemable units (per unit) 10.51
- 47 -

JJPMORGAN ASIAN TOTAL RETURN BOND FUND SSemi--aannual report for the
pperiod ended 31 March 2014
44 Net gains on investments and derivatives
1.10.2013
to 31.3.2014
1.10.2012 to
31.3.2013 US$ US$ Change in unrealized gains/losses in value of investments and derivatives 3,641,645 1,963,467 Realized gains on sale of investments and derivatives 2,640,545 6,143,377 6,282,190 8,106,844
5 Distribution
It is the intention of the manager of the Fund to have at least 85% of the income attributable to the distribution class(es) respectively in respect of each accounting period, after charging the expenses attributable to these distribution class(es) respectively, to be distributed to unitholders of these distribution class(es) respectively. 1.10.2013
to 31.3.2014
1.10.2012 to
31.3.2013 US$ US$ Net operation profit 5,425,964 6,855,797 Adjustments: Net gains on investments and derivatives (6,282,190) (8,106,844) Interest income included in net gains on investments and derivatives (at coupon rate) 4,242,300 5,305,460 Net foreign currency exchange (gains)/losses (90,583) 180,130 Transaction costs 2,902 5,434 Interest paid - (6) Taxation (58,538) (239,875) Capital gain tax 8,027 60,701 Amount available for distribution 3,247,882 4,060,797 Distribution of A$0.0554 per unit on 1,744,116.438 units of AUD Hedged Class (mth) ex on 31 October 2013
and pay on 8 November 2013 (91,498)
C$0.0427 per unit on 85,073.244 units of CAD Hedged Class (mth) ex on 31 October 2013 and pay on 8 November 2013 (3,484)
HK$0.0369 per unit on 5,116,661.719 units of HKD Class (mth) ex on 31 October 2013 and pay on 8 November 2013) (24,352)
NZ$0.0561 per unit on 72,264.634 units of NZD Hedged Class (mth) ex on 31 October 2013 and pay on 8 November 2013 (3,356)
US$0.0425 per unit on 13,989,043.107 units of USD Class (mth) ex on 31 October 2013 and pay on 8 November 2013 (594,534)
(2013: HK$0.0304 per unit on 1,258,681.661 units of HKD Class (mth) ex on 31 October 2012 and pay on 8 November 2012)
(4,937)
(2013: US$0.0350 per unit on 17,336,773.116 units of USD Class (mth) ex on 31 October 2012 and pay on 8 November 2012)
(606,787)
A$0.0546 per unit on 1,696,223.558 units of AUD Hedged Class (mth) ex on 29 November 2013 and pay on 9 December 2013 (84,635)
C$0.0426 per unit on 85,384.717 units of CAD Hedged Class (mth) ex on 29 November 2013 and pay on 9 December 2013 (3,436)
HK$0.0369 per unit on 4,560.286.515 units of HKD Class (mth) ex on 29 November 2013 and pay on 9 December 2013 (21,705)
NZ$0.0550 per unit on 131,080.399 units of NZD Hedged Class (mth) ex on 29 November 2013 and pay on 9 December 2013 (5,886)
US$0.0425 per unit on 12,890,750.678 units of USD Class (mth) ex on 29 November 2013 and pay on 9 December 2013 (547,857)
(2013: HK$0.0304 per unit on 2,142,318.582 units of HKD Class (mth) ex on 30 November 2012 and pay on 10 December 2012)
(8,403)
(2013: US$0.0350 per unit on 18,901,729.440 units of USD Class (mth) ex on 30 November 2012 and pay on 10 December 2012)
(661,561)
- 48 -

JJPMORGAN ASIAN TOTAL RETURN BOND FUND SSemi--aannual report for the
pperiod ended 31 March 2014
1.10.2013 to
31.3.2014
1.10.2012 to
31.3.2013 US$ US$ A$0.0552 per unit on 1,704,044.486 units of AUD Hedged Class (mth) ex on 31 December 2013 and pay on 9 January 2014 (84,154) C$0.0425 per unit on 89,660.490 units of CAD Hedged Class (mth) ex on 31 December 2013 and pay on 9 January 2014 (3,586)
HK$0.0369 per unit on 4,355,917.250 units of HKD Class (mth) ex on 31 December 2013 and pay on 9 January 2014 (20,730)
NZ$0.0562 per unit on 117,353.704 units of NZD Hedged Class (mth) ex on 31 December 2013 and pay on 9 January 2014 (5,428)
US$0.0425 per unit on 12,795,983.033 units of USD Class (mth) ex on 31 December 2013 and pay on 9 January 2014 (543,829)
(2013: HK$0.0304 per unit on 2,321,626.100 units of HKD Class (mth) ex on 31 December 2012 and pay on 9 January 2013)
(9,106)
(2013: US$0.0350 per unit on 18,910,378.767 units of USD Class (mth) ex on 31 December 2012 and pay on 9 January 2013)
(661,863)
A$0.0550 per unit on 1,463,322.813 units of AUD Hedged Class (mth) ex on 30 January 2014 and pay on 11 February 2014 (70,499)
C$0.0423 per unit on 97,843.354 units of CAD Hedged Class (mth) ex on 30 January 2014 and pay on 11 February 2014 (3,702)
HK$0.0369 per unit on 4,246,966.482 units of HKD Class (mth) ex on 30 January 2014 and pay on 11 February 2014 (20,182)
NZ$0.0562 per unit on 120,063.962 units of NZD Hedged Class (mth) ex on 30 January 2014 and pay on 11 February 2014 (5,494)
US$0.0425 per unit on 12,489,370.987 units of USD Class (mth) ex on 30 January 2014 and pay on 11 February 2014 (530,798)
(2013: A$0.0594 per unit on 33,178.463 units of AUD Hedged Class (mth) ex on 31 January 2013 and pay on 8 February 2013)
(2,056)
(2013: C$0.0420 per unit on 19,942.856 units of CAD Hedged Class (mth) ex on 31 January 2013 and pay on 8 February 2013)
(839)
(2013: HK$0.0369 per unit on 2,404,601.802 units of HKD Class (mth) ex on 31 January 2013 and pay on 8 February 2013)
(11,441)
(2013: NZ$0.0562 per unit on 24,230.676 units of NZD Hedged Class (mth) ex on 31 January 2013 and pay on 8 February 2013)
(1,144)
(2013: US$0.0425 per unit on 19,393,101.617 units of USD Class (mth) ex on 31 January 2013 and pay on 8 February 2013)
(824,207)
A$0.0535 per unit on 1,212,634.684 units of AUD Hedged Class (mth) ex on 28 February 2014 and pay on 10 March 2014 (58,054)
C$0.0414 per unit on 341,396.596 units of CAD Hedged Class (mth) ex on 28 February 2014 and pay on 10 March 2014 (12,768)
HK$0.0369 per unit on 4,082,328.209 units of HKD Class (mth) ex on 28 February 2014 and pay on 10 March 2014 (19,410)
NZ$0.0541 per unit on 153,230.553 units of NZD Hedged Class (mth) ex on 28 February 2014 and pay on 10 March 2014 (6,966)
US$0.0425 per unit on 12,194,059.772 units of USD Class (mth) ex on 28 February 2014 and pay on 10 March 2014 (518,248)
(2013: A$0.0569 per unit on 25,571.172 units of AUD Hedged Class (mth) ex on 28 February 2013 and pay on 8 March 2013)
(1,490)
(2013: C$0.0413 per unit on 34,679.059 units of CAD Hedged Class (mth) ex on 28 February 2013 and pay on 8 March 2013)
(1,393)
(2013: HK$0.0369 per unit on 2,137,833.294 units of HKD Class (mth) ex on 28 February 2013 and pay on 8 March 2013)
(10,172)
(2013: NZ$0.0541 per unit on 24,367.536 units of NZD Hedged Class (mth) ex on 28 February 2013 and pay on 8 March 2013)
(1,093)
(2013: US$0.0425 per unit on 17,399,816.813 units of USD Class (mth) ex on 28 February 2013 and pay on 8 March 2013)
(739,492)
A$0.0557 per unit on 1,196,357.071 units of AUD Hedged Class (mth) ex on 31 March 2014 and pay on 8 April 2014 (61,763)
C$0.0421 per unit on 350,000.162 units of CAD Hedged Class (mth) ex on 31 March 2014 and pay on 8 April 2014 (13,350)
HK$0.0369 per unit on 3,921,522.947 units of HKD Class (mth) ex on 31 March 2014 and pay on 8 April 2014 (18,654)
NZ$0.0577 per unit on 166,513.102 units of NZD Hedged Class (mth) ex on 31 March 2014 and pay on 8 April 2014 (8,337)
US$0.0425 per unit on 12,177,619.599 units of USD Class (mth) ex on 31 March 2014 and pay on 8 April 2014 (517,549)
- 49 -

JJPMORGAN ASIAN TOTAL RETURN BOND FUND SSemi--aannual report for the
pperiod ended 31 March 2014
1.10.2013 to
31.3.2014
1.10.2012 to
31.3.2013 US$ US$ (2013: A$0.0590 per unit on 67,529.531 units of AUD Hedged Class (mth) ex on 28 March 2013 and pay on 10 April 2013)
(4,154)
(2013: C$0.0420 per unit on 78,982.938 units of CAD Hedged Class (mth) ex on 28 March 2013 and pay on 10 April 2013)
(3,265)
(2013: HK$0.0369 per unit on 2,177,682.994 units of HKD Class (mth) ex on 28 March 2013 and pay on 10 April 2013)
(10,352)
(2013: NZ$0.0561 per unit on 24,499.496 units of NZD Hedged Class (mth) ex on 28 March 2013 and pay on 10 April 2013)
(1,152)
(2013: US$0.0425 per unit on 17,597,725.720 units of USD Class (mth) ex on 28 March 2013 and pay on 10 April 2013)
(747,903)
Total distribution to holders of redeemable units (3,904,244) (4,312,810)
In the event that the amount available for distribution is insufficient to pay distributions as the Fund declares, the Manager may in its discretion determine that such distributions be paid from capital.
66 Soft commission arrangements
The Investment Manager has entered into soft commission arrangements with brokers under which certain goods and services used to support investment decision making are received by the Investment Manager. The Investment Manager does not make direct payment for these services but transacts an agreed amount of business with the brokers on behalf of the Fund. Commission is paid from the Fund on these transactions.
The goods and services must be of demonstrable benefit to the Fund and may include research and advisory services; economic and political analysis; portfolio analysis, including valuation and performance measurement; market analysis, data and quotation services, computer hardware and software incidental to the above goods and services; clearing and custodian services and investment-related publications.
- 50 -

JJPMORGAN ASIAONE FUND SSemi--aannual report for the
pperiod ended 31 March 2014
IInvestment Portfolio As at 31 March 2014 (Unaudited)
Place of establishment Holding
Fair value
US$
% of net
assets Listed/Quoted Investments (101.8%) Collective Investment Schemes (101.8%) China (18.2%) JPM China Pioneer A-Share Fund ** Hong Kong 83,923 1,885,751 3.0 JPMF-JPM China Fd 'A' (dist)-USD * Luxembourg 122,158 5,361,494 8.4 JPMF-JPM Greater China'A'(dist)-USD * Luxembourg 145,021 4,337,592 6.8 Hong Kong (17.9%) JPMF-JPM Hong Kong 'A' (dist)-USD * Luxembourg 229,360 11,351,036 17.9 India (3.9%) JPM India Fd-USD (acc) * Mauritius 2,998 597,125 0.9 JPM India Smaller Co Fund 'A' ** Mauritius 194,587 1,879,715 3.0 Japan (26.0%) JPMorgan Japan (Yen)(acc)-JPY ** Hong Kong 93,091 16,539,205 26.0 Korea (22.1%) JPM Korea Fd-USD (acc) ** Hong Kong 280,641 14,009,609 22.1 South East Asia (3.4%) JPM Eastern Smaller Cos-USD(acc) ** Hong Kong 14,387 2,169,449 3.4 Taiwan (10.3%) JPMF-JPM Taiwan 'A' (dist)-USD * Luxembourg 414,497 6,515,894 10.3 Total Listed/Quoted Investments 64,646,870 101.8 Other net liabilities (1,158,855) (1.8) Net assets attributable to holders of redeemable units at 31 March 2014 63,488,015 100.0 Total investments, at cost 61,503,445 * Issued and managed by a Connected Person of the Manager ** Issued and managed by the Manager
- 51 -

JJPMORGAN ASIAONE FUND SSemi--aannual report for the
pperiod ended 31 March 2014
SStatement of Movements in Portfolio Holdings For the period ended 31 March 2014 (Unaudited) % holdings
of net assets 31.3.2014 30.9.2013 Listed/Quoted Investments Collective Investment Schemes Japan 26.0 21.0 Korea 22.1 23.0 China 18.2 17.1 Hong Kong 17.9 18.3 Taiwan 10.3 8.7 India 3.9 2.6 South East Asia 3.4 2.8 Thailand - 5.8 Total Listed/Quoted Investments 101.8 99.3 Other net (liabilities)/assets (1.8) 0.7 Net assets attributable to holders of redeemable units 100.0 100.0
- 52 -

JJPMORGAN ASIAONE FUND SSemi--aannual report for the
pperiod ended 31 March 2014
SStatement of Financial Position As at 31 March 2014 (Unaudited) 31.3.2014 30.9.2013 US$ US$ Assets Cash at banks 39,398 160,162 Amounts due from brokers - 1,077,553 Amounts receivable on allotment 510 2,625 Margin deposits 2 - Investments 64,646,870 72,390,178 Interest receivable 1 5 Total assets 64,686,781 73,630,523 ---------- ---------- Liabilities Short term bank loans - unsecured 1,060,402 - Amounts payable on redemption 87,279 662,948 Other accounts payable 51,085 79,479 Total liabilities 1,198,766 742,427 ---------- ---------- Net assets attributable to holders
oof redeemable units [Note 3] 63,488,015 72,888,096 Equity 63,488,015 72,888,096
Statement of Comprehensive Income For the period ended 31 March 2014 (Unaudited) 1.10.2013
to 31.3.2014
1.10.2012 to
31.3.2013 US$ US$ Income Net (losses)/gains on investments
and derivatives [Note 4] (1,370,789) 7,098,897 Interest on deposits 6 20 Net foreign currency exchange
(losses)/gains (273) 1 (1,371,056) 7,098,918 ---------- ---------- Expenses Management fee 170,080 213,150 Registrar's fee 20,586 24,384 Auditor's fee 12,017 12,041 Trustee's fee 10,205 12,789 Valuation fee 8,470 8,330 Printing and publication expenses 3,456 2,873 Safe custody and bank charges 1,990 1,714 Legal and professional expenses 162 225 Transaction costs 134 300 Other operating expenses 1,187 494 228,287 276,300 ---------- ---------- Net operating (loss)/profit (1,599,343) 6,822,618 Finance costs Interest paid (5,723) (7,889) (Decrease)/inncrease in net
assets attributable to holdersof redeemable units and total comprehensive income (1,605,066) 6,814,729
The notes on pages 55 to 56 form part of these financial statements.
- 53 -

JJPMORGAN ASIAONE FUND SSemi--aannual report for the
pperiod ended 31 March 2014
SStatement of Changes in Net Assets Attributable to Holders of Redeemable Units For the period ended 31 March 2014 (Unaudited) 1.10.2013
to 31.3.2014
1.10.2012 to
31.3.2013 US$ US$ Net assets attributable to holders
of redeemable units at the beginning of the period 72,888,096 87,677,146
---------- ---------- Allotment of redeemable units 2,724,741 2,842,666 Redemption of redeemable units (10,519,756) (15,558,028) Net redemption (7,795,015) (12,715,362) ---------- ---------- 65,093,081 74,961,784 (Decrease)/increase in net assets
attributable to holders of redeemable units and total comprehensive income (1,605,066) 6,814,729
Net assets attributable to holders
oof redeemable units at the end of tthe period 63,488,015 81,776,513
Statement of Cash Flows For the period ended 31 March 2014 (Unaudited) 1.10.2013
to 31.3.2014
1.10.2012 to
31.3.2013 US$ US$ Operating activities Purchase of investments and
derivatives (2,701,371) (14,434,230) Proceeds from disposal of
investments and derivatives 10,151,443 20,856,379 Interest received 10 46 Increase in margin deposits (2) (3) Transaction costs paid (274) (560) Trustee's fee paid (10,450) (12,855) Registrar's fee paid (41,063) (49,128) Management fee paid (174,163) (214,255) Others (31,027) (38,257) Net cash inflow from operating
aactivities 7,193,103 6,107,137 ---------- ---------- Financing activities Interest paid (5,699) (7,386) Receipts on allotment of
redeemable units 2,726,856 2,748,333 Payments on redemption of
redeemable units (11,095,425) (15,543,675) Net cash outflow from
ffinancing activities (8,374,268) (12,802,728) ---------- ---------- Decrease in cash and cash
eequivalents (1,181,165) (6,695,591) Cash and cash equivalents at the
beginning of the period 160,162 1,081,343 Exchange losses on cash and cash
equivalents (1) (4) Cash and ccash equivalents at
the end of the period (1,021,004) (5,614,252) Analysis of balances of cash and cash equivalents: Cash at banks 39,398 41,540 Short term bank loans -
unsecured (1,060,402) (5,655,792) (1,021,004) (5,614,252)
The notes on pages 55 to 56 form part of these financial statements.
- 54 -

JJPMORGAN ASIAONE FUND SSemi--aannual report for the
pperiod ended 31 March 2014
NNotes to the Financial Statements
1 The Fund
JPMorgan AsiaOne Fund (the "Fund") was established under a Trust Deed dated 22 August 2006, as amended, and is governed by the laws of Hong Kong. The Fund is authorized by the Securities and Futures Commission of Hong Kong ("SFC").
The investment objective of the Fund is to seek to produce a competitive total return in different market conditions. The Fund seeks to achieve this primarily through an actively managed portfolio of collective investment schemes managed by the Manager or its connected persons (as defined in the SFC Code) which are linked to the economies of Asian countries (including Australia) ("Underlying Funds"). The allocation to the Underlying Funds will be continually monitored and reviewed and changes will be made as considered appropriate to better achieve the Fund's objective. In other words, the Fund may invest up to all of its assets in equity funds when the Investment Manager believes market conditions and opportunities favour equities. When the Investment Manager believes market conditions and opportunities do not favour equities the Fund may invest up to all of its assets in fixed income and money market funds and other funds with a low correlation to equities. The Investment Manager may invest in a range of funds whose underlying assets embrace the full spectrum of the risk return trade off from low to high risk. The Investment Manager may carry out hedging activities via financial futures.
All unitholders' rights with regard to the convening, voting or otherwise acting at any meeting of unitholders are the same.
2 Summary of principal accounting policies
(a) Accounting policies of interim financial statements
The accounting policies and methods of computation used in the preparation of these unaudited condensed interim financial statements are consistent with those used in the annual financial statements for the year ended 30 September 2013.
(b) Investments and derivatives
Classification
The Fund classifies its investments and derivatives as financial assets or financial liabilities at fair value through profit or loss. These financial assets or financial liabilities are held-for-trading as they are acquired or incurred principally for the purpose of selling or repurchasing in the near term or short-term profit taking.
All derivatives are carried in assets when amounts are receivable by the Fund and in liabilities when amounts are payable by the Fund.
Recognition, derecognition and measurement
Purchases and sales of investments and derivatives are accounted for on the trade date basis. Investments and derivatives are initially recognized at fair value and are subsequently re-measured at fair value. Realized and unrealized gains and losses on investments and derivatives are recognized in the Statement of Comprehensive Income. Investments and derivatives are derecognized when the rights to receive cash flows from the investments and derivatives have expired or the Fund has transferred substantially all risks and rewards of ownership.
Fair value estimation
Fair value is the price that would be received to sell an asset or paid to transfer a liability in an orderly transaction between market participants at the measurement date. The fair value of financial assets and liabilities traded in active markets are based on last traded prices. Prior to 1 October 2012, investments that are listed or traded on an exchange and investments with prices quoted in over-the-counter markets or by market makers, are fair valued based on quoted "bid" prices on long investments and quoted "ask" prices on investments sold short. The Fund early adopted Hong Kong Financial Reporting Standard 13, "Fair Value Measurement", with effect from 1 October 2012, it changed its fair valuation input to utilize the last traded market price for both financial assets and financial liabilities where the last traded price falls within the bid-ask spread. When trading in the securities of an investee company is suspended, the investment is valued at the Manager's estimate of its fair value.
Investments in collective investment schemes are stated at fair value based on the net asset value per unit of the respective funds as determined by the administrators of the relevant funds or stated at last traded prices if the collective investment schemes are listed or traded on an exchange.
Open future and swap contracts are valued at last traded prices for both long and short positions at the valuation date. The differences between the last traded prices and the contract prices are recognized in the Statement of Comprehensive Income.
(c) Foreign currency translation
Functional and presentation currency
- 55 -

JJPMORGAN ASIAONE FUND SSemi--aannual report for the
pperiod ended 31 March 2014
The Fund has adopted United States dollar as its functional and presentation currency.
Transactions and balances
Foreign currency transactions are translated into the functional currency using the exchange rates prevailing at the dates of the transactions.
Foreign exchange gains and losses resulting from the settlement of such transactions and from the translation of assets and liabilities denominated in foreign currencies at period/year end exchange rates are recognized in the Statement of Comprehensive Income.
Foreign exchange gains and losses relating to cash and cash equivalents are presented in the Statement of Comprehensive Income within "Net foreign currency exchange gains/losses". Foreign exchange gains and losses relating to the financial assets and liabilities carried at fair value through profit or loss are presented in the Statement of Comprehensive Income within "Net gains/losses on investments and derivatives".
((d) Proceeds and payments on allotment and redemption of units
The net asset value per unit is computed for each dealing day. The price at which units are allotted or redeemed is calculated by reference to the net asset value per unit as at the close of business on the relevant dealing day in accordance with the provisions of the Fund's Trust Deed dated 22 August 2006, as amended, which may be different from the accounting policies stated in the financial statements.
3 Number of units in issue and net assets attributable to holders of redeemable units (per unit)
31.3.2014 30.9.2013 Units Units Number of units in issue 4,519,345.076 5,055,899.798 US$ US$ Net assets attributable to holders of redeemable units 63,488,015 72,888,096 Net assets attributable to holders of redeemable units (per unit) 14.05 14.42
4 Net (losses)/gains on investments and derivatives
1.10.2013
to 31.3.2014
1.10.2012 to
31.3.2013 US$ US$ Change in unrealized gains/losses in value of investments and derivatives (2,867,355) 6,682,296 Realized gains on sale of investments and derivatives 1,496,566 416,601 (1,370,789) 7,098,897
5 Soft commission arrangements
During the period, the Investment Manager and its associates did not enter into any soft commission arrangements in connection with directing transactions of the Fund through a broker or dealer (31 March 2013: nil).
6 Distribution
No distribution was made during the period (31 March 2013: nil).
- 56 -

JJPMORGAN AUSTRALIA FUND SSemi--aannual report for the
pperiod ended 31 March 2014
DDistributor Status The Fund has been certified by HMRC in the UK as a distributing fund in respect of the period from 1 January 1984 to 30 September 2010. The principal effect of this certification is that for unitholders resident or ordinarily resident in the UK for taxation purposes any gains accruing on the sale, redemption or other disposal of units during the period will be taxed in the UK as a capital gain and not as income. This treatment will continue under the new UK reporting fund regime provided the Fund does not invest more than 5% of its assets in other offshore funds which are not themselves reporting funds. There will be no need to formally apply for reporting fund status as the Fund is transparent for UK tax purposes and therefore considered out of scope of the requirements of this new regime. These are now known as "special category transparent offshore funds". As noted, the Fund is transparent for UK income tax purposes and UK investors are subject to UK capital gains tax on disposal of their units. UK investors are subject to tax on their share of income of the Fund on an arising basis. Information has been provided to UK investors of the amount of their share of the underlying income, expenses and overseas tax suffered.
Investment Portfolio As at 31 March 2014 (Unaudited)
Holding
Fair value
US$
% of net
assets Listed/Quoted Investments (98.6%) Equities (98.6%) Australia (94.8%) Banks (24.5%) Australia & NZ Bkg Group-AU
List 91,800 2,812,904 5.5 Commonwealth Bank of
Australia 51,300 3,682,070 7.3 National Australia Bank 83,430 2,742,019 5.4 Westpac Banking 99,300 3,180,771 6.3 Commercial Services & Supplies (4.8%) Brambles Ltd 215,230 1,847,240 3.7 Vocation Ltd 237,000 575,518 1.1 Construction Materials (3.2%) Boral Ltd 312,000 1,633,851 3.2 Containers & Packaging (3.7%) Amcor Ltd 198,000 1,906,734 3.7 Distributors (2.2%) G8 Education 235,912 1,108,581 2.2 Diversified Financials (3.1%) Steadfast Group 687,888 1,000,983 2.0 Veda Group 263,644 584,017 1.1
(Continued)
Holding
Fair value
US$
% of net
assets Diversified Telecommunication Services (6.1%) Telstra Corp 653,000 3,074,584 6.1 Food Products (2.0%) Goodman Fielder 702,606 400,494 0.8 Pact Group Hldgs 191,287 609,893 1.2 Health Care Providers & Services (0.9%) Virtus Health 71,260 480,825 0.9 Hotels Restaurants & Leisure (1.2%) Aristocrat Leisure 120,000 598,374 1.2 Insurance (6.2%) AMP Ltd-AU Listing 384,000 1,772,434 3.5 Cover-More Group 129,302 250,473 0.5 QBE Insurance Group 94,900 1,127,622 2.2 Metals & Mining (11.9%) BHP Billiton Ltd 146,285 4,944,757 9.7 Bluescope Steel 196,000 1,113,592 2.2 Oil & Gas (4.6%) Drillsearch Energy 432,000 668,667 1.3 Karoon Gas Australia 104,000 246,765 0.5 Oil Search 182,975 1,434,735 2.8 Pharmaceuticals (5.2%) CSL Ltd 41,007 2,643,790 5.2 Real Estate (8.5%) AVEO Group Stapled Sec 317,220 593,911 1.2 Ingenia Communities Stapled
Sec 771,000 360,874 0.7 Lend Lease Group Stapled Sec 136,200 1,495,908 2.9 Stockland Stapled Sec 535,000 1,859,493 3.7 Road & Rail (3.7%) Aurizon Holdings 389,715 1,856,606 3.7 Transportation Infrastructure (3.0%) Asciano Ltd 317,000 1,527,820 3.0 New Zealand (3.8%) Healthcare (0.9%) Metlifecare Ltd 127,000 448,531 0.9 Oils (2.9%) Genesis Energy 291,191 391,656 0.8 Z Energy 316,192 1,070,065 2.1 Total LListed/Quoted Investments 50,046,557 98.6 Other net assets 696,793 1.4 Net assets attributable to holders of
rredeemable units at 31 March 2014 50,743,350 100.0 TTotal investments, at cost 40,148,775
- 57 -

JJPMORGAN AUSTRALIA FUND SSemi--aannual report for the
pperiod ended 31 March 2014
SStatement of Movements in Portfolio Holdings For the period ended 31 March 2014 (Unaudited) % holdings
of net assets 31.3.2014 30.9.2013 Listed/Quoted Investments Equities Australia Banks 24.5 23.0 Metals & Mining 11.9 13.5 Real Estate 8.5 5.9 Insurance 6.2 5.1 Diversified Telecommunication Services 6.1 7.1 Pharmaceuticals 5.2 5.4 Commercial Services & Supplies 4.8 3.8 Oil & Gas 4.6 4.2 Containers & Packaging 3.7 2.9 Road & Rail 3.7 2.9 Construction Materials 3.2 1.9 Diversified Financials 3.1 2.4 Transportation Infrastructure 3.0 2.8 Distributors 2.2 2.5 Food Products 2.0 2.8 Hotels Restaurants & Leisure 1.2 - Health Care Providers & Services 0.9 1.4 Beverages - 3.0 New Zealand Oils 2.9 2.2 Healthcare 0.9 - United States Broadcasting (Tv, Radio & Cable) - 4.0 Total Listed/Quoted Investments 98.6 96.8 Other net assets 1.4 3.2 Net assets attributable to holders of
rredeemable units 100.0 100.0
- 58 -

JJPMORGAN AUSTRALIA FUND SSemi--aannual report for the
pperiod ended 31 March 2014
SStatement of Financial Position As at 31 March 2014 (Unaudited) 31.3.2014 30.9.2013 US$ US$ Assets Cash at banks 387,774 247,789 Short term deposits 1,439,106 748,321 Amounts receivable on allotment 117,330 1,006,309 Investments 50,046,557 57,049,692 Dividend and other accounts
receivable 264,490 412,978 Total assets 52,255,257 59,465,089 ---------- ---------- Liabilities Amounts due to brokers 391,656 - Amounts payable on redemption 1,040,088 411,592 Other accounts payable 80,163 116,946 Liabilities (excluding net assets
attributable to holders of redeemable units) 1,511,907 528,538
---------- ---------- Net assets attributable to holders
oof redeemable units [Note 3] 50,743,350 58,936,551
Statement of Comprehensive Income For the period ended 31 March 2014 (Unaudited) 1.10.2013
to 31.3.2014
1.10.2012 to
31.3.2013 US$ US$ Income Net gains on investments and
derivatives [Note 4] 2,271,229 11,980,706 Dividend income 991,658 1,434,764 Net foreign currency exchange
gains 110,817 34,191 Interest on deposits 8,224 13,775 Other income 98 - 3,382,026 13,463,436 ---------- ---------- Expenses Management fee 407,693 568,746 Transaction costs 51,025 74,392 Registrar's fee 23,337 27,230 Trustee's fee 14,868 18,655 Safe custody and bank charges 9,923 11,074 Valuation fee 8,540 8,330 Auditor's fee 6,382 6,439 Printing and publication expenses 1,672 1,569 Legal and professional expenses 129 219 Other operating expenses 652 384 524,221 717,038 ---------- ---------- Net operating profit 2,857,805 12,746,398 Finance costs Interest paid (282) (1,330) Profit before taxation 2,857,523 12,745,068 Taxation (28,664) (52,573) 2,828,859 12,692,495 Change in cumulative difference
arising from the fair value adjustment of units of the Fund - 281,035
Increase in net assets
attributable to holders of redeemable units and total ccomprehensive income 2,828,859 12,973,530
The notes on pages 61 to 64 form part of these financial statements.
- 59 -

JJPMORGAN AUSTRALIA FUND SSemi--aannual report for the
pperiod ended 31 March 2014
SStatement of Changes in Net Assets Attributable to Holders of Redeemable Units For the period ended 31 March 2014 (Unaudited) 1.10.2013
to 31.3.2014
1.10.2012 to
31.3.2013 US$ US$ Net assets attributable to holders
of redeemable units at the beginning of the pperiod 58,936,551 82,105,071
---------- ---------- Allotment of redeemable units 7,243,059 6,970,119 Redemption of redeemable units (18,265,119) (33,643,196) Net redemption (11,022,060) (26,673,077) ---------- ---------- 47,914,491 55,431,994 Increase in net assets
attributable to holders of redeemable units and total comprehensive income 2,828,859 12,973,530
Net assets attributable to holders
of redeemable units at the end oof the period 50,743,350 68,405,524
Statement of Cash Flows For the period ended 31 March 2014 (Unaudited) 1.10.2013
to 31.3.2014
1.10.2012 to
31.3.2013 US$ US$ Operating activities Purchase of investments and
derivatives (15,974,316) (16,936,863) Proceeds from disposal of
investments and derivatives 25,640,336 38,333,737 Dividend received 1,140,186 1,510,989 Interest received 8,184 14,116 Trustee's fee paid (15,134) (18,822) Tax paid (28,664) (52,573) Registrar's fee paid (41,394) (49,289) Transaction costs paid (51,290) (77,796) Management fee paid (421,426) (578,625) Others 93,277 (3,736) Net cash inflow from operating
aactivities 10,349,759 22,141,138 ---------- ---------- Financing activities Interest paid (282) (1,250) Receipts on allotment of
redeemable units 8,132,038 8,755,076 Payments on redemption of
redeemable units (17,636,623) (33,317,474) Net cash outflow from
ffinancing activities (9,504,867) (24,563,648) ---------- ---------- Increase/(decrease) in cash and
ccash equivalents 844,892 (2,422,510) Cash and cash equivalents at the
beginning of the period 996,110 1,726,605 Exchange (losses)/gains on cash
and cash equivalents (14,122) 309 Cash and cash equivalents at
tthe end of the period 1,826,880 (695,596) Analysis of balances of cash and cash equivalents: Cash at banks 387,774 204,627 Short term deposits 1,439,106 - Short term bank loans -
unsecured - (900,223) 1,826,880 (695,596)
The notes on pages 61 to 64 form part of these financial statements.
- 60 -

JJPMORGAN AUSTRALIA FUND SSemi--aannual report for the
pperiod ended 31 March 2014
NNotes to the Financial Statements
1 The Fund
JPMorgan Australia Fund (the "Fund") was established under a Trust Deed dated 5 June 1981, as amended, and is governed by the laws of Hong Kong. The Fund is authorized by the Securities and Futures Commission of Hong Kong.
The investment objective of the Fund is to provide investors with long-term capital growth by investing primarily in Australian securities.
Pursuant to the Supplemental Trust Deed dated 31 August 2012, the Manager may decide to issue separate classes (each a "Class") whose assets will be commonly invested but where a specific fee structure, currency or distribution policy may be applied. Each Class may have a different charging structure with the result that the net asset value attributable to each Class may differ.
All unitholders' rights with regard to the convening, voting or otherwise acting at any meeting of unitholders are the same.
2 Summary of principal accounting policies
(a) Accounting policies of interim financial statements
The accounting policies and methods of computation used in the preparation of these unaudited condensed interim financial statements are consistent with those used in the annual financial statements for the year ended 30 September 2013.
(b) Investments and derivatives
Classification
The Fund classifies its investments and derivatives as financial assets or financial liabilities at fair value through profit or loss. These financial assets or financial liabilities are held-for-trading as they are acquired or incurred principally for the purpose of selling or repurchasing in the near term or short-term profit taking.
All derivatives are carried in assets when amounts are receivable by the Fund and in liabilities when amounts are payable by the Fund.
The Fund makes short sales in which a borrowed security is sold in anticipation of a decline in the market value of that security, or it may use short sales for various arbitrage transactions. Short sales are classified as financial liabilities at fair value through profit or loss.
Recognition, derecognition and measurement
Purchases and sales of investments and derivatives are accounted for on the trade date basis. Investments and derivatives are initially recognized at fair value and are subsequently re-measured at fair value. Realized and unrealized gains and losses on investments and derivatives are recognized in the Statement of Comprehensive Income. Investments and derivatives are derecognized when the rights to receive cash flows from the investments and derivatives have expired or the Fund has transferred substantially all risks and rewards of ownership.
Fair value estimation
Fair value is the price that would be received to sell an asset or paid to transfer a liability in an orderly transaction between market participants at the measurement date. The fair value of financial assets and liabilities traded in active markets are based on last traded prices. Prior to 1 October 2012, investments that are listed or traded on an exchange and investments with prices quoted in over-the-counter markets or by market makers, are fair valued based on quoted "bid" prices on long investments and quoted "ask" prices on investments sold short. The Fund early adopted Hong Kong Financial Reporting Standard 13, "Fair Value Measurement", with effect from 1 October 2012, it changed its fair valuation input to utilize the last traded market price for both financial assets and financial liabilities where the last traded price falls within the bid-ask spread. When trading in the securities of an investee company is suspended, the investment is valued at the Manager's estimate of its fair value.
Debt securities are fair valued based on quoted prices inclusive of accrued interest.
Investments in collective investment schemes are stated at fair value based on the net asset value per unit of the respective funds as determined by the administrators of the relevant funds or stated at last traded prices if the collective investment schemes are listed or traded on an exchange.
Open future and swap contracts are valued at last traded prices for both long and short positions at the valuation date. The differences between the last traded prices and the contract prices are recognized in the Statement of Comprehensive Income.
Open option contracts are valued at last traded prices for both long and short positions at the valuation date. The differences between the last traded prices and the premium amounts/contract prices are recognized in the Statement of Comprehensive Income.
- 61 -

JJPMORGAN AUSTRALIA FUND SSemi--aannual report for the
pperiod ended 31 March 2014
Forward foreign exchange contracts are valued at the forward rates ruling at the valuation date. The differences between the forward rates and the contract rates are recognized in the Statement of Comprehensive Income.
((c) Securities lending and borrowing
Securities lenders' agreements are entered into with institutions of appropriate financial standing who engage in such arrangements acceptable to the Trustee and on arm's length commercial terms. Securities lent are included in the investment portfolio of the Fund. Relevant securities lending income entitled by the Fund is accounted for in the Statement of Comprehensive Income. Collateral received for the purpose of securities lent generally consist of non-cash collateral which are off-balance sheet transactions and are therefore not included in the financial statements.
The Fund may enter into securities borrowing arrangements for short sale purposes. Short positions represent obligations to deliver securities sold but not yet purchased, and are accounted for as investments and valued at their fair value. Securities borrowed during the period/year are off-balance sheet transactions and are therefore not included in the investment portfolio of the Fund. Collateral placed for the purpose of securities borrowed generally consist of cash collateral and are included in the Statement of Financial Position separately.
(d) Foreign currency translation
Functional and presentation currency
The Fund has adopted United States dollar as its functional and presentation currency.
Transactions and balances
Foreign currency transactions are translated into the functional currency using the exchange rates prevailing at the dates of the transactions.
Foreign exchange gains and losses resulting from the settlement of such transactions and from the translation of assets and liabilities denominated in foreign currencies at period/year end exchange rates are recognized in the Statement of Comprehensive Income.
Foreign exchange gains and losses relating to cash and cash equivalents are presented in the Statement of Comprehensive Income within "Net foreign currency exchange gains/losses". Foreign exchange gains and losses relating to the financial assets and liabilities carried at fair value through profit or loss are presented in the Statement of Comprehensive Income within "Net gains/losses on investments and derivatives".
(e) Proceeds and payments on allotment and redemption of units
The net asset value per unit is computed for each dealing day. The price at which units are allotted or redeemed is calculated by reference to the net asset value per unit as at the close of business on the relevant dealing day in accordance with the provisions of the Fund's Trust Deed dated 5 June 1981, as amended, which may be different from the accounting policies stated in the financial statements.
Units of the Fund are redeemable at the option of the holders of redeemable units and are classified as a financial liability in the Statement of Financial Position which represents the net assets attributable to holders of redeemable units (or "net asset value" or "net assets" or "NAV") and is carried at the redemption amount that would be payable at the Statement of Financial Position date if the holders of redeemable units exercised the right to redeem units of the Fund.
- 62 -

JJPMORGAN AUSTRALIA FUND SSemi--aannual report for the
pperiod ended 31 March 2014
33 Number of units in issue and net assets attributable to holders of redeemable units (per unit)
31.3.2014
AUD Class (acc) USD Class (acc) Units Units Number of units in issue: 83,663.717 1,302,669.079 A$ US$ Net assets attributable to
holders of redeemable units 1,066,393 49,754,964
Net assets attributable to
holders of redeemable units (per unit) 12.75 38.19
30.9.2013
AUD Class (acc) USD Class (acc) Units Units Number of units in issue: 103,750.973 1,595,200.217 A$ US$ Net assets attributable to
holders of redeemable units 1,243,007 57,776,467
Net assets attributable to
holders of redeemable units (per unit) 11.98 36.22
4 Net gains on investments and derivatives
1.10.2013
to 31.3.2014
1.10.2012 to
31.3.2013 US$ US$ Change in unrealized gains/losses in value of investments and derivatives (1,402,739) 5,955,725 Realized gains on sale of investments and derivatives 3,673,968 6,024,981 2,271,229 11,980,706
- 63 -

JJPMORGAN AUSTRALIA FUND SSemi--aannual report for the
pperiod ended 31 March 2014
55 Soft commission arrangements
The Investment Manager has entered into soft commission arrangements with brokers under which certain goods and services used to support investment decision making are received by the Investment Manager. The Investment Manager does not make direct payment for these services but transacts an agreed amount of business with the brokers on behalf of the Fund. Commission is paid from the Fund on these transactions.
The goods and services must be of demonstrable benefit to the Fund and may include research and advisory services; economic and political analysis; portfolio analysis, including valuation and performance measurement; market analysis, data and quotation services, computer hardware and software incidental to the above goods and services; clearing and custodian services and investment-related publications.
6 Distribution
No distribution was made during the period (31 March 2013: nil).
- 64 -

JJPMORGAN CHINA NEW GENERATION FUND SSemi--aannual report for the
pperiod ended 31 March 2014
IInvestment Portfolio As at 31 March 2014 (Unaudited)
Holding
Fair value
US$
% of net
assets Listed/Quoted Investments (90.9%) (I) Equities and Convertibles (85.5%) China (85.4%) AVIC Capital Co 'A' 459,950 1,116,958 1.1 Bank of China CB Step Cpn
02/06/16 CNY750,000 119,243 0.1 Beijing Enterprises Water
Group 598,000 418,605 0.4 Beijing Originwater
Technology 'A' 287,755 1,528,554 1.6 Beijing Thunisoft Corp 'A' 79,959 391,565 0.4 Beijing Yanjing Brewery 'A' 649,918 705,524 0.7 BesTV New Media 'A' 261,381 1,348,521 1.4 Bright Dairy & Food 'A' 336,951 908,218 0.9 Changchun High & New
Technology 'A' 107,768 1,669,035 1.7 Changyuan Group 'A' 629,869 1,024,120 1.0 China CYTS Tours Hldg Co
'A' 424,838 1,262,626 1.3 China Minsheng Banking
'A' 1,094,899 1,348,814 1.4 China National Accord
Medicines 'B' 219,949 1,102,432 1.1 China Vanke 'A' 2,731,533 3,553,892 3.6 Chongqing Changan
Automobile 'A' 549,934 846,392 0.9 CITIC Securities Co 'A' 789,775 1,337,461 1.4 Elec-Tech Intl 'A' 474,904 613,297 0.6 FAW Car 'A' 837,643 1,360,597 1.4 Fujian Tianguang Fire-
fighting 'A' 474,829 749,127 0.8 Fuyao Group Glass
Industries 'A' 736,000 977,703 1.0 Gemdale Corp 'A' 2,199,896 2,448,260 2.5 Goertek Inc 'A' 673,845 2,774,273 2.8 Great Wall Motor 'A' 140,630 734,361 0.7 Great Wall Motor 'H' 205,500 1,030,540 1.0 Gree Electric Appliances
'A' 481,710 2,169,167 2.2 Hangzhou Hik-Vision
Digital 'A' 1,054,109 2,958,218 3.0 Hangzhou Shunwang
Technology 'A' 50,228 413,666 0.4 Hebei Chengde Lolo 'A' 134,971 458,007 0.5 Huaneng Renewables 'H' 1,850,000 627,236 0.6 Huayu Automotive
Systems 'A' 834,799 1,288,850 1.3 Industrial Bank 'A' 1,208,188 1,849,783 1.9 Industrial Securities 'A' 299,943 418,705 0.4 Inner Mongolia Yili Ind 'A' 455,899 2,627,028 2.7 Jiangsu Hengrui Medicine
'A' 244,771 1,317,937 1.3 Jointown Pharmaceutical
'A' 264,975 681,827 0.7 Kingenta Ecological
Engineering 'A' 139,916 429,334 0.4 Kweichow Moutai 'A' 58,848 1,464,102 1.5
(Continued)
Holding
Fair value
US$
% of net
assets Leshi Internet Info & Tech
'A' 120,000 720,811 0.7 Lianhua Supermarket 'H' 580,000 329,739 0.3 Nari Technology
Development 'A' 509,824 1,157,722 1.2 Ping An Bank 'A' 1,459,926 2,528,691 2.6 Ping An Insurance (Group)
'A' 827,804 5,000,372 5.1 Poly Real Estate Group 'A' 1,100,000 1,346,253 1.4 SAIC Motor Corp 'A' 535,550 1,192,886 1.2 Sanan Optoelectronics 'A' 282,099 1,032,125 1.1 Shanghai Fosun
Pharmaceutical 'A' 739,748 2,382,945 2.4 Shanghai Friendship
Group 'B' 624,920 767,402 0.8 Shanghai Jahwa United 'A' 335,355 1,818,079 1.8 Shanghai Jinfeng Wine 'A' 1,104,807 1,492,502 1.5 Shanghai Pudong Dev
Bank 'A' * 2,634,949 4,118,962 4.2 Shenzhen O-Film Tech 'A' 79,956 541,355 0.6 Shenzhen Overseas
Chinese Town 'A' 2,159,917 1,601,354 1.6 Sinolink Securities 'A' 309,886 927,964 0.9 Sound Environmental
Resources 'A' 293,429 1,296,788 1.3 Tasly Pharmaceutical
Group 'A' 537,376 3,369,619 3.4 Tencent Hldgs 36,600 2,545,517 2.6 Wonders Information 'A' 163,731 1,031,942 1.0 Yonyou Software 'A' 457,887 1,271,745 1.3 Youku Tudou ADR 3,500 98,140 0.1 Yunnan Baiyao Group 'A' 68,668 927,647 0.9 Zhangjiagang Furui
Special Equip'A' 66,828 653,986 0.7 Hong Kong (0.1%) China Innovationpay
Group 1,600,000 117,570 0.1 84,346,094 85.5 --------- ---- (II) Debt SSecurities (5.4%) China (5.4%)Beijing Capital 6.5%
24/09/14 (SS) CNY1,500,000 249,958 0.3 China Communication
4.7% 08/14 (SS) CNY1,500,000 247,921 0.3 China Gov Bd No1501
4.44% 02/15-SS CNY4,640,000 763,490 0.8 China Govt Bond No1107
4.26%7/21-SS CNY4,800,000 774,348 0.8 China Govt Bond No1213
2.6% 9/17-SS CNY8,000,000 1,230,691 1.2 China Govt Bond No1303
3.4% 4/23-SS CNY6,878,000 1,036,526 1.0 China Guodian 5.6%
22/09/19 (SS) CNY117,000 19,533 0.0
- 65 -

JJPMORGAN CHINA NEW GENERATION FUND SSemi--aannual report for the
pperiod ended 31 March 2014
IInvestment Portfolio (Continued) As at 31 March 2014 (Unaudited)
Holding
Fair value
US$
% of net
assets China (Continued) GD Power Dev 1%
07/05/14 (SS) CNY1,500,000 242,445 0.2 Huaneng Power NoG2
5.75% 12/14 (SS) CNY1,000,000 163,763 0.2 Jiangxi Copper 1%
22/9/16-SerWW(SS) CNY1,000,000 143,942 0.1 Shanghai Intl VRN 5.05%
07/16 (SS) CNY1,500,000 254,664 0.3 Tsingtao Brewery 0.8%
14-SerWW (SS) CNY1,495,000 242,157 0.2 5,369,438 5.4 --------- ---- Total Listed/Quoted Investments 89,715,532 90.9 Other net assets 8,931,470 9.1 Net assets attributable to holders of
rredeemable units at 31 March 2014 98,647,002 100.0 Total investments, at cost 94,580,292 * An affiliate of the investment adviser of the Fund
Statement of Movements in Portfolio Holdings For the period ended 31 March 2014 (Unaudited) % holdings
of net assets 31.3.2014 30.9.2013 Listed/Quoted Investments Equities and Convertibles China 85.4 94.4 Hong Kong 0.1 0.2 Debt Securities China 5.4 4.3 Total Listed/Quoted Investments 90.9 98.9 Other net assets 9.1 1.1 Net assets attributable to holders of
rredeemable units 100.0 100.0
- 66 -

JJPMORGAN CHINA NEW GENERATION FUND SSemi--aannual report for the
pperiod ended 31 March 2014
SStatement of Financial Position As at 31 March 2014 (Unaudited) 31.3.2014 30.9.2013 US$ US$ Assets Cash at banks 13,623,199 9,120,131 Amounts due from brokers 363,417 531,112 Amounts receivable on allotment 46,078 497,220 Margin deposits 1,627,844 - Investments 89,715,532 112,495,468 Dividend and other accounts
receivable 13 8,840 Total assets 105,376,083 122,652,771 ---------- ---------- Liabilities Amounts due to brokers 125,143 1,745,673 Amounts payable on redemption 2,661,108 2,458,658 Provision for taxation [Note 5] 3,497,159 2,826,330 Other accounts payable 175,746 198,084 Deferred tax liabilities [Note 5] 269,925 1,686,898 Total liabilities 6,729,081 8,915,643 ---------- ---------- Net assets attributable to holders
oof redeemable units [Note 3] 98,647,002 113,737,128 Equity 98,647,002 113,737,128
Statement of Comprehensive Income For the period ended 31 March 2014 (Unaudited) 1.10.2013
to 31.3.2014
1.10.2012 to
31.3.2013 US$ US$ Income Net (losses)/gains on investments
and derivatives [Note 4] (20,335,614) 17,474,459 Interest on deposits 13,001 10,782 Dividend income 1,393 11,207 Net foreign currency exchange
(losses)/gains (182,486) 53,660 (20,503,706) 17,550,108 ---------- ---------- Expenses Management fee 986,306 1,031,816 Transaction costs 384,175 332,610 Safe custody and bank charges 48,151 38,860 Trustee's fee 23,315 24,063 Auditor's fee 8,776 8,573 Valuation fee 8,120 7,910 Registrar's fee 6,439 5,312 Printing and publication expenses 3,600 1,372 Legal and professional expenses 2,172 2,830 Other operating expenses 123 449 1,471,177 1,453,795 ---------- ---------- Net operating (loss)/profit (21,974,883) 16,096,313 Finance costs Interest paid - (51) (Loss)/profit before taxation (21,974,883) 16,096,262 Taxation [Note 5] 743,313 (1,684,417) (Decrease)/increase in net
aassets attributable to holdersof redeemable units and total comprehensive income (21,231,570) 14,411,845
The notes on pages 69 to 72 form part of these financial statements.
- 67 -
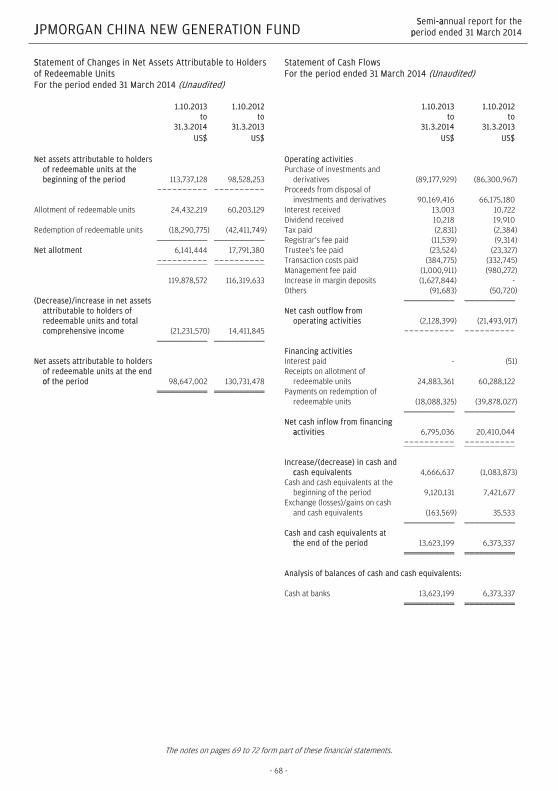
JJPMORGAN CHINA NEW GENERATION FUND SSemi--aannual report for the
pperiod ended 31 March 2014
SStatement of Changes in Net Assets Attributable to Holders of Redeemable Units For the period ended 31 March 2014 (Unaudited) 1.10.2013
to 31.3.2014
1.10.2012 to
31.3.2013 US$ US$ Net assets attributable to holders
of redeemable units at the beginning of the period 113,737,128 98,528,253
---------- ---------- Allotment of redeemable units 24,432,219 60,203,129 Redemption of redeemable units (18,290,775) (42,411,749) Net allotment 6,141,444 17,791,380 ---------- ---------- 119,878,572 116,319,633 (Decrease)/increase in net assets
attributable to holders of redeemable units and total comprehensive income (21,231,570) 14,411,845
Net assets attributable to holders
of redeemable units at the end oof the period 98,647,002 130,731,478
Statement of Cash Flows For the period ended 31 March 2014 (Unaudited) 1.10.2013
to 31.3.2014
1.10.2012 to
31.3.2013 US$ US$ Operating activities Purchase of investments and
derivatives (89,177,929) (86,300,967) Proceeds from disposal of
investments and derivatives 90,169,416 66,175,180 Interest received 13,003 10,722 Dividend received 10,218 19,910 Tax paid (2,831) (2,384) Registrar's fee paid (11,539) (9,314) Trustee's fee paid (23,524) (23,327) Transaction costs paid (384,775) (332,745) Management fee paid (1,000,911) (980,272) Increase in margin deposits (1,627,844) - Others (91,683) (50,720) Net cash outflow ffrom
operating activities (2,128,399) (21,493,917) ---------- ---------- Financing activities Interest paid - (51) Receipts on allotment of
redeemable units 24,883,361 60,288,122 Payments on redemption of
redeemable units (18,088,325) (39,878,027) Net cash inflow from financing
aactivities 6,795,036 20,410,044 ---------- ---------- Increase/(decrease) in cash and
ccash equivalents 4,666,637 (1,083,873) Cash and cash equivalents at the
beginning of the period 9,120,131 7,421,677 Exchange (losses)/gains on cash
and cash equivalents (163,569) 35,533 Cash and cash equivalents at
tthe end of the period 13,623,199 6,373,337 Analysis of balances of cash and cash equivalents: Cash at banks 13,623,199 6,373,337
The notes on pages 69 to 72 form part of these financial statements.
- 68 -

JJPMORGAN CHINA NEW GENERATION FUND SSemi--aannual report ffor the
pperiod ended 31 March 2014
NNotes to the Financial Statements
1 The Fund
JPMorgan China New Generation Fund (the "Fund") was established under a Trust Deed dated 21 May 2009, as amended, and is governed by the laws of Hong Kong. The Fund is authorized by the Securities and Futures Commission of Hong Kong.
The investment objective of the Fund is to provide investors with long-term capital growth by investing primarily in the People's Republic of China ("PRC") securities, including but not limited to A-Shares, of companies whose predominant business will benefit from, or is related to, growth of the domestic consumption sector in the PRC. The Fund may also invest in fixed income instruments denominated in Renminbi issued or listed in or outside the PRC, including debt securities issued by the central government of the PRC, any public or local authorities in the PRC, any quasi-governmental organizations or any corporates.
All unitholders' rights with regard to the convening, voting or otherwise acting at any meeting of unitholders are the same.
2 Summary of principal accounting policies
(a) Accounting policies of interim financial statements
The accounting policies and methods of computation used in the preparation of these unaudited condensed interim financial statements are consistent with those used in the annual financial statements for the year ended 30 September 2013.
(b) Investments and derivatives
Classification
The Fund classifies its investments and derivatives as financial assets or financial liabilities at fair value through profit or loss. These financial assets or financial liabilities are held-for-trading as they are acquired or incurred principally for the purpose of selling or repurchasing in the near term or short-term profit taking.
All derivatives are carried in assets when amounts are receivable by the Fund and in liabilities when amounts are payable by the Fund.
Recognition, derecognition and measurement
Purchases and sales of investments and derivatives are accounted for on the trade date basis. Investments and derivatives are initially recognized at fair value and are subsequently re-measured at fair value. Realized and unrealized gains and losses on investments and derivatives are recognized in the Statement of Comprehensive Income. Investments and derivatives are derecognized when the rights to receive cash flows from the investments and derivatives have expired or the Fund has transferred substantially all risks and rewards of ownership.
Fair value estimation
Fair value is the price that would be received to sell an asset or paid to transfer a liability in an orderly transaction between market participants at the measurement date. The fair value of financial assets and liabilities traded in active markets are based on last traded prices. Prior to 1 October 2012, investments that are listed or traded on an exchange and investments with prices quoted in over-the-counter markets or by market makers, are fair valued based on quoted "bid" prices on long investments and quoted "ask" prices on investments sold short. The Fund early adopted Hong Kong Financial Reporting Standard 13 “Fair Value Measurement” with effect from 1 October 2012, it changed its fair valuation input to utilize the last traded market price for both financial assets and financial liabilities where the last traded price falls within the bid-ask spread. When trading in the securities of an investee company is suspended, the investment is valued at the Manager's estimate of its fair value.
Debt securities are fair valued based on quoted prices inclusive of accrued interest.
Investments in collective investment schemes are stated at fair value based on the net asset value per unit of the respective funds as determined by the administrators of the relevant funds or stated at last traded prices if the collective investment schemes are listed or traded on an exchange.
Open future and swap contracts are valued at last traded prices for both long and short positions at the valuation date. The differences between the last traded prices and the contract prices are recognized in the Statement of Comprehensive Income.
Open option contracts are valued at last traded prices for both long and short positions at the valuation date. The differences between the last traded prices and the premium amounts/contract prices are recognized in the Statement of Comprehensive Income.
Forward foreign exchange contracts are valued at the forward rates ruling at the valuation date. The differences between the forward rates and the contract rates are recognized in the Statement of Comprehensive Income.
- 69 -

JJPMORGAN CHINA NEW GENERATION FUND SSemi--aannual report ffor the
pperiod ended 31 March 2014
((c) Foreign currency translation
Functional and presentation currency
The Fund has adopted United States dollar as its functional and presentation currency.
Transactions and balances
Foreign currency transactions are translated into the functional currency using the exchange rates prevailing at the dates of the transactions.
Foreign exchange gains and losses resulting from the settlement of such transactions and from the translation of assets and liabilities denominated in foreign currencies at year end exchange rates are recognized in the Statement of Comprehensive Income.
Foreign exchange gains and losses relating to cash and cash equivalents are presented in the Statement of Comprehensive Income within "Net foreign currency exchange gains/losses". Foreign exchange gains and losses relating to the financial assets and liabilities carried at fair value through profit or loss are presented in the Statement of Comprehensive Income within "Net gains/losses on investments and derivatives".
(d) Proceeds and payments on allotment and redemption of units
The net asset value per unit is computed for each dealing day. The price at which units are allotted or redeemed is calculated by reference to the net asset value per unit as at the close of business on the relevant dealing day in accordance with the provisions of the Fund's Trust Deed dated 21 May 2009, as amended, which may be different from the accounting policies stated in the financial statements.
(e) Taxation
Deferred income tax is provided, using the liability method, on temporary differences arising between the tax bases of assets and liabilities and their carrying amounts in the financial statements. However, the deferred income tax is not accounted for if it arises from initial recognition of an asset or liability in a transaction that at the time of the transaction affects neither accounting nor taxable profit or loss. Deferred income tax is determined using tax rates (and laws) that have been enacted or substantially enacted by the statement of financial position date and are expected to apply when the related deferred income tax asset is realized or the deferred income tax liability is settled.
Deferred income tax assets are recognized to the extent that it is probable that future taxable profit will be available against which the temporary differences can be utilized.
3 Number of units in issue and net assets attributable to holders of redeemable units (per unit)
Number of units in issue
31.3.2014 30.9.2013 Units Units Number of units in issue 11,613,511.495 11,043,744.691 US$ US$ Net assets attributable to holders of redeemable units 98,647,002 113,737,128 Net assets attributable to holders of redeemable units (per unit) 8.49 10.30
- 70 -

JJPMORGAN CHINA NEW GENERATION FUND SSemi--aannual report ffor the
pperiod ended 31 March 2014
44 Net (losses)/gains on investments and derivatives
1.10.2013
to 31.3.2014
1.10.2012 to
31.3.2013 US$ US$ Change in unrealized gains/losses in value of investments and derivatives (22,112,069) 14,495,370 Realized gains on sale of investments and derivatives 1,776,455 2,979,089 (20,335,614) 17,474,459
5 Taxation
The amount of taxation reversed/(charged) to the Statement of Comprehensive Income represents:
1.10.2013 to
31.3.2014
1.10.2012 To
31.3.2013 US$ US$ Withholding tax - Dividend and interest income (4,923) (4,783) Capital gains tax (668,736) (522,434) Deferred tax liabilities 1,416,972 (1,157,200) Taxation 743,313 (1,684,417)
The movement in deferred tax liabilities is as follows:
1.10.2013 To
31.3.2014
1.10.2012 To
30.9.2013 US$ US$ At the beginning of the period/year 1,686,898 184,441 Deferred tax liabilities (reversed)/charged to the Statement of Comprehensive Income (1,416,973) 1,502,457 At the end of the period/year 269,925 1,686,898
The movement in provision for taxation is as follows:
1.10.2013 To
31.3.2014
1.10.2012 To
30.9.2013 US$ US$ At the beginning of the period/year 2,826,330 1,467,845 Taxation charged to the Statement of Comprehensive Income 673,660 1,609,374 Tax paid (2,831) (250,889) At the end of the period/year 3,497,159 2,826,330
- 71 -

JJPMORGAN CHINA NEW GENERATION FUND SSemi--aannual report ffor the
pperiod ended 31 March 2014
The Fund held A-shares of PRC listed companies through the QFII quota of the Investment Manager and certain investment in other PRC securities. Tax provisioning of 10% is made for PRC sourced dividends and interest (except for Government bond interest which is tax exempt). The PRC taxation of gains on PRC securities is however presently unclear. Under current PRC tax law, a 10% tax may be payable on gains derived from the sale of PRC securities by foreign investors. Up to the issuance date of these financial statements, it is uncertain as to whether the State Administration of Taxation ("SAT") will collect this tax in respect of the gains on PRC securities. However, the Manager is of the view that it is possible that the SAT may start to collect this tax retrospectively from the launch of the Fund. The Manager has assessed the likelihood of such exposure and has made a provision of US$3,762,885 as at 31 March 2014 (30 September 2013: US$4,511,121) based on its best estimate of the potential taxation liability and the probability of such gains crystallizing. The Manager estimates that the potential taxation liability ranges from nil to US$3,762,885 as at 31 March 2014 (30 September 2013: from nil to US$4,511,121). However the Manager would like to highlight that there is a possibility that some or all of the tax provided as at 31 March 2014 for gains on PRC securities in the amount of US$3,762,885 (30 September 2013: US$4,511,121) will not be payable and may be released. The Manager is regularly monitoring the position.
No provision for Hong Kong profits tax has been made as the Fund was authorized as a collective investment scheme under Section 104 of the Securities and Futures Ordinance and is therefore exempt from profits tax under Section 26A(1A) of the Inland Revenue Ordinance.
Overseas withholding tax was charged on certain dividend income received, interest income received and capital gains derived during the period.
66 Soft commission arrangements
The Investment Manager has entered into soft commission arrangements with brokers under which certain goods and services used to support investment decision making are received by the Investment Manager. The Investment Manager does not make direct payment for these services but transacts an agreed amount of business with the brokers on behalf of the Fund. Commission is paid from the Fund on these transactions.
The goods and services must be of demonstrable benefit to the Fund and may include research and advisory services; economic and political analysis; portfolio analysis, including valuation and performance measurement; market analysis, data and quotation services, computer hardware and software incidental to the above goods and services; clearing and custodian services and investment-related publications.
7 Distribution
No distribution was made during the period (31 March 2013: nil).
- 72 -

JJPMORGAN CHINA PIONEER A--SSHARE FUND SSemi--aannual report for the
pperiod ended 31 March 2014
DDistributor Status The Fund has been certified by HMRC in the UK as a distributing fund in respect of the period from 1 January 1984 to 30 September 2010. The principal effect of this certification is that for unitholders resident or ordinarily resident in the UK for taxation purposes any gains accruing on the sale, redemption or other disposal of units during the period will be taxed in the UK as a capital gain and not as income. This treatment will continue under the new UK reporting fund regime provided the Fund does not invest more than 5% of its assets in other offshore funds which are not themselves reporting funds. There will be no need to formally apply for reporting fund status as the Fund is transparent for UK tax purposes and therefore considered out of scope of the requirements of this new regime. These are now known as “special category transparent offshore funds”. As noted, the Fund is transparent for UK income tax purposes and UK investors are subject to UK capital gains tax on disposal of their units. UK investors are subject to tax on their share of income of the Fund on an arising basis. Information has been provided to UK investors of the amount of their share of the underlying income, expenses and overseas tax suffered.
Investment Portfolio As at 31 March 2014 (Unaudited)
Holding
Fair value
US$
% of net
assets Listed/Quoted Investments (96.8%) (I) Equities and Warrants (93.9%) China (93.7%) Anhui Conch 'A' Wts 16/10/15
(BNP) 1,500,000 3,941,782 0.5 Anhui Heli 'A' 4,599,803 8,928,855 1.2 AVIC Capital Co 'A' 2,875,736 6,983,534 0.9 AviChina Industry & Tech 'H' 6,552,000 3,648,892 0.5 BBMG Corp 'H' 1,500,000 1,167,970 0.1 Beijing Enterprises Water
Group 7,088,000 4,961,659 0.7 Beijing Originwater
Technology 'A' 1,899,585 10,090,591 1.3 Beijing Yanjing Brewery 'A' 3,299,789 3,582,113 0.5 BesTV New Media 'A' 1,914,418 9,876,894 1.3 Bright Dairy & Food 'A' 999,913 2,695,166 0.3 Changchun High & New
Technology 'A' 664,484 10,291,060 1.4 Changyuan Group 'A' 4,059,786 6,600,906 0.9 China Cinda Asset
Management 'H' 6,600,000 3,743,691 0.5 China CITIC Bank 'H' 8,288,000 4,775,960 0.6 China Conch Venture Hldgs 848,500 2,163,623 0.3 China CYTS Tours Hldg Co 'A' 2,539,791 7,548,301 1.0 China Minsheng Banking 'A' 5,299,557 6,528,563 0.9 China Petroleum & Chemical
'A' 15,499,861 12,538,485 1.7 China Petroleum & Chemical
'H' 10,000,000 8,946,700 1.2
(Continued)
Holding
Fair value
US$
% of net
assets China Vanke 'A' 16,145,605 21,006,424 2.8 China Vanke 'A' Wts 02/09/14
(UBS) 1,999,932 2,602,034 0.3 China Vanke 'A' Wts 05/05/14
(BNP) 9,200,000 11,969,765 1.6 Chongqing Changan
Automobile 'A' 3,199,942 4,924,967 0.6 CITIC Securities Co 'A' 7,064,692 11,963,848 1.6 CSR Corp 'A' 3,899,862 2,828,623 0.4 Daqin Railway 'A' 8,099,784 8,701,601 1.1 Elec-Tech Intl 'A' 3,099,893 4,003,239 0.5 FAW Car 'A' 6,812,074 11,064,964 1.5 Fuyao Group Glass Industries
'A' 5,569,873 7,399,027 1.0 GCL Poly Energy Hldgs 10,533,000 3,802,012 0.5 Gemdale Corp 'A' 8,519,330 9,481,146 1.2 Goertek Inc 'A' 4,635,029 19,082,783 2.5 Great Wall Motor 'A' 889,508 4,644,954 0.6 Great Wall Motor 'H' 3,714,500 18,627,449 2.5 Gree Electric 'A' Wts
12/02/15(UBS) 3,689,505 16,614,046 2.2 Gree Electric Appliances 'A' 1,240,030 5,583,924 0.7 Haier Electronics Group 1,430,000 3,871,317 0.5 Haitong Securities 'H' 3,665,200 4,857,292 0.6 Hangzhou Hik-Vision Digital 'A' 7,968,965 22,363,853 3.0 Hangzhou Shunwang
Technology 'A' 514,780 4,239,608 0.6 Huaneng Renewables 'H' 17,150,000 5,814,646 0.8 Huayu Automotive Systems 'A' 5,989,761 9,247,621 1.2 Industrial Bank 'A' 5,890,483 9,018,559 1.2 Industrial Bk 'A' Wts
16/12/14(UBS) 4,619,742 7,073,005 0.9 Industrial Securities 'A' 1,999,956 2,791,833 0.4 Inner Mongo Yili 'A'
Wts1/11/16(ML) 435,000 2,506,602 0.3 Inner Mongolia Yili Ind 'A' 3,408,572 19,641,225 2.6 Jiangsu Hengrui Medicine 'A' 1,789,518 9,635,423 1.3 Jointown Pharmaceutical 'A' 1,699,768 4,373,800 0.6 Kingenta Ecological
Engineering 'A' 889,906 2,730,686 0.4 Kweichow Moutai 'A' 420,229 10,455,038 1.4 Leshi Internet Info & Tech 'A' 749,878 4,504,333 0.6 Nari Technology Development
'A' 4,431,515 10,063,202 1.3 Ping An Bank 'A' 9,649,629 16,713,815 2.2 Ping An Ins 'A' Wts 04/12/15
(BNP) 1,480,000 8,939,981 1.2 Ping An Ins 'A' Wts 22/05/15
(BNP) 1,690,000 10,208,491 1.3 Ping An Insurance (Group) 'A' 3,099,746 18,724,101 2.5 Poly Real Estate Group 'A' 7,099,930 8,689,364 1.1 SAIC Motor Corp 'A' 3,586,408 7,988,381 1.1 SAIC Motor Corp 'A' Wts 07/14
(UBS) 2,426,956 5,405,812 0.7 Sanan Optoelectronics 'A' 1,806,585 6,609,812 0.9 Shanghai Fosun
Pharmaceutical 'A' 5,139,633 16,556,264 2.2 Shanghai Jahwa United 'A' 1,969,491 10,677,315 1.4 Shanghai Jinfeng Wine 'A' 5,399,552 7,294,345 1.0 Shanghai Pudong Dev Bank
'A'** 11,423,071 17,856,586 2.4
- 73 -
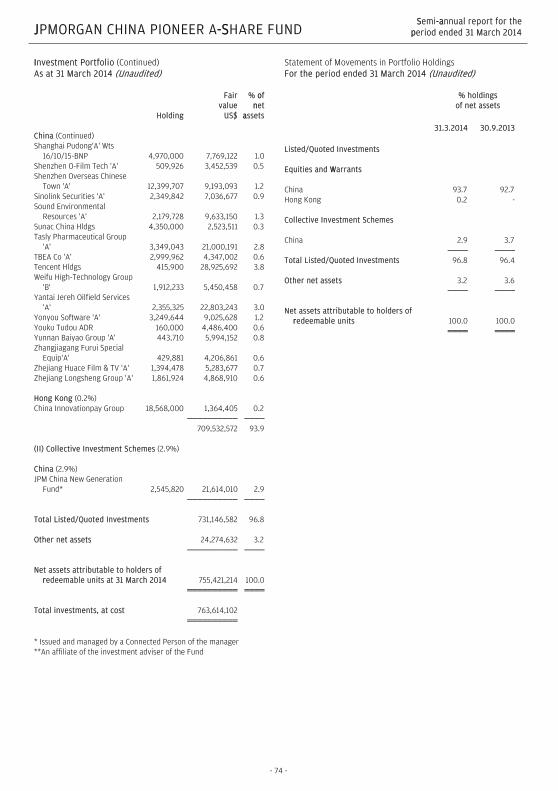
JJPMORGAN CHINA PIONEER A--SSHARE FUND SSemi--aannual report for the
pperiod ended 31 March 2014
IInvestment Portfolio (Continued) As at 31 March 2014 (Unaudited)
Holding
Fair value
US$
% oof nnet
aassets China (Continued) Shanghai Pudong'A' Wts
16/10/15-BNP 4,970,000 7,769,122 1.0 Shenzhen O-Film Tech 'A' 509,926 3,452,539 0.5 Shenzhen Overseas Chinese
Town 'A' 12,399,707 9,193,093 1.2 Sinolink Securities 'A' 2,349,842 7,036,677 0.9 Sound Environmental
Resources 'A' 2,179,728 9,633,150 1.3 Sunac China Hldgs 4,350,000 2,523,511 0.3 Tasly Pharmaceutical Group
'A' 3,349,043 21,000,191 2.8 TBEA Co 'A' 2,999,962 4,347,002 0.6 Tencent Hldgs 415,900 28,925,692 3.8 Weifu High-Technology Group
'B' 1,912,233 5,450,458 0.7 Yantai Jereh Oilfield Services
'A' 2,355,325 22,803,243 3.0 Yonyou Software 'A' 3,249,644 9,025,628 1.2 Youku Tudou ADR 160,000 4,486,400 0.6 Yunnan Baiyao Group 'A' 443,710 5,994,152 0.8 Zhangjiagang Furui Special
Equip'A' 429,881 4,206,861 0.6 Zhejiang Huace Film & TV 'A' 1,394,478 5,283,677 0.7 Zhejiang Longsheng Group 'A' 1,861,924 4,868,910 0.6 Hong Kong (0.2%) China Innovationpay Group 18,568,000 1,364,405 0.2 709,532,572 93.9 (II) Collective Investment Schemes (2.9%) China (2.9%) JPM China New Generation
Fund* 2,545,820 21,614,010 2.9 Total Listed/Quoted Investments 731,146,582 96.8 Other net assets 24,274,632 3.2 Net assets attributable to holders of
rredeemable units at 31 March 2014 755,421,214 100.0 Total investments, at cost 763,614,102 * Issued and managed by a Connected Person of the manager **An affiliate of the investment adviser of the Fund
Statement of Movements in Portfolio Holdings For the period ended 31 March 2014 (Unaudited) % holdings
of net assets 31.3.2014 30.9.2013 Listed/Quoted Investments Equities and WWarrants China 93.7 92.7 Hong Kong 0.2 - Collective Investment Schemes China 2.9 3.7 Total Listed/Quoted Investments 96.8 96.4 Other net assets 3.2 3.6 Net assets attributable to holders of
rredeemable units 100.0 100.0
- 74 -

JJPMORGAN CHINA PIONEER A--SSHARE FUND SSemi--aannual report for the
pperiod ended 31 March 2014
SStatement of Financial Position As at 31 March 2014 (Unaudited) 31.3.2014 30.9.2013 US$ US$ Assets Cash at banks 138,215,548 99,072,570 Amounts due from brokers 2,014,813 14,601,224 Amounts receivable on allotment 3,203,715 14,176,751 Margin deposits 8,178,150 - Investments 731,146,582 841,018,433 Dividend and other accounts
receivable 110 48,268 Total assets 882,758,918 968,917,246 ---------- ---------- Liabilities Amounts due to brokers 3,416,548 17,511,862 Amounts payable on redemption 56,726,534 6,123,506 Provision for taxation [Note 5] 64,352,252 61,630,567 Other accounts payable 1,227,680 1,297,800 Deferred tax liabilities [Note 5] 1,614,690 9,710,513 Total liabilities 127,337,704 96,274,248 ---------- ---------- Net assets attributable to holders
oof redeemable units [Note 3] 755,421,214 872,642,998 Equity 755,421,214 872,642,998
Statement of Comprehensive Income For the period ended 31 March 2014 (Unaudited) 1.10.2013
to 31.3.2014
1.10.2012 to
31.3.2013 US$ US$ Income Net (losses)/gains on investments
and derivatives [Note 4] (135,268,406) 104,800,229 Interest on deposits 177,904 115,071 Dividend income 60,339 126,155 Net foreign currency exchange
(losses)/gains (1,675,271) 587,857 Other income 119 - (136,705,315) 105,629,312 ---------- ---------- Expenses Management fee 7,399,577 6,716,603 Transaction costs 2,491,399 1,668,151 Safe custody and bank charges 219,637 171,714 Trustee's fee 118,012 108,578 Registrar's fee 33,185 33,106 Auditor's fee 10,521 10,159 Printing and publication expenses 8,243 3,989 Valuation fee 8,120 7,910 Legal and professional expenses 3,946 1,940 Other operating expenses 5,236 4,995 10,297,876 8,727,145 ---------- ---------- (Loss)/profit before taxation (147,003,191) 96,902,167 Taxation [Note 5] 5,353,084 (8,667,479) (Decrease)/increase in net
aassets attributable to holdersof redeemable units and total comprehensive income (141,650,107) 88,234,688
The notes on pages 77 to 80 form part of these financial statements.
- 75 -

JJPMORGAN CHINA PIONEER A--SSHARE FUND SSemi--aannual report for the
pperiod ended 31 March 2014
SStatement of Changes in Net Assets Attributable to Holders of Redeemable Units For the period ended 31 March 2014 (Unaudited) 1.10.2013
to 31.3.2014
1.10.2012 to
31.3.2013 US$ US$ Net assets attributable to holders
of redeemable units at the beginning of the period 872,642,998 661,807,687
---------- ---------- Allotment of redeemable units 174,363,569 136,372,344 Redemption of redeemable units (149,935,246) (85,600,280) Net allotment 24,428,323 50,772,064 ---------- ---------- 897,071,321 712,579,751 (Decrease)/increase in net assets
attributable to holders of redeemable units and total comprehensive income (141,650,107) 88,234,688
Net assets aattributable to holders
of redeemable units at the end oof the period 755,421,214 800,814,439
Statement of Cash Flows For the period ended 31 March 2014 (Unaudited) 1.10.2013
to 31.3.2014
1.10.2012 to
31.3.2013 US$ US$ Operating activities Purchase of investments and
derivatives (674,537,334) (450,749,772) Proceeds from disposal of
investments and derivatives 647,670,676 391,118,248 Interest received 177,960 115,212 Dividend received 108,440 228,868 Tax paid (21,054) (9,782) Registrar's fee paid (65,950) (56,882) Trustee's fee paid (118,646) (104,855) Transaction costs paid (2,530,788) (1,689,266) Management fee paid (7,429,706) (6,462,164) Increase in margin deposits (8,178,150) - Others (703,578) (290,009) Net cash outflow from
ooperating activities (45,628,130) (67,900,402) ---------- ---------- Financing activities Receipts on allotment of
redeemable units 185,336,605 140,840,740 Payments on redemption of
redeemable units (99,332,218) (80,898,636) Net cash inflow from financing
aactivities 86,004,387 59,942,104 ---------- ---------- Increase/(decrease) in cash and
ccash equivalents 40,376,257 (7,958,298) Cash and cash equivalents at the
beginning of the period 99,072,570 79,954,054 Exchange (losses)/gains on cash
and cash equivalents (1,233,279) 657,842 Cash and cash equivalents at
tthe end of the period 138,215,548 72,653,598 Analysis of balances of cash and cash equivalents: Cash at banks 138,215,548 72,653,598
The notes on pages 77 to 80 form part of these financial statements.
- 76 -

JJPMORGAN CHINA PIONEER A--SSHARE FUND SSemi--aannual report for the
pperiod ended 31 March 2014
NNotes to the Financial Statements
1 The Fund
JPMorgan China Pioneer A-Share Fund (the "Fund") was established under a Trust Deed dated 14 June 2006, as amended, and is governed by the laws of Hong Kong. The Fund is authorized by the Securities and Futures Commission of Hong Kong ("SFC").
The investment objective and policy of the Fund is to achieve long-term capital growth by investing primarily in the People's Republic of China ("PRC") securities, including but not limited to A-Shares.
All unitholders' rights with regard to the convening, voting or otherwise acting at any meeting of unitholders are the same.
2 Summary of principal accounting policies
(a) Accounting policies of interim financial statements
The accounting policies and methods of computation used in the preparation of these unaudited condensed interim financial statements are consistent with those used in the annual financial statements for the year ended 30 September 2013.
(b) Investments and derivatives
Classification
The Fund classifies its investments and derivatives as financial assets or financial liabilities at fair value through profit or loss. These financial assets or financial liabilities are held-for-trading as they are acquired or incurred principally for the purpose of selling or repurchasing in the near term or short-term profit taking.
All derivatives are carried in assets when amounts are receivable by the Fund and in liabilities when amounts are payable by the Fund.
Recognition, derecognition and measurement
Purchases and sales of investments and derivatives are accounted for on the trade date basis. Investments and derivatives are initially recognized at fair value and are subsequently re-measured at fair value. Realized and unrealized gains and losses on investments and derivatives are recognized in the Statement of Comprehensive Income. Investments and derivatives are derecognized when the rights to receive cash flows from the investments and derivatives have expired or the Fund has transferred substantially all risks and rewards of ownership.
Fair value estimation
Fair value is the price that would be received to sell an asset or paid to transfer a liability in an orderly transaction between market participants at the measurement date. The fair value of financial assets and liabilities traded in active markets are based on last traded prices. Prior to 1 October 2012, investments that are listed or traded on an exchange and investments with prices quoted in over-the-counter markets or by market makers, are fair valued based on quoted "bid" prices on long investments and quoted "ask" prices on investments sold short. The Fund early adopted Hong Kong Financial Reporting Standard 13, "Fair Value Measurement", with effect from 1 October 2012, it changed its fair valuation input to utilize the last traded market price for both financial assets and financial liabilities where the last traded price falls within the bid-ask spread. When trading in the securities of an investee company is suspended, the investment is valued at the Manager's estimate of its fair value.
Debt securities are fair valued based on quoted prices inclusive of accrued interest.
Investments in collective investment schemes are stated at fair value based on the net asset value per unit of the respective funds as determined by the administrators of the relevant funds or stated at last traded prices if the collective investment schemes are listed or traded on an exchange.
Open future and swap contracts are valued at last traded prices for both long and short positions at the valuation date. The differences between the last traded prices and the contract prices are recognized in the Statement of Comprehensive Income.
Open option contracts are valued at last traded prices for both long and short positions at the valuation date. The differences between the last traded prices and the premium amounts/contract prices are recognized in the Statement of Comprehensive Income.
Forward foreign exchange contracts are valued at the forward rates ruling at the valuation date. The differences between the forward rates and the contract rates are recognized in the Statement of Comprehensive Income.
- 77 -

JJPMORGAN CHINA PIONEER A--SSHARE FUND SSemi--aannual report for the
pperiod ended 31 March 2014
((c) Foreign currency translation
Functional and presentation currency
The Fund has adopted United States dollar as its functional and presentation currency.
Transactions and balances
Foreign currency transactions are translated into the functional currency using the exchange rates prevailing at the dates of the transactions.
Foreign exchange gains and losses resulting from the settlement of such transactions and from the translation of assets and liabilities denominated in foreign currencies at period/year end exchange rates are recognized in the Statement of Comprehensive Income.
Foreign exchange gains and losses relating to cash and cash equivalents are presented in the Statement of Comprehensive Income within "Net foreign currency exchange gains/losses". Foreign exchange gains and losses relating to the financial assets and liabilities carried at fair value through profit or loss are presented in the Statement of Comprehensive Income within "Net gains/losses on investments and derivatives".
(d) Proceeds and payments on allotment and redemption of units
The net asset value per unit is computed for each dealing day. The price at which units are allotted or redeemed is calculated by reference to the net asset value per unit as at the close of business on the relevant dealing day in accordance with the provisions of the Fund's Trust Deed dated 14 June 2006, as amended, which may be different from the accounting policies stated in the financial statements.
(e) Taxation
Deferred income tax is provided, using the liability method, on temporary differences arising between the tax bases of assets and liabilities and their carrying amounts in the financial statements. However, the deferred income tax is not accounted for if it arises from initial recognition of an asset or liability in a transaction that at the time of the transaction affects neither accounting nor taxable profit or loss. Deferred income tax is determined using tax rates (and laws) that have been enacted or substantially enacted by the statement of financial position date and are expected to apply when the related deferred income tax asset is realized or the deferred income tax liability is settled.
Deferred income tax assets are recognized to the extent that it is probable that future taxable profit will be available against which the temporary differences can be utilized.
3 Number of units in issue and net assets attributable to holders of redeemable units (per unit)
31.3.2014 30.9.2013 Units Units Number of units in issue 33,617,617.169 32,912,256.636 US$ US$ Net assets attributable to holders of redeemable units 755,421,214 872,642,998 Net assets attributable to holders of redeemable units (per unit) 22.47 26.51
- 78 -

JJPMORGAN CHINA PIONEER A--SSHARE FUND SSemi--aannual report for the
pperiod ended 31 March 2014
44 Net (losses)/gains on investments and derivatives
1.10.2013
to 31.3.2014
1.10.2012 to
31.3.2013 US$ US$ Change in unrealized gains/losses in value of investments and derivatives (155,123,777) 99,748,561 Realized gains on sale of investments and derivatives 19,855,371 5,051,668 (135,268,406) 104,800,229
5 Taxation
The amount of taxation reversed/(charged) to the Statement of Comprehensive Income represents:
1.10.2013 to
31.3.2014
1.10.2012 to
31.3.2013 US$ US$ Withholding tax - Dividend and interest income (19,918) (10,598) Capital gains tax (2,722,821) (3,186,420) Deferred tax liabilities 8,095,823 (5,470,461) Taxation 5,353,084 (8,667,479)
The movement in deferred tax liabilities is as follows:
1.10.2013 to
31.3.2014
1.10.2012 to
30.9.2013 US$ US$ At the beginning of the period/year 9,710,513 2,119,791 Deferred tax liabilities (reversed)/charged to the Statement of Comprehensive Income (8,095,823) 7,590,722 At the end of the period/year 1,614,690 9,710,513
The movement in provision for taxation is as follows:
1.10.2013 to
31.3.2014
1.10.2012 to
30.9.2013 US$ US$ At the beginning of the period/year 61,630,567 54,573,272 Taxation charged to the Statement of Comprehensive Income 2,742,739 8,521,533 Tax paid (21,054) (1,464,238) At the end of the period/year 64,352,252 61,630,567
(a) The Fund held A-shares of PRC listed companies through the QFII quota of the Investment Manager and certain investment in other PRC securities. Tax provisioning of 10% is made for PRC sourced dividends and interest (except for Government bond interest, if any, which is tax exempt). The PRC taxation of gains on PRC securities is however presently unclear. Under current PRC tax law, a 10% tax may be payable on gains derived from the sale of PRC securities by foreign investors. Up to the issuance date of these financial statements, it is uncertain as to whether the State Administration of Taxation ("SAT") will collect this tax in respect of the gains on PRC securities. However, the Manager is of the view that it is possible that the SAT may start to collect this tax retrospectively from the launch of the Fund. The Manager has assessed the likelihood of such exposure and has made a provision of US$65,894,447 as at 31 March 2014 (30 September 2013: US$71,267,448) based on its best estimate of the potential taxation liability and the probability of such gains crystallizing. The Manager estimates that the potential taxation liability ranges from nil to US$65,894,447 as at 31 March 2014 (30
- 79 -

JJPMORGAN CHINA PIONEER A--SSHARE FUND SSemi--aannual report for the
pperiod ended 31 March 2014
September 2013: from nil to US$71,267,448). However the Manager would like to highlight that there is a possibility that some or all of the tax provided as at 31 March 2014 for gains on PRC securities in the amount of US$65,894,447 (30 September 2013: US$71,267,448) will not be payable and may be released. The Manager is regularly monitoring the position.
(b) No provision for Hong Kong profits tax has been made as the Fund was authorized as a collective investment scheme under Section 104 of the Securities and Futures Ordinance and is therefore exempt from profits tax under Section 26A(1A) of the Inland Revenue Ordinance.
Overseas withholding tax was charged on certain dividend income received, interest income received and capital gains derived during the period.
6 Soft commission arrangements
The Investment Manager has entered into soft commission arrangements with brokers under which certain goods and services used to support investment decision making are received by the Investment Manager. The Investment Manager does not make direct payment for these services but transacts an agreed amount of business with the brokers on behalf of the Fund. Commission is paid from the Fund on these transactions.
The goods and services must be of demonstrable benefit to the Fund and may include research and advisory services; economic and political analysis; portfolio analysis, including valuation and performance measurement; market analysis, data and quotation services, computer hardware and software incidental to the above goods and services; clearing and custodian services and investment-related publications.
7 Distribution
No distribution was made during the period (31 March 2013: nil).
- 80 -

JJPMORGAN EASTERN FUND SSemi--aannual report for the
pperiod ended 31 March 2014
DDistributor Status The Fund has been certified by HMRC in the UK as a distributing fund in respect of the period from 1 January 1984 to 30 September 2010. The principal effect of this certification is that for unitholders resident or ordinarily resident in the UK for taxation purposes any gains accruing on the sale, redemption or other disposal of units during the period will be taxed in the UK as a capital gain and not as income. This treatment will continue under the new UK reporting fund regime provided the Fund does not invest more than 5% of its assets in other offshore funds which are not themselves reporting funds. There will be no need to formally apply for reporting fund status as the Fund is transparent for UK tax purposes and therefore considered out of scope of the requirements of this new regime. These are now known as “special category transparent offshore funds”. As noted, the Fund is transparent for UK income tax purposes and UK investors are subject to UK capital gains tax on disposal of their units. UK investors are subject to tax on their share of income of the Fund on an arising basis. Information has been provided to UK investors of the amount of their share of the underlying income, expenses and overseas tax suffered.
Investment Portfolio As at 31 March 2014 (Unaudited)
Holding
Fair value
US$
% of net
assets Listed/Quoted Investments (103.9%) Equities (103.9%) China (33.1%) AAC Technologies Hldgs 710,000 3,674,915 1.3 Agricultural Bank of China 'H' 10,859,000 4,731,621 1.6 Beijing Enterprises Water
Group 4,782,000 3,347,440 1.2 China Cinda Asset
Management 'H' 6,333,000 3,592,242 1.2 China Conch Venture Hldgs 930,000 2,371,443 0.8 China Construction Bank 'H' 12,627,270 8,839,195 3.0 China Eastern Airlines 'H' 5,374,000 1,787,396 0.6 China Everbright Intl 1,897,000 2,597,139 0.9 China Life Insurance 'H' 1,277,000 3,613,506 1.2 China Longyuan Power Group
'H' 2,072,000 2,086,144 0.7 China Minsheng Banking 'H' 3,042,500 3,051,502 1.1 China Oilfield Services 'H' 1,428,000 3,350,449 1.2 China Overseas Land &
Investment 1,470,000 3,809,051 1.3 China Petroleum & Chemical
'H' 6,395,600 5,721,952 2.0 China Resources Gas Group 1,188,000 3,782,830 1.3 China Vanke 'B' 2,477,670 4,120,373 1.4 Chongqing Changan
Automobile 'B' 1,132,100 1,879,767 0.6 CNOOC Ltd 1,496,000 2,248,711 0.8 E-House (China) Hldgs ADR 115,694 1,398,740 0.5 Great Wall Motor 'H' 538,000 2,697,959 0.9
(Continued)
Holding
Fair value
US$
% of net
assets Huaneng Renewables 'H' 5,120,000 1,735,918 0.6 Ping An Insurance (Group) 'H' 712,500 5,906,079 2.0 Sino Biopharmaceutical 1,464,000 1,247,515 0.4 Tencent Hldgs 180,000 12,518,934 4.3 Tingyi (Cayman Islands) Hldgs 1,046,000 3,000,303 1.0 Want Want China Hldgs 2,358,000 3,520,106 1.2 Hong Kong (11.7%) AIA Group 1,740,800 8,258,480 2.8 Cheung Kong (Hldgs) 315,000 5,222,217 1.8 Galaxy Entertainment Group 599,000 5,208,494 1.8 Hutchison Whampoa 347,000 4,594,131 1.6 Lifestyle Intl Hldgs 1,381,000 2,809,339 1.0 MGM China Hldgs 591,200 2,084,468 0.7 Orient Overseas (Intl) 513,500 2,359,953 0.8 Sands China 476,800 3,561,993 1.2 Indonesia (2.3%) Bank Central Asia 3,273,000 3,054,032 1.0 Bank Mandiri (Persero) 1,969,300 1,638,194 0.6 Telekomunikasi Indonesia 'B' 11,000,000 2,144,806 0.7 Japan (3.4%) Mazda Motor 644,000 2,864,029 1.0 Mitsubishi UFJ Financial Group 1,262,000 6,948,138 2.4 Korea (23.3%) Daum Communications 10,470 769,180 0.3 Hyundai Heavy Industries 26,200 5,193,480 1.8 Hyundai Motor 10,500 2,475,927 0.8 KB Financial Group 190,000 6,648,974 2.3 KIA Motors 53,600 2,986,030 1.0 Korea Investment Hldgs 84,000 2,904,035 1.0 LG Chem 17,800 4,247,452 1.5 POSCO 41,500 11,540,232 3.9 Samsung Electronics 16,250 20,502,371 7.0 Samsung Securities 85,000 3,118,277 1.1 Shinhan Financial Group 69,900 3,086,383 1.1 SK Innovation 38,500 4,412,607 1.5 Malaysia (2.5%) SapuraKencana Petroleum 2,637,600 3,634,727 1.2 Tenaga Nasional 1,019,600 3,734,318 1.3 Philippines (2.4%) BDO Unibank 1,056,210 2,001,959 0.7 Cosco Capital 16,729,300 3,543,948 1.2 Robinsons Retail Hldgs 1,000,000 1,516,334 0.5 Singapore (4.1%) CapitaMalls Asia 2,000,000 2,846,805 1.0 DBS Group Hldgs 476,000 6,120,568 2.1 Global Logistics Properties 1,382,000 2,912,250 1.0 Taiwan (17.1%) Advanced Semiconductor Eng 3,655,000 4,056,777 1.4 Asustek Computer 198,000 1,960,332 0.7 China Life Insurance 3,116,960 2,860,817 1.0 China Steel Chemical 472,000 2,696,921 0.9 Delta Electronics 664,000 4,099,237 1.4 E Sun Financial Hldg 3,097,000 1,866,183 0.6
- 81 -

JJPMORGAN EASTERN FUND SSemi--aannual report for the
pperiod ended 31 March 2014
IInvestment Portfolio (Continued) As at 31 March 2014 (Unaudited)
Holding
Fair value
US$
% of net
assets Taiwan (Continued) Huaku Development 294,000 720,217 0.2 Innolux Corp 4,542,000 1,558,621 0.5 MediaTek Inc 291,000 4,295,362 1.5 Merida Industry 271,000 1,797,619 0.6 President Chain Store 309,000 2,181,594 0.8 Quanta Computer 549,000 1,478,302 0.5 Ruentex Development 1,031,777 1,887,201 0.6 Sino-American Silicon
Products 972,000 1,701,259 0.6 St Shine Optical 67,000 1,493,900 0.5 Taiwan Semiconductor Mfg 3,589,000 13,965,898 4.8 United Microelectronics 3,275,000 1,381,947 0.5 Thailand (4.0%) Charoen Pokphand Foods (F) 1,278,900 1,103,859 0.4 Kasikornbank Public Co NVDR 470,100 2,579,464 0.9 PTT Public Co (F) 459,600 4,236,141 1.4 Siam Cement NVDR 286,800 3,695,512 1.3 Total Listed/Quoted Investments 303,192,524 103.9 Other net liabilities (11,409,452) (3.9) Net assets attributable to holders of
rredeemable units at 31 March 2014 291,783,072 100.0 Total investments, at cost 269,283,732
Statement of Movements in Portfolio Holdings For the period ended 31 March 2014 (Unaudited) % holdings
of net assets 31.3.2014 30.9.2013 Listed/Quoted Investments Equities China 33.1 31.2 Korea 23.3 21.5 Taiwan 17.1 14.8 Hong Kong 11.7 18.0 Singapore 4.1 4.1 Thailand 4.0 6.3 Japan 3.4 - Malaysia 2.5 1.8 Philippines 2.4 1.1 Indonesia 2.3 1.3 Total Listed/Quoted Investments 103.9 100.1 Other net liabilities (3.9) (0.1) Net assets attributable to holders of
rredeemable units 100.0 100.0
- 82 -

JJPMORGAN EASTERN FUND SSemi--aannual report for the
pperiod ended 31 March 2014
SStatement of Financial Position As at 31 March 2014 (Unaudited) 31.3.2014 30.9.2013 US$ US$ Assets Cash at banks 3,147,216 1,637,601 Amounts due from brokers 2,029,118 1,379,702 Amounts receivable on allotment 423,464 16,796,082 Investments 303,192,524 323,517,910 Dividend and other accounts
receivable 935,460 294,066 Total assets 309,727,782 343,625,361 ---------- ---------- Liabilities Short term bank loans - unsecured 13,201,465 6,400,300 Amounts due to brokers 1,444,548 3,476,099 Amounts payable on redemption 2,899,885 9,971,242 Other accounts payable 398,812 531,103 Total liabilities 17,944,710 20,378,744 ---------- ---------- Net assets attributable to holders
oof redeemable units [Note 3] 291,783,072 323,246,617 Equity 291,783,072 323,246,617
Statement of Comprehensive Income For the period ended 31 March 2014 (Unaudited) 1.10.2013
to 31.3.2014
1.10.2012 to
31.3.2013 US$ US$ Income Net (losses)/gains on investments
and derivatives [Note 4] (182,296) 34,358,768 Dividend income 1,564,894 1,348,263 Interest on deposits 108 365 Net foreign currency exchange
losses (129,204) (251,154) Other income - 2,286 1,253,502 35,458,528 ---------- ---------- Expenses Management fee 2,334,566 2,519,342 Transaction costs 810,849 944,895 Registrar's fee 60,475 57,723 Trustee's fee 48,157 52,218 Safe custody and bank charges 46,598 47,567 Auditor's fee 9,524 9,416 Valuation fee 8,610 8,330 Printing and publication expenses 7,091 1,979 Legal and professional expenses 2,640 2,140 Other operating expenses 2,148 4,339 3,330,658 3,647,949 ---------- ---------- Net operating (loss)/profit (2,077,156) 31,810,579 Finance costs Interest paid (40,240) (50,287) (Loss)/profit before taxation (2,117,396) 31,760,292 Taxation (237,228) (218,110) (Decrease)/increase in net
aassets attributable to holdersof redeemable units and total comprehensive income (2,354,624) 31,542,182
The notes on pages 85 to 87 form part of these financial statements.
- 83 -

JJPMORGAN EASTERN FUND SSemi--aannual report for the
pperiod ended 31 March 2014
SStatement of Changes in Net Assets Attributable to Holders of Redeemable Units For the period ended 31 March 2014 (Unaudited) 1.10.2013
to 31.3.2014
1.10.2012 to
31.3.2013 US$ US$ Net assets attributable to holders
of redeemable units at the beginning of the period 323,246,617 339,061,729
---------- ---------- Allotment of redeemable units 43,916,497 20,694,115 Redemption of redeemable units (73,025,418) (50,198,606) Net redemption (29,108,921) (29,504,491) ---------- ---------- 294,137,696 309,557,238 (Decrease)/increase in net assets
attributable to holders of redeemable units and total comprehensive income (2,354,624) 31,542,182
Net assets attributable to holders
oof redeemable units at the end of the period 291,783,072 341,099,420
Statement of Cash Flows For the period ended 31 March 2014 (Unaudited) 1.10.2013
to 31.3.2014
1.10.2012 to
31.3.2013 US$ US$ Operating activities Purchase of investments and
derivatives (151,825,321) (180,384,694) Proceeds from disposal of
investments and derivatives 169,290,328 196,150,581 Dividend received 923,064 959,698 Interest received 115 353 Trustee's fee paid (48,808) (51,931) Registrar's fee paid (111,347) (108,168) Tax paid (255,354) (218,110) Transaction costs paid (818,897) (952,247) Management fee paid (2,373,562) (2,514,185) Others (843,558) (333,082) Net cash inflow from operating
aactivities 13,936,660 12,548,215 ---------- ---------- Financing aactivities Interest paid (40,125) (49,087) Receipts on allotment of
redeemable units 60,289,115 21,422,349 Payments on redemption of
redeemable units (80,096,775) (49,311,852) Net cash outflow from
ffinancing activities (19,847,785) (27,938,590) ---------- ---------- Decrease in cash and cash
eequivalents (5,911,125) (15,390,375) Cash and cash equivalents at the
beginning of the period (4,762,699) 4,301,253 Exchange gains/(losses) on cash
and cash equivalents 619,575 (10,932) Cash and cash equivalents at
tthe end of the period (10,054,249) (11,100,054) Analysis of balances of cash and cash equivalents: Cash at banks 3,147,216 2,398,933 Short term bank loans -
unsecured (13,201,465) (13,498,987) (10,054,249) (11,100,054)
The notes on pages 85 to 87 form part of these financial statements.
- 84 -

JJPMORGAN EASTERN FUND SSemi--aannual report for the
pperiod ended 31 March 2014
NNotes to the Financial Statements
1 The Fund
JPMorgan Eastern Fund (the "Fund") was established under a Trust Deed dated 20 January 1971, as amended, and is governed by the laws of Hong Kong. The Fund is authorized by the Securities and Futures Commission of Hong Kong.
The investment objective of the Fund is to provide investors with long-term capital growth by investing primarily in the securities of companies in the Asia-Pacific region, excluding Japan and Australia except the Manager may, from time to time, invest in Japan and Australia when appropriate investment opportunities arise.
Pursuant to the Supplemental Trust Deed dated 4 January 2013, the Manager may decide to issue separate classes (each a "Class") whose assets will be commonly invested but where a specific fee structure, currency or distribution policy may be applied. Each Class may have a different charging structure with the result that the net asset value attributable to each Class may differ.
All unitholders' rights with regard to the convening, voting or otherwise acting at any meeting of unitholders are the same.
2 Summary of principal accounting policies
(a) Accounting policies of interim financial statements
The accounting policies and methods of computation used in the preparation of these unaudited condensed interim financial statements are consistent with those used in the annual financial statements for the year ended 30 September 2013.
(b) Investments and derivatives
Classification
The Fund classifies its investments and derivatives as financial assets or financial liabilities at fair value through profit or loss. These financial assets or financial liabilities are held-for-trading as they are acquired or incurred principally for the purpose of selling or repurchasing in the near term or short-term profit taking.
All derivatives are carried in assets when amounts are receivable by the Fund and in liabilities when amounts are payable by the Fund.
The Fund makes short sales in which a borrowed security is sold in anticipation of a decline in the market value of that security, or it may use short sales for various arbitrage transactions. Short sales are classified as financial liabilities at fair value through profit or loss.
Recognition, derecognition and measurement
Purchases and sales of investments and derivatives are accounted for on the trade date basis. Investments and derivatives are initially recognized at fair value and are subsequently re-measured at fair value. Realized and unrealized gains and losses on investments and derivatives are recognized in the Statement of Comprehensive Income. Investments and derivatives are derecognized when the rights to receive cash flows from the investments and derivatives have expired or the Fund has transferred substantially all risks and rewards of ownership.
Fair value estimation
Fair value is the price that would be received to sell an asset or paid to transfer a liability in an orderly transaction between market participants at the measurement date. The fair value of financial assets and liabilities traded in active markets are based on last traded prices. Prior to 1 October 2012, investments that are listed or traded on an exchange and investments with prices quoted in over-the-counter markets or by market makers, are fair valued based on quoted "bid" prices on long investments and quoted "ask" prices on investments sold short. The Fund early adopted Hong Kong Financial Reporting Standard 13, "Fair Value Measurement", with effect from 1 October 2012, it changed its fair valuation input to utilize the last traded market price for both financial assets and financial liabilities where the last traded price falls within the bid-ask spread. When trading in the securities of an investee company is suspended, the investment is valued at the Manager's estimate of its fair value.
Debt securities are fair valued based on quoted prices inclusive of accrued interest.
Investments in collective investment schemes are stated at fair value based on the net asset value per unit of the respective funds as determined by the administrators of the relevant funds or stated at last traded prices if the collective investment schemes are listed or traded on an exchange.
Open future and swap contracts are valued at last traded prices for both long and short positions at the valuation date. The differences between the last traded prices and the contract prices are recognized in the Statement of Comprehensive Income.
- 85 -
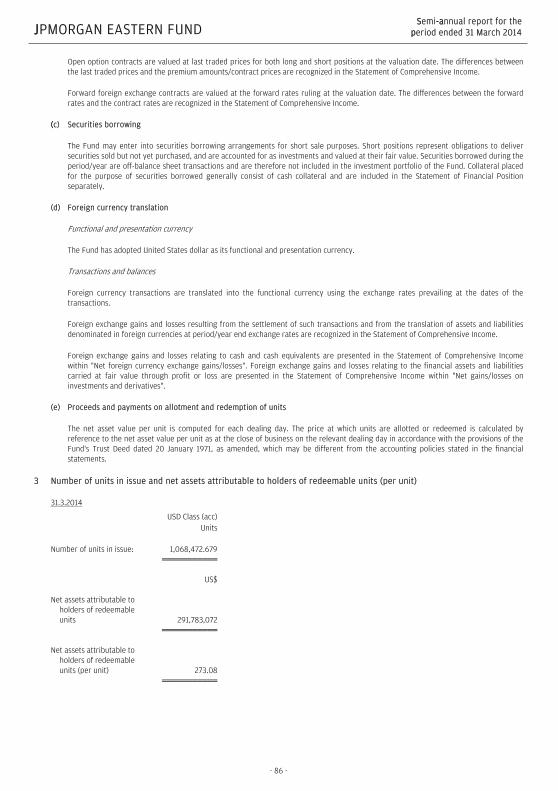
JJPMORGAN EASTERN FUND SSemi--aannual report for the
pperiod ended 31 March 2014
Open option contracts are valued at last traded prices for both long and short positions at the valuation date. The differences between the last traded prices and the premium amounts/contract prices are recognized in the Statement of Comprehensive Income.
Forward foreign exchange contracts are valued at the forward rates ruling at the valuation date. The differences between the forward rates and the contract rates are recognized in the Statement of Comprehensive Income.
((c) Securities borrowing
The Fund may enter into securities borrowing arrangements for short sale purposes. Short positions represent obligations to deliver securities sold but not yet purchased, and are accounted for as investments and valued at their fair value. Securities borrowed during the period/year are off-balance sheet transactions and are therefore not included in the investment portfolio of the Fund. Collateral placed for the purpose of securities borrowed generally consist of cash collateral and are included in the Statement of Financial Position separately.
(d) Foreign currency translation
Functional and presentation currency
The Fund has adopted United States dollar as its functional and presentation currency.
Transactions and balances
Foreign currency transactions are translated into the functional currency using the exchange rates prevailing at the dates of the transactions.
Foreign exchange gains and losses resulting from the settlement of such transactions and from the translation of assets and liabilities denominated in foreign currencies at period/year end exchange rates are recognized in the Statement of Comprehensive Income.
Foreign exchange gains and losses relating to cash and cash equivalents are presented in the Statement of Comprehensive Income within "Net foreign currency exchange gains/losses". Foreign exchange gains and losses relating to the financial assets and liabilities carried at fair value through profit or loss are presented in the Statement of Comprehensive Income within "Net gains/losses on investments and derivatives".
(e) Proceeds and payments on allotment and redemption of units
The net asset value per unit is computed for each dealing day. The price at which units are allotted or redeemed is calculated by reference to the net asset value per unit as at the close of business on the relevant dealing day in accordance with the provisions of the Fund's Trust Deed dated 20 January 1971, as amended, which may be different from the accounting policies stated in the financial statements.
3 Number of units in issue and net assets attributable to holders of redeemable units (per unit)
31.3.2014
USD Class (acc) Units Number of units in issue: 1,068,472.679 US$ Net assets attributable to
holders of redeemable units 291,783,072
Net assets attributable to
holders of redeemable units (per unit) 273.08
- 86 -

JJPMORGAN EASTERN FUND SSemi--aannual report for the
pperiod ended 31 March 2014
30.9.2013
USD Class (acc) Units Number of units in issue: 1,172,547.551 US$ Net assets attributable to
holders of redeemable units 323,246,617
Net assets attributable to
holders of redeemable units (per unit) 275.68
44 Net (losses)/gains on investments and derivatives
1.10.2013
to 31.3.2014
1.10.2012 to
31.3.2013 US$ US$ Change in unrealized gains/losses in value of investments and derivatives (12,730,621) 16,011,399 Realized gains on sale of investments and derivatives 12,548,325 18,347,369 (182,296) 34,358,768
5 Soft commission arrangements
The Investment Manager has entered into soft commission arrangements with brokers under which certain goods and services used to support investment decision making are received by the Investment Manager. The Investment Manager does not make direct payment for these services but transacts an agreed amount of business with the brokers on behalf of the Fund. Commission is paid from the Fund on these transactions.
The goods and services must be of demonstrable benefit to the Fund and may include research and advisory services; economic and political analysis; portfolio analysis, including valuation and performance measurement; market analysis, data and quotation services, computer hardware and software incidental to the above goods and services; clearing and custodian services and investment-related publications.
6 Distribution
No distribution was made during the period (31 March 2013: nil).
- 87 -

JJPMORGAN EASTERN SMALLER COMPANIES FUND SSemi--aannual report for the
pperiod ended 31 March 2014
DDistributor Status The Fund has been certified by HMRC in the UK as a distributing fund in respect of the period from 1 January 1984 to 30 September 2010. The principal effect of this certification is that for unitholders resident or ordinarily resident in the UK for taxation purposes any gains accruing on the sale, redemption or other disposal of units during the period will be taxed in the UK as a capital gain and not as income. This treatment will continue under the new UK reporting fund regime provided the Fund does not invest more than 5% of its assets in other offshore funds which are not themselves reporting funds. There will be no need to formally apply for reporting fund status as the Fund is transparent for UK tax purposes and therefore considered out of scope of the requirements of this new regime. These are now known as "special category transparent offshore funds ". As noted, the Fund is transparent for UK income tax purposes and UK investors are subject to UK capital gains tax on disposal of their units. UK investors are subject to tax on their share of income of the Fund on an arising basis. Information has been provided to UK investors of the amount of their share of the underlying income, expenses and overseas tax suffered.
Investment Portfolio As at 31 March 2014 (Unaudited)
Holding
Fair value
US$
% of net
assets Listed/Quoted Investments (98.0%) Equities (98.0%) China (23.9%) Autohome Inc ADR 13,110 503,555 0.2 Beijing Enterprises Water
Group 1,788,000 1,251,615 0.6 Central China Real Estate
Hldgs 1,592,000 416,622 0.2 China Everbright Intl 500,000 684,539 0.3 China Longyuan Power Group
'H' 1,589,000 1,599,847 0.8 China Resources Land 308,000 675,793 0.3 China State Construction Intl 2,526,000 4,278,900 2.0 China Taiping Insurance Hldgs 495,200 886,081 0.4 CITIC Telecom Intl Hldgs 3,766,500 1,408,119 0.7 Clear Media 1,429,000 1,291,379 0.6 Far East Global Group 6,514,000 1,536,747 0.7 GCL Poly Energy Hldgs 2,392,000 863,421 0.4 Haier Electronics Group 1,907,000 5,162,658 2.5 Huaneng Renewables 'H' 2,898,000 982,557 0.5 Ju Teng Intl Hldgs 2,392,000 1,692,922 0.8 Kingsoft Corp 313,000 1,232,704 0.6 Minth Group 4,012,000 8,171,869 3.9 Phoenix Healthcare Group 716,500 1,041,906 0.5 Poly Culture Group 'H' 168,800 738,781 0.4 Poly Property Group 2,864,000 1,266,399 0.6 REXLot Hldgs 12,189,644 1,414,285 0.7 Sinotrans Ltd 'H' 2,502,000 1,257,927 0.6 Sunac China Hldgs 1,476,000 856,253 0.4
(Continued)
Holding
Fair value
US$
% of net
assets Texhong Textile Group 805,000 948,518 0.5 Tongda Group Hldgs 2,910,000 408,905 0.2 Tongda Group Hldgs (Placing
03/14) 1,210,000 170,026 0.1 Towngas China 7,637,000 9,333,285 4.4 Hong Kong (14.3%) China Innovationpay Group 4,284,000 314,795 0.2 Dah Sing Banking Group 1,068,000 1,685,218 0.8 Dah Sing Financial Hldgs 304,400 1,432,323 0.7 Emperor Watch & Jewellery 17,520,000 1,332,568 0.6 Goldpac Group 789,000 755,734 0.4 Hutchison Telecom HK 1,074,000 357,213 0.2 Intl Housewares Retail 3,212,000 1,652,159 0.8 Johnson Electric Hldgs 1,958,000 1,809,819 0.9 Lifestyle Intl Hldgs 746,000 1,517,572 0.7 Man Wah Hldgs 392,400 662,680 0.3 Samsonite Intl 962,400 2,977,627 1.4 SCMP Group 6,454,000 1,568,353 0.8 Techtronic Industries 3,272,000 9,111,092 4.3 Tsui Wah Hldgs 1,590,000 922,387 0.4 Xinyi Glass Hldgs 2,382,000 1,937,646 0.9 Yue Yuen Industrial (Hldgs) 585,500 1,905,863 0.9 India (8.7%) Ashok Leyland 1,024,078 405,533 0.2 Axis Bank (DEMAT) 15,642 382,522 0.2 Bharat Heavy Electricals 249,264 818,255 0.4 DCB Bank 899,019 922,013 0.4 Eicher Motors 33,626 3,356,547 1.6 Godrej Industries 187,000 988,190 0.5 Gujarat Pipavav Port 1,158,583 1,703,271 0.8 IndusInd Bank 211,490 1,777,157 0.8 ING Vysya Bank 158,130 1,681,054 0.8 JSW Energy 1,055,591 1,047,240 0.5 Just Dial 28,050 727,710 0.3 Raymond Ltd 189,306 959,169 0.5 Shree Cement 12,443 1,181,525 0.6 Shriram Transport Finance 106,000 1,362,217 0.7 Whirlpool Of India 231,973 897,634 0.4 Indonesia (3.4%) Jasa Marga (Persero) 1,910,700 1,009,173 0.5 Kalbe Farma 9,869,300 1,272,757 0.6 Midi Utama Indonesia 10,538,000 482,373 0.2 Pakuwon Jati 26,018,200 801,617 0.4 Sri Rejeki Isman 50,908,000 994,857 0.5 Total Bangun Persada 11,237,800 830,964 0.4 Ultrajaya Milk Ind & Trading 847,400 293,159 0.1 Wijaya Karya 6,881,300 1,447,738 0.7 Korea (16.7%) CJ CheilJedang 2,900 781,906 0.4 CJ O Shopping Co 4,140 1,416,884 0.7 Coway Co 25,600 1,796,533 0.9 DGB Financial Group 235,010 3,400,023 1.6 Dongsuh Co 317,061 4,706,246 2.2 Grand Korea Leisure 17,300 711,048 0.3 GS Home Shopping 4,940 1,099,892 0.5 Hyosung Corp 8,200 591,629 0.3 Hyundai Department Store 14,450 1,927,662 0.9
- 88 -

JJPMORGAN EASTERN SMALLER COMPANIES FUND SSemi--aannual report for the
pperiod ended 31 March 2014
IInvestment Portfolio (Continued) As at 31 March 2014 (Unaudited)
Holding
Fair value
US$
% of net
assets Korea (Continued) iMarketKorea Inc 96,010 2,962,965 1.4 Korea Investment Hldgs 62,280 2,153,134 1.0 Korean Reinsurance 202,624 1,960,663 0.9 LG Chem 5,000 1,193,104 0.6 LG Hausys 5,251 784,357 0.4 NICE Information Service 578,428 1,991,581 1.0 Samsung Securities 63,470 2,328,436 1.1 Seegene Inc 22,626 1,130,822 0.5 Shinsegae Co 10,963 2,373,969 1.1 Shinsegae Food 22,594 1,816,944 0.9 Malaysia (2.2%) Eastern & Oriental (CDS) 1,183,100 768,082 0.4 Gamuda Bhd 317,600 458,091 0.2 Malaysia Airports Hldgs 310,700 761,170 0.3 Muhibbah Engineering (CDS) 1,824,500 1,614,701 0.8 UMW Oil & Gas (IPO-
Cornerstone) 780,000 972,164 0.5 Philippines (2.4%) ABS-CBN Hldgs PDR 1,253,600 894,530 0.4 Cosco Capital 5,690,000 1,205,374 0.6 GT Capital Hldgs 36,348 636,668 0.3 Melco Crown (Philippines)
Resorts 1,958,000 567,600 0.3 Philippine Seven 517,550 1,119,464 0.5 Robinsons Retail Hldgs 360,640 546,851 0.3 Singapore (4.0%) AIMS AMP Capital Ind REIT 510,116 543,561 0.2 Goodpack Ltd 1,865,000 3,173,711 1.5 Osim Intl 1,692,000 3,484,776 1.7 Pacific Radiance 1,499,000 1,257,560 0.6 Taiwan (19.3%) Advantech Co 138,000 895,000 0.4 Axiomtek Co 602,000 1,322,512 0.6 Chailease Hldg GDR-RegS 247,000 2,962,765 1.4 China Development Fin 2,850,000 815,155 0.4 China Life Insurance 2,768,280 2,540,791 1.2 China Steel Chemical 201,000 1,148,477 0.5 Chipbond Technology 1,110,000 1,961,021 0.9 Depo Auto Parts Industrial 388,000 1,509,827 0.7 Dynacolor Inc 535,000 1,466,957 0.7 GeoVision Inc 525,713 3,521,729 1.7 Hiwin Technologies 86,000 833,101 0.4 Huaku Development 401,000 982,336 0.5 Kinsus Interconnect
Technology 471,000 1,747,738 0.8 Macauto Industrial Co 200,000 886,627 0.4 Merida Industry 247,000 1,638,420 0.8 Nak Sealing Technologies 262,000 1,148,576 0.6 Poya Co 168,000 1,092,324 0.5 Rotam Global Agrosciences 458,525 966,663 0.5 Ruentex Development 1,152,269 2,107,590 1.0 Sino-American Silicon
Products 521,000 911,889 0.4 St Shine Optical 32,000 713,505 0.3 Sunspring Metal 914,000 2,629,223 1.3
(Continued)
Holding
Fair value
US$
% of net
assets Systex Corp 687,000 1,608,508 0.8 TSC Auto ID Technology Co 146,000 1,395,156 0.7 Turvo Intl Co 421,000 2,073,721 1.0 Wistron NeWeb 740,000 1,666,990 0.8 Thailand (3.1%) Banpu Public Co (F) 922,400 796,153 0.4 Charoen Pokphand Foods (F) 963,000 831,196 0.4 Charoen Pokphand Foods
NVDR 250,000 215,783 0.1 Chularat Hospital (F) 5,177,500 1,675,825 0.8 GFPT Public Co (F) 3,572,900 1,597,011 0.7 LPN Development (F) 864,600 426,437 0.2 Precious Shipping (F) 680,600 592,693 0.3 Ratchaburi Electricity NVDR 243,700 388,763 0.2 Total Listed/Quoted Investments 205,563,900 98.0 Other net assets 4,209,830 2.0 Net assets attributable to holders of
rredeemable units at 31 March 2014 209,773,730 100.0 Total investments, at cost 172,210,496
- 89 -

JJPMORGAN EASTERN SMALLER COMPANIES FUND SSemi--aannual report for the
pperiod ended 31 March 2014
SStatement of Movements in Portfolio Holdings For the period ended 31 March 2014 (Unaudited) % holdings
of net assets 31.3.2014 30.9.2013 Listed/Quoted Investments Equities China 23.9 22.4 Taiwan 19.3 20.1 Korea 16.7 16.5 Hong Kong 14.3 16.1 India 8.7 4.5 Singapore 4.0 3.0 Indonesia 3.4 2.2 Thailand 3.1 5.0 Philippines 2.4 2.8 Malaysia 2.2 1.9 Total Listed/Quoted Investments 98.0 94.5 Other net assets 2.0 5.5 Net assets attributable to hholders of
redeemable units 100.0 100.0
- 90 -

JJPMORGAN EASTERN SMALLER COMPANIES FUND SSemi--aannual report for the
pperiod ended 31 March 2014
SStatement of Financial Position As at 31 March 2014 (Unaudited) 31.3.2014 30.9.2013 US$ US$ Assets Cash at banks 4,319,790 13,798,377 Amounts due from brokers 1,618,676 2,098,882 Amounts receivable on allotment 305,109 709,536 Investments 205,563,900 208,560,475 Dividend and other accounts
receivable 345,319 136,022 Total assets 212,152,794 225,303,292 ---------- ---------- Liabilities Amounts due to brokers 1,109,990 2,330,827 Amounts payable on redemption 978,823 1,854,940 Other accounts payable 290,251 388,164 Total liabilities 2,379,064 4,573,931 ---------- ---------- Net assets attributable to holders
oof redeemable units [Note 3] 209,773,730 220,729,361 Equity 209,773,730 220,729,361
Statement of Comprehensive Income For the period ended 31 March 2014 (Unaudited) 1.10.2013
to 31.3.2014
1.10.2012 to
31.3.2013 US$ US$ Income Net gains on investments and
derivatives [Note 4] 19,285,679 44,360,058 Dividend income 1,059,723 1,358,511 Interest on deposits 3,002 406 Net foreign currency exchange
losses (97,746) (198,597) Other income 56 5,138 20,250,714 45,525,516 ---------- ---------- Expenses Management fee 1,633,053 1,999,745 Transaction costs 679,777 1,058,668 Registrar's fee 45,522 54,242 Safe custody and bank charges 38,006 44,430 Trustee's fee 36,458 42,509 Legal and professional expenses 21,378 18,525 Valuation fee 8,610 8,330 Auditor's fee 8,427 8,176 Printing and publication expenses 5,759 5,199 Other operating expenses 8,087 4,650 2,485,077 3,244,474 ---------- ---------- Net operating profit 17,765,637 42,281,042 Finance costs Interest paid - (5,320) Profit before taxation 17,765,637 42,275,722 Taxation (130,045) 76,157 Increase in nnet assets
attributable to holders of redeemable units and total ccomprehensive income 17,635,592 42,351,879
The notes on pages 93 to 95 form part of these financial statements.
- 91 -

JJPMORGAN EASTERN SMALLER COMPANIES FUND SSemi--aannual report for the
pperiod ended 31 March 2014
SStatement of Changes in Net Assets Attributable to Holders of Redeemable Units For the period ended 31 March 2014 (Unaudited) 1.10.2013
to 31.3.2014
1.10.2012 to
31.3.2013 US$ US$ Net assets attributable to holders
of redeemable units at the beginning of the period 220,729,361 236,448,087
---------- ---------- Allotment of redeemable units 24,490,922 60,133,776 Redemption of redeemable units (53,082,145) (74,100,331) Net redemption (28,591,223) (13,966,555) ---------- ---------- 192,138,138 222,481,532 Increase in net assets
attributable to holders of redeemable units and total comprehensive income 17,635,592 42,351,879
Net assets attributable to holders
oof redeemable units at the end of the period 209,773,730 264,833,411
Statement of Cash Flows For the period ended 31 March 2014 (Unaudited) 1.10.2013
to 31.3.2014
1.10.2012 to
31.3.2013 US$ US$ Operating activities Purchase of investments and
derivatives (99,895,414) (172,201,182) Proceeds from disposal of
investments and derivatives 121,445,019 192,664,052 Dividend received 850,436 1,185,743 Interest received 3,028 389 Trustee's fee paid (36,674) (41,750) Registrar's fee paid (83,650) (89,552) Tax paid (159,743) 76,157 Transaction costs paid (694,172) (1,070,177) Management fee paid (1,646,039) (1,954,370) Others (158,845) (586,396) Net cash inflow from operating
aactivities 19,623,946 17,982,914 ---------- ---------- Financing activities Interest paid - (5,693) Receipts on allotment of
redeemable units 24,895,349 59,818,362 Payments on redemption of
redeemable units (53,958,262) (72,807,500) Net cash outflow from
ffinancing activities (29,062,913) (12,994,831) ---------- ---------- (Decrease)/increase in cash
aand cash equivalents (9,438,967) 4,988,083 Cash and cash equivalents at the
beginning of the period 13,798,377 (3,167,395) Exchange (losses)/gains on cash
and cash equivalents (39,620) 5,410 Cash aand cash equivalents at
the end of the period 4,319,790 1,826,098 Analysis of balances of cash and cash equivalents: Cash at banks 4,319,790 1,826,098
The notes on pages 93 to 95 form part of these financial statements.
- 92 -

JJPMORGAN EASTERN SMALLER CCOMPANIES FUND SSemi--aannual report for the
pperiod ended 31 March 2014
NNotes to the Financial Statements
1 The Fund
JPMorgan Eastern Smaller Companies Fund (the "Fund") was established under a Trust Deed dated 2 December 1991, as amended, and is governed by the laws of Hong Kong. The Fund is authorized by the Securities and Futures Commission of Hong Kong.
The investment objective of the Fund is to provide investors with long-term capital growth by investing primarily in the securities of small to medium sized companies in the Asia-Pacific region, excluding Japan and Australia except the Manager may, from time to time, invest in Japan and Australia when appropriate investment opportunities arise.
Pursuant to the Supplemental Trust Deed dated 4 January 2013, the Manager may decide to issue separate classes (each a "Class") whose assets will be commonly invested but where a specific fee structure, currency or distribution policy may be applied. Each Class may have a different charging structure with the result that the net asset value attributable to each Class may differ.
All unitholders' rights with regard to the convening, voting or otherwise acting at any meeting of unitholders are the same.
2 Summary of principal accounting policies
(a) Accounting policies of interim financial statements
The accounting policies and methods of computation used in the preparation of these unaudited condensed interim financial statements are consistent with those used in the annual financial statements for the year ended 30 September 2013.
(b) Investments and derivatives
Classification
The Fund classifies its investments and derivatives as financial assets or financial liabilities at fair value through profit or loss. These financial assets or financial liabilities are held-for-trading as they are acquired or incurred principally for the purpose of selling or repurchasing in the near term or short-term profit taking.
All derivatives are carried in assets when amounts are receivable by the Fund and in liabilities when amounts are payable by the Fund.
The Fund makes short sales in which a borrowed security is sold in anticipation of a decline in the market value of that security, or it may use short sales for various arbitrage transactions. Short sales are classified as financial liabilities at fair value through profit or loss.
Recognition, derecognition and measurement
Purchases and sales of investments and derivatives are accounted for on the trade date basis. Investments and derivatives are initially recognized at fair value and are subsequently re-measured at fair value. Realized and unrealized gains and losses on investments and derivatives are recognized in the Statement of Comprehensive Income. Investments and derivatives are derecognized when the rights to receive cash flows from the investments and derivatives have expired or the Fund has transferred substantially all risks and rewards of ownership.
Fair value estimation
Fair value is the price that would be received to sell an asset or paid to transfer a liability in an orderly transaction between market participants at the measurement date. The fair value of financial assets and liabilities traded in active markets are based on last traded prices. Prior to 1 October 2012, investments that are listed or traded on an exchange and investments with prices quoted in over-the-counter markets or by market makers, are fair valued based on quoted "bid" prices on long investments and quoted "ask" prices on investments sold short. The Fund early adopted Hong Kong Financial Reporting Standard 13, "Fair Value Measurement", with effect from 1 October 2012, it changed its fair valuation input to utilize the last traded market price for both financial assets and financial liabilities where the last traded price falls within the bid-ask spread. When trading in the securities of an investee company is suspended, the investment is valued at the Manager's estimate of its fair value.
Debt securities are fair valued based on quoted prices inclusive of accrued interest.
Investments in collective investment schemes are stated at fair value based on the net asset value per unit of the respective funds as determined by the administrators of the relevant funds or stated at last traded prices if the collective investment schemes are listed or traded on an exchange.
Open future and swap contracts are valued at last traded prices for both long and short positions at the valuation date. The differences between the last traded prices and the contract prices are recognized in the Statement of Comprehensive Income.
- 93 -
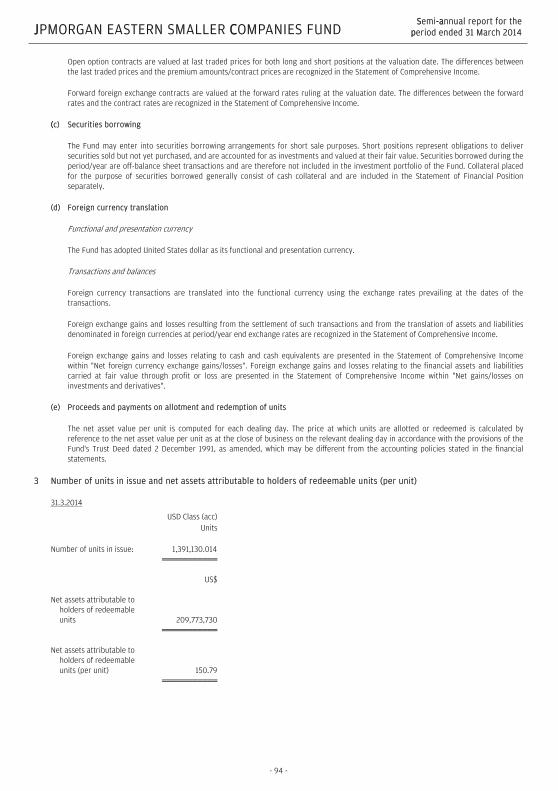
JJPMORGAN EASTERN SMALLER CCOMPANIES FUND SSemi--aannual report for the
pperiod ended 31 March 2014
Open option contracts are valued at last traded prices for both long and short positions at the valuation date. The differences between the last traded prices and the premium amounts/contract prices are recognized in the Statement of Comprehensive Income.
Forward foreign exchange contracts are valued at the forward rates ruling at the valuation date. The differences between the forward rates and the contract rates are recognized in the Statement of Comprehensive Income.
((c) Securities borrowing
The Fund may enter into securities borrowing arrangements for short sale purposes. Short positions represent obligations to deliver securities sold but not yet purchased, and are accounted for as investments and valued at their fair value. Securities borrowed during the period/year are off-balance sheet transactions and are therefore not included in the investment portfolio of the Fund. Collateral placed for the purpose of securities borrowed generally consist of cash collateral and are included in the Statement of Financial Position separately.
(d) Foreign currency translation
Functional and presentation currency
The Fund has adopted United States dollar as its functional and presentation currency.
Transactions and balances
Foreign currency transactions are translated into the functional currency using the exchange rates prevailing at the dates of the transactions.
Foreign exchange gains and losses resulting from the settlement of such transactions and from the translation of assets and liabilities denominated in foreign currencies at period/year end exchange rates are recognized in the Statement of Comprehensive Income.
Foreign exchange gains and losses relating to cash and cash equivalents are presented in the Statement of Comprehensive Income within "Net foreign currency exchange gains/losses". Foreign exchange gains and losses relating to the financial assets and liabilities carried at fair value through profit or loss are presented in the Statement of Comprehensive Income within "Net gains/losses on investments and derivatives".
(e) Proceeds and payments on allotment and redemption of units
The net asset value per unit is computed for each dealing day. The price at which units are allotted or redeemed is calculated by reference to the net asset value per unit as at the close of business on the relevant dealing day in accordance with the provisions of the Fund's Trust Deed dated 2 December 1991, as amended, which may be different from the accounting policies stated in the financial statements.
3 Number of units in issue and net assets attributable to holders of redeemable units (per unit)
31.3.2014
USD Class (acc) Units Number of units in issue: 1,391,130.014 US$ Net assets attributable to
holders of redeemable units 209,773,730
Net assets attributable to
holders of redeemable units (per unit) 150.79
- 94 -

JJPMORGAN EASTERN SMALLER COMPANIES FUND SSemi--aannual report for the
pperiod ended 31 March 2014
30.9.2013
USD Class (acc) Units Number of units in issue: 1,585,302.424 US$ Net assets attributable to
holders of redeemable units 220,729,361
Net assets attributable to
holders of redeemable units (per unit) 139.23
44 Net gains on investments and derivatives
1.10.2013
to 31.3.2014
1.10.2012 to
31.3.2013 US$ US$ Change in unrealized gains/losses in value of investments and derivatives 7,244,814 14,338,858 Realized gains on sale of investments and derivatives 12,040,865 30,021,200 19,285,679 44,360,058
5 Soft commission arrangements
The Investment Manager has entered into soft commission arrangements with brokers under which certain goods and services used to support investment decision making are received by the Investment Manager. The Investment Manager does not make direct payment for these services but transacts an agreed amount of business with the brokers on behalf of the Fund. Commission is paid from the Fund on these transactions.
The goods and services must be of demonstrable benefit to the Fund and may include research and advisory services; economic and political analysis; portfolio analysis, including valuation and performance measurement; market analysis, data and quotation services, computer hardware and software incidental to the above goods and services; clearing and custodian services and investment-related publications.
6 Distribution
No distribution was made during the period (31 March 2013: nil).
- 95 -
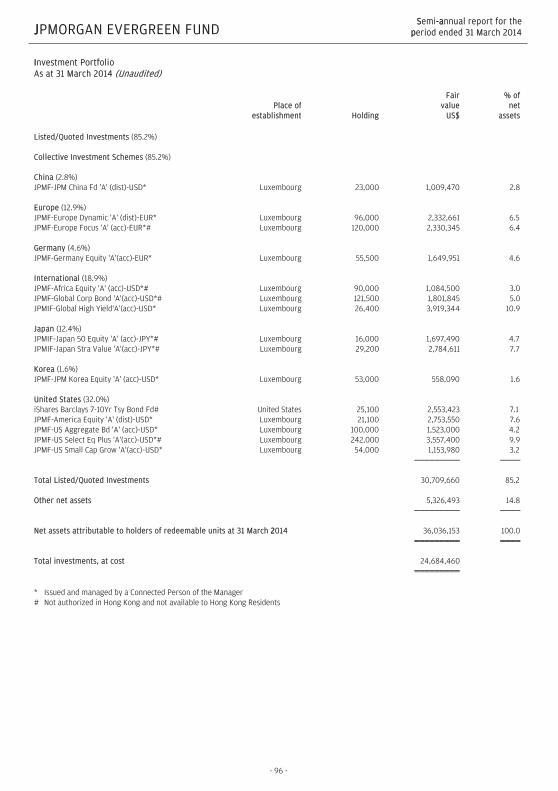
JJPMORGAN EVERGREEN FUND SSemi--aannual report for the
pperiod ended 31 March 2014
IInvestment Portfolio As at 31 March 2014 (Unaudited)
Place of establishment Holding
Fair value
US$
% of net
assets Listed/Quoted Investments (85.2%) Collective Investment Schemes (85.2%) China (2.8%) JPMF-JPM China Fd 'A' (dist)-USD* Luxembourg 23,000 1,009,470 2.8 Europe (12.9%) JPMF-Europe Dynamic 'A' (dist)-EUR* Luxembourg 96,000 2,332,661 6.5 JPMF-Europe Focus 'A' (acc)-EUR*# Luxembourg 120,000 2,330,345 6.4 Germany (4.6%) JPMF-Germany Equity 'A'(acc)-EUR* Luxembourg 55,500 1,649,951 4.6 International (18.9%) JPMF-Africa Equity 'A' (acc)-USD*# Luxembourg 90,000 1,084,500 3.0 JPMF-Global Corp Bond 'A'(acc)-USD*# Luxembourg 121,500 1,801,845 5.0 JPMIF-Global High Yield'A'(acc)-USD* Luxembourg 26,400 3,919,344 10.9 Japan (12.4%) JPMIF-Japan 50 Equity 'A' (acc)-JPY*# Luxembourg 16,000 1,697,490 4.7 JPMIF-Japan Stra Value 'A'(acc)-JPY*# Luxembourg 29,200 2,784,611 7.7 Korea (1.6%) JPMF-JPM Korea Equity 'A' (acc)-USD* Luxembourg 53,000 558,090 1.6 United States (32.0%) iShares Barclays 7-10Yr Tsy Bond Fd# United States 25,100 2,553,423 7.1 JPMF-America Equity 'A' (dist)-USD* Luxembourg 21,100 2,753,550 7.6 JPMF-US Aggregate Bd 'A' (acc)-USD* Luxembourg 100,000 1,523,000 4.2 JPMF-US Select Eq Plus 'A'(acc)-USD*# Luxembourg 242,000 3,557,400 9.9 JPMF-US Small Cap Grow 'A'(acc)-USD* Luxembourg 54,000 1,153,980 3.2 Total Listed/Quoted Investments 30,709,660 85.2 Other net assets 5,326,493 14.8 Net assets attributable to holders of redeemable units at 31 March 22014 36,036,153 100.0 Total investments, at cost 24,684,460 * Issued and managed by a Connected Person of the Manager # Not authorized in Hong Kong and not available to Hong Kong Residents
- 96 -
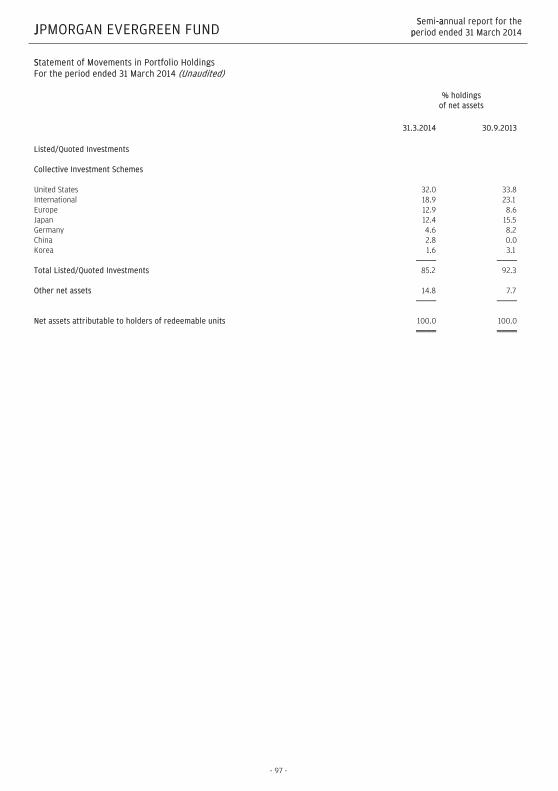
JJPMORGAN EVERGREEN FUND SSemi--aannual report for the
pperiod ended 31 March 2014
SStatement of Movements in Portfolio Holdings For the period ended 31 March 2014 (Unaudited) % holdings
of net assets 31.3.2014 30.9.2013 Listed/Quoted Investments Collective Investment Schemes United States 32.0 33.8 International 18.9 23.1 Europe 12.9 8.6 Japan 12.4 15.5 Germany 4.6 8.2 China 2.8 0.0 Korea 1.6 3.1 Total Listed/Quoted Investments 85.2 92.3 Other net assets 14.8 7.7 Net assets attributable to holders of redeemable units 100.0 100.0
- 97 -

JJPMORGAN EVERGREEN FUND SSemi--aannual report for the
pperiod ended 31 March 2014
SStatement of Financial Position As at 31 March 2014 (Unaudited) 31.3.2014 30.9.2013 US$ US$ Assets Cash at banks 5,244,331 2,679,202 Amounts receivable on allotment 144,813 178,739 Investments 30,709,660 33,737,748 Dividend and interest receivable 27 27,792 Total assets 36,098,831 36,623,481 ---------- ---------- Liabilities Amounts payable on redemption 35,015 15,617 Other accounts payable 27,663 38,444 Total liabilities 62,678 54,061 ---------- ---------- Net assets attributable to holders
oof redeemable units [Note 3] 36,036,153 36,569,420 Equity 36,036,153 36,569,420
Statement of Comprehensive Income For the period ended 31 March 2014 (Unaudited) 1.10.2013
to 31.3.2014
1.10.2012 to
31.3.2013 US$ US$ Income Net gains on investments and
derivatives [Note 4] 1,559,363 2,132,404 Dividend income 28,832 43,098 Interest on deposits 3,246 258 Net foreign currency exchange
(losses)/gains (1,069) 13,862 1,590,372 2,189,622 ---------- ---------- Expenses Management fee 94,016 83,216 Registrar's fee 9,673 9,498 Valuation fee 8,260 8,050 Auditor's fee 5,684 5,743 Trustee's fee 5,641 4,993 Printing and publication expenses 3,540 1,519 Safe custody and bank charges 2,200 2,026 Transaction costs 576 474 Legal and professional expenses 88 2 Other operating expenses 955 1,028 130,633 116,549 ---------- ---------- Net operating profit 1,459,739 2,073,073 Finance costs Interest paid - (47) Profit before taxation 1,459,739 2,073,026 Taxation (8,433) (9,489) Increase in net assets
attributable to holders of redeemable units and total ccomprehensive income 1,451,306 2,063,537
The notes on pages 100 to 101 form part of these financial statements.
- 98 -

JJPMORGAN EVERGREEN FUND SSemi--aannual report for the
pperiod ended 31 March 2014
SStatement of Changes in Net Assets Attributable to Holders of Redeemable Units For the period ended 31 March 2014 (Unaudited) 1.10.2013
to 31.3.2014
1.10.2012 to
31.3.2013 US$ US$ Net assets attributable to holders
of redeemable units at the beginning of the period 36,569,420 33,255,217
---------- ---------- Allotment of redeemable units 4,932,118 4,579,232 Redemption of redeemable units (6,916,691) (5,231,316) Net redemption (1,984,573) (652,084) ---------- ---------- 34,584,847 32,603,133 Increase in net assets
attributable to holders of redeemable units and total comprehensive income 1,451,306 2,063,537
Net assets attributable to holders
oof redeemable units at the end of the period 36,036,153 34,666,670
Statement of Cash Flows For the period ended 31 March 2014 (Unaudited) 1.10.2013
to 31.3.2014
1.10.2012 to
31.3.2013 US$ US$ Operating activities Purchase of investments and
derivatives (4,846,340) (3,456,739) Proceeds from disposal of
investments and derivatives 9,433,791 5,319,675 Dividend received 56,595 55,320 Interest received 3,248 239 Transaction costs paid (636) (474) Trustee's fee paid (5,648) (4,974) Tax paid (8,433) (9,489) Registrar's fee paid (18,710) (19,176) Management fee paid (94,131) (82,912) Others (23,358) (10,480) Net cash inflow ffrom operating
activities 4,496,378 1,790,990 ---------- ---------- Financing activities Interest paid - (47) Receipts on allotment of
redeemable units 4,966,044 4,566,744 Payments on redemption of
redeemable units (6,897,293) (5,519,846) Net cash outflow from
ffinancing activities (1,931,249) (953,149) ---------- ---------- Increase in cash and cash
eequivalents 2,565,129 837,841 Cash and cash equivalents at the
beginning of the period 2,679,202 360,709 Exchange losses on cash and cash
equivalents - (1) Cash and cash equivalents at
tthe end of the period 5,244,331 1,198,549 Analysis of balances of cash and cash equivalents: Cash at banks 5,244,331 1,198,549
The notes on pages 100 to 101 form part of these financial statements.
- 99 -

JJPMORGAN EVERGREEN FUND SSemi--aannual report for the
pperiod ended 31 March 2014
NNotes to the Financial Statements
1 The Fund
JPMorgan Evergreen Fund (the "Fund") was established under a Trust Deed dated 19 January 2004, as amended, and is governed by the laws of Hong Kong. The Fund is authorized by the Securities and Futures Commission of Hong Kong.
The investment objective of the Fund is to seek to produce a competitive total return in different market conditions. The Fund seeks to achieve this through an actively managed portfolio of collective investment schemes managed by the Manager, its connected parties or external parties.
All unitholders' rights with regard to the convening, voting or otherwise acting at any meeting of unitholders are the same.
2 Summary of principal accounting policies
(a) Accounting policies of interim financial statements
The accounting policies and methods of computation used in the preparation of these unaudited condensed interim financial statements are consistent with those used in the annual financial statements for the year ended 30 September 2013.
(b) Investments and derivatives
Classification
The Fund classifies its investments and derivatives as financial assets or financial liabilities at fair value through profit or loss. These financial assets or financial liabilities are held-for-trading as they are acquired or incurred principally for the purpose of selling or repurchasing in the near term or short-term profit taking.
All derivatives are carried in assets when amounts are receivable by the Fund and in liabilities when amounts are payable by the Fund.
Recognition, derecognition and measurement
Purchases and sales of investments and derivatives are accounted for on the trade date basis. Investments and derivatives are initially recognized at fair value and are subsequently re-measured at fair value. Realized and unrealized gains and losses on investments and derivatives are recognized in the Statement of Comprehensive Income. Investments and derivatives are derecognized when the rights to receive cash flows from the investments and derivatives have expired or the Fund has transferred substantially all risks and rewards of ownership.
Fair value estimation
Fair value is the price that would be received to sell an asset or paid to transfer a liability in an orderly transaction between market participants at the measurement date. The fair value of financial assets and liabilities traded in active markets are based on last traded prices. Prior to 1 October 2012, investments that are listed or traded on an exchange and investments with prices quoted in over-the-counter markets or by market makers, are fair valued based on quoted "bid" prices on long investments and quoted "ask" prices on investments sold short. The Fund early adopted Hong Kong Financial Reporting Standard 13, "Fair Value Measurement", with effect from 1 October 2012, it changed its fair valuation input to utilize the last traded market price for both financial assets and financial liabilities where the last traded price falls within the bid-ask spread. When trading in the securities of an investee company is suspended, the investment is valued at the Manager's estimate of its fair value.
Investments in collective investment schemes are stated at fair value based on the net asset value per unit of the respective funds as determined by the administrators of the relevant funds or stated at last traded prices if the collective investment schemes are listed or traded on an exchange.
Open future contracts are valued at last traded prices for both long and short positions at the valuation date. The differences between the last traded prices and the contract prices are recognized in the Statement of Comprehensive Income.
(c) Foreign currency translation
Functional and presentation currency
The Fund has adopted United States dollar as its functional and presentation currency.
Transactions and balances
Foreign currency transactions are translated into the functional currency using the exchange rates prevailing at the dates of the transactions.
- 100 -

JJPMORGAN EVERGREEN FUND SSemi--aannual report for the
pperiod ended 31 March 2014
Foreign exchange gains and losses resulting from the settlement of such transactions and from the translation of assets and liabilities denominated in foreign currencies at period/year end exchange rates are recognized in the Statement of Comprehensive Income.
Foreign exchange gains and losses relating to cash and cash equivalents are presented in the Statement of Comprehensive Income within "Net foreign currency exchange gains/losses". Foreign exchange gains and losses relating to the financial assets and liabilities carried at fair value through profit or loss are presented in the Statement of Comprehensive Income within "Net gains/losses on investments and derivatives".
((d) Proceeds and payments on allotment and redemption of units
The net asset value per unit is computed for each dealing day. The price at which units are allotted or redeemed is calculated by reference to the net asset value per unit as at the close of business on the relevant dealing day in accordance with the provisions of the Fund's Trust Deed dated 19 January 2004, as amended, which may be different from the accounting policies stated in the financial statements.
3 Number of units in issue and net assets attributable to holders of redeemable units (per unit)
31.3.2014 30.9.2013 Units Units Number of units in issue 1,924,195.095 2,028,509.793 US$ US$ Net assets attributable to holders of redeemable units 36,036,153 36,569,420 Net assets attributable to holders of redeemable units (per unit) 18.73 18.03
4 Net gains on investments and derivatives
1.10.2013
to 31.3.2014
1.10.2012 to
31.3.2013 US$ US$ Change in unrealized gains/losses in value of investments and derivatives (135,222) 1,036,009 Realized gains on sale of investments and derivatives 1,694,585 1,096,395 1,559,363 2,132,404
5 Soft commission arrangements
During the period, the Investment Manager and its associates did not enter into any soft commission arrangements in connection with directing transactions of the Fund through a broker or dealer (31 March 2013: nil).
6 Distribution
No distribution was made during the period (31 March 2013: nil).
- 101 -

JJPMORGAN GLOBAL BOND AND CURRENCY FUND SSemi--aannual report for the
pperiod ended 31 March 2014
IInvestment Portfolio As at 31 March 2014 (Unaudited)
Holding
Fair value
US$
% of net
assets Listed/Quoted IInvestments (96.4%) (I) Debt Securities (80.4%) Australia (1.2%) Australian Govt No133
5.5% 21/04/23 AUD129,000 135,947 0.7 Australian Govt No138
3.25% 21/4/29 AUD20,000 16,260 0.1 Australian Govt No141
3.25%21/10/18 AUD90,000 84,123 0.4 Belgium (1.3%) Belgium Kingdom of No31
5.5%28/3/28 EUR78,000 144,394 0.7 Belgium Kingdom of No64
4.5%28/3/26 EUR75,000 125,830 0.6 Canada (0.8%) Canada Govt Of 2.75%
01/06/22 CAD75,000 71,254 0.4 Canada Govt Of 4%
01/06/41 CAD15,000 16,373 0.1 Canada Govt Of 5.75%
01/06/29 CAD50,000 63,147 0.3 China (0.3%) Export-Imp Bk CN 4.875%
07/15-RegS USD60,000 63,373 0.3 Denmark (0.4%) Denmark Kingdom Of 3%
15/11/21 DKK420,000 88,087 0.4 Finland (0.5%) Finnish Govt Of 2.625%
04/07/42 EUR70,000 99,993 0.5 France (3.2%) France OAT 4% 25/04/55 EUR30,000 50,904 0.3 France OAT 4.5%
25/04/41 EUR40,000 72,636 0.4 France OAT 5.75%
25/10/32 EUR113,000 227,086 1.1 French Treasury 1.75%
25/02/17 EUR200,000 287,263 1.4 Germany (1.9%) Bundesobl No166 0.25%
13/04/18 EUR41,000 56,182 0.3 Bundesrep Deut 2.25%
04/09/21 EUR150,000 226,312 1.1 Bundesrep Deut No08
4.75% 04/07/40 EUR36,000 73,871 0.4 Bundesschatzanw 0.25%
13/03/15 EUR20,000 27,595 0.1 Ireland (2.3%) Ireland Treasury 3.4%
18/03/24-RegS EUR212,300 302,757 1.5
(Continued)
Holding
Fair value
US$
% of net
assets Ireland Treasury 4.5%
18/04/20 EUR95,000 154,869 0.8 Italy (8.5%) Italy Rep Of (BTP) 3.5%
01/12/18 EUR130,000 194,803 1.0 Italy Rep Of (BTP) 3.7%
14/11/16 JPY15,000,000 153,879 0.8 Italy Rep Of (BTP) 4%
01/02/37 EUR165,000 232,282 1.1 Italy Rep Of (BTP) 4.25%
01/02/19 EUR260,000 400,514 2.0 Italy Rep Of (BTP) 4.5%
01/05/23 EUR190,000 294,881 1.5 Italy Rep Of (BTP) 4.5%
1/2/20-RegS EUR60,000 93,589 0.5 Italy Rep Of (BTP) 4.75%
01/08/23 EUR125,000 195,865 1.0 Italy Rep Of (BTP) 4.75%
01/09/28 EUR70,000 107,568 0.5 Italy Rep Of (BTP) 4.75%
09/44-RegS EUR20,000 30,025 0.1 Japan (22.5%) JGB No105 (20Yr) 2.1%
20/09/28 JPY22,600,000 252,189 1.3 JGB No20 (30Yr) 2.5%
20/09/35 JPY51,800,000 587,348 2.9 JGB No318 (10Yr) 1%
20/09/21 JPY50,500,000 511,315 2.5 JGB No321 (2Yr) 0.1%
15/10/14 JPY71,500,000 694,734 3.5 JGB No325 (10Yr) 0.8%
20/09/22 JPY88,300,000 877,437 4.4 JGB No328 (2Yr) 0.1%
15/05/15 JPY60,000,000 582,944 2.9 JGB No37 (30Yr) 1.9%
20/09/42 JPY25,400,000 258,729 1.3 JGB No4 (40Yr) 2.2%
20/03/51 JPY5,500,000 59,842 0.3 JGB No73 (20Yr) 2%
20/12/24 JPY29,500,000 327,294 1.6 JGB No78 (20Yr) 1.9%
20/06/25 JPY33,450,000 368,007 1.8 Malaysia (2.3%) Petronas Cap 5.25%
12/08/19-RegS USD400,000 452,957 2.3 Netherlands (1.7%) Majapahit Hldg 7.75%
20/01/20-RegS USD300,000 351,240 1.7 Philippines (2.1%) Dev Bank Of Philip VRN
8.375% Perp USD400,000 429,711 2.1 Portugal (0.8%) Obrigacoes Tesour 5.65%
02/24-RegS EUR100,000 156,330 0.8
- 102 -

JJPMORGAN GLOBAL BOND AND CURRENCY FUND SSemi--aannual report for the
pperiod ended 31 March 2014
IInvestment Portfolio (Continued) As at 31 March 2014 (Unaudited)
Holding
Fair value
US$
% of net
assets Spain (5.8%) Spain Kingdom Of 2.75%
30/04/19 EUR120,000 173,536 0.9 Spain Kingdom Of 3.8%
30/04/24-RegS EUR290,000 421,583 2.1 Spain Kingdom Of 4%
30/04/20 EUR50,000 78,514 0.4 Spain Kingdom Of 4.1%
30/07/18 EUR50,000 78,010 0.4 Spain Kingdom Of 4.65%
30/07/25 EUR15,000 23,790 0.1 Spain Kingdom Of
5.15%31/10/44-RegS EUR75,000 121,205 0.6 Spain Kingdom Of 5.85%
31/01/22 EUR155,000 261,133 1.3 United Kingdom (6.5%) UK Treasury 1.25%
22/07/18 GBP30,000 49,236 0.2 UK Treasury 1.75%
07/09/22 GBP251,000 392,317 2.0 UK Treasury 3.75%
22/07/52 GBP65,000 115,224 0.6 UK Treasury 4% 07/09/16 GBP110,000 197,584 1.0 UK Treasury 4.25%
07/06/32 GBP200,000 380,769 1.9 UK Treasury 4.75%
07/12/38 GBP80,000 164,695 0.8 United States (18.3%) US Treasury 0.375%
15/03/16 USD600,000 599,799 3.0 US Treasury 1.25%
30/04/19 USD250,000 245,179 1.2 US Treasury 2% 15/02/23 USD368,000 351,004 1.7 US Treasury 2.625%
15/08/20 USD780,000 805,123 4.0 US Treasury 2.75%
15/11/23 USD450,000 456,898 2.3 US Treasury 3.125%
15/02/42 USD80,000 74,411 0.4 US Treasury 4.5%
15/02/36 USD100,000 118,067 0.6 US Treasury 4.625%
15/02/40 USD733,000 883,241 4.4 US Treasury 5.25%
15/11/28 USD115,000 146,224 0.7 16,139,281 80.4 --------- ----
(Continued)
Holding
Fair value
US$
% of net
assets (II) Collective Investment Schemes (16.0%) International (16.0%) JPMF-Emerging Market
Local Currency Debt'X'(acc)-USD* 30,279 610,727 3.0
JPMIF-Global High Yield'X'(acc)-USD* 13,470 1,794,608 8.9
JPMIF-Global High Yield'X'(acc)-EUR Hedged* 3,930 815,132 4.1
3,220,467 16.0 --------- ---- Total Listed/Quoted Investments 19,359,748 96.4 Other net assets 720,494 3.6 Net aassets attributable to holders of
redeemable units at 31 March 2014 20,080,242 100.0 Total investments, at cost 19,019,581 * Issued and managed by a Connected Person of the Manager
- 103 -

JJPMORGAN GLOBAL BOND AND CURRENCY FUND SSemi--aannual report for the
pperiod ended 31 March 2014
SStatement of Movements in Portfolio Holdings For the period ended 31 March 2014 (Unaudited) % holdings
of net assets 31.3.2014 30.9.2013 Listed/Quoted Investments Debt Securities Japan 22.5 24.1 United States 18.3 16.8 Italy 8.5 5.6 United Kingdom 6.5 7.1 Spain 5.8 7.9 France 3.2 2.1 Ireland 2.3 0.7 Malaysia 2.3 2.1 Philippines 2.1 2.0 Germany 1.9 0.2 Netherlands 1.7 1.6 Belgium 1.3 2.6 Australia 1.2 0.9 Portugal 0.8 0.6 Canada 0.8 0.8 Finland 0.5 0.4 Denmark 0.4 0.6 China 0.3 0.3 Cayman Islands - 1.7 Russia - 1.1 Venezuela - 0.3 Collective Investment
SSchemes International 16.0 13.7 Total Listed/Quoted
IInvestments 96.4 93.2 Other net assets 3.6 6.8 Net assets attributable to
holders of redeemable uunits 100.0 100.0
- 104 -

JJPMORGAN GLOBAL BOND AND CURRENCY FUND SSemi--aannual report for the
pperiod ended 31 March 2014
SStatement of Financial Position As at 31 March 2014 (Unaudited) 31.3.2014 30.9.2013 US$ US$ Assets Cash at banks 814,007 1,617,907 Amounts due from brokers - 417,307 Amounts receivable on
allotment 7,587 22,427 Investments 19,359,748 20,009,564 Interest and other accounts
receivable 49,080 96 Total assets 20,230,422 22,067,301 ---------- ---------- Liabilities Amounts due to brokers - 400,121 Amounts payable on
redemption 18,422 16,826 Distribution payable [Note 5] 104,201 127,951 Other accounts payable 27,557 42,295 Liabilities (excluding net
assets attributable to holders of redeemable units) 150,180 587,193
---------- ---------- Net assets attributable to
holders of redeemable units [Note 3] 20,080,242 21,480,108
Statement of Comprehensive Income For the period ended 31 March 2014 (Unaudited) 1.10.2013
to 31.3.2014
1.10.2012 to
31.3.2013 US$ US$ Income Net gains/(losses) on investments
and derivatives [Note 4] 596,223 (1,058,810) Interest on deposits 224 229 Net foreign currency exchange
losses (14,775) (79,048) Other income 2 - 581,674 (1,137,629) ---------- ---------- Expenses Management fee 103,918 146,795 Registrar's fee 13,967 18,358 Auditor's fee 5,585 5,746 Safe custody and bank charges 3,778 3,821 Trustee's fee 1,871 2,643 Printing and publication expenses 1,105 1,080 Transaction costs 461 2,429 Legal and professional expenses 47 2,997 Other operating expenses 568 34 131,300 183,903 ---------- ---------- Net ooperating profit/(loss) 450,374 (1,321,532) Finance costs Distribution [Note 5] (104,201) (152,833) Profit/(loss) before taxation 346,173 (1,474,365) Taxation (3,901) (4,456) 342,272 (1,478,821) Change in cumulative difference
arising from the fair value adjustment of units of the Fund - (29,650)
Increase/(decrease) in net
aassets attributable to holdersof redeemable units and total comprehensive income 342,272 (1,508,471)
The notes on pages 107 to 110 form part of these financial statements.
- 105 -

JJPMORGAN GLOBAL BOND AND CURRENCY FUND SSemi--aannual report for the
pperiod ended 31 March 2014
SStatement of Changes in Net Assets Attributable to Holders of Redeemable Units For the period ended 31 March 2014 (Unaudited) 1.10.2013
to 31.3.2014
1.10.2012 to
31.3.2013 US$ US$ Net assets attributable to holders
of redeemable units at the beginning of the period 21,480,108 30,587,160
---------- ---------- Allotment of redeemable units 2,613,838 5,870,537 Redemption of redeemable units (4,355,976) (9,860,480) Net redemption (1,742,138) (3,989,943) ---------- ---------- 19,737,970 26,597,217 Increase/(decrease) in net assets
attributable to holders of redeemable units and total comprehensive income 342,272 (1,508,471)
Net assets attributable to holders
oof redeemable units at the end of the period 20,080,242 25,088,746
Statement of Cash Flows For the period ended 31 March 2014 (Unaudited) 1.10.2013
to 31.3.2014
1.10.2012 to
31.3.2013 US$ US$ Operating activities Purchase of investments and
derivatives (8,851,106) (23,789,117) Proceeds from disposal of
investments and derivatives 10,114,331 29,284,473
Interest received 223 229 Transaction costs paid (996) (2,994) Trustee's fee paid (1,882) (2,735) Tax paid (6,017) (2,452) Registrar's fee paid (22,860) (30,764) Management fee paid (104,508) (172,027) Others (73,388) 95,949 Net cash inflow from
ooperating activities 1,053,797 5,380,562 ---------- ---------- Financing activities Receipts on allotment of
redeemable units 2,628,678 5,913,641 Payments on redemption of
redeemable units (4,354,380) (9,836,450) Distribution paid (127,951) (205,968) Net cash outflow from
ffinancing activities (1,853,653) (4,128,777) ---------- ---------- (Decrease)/increase in cash
aand cash equivalents (799,856) 1,251,785 Cash and cash equivalents at
the beginning of the period 1,617,907 774,256 Exchange losses on cash and
cash equivalents (4,044) (193,146) Cash and cash equivalents
aat the end of the period 814,007 1,832,895
Analysis of balances of cash and cash eequivalents: Cash at banks 814,007 1,832,895
The notes on pages 107 to 110 form part of these financial statements.
- 106 -

JJPMORGAN GLOBAL BOND AND CURRENCY FUND SSeemi--aannual report for the
pperiod ended 31 March 2014
NNotes to the Financial Statements
1 The Fund
JPMorgan Global Bond and Currency Fund (the "Fund") was established under a Trust Deed dated 30 April 1979, as amended, and is governed by the laws of Hong Kong. The Fund is authorized by the Securities and Futures Commission of Hong Kong.
The investment objective of the Fund is to provide a stable income primarily from a portfolio of international interest bearing securities together with long-term capital appreciation through diversification of exposure to the major international currencies.
Pursuant to the Supplemental Trust Deed dated 14 January 2013, the Manager may decide to issue separate classes (each a "Class") whose assets will be commonly invested but where a specific fee structure, currency or distribution policy may be applied. Each Class may have a different charging structure with the result that the net asset value attributable to each Class may differ.
All unitholders' rights with regard to the convening, voting or otherwise acting at any meeting of unitholders are the same.
2 Summary of principal accounting policies
(a) Accounting policies of interim financial statements
The accounting policies and methods of computation used in the preparation of these unaudited condensed interim financial statements are consistent with those used in the annual financial statements for the year ended 30 September 2013.
(b) Investments and derivatives
Classification
The Fund classifies its investments and derivatives as financial assets or financial liabilities at fair value through profit or loss. These financial assets or financial liabilities are held-for-trading as they are acquired or incurred principally for the purpose of selling or repurchasing in the near term or short-term profit taking.
All derivatives are carried in assets when amounts are receivable by the Fund and in liabilities when amounts are payable by the Fund.
The Fund makes short sales in which a borrowed security is sold in anticipation of a decline in the market value of that security, or it may use short sales for various arbitrage transactions. Short sales are classified as financial liabilities at fair value through profit or loss.
Recognition, derecognition and measurement
Purchases and sales of investments and derivatives are accounted for on the trade date basis. Investments and derivatives are initially recognized at fair value and are subsequently re-measured at fair value. Realized and unrealized gains and losses on investments and derivatives are recognized in the Statement of Comprehensive Income. Investments and derivatives are derecognized when the rights to receive cash flows from the investments and derivatives have expired or the Fund has transferred substantially all risks and rewards of ownership.
Fair value estimation
Fair value is the price that would be received to sell an asset or paid to transfer a liability in an orderly transaction between market participants at the measurement date. The fair value of financial assets and liabilities traded in active markets are based on last traded prices. Prior to 1 October 2012, investments that are listed or traded on an exchange and investments with prices quoted in over-the-counter markets or by market makers, are fair valued based on quoted "bid" prices on long investments and quoted "ask" prices on investments sold short. The Fund early adopted Hong Kong Financial Reporting Standard 13, "Fair Value Measurement", with effect from 1 October 2012, it changed its fair valuation input to utilize the last traded market price for both financial assets and financial liabilities where the last traded price falls within the bid-ask spread. When trading in the securities of an investee company is suspended, the investment is valued at the Manager's estimate of its fair value.
Debt securities are fair valued based on quoted prices inclusive of accrued interest.
Investments in collective investment schemes are stated at fair value based on the net asset value per unit of the respective funds as determined by the administrators of the relevant funds or stated at last traded prices if the collective investment schemes are listed or traded on an exchange.
Open future and swap contracts are valued at last traded prices for both long and short positions at the valuation date. The differences between the last traded prices and the contract prices are recognized in the Statement of Comprehensive Income.
Open option contracts are valued at last traded prices for both long and short positions at the valuation date. The differences between the last traded prices and the premium amounts/contract prices are recognized in the Statement of Comprehensive Income.
- 107 -

JJPMORGAN GLOBAL BOND AND CURRENCY FUND SSeemi--aannual report for the
pperiod ended 31 March 2014
Forward foreign exchange contracts are valued at the forward rates ruling at the valuation date. The differences between the forward rates and the contract rates are recognized in the Statement of Comprehensive Income.
((c) Securities borrowing
The Fund may enter into securities borrowing arrangements for short sale purposes. Short positions represent obligations to deliver securities sold but not yet purchased, and are accounted for as investments and valued at their fair value. Securities borrowed during the period/year are off-balance sheet transactions and are therefore not included in the investment portfolio of the Fund. Collateral placed for the purpose of securities borrowed generally consist of cash collateral and are included in the Statement of Financial Position separately.
(d) Foreign currency translation
Functional and presentation currency
The Fund has adopted United States dollar as its functional and presentation currency.
Transactions and balances
Foreign currency transactions are translated into the functional currency using the exchange rates prevailing at the dates of the transactions.
Foreign exchange gains and losses resulting from the settlement of such transactions and from the translation of assets and liabilities denominated in foreign currencies at period/year end exchange rates are recognized in the Statement of Comprehensive Income.
Foreign exchange gains and losses relating to cash and cash equivalents are presented in the Statement of Comprehensive Income within "Net foreign currency exchange gains/losses". Foreign exchange gains and losses relating to the financial assets and liabilities carried at fair value through profit or loss are presented in the Statement of Comprehensive Income within "Net gains/losses on investments and derivatives".
(e) Proceeds and payments on allotment and redemption of units
The net asset value per unit is computed for each dealing day. The price at which units are allotted or redeemed is calculated by reference to the net asset value per unit as at the close of business on the relevant dealing day in accordance with the provisions of the Fund's Trust Deed dated 30 April 1979, as amended, which may be different from the accounting policies stated in the financial statements.
Units of the Fund are redeemable at the option of the holders of redeemable units and are classified as a financial liability in the Statement of Financial Position which represents the net assets attributable to holders of redeemable units (or "net asset value" or "net assets" or "NAV") and is carried at the redemption amount that would be payable at the Statement of Financial Position date if the holders of redeemable units exercised the right to redeem units of the Fund.
3 Number of units in issue and net assets attributable to holders of redeemable units (per unit)
31.3.2014
USD Class (san) Units Number of units in issue: 831,759.237 US$ Net assets attributable to
holders of redeemable units 20,080,242
Net assets attributable to
holders of redeemable units (per unit) 24.14
- 108 -

JJPMORGAN GLOBAL BOND AND CURRENCY FUND SSeemi--aannual report for the
pperiod ended 31 March 2014
30.9.2013
USD Class (san) Units Number of units in issue: 904,574.181 US$ Net assets attributable to
holders of redeemable units 21,480,108
Net assets attributable to
holders of redeemable units (per unit) 23.75
44 Net gains/(losses) on investments and derivatives
1.10.2013
to 31.3.2014
1.10.2012 to
31.3.2013 US$ US$ Change in unrealized gains/losses in value of investments and derivatives 224,302 (1,666,062) Realized gains on sale of investments and derivatives 371,921 607,252 596,223 (1,058,810)
5 Distribution
It is the intention of the manager of the Fund to have at least 85% of the income attributable to the distribution class(es) respectively in respect of each accounting period, after charging the expenses attributable to these distribution class(es) respectively, to be distributed to unitholders of these distribution class(es) respectively.
1.10.2013 to
31.3.2014
1.10.2012 to
31.3.2013 US$ US$ Net operating profit/(loss) 450,374 (1,321,532) Adjustments: Net (gains)/losses on investments and derivatives (596,223) 1,058,810 Net foreign currency exchange losses 14,775 79,048 Interest income included in net gains/losses on investments and derivatives (at coupon rate) 244,293 367,612 Transaction costs 461 2,429 Taxation (3,901) (4,456) Amount available for distribution 109,779 181,911 Interim distribution of US$0.1252 per unit on 832,273.958 units of USD Class (san) ex on 31 March 2014 and pay on 08 April 2014 (104,201) (2013: US$0.1479 per unit on 1,033,356.592 units of USD Class (san) ex on 28 March 2013 and
pay on 10 April 2013)
(152,833)
In the event that the amount available for distribution is insufficient to pay distributions as the Fund declares, the Manager may in its discretion determine that such distributions be paid from capital.
- 109 -

JJPMORGAN GLOBAL BOND AND CURRENCY FUND SSeemi--aannual report for the
pperiod ended 31 March 2014
66 Soft commission arrangements
The Investment Manager has entered into soft commission arrangements with brokers under which certain goods and services used to support investment decision making are received by the Investment Manager. The Investment Manager does not make direct payment for these services but transacts an agreed amount of business with the brokers on behalf of the Fund. Commission is paid from the Fund on these transactions.
The goods and services must be of demonstrable benefit to the Fund and may include research and advisory services; economic and political analysis; portfolio analysis, including valuation and performance measurement; market analysis, data and quotation services, computer hardware and software incidental to the above goods and services; clearing and custodian services and investment-related publications.
- 110 -

JJPMORGAN GLOBAL PROPERTY INCOME FUND SSemi--aannual report for the
pperiod ended 31 March 2014
IInvestment Portfolio As at 31 March 2014 (Unaudited)
Holding
Fair value
US$
% of net
assets Listed/Quoted Investments (99.7%) (I) Equities (100.7%) Australia (10.7%) Dexus Property Group Stapled
Sec 601,650 591,098 2.6 Goodman Group Stapled Sec 121,418 532,297 2.4 Mirvac Group Stapled Sec 290,942 458,421 2.1 Westfield Group Stapled Sec 85,570 812,933 3.6 Belgium (1.2%) Warehouses De Pauw 3,681 276,649 1.2 Canada (7.0%) Allied Properties REIT 11,900 371,959 1.7 Artis Real Estate Inv Trust 12,515 178,356 0.8 Canadian Apartment
Properties REIT 19,800 382,456 1.7 Canadian Real Estate Inv Trust 2,900 118,417 0.5 Dundee Real Estate
Investment 'A' 2,000 52,657 0.2 H&R Real Estate Inv Trust 16,800 347,948 1.5 RioCan Real Estate Inv Trust 5,286 127,534 0.6 Finland (2.1%) Technopolis Oyj 82,813 480,517 2.1 France (2.1%) ICADE SA 4,850 480,015 2.1 Germany (2.5%) Alstria Office REIT 42,215 566,119 2.5 Hong Kong (3.5%) Link REIT 117,000 575,418 2.6 Wharf (Hldgs) 32,000 204,614 0.9 Japan (8.5%) GLP J-REIT 152 153,350 0.7 GLP J-REIT-RegS 97 97,862 0.5 Japan Logistics Fd 101 227,528 1.0 Japan Real Estate Inv 46 231,374 1.0 Kenedix Office Investment 19 94,460 0.4 Mitsui Fudosan 12,000 366,927 1.6 Nippon Prologis REIT-RegS 140 283,032 1.3 ORIX JREIT 358 447,739 2.0 Netherlands (8.3%) Unibail-Rodamco SE-NL List 4,031 1,047,255 4.6 Vastned Retail 12,643 622,864 2.8 Wereldhave NV 2,319 197,491 0.9 Singapore (3.9%) Ascendas Real Estate Inv Trust 83,415 149,909 0.7 CapitaCommercial Trust 359,000 423,931 1.9 CapitaLand Ltd 28,000 64,347 0.3
(Continued)
Holding
Fair value
US$
% of net
assets CapitaMalls Asia 55,000 78,287 0.3 Global Logistics Properties 72,000 151,724 0.7 United Kingdom (16.5%) British Land 96,207 1,048,961 4.7 Hammerson plc 109,813 1,014,235 4.5 Helical Bar 64,848 404,066 1.8 Safestore Hldgs 222,827 880,423 3.9 Segro plc 65,816 364,287 1.6 United States (34.4%) Avalonbay Communities 3,600 472,752 2.1 Boston Properties REIT 3,300 377,949 1.7 Brandywine Realty Trust 19,200 277,632 1.2 CBL & Associates Prop Dep
Pref 'D' 15,000 376,950 1.7 Corporate Office Properties
Trust 8,700 231,768 1.0 DCT Industrial Trust 36,700 289,196 1.3 DDR Corp 18,200 299,936 1.3 Diamondrock Hospitality 11,100 130,425 0.6 Digital Realty Trust 4,400 233,552 1.0 Duke Realty 18,200 307,216 1.4 Education Realty Trust 23,400 230,958 1.0 Equity One 17,800 397,652 1.8 Extra Space Storage 3,100 150,381 0.7 General Growth Properties 13,600 299,200 1.3 Health Care REIT 4,500 268,200 1.2 Healthcare Realty Trust 4,100 99,015 0.4 Highwoods Properties 10,400 399,464 1.8 Lasalle Hotel Properties 5,800 181,598 0.8 Liberty Property Trust 9,300 343,728 1.5 Macerich Co 3,800 236,854 1.1 Mid-America Apartment
Communities 3,200 218,464 1.0 National Retail Properties 4,200 144,144 0.6 Prologis Inc 16,100 657,363 2.9 Realty Income 4,900 200,214 0.9 Select Income REIT 4,300 130,161 0.6 Simon Property Group 2,200 360,800 1.6 Ventas Inc 2,874 174,078 0.8 Vornado Realty Trust 2,600 256,256 1.1 22,653,366 100.7 (II) Derivatives (-1.0%) Forward foreign exchange ccontracts (-1.0%) (224,085) (1.0) Total Listed/Quoted Investments 22,429,281 99.7 ---------- -----
- 111 -

JJPMORGAN GLOBAL PROPERTY INCOME FUND SSemi--aannual report for the
pperiod ended 31 March 2014
IInvestment Portfolio (Continued) As at 31 March 2014 (Unaudited)
Holding
Fair value
US$
% of net
assets Unlisted//Unquoted Investments (0.0%) Equities (0.0%) Malta (0.0%) BGP Hldgs 193,047 0 0.0 Total Unlisted/Unquoted
IInvestments 0 0.0 ---------- ---- Total Investments 22,429,281 99.7 Other net assets 65,905 0.3 Net assets attributable to holders of
rredeemable units at 31 March 2014 22,495,186 100.0 Total investments, at cost 21,002,125
Statement of Movements in Portfolio Holdings For the period ended 31 March 2014 (Unaudited) % holdings
of net assets 31.3.2014 30.9.2013 Listed/Quoted Investments Equities United States 34.4 33.2 United Kingdom 16.5 12.7 Australia 10.7 14.0 Japan 8.5 11.8 Netherlands 8.3 5.2 Canada 7.0 7.6 Singapore 3.9 5.7 Hong Kong 3.5 5.1 Germany 2.5 1.3 Finland 2.1 1.2 France 2.1 1.4 Belgium 1.2 0.8 Derivatives Forward foreign exchange contracts (1.0) (1.0) Total Listed/Quoted Investments 99.7 99.0 ---- ---- Unlisted/Unquoted Investments Equities Malta 0.0 0.0 Total Unlisted/Unquoted Investments 0.0 0.0 ---- ---- Total iinvestments 99.7 99.0 Other net assets 0.3 1.0 Net assets attributable to holders of
rredeemable units 100.0 100.0
- 112 -

JJPMORGAN GLOBAL PROPERTY INCOME FUND SSemi--aannual report for the
pperiod ended 31 March 2014
SStatement of Financial Position As at 31 March 2014 (Unaudited) 31.3.2014 30.9.2013 US$ US$ Assets Cash at banks 73,325 227,077 Amounts due from brokers 740,469 89,607 Amounts receivable on allotment 15,446 384,059 Investments 22,653,366 31,836,375 Dividend and other accounts
receivable 100,613 82,491 Total assets 23,583,219 32,619,609 ---------- ---------- Liabilities Amounts due to brokers 361,565 67,419 Amounts payable on redemption 353,323 200,699 Distribution payable [Note 5] 109,157 138,892 Derivatives 224,085 333,173 Other accounts payable 39,903 73,996 Liabilities (excluding net aassets
attributable to holders of redeemable units) 1,088,033 814,179
---------- ---------- Net assets attributable to holders
oof redeemable units [Note 3] 22,495,186 31,805,430
Statement of Comprehensive Income For the period ended 31 March 2014 (Unaudited) 1.10.2013
to 31.3.2014
1.10.2012 to
31.3.2013 US$ US$ Income Net gains on investments and
derivatives [Note 4] 1,292,795 3,406,029 Dividend income 520,046 465,909 Net foreign currency exchange
gains/(losses) 5,078 (2,213) Other income 394 15 1,818,313 3,869,740 ---------- ---------- Expenses Management fee 203,613 172,585 Transaction costs 18,614 42,623 Registrar's fee 16,466 14,095 Valuation fee 8,610 8,400 Trustee's fee 8,150 6,905 Auditor's fee 4,986 5,051 Safe custody and bank charges 4,069 5,740 Printing and publication expenses 2,974 949 Legal and professional expenses 684 220 Other operating expenses 680 271 268,846 256,839 ---------- ---------- Net operating profit 1,549,467 3,612,901 ---------- ---------- Finance costs Distribution [Note 5] (126,326) (117,839) Interest paid (54) (1) (126,380) (117,840) ---------- ---------- Profit before taxation 1,423,087 3,495,061 Taxation (112,103) (100,385) 1,310,984 3,394,676 Change in cumulative difference
arising from the fair value adjustment of units of the Fund - 43,058
Increase in net assets
attributable to holders of redeemable units and total ccomprehensive income 1,310,984 3,437,734
The notes on pages 115 to 118 form part of these financial statements.
- 113 -

JJPMORGAN GLOBAL PROPERTY INCOME FUND SSemi--aannual report for the
pperiod ended 31 March 2014
SStatement of Changes in Net Assets Attributable to Holders of Redeemable Units For the period ended 31 March 2014 (Unaudited) 1.10.2013
to 31.3.2014
1.10.2012 to
31.3.2013 US$ US$ Net assets attributable to holders
of redeemable units at the beginning of the period 31,805,430 20,607,973
---------- ---------- Allotment of redeemable units 3,078,007 11,012,323 Redemption of redeemable units (13,699,235) (6,084,651) Net (redemption)/allotment (10,621,228) 4,927,672 ---------- ---------- 21,184,202 25,535,645 Increase in net assets
attributable to holders of redeemable units and total comprehensive income 1,310,984 3,437,734
Net assets attributable to holders
of redeemable units at the end oof the period 22,495,186 28,973,379
Statement of Cash Flows For the period ended 31 March 2014 (Unaudited) 1.10.2013
to 31.3.2014
1.10.2012 to
31.3.2013 US$ US$ Operating activities Purchase of investments and
derivatives (3,614,783) (16,958,037) Proceeds from disposal of
investments and derivatives 13,623,842 12,221,087 Dividend received 502,147 456,538 Trustee's fee paid (8,619) (6,557) Transaction costs paid (19,878) (42,907) Registrar's fee paid (33,030) (27,279) Tax paid (113,624) (100,385) Management fee paid (215,341) (163,903) Others (17,892) (27,693) Net cash inflow/(outflow) from
ooperating activities 10,102,822 (4,649,136) ---------- ---------- Financing activities Interest paid (54) (1) Receipts on allotment of
redeemable units 3,446,620 10,710,159 Payments on redemption of
redeemable units (13,546,611) (5,785,289) Distribution paid (156,061) (226,516) Net cash (outflow)/inflow from
ffinancing activities (10,256,106) 4,698,353 ---------- ---------- (Decrease)/increase in cash
aand cash equivalents (153,284) 49,217 Cash and cash equivalents at the
beginning of the period 227,077 787,476 Exchange losses on cash and cash
equivalents (468) (179) Cash and cash equivalents at
tthe end of the period 73,325 836,514 Analysis of balances of cash and cash equivalents: Cash at banks 73,325 836,514
The notes on pages 115 to 118 form part of these financial statements.
- 114 -

JJPMORGAN GLOBAL PROPERTY INCOME FUND SSemi--aannual report for the
pperiod ended 31 March 2014
NNotes to the Financial Statements
1 The Fund
JPMorgan Global Property Income Fund (the "Fund") was established under a Trust Deed dated 6 July 2005, as amended, and is governed by the laws of Hong Kong. The Fund is authorized by the Securities and Futures Commission of Hong Kong.
The investment objective of the Fund is to achieve a high level of current income and long-term capital appreciation primarily through investing in securities that are listed on any stock exchange and are principally engaged in or related to the property industry or which own significant property assets. The Fund does not invest in real estate directly.
Pursuant to the Supplemental Trust Deed dated 4 January 2013, the Manager may decide to issue separate classes (each a "Class") whose assets will be commonly invested but where a specific fee structure, currency or distribution policy may be applied. Each Class may have a different charging structure with the result that the net asset value attributable to each Class may differ.
All unitholders' rights with regard to the convening, voting or otherwise acting at any meeting of unitholders are the same.
2 Summary of principal accounting policies
(a) Accounting policies of interim financial statements
The accounting policies and methods of computation used in the preparation of these unaudited condensed interim financial statements are consistent with those used in the annual financial statements for the year ended 30 September 2013.
(b) Investments and derivatives
Classification
The Fund classifies its investments and derivatives as financial assets or financial liabilities at fair value through profit or loss. These financial assets or financial liabilities are held-for-trading as they are acquired or incurred principally for the purpose of selling or repurchasing in the near term or short-term profit taking.
All derivatives are carried in assets when amounts are receivable by the Fund and in liabilities when amounts are payable by the Fund.
The Fund makes short sales in which a borrowed security is sold in anticipation of a decline in the market value of that security, or it may use short sales for various arbitrage transactions. Short sales are classified as financial liabilities at fair value through profit or loss.
Recognition, derecognition and measurement
Purchases and sales of investments and derivatives are accounted for on the trade date basis. Investments and derivatives are initially recognized at fair value and are subsequently re-measured at fair value. Realized and unrealized gains and losses on investments and derivatives are recognized in the Statement of Comprehensive Income. Investments and derivatives are derecognized when the rights to receive cash flows from the investments and derivatives have expired or the Fund has transferred substantially all risks and rewards of ownership.
Fair value estimation
Fair value is the price that would be received to sell an asset or paid to transfer a liability in an orderly transaction between market participants at the measurement date. The fair value of financial assets and liabilities traded in active markets are based on last traded prices. Prior to 1 October 2012, investments that are listed or traded on an exchange and investments with prices quoted in over-the-counter markets or by market makers, are fair valued based on quoted "bid" prices on long investments and quoted "ask" prices on investments sold short. The Fund early adopted Hong Kong Financial Reporting Standard 13, "Fair Value Measurement", with effect from 1 October 2012, it changed its fair valuation input to utilize the last traded market price for both financial assets and financial liabilities where the last traded price falls within the bid-ask spread. When trading in the securities of an investee company is suspended, the investment is valued at the Manager's estimate of its fair value.
Debt securities are fair valued based on quoted prices inclusive of accrued interest.
Investments in collective investment schemes are stated at fair value based on the net asset value per unit of the respective funds as determined by the administrators of the relevant funds or stated at last traded prices if the collective investment schemes are listed or traded on an exchange.
Open future and swap contracts are valued at last traded prices for both long and short positions at the valuation date. The differences between the last traded prices and the contract prices are recognized in the Statement of Comprehensive Income.
- 115 -

JJPMORGAN GLOBAL PROPERTY INCOME FUND SSemi--aannual report for the
pperiod ended 31 March 2014
Open option contracts are valued at last traded prices for both long and short positions at the valuation date. The differences between the last traded prices and the premium amounts/contract prices are recognized in the Statement of Comprehensive Income.
Forward foreign exchange contracts are valued at the forward rates ruling at the valuation date. The differences between the forward rates and the contract rates are recognized in the Statement of Comprehensive Income.
((c) Securities borrowing
The Fund may enter into securities borrowing arrangements for short sale purposes. Short positions represent obligations to deliver securities sold but not yet purchased, and are accounted for as investments and valued at their fair value. Securities borrowed during the period/year are off-balance sheet transactions and are therefore not included in the investment portfolio of the Fund. Collateral placed for the purpose of securities borrowed generally consist of cash collateral and are included in the Statement of Financial Position separately.
(d) Foreign currency translation
Functional and presentation currency
The Fund has adopted United States dollar as its functional and presentation currency.
Transactions and balances
Foreign currency transactions are translated into the functional currency using the exchange rates prevailing at the dates of the transactions.
Foreign exchange gains and losses resulting from the settlement of such transactions and from the translation of assets and liabilities denominated in foreign currencies at period/year end exchange rates are recognized in the Statement of Comprehensive Income.
Foreign exchange gains and losses relating to cash and cash equivalents are presented in the Statement of Comprehensive Income within "Net foreign currency exchange gains/losses". Foreign exchange gains and losses relating to the financial assets and liabilities carried at fair value through profit or loss are presented in the Statement of Comprehensive Income within "Net gains/losses on investments and derivatives".
(e) Proceeds and payments on allotment and redemption of units
The net asset value per unit is computed for each dealing day. The price at which units are allotted or redeemed is calculated by reference to the net asset value per unit as at the close of business on the relevant dealing day in accordance with the provisions of the Fund's Trust Deed dated 6 July 2005, as amended, which may be different from the accounting policies stated in the financial statements.
Units of the Fund are redeemable at the option of the holders of redeemable units and are classified as a financial liability in the Statement of Financial Position which represents the net assets attributable to holders of redeemable units (or "net asset value" or "net assets" or "NAV") and is carried at the redemption amount that would be payable at the Statement of Financial Position date if the holders of redeemable units exercised the right to redeem units of the Fund.
- 116 -

JJPMORGAN GLOBAL PROPERTY INCOME FUND SSemi--aannual report for the
pperiod ended 31 March 2014
33 Number of units in issue and net assets attributable to holders of redeemable units (per unit)
31.3.2014
USD Class (div) Units Number of units in issue: 2,482,007.642 US$ Net assets attributable to
holders of redeemable units 22,495,186
Net assets attributable to
holders of redeemable units (per unit) 9.06
30.9.2013
USD Class (div) Units Number of units in issue: 3,684,124.606 US$ Net assets attributable to
holders of redeemable units 31,805,430
Net assets attributable to
holders of redeemable units (per unit) 8.63
4 Net gains on investments and derivatives
1.10.2013
to 31.3.2014
1.10.2012 to
31.3.2013 US$ US$ Change in unrealized gains/losses in value of investments and derivatives 1,219,294 1,542,197 Realized gains on sale of investments and derivatives 73,501 1,863,832 1,292,795 3,406,029
- 117 -

JJPMORGAN GLOBAL PROPERTY INCOME FUND SSemi--aannual report for the
pperiod ended 31 March 2014
55 Distribution
It is the intention of the manager of the Fund to have at least 85% of the income attributable to the distribution class(es) respectively in respect of each accounting period, after charging the expenses attributable to these distribution class(es) respectively, to be distributed to unitholders of these distribution class(es) respectively.
1.10.2013 to
31.3.2014
1.10.2012 to
31.3.2013 US$ US$ Net operating profit 1,549,467 3,612,901 Adjustments: Net gains on investments and derivatives (1,292,795) (3,406,029) Net foreign currency exchange gains/(losses) (5,078) 2,213 Transaction costs 18,614 42,623 Interest paid (54) (1) Taxation (112,103) (100,385) Amount available for distribution 158,051 151,322 Distribution of US$0.0056 per unit on 3,066,001.857 units of USD Class (div) ex on 31 December 2013 and pay on 9 January 2014 (17,169)
(US$0.0270 per unit on 2,707,390.173 units of USD Class (div) ex on 31 December 2012 and pay on 9 January 2013)
(73,100)
US$0.0439 per unit on 2,486,480.963 units of USD Class (div) ex on 31 March 2014 and pay on 8 April 2014 (109,157)
(US$0.0139 per unit on 3,218,644.206 units of USD Class (div) ex on 28 March 2013 and pay on 10 April 2013)
(44,739)
Total distribution to holders of redeemable units (126,326) (117,839)
In the event that the amount available for distribution is insufficient to pay distributions as the Fund declares, the Manager may in its discretion determine that such distributions be paid from capital.
6 Soft commission arrangements
The Investment Manager has entered into soft commission arrangements with brokers under which certain goods and services used to support investment decision making are received by the Investment Manager. The Investment Manager does not make direct payment for these services but transacts an agreed amount of business with the brokers on behalf of the Fund. Commission is paid from the Fund on these transactions.
The goods and services must be of demonstrable benefit to the Fund and may include research and advisory services; economic and political analysis; portfolio analysis, including valuation and performance measurement; market analysis, data and quotation services, computer hardware and software incidental to the above goods and services; clearing and custodian services and investment-related publications.
- 118 -

JJPMORGAN GREATER CHINA SMALLER COMPANIES FUND SSemi--aannual report for the
pperiod ended 31 March 2014
IInvestment Portfolio As at 31 March 2014 (Unaudited)
Holding
Fair value
HK$
% of net
assets Listed/Quoted Investments (98.0%) Equities (98.0%) China (43.3%) Asia Cement China Hldgs 767,000 4,717,050 1.0 Chaowei Power Hldgs 1,266,000 4,000,560 0.9 China Shipping Development
'H' 1,006,000 4,446,520 0.9 China Singyes Solar
Technologies 403,000 4,940,780 1.0 China Suntien Green Energy
'H' 2,477,000 6,365,890 1.4 China Taiping Insurance Hldgs 303,800 4,216,744 0.9 CPMC Hldgs 531,000 3,270,960 0.7 Dah Chong Hong Hldgs 1,768,000 8,928,400 1.9 Greatview Aseptic Packaging 1,398,000 5,759,760 1.2 Greentown China Hldgs 524,000 4,391,120 0.9 Haier Electronics Group 602,000 12,642,000 2.7 Haitian Intl Hldgs 620,000 9,647,200 2.0 Hisense Kelon Electrical Hldgs
'H' 356,000 3,382,000 0.7 Home Inns & Hotels Mgt ADR 28,433 7,121,760 1.5 Honworld Group 536,500 3,809,150 0.8 Hopefluent Group Hldgs 2,056,487 5,326,301 1.1 Huadian Fuxin Energy 'H' 2,250,000 9,517,500 2.0 Huaneng Renewables 'H' 1,224,000 3,219,120 0.7 Intime Retail (Group) 687,000 5,736,450 1.2 Kingboard Chemical Hldgs 523,061 7,919,144 1.7 Kingboard Laminates Hldgs 1,900,500 5,397,420 1.1 Minth Group 850,000 13,429,999 2.8 Phoenix Healthcare Group 313,000 3,530,640 0.8 Phoenix Satellite TV Hldgs 1,870,000 4,880,700 1.0 Poly Culture Group 'H' 104,600 3,551,170 0.8 REXLot Hldgs 4,054,048 3,648,643 0.8 Sinotrans Ltd 'H' 2,473,000 9,644,700 2.0 Skyworth Digital Hldgs 2,511,896 10,700,677 2.3 Sunac China Hldgs 1,695,000 7,627,500 1.6 Texhong Textile Group 329,500 3,011,630 0.6 Towngas China 1,200,000 11,376,000 2.4 Weiqiao Textile 'H' 260,500 1,114,940 0.2 Yuexiu REIT 2,128,000 8,171,520 1.7 Hong Kong (32.3%) Chong Hing Bank 24,932 675,657 0.1 Dah Sing Banking Group 844,897 10,341,539 2.2 Dah Sing Financial Hldgs 262,000 9,563,000 2.0 Dorsett Hospitality Intl 2,295,908 3,374,985 0.7 Emperor Watch & Jewellery 7,090,000 4,183,100 0.9 Far East Consortium Intl 617,274 1,666,640 0.4 Guotai Junan Intl Hldgs 1,951,000 8,116,160 1.7 I.T Ltd 1,570,000 3,202,800 0.7 Intl Housewares Retail 1,350,000 5,386,500 1.1 Lifestyle Intl Hldgs 567,000 8,947,260 1.9 Louis XIII Hldgs 1,012,500 8,596,125 1.8 Luk Fook Hldgs Intl 138,000 3,381,000 0.7 Man Wah Hldgs 832,000 10,899,200 2.3 Pacific Textile Hldgs 398,000 4,051,640 0.9 Prosperity REIT 2,955,000 6,619,200 1.4 Sa Sa Intl Hldgs 1,396,000 8,683,120 1.8
(Continued)
Holding
Fair value
HK$
% of net
assets Shun Tak Hldgs 2,568,750 10,249,313 2.2 Singamas Container Hldgs 5,472,000 9,740,160 2.1 SOCAM Development 678,000 4,752,780 1.0 Techtronic Industries 488,000 10,540,800 2.2 Texwinca Hldgs 290,000 2,415,700 0.5 Tsui Wah Hldgs 1,940,000 8,730,000 1.8 Xinyi Glass Hldgs 1,466,000 9,250,460 1.9 Taiwan (22.4%) Casetek Hldgs 69,000 2,917,634 0.6 China Steel Chemical 144,000 6,382,420 1.3 Chipbond Technology 318,000 4,357,958 0.9 CTCI Corp 270,000 3,139,628 0.7 Dynacolor Inc 297,000 6,317,083 1.3 Epistar Corp 237,000 4,413,055 0.9 GeoVision Inc 134,000 6,963,196 1.5 Giant Manufacturing 159,000 8,383,804 1.8 Huaku Development 192,227 3,652,808 0.8 Hung Poo Real Estate Dev 85,000 607,331 0.1 Intai Technology 55,000 2,465,750 0.5 Johnson Health Tech 242,369 4,506,855 0.9 Kindom Construction 412,000 3,316,332 0.7 Merida Industry 96,000 4,939,651 1.0 PCHome Online 225,430 13,092,427 2.8 Rotam Global Agrosciences 317,135 5,186,243 1.1 Ruentex Development 451,777 6,409,925 1.4 Sinmag Equipment 114,100 5,173,438 1.1 Sino-American Silicon
Products 465,000 6,313,262 1.3 Sunspring Metal 185,000 4,128,093 0.9 WPG Hldgs 393,480 3,683,440 0.8 Total Listed/Quoted Investments 465,161,420 98.0 Other net assets 9,470,258 2.0 Net assets attributable tto holders of
redeemable units at 31 March 2014 474,631,678 100.0 Total investments, at cost 442,098,491
- 119 -

JJPMORGAN GREATER CHINA SMALLER COMPANIES FUND SSemi--aannual report for the
pperiod ended 31 March 2014
SStatement of Movements in Portfolio Holdings For the period ended 31 March 2014 (Unaudited) % holdings
of net assets 31.3.2014 30.9.2013 Listed/Quoted Investments Equities China 43.3 42.3 Hong Kong 32.3 32.6 Taiwan 22.4 21.9 Total Listed/Quoted Investments 98.0 96.8 Other net assets 2.0 3.2 Net aassets attributable to holders of
redeemable units 100.0 100.0
- 120 -

JJPMORGAN GREATER CHINA SMALLER COMPANIES FUND SSemi--aannual report for the
pperiod ended 31 March 2014
SStatement of Financial Position As at 31 March 2014 (Unaudited) 31.3.2014 30.9.2013 HK$ HK$ Assets Cash at banks 5,009,529 2,691,551 Amounts due from brokers 1,212,175 709,129 Amounts receivable on allotment 9,928,209 4,941,785 Investments 465,161,420 211,264,662 Dividend receivable 221,921 430,750 Total assets 481,533,254 220,037,877 ---------- ---------- Liabilities Amounts due to brokers 5,514,488 916,475 Amounts payable on redemption 538,409 205,073 Other accounts payable 848,679 613,887 Total liabilities 6,901,576 1,735,435 ---------- ---------- Net assets attributable to holders
oof redeemable units [Note 3] 474,631,678 218,302,442 Equity 474,631,678 218,302,442
Statement of Comprehensive Income For the period ended 31 March 2014 (Unaudited) 1.10.2013
to 31.3.2014
1.10.2012 to
31.3.2013 HK$ HK$ Income Net gains on investments and
derivatives [Note 4] 11,730,949 32,749,449 Dividend income 1,524,481 628,564 Interest on deposits 2,784 - Net foreign currency exchange
(losses)/gains (98,887) 16,402 13,159,327 33,394,415 ---------- ---------- Expenses Management fee 2,932,778 1,709,436 Transaction costs 1,128,491 487,472 Trustee's fee 95,880 58,621 Registrar's fee 81,406 73,559 Auditor's fee 77,711 75,788 Valuation fee 66,788 65,133 Safe custody and bank charges 40,679 32,417 Printing and publication expenses 19,403 11,593 Legal and professional expenses 14,741 14,759 Other operating expenses 1,369 2,250 4,459,246 2,531,028 ---------- ---------- Net operating profit 8,700,081 30,863,387 Finance costs Interest paid (1,171) (270) Profit before taxation 8,698,910 30,863,117 Taxation - (49,570) Increase in net assets
attributable to holders of redeemable units and total ccomprehensive income 8,698,910 30,813,547
The notes on pages 123 to 125 form part of these financial statements.
- 121 -

JJPMORGAN GREATER CHINA SMALLER COMPANIES FUND SSemi--aannual report for the
pperiod ended 31 March 2014
SStatement of Changes in Net Assets Attributable to Holders of Redeemable Units For the period ended 31 March 2014 (Unaudited) 1.10.2013
to 31.3.2014
1.10.2012 to
31.3.2013 HK$ HK$ Net assets attributable to holders
of redeemable units at the beginning of the period 218,302,442 186,934,936
---------- ---------- Allotment of redeemable units 353,439,363 21,606,248 Redemption of redeemable units (105,809,037) (35,461,867) Net allotment/(redemption) 247,630,326 (13,855,619) ---------- ---------- 465,932,768 173,079,317 Increase in net assets
attributable to holders of redeemable units and total comprehensive income 8,698,910 30,813,547
Net assets attributable to holders
oof redeemable units at the end of the period 474,631,678 203,892,864
Statement of Cash Flows For the period ended 31 March 2014 (Unaudited) 1.10.2013
to 31.3.2014
1.10.2012 to
31.3.2013 HK$ HK$ Operating activities Purchase of investments and
derivatives (335,278,207) (67,445,680) Proceeds from disposal of
investments and derivatives 97,200,004 80,944,913 Dividend received 1,733,310 949,163 Interest received 2,784 - Tax paid (259) (49,570) Trustee's fee paid (86,329) (57,791) Registrar's fee paid (150,599) (145,284) Transaction costs paid (1,156,804) (514,621) Management fee paid (2,581,233) (1,685,404) Others (337,340) (259,711) Net cash (outflow)/inflow from
ooperating activities (240,654,673) 11,736,015 ---------- ---------- Financing activities Interest paid (1,171) (270) Receipts on allotment of
redeemable units 348,452,939 21,383,305 Payments on redemption of
redeemable units (105,475,701) (35,939,716) Net cash inflow/(outflow) from
ffinancing activities 242,976,067 (14,556,681) ---------- ---------- Increase/(decrease) in cash and
ccash equivalents 2,321,394 (2,820,666) Cash and cash equivalents at the
beginning of the period 2,691,551 4,507,909 Exchange losses on cash and cash
equivalents (3,416) (7,154) Cash and cash equivalents at
tthe end of the period 5,009,529 1,680,089 Analysis of balances of cash and cash equivalents: Cash at banks 5,009,529 1,680,089
The notes on pages 123 to 125 form part of these financial statements.
- 122 -

JJPMORGAN GREATER CHINA SMALLER COMPANIES FUND SSemi--aannual report for the
pperiod ended 31 March 2014
NNotes to the Financial Statements
1 The Fund
JPMorgan Greater China Smaller Companies Fund (the "Fund") was established under a Trust Deed dated 26 August 2009, as amended, and is governed by the laws of Hong Kong. The Fund is authorized by the Securities and Futures Commission of Hong Kong.
The investment objective of the Fund is to provide investors with long-term capital growth by investing primarily in the securities of small to medium-sized companies in the People's Republic of China, Hong Kong and Taiwan ("Greater China").
Pursuant to the Supplemental Trust Deed dated 4 January 2013, the Manager may decide to issue separate classes (each a "Class") whose assets will be commonly invested but where a specific fee structure, currency or distribution policy may be applied. Each Class may have a different charging structure with the result that the net asset value attributable to each Class may differ.
All unitholders' rights with regard to the convening, voting or otherwise acting at any meeting of unitholders are the same.
2 Summary of principal accounting policies
(a) Accounting policies of interim financial statements
The accounting policies and methods of computation used in the preparation of these unaudited condensed interim financial statements are consistent with those used in the annual financial statements for the year ended 30 September 2013.
(b) Investments and derivatives
Classification
The Fund classifies its investments and derivatives as financial assets or financial liabilities at fair value through profit or loss. These financial assets or financial liabilities are held-for-trading as they are acquired or incurred principally for the purpose of selling or repurchasing in the near term or short-term profit taking.
All derivatives are carried in assets when amounts are receivable by the Fund and in liabilities when amounts are payable by the Fund.
The Fund makes short sales in which a borrowed security is sold in anticipation of a decline in the market value of that security, or it may use short sales for various arbitrage transactions. Short sales are classified as financial liabilities at fair value through profit or loss.
Recognition, derecognition and measurement
Purchases and sales of investments and derivatives are accounted for on the trade date basis. Investments and derivatives are initially recognized at fair value and are subsequently re-measured at fair value. Realized and unrealized gains and losses on investments and derivatives are recognized in the Statement of Comprehensive Income. Investments and derivatives are derecognized when the rights to receive cash flows from the investments and derivatives have expired or the Fund has transferred substantially all risks and rewards of ownership.
Fair value estimation
Fair value is the price that would be received to sell an asset or paid to transfer a liability in an orderly transaction between market participants at the measurement date. The fair value of financial assets and liabilities traded in active markets are based on last traded prices. Prior to 1 October 2012, investments that are listed or traded on an exchange and investments with prices quoted in over-the-counter markets or by market makers, are fair valued based on quoted "bid" prices on long investments and quoted "ask" prices on investments sold short. The Fund early adopted Hong Kong Financial Reporting Standard 13, "Fair Value Measurement", with effect from 1 October 2012, it changed its fair valuation input to utilize the last traded market price for both financial assets and financial liabilities where the last traded price falls within the bid-ask spread. When trading in the securities of an investee company is suspended, the investment is valued at the Manager's estimate of its fair value.
Debt securities are fair valued based on quoted prices inclusive of accrued interest.
Investments in collective investment schemes are stated at fair value based on the net asset value per unit of the respective funds as determined by the administrators of the relevant funds or stated at last traded prices if the collective investment schemes are listed or traded on an exchange.
Open future and swap contracts are valued at last traded prices for both long and short positions at the valuation date. The differences between the last traded prices and the contract prices are recognized in the Statement of Comprehensive Income.
Open option contracts are valued at last traded prices for both long and short positions at the valuation date. The differences between the last traded prices and the premium amounts/contract prices are recognized in the Statement of Comprehensive Income.
- 123 -

JJPMORGAN GREATER CHINA SMALLER COMPANIES FUND SSemi--aannual report for the
pperiod ended 31 March 2014
Forward foreign exchange contracts are valued at the forward rates ruling at the valuation date. The differences between the forward rates and the contract rates are recognized in the Statement of Comprehensive Income.
((c) Securities borrowing
The Fund may enter into securities borrowing arrangements for short sale purposes. Short positions represent obligations to deliver securities sold but not yet purchased, and are accounted for as investments and valued at their fair value. Securities borrowed during the period/year are off-balance sheet transactions and are therefore not included in the investment portfolio of the Fund. Collateral placed for the purpose of securities borrowed generally consist of cash collateral and are included in the Statement of Financial Position separately.
(d) Foreign currency translation
Functional and presentation currency
The Fund has adopted Hong Kong dollar as its functional and presentation currency.
Transactions and balances
Foreign currency transactions are translated into the functional currency using the exchange rates prevailing at the dates of the transactions.
Foreign exchange gains and losses resulting from the settlement of such transactions and from the translation of assets and liabilities denominated in foreign currencies at period/year end exchange rates are recognized in the Statement of Comprehensive Income.
Foreign exchange gains and losses relating to cash and cash equivalents are presented in the Statement of Comprehensive Income within "Net foreign currency exchange gains/losses". Foreign exchange gains and losses relating to the financial assets and liabilities carried at fair value through profit or loss are presented in the Statement of Comprehensive Income within "Net gains/losses on investments and derivatives".
(e) Proceeds and payments on allotment and redemption of units
The net asset value per unit is computed for each dealing day. The price at which units are allotted or redeemed is calculated by reference to the net asset value per unit as at the close of business on the relevant dealing day in accordance with the provisions of the Fund's Trust Deed dated 26 August 2009, as amended, which may be different from the accounting policies stated in the financial statements.
3 Number of units in issue and net assets attributable to holders of redeemable units (per unit)
31.3.2014
HKD Class (acc) Units Number of units in issue: 48,055,336.096 HK$ Net assets attributable to
holders of redeemable units 474,631,678
Net assets attributable to
holders of redeemable units (per unit) 9.88
- 124 -

JJPMORGAN GREATER CHINA SMALLER COMPANIES FUND SSemi--aannual report for the
pperiod ended 31 March 2014
30.9.2013
HKD Class (acc) Units Number of units in issue: 23,367,325.909 HK$ Net assets attributable to
holders of redeemable units 218,302,442
Net assets attributable to
holders of redeemable units (per unit) 9.34
44 Net gains on investments and derivatives
1.10.2013
to 31.3.2014
1.10.2012 to
31.3.2013 HK$ HK$ Change in unrealized gains/losses in value of investments and derivatives 675,683 25,374,830 Realized gains on sale of investments and derivatives 11,055,266 7,374,619 11,730,949 32,749,449
5 Soft commission arrangements
The Investment Manager has entered into soft commission arrangements with brokers under which certain goods and services used to support investment decision making are received by the Investment Manager. The Investment Manager does not make direct payment for these services but transacts an agreed amount of business with the brokers on behalf of the Fund. Commission is paid from the Fund on these transactions.
The goods and services must be of demonstrable benefit to the Fund and may include research and advisory services; economic and political analysis; portfolio analysis, including valuation and performance measurement; market analysis, data and quotation services, computer hardware and software incidental to the above goods and services; clearing and custodian services and investment-related publications.
6 Distribution
No distribution was made during the period (31 March 2013: nil).
- 125 -

JJPMORGAN INDIA FUND SSemi--aannual report for the
pperiod ended 31 March 2014
DDistributor Status The Fund has been certified by HMRC in the UK as a distributing fund in respect of the period from 23 November 1989 to 30 September 2010. The principal effect of this certification is that for unitholders resident or ordinarily resident in the UK for taxation purposes any gains accruing on the sale, redemption or other disposal of units during the period will be taxed in the UK as a capital gain and not as income. This treatment will continue under the new UK reporting fund regime provided the Fund does not invest more than 5% of its assets in other offshore funds which are not themselves reporting funds. There will be no need to formally apply for reporting fund status as the Fund is transparent for UK tax purposes and therefore considered out of scope of the requirements of this new regime. These are now known as “special category transparent offshore funds”. As noted, the Fund is transparent for UK income tax purposes and UK investors are subject to UK capital gains tax on disposal of their units. UK investors are subject to tax on their share of income of the Fund on an arising basis. Information has been provided to UK investors of the amount of their share of the underlying income, expenses and overseas tax suffered.
Investment Portfolio As at 31 March 2014 (Unaudited)
Holding
Fair value
US$
% of net
assets Listed/Quoted Investments (99.3%) Equities (99.3%) India (99.3%) Automobiles (8.5%) Mahindra & Mahindra 1,842,864 30,261,572 2.4 Maruti Suzuki India 469,040 15,889,617 1.3 Tata Motors 8,076,459 53,910,677 4.4 Tata Motors 'A' 1,339,000 4,537,881 0.4 Chemicals (1.7%) Godrej Industries 2,610,556 13,795,328 1.1 Grasim Industries 137,904 6,731,757 0.6 Commercial Banks (19.4%) Axis Bank (DEMAT) 523,592 12,804,322 1.1 HDFC Bank 9,027,570 120,663,605 9.8 ICICI Bank 452,947 9,442,700 0.8 IndusInd Bank 3,919,368 32,934,570 2.7 ING Vysya Bank 2,236,661 23,777,572 1.9 Kotak Mahindra Bank 2,945,054 38,515,374 3.1 Construction & Engineering (1.6%) Larsen & Toubro 947,439 20,177,448 1.6 Construction Materials (6.6%) ACC Ltd 1,685,852 39,506,621 3.2 Ambuja Cements 11,339,708 38,392,381 3.1 Ultratech Cement 95,000 3,478,760 0.3
(Continued)
Holding
Fair value
US$
% of net
assets Consumer Finance (3.2%) Mahindra & Mahindra Fin
Services 6,122,045 25,832,062 2.1 Shriram Transport Finance 1,038,047 13,340,049 1.1 Diversified Financial Services (3.5%) IDFC Ltd 20,490,000 42,925,907 3.5 Electrical Equipment (0.6%) Bharat Heavy Electricals 2,316,006 7,602,712 0.6 Independent Power Producers & Energy Traders (1.6%) NTPC Ltd 9,626,734 19,326,810 1.6 IT Services (14.1%) HCL Technologies (DEMAT) 250,000 5,821,508 0.5 Infosys Ltd 1,859,229 102,197,278 8.3 Tata Consultancy Services 922,000 32,931,714 2.7 Wipro Ltd 3,489,705 31,740,261 2.6 Life Sciences Tools & Services (1.1%) Divi's Laboratories 594,000 13,585,242 1.1 Machinery (0.7%) Cummins India 830,000 8,294,094 0.7 Metals & Mining (1.6%) Hindalco Industries 8,301,805 19,704,146 1.6 Oil & Gas & Consumable Fuels (8.3%) Reliance Industries 6,519,253 101,599,811 8.3 Pharmaceuticals (6.6%) DR Reddy's Laboratories 664,783 28,539,280 2.3 Sun Pharma Advanced
Research 3,267,568 7,968,877 0.7 Sun Pharmaceutical Industries 4,565,142 43,933,448 3.6 Real Estate Management & DDevelopment (1.2%) Godrej Properties 2,505,610 8,971,907 0.7 Oberoi Realty 1,641,127 5,931,387 0.5 Thrifts & Mortgage Finance (9.9%) Housing Development Finance 8,175,000 120,990,959 9.9 Tobacco (6.4%) ITC Ltd 13,311,123 78,644,225 6.4 Wireless Telecommunication Services (2.7%) Bharti Airtel 5,024,018 26,729,988 2.2 Idea Cellular 2,678,300 6,164,048 0.5 Total Listed/Quoted Investments 1,217,595,898 99.3 Other net assets 8,296,116 0.7 Net assets attributable to holders of
rredeemable units at 31 March 2014 1,225,892,014 100.0
- 126 -

JJPMORGAN INDIA FUND SSemi--aannual report for the
pperiod ended 31 March 2014
IInvestment Portfolio (Continued) As at 31 March 2014 (Unaudited) Total investments, at cost 929,876,437
Statement of Movements in Portfolio Holdings For the period ended 31 March 2014 (Unaudited) % holdings
of net assets 31.3.2014 30.9.2013 Listed/Quoted Investments Equities India Commercial Banks 19.4 13.1 IT Services 14.1 14.2 Thrifts & Mortgage Finance 9.9 9.4 Automobiles 8.5 9.4 Oil & Gas & Consumable Fuels 8.3 8.4 Construction Materials 6.6 5.9 Pharmaceuticals 6.6 7.6 Tobacco 6.4 7.8 Diversified Financial Services 3.5 6.1 Consumer Finance 3.2 2.9 Wireless Telecommunication Services 2.7 5.2 Chemicals 1.7 2.4 Construction & Engineering 1.6 1.3 Metals & Mining 1.6 - Independent Power Producers & Energy
Traders 1.6 1.7 Real Estate Management & Development 1.2 1.0 Life Sciences Tools & Services 1.1 1.0 Machinery 0.7 0.5 Electrical Equipment 0.6 - Auto Components - 0.6 Biotechnology - 0.4 Total Listed/Quoted Investments 99.3 98.9 Other net assets 0.7 1.1 Net assets attributable to holders of
rredeemable units 100.0 100.0
- 127 -

JJPMORGAN INDIA FUND SSemi--aannual report for the
pperiod ended 31 March 2014
SStatement of Financial Position As at 31 March 2014 (Unaudited) 31.3.2014 30.9.2013 US$ US$ Assets Cash at banks 10,876,611 21,942,186 Amounts due from brokers 14,535,991 - Amounts receivable on allotment 5,768,113 3,155,259 Investments 1,217,595,898 1,106,110,493 Dividend and other accounts
receivable 961,362 382,887 Total assets 1,249,737,975 1,131,590,825 ---------- ---------- Liabilities Amounts due to brokers 3,039,064 - Amounts payable on redemption 19,216,232 11,691,940 Other accounts payable 1,590,665 1,668,206 Total liabilities 23,845,961 13,360,146 ---------- ---------- Net assets attributable to holders
oof redeemable units [Note 3] 1,225,892,014 1,118,230,679 Equity 1,225,892,014 1,118,230,679
Statement of Comprehensive Income For the period ended 31 March 2014 (Unaudited) 1.10.2013
to 31.3.2014
1.10.2012 to
31.3.2013 US$ US$ Income Net gains/(losses) on investments
and derivatives [Note 4] 227,110,609 (26,849,287) Dividend income 2,714,066 3,488,291 Interest on deposits 16,409 19,233 Net foreign currency exchange
losses (695,914) (485,769) Other income - 156 229,145,170 (23,827,376) ---------- ---------- Expenses Management fee 8,763,850 11,509,394 Transaction costs 640,590 573,399 Trustee's fee 155,374 201,028 Registrar's fee 132,162 141,517 Safe custody and bank charges 129,739 122,047 Auditor's fee 26,976 29,262 Legal and professional expenses 18,667 13,290 Printing and publication expenses 16,036 15,923 Valuation fee 8,190 8,120 Other operating expenses 2,540 5,761 9,894,124 12,619,741 ---------- ---------- Net operating pprofit/(loss) 219,251,046 (36,447,117) Finance costs Interest paid - (831) Increase/(decrease) in net
aassets attributable to holdersof redeemable units and total comprehensive income 219,251,046 (36,447,948)
The notes on pages 130 to 132 form part of these financial statements.
- 128 -

JJPMORGAN INDIA FUND SSemi--aannual report for the
pperiod ended 31 March 2014
SStatement of Changes in Net Assets Attributable to Holders of Redeemable Units For the period ended 31 March 2014 (Unaudited) 1.10.2013
to 31.3.2014
1.10.2012 to
31.3.2013 US$ US$ Net assets attributable to holders
of redeemable units at the beginning of the period 1,118,230,679 1,633,949,466
---------- ---------- Allotment of redeemable units 113,198,854 121,853,041 Redemption of redeemable units (224,788,565) (287,748,616) Net redemption (111,589,711) (165,895,575) ---------- ---------- 1,006,640,968 1,468,053,891 Increase/(decrease) in net assets
attributable to holders of redeemable units and total comprehensive income 219,251,046 (36,447,948)
Net assets attributable to holders
oof redeemable units at the end of the period 1,225,892,014 1,431,605,943
Statement of Cash Flows For the period ended 31 March 2014 (Unaudited) 1.10.2013
to 31.3.2014
1.10.2012 to
31.3.2013 US$ US$ Operating activities Purchase of investments and
derivatives (51,470,862) (46,650,834) Proceeds from disposal of
investments and derivatives 155,546,310 160,329,756 Dividend received 2,135,875 2,573,981 Interest received 16,457 19,824 Decrease in margin deposits - 10,124,540 Trustee's fee paid (153,931) (202,526) Registrar's fee paid (264,338) (275,145) Transaction costs paid (587,801) (545,846) Management fee paid (8,677,360) (11,600,170) Others (931,651) (707,235) Net cash inflow from operating
aactivities 95,612,699 113,066,345 ---------- ---------- Financing activities Interest paid - (715) Receipts on allotment of
redeemable units 110,586,000 123,074,652 Payments on redemption of
redeemable units (217,264,273) (291,783,199) Net cash outflow ffrom
financing activities (106,678,273) (168,709,262) ---------- ---------- Decrease in cash and cash
eequivalents (11,065,574) (55,642,917) Cash and cash equivalents at the
beginning of the period 21,942,186 57,953,271 Exchange losses on cash and cash
equivalents (1) (32,283) Cash and cash equivalents at
tthe end of the period 10,876,611 2,278,071 Analysis of balances of cash and cash equivalents: Cash at banks 10,876,611 3,578,084 Short term bank loans -
unsecured - (1,300,013) 10,876,611 2,278,071
The notes on pages 130 to 132 form part of these financial statements.
- 129 -

JJPMORGAN INDIA FUND SSemi--aannual report for the
pperiod ended 31 March 2014
NNotes to the Financial Statements
1 The Fund
JPMorgan India Fund (the "Fund") was established under a Trust Deed dated 23 November 1989, as amended, and is governed by the laws of the Republic of Mauritius. The Fund is authorized by the Securities and Futures Commission of Hong Kong.
The investment objective of the Fund is to provide long-term capital growth through a portfolio consisting primarily of securities linked to the Indian economy. These include, but are not restricted to, securities traded on the stock exchanges of India and the rest of the Indian sub-continent including Pakistan, Bangladesh and Sri Lanka.
Pursuant to the Supplemental Trust Deed dated 7 January 2013, the Manager may decide to issue separate classes (each a "Class") whose assets will be commonly invested but where a specific fee structure, currency or distribution policy may be applied. Each Class may have a different charging structure with the result that the net asset value attributable to each Class may differ.
All unitholders' rights with regard to the convening, voting or otherwise acting at any meeting of unitholders are the same.
2 Summary of principal accounting policies
(a) Accounting policies of interim financial statements
The accounting policies and methods of computation used in the preparation of these unaudited condensed interim financial statements are consistent with those used in the annual financial statements for the year ended 30 September 2013.
(b) Investments and derivatives
Classification
The Fund classifies its investments and derivatives as financial assets or financial liabilities at fair value through profit or loss. These financial assets or financial liabilities are held-for-trading as they are acquired or incurred principally for the purpose of selling or repurchasing in the near term or short-term profit taking.
All derivatives are carried in assets when amounts are receivable by the Fund and in liabilities when amounts are payable by the Fund.
The Fund makes short sales in which a borrowed security is sold in anticipation of a decline in the market value of that security, or it may use short sales for various arbitrage transactions. Short sales are classified as financial liabilities at fair value through profit or loss.
Recognition, derecognition and measurement
Purchases and sales of investments and derivatives are accounted for on the trade date basis. Investments and derivatives are initially recognized at fair value and are subsequently re-measured at fair value. Realized and unrealized gains and losses on investments and derivatives are recognized in the Statement of Comprehensive Income. Investments and derivatives are derecognized when the rights to receive cash flows from the investments and derivatives have expired or the Fund has transferred substantially all risks and rewards of ownership.
Fair value estimation
Fair value is the price that would be received to sell an asset or paid to transfer a liability in an orderly transaction between market participants at the measurement date. The fair value of financial assets and liabilities traded in active markets are based on last traded prices. Prior to 1 October 2012, investments that are listed or traded on an exchange and investments with prices quoted in over-the-counter markets or by market makers, are fair valued based on quoted "bid" prices on long investments and quoted "ask" prices on investments sold short. The Fund early adopted Hong Kong Financial Reporting Standard 13, "Fair Value Measurement", with effect from 1 October 2012, it changed its fair valuation input to utilize the last traded market price for both financial assets and financial liabilities where the last traded price falls within the bid-ask spread. When trading in the securities of an investee company is suspended, the investment is valued at the Manager's estimate of its fair value.
Debt securities are fair valued based on quoted prices inclusive of accrued interest.
Investments in collective investment schemes are stated at fair value based on the net asset value per unit of the respective funds as determined by the administrators of the relevant funds or stated at last traded prices if the collective investment schemes are listed or traded on an exchange.
Open future and swap contracts are valued at last traded prices for both long and short positions at the valuation date. The differences between the last traded prices and the contract prices are recognized in the Statement of Comprehensive Income.
- 130 -

JJPMORGAN INDIA FUND SSemi--aannual report for the
pperiod ended 31 March 2014
Open option contracts are valued at last traded prices for both long and short positions at the valuation date. The differences between the last traded prices and the premium amounts/contract prices are recognized in the Statement of Comprehensive Income.
Forward foreign exchange contracts are valued at the forward rates ruling at the valuation date. The differences between the forward rates and the contract rates are recognized in the Statement of Comprehensive Income.
((c) Securities borrowing
The Fund may enter into securities borrowing arrangements for short sale purposes. Short positions represent obligations to deliver securities sold but not yet purchased, and are accounted for as investments and valued at their fair value. Securities borrowed during the period/year are off-balance sheet transactions and are therefore not included in the investment portfolio of the Fund. Collateral placed for the purpose of securities borrowed generally consist of cash collateral and are included in the Statement of Financial Position separately.
(d) Foreign currency translation
Functional and presentation currency
The Fund has adopted United States dollar as its functional and presentation currency.
Transactions and balances
Foreign currency transactions are translated into the functional currency using the exchange rates prevailing at the dates of the transactions.
Foreign exchange gains and losses resulting from the settlement of such transactions and from the translation of assets and liabilities denominated in foreign currencies at period/year end exchange rates are recognized in the Statement of Comprehensive Income.
Foreign exchange gains and losses relating to cash and cash equivalents are presented in the Statement of Comprehensive Income within "Net foreign currency exchange gains/losses". Foreign exchange gains and losses relating to the financial assets and liabilities carried at fair value through profit or loss are presented in the Statement of Comprehensive Income within "Net gains/losses on investments and derivatives".
(e) Proceeds and payments on allotment and redemption of units
The net asset value per unit is computed for each dealing day. The price at which units are allotted or redeemed is calculated by reference to the net asset value per unit as at the close of business on the relevant dealing day in accordance with the provisions of the Fund's Trust Deed dated 23 November 1989, as amended, which may be different from the accounting policies stated in the financial statements.
3 Number of units in issue and net assets attributable to holders of redeemable units (per unit)
31.3.2014
USD Class (acc) Units Number of units in issue: 6,154,016.220 US$ Net assets attributable to
holders of redeemable units 1,225,892,014
Net assets attributable to
holders of redeemable units (per unit) 199.20
- 131 -

JJPMORGAN INDIA FUND SSemi--aannual report for the
pperiod ended 31 March 2014
30.9.2013
USD Class (acc) Units Number of units in issue: 6,763,934.592 US$ Net assets attributable to
holders of redeemable units 1,118,230,679
Net assets attributable to
holders of redeemable units (per unit) 165.32
44 Net gains/(losses) on investments and derivatives
1.10.2013
to 31.3.2014
1.10.2012 to
31.3.2013 US$ US$ Change in unrealized gains/losses in value of investments and derivatives 208,852,897 (53,224,074) Realized gains on sale of investments and derivatives 18,257,712 26,374,787 227,110,609 (26,849,287)
5 Soft commission arrangements
The Investment Manager has entered into soft commission arrangements with brokers under which certain goods and services used to support investment decision making are received by the Investment Manager. The Investment Manager does not make direct payment for these services but transacts an agreed amount of business with the brokers on behalf of the Fund. Commission is paid from the Fund on these transactions.
The goods and services must be of demonstrable benefit to the Fund and may include research and advisory services; economic and political analysis; portfolio analysis, including valuation and performance measurement; market analysis, data and quotation services, computer hardware and software incidental to the above goods and services; clearing and custodian services and investment-related publications.
6 Distribution
No distribution was made during the period (31 March 2013: nil).
- 132 -

JJPMORGAN IINDIA SMALLER COMPANIES FUND SSemi--aannual report for the
pperiod ended 31 March 2014
IInvestment Portfolio As at 31 March 2014 (Unaudited)
Holding
Fair value
US$
% of net
assets Listed/Quoted Investments (94.1%) Equities (94.1%) India (92.4%) Air Freight & Couriers Fuels (1.2%) Transport Corp of India 280,310 521,687 1.2 Auto CComponents (5.9%) Balkrishna Industries 123,691 988,534 2.3 BOSCH Ltd 5,995 1,093,384 2.5 NRB Bearings (DEMAT) 554,912 478,977 1.1 Capital Markets (1.2%) Motilal Oswal Financial
Services 344,203 533,112 1.2 Chemicals (6.6%) Berger Paints India 155,396 598,062 1.4 Castrol India 198,566 1,033,850 2.4 Godrej Industries 228,303 1,206,454 2.8 Commercial Banks (7.6%) DCB Bank 725,000 743,543 1.7 IndusInd Bank 147,054 1,235,699 2.9 ING Vysya Bank 122,328 1,300,448 3.0 Construction Materials (7.1%) HeidelbergCement India 1,128,294 835,039 1.9 JK Cement 85,262 342,633 0.8 JK Lakshmi Cement 471,291 881,464 2.1 Shree Cement 10,584 1,005,004 2.3 Consumer Finance (4.6%) Mahindra & Mahindra Fin
Services 200,000 843,903 2.0 Shriram Transport Finance 88,200 1,133,467 2.6 Diversified Financial Services (1.8%) Bajaj Hldgs & Inv 44,700 767,023 1.8 Electric Utilities (2.9%) JSW Energy 854,736 847,974 1.9 Torrent Power 270,000 424,965 1.0 Electrical Equipment (0.9%) Havells India 23,500 367,477 0.9 Food Products (2.2%) Balrampur Chini Mills 998,314 933,582 2.2 Hotels Restaurants & Leisure (3.4%) EIH Ltd (DEMAT) 944,349 1,153,506 2.7 Mahindra Holidays & Resorts
India 83,000 324,718 0.7 Household Durables (3.8%) Hitachi Home & Life Solutions 197,500 575,577 1.3 Whirlpool Of India 274,780 1,063,279 2.5
(Continued)
Holding
Fair value
US$
% of net
assets Insurance (0.1%) Bajaj Finserv 3,787 49,970 0.1 Internet Software & Services (0.6%) Just Dial 10,000 259,433 0.6 IT Services (1.6%) Persistent Systems 38,138 670,165 1.6 Life Sciences Tools & Services (1.7%) Divi's Laboratories 31,753 726,216 1.7 Machinery (11.3%) Ashok Leyland 2,910,000 1,152,355 2.7 Cummins India 127,890 1,277,989 3.0 Eicher Motors 8,725 870,930 2.0 Greaves Cotton 702,755 950,774 2.2 Nesco Ltd 27,188 369,358 0.8 Thermax Ltd (DEMAT) 20,000 250,559 0.6 Media (4.2%) DB Corp 180,691 939,398 2.2 Navneet Education 903,482 864,565 2.0 Oil & Gas & Consumable Fuels (2.5%) Great Eastern Shipping 190,508 1,086,316 2.5 Pharmaceuticals (5.8%) IPCA Laboratories 56,575 818,604 1.9 Lupin Ltd 45,565 735,280 1.7 Torrent Pharmaceuticals 110,418 969,260 2.2 Real Estate Management & Development (7.5%) Godrej Properties 262,426 939,676 2.2 Mahindra Lifespace Developer 75,066 460,659 1.1 Oberoi Realty 267,533 966,922 2.2 Sobha Developers 135,190 847,732 2.0 Textiles & Apparel & Luxury Goods (2.1%) Raymond Ltd 175,000 886,684 2.1 Thrifts & Mortgage Finance (3.0%) GRUH Finance 258,863 1,279,956 3.0 Transportation Infrastructure (2.8%) Gujarat Pipavav Port 831,000 1,221,680 2.8 Singapore (1.7%) Real Estate Investment Trusts (1.7%) Ascendas India Trust 1,216,000 744,559 1.7 Total Listed/Quoted Investments 40,572,401 94.1
- 133 -

JJPMORGAN IINDIA SMALLER COMPANIES FUND SSemi--aannual report for the
pperiod ended 31 March 2014
IInvestment Portfolio (Continued) As at 31 March 2014 (Unaudited)
Fair value
US$
% of net
assets Other net assets 2,561,266 5.9 Net assets attributable to holders of
rredeemable units at 31 March 2014 43,133,667 100.0 Total investments, at cost 33,275,853
Statement of Movements in Portfolio Holdings For the period ended 31 March 2014 (Unaudited) % holdings
of net assets 31.3.2014 30.9.2013 Listed/Quoted Investments Equities India Machinery 11.3 11.4 Commercial Banks 7.6 7.6 Real Estate Management & Development 7.5 8.0 Construction Materials 7.1 5.9 Chemicals 6.6 8.0 Auto Components 5.9 6.2 Pharmaceuticals 5.8 6.7 Consumer Finance 4.6 4.6 Media 4.2 4.9 Household Durables 3.8 3.1 Hotels Restaurants & Leisure 3.4 2.6 Thrifts & Mortgage Finance 3.0 3.4 Electric Utilities 2.9 1.0 Transportation Infrastructure 2.8 3.3 Oil & Gas & Consumable Fuels 2.5 2.8 Food Products 2.2 2.7 Textiles & Apparel & Luxury Goods 2.1 2.0 Diversified Financial Services 1.8 2.7 Life Sciences Tools & Services 1.7 1.8 IT Services 1.6 1.2 Capital Markets 1.2 0.9 Air Freight & Couriers Fuels 1.2 1.0 Electrical Equipment 0.9 0.7 Internet Software & Services 0.6 - Insurance 0.1 - Water Utilities - 1.0 Singapore Real Estate Management & Development 1.7 3.0 Total Listed/Quoted Investments 94.1 96.5 Other net assets 5.9 3.5 Net assets attributable to holders of
rredeemable units 100.0 100.0
- 134 -

JJPMORGAN IINDIA SMALLER COMPANIES FUND SSemi--aannual report for the
pperiod ended 31 March 2014
SStatement of Financial Position As at 31 March 2014 (Unaudited) 31.3.2014 30.9.2013 US$ US$ Assets Cash at banks 1,086,876 1,211,625 Amounts due from brokers 143,983 - Amounts receivable on allotment 1,480,205 4,113 Investments 40,572,401 31,165,251 Dividend and interest receivable 14 3,495 Total assets 43,283,479 32,384,484 ---------- ---------- Liabilities Amounts due to brokers 69,510 - Amounts payable on redemption 13,408 9,668 Other accounts payable 66,894 66,156 Total liabilities 149,812 75,824 ---------- ---------- Net assets attributable to holders
oof redeemable units [Note 3] 43,133,667 32,308,660 Equity 43,133,667 32,308,660
Statement of Comprehensive Income For the period ended 31 March 2014 (Unaudited) 1.10.2013
to 31.3.2014
1.10.2012 to
31.3.2013 US$ US$ Income Net gains/(losses) on investments
and derivatives [Note 4] 11,656,961 (1,971,113) Dividend income 112,734 112,730 Net foreign currency exchange
gains/(losses) 16,828 (17,947) Interest on deposits 79 179 11,786,602 (1,876,151) ---------- ---------- Expenses Management fee 261,277 278,840 Transaction costs 23,873 44,473 Legal and professional expenses 16,358 5,493 Trustee's fee 10,451 11,160 Safe custody and bank charges 9,497 11,264 Auditor's fee 9,025 9,577 Valuation fee 8,190 8,120 Registrar's fee 4,242 5,253 Printing and publication expenses 891 505 Other operating expenses 661 1,892 344,465 376,577 ---------- ---------- Net operating profit/(loss) 11,442,137 (2,252,728) Finance costs Interest paid - (925) Increase/(decrease) in net
aassets attributable to holdersof redeemable units and total comprehensive income 11,442,137 (2,253,653)
The notes on pages 137 to 139 form part of these financial statements.
- 135 -

JJPMORGAN IINDIA SMALLER COMPANIES FUND SSemi--aannual report for the
pperiod ended 31 March 2014
SStatement of Changes in Net Assets Attributable to Holders of Redeemable Units For the period ended 31 March 2014 (Unaudited) 1.10.2013
to 31.3.2014
1.10.2012 to
31.3.2013 US$ US$ Net assets attributable to holders
of redeemable units at the beginning of the period 32,308,660 37,373,342
---------- ---------- Allotment of redeemable units 2,482,807 1,182,110 Redemption of redeemable units (3,099,937) (1,121,611) Net (redemption)/allotment (617,130) 60,499 ---------- ---------- 31,691,530 37,433,841 Increase/(decrease) in net assets
attributable to holders of redeemable units and total comprehensive income 11,442,137 (2,253,653)
Net assets attributable to holders
oof redeemable units at the end of the period 43,133,667 35,180,188
Statement of Cash Flows For the period ended 31 March 2014 (Unaudited) 1.10.2013
to 31.3.2014
1.10.2012 to
31.3.2013 US$ US$ Operating activities Purchase of investments and
derivatives (2,453,445) (10,550,885) Proceeds from disposal of
investments and derivatives 4,628,400 5,071,174 Dividend received 116,197 121,869 Interest received 97 176 Decrease in margin deposits - 31,076 Registrar's fee paid (8,232) (10,558) Trustee's fee paid (10,114) (10,794) Transaction costs paid (25,490) (49,587) Management fee paid (252,705) (269,720) Others (32,022) (55,255) Net cash inflow/(outflow) from
ooperating activities 1,962,686 (5,722,504) ---------- ---------- Financing activities Interest paid - (907) Receipts on allotment of
redeemable units 1,006,715 1,886,005 Payments on redemption of
redeemable units (3,096,197) (1,142,554) Net cash (outflow)/inflow from
ffinancing activities (2,089,482) 742,544 ---------- ---------- Decrease in cash and cash
eequivalents (126,796) (4,979,960) Cash and cash equivalents at the
beginning of the period 1,211,625 5,192,360 Exchange gains/(losses) on cash
and cash equivalents 2,047 (8,781) Cash and cash eequivalents at
the end of the period 1,086,876 203,619 Analysis of balances of cash and cash equivalents: Cash at banks 1,086,876 403,628 Short term bank loans -
unsecured - (200,009) 1,086,876 203,619
The notes on pages 137 to 139 form part of these financial statements.
- 136 -

JJPMORGAN INDIA SMALLER COMPANIES FUND SSemi--aannual report for the
pperiod ended 31 March 2014
NNotes to the Financial Statements
1 The Fund
JPMorgan India Smaller Companies Fund (the "Fund") was established under a Trust Deed dated 13 April 2006, as amended, and is governed by the laws of the Republic of Mauritius. The Fund is authorized by the Securities and Futures Commission of Hong Kong.
The investment objective of the Fund is to provide investors with long-term capital growth by investing primarily in securities of small to medium-sized companies in India.
Pursuant to the Supplemental Trust Deed dated 31 August 2012, the Manager may decide to issue separate classes (each a "Class") whose assets will be commonly invested but where a specific fee structure, currency or distribution policy may be applied. Each Class may have a different charging structure with the result that the net asset value attributable to each Class may differ.
All unitholders' rights with regard to the convening, voting or otherwise acting at any meeting of unitholders are the same.
2 Summary of principal accounting policies
(a) Accounting policies of interim financial statements
The accounting policies and methods of computation used in the preparation of these unaudited condensed interim financial statements are consistent with those used in the annual financial statements for the year ended 30 September 2013.
(b) Investments and derivatives
Classification
The Fund classifies its investments and derivatives as financial assets or financial liabilities at fair value through profit or loss. These financial assets or financial liabilities are held-for-trading as they are acquired or incurred principally for the purpose of selling or repurchasing in the near term or short-term profit taking.
All derivatives are carried in assets when amounts are receivable by the Fund and in liabilities when amounts are payable by the Fund.
The Fund makes short sales in which a borrowed security is sold in anticipation of a decline in the market value of that security, or it may use short sales for various arbitrage transactions. Short sales are classified as financial liabilities at fair value through profit or loss.
Recognition, derecognition and measurement
Purchases and sales of investments and derivatives are accounted for on the trade date basis. Investments and derivatives are initially recognized at fair value and are subsequently re-measured at fair value. Realized and unrealized gains and losses on investments and derivatives are recognized in the Statement of Comprehensive Income. Investments and derivatives are derecognized when the rights to receive cash flows from the investments and derivatives have expired or the Fund has transferred substantially all risks and rewards of ownership.
Fair value estimation
Fair value is the price that would be received to sell an asset or paid to transfer a liability in an orderly transaction between market participants at the measurement date. The fair value of financial assets and liabilities traded in active markets are based on last traded prices. Prior to 1 October 2012, investments that are listed or traded on an exchange and investments with prices quoted in over-the-counter markets or by market makers, are fair valued based on quoted "bid" prices on long investments and quoted "ask" prices on investments sold short. The Fund early adopted Hong Kong Financial Reporting Standard 13, "Fair Value Measurement", with effect from 1 October 2012, it changed its fair valuation input to utilize the last traded market price for both financial assets and financial liabilities where the last traded price falls within the bid-ask spread. When trading in the securities of an investee company is suspended, the investment is valued at the Manager's estimate of its fair value.
Debt securities are fair valued based on quoted prices inclusive of accrued interest.
Investments in collective investment schemes are stated at fair value based on the net asset value per unit of the respective funds as determined by the administrators of the relevant funds or stated at last traded prices if the collective investment schemes are listed or traded on an exchange.
Open future and swap contracts are valued at last traded prices for both long and short positions at the valuation date. The differences between the last traded prices and the contract prices are recognized in the Statement of Comprehensive Income.
Open option contracts are valued at last traded prices for both long and short positions at the valuation date. The differences between the last traded prices and the premium amounts/contract prices are recognized in the Statement of Comprehensive Income.
- 137 -

JJPMORGAN INDIA SMALLER COMPANIES FUND SSemi--aannual report for the
pperiod ended 31 March 2014
Forward foreign exchange contracts are valued at the forward rates ruling at the valuation date. The differences between the forward rates and the contract rates are recognized in the Statement of Comprehensive Income.
((c) Securities borrowing
The Fund may enter into securities borrowing arrangements for short sale purposes. Short positions represent obligations to deliver securities sold but not yet purchased, and are accounted for as investments and valued at their fair value. Securities borrowed during the period/year are off-balance sheet transactions and are therefore not included in the investment portfolio of the Fund. Collateral placed for the purpose of securities borrowed generally consist of cash collateral and are included in the Statement of Financial Position separately.
(d) Foreign currency translation
Functional and presentation currency
The Fund has adopted United States dollar as its functional and presentation currency.
Transactions and balances
Foreign currency transactions are translated into the functional currency using the exchange rates prevailing at the dates of the transactions.
Foreign exchange gains and losses resulting from the settlement of such transactions and from the translation of assets and liabilities denominated in foreign currencies at period/year end exchange rates are recognized in the Statement of Comprehensive Income.
Foreign exchange gains and losses relating to cash and cash equivalents are presented in the Statement of Comprehensive Income within "Net foreign currency exchange gains/losses". Foreign exchange gains and losses relating to the financial assets and liabilities carried at fair value through profit or loss are presented in the Statement of Comprehensive Income within "Net gains/losses on investments and derivatives".
(e) Proceeds and payments on allotment and redemption of units
The net asset value per unit is computed for each dealing day. The price at which units are allotted or redeemed is calculated by reference to the net asset value per unit as at the close of business on the relevant dealing day in accordance with the provisions of the Fund's Trust Deed dated 13 April 2006, as amended, which may be different from the accounting policies stated in the financial statements.
- 138 -

JJPMORGAN INDIA SMALLER COMPANIES FUND SSemi--aannual report for the
pperiod ended 31 March 2014
33 Number of units in issue and net assets attributable to holders of redeemable units (per unit)
31.3.2014
USD Class (acc) Units Number of units in issue: 4,464,703.199 US$ Net assets attributable to
holders of redeemable units 43,133,667
Net assets attributable to
holders of redeemable units (per unit) 9.66
30.9.2013
USD Class (acc) Units Number of units in issue: 4,588,501.402 US$ Net assets attributable to
holders of redeemable units 32,308,660
Net assets attributable to
holders of redeemable units (per unit) 7.04
4 Net gains/(losses) on investments and derivatives
1.10.2013 to
31.3.2014
1.10.2012 to
31.3.2013 US$ US$ Change in unrealized gains/losses in value of investments and derivatives 11,561,887 (1,781,797) Realized gains/(losses) on sale of investments and derivatives 95,074 (189,316) 11,656,961 (1,971,113)
5 Soft commission arrangements
The Investment Manager has entered into soft commission arrangements with brokers under which certain goods and services used to support investment decision making are received by the Investment Manager. The Investment Manager does not make direct payment for these services but transacts an agreed amount of business with the brokers on behalf of the Fund. Commission is paid from the Fund on these transactions.
The goods and services must be of demonstrable benefit to the Fund and may include research and advisory services; economic and political analysis; portfolio analysis, including valuation and performance measurement; market analysis, data and quotation services, computer hardware and software incidental to the above goods and services; clearing and custodian services and investment-related publications.
6 Distribution
No distribution was made during the period (31 March 2013: nil).
- 139 -

JJPMORGAN INDONESIA FUND SSemi--aannual report for the
pperiod ended 31 March 2014
DDistributor Status The Fund has been certified by HMRC in the UK as a distributing fund in respect of the period from 19 September 2006 to 30 September 2010. The principal effect of this certification is that for unitholders resident or ordinarily resident in the UK for taxation purposes any gains accruing on the sale, redemption or other disposal of units during the period will be taxed in the UK as a capital gain and not as income. This treatment will continue under the new UK reporting fund regime provided the Fund does not invest more than 5% of its assets in other offshore funds which are not themselves reporting funds. There will be no need to formally apply for reporting fund status as the Fund is transparent for UK tax purposes and therefore considered out of scope of the requirements of this new regime. These are now known as “special category transparent offshore funds”. As noted, the Fund is transparent for UK income tax purposes and UK investors are subject to UK capital gains tax on disposal of their units. UK investors are subject to tax on their share of income of the Fund on an arising basis. Information has been provided to UK investors of the amount of their share of the underlying income, expenses and overseas tax suffered.
Investment Portfolio As at 31 March 2014 (Unaudited)
Holding
Fair value
US$
% of net
assets Listed/Quoted Investments (97.0%) Equities (97.0%) Indonesia (96.0%) Auto Components (1.4%) Gajah Tunggal 5,460,900 1,021,515 1.4 Automobiles (7.6%) Astra Intl 8,688,400 5,640,577 7.6 Building Products (1.7%) Arwana Citramulia 10,008,600 832,582 1.1 Wijaya Karya Beton 8,748,000 454,342 0.6 Commercial Banks (28.9%) Bank Central Asia 7,547,800 7,042,840 9.5 Bank Mandiri (Persero) 6,823,362 5,676,124 7.7 Bank Negara Indonesia
(Persero) 8,663,600 3,782,699 5.1 Bank Rakyat Indonesia
Persero 5,832,700 4,916,206 6.6 Construction & Engineering (3.0%) Waskita Karya Persero 14,058,800 940,554 1.3 Wijaya Karya 6,013,400 1,265,143 1.7 Construction Materials (5.0%) Indocement Tunggal Prakarsa 570,600 1,174,100 1.6 Semen Indonesia Persero 1,809,500 2,516,734 3.4
(Continued)
Holding
Fair value
US$
% of net
assets Diversified Telecommunication Services (9.2%) Telekomunikasi Indonesia 'B' 34,957,000 6,815,999 9.2 Food Products (6.1%) Astra Agro Lestari 438,100 1,002,694 1.4 Indofood CBP Sukses Makmur 2,143,300 1,905,575 2.6 Japfa Comfeed Indonesia 9,151,700 1,135,906 1.5 Ultrajaya Milk Ind & Trading 1,325,200 458,454 0.6 Gas Utilities (4.0%) Perusahaan Gas Negara 6,643,600 2,997,223 4.0 Household Products (1.3%) Unilever Indonesia 368,700 949,338 1.3 Insurance (1.0%) Panin Financial 33,346,600 763,214 1.0 Machinery (5.0%) United Tractors 2,024,500 3,697,920 5.0 Media (2.9%) Surya Citra Media 7,554,257 2,127,960 2.9 Multiline Retail (0.7%) Matahari Department Store 412,800 505,099 0.7 Oil & Gas & Consumable Fuels (3.4%) Adaro Energy 9,702,900 837,046 1.1 Indo Tambangraya Megah 797,300 1,709,001 2.3 Pharmaceuticals (4.3%) Kalbe Farma 25,074,600 3,233,652 4.3 Real Estate Management & Development (2.9%) Bekasi Fajar Ind Estate 12,941,600 643,662 0.8 Pakuwon Jati 50,351,400 1,551,320 2.1 Road & Rail (1.9%) Express Transindo Utama 10,971,885 1,405,290 1.9 Textiles & Apparel & Luxury Goods (1.8%) Sri Rejeki Isman 67,937,500 1,327,652 1.8 Transportation Infrastructure (3.9%) Jasa Marga (Persero) 5,517,700 2,914,278 3.9 Singapore (1.0%) Food Products (1.0%) First Resources 388,000 721,975 1.0 Total Listed/Quoted Investments 71,966,674 97.0 Other net assets 2,210,616 3.0 Net assets attributable to holders oof
redeemable units at 31 March 2014 74,177,290 100.0 Total investments, at cost 69,294,235
- 140 -

JJPMORGAN INDONESIA FUND SSemi--aannual report for the
pperiod ended 31 March 2014
SStatement of Movements in Portfolio Holdings For the period ended 31 March 2014 (Unaudited) % holdings
of net assets 31.3.2014 30.9.2013 Listed/Quoted Investments Equities Indonesia Commercial Banks 28.9 28.6 Diversified Telecommunication Services 9.2 10.1 Automobiles 7.6 5.4 Food Products 6.1 5.9 Machinery 5.0 - Construction Materials 5.0 5.1 Pharmaceuticals 4.3 5.1 Gas Utilities 4.0 6.4 Transportation Infrastructure 3.9 - Oil & Gas & Consumable Fuels 3.4 9.1 Construction & Engineering 3.0 - Real Estate Management & Development 2.9 5.4 Media 2.9 2.8 Road & Rail 1.9 2.2 Textiles & Apparel & Luxury Goods 1.8 2.4 Building Products 1.7 1.8 Auto Components 1.4 2.1 Household Products 1.3 - Insurance 1.0 - Multiline Retail 0.7 1.7 Singapore Food Products 1.0 2.1 Oil & Gas & Consumable Fuels - 0.4 Thailand Oil & Gas & Consumable Fuels - 3.0 Total Listed/Quoted Investments 97.0 99.6 Other net assets 3.0 0.4 Net assets attributable to holders of
rredeemable units 100.0 100.0
- 141 -

JJPMORGAN INDONESIA FUND SSemi--aannual report for the
pperiod ended 31 March 2014
SStatement of Financial Position As at 31 March 2014 (Unaudited) 31.3.2014 30.9.2013 US$ US$ Assets Cash at banks 1,618,171 2,226,519 Amounts due from brokers 323,717 2,166,927 Amounts receivable on allotment 2,148,471 4,362,744 Investments 71,966,674 69,054,778 Dividend and other accounts
receivable 115,637 329 Total assets 76,172,670 77,811,297 ---------- ---------- Liabilities Amounts due to brokers 1,451,261 1,069,306 Amounts payable on redemption 449,043 7,239,716 Other accounts payable 95,076 153,735 Total liabilities 1,995,380 8,462,757 ---------- ---------- Net assets attributable to holders
oof redeemable units [Note 3] 74,177,290 69,348,540 Equity 74,177,290 69,348,540
Statement of Comprehensive Income For the period ended 31 March 2014 (Unaudited) 1.10.2013
to 31.3.2014
1.10.2012 to
31.3.2013 US$ US$ Income Net gains on investments and
derivatives [Note 4] 5,568,954 29,158,226 Dividend income 398,504 424,678 Interest on deposits 1,493 1,029 Net foreign currency exchange
losses (40,317) (142,639) 5,928,634 29,441,294 ---------- ---------- Expenses Management fee 506,488 920,782 Transaction costs 188,701 272,190 Registrar's fee 23,755 25,694 Trustee's fee 17,294 24,523 Safe custody and bank charges 12,387 21,492 Valuation fee 8,260 7,910 Auditor's fee 5,738 5,796 Printing and publication expenses 2,897 1,334 Legal and professional expenses 160 227 Other operating expenses 1,082 1,245 766,762 1,281,193 ---------- ---------- Net operating profit 5,161,872 28,160,101 Finance costs Interest paid (192) (870) Profit before taxation 5,161,680 28,159,231 Taxation (79,701) (82,943) Increase in net assets
attributable to holders of redeemable units and total ccomprehensive income 5,081,979 28,076,288
The notes on pages 144 to 146 form part of these financial statements.
- 142 -

JJPMORGAN INDONESIA FUND SSemi--aannual report for the
pperiod ended 31 March 2014
SStatement of Changes in Net Assets Attributable to Holders of Redeemable Units For the period ended 31 March 2014 (Unaudited) 1.10.2013
to 31.3.2014
1.10.2012 to
31.3.2013 US$ US$ Net assets attributable to holders
of redeemable units at the beginning of the period 69,348,540 127,181,783
---------- ---------- Allotment of redeemable units 52,860,013 56,414,740 Redemption of redeemable units (53,113,242) (73,418,897) Net redemption (253,229) (17,004,157) ---------- ---------- 69,095,311 110,177,626 Increase in net aassets
attributable to holders of redeemable units and total comprehensive income 5,081,979 28,076,288
Net assets attributable to holders
oof redeemable units at the end of the period 74,177,290 138,253,914
Statement of Cash Flows For the period ended 31 March 2014 (Unaudited) 1.10.2013
to 31.3.2014
1.10.2012 to
31.3.2013 US$ US$ Operating activities Purchase of investments and
derivatives (35,850,483) (39,946,815) Proceeds from disposal of
investments and derivatives 40,731,799 57,189,427 Dividend received 286,039 330,075 Interest received 1,542 950 Trustee's fee paid (17,784) (24,355) Registrar's fee paid (50,925) (46,548) Tax paid (79,701) (82,943) Transaction costs paid (194,469) (286,809) Management fee paid (526,163) (910,810) Others (78,838) (186,407) Net cash inflow from operating
aactivities 4,221,017 16,035,765 ---------- ---------- Financing activities Interest paid (192) (947) Receipts on allotment of
redeemable units 55,074,286 58,739,059 Payments on redemption of
redeemable units (59,903,915) (72,760,561) Net cash outflow from
ffinancing activities (4,829,821) (14,022,449) ---------- ---------- (Decrease)/increase in cash
aand cash equivalents (608,804) 2,013,316 Cash and cash equivalents at the
beginning of the period 2,226,519 (1,120,484) Exchange gains/(losses) on cash
and cash equivalents 456 (1) Cash and cash eequivalents at
the end of the period 1,618,171 892,831 Analysis of balances of cash and cash equivalents: Cash at banks 1,618,171 892,831
The notes on pages 144 to 146 form part of these financial statements.
- 143 -

JJPMORGAN INDONESIA FUND SSemi--aannual report for the
pperiod ended 31 March 2014
NNotes to the Financial Statements
1 The Fund
JPMorgan Indonesia Fund (the "Fund") was established under a Trust Deed dated 19 September 2006, as amended, and is governed by the laws of Hong Kong. The Fund is authorized by the Securities and Futures Commission of Hong Kong.
The investment objective of the Fund is to provide investors with long-term capital appreciation through a portfolio consisting primarily of securities linked to the Indonesian economy. These include, but are not restricted to, securities traded on the stock exchanges of Indonesia.
Pursuant to the Supplemental Trust Deed dated 4 January 2013, the Manager may decide to issue separate classes (each a “Class”) whose assets will be commonly invested but where a specific fee structure, currency or distribution policy may be applied. Each Class may have a different charging structure with the result that the net asset value attributable to each Class may differ.
All unitholders' rights with regard to the convening, voting or otherwise acting at any meeting of unitholders are the same.
2 Summary of principal accounting policies
(a) Accounting policies of interim financial statements
The accounting policies and methods of computation used in the preparation of these unaudited condensed interim financial statements are consistent with those used in the annual financial statements for the year ended 30 September 2013.
(b) Investments and derivatives
Classification
The Fund classifies its investments and derivatives as financial assets or financial liabilities at fair value through profit or loss. These financial assets or financial liabilities are held-for-trading as they are acquired or incurred principally for the purpose of selling or repurchasing in the near term or short-term profit taking.
All derivatives are carried in assets when amounts are receivable by the Fund and in liabilities when amounts are payable by the Fund.
The Fund makes short sales in which a borrowed security is sold in anticipation of a decline in the market value of that security, or it may use short sales for various arbitrage transactions. Short sales are classified as financial liabilities at fair value through profit or loss.
Recognition, derecognition and measurement
Purchases and sales of investments and derivatives are accounted for on the trade date basis. Investments and derivatives are initially recognized at fair value and are subsequently re-measured at fair value. Realized and unrealized gains and losses on investments and derivatives are recognized in the Statement of Comprehensive Income. Investments and derivatives are derecognized when the rights to receive cash flows from the investments and derivatives have expired or the Fund has transferred substantially all risks and rewards of ownership.
Fair value estimation
Fair value is the price that would be received to sell an asset or paid to transfer a liability in an orderly transaction between market participants at the measurement date. The fair value of financial assets and liabilities traded in active markets are based on last traded prices. Prior to 1 October 2012, investments that are listed or traded on an exchange and investments with prices quoted in over-the-counter markets or by market makers, are fair valued based on quoted "bid" prices on long investments and quoted "ask" prices on investments sold short. The Fund early adopted Hong Kong Financial Reporting Standard 13, “Fair Value Measurement”, with effect from 1 October 2012, it changed its fair valuation input to utilize the last traded market price for both financial assets and financial liabilities where the last traded price falls within the bid-ask spread. When trading in the securities of an investee company is suspended, the investment is valued at the Manager's estimate of its fair value.
Debt securities are fair valued based on quoted prices inclusive of accrued interest.
Investments in collective investment schemes are stated at fair value based on the net asset value per unit of the respective funds as determined by the administrators of the relevant funds or stated at last traded prices if the collective investment schemes are listed or traded on an exchange.
Open future and swap contracts are valued at last traded prices for both long and short positions at the valuation date. The differences between the last traded prices and the contract prices are recognized in the Statement of Comprehensive Income.
Open option contracts are valued at last traded prices for both long and short positions at the valuation date. The differences between the last traded prices and the premium amounts/contract prices are recognized in the Statement of Comprehensive Income.
- 144 -
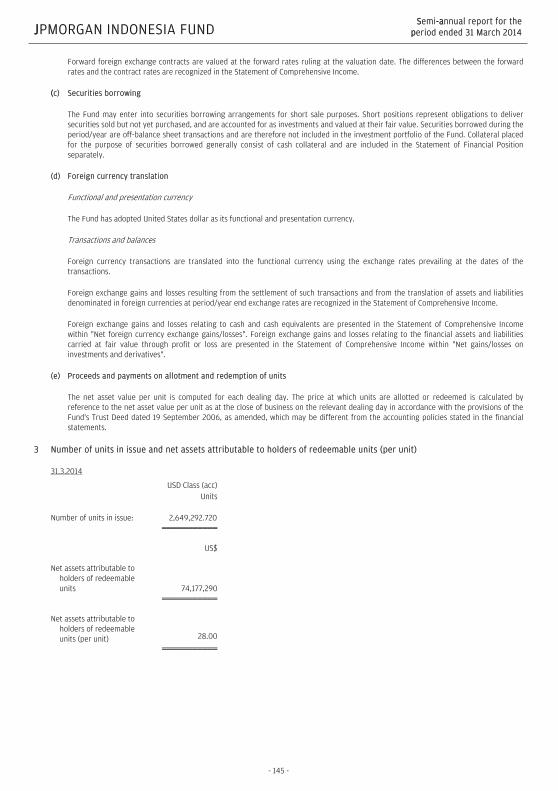
JJPMORGAN INDONESIA FUND SSemi--aannual report for the
pperiod ended 31 March 2014
Forward foreign exchange contracts are valued at the forward rates ruling at the valuation date. The differences between the forward rates and the contract rates are recognized in the Statement of Comprehensive Income.
((c) Securities borrowing
The Fund may enter into securities borrowing arrangements for short sale purposes. Short positions represent obligations to deliver securities sold but not yet purchased, and are accounted for as investments and valued at their fair value. Securities borrowed during the period/year are off-balance sheet transactions and are therefore not included in the investment portfolio of the Fund. Collateral placed for the purpose of securities borrowed generally consist of cash collateral and are included in the Statement of Financial Position separately.
(d) Foreign currency translation
Functional and presentation currency
The Fund has adopted United States dollar as its functional and presentation currency.
Transactions and balances
Foreign currency transactions are translated into the functional currency using the exchange rates prevailing at the dates of the transactions.
Foreign exchange gains and losses resulting from the settlement of such transactions and from the translation of assets and liabilities denominated in foreign currencies at period/year end exchange rates are recognized in the Statement of Comprehensive Income.
Foreign exchange gains and losses relating to cash and cash equivalents are presented in the Statement of Comprehensive Income within "Net foreign currency exchange gains/losses". Foreign exchange gains and losses relating to the financial assets and liabilities carried at fair value through profit or loss are presented in the Statement of Comprehensive Income within "Net gains/losses on investments and derivatives".
(e) Proceeds and payments on allotment and redemption of units
The net asset value per unit is computed for each dealing day. The price at which units are allotted or redeemed is calculated by reference to the net asset value per unit as at the close of business on the relevant dealing day in accordance with the provisions of the Fund's Trust Deed dated 19 September 2006, as amended, which may be different from the accounting policies stated in the financial statements.
3 Number of units in issue and net assets attributable to holders of redeemable units (per unit)
31.3.2014
USD Class (acc) Units Number of units in issue: 2,649,292.720 US$ Net assets attributable to
holders of redeemable units 74,177,290
Net assets attributable to
holders of redeemable units (per unit) 28.00
- 145 -

JJPMORGAN INDONESIA FUND SSemi--aannual report for the
pperiod ended 31 March 2014
30.9.2013
USD Class (acc) Units Number of units in issue: 2,693,113.386 US$ Net assets attributable to
holders of redeemable units 69,348,540
Net assets attributable to
holders of redeemable units (per unit) 25.75
44 Net gains on investments and derivatives
1.10.2013
to 31.3.2014
1.10.2012 to
31.3.2013 US$ US$ Change in unrealized gains/losses in value of investments and derivatives 11,900,173 21,343,200 Realized (losses)/gains on sale of investments and derivatives (6,331,219) 7,815,026 5,568,954 29,158,226
5 Soft commission arrangements
The Investment Manager has entered into soft commission arrangements with brokers under which certain goods and services used to support investment decision making are received by the Investment Manager. The Investment Manager does not make direct payment for these services but transacts an agreed amount of business with the brokers on behalf of the Fund. Commission is paid from the Fund on these transactions.
The goods and services must be of demonstrable benefit to the Fund and may include research and advisory services; economic and political analysis; portfolio analysis, including valuation and performance measurement; market analysis, data and quotation services, computer hardware and software incidental to the above goods and services; clearing and custodian services and investment-related publications.
6 Distribution
No distribution was made during the period (31 March 2013: nil).
- 146 -

JJPMORGAN JAPAN (YEN) FUND SSemi--aannual report for the
pperiod ended 31 March 2014
DDistributor Status The Fund has been certified by HMRC in the UK as a distributing fund in respect of the period from 1 January 1984 to 30 September 2010. The principal effect of this certification is that for unitholders resident or ordinarily resident in the UK for taxation purposes any gains accruing on the sale, redemption or other disposal of units during the period will be taxed in the UK as a capital gain and not as income. This treatment will continue under the new UK reporting fund regime provided the Fund does not invest more than 5% of its assets in other offshore funds which are not themselves reporting funds. There will be no need to formally apply for reporting fund status as the Fund is transparent for UK tax purposes and therefore considered out of scope of the requirements of this new regime. These are now known as "special category transparent offshore funds". As noted, the Fund is transparent for UK income tax purposes and UK investors are subject to UK capital gains tax on disposal of their units. UK investors are subject to tax on their share of income of the Fund on an arising basis. Information has been provided to UK investors of the amount of their share of the underlying income, expenses and overseas tax suffered.
Investment Portfolio As at 31 March 2014 (Unaudited)
Holding
Fair value
JPY'000
% of net
assets Listed/Quoted Investments (115.3%) (I) Equities (115.1%) Japan (115.1%) Banks (10.6%) Mitsubishi UFJ Financial Group 2,309,200 1,309,316 3.9 Seven Bank 761,500 308,408 0.9 Shinsei Bank 1,542,000 313,026 0.9 Sumitomo Mitsui Financial Grp 373,900 1,648,526 4.9 Chemicals (2.3%) Nifco Inc 62,400 181,958 0.5 Unicharm Corp 108,100 595,955 1.8 Construction (0.9%) SHO-BOND Hldgs 68,600 312,816 0.9 Electric Appliances (14.7%) Fanuc Corp 39,800 724,559 2.1 Hitachi Ltd 1,056,000 804,672 2.4 Keyence Corp 20,300 864,171 2.6 Mitsubishi Electric 724,000 841,288 2.5 Murata Mfg 62,500 608,438 1.8 Omron Corp 158,700 676,062 2.0 Sysmex Corp 135,400 445,466 1.3 Foods (2.0%) Coca-Cola East Japan 127,500 330,225 1.0 Kikkoman Corp 182,000 354,354 1.0
(Continued)
Holding
Fair value
JPY'000
% of net
assets Glass & Ceramics PProducts (4.8%) Nippon Sheet Glass 6,231,000 915,957 2.7 Taiheiyo Cement 1,904,000 708,288 2.1 Information & Communication (13.8%) Digital Garage 215,200 378,322 1.1 Fuji Media Hldgs 249,000 471,855 1.4 Hikari Tsushin 84,800 738,608 2.2 KDDI Corp 118,600 708,754 2.1 Otsuka Corp 27,100 365,308 1.1 Softbank Corp 165,200 1,288,560 3.8 Yahoo Japan 1,359,600 687,958 2.1 Insurance (0.3%) Anicom Hldgs 120,900 102,402 0.3 Machinery (5.0%) Daikin Industries 136,500 789,243 2.4 Kubota Corp 254,000 347,218 1.0 SEGA Sammy Hldgs 233,400 539,621 1.6 Metal Products (1.5%) Sanwa Hldgs 755,000 505,095 1.5 Non Ferrous Metals (2.6%) Sumitomo Electric Industries 568,000 872,448 2.6 Other Financing Business (5.2%) AEON Financial Service 158,000 367,666 1.1 Credit Saison 152,300 312,672 0.9 Orix Corp 734,500 1,067,228 3.2 Other Products (1.0%) Pigeon Corp 74,300 346,238 1.0 Pharmaceuticals (4.4%) 3-D Matrix 40,000 166,200 0.5 Nippon Shinyaku 296,000 579,272 1.7 Ono Pharmaceutical 64,100 573,054 1.7 PeptiDream Inc 20,700 167,049 0.5 Precision Instruments (1.4%) Asahi Intecc 76,600 317,890 0.9 CYBERDYNE Inc 20,200 151,904 0.5 Real Estate (7.0%) Industrial & Infrastructure
Fund 297 252,153 0.8 Leopalace21 Corp 845,900 418,720 1.2 Park24 Co 202,200 396,716 1.2 Sumitomo Realty &
Development 173,000 699,266 2.1 Tokyo Tatemono 351,000 310,635 0.9 Tokyu Fudosan Hldgs 368,143 283,470 0.8 Retail Trade (8.3%) Askul Corp 128,700 418,275 1.2 Cosmos Pharmaceutical 38,500 464,310 1.4 Don Quijote 100,800 537,264 1.6 MonotaRO Co 338,800 888,334 2.6
- 147 -

JJPMORGAN JAPAN (YEN) FUND SSemi--aannual report for the
pperiod ended 31 March 2014
IInvestment Portfolio (Continued) As at 31 March 2014 (Unaudited)
Holding
Fair value
JPY'000
% of net
assets Retail TTrade (Continued) Seria Co 127,800 488,835 1.5 Services (18.3%) Cookpad Inc 177,700 436,964 1.3 Cyber Agent 103,400 408,430 1.2 H I S Co 89,700 527,436 1.6 Infomart Corp 247,600 427,605 1.3 Kakaku.com Inc 401,200 673,615 2.0 M3 Inc 522,600 885,284 2.6 NEXT Co 270,600 216,480 0.6 Nihon M&A Center 137,700 380,603 1.1 Pasona Group 365,200 222,407 0.7 Rakuten Inc 585,300 805,958 2.4 Sohgo Security Services 217,900 471,536 1.4 Tokyo Individualized
Educational 382,300 175,093 0.5 Yumeshin Co 588,700 538,660 1.6 Textiles & Apparel (0.3%) Beauty Garage 56,300 96,836 0.3 Transportation Equipment (7.1%) Fuji Heavy Industries 295,000 823,640 2.5 Mazda Motor 2,447,000 1,120,726 3.3 Shimano Inc 42,500 440,725 1.3 Wholesale TTrade (3.6%) Daiichikosho Co 113,200 353,750 1.0 Misumi Group 136,500 390,390 1.2 Sanrio Co 140,000 487,200 1.4 38,829,366 115.1 (II) Derivatives (0.2%) Forward foreign exchange ccontracts (0.2%) 57,942 0.2 Total Listed/Quoted Investments 38,887,308 115.3 Other net liabilities (5,174,402) (15.3) Net assets attributable to holders of
rredeemable units at 31 March 2014 33,712,906 100.0 Total investments, at cost 33,675,018
Statement of Movements in Portfolio Holdings For the period ended 31 March 2014 (Unaudited) % holdings
of net assets 31.3.2014 30.9.2013 Listed/Quoted Investments Equities Japan Services 18.3 17.7 Electric Appliances 14.7 5.9 Information & Communication 13.8 8.4 Banks 10.6 14.4 Retail Trade 8.3 11.3 Transportation Equipment 7.1 7.7 Real Estate 7.0 8.6 Other Financing Business 5.2 6.8 Machinery 5.0 7.8 Glass & Ceramics Products 4.8 4.1 Pharmaceuticals 4.4 5.9 Wholesale Trade 3.6 4.6 Non Ferrous Metals 2.6 1.3 Chemicals 2.3 2.2 Foods 2.0 2.6 Metal Products 1.5 0.9 Precision Instruments 1.4 0.8 Other Products 1.0 - Construction 0.9 2.2 Insurance 0.3 0.5 Textiles & Apparel 0.3 0.6 Derivatives Forward foreign exchange contracts 0.2 (0.0) Total Listed/Quoted Investments 115.3 114.3 Other net liabilities (15.3) (14.3) Net assets attributable to holders of
rredeemable uunits 100.0 100.0
- 148 -

JJPMORGAN JAPAN (YEN) FUND SSemi--aannual report for the
pperiod ended 31 March 2014
SStatement of Financial Position As at 31 March 2014 (Unaudited) 31.3.2014 30.9.2013 JPY'000 JPY'000 Assets Cash at banks 506,685 48,159 Amounts due from brokers 139,526 - Amounts receivable on allotment 83,303 578,855 Derivatives 57,942 - Investments 38,829,366 30,884,505 Dividend and other accounts
receivable 193,291 125,586 Total assets 39,810,113 31,637,105 ---------- ---------- Liabilities Short term bank loans - unsecured 5,238,029 4,047,530 Amounts due to brokers 647,249 147,957 Amounts payable on redemption 165,126 372,486 Derivatives - 1,143 Other accounts payable 46,803 40,835 Liabilities (excluding net assets
attributable to holders of redeemable units) 6,097,207 4,609,951
---------- ---------- Net assets attributable to holders
oof redeemable units [Note 3] 33,712,906 27,027,154
Statement of Comprehensive Income For the period ended 31 March 2014 (Unaudited) 1.10.2013
to 31.3.2014
1.10.2012 to
31.3.2013 JPY'000 JPY'000 Income Net (losses)/gains on investments
and derivatives [Note 4] (1,653,349) 3,765,273 Dividend income 249,222 117,654 Interest on deposits 50 - Net foreign currency exchange
losses (545) (111) (1,404,622) 3,882,816 ---------- ---------- Expenses Management fee 230,189 70,844 Transaction costs 11,488 6,173 Registrar's fee 6,008 2,073 Trustee's fee 4,533 1,873 Safe custody and bank charges 3,113 899 Valuation fee 822 686 Printing and publication expenses 681 176 Auditor's fee 551 556 Legal and professional expenses 69 - Other operating expenses 173 53 257,627 83,333 ---------- ---------- Net operating ((loss)/profit (1,662,249) 3,799,483 Finance costs Interest paid (18,522) (5,769) (Loss)/profit before taxation (1,680,771) 3,793,714 Taxation (25,252) (8,407) (Decrease)/increase in net
assets attributable to holdersof redeemable units and total comprehensive income (1,706,023) 3,785,307
The notes on pages 151 to 154 form part of these financial statements.
- 149 -

JJPMORGAN JAPAN (YEN) FUND SSemi--aannual report for the
pperiod ended 31 March 2014
SStatement of Changes in Net Assets Attributable to Holders of Redeemable Units For the period ended 31 March 2014 (Unaudited) 1.10.2013
to 31.3.2014
1.10.2012 to
31.3.2013 JPY'000 JPY'000 Net assets attributable to holders
of redeemable units at the beginning of the period 27,027,154 8,286,274
---------- ---------- Allotment of redeemable units 22,650,452 3,646,681 Redemption of redeemable units (14,258,677) (2,858,012) Net allotment 8,391,775 788,669 ---------- ---------- 35,418,929 9,074,943 (Decrease)/increase in net assets
attributable to holders of redeemable units and total comprehensive income (1,706,023) 3,785,307
Net assets attributable to holders
oof redeemable units at the end of the period 33,712,906 12,860,250
Statement of Cash Flows For the period ended 31 March 2014 (Unaudited) 1.10.2013
to 31.3.2014
1.10.2012 to
31.3.2013 JPY'000 JPY'000 Operating activities Purchase of investments and
derivatives (14,608,497) (5,700,773) Proceeds from disposal of
investments and derivatives 5,310,485 3,791,727 Dividend received 181,089 99,378 Interest received 34 - Trustee's fee paid (4,383) (1,803) Registrar's fee paid (10,730) (3,565) Transaction costs paid (11,045) (6,319) Tax paid (25,673) (8,407) Management fee paid (221,156) (66,636) Others (25,684) (3,525) Net cash outflow from
ooperating activities (9,415,560) (1,899,923) ---------- ---------- Financing activities Interest paid (18,499) (5,684) Receipts on allotment of
redeemable units 23,146,004 3,156,180 Payments on redemption of
redeemable units (14,466,037) (2,720,532) Net cash inflow from financing
aactivities 8,661,468 429,964 ---------- ---------- Decrease in cash and cash
eequivalents (754,092) (1,469,959) Cash and cash equivalents at the
beginning of the period (3,999,371) (1,109,738) Exchange gains on cash and cash
equivalents 22,119 295 Cash and cash equivalents at
tthe end of the period (4,731,344) (2,579,402) Analysis of balances of cash and cash equivalents: Cash at banks 506,685 5,436 Short term bank loans -
unsecured (5,238,029) (2,584,838) (4,731,344) (2,579,402)
The notes on pages 151 to 154 form part of these financial statements.
- 150 -

JJPMORGAN JAPAN (YEN) FUND SSemi--aannual report for tthe
pperiod ended 31 March 2014
NNotes to the Financial Statements
1 The Fund
JPMorgan Japan (Yen) Fund (the "Fund") was established under a Trust Deed dated 1 August 1969, as amended, and is governed by the laws of Hong Kong. The Fund is authorized by the Securities and Futures Commission of Hong Kong.
The investment objective of the Fund is to provide investors with long-term capital growth through investment primarily in Japanese securities and other securities whose performance is linked to the Japanese economy.
Pursuant to the Supplemental Trust Deed dated 20 June 2013, the Manager may decide to issue separate classes (each a "Class") whose assets will be commonly invested but where a specific fee structure, currency or distribution policy may be applied. Each Class may have a different charging structure with the result that the net asset value attributable to each Class may differ.
All unitholders' rights with regard to the convening, voting or otherwise acting at any meeting of unitholders are the same.
2 Summary of principal accounting policies
(a) Accounting policies of interim financial statements
The accounting policies and methods of computation used in the preparation of these unaudited condensed interim financial statements are consistent with those used in the annual financial statements for the year ended 30 September 2013.
(b) Investments and derivatives
Classification
The Fund classifies its investments and derivatives as financial assets or financial liabilities at fair value through profit or loss. These financial assets or financial liabilities are held-for-trading as they are acquired or incurred principally for the purpose of selling or repurchasing in the near term or short-term profit taking.
All derivatives are carried in assets when amounts are receivable by the Fund and in liabilities when amounts are payable by the Fund.
The Fund makes short sales in which a borrowed security is sold in anticipation of a decline in the market value of that security, or it may use short sales for various arbitrage transactions. Short sales are classified as financial liabilities at fair value through profit or loss.
Recognition, derecognition and measurement
Purchases and sales of investments and derivatives are accounted for on the trade date basis. Investments and derivatives are initially recognized at fair value and are subsequently re-measured at fair value. Realized and unrealized gains and losses on investments and derivatives are recognized in the Statement of Comprehensive Income. Investments and derivatives are derecognized when the rights to receive cash flows from the investments and derivatives have expired or the Fund has transferred substantially all risks and rewards of ownership.
Fair value estimation
Fair value is the price that would be received to sell an asset or paid to transfer a liability in an orderly transaction between market participants at the measurement date. The fair value of financial assets and liabilities traded in active markets are based on last traded prices. Prior to 1 October 2012, investments that are listed or traded on an exchange and investments with prices quoted in over-the-counter markets or by market makers, are fair valued based on quoted "bid" prices on long investments and quoted "ask" prices on investments sold short. The Fund early adopted Hong Kong Financial Reporting Standard 13, "Fair Value Measurement", with effect from 1 October 2012, it changed its fair valuation input to utilize the last traded market price for both financial assets and financial liabilities where the last traded price falls within the bid-ask spread. When trading in the securities of an investee company is suspended, the investment is valued at the Manager's estimate of its fair value.
Debt securities are fair valued based on quoted prices inclusive of accrued interest.
Investments in collective investment schemes are stated at fair value based on the net asset value per unit of the respective funds as determined by the administrators of the relevant funds or stated at last traded prices if the collective investment schemes are listed or traded on an exchange.
Open future and swap contracts are valued at last traded prices for both long and short positions at the valuation date. The differences between the last traded prices and the contract prices are recognized in the Statement of Comprehensive Income.
Open option contracts are valued at last traded prices for both long and short positions at the valuation date. The differences between the last traded prices and the premium amounts/contract prices are recognized in the Statement of Comprehensive Income.
- 151 -
JJPMORGAN JAPAN (YEN) FUND SSemi--aannual report for tthe
pperiod ended 31 March 2014
Forward foreign exchange contracts are valued at the forward rates ruling at the valuation date. The differences between the forward rates and the contract rates are recognized in the Statement of Comprehensive Income.
((c) Securities lending and borrowing
Securities lenders' agreements are entered into with institutions of appropriate financial standing who engage in such arrangements acceptable to the Trustee and on arm's length commercial terms. Securities lent are included in the investment portfolio of the Fund. Relevant securities lending income entitled by the Fund is accounted for in the Statement of Comprehensive Income. Collateral received for the purpose of securities lent generally consist of non-cash collateral which are off-balance sheet transactions and are therefore not included in the financial statements.
The Fund may enter into securities borrowing arrangements for short sale purposes. Short positions represent obligations to deliver securities sold but not yet purchased, and are accounted for as investments and valued at their fair value. Securities borrowed during the period/year are off-balance sheet transactions and are therefore not included in the investment portfolio of the Fund. Collateral placed for the purpose of securities borrowed generally consist of cash collateral and are included in the Statement of Financial Position separately.
(d) Foreign currency translation
Functional and presentation currency
The Fund has adopted Japanese Yen as its functional and presentation currency.
Transactions and balances
Foreign currency transactions are translated into the functional currency using the exchange rates prevailing at the dates of the transactions.
Foreign exchange gains and losses resulting from the settlement of such transactions and from the translation of assets and liabilities denominated in foreign currencies at period/year end exchange rates are recognized in the Statement of Comprehensive Income.
Foreign exchange gains and losses relating to cash and cash equivalents are presented in the Statement of Comprehensive Income within "Net foreign currency exchange gains/losses". Foreign exchange gains and losses relating to the financial assets and liabilities carried at fair value through profit or loss are presented in the Statement of Comprehensive Income within "Net gains/losses on investments and derivatives".
(e) Proceeds and payments on allotment and redemption of units
The net asset value per unit is computed for each dealing day. The price at which units are allotted or redeemed is calculated by reference to the net asset value per unit as at the close of business on the relevant dealing day in accordance with the provisions of the Fund's Trust Deed dated 1 August 1969, as amended, which may be different from the accounting policies stated in the financial statements.
Units of the Fund are redeemable at the option of the holders of redeemable units and are classified as a financial liability in the Statement of Financial Position which represents the net assets attributable to holders of redeemable units (or "net asset value" or "net assets" or "NAV") and is carried at the redemption amount that would be payable at the Statement of Financial Position date if the holders of redeemable units exercised the right to redeem units of the Fund.
- 152 -

JJPMORGAN JAPAN (YEN) FUND SSemi--aannual report for tthe
pperiod ended 31 March 2014
33 Number of units in issue and net assets attributable to holders of redeemable units (per unit)
31.3.2014
HKD Hedged Class (acc) JPY Class (acc) USD Hedged Class (acc) Units Units Units Number of units in issue: 11,860,925.888 1,545,158.192 3,626,750.904 HK$ JPY'000 US$ Net assets attributable to
holders of redeemable units 121,377,594 28,271,948 37,185,147
Net assets attributable to
holders of redeemable units (per unit) 10.23 18.297 10.25
30.9.2013
HKD Hedged Class (acc) JPY Class (acc) USD Hedged Class (acc) Units Units Units Number of units in issue: 1,131,609.695 1,389,303.819 243,660.354 HK$ JPY'000 US$ Net assets attributable to
holders of redeemable units 12,235,172 26,613,838 2,634,467
Net assets attributable to
holders of redeemable units (per unit) 10.81 19.156 10.81
4 Net (losses)/gains on investments and derivatives
1.10.2013
to 31.3.2014
1.10.2012 to
31.3.2013 JPY'000 JPY'000 Change in unrealized gains/losses in value of investments and derivatives (2,046,621) 3,877,595 Realized gains/(losses) on sale of investments and derivatives 393,272 (112,322) (1,653,349) 3,765,273
5 Soft commission arrangements
The Investment Manager has entered into soft commission arrangements with brokers under which certain goods and services used to support investment decision making are received by the Investment Manager. The Investment Manager does not make direct payment for these services but transacts an agreed amount of business with the brokers on behalf of the Fund. Commission is paid from the Fund on these transactions.
The goods and services must be of demonstrable benefit to the Fund and may include research and advisory services; economic and political analysis; portfolio analysis, including valuation and performance measurement; market analysis, data and quotation services, computer hardware and software incidental to the above goods and services; clearing and custodian services and investment-related publications.
- 153 -

JJPMORGAN JAPAN (YEN) FUND SSemi--aannual report for tthe
pperiod ended 31 March 2014
66 Distribution
No distribution was made during the period (31 March 2013: nil).
- 154 -

JJPMORGAN JAPAN SMALLER COMPANY (YEN) FUND SSemi--aannual report for the
pperiod ended 31 March 2014
DDistributor Status The Fund has been certified by HMRC in the UK as a distributing fund in respect of the period from 1 January 1984 to 30 September 2010. The principal effect of this certification is that for unitholders resident or ordinarily resident in the UK for taxation purposes any gains accruing on the sale, redemption or other disposal of units during the period will be taxed in the UK as a capital gain and not as income. This treatment will continue under the new UK reporting fund regime provided the Fund does not invest more than 5% of its assets in other offshore funds which are not themselves reporting funds. There will be no need to formally apply for reporting fund status as the Fund is transparent for UK tax purposes and therefore considered out of scope of the requirements of this new regime. These are now known as "special category transparent offshore funds". As noted, the Fund is transparent for UK income tax purposes and UK investors are subject to UK capital gains tax on disposal of their units. UK investors are subject to tax on their share of income of the Fund on an arising basis. Information has been provided to UK investors of the amount of their share of the underlying income, expenses and overseas tax suffered.
Investment Portfolio As at 31 March 2014 (Unaudited)
Holding
Fair value
JPY'000
% of net
assets Listed/Quoted Investments (107.5%) Equities (107.5%) Japan (107.5%) Banks (5.3%) Seven Bank 368,000 149,040 1.1 Shinsei Bank 1,460,000 296,380 2.1 Suruga Bank 159,000 289,062 2.1 Chemicals (3.3%) Daicel Corp 217,000 183,582 1.3 FP Corp 44,600 146,511 1.1 Unicharm Corp 21,300 117,427 0.9 Construction (5.0%) Nippo Corp 179,000 255,075 1.9 Obayashi Corp 479,000 278,778 2.0 SHO-BOND Hldgs 33,700 153,672 1.1 Electric Appliances (7.2%) Anritsu Corp 103,000 122,055 0.9 Japan Display 130,100 93,802 0.7 NEC Corp 477,000 151,209 1.1 Nidec Corp 37,600 236,090 1.7 Renesas Electronics 113,900 89,639 0.6 Rohm Co 28,800 132,624 1.0 Sysmex Corp 51,200 168,448 1.2 Glass & Ceramics Products (4.9%) Maruwa Co (5344) 37,900 152,358 1.1
(Continued)
Holding
Fair value
JPY'000
% of net
assets Nippon Sheet Glass 1,616,000 237,552 1.7 Taiheiyo Cement 775,000 288,300 2.1 Information & Communication (8.9%) Broadleaf Co 57,700 93,012 0.7 Digital Garage 56,100 98,624 0.7 Fuji Media Hldgs 98,300 186,278 1.3 GMO Payment Gateway 30,500 133,895 1.0 Hikari Tsushin 18,600 162,006 1.2 Konami Corp 46,800 111,618 0.8 V-cube Inc 26,800 123,682 0.9 Yahoo Japan 491,100 248,497 1.8 ZIGExN Co 74,500 74,574 0.5 Insurance (0.8%) Anicom Hldgs 104,600 88,596 0.7 Lifenet Insurance 38,100 16,192 0.1 Iron & Steel (1.2%) Kyoei Steel 26,700 48,861 0.3 Yamato Kogyo 36,700 118,724 0.9 Machinery (7.1%) Daikin Industries 12,700 73,431 0.5 Disco Corp 19,600 125,832 0.9 Makita Corp 25,500 144,585 1.0 Nabtesco Corp 53,000 125,822 0.9 SEGA Sammy Hldgs 87,400 202,069 1.5 Shibuya Kogyo 59,100 162,525 1.2 THK Co 64,200 148,751 1.1 Metal Products (3.2%) Rinnai Corp 31,500 285,705 2.1 Sanwa Hldgs 241,000 161,229 1.1 Non Ferrous Metals (5.3%) Dowa Hldgs 202,000 174,124 1.3 Sumitomo Electric Industries 258,600 397,211 2.9 UACJ Corp 364,000 155,064 1.1 Other Financing Business (5.3%) AEON Financial Service 80,000 186,160 1.3 Credit Saison 64,500 132,418 1.0 Hitachi Capital 51,000 112,608 0.8 Mitsubishi UFJ Lease &
Finance Co 598,100 302,639 2.2 Other Products (2.2%) Fuji Seal Intl 86,000 302,290 2.2 Pharmaceuticals (2.0%) 3-D Matrix 22,200 92,241 0.7 Medrx Co 8,200 10,947 0.1 Nippon Shinyaku 67,000 131,119 0.9 PeptiDream Inc 4,900 39,543 0.3 Precision Instruments (2.4%) Asahi Intecc 57,400 238,210 1.7 CYBERDYNE Inc 12,600 94,752 0.7
- 155 -

JJPMORGAN JAPAN SMALLER COMPANY (YEN) FUND SSemi--aannual report for the
pperiod ended 31 March 2014
IInvestment Portfolio (Continued) As at 31 March 2014 (Unaudited)
Holding
Fair value
JPY'000
% of net
assets Real Estate (9.1%) Arealink Co 464,600 59,004 0.4 GLP J-REIT 1,637 170,084 1.2 Hulic Reit 370 52,170 0.4 Industrial & Infrastructure
Fund 265 224,985 1.6 Leopalace21 Corp 210,300 104,098 0.8 Nippon Prologis REIT 360 74,952 0.6 Park24 Co 115,500 226,611 1.6 Sun Frontier Fudousan 93,200 132,717 1.0 Tokyo Tatemono 232,000 205,320 1.5 Retail Trade (7.9%) Asahi Co 74,400 103,937 0.8 Cosmos Pharmaceutical 9,500 114,570 0.8 Don Quijote 48,600 259,038 1.9 Medical System Network 86,600 40,442 0.3 MonotaRO Co 63,200 165,710 1.2 Seria Co 63,800 244,035 1.8 United Arrows 41,400 158,148 1.1 Services (17.2%) Cyber Agent 160,300 633,186 4.6 Daiseki Co 64,200 114,276 0.8 DeNA Co 30,000 55,920 0.4 DLE Inc 11,100 26,030 0.2 H I S Co 48,900 287,532 2.1 Infomart Corp 102,000 176,154 1.3 Kakaku.com Inc 89,600 150,438 1.1 M3 Inc 235,000 398,091 2.9 Minnano Wedding Co 1,200 3,480 0.0 Nihon M&A Center 76,800 212,275 1.5 Rakuten Inc 105,700 145,549 1.0 Sohgo Security Services 80,400 173,986 1.3 Transportation Equipment (5.5%) Fuji Heavy Industries 51,000 142,392 1.0 Mazda Motor 703,000 321,975 2.3 Shimano Inc 15,300 158,661 1.2 ShinMaywa Industries 145,000 136,590 1.0 Wholesale Trade (3.7%) Daiichikosho Co 56,900 177,812 1.3 Hanwa Co 163,000 65,200 0.5 Misumi Group 49,200 140,712 1.0 Sanrio Co 37,900 131,892 0.9 Total Listed/Quoted Investments 14,833,410 107.5 Other net liabilities (1,031,532) (7.5) Net aassets attributable to holders of
redeemable units at 31 March 2014 13,801,878 100.0 Total investments, at cost 12,154,140
Statement of Movements in Portfolio Holdings For the period ended 31 March 2014 (Unaudited) % holdings
of net assets 31.3.2014 30.9.2013 Listed/Quoted Investments Equities Japan Services 17.2 16.4 Real Estate 9.1 11.6 Information & Communication 8.9 6.3 Retail Trade 7.9 9.3 Electric Appliances 7.2 3.4 Machinery 7.1 11.1 Transportation Equipment 5.5 7.2 Banks 5.3 5.0 Other Financing Business 5.3 6.0 Non Ferrous Metals 5.3 3.6 Construction 5.0 5.3 Glass & Ceramics Products 4.9 2.8 Wholesale Trade 3.7 5.2 Chemicals 3.3 3.7 Metal Products 3.2 1.1 Precision Instruments 2.4 2.6 Other Products 2.2 1.6 Pharmaceuticals 2.0 3.3 Iron & Steel 1.2 1.7 Insurance 0.8 1.3 Total Listed/Quoted Investments 107.5 108.5 Other net liabilities (7.5) (8.5) Net assets aattributable to holders of
redeemable units 100.0 100.0
- 156 -

JJPMORGAN JAPAN SMALLER COMPANY (YEN) FUND SSemi--aannual report for the
pperiod ended 31 March 2014
SStatement of Financial Position As at 31 March 2014 (Unaudited) 31.3.2014 30.9.2013 JPY'000 JPY'000 Assets Cash at banks 37,999 31,462 Amounts due from brokers 143,615 244 Amounts receivable on allotment 1,703 119,756 Investments 14,833,410 10,395,107 Dividend and other accounts
receivable 508,458 36,161 Total assets 15,525,185 10,582,730 ---------- ---------- Liabilities Short term bank loans - unsecured 1,234,533 956,851 Amounts due to brokers 19,651 2,352 Amounts payable on redemption 18,505 28,506 Other accounts payable 450,618 14,678 Total liabilities 1,723,307 1,002,387 ---------- ---------- Net assets attributable to holders
oof redeemable units [Note 3] 13,801,878 9,580,343 Equity 13,801,878 9,580,343
Statement of Comprehensive Income For the period ended 31 March 2014 (Unaudited) 1.10.2013
to 31.3.2014
1.10.2012 to
31.3.2013 JPY'000 JPY'000 Income Net (losses)/gains on investments
and derivatives [Note 4] (361,864) 2,470,001 Dividend income 95,241 56,028 Net foreign currency exchange
gains 232 85 Other income 186 - (266,205) 2,526,114 ---------- ---------- Expenses Management fee 95,065 46,651 Transaction costs 5,892 3,086 Registrar's fee 2,591 1,441 Trustee's fee 1,141 560 Safe custody and bank charges 866 460 Auditor's fee 504 509 Printing and publication expenses 277 180 Legal and professional expenses 23 - Other operating expenses 28 20 106,387 52,907 ---------- ---------- Net operating (loss)/profit (372,592) 2,473,207 Finance costs Interest paid (3,690) (2,281) (Loss)/profit before taxation (376,282) 2,470,926 Taxation (9,700) (3,998) (Decrease)/increase in net
aassets attributable to holdersof redeemable units and total comprehensive income (385,982) 2,466,928
The notes on pages 159 to 161 form part of these financial statements.
- 157 -

JJPMORGAN JAPAN SMALLER COMPANY (YEN) FUND SSemi--aannual report for the
pperiod ended 31 March 2014
SStatement of Changes in Net Assets Attributable to Holders of Redeemable Units For the period ended 31 March 2014 (Unaudited) 1.10.2013
to 31.3.2014
1.10.2012 to
31.3.2013 JPY'000 JPY'000 Net assets aattributable to holders
of redeemable units at the beginning of the period 9,580,343 5,747,109
---------- ---------- Allotment of redeemable units 6,770,581 278,367 Redemption of redeemable units (2,163,064) (610,408) Net allotment/(redemption) 4,607,517 (332,041) ---------- ---------- 14,187,860 5,415,068 (Decrease)/increase in net assets
attributable to holders of redeemable units and total comprehensive income (385,982) 2,466,928
Net assets attributable to holders
oof redeemable units at the end of the period 13,801,878 7,881,996
Statement of Cash Flows For the period ended 31 March 2014 (Unaudited) 1.10.2013
to 31.3.2014
1.10.2012 to
31.3.2013 JPY'000 JPY'000 Operating activities Purchase of investments and
derivatives (9,888,439) (1,891,940) Proceeds from disposal of
investments and derivatives 4,962,018 1,913,952 Dividend received 66,604 48,176 Trustee's fee paid (1,071) (535) Registrar's fee paid (4,011) (2,580) Transaction costs paid (5,770) (3,063) Tax paid (14,505) (3,998) Management fee paid (89,161) (44,555) Others (9,016) (2,215) Net cash (outflow)/inflow from
ooperating activities (4,983,351) 13,242 ---------- ---------- Financing activities Interest paid (3,685) (2,260) Receipts on allotment of
redeemable units 6,888,634 249,545 Payments on redemption of
redeemable units (2,173,065) (594,701) Net cash iinflow/(outflow) from
financing activities 4,711,884 (347,416) ---------- ---------- Decrease in cash and cash
eequivalents (271,467) (334,174) Cash and cash equivalents at the
beginning of the period (925,389) (459,060) Exchange gains on cash and cash
equivalents 322 421 Cash and cash equivalents at
tthe end of the period (1,196,534) (792,813) Analysis of balances of cash and cash equivalents: Cash at banks 37,999 43,792 Short term bank loans -
unsecured (1,234,533) (836,605) (1,196,534) (792,813)
The notes on pages 159 to 161 form part of these financial statements.
- 158 -
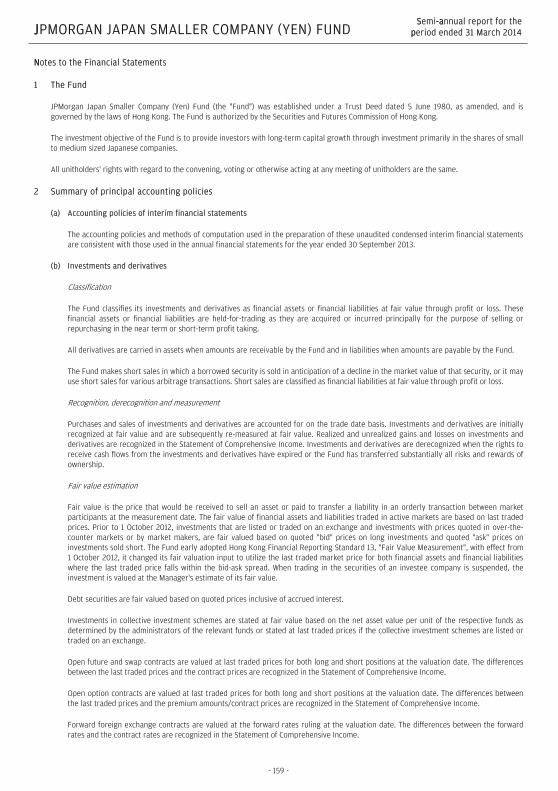
JJPMORGAN JAPAN SMALLER COMPANY (YEN) FUND SSemi--aannual report for the
pperiod ended 31 March 2014
NNotes to the Financial Statements
1 The Fund
JPMorgan Japan Smaller Company (Yen) Fund (the "Fund") was established under a Trust Deed dated 5 June 1980, as amended, and is governed by the laws of Hong Kong. The Fund is authorized by the Securities and Futures Commission of Hong Kong.
The investment objective of the Fund is to provide investors with long-term capital growth through investment primarily in the shares of small to medium sized Japanese companies.
All unitholders' rights with regard to the convening, voting or otherwise acting at any meeting of unitholders are the same.
2 Summary of principal accounting policies
(a) Accounting policies of interim financial statements
The accounting policies and methods of computation used in the preparation of these unaudited condensed interim financial statements are consistent with those used in the annual financial statements for the year ended 30 September 2013.
(b) Investments and derivatives
Classification
The Fund classifies its investments and derivatives as financial assets or financial liabilities at fair value through profit or loss. These financial assets or financial liabilities are held-for-trading as they are acquired or incurred principally for the purpose of selling or repurchasing in the near term or short-term profit taking.
All derivatives are carried in assets when amounts are receivable by the Fund and in liabilities when amounts are payable by the Fund.
The Fund makes short sales in which a borrowed security is sold in anticipation of a decline in the market value of that security, or it may use short sales for various arbitrage transactions. Short sales are classified as financial liabilities at fair value through profit or loss.
Recognition, derecognition and measurement
Purchases and sales of investments and derivatives are accounted for on the trade date basis. Investments and derivatives are initially recognized at fair value and are subsequently re-measured at fair value. Realized and unrealized gains and losses on investments and derivatives are recognized in the Statement of Comprehensive Income. Investments and derivatives are derecognized when the rights to receive cash flows from the investments and derivatives have expired or the Fund has transferred substantially all risks and rewards of ownership.
Fair value estimation
Fair value is the price that would be received to sell an asset or paid to transfer a liability in an orderly transaction between market participants at the measurement date. The fair value of financial assets and liabilities traded in active markets are based on last traded prices. Prior to 1 October 2012, investments that are listed or traded on an exchange and investments with prices quoted in over-the-counter markets or by market makers, are fair valued based on quoted "bid" prices on long investments and quoted "ask" prices on investments sold short. The Fund early adopted Hong Kong Financial Reporting Standard 13, "Fair Value Measurement", with effect from 1 October 2012, it changed its fair valuation input to utilize the last traded market price for both financial assets and financial liabilities where the last traded price falls within the bid-ask spread. When trading in the securities of an investee company is suspended, the investment is valued at the Manager's estimate of its fair value.
Debt securities are fair valued based on quoted prices inclusive of accrued interest.
Investments in collective investment schemes are stated at fair value based on the net asset value per unit of the respective funds as determined by the administrators of the relevant funds or stated at last traded prices if the collective investment schemes are listed or traded on an exchange.
Open future and swap contracts are valued at last traded prices for both long and short positions at the valuation date. The differences between the last traded prices and the contract prices are recognized in the Statement of Comprehensive Income.
Open option contracts are valued at last traded prices for both long and short positions at the valuation date. The differences between the last traded prices and the premium amounts/contract prices are recognized in the Statement of Comprehensive Income.
Forward foreign exchange contracts are valued at the forward rates ruling at the valuation date. The differences between the forward rates and the contract rates are recognized in the Statement of Comprehensive Income.
- 159 -
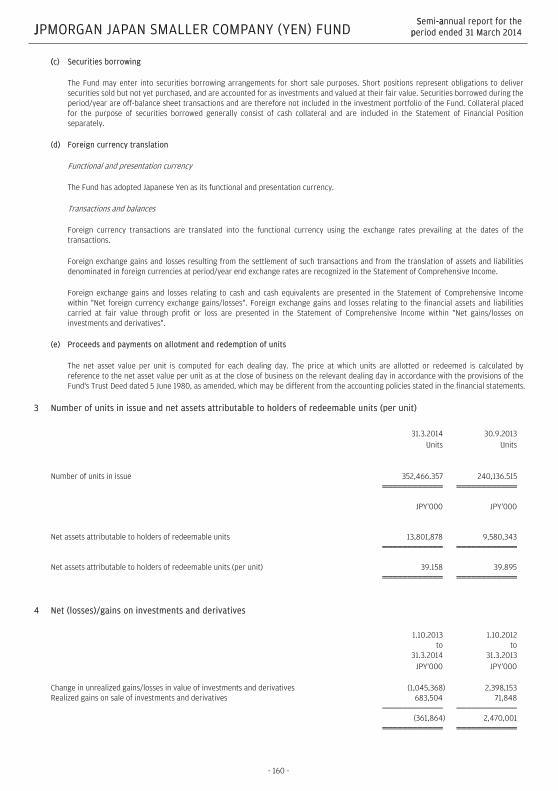
JJPMORGAN JAPAN SMALLER COMPANY (YEN) FUND SSemi--aannual report for the
pperiod ended 31 March 2014
((c) Securities borrowing
The Fund may enter into securities borrowing arrangements for short sale purposes. Short positions represent obligations to deliver securities sold but not yet purchased, and are accounted for as investments and valued at their fair value. Securities borrowed during the period/year are off-balance sheet transactions and are therefore not included in the investment portfolio of the Fund. Collateral placed for the purpose of securities borrowed generally consist of cash collateral and are included in the Statement of Financial Position separately.
(d) Foreign currency translation
Functional and presentation currency
The Fund has adopted Japanese Yen as its functional and presentation currency.
Transactions and balances
Foreign currency transactions are translated into the functional currency using the exchange rates prevailing at the dates of the transactions.
Foreign exchange gains and losses resulting from the settlement of such transactions and from the translation of assets and liabilities denominated in foreign currencies at period/year end exchange rates are recognized in the Statement of Comprehensive Income.
Foreign exchange gains and losses relating to cash and cash equivalents are presented in the Statement of Comprehensive Income within "Net foreign currency exchange gains/losses". Foreign exchange gains and losses relating to the financial assets and liabilities carried at fair value through profit or loss are presented in the Statement of Comprehensive Income within "Net gains/losses on investments and derivatives".
(e) Proceeds and payments on allotment and redemption of units
The net asset value per unit is computed for each dealing day. The price at which units are allotted or redeemed is calculated by reference to the net asset value per unit as at the close of business on the relevant dealing day in accordance with the provisions of the Fund's Trust Deed dated 5 June 1980, as amended, which may be different from the accounting policies stated in the financial statements.
3 Number of units in issue and net assets attributable to holders of redeemable units (per unit)
31.3.2014 30.9.2013 Units Units Number of units in issue 352,466.357 240,136.515 JPY'000 JPY'000 Net assets attributable to holders of redeemable units 13,801,878 9,580,343 Net assets attributable to holders of redeemable units (per unit) 39.158 39.895
4 Net (losses)/gains on investments and derivatives
1.10.2013
to 31.3.2014
1.10.2012 to
31.3.2013 JPY'000 JPY'000 Change in unrealized gains/losses in value of investments and derivatives (1,045,368) 2,398,153 Realized gains on sale of investments and derivatives 683,504 71,848 (361,864) 2,470,001
- 160 -

JJPMORGAN JAPAN SMALLER COMPANY (YEN) FUND SSemi--aannual report for the
pperiod ended 31 March 2014
55 Soft commission arrangements
The Investment Manager has entered into soft commission arrangements with brokers under which certain goods and services used to support investment decision making are received by the Investment Manager. The Investment Manager does not make direct payment for these services but transacts an agreed amount of business with the brokers on behalf of the Fund. Commission is paid from the Fund on these transactions.
The goods and services must be of demonstrable benefit to the Fund and may include research and advisory services; economic and political analysis; portfolio analysis, including valuation and performance measurement; market analysis, data and quotation services, computer hardware and software incidental to the above goods and services; clearing and custodian services and investment-related publications.
6 Distribution
No distribution was made during the period (31 March 2013: nil).
- 161 -

JJPMORGAN KOREA FUND SSemi--aannual report for the
pperiod ended 31 March 2014
DDistributor Status The Fund has been certified by HMRC in the UK as a distributing fund in respect of the period from 11 December 1991 to 30 September 2010. The principal effect of this certification is that for unitholders resident or ordinarily resident in the UK for taxation purposes any gains accruing on the sale, redemption or other disposal of units during the period will be taxed in the UK as a capital gain and not as income. This treatment will continue under the new UK reporting fund regime provided the Fund does not invest more than 5% of its assets in other offshore funds which are not themselves reporting funds. There will be no need to formally apply for reporting fund status as the Fund is transparent for UK tax purposes and therefore considered out of scope of the requirements of this new regime. These are now known as “special category transparent offshore funds”. As noted, the Fund is transparent for UK income tax purposes and UK investors are subject to UK capital gains tax on disposal of their units. UK investors are subject to tax on their share of income of the Fund on an arising basis. Information has been provided to UK investors of the amount of their share of the underlying income, expenses and overseas tax suffered.
Investment Portfolio As at 31 March 2014 (Unaudited)
Holding
Fair value
US$
% of net
assets Listed/Quoted Investments (84.2%) (I) Equities (84.1%) Korea (84.1%) Auto Components (2.7%) Hankook Tire Worldwide 443,000 8,760,534 1.5 Hyundai Mobis 22,600 6,687,961 1.2 Automobiles (5.2%) Hyundai Motor 48,300 11,389,262 2.0 KIA Motors 320,000 17,827,047 3.2 Capital Markets (7.7%) Daishin Securities Pref 328,250 1,754,655 0.3 Hanyang Securities 775,000 4,666,964 0.8 Korea Investment Hldgs 448,000 15,488,186 2.8 Samsung Securities 505,000 18,526,234 3.3 Shin Young Sec 76,570 2,880,951 0.5 Chemicals (5.4%) Hyosung Corp 57,000 4,112,546 0.7 KPX Green Chemical 921,230 4,855,184 0.9 LG Chem 89,800 21,428,156 3.8 Commercial Banks (10.4%) KB Financial Group 1,249,000 43,708,253 7.7 Shinhan Financial Group 338,000 14,924,139 2.7 Construction & Engineering (1.3%) Daelim Industrial 91,500 7,452,722 1.3
(Continued) HHolding
Fair value
US$
% of net
assets Diversified Financial Services (1.3%) Korea Ratings Corp 112,898 3,934,911 0.7 NICE Information Service 987,292 3,399,338 0.6 Diversified Telecommunication Servicces (1.9%) KT Corp 396,000 10,993,283 1.9 Food & Staples RRetailing (1.3%) Dongsuh Co 514,711 7,640,034 1.3 Gas Utilities (0.6%) Hanjin Heavy Ind & Const
Hldgs 331,350 3,159,568 0.6 Hotels Restaurants & Leisure (0.8%) Shinsegae Food 58,695 4,720,083 0.8 Household Products (1.1%) LG Household & Healthcare 13,800 5,957,161 1.1 Insurance (2.8%) Korean Reinsurance 1,047,080 10,131,922 1.8 Samsung Life Insurance 63,000 5,948,142 1.0 Internet Software & Services (1.5%) Daum Communications 86,300 6,340,044 1.1 NAVER Corp 2,600 1,890,554 0.4 Machinery (6.2%) Hyundai Heavy Industries 159,600 31,636,620 5.6 Young Poong Precision 430,000 3,724,553 0.6 Metals & Mining (8.7%) POSCO 178,000 49,497,863 8.7 Multiline Retail (5.6%) Hyundai Department Store 136,400 18,196,064 3.2 Shinsegae Co 61,670 13,354,253 2.4 Oil & Gas & Consumable Fuels (9.5%) GS Hldgs 335,000 15,169,336 2.7 GS Hldgs Pref 21,000 570,154 0.1 SK Innovation 150,500 17,249,284 3.0 S-Oil Corp 262,300 15,179,370 2.7 S-Oil Corp Pref 120,169 5,514,825 1.0 Semiconductors & Semiconductor Equipment (9.8%) Samsung Electronics 20,750 26,179,952 4.6 Samsung Electronics GDR-
RegS 46,500 29,248,500 5.2 Tobacco (0.3%) KT & G 19,000 1,427,968 0.3 475,526,576 84.1 (II) Derivatives (0.1%) Futures (0.1%) KOSPI 200 (KFE) Fut 06/14 280 546,597 0.1
- 162 -

JJPMORGAN KOREA FUND SSemi--aannual report for the
pperiod ended 31 March 2014
IInvestment Portfolio (Continued) As at 31 March 2014 (Unaudited)
Holding
Fair value
US$
% of net
assets Total LListed/Quoted Investments 476,073,173 84.2 Other net assets 89,596,789 15.8 Net assets attributable to holders of
rredeemable units at 31 March 2014 565,669,962 100.0 Total investments, at cost 471,469,410
Statement of Movements in Portfolio Holdings For the period ended 31 March 2014 (Unaudited) % holdings
of net assets 31.3.2014 30.9.2013 Listed/Quoted Investments Equities Korea Commercial Banks 10.4 9.7 Semiconductors & Semiconductor
Equipment 9.8 9.4 Oil & Gas & Consumable Fuels 9.5 5.8 Metals & Mining 8.7 8.0 Capital Markets 7.7 6.1 Machinery 6.2 4.3 Multiline Retail 5.6 3.2 Chemicals 5.4 6.9 Automobiles 5.2 7.8 Insurance 2.8 1.3 Auto Components 2.7 1.3 Diversified Telecommunication Services 1.9 1.1 Internet Software & Services 1.5 - Food & Staples Retailing 1.3 2.8 Construction & Engineering 1.3 4.2 Diversified Financial Services 1.3 2.1 Household Products 1.1 1.3 Hotels Restaurants & Leisure 0.8 0.8 Gas Utilities 0.6 - Tobacco 0.3 2.1 Food Products - 2.5 Electric Utilities - 1.5 Diversified Consumer Services - 1.1 Personal Products - 1.0 Trading Companies & Distributors - 0.8 Electrical Equipment - 0.8 Office Electronics - 0.7 Construction Materials - 0.4 Electronic Equipment, Instruments &
Components - 0.3 Media - 0.2 Leisure Equipment & Products - 0.1 Derivatives Futures 0.1 - Total Listed/Quoted Investments 84.2 87.6 Other net aassets 15.8 12.4 Net assets attributable to holders of
rredeemable units 100.0 100.0
- 163 -
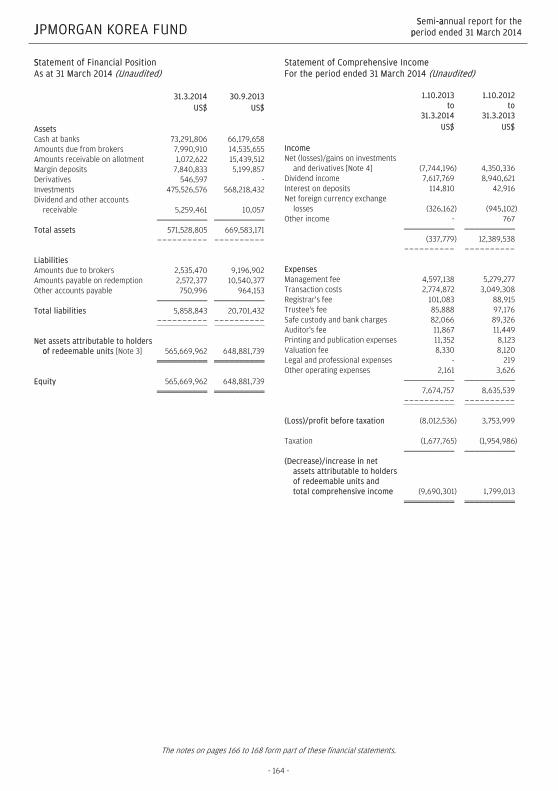
JJPMORGAN KOREA FUND SSemi--aannual report for the
pperiod ended 31 March 2014
SStatement of Financial Position As at 31 March 2014 (Unaudited) 31.3.2014 30.9.2013 US$ US$ Assets Cash at banks 73,291,806 66,179,658 Amounts due from brokers 7,990,910 14,535,655 Amounts receivable on allotment 1,072,622 15,439,512 Margin deposits 7,840,833 5,199,857 Derivatives 546,597 - Investments 475,526,576 568,218,432 Dividend and other accounts
receivable 5,259,461 10,057 Total assets 571,528,805 669,583,171 ---------- ---------- Liabilities Amounts due to brokers 2,535,470 9,196,902 Amounts payable on redemption 2,572,377 10,540,377 Other accounts payable 750,996 964,153 Total liabilities 5,858,843 20,701,432 ---------- ---------- Net assets attributable to holders
oof redeemable units [Note 3] 565,669,962 648,881,739 Equity 565,669,962 648,881,739
Statement of Comprehensive Income For the period ended 31 March 2014 (Unaudited) 1.10.2013
to 31.3.2014
1.10.2012 to
31.3.2013 US$ US$ Income Net (losses)/gains on investments
and derivatives [Note 4] (7,744,196) 4,350,336 Dividend income 7,617,769 8,940,621 Interest on deposits 114,810 42,916 Net foreign currency exchange
losses (326,162) (945,102) Other income - 767 (337,779) 12,389,538 ---------- ---------- Expenses Management fee 4,597,138 5,279,277 Transaction costs 2,774,872 3,049,308 Registrar's fee 101,083 88,915 Trustee's fee 85,888 97,176 Safe custody and bank charges 82,066 89,326 Auditor's fee 11,867 11,449 Printing and publication expenses 11,352 8,123 Valuation fee 8,330 8,120 Legal and professional expenses - 219 Other operating expenses 2,161 3,626 7,674,757 8,635,539 ---------- ---------- (Loss)/profit before taxation (8,012,536) 3,753,999 Taxation (1,677,765) (1,954,986) (Decrease)/increase iin net
assets attributable to holdersof redeemable units and total comprehensive income (9,690,301) 1,799,013
The notes on pages 166 to 168 form part of these financial statements.
- 164 -
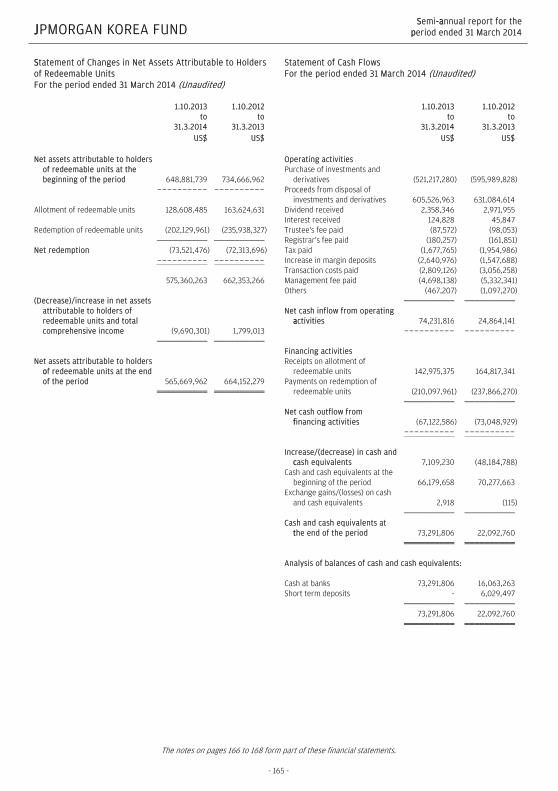
JJPMORGAN KOREA FUND SSemi--aannual report for the
pperiod ended 31 March 2014
SStatement of Changes in Net Assets Attributable to Holders of Redeemable Units For the period ended 31 March 2014 (Unaudited) 1.10.2013
to 31.3.2014
1.10.2012 to
31.3.2013 US$ US$ Net assets attributable to holders
of redeemable units at the beginning of the period 648,881,739 734,666,962
---------- ---------- Allotment of redeemable units 128,608,485 163,624,631 Redemption of redeemable units (202,129,961) (235,938,327) Net redemption (73,521,476) (72,313,696) ---------- ---------- 575,360,263 662,353,266 (Decrease)/increase in net assets
attributable to holders of redeemable units and total comprehensive income (9,690,301) 1,799,013
Net assets attributable to holders
oof redeemable units at the end of the period 565,669,962 664,152,279
Statement of Cash Flows For the period ended 31 March 2014 (Unaudited) 1.10.2013
to 31.3.2014
1.10.2012 to
31.3.2013 US$ US$ Operating activities Purchase of investments and
derivatives (521,217,280) (595,989,828) Proceeds from disposal of
investments and derivatives 605,526,963 631,084,614 Dividend received 2,358,346 2,971,955 Interest received 124,828 45,847 Trustee's fee paid (87,572) (98,053) Registrar's fee paid (180,257) (161,851) Tax paid (1,677,765) (1,954,986) Increase in margin deposits (2,640,976) (1,547,688) Transaction costs paid (2,809,126) (3,056,258) Management fee paid (4,698,138) (5,332,341) Others (467,207) (1,097,270) Net cash inflow from operating
aactivities 74,231,816 24,864,141 ---------- ---------- Financing activities Receipts on allotment of
redeemable units 142,975,375 164,817,341 Payments on redemption of
redeemable units (210,097,961) (237,866,270) Net cash outflow from
ffinancing activities (67,122,586) (73,048,929) ---------- ---------- Increase/(decrease) in cash and
ccash equivalents 7,109,230 (48,184,788) Cash and cash equivalents at the
beginning of the period 66,179,658 70,277,663 Exchange gains/(losses) on cash
and cash equivalents 2,918 (115) Cash and cash equivalents at
tthe end of the period 73,291,806 22,092,760 Analysis of balances of cash and cash equivalents: Cash at banks 73,291,806 16,063,263 Short term deposits - 6,029,497 73,291,806 22,092,760
The notes on pages 166 to 168 form part of these financial statements.
- 165 -

JJPMORGAN KOREA FUND SSemi--aannual rreport for the
pperiod ended 31 March 2014
NNotes to the Financial Statements
1 The Fund
JPMorgan Korea Fund (the "Fund") was established under a Trust Deed dated 11 December 1991, as amended, and is governed by the laws of Hong Kong. The Fund is authorized by the Securities and Futures Commission of Hong Kong.
The investment objective of the Fund is to provide investors with long-term capital appreciation through investment primarily in companies whose shares are listed on the Korea Stock Exchange or traded on the Korean over-the-counter market.
Pursuant to the Supplemental Trust Deed dated 4 January 2013, the Manager may decide to issue separate classes (each a "Class") whose assets will be commonly invested but where a specific fee structure, currency or distribution policy may be applied. Each Class may have a different charging structure with the result that the net asset value attributable to each Class may differ.
All unitholders' rights with regard to the convening, voting or otherwise acting at any meeting of unitholders are the same.
2 Summary of principal accounting policies
(a) Accounting policies of interim financial statements
The accounting policies and methods of computation used in the preparation of these unaudited condensed interim financial statements are consistent with those used in the annual financial statements for the year ended 30 September 2013.
(b) Investments and derivatives
Classification
The Fund classifies its investments and derivatives as financial assets or financial liabilities at fair value through profit or loss. These financial assets or financial liabilities are held-for-trading as they are acquired or incurred principally for the purpose of selling or repurchasing in the near term or short-term profit taking.
All derivatives are carried in assets when amounts are receivable by the Fund and in liabilities when amounts are payable by the Fund.
The Fund makes short sales in which a borrowed security is sold in anticipation of a decline in the market value of that security, or it may use short sales for various arbitrage transactions. Short sales are classified as financial liabilities at fair value through profit or loss.
Recognition, derecognition and measurement
Purchases and sales of investments and derivatives are accounted for on the trade date basis. Investments and derivatives are initially recognized at fair value and are subsequently re-measured at fair value. Realized and unrealized gains and losses on investments and derivatives are recognized in the Statement of Comprehensive Income. Investments and derivatives are derecognized when the rights to receive cash flows from the investments and derivatives have expired or the Fund has transferred substantially all risks and rewards of ownership.
Fair value estimation
Fair value is the price that would be received to sell an asset or paid to transfer a liability in an orderly transaction between market participants at the measurement date. The fair value of financial assets and liabilities traded in active markets are based on last traded prices. Prior to 1 October 2012, investments that are listed or traded on an exchange and investments with prices quoted in over-the-counter markets or by market makers, are fair valued based on quoted "bid" prices on long investments and quoted "ask" prices on investments sold short. The Fund early adopted Hong Kong Financial Reporting Standard 13, "Fair Value Measurement", with effect from 1 October 2012, it changed its fair valuation input to utilize the last traded market price for both financial assets and financial liabilities where the last traded price falls within the bid-ask spread. When trading in the securities of an investee company is suspended, the investment is valued at the Manager's estimate of its fair value.
Debt securities are fair valued based on quoted prices inclusive of accrued interest.
Investments in collective investment schemes are stated at fair value based on the net asset value per unit of the respective funds as determined by the administrators of the relevant funds or stated at last traded prices if the collective investment schemes are listed or traded on an exchange.
Open future and swap contracts are valued at last traded prices for both long and short positions at the valuation date. The differences between the last traded prices and the contract prices are recognized in the Statement of Comprehensive Income.
Open option contracts are valued at last traded prices for both long and short positions at the valuation date. The differences between the last traded prices and the premium amounts/contract prices are recognized in the Statement of Comprehensive Income.
- 166 -

JJPMORGAN KOREA FUND SSemi--aannual rreport for the
pperiod ended 31 March 2014
Forward foreign exchange contracts are valued at the forward rates ruling at the valuation date. The differences between the forward rates and the contract rates are recognized in the Statement of Comprehensive Income.
((c) Securities lending and borrowing
Securities lenders' agreements are entered into with institutions of appropriate financial standing who engage in such arrangements acceptable to the Trustee and on arm's length commercial terms. Securities lent are included in the investment portfolio of the Fund. Relevant securities lending income entitled by the Fund is accounted for in the Statement of Comprehensive Income. Collateral received for the purpose of securities lent generally consist of non-cash collateral which are off-balance sheet transactions and are therefore not included in the financial statements.
The Fund may enter into securities borrowing arrangements for short sale purposes. Short positions represent obligations to deliver securities sold but not yet purchased, and are accounted for as investments and valued at their fair value. Securities borrowed during the period/year are off-balance sheet transactions and are therefore not included in the investment portfolio of the Fund. Collateral placed for the purpose of securities borrowed generally consist of cash collateral and are included in the Statement of Financial Position separately.
(d) Foreign currency translation
Functional and presentation currency
The Fund has adopted United States dollar as its functional and presentation currency.
Transactions and balances
Foreign currency transactions are translated into the functional currency using the exchange rates prevailing at the dates of the transactions.
Foreign exchange gains and losses resulting from the settlement of such transactions and from the translation of assets and liabilities denominated in foreign currencies at period/year end exchange rates are recognized in the Statement of Comprehensive Income.
Foreign exchange gains and losses relating to cash and cash equivalents are presented in the Statement of Comprehensive Income within "Net foreign currency exchange gains/losses". Foreign exchange gains and losses relating to the financial assets and liabilities carried at fair value through profit or loss are presented in the Statement of Comprehensive Income within "Net gains/losses on investments and derivatives".
(e) Proceeds and payments on allotment and redemption of units
The net asset value per unit is computed for each dealing day. The price at which units are allotted or redeemed is calculated by reference to the net asset value per unit as at the close of business on the relevant dealing day in accordance with the provisions of the Fund's Trust Deed dated 11 December 1991, as amended, which may be different from the accounting policies stated in the financial statements.
3 Number of units in issue and net assets attributable to holders of redeemable units (per unit)
31.3.2014
USD Class (acc) Units Number of units in issue: 11,330,493.741 US$ Net assets attributable to
holders of redeemable units 565,669,962
Net assets attributable to
holders of redeemable units (per unit) 49.92
- 167 -

JJPMORGAN KOREA FUND SSemi--aannual rreport for the
pperiod ended 31 March 2014
30.9.2013
USD Class (acc) Units Number of units in issue: 12,802,461.795 US$ Net assets attributable to
holders of redeemable units 648,881,739
Net assets attributable to
holders of redeemable units (per unit) 50.68
44 Net (losses)/gains on investments and derivatives
1.10.2013
to 31.3.2014
1.10.2012 to
31.3.2013 US$ US$ Change in unrealized gains/losses in value of investments and derivatives (34,856,172) (10,339,665) Realized gains on sale of investments and derivatives 27,111,976 14,690,001 (7,744,196) 4,350,336
5 Soft commission arrangements
The Investment Manager has entered into soft commission arrangements with brokers under which certain goods and services used to support investment decision making are received by the Investment Manager. The Investment Manager does not make direct payment for these services but transacts an agreed amount of business with the brokers on behalf of the Fund. Commission is paid from the Fund on these transactions.
The goods and services must be of demonstrable benefit to the Fund and may include research and advisory services; economic and political analysis; portfolio analysis, including valuation and performance measurement; market analysis, data and quotation services, computer hardware and software incidental to the above goods and services; clearing and custodian services and investment-related publications.
6 Distribution
No distribution was made during the period (31 March 2013: nil).
- 168 -

JJPMORGAN MALAYSIA FUND SSemi--aannual report for the
pperiod ended 31 March 2014
DDistributor Status The Fund has been certified by HMRC in the UK as a distributing fund in respect of the period from 12 December 1989 to 30 September 2010. The principal effect of this certification is that for unitholders resident or ordinarily resident in the UK for taxation purposes any gains accruing on the sale, redemption or other disposal of units during the period will be taxed in the UK as a capital gain and not as income. This treatment will continue under the new UK reporting fund regime provided the Fund does not invest more than 5% of its assets in other offshore funds which are not themselves reporting funds. There will be no need to formally apply for reporting fund status as the Fund is transparent for UK tax purposes and therefore considered out of scope of the requirements of this new regime. These are now known as “special category transparent offshore funds”. As noted, the Fund is transparent for UK income tax purposes and UK investors are subject to UK capital gains tax on disposal of their units. UK investors are subject to tax on their share of income of the Fund on an arising basis. Information has been provided to UK investors of the amount of their share of the underlying income, expenses and overseas tax suffered.
Investment Portfolio As at 31 March 2014 (Unaudited)
Holding
Fair value
US$
% of net
assets Listed/Quoted Investments (98.5%) Equities (98.5%) Malaysia (97.9%) Chemicals (3.9%) Petronas Chemicals 2,733,400 5,784,043 3.9 Construction (10.7%) Gamuda Bhd 2,795,700 4,032,383 2.7 Matrix Concepts Hldgs 1,990,000 2,315,725 1.6 Muhibbah Engineering (CDS) 1,036,800 917,578 0.6 SapuraKencana Petroleum 6,213,263 8,562,145 5.8 Consumer Products (5.3%) Axiata Group 2,605,600 5,322,111 3.6 PPB Group 232,000 1,180,781 0.8 Prestariang Bhd 654,000 751,034 0.5 UMW Hldgs 165,000 554,800 0.4 Finance (27.2%) Alliance Financial Group 1,179,000 1,592,219 1.1 AMMB Hldgs 1,148,500 2,525,258 1.7 CIMB Group Hldgs 4,575,208 10,017,681 6.8 Insas Bhd (CDS) 2,200,000 842,138 0.6 Malayan Banking 4,831,953 14,323,473 9.7 Public Bank (L) 1,499,373 8,797,424 5.9 RHB Capital 841,550 2,169,913 1.4
(Continued)
Holding
Fair value
US$
% of net
assets Industrial Products (10.3%) Karex Bhd 1,454,400 1,420,774 0.9 Maxis Bhd 1,592,800 3,394,852 2.3 Petronas Gas 768,600 5,601,801 3.8 Salcon Bhd 4,419,600 1,008,299 0.7 UMW Oil & Gas
(IPO-Cornerstone) 3,050,000 3,801,409 2.6 Plantations (3.6%) Genting Plantations (CDS) 412,900 1,365,586 0.9 IOI Corp (CDS) 729,400 1,072,154 0.8 Kuala Lumpur Kepong 380,000 2,816,108 1.9 Property (1.8%) Eastern & Oriental (CDS) 1,655,300 1,074,640 0.7 IJM Plantations (CDS) 616,000 631,940 0.4 Tropicana Corp 337,000 162,024 0.1 UEM Sunrise 1,248,200 840,925 0.6 Technology (0.3%) Datasonic Group 330,000 451,723 0.3 Trading Services (34.8%) Dialog Group 2,682,160 2,948,692 2.0 Digi.com Bhd 4,963,900 8,193,361 5.5 Genting Bhd 2,303,100 7,052,825 4.8 Genting Malaysia 3,260,800 4,193,955 2.8 Malaysia Airports Hldgs 1,158,149 2,837,297 1.9 Sime Darby 3,005,767 8,569,496 5.8 Telekom Malaysia 1,097,900 1,980,288 1.3 Tenaga Nasional 3,634,000 13,309,642 9.0 Yinson Hldgs Bhd 900,000 2,436,380 1.7 Singapore (0.6%) Real Estate (0.6%) CapitaMalls Asia 576,000 819,880 0.6 Total LListed/Quoted Investments 145,672,757 98.5 Other net assets 2,199,215 1.5 Net assets attributable to holders of
rredeemable units at 31 March 2014 147,871,972 100.0 Total investments, at cost 110,444,332
- 169 -

JJPMORGAN MALAYSIA FUND SSemi--aannual report for the
pperiod ended 31 March 2014
SStatement of Movements in Portfolio Holdings For the period ended 31 March 2014 (Unaudited) % holdings
of net assets 31.3.2014 30.9.2013 Listed/Quoted Investments Equities and Warrants Malaysia Trading Services 34.8 29.7 Finance 27.2 27.8 Construction 10.7 11.9 Industrial Products 10.3 5.5 Consumer Products 5.3 6.7 Chemicals 3.9 4.3 Plantations 3.6 1.7 Property 1.8 2.4 Technology 0.3 - Philippines Food, Beverages & Tobacco - 0.5 Singapore Real Estate 0.6 0.9 Food & Beverages - 1.4 Foreign Bonds - 1.1 Retailing - 1.0 Total Listed/Quoted Investments 98.5 94.9 Other net assets 1.5 5.1 Net assets attributable to holders of
rredeemable units 100.0 100.0
- 170 -

JJPMORGAN MALAYSIA FUND SSemi--aannual report for the
pperiod ended 31 March 2014
SStatement of Financial Position As at 31 March 2014 (Unaudited) 31.3.2014 30.9.2013 US$ US$ Assets Cash at banks 76,124 7,996,410 Amounts due from brokers 3,980,042 486,142 Amounts receivable on allotment 357,774 826,830 Investments 145,672,757 162,389,300 Dividend and other accounts
receivable 224,465 774,614 Total assets 150,311,162 172,473,296 ---------- ---------- Liabilities Short term bank loans - unsecured 670,421 - Amounts due to brokers 330,149 - Amounts payable on redemption 1,237,594 1,094,400 Other accounts payable 201,026 294,430 Liabilities (excluding net assets
attributable to holders of redeemable units) 2,439,190 1,388,830
---------- ---------- Net assets attributable to holders
oof redeemable units classified as financial liability/equity [Note 3] 147,871,972 171,084,466
Statement of Comprehensive Income For the period ended 31 March 2014 (Unaudited) 1.10.2013
to 31.3.2014
1.10.2012 to
31.3.2013 US$ US$ Income Net gains on investments and
derivatives [Note 4] 11,067,914 8,246,599 Dividend income 2,044,287 1,639,541 Interest on deposits 3,105 1,794 Net foreign currency exchange
losses (10,385) (152,679) Other income 114 74 13,105,035 9,735,329 ---------- ---------- Expenses Management fee 1,195,143 1,232,824 Transaction costs 188,449 274,165 Registrar's fee 44,500 43,282 Trustee's fee 29,637 29,724 Safe custody and bank charges 28,908 26,314 Valuation fee 8,330 7,980 Auditor's fee 6,732 6,639 Printing and publication expenses 2,826 1,281 Legal and professional expenses 378 230 Other operating expenses 2,128 2,769 1,507,031 1,625,208 ---------- ---------- Net operating profit 11,598,004 8,110,121 Finance costs Interest paid (624) (644) Profit before taxation 11,597,380 8,109,477 Taxation (102,984) (16,203) Increase in net assets
attributable to holders of redeemable units and total ccomprehensive income 11,494,396 8,093,274
The notes on pages 173 to 175 form part of these financial statements.
- 171 -

JJPMORGAN MALAYSIA FUND SSemi--aannual report for the
pperiod ended 31 March 2014
SStatement of Changes in Net Assets Attributable to Holders of Redeemable Units For the period ended 31 March 2014 (Unaudited) 1.10.2013
to 31.3.2014
1.10.2012 to
31.3.2013 US$ US$ Net assets attributable to holders
of redeemable units at the beginning of the period 171,084,466 175,393,069
---------- ---------- Allotment of redeemable units 44,523,855 50,461,915 Redemption of redeemable units (79,230,745) (56,822,312) Net redemption (34,706,890) (6,360,397) ---------- ---------- 136,377,576 169,032,672 Increase in net assets
attributable to holders of redeemable units and total comprehensive income 11,494,396 8,093,274
Net assets attributable to holders
oof redeemable units at the end of the period 147,871,972 177,125,946
Statement of Cash Flows For the period ended 31 March 2014 (Unaudited) 1.10.2013
to 31.3.2014
1.10.2012 to
31.3.2013 US$ US$ Operating activities Purchase of investments and
derivatives (20,525,909) (46,188,926) Proceeds from disposal of
investments and derivatives 45,142,068 60,085,734 Dividend received 2,594,415 2,220,598 Interest received 3,125 1,492 Trustee's fee paid (30,004) (29,950) Registrar's fee paid (89,984) (78,665) Tax paid (102,984) (16,203) Transaction costs paid (185,946) (277,905) Management fee paid (1,231,348) (1,243,451) Others (68,891) (199,371) Net cash inflow from operating
aactivities 25,504,542 14,273,353 ---------- ---------- Financing activities Interest paid (609) (644) Receipts on allotment of
redeemable units 44,992,911 49,699,316 Payments on redemption of
redeemable units (79,087,551) (55,505,165) Net cash outflow from
ffinancing activities (34,095,249) (5,806,493) ---------- ---------- (Decrease)/increase in cash
aand cash equivalents (8,590,707) 8,466,860 Cash and cash equivalents at the
beginning of the period 7,996,410 2,516,583 Exchange losses on cash and cash
equivalents - (12,458) Cash and cash eequivalents at
the end of the period (594,297) 10,970,985 Analysis of balances of cash and cash equivalents: Cash at banks 76,124 969,985 Short term deposits - 10,001,000 Short term bank loans -
unsecured (670,421) - (594,297) 10,970,985
The notes on pages 173 to 175 form part of these financial statements.
- 172 -

JJPMORRGAN MALAYSIA FUND SSemi--aannual report for the
pperiod ended 31 March 2014
NNotes to the Financial Statements
1 The Fund
JPMorgan Malaysia Fund (the "Fund") was established under a Trust Deed dated 12 December 1989, as amended, and is governed by the laws of Hong Kong. The Fund is authorized by the Securities and Futures Commission of Hong Kong.
The investment objective of the Fund is to provide long-term capital growth by investing primarily in securities linked to the Malaysian economy. These include, but are not restricted to, securities listed on the Kuala Lumpur Stock Exchange.
Pursuant to the Supplemental Trust Deed dated 4 January 2013, the Manager may decide to issue separate classes (each a “Class”) whose assets will be commonly invested but where a specific fee structure, currency or distribution policy may be applied. Each Class may have a different charging structure with the result that the net asset value attributable to each Class may differ.
All unitholders' rights with regard to the convening, voting or otherwise acting at any meeting of unitholders are the same.
2 Summary of principal accounting policies
(a) Accounting policies of interim financial statements
The accounting policies and methods of computation used in the preparation of these unaudited condensed interim financial statements are consistent with those used in the annual financial statements for the year ended 30 September 2013.
(b) Investments and derivatives
Classification
The Fund classifies its investments and derivatives as financial assets or financial liabilities at fair value through profit or loss. These financial assets or financial liabilities are held-for-trading as they are acquired or incurred principally for the purpose of selling or repurchasing in the near term or short-term profit taking.
All derivatives are carried in assets when amounts are receivable by the Fund and in liabilities when amounts are payable by the Fund.
The Fund makes short sales in which a borrowed security is sold in anticipation of a decline in the market value of that security, or it may use short sales for various arbitrage transactions. Short sales are classified as financial liabilities at fair value through profit or loss.
Recognition, derecognition and measurement
Purchases and sales of investments and derivatives are accounted for on the trade date basis. Investments and derivatives are initially recognized at fair value and are subsequently re-measured at fair value. Realized and unrealized gains and losses on investments and derivatives are recognized in the Statement of Comprehensive Income. Investments and derivatives are derecognized when the rights to receive cash flows from the investments and derivatives have expired or the Fund has transferred substantially all risks and rewards of ownership.
Fair value estimation
Fair value is the price that would be received to sell an asset or paid to transfer a liability in an orderly transaction between market participants at the measurement date. The fair value of financial assets and liabilities traded in active markets are based on last traded prices. Prior to 1 October 2012, investments that are listed or traded on an exchange and investments with prices quoted in over-the-counter markets or by market makers, are fair valued based on quoted "bid" prices on long investments and quoted "ask" prices on investments sold short. The Fund early adopted Hong Kong Financial Reporting Standard 13, “Fair Value Measurement”, with effect from 1 October 2012, it changed its fair valuation input to utilize the last traded market price for both financial assets and financial liabilities where the last traded price falls within the bid-ask spread. When trading in the securities of an investee company is suspended, the investment is valued at the Manager's estimate of its fair value.
Debt securities are fair valued based on quoted prices inclusive of accrued interest.
Investments in collective investment schemes are stated at fair value based on the net asset value per unit of the respective funds as determined by the administrators of the relevant funds or stated at last traded prices if the collective investment schemes are listed or traded on an exchange.
Open future and swap contracts are valued at last traded prices for both long and short positions at the valuation date. The differences between the last traded prices and the contract prices are recognized in the Statement of Comprehensive Income.
Open option contracts are valued at last traded prices for both long and short positions at the valuation date. The differences between the last traded prices and the premium amounts/contract prices are recognized in the Statement of Comprehensive Income.
- 173 -

JJPMORRGAN MALAYSIA FUND SSemi--aannual report for the
pperiod ended 31 March 2014
Forward foreign exchange contracts are valued at the forward rates ruling at the valuation date. The differences between the forward rates and the contract rates are recognized in the Statement of Comprehensive Income.
((c) Securities borrowing
The Fund may enter into securities borrowing arrangements for short sale purposes. Short positions represent obligations to deliver securities sold but not yet purchased, and are accounted for as investments and valued at their fair value. Securities borrowed during the period/year are off-balance sheet transactions and are therefore not included in the investment portfolio of the Fund. Collateral placed for the purpose of securities borrowed generally consist of cash collateral and are included in the Statement of Financial Position separately.
(d) Foreign currency translation
Functional and presentation currency
The Fund has adopted United States dollar as its functional and presentation currency.
Transactions and balances
Foreign currency transactions are translated into the functional currency using the exchange rates prevailing at the dates of the transactions.
Foreign exchange gains and losses resulting from the settlement of such transactions and from the translation of assets and liabilities denominated in foreign currencies at period/year end exchange rates are recognized in the Statement of Comprehensive Income.
Foreign exchange gains and losses relating to cash and cash equivalents are presented in the Statement of Comprehensive Income within "Net foreign currency exchange gains/losses". Foreign exchange gains and losses relating to the financial assets and liabilities carried at fair value through profit or loss are presented in the Statement of Comprehensive Income within "Net gains/losses on investments and derivatives".
(e) Proceeds and payments on allotment and redemption of units
The net asset value per unit is computed for each dealing day. The price at which units are allotted or redeemed is calculated by reference to the net asset value per unit as at the close of business on the relevant dealing day in accordance with the provisions of the Fund's Trust Deed dated 12 December 1989, as amended, which may be different from the accounting policies stated in the financial statements.
Units of the Fund are redeemable at the option of the holders of redeemable units and are classified as a financial liability in the Statement of Financial Position which represents the net assets attributable to holders of redeemable units (or "net asset value" or "net assets" or "NAV") and is carried at the redemption amount that would be payable at the Statement of Financial Position date if the holders of redeemable units exercised the right to redeem units of the Fund.
3 Number of units in issue and net assets attributable to holders of redeemable units (per unit)
Fair value adjustment of units of the Fund
As at 31 March 2014, there were two classes in the Fund. The net assets attributable to the holders of the redeemable units was classified as a financial liability which carried at the redemption amount that would be payable at the Statement of Financial Position date, if the holders of redeemable units exercised the right to redeem units of the Fund. The redemption amount is determined based on the net assets attributable to holders of redeemable units calculated in accordance with the provisions of the Fund's Trust Deed dated 12 December 1989, as amended ("Trust Deed NAV").
As at 30 September 2013, there was only one class in the Fund. The net assets attributable to the holders of redeemable units (or “net asset value” or “net assets” or “NAV”) was classified as equity and not adjusted for fair value adjustment of units of the Fund.
- 174 -

JJPMORRGAN MALAYSIA FUND SSemi--aannual report for the
pperiod ended 31 March 2014
Number of units in issue
31.3.2014
USD Class (acc) USD C Class (acc) Units Units Number of units in issue: 2,011,566.604 1,470,921.000 US$ US$ Net assets attributable to
holders of redeemable units 132,768,645 15,103,327
Net assets attributable to
holders of redeemable units (per unit) 66.00 10.27
30.9.2013
USD Class (acc) Units Number of units in issue: 2,778,109.873 US$ Net assets attributable to
holders of redeemable units 171,084,466
Net assets attributable to
holders of redeemable units (per unit) 61.58
44 Net gains on investments and derivatives
1.10.2013
to 31.3.2014
1.10.2012 to
31.3.2013 US$ US$ Change in unrealized gains/losses in value of investments and derivatives 4,197,485 (4,503,938) Realized gains on sale of investments and derivatives 6,870,429 12,750,537 11,067,914 8,246,599
5 Soft commission arrangements
The Investment Manager has entered into soft commission arrangements with brokers under which certain goods and services used to support investment decision making are received by the Investment Manager. The Investment Manager does not make direct payment for these services but transacts an agreed amount of business with the brokers on behalf of the Fund. Commission is paid from the Fund on these transactions.
The goods and services must be of demonstrable benefit to the Fund and may include research and advisory services; economic and political analysis; portfolio analysis, including valuation and performance measurement; market analysis, data and quotation services, computer hardware and software incidental to the above goods and services; clearing and custodian services and investment-related publications.
6 Distribution
No distribution was made during the period (31 March 2013: nil).
- 175 -

JJPMORGAN MONEY FUND SSemi--aannual report for the
pperiod ended 31 March 2014
IInvestment Portfolio As at 31 March 2014 (Unaudited)
Holding
HK$ portfolio
fair value
HK$
% of net
assets Listed/Quoted Investments (61.1%) (I) Debt Securities (26.4%) Australia (1.7%) ANZ Banking Grp
3.275% 10/11/14 HKD12,000,000 12,326,962 1.1Commonwealth Bk
Aust 5.09% 27/06/14 HKD6,000,000 6,062,232 0.6
Hong Kong (12.4%) HK Airport Auth
2.2% 09/04/14-RegS HKD31,000,000 31,165,078 2.8
ICBC Asia FRN 16/04/14 HKD40,000,000 40,071,824 3.7
Kowloon-Canton Rail 2.65% 28/04/14 HKD24,000,000 24,309,603 2.2
Urban Renewal Auth 1.45% 05/05/14 HKD40,000,000 40,120,183 3.7
Korea (9.7%) Export-Imp Bk Kor
1.75% 06/14-RegS HKD16,000,000 16,038,137 1.5Export-Imp Bk Kor
1.76% 02/07/14 HKD10,000,000 10,157,767 0.9Export-Imp Bk Kor
1.76% 8/7/14-RegS HKD10,000,000 10,156,683 0.9
Export-Imp Bk Kor 1.93% 03/06/14 HKD4,000,000 4,072,082 0.4
Kookmin Bank 1.96% 01/06/14 HKD15,000,000 15,057,116 1.4
Korea Dev Bank 2.37% 03/11/14 HKD10,000,000 10,188,658 0.9
Korea Gas 1.65% 27/06/14 HKD8,000,000 8,119,462 0.7
Korea Water Res 4.45% 11/08/14 HKD31,000,000 32,301,158 3.0
Netherlands (1.9%) Rabobank Nederland
3% 02/09/14 HKD21,000,000 21,251,632 1.9 Singapore (0.7%) SP PowerAssets
3.3% 09/04/14 HKD8,000,000 8,062,693 0.7 289,461,270 26.4 --------- ---- (II) Money Market (34.7%) Australia (2.7%)Bank Commun Syd
ECD 0% 23/05/14-HKD HKD30,000,000 29,968,062 2.7
(Continued)
HHolding
HK$pportfolio
fairvvalue HHK$
% of net
aassets China (10.1%) Agricultural Bk China
HK CD0.8% 03/04/14 HKD20,000,000 20,158,955 1.8
Agricultural Bk China HK CD0.8% 07/04/14 HKD10,000,000 10,079,036 0.9
Bank of China HK CD FRN 11/14-RegS HKD40,000,000 40,037,883 3.7
China Dev Bank HK CD FRN 05/12/14 HKD40,000,000 40,030,962 3.7
Hong Kong (14.6%) Bank of East Asia CD
0% 07/04/14 HKD33,000,000 32,996,748 3.0 China CITIC Bank
2.82% 28/04/14 HKD7,000,000 7,193,093 0.7 China CITIC Bank CD
FRN 24/04/14 HKD15,000,000 15,027,978 1.4 Dah Sing Bank CD
1.21% 17/02/15 HKD20,000,000 20,019,688 1.8 DBS Bank (HK) CD
1.94% 11/07/14 HKD10,000,000 10,169,665 0.9 DBS Bank (HK) CD
1.95% 11/07/14 HKD28,500,000 28,982,771 2.7 Fubon Bank HK CD
1% 02/05/14 HKD20,000,000 20,084,698 1.8 Wing Hang Bank CD
FRN 24/04/14 HKD25,000,000 25,039,905 2.3 Malaysia (3.7%) Malayan Banking HK
CD 1% 16/04/14 HKD10,000,000 10,020,442 0.9 Malayan Banking HK
CD FRN 06/06/14 HKD30,000,000 30,020,820 2.8 Netherlands (3.6%) ING Bank ECP 0%
13/06/14-HKD HKD40,000,000 39,976,821 3.6 379,807,527 34.7 --------- ---- Total LListed/Quoted Investments 669,268,797 61.1 Other net assets 426,064,674 38.9 Net assets attributable to holders of
rredeemable units at 31 March 2014 1,095,333,471 100.0 Total investments, at cost 668,748,361
- 176 -

JJPMORGAN MONEY FUND SSemi--aannual report for the
pperiod ended 31 March 2014
SStatement of Movements in Portfolio Holdings For the period ended 31 March 2014 (Unaudited) HK$
portfolio % holdings
of net assets 31.3.2014 30.9.2013 Listed/Quoted Investments Debt Securities Hong Kong 12.4 8.2 Korea 9.7 - Netherlands 1.9 - Australia 1.7 0.6 Singapore 0.7 0.8 Canada - 0.5 France - 0.4 Money Market Hong Kong 14.6 25.3 China 10.1 11.6 Malaysia 3.7 3.9 Netherlands 3.6 3.9 Australia 2.7 3.9 Korea - 3.9 Total Listed/Quoted Investments 61.1 63.0 Other net assets 38.9 37.0 Net assets attributable to holders of
rredeemable units 100.0 100.0
- 177 -

JJPMORGAN MONEY FUND SSemi--aannual report for the
pperiod ended 31 March 2014
SStatement of Financial Position As at 31 March 2014 (Unaudited) HK$
portfolio 31.3.2014 30.9.2013 HK$ HK$ Assets Cash at banks 91,869,491 103,898,037 Short term deposits 351,464,040 281,103,046 Amounts receivable on allotment 268,945 461,030 Investments 669,268,797 646,455,669 Interest and other accounts
receivable 26,477 15,417 Total assets 1,112,897,750 1,031,933,199 ---------- ---------- Liabilities Amounts due to brokers 16,038,137 4,019,635 Amounts payable on redemption 968,159 623,060 Other accounts payable 557,983 540,472 Total liabilities 17,564,279 5,183,167 ---------- ---------- Net assets attributable to holders
oof redeemable units [Note 3] 1,095,333,471 1,026,750,032 Equity 1,095,333,471 1,026,750,032
Statement of Comprehensive Income For the period ended 31 March 2014 (Unaudited) HK$
portfolio 1.10.2013
to 31.3.2014
1.10.2012 to
31.3.2013 HK$ HK$ Income Net gains on investments [Note 4] 2,377,545 2,710,023 Interest on deposits 401,381 179,842 Net foreign currency exchange
gains 49 462 2,778,975 2,890,327 ---------- ---------- Expenses Management fee 1,279,266 1,273,722 Registrar's fee 383,780 382,117 Trustee's fee 92,107 91,708 Auditor's fee 54,137 52,571 Safe custody and bank charges 51,984 47,430 Printing and publication expenses 11,096 4,899 Transaction costs 3,960 3,178 Legal and professional expenses 2,293 66 Other operating expenses 6,189 6,879 1,884,812 1,862,570 ---------- ---------- Increase in net assets
attributable to holders of redeemable units and total ccomprehensive income 894,163 1,027,757
The notes on pages 180 to 181 form part of these financial statements.
- 178 -

JJPMORGAN MONEY FUND SSemi--aannual report for the
pperiod ended 31 March 2014
SStatement of Changes in Net Assets Attributable to Holders of Redeemable Units For the period ended 31 March 2014 (Unaudited) HK$
portfolio 1.10.2013
to 31.3.2014
1.10.2012 to
31.3.2013 HK$ HK$ Net assets attributable to holders
of redeemable units at the beginning of the period 1,026,750,032 1,073,681,125
---------- ---------- Allotment of redeemable units 309,615,494 208,342,253 Redemption of redeemable units (241,926,218) (265,755,061) Net allotment/(redemption) 67,689,276 (57,412,808) ---------- ---------- 1,094,439,308 1,016,268,317 Increase in net assets
attributable to holders of redeemable units and total comprehensive income 894,163 1,027,757
Net assets attributable to holders
oof redeemable units at the end of the period 1,095,333,471 1,017,296,074
Statement of Cash Flows For the period ended 31 March 2014 (Unaudited) HK$
portfolio 1.10.2013
to 31.3.2014
1.10.2012 to
31.3.2013 HK$ HK$ Operating activities Purchase of investments (632,870,672) (887,447,733) Proceeds from disposal of
investments 624,453,590 862,499,972 Interest received 404,060 179,543 Transaction costs paid (3,610) (3,721) Trustee's fee paid (90,962) (92,977) Registrar's fee paid (387,955) (413,493) Management fee paid (1,263,352) (1,291,343) Others (135,117) (168,722) Net cash outflow from
ooperating activities (9,894,018) (26,738,474) ---------- ---------- Financing activities Receipts on allotment of
redeemable units 309,807,579 203,553,098 Payments on redemption of
redeemable units (241,581,119) (267,215,370) Net cash inflow/(outflow) from
ffinancing activities 68,226,460 (63,662,272) ---------- ---------- Increase/(decrease) in cash and
ccash equivalents 58,332,442 (90,400,746) Cash and cash equivalents at the
beginning of the period 385,001,083 381,258,933 Exchange gains on cash and cash
equivalents 6 72 Cash and ccash equivalents at
the end of the period 443,333,531 290,858,259 Analysis of balances of cash and cash equivalents: Cash at banks 91,869,491 10,830,302 Short term deposits 351,464,040 280,027,957 443,333,531 290,858,259
The notes on pages 180 to 181 form part of these financial statements.
- 179 -

JJPMORGAN MONEY FUND SSemi--aannual report for the
pperiod ended 31 March 2014
NNotes to the Financial Statements
1 The Fund
JPMorgan Money Fund (the "Fund") was established under a Trust Deed dated 13 June 1983, as amended, and is governed by the laws of Hong Kong. The Fund is authorized by the Securities and Futures Commission of Hong Kong.The Fund currently comprising the HK$ portfolio (‘Portfolio”).
The investment objective of the Portfolio is to provide an efficient vehicle for holding liquid assets currently denominated in the currency of Hong Kong.
All unitholders' rights with regard to the convening, voting or otherwise acting at any meeting of unitholders are the same.
2 Summary of principal accounting policies
(a) Accounting policies of interim financial statements
The accounting policies and methods of computation used in the preparation of these unaudited condensed interim financial statements are consistent with those used in the annual financial statements for the year ended 30 September 2013.
(b) Investments
Classification
The Fund classifies its investments as financial assets or financial liabilities at fair value through profit or loss. These financial assets or financial liabilities are held-for-trading as they are acquired or incurred principally for the purpose of selling or repurchasing in the near term or short-term profit taking.
Recognition, derecognition and measurement
Purchases and sales of investments are accounted for on the trade date basis. Investments are initially recognized at fair value and are subsequently re-measured at fair value. Realized and unrealized gains and losses on investments are recognized in the Statement of Comprehensive Income. Investments are derecognized when the rights to receive cash flows from the investments have expired or the Fund has transferred substantially all risks and rewards of ownership.
Fair value estimation
Fair value is the price that would be received to sell an asset or paid to transfer a liability in an orderly transaction between market participants at the measurement date. The fair value of financial assets and liabilities traded in active markets are based on last traded prices. Prior to 1 October 2012, investments that are listed or traded on an exchange and investments with prices quoted in over-the-counter markets or by market makers, are fair valued based on quoted "bid" prices on long investments and quoted "ask" prices on investments sold short. The Fund early adopted Hong Kong Financial Reporting Standard 13, "Fair Value Measurement", with effect from 1 October 2012, it changed its fair valuation input to utilize the last traded market price for both financial assets and financial liabilities where the last traded price falls within the bid-ask spread. When trading in the securities of an investee company is suspended, the investment is valued at the Manager's estimate of its fair value.
Debt securities are fair valued based on quoted prices inclusive of accrued interest.
(c) Foreign currency translation
Functional and presentation currency
The Fund has adopted Hong Kong dollar as its functional and presentation currency.
Transactions and balances
Foreign currency transactions are translated into the functional currency using the exchange rates prevailing at the dates of the transactions.
Foreign exchange gains and losses resulting from the settlement of such transactions and from the translation of assets and liabilities denominated in foreign currencies at period/year end exchange rates are recognized in the Statement of Comprehensive Income.
Foreign exchange gains and losses relating to cash and cash equivalents are presented in the Statement of Comprehensive Income within "Net foreign currency exchange gains/losses". Foreign exchange gains and losses relating to the financial assets and liabilities carried at fair value through profit or loss are presented in the Statement of Comprehensive Income within "Net gains/losses on investments ".
- 180 -

JJPMORGAN MONEY FUND SSemi--aannual report for the
pperiod ended 31 March 2014
((d) Proceeds and payments on allotment and redemption of units
The net asset value per unit is computed for each dealing day. The price at which units are allotted or redeemed is calculated by reference to the net asset value per unit as at the close of business on the relevant dealing day in accordance with the provisions of the Fund's Trust Deed dated 13 June 1983, as amended, which may be different from the accounting policies stated in the financial statements.
3 Number of units in issue and net assets attributable to holders of redeemable units (per unit)
31.3.2014 30.9.2013 Units Units Number of units in issue 6,832,077.788 6,409,873.303 HK$ HK$ Net assets attributable to holders of redeemable units 1,095,333,471 1,026,750,032 Net assets attributable to holders of redeemable units (per unit) 160.32 160.18
4 Net gains on investments
1.10.2013
to 31.3.2014
1.10.2012 to
31.3.2013 HK$ HK$ Change in unrealized gains/losses in value of investments (212,104) (778,673) Realized gains on sale of investments 2,589,649 3,488,696 2,377,545 2,710,023
5 Soft commission arrangements
During the period, the Investment Manager and its associates did not enter into any soft commission arrangements in connection with directing transactions of the Fund through a broker or dealer (31 March 2013: nil).
6 Distribution
No distribution was made during the period (31 March 2013: nil).
- 181 -

JJPMORGAN MULTI INCOME FUND SSemi--aannual report for the
pperiod ended 31 March 2014
IInvestment Portfolio As at 31 March 2014 (Unaudited)
Holding
Fair value
US$
% of net
assets Listed/Quoted Investments (98.4%) (I) Equities and Convertibles (52.6%) Australia (1.7%) Australia & NZ Bkg Group-
AU List 389,074 11,921,874 0.3 Dexus Property Group
Stapled Sec 4,803,512 4,719,263 0.1 Goodman Group Stapled
Sec 4,013,712 17,596,114 0.5 Mirvac Group Stapled Sec 2,946,775 4,643,071 0.1 Transurban Group Stapled
Sec 2,607,329 17,544,536 0.4 Westfield Group Stapled
Sec 1,257,449 11,946,033 0.3 Austria (0.0%) Immofinanz AG 204,449 958,340 0.0 Belgium (0.3%) Ageas NV 6,183 275,635 0.0 Belgacom SA 21,864 684,947 0.0 Groupe Bruxelles Lambert 8,150 814,149 0.0 Nyrstar NV CB 7%
10/07/14 EUR1,250,000 1,761,857 0.1 Solvay SA 53,285 8,368,494 0.2 Telenet Group Hldg 12,816 790,360 0.0 Warehouses De Pauw 13,346 1,003,032 0.0 Brazil (1.4%) AES Tiete 118,310 828,406 0.0 Ambev SA ADR 2,038,240 15,103,357 0.4 Banco Bradesco Pref 344,153 4,756,983 0.1 Banco do Brasil 871,946 8,810,268 0.2 CCR SA 319,630 2,467,518 0.1 Cielo SA 290,692 9,315,284 0.2 Embraer SA ADR 210,301 7,463,582 0.2 Tractebel Energia 438,626 6,822,855 0.2 Canada (0.9%) Allied Properties REIT 143,000 4,469,762 0.1 Artis Real Estate Inv Trust 95,463 1,360,483 0.0 Bank Of Montreal 219,153 14,684,987 0.4 Canadian Apartment
Properties REIT 180,900 3,494,259 0.1 Canadian Real Estate Inv
Trust 35,000 1,429,173 0.0 Detour Gold CB 5.5%
30/11/17 USD1,860,000 1,787,235 0.1 Dundee Real Estate
Investment 'A' 52,100 1,371,711 0.0 First Capital Realty 5,598 89,010 0.0 H&R Real Estate Inv Trust 81,000 1,677,608 0.1 Pengrowth Energy CB
6.25% 31/03/17 CAD34,000 32,119 0.0 RioCan Real Estate Inv
Trust 135,361 3,265,833 0.1
(Continued)
Holding
Fair value
US$
% of net
assets Cayman Islands (0.1%) XL Group Pref 'D' 2,475 2,128,500 0.1 China (1.3%) Agile Property CB 4%
28/4/16-PO3/14 USD3,000,000 3,046,833 0.1 Bank of China 'H' 17,620,000 7,813,898 0.2 China Construction Bank
'H' 9,512,000 6,658,480 0.2 China Hongqiao CB 6.5%
10/04/17 USD3,400,000 3,687,489 0.1 China Mobile 721,500 6,603,864 0.2 China Overseas
EB(COLI)0% 2/21-RegS USD2,000,000 1,981,000 0.0 China Shenhua Energy 'H' 2,139,500 6,178,225 0.2 CNOOC Ltd 3,338,000 5,017,511 0.1 Ind & Comm Bank of China
'H' 10,810,000 6,647,334 0.2 Jiangsu Expressway 'H' 1,030,000 1,173,797 0.0 Zhejiang Expressway 'H' 1,292,000 1,177,566 0.0 Denmark (0.4%) ISS A/S 11,553 388,157 0.0 TDC A/S 1,758,142 16,260,459 0.4 Tryg A/S 10,049 994,326 0.0 Finland (0.6%) Elisa Oyj 36,480 1,050,319 0.1 Fortum OYJ 46,880 1,066,104 0.1 Neste Oil 28,254 576,328 0.0 Orion Oyj 'B' 24,572 742,012 0.0 Pohjola Bank 'A' (Offer
03/14) 35,082 779,914 0.0 Sampo Oyj 'A' 19,609 1,017,533 0.0 Stora Enso 'R' 71,275 762,793 0.0 Technopolis Oyj 750,141 4,352,643 0.1 UPM-Kymmene Oyj 687,825 11,764,616 0.3 France (3.3%) Air France-KLM CB 2.03%
15/2/23-Uts EUR299,953 5,542,591 0.2 AXA SA 553,849 14,400,453 0.4 BNP Paribas 188,069 14,512,949 0.4 Bouygues SA 24,609 1,026,848 0.0 Casino Guichard
Perrachon 5,952 708,605 0.0 CGG NoGA CB 1.75%
1/01/16-RegS(Uts) EUR44,143 1,681,012 0.1 CNP Assurances 45,081 954,982 0.0 Electricite de France (EDF) 212,462 8,408,491 0.2 Fonciere des Regions 11,381 1,054,717 0.0 Gaztransport et Technigaz 11,862 768,230 0.0 GDF Suez-FR List 336,155 9,201,250 0.2 ICADE SA 57,005 5,641,906 0.2 Lagardere SCA 27,400 1,088,360 0.0 Nexans SA CB 2.5%
1/01/19-RegS(Uts) EUR16,726 1,734,017 0.1 Orange 95,100 1,405,087 0.0 Rallye CB(Casino) 1%
10/20-RegS-Uts EUR3,443 537,170 0.0
- 182 -

JJPMORGAN MULTI INCOME FUND SSemi--aannual report for the
pperiod ended 31 March 2014
IInvestment Portfolio (Continued) As at 31 March 2014 (Unaudited)
Holding
Fair value
US$
% of net
assets France (Continued) Schneider Electric 119,198 10,571,717 0.3 SCOR SE 27,847 974,855 0.0 SES SA FDR-FR List 19,331 722,157 0.0 Silicon On CB 6.75%
18/09/18 (Uts) EUR198,199 746,568 0.0 Societe Generale 16,990 1,046,833 0.0 Suez Environnement-FR
List 51,503 1,046,659 0.0 Total SA 40,651 2,666,897 0.1 Unibail-Rodamco SE-NL
List 104,091 27,042,854 0.7 Veolia Environnement 57,183 1,131,747 0.0 Vinci SA 186,184 13,833,742 0.4 Vivendi 48,734 1,358,130 0.0 Germany (1.8%) Allianz SE-Regd 9,700 1,640,379 0.1 Alstria Office REIT 331,465 4,445,069 0.1 Axel Springer 7,228 462,784 0.0 BASF SE 176,755 19,654,662 0.5 Daimler AG-Regd 205,884 19,463,072 0.5 Deutsche Telekom-Regd 1,069,327 17,287,672 0.4 Hannover
Rueckversicherung-Regd 11,416 1,021,615 0.0
Kloeckner & Co EB 2.5%22/12/17-RegS EUR2,100,000 2,877,970 0.1
Muenchener Rueck-Regd 5,540 1,210,991 0.0 ProSieben Sat.1 Media 21,380 978,893 0.0 RTL Group 5,900 672,083 0.0 SGL Carbon CB 2.75%
25/01/18-RegS EUR1,100,000 1,547,113 0.1 Hong Kong (1.5%) Hang Seng Bank 369,800 5,887,586 0.2 Hutchison Whampoa 766,000 10,141,510 0.3 Link REIT 898,000 4,416,460 0.1 MGM China Hldgs 1,273,200 4,489,080 0.1 New World Dev Rts (07-
14/04/14) 279,333 57,616 0.0 New World Development 838,000 842,640 0.0 Newford EB (Shangri-La)
0% 12/05/16 USD2,700,000 2,833,299 0.1 SJM Hldgs 1,980,000 5,564,487 0.1 VTech Hldgs 269,200 3,459,980 0.1 Wharf (Hldgs) 410,000 2,621,615 0.1 Wynn Macau 4,241,600 17,607,146 0.4 Hungary (0.1%) MNV Zrt
EB(Richter)3.375% 4/19-RegS EUR2,600,000 3,749,204 0.1
India (0.5%) Coal India 1,632,808 7,894,400 0.2 Sesa Sterlite CB 5%
31/10/14 USD2,100,000 2,146,433 0.0 Sterlite Ind CB 4%
30/10/14 USD3,273,000 3,334,889 0.1
(Continued)
Holding
Fair value
US$
% of net
assets Tata Power CB 1.75%
21/11/14 USD2,000,000 2,167,833 0.1 Tata Steel CB 4.5%
21/11/14 USD3,000,000 3,082,275 0.1 Indonesia (0.4%) Indo Tambangraya Megah 1,298,600 2,783,531 0.1 Perusahaan Gas Negara 9,243,900 4,170,333 0.1 Telekomunikasi Indonesia
'B' 35,003,600 6,825,086 0.2 Italy (0.7%) Astaldi SpA CB 4.5%
31/01/19 EUR1,800,000 3,067,468 0.1 Atlantia SpA 29,450 756,993 0.0 ENI SpA 795,150 19,956,620 0.5 Snam SpA 187,982 1,101,116 0.1 Terna-Rete Elettrica
Nationale 137,619 737,450 0.0 UnipolSai SpA 201,000 770,139 0.0 Japan (2.4%) GLP J-REIT 1,967 1,984,476 0.1 GLP J-REIT-RegS 256 258,275 0.0 Japan Airlines 152,600 7,527,387 0.2 Japan Logistics Fd 625 1,407,972 0.0 Japan Real Estate Inv 492 2,474,690 0.1 Japan Tobacco 482,300 15,173,587 0.4 Kenedix Office Investment 275 1,367,189 0.0 Mitsubishi Estate 78,000 1,852,580 0.0 Mitsui Fudosan 150,000 4,586,590 0.1 Nippon Prologis REIT 1,185 2,395,660 0.1 Nippon Prologis REIT-RegS 535 1,081,585 0.0 ORIX JREIT 1,790 2,238,695 0.1 Seven & I Hldgs 341,900 13,093,689 0.3 Sumitomo Mitsui Financial
Grp 424,200 18,160,875 0.5 Toyota Motor 368,600 20,852,197 0.5 United Urban Investment 806 1,186,480 0.0 Jersey C.I. (0.0%) St Modwen Prop CB
2.875% 03/19-RegS GBP900,000 1,554,498 0.0 Korea (0.7%) Kangwon Land 192,180 5,596,862 0.1 KT & G 89,920 6,758,044 0.2 SK Telecom ADR 541,343 12,218,112 0.3 S-Oil Corp 71,826 4,156,589 0.1 Luxembourg (0.0%) Grand City Prop CB
1.5%24/2/19-RegS EUR1,200,000 1,737,822 0.0 Malaysia (0.0%) Lafarge Malaysia 284,800 788,422 0.0 Mexico (0.1%) Kimberly-Clark de Mexico
'A' 1,851,770 4,961,232 0.1
- 183 -

JJPMORGAN MULTI INCOME FUND SSemi--aannual report for the
pperiod ended 31 March 2014
IInvestment Portfolio (Continued) As at 31 March 2014 (Unaudited)
Holding
Fair value
US$
% of net
assets Netherlands (0.4%) Ahold Await Cert 39,258 788,885 0.0 Amorim Ener
EB(Galp)3.375%6/18-RegS EUR1,300,000 2,023,097 0.1
Delta Lloyd 36,829 1,021,536 0.0 Koninklijke Philips 16,525 580,891 0.0 Vastned Retail 128,528 6,332,002 0.2 Volkswagen Intl CB
5.5%9/11/15-RegS EUR2,400,000 3,968,873 0.1 Wereldhave NV 21,781 1,854,915 0.0 Norway (0.4%) Gjensidige Forsikring 48,976 996,363 0.0 Polarcus Ltd CB 2.875%
27/04/16 USD500,000 493,144 0.0 Statoil ASA 41,184 1,162,525 0.0 Subsea 7 CB 1% 05/10/17 USD3,200,000 3,185,205 0.1 Telenor ASA 439,430 9,739,748 0.3 Yara Intl 18,131 801,307 0.0 Poland (0.2%) Powszechny Zaklad
Ubezpiecze 51,077 7,260,731 0.2 Portugal (0.0%) EDP-Energias de Portugal 251,978 1,170,710 0.0 Qatar (0.2%) Industries Qatar 164,247 8,408,003 0.2 Russia (1.1%) Holdgrove Ltd CB 1%
24/09/17 USD4,800,000 4,617,467 0.1 Lukoil Sponsored ADR-LI
List 131,979 7,332,753 0.2 MMC Norilsk Nickel ADR
(London) 350,684 5,831,875 0.2 Mobile Telesystems ADR 407,972 7,135,430 0.2 Phosagro OJSC GDR-RegS 321,840 3,588,516 0.1 Sberbank of Russia ADR-
UK List 932,350 9,062,442 0.2 TMK Bonds CB 5.25%
11/02/15 USD4,900,000 4,869,069 0.1 Saudi Arabia (0.1%) Yanbu Natl Petro PN
08/03/16 (ML) 165,711 3,126,122 0.1 Yanbu Natl Petrochem PN
10/15 (CS) 137,100 2,586,379 0.0 Singapore (1.0%) Ascendas Real Estate Inv
Trust 1,175,000 2,111,646 0.1 CapitaCommercial Trust 2,581,000 3,047,819 0.1 CapitaLand Ltd 975,000 2,240,666 0.1 CapitaLand Ltd CB
1.85%19/6/20-RegS SGD7,750,000 5,688,832 0.1 CapitaMalls Asia 1,246,000 1,773,560 0.0 Global Logistics Properties 716,000 1,508,807 0.0
(Continued)
Holding
Fair value
US$
% of net
assets Hutchison Port Hldgs
Trust-USD 8,873,000 5,767,450 0.1 Singapore Telecom 6,139,000 17,818,257 0.5 South Africa (1.3%) AVI Ltd 657,110 3,531,734 0.1 Barclays Africa Group 467,292 6,619,811 0.2 Bidvest Group 307,875 8,149,486 0.2 Foschini Group 616,970 6,285,317 0.1 Imperial Hldgs 384,024 6,882,412 0.2 MTN Group 369,230 7,566,865 0.2 Sasol Ltd 133,290 7,471,433 0.2 Steinhoff Fin EB (SHF) 4%
30/01/21 EUR300,000 467,740 0.0 Steinhoff Fin EB (SHF)
4.5% 31/3/18 EUR2,750,000 4,735,839 0.1 Spain (0.7%) Abengoa SA CB 4.5%
03/02/17 EUR4,350,000 6,379,606 0.2 Abertis Infraestructuras 33,340 761,635 0.0 Acciona SA CB 3%
30/01/19-RegS EUR2,200,000 3,496,979 0.1 ACS Actividades de
Construction 22,272 875,307 0.0 Caixabank EB(Repsol)4.5%
11/16-RegS EUR2,700,000 3,880,360 0.1 Ferrovial SA 36,065 781,636 0.0 Gas Natural SDG 33,224 934,594 0.0 Iberdrola SA 204,453 1,430,353 0.1 Mapfre SA 160,957 678,827 0.0 OHL Investment CB 4%
25/04/18-RegS EUR3,200,000 4,740,364 0.1 Red Electrica Corp 14,010 1,139,248 0.1 Repsol SA 33,904 865,640 0.0 Sweden (1.2%) Electrolux AB 'B' 362,540 7,895,466 0.2 Ericsson (LM) Tel 'B' 1,208,913 16,072,722 0.4 Hennes & Mauritz 'B' 16,345 695,795 0.0 Investor AB 'B' 15,634 564,734 0.0 Nordea Bank 101,199 1,432,868 0.1 SAS AB CB 3.625%
01/04/19-RegS SEK6,000,000 833,455 0.0 Securitas AB 'B' 87,586 1,012,496 0.0 Skandinaviska Enskilda
Banken 'A' 72,448 992,821 0.0 Skanska AB 'B' 39,665 932,963 0.0 Svenska Handelsbanken
'A' 20,486 1,026,267 0.0 Swedbank AB 'A' 568,716 15,236,400 0.4 Swedish Match 3,300 107,649 0.0 TeliaSonera AB 141,877 1,067,871 0.1 Switzerland (2.1%) Banque Cantonale
Vaudoise-Regd 763 445,267 0.0 Cembra Money Bank 14,211 969,279 0.0 Givaudan AG (Regd) 222 343,549 0.0 Novartis AG-Regd 193,116 16,396,331 0.4
- 184 -

JJPMORGAN MULTI INCOME FUND SSemi--aannual report for the
pperiod ended 31 March 2014
IInvestment Portfolio (Continued) As at 31 March 2014 (Unaudited)
Holding
Fair value
US$
% of net
assets Switzerland (Continued) Roche Hldg (Genusschein) 75,015 22,504,074 0.6 Swiss Re 334,799 31,059,916 0.8 Swisscom AG-Regd 988 607,329 0.0 Transocean Ltd-Regd-SW
List 11,375 468,985 0.0 UBS AG-Regd 503,892 10,416,107 0.3 Zurich Insurance Group-
Regd 4,200 1,290,406 0.0 Taiwan (1.9%) Asustek Computer 305,000 3,019,703 0.1 Delta Electronics 1,635,000 10,093,753 0.2 Far EasTone Telecom 1,378,000 2,918,677 0.1 Novatek Microelectronics 1,111,000 5,089,385 0.1 President Chain Store 876,000 6,184,714 0.2 Quanta Computer 3,376,000 9,090,617 0.2 Radiant Opto-Electronics 1,124,000 4,539,923 0.1 Siliconware Precision 9,477,000 12,603,842 0.3 Simplo Technology 469,000 2,233,150 0.1 Taiwan Mobile 2,188,300 6,855,392 0.2 Taiwan Semiconductor
Mfg ADR 390,748 7,822,775 0.2 Tripod Technology 1,563,000 3,074,418 0.1 Thailand (0.4%) Advanced Information (F) 1,130,700 7,877,256 0.2 Siam Cement NVDR 599,800 7,728,619 0.2 Turkey (0.5%) Arcelik AS 518,830 2,898,288 0.1 Eregli Demir ve Celik
Fabrikalari 298,319 384,892 0.0 Tofas Turk Otomobil
Fabrikasi 823,150 4,675,240 0.1 Tupras-Turkiye Petrol
Rafinerileri 330,918 7,007,566 0.2 Turk Telekomunikasyon 1,592,930 4,430,597 0.1 United Arab Emirates (0.1%) First Gulf Bank 1,007,606 4,471,543 0.1 United Kingdom (5.1%) Aberdeen Asset
Management 113,205 736,612 0.0 Admiral Group 40,800 971,322 0.0 AMEC plc 57,922 1,083,456 0.0 Anglo American-UK List 42,262 1,075,528 0.0 AstraZeneca plc 287,950 18,609,364 0.5 Aviva plc 1,541,235 12,256,372 0.3 BHP Billiton plc 55,286 1,699,616 0.1 BP plc 337,301 2,699,191 0.1 British Land 1,000,561 10,909,278 0.3 British Sky Broadcasting
Group 798,148 12,148,674 0.3 Direct Line Insurance
Group 2,234,322 8,846,756 0.2 GlaxoSmithKline plc 619,078 16,425,805 0.4 Hammerson plc 991,275 9,155,427 0.2 Helical Bar 824,874 5,139,768 0.1
(Continued)
Holding
Fair value
US$
% of net
assets HSBC Hldgs-UK List 1,169,434 11,843,953 0.3 ICAP plc 111,285 700,557 0.0 Intu Prop Rts (31/3-
17/4/14)(GB) 42,571 67,424 0.0 Intu Properties (GB List) 149,000 700,503 0.0 ITV plc 166,184 530,558 0.0 Legal & General Group 315,388 1,076,311 0.0 Lloyds Banking Group 993,510 1,236,451 0.0 Marks & Spencer Group 105,000 790,354 0.0 National Grid 104,000 1,425,213 0.1 Next plc 6,118 673,175 0.0 Persimmon plc 559,524 12,555,628 0.3 Resolution Ltd 174,000 866,771 0.0 Rio Tinto-UK List 29,210 1,625,277 0.1 Royal Dutch Shell 'A'-UK
List 606,304 22,146,621 0.6 Royal Dutch Shell 'B'-UK
List 98,000 3,823,925 0.1 Safestore Hldgs 2,366,654 9,350,994 0.3 Salamander Energy CB 5%
30/03/15 USD1,700,000 1,698,347 0.1 Segro plc 797,764 4,415,574 0.1 SSE PLC 41,000 1,004,108 0.0 Standard Life 175,786 1,106,308 0.0 TUI Travel 69,885 510,308 0.0 United Utilities Group 36,000 472,937 0.0 Vedanta Res CB 5.5%
13/07/16 USD3,800,000 3,872,464 0.1 Vodafone Group-UK List 5,306,299 19,488,610 0.5 United States (17.7%) Accenture PLC 'A' 154,019 12,278,395 0.3 Allstate Corp Pref 'E' 16,000 402,560 0.0 Ally Financial NoG Pref-
144A 2,175 2,159,095 0.0 American Realty CB 3.75%
15/12/20 USD965,000 1,060,696 0.0 Annaly Capital Mgt CB 5%
15/05/15 USD3,747,000 3,921,340 0.1 Applied Materials 1,038,892 21,208,979 0.5 ArcelorMittal NV Cnv Pref
6%15/1/16 102,723 2,463,298 0.1 Ares Capital CB 4.375%
15/1/19-144A USD3,634,000 3,902,290 0.1 Ares Capital CB 4.75%
15/01/18-144A USD1,801,000 1,950,591 0.0 Ares Capital CB 4.875%
15/03/17 USD1,000,000 1,075,422 0.0 Avalonbay Communities 36,900 4,845,708 0.1 Bank Of America Conv
Pref 7.25%Perp 4,322 4,945,276 0.1 Bank of New York Mellon
Pref 'C' 302,200 6,687,686 0.2 BB&T Corp Deposit Pref 'F' 146,150 3,044,305 0.1 BB&T Corp Deposit Pref 'G' 135,000 2,810,700 0.1 BB&T Corp Pref 'E' 57,200 1,280,708 0.0 Boston Properties Pref 39,000 854,880 0.0 Boston Properties REIT 31,264 3,580,666 0.1 Brandywine Realty Trust 234,700 3,393,762 0.1 Bristol Myers Squibb 315,356 16,382,743 0.4
- 185 -

JJPMORGAN MULTI INCOME FUND SSemi--aannual report for the
pperiod ended 31 March 2014
IInvestment Portfolio (Continued) As at 31 March 2014 (Unaudited)
Holding
Fair value
US$
% of net
assets United States (Continued) Bunge Ltd Conv Pref
4.875% Perp 10,000 1,060,000 0.0 Centerpoint Energy EB
(AOL)FRN 9/29 USD10,950 575,230 0.0 Chesapeake Energy CB
2.25% 15/12/38 USD2,851,000 2,692,469 0.1 Chesapeake Energy CB
2.5% 15/05/37 USD2,509,000 2,586,187 0.1 Cisco Systems 628,923 14,097,308 0.3 CME Group 'A' 191,820 14,198,515 0.4 Colony Financial CB 5%
15/04/23 USD4,378,000 4,746,603 0.1 Comcast Corp 'A' 161,132 8,063,045 0.2 ConocoPhillips 373,619 26,284,096 0.7 Corporate Office
Properties Trust 87,900 2,341,656 0.1 Crown Castle Conv Prf
4.5% 01/11/16 41,423 4,199,878 0.1 DCT Industrial Trust 336,400 2,650,832 0.1 DDR Corp 213,100 3,511,888 0.1 Diamondrock Hospitality 193,300 2,271,275 0.1 Digital Realty Trust 44,100 2,340,828 0.1 Discover Fin Serv Dep Pref
'B' 255,200 6,260,056 0.2 Dominion Conv Pref 6%
01/07/16 'B' 22,230 1,284,227 0.0 Dominion Conv Pref
6.125% 04/16 'A' 9,500 546,250 0.0 Dominion Resources 152,817 10,848,479 0.3 Dow Chemical 300,368 14,594,880 0.4 Duke Energy Pref 230,200 5,340,640 0.1 Duke Realty 156,500 2,641,720 0.1 Education Realty Trust 256,400 2,530,668 0.1 Equity One 126,200 2,819,308 0.1 Extra Space CB 2.375%
01/07/33-144A USD1,980,000 2,080,064 0.0 Extra Space Storage 45,500 2,207,205 0.1 Freeport-McMoRan
Copper & Gold 312,697 10,340,890 0.3 General Growth Properties 142,300 3,130,600 0.1 Goldman Sachs Group Dep
Pref 'I' 173,000 3,987,650 0.1 Goldman Sachs Group Pref
'J' 423,000 10,084,320 0.2 Health Care REIT 58,900 3,510,440 0.1 Health Care REIT Conv Prf
6.5% Perp 29,300 1,627,029 0.0 Healthcare Realty Trust 88,100 2,127,615 0.0 Highwoods Properties 102,100 3,921,661 0.1 Home Depot 209,034 16,540,859 0.4 IAS Operating EB (IVR) 5%
3/18-144A USD1,070,000 1,029,405 0.0 Intel Corp CB 2.95%
15/12/35 USD4,521,000 5,341,905 0.1 iStar Fin NoJ Conv Pref
4.5% Perp 11,480 725,714 0.0 Johnson & Johnson 219,341 21,545,865 0.5 Kilroy Realty 43,600 2,554,088 0.1 KLA-Tencor Corp 113,764 7,865,643 0.2
(Continued)
Holding
Fair value
US$
% of net
assets Lasalle Hotel Properties 74,500 2,332,595 0.1 Liberty Media CB 1.375%
10/23-144A USD2,168,000 2,052,667 0.0 Liberty Property Trust 100,400 3,710,784 0.1 Lorillard Inc 315,949 17,086,521 0.4 Macerich Co 45,800 2,854,714 0.1 Masco Corp 498,087 11,062,512 0.3 McDonald's Corp 80,850 7,925,726 0.2 Merck & Co 384,549 21,830,846 0.5 Meritor Inc CB 7.875%
01/03/26 USD750,000 1,164,848 0.0 MetLife Inc 191,042 10,087,018 0.2 Micron Technology CB 3%
15/11/43 USD1,522,000 1,687,214 0.0 Microsoft Corp 852,719 34,952,951 0.9 Mid-America Apartment
Communities 45,600 3,113,112 0.1 Molson Coors Brewing 'B'
(Non Vtg) 188,352 11,086,399 0.3 Morgan Stanley Pref 'E' 261,000 6,924,330 0.2 National Retail Properties 82,100 2,817,672 0.1 Navistar Intl CB 4.75%
15/4/19-144A USD277,000 276,063 0.0 NextEra Energy 156,475 14,962,139 0.4 Nextera Energy Cnv Prf
5.799% 09/16 119,110 6,434,322 0.2 NRG Yield CB 3.5%
01/02/19-144A USD1,540,000 1,583,025 0.0 Paccar Inc 273,220 18,425,956 0.5 Peabody Energy CB 4.75%
15/12/41 USD4,408,000 3,571,000 0.1 Prologis Inc 79,800 3,258,234 0.1 Prospect Cap CB
5.375%15/10/17-144A USD390,000 420,238 0.0 Prospect Cap CB 5.5%
15/08/16 USD800,000 847,896 0.0 Prospect Cap CB 5.75%
15/03/18 USD3,097,000 3,317,244 0.1 Prospect Cap CB 5.875%
15/1/19 USD2,080,000 2,223,200 0.1 QUALCOMM Inc 142,852 11,265,309 0.3 Realty Income 72,600 2,966,436 0.1 Redwood Trust CB 4.625%
15/04/18 USD3,216,000 3,497,898 0.1 Royal Gold CB 2.875%
15/06/19 USD4,660,000 4,886,220 0.1 SCE Trust II Preferred Secs 145,800 2,997,648 0.1 Seacor Hldgs CB 3%
15/11/28-144A USD967,000 962,631 0.0 Select Income REIT 73,800 2,233,926 0.1 Sempra Energy 158,462 15,332,782 0.4 Ship Finance Intl CB 3.25%
1/2/18 USD561,000 609,743 0.0 Ship Finance Intl CB 3.75%
10/02/16 USD1,100,000 1,186,611 0.0 Simon Property Group 20,557 3,371,348 0.1 Stanley Black Conv Pref
6.25% 11/16 20,000 2,158,800 0.0 State Street Pref 'C' 344,200 7,741,058 0.2 State Street Pref 'D' 93,500 2,420,715 0.1
- 186 -

JJPMORGAN MULTI INCOME FUND SSemi--aannual report for the
pperiod ended 31 March 2014
IInvestment Portfolio (Continued) As at 31 March 2014 (Unaudited)
Holding
Fair value
US$
% of net
assets United States (Continued) TICC Capital CB 7.5%
01/11/17 USD828,000 925,762 0.0 Time Warner 326,005 21,297,906 0.5 United Tech Conv Pref
7.5% 01/08/15 19,640 1,307,435 0.0 United Technologies 98,766 11,539,819 0.3 US Bancorp 309,726 13,274,856 0.3 US Bancorp Dep Pref 'H' 235,000 5,111,250 0.1 Ventas Inc 36,439 2,207,110 0.1 Verizon Communications 538,137 25,599,176 0.6 Vornado Realty Trust 26,000 2,562,560 0.1 Wells Fargo & Co 342,594 17,040,625 0.4 Wells Fargo Conv Pref
7.5% Perp-L 5,459 6,403,407 0.2 Weyerhaeu Co Conv Pref
6.375% 7/16 45,462 2,482,225 0.1 Virgin Islands (0.0%) New Cotai 'B'-144A 2 49,115 0.0 2,086,558,205 52.6 --------- ---- (II) Debt Securities (44.3%) Argentina (0.1%)Cuidad Auto Buenos 12.5%
04/15-RegS USD864,000 952,440 0.0 Prov Buenos Aires
10.875% 1/21-RegS USD1,232,000 1,117,101 0.0 Prov Buenos Aires 11.75%
10/15-RegS USD635,000 657,587 0.0 Prov Buenos Aires 9.625%
04/28-RegS USD2,542,000 2,167,938 0.1 Rep of Argentina 8.28%
31/12/33 USD576,092 630,574 0.0 Aruba (0.1%) Aruba Govt Of 4.625%
14/09/23-RegS USD3,170,000 3,017,313 0.1 Australia (0.2%) Ausdrill Fin 6.875%
01/11/19-144A USD725,000 680,766 0.0 Ausdrill Fin 6.875%
01/11/19-RegS USD200,000 187,734 0.0 BlueScope Stl/Fin 7.125%
05/18-144A USD649,000 703,962 0.0 FMG Res (Aug2006) 6%
01/04/17-144A USD700,000 758,870 0.0 FMG Res (Aug2006) 6%
01/04/17-RegS USD16,000 17,355 0.0 FMG Res (Aug2006)
6.875% 04/22-144A USD1,350,000 1,494,281 0.1 FMG Res (Aug2006)
6.875%1/2/18-144A USD250,000 266,415 0.0 FMG Res (Aug2006)
6.875%1/2/18-RegS USD775,000 826,505 0.0
(Continued)
Holding
Fair value
US$
% of net
assets FMG Res (Aug2006)
8.25%1/11/19-144A USD3,575,000 4,046,453 0.1 Nufarm Aust 6.375%
15/10/19-144A USD500,000 535,411 0.0 Nufarm Aust 6.375%
15/10/19-RegS USD79,000 84,595 0.0 Austria (0.0%) JBS Inv 7.75% 28/10/20-
RegS USD800,000 875,642 0.0 Azerbaijan (0.1%) State Oil Co Azerb 4.75%
13/03/23 USD3,070,000 2,938,932 0.1 State Oil Co Azerb 5.45%
02/17-RegS USD640,000 681,615 0.0 Bahamas (0.1%) Ultrapetrol Bahamas
8.875% 15/06/21 USD1,852,000 2,074,478 0.1 Bermuda (0.1%) Aircastle Ltd 6.25%
01/12/19 USD555,000 611,162 0.0 Aircastle Ltd 7.625%
15/04/20 USD1,485,000 1,746,912 0.1 Fly Leasing 6.75%
15/12/20 USD300,000 319,744 0.0 Misa Investments
8.625%15/8/18-144A USD375,000 390,004 0.0 Seadrill Stp Cpn
6.125%15/9/17-144A USD800,000 840,986 0.0 Seadrill Stp Cpn
6.125%15/9/17-RegS USD200,000 210,270 0.0 Seadrill Stp Cpn
6.625%15/9/20-144A USD950,000 976,722 0.0 Brazil (0.3%) Fed Rep of Brazil 11%
17/08/40 USD8,273,000 9,484,995 0.3 Fed Rep of Brazil 7.125%
20/01/37 USD850,000 1,034,450 0.0 Samarco Mineracao 5.75%
10/23-RegS USD810,000 839,108 0.0 Canada (1.1%) Ainsworth Lumber 7.5%
15/12/17-144A USD549,000 601,332 0.0 Bombardier Inc 4.75%
15/04/19-144A USD1,200,000 1,200,000 0.0 Bombardier Inc 6%
15/10/22-144A USD283,000 283,000 0.0 Bombardier Inc 6.125%
15/01/23-144A USD851,000 868,574 0.0 Bombardier Inc 7.75%
15/03/20-144A USD2,195,000 2,461,055 0.1 Brookfield Res 6.125%
01/07/22-144A USD616,000 645,656 0.0 Brookfield Res 6.5%
15/12/20-144A USD877,000 951,238 0.0
- 187 -

JJPMORGAN MULTI INCOME FUND SSemi--aannual report for the
pperiod ended 31 March 2014
IInvestment Portfolio (Continued) As at 31 March 2014 (Unaudited)
Holding
Fair value
US$
% of net
assets Canada (Continued) Cascades Inc 7.75%
15/12/17 USD200,000 212,607 0.0 Cogeco Cable 4.875%
01/05/20-144A USD254,000 258,926 0.0 First Quantum 6.75%
15/02/20-144A USD739,000 755,166 0.0 First Quantum 7%
15/02/21-144A USD739,000 757,270 0.0 Garda World Sec 7.25%
15/11/21-144A USD1,240,000 1,359,945 0.1 HudBay Minerals 9.5%
01/10/20 USD141,000 158,273 0.0 Kodiak Oil & Gas 5.5%
01/02/22 USD414,000 428,145 0.0 Kodiak Oil & Gas 5.5%
15/01/21 USD755,000 782,757 0.0 Kodiak Oil 8.125%
01/12/19 USD500,000 569,717 0.0 Masonite Intl 8.25%
15/04/21-144A USD1,334,000 1,525,123 0.1 Masonite Intl 8.25%
15/04/21-RegS USD150,000 171,866 0.0 Mattamy Group 6.5%
15/11/20-144A USD1,032,000 1,064,215 0.0 MEG Energy 6.375%
30/01/23-144A USD1,240,000 1,297,014 0.0 MEG Energy 6.375%
30/01/23-RegS USD99,000 103,057 0.0 MEG Energy 6.5%
15/03/21-144A USD185,000 195,280 0.0 MEG Energy 7% 31/03/24-
144A USD500,000 528,950 0.0 New Gold 6.25% 15/11/22-
144A USD765,000 797,256 0.0 New Gold 7% 15/04/20-
144A USD540,000 586,360 0.0 New Gold 7% 15/04/20-
RegS USD24,000 26,060 0.0 Norbord Inc 5.375%
01/12/20-144A USD717,000 737,292 0.0 Nova Chemicals 5.25%
01/08/23-144A USD720,000 777,766 0.0 Novelis Inc 8.75%
15/12/20 USD1,685,000 1,926,809 0.1 Pacific Rubial 5.375%
26/01/19-RegS USD1,700,000 1,802,106 0.1 Precision Drilling 6.5%
15/12/21 USD1,025,000 1,121,677 0.0 Precision Drilling 6.625%
15/11/20 USD900,000 989,111 0.0 Quadra FNX Min 7.75%
15/06/19-144A USD395,000 428,502 0.0 Quebecor Media 5.75%
15/01/23 USD1,347,000 1,380,611 0.1 Stackpole Intl/Pwr 7.75%
10/21-144A USD1,164,000 1,288,580 0.0 Taseko Mines 7.75%
15/04/19 USD710,000 745,593 0.0
(Continued)
Holding
Fair value
US$
% of net
assets Telesat Canada/LLC 6%
15/05/17-RegS USD156,000 165,217 0.0 Trinidad Drill 7.875%
15/01/19-144A USD1,325,000 1,438,964 0.1 Trinidad Drill 7.875%
15/01/19-RegS USD425,000 461,909 0.0 Ultra Petroleum 5.75%
15/12/18-144A USD1,240,000 1,326,886 0.0 Valeant Pharm 5.625%
01/12/21-144A USD1,235,000 1,322,994 0.0 Videotron Ltd 5%
15/07/22 USD1,522,000 1,542,615 0.1 Videotron Ltd 5.375%
15/06/24-144A USD657,000 655,785 0.0 VPII Escrow 6.75%
15/08/18-144A USD1,469,000 1,627,009 0.1 VPII Escrow 7.5%
15/07/21-144A USD5,682,000 6,522,605 0.2 Cayman Islands (0.4%) Kaisa Group 8.875%
19/03/18-RegS USD1,100,000 1,069,755 0.1 Odebrecht Offshore 6.75%
10/22-RegS USD1,000,000 1,015,477 0.0 Seagate HDD Cayman
4.75% 06/23-144A USD894,000 883,570 0.0 Seagate HDD Cayman
6.875% 01/05/20 USD620,000 696,660 0.0 Seagate HDD Cayman 7%
01/11/21 USD565,000 640,286 0.0 Shelf Drilling 8.625%
01/11/18-144A USD150,000 167,391 0.0 Studio City Fin 8.5%
01/12/20-144A USD1,000,000 1,140,033 0.1 UPCB Finance III 6.625%
1/7/20-144A USD600,000 650,422 0.0 UPCB Finance V 7.25%
15/11/21-144A USD3,141,000 3,541,761 0.1 UPCB Finance VI 6.875%
01/22-144A USD3,350,000 3,704,949 0.1 Wynn Macau 5.25%
15/10/21-144A USD685,000 713,570 0.0 Chile (0.1%) Cencosud SA 5.5%
20/01/21-RegS USD2,220,000 2,314,905 0.1 Colombia (0.0%) Ecopetrol SA 5.875%
18/09/23 USD750,000 823,076 0.0 Rep of Colombia 6.125%
18/01/41 USD750,000 850,455 0.0 Costa Rica (0.2%) Banco Costa Rica 9.995%
1/8/20-RegS USD5,675,000 7,279,086 0.2 Banco De Costa 5.25%
12/08/18-RegS USD720,000 739,182 0.0 Instituto Costarr 6.375%
05/43-RegS USD480,000 422,303 0.0
- 188 -

JJPMORGAN MULTI INCOME FUND SSemi--aannual report for the
pperiod ended 31 March 2014
IInvestment Portfolio (Continued) As at 31 March 2014 (Unaudited)
Holding
Fair value
US$
% of net
assets Costa Rica (Continued) Instituto Costarr 6.95%
11/21-RegS USD400,000 435,966 0.0 Croatia (0.1%) Hrvatska Elektro 6%
09/11/17-RegS USD3,030,000 3,223,415 0.1 Rep of Croatia 6.75%
05/11/19-RegS USD950,000 1,074,414 0.0 Dominican Republic (0.3%) Banco Resv Rep Domin 7%
1/2/23-RegS USD2,730,000 2,630,482 0.1 Dominican Republic
5.875% 4/24-RegS USD1,640,000 1,669,133 0.0 Dominican Republic
9.04% 01/18-RegS USD8,028,333 7,875,730 0.2 El Salvador (0.1%) Rep of El Salvador 7.75%
01/23-RegS USD2,340,000 2,543,905 0.1 Finland (0.0%) Nokia Corp 5.375%
15/05/19 USD737,000 784,968 0.0 Nokia Corp 6.625%
15/05/39 USD242,000 254,347 0.0 France (0.2%) Electric France VRN 5.25%
Perp-144A USD5,495,000 5,564,718 0.1 Electric France
VRN5.625% Perp-144A USD2,950,000 3,011,766 0.1 Lafarge SA 7.125%
15/07/36 USD110,000 118,940 0.0 Georgia (0.2%) Bank of Georgia 7.75%
05/07/17-RegS USD1,000,000 1,084,979 0.0 Georgian Railway 7.75%
11/7/22-RegS USD5,320,000 5,785,168 0.2 Ghana (0.1%) Rep of Ghana 8.5%
04/10/17-RegS USD4,395,000 4,664,536 0.1 Standard Bank CLN 21%
28/10/15 USD1,360,000 967,504 0.0 Honduras (0.0%) Rep of Honduras 8.75%
16/12/20-RegS USD900,000 1,013,151 0.0 Hungary (0.3%) Hungarian Dev Bk
6.25%21/10/20-RegS USD1,080,000 1,176,338 0.0 Hungary Govt No20/A
7.5% 12/11/20 HUF96,800,000 504,655 0.0 Rep of Hungary 5.375%
25/03/24 USD1,450,000 1,456,445 0.0 Rep of Hungary 5.75%
22/11/23 USD1,450,000 1,534,483 0.1
(Continued)
Holding
Fair value
US$
% of net
assets Rep of Hungary 6.375%
29/03/21 USD1,342,000 1,472,887 0.0 Rep of Hungary 7.625%
29/03/41 USD5,710,000 6,625,515 0.2 India (0.0%) Bharat Petroleum 4.625%
10/22-RegS USD350,000 343,130 0.0 Indonesia (0.5%) Pertamina Persero 5.25%
05/21-RegS USD2,950,000 3,024,229 0.1 Pertamina Persero 5.625%
05/43-RegS USD880,000 766,414 0.0 Rep of Indonesia 11.625%
03/19-RegS USD9,483,000 12,958,915 0.4 Rep of Indonesia 5.875%
01/24-RegS USD670,000 728,267 0.0 Rep of Indonesia 6.75%
15/1/44-RegS USD630,000 699,355 0.0 Iraq (0.2%) Rep of Iraq 5.8%
15/01/28-RegS USD10,080,000 9,020,648 0.2 Ireland (0.2%) Alfa Bank (Alfa Bd)7.75%
04/21-RegS USD1,400,000 1,474,904 0.1 Ardagh Packaging 7.375%
10/17-144A USD600,000 656,527 0.0 Ardagh Packaging 7.375%
10/17-RegS USD600,000 656,527 0.0 Ardagh Packaging 9.125%
10/20-144A USD2,876,000 3,321,291 0.1 Ardagh Packaging 9.125%
10/20-RegS USD225,000 259,837 0.0 Ardagh Pkg/Hldgs 6.25%
31/1/19-144A USD535,000 563,032 0.0 Ardagh Pkg/Hldgs 7%
15/11/20-144A USD850,000 160,558 0.0 Ardagh Pkg/Hldgs 9.125%
10/20-144A USD350,000 402,440 0.0 Ardagh Pkg/Hldgs 9.125%
10/20-RegS USD200,000 229,966 0.0 Grifols Worldwide 5.25%
1/4/22-144A USD600,000 616,750 0.0 VIP Fin Ireland 7.748%
2/2/21-144A USD400,000 417,605 0.0 Italy (0.3%) Italy Rep Of (BTP) 4.25%
01/03/20 EUR1,300,000 1,996,626 0.0 Italy Rep Of (BTP) 4.5%
01/05/23 EUR2,600,000 4,035,218 0.1 Italy Rep Of (BTP) 4.75%
01/08/23 EUR1,800,000 2,820,458 0.1 Italy Rep Of (BTP) 4.75%
01/09/28 EUR2,250,000 3,457,534 0.1
- 189 -

JJPMORGAN MULTI INCOME FUND SSemi--aannual report for the
pperiod ended 31 March 2014
IInvestment Portfolio (Continued) As at 31 March 2014 (Unaudited)
Holding
Fair value
US$
% of net
assets Japan (0.1%) eAccess Ltd 8.25%
01/04/18-144A USD1,050,000 1,172,273 0.0 Softbank Corp 4.5%
15/04/20-144A USD1,700,000 1,709,988 0.1 Jersey C.I. (0.1%) Swiss Re Cap VRN 6.854%
Perp-144A USD1,920,000 2,098,424 0.1 Kazakhstan (0.2%) KazMunaiGaz Fin 11.75%
01/15-RegS USD6,988,000 7,667,030 0.2 KazMunaiGaz Natl 4.4%
30/04/23-RegS USD550,000 530,600 0.0 KazMunaiGaz Natl 5.75%
30/4/43-RegS USD640,000 592,114 0.0 Liberia (0.0%) Royal Caribbean 7.5%
15/10/27 USD7,000 7,951 0.0 Luxembourg (1.5%) Altice Financing 6.5%
15/01/22-144A USD516,000 552,693 0.0 Altice Financing 7.875%
12/19-144A USD200,000 223,931 0.0 Altice Finco 8.125%
15/01/24-144A USD200,000 220,465 0.0 Aperam SA 7.375%
01/04/16-144A USD800,000 853,500 0.0 Aperam SA 7.75%
01/04/18-144A USD800,000 871,000 0.0 Arcelormittal 7.5%
15/10/39 USD1,000,000 1,069,792 0.0 ArcelorMittal Stp Cpn
10.35% 1/6/19 USD1,250,000 1,629,638 0.1 ArcelorMittal Stp Cpn 5%
25/2/17 USD1,200,000 1,304,567 0.0 ArcelorMittal Stp Cpn
6.75% 25/2/22 USD7,110,000 7,879,213 0.2 ArcelorMittal Stp Cpn
7.25% 1/3/41 USD1,000,000 1,015,446 0.0 Beverage Packaging
5.625%12/16-144A USD685,000 710,152 0.0 Beverage Packaging 6%
15/06/17-144A USD785,000 822,222 0.0 Calcipar SA 6.875%
01/05/18-144A USD775,000 847,872 0.0 Capsugel SA 7% 15/05/19-
144A USD400,000 422,552 0.0 Convatec Fin 8.25%
15/01/19-144A USD709,000 742,781 0.0 Convatec Health 10.5%
15/12/18-144A USD2,363,000 2,696,675 0.1 Ineos Group 5.875%
15/02/19-144A USD332,000 342,684 0.0 INEOS Group 6.125%
15/08/18-144A USD1,113,000 1,169,203 0.0 Intelsat Jackson 5.5%
01/08/23-144A USD1,450,000 1,434,292 0.1
(Continued)
Holding
Fair value
US$
% of net
assets Intelsat Jackson 6.625%
12/22-144A USD950,000 1,006,706 0.0 Intelsat Jackson 6.625%
15/12/22 USD7,230,000 7,661,566 0.2 Intelsat Jackson 7.25%
15/10/20 USD6,370,000 7,125,685 0.2 Intelsat Jackson 7.5%
01/04/21 USD3,250,000 3,705,000 0.1 Intelsat Jackson 8.5%
01/11/19 USD70,000 77,642 0.0 Intelsat Lux 7.75%
01/06/21-144A USD2,371,000 2,556,728 0.1 Intelsat Lux 8.125%
01/06/23-144A USD2,002,000 2,176,341 0.1 Mallinckrodt 3.5% 04/18-
144A-PO3/14 USD120,000 120,776 0.0 Mallinckrodt 4.75% 4/23-
144A-PO3/14 USD450,000 435,384 0.0 MOL Group Fin 6.25%
26/09/19-RegS USD1,430,000 1,507,780 0.1 Nielsen Co Lux 5.5%
01/10/21-144A USD885,000 949,839 0.0 NII Intl Tel 11.375%
15/08/19-144A USD518,000 372,883 0.0 NII Intl Tel 7.875%
15/08/19-144A USD1,130,000 774,368 0.0 RSHB Capital 5.1%
25/07/18-RegS USD580,000 570,947 0.0 Trinseo Materials 8.75%
01/02/19 USD1,904,000 2,069,807 0.1 Wind Acquisition
11.75%15/7/17-144A USD935,000 1,008,053 0.0 Wind Acquisition 7.25%
15/2/18-144A USD1,633,000 1,767,870 0.1 Wind Acquisition 7.25%
15/2/18-RegS USD400,000 433,036 0.0 Wind Acquisition 7.25%
15/2/18-RegS USD200,000 216,518 0.0 Marshall IIsland (0.1%) Navios Maritim 8.125%
15/11/21-144A USD221,000 241,193 0.0 Navios S A Log/Fin 9.25%
15/04/19 USD1,462,000 1,652,659 0.1 Ocean Rig UDW 7.25%
01/04/19-144A USD551,000 551,324 0.0 Teekay Corp 8.5%
15/01/20 USD467,000 542,622 0.0 Mexico (0.3%) Alfa SAB 6.875%
25/03/44-RegS USD636,000 655,135 0.0 Cemex SAB 5.875%
25/03/19-144A USD350,000 364,400 0.0 Cemex SAB 6.5%
10/12/19-144A USD250,000 271,931 0.0 Cemex SAB 7.25%
15/01/21-144A USD1,925,000 2,126,946 0.1 Cemex SAB 9% 11/01/18-
RegS USD800,000 888,200 0.0
- 190 -

JJPMORGAN MULTI INCOME FUND SSemi--aannual report for the
pperiod ended 31 March 2014
IInvestment Portfolio (Continued) As at 31 March 2014 (Unaudited)
Holding
Fair value
US$
% of net
assets Mexico (Continued) Credito Real 7.5%
13/03/19-RegS USD850,000 889,490 0.0 Grupo Televisa 7.25%
14/05/43 MXN13,200,000 827,377 0.0 Mexican Bds Desarr 10%
20/11/36 MXN84,000 874,817 0.0 Mexican Bds Desarr 8%
11/06/20 MXN250,000 2,206,704 0.1 Mexican Bds Desarr NoM
7.75% 05/31 MXN110,000 941,263 0.1 Petroleos Mexicanos
6.375%1/45-RegS USD660,000 725,814 0.0 Netherlands (0.4%) Bharti Airtel 5.125%
11/03/23-RegS USD1,050,000 1,051,722 0.0 Bluewater Hldgs 10%
10/12/19-RegS USD2,100,000 2,243,188 0.1 InterGen NV 7%
30/06/23-144A USD912,000 973,915 0.0 Kazakhstan Temir 6.95%
10/7/42-RegS USD850,000 885,938 0.0 Lyondellbasell Ind 5%
15/04/19 USD900,000 1,020,415 0.0 Lyondellbasell Ind 5.75%
15/04/24 USD200,000 235,055 0.0 Montell Fin 8.1%
15/03/27-144A USD355,000 461,349 0.0 NXP BV/NXP Fdg 3.5%
15/09/16-144A USD221,000 227,117 0.0 NXP BV/NXP Fdg 3.75%
01/06/18-144A USD965,000 986,713 0.0 NXP BV/NXP Fdg 5.75%
15/02/21-144A USD700,000 750,755 0.0 NXP BV/NXP Fdg 5.75%
15/03/23-144A USD950,000 995,330 0.0 Petrobras Global Fin
6.25% 17/03/24 USD383,000 394,208 0.0 Petrobras Global Fin
7.25% 17/03/44 USD268,000 276,981 0.0 Schaeffler Fin 4.75%
15/05/21-144A USD1,025,000 1,064,080 0.1 Sensata Tech 4.875%
15/10/23-144A USD505,000 503,294 0.0 Sensata Tech 6.5%
15/05/19-144A USD1,910,000 2,095,721 0.1 Syncreon Grp/Fin 8.625%
11/21-144A USD324,000 353,887 0.0 VimpelCom Hldgs
7.5043% 1/3/22-144A USD320,000 326,953 0.0 VTR Finance 6.875%
15/01/24-144A USD1,058,000 1,111,414 0.1 Nigeria (0.1%) Citigroup Inc CLN 16.39%
01/22-RegS USD1,500,000 1,359,930 0.1 SEA Trucks 9% 26/03/18-
144A/RegS USD1,098,862 1,070,269 0.0
(Continued)
Holding
Fair value
US$
% of net
assets Norway (0.0%) Petroleum Geo-Ser
7.375% 12/18-144A USD201,000 218,982 0.0 World Wide Supply 7.75%
05/17-RegS USD445,000 458,089 0.0 Pakistan (0.0%) Islamic Rep
Pakistan6.875%6/17-RegS USD500,000 522,708 0.0
Philippines (0.2%) Philippines Rep of
10.625% 16/03/25 USD3,800,000 5,943,664 0.2 Philippines Rep of 4.2%
21/01/24 USD600,000 626,000 0.0 Portugal (0.3%) Obrigacoes Tesour 4.35%
16/10/17 EUR2,300,000 3,451,002 0.1 Obrigacoes Tesour
4.75%14/6/19-RegS EUR4,537,000 7,025,505 0.2 Romania (0.2%) Romania 6.125%
22/01/44-RegS USD930,000 996,504 0.0 Romania 6.75% 07/02/22-
RegS USD7,502,000 8,850,203 0.2 Russia (0.3%) Russian Feder 12.75%
24/06/28-RegS USD6,441,000 10,749,439 0.3 Russian Feder 4.875%
16/09/23-RegS USD1,800,000 1,790,220 0.0 Russian Feder 5.875%
16/09/43-RegS USD600,000 587,347 0.0 Serbia (0.2%) Rep of Serbia 7.25%
28/09/21-RegS USD7,610,000 8,564,717 0.2 Singapore (0.0%) Flextronics Intl 5%
15/02/23 USD300,000 312,548 0.0 Slovenia (0.1%) Rep of Slovenia 5.25%
18/02/24-RegS USD1,850,000 1,941,976 0.0 Rep of Slovenia 5.85%
10/05/23-RegS USD2,690,000 3,009,370 0.1 South Africa (0.2%) Eskom Hldgs SOC 6.75%
06/08/23-RegS USD500,000 532,650 0.0 Rep of South Africa
4.665% 17/01/24 USD750,000 752,564 0.0 Rep of South Africa
5.875% 16/09/25 USD1,990,000 2,145,740 0.1 Rep of South Africa
5.875% 30/05/22 USD2,000,000 2,240,519 0.1
- 191 -

JJPMORGAN MULTI INCOME FUND SSemi--aannual report for the
pperiod ended 31 March 2014
IInvestment Portfolio (Continued) As at 31 March 2014 (Unaudited)
Holding
Fair value
US$
% of net
assets South Africa (Continued) Rep South Africa NoR186
10.5% 12/26 ZAR9,800,000 1,110,551 0.0 Spain (0.5%) Cemex Espana 9.25%
12/05/20-144A USD200,000 226,540 0.0 Cemex Espana 9.25%
12/05/20-RegS USD125,000 141,738 0.0 Cemex Espana 9.875%
30/04/19-144A USD1,125,000 1,354,719 0.0 Spain Kingdom Of 4%
30/04/20 EUR3,300,000 5,181,892 0.1 Spain Kingdom Of 4.85%
31/10/20 EUR4,100,000 6,602,408 0.2 Spain Kingdom Of 5.4%
31/01/23 EUR4,840,000 7,938,347 0.2 Sri Lanka (0.1%) Rep of Sri Lanka
5.875%25/7/22-RegS USD1,610,000 1,637,183 0.1 Rep of Sri Lanka 6.25%
4/10/20-RegS USD1,000,000 1,082,603 0.0 Sweden (0.0%) Skandinaviska VRN
5.471% Perp-144A USD230,000 238,940 0.0 Turkey (0.1%) Rep of Turkey 6%
14/01/41 USD1,650,000 1,645,380 0.1 Rep of Turkey 6.25%
26/09/22 USD1,000,000 1,076,642 0.0 Rep of Turkey 7%
05/06/20 USD550,000 629,255 0.0 Turkey Govt Bond 10.5%
15/01/20 TRY2,700,000 1,313,402 0.0 United Arab Emirates (0.0%) Emirates NBD Tier
VRN5.75%Perp-RegS USD850,000 828,568 0.0 United Kingdom (0.5%) Barclays Bank 7.625%
21/11/22 USD950,000 1,078,009 0.0 CEVA Group 7% 01/03/21-
144A USD300,000 308,258 0.0 Fresnillo PLC 5.5%
13/11/23-RegS USD1,030,000 1,062,379 0.0 INEOS Fin 7.5% 01/05/20-
144A USD4,500,000 5,079,375 0.1 INEOS Fin 8.375%
15/02/19-144A USD2,400,000 2,675,242 0.1 Jaguar Land 5.625%
01/02/23-144A USD150,000 158,531 0.0 Jaguar LD Rover
4.125%15/12/18-144A USD1,232,000 1,279,163 0.1 Royal Bk Scotland 6%
19/12/23 USD343,000 359,315 0.0
(Continued)
Holding
Fair value
US$
% of net
assets Royal Bk Scotland Grp
5.05% 8/1/15 USD30,000 30,818 0.0 Royal Bk Scotland Grp
6.1% 10/06/23 USD2,285,000 2,436,490 0.1 Royal Bk Scotland Grp
6.125% 12/22 USD2,748,000 2,916,026 0.1 Royal Bk Scotland VRN
9.5% 16/03/22 USD483,000 568,888 0.0 Vedanta Res 7.125%
31/05/23-RegS USD965,000 986,522 0.0 Virgin Media Fin 8.375%
15/10/19 USD134,000 149,088 0.0 United States (33.1%) Acadia Healthcare 6.125%
03/21-144A USD416,000 436,963 0.0 Access Mid/ACMP Fin
5.875% 15/04/21 USD968,000 1,057,301 0.0 Access Midstream 4.875%
15/05/23 USD2,329,000 2,397,827 0.1 Access Midstream 6.125%
15/07/22 USD2,028,000 2,206,668 0.1 ACCO Brands 6.75%
30/04/20 USD1,750,000 1,841,438 0.1 ACE Cash Express 11%
01/02/19-144A USD1,490,000 1,303,129 0.0 Activision Blizzard
5.625%9/21-144A USD480,000 513,075 0.0 Activision Blizzard
6.125%9/23-144A USD180,000 196,271 0.0 Actuant Corp 5.625%
15/06/22 USD110,000 116,514 0.0 ADT Corp 3.5% 15/07/22 USD1,164,000 1,030,124 0.0 ADT Corp 4.125%
15/04/19 USD330,000 329,048 0.0 ADT Corp 4.125%
15/06/23 USD1,111,000 1,007,966 0.0 ADT Corp 6.25% 15/10/21-
144A USD2,855,000 3,037,006 0.1 Advanced Micro 6.75%
01/03/19-144A USD835,000 844,811 0.0 Advanced Micro 7.75%
01/08/20 USD640,000 662,507 0.0 AES Corp 4.875%
15/05/23 USD655,000 640,984 0.0 AES Corp 5.5% 15/03/24 USD1,110,000 1,110,077 0.0 AES Corp 7.375% 01/07/21 USD1,100,000 1,278,406 0.0 AES Corp 8% 01/06/20 USD1,000,000 1,214,167 0.0 AES Corp 8% 15/10/17 USD126,000 153,532 0.0 AK Steel 8.75% 01/12/18 USD735,000 847,394 0.0 Alcatel-Lucent USA
4.625% 7/17-144A USD416,000 434,359 0.0 Alcatel-Lucent USA 6.45%
15/03/29 USD1,480,000 1,420,868 0.1 Alcatel-Lucent USA 6.75%
11/20-144A USD1,493,000 1,609,734 0.1 Alcatel-Lucent USA
8.875% 1/20-144A USD685,000 792,673 0.0 Alere Inc 6.5% 15/06/20 USD567,000 604,887 0.0 Alere Inc 7.25% 01/07/18 USD900,000 1,004,894 0.0
- 192 -

JJPMORGAN MULTI INCOME FUND SSemi--aannual report for the
pperiod ended 31 March 2014
IInvestment Portfolio (Continued) As at 31 March 2014 (Unaudited)
Holding
Fair value
US$
% of net
assets United States (Continued) Aleris Intl 7.625%
15/02/18 USD459,000 478,395 0.0 Aleris Intl 7.875%
01/11/20 USD335,000 355,205 0.0 Allbritton Commun 8%
15/05/18 USD1,000,000 1,080,494 0.0 Alliant Techsys 5.25%
01/10/21-144A USD507,000 530,766 0.0 Alliant Techsys 6.875%
15/9/20 USD100,000 109,200 0.0 Allison Trans 7.125%
15/05/19-144A USD850,000 938,922 0.0 Allstate Corp VRN 5.75%
15/08/53 USD11,265,000 11,977,815 0.3 Ally Financial 3.5%
27/01/19 USD3,950,000 3,974,962 0.1 Ally Financial 4.625%
26/06/15 USD1,000 1,052 0.0 Ally Financial 4.75%
10/09/18 USD20,000 21,102 0.0 Ally Financial 5.5%
15/02/17 USD128,000 140,359 0.0 Ally Financial 6.25%
01/12/17 USD4,540,000 5,173,935 0.1 Ally Financial 7.5%
15/09/20 USD6,270,000 7,565,581 0.2 Ally Financial 8% 01/11/31 USD1,895,000 2,396,480 0.1 Ally Financial 8%
15/03/20 USD2,604,000 3,147,657 0.1 Alta Mesa Hldgs/Fin
9.625% 15/10/18 USD337,000 378,249 0.0 AMC Entertain 5.875%
15/02/22-144A USD1,006,000 1,020,060 0.0 AMC Entertainment 9.75%
01/12/20 USD900,000 1,066,500 0.0 American Axle & Mfg
7.75% 15/11/19 USD500,000 592,872 0.0 American Express VRN
6.8% 01/09/66 USD2,675,000 2,931,247 0.1 American Intl Group
6.25% 15/03/37 USD6,745,000 7,169,607 0.2 American Intl Group VRN
8.175% 5/58 USD1,657,000 2,235,476 0.1 Amerigas Finance 6.75%
20/05/20 USD517,000 575,033 0.0 Amerigas Finance 7%
20/05/22 USD1,447,000 1,625,222 0.1 Amerigas Partners 6.5%
20/05/21 USD24,000 26,268 0.0 Amkor Tech 6.375%
01/10/22 USD651,000 696,580 0.0 Amkor Tech 6.625%
01/06/21 USD1,700,000 1,848,688 0.1 Amkor Tech 7.375%
01/05/18 USD195,000 209,533 0.0 Amsouth Bancorp 6.75%
01/11/25 USD295,000 327,855 0.0 Amsted Industries 5%
15/03/22-144A USD335,000 337,373 0.0
(Continued)
Holding
Fair value
US$
% of net
assets Amsurg Corp 5.625%
30/11/20 USD1,020,000 1,080,244 0.0 Anixter Inc 5.625%
01/05/19 USD1,815,000 1,980,052 0.1 Antero Res 5.375%
01/11/21-144A USD370,000 383,208 0.0 Antero Res Fin 6%
01/12/20 USD1,950,000 2,115,750 0.1 Aramark Corp 5.75%
15/03/20 USD2,370,000 2,509,748 0.1 Artesyn Escrow 9.75%
15/10/20-144A USD251,000 250,142 0.0 A-S Merger Sub 7.875%
15/12/20-144A USD750,000 812,555 0.0 Ashland Inc 3% 15/03/16 USD284,000 289,727 0.0 Ashland Inc 3.875%
15/04/18 USD350,000 369,416 0.0 Ashland Inc 4.75%
15/08/22 USD4,075,000 4,018,771 0.1 Ashtead Capital 6.5%
15/07/22-144A USD667,000 734,636 0.0 Atlas Pipe/Fin 4.75%
15/11/21 USD4,250,000 4,124,950 0.1 Atlas Pipe/Fin 5.875%
01/08/23 USD304,000 303,937 0.0 Atlas Pipe/Fin 6.625%
01/10/20 USD275,000 302,672 0.0 Audatex North America
6% 06/21-144A USD2,320,000 2,517,973 0.1 Avaya Inc 10.5% 01/03/21-
144A USD605,000 557,886 0.0 Avaya Inc 7% 01/04/19-
144A USD2,010,000 2,066,883 0.1 Avaya Inc 7% 01/04/19-
RegS USD400,000 410,000 0.0 Avis Budget Car 8.25%
01/19-PO03/14 USD900,000 985,739 0.0 Avis Budget Car/Fin
4.875% 15/11/17 USD161,000 172,037 0.0 Avis Budget Car/Fin 5.5%
01/04/23 USD2,875,000 2,994,054 0.1 Avis Budget Car/Fin 8.25%
15/01/19 USD1,215,000 1,330,748 0.0 Avis Budget Car/Fin 9.75%
15/03/20 USD1,045,000 1,206,561 0.0 Axiall Corp 4.875%
15/05/23-144A USD825,000 822,774 0.0 B&G Foods 4.625%
01/06/21 USD500,000 503,418 0.0 Ball Corp 4% 15/11/23 USD425,000 404,529 0.0 Ball Corp 5% 15/03/22 USD525,000 539,491 0.0 Ball Corp 5.75% 15/05/21 USD275,000 299,580 0.0 Ball Corp 6.75% 15/09/20 USD250,000 271,647 0.0 Bank of America NoK VRN
8% Perp USD13,576,000 15,595,943 0.4 Bank of America NoM VRN
8.125% Perp USD5,946,000 6,977,156 0.2 Bank of America NoU VRN
5.2% Perp USD13,520,000 12,841,747 0.3
- 193 -

JJPMORGAN MULTI INCOME FUND SSemi--aannual report for the
pperiod ended 31 March 2014
IInvestment Portfolio (Continued) As at 31 March 2014 (Unaudited)
Holding
Fair value
US$
% of net
assets United States (Continued) Bank of New York NoD
VRN4.5% 06/23 USD2,600,000 2,392,650 0.1 Bankrate Inc 6.125%
15/08/18-144A USD427,000 456,035 0.0 Basic Energy 7.75%
15/02/19 USD225,000 244,433 0.0 Basic Energy 7.75%
15/10/22 USD1,359,000 1,523,373 0.1 BC Mountain/Fin 7%
01/02/21-144A USD1,034,000 1,040,893 0.0 BE Aerospace 5.25%
01/04/22 USD1,425,000 1,506,439 0.1 BE Aerospace 6.875%
01/10/20 USD2,350,000 2,665,029 0.1 Belden Inc 5.5% 01/09/22-
144A USD2,140,000 2,161,489 0.1 Berry Plastics 9.5%
15/05/18 USD455,000 497,612 0.0 Berry Plastics 9.75%
15/01/21 USD1,617,000 1,917,526 0.1 Big Heart Pet Brands
7.625% 15/2/19 USD1,055,000 1,109,390 0.0 Bill Barrett 7% 15/10/22 USD1,410,000 1,533,336 0.1 Bill Barrett 7.625%
01/10/19 USD758,000 849,434 0.0 BI-LO LLC/Fin 8.625%
15/09/18-144A USD387,000 403,089 0.0 Biomet Inc 6.5% 01/08/20 USD5,212,000 5,669,787 0.2 Biomet Inc 6.5% 01/10/20 USD1,750,000 1,920,625 0.1 Blueline Rental Fin 7%
1/2/19-144A USD780,000 832,975 0.0 Boise Cascade/Fin 6.375%
01/11/20 USD913,000 1,001,162 0.0 Bonanza Creek 6.75%
15/04/21 USD300,000 330,544 0.0 BreitBurn Ener/Fin
7.875% 15/04/22 USD1,050,000 1,174,983 0.0 BreitBurn Ener/Fin
8.625% 15/10/20 USD250,000 282,985 0.0 Briggs & Stratton 6.875%
15/12/20 USD755,000 853,478 0.0 Brightstar Corp 7.25%
01/08/18-144A USD525,000 583,844 0.0 Brightstar Corp 9.5%
01/12/16-RegS USD395,000 442,071 0.0 Building Materials 6.75%
05/21-144A USD1,746,000 1,939,151 0.1 Building Materials 6.75%
05/21-RegS USD375,000 416,484 0.0 Building Materials 7.5%
03/20-144A USD1,400,000 1,513,458 0.1 Bumble Bee Acq 9%
15/12/17-144A USD3,848,000 4,316,494 0.1 Burger King 9.875%
15/10/18 USD575,000 654,125 0.0 Cablevision Systems 8%
15/04/20 USD2,540,000 3,071,142 0.1 Caesars Entertain 11.25%
01/06/17 USD1,679,000 1,675,894 0.1
(Continued)
Holding
Fair value
US$
% of net
assets Caesars Entertain 8%
01/10/20-144A USD3,200,000 3,505,600 0.1 Caesars Entertain 8.5%
15/02/20 USD3,430,000 3,086,304 0.1 Caesars Entertain 9%
15/02/20 USD6,075,000 5,523,694 0.2 Calpine Corp 5.875%
15/01/24-144A USD460,000 470,380 0.0 Calpine Corp 6% 15/01/22-
144A USD817,000 878,275 0.0 Calpine Corp 7.5%
15/02/21-144A USD445,000 493,323 0.0 Calpine Corp 7.5%
15/02/21-RegS USD515,000 566,393 0.0 Calpine Corp 7.875%
15/01/23-144A USD3,466,000 3,951,218 0.1 Calpine Corp 7.875%
31/07/20-144A USD680,000 756,925 0.0 Calpine Corp 7.875%
31/07/20-RegS USD372,000 411,293 0.0 Calumet Spec/Fin 9.375%
01/05/19 USD100,000 117,606 0.0 Cantor Comm Real 7.75%
02/18-144A USD465,000 503,417 0.0 Case New Holland 7.875%
01/12/17 USD975,000 1,171,219 0.0 Casella Waste 7.75%
15/02/19 USD1,030,000 1,079,047 0.0 Catalent Pharma 7.875%
15/10/18 USD1,400,000 1,475,644 0.1 Catamaran Corp 4.75%
15/03/21 USD265,000 268,429 0.0 CB Richard Ellis 6.625%
15/10/20 USD195,000 214,155 0.0 CBRE Services 5%
15/03/23 USD875,000 883,410 0.0 CBS Outdoor Amer
Cap5.25% 2/22-144A USD195,000 201,581 0.0 CBS Outdoor Amer
Cap5.625%2/24-144A USD195,000 201,703 0.0 CCM Merger 9.125%
01/05/19-144A USD390,000 430,178 0.0 CCO Hldgs LLC/Cap 5.25%
15/03/21 USD2,085,000 2,111,019 0.1 CCO Hldgs LLC/Cap 5.25%
30/09/22 USD677,000 672,120 0.0 CCO Hldgs LLC/Cap 6.5%
30/04/21 USD2,471,000 2,699,430 0.1 CCO Hldgs LLC/Cap 7%
15/01/19 USD1,550,000 1,662,332 0.1 CCO Hldgs LLC/Cap
7.375% 01/06/20 USD2,730,000 3,060,366 0.1 CCO Hldgs LLC/Cap
8.125% 30/04/20 USD2,071,000 2,348,111 0.1 CDW LLC/CDW Fin 8.5%
01/04/19 USD3,072,000 3,494,738 0.1 CEC Entertainment 8%
15/02/22-144A USD835,000 870,116 0.0 Cedar Fair/Canada 9.125%
01/08/18 USD30,000 32,444 0.0
- 194 -

JJPMORGAN MULTI INCOME FUND SSemi--aannual report for the
pperiod ended 31 March 2014
IInvestment Portfolio (Continued) As at 31 March 2014 (Unaudited)
Holding
Fair value
US$
% of net
assets United States (Continued) Cedar Fair/Maguum 5.25%
15/03/21 USD210,000 212,621 0.0 Celanese US Hldgs 4.625%
15/11/22 USD1,040,000 1,026,671 0.0 Celanese US Hldgs 6.625%
15/10/18 USD225,000 244,009 0.0 Cemex Finance 6%
01/04/24-144A USD581,000 582,453 0.0 Cemex Finance 9.375%
12/10/22-144A USD6,000,000 7,308,219 0.2 Central Garden 8.25%
01/03/18 USD2,320,000 2,418,745 0.1 Centurylink Inc 5.8%
15/03/22 USD5,000,000 5,129,444 0.1 CenturyLink Inc NoW
6.75% 01/12/23 USD400,000 434,570 0.0 Cenveo Corp 8.875%
01/02/18 USD805,000 827,614 0.0 Ceridian Corp 11%
15/03/21-144A USD341,000 393,921 0.0 Ceridian Corp 8.875%
15/07/19-144A USD485,000 560,894 0.0 Ceridian Corp 8.875%
15/07/19-RegS USD60,000 69,389 0.0 Chemtura Corp 5.75%
15/07/21 USD860,000 902,827 0.0 Chesapeake Energy 3.25%
15/03/16 USD119,000 120,521 0.0 Chesapeake Energy
5.375% 15/06/21 USD300,000 321,269 0.0 Chesapeake Energy 5.75%
15/03/23 USD1,800,000 1,908,388 0.1 Chesapeake Energy
6.125% 15/02/21 USD700,000 767,723 0.0 Chesapeake Energy
6.625% 15/08/20 USD915,000 1,039,119 0.0 Chesapeake Energy
6.875% 15/11/20 USD2,000,000 2,322,326 0.1 Chesapeake Oil Stp Cpn
6.625% 11/19 USD1,640,000 1,755,147 0.1 Chinos Intermediate
7.75% 5/19-144A USD359,000 382,106 0.0 Chiquita Brands 7.875%
01/02/21 USD782,000 884,149 0.0 Chrysler Grp/CG 8%
15/06/19 USD900,000 999,736 0.0 Chrysler Grp/CG 8%
15/06/19-144A USD1,710,000 1,920,634 0.1 Chrysler Grp/CG 8.25%
15/06/21 USD7,675,000 8,880,135 0.2 Chrysler Grp/CG 8.25%
15/06/21-144A USD2,745,000 3,172,591 0.1 CHS/Community 5.125%
01/08/21-144A USD790,000 818,048 0.0 CHS/Community 6.875%
01/02/22-144A USD1,215,000 1,286,276 0.0 CHS/Community Health
5.125% 15/8/18 USD719,000 763,967 0.0
(Continued)
Holding
Fair value
US$
% of net
assets CHS/Community Health
7.125% 15/7/20 USD623,000 687,200 0.0 CHS/Community Health
8% 15/11/19 USD1,050,000 1,188,279 0.0 Cimarex Energy 5.875%
01/05/22 USD1,475,000 1,651,232 0.1 Cincinnati Bell 8.375%
15/10/20 USD368,000 420,017 0.0 Cincinnati Bell 8.75%
15/03/18 USD310,000 324,006 0.0 Cinemark USA 4.875%
01/06/23 USD1,800,000 1,761,750 0.1 Cinemark USA 5.125%
15/12/22 USD840,000 852,795 0.0 CIT Group 4.25% 15/08/17 USD1,513,000 1,581,915 0.1 CIT Group 5% 15/05/17 USD304,000 331,064 0.0 CIT Group 5% 15/08/22 USD4,448,000 4,619,149 0.1 CIT Group 5.25% 15/03/18 USD3,055,000 3,299,336 0.1 CIT Group 5.375%
15/05/20 USD505,000 551,336 0.0 CIT Group 5.5% 15/02/19-
144A USD485,000 524,858 0.0 CIT Group 6.625%
01/04/18-144A USD1,035,000 1,188,309 0.0 CIT Group 6.625%
01/04/18-RegS USD125,000 143,516 0.0 Citgo Petroleum 11.5%
01/07/17-144A USD700,000 772,625 0.0 Citigroup Inc CLN 03/01/17
(1) USD1,650,000 1,250,568 0.0 Citigroup Inc CLN 03/01/17
(3) USD5,405,007 4,251,108 0.1 Citigroup Inc NoD FRN
Perp USD17,805,000 16,876,642 0.4 Citigroup Inc VRN 5.95%
Perp USD16,648,000 16,527,256 0.4 Claire's Stores 6.125%
15/3/20-144A USD754,000 709,056 0.0 Claire's Stores 7.75%
01/06/20-144A USD578,000 465,772 0.0 Claire's Stores 8.875%
15/03/19 USD3,720,000 3,465,890 0.1 Claire's Stores 9%
15/03/19-144A USD4,870,000 5,085,498 0.1 Claire's Stores 9%
15/03/19-RegS USD640,000 668,320 0.0 Claire's Stores 9%
15/03/19-SEPT USD1,100,000 1,149,368 0.0 Clean Harbors 5.125%
01/06/21 USD200,000 206,917 0.0 Clear Channel 11.25%
01/03/21 USD250,000 280,703 0.0 Clear Channel 6.5%
15/11/22-Ser A USD966,000 1,051,478 0.0 Clear Channel 6.5%
15/11/22-Ser B USD11,254,000 12,306,093 0.3 Clear Channel 7.625%
15/03/20-SerA USD485,000 521,909 0.0 Clear Channel 7.625%
15/03/20-SerB USD3,353,000 3,650,078 0.1
- 195 -

JJPMORGAN MULTI INCOME FUND SSemi--aannual report for the
pperiod ended 31 March 2014
IInvestment Portfolio (Continued) As at 31 March 2014 (Unaudited)
Holding
Fair value
US$
% of net
assets United States (Continued) Clear Channel Comm 9%
01/03/21 USD1,285,000 1,356,639 0.1 Clear Channel Comm 9%
15/12/19 USD4,200,000 4,553,850 0.1 Clearwater Paper 4.5%
01/02/23 USD250,000 243,438 0.0 Clearwater Paper 7.125%
01/11/18 USD655,000 714,564 0.0 Clearwire Comm/Fin
14.75%12/16-144A USD800,000 1,097,333 0.0 Cloud Peak Energy 6.375%
15/03/24 USD140,000 144,721 0.0 Cloud Peak Energy 8.5%
15/12/19 USD170,000 187,895 0.0 CNG Hldgs 9.375%
15/05/20-144A USD1,855,000 1,809,881 0.1 CNG Hldgs 9.375%
15/05/20-RegS USD349,000 341,384 0.0 CNH Capital 3.875%
01/11/15 USD200,000 208,729 0.0 CNL Lifestyle Prop 7.25%
15/04/19 USD670,000 725,196 0.0 Coeur Mining 7.875%
01/02/21 USD1,246,000 1,274,814 0.0 Coeur Mining 7.875%
01/02/21-144A USD100,000 102,313 0.0 Commercial Metals
4.875% 15/05/23 USD1,240,000 1,213,405 0.0 Commercial Metals 6.5%
15/07/17 USD340,000 384,014 0.0 Commercial Metals 7.35%
15/08/18 USD725,000 828,425 0.0 Commscope Inc 8.25%
15/01/19-144A USD623,000 685,391 0.0 Community Choice 10.75%
01/05/19 USD622,000 555,005 0.0 Comstock Resources
7.75% 01/04/19 USD950,000 1,051,736 0.0 Comstock Resources 9.5%
15/06/20 USD1,169,000 1,369,596 0.1 Concho Resources 5.5%
01/04/23 USD180,000 191,925 0.0 Concho Resources 5.5%
01/10/22 USD725,000 775,989 0.0 Concho Resources 6.5%
15/01/22 USD1,875,000 2,070,943 0.1 Concho Resources 7%
15/01/21 USD410,000 459,722 0.0 Consol Energy 6.375%
01/03/21 USD1,125,000 1,199,074 0.0 Consol Energy 8%
01/04/17 USD400,000 434,500 0.0 Consol Energy 8.25%
01/04/20 USD775,000 876,331 0.0 Constellation Brands
3.75% 01/05/21 USD201,000 199,618 0.0 Constellation Brands
4.25% 01/05/23 USD374,000 374,078 0.0
(Continued)
Holding
Fair value
US$
% of net
assets Constellation Brands 6%
01/05/22 USD875,000 990,938 0.0 Constellation Brands
7.25% 15/05/17 USD100,000 118,822 0.0 Continental Air 5.5%
29/10/20 USD300,000 321,263 0.0 Continental Air 7.875%
02/07/18 USD1,400,000 597,290 0.0 Continental Air 9.798%
01/04/21 USD1,700,000 1,187,747 0.0 Continental Air NoB 6.25%
11/04/20 USD100,000 104,515 0.0 Corrections Corp 4.125%
01/04/20 USD3,000,000 3,016,875 0.1 Covanta Hldg 5.875%
01/03/24 USD200,000 204,599 0.0 Covanta Hldg 6.375%
01/10/22 USD347,000 379,748 0.0 Crestview DS Merger 10%
1/9/21-144A USD1,595,000 1,785,071 0.1 Crestwood Mids/Fin 6%
15/12/20 USD95,000 101,088 0.0 Crestwood Mids/Fin
6.125% 3/22-144A USD757,000 795,315 0.0 Crestwood Mids/Fin 7.75%
01/04/19 USD333,000 374,209 0.0 Cricket Commun 7.75%
15/10/20 USD1,086,000 1,281,710 0.0 Crosstex Energy/Fin
7.125% 01/06/22 USD1,572,000 1,872,645 0.1 Crown Amer LLC/Cap
4.5% 15/01/23 USD583,000 562,376 0.0 Crown Amer LLC/Cap
6.25% 01/02/21 USD300,000 328,625 0.0 Crown Castle Intl 5.25%
15/01/23 USD1,981,000 2,043,558 0.1 CSC Hldgs 6.75% 15/11/21 USD435,000 500,549 0.0 CSC Hldgs 8.625%
15/02/19 USD1,100,000 1,332,738 0.0 CST Brands 5% 01/05/23 USD1,385,000 1,386,154 0.1 CVR Ref/Coffey Fin 6.5%
01/11/22 USD521,000 561,160 0.0 CyrusOne LP/Fin 6.375%
15/11/22 USD644,000 693,434 0.0 Dana Hldg 5.375%
15/09/21 USD900,000 938,284 0.0 Dana Hldg 6.5% 15/02/19 USD300,000 324,296 0.0 Dana Hldg 6.75% 15/02/21 USD100,000 110,131 0.0 Darling Escrow 5.375%
15/01/22-144A USD611,000 632,958 0.0 DaVita HealthCare Part
5.75% 08/22 USD725,000 777,568 0.0 DaVita HealthCare Part
6.375% 11/18 USD200,000 215,613 0.0 DaVita HealthCare Part
6.625% 11/20 USD1,215,000 1,338,145 0.1 DCP Midstream VRN
5.85% 05/43-144A USD3,535,000 3,380,476 0.1 Dean Foods 7% 01/06/16 USD54,000 60,795 0.0
- 196 -

JJPMORGAN MULTI INCOME FUND SSemi--aannual report for the
pperiod ended 31 March 2014
IInvestment Portfolio (Continued) As at 31 March 2014 (Unaudited)
Holding
Fair value
US$
% of net
assets United States (Continued) Delta Air Lines 4.75%
07/05/20 USD80,000 82,048 0.0 Delta Air Lines 6.875%
7/05/19-144A USD1,344,000 1,405,078 0.1 Deluxe Corp 7% 15/03/19 USD1,615,000 1,751,557 0.1 Denali Borrow 5.625%
15/10/20-144A USD3,938,000 4,094,905 0.1 Denbury Resources 8.25%
15/02/20 USD2,200,000 2,422,356 0.1 Diamondback Ener
7.625% 10/21-144A USD545,000 612,357 0.0 DigitalGlobe Inc 5.25%
1/2/21-144A USD318,000 317,205 0.0 DineEquity Inc 9.5%
30/10/18 USD510,000 579,544 0.0 Dish DBS 5.125% 01/05/20 USD3,525,000 3,741,273 0.1 Dish DBS 5.875% 15/07/22 USD950,000 1,028,248 0.0 Dish DBS 6.75% 01/06/21 USD7,710,000 8,817,927 0.2 Dish DBS 7.875%
01/09/19 USD2,735,000 3,259,009 0.1 DJO Fin 7.75% 15/04/18 USD100,000 108,845 0.0 DJO Fin 8.75% 15/03/18 USD600,000 656,479 0.0 DR Horton 5.625%
15/01/16 USD100,000 107,453 0.0 Dreamworks Ani 6.875%
15/08/20-144A USD460,000 502,079 0.0 DuPont Fabros 5.875%
15/09/21 USD692,000 733,710 0.0 Dycom Inv 7.125%
15/01/21 USD585,000 639,984 0.0 Dynegy Inc 5.875%
01/06/23-144A USD1,091,000 1,090,545 0.0 E*Trade Financial 6.375%
15/11/19 USD1,005,000 1,120,837 0.0 El Paso 7.25% 01/06/18 USD400,000 463,347 0.0 Embarq Corp 7.995%
01/06/36 USD6,368,000 6,887,947 0.2 Endo Finance 5.75%
15/01/22-144A USD525,000 547,418 0.0 Endo Health Solutions 7%
15/07/19 USD150,000 164,433 0.0 Endo Health Solutions 7%
15/12/20 USD313,000 345,961 0.0 Endo Health
Solutions7.25% 15/01/22 USD560,000 619,084 0.0
Energy Transfer 5.875% 15/01/24 USD1,250,000 1,293,229 0.0
Energy Transfer 7.5% 15/10/20 USD625,000 737,370 0.0
Energy XXI Gulf 7.5% 15/12/21-144A USD975,000 1,038,172 0.0
Energy XXI Gulf 7.75% 15/06/19 USD60,000 65,582 0.0
Energy XXI Gulf 9.25% 15/12/17 USD150,000 167,999 0.0
Entegris Inc 6% 01/04/22-144A USD285,000 290,700 0.0
(Continued)
Holding
Fair value
US$
% of net
assets Enterprise Prod NoB VRN
7.034% 1/68 USD2,345,000 2,685,130 0.1 Enterprise Products VRN
7% 01/06/67 USD1,115,000 1,196,767 0.0 Envision Healthcare
8.125% 01/06/19 USD276,000 302,968 0.0 EP Energy/EP Fin 6.875%
01/05/19 USD718,000 796,008 0.0 EP Energy/EP Fin 9.375%
01/05/20 USD5,309,000 6,345,914 0.2 EP Energy/Everest 7.75%
01/09/22 USD1,735,000 1,955,526 0.1 Epicor Software 8.625%
01/05/19 USD775,000 874,539 0.0 Equinix Inc 4.875%
01/04/20 USD370,000 388,269 0.0 Esterline Technologies 7%
01/08/20 USD150,000 163,938 0.0 EV Energy Partners 8%
15/04/19 USD1,100,000 1,187,572 0.0 Exterran Partners 6%
01/10/22-144A USD580,000 570,552 0.0 Felcor Lodging 5.625%
01/03/23 USD350,000 357,055 0.0 Felcor Lodging 6.75%
01/06/19 USD950,000 1,042,625 0.0 Fidelity & Guaranty
6.375%4/21-144A USD1,114,000 1,224,704 0.0 Fifth Third Bancorp VRN
5.1% Perp USD7,420,000 6,921,005 0.2 First Cash Fin 6.75%
01/04/21-144A USD250,000 256,313 0.0 First Data 10.625%
15/06/21 USD425,000 482,958 0.0 First Data 11.25% 15/01/21 USD482,000 571,622 0.0 First Data 11.75% 15/08/21 USD2,046,000 2,182,244 0.1 First Data 12.625%
15/01/21 USD1,720,000 2,101,846 0.1 First Data 6.75% 01/11/20-
144A USD6,055,000 6,694,559 0.2 First Data 6.75% 01/11/20-
RegS USD380,000 420,138 0.0 First Data 7.375%
15/06/19-144A USD825,000 908,094 0.0 First Data 7.375%
15/06/19-RegS USD21,000 23,140 0.0 First Data 8.25% 15/01/21-
144A USD6,244,000 6,853,701 0.2 First Data 8.25% 15/01/21-
RegS USD243,000 267,335 0.0 First Data 8.75% 15/01/22-
144A USD5,260,000 5,831,842 0.2 First Data 8.75% 15/01/22-
RegS USD235,000 260,548 0.0 First Data 8.875%
15/08/20-144A USD1,750,000 1,958,402 0.1 First Data 8.875%
15/08/20-RegS USD100,000 111,909 0.0 First Data Hldgs 14.5%
24/9/19-144A USD1,178,713 1,116,831 0.0
- 197 -

JJPMORGAN MULTI INCOME FUND SSemi--aannual report for the
pperiod ended 31 March 2014
IInvestment Portfolio (Continued) As at 31 March 2014 (Unaudited)
Holding
Fair value
US$
% of net
assets United States (Continued) First Data Hldgs 14.5%
9/19-144A-AC USD56,496 53,530 0.0 Forest Lab 4.375%
01/02/19-144A USD620,000 658,621 0.0 Forest Lab 4.875%
15/02/21-144A USD350,000 372,969 0.0 Freescale Semicon 5%
15/05/21-144A USD415,000 431,197 0.0 Freescale Semicon 6%
15/01/22-144A USD421,000 454,680 0.0 Freescale Semicon 8.05%
01/02/20 USD171,000 189,539 0.0 Fresenius Medi 5.625%
31/07/19-144A USD1,325,000 1,436,399 0.1 Fresenius Medi 5.625%
31/07/19-RegS USD140,000 151,813 0.0 Fresenius Medi 5.75%
15/02/21-144A USD550,000 587,129 0.0 Fresenius Medi 5.75%
15/02/21-RegS USD290,000 309,577 0.0 Fresenius Medi 5.875%
31/01/22-144A USD830,000 894,152 0.0 Fresenius Medi 5.875%
31/01/22-RegS USD12,000 12,838 0.0 Fresenius Medi 6.5%
15/09/18-144A USD275,000 308,157 0.0 Frontier Commun 7.625%
15/04/24 USD21,000 22,740 0.0 Frontier Commun 8.5%
15/04/20 USD625,000 749,119 0.0 Frontier Commun 8.75%
15/04/22 USD400,000 474,236 0.0 Frontier Commun 9.25%
01/07/21 USD575,000 696,109 0.0 FTI Consulting 6.75%
01/10/20 USD370,000 410,238 0.0 Gannett Co 5.125%
15/07/20-144A USD350,000 363,899 0.0 Gannett Co 6.375%
15/10/23-144A USD800,000 874,358 0.0 GCI Inc 8.625% 15/11/19 USD1,350,000 1,490,498 0.1 Gencorp Inc 7.125%
15/03/21 USD131,000 142,412 0.0 General Cable Stp Cp
6.5%10/22-144A USD1,350,000 1,420,875 0.1 General Elec Cap NoB VRN
6.25% Perp USD16,600,000 18,155,858 0.5 General Elec Cap NoC VRN
5.25% Perp USD11,400,000 11,295,738 0.3 General Motors 4.875%
02/10/23-144A USD5,440,000 5,725,883 0.2 General Motors Fin 2.75%
15/05/16 USD129,000 132,551 0.0 General Motors Fin 3.25%
15/05/18 USD1,835,000 1,882,927 0.1 General Motors Fin 4.25%
15/05/23 USD101,000 101,245 0.0 Genesis Energy/Fin 5.75%
15/02/21 USD325,000 337,190 0.0
(Continued)
Holding
Fair value
US$
% of net
assets Genesis Energy/Fin
7.875% 15/12/18 USD280,000 308,671 0.0 GenOn Energy 7.875%
15/06/17 USD575,000 593,915 0.0 GenOn Energy 9.5%
15/10/18 USD1,125,000 1,213,559 0.0 GenOn Energy 9.875%
15/10/20 USD1,565,000 1,667,991 0.1 GEO Group 6.625%
15/02/21 USD600,000 649,182 0.0 Glatfelter 5.375%
15/10/20 USD220,000 232,085 0.0 Goldman Sachs Cap II FRN
01/06/43 USD11,200,000 8,744,089 0.2 Goodman Net Stp Cpn
12.125% 1/7/18 USD840,000 921,113 0.0 Goodman Net Stp
Cpn12.375%7/18-144A USD604,000 662,701 0.0 Goodyear Tire 6.5%
01/03/21 USD215,000 236,706 0.0 Goodyear Tire 7%
15/05/22 USD2,944,000 3,383,065 0.1 Goodyear Tire 8.25%
15/08/20 USD339,000 381,697 0.0 Goodyear Tire 8.75%
15/08/20 USD1,100,000 1,316,066 0.0 Graphic Packaging 4.75%
15/04/21 USD571,000 584,313 0.0 Graphic Packaging 7.875%
01/10/18 USD452,000 499,743 0.0 Graton Economic 9.625%
1/9/19-144A USD675,000 777,987 0.0 Graton Economic 9.625%
1/9/19-RegS USD88,000 101,316 0.0 Gray Television 7.5%
01/10/20 USD1,660,000 1,863,350 0.1 Great Lakes Dredge
7.375% 01/02/19 USD800,000 849,833 0.0 Griffon Corp 5.25%
01/03/22-144A USD850,000 845,839 0.0 Guitar Center 6.5%
15/04/19-144A USD615,000 611,925 0.0 Gymboree Corp 9.125%
01/12/18 USD265,000 233,835 0.0 H&E Equipment Serv 7%
01/09/22 USD1,484,000 1,643,777 0.1 Halcon Res 8.875%
15/05/21 USD1,750,000 1,876,480 0.1 Halcon Res 9.25%
15/02/22-144A USD960,000 1,012,393 0.0 Halcon Res 9.75%
15/07/20-144A USD371,000 408,417 0.0 Hanesbrands Inc 6.375%
15/12/20 USD800,000 891,158 0.0 Harland Clarke 9.75%
01/08/18-144A USD2,055,000 2,291,325 0.1 Harland Escrow 9.25%
01/03/21-144A USD480,000 491,353 0.0 Harron Comm 9.125%
01/04/20-144A USD195,000 229,247 0.0
- 198 -

JJPMORGAN MULTI INCOME FUND SSemi--aannual report for the
pperiod ended 31 March 2014
IInvestment Portfolio (Continued) As at 31 March 2014 (Unaudited)
Holding
Fair value
US$
% of net
assets United States (Continued) Hartford Fin VRN 8.125%
15/06/38 USD730,000 865,648 0.0 Hawk Acquisition
4.25%15/10/20-144A USD4,160,000 4,158,816 0.1 HCA Hldgs 6.25% 15/02/21 USD630,000 680,816 0.0 HCA Hldgs 7.75% 15/05/21 USD5,150,000 5,829,764 0.2 HCA Inc 3.75% 15/03/19 USD827,000 834,081 0.0 HCA Inc 4.75% 01/05/23 USD770,000 778,502 0.0 HCA Inc 5% 15/03/24 USD729,000 732,341 0.0 HCA Inc 5.875% 15/03/22 USD1,160,000 1,254,626 0.0 HCA Inc 6.5% 15/02/20 USD7,450,000 8,407,222 0.2 HCA Inc 7.25% 15/09/20 USD700,000 761,897 0.0 HCA Inc 7.5% 15/02/22 USD7,597,000 8,772,952 0.2 HCA Inc 7.875% 15/02/20 USD130,000 140,014 0.0 HCA Inc 8% 01/10/18 USD900,000 1,102,950 0.0 HCA Inc 8.5% 15/04/19 USD525,000 569,851 0.0 HCA Inc No1 5.875%
01/05/23 USD1,185,000 1,252,520 0.0 HD Supply 7.5% 15/07/20 USD842,000 950,232 0.0 HD Supply 8.125%
15/04/19 USD4,585,000 5,285,088 0.1 Headwaters Inc 7.25%
15/01/19-144A USD520,000 552,529 0.0 Healthcare Tech 7.375%
1/9/18-144A USD387,000 397,356 0.0 Healthsouth Corp 7.75%
15/09/22 USD633,000 698,617 0.0 Hecla Mining 6.875%
01/05/21 USD1,792,000 1,789,573 0.1 Hertz Corp 4.25%
01/04/18 USD67,000 70,434 0.0 Hertz Corp 5.875%
15/10/20 USD2,550,000 2,794,809 0.1 Hertz Corp 6.25%
15/10/22 USD1,294,000 1,425,733 0.1 Hertz Corp 6.75%
15/04/19 USD100,000 110,740 0.0 Hexion US Fin 6.625%
15/04/20 USD2,440,000 2,612,588 0.1 Hexion US/Nova Scot
8.875% 01/02/18 USD200,000 211,458 0.0 Hiland Part/Fin 7.25%
01/10/20-144A USD1,809,000 2,028,341 0.1 Hiland Part/Fin 7.25%
01/10/20-RegS USD66,000 74,333 0.0 Hilcorp Energy/Fin 7.625%
4/21-144A USD1,750,000 1,973,775 0.1 Hilcorp Energy/Fin 7.625%
4/21-RegS USD425,000 479,345 0.0 Hilcorp Energy/Fin 8%
15/02/20-144A USD450,000 492,950 0.0 Hilton Worldwide 5.625%
10/21-144A USD800,000 860,250 0.0 Holly Energy 6.5%
01/03/20 USD105,000 112,188 0.0 Hologic Inc 6.25%
01/08/20 USD3,155,000 3,396,820 0.1 Hospira Inc 5.2% 12/08/20 USD127,000 136,590 0.0
(Continued)
Holding
Fair value
US$
% of net
assets Hughes Satellite 6.5%
15/06/19 USD100,000 112,182 0.0 Huntsman Intl 4.875%
15/11/20 USD3,060,000 3,158,079 0.1 Huntsman Intl 8.625%
15/03/21 USD600,000 675,044 0.0 IAC/InterActive 4.875%
30/11/18 USD165,000 175,486 0.0 Iasis Healthcare/Cap
8.375% 15/5/19 USD994,000 1,094,018 0.0 Icahn Entp/Fin 5.875%
01/02/22-144A USD1,230,000 1,261,096 0.0 IGate Corp 4.75%
15/04/19-144A USD474,000 476,370 0.0 IGate Corp 9% 01/05/16 USD385,000 419,650 0.0 Igloo Hldgs 8.25%
15/12/17-144A USD758,000 794,589 0.0 ILFC E-Capital FRN
21/12/65-144A USD3,616,000 3,459,036 0.1 ILFC E-Capital FRN
21/12/65-RegS USD1,185,000 1,133,561 0.0 IMS Health 6% 01/11/20-
144A USD1,665,000 1,794,038 0.1 Infor US 11.5% 15/07/18 USD600,000 709,258 0.0 Infor US 9.375% 01/04/19 USD2,298,000 2,704,459 0.1 ING US VRN 5.65%
15/05/53 USD7,245,000 7,346,440 0.2 Ingles Markets 5.75%
15/06/23 USD975,000 996,538 0.0 Interactive Data 10.25%
01/08/18 USD200,000 219,667 0.0 Intl Lease Fin 4.625%
15/04/21 USD312,000 319,777 0.0 Intl Lease Fin 5.875%
01/04/19 USD3,250,000 3,654,219 0.1 Intl Lease Fin 6.25%
15/05/19 USD3,660,000 4,131,352 0.1 Intl Lease Fin 8.25%
15/12/20 USD3,770,000 4,653,050 0.1 Intl Lease Fin 8.625%
15/01/22 USD1,860,000 2,320,253 0.1 Intl Lease Fin 8.75%
15/03/17 USD350,000 412,259 0.0 Intl Wire Group 8.5%
15/10/17-144A USD1,110,000 1,255,055 0.0 Intl Wire Group 8.5%
15/10/17-RegS USD91,000 102,778 0.0 inVentiv Health 11%
15/08/18-144A USD775,000 728,005 0.0 inVentiv Health 9%
15/01/18-144A USD375,000 411,281 0.0 inVentiv Health Stp 11%
08/18-144A USD1,120,000 1,049,284 0.0 inVentiv Health Stp
11%8/18-RegS USD275,000 258,324 0.0 Iron Mountain 7.75%
01/10/19 USD375,000 427,969 0.0 Iron Mountain 8.375%
15/08/21 USD137,000 146,960 0.0
- 199 -

JJPMORGAN MULTI INCOME FUND SSemi--aannual report for the
pperiod ended 31 March 2014
IInvestment Portfolio (Continued) As at 31 March 2014 (Unaudited)
Holding
Fair value
US$
% of net
assets United States (Continued) Isle of Capri 5.875%
15/03/21 USD963,000 982,524 0.0 Isle of Capri 8.875%
15/06/20 USD525,000 584,786 0.0 iStar Fin 9% 01/06/17 USD216,000 259,740 0.0 J Crew Group 8.125%
01/03/19 USD5,250,000 5,499,102 0.2 Jabil Circuit 4.7%
15/09/22 USD197,000 195,713 0.0 Jaguar Hldg 9.375%
15/10/17-144A USD130,000 142,316 0.0 Jarden Corp 6.125%
15/11/22 USD3,075,000 3,369,613 0.1 Jarden Corp 7.5%
01/05/17 USD1,050,000 1,244,250 0.0 JB Poindexter 9%
01/04/22-144A USD250,000 278,750 0.0 JB Poindexter 9%
01/04/22-RegS USD350,000 389,375 0.0 JBS USA LLC/Fin 7.25%
01/06/21 USD50,000 54,708 0.0 JBS USA LLC/Fin 7.25%
01/06/21-144A USD1,540,000 1,677,317 0.1 JBS USA LLC/Fin 8.25%
01/02/20-144A USD2,060,000 2,284,025 0.1 JBS USA LLC/Fin 8.25%
01/02/20-RegS USD150,000 167,063 0.0 Jefferies Fin 6.875%
15/04/22-144A USD410,000 413,588 0.0 Jefferies Fin 7.375%
01/04/20-144A USD379,000 411,926 0.0 JM Huber 9.875%
01/11/19-144A USD755,000 903,090 0.0 JMC Steel Group 8.25%
15/03/18-144A USD660,000 676,596 0.0 Jones Energy/Fin 6.75%
1/4/22-144A USD450,000 459,585 0.0 Jurassic Hldgs 6.875%
15/02/21-144A USD600,000 622,052 0.0 K Hovnanian Entp 11.875%
15/10/15 USD850,000 1,011,574 0.0 K Hovnanian Entp 7%
15/01/19-144A USD163,000 169,674 0.0 K Hovnanian Entp
7.25%15/10/20-144A USD378,000 423,788 0.0 K Hovnanian Entp 9.125%
10/20-144A USD290,000 334,870 0.0 Kaiser Aluminum 8.25%
01/06/20 USD601,000 694,896 0.0 KB Home 4.75% 15/05/19 USD548,000 552,616 0.0 KB Home 8% 15/03/20 USD150,000 171,192 0.0 Kennedy-Wilson 5.875%
01/04/24 USD498,000 498,569 0.0 Key Energy Serv 6.75%
01/03/21 USD1,972,000 2,072,942 0.1 Kinder Morgan 5%
15/02/21-144A USD524,000 527,421 0.0 Kinder Morgan 5.625%
15/11/23-144A USD524,000 532,106 0.0
(Continued)
Holding
Fair value
US$
% of net
assets Kinetics Concept 10.5%
01/11/18 USD1,350,000 1,618,313 0.1 L Brands 5.625% 15/10/23 USD850,000 907,942 0.0 L Brands 6.625% 01/04/21 USD1,910,000 2,211,197 0.1 Lamar Media 5% 01/05/23 USD120,000 122,800 0.0 Laredo Petroleum 7.375%
01/05/22 USD678,000 775,109 0.0 Lender Processing 5.75%
15/04/23 USD305,000 331,435 0.0 Lennar Corp 12.25%
01/06/17 USD400,000 530,653 0.0 Lennar Corp 4.5%
15/06/19 USD602,000 614,612 0.0 Lennar Corp 6.95%
01/06/18 USD712,000 819,275 0.0 Level 3 Comm 11.875%
01/02/19 USD4,930,000 5,869,781 0.2 Level 3 Comm 8.875%
01/06/19 USD625,000 705,990 0.0 Level 3 Fin 6.125%
15/01/21-144A USD2,594,000 2,800,817 0.1 Level 3 Fin 7% 01/06/20 USD955,000 1,060,846 0.0 Level 3 Fin 8.125%
01/07/19 USD2,933,000 3,293,209 0.1 Level 3 Fin 8.625%
15/07/20 USD963,000 1,103,548 0.0 Level 3 Fin FRN 15/01/18-
144A USD250,000 257,428 0.0 Libbey Glass 6.875%
15/05/20-PO3/14 USD103,000 115,094 0.0 Liberty Interactive 8.25%
01/02/30 USD360,000 391,950 0.0 Liberty Mutual 7.8%
15/03/37-144A USD1,685,000 1,851,281 0.1 Liberty Mutual 7.8%
15/03/37-RegS USD750,000 824,013 0.0 Liberty Mutual VRN
10.75% 6/58-RegS USD50,000 76,848 0.0 Liberty Tire 11% 01/10/16-
144A USD380,000 391,875 0.0 Lifepoint Hospitals 5.5%
12/21-144A USD410,000 434,691 0.0 Lifepoint Hospitals 6.625%
01/10/20 USD500,000 559,063 0.0 LIN Television 8.375%
15/04/18 USD500,000 549,115 0.0 Linn Energy 7.75%
01/02/21 USD2,525,000 2,723,616 0.1 Linn Energy Stp Cpn
7.25%11/19-144A USD1,850,000 1,979,885 0.1 Live Nation Enter 7%
01/09/20-144A USD305,000 335,551 0.0 Louisiana Pacific 7.5%
01/06/20 USD317,000 359,003 0.0 LSB Ind 7.75% 01/08/19-
144A USD320,000 349,733 0.0 Lynx I 5.375% 15/04/21-
144A USD2,101,000 2,219,043 0.1 M/I Homes 8.625%
15/11/18 USD880,000 979,284 0.0
- 200 -

JJPMORGAN MULTI INCOME FUND SSemi--aannual report for the
pperiod ended 31 March 2014
IInvestment Portfolio (Continued) As at 31 March 2014 (Unaudited)
Holding
Fair value
US$
% of net
assets United States (Continued) MagnaChip Semicon
6.625% 15/07/21 USD995,000 1,009,099 0.0 Manitowoc Co 8.5%
01/11/20 USD970,000 1,129,232 0.0 Marina District Fin 9.875%
15/08/18 USD1,250,000 1,359,865 0.1 Mariposa Bor/Merger
8%15/10/21-144A USD1,169,000 1,330,647 0.0 Markwest Energy 4.5%
15/07/23 USD220,000 214,968 0.0 Markwest Energy 5.5%
15/02/23 USD1,250,000 1,293,351 0.0 Markwest Energy 6.25%
15/06/22 USD1,259,000 1,379,960 0.1 Markwest Energy 6.75%
01/11/20 USD75,000 83,484 0.0 Martin Midst/Fin 7.25%
15/02/21 USD244,000 258,205 0.0 Martin Midst/Fin 7.25%
15/2/21-144A USD400,000 423,286 0.0 Masco Corp 5.95%
15/03/22 USD75,000 82,336 0.0 Masco Corp 7.125%
15/03/20 USD10,000 11,659 0.0 Mastec Inc 4.875%
15/03/23 USD335,000 329,071 0.0 McGraw-Hill Global 9.75%
4/21-144A USD831,000 983,696 0.0 Mediacom LLC/Cap
9.125% 15/08/19 USD815,000 879,722 0.0 Memorial Res Dev 10%
15/12/18-144A USD405,000 431,888 0.0 Meritage Homes 7%
01/04/22 USD458,000 520,975 0.0 Metlife Inc 6.4% 15/12/36 USD11,565,000 12,421,067 0.3 MetroPCS Wireless 6.625%
15/11/20 USD2,246,000 2,454,343 0.1 MetroPCS Wireless 7.875%
01/09/18 USD550,000 589,555 0.0 MGM Resorts Intl 11.375%
01/03/18 USD1,360,000 1,782,181 0.1 MGM Resorts Intl 6.75%
01/10/20 USD4,855,000 5,540,769 0.2 MGM Resorts Intl 7.75%
15/03/22 USD3,979,000 4,630,202 0.1 MGM Resorts Intl 8.625%
1/2/19-144A USD3,890,000 4,713,455 0.1 Michael Foods Group
9.75% 15/07/18 USD1,400,000 1,527,196 0.1 Michaels Stores 7.75%
01/11/18 USD700,000 771,604 0.0 Micron Tech 5.875%
15/02/22-144A USD270,000 285,454 0.0 Midstates Petroleum
10.75% 01/10/20 USD101,000 117,286 0.0 Milacron/Mcron Fin 7.75%
02/21-144A USD1,165,000 1,269,988 0.0 MPH Acquisition 6.625%
1/4/22-144A USD2,200,000 2,255,000 0.1
(Continued)
Holding
Fair value
US$
% of net
assets MPT Operating Part
6.375% 15/02/22 USD40,000 43,133 0.0 MTR Gaming Group 11.5%
01/08/19 USD415,000 472,754 0.0 Multiplan Inc 9.875%
01/09/18-144A USD1,815,000 1,983,436 0.1 Multiplan Inc 9.875%
01/09/18-RegS USD200,000 218,560 0.0 Murphy Oil USA 6%
15/08/23-144A USD245,000 254,269 0.0 Mustang Merger 8.5%
15/08/21-144A USD33,000 36,460 0.0 Mylan Inc 7.875%
15/07/20-144A USD550,000 627,327 0.0 NAI Entertain/Fin 5%
01/08/18-144A USD297,000 309,870 0.0 National Mentor 12.5%
15/02/18-144A USD1,235,000 1,335,430 0.0 National Mentor 12.5%
15/02/18-RegS USD360,000 389,725 0.0 Nationstar Mort/Cap
7.875% 01/10/20 USD795,000 840,216 0.0 Nationstar Mort/Cap
9.625% 01/05/19 USD150,000 173,266 0.0 Natl Financial Part 9%
15/7/21-144A USD340,000 370,345 0.0 NCR Corp 5% 15/07/22 USD166,000 169,020 0.0 NCR Escrow 5.875%
15/12/21-144A USD80,000 85,545 0.0 NCR Escrow 6.375%
15/12/23-144A USD205,000 221,295 0.0 Netflix Inc 5.375%
01/02/21 USD457,000 483,944 0.0 Netflix Inc 5.75%
01/03/24-144A USD740,000 773,757 0.0 Neuberger Berman
5.625%15/3/20-144A USD505,000 537,273 0.0 New Albertson's 6.625%
01/06/28 USD16,000 12,153 0.0 New Albertsons 7.45%
01/08/29 USD812,000 667,802 0.0 New Albertsons 7.75%
15/06/26 USD417,000 351,366 0.0 New Albertsons 8%
01/05/31 USD691,000 603,335 0.0 New Albertsons 8.7%
01/05/30 USD20,000 17,825 0.0 Newfield Exploration
5.625% 1/07/24 USD800,000 844,098 0.0 Newfield Exploration
5.75% 30/01/22 USD2,200,000 2,370,286 0.1 Newfield Exploration
6.875% 1/2/20 USD100,000 107,146 0.0 Newfield Exploration
7.125% 15/5/18 USD100,000 106,336 0.0 Nexstar Broad 6.875%
15/11/20 USD2,933,000 3,226,045 0.1 NFR Energy/Fin 9.75%
15/02/17 USD200,000 211,546 0.0
- 201 -

JJPMORGAN MULTI INCOME FUND SSemi--aannual report for the
pperiod ended 31 March 2014
IInvestment Portfolio (Continued) As at 31 March 2014 (Unaudited)
Holding
Fair value
US$
% of net
assets United States (Continued) NGL Energy Par/Fin
6.875%10/21-144A USD563,000 603,368 0.0 Nielsen Finance 4.5%
01/10/20 USD655,000 677,925 0.0 Nielsen Finance 5%
15/04/22-144A USD442,000 443,105 0.0 NII Capital 7.625%
01/04/21 USD3,486,000 1,117,699 0.0 Nortek Inc 8.5% 15/04/21 USD740,000 856,129 0.0 Northwest Air No07-1
7.027% 1/11/19 USD2,560,000 2,471,265 0.1 Northwest Air No07-1
8.028% 1/11/17 USD335,000 180,535 0.0 NRG Energy 6.25%
15/07/22-144A USD425,000 441,751 0.0 NRG Energy 6.625%
15/03/23 USD2,923,000 3,043,131 0.1 NRG Energy 7.625%
15/01/18 USD1,260,000 1,436,273 0.1 NRG Energy 7.875%
15/05/21 USD267,000 301,323 0.0 NRG Energy 8.25%
01/09/20 USD1,000,000 1,107,563 0.0 NRG Energy 8.5%
15/06/19 USD75,000 80,832 0.0 Nuance Commun 5.375%
15/08/20-144A USD580,000 581,170 0.0 Nuance Commun 5.375%
15/08/20-RegS USD59,000 59,119 0.0 Oasis Petroleum 6.875%
15/3/22-144A USD920,000 1,001,187 0.0 Oil States Intl 5.125%
15/01/23 USD761,000 860,662 0.0 Oil States Intl 6.5%
01/06/19 USD1,125,000 1,211,936 0.0 Olin Corp 5.5% 15/08/22 USD1,675,000 1,724,715 0.1 Omega Healthcare 5.875%
15/03/24 USD94,000 98,961 0.0 Omnicare Inc 7.75%
01/06/20 USD286,000 321,988 0.0 Omnova Solutions 7.875%
01/11/18 USD175,000 192,992 0.0 Onex USI Acq 7.75%
15/01/21-144A USD1,382,000 1,460,189 0.1 Oppenheimer 8.75%
15/04/18-PO 03/14 USD46,000 50,742 0.0 Oppenheimer Hldgs 8.75%
15/04/18 USD159,000 175,391 0.0 Oshkosh Corp 8.5%
01/03/20 USD900,000 994,763 0.0 Paetec Hldg 9.875%
01/12/18 USD285,000 322,169 0.0 Par Pharma Cos 7.375%
15/10/20 USD360,000 401,116 0.0 Parker Drilling 6.75%
15/07/22-144A USD270,000 282,319 0.0 Parker Drilling 7.5%
01/08/20 USD1,229,000 1,327,320 0.0
(Continued)
Holding
Fair value
US$
% of net
assets Party City 8.875%
01/08/20 USD2,701,000 3,051,567 0.1 PC Nextco/Fin 8.75%
15/08/19-144A USD667,000 697,965 0.0 Peabody Energy 6%
15/11/18 USD520,000 560,473 0.0 Peabody Energy 6.25%
15/11/21 USD3,340,000 3,436,141 0.1 Penske Automotive 5.75%
01/10/22 USD86,000 92,578 0.0 Petrologistics LP 6.25%
01/04/20 USD637,000 658,499 0.0 PHI Inc 5.25% 15/03/19-
144A USD419,000 424,107 0.0 Pilgrim's Pride 7.875%
15/12/18 USD2,325,000 2,560,839 0.1 Pioneer Energy 6.125%
15/03/22-144A USD277,000 281,122 0.0 Pioneer Energy 9.875%
15/03/18 USD430,000 455,690 0.0 Pittsburgh Glass 8%
15/11/18-144A USD488,000 545,882 0.0 Plains Exploration 6.5%
15/11/20 USD3,994,000 4,531,138 0.1 Plains Exploration 6.75%
01/02/22 USD254,000 285,915 0.0 Plains Exploration 6.875%
15/02/23 USD692,000 782,528 0.0 PNC Financial NoR VRN
4.85% Perp USD7,160,000 6,828,253 0.2 PNC Financial VRN 6.75%
Perp USD13,058,000 14,347,478 0.4 PNK Fin 6.375% 01/08/21-
144A USD775,000 819,078 0.0 Polymer Group 7.75%
01/02/19 USD544,000 588,318 0.0 PolyOne Corp 5.25%
15/03/23 USD2,402,000 2,422,967 0.1 PolyOne Corp 7.375%
15/09/20 USD1,450,000 1,596,425 0.1 Post Hldgs 6.75%
01/12/21-144A USD1,704,000 1,853,313 0.1 Post Hldgs 7.375%
15/02/22 USD3,008,000 3,284,521 0.1 PPL Cap Fdg NoA VRN
6.7% 30/03/67 USD1,990,000 2,005,666 0.1 Prestige Brands 5.375%
12/21-144A USD550,000 572,372 0.0 Prestige Brands 8.125%
01/02/20 USD271,000 308,545 0.0 Prince Mineral 11.5%
15/12/19-144A USD250,000 288,858 0.0 Prudential Fin VRN 5.2%
15/03/44 USD8,310,000 8,278,468 0.2 Prudential Fin VRN
5.625% 15/06/43 USD10,721,000 11,208,470 0.3 Prudential Fin VRN
5.875% 15/09/42 USD6,365,000 6,661,127 0.2 PVH Corp 4.5% 15/12/22 USD105,000 105,092 0.0
- 202 -

JJPMORGAN MULTI INCOME FUND SSemi--aannual report for the
pperiod ended 31 March 2014
IInvestment Portfolio (Continued) As at 31 March 2014 (Unaudited)
Holding
Fair value
US$
% of net
assets United States (Continued) QEP Resources 5.25%
01/05/23 USD1,007,000 1,023,993 0.0 QEP Resources 5.375%
01/10/22 USD2,250,000 2,331,844 0.1 QEP Resources 6.875%
01/03/21 USD500,000 555,026 0.0 Quapaw Downstream
10.5% 1/7/19-144A USD332,000 362,295 0.0 Quapaw Downstream
10.5% 1/7/19-RegS USD175,000 192,719 0.0 Quiksilver Inc/QS 7.875%
08/18-144A USD270,000 297,844 0.0 QVC Inc 7.375% 15/10/20-
RegS USD300,000 335,764 0.0 Qwest Capital Fdg 6.875%
15/07/28 USD196,000 192,814 0.0 Qwest Capital Fdg 7.75%
15/02/31 USD1,333,000 1,327,097 0.0 Qwest Corp 7.25%
15/09/25 USD210,000 240,199 0.0 Radiation Therapy 8.875%
15/01/17 USD150,000 161,629 0.0 Radio One 9.25%
15/02/20-144A USD310,000 332,742 0.0 Radio Systems 8.375%
01/11/19-144A USD2,637,000 3,012,498 0.1 Rain CII Carbon 8%
01/12/18-144A USD650,000 694,146 0.0 Rain CII Carbon 8.25%
15/01/21-144A USD600,000 627,838 0.0 Range Resources 5%
15/03/23 USD277,000 280,770 0.0 Range Resources 6.75%
01/08/20 USD850,000 927,563 0.0 RCN Telecom/Cap 8.5%
15/08/20-144A USD500,000 534,299 0.0 Realogy Corp 7.625%
15/01/20-144A USD550,000 619,470 0.0 Regal Entertainment
5.75% 01/02/25 USD967,000 957,411 0.0 Regal Entertainment
5.75% 15/03/22 USD935,000 970,861 0.0 Regency Energy/Fin 4.5%
01/11/23 USD333,000 316,766 0.0 Regency Energy/Fin 5.5%
15/04/23 USD490,000 506,177 0.0 Regency Energy/Fin
5.875% 01/03/22 USD739,000 772,984 0.0 Regency Energy/Fin 6.5%
15/07/21 USD1,370,000 1,491,797 0.1 Reliance Hldgs USA 5.4%
02/22-RegS USD1,350,000 1,428,435 0.1 Resolute Forest 5.875%
15/5/23-144A USD75,000 74,802 0.0 Revlon Consumer 5.75%
15/02/21 USD838,000 850,576 0.0 Reynolds Grp 5.75%
15/10/20 USD8,286,000 8,905,781 0.2
(Continued)
Holding
Fair value
US$
% of net
assets Reynolds Grp 6.875%
15/02/21 USD600,000 651,885 0.0 Reynolds Grp 7.125%
15/04/19 USD1,500,000 1,639,578 0.1 Reynolds Grp 7.875%
15/08/19 USD1,550,000 1,720,936 0.1 Reynolds Grp 8.25%
15/02/21 USD1,200,000 1,320,925 0.0 Reynolds Grp 9%
15/04/19 USD2,450,000 2,723,788 0.1 Reynolds Grp 9.875%
15/08/19 USD6,110,000 6,914,335 0.2 RHP Hotel Prop/Fin 5%
15/04/21 USD419,000 431,861 0.0 Ridgebury Crude 7.625%
20/3/17-RegS USD677,000 692,261 0.0 Rite Aid 10.25% 15/10/19 USD1,701,000 1,949,854 0.1 Rite Aid 6.75% 15/06/21 USD680,000 753,143 0.0 Rite Aid 9.25% 15/03/20 USD1,715,000 1,965,164 0.1 Rivers Pittsburgh 9.5%
15/6/19-144A USD718,000 806,484 0.0 Rivers Pittsburgh 9.5%
15/6/19-RegS USD88,000 98,845 0.0 ROC Finance 12.125%
01/09/18-144A USD751,000 803,468 0.0 ROC Finance 12.125%
01/09/18-RegS USD225,000 240,438 0.0 Rockies Express 6%
15/01/19-144A USD200,000 204,067 0.0 Rock-Tenn Co 4.9%
01/03/22 USD30,000 32,255 0.0 Roofing Supply/Fin 10%
1/6/20-144A USD36,000 41,430 0.0 Rosetta Res 5.625%
01/05/21 USD1,575,000 1,659,164 0.1 Rosetta Res 5.875%
01/06/22 USD1,366,000 1,432,876 0.1 RR Donnelley 7% 15/02/22 USD365,000 406,661 0.0 RR Donnelley 7.25%
15/05/18 USD67,000 79,234 0.0 RR Donnelley 7.625%
15/06/20 USD187,000 216,717 0.0 Ryerson Inc/Joseph 9%
15/10/17 USD500,000 560,875 0.0 Sabine Pass 5.625%
15/04/23 USD2,690,000 2,766,917 0.1 Sabine Pass 6.25%
15/03/22-144A USD823,000 854,234 0.0 Sabine Pass Stp Cpn
5.625% 01/02/21 USD488,000 509,045 0.0 Sabre Inc 8.5% 15/05/19-
144A USD2,405,000 2,738,326 0.1 Sabre Inc 8.5% 15/05/19-
RegS USD100,000 113,860 0.0 Sabre Inc 8.5% 15/05/19-
RegS USD25,000 28,559 0.0
- 203 -

JJPMORGAN MULTI INCOME FUND SSemi--aannual report for the
pperiod ended 31 March 2014
IInvestment Portfolio (Continued) As at 31 March 2014 (Unaudited)
Holding
Fair value
US$
% of net
assets United States (Continued) Salix Pharm 6% 15/01/21-
144A USD490,000 527,158 0.0 Sally Hldgs/Cap 5.75%
01/06/22 USD867,000 935,638 0.0 Sally Hldgs/Cap 6.875%
15/11/19 USD700,000 785,318 0.0 Samson Inv Step Cpn
10.75%2/20-144A USD2,225,000 2,456,477 0.1 Samson Inv Step Cpn
10.75%2/20-RegS USD400,000 441,614 0.0 Sandridge Energy 7.5%
15/03/21 USD2,025,000 2,148,609 0.1 SBA Telecom 5.75%
15/07/20 USD501,000 530,333 0.0 Scotts Miracle-Gro 6.625%
15/12/20 USD550,000 604,830 0.0 Sealed Air 5.25%
01/04/23-144A USD392,000 405,230 0.0 Sealed Air 6.5% 01/12/20-
144A USD535,000 600,092 0.0 Sealed Air 8.125%
15/09/19-144A USD400,000 449,535 0.0 Sealed Air 8.375%
15/09/21-144A USD1,575,000 1,823,385 0.1 Sealed Air 8.375%
15/09/21-RegS USD375,000 434,139 0.0 Semgroup Corp 7.5%
15/06/21 USD1,875,000 2,078,516 0.1 Seminole Hard 5.875%
15/05/21-144A USD1,910,000 1,969,416 0.1 Seneca Gaming 8.25%
01/12/18-144A USD1,200,000 1,317,000 0.0 Seneca Gaming 8.25%
01/12/18-RegS USD275,000 301,813 0.0 Serta Simmons 8.125%
01/10/20-144A USD4,210,000 4,802,031 0.1 Serta Simmons 8.125%
01/10/20-RegS USD216,000 246,375 0.0 Service Corp 5.375%1/22-
144A-PO3/14 USD127,000 129,889 0.0 Service Corp 7% 15/05/19 USD2,000,000 2,168,278 0.1 Service Corp 7.5%
01/04/27 USD200,000 220,250 0.0 Service Corp 7.625%
01/10/18 USD100,000 119,188 0.0 Service Corp 8% 15/11/21 USD960,000 1,139,227 0.0 SESI LLC 7.125% 15/12/21 USD500,000 570,589 0.0 Shearers Foods/Chip 9%
1/11/19-144A USD993,000 1,122,090 0.0 Shingle Springs 9.75%
01/09/21-144A USD780,000 873,746 0.0 Sinclair TV 5.375%
01/04/21 USD1,575,000 1,609,453 0.1 Sinclair TV 6.125%
01/10/22 USD775,000 811,328 0.0 Sinclair TV 8.375%
15/10/18 USD750,000 830,701 0.0 Sirius XM Hldgs 4.25%
15/05/20-144A USD3,630,000 3,588,885 0.1
(Continued)
Holding
Fair value
US$
% of net
assets Sirius XM Hldgs 4.625%
15/5/23-144A USD580,000 556,858 0.0 Sirius XM Hldgs 5.25%
15/8/22-144A USD630,000 653,218 0.0 Sirius XM Hldgs 5.875%
1/10/20-144A USD270,000 293,134 0.0 Sitel LLC/Fin 11% 01/08/17 USD220,000 239,433 0.0 Sitel LLC/Fin 11%
01/08/17-144A USD110,000 119,854 0.0 Sitel LLC/Fin 11.5%
01/04/18 USD570,000 573,124 0.0 Six Flags Ent 5.25%
15/01/21-144A USD960,000 980,380 0.0 SM Energy 5% 15/01/24-
144A USD800,000 784,556 0.0 SM Energy 6.5% 01/01/23 USD1,875,000 2,041,406 0.1 SM Energy 6.5% 15/11/21 USD1,705,000 1,883,575 0.1 SM Energy 6.625%
15/02/19 USD720,000 774,828 0.0 Smithfield Foods 5.25%
1/8/18-144A USD2,214,000 2,321,933 0.1 Smithfield Foods 5.875%
1/8/21-144A USD290,000 303,715 0.0 Smithfield Foods 7.75%
01/07/17 USD1,425,000 1,684,172 0.1 Spectrum Brands 6.375%
15/11/20 USD625,000 694,850 0.0 Spectrum Brands 6.625%
15/11/22 USD1,732,000 1,938,042 0.1 Spectrum Brands 6.75%
15/03/20 USD2,500,000 2,717,344 0.1 Speedy Cash 10.75%
15/05/18-RegS USD1,000,000 1,082,790 0.0 Spirit Aerosystems 5.25%
03/22-144A USD319,000 320,848 0.0 Sprint Capital 6.9%
01/05/19 USD100,000 112,875 0.0 Sprint Capital 8.75%
15/03/32 USD7,600,000 8,448,403 0.2 Sprint Commun 11.5%
15/11/21 USD1,010,000 1,379,927 0.1 Sprint Commun 6%
01/12/16 USD600,000 669,570 0.0 Sprint Commun 6%
15/11/22 USD1,675,000 1,738,371 0.1 Sprint Commun 7%
01/03/20-144A USD2,240,000 2,595,973 0.1 Sprint Commun 7%
01/03/20-RegS USD450,000 521,513 0.0 Sprint Commun 7%
15/08/20 USD2,855,000 3,141,610 0.1 Sprint Commun 9%
15/11/18-144A USD4,950,000 6,220,913 0.2 Sprint Commun 9%
15/11/18-RegS USD215,000 270,201 0.0 Sprint Commun 9.125%
01/03/17 USD450,000 537,014 0.0 Sprint Corp 7.125%
15/06/24-144A USD681,000 729,876 0.0 Sprint Corp 7.25%
15/09/21-144A USD5,045,000 5,516,322 0.2
- 204 -

JJPMORGAN MULTI INCOME FUND SSemi--aannual report for the
pperiod ended 31 March 2014
IInvestment Portfolio (Continued) As at 31 March 2014 (Unaudited)
Holding
Fair value
US$
% of net
assets United States (Continued) Sprint Corp 7.875%
15/09/23-144A USD4,073,000 4,495,446 0.1 Standard Pacific 10.75%
15/09/16 USD97,000 116,407 0.0 Standard Pacific 8.375%
15/01/21 USD660,000 797,025 0.0 Standard Pacific 8.375%
15/05/18 USD350,000 425,905 0.0 Station Casinos 7.5%
01/03/21 USD1,275,000 1,388,953 0.1 Steel Dynamics 5.25%
15/04/23 USD602,000 627,196 0.0 Steel Dynamics 6.125%
15/08/19 USD84,000 92,232 0.0 Steel Dynamics 6.375%
15/08/22 USD919,000 1,009,359 0.0 Steel Dynamics 7.625%
15/03/20 USD155,000 167,958 0.0 Stone Energy 7.5%
15/11/22 USD1,973,000 2,197,018 0.1 Suburban Propane/Ener
7.375% 1/8/21 USD293,000 327,000 0.0 Summit Mids 7.5% 07/21-
144A-PO3/14 USD870,000 949,388 0.0 SunGard Avail 8.75%
01/04/22-144A USD507,000 507,000 0.0 SunGard Data Sys 6.625%
01/11/19 USD1,420,000 1,547,948 0.1 SunGard Data Sys 7.625%
15/11/20 USD1,840,000 2,069,774 0.1 Supervalu Inc 8%
01/05/16 USD1,475,000 1,680,885 0.1 Swift Energy 7.125%
01/06/17 USD25,000 25,906 0.0 Swift Energy 7.875%
01/03/22 USD912,000 918,584 0.0 Swift Energy 8.875%
15/01/20 USD850,000 910,420 0.0 Syniverse Hldgs 9.125%
15/01/19 USD145,000 160,518 0.0 Talos
Production/Fin9.75% 2/18-144A USD889,000 943,655 0.0
Targa Res 4.25% 15/11/23-144A USD2,350,000 2,223,508 0.1
Targa Res 5.25% 01/05/23-144A USD425,000 428,984 0.0
Targa Res 6.375% 01/08/22 USD323,000 345,812 0.0
Targa Res 6.875% 01/02/21 USD75,000 81,484 0.0
Taylor Morr/Mon 7.75% 15/04/20-144A USD78,000 88,799 0.0
Taylor Morr/Mon 7.75% 15/04/20-144A USD54,000 61,476 0.0
Taylor Morr/Mon 7.75% 15/04/20-RegS USD80,000 91,076 0.0
Teleflex Inc 6.875% 01/06/19 USD825,000 896,500 0.0
(Continued)
Holding
Fair value
US$
% of net
assets Tenet Healthcare 4.375%
01/10/21 USD834,000 816,017 0.0 Tenet Healthcare 4.5%
01/04/21-144A USD840,000 843,083 0.0 Tenet Healthcare 4.75%
1/6/20-144A USD2,710,000 2,780,008 0.1 Tenet Healthcare 5%
01/03/19-144A USD190,000 190,581 0.0 Tenet Healthcare 6%
01/10/20-144A USD5,596,000 6,167,258 0.2 Tenet Healthcare 6.25%
01/11/18 USD150,000 169,469 0.0 Tenet Healthcare 6.75%
01/02/20 USD2,150,000 2,287,063 0.1 Tenet Healthcare 8%
01/08/20 USD2,723,000 3,011,184 0.1 Tenet Healthcare 8.125%
01/04/22 USD1,787,000 2,076,607 0.1 Terex Corp 6% 15/05/21 USD1,475,000 1,611,029 0.1 Terex Corp 6.5% 01/04/20 USD650,000 728,000 0.0 Tesoro Corp 5.125%
01/04/24 USD332,000 334,322 0.0 Tesoro Corp 5.375%
01/10/22 USD112,000 118,494 0.0 Tesoro Logist/Fin 5.875%
01/10/20 USD730,000 789,769 0.0 Tesoro Logist/Fin 5.875%
10/20-144A USD1,500,000 1,619,063 0.1 Tesoro Logist/Fin 6.125%
15/10/21 USD1,825,000 2,013,583 0.1 Thermadyne Hldgs 9%
15/12/17 USD763,000 837,774 0.0 T-Mobile USA 5.25%
01/09/18 USD485,000 514,009 0.0 T-Mobile USA 6.125%
15/01/22 USD979,000 1,052,218 0.0 T-Mobile USA 6.25%
01/04/21 USD2,990,000 3,268,070 0.1 T-Mobile USA 6.464%
28/04/19 USD330,000 356,892 0.0 T-Mobile USA 6.5%
15/01/24 USD370,000 398,177 0.0 T-Mobile USA 6.625%
01/04/23 USD1,020,000 1,118,813 0.0 T-Mobile USA 6.633%
28/04/21 USD828,000 900,899 0.0 T-Mobile USA 6.731%
28/04/22 USD2,294,000 2,490,633 0.1 T-Mobile USA 6.836%
28/04/23 USD1,255,000 1,362,808 0.1 Toll Brothers Fin 6.75%
01/11/19 USD230,000 266,944 0.0 Tops Hldg/Mkts 8.875%
15/12/17 USD1,135,000 1,275,602 0.0 Transdigm Inc 5.5%
15/10/20 USD480,000 500,047 0.0 Transdigm Inc 7.75%
15/12/18 USD500,000 548,392 0.0 TransUnion Hldg 9.625%
15/06/18 USD700,000 746,057 0.0
- 205 -

JJPMORGAN MULTI INCOME FUND SSemi--aannual report for the
pperiod ended 31 March 2014
IInvestment Portfolio (Continued) As at 31 March 2014 (Unaudited)
Holding
Fair value
US$
% of net
assets United States (Continued) Tronox Fin 6.375%
15/08/20 USD1,060,000 1,101,947 0.0 Tutor Perini 7.625%
01/11/18 USD1,530,000 1,680,354 0.1 UAL 2007 Pass Trust
6.636% 02/07/22 USD1,525,000 1,176,085 0.0 UBS Pfd Fdg No1 VRN
6.243% Perp USD4,165,000 4,534,677 0.1 UCI Intl 8.625% 15/02/19 USD700,000 688,632 0.0 Unifrax I/Hldgs 7.5%
15/02/19-144A USD650,000 696,990 0.0 Unisys Corp 6.25%
15/08/17 USD150,000 164,349 0.0 Unit Corp 6.625%
15/05/21 USD2,719,000 2,950,691 0.1 United Rentals NA 5.75%
15/07/18 USD160,000 172,800 0.0 United Rentals NA 5.75%
15/11/24 USD230,000 231,945 0.0 United Rentals NA 6.125%
15/06/23 USD2,075,000 2,247,650 0.1 United Rentals NA 7.375%
15/05/20 USD1,013,000 1,146,530 0.0 United Rentals NA 7.625%
15/04/22 USD3,127,000 3,628,482 0.1 United Rentals NA 8.25%
01/02/21 USD2,251,000 2,546,556 0.1 United Rentals NA 8.375%
15/09/20 USD950,000 1,057,887 0.0 United Rentals NA 9.25%
15/12/19 USD100,000 113,349 0.0 United Surgical 9%
01/04/20 USD2,289,000 2,649,518 0.1 Univision Comm 5.125%
15/05/23-144A USD750,000 781,503 0.0 Univision Comm 6.75%
15/09/22-144A USD3,434,000 3,801,395 0.1 Univision Comm 6.75%
15/09/22-RegS USD115,000 127,442 0.0 Univision Comm 6.75%
15/09/22-RegS USD113,000 125,225 0.0 Univision Comm 6.875%
15/05/19-144A USD500,000 550,582 0.0 Univision Comm 6.875%
15/05/19-RegS USD225,000 247,762 0.0 Univision Comm 6.875%
15/05/19-RegS USD20,000 22,023 0.0 Univision Comm 7.875%
01/11/20-RegS USD800,000 912,250 0.0 Univision Comm 8.5%
15/05/21-144A USD250,000 284,962 0.0 Univision Comm 8.5%
15/05/21-RegS USD25,000 28,496 0.0 US Airways 2013-1B
5.375% 15/11/21 USD1,128,000 1,176,453 0.0 US Concrete 8.5%
01/12/18-144A USD370,000 410,957 0.0 US Steel 7% 01/02/18 USD14,000 15,698 0.0 US Treasury 0.25%
31/01/15* USD4,025,000 4,031,542 0.1
(Continued)
Holding
Fair value
US$
% of net
assets USG Corp 5.875%
01/11/21-144A USD285,000 309,789 0.0 USG Corp 7.875%
30/03/20-144A USD28,000 31,302 0.0 Vail Resorts 6.5%
01/05/19 USD1,785,000 1,924,825 0.1 Valeant Pharm 6.75%
15/08/21-144A USD2,935,000 3,203,002 0.1 Valeant Pharm 7%
01/10/20-144A USD250,000 279,688 0.0 Valeant Pharm 7%
01/10/20-RegS USD800,000 895,000 0.0 Valeant Pharm 7.25%
15/07/22-144A USD1,775,000 1,991,119 0.1 Vanguard Natl/VNR Fin
7.875% 1/4/20 USD205,000 228,447 0.0 Viasystems Inc 7.875%
01/05/19-144A USD757,000 840,507 0.0 Viasystems Inc 7.875%
01/05/19-RegS USD69,000 76,267 0.0 Viking Cruises 8.5%
15/10/22-144A USD1,046,000 1,228,454 0.0 Virgin Media Fin
6.375%15/4/23-144A USD600,000 650,744 0.0 Visteon Corp 6.75%
15/04/19 USD564,000 611,270 0.0 Visteon Corp 6.75%
15/04/19-PO03/14 USD81,000 87,789 0.0 VPI Escrow 6.375%
15/10/20-144A USD3,505,000 3,897,816 0.1 VPI Escrow 6.375%
15/10/20-RegS USD38,000 42,211 0.0 Vulcan Materials 7%
15/06/18 USD605,000 712,875 0.0 Vulcan Materials 7.5%
15/06/21 USD3,460,000 4,175,084 0.1 VWR Funding 7.25%
15/09/17 USD932,000 1,003,600 0.0 W&T Offshore 8.5%
15/06/19 USD1,690,000 1,872,121 0.1 Wachovia Cap Trust FRN
Perp USD6,875,000 6,681,336 0.2 Walter Inv Mgmt 7.875%
12/21-144A USD773,000 788,822 0.0 WCI Communitie 6.875%
15/08/21-144A USD980,000 1,023,096 0.0 Wells Enterprises 6.75%
02/20-144A USD371,000 384,449 0.0 Wells Fargo VRN 7.98%
Perp-Ser K USD22,610,000 25,903,561 0.7 Western Refining 6.25%
01/04/21 USD925,000 983,969 0.0 Westmoreland Escrow
10.75%2/18-144A USD400,000 443,167 0.0 Whiting Petroleum 5%
15/03/19 USD1,520,000 1,618,589 0.1 Whiting Petroleum 5.75%
15/03/21 USD1,200,000 1,295,706 0.0 Windstream Corp 6.375%
01/08/23 USD30,000 29,710 0.0
- 206 -

JJPMORGAN MULTI INCOME FUND SSemi--aannual report for the
pperiod ended 31 March 2014
IInvestment Portfolio (Continued) As at 31 March 2014 (Unaudited)
Holding
Fair value
US$
% of net
assets United States (Continued) Windstream Corp 7.5%
01/04/23 USD643,000 702,478 0.0 Windstream Corp 7.75%
01/10/21 USD8,400,000 9,387,000 0.3 Windstream Corp 7.75%
15/10/20 USD1,305,000 1,456,317 0.1 WMG Acquisition 5.625%
15/4/22-144A USD145,000 145,906 0.0 WMG Acquisition 6%
15/01/21-144A USD2,913,000 3,081,469 0.1 WMG Acquisition 6.75%
15/04/22-144A USD740,000 743,700 0.0 WOK Acquisition 10.25%
30/6/20-144A USD456,000 501,885 0.0 WPX Energy 5.25%
15/01/17 USD240,000 260,095 0.0 WPX Energy 6% 15/01/22 USD4,765,000 4,951,232 0.1 Zayo Group/Cap 10.125%
01/07/20 USD1,085,000 1,284,708 0.0 Zayo Group/Cap 8.125%
01/01/20 USD819,000 919,747 0.0 Uruguay (0.1%) Rep of Uruguay 8%
18/11/22 USD860,000 1,122,668 0.0 Rep Orient Uruguay
7.625% 21/03/36 USD1,030,000 1,324,044 0.1 Venezuela (0.3%) Petroleos de Venez
5.375% 4/27-RegS USD2,800,000 1,576,069 0.0 Petroleos de Venez
8.5%2/11/17-RegS USD2,355,000 2,091,044 0.1 Rep of Venezuela 12.75%
08/22-RegS USD2,608,000 2,464,723 0.1 Rep of Venezuela 7.65%
21/04/25 USD6,280,000 4,485,380 0.1 Virgin Islands (0.0%) Star Energy 6.125%
27/03/20-RegS USD1,470,000 1,492,132 0.0 1,759,636,996 44.3 --------- ---- (III) Derivatives (1.5%) Forward foreign exchange ccontracts (1.4%) 56,679,582 1.4 Futures (0.1%) US 5Yr Note (CBT) Fut
06/14 (4,206) 2,301,711 0.1 58,981,293 1.5 --------- ---- Total Listed/Quoted Investments 3,905,176,494 98.4
(Continued)
Holding
Fair value
US$
% of net
assets Other net assets 63,497,583 1.6 Net assets attributable to holders of
rredeemable units at 31 March 2014 3,968,674,077 100.0 Total investments, at cost 3,672,278,959 * Security pledged as collateral with broker for derivative contracts
- 207 -

JJPMORGAN MULTI INCOME FUND SSemi--aannual report for the
pperiod ended 31 March 2014
SStatement of Movements in Portfolio HoldingsFor the period ended 31 March 2014 (Unaudited) % holdings
of net assets 31.3.2014 30.9.2013 Listed/Quoted Investments Equities and Convertibles United States 17.7 14.1 United Kingdom 5.1 5.1 France 3.3 2.6 Japan 2.4 2.7 Switzerland 2.1 1.5 Taiwan 1.9 2.1 Germany 1.8 1.7 Australia 1.7 2.2 Hong Kong 1.5 1.9 Brazil 1.4 2.4 South Africa 1.3 2.4 China 1.3 2.0 Sweden 1.2 1.0 Russia 1.1 1.5 Singapore 1.0 1.5 Canada 0.9 1.0 Korea 0.7 0.9 Italy 0.7 0.7 Spain 0.7 0.3 Finland 0.6 0.1 Turkey 0.5 0.9 India 0.5 0.5 Denmark 0.4 0.3 Netherlands 0.4 0.2 Norway 0.4 0.3 Thailand 0.4 0.3 Indonesia 0.4 0.4 Belgium 0.3 0.2 Qatar 0.2 0.3 Poland 0.2 0.4 Saudi Arabia 0.1 - Mexico 0.1 0.1 United Arab Emirates 0.1 0.1 Hungary 0.1 - Cayman Islands 0.1 - Luxembourg 0.0 0.0 Jersey C.I. 0.0 - Portugal 0.0 0.0 Austria 0.0 0.0 Malaysia 0.0 0.0 Virgin Islands 0.0 0.0 Philippines - 0.2 Kazakhstan - 0.1 Debt Securities United States 33.1 27.8 Luxembourg 1.5 1.5 Canada 1.1 0.7 Spain 0.5 1.8 United Kingdom 0.5 0.4 Indonesia 0.5 0.7 Netherlands 0.4 0.3 Cayman Islands 0.4 0.3
(Continued) % holdings
of net assets 331.3.2014 30.9.2013 Russia 0.3 0.7 Hungary 0.3 0.5 Italy 0.3 2.0 Dominican Republic 0.3 0.5 Brazil 0.3 0.5 Mexico 0.3 0.2 Venezuela 0.3 0.6 Portugal 0.3 0.5 Romania 0.2 0.6 Australia 0.2 0.2 Iraq 0.2 0.4 Costa Rica 0.2 0.4 Kazakhstan 0.2 0.5 Ireland 0.2 0.2 France 0.2 0.1 Serbia 0.2 0.4 Georgia 0.2 0.3 South Africa 0.2 0.1 Philippines 0.2 0.3 Ghana 0.1 0.3 Argentina 0.1 0.2 Bermuda 0.1 0.2 Slovenia 0.1 0.1 Turkey 0.1 - Croatia 0.1 0.2 Azerbaijan 0.1 0.1 Aruba 0.1 0.1 Marshall Island 0.1 0.1 Japan 0.1 0.1 Sri Lanka 0.1 0.0 El Salvador 0.1 0.1 Uruguay 0.1 0.1 Nigeria 0.1 0.1 Chile 0.1 0.1 Jersey C.I. 0.1 0.0 Bahamas 0.1 0.0 Colombia 0.0 0.1 Virgin Islands 0.0 - Finland 0.0 0.0 Honduras 0.0 - Austria 0.0 0.0 United Arab Emirates 0.0 - Norway 0.0 0.0 Pakistan 0.0 - India 0.0 - Singapore 0.0 0.0 Sweden 0.0 0.0 Liberia 0.0 - Ukraine - 0.1 Poland - 0.1 Germany - 0.0 International - 0.0 Derivatives Forward foreign exchange contracts 1.4 1.2 Futures 0.1 - Total Listed/Quoted Investments 98.4 97.8
- 208 -

JJPMORGAN MULTI INCOME FUND SSemi--aannual report for the
pperiod ended 31 March 2014
SStatement of Movements in Portfolio Holdings (Continued) For the period ended 31 March 2014 (Unaudited) % holdings
of net assets 31.3.2014 30.9.2013 Other net assets 1.6 2.2 Net assets attributable to holders of
rredeemable units 100.0 100.0
- 209 -
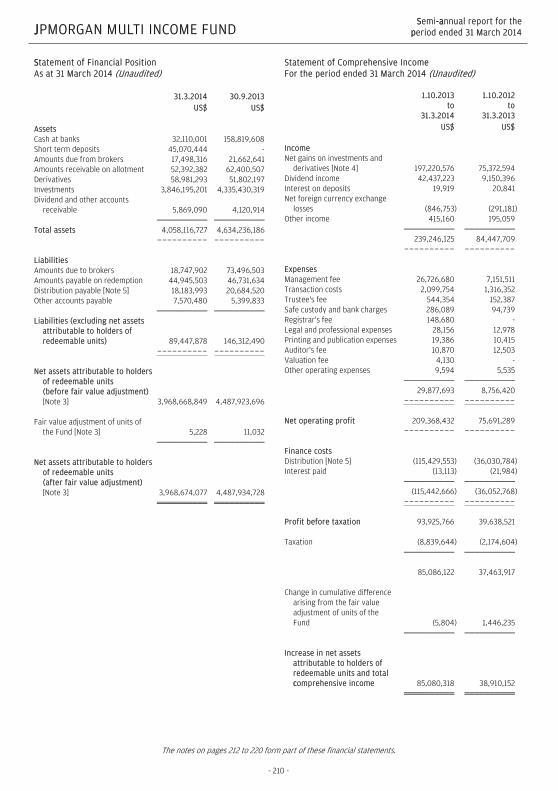
JJPMORGAN MULTI INCOME FUND SSemi--aannual report for the
pperiod ended 31 March 2014
SStatement of Financial Position As at 31 March 2014 (Unaudited) 31.3.2014 30.9.2013 US$ US$ Assets Cash at banks 32,110,001 158,819,608 Short term deposits 45,070,444 - Amounts due from brokers 17,498,316 21,662,641 Amounts receivable on allotment 52,392,382 62,400,507 Derivatives 58,981,293 51,802,197 Investments 3,846,195,201 4,335,430,319 Dividend and other accounts
receivable 5,869,090 4,120,914 Total assets 4,058,116,727 4,634,236,186 ---------- ---------- Liabilities Amounts due to brokers 18,747,902 73,496,503 Amounts payable on redemption 44,945,503 46,731,634 Distribution payable [Note 5] 18,183,993 20,684,520 Other accounts payable 7,570,480 5,399,833 Liabilities (excluding net assets
attributable to holders of redeemable units) 89,447,878 146,312,490
---------- ---------- Net assets attributable to holders
of redeemable units (before fair value adjustment)
[Note 3] 3,968,668,849 4,487,923,696 Fair value adjustment of units of
the Fund [Note 3] 5,228 11,032 Net assets attributable to holders
of redeemable units (after fair value adjustment)
[Note 3] 3,968,674,077 4,487,934,728
Statement of Comprehensive Income For the period ended 31 March 2014 (Unaudited) 1.10.2013
to 31.3.2014
1.10.2012 to
31.3.2013 US$ US$ Income Net gains on investments and
derivatives [Note 4] 197,220,576 75,372,594 Dividend income 42,437,223 9,150,396 Interest on deposits 19,919 20,841 Net foreign currency exchange
losses (846,753) (291,181) Other income 415,160 195,059 239,246,125 84,447,709 ---------- ---------- Expenses Management fee 26,726,680 7,151,511 Transaction costs 2,099,754 1,316,352 Trustee's fee 544,354 152,387 Safe custody and bank charges 286,089 94,739 Registrar's fee 148,680 - Legal and professional expenses 28,156 12,978 Printing and publication expenses 19,386 10,415 Auditor's fee 10,870 12,503 Valuation fee 4,130 - Other operating expenses 9,594 5,535 29,877,693 8,756,420 ---------- ---------- Net operating profit 209,368,432 75,691,289 ---------- ---------- Finance costs Distribution [Note 5] (115,429,553) (36,030,784) Interest paid (13,113) (21,984) (115,442,666) (36,052,768) ---------- ---------- Profit before taxation 93,925,766 39,638,521 Taxation (8,839,644) (2,174,604) 85,086,122 37,463,917 Change in cumulative difference
arising from the fair value adjustment of units of the Fund (5,804) 1,446,235
Increase in net assets
attributable to holders of redeemable units and total ccomprehensive income 85,080,318 38,910,152
The notes on pages 212 to 220 form part of these financial statements.
- 210 -

JJPMORGAN MULTI INCOME FUND SSemi--aannual report for the
pperiod ended 31 March 2014
SStatement of Changes in Net Assets Attributable to Holders of Redeemable Units For the period ended 31 March 2014 (Unaudited) 1.10.2013
to 31.3.2014
1.10.2012 to
31.3.2013 US$ US$ Net assets attributable to holders
of redeemable units at the beginning of the period 4,487,934,728 581,100,054
---------- ---------- Allotment of redeemable units 1,640,095,245 2,015,477,628 Redemption of redeemable units (2,244,436,214) (653,845,381) Net (redemption)/allotment (604,340,969) 1,361,632,247 ---------- ---------- 3,883,593,759 1,942,732,301 Increase in net assets
attributable to holders of redeemable units and total comprehensive income 85,080,318 38,910,152
Net assets aattributable to holders
of redeemable units at the end oof the period 3,968,674,077 1,981,642,453
Statement of Cash Flows For the period ended 31 March 2014 (Unaudited) 1.10.2013
to 31.3.2014
1.10.2012 to
31.3.2013 US$ US$ Operating activities Purchase of investments (998,370,352) (1,446,377,464) Proceeds from disposal of
investments 1,627,116,609 207,291,767 Dividend received 40,448,164 7,368,826 Interest received 19,440 19,376 Increase in margin deposits - (472,134) Trustee's fee paid (554,455) (126,825) Transaction costs paid (2,166,844) (1,323,621) Tax paid (9,205,804) (1,817,860) Management fee paid (27,240,750) (5,871,393) Others 2,391,379 (566,289) Net cash inflow/(outflow) from
ooperating activities 632,437,387 (1,241,875,617) ---------- ---------- Financing activities Interest paid (13,113) (23,017) Receipts on allotment of
redeemable units 1,650,103,370 1,980,899,763 Payments on redemption of
redeemable units (2,246,222,345) (651,426,390) Distribution paid (117,930,080) (30,009,944) Net cash (outflow)/inflow from
ffinancing activities (714,062,168) 1,299,440,412 ---------- ---------- (Decrease)/increase in cash
aand cash equivalents (81,624,781) 57,564,795 Cash and cash equivalents at the
beginning of the period 158,819,608 30,994,041 Exchange losses on cash and cash
equivalents (14,382) (426,156) Cash and cash equivalents at
tthe end of the period 77,180,445 88,132,680 Analysis of balances of cash and cash equivalents: Cash at banks 32,110,001 88,132,680 Short term deposits 45,070,444 - 77,180,445 88,132,680
The notes on pages 212 to 220 form part of these financial statements.
- 211 -

JJPMORGAN MULTI INCOME FUND SSemi--aannual report forr the
pperiod ended 31 March 2014
NNotes to the Financial Statements
1 The Fund
JPMorgan Multi Income Fund (the "Fund") was established under a Trust Deed dated 24 June 2011, as amended, and is governed by the laws of Hong Kong. The Fund is authorized by the Securities and Futures Commission of Hong Kong.
The investment objective of the Fund is to maximize the income return primarily through investing in a diversified portfolio of income producing equities, bonds and other securities. In addition, the Fund aims to provide medium to long term moderate capital growth.
Pursuant to the Trust Deed, the Manager may decide to issue separate classes (each a "Class") whose assets will be commonly invested but where a specific fee structure, currency or distribution policy may be applied. Each Class may have a different charging structure with the result that the net asset value attributable to each Class may differ.
All unitholders' rights with regard to the convening, voting or otherwise acting at any meeting of unitholders are the same.
2 Summary of principal accounting policies
(a) Accounting policies of interim financial statements
The accounting policies and methods of computation used in the preparation of these unaudited condensed interim financial statements are consistent with those used in the annual financial statements for the year ended 30 September 2013.
(b) Investments and derivatives
Classification
The Fund classifies its investments and derivatives as financial assets or financial liabilities at fair value through profit or loss. These financial assets or financial liabilities are held-for-trading as they are acquired or incurred principally for the purpose of selling or repurchasing in the near term or short-term profit taking.
All derivatives are carried in assets when amounts are receivable by the Fund and in liabilities when amounts are payable by the Fund.
The Fund makes short sales in which a borrowed security is sold in anticipation of a decline in the market value of that security, or it may use short sales for various arbitrage transactions. Short sales are classified as financial liabilities at fair value through profit or loss.
Recognition, derecognition and measurement
Purchases and sales of investments and derivatives are accounted for on the trade date basis. Investments and derivatives are initially recognized at fair value and are subsequently re-measured at fair value. Realized and unrealized gains and losses on investments and derivatives are recognized in the Statement of Comprehensive Income. Investments and derivatives are derecognized when the rights to receive cash flows from the investments and derivatives have expired or the Fund has transferred substantially all risks and rewards of ownership.
Fair value estimation
Fair value is the price that would be received to sell an asset or paid to transfer a liability in an orderly transaction between market participants at the measurement date. The fair value of financial assets and liabilities traded in active markets are based on last traded prices. Prior to 1 October 2012, investments that are listed or traded on an exchange and investments with prices quoted in over-the-counter markets or by market makers, are fair valued based on quoted "bid" prices on long investments and quoted "ask" prices on investments sold short. The Fund early adopted Hong Kong Financial Reporting Standard 13, "Fair Value Measurement", with effect from 1 October 2012, it changed its fair valuation input to utilize the last traded market price for both financial assets and financial liabilities where the last traded price falls within the bid-ask spread. When trading in the securities of an investee company is suspended, the investment is valued at the Manager's estimate of its fair value.
Debt securities are fair valued based on quoted prices inclusive of accrued interest.
Investments in collective investment schemes are stated at fair value based on the net asset value per unit of the respective funds as determined by the administrators of the relevant funds or stated at last traded prices if the collective investment schemes are listed or traded on an exchange.
Open future and swap contracts are valued at last traded prices for both long and short positions at the valuation date. The differences between the last traded prices and the contract prices are recognized in the Statement of Comprehensive Income.
Open option contracts are valued at last traded prices for both long and short positions at the valuation date. The differences between the last traded prices and the premium amounts/contract prices are recognized in the Statement of Comprehensive Income.
- 212 -

JJPMORGAN MULTI INCOME FUND SSemi--aannual report forr the
pperiod ended 31 March 2014
Forward foreign exchange contracts are valued at the forward rates ruling at the valuation date. The differences between the forward rates and the contract rates are recognized in the Statement of Comprehensive Income.
((c) Securities borrowing
The Fund may enter into securities borrowing arrangements for short sale purposes. Short positions represent obligations to deliver securities sold but not yet purchased, and are accounted for as investments and valued at their fair value. Securities borrowed during the period/year are off-balance sheet transactions and are therefore not included in the investment portfolio of the Fund. Collateral placed for the purpose of securities borrowed generally consist of cash collateral and are included in the Statement of Financial Position separately.
(d) Foreign currency translation
Functional and presentation currency
The Fund has adopted United States dollar as its functional and presentation currency.
Transactions and balances
Foreign currency transactions are translated into the functional currency using the exchange rates prevailing at the dates of the transactions.
Foreign exchange gains and losses resulting from the settlement of such transactions and from the translation of assets and liabilities denominated in foreign currencies at period/year end exchange rates are recognized in the Statement of Comprehensive Income.
Foreign exchange gains and losses relating to cash and cash equivalents are presented in the Statement of Comprehensive Income within "Net foreign currency exchange gains/losses". Foreign exchange gains and losses relating to the financial assets and liabilities carried at fair value through profit or loss are presented in the Statement of Comprehensive Income within "Net gains/losses on investments and derivatives".
(e) Formation expenses
Formation expenses are recognized as an expense in the period in which they are incurred.
(f) Proceeds and payments on allotment and redemption of units
The net asset value per unit is computed for each dealing day. The price at which units are allotted or redeemed is calculated by reference to the net asset value per unit as at the close of business on the relevant dealing day in accordance with the provisions of the Fund's Trust Deed dated 24 June 2011, as amended, which may be different from the accounting policies stated in the financial statements.
Units of the Fund are redeemable at the option of the holders of redeemable units and are classified as a financial liability in the Statement of Financial Position which represents the net assets attributable to holders of redeemable units (or "net asset value" or "net assets" or "NAV") and is carried at the redemption amount that would be payable at the Statement of Financial Position date if the holders of redeemable units exercised the right to redeem units of the Fund.
3 Net assets attributable to holders of redeemable units and number of units in issue
Fair value adjustment of units of the Fund
As stated in Note 2(f), units of the Fund are redeemable at the option of the holders of redeemable units and are classified as a financial liability in the Statement of Financial Position which represents the net assets attributable to the holders of redeemable units and is carried at the redemption amount that would be payable at the Statement of Financial Position date, if the holders of redeemable units exercised the right to redeem units of the Fund. The redemption amount is determined based on the net assets attributable to holders of redeemable units calculated in accordance with the provisions of the Fund's Trust Deed dated 24 June 2011, as amended ("Trust Deed NAV").
- 213 -

JJPMORGAN MULTI INCOME FUND SSemi--aannual report for the
pperiod ended 31 March 2014
31.3.2014 30.9.2013 US$ US$ Net assets attributable to holders of redeemable units (before fair value adjustment) 3,968,668,849 4,487,923,696 Fair value adjustment of units of the Fund: Unamortized formation expenses as at the end of the period [Note 3(a)] 5,228 11,032 Net assets attributable to holders of redeemable units (after fair value adjustment) 3,968,674,077 4,487,934,728
Note:
(a) In accordance with the provisions of the Fund's Trust Deed, the formation expenses (including legal, accounting, and other professional fees and expenses) or costs incidental to the establishment of the Fund will be paid out of the assets of the Fund and amortized over the first three financial years. However, as stated in Note 2(e), the accounting policy of the Fund for the purpose of compliance with Hong Kong Accounting Standard 38, "Intangible Assets" and for reporting purposes is to expense the expenditure incurred in the formation of the Fund in the period in which they arose.
Number of units in issue
31.3.2014
AUD Hedged Class (mth)
CAD Hedged Class (mth)
EUR Hedged Class (mth)
GBP Hedged Class (mth)
HKD Class (mth)
Units Units Units Units Units Number of units in issue: 121,812,534.020 36,637,405.902 6,509,239.741 8,941,912.810 527,224,404.226 A$ C$ EUR GBP HK$ Net assets attributable to
holders of redeemable units (after fair value adjustment) 1,310,090,777 396,213,931 67,520,624 93,183,250 5,990,660,519
Net assets attributable to
holders of redeemable units (per unit) 10.75 10.81 10.37 10.42 11.36
- 214 -

JJPMORGAN MULTI INCOME FUND SSemi--aannual report forr the
pperiod ended 31 March 2014
NZD Hedged Class (mth)
SGD Hedged Class (mth)
USD Class (mth)
USD Class (acc)
Units Units Units Units Number of units in issue: 16,966,295.609 5,623,601.926 99,890,773.327 2,481,837.450 NZ$ S$ US$ US$ Net assets attributable to
holders of redeemable units (after fair value adjustment) 181,997,887 58,584,657 1,140,587,889 29,646,146
Net assets attributable to
holders of redeemable units (per unit) 10.73 10.42 11.42 11.95
30.9.2013
AUD Hedged Class (mth)
CAD Hedged Class (mth)
EUR Hedged Class (mth)
GBP Hedged Class (mth)
HKD Class (mth)
Units Units Units Units Units Number of units in issue: 144,474,447.706 31,105,090.496 6,660,749.939 9,359,473.785 668,063,068.926 A$ C$ EUR GBP HK$ Net assets attributable to
holders of redeemable units (after fair value adjustment) 1,519,004,003 328,041,422 67,443,446 95,189,553 7,396,161,307
Net assets attributable to
holders of redeemable units (per unit) 10.51 10.55 10.13 10.17 11.07
NZD Hedged Class (mth)
SGD Hedged Class (mth)
USD Class (mth)
USD Class (acc)
Units Units Units Units Number of units in issue: 12,747,441.284 5,690,535.779 120,537,127.713 4,449,427.025 NZ$ S$ US$ US$ Net assets attributable to
holders of redeemable units (after fair value adjustment) 133,713,739 57,842,504 1,341,198,479 50,630,650
Net assets attributable to
holders of redeemable units (per unit) 10.49 10.16 11.13 11.38
- 215 -

JJPMORGAN MULTI INCOME FUND SSemi--aannual report forr the
pperiod ended 31 March 2014
44 Net gains on investments and derivatives
1.10.2013
to 31.3.2014
1.10.2012 to
31.3.2013 US$ US$ Change in unrealized gains/losses in value of investments 166,342,450 59,343,999 Realized gains on sale of investments 30,878,126 16,028,595 197,220,576 75,372,594
5 Distribution
It is the intention of the manager of the Fund to have at least 85% of the income attributable to the distribution class(es) respectively in respect of each accounting period, after charging the expenses attributable to these distribution class(es) respectively, to be distributed to unitholders of these distribution class(es) respectively.
1.10.2013 to
31.3.2014
1.10.2012 to
31.3.2013 US$ US$ Net operating profit 209,368,432 75,691,289 Adjustments:
Net gains on investments and derivatives (197,220,576) (75,372,594) Interest income included in net gains on investments and derivatives (at coupon rate) 67,414,524 21,659,136 Net foreign currency exchange losses 846,753 291,181 Transaction costs 2,099,754 1,316,352 Interest paid (13,113) (21,984) Taxation (8,839,644) (2,174,604) Capital gains tax - 358,103
Amount available for distribution 73,656,130 21,746,879 A$0.0636 per unit on 131,001,147.328 units of AUD Hedged Class (mth) ex on 31 October 2013
and pay on 8 November 2013 (7,889,678) C$0.0493 per unit on 32,623,197.002 units of CAD Hedged Class (mth) ex on 31 October 2013
and pay on 8 November 2013 (1,542,239) EUR0.0391 per unit on 6,877,216.372 units of EUR Hedged Class (mth) ex on 31 October 2013
and pay on 8 November 2013 (365,568) GBP0.0419 per unit on 9,213,649.515 units of GBP Hedged Class (mth) ex on 31 October 2013
and pay on 8 November 2013 (620,231) HK$0.0430 per unit on 671,036,460.197 units of HKD Hedged Class (mth) ex on 31 October 2013
and pay on 8 November 2013 (3,721,705) NZ$0.0644 per unit on 12,339,819.726 units of NZD Hedged Class (mth) ex on 31 October 2013
and pay on 8 November 2013 (657,800) S$0.0393 per unit on 5,575,188.248 units of SGD Hedged Class (mth) ex on 31 October 2013
and pay on 8 November 2013 (176,648) US$0.0430 per unit on 120,180,759.903 units of USD Hedged Class (mth) ex on 31 October 2013
and pay on 8 November 2013 (5,167,773) (2013: A$0.0731 per unit on 20,348,400.679 units of AUD Hedged Class (mth) ex on
1 November 2012 and pay on 9 November 2012) (1,547,190) (2013: C$0.0520 per unit on 3,626,388.959 units of CAD Hedged Class (mth) ex on
1 November 2012 and pay on 9 November 2012) (189,073) (2013: EUR0.0429 per unit on 75,579.823 units of EUR Hedged Class (mth) ex on
1 November 2012 and pay on 9 November 2012) (4,195) (2013: GBP0.0443 per unit on 24,816.282 units of GBP Hedged Class (mth) ex on
1 November 2012 and pay on 9 November 2012) (1,774) (2013: HK$0.0470 per unit on 142,899,188.428 units of HKD Class (mth) ex on
1 November 2012 and pay on 9 November 2012) (866,609)
- 216 -

JJPMORGAN MULTI INCOME FUND SSemi--aannual report forr the
pperiod ended 31 March 2014
1.10.2013 to
31.3.2014
1.10.2012 to
31.3.2013 US$ US$ (2013: NZ$0.0666 per unit on 4,380,471.425 units of NZD Hedged Class (mth) ex on
1 November 2012 and pay on 9 November 2012) (241,108) (2013: S$0.0432 per unit on 88,617.793 units of SGD Hedged Class (mth) ex on
1 November 2012 and pay on 9 November 2012) (3,138) (2013: US$0.0470 per unit on 32,332,670.615 units of USD Class (mth) ex on
1 November 2012 and pay on 9 November 2012) (1,519,636) A$0.0626 per unit on 134,058,348.173 units of AUD Hedged Class (mth) ex on 29 November 2013
and pay on 9 December 2013 (7,669,077) C$0.0491 per unit on 35,481,149.054 units of CAD Hedged Class (mth) ex on 29 November 2013
and pay on 9 December 2013 (1,645,532) EUR0.0383 per unit on 7,147,718.889 units of EUR Hedged Class (mth) ex on 29 November 2013
and pay on 9 December 2013 (372,735) GBP0.0418 per unit on 9,418,136.191 units of GBP Hedged Class (mth) ex on 29 November 2013
and pay on 9 December 2013 (644,864) HK$0.0430 per unit on 665,733,818.239 units of HKD Hedged Class (mth) ex on 29 November 2013
and pay on 9 December 2013 (3,692,486) NZ$0.0631 per unit on 13,742,627.404 units of NZD Hedged Class (mth) ex on 29 November 2013
and pay on 9 December 2013 (707,949) S$0.0393 per unit on 5,602,076.361 units of SGD Hedged Class (mth) ex on 29 November 2013
and pay on 9 December 2013 (175,624) US$0.0430 per unit on 119,286,475.450 units of USD Hedged Class (mth) ex on 29 November 2013
and pay on 9 December 2013 (5,129,318) (2013: A$0.0707 per unit on 23,460,467.249 units of AUD Hedged Class (mth) ex on
30 November 2012 and pay on 10 December 2012) (1,730,392) (2013: C$0.0513 per unit on 5,534,929.774 units of CAD Hedged Class (mth) ex on
30 November 2012 and pay on 10 December 2012) (285,843) (2013: EUR0.0429 per unit on 432,262.029 units of EUR Hedged Class (mth) ex on
30 November 2012 and pay on 10 December 2012) (24,118) (2013: GBP0.0443 per unit on 403,419.347 units of GBP Hedged Class (mth) ex on
30 November 2012 and pay on 10 December 2012) (28,642) (2013: HK$0.0470 per unit on 163,864,228.554 units of HKD Class (mth) ex on
30 November 2012 and pay on 10 December 2012) (993,751) (2013: NZ$0.0657 per unit on 4,798,397.234 units of NZD Hedged Class (mth) ex on
30 November 2012 and pay on 10 December 2012) (258,714) (2013: S$0.0433 per unit on 203,691.600 units of SGD Hedged Class (mth) ex on
30 November 2012 and pay on 10 December 2012) (7,227) (2013: US$0.0470 per unit on 36,494,189.624 units of USD Class (mth) ex on
30 November 2012 and pay on 10 December 2012) (1,715,227) A$0.0632 per unit on 136,633,591.370 units of AUD Hedged Class (mth) ex on 31 December 2013
and pay on 9 January 2014 (7,725,520) C$0.0490 per unit on 35,836,611.576 units of CAD Hedged Class (mth) ex on 31 December 2013
and pay on 9 January 2014 (1,652,700) EUR0.0395 per unit on 6,893,902.333 units of EUR Hedged Class ex (mth) on 31 December 2013
and pay on 9 January 2014 (375,228) GBP0.0413 per unit on 9,071,007.530 units of GBP Hedged Class ex (mth) on 31 December 2013
and pay on 9 January 2014 (620,485) HK$0.0430 per unit on 627,218,305.084 units of HKD Hedged Class ex (mth) on 31 December 2013
and pay on 9 January 2014 (3,478,367) NZ$0.0644 per unit on 14,198,964.503 units of NZD Hedged Class (mth) ex on 31 December 2013
and pay on 9 January 2014 (752,608) S$0.0393 per unit on 5,351,026.753 units of SGD Hedged Class (mth) ex on 31 December 2013
and pay on 9 January 2014 (166,557) US$0.0430 per unit on 115,688,795.657 units of USD Hedged Class (mth) ex on 31 December 2013
and pay on 9 January 2014 (4,974,618) (2013: A$0.0708 per unit on 22,388,123.906 units of AUD Hedged Class (mth) ex on
31 December 2012 and pay on 9 January 2013) (1,645,629)
- 217 -
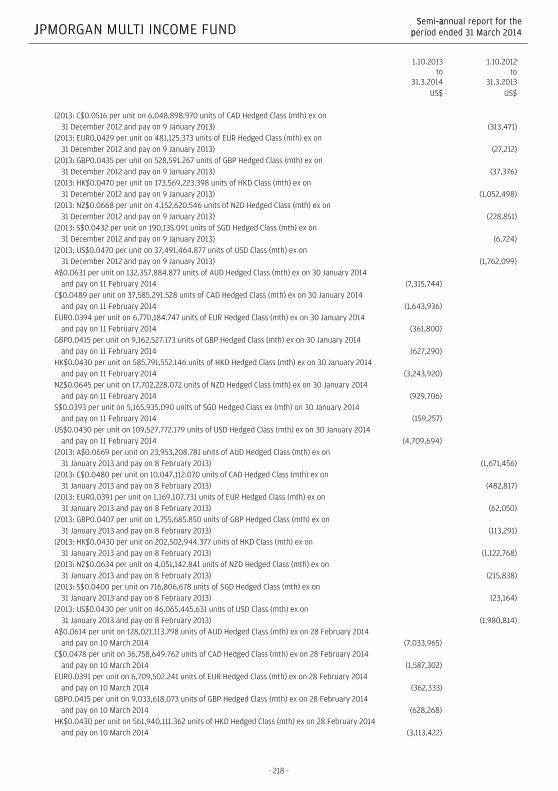
JJPMORGAN MULTI INCOME FUND SSemi--aannual report forr the
pperiod ended 31 March 2014
1.10.2013 to
31.3.2014
1.10.2012 to
31.3.2013 US$ US$ (2013: C$0.0516 per unit on 6,048,898.970 units of CAD Hedged Class (mth) ex on
31 December 2012 and pay on 9 January 2013) (313,471) (2013: EUR0.0429 per unit on 481,125.373 units of EUR Hedged Class (mth) ex on
31 December 2012 and pay on 9 January 2013) (27,212) (2013: GBP0.0435 per unit on 528,591.267 units of GBP Hedged Class (mth) ex on
31 December 2012 and pay on 9 January 2013) (37,376) (2013: HK$0.0470 per unit on 173,569,223.398 units of HKD Class (mth) ex on
31 December 2012 and pay on 9 January 2013) (1,052,498) (2013: NZ$0.0668 per unit on 4,152,620.546 units of NZD Hedged Class (mth) ex on
31 December 2012 and pay on 9 January 2013) (228,851) (2013: S$0.0432 per unit on 190,135.091 units of SGD Hedged Class (mth) ex on
31 December 2012 and pay on 9 January 2013) (6,724) (2013: US$0.0470 per unit on 37,491,464.877 units of USD Class (mth) ex on
31 December 2012 and pay on 9 January 2013) (1,762,099) A$0.0631 per unit on 132,357,884.877 units of AUD Hedged Class (mth) ex on 30 January 2014
and pay on 11 February 2014 (7,315,744) C$0.0489 per unit on 37,585,291.528 units of CAD Hedged Class (mth) ex on 30 January 2014
and pay on 11 February 2014 (1,643,936) EUR0.0394 per unit on 6,770,184.747 units of EUR Hedged Class (mth) ex on 30 January 2014
and pay on 11 February 2014 (361,800) GBP0.0415 per unit on 9,162,527.173 units of GBP Hedged Class (mth) ex on 30 January 2014
and pay on 11 February 2014 (627,290) HK$0.0430 per unit on 585,791,552.146 units of HKD Hedged Class (mth) ex on 30 January 2014
and pay on 11 February 2014 (3,243,920) NZ$0.0645 per unit on 17,702,228.072 units of NZD Hedged Class (mth) ex on 30 January 2014
and pay on 11 February 2014 (929,706) S$0.0393 per unit on 5,165,935.090 units of SGD Hedged Class ex (mth) on 30 January 2014
and pay on 11 February 2014 (159,257) US$0.0430 per unit on 109,527,772.179 units of USD Hedged Class (mth) ex on 30 January 2014
and pay on 11 February 2014 (4,709,694) (2013: A$0.0669 per unit on 23,953,208.781 units of AUD Hedged Class (mth) ex on
31 January 2013 and pay on 8 February 2013) (1,671,456) (2013: C$0.0480 per unit on 10,047,112.070 units of CAD Hedged Class (mth) ex on
31 January 2013 and pay on 8 February 2013) (482,817) (2013: EUR0.0391 per unit on 1,169,107.731 units of EUR Hedged Class (mth) ex on
31 January 2013 and pay on 8 February 2013) (62,050) (2013: GBP0.0407 per unit on 1,755,685.850 units of GBP Hedged Class (mth) ex on
31 January 2013 and pay on 8 February 2013) (113,291) (2013: HK$0.0430 per unit on 202,502,944.377 units of HKD Class (mth) ex on
31 January 2013 and pay on 8 February 2013) (1,122,768) (2013: NZ$0.0634 per unit on 4,051,142.841 units of NZD Hedged Class (mth) ex on
31 January 2013 and pay on 8 February 2013) (215,838) (2013: S$0.0400 per unit on 716,806.678 units of SGD Hedged Class (mth) ex on
31 January 2013 and pay on 8 February 2013) (23,164) (2013: US$0.0430 per unit on 46,065,445.631 units of USD Class (mth) ex on
31 January 2013 and pay on 8 February 2013) (1,980,814) A$0.0614 per unit on 128,021,113.798 units of AUD Hedged Class (mth) ex on 28 February 2014
and pay on 10 March 2014 (7,033,965) C$0.0478 per unit on 36,758,649.762 units of CAD Hedged Class (mth) ex on 28 February 2014
and pay on 10 March 2014 (1,587,302) EUR0.0391 per unit on 6,709,502.241 units of EUR Hedged Class (mth) ex on 28 February 2014
and pay on 10 March 2014 (362,333) GBP0.0415 per unit on 9,033,618.073 units of GBP Hedged Class (mth) ex on 28 February 2014
and pay on 10 March 2014 (628,268) HK$0.0430 per unit on 561,940,111.362 units of HKD Hedged Class (mth) ex on 28 February 2014
and pay on 10 March 2014 (3,113,422)
- 218 -
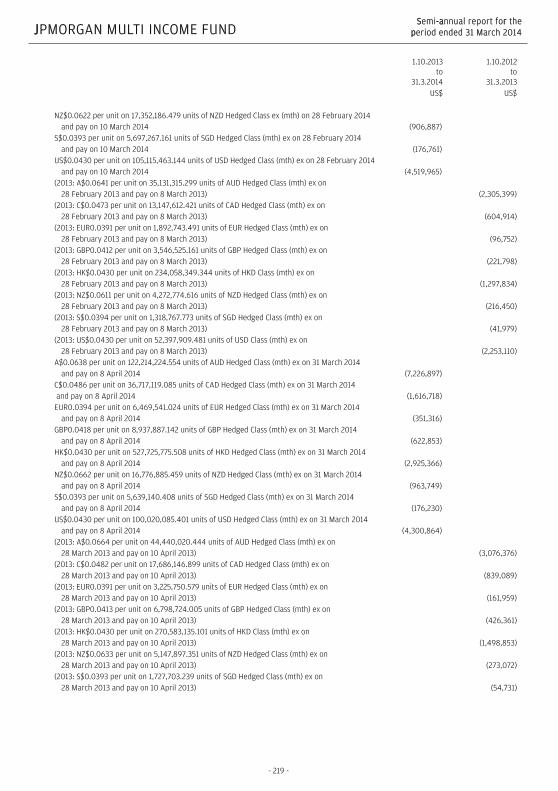
JJPMORGAN MULTI INCOME FUND SSemi--aannual report forr the
pperiod ended 31 March 2014
1.10.2013 to
31.3.2014
1.10.2012 to
31.3.2013 US$ US$ NZ$0.0622 per unit on 17,352,186.479 units of NZD Hedged Class ex (mth) on 28 February 2014
and pay on 10 March 2014 (906,887) S$0.0393 per unit on 5,697,267.161 units of SGD Hedged Class (mth) ex on 28 February 2014
and pay on 10 March 2014 (176,761) US$0.0430 per unit on 105,115,463.144 units of USD Hedged Class (mth) ex on 28 February 2014
and pay on 10 March 2014 (4,519,965) (2013: A$0.0641 per unit on 35,131,315.299 units of AUD Hedged Class (mth) ex on
28 February 2013 and pay on 8 March 2013) (2,305,399) (2013: C$0.0473 per unit on 13,147,612.421 units of CAD Hedged Class (mth) ex on
28 February 2013 and pay on 8 March 2013) (604,914) (2013: EUR0.0391 per unit on 1,892,743.491 units of EUR Hedged Class (mth) ex on
28 February 2013 and pay on 8 March 2013) (96,752) (2013: GBP0.0412 per unit on 3,546,525.161 units of GBP Hedged Class (mth) ex on
28 February 2013 and pay on 8 March 2013) (221,798) (2013: HK$0.0430 per unit on 234,058,349.344 units of HKD Class (mth) ex on
28 February 2013 and pay on 8 March 2013) (1,297,834) (2013: NZ$0.0611 per unit on 4,272,774.616 units of NZD Hedged Class (mth) ex on
28 February 2013 and pay on 8 March 2013) (216,450) (2013: S$0.0394 per unit on 1,318,767.773 units of SGD Hedged Class (mth) ex on
28 February 2013 and pay on 8 March 2013) (41,979) (2013: US$0.0430 per unit on 52,397,909.481 units of USD Class (mth) ex on
28 February 2013 and pay on 8 March 2013) (2,253,110) A$0.0638 per unit on 122,214,224.554 units of AUD Hedged Class (mth) ex on 31 March 2014
and pay on 8 April 2014 (7,226,897) C$0.0486 per unit on 36,717,119.085 units of CAD Hedged Class (mth) ex on 31 March 2014 and pay on 8 April 2014 (1,616,718) EUR0.0394 per unit on 6,469,541.024 units of EUR Hedged Class (mth) ex on 31 March 2014
and pay on 8 April 2014 (351,316) GBP0.0418 per unit on 8,937,887.142 units of GBP Hedged Class (mth) ex on 31 March 2014
and pay on 8 April 2014 (622,853) HK$0.0430 per unit on 527,725,775.508 units of HKD Hedged Class (mth) ex on 31 March 2014
and pay on 8 April 2014 (2,925,366) NZ$0.0662 per unit on 16,776,885.459 units of NZD Hedged Class (mth) ex on 31 March 2014
and pay on 8 April 2014 (963,749) S$0.0393 per unit on 5,639,140.408 units of SGD Hedged Class (mth) ex on 31 March 2014
and pay on 8 April 2014 (176,230) US$0.0430 per unit on 100,020,085.401 units of USD Hedged Class (mth) ex on 31 March 2014
and pay on 8 April 2014 (4,300,864) (2013: A$0.0664 per unit on 44,440,020.444 units of AUD Hedged Class (mth) ex on
28 March 2013 and pay on 10 April 2013) (3,076,376) (2013: C$0.0482 per unit on 17,686,146.899 units of CAD Hedged Class (mth) ex on
28 March 2013 and pay on 10 April 2013) (839,089) (2013: EUR0.0391 per unit on 3,225,750.579 units of EUR Hedged Class (mth) ex on
28 March 2013 and pay on 10 April 2013) (161,959) (2013: GBP0.0413 per unit on 6,798,724.005 units of GBP Hedged Class (mth) ex on
28 March 2013 and pay on 10 April 2013) (426,361) (2013: HK$0.0430 per unit on 270,583,135.101 units of HKD Class (mth) ex on
28 March 2013 and pay on 10 April 2013) (1,498,853) (2013: NZ$0.0633 per unit on 5,147,897.351 units of NZD Hedged Class (mth) ex on
28 March 2013 and pay on 10 April 2013) (273,072) (2013: S$0.0393 per unit on 1,727,703.239 units of SGD Hedged Class (mth) ex on
28 March 2013 and pay on 10 April 2013) (54,731)
- 219 -
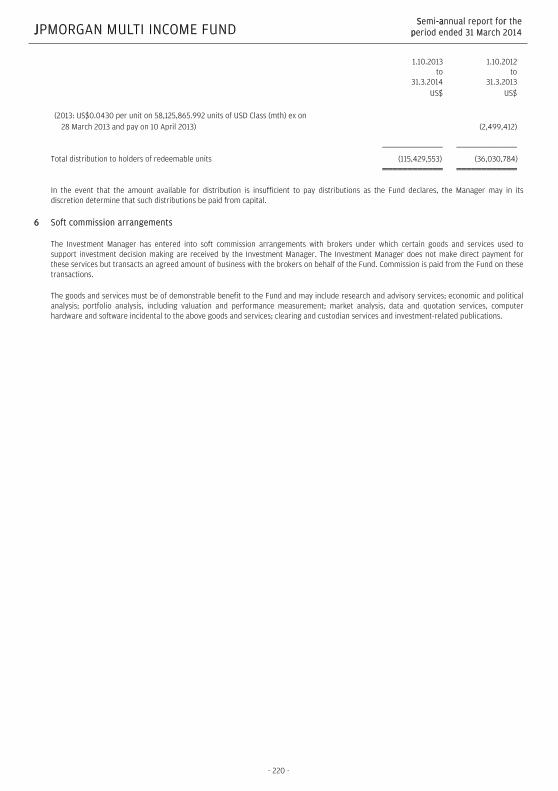
JJPMORGAN MULTI INCOME FUND SSemi--aannual report forr the
pperiod ended 31 March 2014
1.10.2013 to
31.3.2014
1.10.2012 to
31.3.2013 US$ US$
(2013: US$0.0430 per unit on 58,125,865.992 units of USD Class (mth) ex on
28 March 2013 and pay on 10 April 2013) (2,499,412)
Total distribution to holders of redeemable units (115,429,553) (36,030,784)
In the event that the amount available for distribution is insufficient to pay distributions as the Fund declares, the Manager may in its discretion determine that such distributions be paid from capital.
66 Soft commission arrangements
The Investment Manager has entered into soft commission arrangements with brokers under which certain goods and services used to support investment decision making are received by the Investment Manager. The Investment Manager does not make direct payment for these services but transacts an agreed amount of business with the brokers on behalf of the Fund. Commission is paid from the Fund on these transactions.
The goods and services must be of demonstrable benefit to the Fund and may include research and advisory services; economic and political analysis; portfolio analysis, including valuation and performance measurement; market analysis, data and quotation services, computer hardware and software incidental to the above goods and services; clearing and custodian services and investment-related publications.
- 220 -

JJPMORGAN PACIFIC SECURITIES FUND SSemi--aannual report for the
pperiod ended 31 March 2014
DDistributor Status The Fund has been certified by HMRC in the UK as a distributing fund in respect of the period from 1 January 1984 to 30 September 2010. The principal effect of this certification is that for unitholders resident or ordinarily resident in the UK for taxation purposes any gains accruing on the sale, redemption or other disposal of units during the period will be taxed in the UK as a capital gain and not as income. This treatment will continue under the new UK reporting fund regime provided the Fund does not invest more than 5% of its assets in other offshore funds which are not themselves reporting funds. There will be no need to formally apply for reporting fund status as the Fund is transparent for UK tax purposes and therefore considered out of scope of the requirements of this new regime. These are now known as “special category transparent offshore funds”. As noted, the Fund is transparent for UK income tax purposes and UK investors are subject to UK capital gains tax on disposal of their units. UK investors are subject to tax on their share of income of the Fund on an arising basis. Information has been provided to UK investors of the amount of their share of the underlying income, expenses and overseas tax suffered.
Investment Portfolio As at 31 March 2014 (Unaudited)
Holding
Fair value
US$
% of net
assets Listed/Quoted Investments (93.7%) (I) Equities (92.3%) Australia (11.3%) AMP Ltd-AU Listing 500,000 2,307,857 0.5 Asciano Ltd 400,000 1,927,848 0.5 Aurizon Holdings 550,000 2,620,205 0.6 Australia & NZ Bkg Group-
AU List 180,000 5,515,499 1.3 BHP Billiton Ltd 250,000 8,450,555 1.9 Commonwealth Bank of
Australia 130,000 9,330,784 2.1 CSL Ltd 80,000 5,157,735 1.2 Insurance Australia Group 1,150,000 5,936,938 1.4 Oil Search 400,000 3,136,460 0.7 Westfield Group Stapled
Sec 500,000 4,750,106 1.1 China (12.7%) Agricultural Bank of China
'H' 8,000,000 3,485,861 0.8 China Construction Bank
'H' 13,000,588 9,100,521 2.1 China Longyuan Power
Group 'H' 2,200,000 2,215,017 0.5 China Oilfield Services 'H' 1,300,000 3,050,129 0.7 China Overseas Land &
Investment 1,200,000 3,109,429 0.7 China Petroleum &
Chemical 'H' 2,800,000 2,505,076 0.6
(Continued)
Holding
Fair value
US$
% of net
assets China Resources Land 1,350,000 2,962,080 0.7 China State Construction
Intl 1,940,000 3,286,249 0.7 China Telecom 'H' 7,000,000 3,239,634 0.7 CNOOC Ltd 2,600,000 3,908,187 0.9 Ind & Comm Bank of China
'H' 7,000,000 4,304,471 1.0 Ping An Insurance (Group)
'H' 600,000 4,973,540 1.1 Qihoo 360 Technologies
ADR 25,000 2,489,500 0.6 Tencent Hldgs 100,000 6,954,964 1.6 Hong Kong (9.0%) AIA Group 1,100,000 5,218,479 1.2 BOC Hong Kong (Hldgs) 1,700,000 4,843,336 1.1 Cheung Kong (Hldgs) 180,000 2,984,124 0.7 Galaxy Entertainment
Group 280,000 2,434,688 0.5 HSBC Hldgs-HK List 340,240 3,445,363 0.8 Hutchison Whampoa 160,000 2,118,331 0.5 Jardine Strategic Hldgs
(CDP) 120,000 4,303,200 1.0 MGM China Hldgs 500,000 1,762,912 0.4 MTR Corp 800,000 2,959,888 0.7 New World Dev Rts (07-
14/04/14) 400,000 82,506 0.0 New World Development 1,200,000 1,206,644 0.3 Sands China 650,000 4,855,905 1.1 Wharf (Hldgs) 250,000 1,598,546 0.4 Wheelock & Co 400,000 1,562,450 0.3 India (0.4%) Reliance Ind GDR-144A 60,000 1,860,000 0.4 Japan (41.9%) Aisin Seiki 80,000 2,893,625 0.7 Bridgestone Corp 60,000 2,132,349 0.5 Daikin Industries 50,000 2,807,205 0.6 Denso Corp 50,000 2,402,292 0.6 East Japan Railway 70,000 5,169,879 1.2 Hino Motors 300,000 4,459,873 1.0 Hitachi Ltd 400,000 2,959,654 0.7 Honda Motor 80,000 2,822,935 0.7 Isuzu Motors 1,300,000 7,485,556 1.7 JFE Hldgs 300,000 5,660,048 1.3 Kubota Corp 500,000 6,636,889 1.5 Lawson Inc 50,000 3,544,205 0.8 Marubeni Corp 400,000 2,691,654 0.6 Mazda Motor 1,200,000 5,336,700 1.2 Mitsubishi Estate 350,000 8,312,861 1.9 Mitsubishi UFJ Financial
Group 2,800,000 15,415,838 3.5 Mitsui Fudosan 200,000 6,115,454 1.4 Mizuho Financial Group 2,000,000 3,961,742 0.9 MS&AD Insurance Group
Hldgs 180,000 4,131,864 1.0 Nippon Steel & Sumitomo
Metal 2,000,000 5,476,526 1.3 Nissan Motor 500,000 4,466,670 1.0 Nomura Hldgs 800,000 5,142,496 1.2
- 221 -

JJPMORGAN PACIFIC SECURITIES FUND SSemi--aannual report for the
pperiod ended 31 March 2014
IInvestment Portfolio (Continued) As at 31 March 2014 (Unaudited)
Holding
Fair value
US$
% of net
assets Japan (Continued) Nomura Real Estate Office
Fd 400 1,749,769 0.4 Orix Corp 150,000 2,116,328 0.5 Pigeon Corp 50,000 2,262,465 0.5 Rakuten Inc 150,000 2,005,632 0.5 Sanrio Co 50,000 1,689,566 0.4 Sekisui House 400,000 4,975,482 1.1 Shin-Etsu Chemical 80,000 4,581,638 1.1 Softbank Corp 80,000 6,059,135 1.4 Sumitomo Mitsui Financial
Grp 340,000 14,556,101 3.3 Sumitomo Realty &
Development 150,000 5,887,265 1.4 Sumitomo Rubber
Industries 300,000 3,827,742 0.9 THK Co 100,000 2,249,842 0.5 Tokio Marine Hldgs 150,000 4,512,308 1.0 Toshiba Corp 1,000,000 4,243,336 1.0 Toyota Motor 150,000 8,485,702 1.9 Unicharm Corp 60,000 3,211,924 0.7 Korea (9.4%) CJ O Shopping Co 6,000 2,053,455 0.5 GS Hldgs 45,000 2,037,672 0.5 Hyundai Heavy Industries 15,000 2,973,367 0.7 Hyundai Motor 12,000 2,829,630 0.6 KB Financial Group 120,000 4,199,352 0.9 KIA Motors 40,000 2,228,381 0.5 POSCO 20,000 5,561,558 1.3 Samsung Electronics 11,000 13,878,529 3.2 Samsung Fire & Marine
Insurance 10,000 2,249,988 0.5 SK Innovation 16,000 1,833,811 0.4 SK Telecom ADR 60,000 1,354,200 0.3 Malaysia (0.5%) Malayan Banking 800,000 2,371,459 0.5 Singapore (1.2%) DBS Group Hldgs 400,000 5,143,334 1.2 Taiwan (3.8%) Ruentex Development 1,500,000 2,743,617 0.7 Taiwan Semiconductor
Mfg 3,500,000 13,619,571 3.1 Thailand (2.1%) Bangkok Bank (F) 600,000 3,319,975 0.8 Banpu Public Co (F) 2,309,700 1,993,576 0.5 PTT Public Co (F) 400,000 3,686,806 0.8 402,473,848 92.3 (II) Debt Securities (1.0%) Hong Kong (1.0%) Sino-Ocean Land VRN
10.25%Perp-RegS USD3,800,000 4,130,890 1.0
(Continued)
Holding
Fair value
US$
% of net
assets (III) Derivatives (0.4%) Forward foreign exchange ccontracts (0.4%) 1,663,525 0.4 Total Listed/Quoted Investments 408,268,263 93.7 Other net assets 27,596,571 6.3 Net assets attributable to holders of
rredeemable units at 31 March 2014 435,864,834 100.0 Total investments, at cost 412,373,033
- 222 -

JJPMORGAN PACIFIC SECURITIES FUND SSemi--aannual report for the
pperiod ended 31 March 2014
SStatement of Movements in Portfolio Holdings For the period ended 31 March 2014 (Unaudited) % holdings
of net assets 31.3.2014 30.9.2013 Listed/Quoted Investments Equities Japan 41.9 40.4 China 12.7 12.1 Australia 11.3 12.6 Korea 9.4 10.7 Hong Kong 9.0 8.8 Taiwan 3.8 4.3 Thailand 2.1 2.8 Singapore 1.2 2.4 Malaysia 0.5 0.6 India 0.4 - New Zealand - 0.6 Debt Securities Hong Kong 1.0 1.0 Derivatives Forward foreign exchange contracts 0.4 0.0 Total LListed/Quoted Investments 93.7 96.3 Other net assets 6.3 3.7 Net assets attributable to holders of
rredeemable units 100.0 100.0
- 223 -

JJPMORGAN PACIFIC SECURITIES FUND SSemi--aannual report for the
pperiod ended 31 March 2014
SStatement of Financial Position As at 31 March 2014 (Unaudited) 31.3.2014 30.9.2013 US$ US$ Assets Cash at banks 15,597,617 2,359,633 Amounts due from brokers 9,447,500 9,928,666 Amounts receivable on allotment 8,280,798 13,718,973 Margin deposits - 49 Derivatives 1,663,525 177,445 Investments 406,604,738 423,029,436 Dividend and other accounts
receivable 2,292,447 1,856,448 Total assets 443,886,625 451,070,650 ---------- ---------- Liabilities Amounts due to brokers 6,505,717 6,091,434 Amounts payable on redemption 944,814 4,676,178 Other accounts payable 571,260 674,260 Total liabilities 8,021,791 11,441,872 ---------- ---------- Net assets attributable to holders
oof redeemable units [Note 3] 435,864,834 439,628,778 Equity 435,864,834 439,628,778
Statement of Comprehensive Income For the period ended 31 March 2014 (Unaudited) 1.10.2013
to 31.3.2014
1.10.2012 to
31.3.2013 US$ US$ Income Net (losses)/gains on investments
and derivatives [Note 4] (10,620,174) 44,666,717 Dividend income 4,110,904 3,722,538 Interest on deposits 387 613 Net foreign currency exchange
(losses)/gains (90,738) 166,283 (6,599,621) 48,556,151 ---------- ---------- Expenses Management fee 3,276,192 2,873,392 Transaction costs 887,949 1,578,374 Trustee's fee 63,859 57,072 Registrar's fee 59,627 42,838 Safe custody and bank charges 38,266 38,442 Auditor's fee 9,773 9,564 Valuation fee 8,050 8,330 Printing and publication expenses 7,755 2,088 Legal and professional expenses 2,938 2,619 Other operating expenses 7,562 4,454 4,361,971 4,617,173 ---------- ---------- Net operating (loss)/profit (10,961,592) 43,938,978 Finance costs Interest paid (7,503) (78,367) (Loss)/profit before taxation (10,969,095) 43,860,611 Taxation (367,604) (332,288) (Decrease)/increase in net
aassets attributable to holdersof redeemable units and total comprehensive income (11,336,699) 43,528,323
The notes on pages 226 to 228 form part of these financial statements.
- 224 -

JJPMORGAN PACIFIC SECURITIES FUND SSemi--aannual report for the
pperiod ended 31 March 2014
SStatement of Changes in Net Assets Attributable to Holders of Redeemable Units For the period ended 31 March 2014 (Unaudited) 1.10.2013
to 31.3.2014
1.10.2012 to
31.3.2013 US$ US$ Net assets attributable to hholders
of redeemable units at the beginning of the period 439,628,778 375,783,630
---------- ---------- Allotment of redeemable units 99,177,978 27,686,027 Redemption of redeemable units (91,605,223) (49,689,689) Net allotment/(redemption) 7,572,755 (22,003,662) ---------- ---------- 447,201,533 353,779,968 (Decrease)/increase in net assets
attributable to holders of redeemable units and total comprehensive income (11,336,699) 43,528,323
Net assets attributable to holders
oof redeemable units at the end of the period 435,864,834 397,308,291
Statement of Cash Flows For the period ended 31 March 2014 (Unaudited) 1.10.2013
to 31.3.2014
1.10.2012 to
31.3.2013 US$ US$ Operating activities Purchase of investments and
derivatives (375,402,526) (535,250,357) Proceeds from disposal of
investments and derivatives 380,617,879 533,221,383 Dividend received 3,673,340 2,812,864 Interest received 348 603 Decrease in margin deposits 49 - Trustee's fee paid (63,907) (56,480) Registrar's fee paid (110,240) (79,696) Tax paid (367,604) (332,288) Transaction costs paid (891,495) (1,652,446) Management fee paid (3,279,075) (2,838,126) Others (1,690) 145,627 Net cash inflow/(outflow) from
ooperating activities 4,175,079 (4,028,916) ---------- ---------- Financing activities Interest paid (7,503) (76,063) Receipts on allotment of
redeemable units 104,616,153 26,250,916 Payments on redemption of
redeemable units (95,336,587) (48,839,949) Net cash inflow/(outflow) from
ffinancing activities 9,272,063 (22,665,096) ---------- ---------- Increase/(decrease) in cash and
ccash equivalents 13,447,142 (26,694,012) Cash and cash equivalents at the
beginning of the period 2,359,633 335,925 Exchange losses on cash and cash
equivalents (209,158) (64,872) Cash and cash equivalents at
tthe end of the period 15,597,617 (26,422,959) Analysis of balances of cash and cash equivalents: Cash at banks 15,597,617 726,783 Short term bank loans -
unsecured - (27,149,742) 15,597,617 (26,422,959)
The notes on pages 226 to 228 form part of these financial statements.
- 225 -

JJPMORGAN PACIFIC SECURITIES FUND SSemi--aannual report for the
pperiod ended 31 March 2014
NNotes to the Financial Statements
1 The Fund
JPMorgan Pacific Securities Fund (the "Fund") was established under a Trust Deed dated 7 April 1978, as amended, and is governed by the laws of Hong Kong. The Fund is authorized by the Securities and Futures Commission of Hong Kong.
The investment objective of the Fund is to provide investors with long-term capital growth by investing primarily in the securities of companies in the Asia-Pacific region, including Japan, Australia and New Zealand.
Pursuant to the Supplemental Trust Deed dated 4 January 2013, the Manager may decide to issue separate classes (each a "Class") whose assets will be commonly invested but where a specific fee structure, currency or distribution policy may be applied. Each Class may have a different charging structure with the result that the net asset value attributable to each Class may differ.
All unitholders' rights with regard to the convening, voting or otherwise acting at any meeting of unitholders are the same.
2 Summary of principal accounting policies
(a) Accounting policies of interim financial statements
The accounting policies and methods of computation used in the preparation of these unaudited condensed interim financial statements are consistent with those used in the annual financial statements for the year ended 30 September 2013.
(b) Investments and derivatives
Classification
The Fund classifies its investments and derivatives as financial assets or financial liabilities at fair value through profit or loss. These financial assets or financial liabilities are held-for-trading as they are acquired or incurred principally for the purpose of selling or repurchasing in the near term or short-term profit taking.
All derivatives are carried in assets when amounts are receivable by the Fund and in liabilities when amounts are payable by the Fund.
The Fund makes short sales in which a borrowed security is sold in anticipation of a decline in the market value of that security, or it may use short sales for various arbitrage transactions. Short sales are classified as financial liabilities at fair value through profit or loss.
Recognition, derecognition and measurement
Purchases and sales of investments and derivatives are accounted for on the trade date basis. Investments and derivatives are initially recognized at fair value and are subsequently re-measured at fair value. Realized and unrealized gains and losses on investments and derivatives are recognized in the Statement of Comprehensive Income. Investments and derivatives are derecognized when the rights to receive cash flows from the investments and derivatives have expired or the Fund has transferred substantially all risks and rewards of ownership.
Fair value estimation
Fair value is the price that would be received to sell an asset or paid to transfer a liability in an orderly transaction between market participants at the measurement date. The fair value of financial assets and liabilities traded in active markets are based on last traded prices. Prior to 1 October 2012, investments that are listed or traded on an exchange and investments with prices quoted in over-the-counter markets or by market makers, are fair valued based on quoted "bid" prices on long investments and quoted "ask" prices on investments sold short. The Fund early adopted Hong Kong Financial Reporting Standard 13, "Fair Value Measurement", with effect from 1 October 2012, it changed its fair valuation input to utilize the last traded market price for both financial assets and financial liabilities where the last traded price falls within the bid-ask spread. When trading in the securities of an investee company is suspended, the investment is valued at the Manager's estimate of its fair value.
Debt securities are fair valued based on quoted prices inclusive of accrued interest.
Investments in collective investment schemes are stated at fair value based on the net asset value per unit of the respective funds as determined by the administrators of the relevant funds or stated at last traded prices if the collective investment schemes are listed or traded on an exchange.
Open future and swap contracts are valued at last traded prices for both long and short positions at the valuation date. The differences between the last traded prices and the contract prices are recognized in the Statement of Comprehensive Income.
Open option contracts are valued at last traded prices for both long and short positions at the valuation date. The differences between the last traded prices and the premium amounts/contract prices are recognized in the Statement of Comprehensive Income.
- 226 -

JJPMORGAN PACIFIC SECURITIES FUND SSemi--aannual report for the
pperiod ended 31 March 2014
Forward foreign exchange contracts are valued at the forward rates ruling at the valuation date. The differences between the forward rates and the contract rates are recognized in the Statement of Comprehensive Income.
((c) Securities lending and borrowing
Securities lenders' agreements are entered into with institutions of appropriate financial standing who engage in such arrangements acceptable to the Trustee and on arm's length commercial terms. Securities lent are included in the investment portfolio of the Fund. Relevant securities lending income entitled by the Fund is accounted for in the Statement of Comprehensive Income. Collateral received for the purpose of securities lent generally consist of non-cash collateral which are off-balance sheet transactions and are therefore not included in the financial statements.
The Fund may enter into securities borrowing arrangements for short sale purposes. Short positions represent obligations to deliver securities sold but not yet purchased, and are accounted for as investments and valued at their fair value. Securities borrowed during the period/year are off-balance sheet transactions and are therefore not included in the investment portfolio of the Fund. Collateral placed for the purpose of securities borrowed generally consist of cash collateral and are included in the Statement of Financial Position separately.
(d) Foreign currency translation
Functional and presentation currency
The Fund has adopted United States dollar as its functional and presentation currency.
Transactions and balances
Foreign currency transactions are translated into the functional currency using the exchange rates prevailing at the dates of the transactions.
Foreign exchange gains and losses resulting from the settlement of such transactions and from the translation of assets and liabilities denominated in foreign currencies at period/year end exchange rates are recognized in the Statement of Comprehensive Income.
Foreign exchange gains and losses relating to cash and cash equivalents are presented in the Statement of Comprehensive Income within "Net foreign currency exchange gains/losses". Foreign exchange gains and losses relating to the financial assets and liabilities carried at fair value through profit or loss are presented in the Statement of Comprehensive Income within "Net gains/losses on investments and derivatives".
(e) Proceeds and payments on allotment and redemption of units
The net asset value per unit is computed for each dealing day. The price at which units are allotted or redeemed is calculated by reference to the net asset value per unit as at the close of business on the relevant dealing day in accordance with the provisions of the Fund's Trust Deed dated 7 April 1978, as amended, which may be different from the accounting policies stated in the financial statements.
3 Number of units in issue and net assets attributable to holders of redeemable units (per unit)
31.3.2014
USD Class (acc) Units Number of units in issue: 1,712,145.418 US$ Net assets attributable to
holders of redeemable units 435,864,834
Net assets attributable to
holders of redeemable units (per unit) 254.57
- 227 -

JJPMORGAN PACIFIC SECURITIES FUND SSemi--aannual report for the
pperiod ended 31 March 2014
30.9.2013
USD Class (acc) Units Number of units in issue: 1,682,651.916 US$ Net assets attributable to
holders of redeemable units 439,628,778
Net assets attributable to
holders of redeemable units (per unit) 261.27
44 Net (losses)/gains on investments and derivatives
1.10.2013
to 31.3.2014
1.10.2012 to
31.3.2013 US$ US$ Change in unrealized gains/losses in value of investments and derivatives (20,336,398) 4,726,824 Realized gains on sale of investments and derivatives 9,716,224 39,939,893 (10,620,174) 44,666,717
5 Soft commission arrangements
The Investment Manager has entered into soft commission arrangements with brokers under which certain goods and services used to support investment decision making are received by the Investment Manager. The Investment Manager does not make direct payment for these services but transacts an agreed amount of business with the brokers on behalf of the Fund. Commission is paid from the Fund on these transactions.
The goods and services must be of demonstrable benefit to the Fund and may include research and advisory services; economic and political analysis; portfolio analysis, including valuation and performance measurement; market analysis, data and quotation services, computer hardware and software incidental to the above goods and services; clearing and custodian services and investment-related publications.
6 Distribution
No distribution was made during the period (31 March 2013: nil).
- 228 -

JJPMORGAN PACIFIC TECHNOLOGY FUND SSemi--aannual report for the
pperiod ended 31 March 2014
DDistributor Status The Fund has been certified by HMRC in the UK as a distributing fund in respect of the period from 14 August 1997 to 30 September 2010. The principal effect of this certification is that for unitholders resident or ordinarily resident in the UK for taxation purposes any gains accruing on the sale, redemption or other disposal of units during the period will be taxed in the UK as a capital gain and not as income. This treatment will continue under the new UK reporting fund regime provided the Fund does not invest more than 5% of its assets in other offshore funds which are not themselves reporting funds. There will be no need to formally apply for reporting fund status as the Fund is transparent for UK tax purposes and therefore considered out of scope of the requirements of this new regime. These are now known as "special category transparent offshore funds ". As noted, the Fund is transparent for UK income tax purposes and UK investors are subject to UK capital gains tax on disposal of their units. UK investors are subject to tax on their share of income of the Fund on an arising basis. Information has been provided to UK investors of the amount of their share of the underlying income, expenses and overseas tax suffered.
Investment Portfolio As at 31 March 2014 (Unaudited)
Holding
Fair value
US$
% of net
assets Listed/Quoted Investments (92.8%) Equities (92.8%) Australia (0.5%) Computershare Ltd 41,525 465,698 0.5 China (12.2%) AAC Technologies Hldgs 45,000 232,917 0.2 Coolpad Group 2,548,000 1,251,491 1.3 GCL Poly Energy Hldgs 587,000 211,885 0.2 Kingsoft Corp 41,000 161,472 0.2 Lenovo Group 718,000 793,247 0.8 Semiconductor Mfg Intl 13,464,000 1,006,713 1.0 Tencent Hldgs 122,300 8,505,919 8.5 Japan (26.5%) Brother Industries 28,400 397,934 0.4 Canon Inc 83,000 2,571,763 2.6 Cyber Agent 16,500 632,859 0.6 FUJIFILM Hldgs 45,600 1,226,952 1.2 Fujitsu Ltd 220,000 1,333,010 1.3 Gree Inc 55,500 614,361 0.6 Hamamatsu Photonics 1,700 76,759 0.1 Hitachi Ltd 436,000 3,226,023 3.2 Hoya Corp 51,200 1,597,374 1.6 JCU Corp 3,800 242,055 0.3 Kakaku.com Inc 17,500 285,309 0.3 Keyence Corp 5,420 2,240,418 2.2 Konami Corp 6,500 150,532 0.2 Murata Mfg 32,200 3,043,812 3.0 NEC Corp 402,000 1,237,404 1.2
(Continued)
Holding
Fair value
US$
% of net
assets NTT Data 13,300 518,517 0.5 Omron Corp 24,900 1,029,995 1.0 Oracle Corp Japan 4,500 204,277 0.2 Otsuka Corp 2,100 274,875 0.3 Rohm Co 23,800 1,064,223 1.1 Shibuya Kogyo 22,700 606,156 0.6 Tabuchi Electric Co 47,000 329,048 0.3 TDK Corp 29,700 1,242,967 1.3 Teikoku Electric Mfg 8,300 272,409 0.3 THK Co 22,700 510,714 0.5 Yahoo Japan 166,900 820,036 0.8 Yokogawa Electric 51,600 835,240 0.8 Korea (17.8%) CrucialTec Co 41,010 487,366 0.5 LG Chem 2,110 503,490 0.5 LG Display 41,520 1,039,511 1.0 LG Electronics 6,802 414,721 0.4 NAVER Corp 4,371 3,178,312 3.2 NCsoft Corp 815 166,912 0.2 NEPES Corp 75,009 564,444 0.6 Samsung Electronics 6,383 8,053,332 8.0 Samsung Electronics Pref 1,786 1,773,500 1.8 Samsung Techwin 9,331 507,553 0.5 Seoul Semiconductor 8,120 345,564 0.3 SK C&C Co 3,999 561,652 0.5 Wemade Entertainment 6,149 276,126 0.3 Taiwan (35.8%) Addcn Technology Co 110,000 1,517,117 1.5 Advanced Power Electronics 1,400,000 1,370,002 1.4 Advanced Semiconductor Eng 1,995,463 2,214,815 2.2 Advantech Co 63,000 408,587 0.4 Altek Corp 806,000 902,540 0.9 Asustek Computer 62,000 613,841 0.6 Auto Server 12,000 42,164 0.0 Capella Microsystems Taiwan 41,000 152,812 0.1 Career Technology 143,000 158,250 0.2 Casetek Hldgs 18,000 98,120 0.1 Chicony Power Technology 104,000 152,999 0.2 Chipbond Technology 346,000 611,273 0.6 Delta Electronics 20,000 123,471 0.1 Depo Auto Parts Industrial 51,000 198,457 0.2 Dynacolor Inc 57,000 156,293 0.2 Elan Microelectronics 259,000 498,396 0.5 Epistar Corp 82,000 196,838 0.2 Global Unichip 195,000 567,343 0.6 Hon Hai Precision Ind 352,074 997,750 1.0 HTC Corp 281,000 1,411,805 1.4 Innolux Corp 871,000 298,890 0.3 Intai Technology 42,000 242,739 0.2 Kaori Heat Treatment 682,000 1,840,913 1.8 King Slide Works 62,000 844,922 0.8 Kinik Co 386,000 1,226,986 1.2 Kinsus Interconnect
Technology 90,000 333,963 0.3 Lotes Co 304,000 1,063,164 1.1 MediaTek Inc 40,348 595,564 0.6 Novatek Microelectronics 368,000 1,685,773 1.7 Pegatron Corp 311,000 463,143 0.5
- 229 -

JJPMORGAN PACIFIC TECHNOLOGY FUND SSemi--aannual report for the
pperiod ended 31 March 2014
IInvestment Portfolio (Continued) As at 31 March 2014 (Unaudited)
Holding
Fair value
US$
% of net
assets Taiwan (Continued) Powertech Technology 872,000 1,318,631 1.3 Quanta Computer 216,000 581,627 0.6 Radiant Opto-Electronics 65,000 262,540 0.3 Silergy Corp 22,000 219,982 0.2 Simplo Technology 189,000 899,926 0.9 Sino-American Silicon
Products 355,000 621,345 0.6 Synnex Technology 62,000 99,762 0.1 Systex Corp 813,000 1,903,519 1.9 Taiwan IC Packaging 1,837,000 687,687 0.7 Taiwan Semiconductor Mfg 1,155,788 4,497,525 4.5 Test Research 229,000 371,483 0.4 TPK Hldg Co 86,000 509,745 0.5 Unimicron Technology 378,000 304,113 0.3 United Microelectronics 369,000 155,706 0.2 Wistron NeWeb 986,000 2,221,151 2.2 Yeong Guan Energy
Technology Group 52,000 250,160 0.2 Total Listed/Quoted Investments 92,980,679 92.8 Other net assets 7,231,853 7.2 Net assets attributable to holders of
rredeemable units at 31 March 2014 100,212,532 100.0 Total investments, at cost 84,666,599
Statement of Movements in Portfolio Holdings For the period ended 31 March 2014 (Unaudited) % holdings
of net assets 31.3.2014 30.9.2013 Listed/Quoted Investments Equities Taiwan 35.8 25.2 Japan 26.5 30.8 Korea 17.8 28.9 China 12.2 6.9 Australia 0.5 - Hong Kong - 2.2 Thailand - 1.5 Total Listed/Quoted Investments 92.8 95.5 Other net assets 7.2 4.5 Net assets attributable to holders of
rredeemable units 100.0 100.0
- 230 -
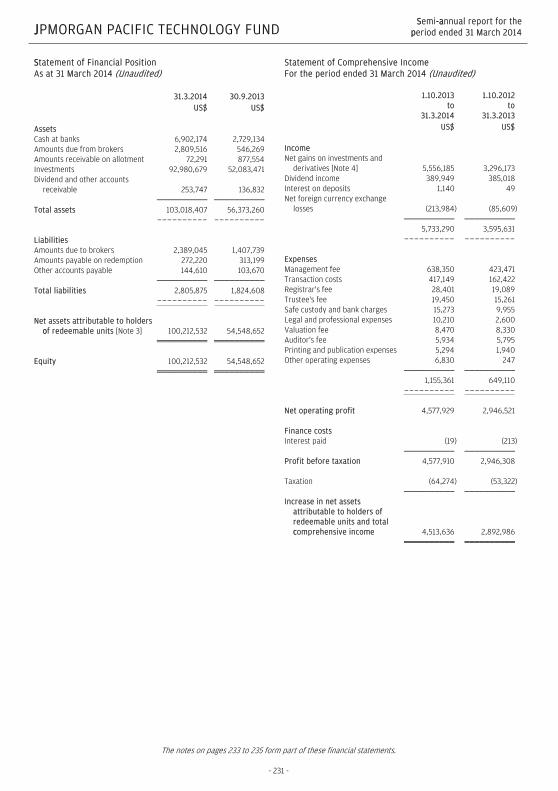
JJPMORGAN PACIFIC TECHNOLOGY FUND SSemi--aannual report for the
pperiod ended 31 March 2014
SStatement of Financial Position As at 31 March 2014 (Unaudited) 31.3.2014 30.9.2013 US$ US$ Assets Cash at banks 6,902,174 2,729,134 Amounts due from brokers 2,809,516 546,269 Amounts receivable on allotment 72,291 877,554 Investments 92,980,679 52,083,471 Dividend and other accounts
receivable 253,747 136,832 Total assets 103,018,407 56,373,260 ---------- ---------- Liabilities Amounts due to brokers 2,389,045 1,407,739 Amounts payable on redemption 272,220 313,199 Other accounts payable 144,610 103,670 Total liabilities 2,805,875 1,824,608 ---------- ---------- Net assets attributable to holders
oof redeemable units [Note 3] 100,212,532 54,548,652 Equity 100,212,532 54,548,652
Statement of Comprehensive Income For the period ended 31 March 2014 (Unaudited) 1.10.2013
to 31.3.2014
1.10.2012 to
31.3.2013 US$ US$ Income Net gains on investments and
derivatives [Note 4] 5,556,185 3,296,173 Dividend income 389,949 385,018 Interest on deposits 1,140 49 Net foreign currency exchange
losses (213,984) (85,609) 5,733,290 3,595,631 ---------- ---------- Expenses Management fee 638,350 423,471 Transaction costs 417,149 162,422 Registrar's fee 28,401 19,089 Trustee's fee 19,450 15,261 Safe custody and bank charges 15,273 9,955 Legal and professional expenses 10,210 2,600 Valuation fee 8,470 8,330 Auditor's fee 5,934 5,795 Printing and publication expenses 5,294 1,940 Other operating expenses 6,830 247 1,155,361 649,110 ---------- ---------- Net operating profit 4,577,929 2,946,521 Finance costs Interest paid (19) (213) Profit before taxation 4,577,910 2,946,308 Taxation (64,274) (53,322) Increase in net assets
attributable to holders of redeemable units and total ccomprehensive income 4,513,636 2,892,986
The notes on pages 233 to 235 form part of these financial statements.
- 231 -
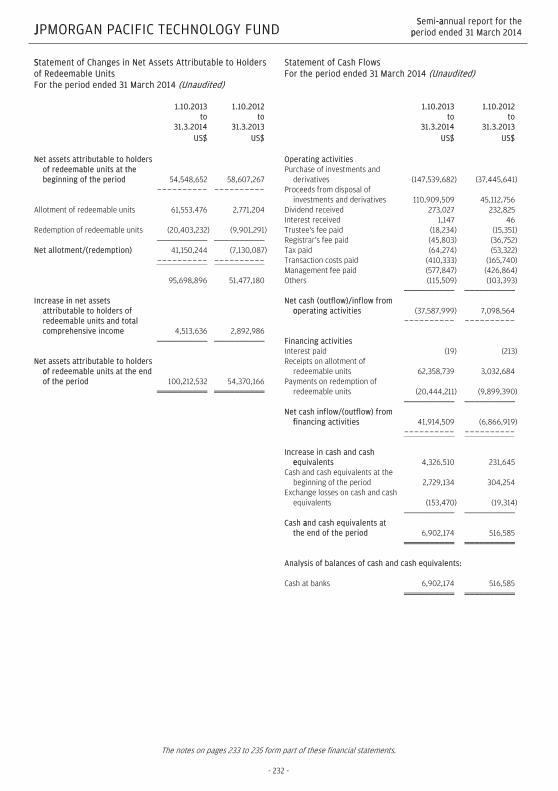
JJPMORGAN PACIFIC TECHNOLOGY FUND SSemi--aannual report for the
pperiod ended 31 March 2014
SStatement of Changes in Net Assets Attributable to Holders of Redeemable Units For the period ended 31 March 2014 (Unaudited) 1.10.2013
to 31.3.2014
1.10.2012 to
31.3.2013 US$ US$ Net assets attributable to holders
of redeemable units at the beginning of the period 54,548,652 58,607,267
---------- ---------- Allotment of redeemable units 61,553,476 2,771,204 Redemption of redeemable units (20,403,232) (9,901,291) Net allotment/(redemption) 41,150,244 (7,130,087) ---------- ---------- 95,698,896 51,477,180 Increase iin net assets
attributable to holders of redeemable units and total comprehensive income 4,513,636 2,892,986
Net assets attributable to holders
oof redeemable units at the end of the period 100,212,532 54,370,166
Statement of Cash Flows For the period ended 31 March 2014 (Unaudited) 1.10.2013
to 31.3.2014
1.10.2012 to
31.3.2013 US$ US$ Operating activities Purchase of investments and
derivatives (147,539,682) (37,445,641) Proceeds from disposal of
investments and derivatives 110,909,509 45,112,756 Dividend received 273,027 232,825 Interest received 1,147 46 Trustee's fee paid (18,234) (15,351) Registrar's fee paid (45,803) (36,752) Tax paid (64,274) (53,322) Transaction costs paid (410,333) (165,740) Management fee paid (577,847) (426,864) Others (115,509) (103,393) Net cash (outflow)/inflow from
ooperating activities (37,587,999) 7,098,564 ---------- ---------- Financing activities Interest paid (19) (213) Receipts on allotment of
redeemable units 62,358,739 3,032,684 Payments on redemption of
redeemable units (20,444,211) (9,899,390) Net cash inflow/(outflow) from
ffinancing activities 41,914,509 (6,866,919) ---------- ---------- Increase in cash and cash
eequivalents 4,326,510 231,645 Cash and cash equivalents at the
beginning of the period 2,729,134 304,254 Exchange losses on cash and cash
equivalents (153,470) (19,314) Cash aand cash equivalents at
the end of the period 6,902,174 516,585 Analysis of balances of cash and cash equivalents: Cash at banks 6,902,174 516,585
The notes on pages 233 to 235 form part of these financial statements.
- 232 -

JJPMORGAN PACIFIC TECHNOLOGY FUND SSemi--aannual report for the
pperiod ended 31 March 2014
NNotes to the Financial Statements
1 The Fund
JPMorgan Pacific Technology Fund (the "Fund") was established under a Trust Deed dated 14 August 1997, as amended, and is governed by the laws of Hong Kong. The Fund is authorized by the Securities and Futures Commission of Hong Kong.
The investment objective of the Fund is to provide long-term capital growth through a portfolio consisting primarily of securities of technology companies in the Pacific region, including Japan.
Pursuant to the Supplemental Trust Deed dated 4 January 2013, the Manager may decide to issue separate classes (each a "Class") whose assets will be commonly invested but where a specific fee structure, currency or distribution policy may be applied. Each Class may have a different charging structure with the result that the net asset value attributable to each Class may differ.
All unitholders' rights with regard to the convening, voting or otherwise acting at any meeting of unitholders are the same.
2 Summary of principal accounting policies
(a) Accounting policies of interim financial statements
The accounting policies and methods of computation used in the preparation of these unaudited condensed interim financial statements are consistent with those used in the annual financial statements for the year ended 30 September 2013.
(b) Investments and derivatives
Classification
The Fund classifies its investments and derivatives as financial assets or financial liabilities at fair value through profit or loss. These financial assets or financial liabilities are held-for-trading as they are acquired or incurred principally for the purpose of selling or repurchasing in the near term or short-term profit taking.
All derivatives are carried in assets when amounts are receivable by the Fund and in liabilities when amounts are payable by the Fund.
The Fund makes short sales in which a borrowed security is sold in anticipation of a decline in the market value of that security, or it may use short sales for various arbitrage transactions. Short sales are classified as financial liabilities at fair value through profit or loss.
Recognition, derecognition and measurement
Purchases and sales of investments and derivatives are accounted for on the trade date basis. Investments and derivatives are initially recognized at fair value and are subsequently re-measured at fair value. Realized and unrealized gains and losses on investments and derivatives are recognized in the Statement of Comprehensive Income. Investments and derivatives are derecognized when the rights to receive cash flows from the investments and derivatives have expired or the Fund has transferred substantially all risks and rewards of ownership.
Fair value estimation
Fair value is the price that would be received to sell an asset or paid to transfer a liability in an orderly transaction between market participants at the measurement date. The fair value of financial assets and liabilities traded in active markets are based on last traded prices. Prior to 1 October 2012, investments that are listed or traded on an exchange and investments with prices quoted in over-the-counter markets or by market makers, are fair valued based on quoted "bid" prices on long investments and quoted "ask" prices on investments sold short. The Fund early adopted Hong Kong Financial Reporting Standard 13, "Fair Value Measurement", with effect from 1 October 2012, it changed its fair valuation input to utilize the last traded market price for both financial assets and financial liabilities where the last traded price falls within the bid-ask spread. When trading in the securities of an investee company is suspended, the investment is valued at the Manager's estimate of its fair value.
Debt securities are fair valued based on quoted prices inclusive of accrued interest.
Investments in collective investment schemes are stated at fair value based on the net asset value per unit of the respective funds as determined by the administrators of the relevant funds or stated at last traded prices if the collective investment schemes are listed or traded on an exchange.
Open future and swap contracts are valued at last traded prices for both long and short positions at the valuation date. The differences between the last traded prices and the contract prices are recognized in the Statement of Comprehensive Income.
Open option contracts are valued at last traded prices for both long and short positions at the valuation date. The differences between the last traded prices and the premium amounts/contract prices are recognized in the Statement of Comprehensive Income.
- 233 -

JJPMORGAN PACIFIC TECHNOLOGY FUND SSemi--aannual report for the
pperiod ended 31 March 2014
Forward foreign exchange contracts are valued at the forward rates ruling at the valuation date. The differences between the forward rates and the contract rates are recognized in the Statement of Comprehensive Income.
((c) Securities borrowing
The Fund may enter into securities borrowing arrangements for short sale purposes. Short positions represent obligations to deliver securities sold but not yet purchased, and are accounted for as investments and valued at their fair value. Securities borrowed during the period/year are off-balance sheet transactions and are therefore not included in the investment portfolio of the Fund. Collateral placed for the purpose of securities borrowed generally consist of cash collateral and are included in the Statement of Financial Position separately.
(d) Foreign currency translation
Functional and presentation currency
The Fund has adopted United States dollar as its functional and presentation currency.
Transactions and balances
Foreign currency transactions are translated into the functional currency using the exchange rates prevailing at the dates of the transactions.
Foreign exchange gains and losses resulting from the settlement of such transactions and from the translation of assets and liabilities denominated in foreign currencies at period/year end exchange rates are recognized in the Statement of Comprehensive Income.
Foreign exchange gains and losses relating to cash and cash equivalents are presented in the Statement of Comprehensive Income within "Net foreign currency exchange gains/losses". Foreign exchange gains and losses relating to the financial assets and liabilities carried at fair value through profit or loss are presented in the Statement of Comprehensive Income within "Net gains/losses on investments and derivatives".
(e) Proceeds and payments on allotment and redemption of units
The net asset value per unit is computed for each dealing day. The price at which units are allotted or redeemed is calculated by reference to the net asset value per unit as at the close of business on the relevant dealing day in accordance with the provisions of the Fund's Trust Deed dated 14 August 1997, as amended, which may be different from the accounting policies stated in the financial statements.
3 Number of units in issue and net assets attributable to holders of redeemable units (per unit)
31.3.2014
USD Class (acc) Units Number of units in issue: 2,447,256.174 US$ Net assets attributable to
holders of redeemable units 100,212,532
Net assets attributable to
holders of redeemable units (per unit) 40.95
- 234 -

JJPMORGAN PACIFIC TECHNOLOGY FUND SSemi--aannual report for the
pperiod ended 31 March 2014
30.9.2013
USD Class (acc) Units Number of units in issue: 1,409,670.647 US$ Net assets attributable to
holders of redeemable units 54,548,652
Net assets attributable to
holders of redeemable units (per unit) 38.70
44 Net gains on investments and derivatives
1.10.2013
to 31.3.2014
1.10.2012 to
31.3.2013 US$ US$ Change in unrealized gains/losses in value of investments and derivatives 2,734,530 (1,655,518) Realized gains on sale of investments and derivatives 2,821,655 4,951,691 5,556,185 3,296,173
5 Soft commission arrangements
The Investment Manager has entered into soft commission arrangements with brokers under which certain goods and services used to support investment decision making are received by the Investment Manager. The Investment Manager does not make direct payment for these services but transacts an agreed amount of business with the brokers on behalf of the Fund. Commission is paid from the Fund on these transactions.
The goods and services must be of demonstrable benefit to the Fund and may include research and advisory services; economic and political analysis; portfolio analysis, including valuation and performance measurement; market analysis, data and quotation services, computer hardware and software incidental to the above goods and services; clearing and custodian services and investment-related publications.
6 Distribution
No distribution was made during the period (31 March 2013: nil).
- 235 -

JJPMORGAN PHILIPPINE FUND SSemi--aannual report for the
pperiod ended 31 March 2014
DDistributor Status The Fund has been certified by HMRC in the UK as a distributing fund in respect of the period from 30 June 1987 to 30 September 2010. The principal effect of this certification is that for unitholders resident or ordinarily resident in the UK for taxation purposes any gains accruing on the sale, redemption or other disposal of units during the period will be taxed in the UK as a capital gain and not as income. This treatment will continue under the new UK reporting fund regime provided the Fund does not invest more than 5% of its assets in other offshore funds which are not themselves reporting funds. There will be no need to formally apply for reporting fund status as the Fund is transparent for UK tax purposes and therefore considered out of scope of the requirements of this new regime. These are now known as “special category transparent offshore funds”. As noted, the Fund is transparent for UK income tax purposes and UK investors are subject to UK capital gains tax on disposal of their units. UK investors are subject to tax on their share of income of the Fund on an arising basis. Information has been provided to UK investors of the amount of their share of the underlying income, expenses and overseas tax suffered.
Investment Portfolio As at 31 March 2014 (Unaudited)
Holding
Fair value
US$
% of net
assets Listed/Quoted Investments (96.5%) Equities (96.5%) Philippines (96.5%) Banks (17.0%) Bank Of Philippine Islands 3,572,585 6,843,239 5.1 BDO Unibank 6,398,027 12,126,933 9.1 Metropolitan Bank & Trust 2,186,934 3,769,651 2.8 Communications (13.2%) ABS-CBN Hldgs PDR 3,872,000 2,762,939 2.1 Globe Telecom 104,250 3,868,257 2.9 Philippine Long Distance
Telephone 181,365 11,040,840 8.2 Diversified Industrials (1.8%) Alliance Global Group 3,756,800 2,387,530 1.8 Energy (1.0%) Energy Development-PH List 10,542,300 1,330,570 1.0 Food, Beverages & Tobacco (11.8%) Jollibee Food 1,526,170 5,819,491 4.3 RFM Corp 800 104 0.0 Universal Robina 3,171,940 10,043,828 7.5
(Continued)
Holding
Fair value
US$
% of net
assets Holding Firms (19.2%) Aboitiz Equity Ventures 3,320,710 4,146,722 3.1 Ayala Corp 607,870 7,834,739 5.9 DMCI Hldgs 1,578,140 2,463,369 1.8 JG Summit Hldgs 3,692,000 4,075,237 3.0 SM Investments 457,597 7,193,798 5.4 Hotel, Recreation & Other Services (1.9%) Melco Crown (Philippines)
Resorts 8,746,400 2,535,471 1.9 Investment Trusts (3.0%) Metro Pacific Inv 38,611,000 4,072,473 3.0 Manufacturing, Distribution & Trading (2.6%) Bloomberry Resorts 3,238,800 725,110 0.5 Philippine Seven 613,077 1,326,089 1.0 Robinsons Retail Hldgs 945,810 1,434,164 1.1 Mining (0.0%) Atlas Consolidated Mining 100 31 0.0 Oil (2.8%) Cosco Capital 17,888,800 3,789,577 2.8 Power & Energy (4.7%) Aboitiz Power 4,698,000 3,897,103 2.9 Manila Electric 268,200 1,698,490 1.3 Manila Water 1,250,000 666,184 0.5 Property (14.4%) Ayala Land 18,947,660 12,633,182 9.4 SM Prime Hldgs 20,672,186 6,730,158 5.0 Transportation Services (3.1%) Intl Container Terminal
Services 1,739,760 4,189,856 3.1 Total Listed/Quoted Investments 129,405,135 96.5 Other net assets 4,710,539 3.5 Net assets attributable to holders of
rredeemable units at 31 March 2014 134,115,674 100.0 Total investments, at cost 124,231,633
- 236 -

JJPMORGAN PHILIPPINE FUND SSemi--aannual report for the
pperiod ended 31 March 2014
SStatement of Movements in Portfolio Holdings For the period ended 31 March 2014 (Unaudited) % holdings
of net assets 31.3.2014 30.9.2013 Listed/Quoted Investments Equities Hong Kong Consolidated Enterprises - 1.0 Philippines Holding Firms 19.2 18.3 Banks 17.0 14.2 Property 14.4 20.7 Communications 13.2 12.8 Food, Beverages & Tobacco 11.8 11.0 Power & Energy 4.7 5.0 Transportation Services 3.1 2.0 Investment Trusts 3.0 - Oil 2.8 3.1 Manufacturing, Distribution & Trading 2.6 1.3 Hotel, Recreation & Other Services 1.9 3.1 Diversified Industrials 1.8 2.3 Energy 1.0 1.5 Mining 0.0 0.0 Financial Services - 2.9 Media - 1.3 Others - 1.3 Total Listed/Quoted IInvestments 96.5 101.8 Other net assets/(liabilities) 3.5 (1.8) Net assets attributable to holders of
rredeemable units 100.0 100.0
- 237 -

JJPMORGAN PHILIPPINE FUND SSemi--aannual report for the
pperiod ended 31 March 2014
SStatement of Financial Position As at 31 March 2014 (Unaudited) 31.3.2014 30.9.2013 US$ US$ Assets Cash at banks 602,492 430,476 Amounts due from brokers 42,211 775,471 Amounts receivable on allotment 8,414,930 2,965,490 Investments 129,405,135 138,141,335 Dividend and interest receivable 638,276 98,516 Total assets 139,103,044 142,411,288 ---------- ---------- Liabilities Short term bank loans - unsecured - 430,087 Amounts due to brokers 2,982,230 737,455 Amounts payable on redemption 1,857,925 5,215,813 Other accounts payable 147,215 269,060 Liiabilities ((excluding net assets
attributable to holders of redeemable units) 4,987,370 6,652,415
---------- ---------- Net assets attributable to holders
of redeemable units classified as financial liability/equity [Note 3] 134,115,674 135,758,873
Statement of Comprehensive Income For the period ended 31 March 2014 (Unaudited) 1.10.2013
to 31.3.2014
1.10.2012 to
31.3.2013 US$ US$ Income Net (losses)/gains on investments
and derivatives [Note 4] (195,923) 41,391,629 Dividend income 1,335,885 1,640,631 Interest on deposits 1,646 1,053 Net foreign currency exchange
losses (74,644) (56,769) 1,066,964 42,976,544 ---------- ---------- Expenses Management fee 993,435 1,017,131 Transaction costs 577,965 946,951 Registrar's fee 58,233 43,461 Safe custody and bank charges 35,421 32,609 Trustee's fee 25,803 26,079 Valuation fee 8,190 7,910 Auditor's fee 5,585 5,518 Printing and publication expenses 2,486 1,124 Legal and professional expenses 2,232 2,136 Other operating expenses 1,141 899 1,710,491 2,083,818 ---------- ---------- Net operating (loss)/profit (643,527) 40,892,726 Finance costs Interest paid (89) (234) (Loss)/profit before taxation (643,616) 40,892,492 Taxation (200,383) (246,095) (Decrease)/increase in net
assets attributable to holdersof redeemable units and total comprehensive income (843,999) 40,646,397
The notes on pages 240 to 242 form part of these financial statements.
- 238 -

JJPMORGAN PHILIPPINE FUND SSemi--aannual report for the
pperiod ended 31 March 2014
SStatement of Changes in Net Assets Attributable to Holders of Redeemable Units For the period ended 31 March 2014 (Unaudited) 1.10.2013
to 31.3.2014
1.10.2012 to
31.3.2013 US$ US$ Net assets attributable to holders
of redeemable units at the beginning of the period 135,758,873 93,244,148
---------- ---------- Allotment of redeemable units 86,990,876 163,446,798 Redemption of redeemable units (87,790,076) (94,300,855) Net (redemption)/allotment (799,200) 69,145,943 ---------- ---------- 134,959,673 162,390,091 (Decrease)/increase in net assets
attributable to holders of redeemable units and total comprehensive income (843,999) 40,646,397
Net assets attributable to holders
oof redeemable units at the end of the period 134,115,674 203,036,488
Statement of Cash Flows For the period ended 31 March 2014 (Unaudited) 1.10.2013
to 31.3.2014
1.10.2012 to
31.3.2013 US$ US$ Operating activities Purchase of investments and
derivatives (52,942,984) (151,812,564) Proceeds from disposal of
investments and derivatives 64,465,996 88,042,077 Dividend received 796,114 656,816 Interest received 1,657 805 Trustee's fee paid (25,940) (24,138) Registrar's fee paid (120,570) (75,217) Tax paid (233,215) (246,095) Transaction costs paid (587,075) (952,605) Management fee paid (1,002,360) (897,707) Others (142,893) (130,229) Net cash inflow/(outflow) from
ooperating activities 10,208,730 (65,438,857) ---------- ---------- Financing activities Interest paid (99) (234) Receipts on allotment of
redeemable units 81,541,436 158,383,951 Payments on redemption of
redeemable units (91,147,964) (90,479,235) Net cash (outflow)/inflow from
ffinancing activities (9,606,627) 67,904,482 ---------- ---------- Increase in cash and cash
eequivalents 602,103 2,465,625 Cash and cash equivalents at the
beginning of the period 389 2,101,301 Exchange losses on cash and cash
equivalents - (1) Cash and cash equivalents at
tthe end of the period 602,492 4,566,925 Analysis of balances of cash and cash equivalents: Cash at banks 602,492 4,566,925
The notes on pages 240 to 242 form part of these financial statements.
- 239 -

JJPMORGAN PHILIPPINE FUND SSemi--aannual repoort for the
pperiod ended 31 March 2014
NNotes to the Financial Statements
1 The Fund
JPMorgan Philippine Fund (the "Fund") was established under a Trust Deed dated 29 July 1974, as amended, and is governed by the laws of Hong Kong. The Fund is authorized by the Securities and Futures Commission of Hong Kong.
The investment objective of the Fund is to provide long-term capital growth through investment primarily in the securities of companies based or operating in the Philippines.
Pursuant to the Supplemental Trust Deed dated 4 January 2013, the Manager may decide to issue separate classes (each a “Class”) whose assets will be commonly invested but where a specific fee structure, currency or distribution policy may be applied. Each Class may have a different charging structure with the result that the net asset value attributable to each Class may differ.
All unitholders' rights with regard to the convening, voting or otherwise acting at any meeting of unitholders are the same.
2 Summary of principal accounting policies
(a) Accounting policies of interim financial statements
The accounting policies and methods of computation used in the preparation of these unaudited condensed interim financial statements are consistent with those used in the annual financial statements for the year ended 30 September 2013.
(b) Investments and derivatives
Classification
The Fund classifies its investments and derivatives as financial assets or financial liabilities at fair value through profit or loss. These financial assets or financial liabilities are held-for-trading as they are acquired or incurred principally for the purpose of selling or repurchasing in the near term or short-term profit taking.
All derivatives are carried in assets when amounts are receivable by the Fund and in liabilities when amounts are payable by the Fund.
The Fund makes short sales in which a borrowed security is sold in anticipation of a decline in the market value of that security, or it may use short sales for various arbitrage transactions. Short sales are classified as financial liabilities at fair value through profit or loss.
Recognition, derecognition and measurement
Purchases and sales of investments and derivatives are accounted for on the trade date basis. Investments and derivatives are initially recognized at fair value and are subsequently re-measured at fair value. Realized and unrealized gains and losses on investments and derivatives are recognized in the Statement of Comprehensive Income. Investments and derivatives are derecognized when the rights to receive cash flows from the investments and derivatives have expired or the Fund has transferred substantially all risks and rewards of ownership.
Fair value estimation
Fair value is the price that would be received to sell an asset or paid to transfer a liability in an orderly transaction between market participants at the measurement date. The fair value of financial assets and liabilities traded in active markets are based on last traded prices. Prior to 1 October 2012, investments that are listed or traded on an exchange and investments with prices quoted in over-the-counter markets or by market makers, are fair valued based on quoted "bid" prices on long investments and quoted "ask" prices on investments sold short. The Fund early adopted Hong Kong Financial Reporting Standard 13, “Fair Value Measurement”, with effect from 1 October 2012, it changed its fair valuation input to utilize the last traded market price for both financial assets and financial liabilities where the last traded price falls within the bid-ask spread. When trading in the securities of an investee company is suspended, the investment is valued at the Manager's estimate of its fair value.
Debt securities are fair valued based on quoted prices inclusive of accrued interest.
Investments in collective investment schemes are stated at fair value based on the net asset value per unit of the respective funds as determined by the administrators of the relevant funds or stated at last traded prices if the collective investment schemes are listed or traded on an exchange.
Open future and swap contracts are valued at last traded prices for both long and short positions at the valuation date. The differences between the last traded prices and the contract prices are recognized in the Statement of Comprehensive Income.
Open option contracts are valued at last traded prices for both long and short positions at the valuation date. The differences between the last traded prices and the premium amounts/contract prices are recognized in the Statement of Comprehensive Income.
- 240 -

JJPMORGAN PHILIPPINE FUND SSemi--aannual report for the
pperiod ended 31 March 2014
Forward foreign exchange contracts are valued at the forward rates ruling at the valuation date. The differences between the forward rates and the contract rates are recognized in the Statement of Comprehensive Income.
((c) Securities borrowing
The Fund may enter into securities borrowing arrangements for short sale purposes. Short positions represent obligations to deliver securities sold but not yet purchased, and are accounted for as investments and valued at their fair value. Securities borrowed during the period/year are off-balance sheet transactions and are therefore not included in the investment portfolio of the Fund. Collateral placed for the purpose of securities borrowed generally consist of cash collateral and are included in the Statement of Financial Position separately.
(d) Foreign currency translation
Functional and presentation currency
The Fund has adopted United States dollar as its functional and presentation currency.
Transactions and balances
Foreign currency transactions are translated into the functional currency using the exchange rates prevailing at the dates of the transactions.
Foreign exchange gains and losses resulting from the settlement of such transactions and from the translation of assets and liabilities denominated in foreign currencies at period/year end exchange rates are recognized in the Statement of Comprehensive Income.
Foreign exchange gains and losses relating to cash and cash equivalents are presented in the Statement of Comprehensive Income within "Net foreign currency exchange gains/losses". Foreign exchange gains and losses relating to the financial assets and liabilities carried at fair value through profit or loss are presented in the Statement of Comprehensive Income within "Net gains/losses on investments and derivatives".
(e) Proceeds and payments on allotment and redemption of units
The net asset value per unit is computed for each dealing day. The price at which units are allotted or redeemed is calculated by reference to the net asset value per unit as at the close of business on the relevant dealing day in accordance with the provisions of the Fund's Trust Deed dated 29 July 1974, as amended, which may be different from the accounting policies stated in the financial statements.
Units of the Fund are redeemable at the option of the holders of redeemable units and are classified as a financial liability in the Statement of Financial Position which represents the net assets attributable to holders of redeemable units (or "net asset value" or "net assets" or "NAV") and is carried at the redemption amount that would be payable at the Statement of Financial Position date if the holders of redeemable units exercised the right to redeem units of the Fund.
3 Number of units in issue and net assets attributable to holders of redeemable units (per unit)
Fair value adjustment of units of the Fund
As at 31 March 2014, there were two classes in the Fund. The net assets attributable to the holders of redeemable units was classified as a financial liability which carried at the redemption amount that would be payable at the Statement of Financial Position date, if the holders of redeemable units exercised the right to redeem units of the Fund. The redemption amount is determined based on the net assets attributable to holders of redeemable units calculated in accordance with the provisions of the Fund's Trust Deed dated 29 July 1974, as amended ("Trust Deed NAV").
As at 30 September 2013, there was only one class in the Fund. The net assets attributable to the holders of redeemable units (or "net asset value" or "net assets" or "NAV") was classified as equity and not adjusted for fair value adjustment of units of the Fund.
Number of units in issue
31.3.2014
USD Class (acc) USD C Class (acc) Units Units Number of units in issue: 1,277,536.738 588,849.000
- 241 -

JJPMORGAN PHILIPPINE FUND SSemi--aannual repoort for the
pperiod ended 31 March 2014
US$ US$ Net assets attributable to
holders of redeemable units 128,373,145 5,742,529
Net assets attributable to
holders of redeemable units (per unit) 100.48 9.75
30.9.2013
USD Class (acc) Units Number of units in issue: 1,352,261.596 US$ Net assets attributable to
holders of redeemable units 135,758,873
Net assets attributable to
holders of redeemable units (per unit) 100.39
44 Net (losses)/gains on investments and derivatives
1.10.2013
to 31.3.2014
1.10.2012 to
31.3.2013 US$ US$ Change in unrealized gains/losses in value of investments and derivatives 2,179,276 28,385,414 Realized (losses)/gains on sale of investments and derivatives (2,375,199) 13,006,215 (195,923) 41,391,629
5 Soft commission arrangements
The Investment Manager has entered into soft commission arrangements with brokers under which certain goods and services used to support investment decision making are received by the Investment Manager. The Investment Manager does not make direct payment for these services but transacts an agreed amount of business with the brokers on behalf of the Fund. Commission is paid from the Fund on these transactions.
The goods and services must be of demonstrable benefit to the Fund and may include research and advisory services; economic and political analysis; portfolio analysis, including valuation and performance measurement; market analysis, data and quotation services, computer hardware and software incidental to the above goods and services; clearing and custodian services and investment-related publications.
6 Distribution
No distribution was made during the period (31 March 2013: nil).
- 242 -

JJPMORGAN TTHAILAND FUND SSemi--aannual report for the
pperiod ended 31 March 2014
DDistributor Status The Fund has been certified by HMRC in the UK as a distributing fund in respect of the period from 8 August 1989 to 30 September 2010. The principal effect of this certification is that for unitholders resident or ordinarily resident in the UK for taxation purposes any gains accruing on the sale, redemption or other disposal of units during the period will be taxed in the UK as a capital gain and not as income. This treatment will continue under the new UK reporting fund regime provided the Fund does not invest more than 5% of its assets in other offshore funds which are not themselves reporting funds. There will be no need to formally apply for reporting fund status as the Fund is transparent for UK tax purposes and therefore considered out of scope of the requirements of this new regime. These are now known as “special category transparent offshore funds”. As noted, the Fund is transparent for UK income tax purposes and UK investors are subject to UK capital gains tax on disposal of their units. UK investors are subject to tax on their share of income of the Fund on an arising basis. Information has been provided to UK investors of the amount of their share of the underlying income, expenses and overseas tax suffered.
Investment Portfolio As at 31 March 2014 (Unaudited)
Holding
Fair value
US$
% of net
assets Listed/Quoted Investments (96.7%) Equities (96.7%) Thailand (96.7%) Agribusiness (7.2%) Charoen Pokphand Foods (F) 15,133,300 13,062,035 2.9 Charoen Pokphand
Foods NVDR 4,225,000 3,646,732 0.8 GFPT Public Co (F) 34,617,400 15,473,252 3.5 Banking (21.9%) Bangkok Bank NVDR 3,839,100 21,124,518 4.7 Kasikornbank Public Co (F) 1,260,900 7,190,706 1.6 Kasikornbank Public Co NVDR 6,365,400 34,927,287 7.8 Krung Thai Bank (F) 27,555,000 15,884,047 3.6 Siam Commercial Bank (F) 3,582,300 17,392,486 3.9 TMB Bank NVDR 15,000,000 1,137,485 0.3 Building & Furnishing Materials (10.9%) Siam Cement (F) 1,725,100 22,228,477 5.0 Siam Cement NVDR 1,407,200 18,132,232 4.1 STP & I (F) 12,103,300 8,096,227 1.8 Chemicals & Plastics (4.7%) PTT Global Chemical (F) 9,343,850 20,810,517 4.7
(Continued)
Holding
Fair value
US$
% of net
assets Communications (11.8%) Advanced Information (F) 6,070,400 42,290,704 9.5 Shin Corp NVDR 1,855,000 4,417,347 1.0 Total Access
Communication NVDR 1,646,200 5,911,908 1.3 Construction & House (2.8%) Banpu Public Co (F) 14,631,900 12,629,260 2.8 Electronic Components (1.8%) Hana Microelectronics (F) 8,369,400 7,868,887 1.8 Energy (19.6%) PTT Exploration &
Production (F) 8,157,885 39,481,749 8.9 PTT Public Co (F) 4,611,300 42,502,427 9.5 Ratchaburi Electricity NVDR 3,407,000 5,435,026 1.2 Food & Beverages (3.6%) CP ALL (F) 7,381,000 9,897,457 2.3 Thai Union Frozen Products (F) 2,770,800 5,872,149 1.3 Health Care Services (4.8%) Beauty Community (F) 1,809,000 1,098,560 0.3 Bumrungrad Hospital (F) 2,728,400 8,095,207 1.8 Chularat Hospital (F) 25,205,200 8,158,280 1.8 Mega Lifesciences (F) 6,400,000 4,202,219 0.9 Hotel & Travel Services (0.5%) Central Plaza Hotel (F) 2,354,400 2,195,456 0.5 Property Development (4.1%) Hemaraj Land &
Development (F) 36,264,500 3,487,831 0.8 Land & Houses NVDR 13,262,600 3,924,814 0.9 LPN Development (F) 12,615,200 6,222,047 1.4 Ticon Industrial Connection (F) 8,502,200 4,507,948 1.0 Transportation (3.0%) Namyong Terminal (F) 16,126,400 8,848,641 2.0 Precious Shipping (F) 5,350,700 4,659,595 1.0 Total Listed/Quoted Investments 430,813,513 96.7 Other net assets 14,608,296 3.3 Net assets attributable to holders of
rredeemable units at 31 March 2014 445,421,809 100.0 Total investments, at cost 406,563,188
- 243 -

JJPMORGAN TTHAILAND FUND SSemi--aannual report for the
pperiod ended 31 March 2014
SStatement of Movements in Portfolio Holdings For the period ended 31 March 2014 (Unaudited) % holdings
of net assets 31.3.2014 30.9.2013 Listed/Quoted Investments Equities Indonesia Energy -- 0.4 Thailand Banking 21.9 20.9 Energy 19.6 20.6 Communications 11.8 10.4 Building & Furnishing Materials 10.9 10.0 Agribusiness 7.2 2.4 Health Care Services 4.8 3.7 Chemicals & Plastics 4.7 6.2 Property Development 4.1 11.7 Food & Beverages 3.6 1.5 Transportation 3.0 4.9 Construction & House 2.8 3.2 Electronic Components 1.8 - Hotel & Travel Services 0.5 2.5 Householding Goods - 0.5 Total Listed/Quoted Investments 96.7 98.9 Other net assets 3.3 1.1 Net assets attributable to holders of
rredeemable units 100.0 100.0
- 244 -

JJPMORGAN TTHAILAND FUND SSemi--aannual report for the
pperiod ended 31 March 2014
SStatement of Financial Position As at 31 March 2014 (Unaudited) 31.3.2014 30.9.2013 US$ US$ Assets Cash at banks 12,541,264 2,207,053 Amounts due from brokers 2,791,561 2,066,187 Amounts receivable on allotment 2,365,428 9,324,932 Investments 430,813,513 475,786,959 Dividend and other accounts
receivable 4,696,964 609,414 Total aassets 453,208,730 489,994,545 ---------- ---------- Liabilities Amounts due to brokers 4,707,117 2,673,023 Amounts payable on redemption 2,497,108 5,594,210 Other accounts payable 582,696 784,029 Total liabilities 7,786,921 9,051,262 ---------- ---------- Net assets attributable to holders
oof redeemable units [Note 3] 445,421,809 480,943,283 Equity 445,421,809 480,943,283
Statement of Comprehensive Income For the period ended 31 March 2014 (Unaudited) 1.10.2013
to 31.3.2014
1.10.2012 to
31.3.2013 US$ US$ Income Net (losses)/gains on investments
and derivatives [Note 4] (23,147,182) 133,982,125 Dividend income 5,672,910 4,856,683 Interest on deposits 16,034 4,393 Net foreign currency exchange
(losses)/gains (221,656) 19,164 Other income 857 480 (17,679,037) 138,862,845 ---------- ---------- Expenses Management fee 3,356,398 3,587,526 Transaction costs 617,889 648,860 Registrar's fee 112,625 100,380 Safe custody and bank charges 85,073 80,817 Trustee's fee 65,197 68,978 Auditor's fee 8,726 8,573 Valuation fee 8,190 8,120 Printing and publication expenses 6,075 3,101 Legal and professional expenses 1,042 244 Other operating expenses 3,619 3,147 4,264,834 4,509,746 ---------- ---------- Net operating (loss)/profit (21,943,871) 134,353,099 Finance costs Interest paid (13) - (Loss)/profit before taxation (21,943,884) 134,353,099 Taxation (382,060) (364,702) (Decrease)/increase in net
aassets attributable to holdersof redeemable units and total comprehensive income (22,325,944) 133,988,397
The notes on pages 247 to 249 form part of these financial statements.
- 245 -
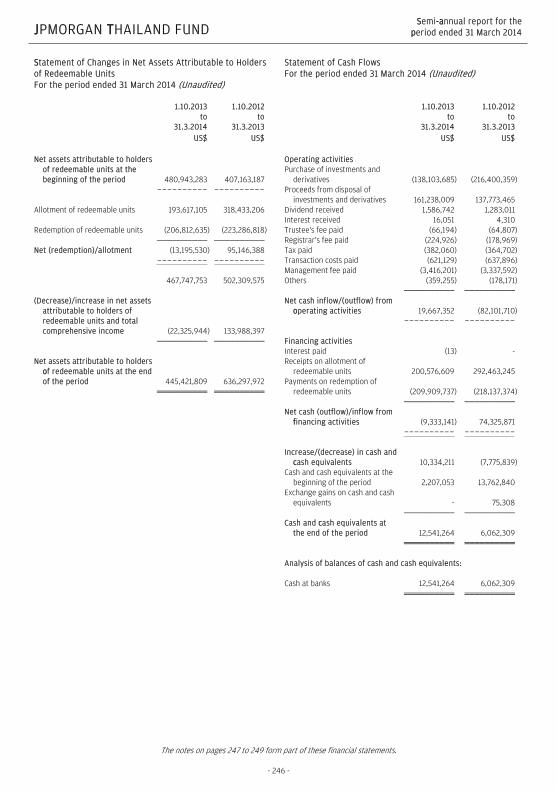
JJPMORGAN TTHAILAND FUND SSemi--aannual report for the
pperiod ended 31 March 2014
SStatement of Changes in Net Assets Attributable to Holders of Redeemable Units For the period ended 31 March 2014 (Unaudited) 1.10.2013
to 31.3.2014
1.10.2012 to
31.3.2013 US$ US$ Net assets attributable to holders
of redeemable units at the beginning of the period 480,943,283 407,163,187
---------- ---------- Allotment of redeemable units 193,617,105 318,433,206 Redemption of redeemable units (206,812,635) (223,286,818) Net (redemption)/allotment (13,195,530) 95,146,388 ---------- ---------- 467,747,753 502,309,575 (Decrease)/increase in net assets
attributable to holders of redeemable units and total comprehensive income (22,325,944) 133,988,397
Net assets attributable to holders
oof redeemable units at the end of the period 445,421,809 636,297,972
Statement of Cash Flows For the period ended 31 March 2014 (Unaudited) 1.10.2013
to 31.3.2014
1.10.2012 to
31.3.2013 US$ US$ Operating activities Purchase of investments and
derivatives (138,103,685) (216,400,359) Proceeds from disposal of
investments and derivatives 161,238,009 137,773,465 Dividend received 1,586,742 1,283,011 Interest received 16,051 4,310 Trustee's fee paid (66,194) (64,807) Registrar's fee paid (224,926) (178,969) Tax paid (382,060) (364,702) Transaction costs paid (621,129) (637,896) Management fee paid (3,416,201) (3,337,592) Others (359,255) (178,171) Net cash inflow/(outflow) from
ooperating activities 19,667,352 (82,101,710) ---------- ---------- Financing activities Interest paid (13) - Receipts on allotment of
redeemable units 200,576,609 292,463,245 Payments on redemption of
redeemable units (209,909,737) (218,137,374) Net cash (outflow)/inflow from
ffinancing activities (9,333,141) 74,325,871 ---------- ---------- Increase/(decrease) in cash and
ccash equivalents 10,334,211 (7,775,839) Cash and cash equivalents at the
beginning of the period 2,207,053 13,762,840 Exchange gains on cash and cash
equivalents - 75,308 Cash and ccash equivalents at
the end of the period 12,541,264 6,062,309 Analysis of balances of cash and cash equivalents: Cash at banks 12,541,264 6,062,309
The notes on pages 247 to 249 form part of these financial statements.
- 246 -

JJPMORGAN THAILAND FUND SSemi--aannual report for the
pperiod ended 31 March 2014
NNotes to the Financial Statements
1 The Fund
JPMorgan Thailand Fund (the "Fund") was established under a Trust Deed dated 20 July 1989, as amended, and is governed by the laws of Hong Kong. The Fund is authorized by the Securities and Futures Commission of Hong Kong.
The investment objective of the Fund is to provide investors with long-term capital appreciation through a portfolio consisting primarily of securities of companies based, or operating principally, in Thailand.
Pursuant to the Supplemental Trust Deed dated 4 January 2013, the Manager may decide to issue separate classes (each a “Class”) whose assets will be commonly invested but where a specific fee structure, currency or distribution policy may be applied. Each Class may have a different charging structure with the result that the net asset value attributable to each Class may differ.
All unitholders' rights with regard to the convening, voting or otherwise acting at any meeting of unitholders are the same.
2 Summary of principal accounting policies
(a) Accounting policies of interim financial statements
The accounting policies and methods of computation used in the preparation of these unaudited condensed interim financial statements are consistent with those used in the annual financial statements for the year ended 30 September 2013.
(b) Investments and derivatives
Classification
The Fund classifies its investments and derivatives as financial assets or financial liabilities at fair value through profit or loss. These financial assets or financial liabilities are held-for-trading as they are acquired or incurred principally for the purpose of selling or repurchasing in the near term or short-term profit taking.
All derivatives are carried in assets when amounts are receivable by the Fund and in liabilities when amounts are payable by the Fund.
The Fund makes short sales in which a borrowed security is sold in anticipation of a decline in the market value of that security, or it may use short sales for various arbitrage transactions. Short sales are classified as financial liabilities at fair value through profit or loss.
Recognition, derecognition and measurement
Purchases and sales of investments and derivatives are accounted for on the trade date basis. Investments and derivatives are initially recognized at fair value and are subsequently re-measured at fair value. Realized and unrealized gains and losses on investments and derivatives are recognized in the Statement of Comprehensive Income. Investments and derivatives are derecognized when the rights to receive cash flows from the investments and derivatives have expired or the Fund has transferred substantially all risks and rewards of ownership.
Fair value estimation
Fair value is the price that would be received to sell an asset or paid to transfer a liability in an orderly transaction between market participants at the measurement date. The fair value of financial assets and liabilities traded in active markets are based on last traded prices. Prior to 1 October 2012, investments that are listed or traded on an exchange and investments with prices quoted in over-the-counter markets or by market makers, are fair valued based on quoted "bid" prices on long investments and quoted "ask" prices on investments sold short. The Fund early adopted Hong Kong Financial Reporting Standard 13, “Fair Value Measurement”, with effect from 1 October 2012, it changed its fair valuation input to utilize the last traded market price for both financial assets and financial liabilities where the last traded price falls within the bid-ask spread. When trading in the securities of an investee company is suspended, the investment is valued at the Manager's estimate of its fair value.
Debt securities are fair valued based on quoted prices inclusive of accrued interest.
Investments in collective investment schemes are stated at fair value based on the net asset value per unit of the respective funds as determined by the administrators of the relevant funds or stated at last traded prices if the collective investment schemes are listed or traded on an exchange.
Open future and swap contracts are valued at last traded prices for both long and short positions at the valuation date. The differences between the last traded prices and the contract prices are recognized in the Statement of Comprehensive Income.
Open option contracts are valued at last traded prices for both long and short positions at the valuation date. The differences between the last traded prices and the premium amounts/contract prices are recognized in the Statement of Comprehensive Income.
- 247 -

JJPMORGAN THAILAND FUND SSemi--aannual report for the
pperiod ended 31 March 2014
Forward foreign exchange contracts are valued at the forward rates ruling at the valuation date. The differences between the forward rates and the contract rates are recognized in the Statement of Comprehensive Income.
((c) Securities borrowing
The Fund may enter into securities borrowing arrangements for short sale purposes. Short positions represent obligations to deliver securities sold but not yet purchased, and are accounted for as investments and valued at their fair value. Securities borrowed during the period/year are off-balance sheet transactions and are therefore not included in the investment portfolio of the Fund. Collateral placed for the purpose of securities borrowed generally consist of cash collateral and are included in the Statement of Financial Position separately.
(d) Foreign currency translation
Functional and presentation currency
The Fund has adopted United States dollar as its functional and presentation currency.
Transactions and balances
Foreign currency transactions are translated into the functional currency using the exchange rates prevailing at the dates of the transactions.
Foreign exchange gains and losses resulting from the settlement of such transactions and from the translation of assets and liabilities denominated in foreign currencies at period/year end exchange rates are recognized in the Statement of Comprehensive Income.
Foreign exchange gains and losses relating to cash and cash equivalents are presented in the Statement of Comprehensive Income within "Net foreign currency exchange gains/losses". Foreign exchange gains and losses relating to the financial assets and liabilities carried at fair value through profit or loss are presented in the Statement of Comprehensive Income within "Net gains/losses on investments and derivatives".
(e) Proceeds and payments on allotment and redemption of units
The net asset value per unit is computed for each dealing day. The price at which units are allotted or redeemed is calculated by reference to the net asset value per unit as at the close of business on the relevant dealing day in accordance with the provisions of the Fund's Trust Deed dated 20 July 1989, as amended, which may be different from the accounting policies stated in the financial statements.
3 Number of units in issue and net assets attributable to holders of redeemable units (per unit)
31.3.2014
USD Class (acc) Units Number of units in issue: 3,732,402.812 US$ Net assets attributable to
holders of redeemable units 445,421,809
Net assets attributable to
holders of redeemable units (per unit) 119.34
- 248 -

JJPMORGAN THAILAND FUND SSemi--aannual report for the
pperiod ended 31 March 2014
30.9.2013
USD Class (acc) Units Number of units in issue: 3,851,482.392 US$ Net assets attributable to
holders of redeemable units 480,943,283
Net assets attributable to
holders of redeemable units (per unit) 124.87
44 Net (losses)/gains on investments and derivatives
1.10.2013
to 31.3.2014
1.10.2012 to
31.3.2013 US$ US$ Change in unrealized gains/losses in value of investments and derivatives (21,599,751) 85,107,453 Realized (losses)/gains on sale of investments and derivatives (1,547,431) 48,874,672 (23,147,182) 133,982,125
5 Soft commission arrangements
The Investment Manager has entered into soft commission arrangements with brokers under which certain goods and services used to support investment decision making are received by the Investment Manager. The Investment Manager does not make direct payment for these services but transacts an agreed amount of business with the brokers on behalf of the Fund. Commission is paid from the Fund on these transactions.
The goods and services must be of demonstrable benefit to the Fund and may include research and advisory services; economic and political analysis; portfolio analysis, including valuation and performance measurement; market analysis, data and quotation services, computer hardware and software incidental to the above goods and services; clearing and custodian services and investment-related publications.
6 Distribution
No distribution was made during the period (31 March 2013: nil).
- 249 -

JJPMORGAN VIETNAM OPPORTUNITIES FUND SSemi--aannual report for the
pperiod ended 31 March 2014
IInvestment Portfolio As at 31 March 2014 (Unaudited)
Holding
Fair value
US$
% of net
assets Listed/Quoted Investments (87.4%) Equities and Convertibles (87.4%) Hong Kong (1.0%) C P Pokphand 13,888,000 1,450,201 1.0 Thailand (0.8%) Mega Lifesciences (F) 1,688,000 1,108,335 0.8 Vietnam (85.6%) Bao Viet Securities 60 53 0.0 Danang Rubber 335,406 718,585 0.5 DHG Pharmaceutical 1,385,098 9,125,661 6.4 FPT Corp 2,105,865 6,987,111 4.9 HAGL Joint Stock 2 3 0.0 Ho Chi Minh City
Securities 1,641,457 3,306,644 2.3 Hoa Phat Group 1,558,162 3,914,331 2.8 Imexpharm
Pharmaceutical 162,690 481,959 0.3 JSC Bank for Foreign
Trade 5,700,972 8,322,785 5.9 Kinh Do 2,530,837 7,677,383 5.4 Lam Son Sugar CB 12%
10/10/14 VND2,227,000,000 111,561 0.1 Masan Group 1,751,310 8,052,001 5.7 Military Commercial
JS Bank 6,769,219 5,101,580 3.6 Petrovietnam Drilling &
Well Services 1,662,119 6,538,969 4.6 Petrovietnam Fertilizer &
Chemical 2,156,380 4,405,261 3.1 PetroVietnam Gas 3,485,430 13,794,687 9.7 Refrigeration Electrical
Engineering 5,287,340 7,869,297 5.5 Saigon Securities 1,300,000 1,836,237 1.3 Southern Rubber
Industry 678,523 1,363,639 1.0 Thien Long Group 250,007 535,624 0.4 Vietnam Dairy Products 1,881,365 12,573,645 8.9 Vietnam Export-Import
Comm JS Bank 2,709,915 1,862,485 1.3 VietNam JS Comm Bank
for Industry & Trade 7,334,053 5,874,891 4.1 Vietnam Sun 1,060,666 2,589,136 1.8
(Continued)
Holding
Fair value
US$
% of net
assets Vingroup Joint Stock 2,462,020 8,577,248 6.0 Total Listed/Quoted Investments 124,179,312 87.4 Other net assets 17,942,277 12.6 Net assets attributable to holders of
rredeemable units at 31 March 2014 142,121,589 100.0 Total investments, at cost 103,355,477
- 250 -

JJPMORGAN VIETNAM OPPORTUNITIES FUND SSemi--aannual report for the
pperiod ended 31 March 2014
SStatement of Movements in Portfolio Holdings For the period ended 31 March 2014 (Unaudited) % holdings
of net assets 31.3.2014 30.9.2013 Listed/Quoted Investments Equities and Convertibles Vietnam 85.6 91.1 Hong Kong 1.0 1.2 Thailand 0.8 0.9 Total Listed/Quoted Investments 87.4 93.2 Other net assets 12.6 6.8 Net assets attributable to holders of
rredeemable units 100.0 100.0
- 251 -

JJPMORGAN VIETNAM OPPORTUNITIES FUND SSemi--aannual report for the
pperiod ended 31 March 2014
SStatement of Financial Position As at 31 March 2014 (Unaudited) 31.3.2014 30.9.2013 US$ US$ Assets Cash at banks 17,820,130 8,283,473 Amounts receivable on allotment 1,192,400 606,576 Investments 124,179,312 103,841,549 Dividend and other accounts
receivable 119,984 289,031 Total assets 143,311,826 113,020,629 ---------- ---------- Liabilities Amounts due to brokers - 808,219 Amounts payable on redemption 994,752 651,596 Other accounts payable 195,485 200,596 Total liabilities 1,190,237 1,660,411 ---------- ---------- Net assets attributable to holders
oof redeemable units [Note 3] 142,121,589 111,360,218 Equity 142,121,589 111,360,218
Statement of Comprehensive Income For the period ended 31 March 2014 (Unaudited) 1.10.2013
to 31.3.2014
1.10.2012 to
31.3.2013 US$ US$ Income Net gains on investments and
derivatives [Note 4] 21,785,667 27,694,306 Dividend income 1,170,229 2,575,340 Interest on deposits 8,186 2,731 Net foreign currency exchange
losses (9,834) (82,661) 22,954,248 30,189,716 ---------- ---------- Expenses Management fee 907,421 921,991 Transaction costs 97,810 347,377 Safe custody and bank charges 78,892 71,655 Registrar's fee 26,795 26,805 Trustee's fee 24,357 24,549 Valuation fee 8,260 8,190 Auditor's fee 7,081 6,986 Printing and publication expenses 5,769 2,344 Legal and professional expenses 2,158 2,127 Other operating expenses 3,042 4,558 1,161,585 1,416,582 ---------- ---------- Net operating profit 21,792,663 28,773,134 Finance costs Interest paid - (5) Profit before taxation 21,792,663 28,773,129 Taxation (633) (3,556) Increase in net assets
attributable to holders of redeemable units and total ccomprehensive income 21,792,030 28,769,573
The notes on pages 254 to 256 form part of these financial statements.
- 252 -

JJPMORGAN VIETNAM OPPORTUNITIES FUND SSemi--aannual report for the
pperiod ended 31 March 2014
SStatement of Changes in Net Assets Attributable to Holders of Redeemable Units For the period ended 31 March 2014 (Unaudited) 1.10.2013
to 31.3.2014
1.10.2012 to
31.3.2013 US$ US$ Net assets attributable to holders
of redeemable units at the beginning of the period 111,360,218 119,084,399
---------- ---------- Allotment of redeemable units 43,836,328 33,483,608 Redemption of redeemable units (34,866,987) (66,246,657) Net allotment/(redemption) 8,969,341 (32,763,049) ---------- ---------- 120,329,559 86,321,350 Increase in net assets
attributable to holders of redeemable units and total comprehensive income 21,792,030 28,769,573
Net assets attributable to holders
oof redeemable units at the end of the pperiod 142,121,589 115,090,923
Statement of Cash Flows For the period ended 31 March 2014 (Unaudited) 1.10.2013
to 31.3.2014
1.10.2012 to
31.3.2013 US$ US$ Operating activities Purchase of investments and
derivatives (18,321,327) (53,265,869) Proceeds from disposal of
investments and derivatives 18,962,327 78,822,212 Dividend received 1,339,163 2,676,445 Interest received 8,300 2,793 Tax paid (633) (3,556) Trustee's fee paid (23,672) (24,692) Registrar's fee paid (54,204) (52,476) Transaction costs paid (100,246) (353,377) Management fee paid (866,338) (930,617) Others (135,762) (190,975) Net cash inflow from operating
aactivities 807,608 26,679,888 ---------- ---------- Financing activities Interest paid - (5) Receipts on allotment of
redeemable units 43,250,504 33,418,447 Payments on redemption of
redeemable units (34,523,831) (65,713,359) Net cash inflow/(outflow) from
ffinancing activities 8,726,673 (32,294,917) ---------- ---------- Increase/(decrease) in cash and
ccash equivalents 9,534,281 (5,615,029) Cash and cash equivalents at the
beginning of the period 8,283,473 12,867,861 Exchange gains/(losses) on cash
and cash equivalents 2,376 (10,070) Cash and cash equivalents at
tthe end of the period 17,820,130 7,242,762 Analysis of balances of cash and cash equivalents: Cash at banks 17,820,130 7,242,762
The notes on pages 254 to 256 form part of these financial statements.
- 253 -

JJPMORGAN VIETNAM OPPORTUNITIES FUND SSemi--aannual rreport for the
pperiod ended 31 March 2014
NNotes to the Financial Statements
1 The Fund
JPMorgan Vietnam Opportunities Fund (the "Fund") was established under a Trust Deed dated 15 August 2006, as amended, and is governed by the laws of Hong Kong. The Fund is authorized by the Securities and Futures Commission of Hong Kong.
The investment objective of the Fund is to provide investors with long-term capital growth by investing primarily in securities of companies either (i) domiciled or listed on a stock exchange in Vietnam, or (ii) with actual or prospective operations, assets or investments, direct or indirect, in Vietnam in an aggregate amount of not less than either US$50 million or 10 per cent of the gross assets of the investing company (albeit such operations, assets or investments may at the time of investment be immaterial to the financial results of such company).
Pursuant to the Supplemental Trust Deed dated 31 August 2012, the Manager may decide to issue separate classes (each a “Class”) whose assets will be commonly invested but where a specific fee structure, currency or distribution policy may be applied. Each Class may have a different charging structure with the result that the net asset value attributable to each Class may differ.
All unitholders' rights with regard to the convening, voting or otherwise acting at any meeting of unitholders are the same.
2 Summary of principal accounting policies
(a) Accounting policies of interim financial statements
The accounting policies and methods of computation used in the preparation of these unaudited condensed interim financial statements are consistent with those used in the annual financial statements for the year ended 30 September 2013.
(b) Investments and derivatives
Classification
The Fund classifies its investments and derivatives as financial assets or financial liabilities at fair value through profit or loss. These financial assets or financial liabilities are held-for-trading as they are acquired or incurred principally for the purpose of selling or repurchasing in the near term or short-term profit taking.
All derivatives are carried in assets when amounts are receivable by the Fund and in liabilities when amounts are payable by the Fund.
The Fund makes short sales in which a borrowed security is sold in anticipation of a decline in the market value of that security, or it may use short sales for various arbitrage transactions. Short sales are classified as financial liabilities at fair value through profit or loss.
Recognition, derecognition and measurement
Purchases and sales of investments and derivatives are accounted for on the trade date basis. Investments and derivatives are initially recognized at fair value and are subsequently re-measured at fair value. Realized and unrealized gains and losses on investments and derivatives are recognized in the Statement of Comprehensive Income. Investments and derivatives are derecognized when the rights to receive cash flows from the investments and derivatives have expired or the Fund has transferred substantially all risks and rewards of ownership.
Fair value estimation
Fair value is the price that would be received to sell an asset or paid to transfer a liability in an orderly transaction between market participants at the measurement date. The fair value of financial assets and liabilities traded in active markets are based on last traded prices. Prior to 1 October 2012, investments that are listed or traded on an exchange and investments with prices quoted in over-the-counter markets or by market makers, are fair valued based on quoted "bid" prices on long investments and quoted "ask" prices on investments sold short. The Fund early adopted Hong Kong Financial Reporting Standard 13, “Fair Value Measurement”, with effect from 1 October 2012, it changed its fair valuation input to utilize the last traded market price for both financial assets and financial liabilities where the last traded price falls within the bid-ask spread. When trading in the securities of an investee company is suspended, the investment is valued at the Manager's estimate of its fair value.
Debt securities are fair valued based on quoted prices inclusive of accrued interest.
Investments in collective investment schemes are stated at fair value based on the net asset value per unit of the respective funds as determined by the administrators of the relevant funds or stated at last traded prices if the collective investment schemes are listed or traded on an exchange.
Open future and swap contracts are valued at last traded prices for both long and short positions at the valuation date. The differences between the last traded prices and the contract prices are recognized in the Statement of Comprehensive Income.
- 254 -

JJPMORGAN VIETNAM OPPORTUNITIES FUND SSemi--aannual rreport for the
pperiod ended 31 March 2014
Open option contracts are valued at last traded prices for both long and short positions at the valuation date. The differences between the last traded prices and the premium amounts/contract prices are recognized in the Statement of Comprehensive Income.
Forward foreign exchange contracts are valued at the forward rates ruling at the valuation date. The differences between the forward rates and the contract rates are recognized in the Statement of Comprehensive Income.
((c) Securities borrowing
The Fund may enter into securities borrowing arrangements for short sale purposes. Short positions represent obligations to deliver securities sold but not yet purchased, and are accounted for as investments and valued at their fair value. Securities borrowed during the period/year are off-balance sheet transactions and are therefore not included in the investment portfolio of the Fund. Collateral placed for the purpose of securities borrowed generally consist of cash collateral and are included in the Statement of Financial Position separately.
(d) Foreign currency translation
Functional and presentation currency
The Fund has adopted United States dollar as its functional and presentation currency.
Transactions and balances
Foreign currency transactions are translated into the functional currency using the exchange rates prevailing at the dates of the transactions.
Foreign exchange gains and losses resulting from the settlement of such transactions and from the translation of assets and liabilities denominated in foreign currencies at period/year end exchange rates are recognized in the Statement of Comprehensive Income.
Foreign exchange gains and losses relating to cash and cash equivalents are presented in the Statement of Comprehensive Income within "Net foreign currency exchange gains/losses". Foreign exchange gains and losses relating to the financial assets and liabilities carried at fair value through profit or loss are presented in the Statement of Comprehensive Income within "Net gains/losses on investments and derivatives".
(e) Proceeds and payments on allotment and redemption of units
The net asset value per unit is computed for each dealing day. The price at which units are allotted or redeemed is calculated by reference to the net asset value per unit as at the close of business on the relevant dealing day in accordance with the provisions of the Fund's Trust Deed dated 15 August 2006, as amended, which may be different from the accounting policies stated in the financial statements.
3 Number of units in issue and net assets attributable to holders of redeemable units (per unit)
31.3.2014
USD Class (acc) Units Number of units in issue: 12,483,972.384 US$ Net assets attributable to
holders of redeemable units 142,121,589
Net assets attributable to
holders of redeemable units (per unit) 11.38
- 255 -

JJPMORGAN VIETNAM OPPORTUNITIES FUND SSemi--aannual rreport for the
pperiod ended 31 March 2014
30.9.2013
USD Class (acc) Units Number of units in issue: 11,680,268.323 US$ Net assets attributable to
holders of redeemable units 111,360,218
Net assets attributable to
holders of redeemable units (per unit) 9.53
44 Net gains on investments and derivatives
1.10.2013
to 31.3.2014
1.10.2012 to
31.3.2013 US$ US$ Change in unrealized gains/losses in value of investments and derivatives 23,687,954 20,488,204 Realized (losses)/gains on sale of investments and derivatives (1,902,287) 7,206,102 21,785,667 27,694,306
5 Soft commission arrangements
The Investment Manager has entered into soft commission arrangements with brokers under which certain goods and services used to support investment decision making are received by the Investment Manager. The Investment Manager does not make direct payment for these services but transacts an agreed amount of business with the brokers on behalf of the Fund. Commission is paid from the Fund on these transactions.
The goods and services must be of demonstrable benefit to the Fund and may include research and advisory services; economic and political analysis; portfolio analysis, including valuation and performance measurement; market analysis, data and quotation services, computer hardware and software incidental to the above goods and services; clearing and custodian services and investment-related publications.
6 Distribution
No distribution was made during the period (31 March 2013: nil).
- 256 -

www.jpmorganam.com.hk
JPMorgan Funds(Unit Trust Range)
Unaudited Semi-Annual Report31 March 2014
Consolidated(306x210)Co.ai 1 16/05/2014 4:49 PMConsolidated(306x210)Co.ai 1 16/05/2014 4:49 PM