statement of accounts 2011/2012 -...
TRANSCRIPT

STATEMENT OF ACCOUNTS 2011/2012
Page 1 of 162
CONTENTS PAGE Explanatory Foreword by the Head of Finance 3 Statement of Responsibilities 13 Movement in Reserves Statement 14 Comprehensive Income and Expenditure Statement 16 Balance Sheet 17 Cash Flow Statement 18 Notes to the Financial Statements 19 Note 1 Accounting Policies 19 Note 2 Accounting Standards That Have Been Issued but Have Not Yet Been
Adopted
34 Note 3 Critical Judgements in Applying Accounting Policies 34 Note 4 Assumptions Made About the Future and Other Major Sources of
Estimation Uncertainty
34 Note 5 Adjustments between Accounting Basis and Funding Basis under
Regulations
36 Note 6 Transfers to/from Earmarked Reserves 41 Note 7 Amounts Reported for Resource Allocation Decisions 43 Note 8 Other Operating Expenditure 48 Note 9 Financing and Investment Income and Expenditure 48 Note 10 Taxation and Non Specific Grant Incomes 48 Note 11 Material Items of Income and Expense 48 Note 12 Exceptional Items and Prior Period Adjustments 48 Note 13 Trading Operations 50 Note 14 Agency Services 52 Note 15 Partnership Arrangements under the Community Care and Health
(Scotland) Act 2002
52 Note 16 External Audit Costs 52 Note 17 Councillors’ Remuneration 53 Note 18 Officers’ Remuneration 53 Note 19 Termination Benefits 53 Note 20 Construction Contracts 53 Note 21 Capital Expenditure and Capital Financing 53 Note 22 Property, Plant and Equipment 54 Note 23 Heritage Assets 61 Note 24 Heritage Assets – Five Year Summary of Transactions 61 Note 25 Heritage Assets – Further Information on Museums’ Collections 61 Note 26 Heritage Assets – Change in Accounting Policy 66 Note 27 Investment Properties 68 Note 28 Intangible Assets 68 Note 29 Assets Held for Sale 70 Note 30 Leases 70 Note 31 Private Finance Initiatives and Similar Contracts 73 Note 32 Impairment Losses 75 Note 33 Financial Instruments 75 Note 34 Nature and Extent of Risks Arising from Financial Instruments 77 Note 35 Inventories 80 Note 36 Debtors 81 Note 37 Cash and Cash Equivalents 82 Note 38 Creditors 82 Note 39 Provisions 82
STATEMENT OF ACCOUNTS 2011/2012
Page 2 of 162
Note 40 Grant Income 84 Note 41 Usable Reserves 86 Note 42 Unusable Reserves 86 Note 43 Events After the Balance Sheet Date 90 Note 44 Contingent Liabilities 90 Note 45 Contingent Assets 91 Note 46 Pensions Schemes Accounted for as Defined Contribution Schemes 91 Note 47 Defined Benefit Pension Schemes 91 Note 48 Related Parties 98 Note 49 Cash Flow Statement – Operating Activities 102 Note 50 Cash Flow Statement – Investing Activities 103 Note 51 Cash Flow Statement – Financing Activities 103 Housing Revenue Account 104 Council Tax 108 Business Rates 111 Loans Fund 113 Trusts and Endowments 114 Common Good Funds 120 Group Accounts 123 Statement of Assurance 143 Remuneration Report 145 Glossary of Terms 156 Independent Auditor’s Report 161

EXPLANATORY FOREWORD BY THE HEAD OF FINANCE
Page 3 of 162
INTRODUCTION
The purpose of the annual Statement of Accounts is to demonstrate proper stewardship of the Council’s financial affairs. The Statement has been prepared in accordance with the Code of Practice on Local Authority Accounting in the United Kingdom 2011/12 Based on International Financial Reporting Standards (the Code) and the 2011/12 Code Update, both of which were issued by the Chartered Institute of Public Finance and Accountancy (CIPFA) and the Local Authority (Scotland) Accounts Advisory Committee (LASAAC). This foreword provides an explanation of the Statement of Accounts and of the most significant matters reported in the Accounts, together with a summary of the financial outturn for the year ended 31 March 2012. 2011/12 sees the second year in which the Statement of Accounts has been produced using International Financial Reporting Standards (IFRS). The format is largely similar to the 2010/11 Statement of Accounts, although there have been some changes, mostly notably the introduction of a new category of fixed asset called Heritage Assets. The purpose of the Financial Statements is described in detail in the next section. Details of the significance of the changes with regard to Heritage Assets are included within the section on Significant Changes in Accounting Policies on page 9, in Note 12 on Exceptional Items and Prior Period Adjustments on pages 48 - 50 and in Note 26 on Heritage Assets - Change in Accounting Policy on Pages 66 - 68. FINANCIAL STATEMENTS During the year, the Council increased its Usable Reserves by £23,020,000 from £44,182,000 to £67,202,000, with the movements shown as follows:
31 March
2011 31 March
2012 (Increase)/ Decrease
£'000 £'000 £'000
General Fund Balance (17,404) (27,863) (10,459)
Earmarked General Fund Reserves (11,759) (19,595) (7,836)
Housing Revenue Account (HRA) (2,000) (2,000) -
Earmarked HRA Reserves (3,033) - 3,033
Capital Receipts Reserve (696) (692) 4
Capital Fund (5,956) (10,803) (4,847)
Repairs and Renewals Fund (980) (4,047) (3,067)
Insurance Fund (1,119) (1,250) (131)
Capital Grants Unapplied Account (1,235) (952) 283
Total Usable Reserves (44,182) (67,202) (23,020)
The largest movement is in the General Fund Balance, which has increased by £10,459,000. The Revenue Budget had been set to reduce this balance by £9,777,000. However, during the year, the measures that were put in place during 2010/11 to encourage proactive management of budgets across all services continued and this was supplemented by the early achievement of some savings, as reported to Policy and Resources Committee throughout the year. Significant transfers to the Invest to Save Fund (one of the Earmarked General Fund Reserves), the Capital Fund and the Winter Maintenance and Other Emergencies Fund (an element of the Repairs and Renewals Fund) were approved during the year. Policy and Resources Committee also approved a revised Usable Reserves Strategy.
The following statements are shown in the accounts. 1. Movement in Reserves Statement This statement shows the movement in the year on the different reserves held by the Council, analysed into “usable reserves” (i.e. those that can be applied to fund expenditure or reduce local taxation) and

EXPLANATORY FOREWORD BY THE HEAD OF FINANCE
Page 4 of 162
other reserves. The Surplus or (Deficit) on the Provision of Services line shows the true economic cost of providing the Council’s services, more details of which are shown in the Comprehensive Income and Expenditure Statement. These are different from the statutory amounts required to be charged to the General Fund Balance and the Housing Revenue Account for council tax setting and dwellings rent setting purposes. The Net Increase/Decrease before Transfers to Earmarked Reserves line shows the statutory General Fund Balance and Housing Revenue Account Balance before any discretionary transfers to or from earmarked reserves undertaken by the Council. 2. Comprehensive Income and Expenditure Statement This statement shows the accounting cost in the year of providing services in accordance with generally accepted accounting practices, rather than the amount to be funded from taxation. Authorities raise taxation to cover expenditure in accordance with regulations; this may be different from the accounting cost. The taxation position is shown in the Movement in Reserves Statement. 3. Balance Sheet The Balance Sheet shows the value as at the Balance Sheet date of the assets and liabilities recognised by the Council. The net assets of the Council (assets less liabilities) are matched by the reserves held by the Council. Reserves are reported in two categories. The first category of reserves are usable reserves, i.e. those reserves that the Council may use to provide services, subject to the need to maintain a prudent level of reserves and any statutory limitations on their use (for example the Capital Receipts Reserve that may only be used to fund capital expenditure or repay debt). The second category of reserves is those that the Council is not able to use to provide services. This category of reserves includes reserves that hold unrealised gains and losses (for example the Revaluation Reserve), where amounts would only become available to provide services if the assets are sold; and reserves that hold timing differences shown in the Movement in Reserves Statement line “Adjustments between accounting basis and funding basis under regulations”. 4. Cash Flow Statement The Cash Flow Statement shows the changes in cash and cash equivalents of the Council during the reporting period. The statement shows how the Council generates and uses cash and cash equivalents by classifying cash flows as operating, investing and financing activities. The amount of net cash flows arising from operating activities is a key indicator of the extent to which the operations of the Council are funded by way of taxation and grant income or from the recipients of services provided by the Council. Investing activities represent the extent to which cash outflows have been made for resources which are intended to contribute to the Council’s future service delivery. Cash flows arising from financing activities are useful in predicting claims on future cash flows by providers of capital (i.e. borrowing) to the Council. 5. Notes to the Financial Statements The Notes to the Financial Statements provide supplementary information on core financial transactions which are not detailed separately in the statements. 6. Housing Revenue Account Income and Expenditure Statement The Housing Revenue Account Income and Expenditure Statement shows the economic cost in the year of providing housing services in accordance with generally accepted accounting practices, rather than the amount to be funded from rents and other income. Authorities charge rents to cover expenditure in accordance with regulations; this may be different from the accounting cost. The increase or decrease in the year, on the basis of which rents are raised, is shown in the Movement on the Housing Revenue Account Statement. 7. Council Tax Income Account The Council Tax Income Account shows the gross income raised from council taxes levies and deductions made under Statute. The resultant net income is transferred to the Comprehensive Income and Expenditure Statement of the Council.

EXPLANATORY FOREWORD BY THE HEAD OF FINANCE
Page 5 of 162
8. Business Rate Account The Business Rate Account is an agent’s statement that reflects the statutory obligation for billing authorities to maintain a separate Business Rate Account. The statement shows the gross income from rates and deductions made under Statute. The net income is paid to the Scottish Government as a contribution to the national non-domestic rate pool.
9. Loans Fund A Loans Fund is maintained under powers contained in the Local Government (Scotland) Act 1975 and is the central capital financing account of the Council. It is an accounting arrangement which simplifies the funding of capital projects, funded by borrowing to the actual borrowing undertaken. All advances to finance capital expenditure are made through the Loans Fund except for capital projects financed directly from revenue or from capital receipts. The Council uses the annuity method to calculate the repayment of loans fund advances. The maximum period for the repayment of those advances are set out in the Scottish Government’s Financial Circular 29/1975. All interest and management expenses incurred through external borrowing are initially paid by the Loans Fund. These are recharged to the Comprehensive Income and Expenditure Statement, although bank charges are charged direct to Corporate and Democratic Core. 10. Trust Funds and Common Good Funds
Trust Funds and Common Good Funds administered by the Council are shown separately within the Statement of Accounts, together with any relevant Notes that provide supplementary information. An Income and Expenditure Statement and Balance Sheet are shown for the total of all Trust Funds and similar statements are shown for the total of all Common Good Funds. 11. Group Accounts A Movement in Reserves Statement, a Comprehensive Income and Expenditure Statement, a Balance Sheet and a Cash Flow Statement, together with any relevant Notes are also shown for the Council and its Group entities. 12. Remuneration Report The Remuneration Report provides narrative details of the Council’s remuneration policy for its senior councillors, senior employees and subsidiary bodies where it has a role in determining the remuneration policy, and states how remuneration arrangements are managed, including the role and membership of any remuneration committee. It also discloses details of remuneration information for senior councillors, senior employees and subsidiary bodies, including pension benefits. Information is provided on the number of persons whose remuneration was £50,000 or more, disclosed in bands of £5,000. The Remuneration Report is produced in terms of the Scottish Government’s Local Government Finance Circular No 8/2011 (revised and re-issued). FINANCIAL OUTTURN 2011/12 1. General Fund Revenue Expenditure The Comprehensive Income and Expenditure Statement on page 16 shows a deficit on the provision of services of £26,131,000. When the figure is adjusted to take account of transactions that have been included on an accounting basis, expenditure and income that is required to be included on a funding basis under statute, and any transfers to or from Council reserves, the movement in the General Fund balance is an increase of £18,295,000. Of this movement, £7,836,000 has been transferred to Earmarked Reserves of the General Fund, giving an increase in the working balance of £10,459,000. This compares with a budgeted reduction of £9,777,000 in the working balance, giving a surplus of £20,236,000 on the working balance for the year.

EXPLANATORY FOREWORD BY THE HEAD OF FINANCE
Page 6 of 162
In 2011/12, the Council budgeted to spend £502,823,000 on the provision of Services. Actual expenditure was £485,681,000 or £17,142,000 lower than anticipated. Expenditure on other items such as Capital Financing Costs, Trading Accounts and transfers to and from various Council balances was budgeted at £38,484,000. Actual expenditure was £35,983,000 or £2,501,000 lower than anticipated. Income from Revenue Support Grant was budgeted at £344,291,000, income from Business Rates was budgeted at £68,500,000 and income from Council Tax was budgeted at £118,739,000. Actual income in total from these sources was £532,123,000 or £593,000 higher than anticipated. Taking all of the above into account gives net expenditure for the year which is £20,236,000 lower than anticipated. The actual working balance at the year end is £27,863,000. The surplus has been generated through proactive budget management across all services and the early achievement of some savings, as reported to Policy and Resources Committee throughout the year. This is a positive outturn that reflects sound financial management across all Council Services and will offer both protection against the uncertainty surrounding future years' financial pressures in the current climate, and, an opportunity to enhance service delivery through a managed programme of investment. Since these savings are largely one-off the surplus needs to be set aside to manage future financial risk and to create the capacity for refocusing service delivery. Reasons for the major underspends include:
management of vacant posts, particularly where services reviews are in progress;
a reduction in the number of teaching staff on conserved salaries, the non-filling of some vacancies and changes to the terms and conditions of service for Supply Teachers;
a reduction in the number of placements in residential care due to the use of more flexible local solutions;
a delay in negotiating the terms and conditions relating to the purchase of an Electronic Homecare Management System;
increased income from planning application fees and the rental of industrial and commercial properties;
increased income from the sale of recyclates, reduced levels of waste and a reduction in the costs associated with waste disposal including new contract prices being in place;
rephasing of schemes associated with the local economy, particularly those which rely on third parties;
lower leasing costs for vehicles as new vehicles have been purchased rather than leased and reductions in the purchase of small items of vehicles and plant as a result of delays in the tender process;
an underspend on Capital Financing Charges due to a combination of factors including delays in the capital programme, favourable borrowing conditions and lower than budgeted principal repayments;
delays in progressing a number of technologically based projects and savings in Hardware Maintenance Contracts, Software Infrastructure, Business Systems, the cost of Data Lines and the IT Development Strategy;
the return of a significant surplus from the Grampian Joint Police Board; and
a higher than forecast recovery of benefit subsidy. Partly offsetting these underspends are a number of overspends, including:
an increase in essential reactive maintenance of council properties;
a shortfall in achieving some cross service procurement savings as a result of a higher than anticipated inflation rate and policy implications associated with some of the originally planned savings; and
a significant increase in the provision for bad debts. The majority of the above items have been detailed in monitoring reports to the Council as issues arose throughout the financial year. The Council made some extremely difficult decisions in setting its budget for 2011/12 and the following three years. The underspend in 2011/12 includes savings brought forward from future years. Despite a significant increase in the provision for bad debts, increased income from a number of sources in the last few months of the year was experienced. There are still financial challenges ahead and the Council is well placed to face these challenges, starting from a strong base of sound financial performance. With the

EXPLANATORY FOREWORD BY THE HEAD OF FINANCE
Page 7 of 162
challenges comes opportunity, and the Council will continue to direct resources at areas of greatest need through a combination of further efficiency measures and realignment of budgets. 2. Housing Revenue Account (HRA) The HRA Income and Expenditure Statement on page 103 shows a deficit of £42,908,000. When the figure is adjusted to take account of transactions that have been included on an accounting basis, expenditure and income that is required to be included on a funding basis under statute, and any transfers to or from Council reserves, the movement in the HRA balance is a reduction of £3,033,000.
The revised HRA budget for 2011/12 had approved expenditure of £47,802,000 and income of £44,769,000, giving a net operating deficit of £3,033,000. Actual expenditure totalled £50,979,000 with income of £47,946,000, giving a net deficit of £3,033,000. This deficit was funded by a transfer from the HRA balance.
Although the net deficit was in line with the budget overall, there were a number of variances within the budget. Reasons for the underspends include:
lower salary costs due to vacant posts as a result of proactive vacancy management;
heating and lighting costs are lower than budget due to large credits received during the year relating to previous years;
planned maintenance costs are lower than budget due to tenders for the external painterwork contract being lower than anticipated;
cleaning costs are lower than budget due to delays in implementing the sheltered housing cleaning contract;
underspends in the capital programme and higher balances brought forward from previous years have resulted in reduced borrowing requirements. The cost of borrowing has also reduced due to lower interest rates;
rental income is higher than budget due to a net 35 properties being added to stock through the new build programme;
additional rental income in respect of housing support provided by staff in hostels;
additional income for the new build programme and the provision of equipment and adaptations to council house tenants; and
additional income from temporary accommodation units.
Partly offsetting these underspends are a number of overspends, including:
higher expenditure on response repairs due to higher levels of repairs to gas and oil heating systems and damage to buildings following the adverse weather over the winter months; and
a significant increase in the provision for bad debts.
The budget included £7,023,000 to meet capital expenditure. The variances detailed above produced a net underspend, which allowed expenditure of £13,872,000 to be used to meet capital expenditure whilst reducing the HRA balance by £3,033,000 as planned. This continues the strategy which had been in place over the previous two years to fund capital expenditure using the HRA balance as an alternative to borrowing. This strategy generated substantial savings on Capital Financing Costs. This strategy has reduced the HRA balance to £2,000,000 which is required to be retained as a working balance to meet any unexpected costs that occur. No further funding, other than any budgeted provision will be available to finance capital expenditure in 2012/13, and the balance of capital expenditure will be met from borrowing.
The HRA balance is in accordance with the 30 Year “Retention Plus” business plan agreed by the Council for the HRA. The business plan seeks to ensure that the future needs of the stock and of tenants can be met and are affordable.

EXPLANATORY FOREWORD BY THE HEAD OF FINANCE
Page 8 of 162
3. Trading Operations The Local Government in Scotland Act 2003 sets out a statutory duty for Councils to achieve Best Value. It provides a strong link between the duty of Best Value, the delivery of services and the reporting of financial performance. Councils are required to maintain statutory trading accounts for “significant trading operations”, and these operations should break even over a three year rolling period. Under the Act, the Council has established trading accounts for two services – Housing Repairs and Roads Operations. The trading operations returned a net surplus of £2,875,000 in 2011/12. Housing Repairs and Roads Operations both achieved their statutory break-even target over the three year period 2009/10 to 2011/12. Further details of the trading operations are set out in note 13 on pages 50 - 51. At its meeting on 10 November 2011, Policy and Resources Committee agreed that Housing Repairs would no longer be a statutory trading account, with effect from 1 April 2012. From that date, its costs will be consolidated into the Housing Revenue Account. 4. Capital Expenditure Under the Prudential Code for capital finance, Aberdeenshire Council is allowed to determine its own limits for borrowing and capital expenditure. Expenditure plans must be affordable, sustainable and prudent. Capital expenditure is aligned closely with the Council’s Corporate Asset Management Plan. The Council’s approach to asset management involves producing and continuing to update a wide range of relevant information on the performance of assets and the full investigation of capital and revenue spending decisions. Capital expenditure is reported in terms of the main themes that determine the strategic priorities of the Council. In 2011/12, total capital expenditure was £74,782,000, of which £8,442,000 was spent on Community Wellbeing, £19,087,000 was spent on Jobs and the Economy, £13,078,000 was spent on Lifelong Learning, £1,827,000 was spent on Sustainable Environment and £7,350,000 was spent on Corporate Improvement. In addition, £24,998,000 was spent on HRA Housing. Capital expenditure includes the purchase of intangible assets, such as software. MATERIAL ASSETS ACQUIRED OR LIABILITIES INCURRED An opportunity arose during the year to make an advance payment £20,963,000 to the North East Scotland Pension Fund in respect of deficit contributions for the period 2012-15. This capitalised payment attracted an advantageous discount over the payment of deficit contributions in year. The transaction has been recognised as a debtor on the balance sheet. PENSION LIABILITIES The Statement of Accounts includes the future pension liability of the Council resulting from the full implementation of IAS 19. Accounting Policy 1.6 on pages 21-22 sets out the Council’s policy on pension costs and note 42 on pages 86 - 90 and notes 46 - 47 on pages 91 - 98 give more details of the pension liabilities. The Council participates in the Local Government Pension Scheme which is administered by Aberdeen City Council, known as the North East Scotland Pension Fund. This Fund is in deficit due to a substantial fall in the value of world stock markets in previous years. The Council’s share of the net Fund deficit has increased during 2011/12 by £25,988,000. The deficit position on the Fund was considered as part of the triennial revaluation of the Pension Fund as at 31 March 2011. At each full revaluation of the Fund, the assets and liabilities of the Fund are recalculated in full. As a result of this recalculation, the value of both the assets and the liabilities has

EXPLANATORY FOREWORD BY THE HEAD OF FINANCE
Page 9 of 162
been reduced. However, the reduction in the value of the assets is greater than the reduction in the value of the liabilities, and this has resulted in an increase in the Council’s share of the net Fund deficit. A funding plan has been determined with the aim of recovering the deficit over a period of up to 22 years which requires additional contributions to correct the shortfall, and this is explained in Note 47 on page 96. The next triennial valuation will be as at 31 March 2014. MATERIAL AND UNUSUAL CHARGES OR CREDITS There are no material and unusual charges or credits that are required to be highlighted. SIGNIFICANT CHANGES IN ACCOUNTING POLICIES The Code of Practice on Local Authority Accounting in the United Kingdom 2011/12 introduced a change to the treatment in accounting for heritage assets held by the Council. Heritage assets are now required to be carried in the balance sheet at valuation. Various balances and transactions have been restated throughout the accounts. The change has necessitated the preparation of three Balance Sheets. These are as at 1 April 2010, 31 March 2011 and 31 March 2012. Other financial statements and disclosure notes have been restated for 2010/11. More details on the restatements are shown in Note 12 on Exceptional Items and Prior Period Adjustments and Note 26 on Heritage Assets – Change in Accounting Policy. MAJOR CHANGES IN STATUTORY FUNCTIONS There were no major changes in statutory functions during 2011/12, however on 7 August 2012, the Police and Fire Reform (Scotland) Act 2012 received royal assent. Responsibility for Police and Fire and Rescue Services will transfer from local government to new central government bodies on 1 April 2013. The full impact of the reform is being assessed currently CURRENT BORROWING FACILITIES
The Council’s Treasury Management Strategy sets out the following criteria to determine from whom the Council may borrow: any other UK local authority or government guaranteed institution and any bank, financial institution, insurance company or utility company which is governed by MiFID, the EU Markets in Financial Instruments Directive (2004/39/EC). The long term borrowing at 31 March 2012 was £400,398,000 (2010/11 £357,068,000) of which £301,270,000 (2010/11 £257,866,000) was from the Public Works Loan Board (PWLB) with the balance being market loans i.e. bonds and mortgages. During 2011/12 capital expenditure amounted to £74,782,000. This was funded by a combination of revenue funding, capital grant, capital receipts and long term borrowing. All new long term borrowing in 2011/12 was from the PWLB and no other financial instruments were used in 2011/12.
FUNDS AVAILABLE TO MEET CAPITAL EXPENDITURE
The total amount of capital expenditure incurred to 31 March 2012 (including the value of assets acquired under finance leases and PFI/PPP contracts) that has not yet been charged to the revenue account of the Council is £27,729,000. The reason it has not been charged to the revenue account is that the assets are to be financed in future years by charges to revenue as they are used by the Council. The resources used to finance this expenditure is a combination of PWLB and market borrowing.
SIGNIFICANT PROVISIONS AND WRITE OFFS There were no significant increases in provisions or write offs during the year.

EXPLANATORY FOREWORD BY THE HEAD OF FINANCE
Page 10 of 162
MATERIAL EVENTS AFTER THE REPORTING DATE No material events have occurred after the reporting date that require to be disclosed. FINANCIAL RATIOS For 2011/12 Councils in Scotland have introduced the use of ratios to support the interpretation of the Council’s financial statements, financial position and performance. 1. Reserves
1.1 Uncommitted General Fund Balance as a Percentage of Annual Budgeted Expenditure
Purpose: To reflect the percentage of reserves that are neither committed nor earmarked against the annual revenue budget.
Actual 2010/11
Actual 2011/12
3.16%
5.13%
1.2 Movement in the Uncommitted General Fund Balance
Purpose: To reflect the movement in reserves that are neither committed nor earmarked in accordance with the reserve strategy of the council. Actual
2010/11 Actual
2011/12 £’000 £’000 Opening Uncommitted General Fund Balance 9,519 17,404 Closing Uncommitted General Fund Balance 17,404 27,863 Movement Uncommitted General Fund Balance 7,885 10,459
The Working Balances provide a cushion against the impact of any unforeseen circumstances or emergencies. 2. Council Tax 2.1 In-year Collection Rate Purpose: To reflect the percentage of income received from Council Tax for year received by the year end.
Actual 2010/11
Actual 2011/12
95.83% 96.21% 2.2 Council Tax Income as a Percentage of Overall Funding Purpose: To reflect the percentage of funding for the Council that comes from Council Tax. Actual
2010/11 Actual
2011/12 £’000 £’000 Council Tax Income (117,970) (119,412) Overall Funding: CT/Business Rates/Non Ring Fenced Government Grants (538,887) (532,123) Movement General Fund Balance 21.89% 22.44%

EXPLANATORY FOREWORD BY THE HEAD OF FINANCE
Page 11 of 162
3. Financial Management 3.1 Actual Outturn as a Percentage of Net Expenditure Budget
Purpose: To reflect the percentage by which actual outturn differs from budgeted outturn. Actual
2010/11 Actual
2011/12 General Fund 1.9% 3.41% 4. Debt and Borrowing 4.1 Estimated Ratio of Financing Cost to Net Revenue Stream Purpose: This ratio indicates the percentage of the revenue budget that is required to meet the cost of external borrowing. A separate ratio is shown for the General Fund and Housing Revenue Account (HRA), and indicates the affordability of the Council’s capital expenditure proposals. Actual
2010/11 Actual
2011/12 General Fund 4.27% 5.84% Housing Revenue Account 15.99% 15.12% 4.2 Estimated Incremental Impact of Investment Decisions on Council Tax/Rents Purpose: This ratio links with the previous ratio and indicates the impact of capital expenditure plans on the revenue budget. Actual
2010/11 Actual
2011/12 General Fund zero zero Housing Revenue Account zero zero This indicates that, because there is no proposed change to the existing capital plans which impacts on the level of borrowing over the medium term there is no incremental effect on council tax or rents. 4.3 Net Borrowing and the Capital Financing Requirement Purpose: These indicators show the estimated total borrowing required to fund existing and additional capital expenditure proposals and the estimated level of actual borrowing. The indicators are only required for the Council’s overall position and are not divided between the General Fund and HRA. Actual
2010/11 Actual
2011/12 £m £m Net Borrowing 420 430 Capital Financing Requirement 485 499 Net borrowing is less than the capital financing requirement. This indicates that the Council is utilising internal revenue balances to meet the cash requirements of its capital investment plans. IMPACT OF ECONOMIC CLIMATE In 2011/12 the UK economy stagnated and entered back into recession in the final quarter. This together with the global economic climate and the fall out from the banking crisis in 2008, has impacted on the activities of the Council and is therefore reflected within the Statement of Accounts. The most material areas of impact are considered below. Impairment of Non Current Assets – Non current assets are valued on a five year rolling programme (see Note 22), although an impairment review is carried out at each balance sheet date. Asset values in

EXPLANATORY FOREWORD BY THE HEAD OF FINANCE
Page 12 of 162
Aberdeenshire have not been affected as significantly as in other parts of the country by the recession. Impairment losses totalling £14,730,000 have been recognised in the Revaluation Reserve or Surplus or Deficit on the Provision of Services, representing 0.72% of the net book value of non current assets. The main economic factors relate to changes in construction costs and market conditions. Impairment of Debtors - Bad Debt Provision - The credit risk the Council is exposed to has increased as a result of the economic downturn. This has been reflected when reviewing the bad debt provision in relation to the customers of the Council, which has increased by 2.06% as detailed below. The increase in provision is charged to the Comprehensive Income and Expenditure Statement.
2010/11
2011/12 Increase/
(Decrease)
£’000 £’000 %
General Debtors 3,458 4,239 22.58
Revenues 20,928 22,649 (8.22)
Housing Rents 1,203 1,239 2.99
Total Bad Debt Provision 25,589 28,127 9.92
Shareholding Values - associated with the economic downturn is a reduction in share prices. The Council administers 423 Trusts and Endowments with a total value of £5,047,000, details of which can be found on pages 113 - 118. Of the funds invested, £2,850,000 is invested in stocks and shares. These consist of unit trusts and stocks and shares some of which are managed by fund managers. The change in value of investments is a decrease of £12,000 from 2010/11 to 2011/12. Treasury Management Activities - The Council has been pro-active in its approach to Treasury Management and has not suffered any adverse effects from the economic situation in 2011/12. As a result of the banking crisis, the credit ratings of many of the financial institutions used by the Council previously to invest its cash balances, now fall outwith the criteria of the Council’s Investment Policy and low levels of bank interest rates have led to relatively low levels of investment returns. However long term borrowing rates during the year were at historic lows and borrowing requirements were secured significantly lower than anticipated. RELATIONSHIP WITH OTHER PUBLISHED DOCUMENTS A summarised version of the financial statements will be published on the Council’s website. ACKNOWLEDGEMENTS The production of the Statement of Accounts is very much a team effort involving many staff from both my own and other services of the Council. I would like to take this opportunity to thank all those involved for their help and co-operation.
Alan Wood, MA (Hons), CPFA Head of Finance
18 June 2012
STATEMENT OF RESPONSIBILITIES
Page 13 of 162
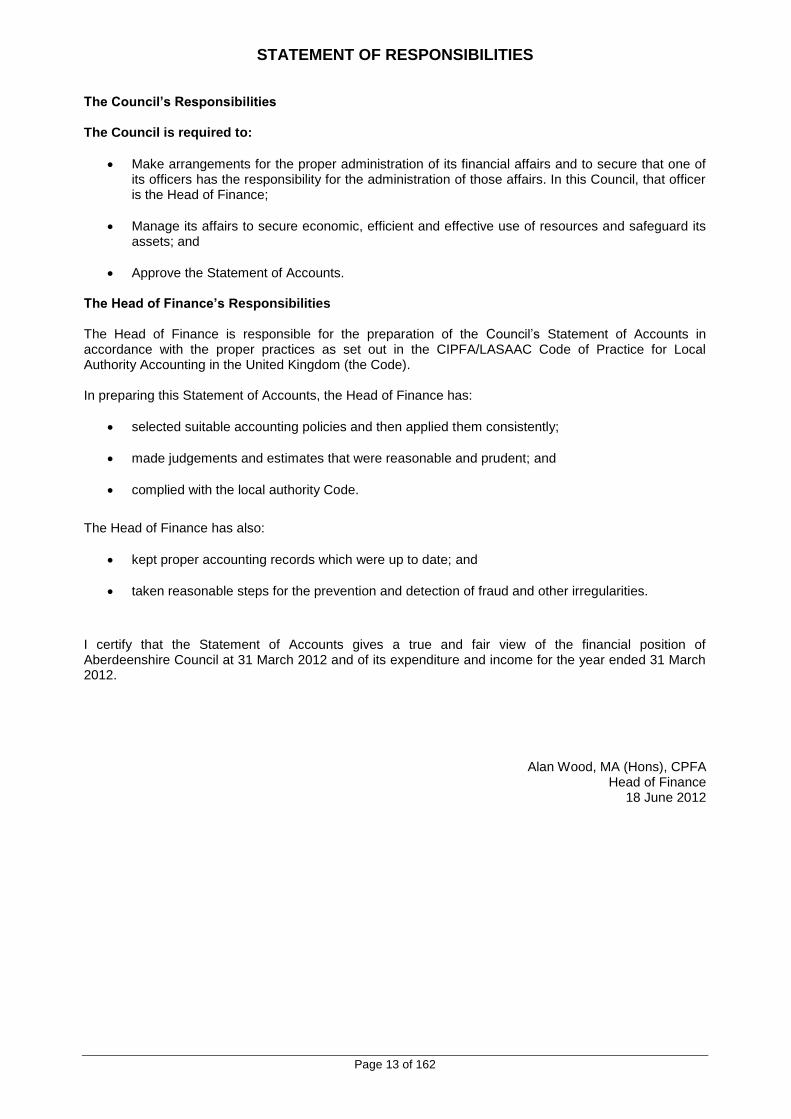
The Council’s Responsibilities The Council is required to:
Make arrangements for the proper administration of its financial affairs and to secure that one of its officers has the responsibility for the administration of those affairs. In this Council, that officer is the Head of Finance;
Manage its affairs to secure economic, efficient and effective use of resources and safeguard its assets; and
Approve the Statement of Accounts. The Head of Finance’s Responsibilities The Head of Finance is responsible for the preparation of the Council’s Statement of Accounts in accordance with the proper practices as set out in the CIPFA/LASAAC Code of Practice for Local Authority Accounting in the United Kingdom (the Code). In preparing this Statement of Accounts, the Head of Finance has:
selected suitable accounting policies and then applied them consistently;
made judgements and estimates that were reasonable and prudent; and
complied with the local authority Code.
The Head of Finance has also:
kept proper accounting records which were up to date; and
taken reasonable steps for the prevention and detection of fraud and other irregularities.
I certify that the Statement of Accounts gives a true and fair view of the financial position of Aberdeenshire Council at 31 March 2012 and of its expenditure and income for the year ended 31 March 2012.
Alan Wood, MA (Hons), CPFA Head of Finance
18 June 2012

MOVEMENT IN RESERVES STATEMENT FOR THE YEAR ENDED 31 MARCH 2012
Page 14 of 162
General Fund
Balance
Earmarked General
Fund Reserves
Housing Revenue Account
Earmarked HRA
Reserves
Capital Receipts Reserve
Capital Fund
Repairs and
Renewals Fund
Insurance Fund
Capital Grants
Unapplied Account
Total Usable
Reserves
Restated Total
Unusable Reserves
Restated Total
Council Reserves
Notes Ref
£’000 £'000 £'000 £'000 £'000 £'000 £'000 £'000 £'000 £'000 £'000 £'000
Balance at 31 March 2010 (9,519) (6,772) (2,000) (17,772) (699) (5,919) (3,173) (1,219) (490) (47,563) (1,066,052) (1,113,615)
Movement in Reserves During 2010/11
(Surplus) or Deficit on the Provision of Services (22,900) - (1,551) - - - - - - (24,451) - (24,451)
Other Comprehensive Income and Expenditure - - - - - - - - - - (31,587) (31,587)
Total Comprehensive Income and Expenditure (22,900) - (1,551) - - - - - - (24,451) (31,587) (56,038)
Adjustments Between Accounting Basis & Funding Basis Under Regulations 10,373 - 18,204 - - - - - (745) 27,832 (27,832) - 5
Net(Increase)/ Decrease before Transfers to Earmarked Reserves (12,527) - 16,653 - - - - - (745) 3,381 (59,419) (56,038)
Transfers to/from Earmarked Reserves 4,642 (4,987) (16,653) 14,739 3 (37) 2,193 100 - - - -
(Increase)/ Decrease in 2010/11
(7,885)
(4,987)
-
14,739
3
(37)
2,193
100
(745)
3,381 (59,419) (56,038)
Balance at 31 March 2011 Carried Forward (17,404) (11,759) (2,000) (3,033) (696) (5,956) (980) (1,119) (1,235) (44,182) (1,125,471) (1,169,653)
Notes Ref 6 6 Refer to Note 12 for restatements

MOVEMENT IN RESERVES STATEMENT FOR THE YEAR ENDED 31 MARCH 2012
Page 15 of 162
General Fund
Balance
Earmarked General
Fund Reserves
Housing Revenue Account
Earmarked HRA
Reserves
Capital Receipts Reserve
Capital Fund
Repairs and
Renewals Fund
Insurance Fund
Capital Grants
Unapplied Account
Total Usable
Reserves
Total Unusable Reserves
Total Council
Reserves Notes Ref
£'000 £'000 £'000 £'000 £'000 £'000 £'000 £'000 £'000 £'000 £'000 £'000
Balance at 31 March 2011
(17,404)
(11,759)
(2,000) (3,033)
(696) (5,956) (980) (1,119)
(1,235) (44,182) (1,125,471)
(1,169,653)
Movement in Reserves During 2011/12
(Surplus) or Deficit on the Provision of Services (16,777) - 42,908 - - - - - - 26,131 - 26,131
Other Comprehensive Income and Expenditure - - - - - - - - - - (115,773) (115,773)
Total Comprehensive Income and Expenditure (16,777) - 42,908 - - - - - - 26,131 (115,773) (89,642)
Adjustments Between Accounting Basis & Funding Basis Under Regulations (11,392) - (38,042) - - - - - 283 (49,151) 49,151 - 5
Net (Increase) Decrease before Transfers to Earmarked Reserves (28,169) - 4,866 - - - - - 283 (23,020) (66,622) (89,642
Transfers to/from Earmarked Reserves 17,710 (7,836) (4,866) 3,033 4 (4,847) (3,067) (131) - - - -
(Increase) Decrease in 2011/12 (10,459) (7,836) - 3,033 4 (4,847) (3,067) (131) 283 (23,020) (66,622) (89,642)
Balance at 31 March 2012 Carried Forward (27,863) (19,595) (2,000) - (692) (10,803) (4,047) (1,250) (952) (67,202) (1,192,093) (1,259,295)
Notes Ref 6 6

COMPREHENSIVE INCOME AND EXPENDITURE STATEMENT FOR THE YEAR ENDED 31 MARCH 2012
Page 16 of 162
Restated Restated
Gross Restated Net Gross Net
Expenditure Income Expenditure Expenditure Income Expenditure Notes
2010/11 2010/11 2010/11 Aberdeenshire Services 2011/12 2011/12 2011/12 Ref
£'000 £'000 £'000 £'000 £'000 £'000
293,312 (26,995) 266,317 Education Services 256,605 (3,730) 252,875
45,651 (39,689) 5,962 Housing Services 47,113 (40,802) 6,311
37,214 (42,953) (5,739) HRA 86,309 (46,061) 40,248
42,235 (14,848) 27,387 Cultural & Related Services 32,777 (10,331) 22,446
38,661 (6,614) 32,047 Environmental Services 35,447 (7,243) 28,204
70,704 (24,527) 46,177 Roads & Transport Services 37,088 (1,118) 35,970
18,779 (10,224) 8,555 Planning & Development Services 18,901 (11,155) 7,746
159,480 (25,970) 133,510 Social Work 151,471 (26,335) 125,136
27,589 (20,876) 6,713 Central Services 30,020 (24,737) 5,283
8,827 - 8,827 Fire Services 7,969 - 7,969
17,814 (1,042) 16,772 Police Services 16,111 - 16,111
2,860 - 2,860 Exceptional Items - (48) (48) 12
9,958 (46) 9,912 Corporate & Democratic Core 9,103 (61) 9,042
1,613 (62,332) (60,719) Non Distributed Costs 3,340 - 3,340
774,697 (276,116) 498,581 COST OF SERVICES 732,254 (171,621) 560,633 7
41,492 (42,031) (539) Other Operating Expenditure 39,487 (39,799) (312) 8
31,166 (1,792) 29,374 Financing and Investment Income and Expenditure 26,970 (809) 26,161 9
- (551,867) (551,867) Taxation and Non-Specific Grant Income - (560,351) (560,351) 10
(24,451) (Surplus) or Deficit on Provision of Services 26,131
(43,372) Surplus on revaluation of non current assets (134,903)
11,785 Actuarial losses on pension assets/liabilities 19,130
(31,587) Other Comprehensive Income and Expenditure (115,773)
(56,038) Total Comprehensive Income and Expenditure (89,642)
Other Notes to the Comprehensive Income and Expenditure Statement 11, 13 - 20
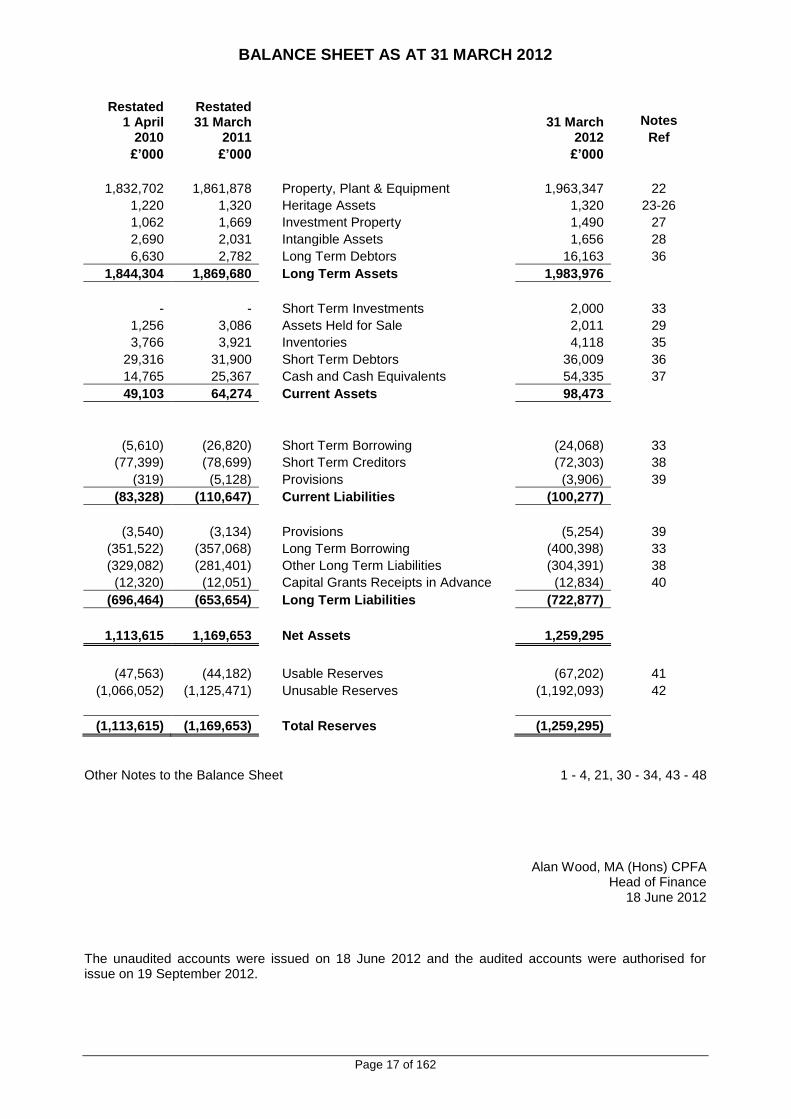
BALANCE SHEET AS AT 31 MARCH 2012
Page 17 of 162
Restated 1 April
2010
Restated 31 March
2011
31 March
2012
Notes
Ref
£’000 £’000 £’000
1,832,702 1,861,878 Property, Plant & Equipment 1,963,347 22
1,220 1,320 Heritage Assets 1,320 23-26
1,062 1,669 Investment Property 1,490 27
2,690 2,031 Intangible Assets 1,656 28
6,630 2,782 Long Term Debtors 16,163 36
1,844,304 1,869,680 Long Term Assets 1,983,976
- - Short Term Investments 2,000 33
1,256 3,086 Assets Held for Sale 2,011 29
3,766 3,921 Inventories 4,118 35
29,316 31,900 Short Term Debtors 36,009 36
14,765 25,367 Cash and Cash Equivalents 54,335 37
49,103 64,274 Current Assets 98,473
(5,610) (26,820) Short Term Borrowing (24,068) 33
(77,399) (78,699) Short Term Creditors (72,303) 38
(319) (5,128) Provisions (3,906) 39
(83,328) (110,647) Current Liabilities (100,277)
(3,540) (3,134) Provisions (5,254) 39
(351,522) (357,068) Long Term Borrowing (400,398) 33
(329,082) (281,401) Other Long Term Liabilities (304,391) 38
(12,320) (12,051) Capital Grants Receipts in Advance (12,834) 40
(696,464) (653,654) Long Term Liabilities (722,877)
1,113,615 1,169,653 Net Assets 1,259,295
(47,563) (44,182) Usable Reserves (67,202) 41
(1,066,052) (1,125,471) Unusable Reserves (1,192,093) 42
(1,113,615) (1,169,653) Total Reserves (1,259,295)
Other Notes to the Balance Sheet 1 - 4, 21, 30 - 34, 43 - 48
Alan Wood, MA (Hons) CPFA Head of Finance
18 June 2012
The unaudited accounts were issued on 18 June 2012 and the audited accounts were authorised for issue on 19 September 2012.

CASH FLOW STATEMENT FOR THE YEAR ENDED 31 MARCH 2012
Page 18 of 162
Restated 2010/11 2011/12
Notes Ref
£’000 £’000
24,451 Net surplus or (deficit) on the provision of services (26,131)
25,225 Adjust net surplus or deficit on the provision of services for non cash movements 107,668
(8,697) Adjust for items included in the net surplus or deficit on the provision of services that are investing and financing activities (5,122)
40,979 Net cash flows from Operating Activities 76,415 49 (54,465) Investing Activities (85,102) 50
24,088 Financing Activities 37,655 51
10,602 Net increase or decrease in cash and cash equivalents 28,968
14,765 Cash and cash equivalents at the beginning of the reporting period 25,367
25,367 Cash and cash equivalents at the end of the reporting period 54,335 37

NOTES TO THE FINANCIAL STATEMENTS FOR THE YEAR ENDED 31 MARCH 2012
Page 19 of 162
1. Accounting Policies 1.1 General Principles The Statement of Accounts summarises the Council’s transactions for the 2011/12 financial year and its position at the year end of 31 March 2012. The Council is required to prepare an annual Statement of Accounts by the Local Authority Accounts (Scotland) Regulations 1985, which section 12 of the Local Government in Scotland Act 2003 requires to be prepared in accordance with proper accounting practices. These practices primarily comprise the Code of Practice on Local Authority Accounting in the United Kingdom 2011/12 and the 2011/12 Code Update and the Service Reporting Code of Practice 2011/12, supported by International Financial Reporting Standards (IFRS) and statutory guidance issued under section 12 of the 2003 Act. The accounting convention adopted in the Statement of Accounts is principally historical cost, modified by the revaluation of certain categories of non-current assets and financial instruments. 1.2 Accruals of Income and Expenditure Activity is accounted for in the year that it takes place, not simply when cash payments are made or received. In particular:
revenue from the sale of goods is recognised when the Council transfers the significant risks and rewards of ownership to the purchaser and it is probable that economic benefits or service potential associated with the transaction will flow to the Council;
revenue from the provision of services is recognised when the Council can measure reliably the percentage of completion of the transaction and it is probable that economic benefits or service potential associated with the transaction will flow to the Council;
supplies are recorded as expenditure when they are consumed – where there is a gap between the date supplies are received and their consumption, they are carried as inventories on the Balance Sheet;
expenses in relation to services received (including services provided by employees) are recorded as expenditure when the services are received rather than when payments are made;
interest payable on borrowings and receivable on investments is accounted for on the basis of the effective interest rate for the relevant financial instrument rather than the cash flows fixed or determined by the contract; and
where revenue and expenditure have been recognised but cash has not been received or paid, a debtor or creditor for the relevant amount is recorded in the Balance Sheet. Where there is evidence that debts are unlikely to be settled, the balance of debtors is written down and a charge made to revenue for the income that might not be collected.
1.3 Cash and Cash Equivalents Cash is represented by cash in hand and deposits with financial institutions repayable without penalty on notice of not more than 24 hours. Cash equivalents are investments that mature in three months or less and that are readily convertible to known amounts of cash with insignificant risk of change in value. In the Balance Sheet and Cash Flow Statement, cash and cash equivalents are shown net of bank overdrafts that are repayable on demand and form an integral part of the Council’s cash management. 1.4 Charges to Revenue for Non-Current Assets Services, support services and trading accounts are debited with the following amounts to record the cost of holding non-current assets during the year:
depreciation attributable to the assets used by the relevant service;
revaluation and impairment losses on assets used by the service where there are no accumulated gains in the Revaluation Reserve against which the losses can be written off; and
amortisation of intangible assets attributable to the service. The Council is not required to raise council tax to cover depreciation, impairment losses, revaluation losses or amortisation. However, it is required to make an annual contribution from revenue towards the reduction in its overall borrowing requirement equal to loans fund principal repayments. Depreciation,

NOTES TO THE FINANCIAL STATEMENTS FOR THE YEAR ENDED 31 MARCH 2012
Page 20 of 162
impairment losses, revaluation losses and amortisations are therefore substituted by a funding contribution in the General Fund Balance, by way of an adjusting transaction with the Capital Adjustment Account in the Movement in Reserves Statement for the difference between the two. 1.5 Employee Benefits (i) Benefits Payable During Employment Short-term employee benefits are those due to be settled within twelve months of the year end. They include such benefits as wages and salaries, paid annual leave and paid sick leave, bonuses and non-monetary benefits for current employees, and are recognised as an expense in the year in which employees render service to the Council. An accrual is made for the cost of holiday entitlements and flexi time earned by employees but not taken before the year end and which employees can carry forward into the next financial year. The accrual is made at the wage and salary rates applicable in the following accounting year, being the period in which the employee takes the benefit. The accrual is charged to the Surplus or Deficit on the Provision of Services, but then reversed out through the Movement in Reserves Statement so that holiday benefits are charges to revenue in the financial year in which the holiday absence occurs. (ii) Termination Benefits Termination benefits are amounts payable as a result of a decision by the Council to terminate an officer’s employment before the normal retirement date or an officer’s decision to accept voluntary redundancy and are charged on an accruals basis to the relevant service line in the Comprehensive Income and Expenditure Statement when the Council is demonstrably committed to either terminating the employment of an officer or group of officers or making an offer to encourage voluntary redundancy. Where termination benefits involve the enhancement of pensions, statutory provisions require the General Fund balance to be charged with the amount payable by the Council to the pension fund or pensioner in the year, not the amount calculated according to the relevant accounting standards. In the Movement in Reserves Statement, appropriations are required to and from the Pensions Reserve to remove the notional debits and credits for pension enhancement termination benefits and replace them with debits for the cash paid to the pension fund and pensioners and any such amounts payable but unpaid at the year end. (iii) Post Employment Benefits Employees of the Council are members of one of two separate pension schemes:
The Scottish Teachers’ Pension Scheme, administered by the Scottish Government; and
The Local Government Pension Scheme The North East Scotland Pension Fund, administered by Aberdeen City Council.
Both schemes provide defined benefits to members (retirement lump sums and pensions), earned as employees worked for the Council. However, the arrangements for the teachers’ scheme mean that liabilities for these benefits cannot be identified specifically to the Council. The scheme is therefore accounted for as if it were a defined contributions scheme – no liability for future payments of benefits is recognised in the Balance Sheet and the Education Service line in the Comprehensive Income and Expenditure Statement is charged with the employer’s contributions payable to Teachers’ Pensions in the year. (iv) The Local Government Pension Scheme The Local Government Scheme is accounted for as a defined benefits scheme:
the liabilities of the North East Scotland Pension Fund attributable to the Council are included in the Balance Sheet on an actuarial basis using the projected unit method i.e. an assessment of the future payments that will be made in relation to retirement benefits earned to date by employees, based on assumptions about mortality rates, employee turnover rates, etc, and projections of projected earnings for current employees;

NOTES TO THE FINANCIAL STATEMENTS FOR THE YEAR ENDED 31 MARCH 2012
Page 21 of 162
liabilities are discounted to their value at current prices, using a discount rate of 4.9% (based on a weighted average of “spot yields” on AA rated corporate bonds);
the assets of the North East Scotland Pension Fund attributable to the Council are included in the Balance Sheet at their fair value: - quoted securities – current bid price; - unquoted securities – professional estimate; - unitised securities – current bid price; and - property – market value; and
The change in the net pensions liability is analysed into seven components: - current service cost – the increase in liabilities as a result of years of service earned this year
– allocated in the Comprehensive Income and Expenditure Statement to the services for which the employees worked;
- past service cost – the increase in liabilities arising from current year decisions whose effect relates to years of service earned in earlier years – debited to the Surplus/Deficit on the Provision of Services in the Comprehensive Income and Expenditure Statement as part of Non Distributed Costs;
- interest cost – the expected increase in the present value of liabilities during the year as they move one year closer to being paid – debited to the Finance and Investment Income and Expenditure line in the Comprehensive Income and Expenditure Statement;
- expected return on assets – the annual investment return on the fund assets attributable to the Council, based on an average of the expected long term return – credited to the Finance and Investment Income and Expenditure line in the Comprehensive Income and Expenditure Statement;
- gains/losses on settlements and curtailments – the result of actions to relieve the Council of liabilities or events that reduce the expected future service or accrual of benefits of employees – debited/credited to the Surplus/Deficit on the Provision of Services in the Comprehensive Income and Expenditure Statement as part of Non Distributed Costs;
- actuarial gains and losses – changes in the net pensions liability that arise because events have not coincided with assumptions made at the last actuarial valuation or because the actuaries have updated their assumptions – debited to the Pensions Reserve; and
- contributions paid to the North East Scotland Pension Fund – cash paid as employer’s contributions to the pension fund in settlement of liabilities; not accounted for as an expense.
In relation to retirement benefits, statutory provisions require the General Fund balance to be charged with the amount payable by the Council to the Pension Fund or directly to pensioners in the year, not the amount calculated according to the relevant accounting standards. In the Movement in Reserves Statement, this means that there are appropriations to and from the Pensions Reserve to remove the notional debits and credits for retirement benefits and replace them with debits for the cash paid to the pension fund and pensioners and any such amounts payable but unpaid at the year end. The negative balance that arises on the Pensions Reserve thereby measures the beneficial impact to the General Fund of being required to account for retirement benefits on the basis of cash flows rather than as benefits are earned by employees. (v) Discretionary Benefits The Council also has restricted powers to make discretionary awards of retirement benefits in the event of early retirements. Any liabilities estimated to arise as a result of an award to any member of staff (including teachers) are accrued in the year of the decision to make the award and accounted for using the same policies as are applied to the Local Government Pension Scheme. 1.6 Events after the Balance Sheet Date Events after the Balance Sheet date are those events, both favourable and unfavourable, that occur between the end of the reporting period and the date when the Statement of Accounts is authorised for issue. Two types of events can be identified:
those that provide evidence of conditions that existed at the end of the reporting period – the Statement of Accounts is adjusted to reflect such events; and

NOTES TO THE FINANCIAL STATEMENTS FOR THE YEAR ENDED 31 MARCH 2012
Page 22 of 162
those that are indicative of conditions that arose after the reporting period – the Statement of Accounts is not adjusted to reflect such events, but where a category of events would have a material effect disclosure is made in the notes of the nature of the events and their estimated financial effect.
Events taking place after the date of authorisation for issue are not reflected in the Statement of Accounts. 1.7 Exceptional Items When items of income and expense are material, their nature and amount is disclosed separately, either on the face of the Comprehensive Income and Expenditure Statement or in the notes to the accounts, depending on how significant the items are to an understanding of the Council’s financial performance. 1.8 Financial Liabilities Financial liabilities are recognised on the Balance Sheet when the Council becomes a party to the contractual provisions of a financial instrument and initially measured at fair value and carried at their amortised cost subsequently. Annual charges to the Financing and Investment Income and Expenditure line in the Comprehensive Income and Expenditure Statement for interest payable are based on the carrying amount of the liability, multiplied by the effective rate of interest for the instrument. The effective interest rate is the rate that exactly discounts estimated future cash payments over the life of the instrument to the amount at which it was originally recognised. For most of the borrowings that the Council has, this means that the amount presented in the Balance Sheet is the outstanding principal repayable (plus accrued interest reflected in Creditors) and interest charged to the Comprehensive Income and Expenditure Statement is the amount payable for the year according to the loan agreement. Gains and losses on the repurchase or early settlement of borrowing are credited and debited to the Financing and Investment Income and Expenditure line in the Comprehensive Income and Expenditure Statement in the year of repurchase/settlement. However, where repurchase has taken place as part of a restructuring of the loan portfolio that involves the modification or exchange of existing instruments, the premium or discount is respectively deducted from or added to the amortised cost of the new or modified loan and the write-down to the Comprehensive Income and Expenditure Statement is spread over the life of the loan by an adjustment to the effective interest rate. Where premiums and discounts have been charged to the Comprehensive Income and Expenditure Statement, regulations allow the impact on the General Fund Balance to be spread over future years. The Council has a policy of spreading the gain/loss over the term that was remaining on the loan against which the premium was payable or discount receivable when it was repaid. The reconciliation of amounts charged to the Comprehensive Income and Expenditure Statement to the net charge required against the General Fund Balance is managed by a transfer to or from the Financial Instruments Adjustment Account in the Movement in Reserves Statement. 1.9 Financial Assets Financial assets are classified into two types:
loans and receivables – assets that have fixed or determinable payments but are not quoted in an active market; and
available-for-sale assets – assets that have a quoted market price and/or do not have fixed or determinable payments.
(i) Loans and Receivables Loans and receivables are recognised on the Balance Sheet when the Council becomes a party to the contractual provisions of a financial instrument and are initially measured at fair value. They are measured subsequently at their amortised cost. Annual credits to the Financing and Investment Income and Expenditure line in the Comprehensive Income and Expenditure Statement for interest receivable are

NOTES TO THE FINANCIAL STATEMENTS FOR THE YEAR ENDED 31 MARCH 2012
Page 23 of 162
based on the carrying amount of the asset multiplied by the effective rate of interest for the instrument. For most of the loans that the Council has made, this means that the amount presented in the Balance Sheet is the outstanding principal receivable (plus accrued interest reflected in Debtors) and interest credited to the Comprehensive Income and Expenditure Statement is the amount receivable for the year in the loan agreement. However, the Council has made a number of loans to small businesses and other organisations at less than market rates (soft loans). When soft loans are made, a loss is recorded in the Comprehensive Income and Expenditure Statement (debited to the appropriate service) for the present value of the interest that will be foregone over the life of the instrument, resulting in a lower amortised cost than the outstanding principal. Interest is credited to the Financing and Investment Income and Expenditure line in the Comprehensive Income and Expenditure Statement at a marginally higher effective rate of interest than the rate receivable from the small businesses and other organisations, with the difference serving to increase the amortised cost of the loan in the Balance Sheet. Statutory provisions require that the impact of soft loans on the General Fund Balance is the interest receivable for the financial year – the reconciliation of amounts debited and credited to the Comprehensive Income and Expenditure Statement to the net gain required against the General Fund Balance is managed by a transfer to or from the Financial Instruments Adjustment Account in the Movement in Reserves Statement. Where assets are identified as impaired because of a likelihood arising from a past event that payments due under the contract will not be made, the asset is written down and a charge made to the Financing and Investment Income and Expenditure line in the Comprehensive Income and Expenditure Statement. The impairment loss is measured as the difference between the carrying amount and the present value of the revised future cash flows discounted at the asset’s original effective interest rate. Any gains and losses that arise on the derecognition of an asset are credited/debited to the Financing and Investment Income and Expenditure line in the Comprehensive Income and Expenditure Statement. (ii) Available-for-Sale Assets Available-for-sale assets are recognised on the Balance Sheet when the Council becomes a party to the contractual provisions of a financial instrument and are initially measured and carried at fair value. Where the asset has fixed or determinable payments, annual credits to the Financing and Investment Income and Expenditure line in the Comprehensive Income and Expenditure Statement for interest receivable are based on the amortised cost of the asset multiplied by the effective rate of interest for the instrument. Where there are no fixed or determinable payments, income (e.g. dividends) is credited to the Comprehensive Income and Expenditure Statement when it becomes receivable by the Council. Assets are maintained in the Balance Sheet at fair value. Values are based on the following principles:
instruments with quoted market prices – the market price;
other instruments with fixed and determinable payments – discounted cash flow analysis; and
equity shares with no quoted market prices – independent appraisal of company valuations. Changes in fair value are balanced by an entry in the Available-for-Sale Reserve and the gain/loss is recognised in the Surplus/Deficit on Revaluation of Available-for-Sale Financial Assets. The exception is where impairment losses have been incurred – these are debited to the Financing and Investment Income and Expenditure line in the Comprehensive Income and Expenditure Statement, along with any net gain/loss for the asset accumulated in the Reserve. Where financial assets are identified as impaired because of a likelihood arising from a past event that payments due under the contract will not be made (fixed or determinable payments) or fair value falls below cost, the asset is written down and a charge made to the Financing and Investment Income and Expenditure line in the Comprehensive Income and Expenditure Statement. If the asset has fixed or determinable payments, the impairment loss is measured as the difference between the carrying amount and the present value of the revised future cash flows discounted at the asset’s original effective interest rate. Otherwise, the impairment loss is measured as any shortfall of fair value against the acquisition cost of the instrument (net of any principal repayment and amortisation).

NOTES TO THE FINANCIAL STATEMENTS FOR THE YEAR ENDED 31 MARCH 2012
Page 24 of 162
Any gains and losses that arise on the derecognition of the asset are credited/debited to the Financing and Investment Income and Expenditure line in the Comprehensive Income and Expenditure Statement, along with any accumulated gains/losses previously recognised in the Available-for Sale Reserve. Where fair value cannot be measured reliably, the instrument is carried at cost (less any impairment losses). (iii) Instruments Entered Into Before 1 April 2006 The Council entered into a number of financial guarantees that are not required to be accounted for as financial instruments. These guarantees are reflected in the Statement of Accounts to the extent that provisions might be required or a contingent liability note is needed under the policies set out in the section on Provisions, Contingent Liabilities and Contingent Assets. 1.10 Foreign Currency Translation Where the Council has entered into a transaction denominated in a foreign currency, the transaction is converted into sterling at the exchange rate applicable on the date on which the transaction was effective. Where amounts in foreign currency are outstanding at the year end, they are reconverted at the spot exchange rate at 31 March. Resulting gains or losses are recognised in the Financing and Investment Income and Expenditure line in the Comprehensive Income and Expenditure Statement. 1.11 Government Grants and Contributions Whether paid on account, by instalments or in arrears, government grants and third party contributions and donations are recognised as due to the Council when there is reasonable assurance that:
the Council will comply with the conditions attached to the payments, and;
the grants or contributions will be received. Amounts recognised as due to the Council are not credited to the Comprehensive Income and Expenditure Account until conditions attaching to the grant or contribution have been satisfied. Conditions are stipulations that specify that the future economic benefits or service potential embodied in the asset acquired using the grant or contribution are required to be consumed by the recipient as specified or future economic benefits or service potential must be returned to the transferor. Monies advanced as grants and contributions for which conditions have not been satisfied are carried in the Balance Sheet as creditors. When conditions are satisfied, the grant or contribution is credited to the relevant service line (attributable revenue grants/contributions) or Taxation and Non-Specific Grant Income (non-ring-fenced revenue grants and all capital grants) in the Comprehensive Income and Expenditure Statement. Where capital grants are credited to the Comprehensive Income and Expenditure Statement, they are reversed out of the General Fund Balance in the Movement in Reserves Statement. Where the grant has yet to be used to finance capital expenditure, it is posted to the Capital Grants Unapplied Account. Where it has been applied, it is posted to the Capital Adjustment Account. Amounts in the Capital Grants Unapplied Account are transferred to the Capital Adjustment Account once they have been applied to fund capital expenditure. 1.12 Heritage Assets Tangible and Intangible Heritage Assets (described in this summary of significant accounting policies as heritage assets) Aberdeenshire Council’s Museum Service’s collections relate to the natural and man-made history of Aberdeenshire. There are three distinct collections: Fine & Applied Art, Natural Sciences, and Human History. These are held in support of the Museum Service’s primary objective which is “To collect, research, conserve, interpret and make accessible to all people living in Aberdeenshire the museum collection belonging to Aberdeenshire Council”. The vast majority of the objects held were acquired in the 19th century and the first half of the 20th century.

NOTES TO THE FINANCIAL STATEMENTS FOR THE YEAR ENDED 31 MARCH 2012
Page 25 of 162
Aberdeenshire Council’s Archaeology Service’s collections and heritage assets either relate directly to the everyday activities of protecting and managing all known elements of the historic environment within Aberdeenshire Council (it also provides a similar service to Moray and Angus Councils) or are physical items that have been allocated to it under the Council’s Asset Management Plan. There are four distinct collections: the Aikey Brae Stone Circle at Mintlaw, the Rhynie Man, Vertical Aerial Photograph Collection and a Photograph and Slide collection. In the opinion of the Council, reliable information on cost or valuation is not available for the majority of these collections. This is owing to the lack of information on purchase cost, the lack of comparable market values, the diverse nature of the objects and the volume of items held. The Council has applied a de minimus of £100,000 for reporting Heritage Assets on the Balance Sheet. These collections are therefore not reported as assets in the Balance Sheet, with the exception of the Vertical Aerial Photograph Collection, for which a replacement cost is available. The Council has a historic valuation (1978) for part of the Fine Art collection, and three further paintings were valued in 2011. Five archaeological items, including the Deskford Carnyx regarded as of national importance, on loan to National Museums Scotland were valued by them in 2011 at current sale room prices. The Council’s collections are accounted for as follows: Fine & Applied Art That part of the Fine Art collection which was valued in 1978 is valued at the 1978 historical value (£9,000); the three paintings valued in 2011 by National Galleries of Scotland were deemed to have a total value of £20,000. These item are not reported on the Balance Sheet as they are below the Council’s de minimus threshold. Acquisitions are made by purchase or donation. Purchases are recorded at cost. Natural Sciences, Human History, Aikey Brae Stone Circle and Rhynie Man The Council does not consider that reliable cost or valuation information can be obtained for the vast majority of items held in the collections of Natural Sciences, Human History, the Aikey Brae Stone Circle or the Rhynie Man. This is because of the diverse nature of the items held, the number of items held and the lack of comparable market values. Therefore, the Council does not recognise these assets on its Balance Sheet. A small number of archaeological items on loan to National Museums Scotland have been valued by them in 2011. One item, the Deskford Carnyx, has been valued at £750,000 in view of its national importance, and is shown on the Balance Sheet. The other four items have been valued at a total of £100,000, and are not shown on the Balance Sheet. In addition, Hareshowe Farm, Aden Country Park is valued at £250,000 and is shown on the Balance Sheet. The valuation basis is fair value. Vertical Aerial Photograph Collection and Photograph and Slide Collection The Vertical Aerial Photograph Collection has been valued at £320,000, which is the estimated cost of replacing the collection, and is shown in the Balance Sheet. The Photograph and Slide Collection is valued at £14,000 and is not shown on the Balance Sheet. Preservation costs Expenditure which, in the Council’s view, is required to preserve or clearly prevent further deterioration of individual collection items is recognised in the Comprehensive Income and Expenditure Statement when it is incurred. Further information on the collections is given in Notes 23 to 26 to the accounts.

NOTES TO THE FINANCIAL STATEMENTS FOR THE YEAR ENDED 31 MARCH 2012
Page 26 of 162
General Heritage assets are deemed to have indeterminate lives and a high residual value; hence the Council does not consider it appropriate to charge depreciation. The carrying amounts of heritage assets are reviewed where there is evidence of impairment for heritage assets, e.g. where an item has suffered physical deterioration or breakage or where doubts arise as to its authenticity. Any impairment is recognised and measured in accordance with the Council’s general policies on impairment – see note 1.21 (iii) on page 31. The Council will occasionally dispose of heritage assets where an item which is too badly damaged or deteriorated to be of any further use for the purposes of Council, to improve the curatorial care of the collections by the disposal of duplicate or unprovenanced material of low intrinsic relevance to the Acquisition Policy, or to transfer to the ownership of another Accredited museum any item which, by reasons of changes in public, social or educational need, administrative responsibility, development priorities, or the establishment of a new Accredited museum, the Principal Museums & Heritage Officer advises the Council would be more appropriately placed elsewhere. Any money received by the Council as the result of the sale of a museum item must be used for the benefit of the collection. Normally this will mean it is placed in the Aberdeenshire Heritage Artefact Acquisition Fund or Aberdeenshire Farming Museum Purchase Fund, as appropriate, and used for the acquisition of further items but in exceptional cases improvements relating to the care of collections may be justifiable. 1.13 Intangible Assets Expenditure on non-monetary assets that do not have physical substance but are controlled by the Council as a result of past events (e.g. software licences) is capitalised when it is expected that future economic benefits or service potential will flow from the intangible asset to the Council. Internally generated assets are capitalised where it is demonstrable that the project is technically feasible and is intended to be completed (with adequate resources being available) and the Council will be able to generate future economic benefits or deliver service potential by being able to sell or use the asset. Expenditure is capitalised where it can be measured reliably as attributable to the asset and restricted to that incurred during the development phase (research expenditure is not capitalised). Expenditure on the development of websites is not capitalised if the website is solely or primarily intended to promote or advertise the Council’s goods or services. Intangible assets are measured initially at cost. Amounts are not revalued, as the fair value of the assets held by the Council cannot be determined by reference to an active market. The amortisable amount of an intangible asset is amortised over its useful life to the relevant service line(s) in the Comprehensive Income and Expenditure Statement. No amortisation charge is made for an intangible asset in the year of acquisition. Thereafter, the straight line method is applied, based on the opening balance. A full year’s amortisation charge is made in the year of disposal. An asset is tested for impairment whenever there is an indication that the asset might be impaired – any losses recognised are posted to the relevant service line(s) in the Comprehensive Income and Expenditure Statement. Any gain or loss arising on the disposal or abandonment of an intangible asset is posted to the Other Operating Expenditure line in the Comprehensive Income and Expenditure Statement. Where expenditure on intangible assets qualifies as capital expenditure for statutory purposes, amortisation, impairment losses and disposal gains and losses are not permitted to have an impact on the General Fund Balance. The gains and losses are therefore reversed out of the General Fund Balance in the Movement in Reserves Statement and posted to the Capital Adjustment Account and (for sale proceeds) the Capital Receipts Reserve.

NOTES TO THE FINANCIAL STATEMENTS FOR THE YEAR ENDED 31 MARCH 2012
Page 27 of 162
1.14 Interests in Companies and Other Entities The Council has material interests in companies and other entities that have the nature of subsidiaries and associates that require it to prepare group accounts. In the Council’s own single-entity accounts, the interests in companies and other entities are recorded as financial assets at cost, less any provision for losses. 1.15 Inventories and Work in Progress Inventories are included in the Balance Sheet at the lower of cost and net realisable value. The cost of inventories is assigned using the weighted average costing formula. Work in progress is subject to an interim valuation at the year end and recorded in the Balance Sheet at cost plus any profit reasonably attributable to the works. 1.16 Investment Properties Investment properties are those that are used solely to earn rentals and/or for capital appreciation. The definition is not met if the property is used in any way to facilitate the delivery of services or production of goods or is held for sale. Investment properties are measured initially at cost and subsequently at fair value, based on the amount at which the asset could be exchanged between knowledgeable parties at arm’s length. Properties are not depreciated but are revalued annually according to market conditions at the year-end. Gains and losses on revaluation are posted to the Financing and Investment Income and Expenditure line in the Comprehensive Income and Expenditure Statement. The same treatment is applied to gains and losses on disposal. Rentals received in relation to investment properties are credited to the Financing and Investment Income line and result in a gain for the General Fund Balance. However, revaluation and disposal gains and losses are not permitted by statutory arrangements to have an impact on the General Fund Balance. The gains and losses are therefore reversed out of the General Fund Balance in the Movement in Reserves Statement and posted to the Capital Adjustment Account and (for sale proceeds) the Capital Receipts Reserve. 1.17 Jointly Controlled Operations and Jointly Controlled Assets Jointly controlled operations are activities undertaken by the Council in conjunction with other venturers that involve the use of the assets and resources of the venturers rather than the establishment of a separate entity. The Council would recognise on its Balance Sheet the assets that it controls and the liabilities that it incurs and debits and credits the Comprehensive Income and Expenditure Statement with the expenditure it incurs and the share of income it earns from the activity of the operation. However, there are currently no operations that falls under this category. Jointly controlled assets are items of property, plant or equipment that are jointly controlled by the Council and other venturers, with the assets being used to obtain benefits for the venturers. The joint venture does not involve the establishment of a separate entity. The Council accounts for its share of the jointly controlled assets, the liabilities and expenses that it incurs on its own behalf or jointly with others in respect of its interest in the joint venture and income that it earns from the venture. 1.18 Leases Leases are classified as finance leases where the terms of the lease transfer substantially all the risks and rewards incidental to ownership of the property from the lessor to the lessee. All other leases are classified as operating leases. Where a lease covers both land and buildings, the land and buildings elements are considered separately for classification.

NOTES TO THE FINANCIAL STATEMENTS FOR THE YEAR ENDED 31 MARCH 2012
Page 28 of 162
Arrangements that do not have the legal status of a lease but convey a right to use an asset in return for payment are accounted for under this policy where fulfilment of the arrangement is dependent on the use of specific assets. (i) The Council as Lessee Finance Leases Property, plant and equipment held under finance leases is recognised on the Balance Sheet at the commencement of the lease at its fair value measured at the lease’s inception (or the present value of the minimum lease payments, if lower). The asset recognised is matched by a liability for the obligation to pay the lessor. Lease payments are apportioned between:
a charge for the acquisition of the interest in the property – applied to write down the lease liability; and
a finance charge (debited to the Financing and Investment Income and Expenditure line in the Comprehensive Income and Expenditure Statement).
Property, Plant and Equipment recognised under finance leases is accounted for using the policies applied generally to such assets, subject to depreciation being charged over the lease term if this is shorter than the asset’s estimated useful life. The Council is not required to raise council tax to cover depreciation or revaluation and impairment losses arising on leased assets. Instead, a prudent annual contribution is made from revenue funds towards the deemed capital investment in accordance with statutory requirements. Depreciation and impairment losses are therefore substituted by a revenue contribution in the General Fund Balance, by way of an adjusting transaction with the Capital Adjustment Account in the Movement in Reserves Statement for the difference between the two. Operating Leases Rentals paid under operating leases are charged to the Comprehensive Income and Expenditure Statement as an expense of the services benefitting from use of the leased property, plant or equipment. Charges are made on a straight-line basis over the life of the lease, even if this does not match the pattern of payments (e.g. there is a rent-free period at the commencement of the lease). (ii) The Council as Lessor Finance Leases Where the Council grants a finance lease over a property the relevant asset is written out of the Balance Sheet as a disposal. At the commencement of the lease, the carrying amount of the asset in the Balance Sheet is written off to the Other Operating Expenditure line in the Comprehensive Income and Expenditure Statement as part of the gain or loss on disposal. A gain, representing the Council’s net investment in the lease, is credited to the same line in the Comprehensive Income and Expenditure Statement also as part of the gain or loss on disposal (i.e. netted off against the carrying value of the asset at the time of disposal), matched by a Debtor in the Balance Sheet. Lease rentals receivable are apportioned between:
a capital receipt for the disposal of the asset – applied to write down the Debtor and
finance income (credited to the Financing and Investment Income and Expenditure line in the Comprehensive Income and Expenditure Statement).
The gain credited to the Comprehensive Income and Expenditure Statement on disposal is not permitted by statute to increase the General Fund Balance and will be required to be treated as a capital receipt. Where a premium has been received, this is posted out of the General Fund Balance to the Capital Receipts Reserve in the Movement in Reserves Statement. Where the amount due in relation to the lease asset is to be settled by the payment of rentals in future financial years, this is posted out of the General

NOTES TO THE FINANCIAL STATEMENTS FOR THE YEAR ENDED 31 MARCH 2012
Page 29 of 162
Fund Balance to an earmarked part of the Capital Receipt Reserve. When the future rentals are received, the element for the capital receipt for the disposal of the asset is used to write down the Debtor. At this point, the deferred capital receipts are transferred to the Capital Receipts Reserve. The written-off value of disposals is not a charge against council tax, as the cost of fixed assets is fully provided for under separate arrangements for capital financing. Amounts are appropriated to the Capital Adjustment Account from the General Fund Balance in the Movement in Reserves Statement. Operating Leases Where the Council grants an operating lease over a property or an item of plant or equipment, the asset is retained in the Balance Sheet. Rental income is credited to the Other Operating Expenditure line in the Comprehensive Income and Expenditure Statement. Credits are made on a straight-line basis over the life of the lease, even if this does not match the pattern of payments (e.g. there is a premium paid at the commencement of the lease). Initial direct costs incurred in negotiating and arranging the lease are added to the carrying amount of the relevant asset and charged as an expense over the lease term on the same basis as rental income. 1.19 Overheads and Support Services The costs of overheads and support services are charged to those that benefit from the supply or service in accordance with the costing principles of the CIPFA Service Reporting Code of Practice 2011/12 (SeRCOP). The total absorption costing principle is used – the full cost of overheads and support services are shared between users in proportion to the benefits received, with the exception of:
Corporate and Democratic Core – costs relating to the Council’s status as a multi-functional, democratic organisation;
Non Distributed Costs – the cost of discretionary benefits awarded to employees retiring early and any depreciation and impairment losses chargeable on Assets Held for Sale.
These two cost categories are defined in SeRCOP and accounted for as separate headings in the Comprehensive Income and Expenditure Statement, as part of Net Expenditure on Continuing Services. 1.20. Prior Period Adjustments, Changes in Accounting Policies and Estimates and Errors Changes in accounting policies are only made when required by proper accounting practices or the change provides more reliable or relevant information about the effect of transactions, other events and conditions on the Council’s financial position or financial performance. Where a change is made, it is applied retrospectively by adjusting opening balances and comparative amounts for the prior period as if the new policy had always been applied. Changes in accounting estimates are accounted for prospectively, i.e. in the current and future years affected by the change. Material errors discovered in prior period figures are corrected retrospectively by amending opening balances and comparative amounts for the prior period. 1.21 Property, Plant and Equipment Assets that have physical substance and are held for use in the production or supply of goods or services, for rental to others for administrative purposes and that are expected to be used during more than one financial year are classified as Property, Plant and Equipment.

NOTES TO THE FINANCIAL STATEMENTS FOR THE YEAR ENDED 31 MARCH 2012
Page 30 of 162
(i) Recognition Expenditure on the acquisition, creation or enhancement of Property, Plant and Equipment is capitalised on an accruals basis, provided that it is probable that the future economic benefits or service potential associated with the item will flow to the Council and the cost of the item can be measured reliably. Expenditure that maintains but does not add to an asset’s potential to deliver future economic benefits or service potential (i.e. repairs and maintenance) is charged as an expense when it is incurred. The de minimus applied when accounting for expenditure of a capital nature that is funded from revenue is £6,000 for Vehicles, Plant, Furniture and Equipment and £20,000 for all other categories of Property, Plant and Equipment which reflects the concept of materiality when preparing the financial statements. (ii) Measurement Assets are initially measured at cost, comprising:
• the purchase price; • any costs attributable to bringing the asset to the location and condition necessary for it to be capable of operating in the manner intended by management; and • the initial estimate of the costs of dismantling and removing the item and restoring the site on which it is located.
The Council does not capitalise borrowing costs incurred whilst assets are under construction. The cost of assets acquired other than by purchase is deemed to be its fair value, unless the acquisition will not increase the cash flows of the Council. In the latter case, the cost of the acquisition is the carrying amount of the asset given up by the Council. Donated assets are measured initially at fair value. The difference between fair value and any consideration paid is credited to the Taxation and Non-Specific Grant Income line of the Comprehensive Income and Expenditure Statement, unless the donation has been made conditionally. Until conditions are satisfied, the gain is held in the Donated Assets Account. Where gains are credited to the Comprehensive Income and Expenditure Statement, they are reversed out of the General Fund Balance to the Capital Adjustment Account in the Movement in Reserves Statement. Assets are then carried in the Balance Sheet using the following measurement bases:
infrastructure, community assets and assets under construction – depreciated historical cost;
dwellings – fair value, determined using the basis of existing use value for social housing (EUV-SH). A discount factor of 51% is applied, representing the difference between the public and private rental sector for general Housing stock; and
all other assets – fair value, determined the amount that would be paid for the asset in its existing use (existing use value – EUV).
Where there is no market-based evidence of fair value because of the specialist nature of an asset, depreciated replacement cost is used as an estimate of fair value. Where non-property assets that have short useful lives or low values (or both), depreciated historical cost basis is used as a proxy for fair value. Assets included in the Balance Sheet at fair value are revalued sufficiently regularly to ensure that their carrying amount is not materially different from their fair value at the year end, but as a minimum every five years. Increases in valuations are matched by credits to the Revaluation Reserve to recognise unrealised gains. Exceptionally, gains will be credited to the Comprehensive Income and Expenditure Statement where they arise from the reversal of an revaluation loss charged previously to a service. The Revaluation Reserve contains revaluation gains recognised since 1 April 2007 only, the date of its formal implementation. Gains arising before that date have been consolidated into the Capital Adjustment Account.

NOTES TO THE FINANCIAL STATEMENTS FOR THE YEAR ENDED 31 MARCH 2012
Page 31 of 162
(iii) Impairment Assets are assessed at each year end as to whether there is any indication that an asset may be impaired. Where indications exist and any possible differences are estimated to be material, the recoverable amount of the asset is estimated and, where this is less than the carrying amount of the asset, an impairment loss is recognised for the shortfall. Where impairment losses are identified, they are accounted as follows:
where there is a balance of revaluation gains for the asset in the Revaluation Reserve, the carrying amount of the asset is written down against that balance (up to the amount of the accumulated gains) with the remaining impairment recognised is the relevant service line(s) in the Comprehensive Income and Expenditure Statement; and
where there is no balance in the Revaluation Reserve, the carrying amount of the asset is written down against the relevant service line(s) in the Comprehensive Income and Expenditure Statement
Where an impairment loss is reversed subsequently, the reversal is credited to the relevant service line(s) in the Comprehensive Income and Expenditure Statement, up to the amount of the original loss, adjusted for depreciation that would have been charged if the loss had not been recognised. (iv) Disposals When it becomes probable that the carrying amount of an asset will be recovered principally through a sale transaction rather than through its continuing use, it is reclassified as an Asset Held for Sale. The asset is revalued immediately before reclassification and then carried at the lower of this amount and fair value less costs to sell. Where there is a subsequent decrease to fair value less costs to sell, the loss is posted to the Other Operating Expenditure line in the Comprehensive Income and Expenditure Statement. Gains in fair value are recognised only up to the amount of any previously losses recognised in the Surplus or Deficit on Provision of Services. Depreciation is not charged on Assets Held for Sale. If assets no longer meet the criteria to be classified as Assets Held for Sale, they are reclassified back to non-current assets and valued at the lower of their carrying amount before they were classified as held for sale; adjusted for depreciation, amortisation or revaluations that would have been recognised had they not been classified as Held for Sale, and their recoverable amount at the date of the decision not to sell. Assets that are to be abandoned or scrapped are not reclassified as Assets Held for Sale. When an asset is disposed of or decommissioned, the carrying amount of the asset in the Balance Sheet (whether Property, Plant and Equipment or Assets Held for Sale) is written off to the Other Operating Expenditure line in the Comprehensive Income and Expenditure Statement as part of the gain or loss on disposal. Receipts from disposals (if any) are credited to the same line in the Comprehensive Income and Expenditure Statement also as part of the gain or loss on disposal (i.e. netted off against the carrying value of the asset at the time of disposal). Any revaluation gains accumulated for the asset in the Revaluation Reserve are transferred to the Capital Adjustment Account. Amounts received for a disposal are categorised as capital receipts. Receipts are required to be credited to the Capital Receipts Reserve, and can then only be used for new capital investment. Receipts are appropriated to the Reserve from the General Fund Balance in the Movement in Reserves Statement. The written-off value of disposals is not a charge against council tax, as the cost of non-current assets is fully provided for under separate arrangements for capital financing. Amounts are appropriated to the Capital Adjustment Account from the General Fund Balance in the Movement in Reserves Statement. (v) Depreciation Depreciation is provided for on all Property, Plant and Equipment assets by the systematic allocation of their depreciable amounts over their useful lives. An exception is made for assets without a determinable finite useful life (i.e. freehold land and certain Community Assets) and assets that are not yet available for use (i.e. assets under construction).

NOTES TO THE FINANCIAL STATEMENTS FOR THE YEAR ENDED 31 MARCH 2012
Page 32 of 162
Deprecation is calculated on the following bases:
Council Dwellings - straight-line allocation over the useful life of the property (60 years) as estimated by the valuer;
Other Land and Buildings – straight-line allocation over the useful life of the property (between 10 and 60 years) as estimated by the valuer;
Vehicles, Plant and Equipment – straight-line allocation over the useful life of the asset (between 4 and 30 years) as advised by a suitably qualified officer;
Infrastructure – straight-line allocation over the useful life of the asset (between 10 and 60 years) as advised by a suitably qualified officer;
Community Assets – straight-line allocation over the useful life of the asset (between 5 and 60 years) as advised by a suitably qualified officer; and
Surplus Assets – straight-line allocation over the useful life of the asset (between 10 and 60 years) as advised by a suitably qualified officer.
Where an item of Property, Plant and Equipment asset has major components whose cost is significant in relation to the total cost of the item, the components are depreciated separately. Revaluation gains are also depreciated, with an amount equal to the difference between current value depreciation charged on assets and the depreciation that would have been chargeable based on their historical cost being transferred each year from the Revaluation Reserve to the Capital Adjustment Account. (vi) Componentisation Components of an item of Property, Plant and Equipment are recognised separately for depreciation purposes where it is considered that the cost of the component is significant in relation to the total cost of the asset. Assets with a carrying value of £5,000,000 and below will be disregarded for componentisation as the impact upon the reported cost of service is not considered material. Assets that are above the £5,000,000 de minimus threshold will be componentised where the cost of the component is significant in relation to the overall total cost of the asset and the difference in useful life is significant in relation to the main asset. The components that will be considered in terms of this policy are:
External Works;
Walls and Structure;
Roof; and
Mechanical and Electrical. This policy applies to enhancement and acquisition expenditure incurred, and revaluations carried out, from 1 April 2010. It excludes land assets which are already identified separately. 1.22 Private Finance Initiative (PFI) and Similar Contracts PFI contracts are agreements to receive services, where the responsibility for making available the property, plant and equipment needed to provide the services passes to the PFI contractor. As the Council is deemed to control the services that are provided under its PFI schemes and as ownership of the property, plant and equipment will pass to the Council at the end of the contracts for no additional charge, the Council carries the assets used under the contracts on its Balance Sheet as part of Property, Plant and Equipment. The original recognition of these assets at fair value (based on the cost to purchase the property, plant and equipment) was balanced by the recognition of a liability for amounts due to the scheme operator to pay for the capital investment. Non current assets recognised on the Balance Sheet are revalued and depreciated in the same way as property, plant and equipment owned by the Council under a finance lease. The amounts payable to the PFI operators each year are analysed into five elements:

NOTES TO THE FINANCIAL STATEMENTS FOR THE YEAR ENDED 31 MARCH 2012
Page 33 of 162
fair value of the services received during the year – debited to the relevant service in the Comprehensive Income and Expenditure Statement;
finance cost – an interest charge on the outstanding Balance Sheet liability, debited to the Financing and Investment Income and Expenditure line in the Comprehensive Income and Expenditure Statement. The interest charge on the contract with Robertson Education (Aberdeenshire) Limited is 8.687% and the interest charge on the contract with Robertson Education (Aberdeenshire 2) Limited is 8.299%;
contingent rent – increases in the amount to be paid for the property arising during the contract, debited to the Financing and Investment Income and Expenditure line in the Comprehensive Income and Expenditure Statement;
payment towards liability – applied to write down the Balance Sheet liability towards the PFI operator (the profile of write-downs is calculated using the same principles as for a finance lease); and
lifecycle replacement costs – a proportion of the amounts payable is posted to the Balance Sheet as a prepayment and then recognised as additions to Property, Plant and Equipment when the relevant works are eventually carried out.
1.23 Provisions, Contingent Liabilities and Contingent Assets (i) Provisions Provisions are made where an event has taken place that gives the Council a legal or constructive obligation that probably requires settlement by a transfer of economic benefits or service potential, and a reliable estimate can be made of the amount of the obligation. For instance, the Council may be involved in a court case that could eventually result in the making of a settlement or the payment of compensation. Provisions are charged as an expense to the appropriate service line in the Comprehensive Income and Expenditure Statement in the year that the Council becomes aware of the obligation, and measured at the best estimate at the balance sheet date of the expenditure required to settle the obligation, taking into account relevant risks and uncertainties. When payments are eventually made, they are charged to the provision carried in the Balance Sheet. Estimated settlements are reviewed at the end of each financial year – where it becomes less than probable that a transfer of economic benefits will now be required (or a lower settlement than anticipated is made), the provision is reversed and credited back to the relevant service. Where some or all of the payment required to settle a provision is expected to be recovered from another party (e.g. from an insurance claim), this is only recognised as income for the relevant service if it is virtually certain that reimbursement will be received if the Council settles the obligation. The Council has created provisions for correcting defects on completed contracts within Roads Operations, compensation for equal pay claims for staff who have not yet signed compromise agreements and who have progressed a tribunal claim, potential settlements in respect of deductions for non-performance on PFI/PPP contracts, to cover the possibility that the Council may be required to meet the accumulated deficit of the North Sea Regional Advisory Council, costs of staff who are to be made redundant in Older People Residential Care Homes, additional hours worked by staff in Older People Home Care, the Council’s share of purchasing 19 houses for use as supported accommodation by people with complex needs, costs of staff who are to be made redundant across all services and the cost of buying janitors out of their contractual overtime. The Council is required to participate in the Carbon Reduction Commitment (CRC) Energy Efficiency Scheme. This scheme is currently in its introductory phase which will last until 31 March 2014. The Council is required to purchase and surrender allowances, currently retrospectively, on the basis of emissions i.e. carbon dioxide produced as energy is used. As carbon dioxide is emitted (i.e. as energy is used), a liability and an expense are recognised. The liability will be discharged by surrendering allowances. The liability is measured as the best estimate of the expenditure required to meet the obligation, normally at the current market price of the number of allowances required to meet the liability at the reporting date. The cost to the Council is recognised and reported in the cost of the Council’s services and is apportioned to services on the basis of energy consumption.

NOTES TO THE FINANCIAL STATEMENTS FOR THE YEAR ENDED 31 MARCH 2012
Page 34 of 162
(ii) Contingent Liabilities A contingent liability arises where an event has taken place that gives the Council a possible obligation whose existence will only be confirmed by the occurrence or otherwise of uncertain future events not wholly within the control of the Council. Contingent liabilities also arise in circumstances where a provision would otherwise be made but either it is not probable that an outflow of resources will be required or the amount of the obligation cannot be measured reliably. Contingent liabilities are not recognised in the Balance Sheet but disclosed in a note to the accounts. (iii) Contingent Assets A contingent asset arises where an event has taken place that gives the Council a possible asset whose existence will only be confirmed by the occurrence or otherwise of uncertain future events not wholly within the control of the Council. Contingent assets are not recognised in the Balance Sheet but disclosed in a note to the accounts where it is probable that there will be an inflow of economic benefits or service potential. 1.24 Reserves The Council sets aside specific amounts as reserves as allowed by statute. Reserves are created by appropriating amounts out of the General Fund Balance in the Movement in Reserves Statement. When expenditure to be financed from a reserve is incurred, it is charged to the appropriate service in that year to score against the Surplus/Deficit on the Provision of Services in the Comprehensive Income and Expenditure Statement. The reserve is then appropriated back into the General Fund Balance in the Movement in Reserves Statement so that there is no net charge against council tax for the expenditure. Certain reserves are kept to manage the accounting processes for non-current assets, financial instruments, retirement and employee benefits and that do not represent usable resources for the Council - these reserves are explained in the relevant policies. 1.25 VAT VAT payable is included as an expense only to the extent that it is not recoverable from Her Majesty’s Revenue and Customs. VAT receivable is excluded from income. 2. Accounting Standards that have been Issued but have not yet been Adopted The adoption of amendments to IFRS 7 Financial Instruments: Disclosures by the code in 2012/13 will result in a change of accounting policy which will require additional disclosure for the transfer of financial assets. It is not anticipated that this change will have a material effect for Aberdeenshire Council. 3. Critical Judgements in Applying Accounting Policies In applying the accounting policies set out in Note 1, the Council has had to make certain judgements about complex transactions or those involving uncertainty about future events. The critical judgements made in the Statement of Accounts are:
There is a high degree of uncertainty about future levels of funding for local government. However, the Council has determined that this uncertainty is not yet sufficient to provide an indication that the assets of the Council might be impaired as a result of a need to close facilities and reduce levels of service provision.
4. Assumptions Made About the Future and Other Major Sources of Estimation Uncertainty The Statement of Accounts contains estimated figures that are based on assumptions made by the Council about the future or that are otherwise uncertain. Estimates are made taking into account historical experience, current trends and other relevant factors. However, because balances cannot be determined with certainty, actual results could be materially different from the assumptions and estimates.

NOTES TO THE FINANCIAL STATEMENTS FOR THE YEAR ENDED 31 MARCH 2012
Page 35 of 162
The items in the Council’s Balance Sheet at 31 March 2012 for which there is a significant risk of material adjustment in the forthcoming financial year are as follows: Property, Plant and Equipment - assets are depreciated over useful lives that are dependent on assumptions about the level of repairs and maintenance that will be incurred in relation to individual assets. The current economic climate makes it uncertain that the Council will be able to sustain its current spending on repairs and maintenance, bringing into doubt the useful lives assigned to assets. If the useful life of assets is reduced, depreciation increases and the carrying amount of the assets falls. It is estimated that the annual depreciation charge for buildings would increase by £5,275,000 for every year that useful lives had to be reduced. Provisions - The Council has made a provision of £5,065,000 for the settlement of claims for back pay arising from the Equal Pay initiative, based on the number of claims received and an average settlement amount. It is not certain that all valid claims have yet been received by the Council or that precedents set by other authorities in the settlement of claims will be applicable. An increase over the forthcoming year of 10% in either the total number of claims or the estimated average settlement would each have the effect of adding £506,000 to the provision needed. Pensions Liability - Estimation of the net liability to pay pensions depends on a number of complex judgements relating to the discount rate used, the rate at which salaries are projected to increase, changes in retirement ages, mortality rates and expected returns on pension fund assets. A firm of consulting actuaries is engaged by the North East Scotland Pension Fund to provide the constituent members of the Fund with expert advice about the assumptions to be applied. The effects on the net pensions liability of changes in individual assumptions can be measured, and examples are:-
+0.1% per annum
discount rate as at 31 March 2012
+0.1% per annum
inflation as at 31 March
2012
1 year addition to members'
life expectancy
as at 31 March 2012
£'000 £'000 £'000
(Decrease)/Increase in Liabilities as at 31 March 2012 (15,426) 15,715 17,252
(Decrease)/Increase in Deficit as at 31 March 2012 (15,426) 15,715 17,252
(Decrease)/Increase in Projected Current Service Cost for Year Commencing 1 April 2012 (798) 817 606
The above figure is based on a percentage rate applied to payroll. The percentage rate is: 19.1% 20.3% 20.1%
The projected pensionable payroll used in the above calculation is: 137,269 137,269 137,269
(Decrease)/Increase in Projected Interest Cost for the Year Commencing 1 April 2012 122 790 860
Arrears - At 31 March 2012, the Council had a balance of sundry debtors of £8,797,000. A review of significant balances suggested that an allowance for doubtful debts of 47.35% (£4,166,000) was appropriate. However, in the current economic climate it is not certain that such an allowance would be sufficient.

NOTES TO THE FINANCIAL STATEMENTS FOR THE YEAR ENDED 31 MARCH 2012
Page 36 of 162
If collection rates were to deteriorate, a doubling of the amount of doubtful debts would require an additional £4,166,000 to set aside as an allowance. This list does not include assets and liabilities that are carried at fair value based on a recently observed market price. 5. Adjustments between Accounting Basis and Funding Basis under Regulations This note details the adjustments that are made to the total comprehensive income and expenditure recognised by the Council in the year in accordance with proper accounting practice to the resources that are specified by statutory provisions as being available to the Council to meet future capital and revenue expenditure.
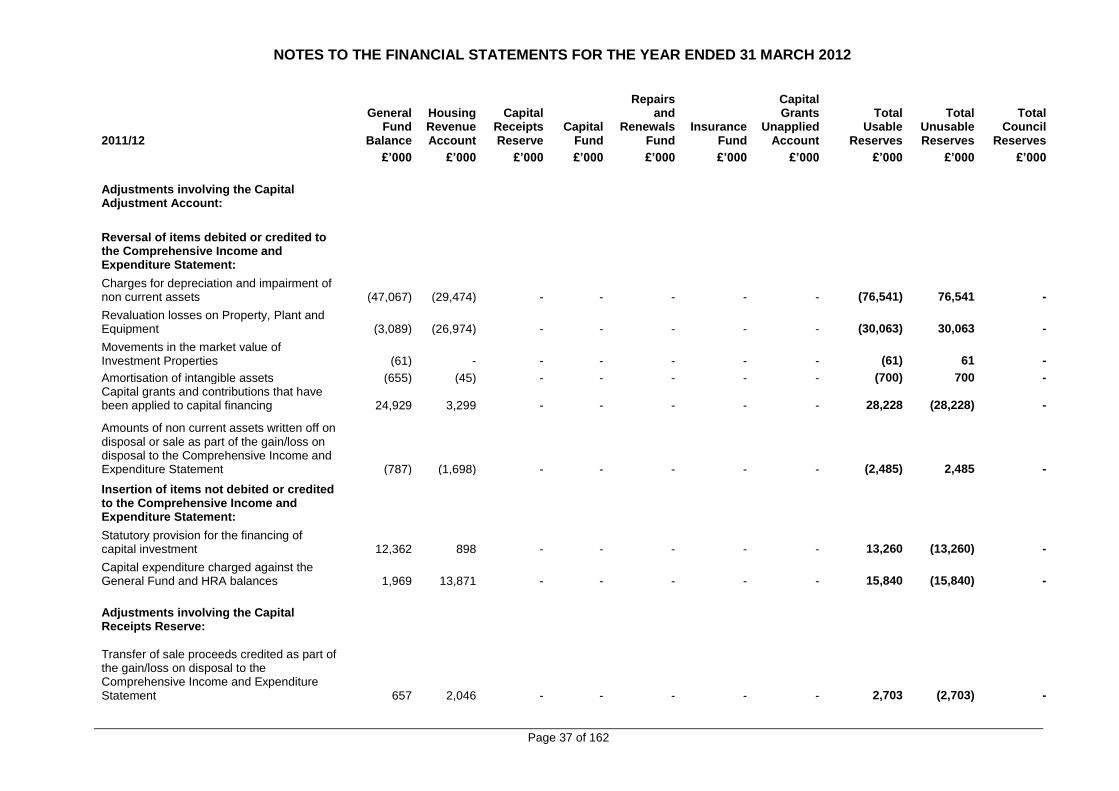
NOTES TO THE FINANCIAL STATEMENTS FOR THE YEAR ENDED 31 MARCH 2012
Page 37 of 162
2011/12
General Fund
Balance
Housing Revenue Account
Capital Receipts Reserve
Capital Fund
Repairs and
Renewals Fund
Insurance
Fund
Capital Grants
Unapplied Account
Total Usable
Reserves
Total Unusable Reserves
Total Council
Reserves
£’000 £’000 £’000 £’000 £’000 £’000 £’000 £’000 £’000 £’000
Adjustments involving the Capital Adjustment Account:
Reversal of items debited or credited to the Comprehensive Income and Expenditure Statement:
Charges for depreciation and impairment of non current assets (47,067) (29,474) - - - - - (76,541) 76,541
-
Revaluation losses on Property, Plant and Equipment (3,089) (26,974) - - - - - (30,063) 30,063 -
Movements in the market value of Investment Properties (61) - - - - - - (61) 61 -
Amortisation of intangible assets (655) (45) - - - - - (700) 700 -
Capital grants and contributions that have been applied to capital financing 24,929 3,299 - - - - - 28,228 (28,228) -
Amounts of non current assets written off on disposal or sale as part of the gain/loss on disposal to the Comprehensive Income and Expenditure Statement (787) (1,698) - - - - - (2,485) 2,485 -
Insertion of items not debited or credited to the Comprehensive Income and Expenditure Statement:
Statutory provision for the financing of capital investment 12,362 898 - - - - - 13,260 (13,260) -
Capital expenditure charged against the General Fund and HRA balances 1,969 13,871 - - - - - 15,840 (15,840) -
Adjustments involving the Capital Receipts Reserve:
Transfer of sale proceeds credited as part of the gain/loss on disposal to the Comprehensive Income and Expenditure Statement 657 2,046 - - - - - 2,703 (2,703) -

NOTES TO THE FINANCIAL STATEMENTS FOR THE YEAR ENDED 31 MARCH 2012
Page 38 of 162
Use of the Capital Receipts Reserve to finance new capital expenditure - - - - - - - - - -
Adjustment involving the Capital Grants Unapplied Account
Application of grants to capital financing transferred to the Capital Adjustment Account - - - - - - 283 283 (283) -
Adjustments involving the Financial Instruments Adjustment Account:
Amount by which finance costs charged to the Comprehensive Income and Expenditure Statement are different from finance costs chargeable in the year in accordance with statutory requirements 857 311 - - - - - 1,168 (1,168) -
Adjustments involving the Pensions Reserve:
Reversal of items relating to post employment benefits debited or credited to the Surplus or Deficit on the Provision of Services in the Comprehensive Income and Expenditure Statement (see note 28) (34,577) (1,462) - - - - - (36,039) 36,039 -
Employer’s pensions contributions and direct payments to pensioners payable in the year 27,984 1,197 - - - - - 29,181 (29,181) -
Adjustment involving the Accumulating Compensated Absences Adjustment Account
Amount by which officer remuneration charged to the Comprehensive Income and Expenditure Statement on an accruals basis is different from remuneration chargeable in the year in accordance with statutory requirements 6,086 (11) - - - - - 6,075 (6,075) -
Total Adjustments (11,392) (38,042) - - - - 283 (49,151) 49,151 -

NOTES TO THE FINANCIAL STATEMENTS FOR THE YEAR ENDED 31 MARCH 2012
Page 39 of 162
2010/11 Comparative Figures
General Fund
Balance
Housing Revenue Account
Capital Receipts Reserve
Capital Fund
Repairs and
Renewals Fund
Insurance
Fund
Capital Grants
Unapplied Account
Total Usable
Reserves
Total Unusable Reserves
Total Council
Reserves
£’000 £’000 £’000 £’000 £’000 £’000 £’000 £’000 £’000 £’000 Adjustments involving the Capital Adjustment Account: Reversal of items debited or credited to the Comprehensive Income and Expenditure Statement:
Charges for depreciation and impairment of non current assets
(46,150)
(7,237)
-
-
-
-
-
(53,387)
53,387
-
Revaluation losses on Property, Plant and Equipment (21,815)
(434)
-
-
-
-
-
(22,249)
22,249
-
Movements in the market value of Investment Properties
612
-
-
-
-
-
-
612
(612)
-
Amortisation of intangible assets (745) (85) - - - - - (830) 830 -
Capital grants and contributions that have been applied to capital financing
11,304
889
-
-
-
-
-
12,193
(12,193)
-
Amounts of non current assets written off on disposal or sale as part of the gain/loss on disposal to the Comprehensive Income and Expenditure Statement
(521)
(1,712)
-
-
-
-
-
(2,233)
2,233
-
Insertion of items not debited or credited to the Comprehensive Income and Expenditure Statement:
Statutory provision for the financing of capital investment
12,891
1,029
-
-
-
-
-
13,920
(13,920)
-
Capital expenditure charged against the General Fund and HRA balances 3,049 22,612 - - - - - 25,661 (25,661) -
Adjustments involving the Capital Receipts Reserve:
Transfer of sale proceeds credited as part of the gain/loss on disposal to the Comprehensive Income and Expenditure Statement
609
2,308
-
-
-
-
-
2,917
(2,917)
-
Use of the Capital Receipts Reserve to finance new capital expenditure
-
-
-
-
-
-
-
-
-
-

NOTES TO THE FINANCIAL STATEMENTS FOR THE YEAR ENDED 31 MARCH 2012
Page 40 of 162
Adjustment involving the Capital Grants Unapplied Account
Reversal of unapplied capital grants and contributions credited to the Comprehensive Income and Expenditure Statement
707
80
(787)
-
-
-
Application of grants to capital financing transferred to the Capital Adjustment Account - - - - - - 42 42 (42) -
Adjustments involving the Financial Instruments Adjustment Account:
Amount by which finance costs charged to the Comprehensive Income and Expenditure Statement are different from finance costs chargeable in the year in accordance with statutory requirements
844
320
-
-
-
-
-
1,164
(1,164)
-
Adjustments involving the Pensions Reserve:
Reversal of items relating to post employment benefits debited or credited to the Surplus or Deficit on the Provision of Services in the Comprehensive Income and Expenditure Statement (see note 43)
26,666
(690)
-
-
-
-
-
25,976
(25,976)
-
Employer’s pensions contributions and direct payments to pensioners payable in the year
28,774
1,219
-
-
-
-
-
29,993
(29,993)
-
Adjustment involving the Accumulating Compensated Absences Adjustment Account
Amount by which officer remuneration charged to the Comprehensive Income and Expenditure Statement on an accruals basis is different from remuneration chargeable in the year in accordance with statutory requirements
(5,852)
(95)
-
-
-
-
-
(5,947)
5,947
-
Total Adjustments
10,373
18,204
-
-
-
-
(745)
27,832
(27,832)
-
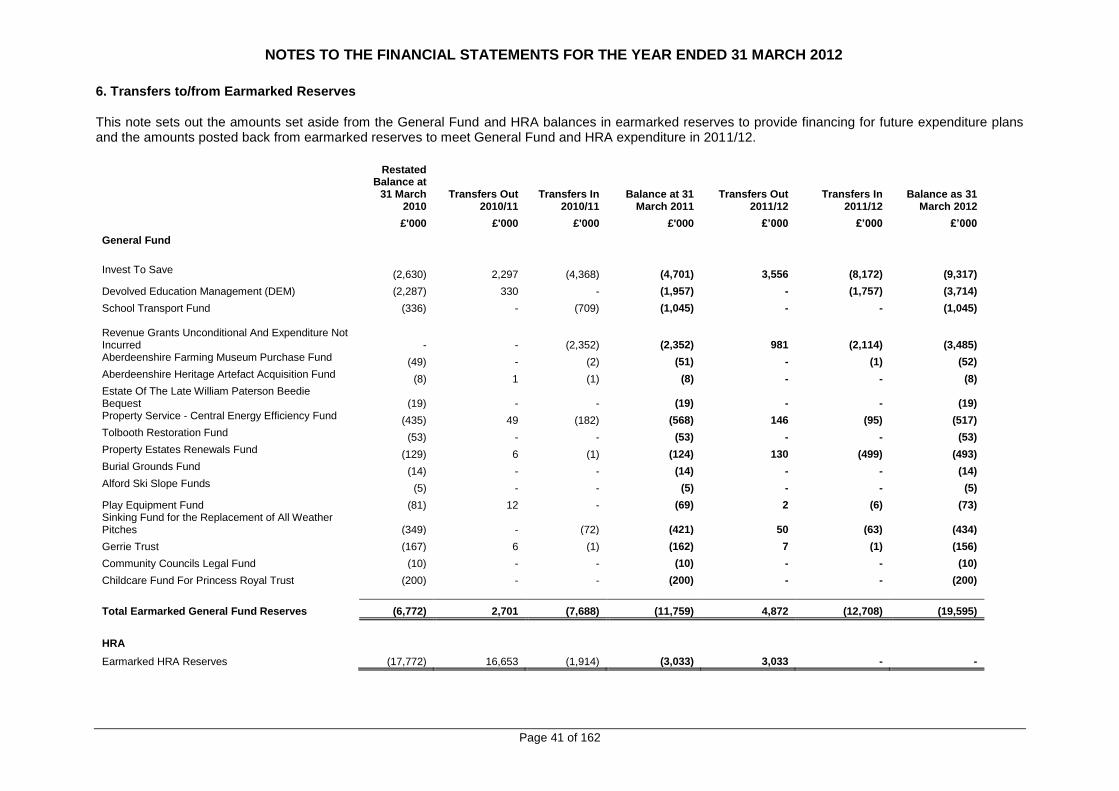
NOTES TO THE FINANCIAL STATEMENTS FOR THE YEAR ENDED 31 MARCH 2012
Page 41 of 162
6. Transfers to/from Earmarked Reserves This note sets out the amounts set aside from the General Fund and HRA balances in earmarked reserves to provide financing for future expenditure plans and the amounts posted back from earmarked reserves to meet General Fund and HRA expenditure in 2011/12.
Restated Balance at
31 March 2010
Transfers Out 2010/11
Transfers In 2010/11
Balance at 31 March 2011
Transfers Out 2011/12
Transfers In 2011/12
Balance as 31 March 2012
£'000 £'000 £'000 £'000 £’000 £’000 £’000
General Fund
Invest To Save (2,630) 2,297 (4,368) (4,701) 3,556 (8,172) (9,317)
Devolved Education Management (DEM) (2,287) 330 - (1,957) - (1,757) (3,714)
School Transport Fund (336) - (709) (1,045) - - (1,045)
Revenue Grants Unconditional And Expenditure Not Incurred - - (2,352) (2,352)
981
(2,114)
(3,485) Aberdeenshire Farming Museum Purchase Fund (49) - (2) (51) - (1) (52) Aberdeenshire Heritage Artefact Acquisition Fund (8) 1 (1) (8) - - (8) Estate Of The Late William Paterson Beedie Bequest (19) - - (19) - - (19) Property Service - Central Energy Efficiency Fund (435) 49 (182) (568) 146 (95) (517) Tolbooth Restoration Fund (53) - - (53) - - (53) Property Estates Renewals Fund (129) 6 (1) (124) 130 (499) (493) Burial Grounds Fund (14) - - (14) - - (14) Alford Ski Slope Funds (5) - - (5) - - (5)
Play Equipment Fund (81) 12 - (69) 2 (6) (73) Sinking Fund for the Replacement of All Weather Pitches (349) - (72) (421) 50 (63) (434)
Gerrie Trust (167) 6 (1) (162) 7 (1) (156)
Community Councils Legal Fund (10) - - (10) - - (10)
Childcare Fund For Princess Royal Trust (200) - - (200) - - (200)
Total Earmarked General Fund Reserves (6,772) 2,701 (7,688) (11,759) 4,872 (12,708) (19,595)
HRA
Earmarked HRA Reserves (17,772) 16,653 (1,914) (3,033) 3,033 - -

NOTES TO THE FINANCIAL STATEMENTS FOR THE YEAR ENDED 31 MARCH 2012
Page 42 of 162
The following describes the nature and purpose of each reserve: General Fund
Devolved Education Management (DEM) Balance – This fund is a consolidation of balances held by schools that are retained for the specific purpose of investing in services delivered at each individual school. The DEM scheme enables a policy of retaining resources at each school rather than returning balances to a corporate fund, and encourages schools to plan over the medium financial term;
Invest to Save – The purpose of this fund is to provide initial investment to finance schemes that will generate long-term revenue savings. The Council’s policy is to utilise this investment to develop proposals that will lead to a more effective and efficient use of resources;
School Transport – The budget for school transport is based on the assumption that there will be 190 school days in each financial year. However, due to the timing of the Easter holidays which may fall in March or April, in some years this may exceed 190 days and in other years it may be less than 190 days. To prevent the budget from fluctuating from year to year, this fund has been established. Each year a sum is transferred to or from the fund as appropriate to help defray expenditure on school transport;
Revenue Grants Unconditional and Expenditure Not Incurred - These funds represent earmarked revenue grant income that has no conditions attached to it but has yet to be applied to expenditure. However, there are restrictions as to how the monies are to be applied;
Aberdeenshire Farming Museum Purchase Fund - This fund incorporates the money which goes into the donations box at Aberdeenshire Farming Museum, Mintlaw. It is used for buying new artefacts for the museum;
Aberdeenshire Heritage Artefact Acquisition Fund - This is the money which goes into the donations boxes at Aberdeenshire Council museums excluding the Aberdeenshire Farming Museum, Mintlaw. The fund is used for buying new artefacts for the museums;
Estate Of The Late William Paterson Beedie Bequest - This is money received from the Estate Of The Late William Paterson Beedie. This is to be used for the benefit of the Museums Service;
Property Service - Central Energy Efficiency Fund – This Fund was set up by a grant from Scottish Government. It is used to create a revolving fund which can only be invested in energy efficiency measures that reduce energy consumption and carbon emissions;
Tolbooth Restoration Fund - This is money to be used to upkeep/ restore the Tolbooth Museum, Stonehaven;
Property Estates Renewals Fund – This fund comprises excess dilapidation charges for ex tenants where leased premises have been left in poor repair. It is also used to pay for similar incidents where no payments have been received;
Burial Grounds Fund - This is a maintenance in perpetuity fund that was set up to clean and tidy memorials/headstones at certain cemeteries. Any income generated by the fund can only be used to defray these maintenance costs;
Alford Ski Slope Funds - This fund is to be used for equipment or upgrades to the Alford Ski Slope;
Play Equipment Fund (off-site play facilities) – This money is received from developers for off-site play areas and is used to purchase/install play equipment at specified developments. The funds can be spent as and when the Service are ready to purchase and install play equipment;
Sinking Funds for the Replacement of All Weather Pitches - Money for the replacement of certain all weather pitches at the end of their useful lives. These include those at Turriff, Mintlaw and Fraserburgh, where the money is set aside from the trading account budget. Bennachie Leisure Centre, Garioch Sports Trust and Huntly Sports Trust have money set aside from the grants budget. The funds have been on-going for approx 4-6 years;
Gerrie Trust - This fund is put towards the Salvation Army project set up to provide a ‘person centred’ support service within the community (non-residential) for homeless or potentially homeless people with substance misuse related problems. This was received from the late George Gerrie’s Estate under his Will for the purposes of providing the service outlined;
Community Councils Legal Fund - This was set up for the legal expenses that may be incurred in the administration and management of Community Councils;

NOTES TO THE FINANCIAL STATEMENTS FOR THE YEAR ENDED 31 MARCH 2012
Page 43 of 162
Childcare Fund For Princess Royal Trust - This represents a commitment made by the Childcare Partnership to contribute towards a proposed new facility in Banff. The facility will be run by an external group which required funding streams to be identified in order for it to attract further grant aid. This commitment will require to be paid over when the facility is built; and
Education Year End Fund - This was proposed by the Education, Learning and Leisure service as being a way to meet the on-going and changing priorities faced by an Education service. It has a nil balance.
Housing Revenue Account The Housing Revenue Account earmarked reserve is used to build up funds to provide for the future enhancement of the council housing stock. The principles of the operation of this reserve are established under the 30 year Business Plan for Council Housing, which is reviewed regularly by the Social Work and Housing Committee in consultation with tenants’ associations and other interested parties. 7. Amounts Reported for Resource Allocation Decisions The analysis of income and expenditure by service on the face of the Comprehensive Income and Expenditure Account is that specified by the Service Reporting Code of Practice. However, decisions about resource allocation are taken by the Council’s Policy and Resources Committee on the basis of budget reports analysed across Council Services. These reports are prepared on a different basis from the accounting policies used in the financial statements. In particular:
no charges are made in relation to capital expenditure (whereas depreciation, impairment losses and amortisation are charged to services in the Comprehensive Income and Expenditure Account);
the cost of retirement benefits is based on cash flows (payment of employer’s pensions contributions) rather than current service cost of benefits accrued in the year; and
expenditure on some support services is budgeted for centrally and not charged to Services. The income and expenditure of the Council’s principal portfolios recorded in the budget reports for the year is as follows:
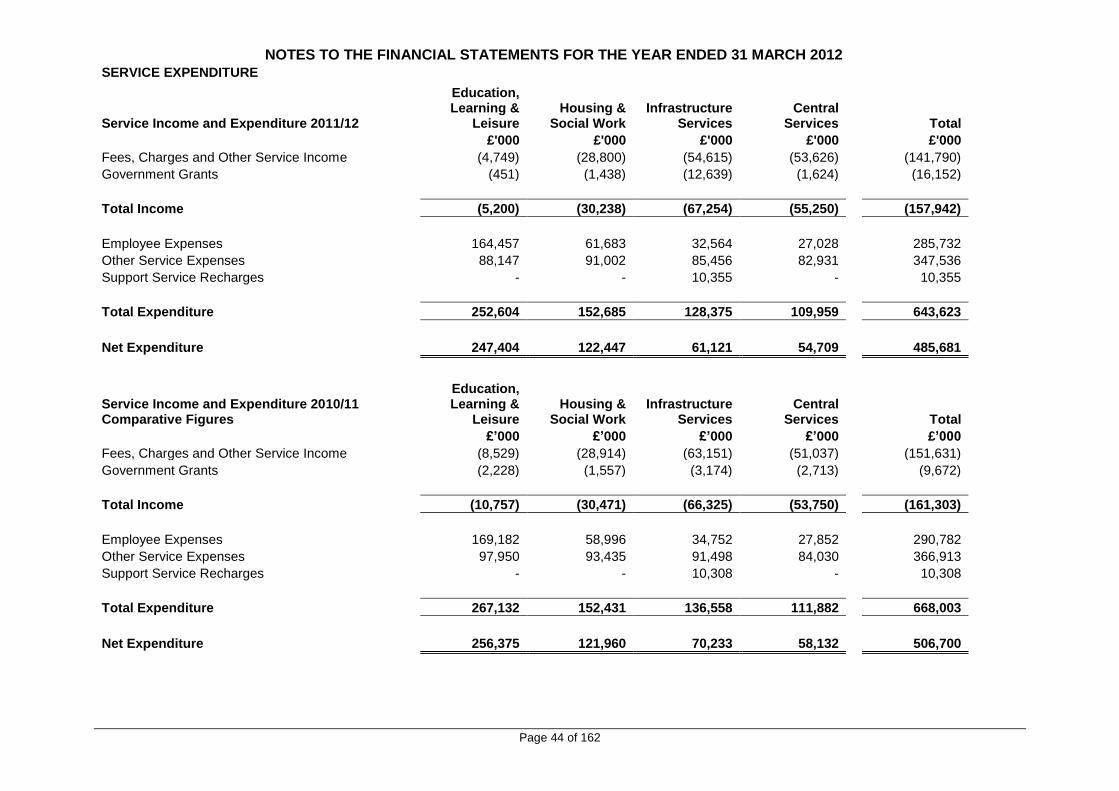
NOTES TO THE FINANCIAL STATEMENTS FOR THE YEAR ENDED 31 MARCH 2012
Page 44 of 162
SERVICE EXPENDITURE
Service Income and Expenditure 2011/12
Education, Learning &
Leisure Housing &
Social Work Infrastructure
Services Central
Services Total
£'000 £'000 £'000 £'000 £'000
Fees, Charges and Other Service Income (4,749) (28,800) (54,615) (53,626) (141,790)
Government Grants (451) (1,438) (12,639) (1,624) (16,152)
Total Income (5,200) (30,238) (67,254) (55,250) (157,942)
Employee Expenses 164,457 61,683 32,564 27,028 285,732
Other Service Expenses 88,147 91,002 85,456 82,931 347,536
Support Service Recharges - - 10,355 - 10,355
Total Expenditure 252,604 152,685 128,375 109,959 643,623
Net Expenditure 247,404 122,447 61,121 54,709 485,681
Service Income and Expenditure 2010/11 Comparative Figures
Education, Learning &
Leisure Housing &
Social Work Infrastructure
Services Central
Services Total
£’000 £’000 £’000 £’000 £’000
Fees, Charges and Other Service Income (8,529) (28,914) (63,151) (51,037) (151,631)
Government Grants (2,228) (1,557) (3,174) (2,713) (9,672)
Total Income (10,757) (30,471) (66,325) (53,750) (161,303)
Employee Expenses 169,182 58,996 34,752 27,852 290,782
Other Service Expenses 97,950 93,435 91,498 84,030 366,913
Support Service Recharges - - 10,308 - 10,308
Total Expenditure 267,132 152,431 136,558 111,882 668,003
Net Expenditure 256,375 121,960 70,233 58,132 506,700

NOTES TO THE FINANCIAL STATEMENTS FOR THE YEAR ENDED 31 MARCH 2012
Page 45 of 162
Reconciliation of Service Income and Expenditure to Cost of Services in the Comprehensive Income and Expenditure Statement This reconciliation shows how the figures in the analysis of Service income and expenditure relate to the amounts included in the Comprehensive Income and Expenditure Statement. Reconciliation of Service Income and Expenditure to Cost of
Services in the Comprehensive Income and Expenditure Statement
2010/11 2011/12
£’000 £’000
506,700 Net Expenditure in the Service Analysis 485,681
(12,035)
Net Expenditure of Services and Support Services not Included in the Analysis
(19,343)
11,409
Amounts in the Comprehensive Income and Expenditure Statement not Reported to Management in the Analysis
102,553
(7,493)
Amounts Included in the Analysis not Included in the Comprehensive Income and Expenditure Statement
(8,258)
498,581
Cost of Services in Comprehensive Income and Expenditure Statement
560,633
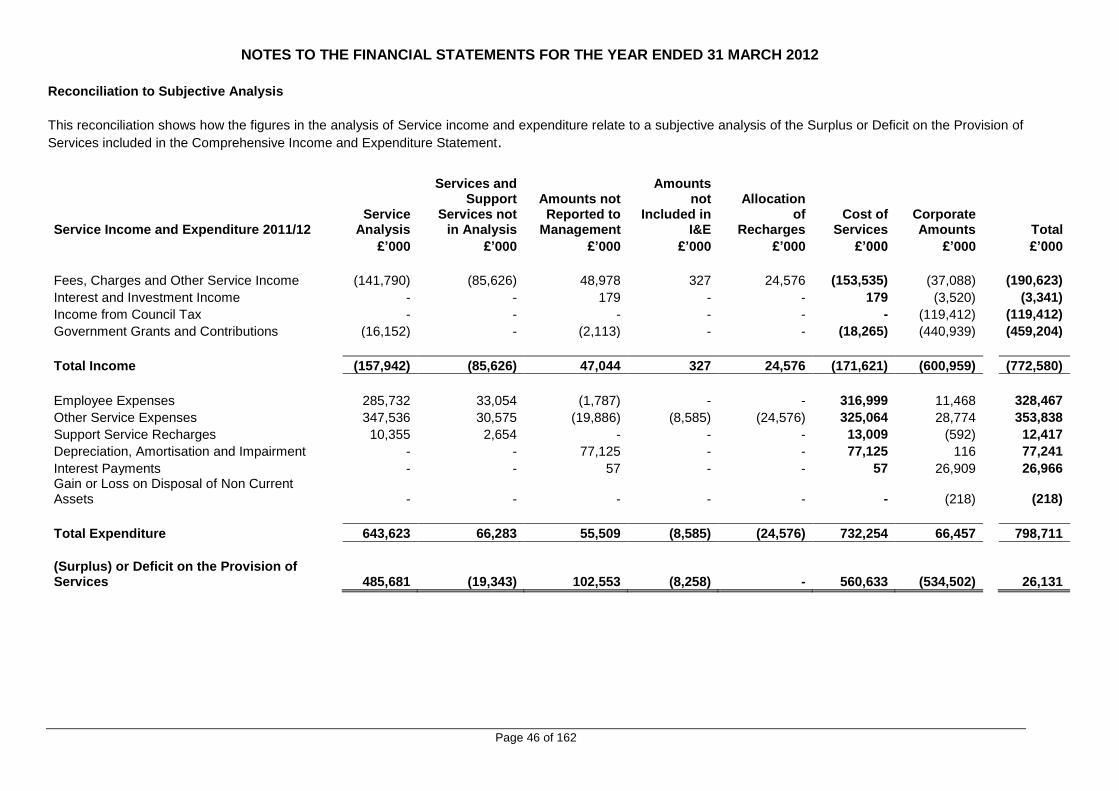
NOTES TO THE FINANCIAL STATEMENTS FOR THE YEAR ENDED 31 MARCH 2012
Page 46 of 162
Reconciliation to Subjective Analysis
This reconciliation shows how the figures in the analysis of Service income and expenditure relate to a subjective analysis of the Surplus or Deficit on the Provision of
Services included in the Comprehensive Income and Expenditure Statement.
Service Income and Expenditure 2011/12 Service
Analysis
Services and Support
Services not in Analysis
Amounts not Reported to
Management
Amounts not
Included in I&E
Allocation of
Recharges Cost of
Services Corporate Amounts Total
£’000 £’000 £’000 £’000 £’000 £’000 £’000 £’000
Fees, Charges and Other Service Income (141,790) (85,626) 48,978 327 24,576 (153,535) (37,088) (190,623)
Interest and Investment Income - - 179 - - 179 (3,520) (3,341)
Income from Council Tax - - - - - - (119,412) (119,412)
Government Grants and Contributions (16,152) - (2,113) - - (18,265) (440,939) (459,204)
Total Income (157,942) (85,626) 47,044 327 24,576 (171,621) (600,959) (772,580)
Employee Expenses 285,732 33,054 (1,787) - - 316,999 11,468 328,467
Other Service Expenses 347,536 30,575 (19,886) (8,585) (24,576) 325,064 28,774 353,838
Support Service Recharges 10,355 2,654 - - - 13,009 (592) 12,417
Depreciation, Amortisation and Impairment - - 77,125 - - 77,125 116 77,241
Interest Payments - - 57 - - 57 26,909 26,966 Gain or Loss on Disposal of Non Current Assets - - - - - - (218) (218)
Total Expenditure 643,623 66,283 55,509 (8,585) (24,576) 732,254 66,457 798,711
(Surplus) or Deficit on the Provision of Services 485,681 (19,343) 102,553 (8,258) - 560,633 (534,502) 26,131

NOTES TO THE FINANCIAL STATEMENTS FOR THE YEAR ENDED 31 MARCH 2012
Page 47 of 162
RECONCILIATION TO SUBJECTIVE ANALYSIS
Service Income and Expenditure 2010/11 Service
Analysis
Services and Support
Services not in Analysis
Amounts not Reported to
Management
Amounts not
Included in I&E
Allocation of
Recharges Cost of
Services Corporate Amounts Total
£'000 £'000 £'000 £'000 £'000 £'000 £'000 £'000
Fees, Charges and Other Service Income (151,631) (81,693) (62,584) - 39,316 (256,592) (42,031) (298,623)
Interest and Investment Income - - (58) - - (58) (1,792) (1,850)
Income from Council Tax - - - - - - (117,970) (117,970) Government Grants and Contributions (9,672) (45) (9,749) - - (19,466) (433,897) (453,363)
Total Income (161,303) (81,738) (72,391) - 39,316 (276,116) (595,690) (871,806)
Employee Expenses 290,782 36,701 14,183 - - 341,666 14,385 356,051
Other Service Expenses 366,913 30,175 16,577 (7,493) (39,316) 366,856 27,263 394,119
Support Service Recharges 10,308 2,827 - - - 13,135 526 13,661
Depreciation, Amortisation and Impairment - - 54,204 - - 54,204 - 54,204
Interest Payments - - (1,164) - - (1,164) 31,166 30,002 Gain or Loss on Disposal of Non Current Assets - - - - - - (682) (682)
Total Expenditure 668,003 69,703 83,800 (7,493) (39,316) 774,697 72,658 847,355
(Surplus) or Deficit on the Provision of Services 506,700 (12,035) 11,409 (7,493) - 498,581 (523,032) (24,451)

NOTES TO THE FINANCIAL STATEMENTS FOR THE YEAR ENDED 31 MARCH 2012
Page 48 of 162
8. Other Operating Expenditure
2010/11 £’000
2011/12 £’000
(682) (Gains)/Losses on the Disposal of Non Current Assets (218)
143 (Surplus)/Deficit on Trading Operations (Note 13) (94)
(539) Total (312)
9. Financing and Investment Income and Expenditure
10. Taxation and Non Specific Grant Income
2010/11 £’000
2011/12 £’000
(117,970) Council Tax Income (119,412)
(96,407) Business Rates (68,420)
(324,510) Non Ring Fenced Government Grants (344,291)
(12,980) Non Specific Grant Income (28,228)
(551,867) Total (560,351)
11. Material Items of Income and Expense
An opportunity arose during the year to make an advance payment of £20,963,000 to the North East Scotland Pension Fund in respect of deficit contributions for the period 2012/15. This payment, representing the capitalised costs of the next three years’ past service deficit costs, attracted an advantageous discount over the payment of deficit contributions in year. The transaction relates to an advance payment and is therefore not reflected on the face of the Comprehensive Income and Expenditure Statement in 2011/12, it has been recognised as a debtor on the Balance Sheet and will be reflected in this account in future years. 12. Exceptional Items and Prior Period Adjustments
In common with most other Scottish local authorities, the Council sought to settle potential equal pay claims through the offer of compensation payments to entitled employee groups. In the main, these were predominantly female groups of manual workers whose jobs do not attract bonus payments and who were able to identify a manual worker job undertaken predominantly by males, which does attract bonus payments and is graded at a comparable level. Between 2006/07 and 2010/11, actual payments of £22,105,000 were made in respect of compensation for equal pay. At 31 March 2011, the Council held a provision of £5,114,000 in respect of claims for staff who have not yet signed compromise agreements and who have progressed to a tribunal claim.
2010/11 £’000
2011/12 £’000
23,752 Interest Payable and Similar Charges 24,431
7,414 Pensions Interest Cost and Expected Return on Pensions Assets 2,478
(612) Income and Expenditure in Relation to Investment Properties and changes in their Fair Value -
(1,180) Interest Receivable and Similar Income (809)
- Investment Losses 61
29,374 Total 26,161

NOTES TO THE FINANCIAL STATEMENTS FOR THE YEAR ENDED 31 MARCH 2012
Page 49 of 162
No claims were settled during 2011/12 and hence no further payments have been made. However, a small number of tribunal claims have been withdrawn hence the provision has been reduced by £48,000. This reduction in the provision is shown as an Exceptional Item in the Comprehensive Income and Expenditure Statement. Prior Period Adjustments 1. Heritage Assets The Statement of Accounts for 2011/12 introduce a change in treatment for heritage assets held by the Council. Further details can be found under Note 26 on pages 66 - 68. 2. Capital Grants An error has been identified regarding the treatment of capital grants in the Comprehensive Income and Expenditure Statement. The guidance requires capital grants to be recorded against the 'Tax and non-specific grant income' line rather than 'Service Revenue Account' line of the Comprehensive Income and Expenditure Statement. a. 2010/11 Comprehensive Income and Expenditure Statement
Published
2010/11 Adjustment
Aberdeenshire Services Statement Made
£000s £000s
Education Services 265,822 495
Housing Services 5,882 80
HRA (6,628) 889
Cultural & Related Services 27,117 270
Environmental Services 31,996 51
Roads & Transport Services 43,416 2,761
Planning & Development Services 8,362 193
Social Work 133,453 57
Central Services 6,713 -
Fire Services 8,827 -
Police Services 16,772 -
Exceptional Items 2,860 -
Corporate & Democratic Core 9,912 -
Non Distributed Costs (60,719) -
COST OF SERVICES 493,785 4,796
Other Operating Expenditure
Net (Gain)/Loss on Disposal of Fixed Assets (682) - (Surplus)/deficit on Trading Undertakings not included in Net Cost of Services 143 - Extraordinary Items - -
(539) -
Financing and Investment Income and Expenditure
Interest payable and similar charges 23,752 - Pensions interest cost and expected return on pensions assets 7,414 -
Income and expenditure in relation to investment properties and changes in their fair value (612) - Interest and investment income (1,180) - Investment losses - -
29,374 -

NOTES TO THE FINANCIAL STATEMENTS FOR THE YEAR ENDED 31 MARCH 2012
Page 50 of 162
Surplus or Deficit of Discontinued Operations Taxation and Non-Specific Grant Income
Council Tax (including Community Charges) (117,970) -
Business Rates (96,407) -
Non Ring Fenced Government Grants (324,510) - Non-Specific Grant Income (8,184) (4,616)
(547,071) (4,616)
(Surplus) or Deficit on Provision of Services (24,451) - 13. Trading Operations
The Local Government in Scotland Act 2003 sets out the requirement for statutory trading accounts to be maintained for ‘significant trading operations’. Statutory trading accounts must break even over a three year rolling period. The Council has established two trading services where the service manager is required to consider commercial factors and balance their budget by generating income from other parts of the Council and/or other organisations. Details of these services are as follows:
Housing Repairs
The performance of the Housing Repairs statutory trading account in the current year is summarised in the following table:-
2011/12 Turnover
2011/12
Expenditure
2011/12 (Surplus)/
Deficit £’000 £’000 £’000 Target (16,250) 16,162 (88) Actual (15,250) 13,853 (1,397)
The cumulative performance over the previous three years is shown in the following table:-
Target (Surplus)/
Deficit £’000 £’000 2009/10 (61) (1,232) 2010/11 (57) (1,163) 2011/12 (88) (1,397)
Cumulative (206) (3,792)
Housing Repairs undertakes all types of property maintenance, with the principal client being the Housing Revenue Account, which had a stock of 12,940 houses at 31 March 2012. The actual financial performance for the current year of £1,397,000 surplus compares favourably with the financial target for the year which was a £88,000 surplus. The statutory financial target for the three year period is to break even although the Council has set a target of £206,000, which is in excess of that required. Housing Repairs has a cumulative surplus for 2009/10–2011/12 of £3,792,000 and has therefore achieved its statutory break-even target for 2009/10-2011/12. At its meeting on 10 November 2011, Policy and Resources Committee agreed that Housing Repairs would no longer be a statutory trading account, with effect from 1 April 2012. From that date, its costs will be consolidated into the Housing Revenue Account.

NOTES TO THE FINANCIAL STATEMENTS FOR THE YEAR ENDED 31 MARCH 2012
Page 51 of 162
Roads Operations The performance of the Roads Operations statutory trading account in the current year is summarised in the following table:-
2011/12 Turnover
2011/12
Expenditure
2011/12 (Surplus)/
Deficit £’000 £’000 £’000 Target (26,216) 25,584 (632) Actual (24,661) 23,183 (1,478)
The cumulative performance over the previous three years is shown in the following table:-
Target (Surplus)/
Deficit £’000 £’000 2009/10 (562) (788) 2010/11 (589) (1,314) 2011/12 (632) (1,478)
Cumulative (1,783) (3,580)
Roads Operations is principally involved in maintenance work on 5,443 kilometres of roads and 2,707 bridges and drains, for which the Council has a statutory responsibility. In addition, work is undertaken in respect of the installation and maintenance of 41,096 street lights. The actual financial performance for the current year of £1,478,000 surplus compares favourably with the financial target for the year which was £632,000 surplus. The statutory financial target for the three year period is to break even, although the Council has set a target of £1,783,000 surplus, which is in excess of that required. Roads Operations has a cumulative surplus for 2009/10-2011/12 of £3,580,000 and has therefore achieved its statutory break-even target for 2009/10-2011/12.
Net Surplus/Deficit on Trading Accounts
The net surplus on the statutory trading accounts is £2,875,000. This does not agree with the surplus from Trading Operations of £692,000 shown on the CIES as (i) the internally generated surpluses on Housing Repairs and Roads Operations have been reapportioned to the appropriate services, to reflect the true cost of providing those services and (ii) the position reported above are inclusive of interest on revenue balances (IORB) and interest in stock balances (IOSB) detailed as follows: (Surplus)/
Deficit £’000
IORB/ IOSB £’000
Reallocation of (Surplus)/Deficit
£’000
Per CIES (Surplus)/Deficit
£’000 Housing Repairs (1,397) (11) 1,376 (32) Roads Operations (1,478) (31) 1,447 (62)
Surplus on CIES (2,875) (42) 2,823 (94)
In order to satisfy the requirements of competition law, recharges for internal work done by the trading operation following competition with the private sector have been priced to include a cost of capital recovery. The Code does not permit charges for the cost of capital to be debited to trading accounts, so the recharges that have been made result in additional surplus on the accounts. As a result, if the cost of capital charges had been made, the accounts for Housing Repairs showing a surplus of £1,397,000 would be reduced to £1,352,000 and those for Roads Operations showing a surplus of £1,478,000 would be reduced to £1,132,000.

NOTES TO THE FINANCIAL STATEMENTS FOR THE YEAR ENDED 31 MARCH 2012
Page 52 of 162
14. Agency Services Grampian Joint Fire and Rescue Board The Council provides payroll services for Grampian Joint Fire and Rescue Board, involving the payment of £11,044,000 (2010/11 £11,179,000) to employees and £4,592,000 (2010/11 £4,795,000) to Her Majesty's Revenue and Customs. The Fire and Rescue Board pays a management fee of £57,000 (2010/11 £57,000) for this service, £18,000 (2010/11 £18,000) for Treasury and Financial Advice Services with a further £15,000 (2010/11 £18,000) for Board Clerking Services which then total £90,000 (2010/11 £93,000).
Scottish Water
The Council collects Water and Sewage Rates on behalf of Scottish Water from householders within the Council’s boundaries, where the annual collections were £31,805,000 (2010/11 £31,270,000). There is a management fee payable to the Council associated with these collections of £6.14 per chargeable dwelling which amounted to £604,000 in 2011/12 (2010/11 £572,000). Northern Community Justice Authority The Council provides all the necessary financial and administrative services to run the Northern Community Justice Authority for which it receives an 8% administration fee on the annual funding which amounted to £2,460,000 (2010/11 £2,541,000). The fee in 2011/12 amounted to £179,000 (2010/11 £179,000). Income from Educating Pupils from Other Authorities in Aberdeenshire The Council supplies education services for pupils on behalf of other local authorities. The income received covers the costs incurred in the provision of additional support needs for Looked After Children where no surplus is generated from the provision of this service. This amounted to £86,000 (2010/11 £112,000). 15. Partnership Arrangements under the Community Care and Health (Scotland) Act 2002 Under the terms of the Community Care and Health (Scotland) Act 2002, Aberdeenshire Council and NHS Grampian entered into a Governance and Accountability Agreement from 2003/04. The purpose of this Agreement is to establish a single visible entity, which will deliver fully integrated health, housing and social care services that will serve the local community of Aberdeenshire by improving, maintaining and restoring health and independence and will assure access to quality health and Social Care Services to people at all levels of need. The agreement is required to fulfil the requirements of the Scottish Government guidance on Joint Resourcing and Joint Management (CCD7/2001). For these objectives to be met, continued co-operation between the partners and the alignment of budgets and managers must be maintained. The services covered in the initial agreement were Care for the Elderly and Occupational Therapy. From 2004/05 the scope of services included within the Agreement was extended to include all services for adults. During 2011/12 the gross budget of the partnership was £185,699,000 (2010/11 £182,337,000) and its gross expenditure was £183,781,000 (2010/11 £180,343,000). Aberdeenshire’s contribution to the partnership was £100,758,000 (2010/11 £89,376,000).
16. External Audit Costs
The Council has incurred the following costs in relation to the audit of the Statement of Accounts,
certification of grant claims and statutory inspections and to non-audit services provided by the Council’s
external auditors:
2010/11 2011/12 £’000 £’000
451 Fees for services undertaken in ‘Code of Audit Practice’ 430

NOTES TO THE FINANCIAL STATEMENTS FOR THE YEAR ENDED 31 MARCH 2012
Page 53 of 162
17. Councillors’ Remuneration Information on Councillors’ Remuneration is detailed in the Remuneration Report. 18. Officers’ Remuneration Information on Officers’ Remuneration is detailed in the Remuneration Report. 19. Termination Benefits Information on Termination Benefits is detailed in the Remuneration Report. 20. Construction Contracts The Council did not have any construction contracts in progress at 31 March 2012. 21. Capital Expenditure and Capital Financing
The total amount of capital expenditure incurred in the year is shown in the table below (including the
value of assets acquired under finance leases and PFI/PPP contracts), together with the resources that
have been used to finance it. Where capital expenditure is to be financed in future years by charges to
revenue as assets are used by the Council, the expenditure results in an increase in the Capital
Financing Requirement (CFR), a measure of the capital expenditure incurred historically by the Council
that has yet to be financed. The CFR is analysed in the second part of this note.
2010/11 2011/12
£'000 £'000
474,150 Opening Capital Financing Requirement 485,189
Capital Investment
65,597 Property, Plant and Equipment 74,457
171 Intangible Assets 325
Sources of Finance
(2,915) Capital Receipts (2,703)
(12,233) Government Grants and Other Contributions (28,509)
Sums Set Aside from Revenue:
(25,661) Capital Financed from Current Revenue (15,840)
(13,920) Loans Fund Principal Repayments (13,260)
485,189 Closing Capital Financing Requirement 499,659
Explanation of movements in year
11,039 Increase in Underlying Need to Borrow (Supported by Government Financial Assistance) 14,470
11,039 Increase/(Decrease) in Capital Financing Requirement 14,470

NOTES TO THE FINANCIAL STATEMENTS FOR THE YEAR ENDED 31 MARCH 2012
Page 54 of 162
22. Property, Plant and Equipment
Movements in 2011/12: Council
Dwellings
Other Land and Buildings
Vehicles, Plant,
Furniture &
Equipment Infrastructure
Assets Community
Assets
Assets Under
Construction
Total Property, Plant and
Equipment
PFI Assets included in
Property, Plant and
Equipment
£'000 £'000 £'000 £'000 £'000 £'000 £'000 £'000
Cost or Valuation
At 1 April 2011 470,734 1,248,688 66,792 249,085 7,436 7,746 2,050,481 154,544
Additions 17,618 11,711 8,852 18,365 - 17,911 74,457 1,087
Revaluation Increases/(Decreases) Recognised in the Revaluation Reserve 105,052 5,765 12 - - - 110,829 -
Revaluation Increases/(Decreases) Recognised in the Surplus/Deficit on the Provision of Services (27,872) (5,892) (26) - (112) (779) (34,681) -
Derecognition - Disposals (1,777) (220) (1,515) - - - (3,512) -
Assets Reclassified (to)/from Held for Sale - 977 - - - - 977 -
Transfers or Reclassifications of Assets 6,618 18,080 - (12,063) (7,173) (5,342) 120 -
At 31 March 2012 570,373 1,279,109 74,115 255,387 151 19,536 2,198,671 155,631

NOTES TO THE FINANCIAL STATEMENTS FOR THE YEAR ENDED 31 MARCH 2012
Page 55 of 162
22. Property, Plant and Equipment (continued)
Movements in 2011/12: Council
Dwellings
Other Land and Buildings
Vehicles, Plant,
Furniture & Equipment
Infrastructure Assets
Community Assets
Assets Under Construction
Total Property, Plant and
Equipment
PFI Assets included in
Property, Plant and Equipment
£'000 £'000 £'000 £'000 £'000 £'000 £'000 £'000 Accumulated Depreciation and Impairment At 1 April 2011 (27,565) (61,749) (33,684) (64,561) (1,042) (2) (188,603) (9,343) Depreciation Charge Depreciation Written Out to the Revaluation Reserve
(22,020)
23,767
(30,520)
228
(7,844)
-
(7,824)
(3)
-
-
-
(68,211)
23,995
(2,322)
Depreciation Written Out to the Surplus/Deficit on the Provision of Services 3,875 727 12 - 4 - 4,618 -
Impairment Losses/(Reversals) recognised in the Surplus/Deficit on the Provision of Services (6,823) (1,507) - - - - (8,330) -
Derecognition - Disposals 79 8 1,153 - - -
1,240 -
Other Movements in Depreciation and Impairment (79) (996) - 4 1,036 2 (33) -
At 31 March 2012 (28,766) (93,809) (40,363) (72,381) (5) - (235,324) (11,665)
Net Book Value
At 31 March 2012 541,607 1,185,300 33,752 183,006 146 19,536 1,963,347 143,966
At 31 March 2011 443,169 1,186,939 33,108 184,524 6,394 7,744 1,861,878 145,201

NOTES TO THE FINANCIAL STATEMENTS FOR THE YEAR ENDED 31 MARCH 2012
Page 56 of 162
22. Property, Plant and Equipment (continued)
Restated Comparative Movements in 2010/11:
Council Dwellings
Other Land and Buildings
Vehicles, Plant,
Furniture &
Equipment Infrastructure
Assets Community
Assets
Assets Under
Construction
Total Property, Plant and
Equipment
PFI Assets included in
Property, Plant and Equipment
£'000 £'000 £'000 £'000 £'000 £'000 £'000 £'000
Cost or Valuation
At 1 April 2010 453,197 1,224,646 61,935 230,234 7,374 1,409 1,978,795 153,447
Additions 18,942 15,820 5,950 18,620 41 6,224 65,597 1,097
Revaluation Increases/(Decreases) Recognised in the Revaluation Reserve - 32,855 56 6,929 1,146 - 40,986 -
Revaluation Increases/(Decreases) Recognised in the Surplus/Deficit on the Provision of Services - (22,177) - (6,698) (1,125) - (30,000) -
Derecognition - Disposals (1,405) (543) (1,149) - - - (3,097) -
Assets Reclassified (to)/from Held for Sale - (1,784) - - - - (1,784) -
Transfers or Reclassifications of Assets - (129) - - - 113 (16) -
At 31 March 2011 470,734 1,248,688 66,792 249,085 7,436 7,746 2,050,481 154,544

NOTES TO THE FINANCIAL STATEMENTS FOR THE YEAR ENDED 31 MARCH 2012
Page 57 of 162
Property, Plant and Equipment (continued)
Restated Comparative Movements in 2010/11:
Council Dwellings
Other Land and Buildings
Vehicles, Plant,
Furniture &
Equipment Infrastructure
Assets Community
Assets
Assets Under
Construction
Total Property, Plant and
Equipment
PFI Assets included in
Property, Plant and Equipment
£'000 £'000 £'000 £'000 £'000 £'000 £'000 £'000
Accumulated Depreciation and Impairment
At 1 April 2010 (21,206) (39,311) (26,654) (57,890) (1,032) - (146,093) (7,043) Depreciation Charge (6,442) (30,013) (7,970) (7,426) (175) - (52,026) (2,300) Depreciation Written Out to the Revaluation Reserve - - - - - - - -
Depreciation Written Out to the Surplus/Deficit on the Provision of Services 83 1,912 - - 127 - 2,122 -
Impairment Losses/(Reversals) recognised in the Surplus/Deficit on the Provision of Services - 5,634 - 755 38 - 6,427 -
Derecognition - Disposals - 12 940 - - - 952 - Other Movements in Depreciation and Impairment - 17 - - - (2) 15 -
At 31 March 2011 (27,565) (61,749) (33,684) (64,561) (1,042) (2) (188,603) (9,343)

NOTES TO THE FINANCIAL STATEMENTS FOR THE YEAR ENDED 31 MARCH 2012
Page 58 of 162
Capital Commitments
At 31 March 2012, the Council has entered into a number of contracts for the construction or enhancement
of Property, Plant and Equipment in 2012/13 and future years budgeted to cost £37,121,000. Similar
commitments at 31 March 2011 were £29,421,000. The major commitments are:
£'000
Banff & Buchan - Banff, Portsoy and Macduff - Gas Heating Upgrades 105
Formartine - Council House Insulation Works 105
Balmedie Primary School Extension 112 Kemnay - Alehousewells Primary: Works required to comply with the Disability and Equality Act 2010 113
Formartine Kitchen Upgrades 114
Garioch Sheltered Housing Bathroom Upgrades 122
Formartine Sheltered Housing Kitchen Upgrades 122
Marr - Council House Insulation Works 127
Peterhead - Boddam School - Window Upgrade 134
Lairhillock Primary School - New Primary School 142
Window Upgrades 145
Peterhead - Balmoor Industrial Estate - Reinstatement of Electrics 148
Ellon, Meiklemill School - Window Upgrade 149
Marr - Bathroom Upgrades 156
Macduff - Industrial Estate - Site Servicing 163
Banff & Buchan Kitchen Upgrades 166
Buchan Kitchen Upgrades 171
Laurencekirk - Replacement Mearns Academy 186
Kincardine & Mearns - Bathroom Upgrades 190
Cruden Bay - John Buchan Drive - Residential Care Unit and Site Infrastructure 196
Kinellar Primary School - Replacement Primary School 219
Stonehaven - Redcloak Proposed Civic Amenity Site 255
Alford - Hamewith Court - Phases 2 and 3 Alterations and Extensions 261
Ellon - Replacement Household Waste Recycling Centre 284
Garioch - Blackburn and Inverurie - Gas Heating Upgrades 328
Primary Schools - Toilet Upgrades 336
Marr Kitchen Upgrades 343
Keig Primary School - Extensions to provide Administration Accommodation and Kitchen/Store 361
Buchan - Bathroom Upgrades 377
Inverurie Academy - Windows Upgrade 394
Banchory - Crows Nest - Proposed Waste Transfer Station 411
Turriff - Markethill - New Primary School 429
Sheltered Housing - Installation of Sprinkler Systems 430
Banff - Swimming Pool - Air Handling Unit Upgrade 439
Banff & Buchan - Heating Upgrades 445
Ellon - Replacement Academy 470
Wireless and Hilltop Networks 541
Peterhead Academy - Upgrading of Lighting and Mechanical Controls 553
Inverurie - Stonefield Croft - New Social Housing Development 578
Fraserburgh Academy - Technical Upgrade 653
Vehicle Replacement 688
Banff Academy - Curtain Walling Upgrade 718

NOTES TO THE FINANCIAL STATEMENTS FOR THE YEAR ENDED 31 MARCH 2012
Page 59 of 162
Mintlaw Academy - Science Upgrade 744
Alford - Greystone Road - New Community School Campus 936
Banff Primary School - New Build Housing 997
Inverurie - Old Kemnay Road - Replacement Children's Home 1,092
Cruden Bay - John Buchan Drive - New Build Council Housing 1,165
Garioch - Bathroom Upgrades 1,209
Aberdeenshire - Cruden House Types - Insulation and Repair 2,966
Stonehaven - School Road - New 60 Bed Care Home and 8 Housing Units 3,078
Fraserburgh Replacement Swimming Pool and Community Centre 4,358
Effects of Changes in Estimates The revaluation of the Council’s Sheltered Housing portfolio has been adjusted by a discount factor of 51% to reflect Existing Use Value – Social Housing. There is no private rental sector for Sheltered Housing in Aberdeenshire, hence the discount factor used is that which is applied to the general Housing stock. The effect of this is to reduce the value of the Sheltered Housing portfolio by £48,959,000. This is considered to be a change in accounting estimation technique and hence it does not require a prior period adjustment. Revaluations
The Council carries out a rolling programme that ensures that all Property, Plant and Equipment required to
be measured at fair value is revalued at least every five years. All valuations were carried out internally.
Valuations of land and buildings were carried out in accordance with the methodologies and bases for
estimation set out in the professional standards of the Royal Institution of Chartered Surveyors. Valuations
of vehicles, plant and equipment are based on current prices where there is an active second hand market
or latest list prices adjusted for the condition of the asset.
The significant assumptions applied in estimating the fair values are:
General - Regard was had to the information held by Aberdeenshire Council, including leases in place and state of repair. Inspections were carried out where considered appropriate;
Measurement - All property areas are in accordance with the RICS Code of Measuring Practice (6th Edition);
Planning - It is assumed that all premises have valid planning permission for their current use;
Hazardous Materials - No investigation has been carried out to determine whether or not any deleterious or hazardous material has been used in the construction of the properties or that they are free from risk in this respect. For the purposes of this valuation report it has been assumed that such investigation would not disclose the presence of any such material to any significant extent;
Contamination – Valuers are not aware of the content of either any environmental audit or other environmental investigation or soil survey which may have been carried out on the properties and which may draw attention to any contamination or the possibility of such contamination. In undertaking the valuation it has been assumed that the properties have not been subjected to any contaminated or potentially contaminated use. However, should it be established subsequently that contamination exists either within the subjects or on any neighbouring land or the premises have been the subject of any use giving rise to contamination, this situation may well affect the valuation advice reported and the right to amend the advice is accordingly reserved;
Inspections to Consider the State of Repair - As a building survey of the subjects is not required for the stated instruction, regard has been had only to their apparent state of repair and condition and, accordingly, no inspection of woodwork and other parts of the structure that were covered, non-exposed or inaccessible has been made. In addition, no detailed investigations have been undertaken with regard to the fabric of the building and therefore no undertaking can be given to the effect that the property is free from rot or defects arising from the use of any deleterious materials. Without the advice of consulting engineers, no opinion can be given as to the permissible imposed floor loadings. Lastly, no investigations have been carried out as to whether or not there are any related site problems and therefore no opinion can be given as to the suitability or freedom from contamination of the site;
Title Deeds - The title deeds for the properties involved have not been examined and in reaching the individual valuations it has been assumed that unless otherwise stated the properties are held under feudal tenure. Further it has been assumed there are no onerous restrictions relating to the use of

NOTES TO THE FINANCIAL STATEMENTS FOR THE YEAR ENDED 31 MARCH 2012
Page 60 of 162
these properties and that they are not adversely affected by any unusual rights, obligations, restrictions or burdens which would impede a sale. It has also been assumed that there is an unfettered right of access to all adjacent public roads and that the properties are not burdened by any existing rights of access. Where otherwise is known to be the case, appropriate adjustments to reflect the impact on value have been made;
Plant and Machinery - Elements of plant and machinery normally found and deemed to be part of the heritage have been included in the value. However, all non-heritable items and furnishings have been excluded;
Disability Discrimination Act - No allowance has been made with regard to the condition of the property and any works that may be required to comply with the Disability Discrimination Act;
Ground rents/grassum leases - It has been assumed that these assets will have a positive covenant to return a cleared site at the end of the contractual term. Therefore, the value of the asset will be attributed solely to the land i.e. no building/land split; and
Assets with no building element - By definition ground rents and grassum leases do not have a building element. Therefore the value of the asset shall be solely attributed to the land i.e. no building/land split.
Council
Dwellings
Other Land &
Buildings Other PPE* Total
£'000 £'000 £'000 £'000
Carried at Historical Cost 17,618 51,403 349,189 418,210
Valued at fair value as at:
1 April 2011 552,755 17,834 - 570,589
1 April 2010 - 116,043 - 116,043
1 April 2009 - 1,033,187 - 1,033,187
1 April 2008 - 59,276 - 59,276
1 April 2007 - 1,366 - 1,366
Total Cost or Valuation 570,373 1,279,109 349,189 2,198,671
*Other Plant, Property and Equipment (PPE) consists of:
Vehicles, Plant, Furniture and Equipment;
Infrastructure Assets;
Community Assets; and
Assets under Construction.

NOTES TO THE FINANCIAL STATEMENTS FOR THE YEAR ENDED 31 MARCH 2012
Page 61 of 162
23. Heritage Assets Reconciliation of the Carrying Value of Heritage Assets Held by the Council
Human History
Archaeology
Total Assets
£'000 £’000 £'000
Cost or Valuation
1 April 2010 900 320 1,220
Revaluations 100 - 100
31 March 2011 1,000 320 1,320
Cost or Valuation
at 31 March 2012 1,000 320 1,320 Human History A small number of archaeological items on loan to National Museums Scotland were valued by them in 2011 on the basis of current sale room prices. One item, the Deskford Carnyx, has been valued at £750,000 in view of its national importance. Four items have been valued at a combined total of £100,000, and these are not reported on the Balance Sheet. In addition, Hareshowe Farm, Aden Country Park is valued on the Balance Sheet at £250,000. Verticle Area Photograph Collection The Verticle Area Photograph Collection has been valued at £320,000 and is shown in the Balance Sheet. 24. Heritage Assets - Five Year Summary of Transactions No material transactions in relation to Heritage Assets have taken place during the last five financial years. 25. Heritage Assets - Further Information on Museums’ Collections (i) Fine Art and Applied Art Collections The Art collection is divided into the following:
Fine Art – includes paintings (oils and water-colours), drawings (pencil, ink, charcoal and pastel) and prints; and
Applied Art – includes sculpture, silver, glass, ceramics, furniture, horology, metalwork and some miscellaneous domestic and religious material.
Fine Art The core of the Fine Art collection largely comprises the former burgh collections. Whilst there are four pre-19th century portraits, the greatest concentration is on 19th and early 20th century Scottish painting, particularly portraits, maritime paintings and a few landscapes, and some contemporary 20th and early 21st century material by North East artists. In 1978 part of the Fine Art collection was valued at £9,000, and three further paintings valued in 2011 by National Galleries of Scotland were deemed to have a total value of £20,000. Oil Paintings - This group comprises portraits (mainly of former Provosts), maritime paintings, landscapes, still life and some genre paintings. Important names in this group include Robert Brough, Joseph Farquharson, James Giles, George Sherwood Hunter, R. Gemmell Hutchison, Norman Macbeth, John Phillip, Sir George Reid and George Fiddes Watt. Aberdeenshire Council holds the only collection in public hands in Northern Scotland of works by the Peterhead artist James Forbes, who was the teacher of John Phillip. In recent years there has been a policy of acquiring contemporary paintings by North East artists.

NOTES TO THE FINANCIAL STATEMENTS FOR THE YEAR ENDED 31 MARCH 2012
Page 62 of 162
Water-colours and Drawings - This is a small group, the most significant of which are the 18th century portraits by James Ferguson, and the series of water-colours of Peterhead painted in 1795 by Montague Beattie. There are a small number of contemporary water-colours and drawings by North East artists. Prints - This group falls into two distinct sections. One group is of 19th century prints, largely landscape views, nearly all of which are of North East scenes. The other group is a larger collection of late 20 th century prints, mostly by contemporary North East artists. Applied Art The Applied Art collection covers a wide variety of objects and materials, of which the Banff silver sub-collection is of national importance. Silver - This group of artefacts includes material produced in Banff, Peterhead, Ballater and Stonehaven. The collection of Banff silver is the largest in Scotland. Although just under half of the known Banff silversmiths are represented in the collection, this includes eleven out of thirteen silversmiths for whom marks are recorded. There is an important series of silver prize trophies associated with the mid-19th century Volunteer movement in Aberdeenshire. Sculpture and Ceramics - There are a small number of sculptures and ceramic works, some of which are by contemporary North East artists. Furniture and Horology - This is a small collection, the most significant items being several 17th-century chairs and a few longcase clocks, as well as the chair of William Thom, the Inverurie poet. Metalwork - This group of material includes brass, copper, pewter and plated wares. It incorporates secular and religious material such as presentation gifts and trophies and community plate, mostly of local manufacture and association. (ii) Natural Sciences Collection The National Sciences Collection is divided into the following sub-headings:
Vertebrate Zoology;
Invertebrate Zoology;
Botany; and
Geology. Vertebrate Zoology Mounted Birds - This collection consists largely of British birds, with some foreign species. Much of the material represents what survives of 19th century collections. Some 20th century specimens have been acquired for display purposes. Bird’s Eggs - This is a small collection, largely of British birds, with some exotic species (e.g. Ostrich). Other Vertebrates - This group of collections contains mammals, some reptiles and fish. The older part of the collection consists of faded and somewhat decayed mounted specimens, now of little display value. Modern mounted mammal specimens have been acquired purely for display purposes. Invertebrate Zoology This is the largest collection in the Service comprising several thousand specimens from a number of sources. The two principal components are mollusc shells and insects. The mollusc shell collection is largely of foreign species. Much comes from historical collections, and there is a good late 20th century collection. The historical collections reflect scientific collecting during the 19th century period of “Scots abroad”. The insect collection derives from historical collections. No recent additions have been made to this section.
NOTES TO THE FINANCIAL STATEMENTS FOR THE YEAR ENDED 31 MARCH 2012
Page 63 of 162
Botany The botanical collection consists solely of a single small herbarium of Arctic plants collected by Captain Francis Crozier who was with Sir John Franklin on his last expedition. Geology The collections of rocks, minerals and fossils are small and variable in quality. Rocks - The rock collection consists of a few hundred specimens from Aberdeenshire, Britain and Europe. There is patchy coverage of local rock types, though there is a representative collection of granites. Minerals - This collection contains a fairly representative group of minerals, not all of display quality. Fossils - The Fossil collection includes representative specimens of the major fossil groups, and has important Old Red Sandstone fish material. Much of the material, however, is not of display quality, although the Old Red Sandstone fish material has been the subject of recent research work. (iii) Human History Collection The Human History Collection is divided into the following sub-headings:
Farming;
Social History;
Archives;
Costume & Textiles;
Archaeology;
Numismatics;
Ethnography;
Arms and Armour; and
Photography. Farming The agricultural collections of the Aberdeenshire Farming Museum are a Recognised Collection of National Significance (so designated by Museums Galleries Scotland in 2008). The collection is based on the original agricultural collection amassed at Adamston, Huntly by the late Hew McCall-Smith and purchased by the former Banff and Buchan District Council in 1984. The original collection was augmented by further acquisitions by the former North East Scotland Agricultural Heritage Centre (NESAHC), including the relocation to Aden Country Park of the Hareshowe croft in 1990. The NESAHC collections were supplemented in 1996 by the agricultural collection of North East Scotland Museums Service (NESMS). The collection presents an extensive view of farming and country life in North East Scotland over the last two to three hundred years, with a strong focus on the nineteenth and twentieth centuries. The collection includes some important items such as the early wooden ox plough from the NESMS collection. The range of larger agricultural implements demonstrates the importance of the local burgh foundries to farming in the Northeast. Archives relating to this collection include some rural farming business material such as Barclay, Ross & Hutchison of Turriff. There is a good, though incomplete, run of the Transactions of the (Royal) Highland & Agricultural Society of Scotland from 1872 to 1968, as well as Clydesdale stud books. The Council also owns Hareshowe Farm which is a working farm at Aden Country Park, which is set in the 1950s. The farm is valued at £150,000 at 1 April 2010 and at £250,000 at 31 March 2011 and 31 March 2012 in the Balance Sheet.

NOTES TO THE FINANCIAL STATEMENTS FOR THE YEAR ENDED 31 MARCH 2012
Page 64 of 162
Social History The Social History collection covers a wide range of material including bicycles, prams, shop fittings, industrial machinery, ship models, medical, musical and scientific instruments, commemorative and ornamental items, toys and games, weights and measures, photographic and textile equipment, and everyday domestic material. Much of the material has a specific association with Aberdeenshire, such as civic regalia and weights and measures. In particular, the maritime collections relate to the herring fishing, the whaling trade and harbour development. Archives A variety of miscellaneous archival records are held, many of which relate directly to other items in the collections. Some archival material has been collected for display purposes, such as posters. Amongst the older records held are seventeenth-century rentals for the Peterhead area and the earliest minute book of the Peterhead Trades (1728-92). Business records include material relating to Crosse & Blackwell and Cleveland Twist Drill in Peterhead, as well as some rural trade and farming businesses such as the account books from the McBain shoemakers’ business at Whitehills. There are a small number of whaling journals kept by crew members of Peterhead whalers, and the service has on loan from Peterhead Port Authority the Arrivals/Sailings registers of Peterhead Harbour Board 1865-1935. The service also has the prisoner of war diaries of Thomas Ainsworth who was held at MARLAG und MILAG NORD camp from 1941 to 1945. The service holds a major archive relating to the Troup and MacDonald families from Huntly, descended from the preacher and author, George MacDonald. This archive includes original manuscripts, correspondence, photographs and other memorabilia. The archive collection also includes the bound volumes of the Peterhead Sentinel (1857-1913) and the Buchan Observer (1871- present) newspapers. Costume & Textiles This collection comprises costume, textiles and accessories. The collection comprises mainly ladies’ costume, with some notable 19th century dresses, including a fair sample for the period 1850 to 1920 and for the 1960s and 1970s. There are also several banners, most notably the banner of the Banff Hammermen. Archaeology The Archaeology collection comprises material from North East Scotland and some foreign material. The North East material is generally confined to individual items from Aberdeenshire. In the past, individual finds came to the collection mainly by donation. A few items have been allocated more recently by the Scottish Archaeological Finds Allocation Panel (SAFAP). The collection is strongest in Neolithic and Bronze Age material, with a large collection of flints of various ages, a significant collection of beakers and cinerary urns, and an important collection of carved stone balls. The most important parts of the Archaeology collection comprise the Neolithic Ardiffery jet necklace, the Iron Age Deskford Carnyx, and the Pictish Gaulcross silver hoard (the two latter being of national importance and are on loan to National Museums Scotland). The collection is weak in Iron Age and Roman period material. The Mediaeval period is a slowly growing collection and has been recently augmented by a number of excavation assemblages. Numismatics The core of this collection is the Arbuthnot Coin and Medal Collection. This is a representative collection which includes Greek, Roman, English, Scottish, and British coins, and 18th and 19th century commemorative medals, together with associated archive material related to its acquisition by Adam Arbuthnot. There is a more general collection which includes trade and church tokens, as well as miscellaneous material including beggars’ badges. The core of the commemorative medal collection is the Arbuthnot collection. There is a small collection of military medals representing the First and Second World Wars, as well as a Waterloo Medal.

NOTES TO THE FINANCIAL STATEMENTS FOR THE YEAR ENDED 31 MARCH 2012
Page 65 of 162
Ethnography The Ethnography collection is based on the Arbuthnot Collection and on other 19th century burgh collections. The most significant section is the Inuit material, brought back by whaling ships in the 19th century. Other items come from Africa and China. Arms and Armour This is a small and varied collection of British and foreign firearms, swords and daggers, shot and powder flasks and a few pieces of armour. There are two significant sub-collections: (a) the arms and armour donated by the Duke of Fife; and (b) the Anderson Bey collection of North African militaria formerly held by Rhynie School. Photography This collection holds some 14,000 catalogued images, as glass negatives, original photographs, postcards and copy negatives. Over half of this material relates to the Peterhead area. The glass negatives are primarily the Shivas collection from Peterhead and provide a record of the area between about 1860 and 1910. Original photographs and postcards provide a record up to the 1960s supplemented by copy negatives. The recently-acquired Broughall collection comprises negatives from the Peterhead area during the last two decades of the 20th century. There are also two large uncatalogued accessions from the Banff area: the Bodie collection of late 19th and early 20th century glass plates, and the Ritchie collection of early to mid 20th century roll film negatives. (iv) Aikey Brae Stone Circle, Mintlaw This is the remains of a recumbent stone circle dating to the Neolithic period (circa 2500BC), and is an example of a type of monument unique to the North East of Scotland. There are five erect stones, including the recumbent, still standing which are set on a bank of small stones. The monument is set within a larger fenced area on the edge of a tree plantation. The land is owned by Aberdeenshire Council, and is nationally protected as a Scheduled Ancient Monument. (v) Rhynie Man, Woodhill House, Aberdeen This is a Class I symbol stone dating to the Early Medieval (Pictish) period (circa 6th-8th century AD). It is a large grey granite boulder incised with a rare example of a standing figure of a warrior. The stone, which is of international importance, was awarded to the former Grampian Regional Council by Historic Scotland in 1978 following its discovery, and is now on public display in the Woodhill House reception area. (vi) Vertical Aerial Photograph Collection This collection consists of three sets of vertical aerial imagery:
1977 BKS B&W Image Collection (circa 6000 images);
1988 JASair B&W Image Collection (circa 2500 images); and
1946 RAF B&W Image Collection (estimate 3000 images);
These image sets are used to assess landscape change, identify new cropmark archaeological sites, and other research activities undertaken by external bodies. The public and other organisations can arrange access to the collections under supervision. The 1977 and 1988 collections were inherited from the former Grampian Regional Council, while the 1946 RAF collection was gifted to the Archaeology Service by the Royal Commission Ancient Historical Monuments Scotland (RCAHMS).
The BKS Images can be replaced at an average cost of £30 per image from Fugro-BKS Ltd, making the collection value an estimated £180,000. The JASair images can be replaced at an average cost of £20 per image from RCAHMS, making the collection value an estimated £50,000. The RAF collection can be replaced at an average cost of £30 per image from RCAHMS, making the collection value and estimated £90,000. The total value of the collection is £320,000.

NOTES TO THE FINANCIAL STATEMENTS FOR THE YEAR ENDED 31 MARCH 2012
Page 66 of 162
(vii) Photograph and Slide Collection The slide collection consists of an estimated 23,000 images of archaeological sites taken either on the ground or via the former aerial photography programme undertaken by the Archaeology Service over the years since 1975. The collection is currently undergoing a digitisation programme to allow greater public access to it, and to provide backup as part of the disaster management plan.
To produce physical reproductions of the images would average £0.63 per image, making the collection value an estimated £14,000. However the collection in terms of content would be impossible to replicate from scratch given the nature of how it was formed. (viii) Heritage Assets of Particular Importance As explained in note 23, the Council holds one item which, in the opinion of the Curatorial staff, is of particular significance and has been valued by National Museums Scotland at £750,000. The Council also holds certain items which the Curators regard as particularly important to the collections. Of particular importance are a number of the paintings, the Banff silver collection, much of the numismatics collection, and the arms and armour. Most of these items were acquired by the Museum Service in the late 19th century and, in the Curators’ opinion, it is not possible to provide a reliable estimate of their value. (ix) Preservation and Management The Council is presently engaged in a complete relocation of the reserve collections from old inadequate stores to a central headquarters building that was completed in 2005. About half of the reserve collections have been relocated and it is estimated that about four to five years will be required for completion of this exercise. Until the relocation exercise has been completed, the conservation programme will be limited to intervention measures carried out on items on arrival at Museums HQ, and on material chosen for displays at the service’s museums. A rolling programme of formal conservation work will be established once the relocation exercise is completed. The Aberdeenshire Council Museum Service collections are managed by the Curatorial Officer – Documentation & Conservation who reports to the Principal Curatorial & Heritage Officer. The Curators manage the collections in accordance with policies that are approved by Aberdeenshire Council. Further information is provided in the Museum Service’s Acquisition & Disposal Policies 2007-2012, which is available on the Council’s website:
(http://www.aberdeenshire.gov.uk/museums/explore/AcquisitionPolicy2007-12.PDF) As is explained in that document, items in the collection are only disposed of where, in the opinion of the Curators, an item does not contribute to the interest and diversity of the Museum Service’s collection. The Museum Service maintains several databases of items in the collections. The ADLiB collections management system records all items relocated to the HQ building and formally catalogued and will ultimately be the Museum Service’s final register for the collections. There is also an inventory for each of the stores at HQ building which records material relocated to the HQ building but awaiting formal cataloguing onto ADLiB. The inventory is being updated constantly as material is moved to the HQ building. There are also partial records, both paper and computer based, of other sections of the collections which have not been moved to the HQ building. These are incomplete and the latter suffer from poor data input when created originally. It is estimated that it will take some five to six years to complete the creation of the final ADLiB database. 26. Heritage Assets – Change in Accounting Policy The Code of Practice on Local Authority Accounting in the United Kingdom 2011/12 introduced a change to the treatment in accounting for heritage assets held by the Council. As set out in our summary of significant accounting policies, the Council now requires heritage assets to be carried in the balance sheet at valuation.

NOTES TO THE FINANCIAL STATEMENTS FOR THE YEAR ENDED 31 MARCH 2012
Page 67 of 162
Heritage Assets For 2011/12, the Council is required to change its accounting policy for heritage assets and recognise them at valuation. Previously, heritage assets were either recognised as community assets (at cost) in the property, plant and equipment classification in the Balance Sheet or were not recognised in the Balance Sheet as it was not possible to obtain cost information on the assets. Community Assets (that are now to be classified as heritage assets) that were donated to the Council were held at valuation as a proxy for historical cost. The Council’s accounting policies for recognition and measurement of heritage assets are set out in the summary of significant accounting policies (see Note 1.12 on pages 24-26). In applying the new accounting policy, the Council has identified that an asset that was held previously as a Community Asset within Property, Plant and Equipment at £250,000 should now be recognised as a heritage asset and measured at £250,000. This asset relates to Hareshowe Farm, Aden Country Park. The Council will also recognise an additional £1,070,000 million for the recognition of heritage assets that were not recognised previously in the Balance Sheet. This increase is recognised in the Revaluation Reserve. The 1 April 2010 and 31 March 2011 Balance Sheets and 2010/11 comparative figures have thus been restated in the 2011/12 Statement of Accounts to apply the new policy. The effects of the restatement are as follows:
At 1 April 2010 the carrying amount of the Heritage Assets is presented at its valuation at £1,220,000. The element that was previously recognised in Property, Plant and Equipment has been reclassified. The Unusable Reserves have increased by £1,075,000.
The fully restated 1 April 2010 Balance Sheet is provided on page 17. The adjustments that have been made to that Balance Sheet over the version published in the 2010/11 Statement of Accounts are as follows:
Effect on Opening Balance Sheet 2010
As Stated Previously at
1 April 2010 As Restated 1 April 2010
Restatement Required to
Opening Balances as at
1 April 2010
£’000 £’000 £’000
Property, Plant and Equipment 1,832,847 1,832,702 (145)
Heritage Assets - 1,220 1,220
Unusable Reserves (1,064,977) (1,066,052) (1,075) Comprehensive Income and Expenditure Statement There has been no restatement to any of the lines in the Comprehensive Income and Expenditure Statement. Movement in Reserves Statement – Unusable Reserves 2010/11 The restatement of the relevant lines of the Movement in Reserves Statement, as of 31 March 2011, as a result of the application of this new accounting policy is presented in the table below.
As Previously Stated 31
March 2011 As Restated
31 March 2011 Restatement
2011
£’000 £’000 £’000
Balance as at the End of the Previous Reporting Period - 31 March 2010 (1,112,540) (1,113,615) (1,075)
Balance at the End of the Current Reporting Period 31 March 2011 (1,168,578) (1,169,653) (1,075)

NOTES TO THE FINANCIAL STATEMENTS FOR THE YEAR ENDED 31 MARCH 2012
Page 68 of 162
The resulting restated Balance Sheet for 31 March 2011 is provided on page 17. The adjustments that have been made to that Balance Sheet over the version published in the 2010/11 Statement of Accounts are as follows: Effect on Balance Sheet 31 March 2011
As Stated Previously
31 March 2011
As Restated 31 March 2011
Restatement 2011
£’000 £’000 £’000
Property, Plant and Equipment 1,862,123 1,861,878 (245)
Heritage Assets - 1,320 1,320
Unusable Reserves (1,124,396) (1,125,471) (1,075)
The effect of the change in accounting policy in 2010/11 has been that heritage assets are recognised at £1,320,000 on the Balance Sheet resulting in an increase to the Unusable Reserves of £1,075,000 and Property, Plant and Equipment being restated by the amount of heritage assets previously recognised at cost in Community Assets (a sub-classification of Property, Plant and Equipment) of £245,000. 27. Investment Properties No material items of income and expenditure in relation to investment properties have been accounted for in the Financing and Investment Income and Expenditure line in the CIES.
There are no restrictions on the Council’s ability to realise the value inherent in its investment property or on
the Council’s right to the remittance of income and the proceeds of disposal. The Council has no contractual
obligations to purchase, construct or develop investment property or repairs, maintenance or enhancement.
The following table summarises the movement in the fair value of investment properties over the year:
2010/11 2011/12
£’000 £’000
1,062 Balance at 1 April 1,669
(5) Disposals -
612 Net Gains/(Losses) from Fair Value Adjustments (61)
- Reclassified as Property, Plant and Equipment (118)
1,669 Balance at 31 March 1,490
28. Intangible Assets
The Council accounts for its software as intangible assets, to the extent that the software is not an integral
part of a particular IT system and accounted for as part of the hardware item of Property, Plant and
Equipment. The intangible assets include purchased licenses. The Council does not have any internally
generated software.
All software is given a finite useful life, based on assessments of the period that the software is expected to be of use to the Council. All software suites used by the Council have been assigned a useful life of five years.
The carrying amount of intangible assets is amortised on a straight-line basis. Amortisation of £700,000 was
charged to revenue in 2011/12. Of this, £377,000 was charged directly to the Services that benefited from
the use of the software. The balance of £323,000 was charged to the ICT cost centre and other Central
Services, and has been absorbed as an overhead across all the service headings in the Net Expenditure of
Services. This is included in the table below which shows the amounts charges direct to services and the
amounts reallocated to services through the central administration recharges:

NOTES TO THE FINANCIAL STATEMENTS FOR THE YEAR ENDED 31 MARCH 2012
Page 69 of 162
£'000
Education Services 193
Housing Services 2
HRA 45
Cultural & Related Services 148
Environmental Services 25
Roads & Transport Services 41
Planning & Development Services 19
Social Work 72
Central Services 68
Corporate & Democratic Core 86
Included in Cost of Services 699
Other Operating Expenditure 1
Total Intangibles Amortisation 700
The movement on Intangible Asset balances during the year is as follows:
2010/11 2011/12
£'000 £'000
Balance at start of year:
4,764 - Gross carrying amounts 4,934
(2,074) - Accumulated amortisation (2,903)
2,690 Net Carrying amount at start of the year 2,031
Additions:
171 - Purchases 325
(830) Amortisation for the period (700)
2,031 Net carrying amount at end of year 1,656
Comprising:
4,934 - Gross carrying amounts 5,259
(2,903) - Accumulated amortisation (3,603)
2,031 Net carrying amount at end of year 1,656

NOTES TO THE FINANCIAL STATEMENTS FOR THE YEAR ENDED 31 MARCH 2012
Page 70 of 162
29. Assets Held for Sale
Non-Current Non-Current
2010/11 2011/12
£'000 £'000
1,256 Balance Outstanding at Start of the Year 3,086
Assets Newly Classified as Held for Sale:
1,784 Property, Plant and Equipment 68
(36) Revaluation Losses -
194 Revaluation Gains 73
Assets Declassified as Held for Sale:
- Property, Plant and Equipment (1,008)
(87) Assets Sold (212)
(25) Other Movements 4
3,086 Balance Outstanding at End of the Year 2,011
30. Leases
Council as Lessee Finance Leases The Council has acquired vehicles and plant under finance leases. The assets acquired under these leases are carried as Property, Plant and Equipment in the Balance Sheet at the following net amounts:
Restated 2010/11 2011/12
£'000 £'000
2,611 Property, Plant & Equipment 1,518
2,611 Gross investment in the lease 1,518
The Council is committed to making minimum payments under these leases comprising of settlement of the long-term liability for the interest in the property acquired by the Council and finance costs that will be payable by the Council in future years while the liability remains outstanding. The minimum lease payments are made up of the following amounts:
Restated 2010/11 2011/12
£'000 £'000
Finance lease liabilities (net present value of minimum lease payments):
1,180 Current 868
1,415 Non-current 546
254 Finance costs payable in future years 193
2,849 Minimum Lease Payments 1,607

NOTES TO THE FINANCIAL STATEMENTS FOR THE YEAR ENDED 31 MARCH 2012
Page 71 of 162
Profile of Payment The minimum lease payments will be payable over the following periods:
2010/11 2011/12
£'000 Total Minimum Lease Payment £'000
1,275 Not later than one year 923
1,394 Later than one year and not later than five years 491
180 Later than five years 193
2,849 Minimum Lease Payments 1,607
2010/11 2011/12
£'000 Of Which Finance Lease Liabilities are: £'000
1,180 Not later than one year 868
1,299 Later than one year and not later than five years 436
115 Later than five years 110
2,594 Minimum Lease Payments 1,414
The minimum lease payments do not include rents that are contingent on events taking place after the lease was entered into, such as adjustments following rent reviews. In 2011/12 £3,000 contingent rents were payable by the Council (2010/11 £1,000). Operating Leases The Council has acquired vehicles by entering into operating leases, with typical lives of five to seven years. Additionally the Council leases part of its property portfolio. The future minimum lease payments due under non-cancellable leases in future years are:
Restated 2010/11 2011/12
£'000 £'000
1,093 Not later than one year 652
2,201 Later than one year and not later than five years 2,168
7,725 Later than five years 11,434
11,019 Minimum Lease Payments 14,254
The expenditure charged to the Services occupying or using the assets and is shown across the various lines in the Comprehensive Income and Expenditure Statement. The expenditure during the year in relation to these leases was:
Restated 2010/11 2011/12
£'000 £'000
1,351 Minimum Lease Payment 877
76 Contingent Rentals 22
1,427 Total Operating Lease Expenditure 899

NOTES TO THE FINANCIAL STATEMENTS FOR THE YEAR ENDED 31 MARCH 2012
Page 72 of 162
Council as Lessor Finance Leases The Council has leased out a number of properties on a finance lease basis. The Council has a gross investment in the lease, made up of the minimum lease payments expected to be received over the remaining term and the residual value anticipated for the property when the lease comes to an end. The minimum lease payments comprises of settlement of the long-term debtor for the interest in the property acquired by the lessee and finance income that will be earned by the Council in future years whilst the debtor remains outstanding. The gross investment is made up of the following amounts:
2010/11 2011/12
£'000 £'000
Finance lease debtor (net present value of minimum lease payments):
4 Current 4
692 Non-current 688
2,387 Unearned finance income 4,060
3,083 Gross investment in the lease 4,752
The gross investment in the lease and the minimum lease payments will be received over the following periods:
Gross Investment
in the Lease
Minimum Lease
Payments
Gross Investment
in the Lease
Minimum Lease
Payments
2010/11 2010/11 2011/12 2011/12
£'000 £'000 £'000 £'000
69 69 Not later than one year 90 90
277 277 Later than one year and not later than five years 359 359
2,737 2,737 Later than five years 4,303 4,303
3,083 3,083 Total 4,752 4,752
As there is a possibility that worsening financial circumstances might result in lease payments not being made, the Council has made no specific bad debt provision in relation to finance lease, albeit a general provision is made in relation to this area of the Council’s activity. The minimum lease payments do not include rents that are contingent on events taking place after the lease was entered into, such as adjustments following rent reviews. In 2011/12 £18,000 contingent rents were receivable by the Council (2010/11 £18,000).

NOTES TO THE FINANCIAL STATEMENTS FOR THE YEAR ENDED 31 MARCH 2012
Page 73 of 162
Operating Leases The Council leases out property under operating leases for the following purposes:
for economic development purposes to provide suitable affordable accommodation for local businesses, and
for community activity purposes to provide suitable facilities for local community groups.
The future minimum lease payments receivable under non-cancellable leases in future years are:
Restated 2010/11 2011/12
£'000 £'000
4,384 Not later than one year 3,435
12,506 Later than one year and not later than five years 9,887
24,646 Later than five years 24,155
41,536 Minimum Lease Payments 37,477
In 2011/12 £954,000 contingent rents were receivable by the Council (2010/11 £206,000).
31. Private Finance Initiatives and Similar Contracts
Education PFI Schemes The Council is committed to two PFI contracts. The first contract, which was entered into in 2001, is with Robertson Education (Aberdeenshire) Limited (REAL), a consortium formed by the Robertson Group (Scotland) Limited, to provide Educational services to the Council on four sites in Aberdeenshire until 17 February 2027 under a Private Finance Initiative (PFI) contract. The contract involves: (1) Design, construction and service provision of a new academy at Oldmeldrum. (2) Design, refurbishment and service provision of the Banff Primary School. (3) Design, extension and service provision of Meldrum Primary. (4) Design and construction of a Support for Learners Unit at Banff Academy. The effective date of service commencement for Banff Primary School and Meldrum Primary was 18 February 2002, and the contract will run for 25 years. The effective date of service commencement for the academy at Oldmeldrum was 1 August 2002, and the contract will also terminate on 17 February 2027. In respect of the PFI contract, the Council has leased Banff Primary School, Meldrum Primary School and the Meldrum Academy Site to REAL at a nominal rent.
The second contract, which was entered into in 2004, is with Robertson Education (Aberdeenshire 2) Limited (REAL2) to provide Education services on six sites in Aberdeenshire until 2 October 2030. The contract involves the construction or substantial refurbishment and service provision by the Contractor of educational assets, including primary and secondary schools across six different sites. The contract covers the replacement of Kintore, Rosehearty, Longside and Rothienorman Primary Schools and the building of two new schools; Portlethen Academy and a new Primary School at Banchory. The effective date of service commencement for Longside Primary and Rosehearty Primary was 6 October 2005, for Rothienorman Primary it was 12 December 2005, for Kintore Primary 23 January 2006, Hill of Banchory Primary 26 January 2006, and Portlethen Academy 24 July 2006. The contract will terminate on 2 October 2030. In respect of this second contract, the Council has leased Portlethen Academy and sites at Longside, Rosehearty, Rothienorman and Kintore to REAL2 at a nominal rent.

NOTES TO THE FINANCIAL STATEMENTS FOR THE YEAR ENDED 31 MARCH 2012
Page 74 of 162
The Council has certain exclusive use rights for the use of the schools during school terms. The contract specifies minimum standards for the services to be provided by the contractor, with deductions from the fee payable being made if facilities are unavailable or performance is below the minimum standards. The contractor took on the obligation to construct or refurbish the schools and maintain them in a minimum acceptable condition. The buildings and any plant and equipment installed in them at the end of the contract will be transferred to the Council for nil consideration. The Council only has rights to terminate the contract if it compensates the contractor in full for costs incurred and future profits that would have been generated over the remaining term of the contract or as a result of breach of contract. Property, Plant and Equipment The assets used to provide services at the schools are recognised on the Council’s Balance Sheet. Movements in their value over the year are detailed in the analysis of the movement on the Property, Plant and Equipment balance in Note 22. Payments The Council makes an agreed payment each year which is increased each year by inflation and can be reduced if the contractor fails to meet availability and performance standards in any year but which is otherwise fixed. Payments remaining to be made under the PFI contracts at 31 March 2012 (excluding any estimation of inflation and availability/performance deductions) are as follows:
Operating Interest Contingent Liability Lifecycle Total
Unitary
Costs Charges Rentals Repayment Maintenance Charge
£'000 £'000 £'000 £'000 £'000 £'000
Obligations Payable
2012/13 3,353 3,612 1,050 2,131 800 10,946 Between 2013/14 and 2016/17 14,249 13,239 4,483 7,783 6,730 46,484 Between 2017/18 and 2021/22 19,844 13,367 8,567 14,233 8,693 64,704 Between 2022/23 and 2026/27 21,916 7,345 13,010 22,967 7,155 72,453 Between 2027/28 and 2030/31 12,270 1,034 9,921 10,388 1,895 35,508
Although the payments made to the contractors are described as unitary payments, they have been calculated to compensate the contractors for the fair value of the services they provide, the capital expenditure incurred and interest payable whilst the capital expenditure remains to be reimbursed. The liability outstanding to pay the liability to the contractor for capital expenditure incurred is as follows:
Long Term Total Long Term Total
Creditors Liabilities Liability Creditors Liabilities Liability
2010/11 2010/11 2010/11 2011/12 2011/12 2011/12
£'000 £'000 £'000 £'000 £'000 £'000
(1,563) (59,246) (60,809) Balance Outstanding at Start of Year (1,743) (57,503) (59,246)
- 1,563 1,563 Payments During the Year - 1,743 1,743
(180) 180 - Other Movements (388) 388 -
(1,743) (57,503) (59,246) Balance Outstanding at Year End (2,131) (55,372) (57,503)

NOTES TO THE FINANCIAL STATEMENTS FOR THE YEAR ENDED 31 MARCH 2012
Page 75 of 162
32. Impairment Losses
During 2011/12, the Council has recognised an impairment loss of £14,730,000 in relation to its fixed assets. This is due to downward revaluations (Economic Loss) of £7,077,000 being accounted for and adjusting for capital expenditure amounting to £7,653,000 during the financial year which, although meeting the enhancement definition, added no value (Consumption Loss) to the Council's Balance Sheet. The downward revaluations can be analysed as follows: Property, Plant and Equipment £6,997,000 and Investment Property £80,000. The Impairment Losses all relate to Property, Plant and Equipment. The main reasons for the drop in valuations are changes in construction costs and market conditions, and also some deterioration in the condition of the assets since the previous formal valuations five years ago.
33. Financial Instruments
Categories of Financial Instruments
The following categories of Financial Instruments are carried on the Balance Sheet:
Long-term Current Long-term Current
2010/11 2010/11 2011/12 2011/12
£'000 £'000 £'000 £'000
Investments
- - Loans and receivables - 2,000
- - Total Investments - 2,000
Debtors
2,782 31,900 Loans and receivables 16,163 36,009
- 25,367 Financial assets carried at contract amounts - 54,335
2,782 57,267 Total Debtors 16,163 90,344
Borrowings
(357,068) (26,820) Financial liabilities at amortised cost (400,398) (24,068)
(357,068) (26,820) Total Borrowings (400,398) (24,068)
Other Long Term Liabilities
(61,839) - PFI and finance lease liabilities (58,917) -
(61,839) - Total Other Long Term Liabilities (58,917) -
Creditors
- (78,699) Financial liabilities at amortised cost - (72,303)
- - Financial liabilities carried at contract amounts - -
- (78,699) Total Creditors - (72,303)
Material Soft Loans Made by the Authority
Loan to Aberdeenshire Housing Partnership for the provision of housing in Aberdeenshire.
The interest free loan of £3,750,000 to Aberdeen Housing Partnership to construct, manage, maintain and the general development of new housing for rental or low cost home ownership is deemed to be a material soft loan.
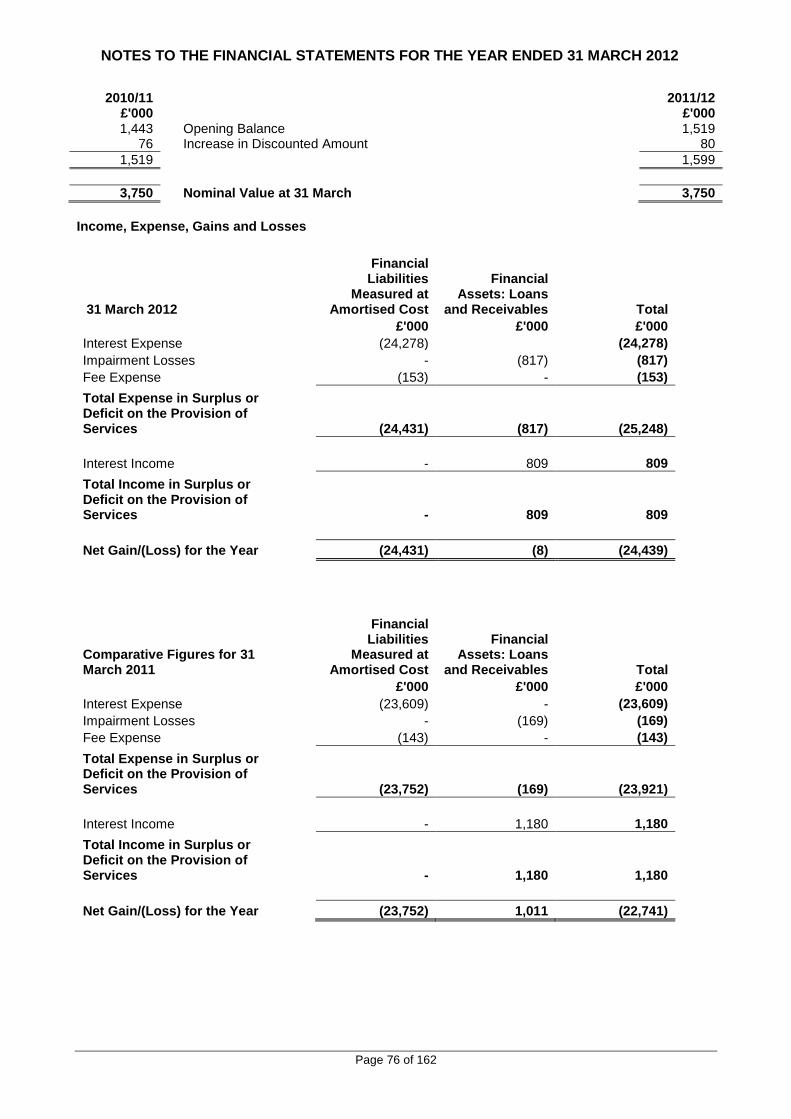
NOTES TO THE FINANCIAL STATEMENTS FOR THE YEAR ENDED 31 MARCH 2012
Page 76 of 162
2010/11 2011/12
£'000 £'000 1,443 Opening Balance 1,519
76 Increase in Discounted Amount 80
1,519 1,599
3,750 Nominal Value at 31 March 3,750
Income, Expense, Gains and Losses
31 March 2012
Financial Liabilities
Measured at Amortised Cost
Financial Assets: Loans
and Receivables Total
£'000 £'000 £'000
Interest Expense (24,278) (24,278)
Impairment Losses - (817) (817)
Fee Expense (153) - (153)
Total Expense in Surplus or Deficit on the Provision of Services (24,431) (817) (25,248)
Interest Income - 809 809
Total Income in Surplus or Deficit on the Provision of Services - 809 809
Net Gain/(Loss) for the Year (24,431) (8) (24,439)
Comparative Figures for 31 March 2011
Financial Liabilities
Measured at Amortised Cost
Financial Assets: Loans
and Receivables Total
£'000 £'000 £'000
Interest Expense (23,609) - (23,609)
Impairment Losses - (169) (169)
Fee Expense (143) - (143)
Total Expense in Surplus or Deficit on the Provision of Services (23,752) (169) (23,921)
Interest Income - 1,180 1,180
Total Income in Surplus or Deficit on the Provision of Services - 1,180 1,180
Net Gain/(Loss) for the Year (23,752) 1,011 (22,741)

NOTES TO THE FINANCIAL STATEMENTS FOR THE YEAR ENDED 31 MARCH 2012
Page 77 of 162
Fair Value of Assets and Liabilities Financial liabilities, financial assets represented by loans and receivables and long term debtors and creditors are carried in the Balance Sheet at amortised cost. Their fair value can be assessed by calculating the present value of the cash flows that will take place over the remaining term of the instruments, using the following assumptions:
estimated ranges of interest rates at 31 March 2012 of 1.28% to 4.42% for loans from the PWLB
and 4.29% to 4.73% for other loans receivable and payable, based on new lending rates for
equivalent loans at that date;
no early repayment or impairment is recognised;
where an instrument will mature in the next 12 months, carrying amount is assumed to
approximate to fair value; and
the fair value of trade and other receivables is taken to be the invoiced or billed amount.
The fair values calculated are as follows:
Carrying Amount
Fair Value
Carrying Amount Fair Value
2010/11 2010/11 2011/12 2011/12
£’000 £’000 £’000 £’000
524,426 568,221 Financial Liabilities 555,840 620,511
- - Long-term creditors - -
524,426 568,221 Total 555,840 620,511
The fair value of the liabilities is higher than the carrying amount because the Council’s portfolio of loans includes a number of fixed rate loans where the interest rate payable is higher than the prevailing rates at the Balance Sheet date. This shows a notional future loss (based on economic conditions at 31 March 2012) arising from a commitment to pay interest to lenders above current market rates.
Carrying Amount
Fair value
Carrying Amount Fair Value
2010/11 2010/11 2011/12 2011/12
£’000 £’000 £’000 £’000
57,267 57,267 Loans and receivables 92,498 92,498
2,782 2,782 Long-term debtors 16,163 16,163
60,049 60,049 Total 108,661 108,661
Short term debtors and creditors are carried at cost as this is a fair approximation of their value. 34. Nature and Extent of Risks Arising from Financial Instruments The Council’s activities expose it to a variety of financial risks:
credit risk – the possibility that other parties might fail to pay amounts due to the Council
liquidity risk – the possibility that the Council might not have funds available to meet its commitments to make payments; and
market risk – the possibility that financial loss might arise for the Council as a result of changes in such measures as interest rates and stock market movements.
The Council’s overall risk management programme focuses on the unpredictability of financial markets and seeks to minimise potential adverse effects on the resources available to fund services. Risk management is carried out by a central treasury team, under policies approved by the Council in the annual treasury management strategy statement. The most recent Treasury Management Strategy document was approved

NOTES TO THE FINANCIAL STATEMENTS FOR THE YEAR ENDED 31 MARCH 2012
Page 78 of 162
by the Council’s Policy and Resources Committee on 23 February 2012. A copy of the report can be found on the Council’s website. The Council provides written principles for overall risk management, as well as written policies covering specific areas, such as interest rate risk, credit risk and the investment of surplus cash. Credit Risk Credit risk arises from deposits with banks and financial institutions, as well as credit exposures to the Council’s customers. This risk is minimised through the Annual Investment Strategy, which requires that deposits are not made with financial institutions unless they are rated independently with a “very small risk” classification, specifically a member of the EU, a rating of P-1 (or better) from Moodys or a rating of F-1 (or better) from Fitch, and has a Moodys Financial Strength Rating of ‘C’ or greater. The Council has a policy of not lending more than £20,000,000 of its surplus balances to only one institution. Customers for goods and services are assessed, taking into account their financial position, past experience and other factors, with individual credit limits being set in accordance with internal ratings in accordance with parameters set by the Council. The Council’s maximum exposure to credit risk in relation to its investments in banks and building societies of £6,600,000 cannot be assessed generally as the risk of any institution failing to make interest payments or repay the principal sum will be specific to each individual institution. Recent experience has shown that it is rare for such entities to be unable to meet their commitments. A risk of irrecoverability applies to all of the Council’s deposits, but there was no evidence at the 31 March 2012 that this was likely to crystallise. The following analysis summarises the Council’s potential maximum exposure to credit risk on other financial assets, based on experience of default and uncollectability over the last five financial years, adjusted to reflect current market conditions.
Debtors as at 31 March
2012
Historical experience
of default
Historical experience
adjusted for market
conditions at 31 March 2012
Estimated maximum
exposure to default and
uncollectability at 31 March 2012
Estimated maximum
exposure at 31 March
2011
£’000 % % £’000 £’000
A B C (A X C)
Customers 9,201 51.67 51.67 4,754 3,371
Housing Rents 1,709 72.56 72.56 1,240 1,204
10,910 54.94 54.94 5,994 4,575
No credit limits were exceeded during the reporting period and the Council does not expect any losses from non-performance by any of its counterparties in relation to deposits and bonds. The past due amount can be analysed by age as follows:
31 March 2011 31 March 2012
£’000 £’000
3,495 Less than Three Months 3,695
618 Three to Six Months 698
798 Six Months to One Year 992
4,161 More than One Year 4,700
9,072 Total 10,085
Liquidity Risk The Council has a comprehensive cash flow management system that seeks to ensure that cash is available as needed. If unexpected movements happen, the Council has ready access to borrowings from the money markets and the Public Works Loans Board. There is no significant risk that it will be unable to raise finance to meet its commitments under financial instruments. Instead, the risk is that the Council will be bound to replenish a significant proportion of its borrowings at a time of unfavourable interest rates. The Council sets

NOTES TO THE FINANCIAL STATEMENTS FOR THE YEAR ENDED 31 MARCH 2012
Page 79 of 162
limits on the proportion of its fixed rate borrowing during specified periods. The strategy is to ensure that not more than 60% of loans are due to mature within any rolling two-year period through a combination of careful planning of new loans taken out and (where it is economic to do so) making early repayments. The maturity analysis of financial liabilities is as follows:
31 March 2011 31 March 2012
£’000 £’000
(26,820) Less than One Year (24,068)
(20,597) Between One and Two Years (625)
(50,473) Between Two and Five Years (94,513)
(285,998) More than Five Years (305,260)
(383,888) Total (424,466)
All trade and other payables are due to be paid in less than one year. Market Risk Interest Rate Risk The Council is exposed to risk in terms of its exposure to interest rate movements on its borrowings and investments. Movements in interest rates have a complex impact on the Council. For instance, a rise in interest rates would have the following effects:
borrowings at variable rates – the interest expense charged to the Surplus or Deficit on the Provision of Services will rise;
borrowings at fixed rates – the fair value of the liabilities borrowings will fall;
investments at variable rates – the interest income credited to the Surplus or Deficit on the Provision of Services will rise;
investments at fixed rates – the fair value of the assets will fall. Borrowings are not carried at fair value, so nominal gains and losses on fixed rate borrowings would not impact on the Surplus of Deficit on the Provision of Services or Other Comprehensive Income and Expenditure. However, changes in interest payable and receivable on variable rate borrowings and investments will be posted to the Surplus or Deficit on the Provision of Services and affect the General Fund Balance. Movements in the fair value of fixed rate investments that have a quoted market price will be reflected in Other Comprehensive Income and Expenditure. The Council has a number of strategies for managing interest rate risk. Policy is to aim to keep a maximum of 30% of its borrowings in variable rate loans. During periods of falling interest rates, and where economic circumstances make it favourable, fixed rate loans will be repaid early to limit exposure to losses. The treasury management team has an active strategy for assessing interest rate exposure that feeds into the setting of the annual budget and which is used to update the budget quarterly during the year. The analysis will also advise whether new borrowing taken out is fixed or variable. According to this assessment strategy, at 31 March 2012, if interest rates had been 1% higher with all other variables held constant, the financial effect would be:
31 March 2012
£’000
Increase in interest receivable on variable rate investments 639
Increase in government grant receivable for financing costs 252
Impact on Surplus or Deficit on the Provision of Services 891
Share of overall impact debited to the HRA 187
Decrease in fair value of fixed rate borrowings liabilities (no impact on the Surplus or Deficit on the Provision of Services or Other Comprehensive Income and Expenditure)
20,292
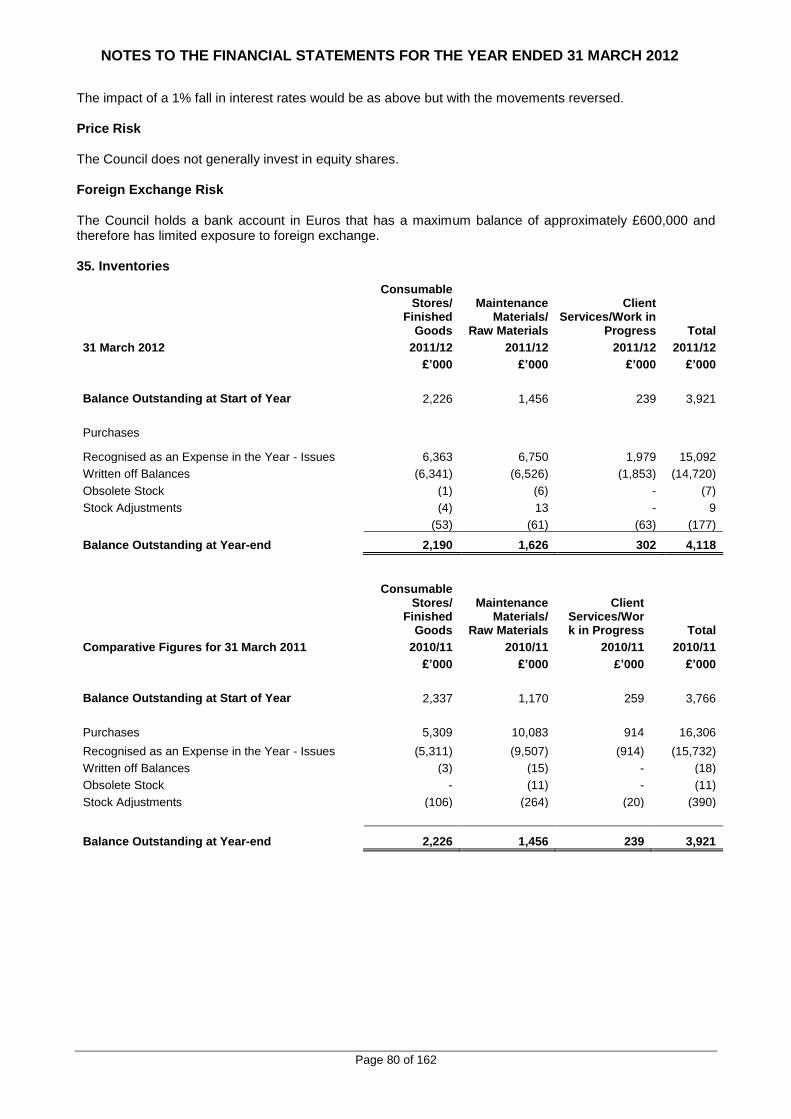
NOTES TO THE FINANCIAL STATEMENTS FOR THE YEAR ENDED 31 MARCH 2012
Page 80 of 162
The impact of a 1% fall in interest rates would be as above but with the movements reversed. Price Risk The Council does not generally invest in equity shares. Foreign Exchange Risk The Council holds a bank account in Euros that has a maximum balance of approximately £600,000 and therefore has limited exposure to foreign exchange. 35. Inventories
Consumable Stores/
Finished Goods
Maintenance Materials/
Raw Materials
Client Services/Work in
Progress Total
31 March 2012 2011/12 2011/12 2011/12 2011/12
£’000 £’000 £’000 £’000
Balance Outstanding at Start of Year 2,226 1,456 239 3,921
Purchases
Recognised as an Expense in the Year - Issues 6,363 6,750 1,979 15,092
Written off Balances (6,341) (6,526) (1,853) (14,720)
Obsolete Stock (1) (6) - (7)
Stock Adjustments (4) 13 - 9
(53) (61) (63) (177)
Balance Outstanding at Year-end 2,190 1,626 302 4,118
Consumable Stores/
Finished Goods
Maintenance Materials/
Raw Materials
Client Services/Work in Progress Total
Comparative Figures for 31 March 2011 2010/11 2010/11 2010/11 2010/11
£’000 £’000 £’000 £’000
Balance Outstanding at Start of Year 2,337 1,170 259 3,766
Purchases 5,309 10,083 914 16,306
Recognised as an Expense in the Year - Issues (5,311) (9,507) (914) (15,732)
Written off Balances (3) (15) - (18)
Obsolete Stock - (11) - (11)
Stock Adjustments (106) (264) (20) (390)
Balance Outstanding at Year-end 2,226 1,456 239 3,921

NOTES TO THE FINANCIAL STATEMENTS FOR THE YEAR ENDED 31 MARCH 2012
Page 81 of 162
36. Debtors Long Term Debtors
Balance Outstanding At 31 March
2010 £’000
Cumulative
Soft Loan Adjustment
2010/11 £’000
Fair Value Amortised
Costs At 31 March
2011 £’000
Enterprise North-East Trust 100 (54) 46 Portlethen Golf Club 318 - 318 Visit Scotland 17 - 17 Aberdeenshire Housing Partnership
3,743
(2,230)
1,513
Cornerstone Community Association
90
-
90
House Loans 131 - 131 Support for Aberdeenshire Business Loans
174
(22)
152
North East Scotland Preservation Trust
22
(22)
-
Leasing 696 - 696 5,291 (2,328) 2,963
Repayments due 2010/11 shown as Current Debtors (181)
Long Term Debtors at 31 March 2011 2,782
Balance Outstanding At 31 March
2011 £’000
Cumulative
Soft Loan Adjustment
2011/12 £’000
Fair Value Amortised
Costs At 31 March
2012 £’000
Enterprise North-East Trust 100 (51) 49 Portlethen Golf Club 311 - 311 Visit Scotland 17 - 17 Aberdeenshire Housing Partnership
3,743
(2,151)
1,592
Cornerstone Community Association
90
-
90
House Loans 118 - 118 Support for Aberdeenshire Business Loans
182
(24)
158
Leasing 692 - 692 Pension Fund - Advance Deficit Payment - 2012-2015
20,963 - 20,963
26,216 (2,226) 23,990
Repayments due 2011/12 shown as Current Debtors (7,827)
Long Term Debtors at 31 March 2012 16,163
Local authorities sometimes make loans for policy reasons that are interest free or below the prevailing market rates. Fair value on loans normally equates to the consideration given however financial instruments accounting requires the fair value to reflect interest lower than the market rate.

NOTES TO THE FINANCIAL STATEMENTS FOR THE YEAR ENDED 31 MARCH 2012
Page 82 of 162
Short Term Debtors
2010/11 2011/12
£’000 £’000
9,379 Central Government Bodies 6,114
747 Other Local Authorities 505
28 NHS Bodies 84
2,075 Public Corporations and Trading Funds 1,800
19,671 Other Entities and Individuals 27,506
31,900 Total Short Term Debtors 36,009
37. Cash and Cash Equivalents The balance of Cash and Cash Equivalents is made up of the following elements:
2010/11 2011/12
£'000 £'000
567 Cash Held by the Council 43
24,800 Bank Current Accounts 14,292
- Short Term Money Market Deposits 40,000
25,367 Total Cash and Cash Equivalents 54,335
38. Creditors Short Term Creditors
2010/11 2011/12
£’000 £’000
(9,611) Central Government Bodies (8,053)
(4,263) Other Local Authorities (6,326)
(1,251) NHS Bodies (1,267)
(1,535) Public Corporations and Trading Funds (1,670)
(62,039) Other Entities and Individuals (54,987)
(78,699) Total Short Term Creditors (72,303)
Other Long Term Liabilities
2010/11 2011/12 Notes
Ref
£’000 £’000
(222,485) Pension Liabilities (248,473) 47
(1,414) Finance Leases (546) 30
(57,502) PFI and PPP (55,372) 31
(281,401) (304,391)
39. Provisions (i) General Provision
Estimates have been made for potential liabilities in relation to the following:
Roads Operations Contracts A provision has been created to provide for the cost of correcting defects on completed contracts within the Roads Operations Trading Account.

NOTES TO THE FINANCIAL STATEMENTS FOR THE YEAR ENDED 31 MARCH 2012
Page 83 of 162
Equal Pay A provision for future action in relation to equal pay has been made in respect of claims for staff who have not yet signed compromise agreements and who have progressed to tribunal claims (see note 12). PFI/PPP Contracts A provision has been made for potential settlements in respect of deductions for non-performance of PFI/PPP contracts. North Sea Regional Advisory Council (NSRAC) A provision has been made to cover the possibility that the Council may be required to meet the accumulated deficit of NSRAC. Older People Residential Care – Redundancy A provision has been made in respect of staff who are to be made redundant. Older People Home Care – Staffing Costs A provision has been made for additional hours worked by staff in the latter half of 2010/11 due to anomalies in the time recording system. Cothrom Supported Accommodation A provision has been made for the Council's share of purchasing 19 houses for use as supported accommodation by people with complex needs. Voluntary Severance A provision has been made to cover potential voluntary severance costs across all services. Janitors Contractual Overtime - Buy Out A provision has been made to cover the costs of buying janitors out of their contractual overtime. Carbon Reduction Commitment Scheme A provision has been made for the retrospective purchase of Carbon Reduction Commitment Allowances.

NOTES TO THE FINANCIAL STATEMENTS FOR THE YEAR ENDED 31 MARCH 2012
Page 84 of 162
Balance at 1 April
2011
Provision Made in
Year
Provision Not
Realised in Year
Provision Utilised in Year
Balance at 31
March 2012
£'000 £'000 £'000 £'000 £'000
Roads Operations (211) (104) 130 8 (177)
Equal Pay (5,114) - 49 - (5,065)
PFI/PPP Non-Performance (1,186) - 236 950 -
NSRAC (100) - - - (100)
Older People - Residential Care (36) (17) - 36 (17)
Older People - Homecare (50) - - 50 -
Cothrom Supported Accommodation - (709) - - (709)
Voluntary Severance (1,565) (2,175) - 1,474 (2,266)
Janitors Contractual Overtime - (278) - - (278)
Carbon Reduction Commitment Scheme - (548) - - (548)
Total (8,262) (3,831) 415 2,518 (9,160)
Provisions anticipated to be utilised within 12 months, shown as current Provisions. 5,128 3,906
Non-Current Provisions at 31 March (3,134) (5,254)
(ii) Debtors Provision
Estimates have been made of possible losses on the non-collection of debts. These estimates have decreased the debtors’ figures in accordance with accounting practice.
General Debtors
Provides for possible losses on debts and loans which the Council considers may not be settled in full.
Revenues
Provides for possible losses on the collection of Community Charge, Council Tax and Business Rates. Housing Rents
Provides for possible losses on housing rents. The tenants’ rent arrears amount to £1,709,000 as at 31 March 2012.
Balance at 31
March 2011
Adjustment to Provision
Made in Year Balance at 31
March 2012
£'000 £'000 £'000
General Debtors (3,458) (781) (4,239)
Revenues (20,928) (1,721) (22,649)
Housing Rents (1,203) (36) (1,239)
Total (25,589) (2,538) (28,127)
40. Grant Income
The Council credited the following grants, contributions and donations to the Comprehensive Income and Expenditure Account in 2011/12:

NOTES TO THE FINANCIAL STATEMENTS FOR THE YEAR ENDED 31 MARCH 2012
Page 85 of 162
Restated
31 March 2011 31 March 2012
£'000 £'000
Credited to Taxation and Non Specific Grant Income
(324,510) Revenue Support Grant (344,291)
(96,407) NDR Receipts From Pool (68,420)
(8,184) Scottish Government General Capital Grant (20,723)
(475) Education - Devolved to Secondary Schools (1,379)
(889) Housing Revenue Account (3,159)
(630) Roads: Structural, Environmental & Safety Maintenance and Routine Repairs (350)
(1,859) Roads and Transport Services - Network and Traffic Management (1,218)
(272) Public Transport (215)
(193) Environment Initiatives (140)
(478) Other Capital Grants (each less than £100,000) (1,044)
(433,897) Total (440,939)
Credited to Services
(1,541) Determined to Succeed -
(657) Youth Music Initiative (441)
(545) Education Maintenance Allowances (424)
(1,203) Active Schools (578)
(130) English For Speakers Of Other Languages (50)
(231) Community Learning & Development Upskilling Project (63)
(317) North East Work Skills Project (150)
(125) Health & Wellbeing (15)
(386) Arts Development (166)
(416) Sports Development (221)
(2,541) Criminal Justice Service Grant (2,531)
(1,078) Alcohol & Drugs Partnership (729)
(336) Prison Welfare (246)
(124) Day Services Project Funding (15)
(103) Early Implementation & Data Collection -
(354) Data Sharing (32)
(238) Telecare -
(251) North Of Scotland Learning Network (22)
(973) Private Sector Housing Grant -
(354) Universal Homes Insulation Scheme (464)
(926) Scottish Rural Development Programme - LEADER (992)
(162) Macduff Property Improvement Zone -
(238) Future Jobs Fund -
- Older People’s Change Fund (992)
- NHS Grampian (1,570)
- Stratmos (142)
(1,432) Nestrans (1,176)
(603) Grampian Police Grant -
(33,771) Council Tax Benefits (34,882)
(8,589) Housing Benefits (8,422)
(1,412) Benefits Administration (1,395)
(699) Other grants (each less than £100,000) (880)
(59,735) Total (56,598)
The Council has received a number of grants, contributions and donations that have yet to be recognised as income as they have conditions attached to them that will require the monies or property to be returned to the funding organisation. The balances at the year-end are as follows:

NOTES TO THE FINANCIAL STATEMENTS FOR THE YEAR ENDED 31 MARCH 2012
Page 86 of 162
Current Liabilities
Revenue Grants Receipts in Advance
31 March 2011 31 March 2012
£’000 £’000
- Deeside Way - Scottish Enterprise (205)
- Banff Renaissance (122)
(64) Other Grants (each less than (£100,000) (77)
(64) Total (404)
Long Term Liabilities
Capital Grants Receipts in Advance
31 March 2011 31 March 2012
£’000 £’000
(12,051) Planning Gain (12,484)
Change Fund – Very Sheltered Housing (350)
(12,051) Total (12,834)
Revenue Grants Receipts in Advance
31 March 2011 31 March 2012
£’000 £’000
(165) Banff Renaissance -
(168) Peterhead Conservation Area Regeneration Scheme -
(147) Deeside Way - Sustrans -
(159) Other Grants (each less than £100,000) -
(639) Total -
41. Usable Reserves Movements in the Council’s usable reserves are detailed in the Movement in Reserves Statement and note 6. 42. Unusable Reserves
31 March 2011 31 March 2012
£’000 £’000
(753,548) Revaluation Reserve (864,426)
- Available for Sale Financial Instruments Reserve -
(631,250) Capital Adjustment Account (605,739)
20,186 Financial Instruments Adjustment Account 19,018
222,485 Pensions Reserve 248,473
16,656 Accumulating Compensated Absences Adjustment Account 10,581
(1,125,471) Total (1,192,093)
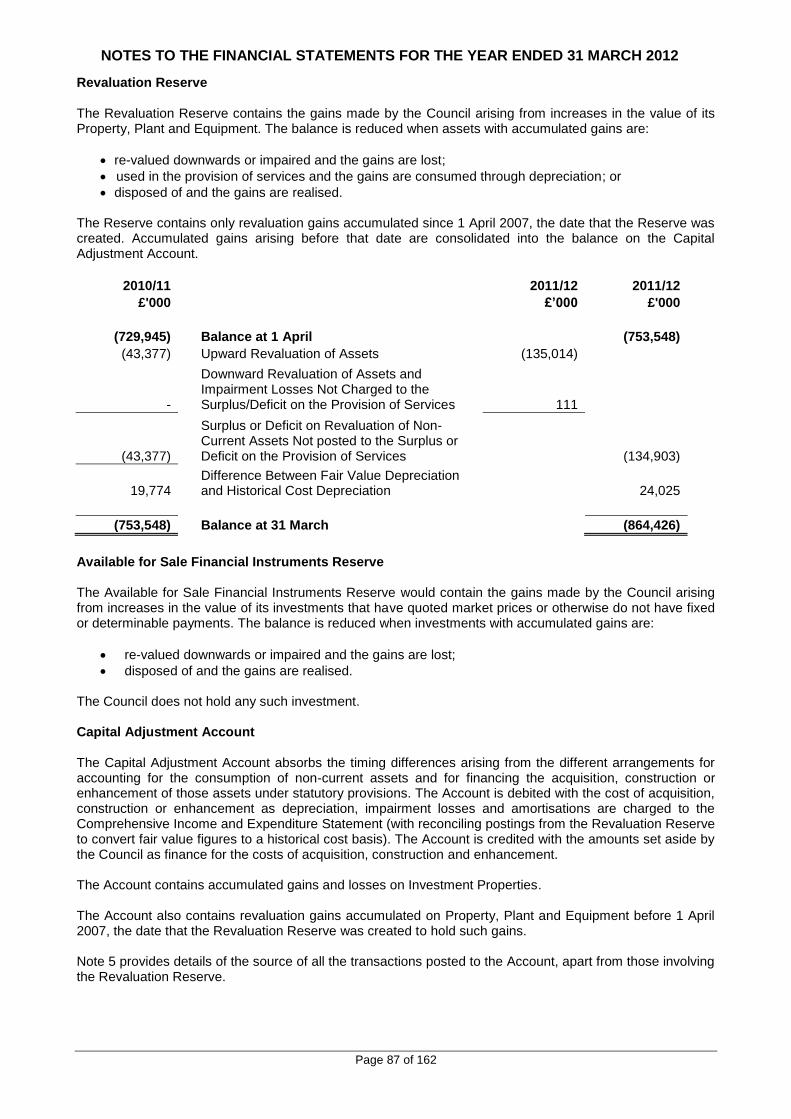
NOTES TO THE FINANCIAL STATEMENTS FOR THE YEAR ENDED 31 MARCH 2012
Page 87 of 162
Revaluation Reserve The Revaluation Reserve contains the gains made by the Council arising from increases in the value of its Property, Plant and Equipment. The balance is reduced when assets with accumulated gains are:
re-valued downwards or impaired and the gains are lost;
used in the provision of services and the gains are consumed through depreciation; or
disposed of and the gains are realised. The Reserve contains only revaluation gains accumulated since 1 April 2007, the date that the Reserve was created. Accumulated gains arising before that date are consolidated into the balance on the Capital Adjustment Account.
2010/11 2011/12 2011/12
£'000 £’000 £'000
(729,945) Balance at 1 April (753,548)
(43,377) Upward Revaluation of Assets (135,014)
-
Downward Revaluation of Assets and Impairment Losses Not Charged to the Surplus/Deficit on the Provision of Services 111
(43,377)
Surplus or Deficit on Revaluation of Non-Current Assets Not posted to the Surplus or Deficit on the Provision of Services (134,903)
19,774 Difference Between Fair Value Depreciation and Historical Cost Depreciation 24,025
(753,548) Balance at 31 March (864,426)
Available for Sale Financial Instruments Reserve The Available for Sale Financial Instruments Reserve would contain the gains made by the Council arising from increases in the value of its investments that have quoted market prices or otherwise do not have fixed or determinable payments. The balance is reduced when investments with accumulated gains are:
re-valued downwards or impaired and the gains are lost;
disposed of and the gains are realised. The Council does not hold any such investment. Capital Adjustment Account The Capital Adjustment Account absorbs the timing differences arising from the different arrangements for accounting for the consumption of non-current assets and for financing the acquisition, construction or enhancement of those assets under statutory provisions. The Account is debited with the cost of acquisition, construction or enhancement as depreciation, impairment losses and amortisations are charged to the Comprehensive Income and Expenditure Statement (with reconciling postings from the Revaluation Reserve to convert fair value figures to a historical cost basis). The Account is credited with the amounts set aside by the Council as finance for the costs of acquisition, construction and enhancement. The Account contains accumulated gains and losses on Investment Properties. The Account also contains revaluation gains accumulated on Property, Plant and Equipment before 1 April 2007, the date that the Revaluation Reserve was created to hold such gains. Note 5 provides details of the source of all the transactions posted to the Account, apart from those involving the Revaluation Reserve.
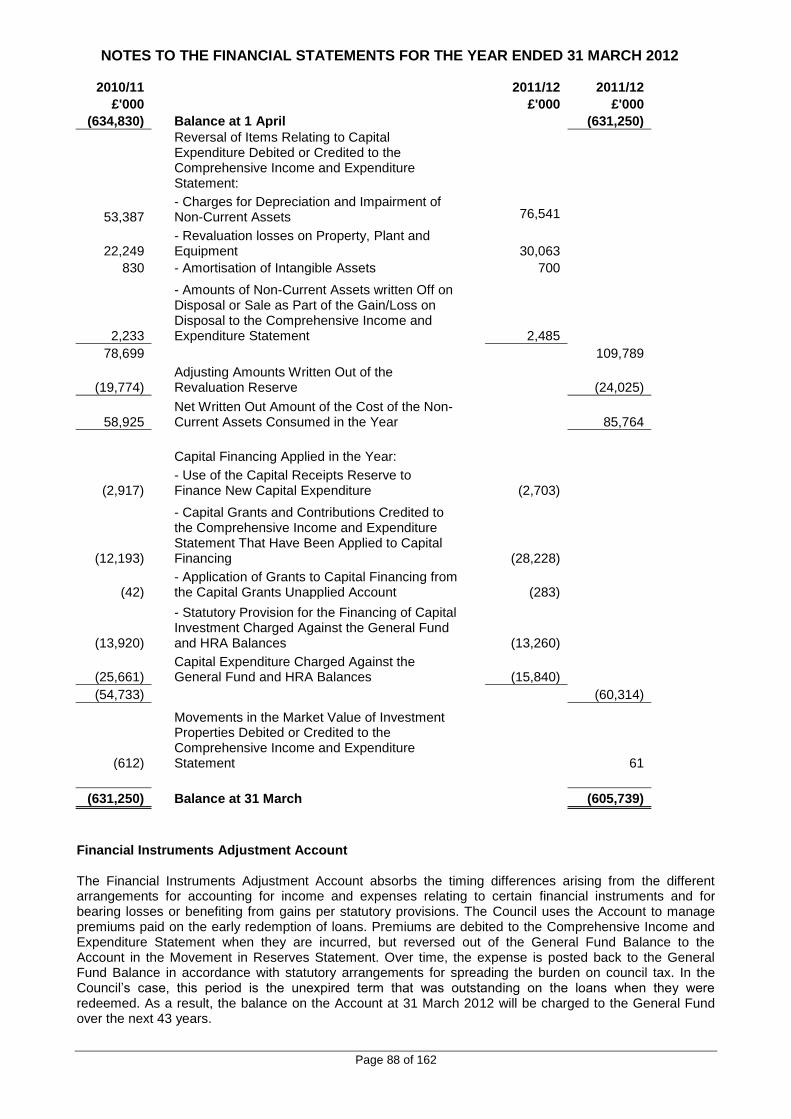
NOTES TO THE FINANCIAL STATEMENTS FOR THE YEAR ENDED 31 MARCH 2012
Page 88 of 162
2010/11 2011/12 2011/12
£'000 £'000 £'000
(634,830) Balance at 1 April (631,250)
Reversal of Items Relating to Capital Expenditure Debited or Credited to the Comprehensive Income and Expenditure Statement:
53,387 - Charges for Depreciation and Impairment of Non-Current Assets
76,541
22,249 - Revaluation losses on Property, Plant and Equipment 30,063
830 - Amortisation of Intangible Assets 700
2,233
- Amounts of Non-Current Assets written Off on Disposal or Sale as Part of the Gain/Loss on Disposal to the Comprehensive Income and Expenditure Statement 2,485
78,699 109,789
(19,774) Adjusting Amounts Written Out of the Revaluation Reserve (24,025)
58,925 Net Written Out Amount of the Cost of the Non-Current Assets Consumed in the Year 85,764
Capital Financing Applied in the Year:
(2,917) - Use of the Capital Receipts Reserve to Finance New Capital Expenditure (2,703)
(12,193)
- Capital Grants and Contributions Credited to the Comprehensive Income and Expenditure Statement That Have Been Applied to Capital Financing (28,228)
(42) - Application of Grants to Capital Financing from the Capital Grants Unapplied Account (283)
(13,920)
- Statutory Provision for the Financing of Capital Investment Charged Against the General Fund and HRA Balances (13,260)
(25,661) Capital Expenditure Charged Against the General Fund and HRA Balances (15,840)
(54,733) (60,314)
(612)
Movements in the Market Value of Investment Properties Debited or Credited to the Comprehensive Income and Expenditure Statement 61
(631,250) Balance at 31 March (605,739)
Financial Instruments Adjustment Account The Financial Instruments Adjustment Account absorbs the timing differences arising from the different arrangements for accounting for income and expenses relating to certain financial instruments and for bearing losses or benefiting from gains per statutory provisions. The Council uses the Account to manage premiums paid on the early redemption of loans. Premiums are debited to the Comprehensive Income and Expenditure Statement when they are incurred, but reversed out of the General Fund Balance to the Account in the Movement in Reserves Statement. Over time, the expense is posted back to the General Fund Balance in accordance with statutory arrangements for spreading the burden on council tax. In the Council’s case, this period is the unexpired term that was outstanding on the loans when they were redeemed. As a result, the balance on the Account at 31 March 2012 will be charged to the General Fund over the next 43 years.
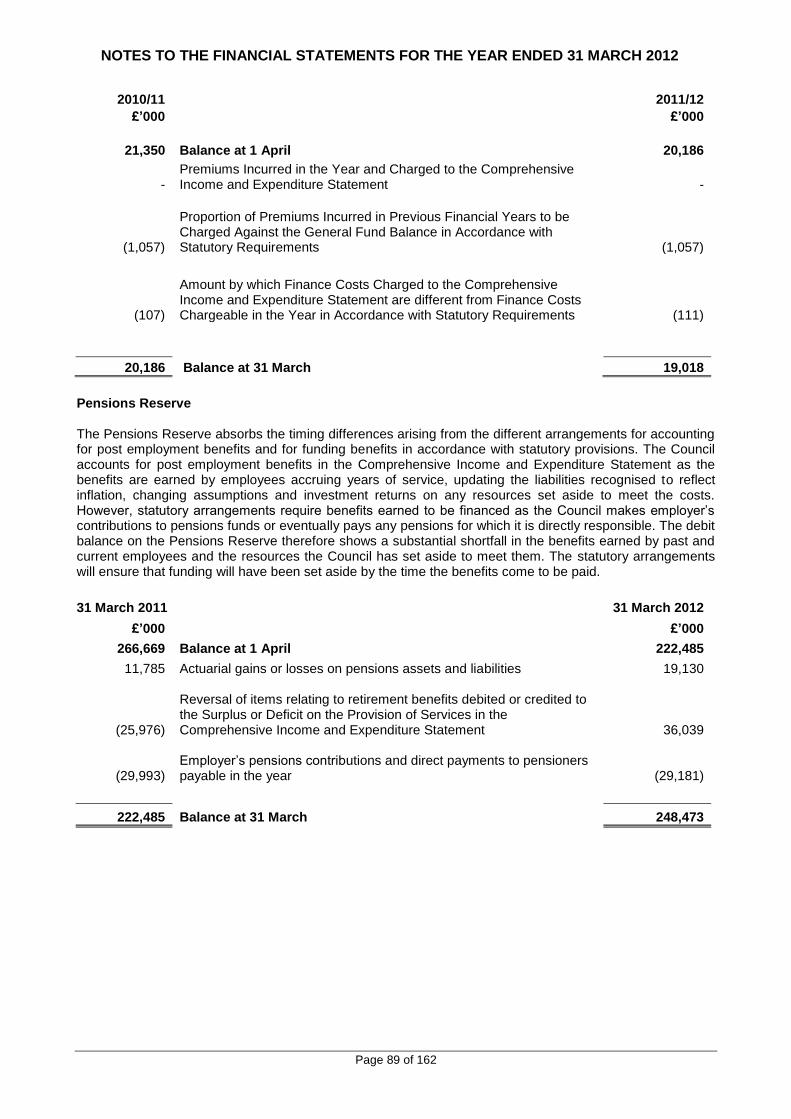
NOTES TO THE FINANCIAL STATEMENTS FOR THE YEAR ENDED 31 MARCH 2012
Page 89 of 162
2010/11 2011/12
£’000 £’000
21,350 Balance at 1 April 20,186
- Premiums Incurred in the Year and Charged to the Comprehensive Income and Expenditure Statement -
(1,057)
Proportion of Premiums Incurred in Previous Financial Years to be Charged Against the General Fund Balance in Accordance with Statutory Requirements (1,057)
(107)
Amount by which Finance Costs Charged to the Comprehensive Income and Expenditure Statement are different from Finance Costs Chargeable in the Year in Accordance with Statutory Requirements (111)
20,186 Balance at 31 March 19,018
Pensions Reserve The Pensions Reserve absorbs the timing differences arising from the different arrangements for accounting for post employment benefits and for funding benefits in accordance with statutory provisions. The Council accounts for post employment benefits in the Comprehensive Income and Expenditure Statement as the benefits are earned by employees accruing years of service, updating the liabilities recognised to reflect inflation, changing assumptions and investment returns on any resources set aside to meet the costs. However, statutory arrangements require benefits earned to be financed as the Council makes employer’s contributions to pensions funds or eventually pays any pensions for which it is directly responsible. The debit balance on the Pensions Reserve therefore shows a substantial shortfall in the benefits earned by past and current employees and the resources the Council has set aside to meet them. The statutory arrangements will ensure that funding will have been set aside by the time the benefits come to be paid.
31 March 2011 31 March 2012
£’000 £’000
266,669 Balance at 1 April 222,485
11,785 Actuarial gains or losses on pensions assets and liabilities 19,130
(25,976)
Reversal of items relating to retirement benefits debited or credited to the Surplus or Deficit on the Provision of Services in the Comprehensive Income and Expenditure Statement
36,039
(29,993)
Employer’s pensions contributions and direct payments to pensioners payable in the year (29,181)
222,485 Balance at 31 March 248,473

NOTES TO THE FINANCIAL STATEMENTS FOR THE YEAR ENDED 31 MARCH 2012
Page 90 of 162
Accumulating Compensated Absences Adjustment Account The Accumulating Compensated Absences Adjustment Account absorbs the differences that would otherwise arise on the General Fund Balance from accruing for compensated absences earned but not taken in the year. Statutory arrangements require that the impact on the General Fund Balance is neutralised by transfers to or from the Account.
2010/11 2011/12 2011/12
£’000 £’000 £’000
10,709 Balance at 1 April 16,656
(10,709) Settlement or cancellation of accrual made at the end of the preceding year (16,656)
16,656 Amounts accrued at the end of the current year 10,581
5,947
Amount by which officer remuneration charged to the Comprehensive Income and Expenditure Statement on an accruals basis is different from remuneration chargeable in the year in accordance with statutory requirements (6,075)
16,656 Balance at 31 March 10,581
43. Events after the Balance Sheet Date The unaudited accounts were issued on 18 June 2012, and the audited accounts were authorised for issue on 19 September 2012 by Alan Wood, MA (Hons), CPFA, Head of Finance, who is the proper officer of the Council in accordance with Section 95 of the Local Government (Scotland) Act 1973. Where events taking place before the balance sheet date provided information about conditions existing at 31 March 2012, the figures in the financial statements and notes have been adjusted in all material respects to reflect the impact of this information. The Police and Fire Reform (Scotland) Act 2012 received royal assent on 7 August 2012. Responsibility for Police and Fire and Rescue Services will transfer from local government to new central government bodies on 1 April 2013. The full impact of the reform process is being assessed currently. There have been no material events since the date of the balance sheet which necessitate the revision of the figures in the financial statements or notes thereto including contingent assets and liabilities. 44. Contingent Liabilities Landfill Allowances Trading Scheme
The Landfill Allowances Trading Scheme (LATS) is currently under review and the Scottish Government has suspended penalties and trading under the scheme since October 2008 pending the review’s outcome. The Council has exceeded its allowances in each of the financial years from 2006/07 to 2011/12 as shown below:
Excess over
allowance
Potential Penalty 2006/07 7,159 £25 per tonne 2007/08 6,872 £50 per tonne 2008/09 12,614 £150 per tonne 2009/10 10,947 £150 per tonne 2010/11 15,020 £150 per tonne 2011/12 20,322 £150 per tonne
In total, the potential penalty that could be applied to the Council is £9,358,000.

NOTES TO THE FINANCIAL STATEMENTS FOR THE YEAR ENDED 31 MARCH 2012
Page 91 of 162
Scheme of Arrangement - Insurance Municipal Mutual Insurance Company (MMI) was the main local authority insurer for many years up until 1992 when the company failed and went into “run-off”. The Scheme of Arrangement was approved in 1994 with the aim of meeting all claims and achieving a solvent run-off. For a number of years the Administration and Creditors Committee reported that a solvent run-off was likely to be achieved and sought to sell the business to another insurer to bring the arrangement to a conclusion. Unfortunately a sale has never been achieved and more recently claims have emerged where courts have ruled in favour of others rather than MMI. This has increased the risk that a solvent run-off will not be achieved. If that were to be the case, councils (and others, such as housing associations) would be liable to clawback of monies paid out to settle claims. The main areas for claims that have arisen since the demise of MMI relate to asbestos. The company lost its appeal to the Supreme Court in March 2012 in relation liability in this area. There is now an increased likelihood that under the Scheme of Arrangement a clawback of monies from the Council will occur. The Board of Directors of MMI are currently examining the implication of the Supreme Court ruling. There is no action the Council can take to improve its position. As the Council is committed to make these payments in the event of an insolvent run off, the matter should be included as a contingent liability within the accounts as presently an obligation exists as a result of a past event but it is not presently possible to determine if a transfer of economic benefit is required and consequently a reliable estimate cannot be formed. 45. Contingent Assets The Council is pursuing the potential recovery of VAT and Landfill Tax overpayments in relation to previous years, resulting from challenges to existing legislation. 46. Pensions Schemes Accounted for as Defined Contribution Schemes Teachers employed by the Council are entitled to be members of the Scottish Teachers’ Pension Scheme, which is administered by the Scottish Government. The Scheme provides teachers with specified benefits upon their retirement, and the Council contributes towards the costs by making contributions based on a percentage of members’ pensionable salaries. The scheme is technically a defined benefit scheme. However, the Scheme is unfunded and the Scottish Government uses a notional fund as the basis for calculating the employers’ contribution rate paid by Local Authorities. The Council is not able to identify its share of underlying financial position and performance of the Scheme with sufficient reliability for accounting purposes. For the purposes of this Statement of Accounts, it is therefore accounted for on the same basis as a defined contribution scheme. In 2011/12, the Council paid £14,700,000 to the Scottish Government in respect of teachers’ retirement benefits representing 14.90% of pensionable pay. The figures for 2010/11 were £15,133,000 and 14.90%. In addition, the council is responsible for all pension payments related to “added years” it has awarded, together with related increases. These amounted to £61,000 or 0.06% of pensionable pay. The figures for 2010/11 were £74,000 and 0.07%. Contributions of £1,848,000 remained payable at the year end. The Council is responsible for the costs of any additional benefits awarded upon early retirement outside the terms of the teachers’ scheme. These costs are accounted for on a defined benefit basis and detailed in note 47. 47. Defined Benefit Pension Schemes Participation in Pensions Schemes
As part of the terms and conditions of employment of its officers and other employees, the Council makes contributions towards the cost of post employment benefits. Although these benefits will not actually be payable until employees retire, the Council has a commitment to make the payments that needs to be disclosed at the time that employees earn their future entitlement.

NOTES TO THE FINANCIAL STATEMENTS FOR THE YEAR ENDED 31 MARCH 2012
Page 92 of 162
The Council participates in two post employment schemes:
the North East Scotland Pension Fund, administered by Aberdeen City Council. All employees, with the main exception of teachers, are eligible to join this scheme, subject to certain qualifying criteria. This is a funded defined benefit final salary scheme, which means that the Council and employees pay contributions into a fund, calculated at a level intended to balance the pensions liabilities with investment assets. The Council has discretion to award additional post employment benefits upon early retirement. This is an unfunded defined benefit arrangement, under which liabilities are recognised when awards are made. However, there are no investment assets built up to meet these pension liabilities, and cash has to be generated to meet actual pension payments as they fall due; and
the Teachers’ Pension Scheme, which is administered by the Scottish Government. This scheme meets the definition of a defined benefit scheme, but it is accounted for on the same basis as a defined contribution scheme as described in note 46.
Transactions Relating to Post-employment Benefits The Council recognises the cost of retirement benefits in the reported cost of services when they are earned by employees, rather than when the benefits are eventually paid as pensions. However, the charge the Council is required to make against council tax is based on the cash payable in the year, so the real cost of post employment benefits is reversed out in the General Fund via the Movement in Reserves Statement. The following transactions have been made in the Comprehensive Income and Expenditure Statement and the General Fund Balance via the Movement in Reserves Statement during the year:

NOTES TO THE FINANCIAL STATEMENTS FOR THE YEAR ENDED 31 MARCH 2012
Page 93 of 162
Teachers Additional Unfunded Pensions
Teachers Additional Unfunded Pensions
North East Scotland Pension
Fund
North East Scotland Pension
Fund
Total 2010/11
Total
2011/12 Comprehensive Income and Expenditure Statement
£’000 £’000 £’000 £’000 £’000 £’000
Cost of Services:
27,523 - 27,523 - Current Service Cost 30,221 - 30,221
(61,694) (949) (62,643) - Past Service Costs 52 - 52
955 775 1,730 - Settlements and Curtailments 3,288 - 3,288
Financing and Investment Income and Expenditure:
50,801 842 51,643 - Interest Cost 52,616 851 53,467
(44,229) - (44,229) - Expected Return on Scheme Assets (50,989) - (50,989)
(26,644) 668 (25,976) Total Post Employment Benefit Charged to the Surplus or Deficit on the Provision of Services 35,188 851 36,039
Other Post Employment Benefit Charged to the Comprehensive Income and Expenditure Statement
10,907 878 11,785 - Actuarial Gains and Losses 18,459 671 19,130
(15,737) 1,546 (14,191) Total Post Employment Benefit Charged to the Comprehensive Income and Expenditure Statement 53,647 1,522 55,169
Movement in Reserves Statement
26,644 (668) 25,976
Reversal of Net Charges Made to the Surplus or Deficit for the Provision of Services for Post Employment Benefits in Accordance with the Code (35,188) (851) (36,039)
Actual amount charged against the General Fund Balance for pensions in the year:
28,833 Employers' Contributions Payable to the Scheme 28,150
1,160 Retirement Benefits Payable to Pensioners 1,031

NOTES TO THE FINANCIAL STATEMENTS FOR THE YEAR ENDED 31 MARCH 2012
Page 94 of 162
The cumulative amount of actuarial gains and losses recognised in the Comprehensive Income and Expenditure Statement to 31 March 2012 is a loss of £248,914,000. Contributions of £2,914,000 remained payable at the year end. Assets and Liabilities in Relation to Post-employment Benefits Reconciliation of present value of the scheme liabilities (defined benefit obligation):

NOTES TO THE FINANCIAL STATEMENTS FOR THE YEAR ENDED 31 MARCH 2012
Page 95 of 162
North East Scotland Pension Fund
Teachers Additional Unfunded Pensions
North East Scotland Pension Fund
Teachers Additional Unfunded Pensions
Funded Benefits
Unfunded Benefits
Total 2010/11
Funded Benefits
Unfunded Benefits
Total 2011/12
£’000 £’000 £’000 £’000 £’000 £’000 £’000 £’000
865,889 23,790 15,892 905,571 Opening Balance at 1 April 926,343 23,439 16,278 966,060
27,523 - - 27,523 Current Service Cost 30,221 - - 30,221
49,508 1,293 842 51,643 Interest Cost 51,371 1,245 851 53,467
8,839 - - 8,839 Contributions by Scheme Participants 8,464 - - 8,464
34,501 576 878 35,955 Actuarial (Gains)/Losses (115,816) 4,267 671 (110,878)
- (1,398) (1,160) (2,558) Benefits Paid (23,327) (1,595) (1,031) (25,953)
(60,310) (1,384) (949) (62,643) Past Service Cost 52 - - 52
393 562 775 1,730 Curtailments 3,288 - - 3,288
926,343 23,439 16,278 966,060 Closing Balance at 31 March 880,596 27,356 16,769 924,721
Reconciliation of fair value of the scheme (plan) assets:
North East Scotland Pension Fund
Teachers Additional Unfunded Pensions
North East Scotland Pension Fund
Teachers Additional Unfunded Pensions
Funded Benefits
Unfunded Benefits
Total 2010/11
Funded Benefits
Unfunded Benefits
Total 2011/12
£’000 £’000 £’000 £’000 £’000 £’000 £’000 £’000
638,902 - - 638,902 Opening Balance at 1 April 743,575 - - 743,575
44,229 - - 44,229 Expected Rate of Return 50,989 - - 50,989
24,170 - - 24,170 Actuarial Gains and Losses (150,971) - - (150,971)
27,435 1,398 1,160 29,993 Employer Contributions 47,518 1,595 1,031 50,144
8,839 - - 8,839 Contributions by Scheme Participants 8,464 - - 8,464
- (1,398) (1,160) (2,558) Benefits Paid (23,327) (1,595) (1,031) (25,953)
743,575 - - 743,575 Closing Balance at 31 March 676,248 - - 676,248

NOTES TO THE FINANCIAL STATEMENTS FOR THE YEAR ENDED 31 MARCH 2012
Page 96 of 162
The expected return on scheme assets is determined by considering the expected returns available on the assets underlying the current investment policy. Expected yields on fixed interest investments are based on gross redemption yields as at the Balance Sheet date. Expected returns on equity investments reflect long-term real rates of return experienced in the respective markets. The actual return on scheme assets in the year was £9,753,000 (2010/11 £68,399,000). In the UK budget statement on 22 June 2010 the Chancellor of the Exchequer announced that with effect from 1 April 2011 public service pensions would be increased in line with CPI rather than RPI. This had the effect of reducing the Council’s liabilities in North East Scotland Pension Fund by £62,005,000 in 2010/11 and was recognised as a past service gain in accordance with guidance set down in UITF Abstract 48, since the change was considered to be a change in benefit entitlement. There was no impact upon either the General Fund or Housing Revenue Account. Scheme History
2007/08 2008/09 2009/10 2010/11 2011/12
£’000 £’000 £’000 £’000 £’000
Present Value of Liabilities:
Local Government Pension Scheme (698,849) (590,656) (865,889) (926,343)
(880,596)
Unfunded Benefits (21,371) (18,181) (23,790) (23,439) (27,356)
Teachers Pension Scheme (14,307) (13,076) (15,892) (16,278) (16,769)
Fair Value of Assets:
Local Government Pension Scheme 565,690 431,181 638,902 743,575
676,248
Surplus/(Deficit) in the Scheme:
Local Government Pension Scheme (133,159) (159,175) (226,987) (182,768)
(204,348)
Unfunded Benefits (21,371) (18,181) (23,790) (23,439) (27,356)
Teachers Pension Scheme (14,307) (13,076) (15,892) (16,278) (16,769)
Total (168,837) (190,432) (266,669) (222,485) (248,473)
The liabilities show the underlying commitments that the Council has in the long run to pay post-employment benefits. The total liability of £248,473,000 has a substantial impact on the net worth of the Council as recorded in the Balance Sheet, resulting in a reduced overall balance of £1,259,295.000. However, statutory arrangements for funding the deficit mean that the financial position of the Council remains healthy. The deficit on the local government scheme will be made good by increased contributions over the remaining working life of employees (i.e. before payments fall due), as assessed by the scheme actuary. The Council’s contribution rate over the accounting period was 19.3% of members’ contributions. The rate of employer contributions as a percentage of pensionable pay for 2012/13, 2013/14 and 2014/15 is 14.4%. This reflects a reduction of 4.9% following a capitalised payment made in March 2012 in relation to deficit contributions. The total contributions expected to be made to the Local Government Pension Scheme by the council in the year to 31 March 2013 is £21,416,000. Basis for Estimating Assets and Liabilities Liabilities have been assessed on an actuarial basis using the projected unit credit method, an estimate of the pensions that will be payable in future years dependent on assumptions about mortality rates, salary levels, etc. The Scheme has been assessed by Mercer Limited, an independent firm of actuaries, estimates for the Fund being based on the latest full valuation of the scheme as at 1 April 2011. The next triennial valuation will be based on the Fund as at 31 March 2014.

NOTES TO THE FINANCIAL STATEMENTS FOR THE YEAR ENDED 31 MARCH 2012
Page 97 of 162
The principal assumptions used by the actuary have been:
North East Scotland Pension Fund
Teachers Additional Unfunded Pensions
North East Scotland Pension Fund
Teachers Additional Unfunded Pensions
Funded Benefits
Unfunded Benefits
Funded Benefits
Unfunded Benefits
2010/11 2010/11 2010/11 2011/12 2011/12 2011/12
Long-term expected rate of return on assets in the scheme:
7.50% - - Equities 7.00% - -
4.40% - - Government Bonds 3.10% - -
5.10% - - Other Bonds 4.10% - -
6.50% - - Property 6.00% - -
0.50% - - Cash/Liquidity 0.50% - -
7.50% - - Other 7.00% - -
Mortality Assumptions:
Longevity at 65 for Current Pensioners:
22.2 22.2 21.3 Men 22.3 22.3 22.3
24.2 24.2 24.2 Women 25.3 25.3 25.3
Longevity at 65 for Future Pensioners:
23.2 - - Men 24.6 - -
25.1 - - Women 27.7 - -
2.90% 2.90% 2.80% Rate of Inflation 2.50% 2.50% 2.30%
5.15% - - Rate of Increase in Salaries 4.25% - -
2.90% 2.90% 2.80% Rate of Increase in Pensions 2.50% 2.50% 2.30%
5.50% 5.50% 5.40% Rate for Discounting Scheme Liabilities 4.90% 4.90% 4.60%
50.00% - - Take-up of Option to Convert Annual Lump Sum Pension into Retirement Lump Sum 50.00% - -

NOTES TO THE FINANCIAL STATEMENTS FOR THE YEAR ENDED 31 MARCH 2012
Page 98 of 162
The North East Scotland Pension Fund’s assets consist of the following categories, by proportion of the total assets held:
2010/11 2011/12
79.60% Equities 81.50%
4.80% Government Bonds 7.00%
3.00% Other Bonds 2.90%
5.60% Property 6.40%
2.70% Cash/Liquidity 2.20%
4.30% Other 0.00% History of Experience Gains and Losses The actuarial gains identified as movements on the Pensions Reserve in 2011/12 can be analysed into the following categories, measured as a percentage of assets or liabilities at 31 March 2012:
2007/08 2008/09 2009/10 2010/11 2011/12
Differences between the expected and actual return on assets 9.6% 47.8% 22.4% 3.3%
22.3%
Experience gains and losses on liabilities 0.3% 6.7% 0.0% 0.0%
14.4% Joint Boards Local Government legislation provides that local authorities have an obligation to meet the expenditure of the Joint Boards of which they are constituent members. As a consequence, the Council has the following additional liabilities arising from the pension deficits:
2010/11 2010/11
2010/11 Aberdeenshire 2010/11 Aberdeenshire
Total Share Total Share
£’000 £’000 £’000 £’000
157,440 53,530 Grampian Joint Fire and Rescue Board 164,594 55,962
680,188 244,868 Grampian Joint Police Board 714,343 257,163
4,104 1,806 Grampian Valuation Joint Board 5,137 2,260
Further information regarding these deficits can be found in the annual report and accounts of the relevant bodies. 48. Related Parties The Council is required to disclose material transactions with related parties – bodies or individuals that have the potential to control or influence the council or to be controlled or influenced by the Council. Disclosure of these transactions allows readers to assess the extent to which the council might have been constrained in its ability to operate independently or might have secured the ability to limit another party’s ability to bargain freely with the Council.

NOTES TO THE FINANCIAL STATEMENTS FOR THE YEAR ENDED 31 MARCH 2012
Page 99 of 162
Scottish Government The Scottish Government has effective control over the general operations of the Council – it is responsible for providing the statutory framework within which the Council operates, provides the majority of its funding in the form of grants and prescribes the terms of many of the transactions that the Council has with other parties (e.g. council tax bills, housing benefits). Grants received from the Scottish Government are set out in the subjective analysis in Note 7 on reporting for resources allocation decisions. Grant receipts outstanding at 31 March 2012 are shown in Note 40. Councillors Councillors have direct control over the Council’s financial and operating policies. The total of Councillors’ allowances paid in 2011/12 is shown in the Remuneration Report. During 2011/12, works and services to the value of £2,108,000 were commissioned from companies in which 15 Councillors’ had an interest (2010/11 £2,526,000 and 20 Councillors). Contracts were entered into in full compliance with the Council’s standing orders. In addition Grants totalling £399,000 to voluntary organisations in which 12 Councillors had positions on the governing body (2010/11 £345,000 and 13 Councillors). In all instances, the grants were made with proper consideration of declarations of interest. The relevant Councillors did not take part in any discussion or decision relating to the grants. Details of all these transactions are recorded in the Register of Councillors’ Interest, open to public inspection at Woodhill House Reception, Westburn Road, Aberdeen. AB16 5GB during office hours or is available on the Council’s website (http://www.aberdeenshire.gov.uk/councillors/RegisterofMembersInterests-Amended230412.pdf) Officers – Key Management Personnel The salaries of the Key Management Personnel of the Council are disclosed in the Council’s Remuneration report on pages 143 - 153. These officers have responsibility for planning, directing and controlling the activities of the Council. Their scope of influence is determined by the Scheme of Delegation and Financial Regulations. On this basis the Council is satisfied that appropriate controls are in place to manage and monitor the influence of the Council’s Key Management Personnel. Other Public Bodies [Subject to Common Control by Central Government] Under the terms of the Community Care & Health Act 2002, the Council has an arrangement with NHS Grampian to deliver fully integrated health, housing and social care services. Transactions and balances outstanding are detailed in Note 15. Grampian Joint Police Board Grampian Joint Police Board was created by a statutory instrument and administers the policing provision for the local government areas of Aberdeen City, Aberdeenshire and Moray Councils. Six of the fifteen members of the Board are appointed by Aberdeenshire Council, and are Councillors. For the year ended 31 March 2012, the total comprehensive income and expenditure statement shows a deficit of £33,831,000 (2010/11 £30,230,000 surplus) and the net liabilities were £701,037,000 (2010/11 £668,459,000). The Board is funded by requisitions from the three Councils and 36% of the financial results of the Board are incorporated in the Group Accounts as an Associate. The Council paid a requisition of £16,111,000 (2010/11 £16,772,000), anti-social behaviour funding of £221,000 (2010/11 £253,000) and a capital grant of £608,000 (2010/11 £603,000). A copy of the accounts can be obtained from Grampian Joint Police Board, Grampian Police Headquarters, Queen Street, Aberdeen, AB10 1ZA. Grampian Joint Fire and Rescue Board Grampian Joint Fire and Rescue Board was created by a statutory instrument and administers the fire and rescue services for the local government areas of Aberdeen City, Aberdeenshire and Moray Councils. Six of the fifteen members of the Board are appointed by Aberdeenshire Council, and are Councillors. For the year ended 31 March 2012, the total comprehensive income and expenditure statement shows a deficit of £8,603,000 (2010/11 £8,441,000 surplus) and the net liabilities were £120,908,000 (2010/11 £111,303,000). The Board is funded by requisitions from the three Councils and 34% of the financial results of the Board are incorporated in the Group Accounts as an Associate. The Council paid a requisition of £7,969,000 (2010/11 £8,827,000). A copy of the accounts can be obtained from Grampian Fire and Rescue Service, 19 North Anderson Drive, Aberdeen, AB15 6DW.

NOTES TO THE FINANCIAL STATEMENTS FOR THE YEAR ENDED 31 MARCH 2012
Page 100 of 162
Grampian Valuation Joint Board
Grampian Valuation Joint Board was created by Aberdeen City, Aberdeenshire and Moray Councils to administer the register of electors and the valuation of land and properties for Council Tax and Business Rate purposes across their local government areas. Six of the fifteen members of the Board are appointed by Aberdeenshire Council, and are Councillors. For the year ended 31 March 2012, the total comprehensive income and expenditure statement shows a deficit of £994,000 (2010/11 £1,341,000 surplus) and the net liabilities were £4,221,000 (2010/11 £3,227,000). The Board is funded by requisitions from the three Councils and 44% of the financial results of the Board are incorporated in the Group Accounts as an Associate. The Council paid a requisition of £1,674,000 (2010/11 £1,741,000) in 2011/12. A copy of the accounts can be obtained from The Treasurer, Grampian Valuation Joint Board, c/o Moray Council, Council Offices, High Street, Elgin, IV20 1BX.
North East of Scotland Transport Partnership (Nestrans)
Nestrans was created under the Transport (Scotland) Act 2005 by the Scottish Executive. The Partnership aims to develop and deliver a long-term regional transport strategy and take forward strategic transport improvements that support and improve the economy, environment and quality of life across Aberdeen City and Shire. Four of the twelve Board members are appointed by Aberdeenshire Council, and are Councillors. For the year ended 31 March 2012, the total comprehensive income and expenditure statement was £2,000 (2010/11 nil) and the net assets were £6,000 (2010/11 nil). The two Councils fund the Partnership and 50% of the financial results are incorporated in the Group Accounts as an Associate. The Council paid a requisition of £13,000 (2010/11 £60,000) and provided capital funding of £1,172,000 in (2010/11 £1,432,000). A copy of the accounts can be obtained from the Head of Finance, Aberdeenshire Council, Woodhill House, Westburn Road, Aberdeen, AB16 5GB. Trusts and Common Good Funds The Council acts as Trustee for 423 Charitable Trusts & Endowments and 17 Common Good Funds. Disbursements from the Trusts range from Educational grants for books and equipment to donations to the elderly. In administering the Common Good Funds the Council has regard to the interests of the inhabitants of the area to which the Common Good Fund formerly related and overall, the funds are used for purposes which are of benefit to the relevant communities. For the year ended 31 March 2012, the net assets were £5,047,000 (2010/11 £5,060,000) for Trusts and £9,723,000 (2010/11 £3,098,000) for Common Good Funds. The accounts of the Trusts and Common Good Funds are shown on pages 113 - 121. The financial results of the Trusts and Common Good Funds are incorporated in the Group Accounts in full as a Subsidiary. The Trusts and Common Good Funds had £3,448,000 (2010/11 £3,479,000) invested in the Council’s loans fund at the 31 March 2012. A full analysis of the individual Trusts and Common Good Funds can be obtained from the Head of Finance, Aberdeenshire Council, Woodhill House, Westburn Road, Aberdeen, AB16 5GB. Strategic Development Planning Authority
Under the Planning etc. (Scotland) Act 2006, Aberdeen City and Aberdeenshire Councils were required by Scottish Ministers to constitute a new Strategic Development Planning Authority (SDPA) in the North East covering both Aberdeen City and Aberdeenshire. The SDPA will manage the process of preparing and reviewing the strategic development plan and defining its boundaries. Aberdeenshire Council and Aberdeen City Council each contribute £58,000 per financial year to the partnership. Six of the twelve Board members are appointed by Aberdeenshire Council, and are Councillors. For the year ended 31 March 2012, the total comprehensive income and expenditure statement was nil (2010/11 nil) and the net assets were nil (2010/11 nil). The organisation is excluded from the group accounts, as consolidation into the group would not materially change the values on the financial statements. A copy of the accounts can be obtained from the Head of Finance, Aberdeenshire Council, Woodhill House, Westburn Road, Aberdeen, AB16 5GB.
Scotland Excel
Scotland Excel is a not-for-profit organisation and was launched in April 2008. It aims to raise procurement standards by working with Scottish local authorities and suppliers to secure best value through collaborative contracts. Aberdeenshire Council and twenty-seven other local authorities fund the organisation. For the year ended 31 March 2012, the total comprehensive income and expenditure statement shows a deficit of £828,000 (2010/11 £81,000), the net liabilities were £692,000 (2010/11 £35,000). Aberdeenshire Council’s contribution to the organisations in 2011/12 was £140,000 (2010/11 £144,000). The organisation is excluded

NOTES TO THE FINANCIAL STATEMENTS FOR THE YEAR ENDED 31 MARCH 2012
Page 101 of 162
from the group accounts, as consolidation into the group would not materially change the values on the financial statements. A copy of the accounts can be obtained from the Head of Finance, Aberdeenshire Council, Woodhill House, Westburn Road, Aberdeen, AB16 5GB.
Aberdeenshire Towns’ Programme The Aberdeenshire Towns’ Programme created the following entities:- Banff and Macduff Community Trust Fraserburgh Development Trust Huntly Development Trust Peterhead Project Limited These entities were created to lead economic and community developments in the towns on behalf of the
wider community and in conjunction with the Aberdeenshire Community Planning Partnership. The trusts are supported by Council Officers and Councillors, however, the Council holds no voting rights at any of the trusts’ meetings. For the financial year 31 March 2012, the Council contributed £140,000 (2010/11 £301,000) towards the running costs of the trusts. The Council’s financial contribution to the trusts was due to end on 31 March 2012, but has been extended for one year at a reduced level of £70,000, at which point the trusts will be responsible for seeking alternative sources of finance to fund their business plans. The trusts are excluded from the group accounts, as the Council has no voting rights and is not committed to providing revenue funding post March 2012. Other Entities in which the Council has an interest not reflected in Group Accounts Archaeolink Trust The Archaeolink Trust is a charitable trust which was established to enhance recreational and educational provision in Aberdeenshire. In 2005/06 the Council entered into a management agreement with the Trust to manage the facility including the provision of financial services on a full cost recovery basis. It has two Trustees both of whom are appointed by Aberdeenshire Council, and are Councillors. Aberdeenshire Council withdrew funding from 1 April 2011 and the decision was taken to close the facility. The site is owned by Aberdeenshire Council and leased to Archaeolink. A renunciation of the lease is in the process of being signed by the Trustees. Once this is received, the site will transfer back to Aberdeenshire Council. The accounts of Archaeolink for 2010/11 were prepared on the basis of being final accounts and included transactions up to and including September 2011. A copy of these accounts can be obtained from the Head of Finance, Aberdeenshire Council, Woodhill House, Westburn Road, Aberdeen, AB16 5GB. Various transactions have taken place since September 2011, but these are not material and on this basis, Archaeolink has not been included in the Group Accounts Scotland’s Lighthouse Museum Limited This company was formed to advance and promote the education of the general public, and in particular the inhabitants of Scotland, by the establishment and preservation of a museum of the history and operation of lighthouses in Scotland, with the dual aim of aiding and physical preservation of the Kinnaird Head Lighthouse, Fraserburgh. It is limited by guarantee but has no share capital. Two of the eight Directors are appointed by Aberdeenshire Council, and are Councillors. The company is also recognised as a charity. For the year ended 31 March 2012, the Council awarded a grant of £90,000 to Scotland’s Lighthouse Museum Limited. As this was below £100,000, the decision was taken to remove Scotland’s Lighthouse Museum Limited from the Group Accounts. Grampian Venture Capital Limited The Council owns £161,000 fully paid up £1 shares in the Grampian Venture Capital Limited. The company was incorporated in 1987 to encourage the economic development of the local area. The management of this company is undertaken by the Moray Chamber of Commerce. The cost of the investment was written off in the year of acquisition and consequently is not reflected in the balance sheet. The Council holds a 35% shareholding in the company but the results are not incorporated in the Group Accounts as it is not considered material. The Council has no exposure to commercial risk from the company and the Council has not passed on control of any of its assets to the company. The financial transactions of the company would also have no material effect on the Council’s accounts.

NOTES TO THE FINANCIAL STATEMENTS FOR THE YEAR ENDED 31 MARCH 2012
Page 102 of 162
Sporting Trusts The Council has an interest in the following sporting trusts: Balmedie Sports Trust; Bennachie Sports Trust; Denman Park Pavilion; Ellon & District Trust; Garioch Sports Trust; Lawsondale Playing Fields; Westdyke Leisure Centre; Huntly Leisure Trust. A decision was taken not to include the sporting trusts in the Group Accounts on the basis that their inclusion would not have a material impact on the accounts.
49. Cash Flow Statement – Operating Activities
2010/11 2011/12
£’000 £’000
24,451 Net Surplus or (Deficit) on the Provision of Services (26,131)
Adjust net surplus or deficit on the provision of services for non cash movements
53,387 Depreciation and Impairment 76,541
22,249 Downward Revaluations 30,063
830 Amortisation 700
- Soft Loans (non Subsidiary)-Interest adjustment credited to CIES during year (82)
(28) Adjustments for effective interest rates -
(327) Increase/Decrease in Interest Creditors 2,354
12,374 Increase/Decrease in Creditors (10,551)
46 Increase/Decrease in Interest and Dividend Debtors (22)
(2,134) Increase/Decrease in Debtors (1,437)
(155) Increase/Decrease in Inventories (197)
(56,333) Movement in Pension Liability 6,858
(6,306) Contributions to/(from) Provisions 898
2,234 Carrying amount of non-current assets and non-current assets held for sale, sold or derecognised 2,482
(612) Movement in Investment Property Values 61
25,225 107,668
Adjust for items included in the net surplus or deficit on the provision of services that are investing or financing activities
(12,980) Capital Grants credited to surplus or deficit on the provision of services (2,419)
7,200 Net adjustment from the sale of short and long term investments -
(2,917) Proceeds from the sale of property plant and equipment, investment property and intangible assets (2,703)
(8,697) (5,122)
40,979 Net Cash Flows from Operating Activities 76,415

NOTES TO THE FINANCIAL STATEMENTS FOR THE YEAR ENDED 31 MARCH 2012
Page 103 of 162
The cash flows for operating activities include the following items:
2010/11 2011/12
£’000 £’000
1,144 Interest Received 705
(24,107) Interest Paid (22,077)
50. Cash Flow Statement – Investing Activities
2010/11 2011/12
£’000 £’000
(66,409) Purchase of Property, Plant and Equipment, Investment Property and Intangible Assets (73,056)
(633,391) Purchase of Short Term and Long Term Investments (2,000)
(128) Other Payments for Investing Activities (20,963)
2,917 Proceeds from the Sale of Property, Plant and Equipment, Investment Property and Intangible Assets 2,536
626,191 Proceeds from Short Term and Long Term Investments -
16,355 Other Receipts from Investment Activities 8,381
(54,465) Net Cash Flows from Investing Activities (85,102)
51. Cash Flow Statement – Financing Activities
2010/11 2011/12
£’000 £’000
34,081 Cash Receipts of Short Term and Long Term Borrowing 63,896
(2,697)
Cash Payments for the Reduction of the Outstanding Liabilities Relating to the Finance Leases and On Balance Sheet PFI Contracts (2,923)
(7,296) Repayments of Short Term and Long Term Borrowing (23,318)
24,088 Net Cash Flows from Financing Activities 37,655

HOUSING REVENUE ACCOUNT
Page 104 of 162
HOUSING REVENUE ACCOUNT INCOME AND EXPENDITURE STATEMENT
Restated 2010/11 2011/12 2011/12 Notes
£'000 Expenditure £'000 £'000 Ref
12,896 Repairs and Maintenance 12,964
9,146 Supervision and Management 9,039
7,756 Depreciation and Impairment of Non Current Assets 56,493
208 Movement in the Allowance for Bad Debts 510
7,208 Other Expenditure 7,303
37,214 Total Expenditure 86,309
Income
(34,946) Dwelling Rents (37,032)
(1,406) Non-dwelling Rents (1,479)
(6,601) Other Income (7,550)
(42,953) Total Income (46,061)
(5,739) Net Cost of HRA Services as Included in the Comprehensive Income and Expenditure Statement 40,248
501 HRA Services' Share of Corporate and Democratic Core 429
(778)
HRA Share of Other Amounts Included in the Whole Council’s Net Cost of Services but Not Allocated to Specific Services 53
(6,016) Net Income for HRA Services 40,730
HRA Share of the Operating Income and Expenditure Included in the Comprehensive Income and Expenditure Statement
(596) (Gain) or Loss on Sale of HRA Non Current Assets (348)
5,782 Interest Payable and Similar Charges 5,792
(120) Interest and Investment Income (38)
288 Pensions Interest Cost and Expected Return on Pensions Assets 71
(889) Non-specific Grant Income (3,299)
(1,551) (Surplus) or Deficit for the Year on HRA Services 42,908
Other Notes to the HRA Income and Expenditure Statement 3 - 6

HOUSING REVENUE ACCOUNT
Page 105 of 162
MOVEMENT ON THE HOUSING REVENUE ACCOUNT STATEMENT
2010/11 2011/12 2011/12 Notes
£'000 £'000 £'000 Ref
(19,772) Balance on the HRA at 1 April (5,033)
(1,551) (Surplus)/Deficit for the Year on the HRA Income and Expenditure Statement 42,908
18,204 Adjustments Between Accounting Basis and Funding Basis Under Statute (38,042)
1
16,653 Net (Increase) or Decrease Before Transfers to or from Reserves 4,866
(1,914) Transfers to or from Reserves (1,833) 2
14,739 (Increase)/Decrease in Year on the HRA 3,033
(5,033) Balance on the HRA at 31 March (2,000)

HOUSING REVENUE ACCOUNT
Page 106 of 162
HOUSING REVENUE ACCOUNT DISCLOSURES 1. Adjustments between Accounting Basis and Funding Basis under Statute
2010/11 2011/12
£'000 Adjustments involving the Capital Adjustment Account: £'000
Reversal of Items Debited or Credited to the HRA Income and Expenditure Statement:
(7,237) Charges for Depreciation and Impairment of Non Current Assets (29,474)
(434) Revaluation Losses on Property, Plant and Equipment (26,974)
(85) Amortisation of Intangible Assets (45)
889 Capital Grants and Contributions that Have Been Applied to Capital Financing 3,299
(1,712) Amounts of Non Current Assets Written Off on Disposal or Sale as Part of the Gain/Loss on Disposal to the HRA Income and Expenditure Statement (1,698)
Insertion of Items Not Debited or Credited to the HRA Income and Expenditure Statement:
1,029 Statutory Provision for the Financing of Capital Investment 898
22,612 Capital Expenditure Charged Against HRA Balances 13,871
Adjustments involving the Capital Receipts Reserve:
2,308 Transfer of sale proceeds credited as part of the gain/loss on disposal to the Comprehensive Income and Expenditure Statement 2,046
Adjustment involving the Capital Grants Unapplied Account:
80 Reversal of unapplied capital grants and contributions credited to the Comprehensive Income and Expenditure Statement -
Adjustments involving the Financial Instruments Adjustment Account:
320
Amount by which finance costs charged to the Comprehensive Income and Expenditure Statement are different from finance costs chargeable in the year in accordance with statutory requirements 311
Adjustments involving the Pensions Reserve:
(690)
Reversal of Items Relating to Post Employment Benefits Debited or Credited to the Surplus or Deficit on the Provision of Services in the HRA Income and Expenditure Statement (1,462)
1,219 Employer’s Pensions Contributions and Direct Payments to Pensioners Payable in the Year 1,197
Adjustment Involving the Accumulating Compensated Absences Adjustment Account
(95)
Amount by Which Officer Remuneration Charged to the Comprehensive Income and Expenditure Statement on an Accruals Basis is Different from Remuneration Chargeable in the Year in Accordance with Statutory Requirements (11)
18,204 Total (38,042)

HOUSING REVENUE ACCOUNT
Page 107 of 162
2. Transfers to/from Reserves
2010/11 2011/12
£'000 £'000
(1,903) Transfer to/(from) General Fund (1,847)
(11) Transfer to/(from) Insurance Fund 14
(1,914) Total (1,833)
3. Housing Stock The Council’s housing stock at 31 March 2012 was 12,940 (12,905 at 31 March 2010) in the following categories:
2010/11 Types of dwellings: 2011/12
1,538 - Sheltered Housing 1,538
11 - 1 apartment 15
3,598 - 2 apartment 3,621
5,129 - 3 apartment 5,128
2,490 - 4 apartment 2,495
139 - 5 + apartment 143
12,905 Total Housing Stock as at 31 March 12,940
The Council’s housing stock includes 54 properties that are not in the ownership of the Council. 4. Rent Arrears Rent arrears at 31 March 2012 were £1,709,000 (£1,589,000 at 31 March 2011). 5. Impairment of Debtors In 2011/12 an impairment of £1,240,000 has been provided in the Balance Sheet for irrecoverable rents, an increase of £36,000 from the provision in 2010/11. 6. Exceptional or Prior Year Adjustments Exceptional Items There are no exceptional items in the HRA. Prior Period Adjustments An error has been identified regarding the treatment of capital grants in the HRA Income and Expenditure Statement. The guidance requires capital grants to be recorded against the “Non-Specific Grant Income” line rather than as income in the Net Cost of HRA Services as included in the Comprehensive Income and Expenditure Statement.

COUNCIL TAX
Page 108 of 162
COUNCIL TAX INCOME ACCOUNT Local authorities raise taxes from its residents through the Council Tax – which is a property taxed linked to property values. Each dwelling in a local authority area is placed into one of eight valuation bands (A to H). The property values are determined by the Assessor. The local authority determines the annual tax for a band D property and all other properties are charged a proportion of this, with lower valued properties (Bands A to C) paying less, and higher valued properties (E to H) paying more. All domestic dwellings which appear on the valuation list are liable for the tax, but some dwellings, for instance student residences and certain unoccupied dwellings, are exempt. The full Council Tax bill is based on the assumption that there are two adults living in the dwelling. If only one adult lives in a dwelling the Council Tax bill is reduced by 25%. In 2011/12, for Band D properties, the Council Tax was £1,141.00. The Scottish average Band D Council Tax for 2010/11 was £1,141.00 This statement also includes any residual Community Charges collected.
2010/11 2011/12 2011/12 Notes
£’000 £’000 £’000 Ref
(130,971) Gross Council Tax Levied and Contributions in Lieu (132,637)
Less:
Council Tax Benefits (Net of Government Grant)
10,859 Other Discounts and Reductions 11,181
1,631 Write Off of Uncollectable Debts and Allowance for Impairment 1,654
12,490 12,835
511 Adjustments to Previous Years' Community Charge and Council Tax 390
(117,970) Transfer to Comprehensive Income and Expenditure Statement (119,412)
Council Tax Income Account notes 1-2

COUNCIL TAX
Page 109 of 162
COUNCIL TAX DISCLOSURES 1. Calculation of Council Tax Base 2011/12
The Council Tax Base is calculated by analysing properties across the valuation bandings and detailing the numbers of properties which are subject to discounts and those which are exempt. The total number of properties in each banding is then converted into Band D equivalent figures. This calculation is based on the valuation list at 31 March 2012.
BAND Band A* Band B Band C Band D Band E Band F Band G Band H TOTAL
Properties 20,636 15,817 13,923 16,699 20,098 14,616 8,925 539 111,253
Less:
Exemptions 1,135 516 427 347 274 161 92 9 2,961
Discount - 25% 2,601 1,543 1,148 1,126 1,005 525 237 13 8,198
Discount - 50% 395 291 270 274 260 167 119 18 1,794
Number of chargeable dwellings subject to disabled reduction
(61) (34) 1 (63) 38 52 62 5 -
Number of adjusted chargeable dwellings 16,566 13,501 12,077 15,015 18,521 13,711 8,415 494 98,300
Ratio to Band D 6/9 7/9 8/9 9/9 11/9 13/9 15/9 18/9
Number of Band D equivalents for RSG purposes 11,039 10,501 10,735 15,015 22,637 19,805 14,025 988 104,745
Contributions in lieu in respect of class 17 and 24 dwellings: Band D equivalents in the financial year 2011/12 14
COUNCIL TAX BASE 2011/12 104,759
2010/11 103,766
* Of the 16,566 Band A properties, 50 receive a discount in the ratio 5/9 relating to disabled relief.

COUNCIL TAX
Page 110 of 162
2. Council Tax Charges The Council Tax charges are set out below:
Band Property Value Proportion of Band D
2010/11 Council Tax
2011/12 Council Tax
A Up to £27,000 6/9 £760.67 £760.67 B £27,001 – £35,000 7/9 £887.44 £887.44 C £35,001 – £45,000 8/9 £1,014.22 £1,014.22 D £45,001 - £58,000 9/9 £1,141.00 £1,141.00 E £58,001 - £80,000 11/9 £1,394.56 £1,394.56 F £80,001 - £106,000 13/9 £1,648.11 £1,648.11 G £106,001 - £212,000 15/9 £1,901.67 £1,901.67 H Above £212,000 18/9 £2,282.00 £2,282.00

BUSINESS RATES
Page 111 of 162
BUSINESS RATES INCOME ACCOUNT Business rates income is collected by local authorities, but all income is then remitted to the Scottish Government, where it is pooled nationally, and re-distributed back to local authorities along with the Revenue Support Grant. Business rates are levied in respect of all commercial properties within the area. The Assessor determines a rateable value for each property, this figure broadly representing the rent, which the property could expect to fetch on the open market. Properties which are empty may be exempt from the charge for up to three months, and thereafter may enjoy, in certain circumstances, some further relief against the charge. Similarly certain properties, such as Post Offices in rural areas, can also qualify for relief from the full charge. Charities can also receive reductions against the rates bill for any property. The table below details the actual levels of Business Rates collected by the Council, and the overall increase/decrease between the rates collected and the amount that the Council is entitled to receive under the National Pooling arrangement.
2010/11 2011/12 2011/12 Notes
£’000 £’000 £’000 Ref
(83,161) Gross Rates Levied and Contributions in Lieu (89,428)
Less:
16,583 Reliefs and Other Deductions 18,245
3 Payment of Interest 2
15
Write Off of Uncollectable Debts and Allowance for Impairment 71 18,318
(66,560) Net Business Rate Income (71,110)
- Adjustments to Previous Years' Business Rates -
(29,847) Contribution to/(from) National Non-Domestic Rate Pool 2,690
(96,407) Transfer to Comprehensive Income and Expenditure Statement (68,420)
Business Rate Income Account notes 1-2

BUSINESS RATES
Page 112 of 162
BUSINESS RATES DISCLOSURES 1. Rateable Values and Number of Premises at 1 April 2011
2010/11 2010/11 2011/12 2011/12
Number Rateable Number Rateable of
Subjects Value £’000
of Subjects
Value £’000
1,816 32,547 Shops 1,825 33,579
112 2,166 Public Houses 111 2,125
1,221 24,028 Offices (Including Banks) 1,281 26,686
237 6,343 Hotel, Boarding Houses etc 245 6,191
333 28,171 Industrial and Freight Transport Subjects 332 28,235
598 3,421 Leisure, Entertainment, Caravans and Holiday Sites 653 3,509
433 2,909 Garage and Petrol Stations 425 2,890
52 614 Cultural 52 611
385 3,543 Sporting Subjects 386 3,552
291 17,942 Education and Training 293 18,071
150 1,483 Public Services Subjects 151 1,502
43 1,275 Communications (Non Formula) 39 1,275
202 1,313 Quarries, Mines etc 200 1,294
17 12,239 Petrochemical 16 12,203
237 1,296 Religious 238 1,365
116 3,261 Health Medical 118 3,271
4,410 48,298 Other 4,492 50,879
114 3,294 Care Facilities 111 3,281
20 32 Advertising 21 32
27 4,992 Undertaking 28 6,566
10,814 199,167 Total 11,017 207,117
Note: The 2010 Revaluation Roll came into force on 1 April 2010 and contains revised rateable values. National revaluations take place every five years throughout Scotland. 2. Explanation of the Nature and Amount of Each Rate Fixed The Assessor maintains the listing of all rateable values in the Valuation Roll. All properties listed in the Roll are liable for rating purposes. The actual rates charge is calculated by multiplying the rateable value by the poundage i.e. pence in the pound, set each year by the Scottish Government. The poundage set for the year 2011/12 for properties with a rateable value up to £35,000 was 42.6 pence (2010/11 40.7 pence), and for properties with rateable value over £35,000 was 43.3 pence (2010/11 41.4 pence). Properties with a combined rateable value of £18,000 or less are entitled to claim under the Small Business Bonus Scheme for rates relief. In addition, where the cumulative rateable value of a business with multiple properties falls between £18,000 and £25,000, the scheme will offer 25% relief to individual properties with a rateable value of £18,000 or under.
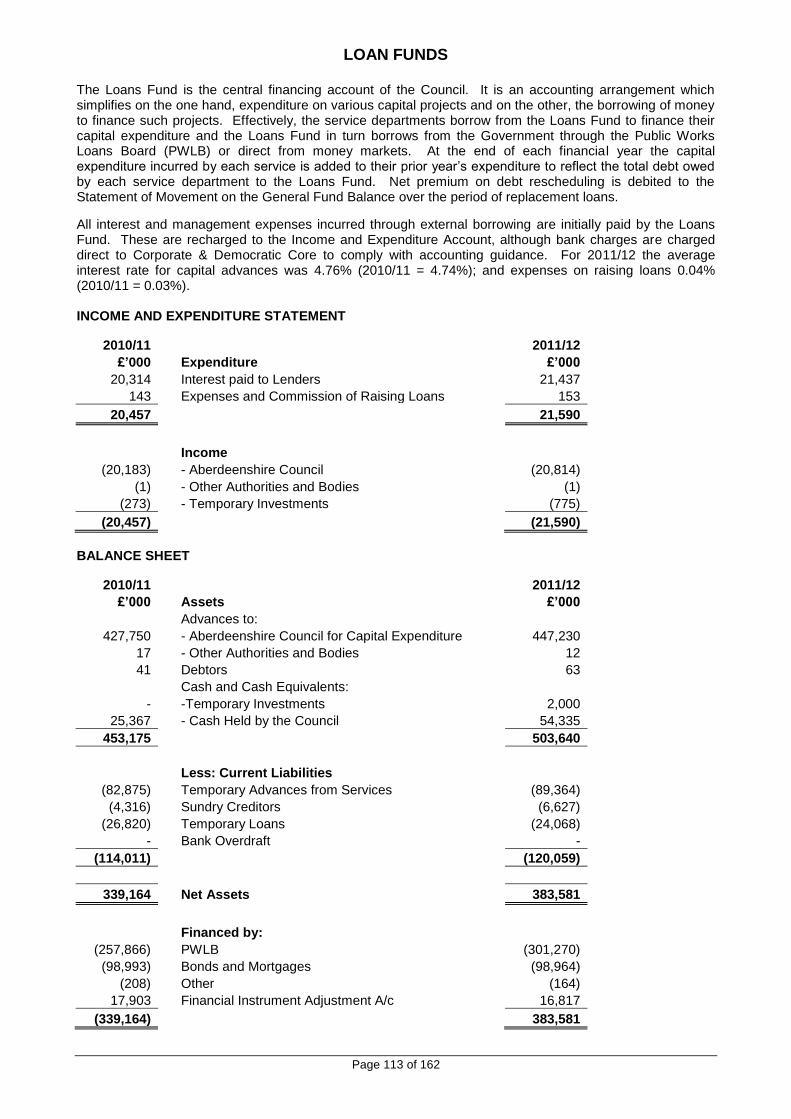
LOAN FUNDS
Page 113 of 162
The Loans Fund is the central financing account of the Council. It is an accounting arrangement which simplifies on the one hand, expenditure on various capital projects and on the other, the borrowing of money to finance such projects. Effectively, the service departments borrow from the Loans Fund to finance their capital expenditure and the Loans Fund in turn borrows from the Government through the Public Works Loans Board (PWLB) or direct from money markets. At the end of each financial year the capital expenditure incurred by each service is added to their prior year’s expenditure to reflect the total debt owed by each service department to the Loans Fund. Net premium on debt rescheduling is debited to the Statement of Movement on the General Fund Balance over the period of replacement loans.
All interest and management expenses incurred through external borrowing are initially paid by the Loans Fund. These are recharged to the Income and Expenditure Account, although bank charges are charged direct to Corporate & Democratic Core to comply with accounting guidance. For 2011/12 the average interest rate for capital advances was 4.76% (2010/11 = 4.74%); and expenses on raising loans 0.04% (2010/11 = 0.03%). INCOME AND EXPENDITURE STATEMENT
2010/11 2011/12
£’000 Expenditure £’000
20,314 Interest paid to Lenders 21,437
143 Expenses and Commission of Raising Loans 153
20,457 21,590
Income
(20,183) - Aberdeenshire Council (20,814)
(1) - Other Authorities and Bodies (1)
(273) - Temporary Investments (775)
(20,457) (21,590)
BALANCE SHEET
2010/11 2011/12
£’000 Assets £’000
Advances to:
427,750 - Aberdeenshire Council for Capital Expenditure 447,230
17 - Other Authorities and Bodies 12
41 Debtors 63
Cash and Cash Equivalents:
- -Temporary Investments 2,000
25,367 - Cash Held by the Council 54,335
453,175 503,640
Less: Current Liabilities
(82,875) Temporary Advances from Services (89,364)
(4,316) Sundry Creditors (6,627)
(26,820) Temporary Loans (24,068)
- Bank Overdraft -
(114,011) (120,059)
339,164 Net Assets 383,581
Financed by:
(257,866) PWLB (301,270)
(98,993) Bonds and Mortgages (98,964)
(208) Other (164)
17,903 Financial Instrument Adjustment A/c 16,817
(339,164) 383,581

TRUSTS AND ENDOWMENTS
Page 114 of 162
The Council administers 423 Trusts and Endowments, mainly of an Educational and Social Work nature. An Income and Expenditure Account, Balance Sheet, a summary of the balances of the Trusts at 31 March 2012 and details of how these balances were invested at that date are shown below. INCOME AND EXPENDITURE STATEMENT
2010/11 2011/12 Notes
£’000 Expenditure £’000 Ref
48 Administrative Costs 50
61 Donations, Grants etc 66
109 Total Expenditure 116
Income
(1) Property (1)
(78) Investment Income (85)
(26) Other Income (30)
(105) Total Income (116)
4 (Surplus)/Deficit for the year -
BALANCE SHEET
2010/11 2011/12
£’000 Current Assets £’000
10 Other 14
2,862 Investments 2,850
2,215 Loans Fund Balance 2,211
5,087 5,075
Current Liabilities
(27) Creditors (28)
5,060 Net Current Assets 5,047
5,060 Total Net Assets 5,047
Financed by:
(3,933) Capital (3,922)
(1,127) Revenue Balance (1,125)
(5,060) Reserves (5,047)
Trusts and Endowments notes 1 - 3
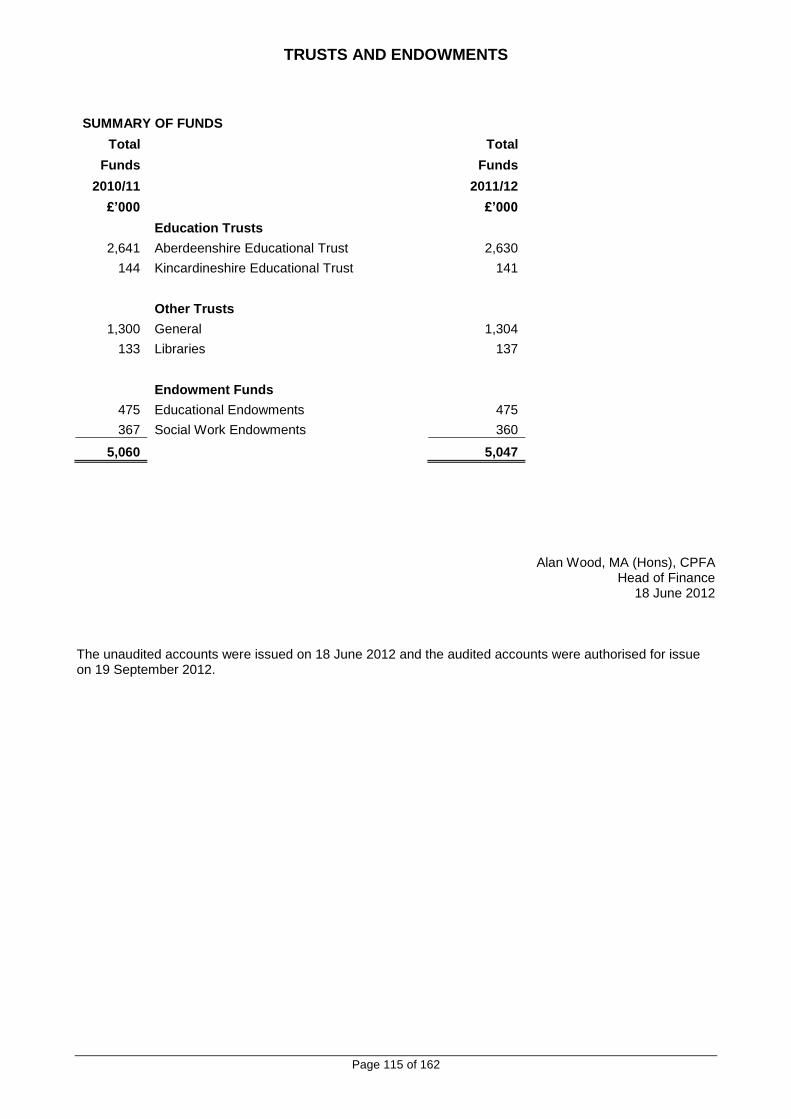
TRUSTS AND ENDOWMENTS
Page 115 of 162
SUMMARY OF FUNDS
Total Total
Funds Funds
2010/11 2011/12
£’000 £’000
Education Trusts
2,641 Aberdeenshire Educational Trust 2,630
144 Kincardineshire Educational Trust 141
Other Trusts
1,300 General 1,304
133 Libraries 137
Endowment Funds
475 Educational Endowments 475
367 Social Work Endowments 360
5,060 5,047
Alan Wood, MA (Hons), CPFA Head of Finance
18 June 2012 The unaudited accounts were issued on 18 June 2012 and the audited accounts were authorised for issue on 19 September 2012.

TRUSTS AND ENDOWMENTS
Page 116 of 162
NOTES TO THE TRUSTS AND ENDOWMENTS 1. Purpose and Administration of Trusts The money earned from the investments of the Trusts is used to provide grants, prizes and dux medals for school children and requisitions for clients in Social Work homes. In addition to administering the trusts, the Council is also the appointed Trustee for all the Trusts except the Kincardineshire Educational Trust. For this Trust, the Council’s Director of Education, Learning & Leisure, Head of Finance and Head of Legal & Governance act as Educational Adviser, Treasurer and Clerk respectively; this arrangement was approved by the former Grampian Regional Council on 8 April 1976. With the exception of the Kincardineshire Educational Trust and other trusts, the investments of the Trusts, apart from property superiorities, were transferred on 1 April 1977 to a Central Investment Fund. The quoted investments of this Fund were revalued to market value at 31 March 2012 and the resultant gain on revaluation has been credited to the various Trusts in proportion to their holding in the Central Fund. 2. Charitable Trusts Forty of the Trusts and Endowments are registered Charities. A separate Income and Expenditure Statement and Balance Sheet have been prepared covering the Charitable Trusts only and these are shown below, along with a summary of the total funds held by each Charitable Trust. The total funds held by a number of the Trusts is less than £1,000.

TRUSTS AND ENDOWMENTS
Page 117 of 162
Income and Expenditure Statement
2010/11 2011/12 Notes
£’000 Expenditure £’000 Ref
30 Administrative Costs 31
47 Donations, Grants etc 43
77 Total Expenditure 74
Income
(56) Investment Income (61)
(13) Other Income (17)
(69) Total Income (78)
8 (Surplus)/Deficit for the year (4)
Balance Sheet
2010/11 2011/12
£’000 Current Assets £’000
1 Other 1
2,076 Investments 2,069
1,048 Loans Fund Balance 1,049
3,125 3,119
Current Liabilities
(27) Creditors (27)
3,098 Net Current Assets 3,092
3,098 Total Net Assets 3,092
Financed by:
(2,871) Capital (2,775)
(227) Revenue Balance (317)
(3,098) Reserves (3,092)
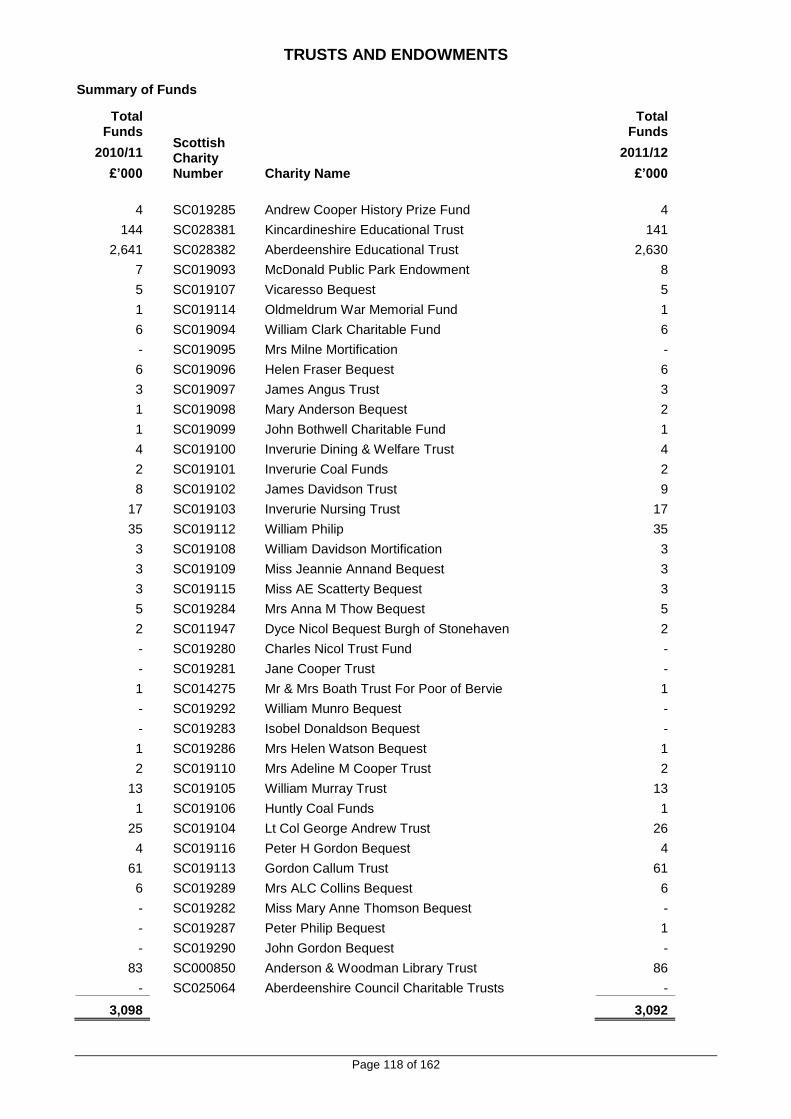
TRUSTS AND ENDOWMENTS
Page 118 of 162
Summary of Funds
Total Funds
Scottish Charity Number Charity Name
Total Funds
2010/11 2011/12
£’000 £’000
4 SC019285 Andrew Cooper History Prize Fund 4
144 SC028381 Kincardineshire Educational Trust 141
2,641 SC028382 Aberdeenshire Educational Trust 2,630
7 SC019093 McDonald Public Park Endowment 8
5 SC019107 Vicaresso Bequest 5
1 SC019114 Oldmeldrum War Memorial Fund 1
6 SC019094 William Clark Charitable Fund 6
- SC019095 Mrs Milne Mortification -
6 SC019096 Helen Fraser Bequest 6
3 SC019097 James Angus Trust 3
1 SC019098 Mary Anderson Bequest 2
1 SC019099 John Bothwell Charitable Fund 1
4 SC019100 Inverurie Dining & Welfare Trust 4
2 SC019101 Inverurie Coal Funds 2
8 SC019102 James Davidson Trust 9
17 SC019103 Inverurie Nursing Trust 17
35 SC019112 William Philip 35
3 SC019108 William Davidson Mortification 3
3 SC019109 Miss Jeannie Annand Bequest 3
3 SC019115 Miss AE Scatterty Bequest 3
5 SC019284 Mrs Anna M Thow Bequest 5
2 SC011947 Dyce Nicol Bequest Burgh of Stonehaven 2
- SC019280 Charles Nicol Trust Fund -
- SC019281 Jane Cooper Trust -
1 SC014275 Mr & Mrs Boath Trust For Poor of Bervie 1
- SC019292 William Munro Bequest -
- SC019283 Isobel Donaldson Bequest -
1 SC019286 Mrs Helen Watson Bequest 1
2 SC019110 Mrs Adeline M Cooper Trust 2
13 SC019105 William Murray Trust 13
1 SC019106 Huntly Coal Funds 1
25 SC019104 Lt Col George Andrew Trust 26
4 SC019116 Peter H Gordon Bequest 4
61 SC019113 Gordon Callum Trust 61
6 SC019289 Mrs ALC Collins Bequest 6
- SC019282 Miss Mary Anne Thomson Bequest -
- SC019287 Peter Philip Bequest 1
- SC019290 John Gordon Bequest -
83 SC000850 Anderson & Woodman Library Trust 86
- SC025064 Aberdeenshire Council Charitable Trusts -
3,098
3,092

TRUSTS AND ENDOWMENTS
Page 119 of 162
3. Further Details A full analysis of the individual Trusts and also the Common Good Funds can be obtained from the Head of Finance, Aberdeenshire Council, Woodhill House, Westburn Road, Aberdeen, AB16 5GB.

COMMON GOOD FUNDS
Page 120 of 162
SUMMARY OF FUNDS The Common Good Funds were inherited from the former Town Councils and can be disbursed on projects within the boundaries of these former Burghs. INCOME AND EXPENDITURE STATEMENT
2010/11 2011/12 £’000 £’000
Expenditure
21 Administrative Costs 21
27 Donations, Grants etc 20
13 Other Costs 19
61 Total Expenditure 60
Income
(8) Property (8)
(1) Investment Income (1)
(7) Other Income (12)
(16) Total Income (21)
45 (Surplus)/Deficit for the year 39
BALANCE SHEET
2010/11 2011/12 Notes
Ref £’000 £’000
Non-Current Assets
806 Property, Plant & Equipment 1,193
806 1,193
Current Assets
7,280 Assets Held for Sale 7,280 1
- Other -
15 Investments 15
1,264 Loans Fund Balance 1,237
8,559 8,532
Current Liabilities
(10) Creditors (2)
8,549 Net Current Assets 8,530
9,355 Total Net Assets 9,723
Financed by:
(270) Capital (717)
(8,050) Revaluation Reserve (8,010)
(1,035) Revenue Balance (996)
(9,355) Reserves (9,723)

COMMON GOOD FUNDS
Page 121 of 162
SUMMARY OF FUNDS
Total Total
Funds Funds
2010/11 2011/12
£’000 £’000
3,795 Macduff 3,790
4,490 Banff 4,653
8 Rosehearty 9
11 Portsoy 9
5 Aberchirder 5
62 Fraserburgh 63
449 Peterhead 449
27 Turriff 26
11 Oldmeldrum 11
109 Inverurie 109
44 Kintore 44
103 Stonehaven 310
54 Inverbervie 54
36 Laurencekirk 36
117 Huntly 120
34 Banchory 35
- Ballater -
9,355 9,723
Alan Wood, MA (Hons), CPFA Head of Finance
18 June 2012 The unaudited accounts were issued on 18 June 2012 and the audited accounts were authorised for issue on 19 September 2012.

COMMON GOOD FUNDS
Page 122 of 162
NOTES TO THE COMMON GOOD FUNDS 1. Assets Held for Sale Assets Held for Sale were revalued as at 31 March 2011. This represents land at Canal Park, Banff. The
value of the asset is split equally between the Macduff and Banff Common Good Funds.

GROUP ACCOUNTS
Page 123 of 162
GROUP MOVEMENT IN RESERVES STATEMENT FOR THE YEAR ENDED 31 MARCH 2012
Total Usable Aberdeenshire
Reserves
Restated Total Unusable Aberdeenshire
Reserves
Restated Unusable reserves
Associates and Subsidiaries
Restated Total Group
Unusable Reserves
Restated Total Group
Authority Reserves
Notes
£'000 £'000 £'000 £'000 £'000 Ref
Restated Balance at 31 March 2010 (47,563) (1,066,052) 286,990 (779,062) (826,625)
Movement in Reserves During 2010/11 (Surplus) or Deficit on the Provision of Services (24,451) - (9,926) (9,926) (34,377) Other Comprehensive Income and Expenditure - (31,587) (11,995) (43,582) (43,582)
Total Comprehensive Income and Expenditure (24,451) (31,587) (21,921) (53,508) (77,959)
Adjustments between Group Accounts and authority accounts - - - - -
Net Increase/Decrease before Transfers (24,451) (31,587) (21,921) (53,508) (77,959)
Adjustments Between Accounting Basis & Funding Basis Under Regulations 27,832 (27,832) - (27,832) -
Net Increase/Decrease before Transfers to Earmarked Reserves 3,381 (59,419) (21,921) (81,340) (77,959)
Transfers to/from Earmarked Reserves - - - - -
Increase/Decrease in 2010/11 3,381 (59,419) (21,921) (81,340) (77,959)
Balance at 31 March 2011 Carried Forward (44,182) (1,125,471) 265,069 (860,402) (904,584)

GROUP ACCOUNTS
Page 124 of 162
Total Usable Aberdeenshire
Reserves
Total Unusable Aberdeenshire
Reserves
Unusable reserves Associates and
Subsidiaries
Total Group Unusable Reserves
Total Group Authority Reserves Notes
£'000 £'000 £'000 £'000 £'000 Ref
Restated Balance at 31 March 2011 (44,182) (1,125,471) 265,069 (860,402) (904,584)
Movement in Reserves During 2011/12 (Surplus) or Deficit on the Provision of Services 26,131 - 16,681 16,681 42,812
Other Comprehensive Income and Expenditure - (115,773) (1,177) (116,950) (116,950)
Total Comprehensive Income and Expenditure 26,131 (115,773) 15,504 (100,269) (74,138)
Adjustments between Group Accounts and authority accounts - - - - -
Net Increase/Decrease before Transfers 26,131 (115,773) 15,504 (100,269) (74,138)
Adjustments Between Accounting Basis & Funding Basis Under Regulations (49,151) 49,151 - 49,151 -
Net Increase/Decrease before Transfers to Earmarked Reserves (23,020) (66,622) 15,504 (51,118) (74,138)
Transfers to/from Earmarked Reserves - - - - -
Increase/Decrease in 2011/12 (23,020) (66,622) 15,504 (51,118) (74,138)
Balance at 31 March 2012 Carried Forward (67,202) (1,192,093) 280,573 (911,520) (978,722)

GROUP ACCOUNTS
Page 125 of 162
GROUP COMPREHENSIVE INCOME & EXPENDITURE STATEMENT FOR THE YEAR ENDED 31 MARCH 2012
Restated Net Expenditure
2010/11
Gross Expenditure
2011/12
Income 2011/112
Net Expenditure
2011/12
Notes Ref
£’000
£’000
£’000
£’000
266,290 Education Services 256,649 (3,807) 252,842 5,962 Housing Services 47,113 (40,802) 6,311
(5,747) HRA 86,301 (46,061) 40,240 27,426 Cultural & Related Services 32,816 (10,333) 22,483 32,047 Environmental Services 35,447 (7,243) 28,204 8,827 Fire Services 7,969 - 7,969
46,177 Roads & Transport Services 37,088 (1,118) 35,970 16,772 Police Services 16,111 - 16,111 8,555 Planning and Development Services 18,901 (11,155) 7,746
133,505 Social Work 151,484 (26,346) 125,138 6,713 Central Services to the Public 30,020 (24,737) 5,283 9,980 Corporate & Democratic Core 9,180 (69) 9,111
(60,719) Non Distributed Costs 3,340 - 3,340
2,860 Exceptional Items - (48) (48)
498,648 NET COST OF SERVICES 732,419 (171,719) 560,700 11
(561) Other Operating Expenditure 39,487 (39,799) (312)
29,356 Financing & Investment Income & Expenditure 26,970 (840) 26,130
(551,867) Taxation and Non Specific Grant Income - (560,351) (560,351)
(24,424) (Surplus) or Deficit on Provision of Services 798,876 (772,709) 26,167

GROUP ACCOUNTS
Page 126 of 162
(9,953) Share of the surplus or deficit on the provision of services be associates 75,792 (59,147) 16,645
(34,377) Group (Surplus)/Deficit 874,668 (831,856) 42,812 11
(50,651)
Surplus or deficit on revaluation of non-current assets 111 (135,419) (135,308)
- Surplus or deficit on revaluation of available for sale financial assets - - -
11,785
Actuarial gains/losses on pension assets/liabilities 19,130 - 19,130
(182) Other unrealised gains/losses 14 - 14
(4,534) Share of Other Comprehensive Income and Expenditure of Associates 458 (1,244) (786)
(43,582)
Other Comprehensive Income and Expenditure 19,713 (136,663) (116,950)
(77,959) Total Comprehensive Income and Expenditure 894,381 (968,519) (74,138)
Other Notes to the Group Comprehensive Income and Expenditure Statement 1 - 6

GROUP ACCOUNTS
Page 127 of 162
GROUP BALANCE SHEET AS AT 31 MARCH 2012
Restated 1 April
2010
Restated 31 March
2011
31 March 2012 Notes
Ref
£’000 £’000 £’000
1,833,546 1,862,684 Property, Plant & Equipment 1,964,540 7
1,220 1,320 Heritage Assets 1,320
1,061 1,669 Investment Property 1,490
2,690 2,031 Intangible Assets 1,656
6,630 2,782 Long Term Debtors 16,163
1,845,147 1,870,486 Long Term Assets 1,985,169
2,692 2,877 Short Term Investments 4,865
1,256 10,366 Assets Held for Sale 9,291
3,767 3,921 Inventories 4,118
29,352 31,910 Short Term Debtors 36,023
14,738 25,367 Cash and Cash Equivalents 54,335
51,805 74,441 Current Assets 108,632
(2,137) (23,341) Short Term Borrowing (20,620)
(77,437) (78,736) Short Term Creditors (72,333)
(319) (5,128) Provisions (3,906)
(79,893) (107,205) Current Liabilities (96,859)
(3,541) (3,134) Provisions (5,254)
(351,522) (357,068) Long Term Borrowing (400,398)
(293,968) (279,484) Liabilities in Associates (295,343)
(329,083) (281,401) Other Long Term Liabilities (304,391)
(12,320) (12,051) Capital Grants Receipts in Advance (12,834)
(990,434) (933,138) Long Term Liabilities (1,018,220)
826,625 904,584 Net Assets 978,722
(47,563) (44,182) Usable Reserves (67,202)
(779,062) (860,402) Unusable Reserves (911,520) 8
(826,625) (904,584) Total Reserves (978,722)
Alan Wood, MA (Hons), CPFA Head of Finance
18 June 2012
The unaudited accounts were issued on 18 June 2012 and the audited accounts were authorised for issue on 19 September 2012.
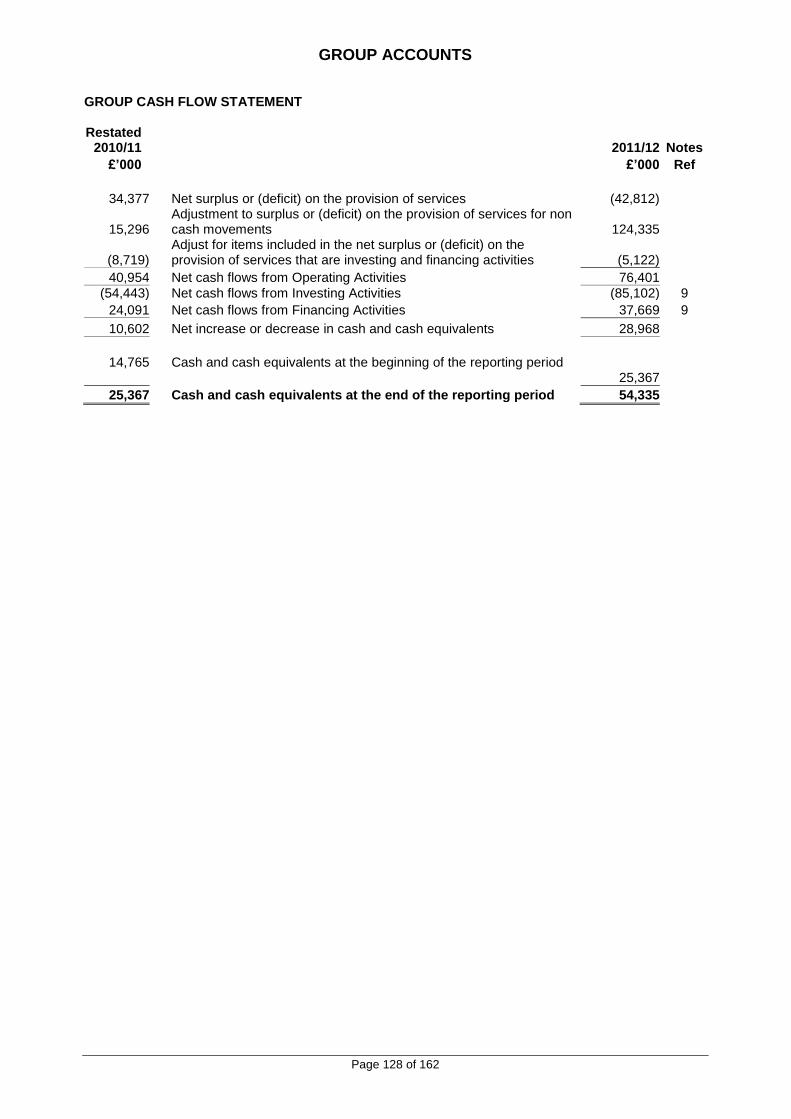
GROUP ACCOUNTS
Page 128 of 162
GROUP CASH FLOW STATEMENT Restated
2010/11
2011/12
Notes
£’000 £’000 Ref
34,377 Net surplus or (deficit) on the provision of services (42,812)
15,296 Adjustment to surplus or (deficit) on the provision of services for non cash movements 124,335
(8,719) Adjust for items included in the net surplus or (deficit) on the provision of services that are investing and financing activities (5,122)
40,954 Net cash flows from Operating Activities 76,401
(54,443) Net cash flows from Investing Activities (85,102) 9
24,091 Net cash flows from Financing Activities 37,669 9
10,602 Net increase or decrease in cash and cash equivalents 28,968
14,765
Cash and cash equivalents at the beginning of the reporting period 25,367
25,367 Cash and cash equivalents at the end of the reporting period 54,335

GROUP ACCOUNTS
Page 129 of 162
NOTES TO THE GROUP FINANCIAL STATEMENTS 1. Accounting Policies The financial statements in the group accounts are prepared in accordance with the policies set out in the Accounting Policies on pages 19 - 34, with the following exceptions: 1.1 Value Added Tax VAT paid by other group entities is accounted for in the Group Comprehensive Income and Expenditure Statement to the extent that it is irrecoverable from HM Revenues and Customs. 2. Basis of Consolidation
The Council has an interest in a number of Subsidiary and Associate organisations. The Group Accounts have been prepared on the basis of full consolidation of the financial transactions and balances of the Council, the Common Good Funds falling within the boundaries of Aberdeenshire Council, Aberdeenshire Education Trust, Kincardineshire Education Trust, Other Trusts and Educational and Social Work Endowment Funds. Grampian Joint Police Board, Grampian Joint Fire and Rescue Board, Grampian Valuation Joint Board and the North East of Scotland Transport Partnership (Nestrans) have been incorporated as associates, using the equity method i.e. the Council’s investments in these associates are incorporated at cost and adjusted each year by the Council’s share of each organisation’s results (recognised in the Group Income and Expenditure Statement), and its share of other gains and losses. The accounting period for all entities is 31 March 2012. 3. Nature of Combination The Council inherited its interest in these subsidiary and associate organisations following the reorganisation of local government in 1996. The Nestrans partnership was formed during the financial year 2006/07. It is considered that the combination was based on a merger basis. However, as no consideration was given for this interest there is no goodwill involved in these instances. 4. Other Entities in Which the Council has an Interest The Council has an interest in the following entities:
Grampian Venture Capital Fund Limited
Balmedie Sports Trust
Bennachie Sports Trust
Denman Park Pavilion
Ellon & District Trust
Garioch Sports Trust
Lawsondale Playing Fields
Westdyke Leisure Centre
Huntly Leisure Trust
Strategic Development Planning Authority (SDPA)
Scotland Excel
Banff and Macduff Community Trust
Fraserburgh Development Trust
Huntly Development Trust
Peterhead Project Limited
Scotland’s Lighthouse Museum Limited These entities have not been consolidated into the Group Accounts. A more detailed explanation for the exclusion can be found in Note 48, Related Parties on Pages 98 - 101.

GROUP ACCOUNTS
Page 130 of 162
5. Financial Impact of Consolidation The effect of inclusion of the subsidiary and associate entities on the group balance sheet is to decrease both reserves and net assets by £280,944,000 (restated 2010/11 £265,068,000) representing the Council’s share in these companies. 6. Prior Period Adjustments The following sections describe the material differences between the amounts presented in the 2010/11 financial statements and the equivalent amounts presented in the 2011/12 financial statements. (i) Archaeolink Trust Aberdeenshire Council withdrew the funding it previously provided to the Archaeolink Trust from 1 April 2011 and the decision was taken to close the facility. The site is owned by Aberdeenshire Council and leased to Archaeolink. A renunciation of the lease is in the process of being signed by the Trustees. Once this is received, the site will transfer back to Aberdeenshire Council. The accounts of Archaeolink for 2010/11 were prepared on the basis of being final accounts and included transactions up to and including September 2011. (ii) Scotland’s Lighthouse Museum Limited For the year ended 31 March 2012, the Council awarded a grant of £90,000 to Scotland’s Lighthouse Museum Limited. As this was below £100,000, the decision was taken to remove Scotland’s Lighthouse Museum Limited from the Group Accounts. (iii) Grampian Joint Police Board In 2010/11 Grampian Joint Police Board ran a voluntary redundancy scheme for Police Staff and in some cases compensatory added years were included within the total benefit. A provision of £1,470,000 was created for these future costs. However following a review of the accounting treatment the compensatory added years provision was found to already be included in the Actuary's calculation of Grampian Joint Police Board’s pension liability as at 31 March 2011 and therefore no provision was required. Aberdeenshire Council had a 36% share of this provision (£529,000). (iv) Nestrans Due to the legislation it was created under, Nestrans is not permitted to maintain a general fund. As a result last year £151,000 of expenditure was classified as 'Amounts returned to partner authorities' reducing the Total Comprehensive Income and Expenditure to £nil. However £4,000 actually related to compensated absences accrued but not taken in the year. This has resulted in changes being made to the 2010/11 financial figures, as set out in the following tables. The Aberdeenshire figures are included for completeness, and are set out in Note 12 to the single entity financial statements.
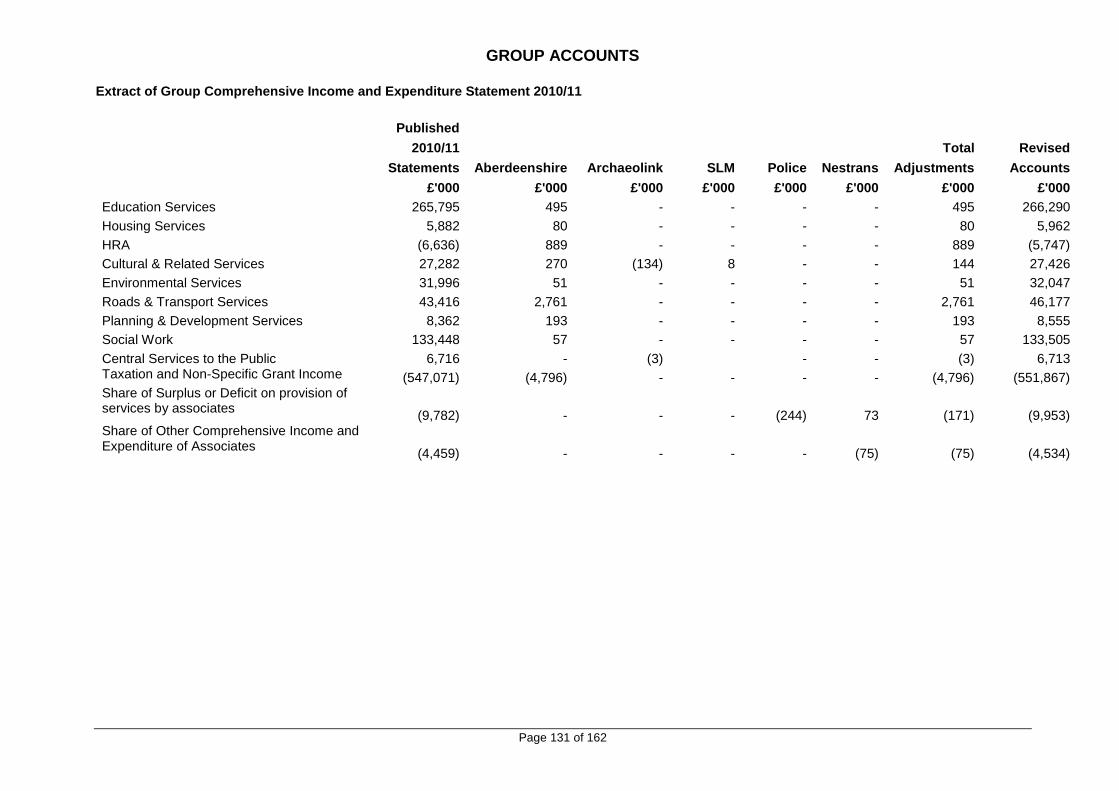
GROUP ACCOUNTS
Page 131 of 162
Extract of Group Comprehensive Income and Expenditure Statement 2010/11
Published
2010/11 Total Revised
Statements Aberdeenshire Archaeolink SLM Police Nestrans Adjustments Accounts
£'000 £'000 £'000 £'000 £'000 £'000 £'000 £'000
Education Services 265,795 495 - - - - 495 266,290
Housing Services 5,882 80 - - - - 80 5,962
HRA (6,636) 889 - - - - 889 (5,747)
Cultural & Related Services 27,282 270 (134) 8 - - 144 27,426
Environmental Services 31,996 51 - - - - 51 32,047
Roads & Transport Services 43,416 2,761 - - - - 2,761 46,177
Planning & Development Services 8,362 193 - - - - 193 8,555
Social Work 133,448 57 - - - - 57 133,505
Central Services to the Public 6,716 - (3) - - (3) 6,713 Taxation and Non-Specific Grant Income (547,071) (4,796) - - - - (4,796) (551,867) Share of Surplus or Deficit on provision of services by associates
(9,782) - - - (244) 73 (171) (9,953) Share of Other Comprehensive Income and Expenditure of Associates
(4,459) - - - - (75) (75) (4,534)

GROUP ACCOUNTS
Page 132 of 162
Extract of Group Balance Sheet 31 March 2011
Published
2010/11 Total Revised
Statements Aberdeenshire Archaeolink SLM Police Nestrans Adjustments Accounts
£’000 £’000 £’000 £’000 £’000 £’000 £’000 £’000
Property, Plant & Equipment 1,868,074 (245) (5,131) (14) - - (5,390) 1,862,684
Heritage Assets - 1,320 - - - - 1,320 1,320
Inventories 3,935 - (4) (10) - - (14) 3,921
Short Term Debtors 31,918 - (1) (7) - - (8) 31,910
Cash and Cash Equivalents 25,428 - (15) (46) - - (61) 25,367
Short Term Creditors (78,749) - 5 8 - - 13 (78,736)
Liabilities in Associates (280,010) - - - 528 (2) 526 (279,484)
Capital Grants Receipts in Advance (12,053) 2 - - - - 2 (12,051)
Revaluation Reserve (752,473) (1,075) - - - - (1,075) (753,548) Unusable Reserves - Associates and Subsidiaries 260,382 (2) 5,146 69 (528) 2 4,687 265,069
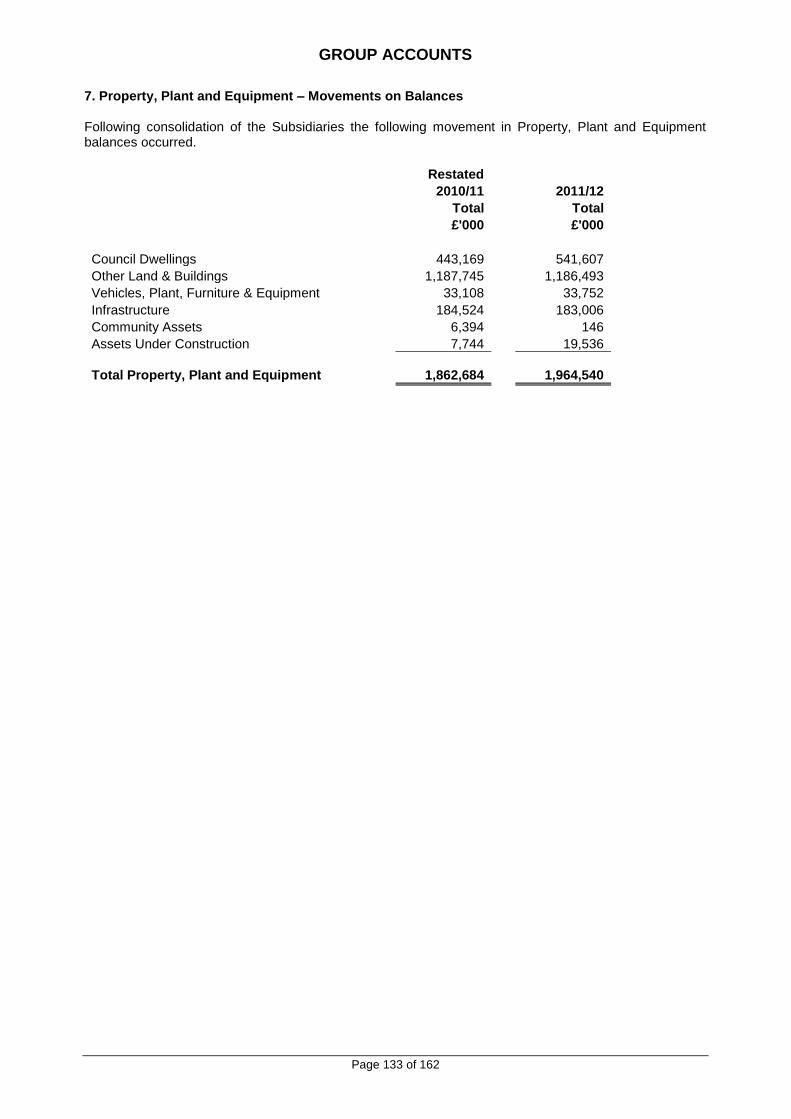
GROUP ACCOUNTS
Page 133 of 162
7. Property, Plant and Equipment – Movements on Balances Following consolidation of the Subsidiaries the following movement in Property, Plant and Equipment balances occurred.
Restated
2010/11 2011/12
Total Total
£'000 £'000
Council Dwellings 443,169 541,607
Other Land & Buildings 1,187,745 1,186,493
Vehicles, Plant, Furniture & Equipment 33,108 33,752
Infrastructure 184,524 183,006
Community Assets 6,394 146
Assets Under Construction 7,744 19,536
Total Property, Plant and Equipment
1,862,684
1,964,540

GROUP ACCOUNTS
Page 134 of 162
Breakdown of Purchases, Plant and Equipment lines which change following consolidation of group entities:
PROPERTY, PLANT AND EQUIPMENT
Movements in 2011/12:
Other Land and Buildings
£'000
Cost or Valuation
At 1 April 2011 1,248,688
Additions 11,711
Revaluation Increases/(Decreases) Recognised in the Revaluation Reserve 5,765
Revaluation Increases/(Decreases) Recognised in the Surplus/Deficit on the Provision of Services (5,922)
Derecognition - Disposals (220)
Assets Reclassified (to)/from Held for Sale 977
Transfers or Reclassification of Assets 18,080
At 31 March 2012 1,279,079
Accumulated Depreciation and Impairment
At 1 April 2011 (61,749)
Depreciation Charge (30,520)
Depreciation Written Out to the Revaluation Reserve 228
Depreciation Written Out to the Surplus/Deficit on the Provision of Services 727
Impairment Losses/(Reversals) recognised in the Surplus/Deficit on the Provision of Services (1,477)
Derecognition - Disposals 8
Other Movements in Depreciation and Impairment (996)
At 31 March 2012 (93,779)
Net Book Value
At 31 March 2012 1,185,300
At 31 March 2011 1,187,745

GROUP ACCOUNTS
Page 135 of 162
Restated Comparative Movements in 2010/11:
Restated Other
Land and Buildings
£'000
Cost or Valuation
At 1 April 2010 1,225,466
Additions 15,820
Revaluation Increases/(Decreases) Recognised in the Revaluation Reserve 32,855
Revaluation Increases/(Decreases) Recognised in the Surplus/Deficit on the Provision of Services (22,177)
Derecognition - Disposals (555)
Assets Reclassified (to)/from Held for Sale (1,784)
Other Movements in Cost or Valuation (78)
At 31 March 2011 1,249,547
Accumulated Depreciation and Impairment
At 1 April 2010 (39,333)
Depreciation Charge (30,041)
Depreciation Written Out to the Surplus/Deficit on the Provision of Services 1,912
Impairment Losses/(Reversals) recognised in the Surplus/Deficit on the Provision of Services 5,634
Derecognition - Disposals 12
Other Movements in Depreciation and Impairment 14
At 31 March 2011 (61,802)

GROUP ACCOUNTS
Page 136 of 162
8. Total Movement on Group Reserves The reserves of all subsidiaries and associates are held in one unusable reserve called the Total Unusable Reserves of Subsidiaries and Associates. A breakdown of this reserve is shown below for 2010/11 and 2011/12.
Trusts
Grampian Joint Police
36%
Grampian Joint Fire
and Rescue 34%
Grampian Joint
Valuation 44%
Restated NESTRANS
50% Total
£'000 £'000 £'000 £'000 £'000 £'000
Capital Adjustment Account
(215)
(10,499)
(12,290)
(243)
-
(23,247)
Capital Receipts Reserve
-
(1,648)
(105)
-
-
(1,753)
Pension Reserve
-
257,164
55,962
2,260
-
315,386
Employee Statutory Adjustment Account
-
10,914
2,339
-
-
13,253
Absences Account
-
593
175
30
3
801
Funds & Reserves
(3,216)
-
-
(31)
-
(3,247)
Charities Ring-Fenced Reserve
(3,062)
-
-
-
-
(3,062)
General Fund Balance
-
(3,010)
(418)
(87)
-
(3,515)
Revaluation Reserve
(8,277)
(1,140)
(4,554)
(72)
-
(14,043)
Balance at 31 March 2012
(14,770)
252,374
41,109
1,857
3
280,573

GROUP ACCOUNTS
Page 137 of 162
Trusts
Grampian Joint Police
36%
Grampian Joint Fire
and Rescue 34%
Grampian Joint
Valuation 44%
Restated NESTRANS
50% Total
£'000 £'000 £'000 £'000 £'000 £'000
Capital Adjustment Account (196) (11,310) (12,304) (257)
- (24,067)
Capital Receipts Reserve - (1,440) (87) -
- (1,527)
Pension Reserve - 244,868 53,530 1,806
- 300,204
Employee Statutory Adjustment Account - 10,226 2,158 -
-
12,384
Absences Account - 620 149 30
2 801
Funds & Reserves (3,231) - - (31)
- (3,262)
Charities Ring-Fenced Reserve (3,098) - - -
- (3,098)
General Fund Balance - (1,931) (736) (54)
- (2,721)
Revaluation Reserve (7,890) (838) (4,823) (74)
- (13,625)
Capital Grants Unapplied - - (20) -
- (20)
Balance at 31 March 2011 (14,415) 240,195 37,867 1,420
2 265,069

GROUP ACCOUNTS
Page 138 of 162
9. Cash Flow Statement Notes
Cash Flow Statement – Investing Activities
Restated
2010/11 2011/12
£’000 £’000
(66,409)
Purchase of Property, Plant and Equipment, Investment Property and Intangible Assets (73,056)
(633,391) Purchase of Short Term and Long Term Investments (2,000)
(128) Other Payments for Investing Activities (20,963)
2,939
Proceeds from the Sale of Property, Plant and Equipment, Investment Property and Intangible Assets 2,536
626,191 Proceeds from Short Term and Long Term Investments -
16,355 Other Receipts from Investment Activities 8,381
(54,443) Net Cash Flows from Investing Activities (85,102)
Restated
2010/11 2011/12
£’000 £’000
34,084 Cash Receipts of Short Term and Long Term Borrowing 63,910
(7,296) Repayments of Short Term and Long Term Borrowing (23,318)
(2,697) Other Payments from Financing Activities (2,923)
24,091 Net Cash Flows from Financing Activities 37,669

GROUP ACCOUNTS
Page 139 of 162
10. Charitable Trusts Incorporated in Group Accounts The Council has identified that it has significant influence over Forty Trust Funds (see pages 113 - 118, Note 2 for further details) which are registered as charities: The balance and the net income and expenditure for the above charities is now posted to the Charities Ring-Fenced Reserve. The purpose of the Charities Ring-Fenced Reserve is to highlight that these assets are not the property of the local authority and are subject to charitable trusts. £’000 Charities Ring-Fenced Reserve Opening Balance at 1 April 2011
Trust Funds (3,098) Surplus/Deficit Trust Funds 36
Closing Balance at 31 March 2012 (3,062)
11. Amounts Reported for Resource Allocation Decisions The analysis of income and expenditure by service on the face of the Comprehensive Income and Expenditure Statement is that specified by the Service Reporting Code of Practice. However, decisions about resource allocation are taken by the Council’s Policy and Resources Committee on the basis of budget reports analysed across Council Services. These reports are prepared on a different basis from the accounting policies used in the financial statements. In particular:
no charges are made in relation to capital expenditure (whereas depreciation, impairment losses and amortisations are charged to services in the Comprehensive Income and Expenditure Account);
the cost of retirement benefits is based on cash flows (payment of employer’s pensions contributions) rather than current service cost of benefits accrued in the year; and
expenditure on some support services is budgeted for centrally and not charged to portfolios The income and expenditure of the Council’s principal portfolios recorded in the budget reports are contained in the single entity accounts (Note 7). Reconciliation of Service Income and Expenditure to Cost of Services in the Comprehensive Income and Expenditure Statement This reconciliation shows how the figures in the analysis of Service income and expenditure relate to the amounts included in the Comprehensive Income and Expenditure Statement.
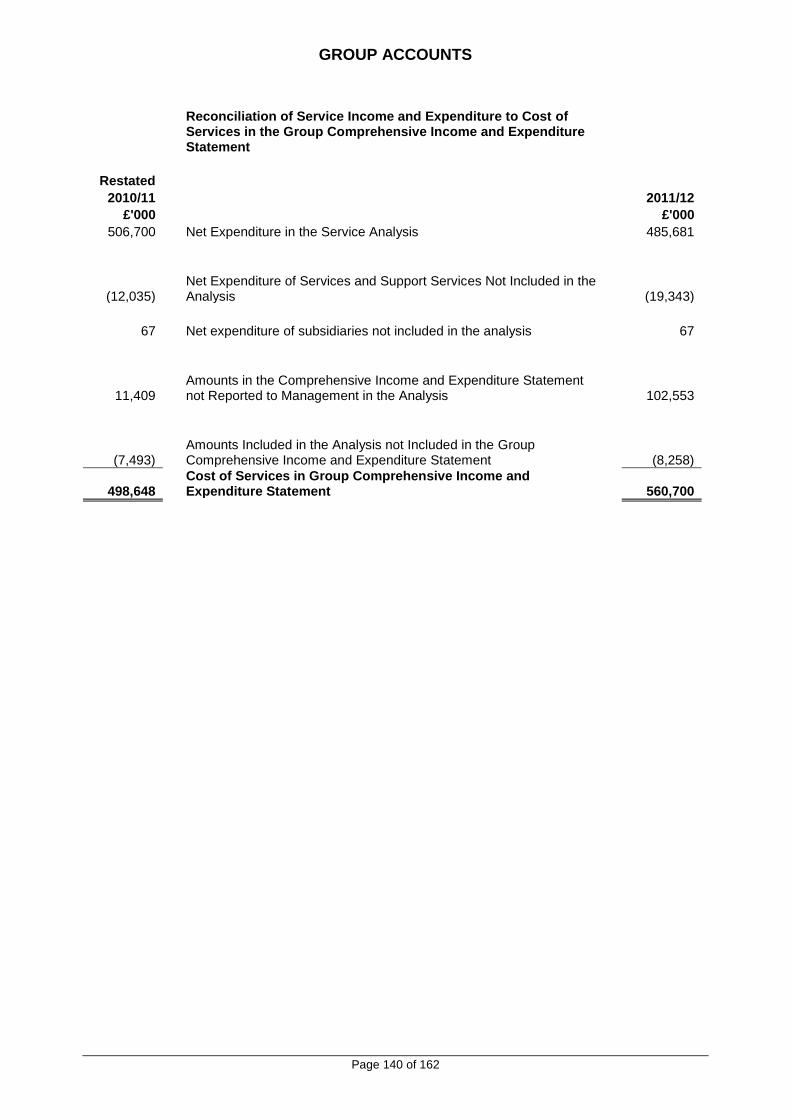
GROUP ACCOUNTS
Page 140 of 162
Reconciliation of Service Income and Expenditure to Cost of
Services in the Group Comprehensive Income and Expenditure Statement
Restated
2010/11 2011/12
£'000 £'000
506,700 Net Expenditure in the Service Analysis 485,681
(12,035) Net Expenditure of Services and Support Services Not Included in the
Analysis
(19,343)
67 Net expenditure of subsidiaries not included in the analysis 67
11,409 Amounts in the Comprehensive Income and Expenditure Statement
not Reported to Management in the Analysis
102,553
(7,493) Amounts Included in the Analysis not Included in the Group
Comprehensive Income and Expenditure Statement
(8,258)
498,648 Cost of Services in Group Comprehensive Income and
Expenditure Statement
560,700

GROUP ACCOUNTS
Page 141 of 162
Reconciliation to Subjective Analysis
This reconciliation shows how the figures in the analysis of Service income and expenditure relate to a subjective analysis of the Surplus or Deficit on the
Provision of Services included in the Group Comprehensive Income and Expenditure Statement.
Service Income and Expenditure 2011/12 Comparative Figures
Service Analysis
Services and Support Services not
in Analysis
Amounts not
Reported to Management
Net expenditure of
subsidiaries not included in
the Analysis
Amounts not
Included in I&E
Allocation of
Recharges Cost of
Services Corporate Amounts Total
£'000 £'000 £'000 £'000 £'000 £'000 £'000 £'000
Fees, Charges and Other Service Income (141,790) (85,626) 48,978 (13) 327 24,576 (153,548) (37,088) (190,636)
Surplus or Deficit on Associates and Joint Ventures - - - - - - - (59,147) (59,147)
Interest and Investment Income - - 179 (85) - - 94 (3,551) (3,457)
Income from Council Tax - - - - - - - (119,412) (119,412)
Government Grants and Contributions (16,152) - (2,113) - - - (18,265) (440,939) (459,204)
Total Income (157,942) (85,626) 47,044 (98) 327 24,576 (171,719) (660,137) (831,856)
Employee Expenses 285,732 33,054 (1,787) - - - 316,999 11,468 328,467 Surplus or Deficit on Associates and Joint Ventures - - - - - - - 75,792 75,792
Other Service Expenses 347,536 30,575 (19,886) 165 (8,585) (24,576) 325,229 28,774 354,003
Support Service Recharges 10,355 2,654 - - - - 13,009 (592) 12,417
Depreciation, Amortisation and Impairment - - 77,125 - - - 77,125 116 77,241
Interest Payments - - 57 - - - 57 26,909 26,966
Gain or Loss on Disposal of Fixed Assets - - - - - - - (218) (218)
Total Expenditure 643,623 66,283 55,509 165 (8,585) (24,576) 732,419 142,249 874,668
Surplus or Deficit on the Provision of Services 485,681 (19,343) 102,553 67 (8,258) - 560,700 (517,888) 42,812

GROUP ACCOUNTS
Page 142 of 162
Service Income and Expenditure 2010/11 Comparative Figures
Service Analysis
Services and Support Services not
in Analysis
Restated Amounts
not Reported to
Management
Net expenditure of
subsidiaries not included in
the Analysis
Amounts not
Included in I&E
Allocation of
Recharges
Restated Cost of
Services
Restated Corporate Amounts Total
£'000 £'000 £'000 £'000 £'000 £'000 £'000 £'000 £'000
Fees, Charges and Other Service Income
(151,631)
(81,693)
(62,584)
(16)
-
39,316
(256,608)
(42,053)
(298,661)
Restated Surplus or Deficit on Associates and Joint Ventures
-
-
-
-
-
-
-
(87,290)
(87,290)
Interest and Investment Income - - (58) (11) - - (69) (1,792) (1,861)
Income from Council Tax - - - - - - - (117,988) (117,988)
Restated Government Grants and Contributions
(9,672)
(45) (9,749)
-
-
- (19,466) (433,897)
(453,363)
Total Income (161,303) (81,738) (72,381) (27) - 39,316 (276,143) (683,020) (959,163)
Employee Expenses 290,782 36,701 14,183 - - - 341,666 14,385 356,051 Surplus or Deficit on Associates and Joint Ventures - - - - - - - 77,337 77,337
Other Service Expenses 366,913 30,175 16,577 94 (7,493) (39,316) 366,950 27,263 394,213
Support Service Recharges 10,308 2,827 - - - - 13,135 526 13,661
Depreciation, Amortisation and Impairment
-
-
54,204
-
-
-
54,204
-
54,204
Interest Payments - - (1,164) - - - (1,164) 31,166 30,002
Gain or Loss on Disposal of Fixed Assets
-
-
-
-
-
-
-
(682)
(682)
Total Expenditure 668,003 69,703 83,800 94 (7,493) (39,316) 774,791 149,995 924,786
Surplus or Deficit on the Provision of Services
506,700
(12,035) 11,409
67
(7,493)
-
498,648 (533,025)
(34,377)

STATEMENT OF ASSURANCE
Page 143 of 162
Aberdeenshire Council has a responsibility for ensuring that its business is conducted in accordance with the law and proper standards, and that public money is safeguarded, properly accounted for, and used appropriately. In discharging this responsibility, councillors and senior officers put in place proper governance arrangements for the stewardship of Aberdeenshire Council’s resources. To this end, Aberdeenshire Council has adopted a code of corporate governance representing the collation of existing arrangements ensuring the accountability and probity of officers of the Council. The Code is consistent with the principles and reflects the requirements of the CIPFA/SOLACE Framework Corporate Governance in Local Government: A Keystone for Community Governance. A copy of the code is on our website at www.aberdeenshire.gov.uk. The Code covers four key areas: Community Focus, Service Delivery, Structures and Processes, and Risk Management and Internal Control. The Director of Corporate Services has been given responsibility for overseeing the implementation and monitoring of the operation of the code, reviewing the code in practice and reporting annually to the Policy & Resources Committee on compliance with the code and any changes that may be necessary to maintain it and ensure its’ effectiveness in practice. The Council’s Code of Corporate Governance and the related systems of internal financial control provide reasonable, not absolute assurance that objectives will be met. Aberdeenshire Council adhere to the principles of openness, integrity and accountability and takes all reasonable steps to ensure assets are safeguarded, transactions are authorised and properly recorded and that material errors are either prevented or detected within a timely period, and corrective action taken. The system of corporate governance and internal financial control is based on a framework of financial regulations, management information, and a system of responsibility, delegation and accountability. Progressive development of the system is undertaken by managers within the Council. In particular, the system includes:
Performance management;
Comprehensive financial management systems;
Periodic and annual financial reports;
Targets set for financial and other performance;
Clearly defined capital expenditure guidelines;
Formal project management disciplines; and
Communication of financial information to Strategic Management Team and Committees. The effectiveness of the corporate governance and internal control procedures is informed by:
Feedback from councillors and committees carrying out their scrutiny role;
The work of the managers within the Council;
The work of Internal Audit;
The work of External Audit;
Work undertaken by external review bodies including Her Majesty’s Inspectors; and
Customer and stakeholder feedback. Significant progress has been made in respect of risk management. Risk registers are now fully embedded in all services in a consistent format, and these are subject to regular monitoring and review. Further work is ongoing to consider, test and evaluate operational risks. Aberdeenshire Council’s Chief Internal Auditor has been given the responsibility to review independently, and report to the Scrutiny and Audit Committee annually, to provide assurance on the adequacy and effectiveness of the code and the extent of compliance with it. On the basis of the report of the Chief Internal Auditor arising from his review of Aberdeenshire Council’s corporate governance arrangements, we are satisfied that they are adequate and are operating effectively. In addition, Aberdeenshire Council has largely concluded work on all 12 Action Points arising from the External Auditors report on the 2010/11 audit. The Action Plan was reported to Scrutiny & Audit Committee on 28 March 2012, and highlighted 5 Action Points as ‘Green’ and 7 as ‘amber’. To date 11 Action Points are now complete with the remaining one on target to be completed by its due date of December 2012. The Council recognises the importance of this Action Plan, and has reacted positively and constructively in implementing the Planned Management Actions.

STATEMENT OF ASSURANCE
Page 144 of 162
The Chief Internal Auditor reports that, in his opinion, based on his evaluation of the control environment, reasonable assurance can be placed upon the adequacy and effectiveness of the Council’s control system in the year to 31 March 2012. Whilst this opinion gives the Council assurance, Internal Audit reports do highlight areas where improvements can be made, and these areas will be reviewed in order that best practice can be achieved in all areas of activity.
The Council’s financial management arrangements conform with the governance requirements of the CIPFA Statement on the Role of the Chief Financial Officer in Local Government (2010).
In preparing this Statement, account has also been taken of the organisations supported directly by Aberdeenshire Council within the Consolidated Group accounts. Aberdeenshire Council assumes responsibility for the proper financial controls and effective governance procedures for these organisations.
These have been reviewed by the Head of Finance. No areas of concern have been identified. Signed: Councillor Jim Gifford, Leader of the Council Colin Mackenzie, Chief Executive On behalf of the Councillors and Officers of Aberdeenshire Council
Dated 18 June 2012

REMUNERATION REPORT
Page 145 of 162
Introduction The remuneration report has been prepared in accordance with the Local Authority Accounts (Scotland) Regulations 1985 (as amended by the Local Authority (Scotland) Amendment Regulations 2011). These Regulations require various disclosures about the remuneration and pension benefits of Senior Councillors and Senior Employees. The term Senior Councillor means the Leader of the Council, the Civic Head, the Chair and Vice-Chair of the Joint Boards and any Councillor who holds a significant position of responsibility in the Council’s political management structure, all as defined by regulation 2 of the Local Governance (Scotland) Act 2004 (Remuneration) Regulations 2007. The term Senior Employee means:
1. any local authority employee who has responsibility for the management of the local authority to the extent that the person has the power to direct or control the major activities of the authority (including activities involving the expenditure of money), during the year to which the report relates, whether solely or collectively with other persons;
2. who holds a post that is politically restricted by reason of section 2(1) (a), (b) or (c) of Local
Government and Housing Act 1989; or 3. whose annual remuneration, including any remuneration from a local authority subsidiary
body, is £150,000 or more. This report will provide background on the arrangements for determining salary levels followed by detailed tables showing the remuneration and pension benefits for Senior Councillors and Employees covered by this report. Arrangements for Remuneration The Full Council sets the remuneration levels for Senior Councillors and the rates of pay for Senior Employees. Its role is to ensure the application and implementation of fair and equitable systems for pay within the guidelines of and as determined by the Scottish Ministers and the Scottish Government. In reaching its decisions, the Council has to consider the need to recruit, retain and motivate suitably able and qualified people to deliver the policies and services of the Council. Councillors, Senior Councillors, Council Leader and Provost The remuneration of Senior Councillors is regulated by the Local Governance (Scotland) Act 2004 (Remuneration) Regulations 2007. The regulations provide for the grading of councillors for the purposes of remuneration arrangements, as either the Leader of the Council, the Provost, Senior Councillors or Councillors. The Leader of the Council and the Provost cannot be the same person for the purposes of payment of remuneration. The total remuneration that may be paid to the Leader and the Provost is set out in the regulations. When determining the level of remuneration for Councillors the Scottish Ministers consider the recommendations of the Scottish Local Authority Remuneration Committee (SLARC). In accordance with the regulations Aberdeenshire Council may have up to 19 senior councillors. The regulations set out the maximum that the Council may pay as remuneration to its Senior Councillors. For 2011/12 the salary for the Leader of Aberdeenshire Council is £37,880. The maximum yearly amount that may be paid to a Senior Councillor is 75 per cent of the total yearly amount payable to the Leader of the Council. The Council is able to exercise local flexibility in the determination of the precise number of Senior Councillors and their salary grade within these maximum limits. In 2011/12 Aberdeenshire Council had 19 Senior Councillors with an additional Senior Councillor for a Joint Board. The remuneration paid to Senior Councillors totalled £513,740 and is detailed in table A of this report.
REMUNERATION REPORT
Page 146 of 162
The regulations also permit the Council to pay contributions or other payments as required to the Local Government Pension Scheme in respect of those Councillors who elect to become members of the pension scheme. In 2011/12 Aberdeenshire Council recharged Grampian Fire and Rescue Board (£16,611) for the costs of their convenor. The Aberdeenshire Council Members’ Salaries and Expenses Scheme which includes the salaries, allowances and expenses of all elected members including the Leader, Provost and Senior Councillors was agreed at a meeting of the full Council on 17 May 2007. Senior Employees – Aberdeenshire Council The remuneration of senior employees is set by reference to national arrangements. The Scottish Joint Negotiating Committee (SJNC) for Local Authority Services sets the salaries for the Chief Executives of Scottish Local Authorities. The revised salary structure for Corporate Directors was approved by Full Council in January 2009 under which the salaries are based on SJNC Point 53. The Policy & Resources Committee agreed to a revised salary structure in June 2009 for Heads of Service where they would be paid at SJNC Point 34. Where the statutory roles of Section 95 officer, Monitoring Officer and Chief Social Work Officer are held at Head of Service level the jobholders are entitled to an additional two increments to their salary which places them on SJNC Point 36. Aberdeenshire Council does not pay bonuses to senior officers or performance related pay. Chief Officers receive business mileage and subsistence allowances in accordance with amounts either agreed nationally by SJNC or as approved locally. Chief Officers are eligible to join the Local Government Pension Scheme (LGPS). The scheme is outlined and the costs identified on pages 149 - 152 of this report. Senior Employees - Subsidiaries The Council’s subsidiaries for accounting purposed in 2011/12 were Archaeolink Trust and Scotland’s Lighthouse Museum Limited. The remuneration rates of the senior employees of these bodies are set by the individual trusts. Remuneration The term remuneration means gross salary, fees and bonuses, allowances and expenses, and compensation for loss of employment. It excludes pension contributions paid by the Council. Pension contributions made to a person’s pension are disclosed as part of the pension benefits disclosure.
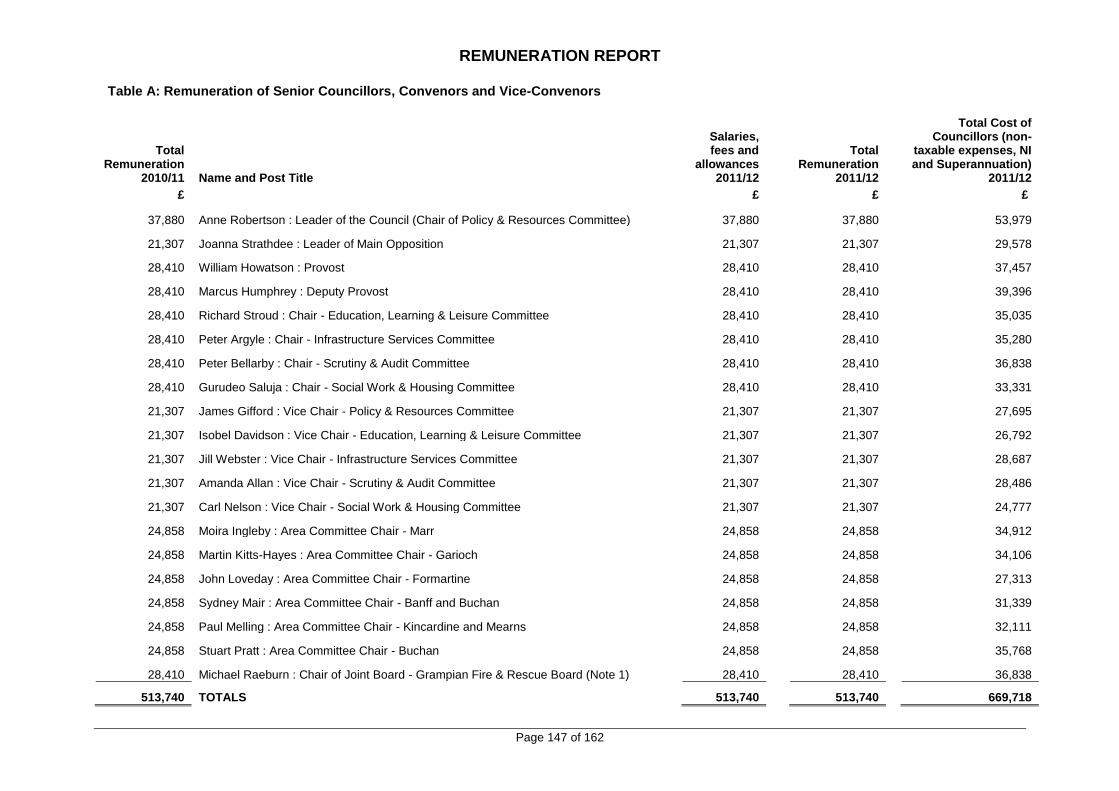
REMUNERATION REPORT
Page 147 of 162
Table A: Remuneration of Senior Councillors, Convenors and Vice-Convenors
Total Remuneration
2010/11 Name and Post Title
Salaries, fees and
allowances 2011/12
Total Remuneration
2011/12
Total Cost of Councillors (non-
taxable expenses, NI and Superannuation)
2011/12
£ £ £ £
37,880 Anne Robertson : Leader of the Council (Chair of Policy & Resources Committee) 37,880 37,880 53,979
21,307 Joanna Strathdee : Leader of Main Opposition 21,307 21,307 29,578
28,410 William Howatson : Provost 28,410 28,410 37,457
28,410 Marcus Humphrey : Deputy Provost 28,410 28,410 39,396
28,410 Richard Stroud : Chair - Education, Learning & Leisure Committee 28,410 28,410 35,035
28,410 Peter Argyle : Chair - Infrastructure Services Committee 28,410 28,410 35,280
28,410 Peter Bellarby : Chair - Scrutiny & Audit Committee 28,410 28,410 36,838
28,410 Gurudeo Saluja : Chair - Social Work & Housing Committee 28,410 28,410 33,331
21,307 James Gifford : Vice Chair - Policy & Resources Committee 21,307 21,307 27,695
21,307 Isobel Davidson : Vice Chair - Education, Learning & Leisure Committee 21,307 21,307 26,792
21,307 Jill Webster : Vice Chair - Infrastructure Services Committee 21,307 21,307 28,687
21,307 Amanda Allan : Vice Chair - Scrutiny & Audit Committee 21,307 21,307 28,486
21,307 Carl Nelson : Vice Chair - Social Work & Housing Committee 21,307 21,307 24,777
24,858 Moira Ingleby : Area Committee Chair - Marr 24,858 24,858 34,912
24,858 Martin Kitts-Hayes : Area Committee Chair - Garioch 24,858 24,858 34,106
24,858 John Loveday : Area Committee Chair - Formartine 24,858 24,858 27,313
24,858 Sydney Mair : Area Committee Chair - Banff and Buchan 24,858 24,858 31,339
24,858 Paul Melling : Area Committee Chair - Kincardine and Mearns 24,858 24,858 32,111
24,858 Stuart Pratt : Area Committee Chair - Buchan 24,858 24,858 35,768
28,410 Michael Raeburn : Chair of Joint Board - Grampian Fire & Rescue Board (Note 1) 28,410 28,410 36,838
513,740 TOTALS 513,740 513,740 669,718

REMUNERATION REPORT
Page 148 of 162
Notes to Table A:
Note 1 – The amount recharged to Grampian Fire and Rescue Board in 2011/12 was £16,611 (£15,275 in 2010/11). Note 2 – The scheme for Councillor’s allowances is not the same as that for MPs, MEPs or MSPs. Councillors receive a basic salary and are entitled to claim for a limited range of expenses. These are limited to essential travel and subsistence directly related to their duties as Councillors. Costs related to the employment of staff, second home or furnishings etc are not, and never have been, included in the scheme. The only such claim that can be made is an annual figure of £50 that is paid where a Councillor chooses to make his or her personal computer available for council use, 3 Councillors claimed this in 2011/12. Note 3 – The figures shown reflect the remuneration for the period of their appointment in the reporting periods. Note 4 – No Senior Councillor received any remuneration from a subsidiary body as a representative of the Council. Note 5 – The column titled ‘Total Cost of Councillors (non-taxable expenses, NI and Superannuation)’ contains the information reported each year on the cost of Councillors which is published on the Council’s website. Note 6 – For 2011/12 there was no payment for Bonuses, Taxable Expenses, Compensation for Loss of Employment, and Non-Cash Benefits. These columns have been removed from the above table.
Table B: Payments to Councillors
The Council paid the following salaries, allowances and expenses to all Councillors (including the Senior Councillors above) during the year.
2010/11 Type of Remuneration 2011/12
£'000 £'000
1,549 Salaries 1,546
1 Allowances -
118 Expenses 121
1,668 Totals 1,667
The annual return of Councillors’ salaries and expenses for 2011/12 is available for any member of the public to view at all Council libraries and public offices during normal working hours and is also available on the Council’s website at www.aberdeenshire.gov.uk.

REMUNERATION REPORT
Page 149 of 162
Table C: Remuneration of Senior Employees
Total remuneration
2010/11 Name and Post Title
Gross salary, fees &
allowances 2011/12
Total remuneration
2011/12
£ £ £
143,121 Colin Mackenzie : Chief Executive
148,533 (Full Year
Equivalent £133,971) 148,533
109,827 Ritchie Johnson : Director of Housing & Social Work 109,827 109,827
109,827
Christine Gore : Director of Corporate Services (from 13 January 2011 - previously Director of Planning & Environmental Services)
110,202 (Full Year
Equivalent £109,827) 110,202
-
Maria Walker : Director of Education, Learning and Leisure (from 06 June 2011)
89,968 (Full Year
Equivalent £109,827) 89,968
109,827
Iain Gabriel : Director of Infrastructure Services (until 31 July 2011 – previously Director of Transportation and Infrastructure)
36,709 (Full Year
Equivalent £109,827) 36,709
-
Stephen Archer : Director of Infrastructure Services (from 29 August 2011)
64,693 (Full Year
Equivalent £109,827) 64,693
80,604 Derek Yule : Head of Service (Finance) (until 30 October 2011)
47,325 (Full Year
Equivalent £80,604) 47,325
- Alan Wood : Head of Service (Finance) (from 31 October 2011)
37,893 (Full Year
Equivalent £80,604) 37,893
80,604
Christopher Booth : Head of Service (Chief Social Work Officer) (until 15 December 2011)
60,729 (Full Year
Equivalent £80,604) 60,729
-
Robert Driscoll : Head of Service (Chief Social Work Officer) (from 16 December 2011)
26,711 (Full Year
Equivalent £80,604) 26,711
80,604 Karen Wiles : Head of Service - Legal & Governance 80,604 80,604
714,414 TOTALS 813,194 813,194
Notes to Table C: The Director of Corporate Services was formerly the Director of Planning and Environmental Services, the Director of Infrastructure was formerly the Director of Transportation and Infrastructure. Both officers assumed amended responsibilities following an organisational restructuring of senior management approved by Council at its meeting of 19 November 2010.

REMUNERATION REPORT
Page 150 of 162
The figure for gross salary, fees and allowances shown for the Chief Executive for the year ended 31 March 2012 includes the amount of £14,462 received as the Returning Officer for Aberdeenshire in respect of the 2011 Scottish Parliamentary Elections. They also include an amount of £100 received as the Returning Officer for the Cairngorm National Park Authority. The Director of Corporate Services and the Head of Service (Finance) also received payments relating to the Scottish Parliamentary Elections of £375 and £288 respectively during the year ended 31 March 2012. The figure for gross salary, fees and allowances shown for the Chief Executive for the year ended 31 March 2011 includes the amount of £9,150 received as the Returning Officer for Aberdeenshire in respect of the 2010 General Election. For 2011/12 there was no payment for Bonuses, Taxable Expenses, Compensation for Loss of Employment, and Non-Cash Benefits. These columns have been removed from the above table. Table D: Remuneration of Employees receiving more than £50,000 The Council’s employees receiving more than £50,000 remuneration for the year were paid the following amounts. In accordance with the disclosure requirement of the Regulations, the information in the table shows the number of employees in bands of £5,000. This information includes the senior employees who are subject to the fuller disclosure requirements in the tables above.
Remuneration Bands No of Employees
2011/12 2010/11
£50,000 - £54,999 116 120
£55,000 - £59,999 15 26
£60,000 - £64,999 8 6
£65,000 - £69,999 7 5
£70,000 - £74,999 4 5
£75,000 - £79,999 22 26
£80,000 - £84,999 1 4
£85,000 - £89,999 1 -
£90,000 - £94,999 - -
£95,000 - £99,999 - -
£100,000 - £104,999 - -
£105,000 - £109,999 2 3
£110,000 - £114,999 - -
£115,000 - £119,999 - -
£120,000 - £124,999 - -
£125,000 - £129,999 - -
£130,000 -> 1 1
TOTALS 177 196
Notes to Table D: A number of employees who were included within the 2010/11 figures took advantage of voluntary redundancy offers and left the employment of the Council in 2011/12. This accounts for the overall decrease in numbers.

REMUNERATION REPORT
Page 151 of 162
Pension Benefits The majority of Senior Councillors and senior employees shown in the tables above are members of the Local Government Pension Scheme (LGPS). The scheme’s normal retirement age for both councillors and employees is 65. The LGPS provides pension benefits on retirement. For council officers their pension benefits are based on the member’s pensionable service (how long he or she has been a member of the LGPS) and his or her final pay. Elected members’ pension benefits are based on a “career average” pay which is the aggregate of each year’s pay (adjusted for inflation) divided by the total number of years and part years they have been a member of the LPGS. For service up to 31 March 2009, the annual pension is calculated by dividing the final pensionable pay by 80 and multiplying this by their total membership as at 31 March 2009. The lump sum, which is paid automatically when the person retires for service up to 31 March 2009, is normally three times his or her annual pension and is tax-free. For service after 1 April 2009, the annual pension is calculated by dividing the final pensionable pay by 60 and multiplying this by their total membership since 1 April 2009. There is no automatic lump sum for service after 1 April 2009 and LGPS Members may opt to give up (commute) pension for lump sum up to the limit set by the Finance Act 2004. A Scheme member’s pension contribution depends on his or her full-time equivalent pay. From 1 April 2009, a five tier contribution system was introduced with contributions from members being based on how much pay falls into each tier. The tiers for 2011/12 have increased in line with the Consumer Price Index as at September 2011.
Contribution Rates 2011/12 2010/11
5.50 % Between £0 and £19,401 £0 and £18,001 7.25 % Between £19,400 and £23,701 £18,000 and £22,001 8.50% Between £23,700 and £32,501 £22,000 and £30,001 9.50% Between £32,500 and £43,301 £30,000 and £40,001
12.00% Above £43,300 £40,000 The value of the accrued benefits in tables F and G below has been calculated on the basis of the age at which the person will first become entitled to receive a full pension on retirement without reduction on account of its payment at that age; without exercising any option to commute pension entitlement into a lump sum; and without any adjustment for the effects of future inflation. The pension figures shown relate to the benefits that the person has accrued as consequence of their total local government service, and not just their current appointment.

REMUNERATION REPORT
Page 152 of 162
Table F: Pension Benefits of Senior Councillors, Convenors and Vice-Convenors
In-Year Pension Accrued
Contributions Pension Benefits
Name and Post Title
For year to 31
March 2012
For year to 31
March 2011
As at 31 March
2012
Difference from 31
March 2011
£ £ £000's £000's
Anne Robertson : Leader of the Council (Chair of Policy & Resources Committee) 7,311 7,273 Pension Lump Sum
3 2
1 -
Joanna Strathdee : Leader of Main Opposition 4,112 4,091 Pension Lump Sum
2 2
1 -
William Howatson : Provost 5,483 5,455 Pension Lump Sum
2 2
- -
Marcus Humphrey : Deputy Provost 5,483 5,455 Pension Lump Sum
4 3
2 -
Richard Stroud : Chair - Education, Learning & Leisure Committee - - Pension Lump Sum - -
Peter Argyle : Chair - Infrastructure Services Committee - - Pension Lump Sum - -
Peter Bellarby : Chair - Scrutiny & Audit Committee 5,483 5,455 Pension Lump Sum
4 3
3 1
Gurudeo Saluja : Chair - Social Work & Housing Committee - - Pension Lump Sum - -
Jim Gifford : Vice Chair - Policy & Resources Committee 4,112 4,091 Pension Lump Sum
2 2
1 -
Isobel Davidson : Vice Chair - Education, Learning & Leisure Committee 4,112 4,091 Pension Lump Sum
2 2
1 -
Jill Webster : Vice Chair - Infrastructure Services Committee 4,112 4,091 Pension Lump Sum
2 2
1 -
Amanda Allan : Vice Chair - Scrutiny & Audit Committee 4,112 4,091 Pension Lump Sum
2 2
1 -
Carl Nelson : Vice Chair - Social Work & Housing Committee - - Pension Lump Sum - -
Moira Ingleby : Area Committee Chair - Marr 4,798 4,773 Pension Lump Sum
2 2
1 -
Martin Kitts-Hayes : Area Committee Chair – Garioch 4,798 4,773 Pension Lump Sum
2 2
1 -

REMUNERATION REPORT
Page 153 of 162
Table F: Pension Benefits of Senior Councillors, Convenors and Vice-Convenors (Continued)
In-Year Pension Accrued
Contributions Pension Benefits
Name and Post Title
For year to 31
March 2012
For year to 31
March 2011
As at 31 March
2012
Difference from 31
March 2011
£ £ £000's £000's
John Loveday : Area Committee Chair - Formartine - - Pension Lump Sum - -
Sydney Mair : Area Committee Chair - Banff and Buchan - - Pension Lump Sum - -
Paul Melling : Area Committee Chair - Kincardine and Mearns 4,798 4,773 Pension Lump Sum
3 2
2 1
Stuart Pratt : Area Committee Chair - Buchan 4,798 4,773 Pension Lump Sum
2 2
1 -
Michael Raeburn : Chair of Joint Board - Grampian Fire & Rescue Board 5,483 5,455 Pension Lump Sum
2 1
1 -
TOTALS 68,995 68,640 63 19

REMUNERATION REPORT
Page 154 of 162
Table G: Pension Benefits of Senior Employees
In-Year Pension Accrued
Contributions Pension Benefits
Name and Post Title
For year to 31
March 2012
For year to 31
March 2011
As at 31 March
2012
Difference from 31
March 2011
£ £ £000's £000's Colin Mackenzie : Chief Executive 25,876 27,479 Pension
Lump Sum 66
178 2
- Maria Walker : Director of Education, Learning and Leisure (from 06 June 2011) 17,364 - Pension
Lump Sum 48
129 48
129 Stephen Archer : Director of Infrastructure Services (from 29 August 2011) 12,486 - Pension
Lump Sum 1 -
1 -
Ritchie Johnson ; Director of Housing & Social Work 21,197 21,087 Pension Lump Sum
28 69
2 -
Christine Gore : Director of Corporate Services (from 13 January 2011 - previously Director of Planning & Environmental Services)
21,197 21,087 Pension Lump Sum
42 110
2 -
Iain Gabriel : Director of Transportation & Infrastructure (until 31 July 2011) 9,496 21,087 Pension Lump Sum
55 153
- -
Derek Yule : Head of Service (Finance) (until 30 October 2011) 9,078 15,476 Pension Lump Sum
32 86
- -
Alan Wood : Head of Service (Finance) (from 31 October 2011) 7,313 - Pension Lump Sum
17 43
4 18
Christopher Booth : Head of Service (Chief Social Work Officer) (until 15 December 2011)
11,721 15,476 Pension Lump Sum
38 101
1 -
Robert Driscoll : Head of Service (Chief Social Work Officer) (from 16 December 2011) 5,155 - Pension Lump Sum
29 74
1 1
Karen Wiles : Head of Service (Legal & Governance)
15,557 15,476 Pension Lump Sum
3 -
1 -
TOTALS 156,440 137,168 1,302 210

REMUNERATION REPORT
Page 155 of 162
Termination Benefits Table H: Exit Packages
Bandings 2011/12 Compulsory Voluntary Number Value Number Value £ £
Up to £19,999 35 119,387 297 1,767,074 £20,000 up to £39,999 3 87,975 28 737,594 £40,000 up to £59,999 - - 3 149,474 Provision 8 17,200 - -
Bandings 2010/11 Compulsory Voluntary Number Value Number Value £ £
Up to £19,999 - - 92 512,750 £20,000 up to £39,999 - - 13 356,896 £40,000 up to £59,999 - - 1 40,510
Notes to Table H: Following the completion of a fixed term project, two compulsory redundancy packages, included in Table H, with a value of £58,200 were paid using funding received from the Scottish Government as part of the overall cost of the project. The total cost of £2,878,704 in the table above includes £2,861,504 for exit packages that have been agreed, accrued for and charged to the Council’s Comprehensive Income and Expenditure Statement in the current year. In addition the Council’s Comprehensive Income and Expenditure Statement includes a provision for £17,200 which has been agreed and is payable to eight officers, these costs are not included in the bands and therefore an additional line has been added to reconcile to the total cost of termination benefits reported in the Comprehensive Income and Expenditure Statement. Signed Councillor Jim Gifford, Leader of the Council Colin Mackenzie, Chief Executive On behalf of the Councillors and Officers of Aberdeenshire Council 18 June 2012

GLOSSARY OF TERMS
Page 156 of 162
1. Accruals:
The concept that income and expenditure are recognised as they are earned or incurred, not as money is received or paid.
2. Acquisition Basis:
A method of accounting for acquisitions and subsidiaries and associates in which the values of assets and liabilities of the subsidiary or associate are required to be adjusted to fair value. The difference between the fair value of the assets and liabilities acquired and the consideration paid is recognised as positive or negative goodwill. 3. Administration Costs:
Includes telephone, printing, stationery, advertising and postage. 4. Allocations and Charges to Other Accounts:
For services provided by one service to another. 5. Amortisation:
The writing off of the expenditure on an asset or the income from a grant over a fixed period. 6. Assets Held for Sale:
Usually restricted to property or disposal groups that are expected to be sold within 12 months. 7. Associate:
An organisation other than a subsidiary or a joint venture in which the Council has a participating interest and over whose operating and financial policies the Council is able to exercise a significant influence without support from other participants. 8. Business Rates:
A charge levied on commercial properties and collected by the Council. The rate is set by the Scottish Government. It is also known as Non-Domestic Rates. 9. Capital Expenditure:
This is expenditure incurred in creating or acquiring a non current asset, or expenditure which adds to, and not merely maintains, the value of an existing non current asset. Capital expenditure is normally financed by borrowing over a period of years or by utilising the income from the sale of existing assets. 10. Cash and Cash Equivalents:
Cash is represented by notes and coins held by the Council and deposits available on demand. Cash equivalents are short-term, highly liquid investments that are readily convertible to known amounts of cash and which are subject to an insignificant risk of changes in value.
11. Community Assets:
Assets that the Local Authority intends to hold in perpetuity, that have no determinable useful life, and that may have restrictions on their disposal, for example, parks and historic buildings. 12. Compensated Absences:
Periods during which an employee does not provide services to the employer, but employee benefits continue to be paid. Typical employee benefits include: annual leave, sick leave, maternity leave, jury service, military service.

GLOSSARY OF TERMS
Page 157 of 162
13. Consistency: The concept that the accounting treatment of like items within an accounting period, and from one period to the next, is the same. 14. Contingent Liability: A contingent liability is either: - (a) a possible obligation arising from past events whose existence will be confirmed only by the occurrence of one or more uncertain future events not wholly within the Council’s control, or (b) a present obligation arising from past events where it is not probable that a transfer of economic benefits will be required or the amount of the obligation cannot be measured with sufficient reliability. 15. Corporate & Democratic Core & Non Distributed Costs: Corporate & Democratic Core relates to those activities in which the Council engages, over and above the provision of any single service. This includes, for example, meetings of the Council, members' expenses and External Audit fees. Non Distributed Costs are overheads for which no user benefits and are not apportioned to services. For example, excess pension costs and long term unused but unrealisable assets. 16. Defined Contribution Scheme: A pension or other retirement benefit scheme into which an employer pays regular contributions fixed as an amount or as a percentage of pay and will have no legal or constructive obligation to pay further contributions if the scheme does not have sufficient assets to pay all employee benefits relating to employee service in the current and prior periods. 17. Defined Benefit Scheme: A pension or other retirement benefit scheme other than a defined contribution scheme. Usually, the scheme rules define the benefits independently of the contributions payable, and the benefits are not directly related to the investments of the scheme. The scheme may be funded or unfunded (including notionally funded). 18. Depreciation: The measure of wearing out, consumption, or other reduction in the useful economic life of a fixed asset, whether arising from use, the passage of time or obsolescence through technological or other changes. 19. Dominant Influence: The Council exercises dominant influence over an organisation where it has a right to give directions with regard to the operating and financial policies of that organisation. The organisation is required to comply with these policies whether or not they are for the benefit of the organisation. 20. Donated Assets: Assets transferred at nil value or acquired at less than fair value. Donated assets may be received by the Council under a number of different circumstances. The assets may be donated by private individuals or entities. 21. Equity Method: A method of accounting that brings an investment into the Council’s financial statements, initially at cost, identifying any goodwill arising. The amount of the investment is then adjusted in each reporting period by the Council’s share of the results of the organisation, less any amortisation or write off of goodwill. The Council’s share of any relevant gains or losses, and any other changes in the organisations net assets.

GLOSSARY OF TERMS
Page 158 of 162
22. Exceptional Items:
This relates to material items which are not expected to recur, and which require to be disclosed separately.
23. Expected Rate of Return on Pensions Assets:
For a funded defined benefit scheme, the average rate of return, including both income and changes in fair value but net of scheme expenses, expected over the remaining life of the related obligation on the actual assets held by the scheme.
24. Fair Value:
The fair value of an asset is the price at which it could be exchanged in an arm’s length transaction less, where applicable, any grants receivable towards the purchase or use of the asset.
25. Fees and Charges:
Income received for services provided.
26. Goodwill:
The monetary marketable value of the established trade, reputation or personal relationship with customers. Goodwill is an intangible asset.
27. Government Grants:
Assistance by government and inter-government agencies and similar bodies, whether local, national or international, in the form of cash or transfers of assets to the Council in return for past or future compliance with certain conditions relating to the activities of the Council.
28. Heritage Assets
A tangible heritage asset has historical, artistic, scientific, technological, geophysical or environmental qualities that is held and maintained principally for its contribution to knowledge and culture. An intangible heritage asset has cultural, environmental or historical significance which are intangible.
29. Intangible Assets:
Intangible assets are non-financial assets that do not have physical substance but are identifiable and are controlled by the Council through custody or legal rights e.g. software licences.
30. Interest Cost (Pensions):
For a defined benefit scheme, the expected increase during the period in the present value of the scheme liabilities because the benefits are one period closer to settlement. 31. International Financial Reporting Standards (IFRS):
The new accounting standards adopted by the Council in the preparation of its accounts in 2010/11. 32. Investments (Pensions Fund)
The investments of the Pensions Fund will be accounted for in the statements of that Fund. However the Council is also required to disclose, as part of the disclosures relating to retirement benefits, the attributable share of pension scheme assets associated with their underlying obligations.
33. Investment Properties:
Interest in land and/or buildings:
a) in respect of which construction work and development have been completed; and b) which is held for its investment potential, any rental income being negotiated at arm’s length.

GLOSSARY OF TERMS
Page 159 of 162
34. Joint Venture: An organisation in which the Council has an interest on a long term basis and is controlled jointly by the Council and one or more other entities under a contract or other binding arrangement. 35. Net Book Value: The amount at which non current assets are included in the balance sheet, i.e. their historical cost or current value less the cumulative amounts provided for depreciation. 36. Net Current Replacement Cost: The cost of replacing or recreating the particular asset in its existing condition and in its existing use, i.e. the cost of its replacement or the nearest equivalent asset, adjusted to reflect the current condition of the asset. 37. Net Realisable Value: The open market value of the asset in its existing use (or open market value in the case of non-operational assets), less the expenses to be incurred in realising the asset. 38. Non Current Assets: Tangible assets that yield benefits to the Council and the services it provides for a period of more than one year. 39. Non-Specific Grant Income: All the grants and contributions receivable that cannot be identified to particular service expenditure. 40. Past Service Cost: For a defined benefit scheme, the increase in the present value of the scheme liabilities related to employee service in prior periods arising in the current period as a result of the introduction of, or improvement to, retirement benefits. 41. Premises Costs: Includes rent, rates, repairs and maintenance, heating and lighting costs as well as feu duties, metered water charges, etc. 42. Prior Period Adjustments: Those material adjustments applicable to prior years arising from changes in accounting policies or from the correction of fundamental errors. A fundamental error is one that is of such significance as to undermine the validity of the financial statements. They do not include normal recurring corrections or adjustments of accounting estimates made in prior years. 43. Payments to Agencies and Others: Includes rent, rates, repairs and maintenance, heating and lighting costs as well as fuel duties, metered water charges, etc. 44. Post Employment Benefits: All forms of consideration given by an employer in exchange for services rendered by employees that are payable after the completion of employment. Retirement benefits do not include termination benefits payable as a result of either (i) an employer’s decision to terminate an employee’s employment before the normal retirement date or (ii) an employee’s decision to accept voluntary redundancy in exchange for those benefits, because these are not given in exchange for services rendered by employees.

GLOSSARY OF TERMS
Page 160 of 162
45. Public Works Loans Board (PWLB):
A Government Agency which provides long term loans to the Council. 46. Remuneration:
All sums paid to or receivable by an employee and sums due by way of expenses allowances (as far as those sums are chargeable to UK income tax) and the money value of any other benefits received other than in cash. Pension contributions payable by the employer are excluded. 47. Revenue Expenditure:
This is expenditure incurred in providing services in the current year and which benefits that year only. 48. Revenue Support Grant:
A block grant received from Government to help finance the cost of the Council’s services. 49. Significant Influence:
The exercise of significant influence occurs when the Council is actively involved and is influential in the direction of an organisation through its participation in policy decisions, covering aspects of policy relevant to the Council including decisions on strategic issues. A holding of 20% or more of the voting rights is presumed to confer significant influence unless the contrary is shown. 50. Single Status:
The Single Status Agreement is a national agreement which uses a Job Evaluation Scheme to produce a single pay spine for all employees covered by the Agreement. The Agreement also reduced the working week for manual employees from 39 to 37 hours and allows for local negotiation on conditions of service. 51. Staff Costs:
Includes wages, salaries, bonuses, overtime, employer’s National Insurance and Superannuation contributions as well as staff training, travelling and subsistence expenses. 52. Subsidiary:
An organisation in which the Council controls the majority of the share capital or equivalent voting rights or exercises or has the right to exercise dominant influence. 53. Supplies and Services:
Includes the cost of purchasing materials, spare parts, food and protective clothing as well as payments to contractors and others for the provision of services. 54. Transport and Plant Costs:
Includes the cost of providing and maintaining all vehicles and plant including fuel, tyres, repairs, road tax, insurance, etc. 55. Unusable Reserves
Those reserves that an authority is not able to utilise to provide service. 56. Usable Reserves: Those reserves that contain resources that an authority can apply to the provision of services, either by incurring expenses or undertaking capital investment, whether or not there are particular restrictions on the exact application of those resources.

INDEPENDENT AUDITOR’S REPORT
Page 161 of 162
Independent auditor’s report to the members of Aberdeenshire Council and the Accounts Commission for Scotland We have audited the financial statements of Aberdeenshire Council and its group for the year ended 31 March 2012 under Part VII of the Local Government (Scotland) Act 1973. The financial statements comprise the group and authority-only Comprehensive Income and Expenditure Statements, Movement in Reserves Statements, Balance Sheets, and Cash-Flow Statements, the authority-only Housing Revenue Account Income and Expenditure Statement, the Movement on the Housing Revenue Account Statement, the Council Tax Income Account the Business Rate Income Account, the Loans Fund, Trusts and Endowments and Common Good Funds and the related notes 1 to 51. The financial reporting framework that has been applied in their preparation is applicable law and International Financial Reporting Standards (IFRSs) as adopted by the European Union, and as interpreted and adapted by the Code of Practice on Local Authority Accounting in the United Kingdom 2011/12 (the 2011/12 Code). This report is made solely to the members of Aberdeenshire Council as a body and the Accounts Commission for Scotland, in accordance with Part VII of the Local Government (Scotland) Act 1973. Our audit work has been undertaken so that we might state to the members of Aberdeenshire Council as a body and the Accounts Commission for Scotland those matters we are required to state to them in an auditor’s report and for no other purpose. To the fullest extent permitted by law, we do not accept or assume responsibility to anyone other than the members of Aberdeenshire Council as a body and the Accounts Commission for Scotland, for our audit work, for this report, or for the opinions we have formed. Respective responsibilities of the Responsible Financial Officer and auditor As explained more fully in the Statement of Responsibilities set out on page 13, the Responsible Financial Officer is responsible for the preparation of the financial statements and for being satisfied that they give a true and fair view. Our responsibility is to audit and express an opinion on the financial statements in accordance with applicable law and International Standards on Auditing (UK and Ireland) as required by the Code of Audit Practice approved by the Accounts Commission for Scotland. Those standards require us to comply with the Auditing Practices Board’s Ethical Standards for Auditors. Scope of the audit of the financial statements An audit involves obtaining evidence about the amounts and disclosures in the financial statements sufficient to give reasonable assurance that the financial statements are free from material misstatement, whether caused by fraud or error. This includes an assessment of: whether the accounting policies are appropriate to the group’s and the body’s circumstances and have been consistently applied and adequately disclosed; the reasonableness of significant accounting estimates made by the Responsible Financial Officer; and the overall presentation of the financial statements. In addition, we read all the financial and non-financial information in the statement of accounts to identify material inconsistencies with the audited financial statements. If we become aware of any apparent material misstatements or inconsistencies we consider the implications for our report. Opinion on financial statements In our opinion the financial statements:
give a true and fair view in accordance with applicable law and the 2011/12 Code of the state of the affairs of the group and of the body as at 31 March 2012 and of the income and expenditure of the group and the body for the year then ended;
have been properly prepared in accordance with IFRSs as adopted by the European Union, as interpreted and adapted by the 2011/12 Code; and
have been prepared in accordance with the requirements of the Local Government (Scotland) Act 1973 and the Local Government in Scotland Act 2003.
Opinion on other prescribed matters In our opinion:
the part of the Remuneration Report to be audited has been properly prepared in accordance with The Local Authority Accounts (Scotland) Regulations 1985; and
the information given in the Explanatory Foreword for the financial year for which the financial statements are prepared is consistent with the financial statements.

INDEPENDENT AUDITOR’S REPORT
Page 162 of 162
Matters on which we are required to report by exception We are required to report to you if, in our opinion:
adequate accounting records have not been kept; or
the financial statements and the part of the Remuneration Report to be audited are not in agreement with the accounting records; or
we have not received all the information and explanations we require for our audit; or
the Statement of Assurance does not comply with Delivering Good Governance in Local Government]; or
there has been a failure to achieve a prescribed financial objective.
We have nothing to report in respect of these matters. Deloitte LLP Appointed Auditor Glasgow 19 September 2012