state street reports second quarter 2021 eps of …
TRANSCRIPT

Boston, MA… July 16, 2021 News Release
STATE STREET REPORTS SECOND QUARTER 2021 EPS OF $2.07; $1.97 EXCLUDING NOTABLE ITEMS(a)
% changes noted below reflect year-over-year 2Q comparisons
TOTAL FEE REVENUE UP 6%; UP 4% EX-CURRENCY(a)
STRONG SERVICING AND MANAGEMENT FEE GROWTH OF 10% AND 14%(b)
EXPENSES UP 1%; DOWN (0.4)% EX-NOTABLES AND CURRENCY(a)
PRE-TAX MARGIN OF 30.9%; 29.7% EX-NOTABLES(a)
ROE OF 12.6%, UP 0.5% POINTSANNOUNCED COMMON SHARE REPURCHASE PROGRAM OF UP TO $3 BILLION
Ron O'Hanley, Chairman and Chief Executive Officer: "Our second quarter results reflect the successful execution of our strategic priorities. We delivered record fee revenue with continued expense discipline, driving considerable pre-tax margin expansion and earnings growth in the second quarter thus demonstrating meaningful progress toward our medium-term targets. Our innovative client solutions and operational capabilities are yielding benefits across the franchise, as evidenced by another quarter of robust servicing mandates, including State Street AlphaSM, as well as a strong performance at Global Advisors."
O'Hanley added: "The results of the recent supervisory stress test is yet another testament to the strength and resiliency of our business model. Starting in the third quarter, we have announced an increase to our common stock dividend by 10% to $0.57 per share and our Board has authorized a common share repurchase program of up to $3 billion through 2022."
FINANCIAL HIGHLIGHTS
Income statement:Total fee revenue $ 2,514 $ 2,483 $ 2,378 1 % 6 %Net interest income 467 467 559 — (16) Other income 53 — — nm nm
Total revenue 3,034 2,950 2,937 3 3 Provision for credit losses (15) (9) 52 nm nmTotal expenses 2,111 2,332 2,082 (9) 1 Net income 763 519 694 47 10
Financial ratios and other metrics:Diluted earnings per share (EPS) $ 2.07 $ 1.37 $ 1.86 51 % 11 %Return on average common equity (ROE) 12.6 % 8.4 % 12.1 % 420 bps 50 bpsPre-tax margin 30.9 21.3 27.3 960 360 AUC/A ($ billions)(1) 42,597 40,263 33,515 6 % 27 %AUM ($ billions)(1) 3,897 3,591 3,054 9 28
(Table presents summary results, dollars in millions, except per share amounts, or where otherwise noted) 2Q21 1Q21 2Q20 % QoQ % YoY
(1) As of period-end.
(a) See "2Q21 Highlights" in this news release for a listing of notable items. Results excluding notable items and/or currency translation impact are non-GAAP measures. Please refer to the Addendum included with this news release for an explanation and reconciliation of non-GAAP measures.(b) 2Q21 Servicing and management fees increased 7% and 11% compared to 2Q20, respectively, excluding currency translation. See footnote (a) above.
Investor Contact: Ilene Fiszel Bieler +1 617-664-3477 Media Contact: Carolyn Cichon +1 617-664-8672
Exhibit 99.1State Street Corporation
One Lincoln StreetBoston, MA 02111
NYSE: STT www.statestreet.com
1

2Q21 HIGHLIGHTS (all comparisons are to 2Q20, unless otherwise noted)
AUC/A and AUM• Investment Servicing AUC/A as of quarter-end increased 27% to $42.6 trillion, primarily due to higher
period-end market levels, net new business growth, and client flows• Investment Management AUM as of quarter-end increased 28% to $3.9 trillion, mainly reflecting higher
period-end market levels and net inflows from ETFs and cash, partially offset by institutional net outflows
New business• Investment Servicing mandates announced in 2Q21 totaled $1.2 trillion, with quarter-end servicing assets
to be installed in future periods of $1.2 trillion◦ Strong servicing wins across segments and regions◦ Reported two new Alpha deals and five Alpha client mandates live as of the end of 2Q21
• Charles River Development (CRD) achieved new bookings of $19 million and annual recurring revenue (ARR)(a) of $230 million in 2Q21, up 11%
• Investment Management experienced a second consecutive quarter of robust net inflows of $83 billion from institutional, ETFs and cash
• Announced the formation of State Street Digital, a new division focused on addressing the industry's evolving shift to digital finance
Revenue• Fee revenue increased 6%; up 4% excluding currency translation,(b) primarily reflecting strong Servicing
and Management fees, partially offset by lower FX trading services and Software and processing fees◦ Servicing fees increased 10%; up 7% excluding currency translation(b)
◦ Management fees increased 14%; up 11% excluding currency translation(b)
◦ Securities finance increased 18%◦ FX trading services decreased (12)%, driven by the absence of 2Q20 FX volatility associated with
the COVID-19 pandemic◦ Software and processing fees decreased (12)%, mainly reflecting the absence of prior year
market-related adjustments• Net interest income (NII) decreased (16)%, primarily due to lower investment portfolio yields and a
decline in average short-end market rates, partially offset by growth in deposits, the investment portfolio size, and loan balances
◦ Compared to 1Q21, NII was flat, as growth in the investment portfolio size and loan balances offset lower investment portfolio yields and a decline in average short-end market rates
Expenses• Total expenses increased 1%, primarily reflecting the impact of currency translation; total expenses
decreased (0.4)%, excluding notable items and currency translation(c)
◦ Productivity savings more than offset higher revenue-related expenses and planned investments to support client onboarding, operations, as well as technology and product innovation(c)
(a) See the endnotes included in the "In This News Release" section for explanations of CRD bookings and annual recurring revenue (ARR).(b) Results excluding currency translation impact are non-GAAP measures. Please refer to the Addendum included with this news release for an explanation and reconciliation of non-GAAP measures.(c) Total expenses presented excludes notable items and currency translation. This is a non-GAAP presentation. Please refer to the Addendum included with this news release for a reconciliation of ex-notable items/currency translation and further explanations of non-GAAP measures.
2

Notable items
(Dollars in millions, except EPS amounts)Quarters
2Q21 1Q21 2Q20
Other income(a) 53 — — Acquisition and restructuring costs (11) (10) (12) Legal and other costs(b) 11 (29) — Notable items (pre-tax) $ 53 $ (39) $ (12)
Preferred securities redemption (after-tax)(c) — (5) —
EPS impact $ 0.10 $ (0.10) $ (0.02)
Capital• Standardized Common Equity Tier 1 (CET1) of 11.2% was down (1.1)% points compared to 2Q20, but
increased 0.4% points compared to 1Q21• Tier 1 leverage ratio of 5.2% was down (0.9)% points and (0.2)% points compared to 2Q20 and 1Q21,
respectively• ROE of 12.6% increased 0.5% points and 4.2% points compared to 2Q20 and 1Q21, respectively• Preliminary Stress Capital Buffer (SCB) calculated under this year’s supervisory stress test was well
below the 2.5% minimum, resulting in an SCB at that floor; G-SIB surcharge at 1% through 2023• Capital return:
◦ In 2Q21, State Street returned more than $600 million of capital to shareholders, consisting of $181 million of common stock dividends and $425 million in common share repurchases
◦ In July 2021, State Street announced a 10% increase to 3Q21 quarterly common stock dividend to $0.57 per share, and a common stock repurchase program of up to $3 billion through year end 2022(d)
(a) $53 million in 2Q21, included in Other income, reflecting a gain on sale of a majority interest in our Wealth Manager Services business.(b) Legal and other benefits of $11 million in 2Q21 included in Other expenses. Legal and other costs of $29 million in 1Q21 included $20 million in Information systems and communications, $8 million in Transaction processing, and $1 million in Other expenses.(c) $5 million in 1Q21 was related to the redemption of $500 million of outstanding Series F preferred stock.(d) State Street’s $3 billion common stock repurchase authorization covers through year end 2022. Stock purchases may be made using various types of transactions, including open-market purchases, accelerated share repurchases or other transactions off the market, and may be made under Rule 10b5-1 trading programs. The timing and amount of any stock purchases and the type of transaction will depend on several factors, including investment opportunities, State Street’s capital position, its financial performance, market conditions and the amount of common stock issued as part of employee compensation programs. The common stock purchase program does not have specific price targets and may be suspended at any time.
3

MARKET DATAThe following table provides a summary of selected financial information, including market indices and foreign exchange rates.
(Dollars in billions, except market indices and foreign exchange rates) 2Q21 1Q21 2Q20 % QoQ % YoY
Assets under Custody and/or Administration (AUC/A)(1) (2) $ 42,597 $ 40,263 $ 33,515 5.8 27.1 Assets under Management (AUM)(2) 3,897 3,591 3,054 8.5 27.6
Market Indices:(3)
S&P 500 daily average 4,184 3,866 2,932 8.2 42.7 S&P 500 EOP 4,298 3,973 3,100 8.2 38.6 MSCI EAFE daily average 2,307 2,201 1,681 4.8 37.2 MSCI EAFE EOP 2,305 2,208 1,781 4.4 29.4 MSCI Emerging Markets daily average 1,351 1,363 930 (0.9) 45.3 MSCI Emerging Markets EOP 1,375 1,316 995 4.5 38.2 Barclays Capital Global Aggregate Bond Index EOP 541 534 527 1.3 2.7
Foreign Exchange Volatility Indices:(3)
JPM G7 Volatility Index daily average 6.3 6.8 8.2 (7.4) (23.2) JPM Emerging Market Volatility Index daily average 9.4 10.4 11.1 (9.6) (15.3)
Average Foreign Exchange Rate:EUR vs. USD 1.205 1.205 1.101 — 9.4 GBP vs. USD 1.398 1.379 1.242 1.4 12.6
(1) Includes assets under custody of $31,947 billion, $30,134 billion, and $25,399 billion, as of EOP for 2Q21, 1Q21, and 2Q20, respectively. (2) As of period-end.(3) The index names listed in the table are service marks of their respective owners.
INDUSTRY FLOW DATAThe following table represents industry flow data.
(Dollars in billions) 2Q21 1Q21 4Q20 3Q20 2Q20North America - (US Domiciled) Morningstar Direct Market Data:(1)(2)
Long Term Funds $ 167 $ 165 $ 74 $ 21 $ 56 Money Market 24 156 (82) (166) 259 ETF 148 148 120 60 70
Total Flows(3) $ 340 $ 470 $ 112 $ (84) $ 385
EMEA-Morningstar Direct Market Data:(1)(4)
Long Term Funds $ 206 $ 237 $ 250 $ 134 $ 168 Money Market 7 (91) 59 60 153 ETF 53 54 48 32 36
Total Flows(3) $ 266 $ 200 $ 357 $ 227 $ 357 (1) Industry data is provided for illustrative purposes only. It is not intended to reflect State Street or its clients' activity and is indicative of only segments of the entire industry. Industry flow data presented reflects a change in data providers from previous presentations for all periods presented. See endnotes included in the "In This News Release" section.(2) 2Q21 data for North America includes actuals for April and May 2021 and Morningstar estimates for June 2021.(3) Line items may not sum to total due to rounding.(4) 2Q21 data for Europe is on a rolling three month basis for March 2021 through May 2021, sourced by Morningstar.
4
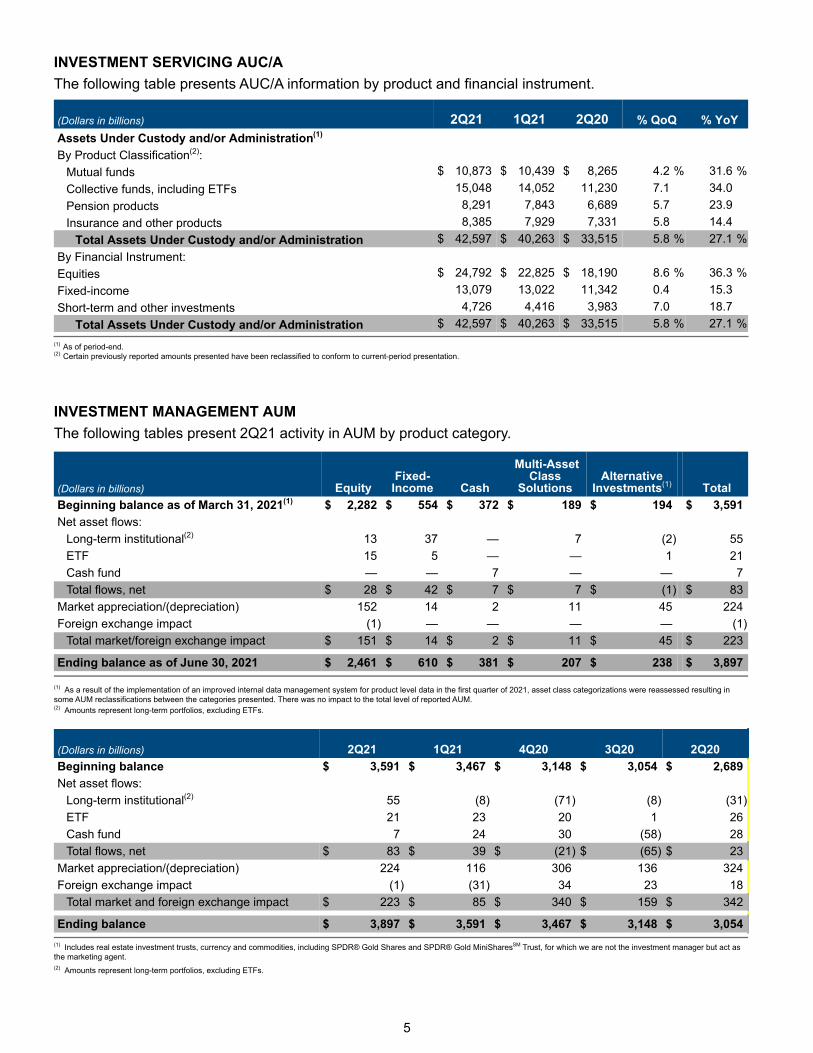
INVESTMENT SERVICING AUC/AThe following table presents AUC/A information by product and financial instrument.
(Dollars in billions) 2Q21 1Q21 2Q20 % QoQ % YoYAssets Under Custody and/or Administration(1)
By Product Classification(2):Mutual funds $ 10,873 $ 10,439 $ 8,265 4.2 % 31.6 %Collective funds, including ETFs 15,048 14,052 11,230 7.1 34.0 Pension products 8,291 7,843 6,689 5.7 23.9 Insurance and other products 8,385 7,929 7,331 5.8 14.4
Total Assets Under Custody and/or Administration $ 42,597 $ 40,263 $ 33,515 5.8 % 27.1 %By Financial Instrument:Equities $ 24,792 $ 22,825 $ 18,190 8.6 % 36.3 %Fixed-income 13,079 13,022 11,342 0.4 15.3 Short-term and other investments 4,726 4,416 3,983 7.0 18.7
Total Assets Under Custody and/or Administration $ 42,597 $ 40,263 $ 33,515 5.8 % 27.1 %(1) As of period-end.(2) Certain previously reported amounts presented have been reclassified to conform to current-period presentation.
INVESTMENT MANAGEMENT AUMThe following tables present 2Q21 activity in AUM by product category.
(Dollars in billions) EquityFixed-
Income Cash
Multi-Asset Class
SolutionsAlternative
Investments(1) TotalBeginning balance as of March 31, 2021(1) $ 2,282 $ 554 $ 372 $ 189 $ 194 $ 3,591 Net asset flows:
Long-term institutional(2) 13 37 — 7 (2) 55 ETF 15 5 — — 1 21 Cash fund — — 7 — — 7 Total flows, net $ 28 $ 42 $ 7 $ 7 $ (1) $ 83
Market appreciation/(depreciation) 152 14 2 11 45 224 Foreign exchange impact (1) — — — — (1)
Total market/foreign exchange impact $ 151 $ 14 $ 2 $ 11 $ 45 $ 223
Ending balance as of June 30, 2021 $ 2,461 $ 610 $ 381 $ 207 $ 238 $ 3,897
(1) As a result of the implementation of an improved internal data management system for product level data in the first quarter of 2021, asset class categorizations were reassessed resulting in some AUM reclassifications between the categories presented. There was no impact to the total level of reported AUM.(2) Amounts represent long-term portfolios, excluding ETFs.
(Dollars in billions) 2Q21 1Q21 4Q20 3Q20 2Q20Beginning balance $ 3,591 $ 3,467 $ 3,148 $ 3,054 $ 2,689 Net asset flows:
Long-term institutional(2) 55 (8) (71) (8) (31) ETF 21 23 20 1 26 Cash fund 7 24 30 (58) 28 Total flows, net $ 83 $ 39 $ (21) $ (65) $ 23
Market appreciation/(depreciation) 224 116 306 136 324 Foreign exchange impact (1) (31) 34 23 18
Total market and foreign exchange impact $ 223 $ 85 $ 340 $ 159 $ 342 0Ending balance $ 3,897 $ 3,591 $ 3,467 $ 3,148 $ 3,054
(1) Includes real estate investment trusts, currency and commodities, including SPDR® Gold Shares and SPDR® Gold MiniSharesSM Trust, for which we are not the investment manager but act as the marketing agent.(2) Amounts represent long-term portfolios, excluding ETFs.
5

REVENUE
(Dollars in millions) 2Q21 1Q21 2Q20 % QoQ % YoYServicing fees $ 1,399 $ 1,371 $ 1,272 2.0 % 10.0 %Management fees(a) 504 493 444 2.2 13.5 Foreign exchange trading services(a) 286 346 325 (17.3) (12.0) Securities finance revenue 109 99 92 10.1 18.5 Software and processing fees 216 174 245 24.1 (11.8)
Total fee revenue $ 2,514 $ 2,483 $ 2,378 1.2 % 5.7 %
Net interest income 467 467 559 — (16.5) Other income 53 — — nm nm
Total Revenue $ 3,034 $ 2,950 $ 2,937 2.8 % 3.3 %
Net interest margin (FTE)(b) 0.71 % 0.75 % 0.93 % (4) bps (22) bps
Servicing fees increased 10% compared to 2Q20, primarily driven by higher average equity market levels, client flows, net new business, and the impact of currency translation, partially offset by normal pricing headwinds and the absence of prior year client activity. Servicing fees were up 2% compared to 1Q21, mainly due to higher average equity market levels and net new business.
Management fees(a) increased 14% compared to 2Q20, primarily reflecting higher average equity market levels, net inflows from ETFs, and the impact of currency translation, partially offset by an idiosyncratic institutional client asset reallocation reported in 1Q21, and money market fee waivers. Management fees were up 2% compared to 1Q21, primarily reflecting higher average equity market levels and net inflows, partially offset by money market fee waivers.
Foreign exchange trading services(a) decreased (12)% compared to 2Q20, largely reflecting the absence of 2Q20 FX volatility associated with the COVID-19 pandemic, partially offset by higher client FX volumes. Compared to 1Q21, Foreign exchange trading services decreased (17)%, mainly due to lower FX volatility and client volumes.
Securities finance increased 18% and 10% compared to 2Q20 and 1Q21, respectively, primarily driven by higher client balances, partially offset by lower spreads.
Software and processing fees decreased (12)% compared to 2Q20, mainly reflecting the absence of prior year market-related adjustments. Software and processing fees increased 24% compared to 1Q21, primarily reflecting higher CRD revenues.
Net interest income (NII) decreased (16)% compared to 2Q20, primarily due to lower investment portfolio yields and a decline in average short-end market rates, partially offset by growth in deposits, the investment portfolio size, and loan balances. Compared to 1Q21, NII was flat, as growth in the investment portfolio size and loan balances offset lower investment portfolio yields and a decline in average short-end market rates.
Other income of $53 million, reflecting a gain on sale of a majority interest in our Wealth Manager Services business.
Total revenues were positively impacted by currency translation when compared to 2Q20 and 1Q21 by $64 million and $2 million, respectively.
(a) Certain fees associated with our GLD ETFs have been reclassified from Foreign exchange trading services to Management fees to better reflect the nature of those fees. Prior periods have been reclassified to conform to current-period presentation. These fees were approximately $15 million, $19 million, $24 million, and $23 million in the first, second, third and fourth quarters of 2020, respectively. (b) Net Interest Margin (NIM) is presented on a fully taxable-equivalent (FTE) basis. Refer to the Addendum for reconciliations of our FTE-basis presentation.
6
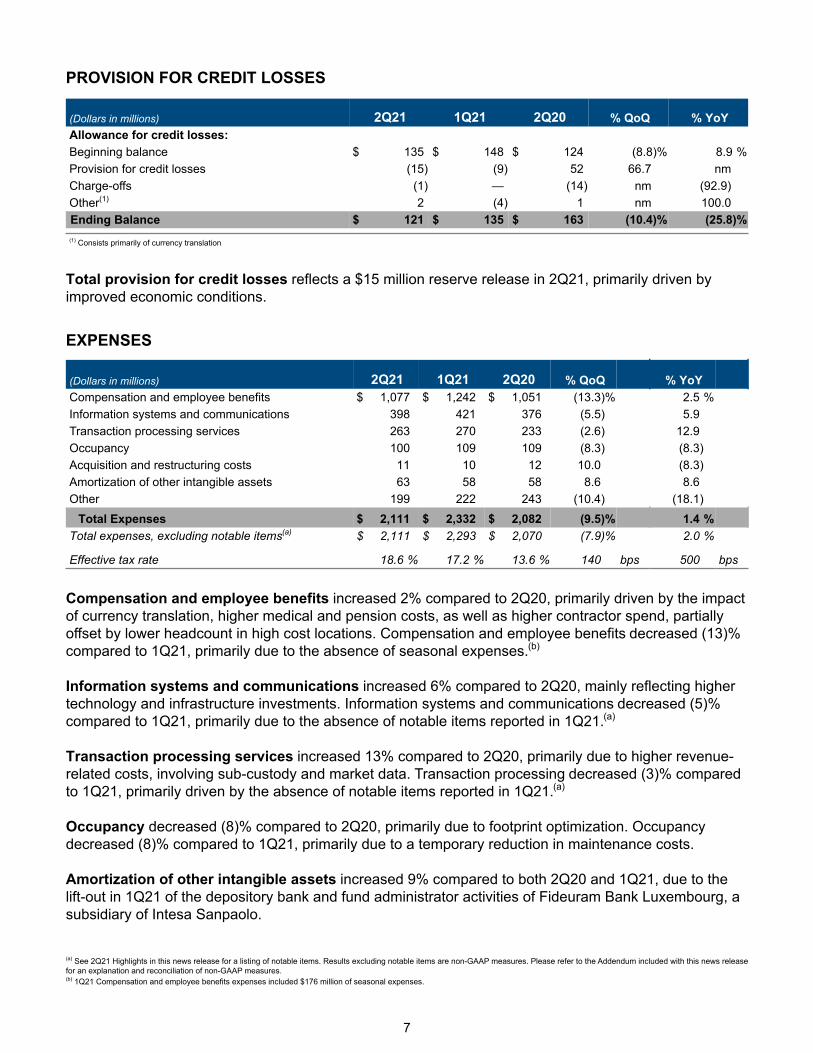
PROVISION FOR CREDIT LOSSES
(Dollars in millions) 2Q21 1Q21 2Q20 % QoQ % YoYAllowance for credit losses:Beginning balance $ 135 $ 148 $ 124 (8.8) % 8.9 %Provision for credit losses (15) (9) 52 66.7 nmCharge-offs (1) — (14) nm (92.9) Other(1) 2 (4) 1 nm 100.0 Ending Balance $ 121 $ 135 $ 163 (10.4) % (25.8) %(1) Consists primarily of currency translation
Total provision for credit losses reflects a $15 million reserve release in 2Q21, primarily driven by improved economic conditions.
EXPENSES
(Dollars in millions) 2Q21 1Q21 2Q20 % QoQ % YoYCompensation and employee benefits $ 1,077 $ 1,242 $ 1,051 (13.3) % 2.5 %Information systems and communications 398 421 376 (5.5) 5.9 Transaction processing services 263 270 233 (2.6) 12.9 Occupancy 100 109 109 (8.3) (8.3) Acquisition and restructuring costs 11 10 12 10.0 (8.3) Amortization of other intangible assets 63 58 58 8.6 8.6 Other 199 222 243 (10.4) (18.1)
Total Expenses $ 2,111 $ 2,332 $ 2,082 (9.5) % 1.4 %Total expenses, excluding notable items(a) $ 2,111 $ 2,293 $ 2,070 (7.9) % 2.0 %
Effective tax rate 18.6 % 17.2 % 13.6 % 140 bps 500 bps
Compensation and employee benefits increased 2% compared to 2Q20, primarily driven by the impact of currency translation, higher medical and pension costs, as well as higher contractor spend, partially offset by lower headcount in high cost locations. Compensation and employee benefits decreased (13)% compared to 1Q21, primarily due to the absence of seasonal expenses.(b)
Information systems and communications increased 6% compared to 2Q20, mainly reflecting higher technology and infrastructure investments. Information systems and communications decreased (5)% compared to 1Q21, primarily due to the absence of notable items reported in 1Q21.(a)
Transaction processing services increased 13% compared to 2Q20, primarily due to higher revenue-related costs, involving sub-custody and market data. Transaction processing decreased (3)% compared to 1Q21, primarily driven by the absence of notable items reported in 1Q21.(a)
Occupancy decreased (8)% compared to 2Q20, primarily due to footprint optimization. Occupancy decreased (8)% compared to 1Q21, primarily due to a temporary reduction in maintenance costs.
Amortization of other intangible assets increased 9% compared to both 2Q20 and 1Q21, due to the lift-out in 1Q21 of the depository bank and fund administrator activities of Fideuram Bank Luxembourg, a subsidiary of Intesa Sanpaolo.
(a) See 2Q21 Highlights in this news release for a listing of notable items. Results excluding notable items are non-GAAP measures. Please refer to the Addendum included with this news release for an explanation and reconciliation of non-GAAP measures.(b) 1Q21 Compensation and employee benefits expenses included $176 million of seasonal expenses.
7

Other expenses decreased (18)% compared to 2Q20, largely driven by lower professional fees and the impact of notable items in 2Q21.(a) Other expenses decreased (10)% compared to 1Q21, largely reflecting the impact of notable items in 2Q21.(a)
Total expenses were adversely impacted by currency translation when compared to 2Q20 and 1Q21 by $49 million and $2 million, respectively.
TAXES
The effective tax rate in 2Q21 increased to 18.6% from 13.6% in 2Q20, mainly due to higher foreign tax credits in 2Q20 and lower benefits from tax credit investments. Compared to 1Q21, the effective tax rate increased from 17.2%, primarily due to lower benefits from tax credit investments.
CAPITAL AND LIQUIDITY
The following table presents preliminary estimated regulatory capital and liquidity ratios for State Street Corporation.
(As of period end) 2Q21 1Q21 2Q20Basel III Standardized Approach:Common Equity Tier 1 ratio 11.2 % 10.8 % 12.3 %Tier 1 capital ratio 12.9 12.4 14.6 Total capital ratio 14.3 14.0 15.7
Basel III Advanced Approaches:Common Equity Tier 1 ratio 11.8 11.9 12.7 Tier 1 capital ratio 13.5 13.6 15.1 Total capital ratio 14.8 15.2 16.0
Tier 1 leverage ratio 5.2 5.4 6.1 Supplementary leverage ratio 6.7 7.2 8.3
Liquidity coverage ratio 104 % 107 % 109 %
Standardized capital ratios were binding for all periods included above.
CET1 ratio (standardized) decreased (1.1)% points compared to 2Q20, largely reflecting higher risk-weighted assets. CET1 ratio (standardized) increased 0.4% points compared to 1Q21, largely reflecting lower risk-weighted assets.
Tier 1 leverage ratio decreased (0.9)% points and (0.2)% points compared to 2Q20 and 1Q21, respectively, primarily driven by higher client deposit levels.
Liquidity coverage ratio (LCR) for State Street Corporation was approximately 104%, lower than prior periods, primarily due to higher deposits. LCR for State Street Bank and Trust was approximately 131%.
(a) See 2Q21 Highlights in this news release for a listing of notable items. Results excluding notable items are non-GAAP measures. Please refer to the Addendum included with this news release for an explanation and reconciliation of non-GAAP measures.
8

INVESTOR CONFERENCE CALL AND QUARTERLY WEBSITE DISCLOSURE
State Street will webcast an investor conference call today, Friday, July 16, 2021, at 10:00 a.m. ET, available at http://investors.statestreet.com/. The conference call will also be available via telephone, at (833) 380-0399 or (236) 714-2093. The Conference ID# is 2488549.
Recorded replays of the conference call will be available on the website and by telephone at (800) 585-8367 or (416) 621-4642 beginning approximately two hours after the call's completion. The Conference ID# is 2488549.
The telephone replay will be available for approximately two weeks following the conference call. This News Release, presentation materials referred to on the conference call and additional financial information are available on State Street's website, at http://investors.statestreet.com/ under “Investor Relations--Investor News & Events" and under the title “Events and Presentations".
State Street intends to publish updates to its public disclosure regarding regulatory capital, as required by the Basel III final rule, and the liquidity coverage ratio, on a quarterly basis on its website at http:// investors.statestreet.com/, under "Filings & Reports." Those updates will be published each quarter, during the period beginning after State Street's public announcement of its quarterly results of operations and ending on or prior to the due date under applicable bank regulatory requirements (i.e., ordinarily, ending no later than 60 days following year-end or 45 days following each other quarter-end, as applicable). For 2Q21, State Street expects to publish its updates during the period beginning today and ending on or about August 15, 2021.
State Street Corporation (NYSE: STT) is one of the world's leading providers of financial services to institutional investors including investment servicing, investment management and investment research and trading. With $42.6 trillion in assets under custody and/or administration and $3.9 trillion* in assets under management as of June 30, 2021, State Street operates globally in more than 100 geographic markets and employs approximately 39,000 worldwide. For more information, visit State Street's website at www.statestreet.com.* Assets under management as of June 30, 2021 includes approximately $64 billion of assets with respect to SPDR® products for which State Street Global Advisors Funds Distributors, LLC (SSGA FD) acts solely as the marketing agent. SSGA FD and State Street Global Advisors are affiliated.
9

IN THIS NEWS RELEASE:• Expenses and other measures are sometimes presented excluding notable items/effects of currency translation. This is a
non-GAAP presentation. See the Addendum to this News Release for an explanation and reconciliations of our non-GAAP measures.
• New asset servicing mandates, including announced front-to-back investment servicing clients, may be subject to completion of definitive agreements, approval of applicable boards and shareholders and customary regulatory approvals. New asset servicing mandates and servicing assets remaining to be installed in future periods exclude new business which has been contracted, but for which the client has not yet provided permission to publicly disclose and is not yet installed. These excluded assets, which from time to time may be significant, will be included in new asset servicing mandates and reflected in servicing assets remaining to be installed in the period in which the client provides its permission. Servicing mandates and servicing assets remaining to be installed in future periods are presented on a gross basis and therefore also do not include the impact of clients who have notified us during the period of their intent to terminate or reduce their relationship with State Street, which from time to time may be significant.
• New business in assets to be serviced is reflected in our AUC/A after we begin servicing the assets, and new business in assets to be managed is reflected in our AUM after we begin managing the assets. As such, only a portion of any new asset servicing and asset management mandates may be reflected in our AUC/A and AUM as of any particular date specified. Generally, our servicing fee revenues are affected by several factors, including changes in market valuations, client activity and asset flows, net new business and the manner in which we price our services. We provide a range of services to our clients, including core custody services, accounting, reporting and administration and middle office services, and the nature and mix of services provided affects our servicing fees. The basis for fees will differ across regions and clients. The industry in which we operate has historically faced pricing pressure, and our servicing fee revenues are also affected by such pressures today. Consequently, no assumption should be drawn as to future revenue run rate from announced servicing wins or new servicing business yet to be installed, as the amount of revenue associated with AUC/A can vary materially. Management fees generally are affected by our level of AUM and differ based upon the nature, type and investment strategy of the investment product. Management fee revenue is more sensitive to market valuations than servicing fee revenue, as a higher proportion of the underlying services provided, and the associated management fees earned, are dependent on equity and fixed-income security valuations. Additional factors, such as the relative mix of assets managed, may have a significant effect on our management fee revenue. While certain management fees are directly determined by the values of AUM and the investment strategies employed, management fees may reflect other factors, including performance fee arrangements, as well as our relationship pricing for clients.
• CRD bookings, as presented in this News Release, represent signed annual recurring revenue contract value excluding bookings with affiliates, including SSGA. CRD revenue derived from affiliate agreements is eliminated in consolidation for financial reporting purposes.
• CRD annual recurring revenue (ARR), an operating metric, is calculated by annualizing current quarter revenue and includes annualized amount of most software-enabled revenue, including revenue generated from Software-as-a-service, maintenance and support revenue, revenue from the Charles River Network's FIX Network Service (CRN), and value-added services, which are all expected to be recognized ratably over the term of client contracts. ARR excludes software-enabled brokerage revenue. ARR of $207 million, $225 million, and $230 million in 2Q20, 1Q21, and 2Q21, respectively, includes annualized intercompany revenues of $17 million, $20 million, and $21 million, respectively.
• Revenue and pre-tax income reflects the application of ASC 606. Revenue recognition under ASC 606 results in the acceleration of a significant portion of revenues for on-premises software agreements when a client goes live or renews their contract with us. The amount of revenue recognized in any given quarter will be driven in large part by client activity, including agreements that renew or are installed in that quarter.
• Unless otherwise noted, all capital ratios referenced on this News Release and elsewhere in this presentation refer to State Street Corporation, or State Street, and not State Street Bank and Trust Company, or State Street Bank. The lower of capital ratios calculated under the Basel III advanced approaches and under the Basel III standardized approach are applied in the assessment of our capital adequacy for regulatory purposes. Standardized ratios were binding for 2Q21. Refer to the Addendum included with this News Release for additional information. All capital ratios are estimated. Liquidity Coverage Ratio (LCR) is a preliminary estimate based on a quarterly daily average.
• All earnings per share amounts represent fully diluted earnings per common share.
• Return on average common shareholders' equity is determined by dividing annualized net income available to common equity by average common shareholders' equity for the period.
• Quarter-over-quarter (QoQ) is a sequential quarter comparison. Year-on-year (YoY) is the current period compared to the same period a year ago.
• "AUC/A" denotes Assets Under Custody and/or Administration; "AUC" denotes Assets Under Custody; "AUM" denotes Assets Under Management; "nm" denotes not meaningful; "EOP" denotes end of period.
• "FTE" denotes fully taxable-equivalent basis; NIM is presented on an FTE-basis. Refer to the Addendum for reconciliations of our FTE-basis presentation.
10

• Industry data is provided for illustrative purposes only. It is not intended to reflect State Street's or its clients' activity and is indicative of only selected segments of the entire industry.
◦ Morningstar data includes long-term mutual funds, ETF’s and Money Market funds. Mutual fund data represents estimates of net new cash flow, which is new sales minus redemptions combined with net exchanges, while ETF data represents net issuance, which is gross issuance less gross redemptions. Data for Fund of Funds, Feeder funds and Obsolete funds were excluded from the series to prevent double counting. Data is from the Morningstar Direct Asset Flows database.
◦ The long-term fund flows reported by Morningstar in North America are composed of US domiciled Market flows mainly in Equities, Allocation and Fixed Income asset classes. 2Q21 data for North America (US domiciled) includes Morningstar actuals for April and May 2021 and Morningstar estimates for June 2021.
◦ The long-term funds flows reported by Morningstar direct in EMEA are composed of the European market flows mainly in Equities, Allocation and Fixed Incomes asset classes. 2Q21 data for Europe is on a rolling three month basis for March 2021 through May 2021, sourced by Morningstar.
11

FORWARD LOOKING STATEMENTSThis News Release (and the conference call referenced herein) contains forward-looking statements within the meaning of United States securities laws, including statements about our goals and expectations regarding our business, financial and capital condition, results of operations, strategies, the financial and market outlook, dividend and stock purchase programs, governmental and regulatory initiatives and developments, expense reduction programs, new client business, and the business environment. Forward-looking statements are often, but not always, identified by such forward-looking terminology as “outlook,” “guidance,” “expect,” “priority,” “objective,” “intend,” “plan,” “forecast,” “believe,” “anticipate,” “estimate,” “seek,” “may,” “will,” “trend,” “target,” “strategy” and “goal,” or similar statements or variations of such terms. These statements are not guarantees of future performance, are inherently uncertain, are based on current assumptions that are difficult to predict and involve a number of risks and uncertainties. Therefore, actual outcomes and results may differ materially from what is expressed in those statements, and those statements should not be relied upon as representing our expectations or beliefs as of any time subsequent to the time this News Release is first issued.
Important factors that may affect future results and outcomes include, but are not limited to:
• We are subject to intense competition, which could negatively affect our profitability;
• We are subject to significant pricing pressure and variability in our financial results and our AUC/A and AUM;
• Our development and completion of new products and services, including State Street Alpha, may involve costs and dependencies and expose us to increased risk;
• Our business may be negatively affected by our failure to update and maintain our technology infrastructure;
• The COVID-19 pandemic continues to create significant risks and uncertainties for our business;
• Acquisitions, strategic alliances, joint ventures and divestitures, and the integration, retention and development of the benefits of our acquisitions, pose risks for our business;
• The integration of CRD may be more difficult, costly or time consuming than expected, and the anticipated benefits and cost synergies may not be fully realized;
• Competition for qualified members of our workforce is intense, and we may not be able to attract and retain the highly skilled people we need to support our business;
• We could be adversely affected by geopolitical, economic and market conditions;
• We have significant International operations, and disruptions in European and Asian economies could have an adverse effect on our consolidated results of operations or financial condition;
• Our investment securities portfolio, consolidated financial condition and consolidated results of operations could be adversely affected by changes in the financial markets;
• Our business activities expose us to interest rate risk;
• We assume significant credit risk to counterparties, who may also have substantial financial dependencies with other financial institutions, and these credit exposures and concentrations could expose us to financial loss;
• Our fee revenue represents a significant portion of our consolidated revenue and is subject to decline based on, among other factors, the investment activities of our clients;
• If we are unable to effectively manage our capital and liquidity, our consolidated financial condition, capital ratios, results of operations and business prospects could be adversely affected;
• We may need to raise additional capital or debt in the future, which may not be available to us or may only be available on unfavorable terms;
• If we experience a downgrade in our credit ratings, or an actual or perceived reduction in our financial strength, our borrowing and capital costs, liquidity and reputation could be adversely affected;
• Our business and capital-related activities, including common share repurchases, may be adversely affected by capital and liquidity standards required as a result of capital stress testing;
• We face extensive and changing government regulation in the jurisdictions in which we operate, which may increase our costs and compliance risks;
• We are subject to enhanced external oversight as a result of the resolution of prior regulatory or governmental matters;
• Our businesses may be adversely affected by government enforcement and litigation;
• Any misappropriation of the confidential information we possess could have an adverse impact on our business and could subject us to regulatory actions, litigation and other adverse effects;
12

• Our calculations of risk exposures, total RWA and capital ratios depend on data inputs, formulae, models, correlations and assumptions that are subject to change, which could materially impact our risk exposures, our total RWA and our capital ratios from period to period;
• Changes in accounting standards may adversely affect our consolidated financial statements;
• Changes in tax laws, rules or regulations, challenges to our tax positions and changes in the composition of our pre-tax earnings may increase our effective tax rate;
• The transition away from LIBOR may result in additional costs and increased risk exposure;
• Our control environment may be inadequate, fail or be circumvented, and operational risks could adversely affect our consolidated results of operations;
• Cost shifting to non-U.S. jurisdictions and outsourcing may expose us to increased operational risk and reputational harm and may not result in expected cost savings;
• If we, or the third parties with which we do business, experience failures, attacks or unauthorized access to our or their respective information technology systems or facilities, or disruptions to our continuous operations, this could result in significant costs, reputational damage and limits on our business activities;
• Long-term contracts expose us to pricing and performance risk;
• Our businesses may be negatively affected by adverse publicity or other reputational harm;
• We may not be able to protect our intellectual property;
• The quantitative models we use to manage our business may contain errors that could result in material harm;
• Our reputation and business prospects may be damaged if our clients incur substantial losses or are restricted in redeeming their interests in investment pools that we sponsor or manage;
• The impacts of climate change could adversely affect our business operations;
• We may incur losses as a result of unforeseen events including terrorist attacks, natural disasters, the emergence of a new pandemic or acts of embezzlement.
Other important factors that could cause actual results to differ materially from those indicated by any forward-looking statements are set forth in our 2020 Annual Report on Form 10-K and our subsequent SEC filings. We encourage investors to read these filings, particularly the sections on risk factors, for additional information with respect to any forward-looking statements and prior to making any investment decision. The forward-looking statements contained in this News Release (and the conference call referenced herein) should not by relied on as representing our expectations or beliefs as of any time subsequent to the time this News Release is first issued, and we do not undertake efforts to revise those forward-looking statements to reflect events after that time.
13