state ranking of best economic development site...
TRANSCRIPT

STATE RANKING OF BEST ECONOMIC DEVELOPMENT SITE SELECTION WEBSITE SERVICES

Sigala Inc. is a multidisciplinary corporation with a mission of providing the highest level of professional and quality services to both public and private sector clients involved in planning and development processes. Our principals have extensive experience in urban planning, real estate and economics, housing, and development project management in
cities throughout the United States.
www.sigalainc.com

3State Ranking of BeSt economic Development Site Selection WeBSite SeRviceS
SigalaINC Development and Consulting Services © 2014
Table of ConTenTs
sTaTe Ranking of besT eConomiC DevelopmenT siTe seleCTion websiTe seRviCes 4meTHoDologY: How THe sTaTes weRe RankeD 5essenTial elemenTs of a sUCCessfUl online eConomiC DevelopmenT pRogRam 6Ranking of sTaTe siTe seleCTion websiTe seRviCes 8
RANKING BY REGION 10RANKINGS BY SIZE OF STATE POPULATION 11RANKINGS BY SOFTWARE VENDORS 12RANKING BY THE FOUR MAIN CATEGORIES 13
websiTe aDDRess loCaTions 14oTHeR keY obseRvaTions 16

State Ranking of BeSt economic Development Site Selection WeBSite SeRviceS 4
SigalaINC Development and Consulting Services © 2014
sTaTe Ranking of besT eConomiC DevelopmenT siTe seleCTion websiTe seRviCes
US states are competing actively and aggressively to help businesses start up, expand, and relocate into their area to foster economic development. The need
for and importance of business investment has grown as a result of challenging economic times across the nation and high unemployment rates. In many cases states are actively trying to recruit businesses to take these businesses from competing states.
A primary way that states are promoting themselves as at-tractive for business investment is by convincing the com-pany that their location meets the unique needs of each business and that a place in their state provides a superior location advantage.
Given that businesses and consumers are performing much of their initial research online before making a buying or investment decision, state economic development agencies have responded by providing online corporate site location assistance services to enable businesses to research opti-mal locations.
Since this goal of investment attraction is so important, and the process of assisting businesses in this process is so fun-damental to state economic development activities, this study compares and ranks the online site selection analysis and assistance websites of all 50 US states based on quantitative metrics.
The four key elements of an online economic development investment attraction strategy are:
1. Lead generation2. Community search3. Property search4. Location analysis
The methodology of this research project is discussed in the next section. This is then followed by further discussion of the four essential elements of the corporate site location process, state rankings, vendor review, and analysis of re-sults.

5State Ranking of BeSt economic Development Site Selection WeBSite SeRviceS
SigalaINC Development and Consulting Services © 2014
meTHoDologY: How THe sTaTes weRe RankeD
All of the states were ranked across the four major func-tional site location categories and by over 300 individ-
ual measurement variables within them. Each of these four categories had a total possible point value of 25 and an aggregate possible total of 100. Within each of the over 300 variables, the state that had the highest performance received 100% of the points possible for that variable. All other states’ points were assigned as a portion of the total possible points relative to the top-performing state for that variable.
After the point totals for each of the four main categories were added up, the state with the most points in each cate-gory received 100% of the points available. So at least one state in each of these four categories received the maximum 25 points.
All of the points for the four categories were then added up, leading to the overall state ranking based on a possible perfect total of 100 points.
State rankings were then analyzed and filtered based on overall ranking, regional ranking, and ranking by size of population. The overall ranking compares all of the states. The regional ranking separates the states into four regions of the USA as divided by the economic development profes-sion’s own regional membership associations. The ranking by the state’s population size uses a mathematical algorithm called “natural breaks” for dividing the states into five simi-larly grouped categories of very large, large, medium, small, and very small states.
Each state economic development agency was contacted, re-questing that the staff provide the website address of their main website and the specific address of their site selection website service. The websites evaluated were based on the information provided by each state. Research was conducted during the month of August 2013 to gather all of the raw data for each state’s website. Analysis was conducted from September 2013 to January 2014. During the time of this analysis, four states’ EDAs replaced or eliminated their online site selection services. These were Florida, Minnesota, Ore-
gon, and Rhode Island. Each of these four states was reeval-uated in January of 2014 and new statistics were collected for these states, which are included in this analysis. No data collection occurred after January 15, 2014. Georgia was the only state that, from one webpage, directed website users to four different site selection website services. Given that the website with the four websites listed was selected by staff during the initial phase of research, all four of the site se-lection websites were evaluated. The average scores for the four websites were used in the ranking. Georgia’s websites ranged in quality and some would have been among the best rankings and others among the worst.

State Ranking of BeSt economic Development Site Selection WeBSite SeRviceS 6
SigalaINC Development and Consulting Services © 2014
essenTial elemenTs of a sUCCessfUl online eConomiC DevelopmenT pRogRam
1. Lead Generation
State economic development agencies are marketing their online site selection assistance services directly to com-
panies through a number of channels. They are also making sure that they can serve their business customers in multiple online formats.
This category of analysis and measurement includes the network of online marketing initiatives that state economic development agencies (EDAs) are implementing, including marketing in corporate real estate and/or national business publications’ websites, inclusion in national site selection portals, presence on related federal websites, blogs, social media, and search engine optimization. Also, some states are making their services more easily available and usable by providing their services in device-optimized ways that enable device-appropriate searching on smartphones or tablets.
Analysis: State EDAs are using increasingly more sophisticated online mar-keting to help businesses find their services when it’s time to con-sider a business location decision. Some of these methods play to the advantages of government organizations such as Search Engine Optimization (SEO), as government websites automatical-ly have higher relevance ranking on the leading search engines. Sophisticated organizations are providing comparable experienc-es whether the businessperson is on their desktop, smartphone, or tablet. Also, states are growing their communication influence through social media, although there are huge disparities between the states with the most and least reach on social media platforms. In addition, states are going beyond the website locations they own to place themselves where their customers are, and doing research online through national site selection portals, corporate real estate websites, and traditional business publications’ websites.
2. Community Search
The first phase of the corporate site location process is the evaluation, analysis, and selection of the correct
community to meet the business needs of the company. This is a critical part of the process because the next phases of decision-making are built upon this inital analysis of loca-tion. After the “Situation Assessment” of a business location project for its corporate clients, KPMG Global Location and Expansion Services refers to their next step in their process, which includes the search for potential community locations, as “Location Screening”.
The Community Search phase involves seeking a location such as a metro, county, or city that meets the specific re-quirements of the business. These usually include analysis of and filtering locations based on issues related to the demo-graphics, labor force, access to transportation and logistical advantages, cost-related factors, consumers, community amenities, industry suitability, and the presence of business competitors, suppliers, and customers. The state websites were measured and ranked based on the quality and ability to provide these services.
Analysis: Considering the primary and essential importance of finding the right community location in a state for a business in the overall site selection process, it is concerning that 40% of states provide no service to assist in this process at all. Consequently, states without this search functionality offer no way to search for specific commu-nities that match a business’ needs based on demographic, busi-ness, and geographic characteristics. The states that do provide this assistance make the process of finding the optimal location in their state easier.

7State Ranking of BeSt economic Development Site Selection WeBSite SeRviceS
SigalaINC Development and Consulting Services © 2014
3. Property Search
After finding a suitable community or communities to potentially locate a business, the company must find
an actual location for them to operate. State EDAs enable businesses to more rapidly find a specific location to open by providing a searchable database of properties that can typically be filtered by sites, buildings, property type, building characteristics, size, cost, and incentives. Property reports can include detailed information, multi-media, and contact resources for a business interested in the property.
Analysis: Most states had a searchable database of properties and, com-pared to the wider performance gaps in other categories of com-parison, performed relatively well in this comparison. Only seven states did not provide this service to businesses. Of the states that had a searchable database, there were varying levels of the quantity of variables that could be searched on and the ease of use of searching for properties.
4. Location Analysis
The saying goes that the three most important elements of real estate are “location, location, location,” and that
certainly is the case for analyzing the business viability of a specific location within a city. Although a metro, county, or city may have the overall characteristics a business is looking for, if the needed elements aren’t all at or nearby the specific location the business will locate, it can be a bad match. For example, having railroad access in the county isn’t the same as having railroad access directly from the property. Having a great customer or employee base on one side of the met-ro-region that is 30 miles away from the potential business location won’t work if customers or employees typically only travel 15 miles for work or to get services. If being near a concentration of businesses in a specific industry is essen-tial, then they actually have to be nearby and not just within the political boundary of the municipality.
Some state EDAs help companies understand the specific characteristics of a potential business site by making that address the center of the location analysis. They also enable the business to custom-define the distance of their analysis around the unique location. This also addresses the reality that political boundaries often have no relationship to labor sheds or geographic business markets that companies oper-ate within. Property specific data provided at business-de-fined distances of miles or drive-time around the potential business location can include data for demographics, labor, consumer spending and segmentation, wages, housing, in-come, businesses, industries, and industry clusters.
Analysis: There was a wide disparity between the high and low performing states for this measurement. The high scoring states had more data, more data categories, and detailed information for the data variables provided. They also had greater ability for website visitors to customize the data analysis. The highest ranked states had deep integration of the data reports, with visualization of the data by ge-ography on interactive maps. This was especially the case with the ability to search, filter, and visualize industries by business sector on interactive maps. There was also disparity related to the user interface and usability of some of the reports. Higher performing states had the data integrated directly into their website that was produced quickly and could be modified easily, while lower-per-forming websites produced static reports in separate documents or reports that were less easy to access as pop-ups. However, 10% of the states provided none of this type of location-specific information at all.

State Ranking of BeSt economic Development Site Selection WeBSite SeRviceS 8
SigalaINC Development and Consulting Services © 2014
Ranking of sTaTe siTe seleCTion websiTe seRviCes
Rank sTaTeleaD
geneRaTionCommUniTY
siTe seleCTionpRopeRTY
seaRCHloCaTion analYsis
ToTal sCoRe
1 indiana 25.00 25.00 19.89 24.96 94.85
2 michigan 20.80 25.00 23.23 22.64 91.67
3 wisconsin 18.20 25.00 25.00 23.13 91.33
4 idaho 22.63 24.44 19.86 22.45 89.39
5 new York 17.98 25.00 21.50 23.79 88.27
6 Connecticut 18.91 25.00 20.70 22.41 87.03
7 pennsylvania 16.85 25.00 21.22 22.50 85.56
8 oklahoma 18.70 25.00 18.91 22.27 84.89
9 new Jersey 16.68 25.00 18.18 25.00 84.86
10 oregon 18.05 24.44 18.84 21.63 82.96
11 massachusetts 16.97 25.00 17.72 22.95 82.64
12 alaska 18.35 24.44 14.76 24.77 82.33
13 arizona 17.15 25.00 15.11 22.42 79.68
14 wyoming 17.47 24.44 14.70 22.63 79.25
15 Texas 20.66 24.44 0.00 24.97 70.07
16 georgia (avg.)* 9.88 15.67 15.51 13.90 54.97
17 maryland 20.41 0.00 15.63 10.75 46.79
18 new mexico 13.26 6.39 18.21 7.70 45.57
19 north Carolina 14.97 2.64 17.76 10.17 45.53
20 nebraska 16.66 0.00 17.22 9.70 43.58
21 Tennessee 15.43 1.11 12.94 12.82 42.31
22 iowa 12.37 2.36 17.31 10.16 42.20
23 illinois 10.20 0.00 21.95 10.04 42.18
24 nevada 15.87 3.19 11.79 10.98 41.83
25 minnesota 10.16 0.83 19.93 10.61 41.53
* Georgia was the only state that, from one webpage, directed website users to four different site selection website services. All four websites were evaluated and the average of the four websites was used for the ranking.

9State Ranking of BeSt economic Development Site Selection WeBSite SeRviceS
SigalaINC Development and Consulting Services © 2014
Rank sTaTeleaD
geneRaTionCommUniTY
siTe seleCTionpRopeRTY
seaRCHloCaTion analYsis
ToTal sCoRe
26 Rhode island 9.98 1.11 15.83 13.75 40.66
27 missouri 9.32 0.83 20.89 9.52 40.56
28 Colorado 10.58 1.11 14.12 13.74 39.55
29 virginia 12.23 10.09 12.24 4.14 38.69
30 kansas 10.68 0.83 16.86 10.08 38.45
31 kentucky 7.93 3.75 12.62 14.12 38.42
32 ohio 9.60 0.00 15.63 11.38 36.61
33 mississippi 9.50 0.00 16.26 9.34 35.11
34 montana 3.23 0.00 9.92 17.47 30.62
35 north Dakota 6.08 14.71 3.66 2.43 26.87
36 south Dakota 7.97 1.11 12.26 5.23 26.57
37 louisiana 7.08 0.00 13.28 5.92 26.28
38 south Carolina 9.41 0.00 12.79 0.24 22.44
39 florida 11.78 0.00 0.00 6.82 18.61
40 Utah 9.69 0.00 6.63 0.97 17.29
41 arkansas 0.14 0.00 11.22 5.33 16.69
42 alabama 4.11 0.00 10.72 0.97 15.79
43 vermont 8.86 0.00 6.57 0.00 15.43
44 west virginia 7.24 0.00 6.34 0.74 14.33
45 washington 11.36 0.00 0.00 0.00 11.36
46 new Hampshire 11.13 0.00 0.00 0.00 11.13
47 California 4.60 0.00 1.96 2.33 8.89
48 Delaware 7.27 0.00 0.00 0.00 7.27
49 maine 4.61 0.00 0.00 1.10 5.70
50 Hawaii 4.63 0.00 0.00 0.00 4.63

State Ranking of BeSt economic Development Site Selection WeBSite SeRviceS 10
SigalaINC Development and Consulting Services © 2014
Ranking bY Region
Rank sTaTe ToTal sCoRe
1 indiana 94.85
2 michigan 91.67
3 wisconsin 91.33
4 nebraska 43.58
5 iowa 42.20
Midwest
Rank sTaTe ToTal sCoRe
1 new York 88.27
2 Connecticut 87.03
3 pennsylvania 85.56
4 new Jersey 84.86
5 massachusetts 82.64
Northeast
Rank sTaTe ToTal sCoRe
1 oklahoma 84.89
2 Texas 70.07
3 georgia (avg.) 54.97
4 north Carolina 45.53
5 Tennessee 42.31
South
Rank sTaTe ToTal sCoRe
1 idaho 89.39
2 oregon 82.96
3 alaska 82.33
4 arizona 79.68
5 wyoming 79.25
West

11State Ranking of BeSt economic Development Site Selection WeBSite SeRviceS
SigalaINC Development and Consulting Services © 2014
Rankings bY siZe of sTaTe popUlaTion
Rank sTaTeToTal sCoRe
2013 CensUs
esTimaTe
1 new York 88.27 19,651,127
2 Texas 70.07 26,448,193
3 illinois 42.18 12,882,135
4 florida 18.61 19,552,860
5 California 8.89 38,332,521
Very large Large
Medium Small
Very small
Rank sTaTeToTal sCoRe
2013 CensUs
esTimaTe
1 indiana 94.85 6,570,902
2 wisconsin 91.33 5,742,713
3 massachusetts 82.64 6,692,824
4 arizona 79.68 6,626,624
5 maryland 46.79 5,928,814
Rank sTaTeToTal sCoRe
2013 CensUs
esTimaTe
1 idaho 89.39 1,612,136
2 alaska 82.33 735,132
3 wyoming 79.25 582,658
4 new mexico 45.57 2,085,287
5 nebraska 43.58 1,868,516
Rank sTaTeToTal sCoRe
2013 CensUs
esTimaTe
1 michigan 91.67 9,895,622
2 pennsylvania 85.56 12,773,801
3 new Jersey 84.86 8,899,339
4 georgia (avg.) 54.97 9,992,167
5 north Carolina 45.53 9,848,060
Rank sTaTeToTal sCoRe
2013 CensUs
esTimaTe
1 Connecticut 87.03 3,596,080
2 oklahoma 84.89 3,850,568
3 oregon 82.96 3,930,065
4 iowa 42.20 3,090,416
5 nevada 41.83 2,790,136

State Ranking of BeSt economic Development Site Selection WeBSite SeRviceS 12
SigalaINC Development and Consulting Services © 2014
Rankings bY sofTwaRe venDoRs
#4511.36
#1082.96
#478.89
#4017.29
#2839.55
#2640.66
#3038.45
#489.39 #14
79.25
#1379.68
#1570.07
#1282.33
#504.63
#1845.57
#4611.13
#4315.43
#3236.61
#3138.42
#4414.33
#687.03
#984.86
#3430.62
#884.89
#2043.58
#3626.57
#3526.87
#2541.53
#2242.2
#2740.56
#4116.69
#3726.28
#1654.97
#3335.11
#2342.18
#391.33
#291.67
#194.85
#588.27
#785.56
#1182.64
#1746.79
#2142.31
#3918.61
#487.27
#4215.79
#3822.44
#1945.53
#2938.69
#2441.83
#495.7
GIS Planning (15 states)
LocationOne (8 states)
Atlas Advertising (5 states)
Other 3rd party vendors (7 states)
Internal (8 states)
N/A (6 states)
Georgia: multiple services

13State Ranking of BeSt economic Development Site Selection WeBSite SeRviceS
SigalaINC Development and Consulting Services © 2014
Ranking bY THe foUR main CaTegoRies
State rankings for the four main categories of analysis are broken down in the following tables. Each category has a maximum score of 25 points.
Lead GenerationThese five top scoring state websites all offered a variety of well-developed initiatives to drive traffic back to their sites, including search engine optimization, social media, national portals, and other factors.
Rank sTaTeleaD geneRaTion
sCoRe
1 indiana 25.00
2 idaho 22.63
3 michigan 20.80
4 Texas 20.66
5 maryland 20.41
Community SearchTen states tied for first place due to their use of the same community search software tool from the same vendor (GIS Planning).
Rank sTaTeCommUniTY siTe
seleCTion sCoRe
1 arizona 25.00
1 Connecticut 25.00
1 indiana 25.00
1 massachusetts 25.00
1 michigan 25.00
1 oklahoma 25.00
1 pennsylvania 25.00
1 new Jersey 25.00
1 new York 25.00
1 wisconsin 25.00
Property SearchHigh property search scores were determined for each state site selection website by ease of use, the variety of search variables, customized search tools, property availability, and dynamic mapping.
Rank sTaTepRopeRTY seaRCH
sCoRe
1 wisconsin 25.00
2 michigan 23.23
3 illinois 21.95
4 new York 21.50
5 pennsylvania 21.22
Location AnalysisThe high scoring states had more data, more data catego-ries, and detailed information for the data variables pro-vided. They also had greater ability for website visitors to customize the data analysis. The highest ranked states had deep integration of the data reports with visualization of the data by geography on interactive maps, as well as the ability to search, filter and visualize industries by business sector on interactive maps. Integrated reporting functionality was scored higher than static reports.
Rank sTaTeloCaTion analYsis
sCoRe
1 new Jersey 25.00
2 Texas 24.97
3 indiana 24.96
4 alaska 24.77
5 new York 23.79
State Ranking of BeSt economic Development Site Selection WeBSite SeRviceS 14
SigalaINC Development and Consulting Services © 2014
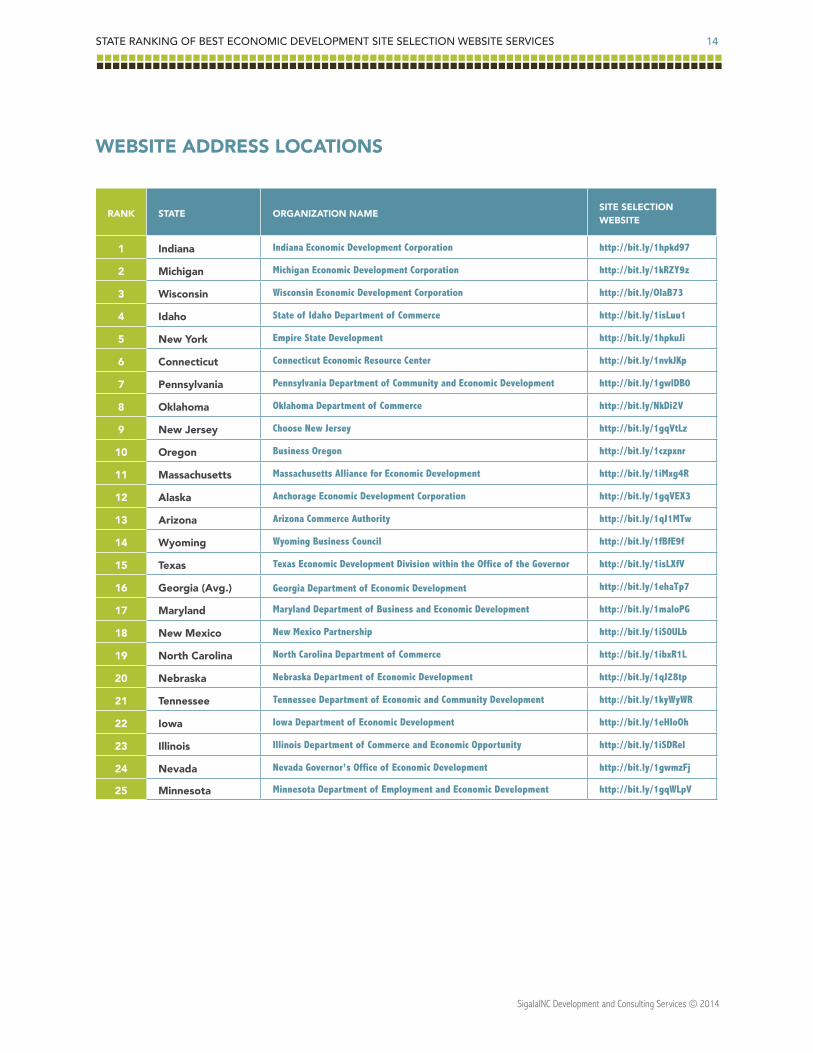
Rank sTaTe oRganiZaTion namesiTe seleCTion websiTe
1 indiana Indiana Economic Development Corporation http://bit.ly/1hpkd97
2 michigan Michigan Economic Development Corporation http://bit.ly/1kRZY9z
3 wisconsin Wisconsin Economic Development Corporation http://bit.ly/OlaB73
4 idaho State of Idaho Department of Commerce http://bit.ly/1isLuu1
5 new York Empire State Development http://bit.ly/1hpkuJi
6 Connecticut Connecticut Economic Resource Center http://bit.ly/1nvkJKp
7 pennsylvania Pennsylvania Department of Community and Economic Development http://bit.ly/1gwlDB0
8 oklahoma Oklahoma Department of Commerce http://bit.ly/NkDi2V
9 new Jersey Choose New Jersey http://bit.ly/1gqVtLz
10 oregon Business Oregon http://bit.ly/1czpxnr
11 massachusetts Massachusetts Alliance for Economic Development http://bit.ly/1iMxg4R
12 alaska Anchorage Economic Development Corporation http://bit.ly/1gqVEX3
13 arizona Arizona Commerce Authority http://bit.ly/1qJ1MTw
14 wyoming Wyoming Business Council http://bit.ly/1fBfE9f
15 Texas Texas Economic Development Division within the Office of the Governor http://bit.ly/1isLXfV
16 georgia (avg.) Georgia Department of Economic Development http://bit.ly/1ehaTp7
17 maryland Maryland Department of Business and Economic Development http://bit.ly/1maloPG
18 new mexico New Mexico Partnership http://bit.ly/1iS0ULb
19 north Carolina North Carolina Department of Commerce http://bit.ly/1ibxR1L
20 nebraska Nebraska Department of Economic Development http://bit.ly/1qJ28tp
21 Tennessee Tennessee Department of Economic and Community Development http://bit.ly/1kyWyWR
22 iowa Iowa Department of Economic Development http://bit.ly/1eHIoOh
23 illinois Illinois Department of Commerce and Economic Opportunity http://bit.ly/1iSDReI
24 nevada Nevada Governor’s Office of Economic Development http://bit.ly/1gwmzFj
25 minnesota Minnesota Department of Employment and Economic Development http://bit.ly/1gqWLpV
websiTe aDDRess loCaTions

15State Ranking of BeSt economic Development Site Selection WeBSite SeRviceS
SigalaINC Development and Consulting Services © 2014
Rank sTaTe oRganiZaTion namesiTe seleCTion websiTe
26 Rhode island Rhode Island Economic Development Corporation http://bit.ly/1od9KCi
27 missouri Missouri Department of Economic Development http://on.mo.gov/XfTf0m
28 Colorado Colorado Office of Economic Development and International Trade http://bit.ly/1fBg7s6
29 virginia YesVirginia http://bit.ly/1iby3xU
30 kansas Kansas Department of Commerce http://bit.ly/1kT6asF
31 kentucky Kentucky Cabinet for Economic Development http://bit.ly/1gCQA2D
32 ohio JobsOhio http://bit.ly/1dbeHEU
33 mississippi Mississippi Development Authority http://bit.ly/1uLQI8X
34 montana Montana West Economic Development http://bit.ly/1d4FeZV
35 north Dakota North Dakota Department of Commerce http://1.usa.gov/NkEDqu
36 south Dakota South Dakota Governor's Office of Economic Development http://bit.ly/1nvmhnE
37 louisiana Louisiana Economic Development http://bit.ly/1dbf0Q4
38 south Carolina South Carolina Department of Commerce http://bit.ly/1kV89SJ
39 florida Enterprise Florida n/a
40 Utah Economic Development Corporation Utah http://bit.ly/1p0VhrA
41 arkansas Arkansas Economic Development Commission http://bit.ly/1hpmdOM
42 alabama Economic Development Partnership Alabama http://bit.ly/1osOmMy
43 vermont Vermont Agency of Commerce & Community Development http://bit.ly/1gwn7et
44 west virginia West Virginia Department of Commerce http://bit.ly/1nvmzLd
45 washington Washington Department of Commerce http://bit.ly/Old8hy
46 new Hampshire New Hampshire Department of Resources and Economic Development n/a
47 California California Go Biz http://bit.ly/1p0Vv1N
48 Delaware Delaware Economic Development Office n/a
49 maine Maine and Company http://bit.ly/1iS2b52
50 Hawaii State of Hawaii Dept of Business, Economic Development & Tourism n/a
All of the above URLs were functional as of January 2014. Links that are non-functional after the time of writing may be due to subsequent changes in service providers, technical problems, or redesign.
Due to the long length of actual EDA website URLs, they were shortened using a URL shortening service. By entering in these URLs you will be directed to the original EDA website services URLs.

State Ranking of BeSt economic Development Site Selection WeBSite SeRviceS 16
SigalaINC Development and Consulting Services © 2014
oTHeR keY obseRvaTions
Many of the key results of this ranking are analyzed in other places in this report. However there were some
additional quantitative and qualitative observations that emerged through the research and analysis of this ranking of the states.
EDA staff doesn’t know their own services
During the initial period of research, economic develop-ment staff were contacted for the Internet address of
their site selection assistance services. On several occa-sions, staff said that their state websites did not provide any such services. To validate whether a state did or did not have these services, each website was visited to try to find any services. In some cases the states actually did provide these online services, even though EDA state staff indicated they were not available. It seems that there are communication problems internal to state EDAs where their own staff do not know their own programs or services.
Outsourcing
In general, the highest ranked states outsourced their site selection assistance and analysis websites to private com-
panies that specialize in providing these services. The lower performing states tended to offer no comprehensive service or built a system internally. There were some exceptions to this trend, such as North Carolina, which built their own ser-vice and is ranked #19, and Virginia, which also built an internal service and is ranked #29. It’s notable that the top ranked states all used GIS Planning’s ZoomProspector soft-ware. Other third-party vendors’ services and internally-built systems were used by some of the states found in the middle and bottom of the rankings.
States are not always the best source of site selec-tion analysis information
Although local economic development agencies may have good information at the metro, county, or city level for
site selection analysis, utility companies that are involved in economic development may have the most comprehensive statewide data relevant to site selection analysis and eval-uation on their websites. In the case of Georgia, 3 of the 4 site selection services available on the state’s website are
provided by Georgia-based utility companies and all of their websites outranked the state’s own site selection assistance service.
Varying data quality
On some of the states’ websites, the data provided re-lated to communities was out of date or no date was
included at all. On one website, the data was listed as being from 2004. Another problem was that frequently data did not have a description of the source of the data, which will likely confuse businesses using the website or make them suspicious of the data and how current it is. On several of the websites, states had multiple reports that just repeated the same demographic information in each of the reports, perhaps in an attempt to make it look like the state had more data. The best websites had more and detailed data that was easy to access, customize, and visualize.
Mobility
Business people are frequently traveling and access-ing information on the go with mobile devices such as
smartphones and tablets. Some of the state websites were extremely difficult to use because they were not designed for mobile devices, or the websites simply squeezed all the information that might be visible on a large desktop monitor onto the small space of a smartphone screen. The highest quality state site selection analysis services provided a mo-bile version with features optimized with a different design for use on smart phones and tablets. Trends indicate that increasingly people will access information through mobile Internet devices, and this trend will impact the value of these state website services (Mary Meeker & Liang Wu, 2013 Internet Trends).
