state of the world's cities 2010-2011: bridging the urban divide - overview and key findings
DESCRIPTION
The world's urban population now exceeds the world's rural population. What does this mean for the state of our cities, given the strain this global demographic shift is placing upon current urban infrastructure? Following on from previous State of the World's Cities reports, this edition uses the framework of 'The Urban Divide' to analyze the complex social, political, economic and cultural dynamics of urban environments. The book focuses on the concept of the 'right to the city' and ways in which many urban dwellers are excluded from the advantages of city life, using the framework to explore links among poverty, inequality, slum formation and economic growth. The volume will be essential reading for all professionals and policymakers in the field, and a valuable resource for researchers and students in all aspects of urban developmentTRANSCRIPT
Overview and Key Findings

Acknowledgements
Core TeamDirector: Oyebanji Oyeyinka Coordinator: Eduardo López MorenoStatistical Adviser: Gora Mboup
Principal Authors: Eduardo López Moreno, Oyebanji Oyeyinka, Gora MboupEditorial Management: Thierry Naudin, Rasna WarahEditorial Support: Darcy Varney
Support TeamContributors: Padmashree Sampath, Cecilia Zanetta, Miloon Kothari, Shivani Chaudhry, Christopher WilliamsResearch: Gianluca Crispi, Raymond Otieno Otieno, Anne AminGraphs: Gianluca Crispi, Azad Amir-Ghassemi, Raymond Otieno OtienoMaps: Jane ArimahStatistics: Julius Majale, Philip Mukungu, Souleymane Ndoye, Wandia Riunga, Barbara Agonga-Williams, Wladimir RayAdministrative Assistance: Anne Idukitta, Elizabeth Kahwae, Mary Dibo
(The complete list of acknowledgements can be found in the full report.)
Cover design and page layout: Michael Jones SoftwareCover montage: Boston Street ©Jorge Salcedo/Shutterstock and Kathmandu, Nepal ©Dhoxax/Shutterstock.
Copyright © United Nations Human Settlements Programme, 2010.
All rights reserved
For more information contact:United Nations Human Settlements Programme (UN-HABITAT)P.O. Box 30030, Nairobi, KenyaTel: +254 20 7621 234Fax: +254 20 7624 266/7E-mail: [email protected] Website: www.unhabitat.org
DISCLAIMER
The designations employed and the presentation of the material in this report do not imply the expression of any opinion whatsoever on the part of the Secretariat of the United Nations concerning the legal status of any country, territory, city or area, or of its authorities, or concerning delimitation of its frontiers or boundaries, or regarding its economic system or degree of development. The analysis, conclusions and recommendations of this report does not necessarily reflect the views of the United Nations Human Settlements Programme or its Governing Council.
The emerging picture of the 21st century city fits many descriptions. Some are centres of rapid industrial growth and wealth creation, often accompanied by harmful waste and pollution.
Others are characterized by stagnation, urban decay and rising social exclusion and intolerance. Both scenarios point to the urgent need for new, more sustainable approaches to urban development. Both argue for greener, more resilient and inclusive towns and cities that can help combat climate change and resolve age-old urban inequalities.
The 2010/11 State of the World’s Cities Report, “Bridging the Urban Divide” examines the social, economic, cultural and political drivers of urban poverty and deprivation. It argues that much inequality and injustice stems from inadequate policy-making and planning by local authorities and central governments alike. Typical remedies include removing barriers that prevent access to land, housing, infrastructure and basic services, and facilitating rather than inhibiting
Foreword
participation and citizenship. The report also emphasizes that lasting gains are best achieved through a combination of local action and national enabling policies.
As we grapple with old and new challenges in a rapidly urbanizing world, this timely report can help inform research, policy dialogue and development planning for years to come. I commend its findings to all who are working to create the just, green and dynamic environments that the inhabitants of the world’s towns and cities need to thrive.
Ban Ki-moonSecretary-GeneralUnited Nations

Introduction
This State of the World’s Cities Report (2010/11)is published in a very important year – a key milestone that marks the halfway point towards the deadline for the “slum target” of the Millennium
Development Goals. Government efforts to reduce the number of slum dwellers show some positive results.
According to new estimates presented in this Report, between the year 2000 and 2010 over 200 million people in the developing world will have been lifted out of slum conditions. In other words, governments have collectively exceeded the Millennium Target by at least a multiple of two. However, this achievement is not uniformly distributed across regions. Success is highly skewed towards the more advanced emerging economies, while poorer countries have not done as well. For this reason, there is no room for complacency, because in the course of the same years the number of slum dwellers increased by six million every year. Based on these trends it is expected that the world’s slum population will continue to grow if no corrective action is taken in the coming years.
This Report highlights the unprecedented challenges which urbanization throws at the world’s cities today – particularly in the South – and the attendant urban divide which we all have to address collectively to stem the multiple deprivations that follow from unequal growth. These challenges include grinding poverty, environmental degradation, income in-equalities, historical socio-economic inequalities, marginal-ization and various forms of exclusion.
Achieving sustainable urban development is likely to prove impossible if the urban divide is allowed not only to persist, but to continue growing, opening up an enormous gap, even in some cities a gulf, an open wound, which can produce social instability or at least generate high social and economic costs not only for the urban poor, but for society at large.
This edition of the Report underlines the choices available to policymakers across the range of economic, social, cultural and political challenges that are needed to bridge the urban divide. It charts a new course of action, with the steps and levers needed to achieve a more inclusive city, emphasizing the need for comprehensive and integrated responses that go beyond a compartmentalized, short-term perspective.
The Report benefits enormously from context-specific knowledge drawing in large part on regional perspectives and information, in a bid to inspire evidence-based local policy responses. In that sense, this Report contributes to bridge the gap between scientific information and societal action, which is a simple, but fundamental requisite, to promote equity and sustainability for more harmonious cities.
Anna K. TibaijukaUnder-Secretary-General and Executive DirectorUnited Nations Human Settlements Programme (UN-HABITAT)
Overview and Key Findings
The world is inexorably becoming urban. By 2030 all developing regions, including Asia and Africa, will have more people living in urban than rural areas. In the next 20 years, Homo sapiens, “the wise
human”, will become Homo sapiens urbanus in virtually all regions of the planet.
Cities – whether large or small, whole neighbourhoods, city centres, suburban or peri-urban areas – offer human beings the potential to share urban spaces, participate in public and private events and exercise both duties and rights. These opportunities in turn make it possible to cultivate societal values and define modes of governance and other rules that enable human beings to produce goods, trade with others and get access to resources, culture, and various forms of riches or well-being.
Cities can be open or closed with regard to residents’ ability to access, occupy and use urban space, and even produce new spaces to meet their needs. Cities can also be open or closed in terms of residents’ ability to access decisions and participate in various types of interaction and exchange. Some residents find the city as the place where social and political life takes place, knowledge is created and shared, and various forms of creativity and art are developed; other residents find that the city denies them these opportunities. Cities can therefore be places of inclusion and participation, but they can be also places of exclusion and marginalization.
The Urban Divide
Cities are constantly changing. They are built, rebuilt, transformed, occupied by different groups, and used for different functions. In the search for better spatial organization for higher returns, more efficient economies of scale and other agglomeration benefits, cities generate various degrees of residential differentiation. In most urban areas of the developed world, the segmentation of spaces for different uses is relatively visible, although social heterogeneity and mixed uses remain widespread. In contrast, in many cities of the developing world, the separation of uses and degrees of prosperity are so obvious that the rich live in well-serviced neighbourhoods, gated communities and well-built formal settlements, whereas the poor are confined to inner-city or peri-urban informal settlements and slums.
Cities, particularly in the South, are far from offering equal conditions and opportunities to their resident communities. The majority of the urban population is prevented from, or restricted in, the fulfillment of their basic needs because of their economic, social or cultural status, ethnic origins, gender or age. Others, a minority, benefit from the economic and social progress that is typically associated with urbanization. In some of these cities, the urban divide between “haves” and
“have nots” opens up a gap – if not, on occasion, a chasm, an open wound – which can produce social instability or at least generate high social and economic costs not only for the urban poor, but for society at large.
Cities are, more often than not, divided by invisible borders. These split the “centre” from the “off-centre”, or the “high” from the “low”, as the urban divide is colloquially referred to in many parts of the South. These man-made demarcations are often completely different along a spatial and social continuum, reflecting the only difference experienced by their respective populations: socio-economic status. Closer assessment of the urban space in many cities of the developing world sheds forensic light on the fragmentation of society, marking out differences in the way space and opportunities are produced, appropriated, transformed and used. Some areas feature significant infrastructure, well-kept parks, gardens and up-market residential areas. In contrast, other areas are characterized by severe deprivation, inadequate housing, deficient services, poor recreation and cultural facilities, urban decay, and scarce capital investment in public infrastructure. These tangible differences in access come as symptoms of the intangible yet enduring divisions in society that apportion unequal opportunities and liberties across residents.
The physical divide takes the form of social, cultural and economic exclusion. Large sections of society are frequently excluded on grounds of predetermined attributes over which they have no control at all, such as gender, age, race, or ethnicity, or over which they have very little control, such as where they live (slums vs. rich neighbourhoods) or what they own (income and social status). However, this narrow perspective overlooks the actual and potential contributions of marginalized groups to the building of cities and nations, and therefore can only delay progress toward sustainable and inclusive development.
The urban divide is the face of injustice and a symptom of systemic dysfunction. A society cannot claim to be harmoni-ous or united if large numbers of people cannot meet their basic needs while others live in opulence. A city cannot be harmonious if some groups concentrate resources and oppor-tunities while others remain impoverished and deprived.
Yet cities are not – and should not be – “the world which man created, and therefore the world in which he is hence-forth condemned to live”. Cities are, on the contrary, vehicles for social change: places where new values, beliefs and ideas can forge a different growth paradigm that promotes rights and opportunities for all members of society. Based not only on moral and ethical arguments but also practical access to opportunity, the concept of an “inclusive city”, or “a city for all”, encompasses the social and economic benefits of greater equality, promoting positive outcomes for each and every in-dividual in society.

STA
TE
OF
TH
E W
OR
LD
’S C
ITIE
S 20
10/2
011
- OV
ER
VIE
W
4
Urbanization: A Positive Force for Transformation
By the mid-20th century, three out of 10 people on the planet lived in urban areas. At that time, and over the following three decades, demographic expansion was at its fastest in cities around the world. Subsequently, a slow but steady process of deceleration took over. Today, half the world’s population lives in urban areas and by the middle of this century all regions will be predominantly urban, with the tipping point in Eastern Africa anticipated slightly after 2050. According to current projections, virtually the whole of the world’s population growth over the next 30 years will be concentrated in urban areas.
Although many countries have adopted an ambivalent or hostile attitude to urbanization, often with negative consequences, it appears today that this worldwide process is inevitable. It is also generally positive, as it brings a number of fundamental changes, namely: (a) in the employment sector, from agriculture-based activities to mass production and service industries; (b) in societal values and modes of governance; (c) in the configuration and functionality of human settlements; (d) in the spatial scale, density and activities of cities; (e) in the composition of social, cultural and ethnic groups; and (f ) in the extension of democratic rights, particularly women’s empowerment.
Using a wealth of significant and comparative new data, this Report identifies the trends, both similar and dissimilar, that characterize urbanization in various regions and countries; it does so against a background of significant recent changes, such as accelerated expansion or shrinking of cities, ageing populations, urban and regional dynamics and regional location factors, among others. In this respect, it is worth mentioning two significant trends that can either help bridge or exacerbate the urban divide:
• Cities are merging together to create urban settlements on a massive scale. These configurations take the form of mega-regions, urban corridors and city-regions. They are emerging in various parts of the world, turning into spatial units that are territorially and functionally bound by eco-nomic, political, socio-cultural, and ecological systems. Cities in clusters, corridors and regions are becoming the new engines of both global and regional economies, and they reflect the emerging links between urban expan-sion and new patterns of economic activity. However, as they improve inter-connectivity and create new forms of interdependence among cities, these configurations can also result in unbalanced regional and urban develop-ment as they strengthen ties to existing economic centres, rather than allow for more diffused spatial development.
1Urban Trends
City-regions
Urban corridors
Mega-regions
N
MAP 1.1: SELECTED GLOBAL CITY-REGIONS, URBAN CORRIDORS AND MEGA-REGIONS
Source: UN-HABITAT Regional Offices, 2009.

5
UR
BA
N T
RE
ND
S
The challenge here is for local authorities and regional gov-ernments to adopt policies that maximize the benefits of urbanization and respond to these forms of inter-connec-tivity and city interdependence. The rationale is to promote regional economic development growth, as well as to antici-pate and manage the negative consequences of urban/regional growth, such as asymmetrical regional and urban develop-ment that has the potential to compound the urban divide.
• More and more people both in the North and South are moving outside the city to “satellite” or dormitory cities and suburban neighbourhoods, taking advantage of accommodation that can be more affordable than in central areas, with lower densities and sometimes a better quality of life in certain ways. Spatial expansion of cities is triggered not only by residents’ preference for a suburban lifestyle, but also by land regulation crises, lack of control over peri-urban areas, weak planning control over land subdivisions, improved or expanded commuting technologies and
services, as well as greater population mobility. Whether it takes the form of “peripherization” (informal settlements) or “suburban sprawl” (residential zones for high- and middle-income groups), sub-urbanization generates negative environmental, economic and social externalities. In developing countries, the phenomenon comes mainly as an escape from inadequate governance, lack of planning and poor access to amenities. Rich and poor seek refuge outside the city, which generates further partitioning of the physical and social space.
Cities must aim policies at current urban challenges (slums, affordable land, basic services, public transport) and more particularly anticipate expansion with sound planning policies and related actions that control the speculation associated with urban sprawl. Cities must also grant rights to the urban poor, along with affordable serviced land and security of tenure if further peripherization is to be avoided.
s
Lima, Peru. By 2050, South America will be the most urban region in the world with 91.4 per cent of its population residing in urban areas. ©Yory Frenklakh/Shutterstock

STA
TE
OF
TH
E W
OR
LD
’S C
ITIE
S 20
10/2
011
- OV
ER
VIE
W
6
The Wealth of Cities
The prosperity of nations is intimately linked to the prosperity of their cities. No country has ever achieved sustained economic growth or rapid social development without urbanizing (countries with the highest per capita income tend to be more urbanized, while low-income countries are the least urbanized). Thanks to superior productivity, urban-based enterprises contribute large shares of gross domestic product (GDP). In other countries, it is a group of cities that accounts for a significant share of national GDP. The clustering of cities into mega-regions, urban corridors and city-regions operating as single economic entities sets in motion self-reinforcing, cumulative growth patterns that are making a significant contribution to the world’s economic activity. High urban densities reduce transaction costs, make public spending on infrastructure and services more economically viable, and facilitate generation and diffusion of knowledge, all of which are important for growth. Hand in hand with economic growth, urbanization has helped reduce overall poverty by providing new opportunities, raising incomes and increasing the numbers of livelihood options for both rural and urban populations. Urbanization, therefore, does indeed play a positive role in overall poverty reduction, particularly where supported by well-adapted policies. However, when accompanied by weak economic growth, or when distributive policies are nonexistent or ineffective, urbanization results in local concentration of poor people rather than significant poverty reduction.
Cities have the potential to make countries rich because they provide the economies of scale and proximity that generate enhanced productivity. Economic growth can turn urban centres into effective “poverty fighters” if benefits and opportunities are redistributed through adequate policies. Cities can also significantly reduce rural poverty.
Slums: Good News is Shadowed by Bad News
In many developing countries, urban expansion has often been characterized by informality, illegality and unplanned settlements. Above all, urban growth has been strongly associated with poverty and slum growth. Fortunately, a number of countries have, to some extent, managed to curb the further expansion of slums and to improve the living conditions prevailing there. Uneven as they may have been around the world, efforts to narrow the most unacceptable form of urban divide as represented by slums have yielded some positive results. According to UN-HABITAT estimates, between the year 2000 and 2010, a total 227 million people in the developing world will have moved out of slum conditions. In other words, governments have collectively exceeded the slum target of Millennium Development Goal 7 by at least 2.2 times, and 10 years ahead of the agreed 2020 deadline.
0
5
10
15
20
25
Kampa
la
Addis A
baba
Nairob
i
Kharto
umLomé
Lagos
Yaou
ndéFès
Dire Daw
aNaku
ru
0
5
10
15
20
25
Beijing
Pada
ng
Chand
igarh
Rajkot
Pune
Surat
Nashik
Seong
nam
Farida
bad
Shang
hai
Kalooka
n
Guang
zhou
Karaj
Chong
qing
Dongg
uan
Shenzh
en
0
5
10
15
20
25
Santa
Fé De B
ogotá
Guada
lajara
Campo
Grande
Maceió
Port-a
u-Prin
ce
Ciudad
Juáre
z
Valenc
ia
Maracai
boTiju
ana
Santa
Cruz
Puen
te Alto
Rate
of g
row
th (%
)Ra
te o
f gro
wth
(%)
Rate
of g
row
th (%
)
13.3
7.8 7.45.7 5.7 5.3 5.1 4.9
4.1 4.0
20.8
13.111.3
8.0 7.76.5
5.6 5.4 5.3 4.9 4.8 4.8 4.6 4.6 4.6 4.5
7.55.7
4.3 4.3 4.2 4.0 4.0 3.5 3.4 3.2 2.4
0
5
10
15
20
25
Kampa
la
Addis A
baba
Nairob
i
Kharto
umLomé
Lagos
Yaou
ndéFès
Dire Daw
aNaku
ru
0
5
10
15
20
25
Beijing
Pada
ng
Chand
igarh
Rajkot
Pune
Surat
Nashik
Seong
nam
Farida
bad
Shang
hai
Kalooka
n
Guang
zhou
Karaj
Chong
qing
Dongg
uan
Shenzh
en
0
5
10
15
20
25
Santa
Fé De B
ogotá
Guada
lajara
Campo
Grande
Maceió
Port-a
u-Prin
ce
Ciudad
Juáre
z
Valenc
ia
Maracai
boTiju
ana
Santa
Cruz
Puen
te Alto
Rate
of g
row
th (%
)Ra
te o
f gro
wth
(%)
Rate
of g
row
th (%
)
13.3
7.8 7.45.7 5.7 5.3 5.1 4.9
4.1 4.0
20.8
13.111.3
8.0 7.76.5
5.6 5.4 5.3 4.9 4.8 4.8 4.6 4.6 4.6 4.5
7.55.7
4.3 4.3 4.2 4.0 4.0 3.5 3.4 3.2 2.4
FIGURE 1.1: AVERAGE ANNUAL GROWTH RATE OF SELECTED FAST GROWING CITIES IN AFRICA BETWEEN 1990 AND 2006
FIGURE 1.2: AVERAGE ANNUAL GROWTH RATE OF SELECTED FAST GROWING CITIES IN ASIA BETWEEN 1990 AND 2006
FIGURE 1.3: AVERAGE ANNUAL GROWTH RATE OF SELECTED FAST GROWING CITIES IN LATIN AMERICA AND CARIBBEAN REGION BETWEEN 1990 AND 2006
Source: Demographic Yearbook, Various Years 1990 - 2006.

7
UR
BA
N T
RE
ND
S
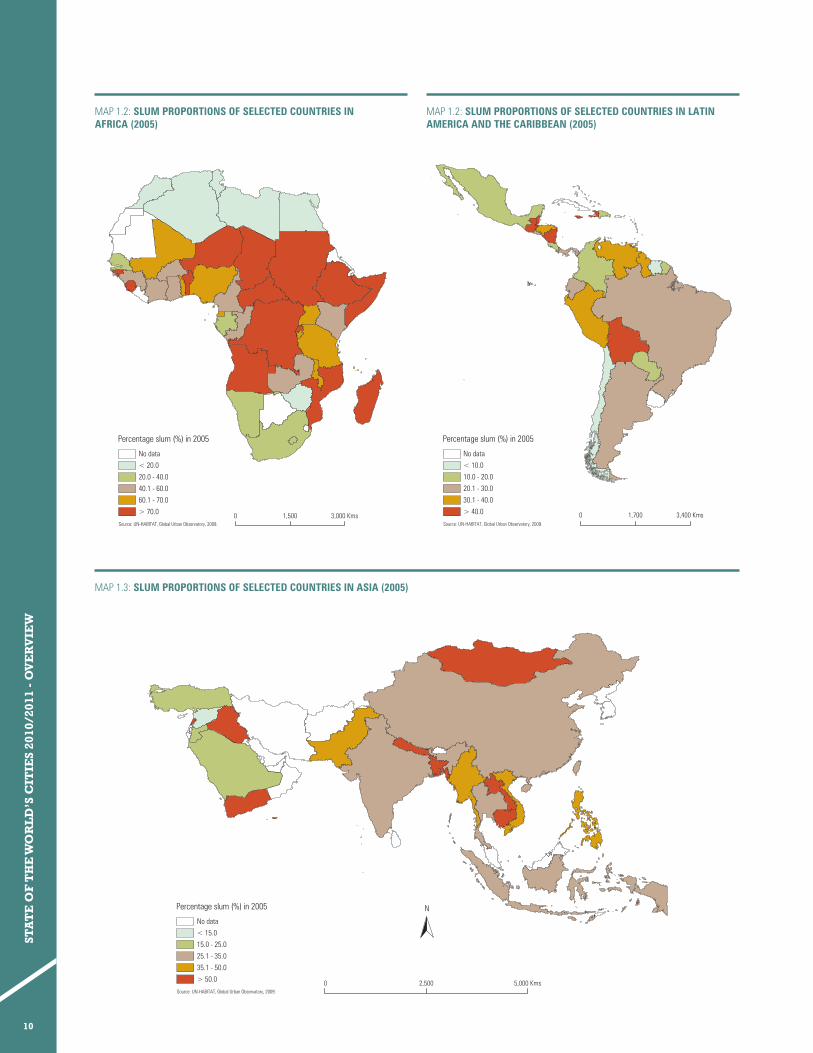
Asia stood at the forefront of successful efforts to reach the slum target, with governments in the region together improving the lives of an estimated 172 million slum dwellers between the year 2000 and 2010; this represents 74 per cent of the total number of urban residents in the world who no longer suffer from inadequate housing. China and India have improved the lives of more slum dwellers than any other countries, having together lifted no less than 125 million people out of slum conditions in the same period. After China and India, the most significant improvements in slum conditions in Asia were recorded in Indonesia, Turkey and Viet Nam. At sub-regional level, the greatest advances were recorded in Southern and Eastern Asia (73 and 72 million people, respectively), followed by South-East Asia (33 million). In contrast, Western Asia failed to make a contribution, as the number of slum dwellers in the sub-region increased by 12 million.
Across Africa, the lives of an estimated 24 million slum dwellers have improved in the last decade, representing 12 per cent of the global effort to narrow this form of urban divide. North Africa is the only sub-region in the developing world where both the number (8.7 million) and proportion of slum dwellers have steadily declined (from 20 to 13 per cent). Egypt, Morocco and Tunisia were the most successful countries. In sub-Saharan Africa, though, the total proportion of the urban population living in slums has decreased by only 5 per cent (or 17 million people). Ghana, Senegal, Uganda, Rwanda and Guinea were the most successful countries in the
sub-region, reducing the proportions of slum dwellers by over one-fifth in the last decade.
Some 13 per cent of the progress made towards the global slum target occurred in Latin America and the Caribbean, where an estimated 30 million people have moved out of slum conditions since the year 2000. Over the past decade, Argentina, Colombia and Dominican Republic have been able to reduce their proportions of slum dwellers by over a third, making them the most successful countries in the region.
The successful municipalities took the responsibility for slum reduction squarely on their shoulders, backing commitments with bold policy reforms, and preventing future slum growth with equitable planning and economic policies. Recognition of the existence of slums must combine with long-term political commitment backed by adequate budget resources, policy reforms and institutional strengthening, strong monitoring and scaling up of successful local projects, if slums are to be tackled effectively.
In all developing regions, improving the lives of slum dwellers calls for macro-level programmes that include housing infrastructure and finance, improved water and sanitation, and adequate living spaces. However, these macro-level programmes must be associated with micro-level schemes, including micro-credit, self-help, education and employment.
The fact that an additional 227 million urban dwellers have gained access to improved water and sanitation as well as to durable and less crowded housing shows that a number of countries and cities are taking the slum target seriously. This enhances the prospects for millions of people to escape poverty, disease and illiteracy, and to lead better lives thanks to a narrower urban divide.
Over the past 10 years, the proportion of the urban population living in slums in the developing world has declined from 39 per cent in the year 2000 to an estimated 32 per cent in 2010. And yet the urban divide endures, because in absolute terms the numbers of slum dwellers have actually grown considerably, and will continue to rise in the near future. Between the year 2000 and 2010, the urban population in the developing world increased by an estimated average of 58 million per annum; this includes 6 million who were not able to improve their conditions and joined the ranks of slum dwellers. At the same time, UN-HABITAT estimates that through upgrading or prevention of informal settlements, developing countries lifted an annual 22 million
FIGURE 1.4: BRIDGING THE URBAN DIVIDE THROUGH SLUM IMPROVEMENT: THE MOST SUCCESSFUL COUNTRIES
0 10 20 30 40 50 60 70 80
China
India
Indonesia
Brazil
Nigeria
Mexico
Egypt
Argentina
Colombia
Turkey
Morocco
South Africa
Slum improvements in absolute numbers (2000-2010) millions
1.96
2.43
3.51
3.72
4.94
5.01
5.08
8.05
10.38
21.23
59.73
65.31
Source: UN-HABITAT - GUO, 2009. Note: 2010 data are predictions.
Improving the lives of slum dwellers is the best way to achieve all the Millennium Development Goals. Improved housing conditions and provision of water and sanitation will not only save lives among the very poor, but also support progress in education and health.
STA
TE
OF
TH
E W
OR
LD
’S C
ITIE
S 20
10/2
011
- OV
ER
VIE
W
8
s
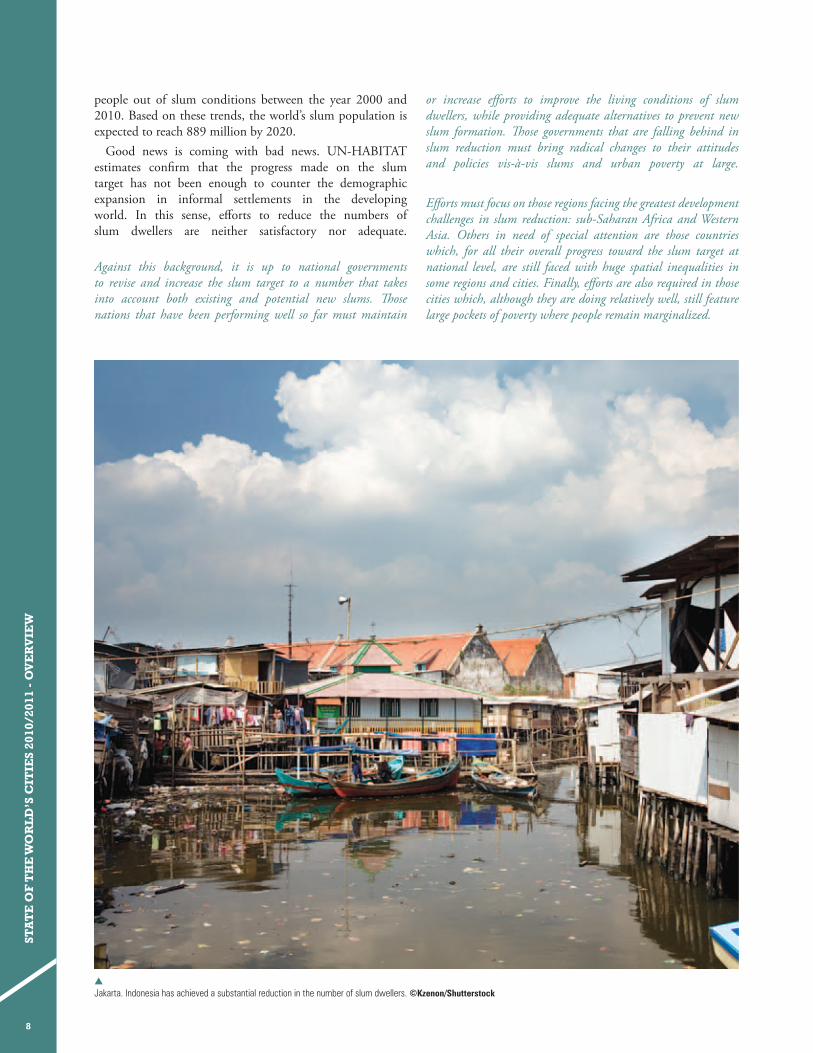
Jakarta. Indonesia has achieved a substantial reduction in the number of slum dwellers. ©Kzenon/Shutterstock
people out of slum conditions between the year 2000 and 2010. Based on these trends, the world’s slum population is expected to reach 889 million by 2020.
Good news is coming with bad news. UN-HABITAT estimates confirm that the progress made on the slum target has not been enough to counter the demographic expansion in informal settlements in the developing world. In this sense, efforts to reduce the numbers of slum dwellers are neither satisfactory nor adequate.
Against this background, it is up to national governments to revise and increase the slum target to a number that takes into account both existing and potential new slums. Those nations that have been performing well so far must maintain
or increase efforts to improve the living conditions of slum dwellers, while providing adequate alternatives to prevent new slum formation. Those governments that are falling behind in slum reduction must bring radical changes to their attitudes and policies vis-à-vis slums and urban poverty at large.
Efforts must focus on those regions facing the greatest development challenges in slum reduction: sub-Saharan Africa and Western Asia. Others in need of special attention are those countries which, for all their overall progress toward the slum target at national level, are still faced with huge spatial inequalities in some regions and cities. Finally, efforts are also required in those cities which, although they are doing relatively well, still feature large pockets of poverty where people remain marginalized.

9
UR
BA
N T
RE
ND
S
TABLE 1.1: URBAN POPULATION LIVING IN SLUMS, 1990-2010
URBAN SLUM POPULATION (THOUSANDS)
Major region or area 1990 1995 2000 2005 2007 2010
Developing Regions 656,739 718,114 766,762 795,739 806,910 827,690North Africa 19,731 18,417 14,729 10,708 11,142 11,836Sub-Saharan Africa 102,588 123,210 144,683 169,515 181,030 199,540Latin America and the Caribbean 105,740 111,246 115,192 110,105 110,554 110,763Eastern Asia 159,754 177,063 192,265 195,463 194,020 189,621Southern Asia 180,449 190,276 194,009 192,041 191,735 190,748South-Eastern Asia 69,029 76,079 81,942 84,013 83,726 88,912Western Asia 19,068 21,402 23,481 33,388 34,179 35,713Oceania 379 421 462 505 524 556
PROPORTION OF URBAN POPULATION LIVING IN SLUMS (%)Major region or area 1990 1995 2000 2005 2007 2010
Developing Regions 46.1 42.8 39.3 35.7 34.3 32.7North Africa 34.4 28.3 20.3 13.4 13.4 13.3Sub-Saharan Africa 70 67.6 65 63 62.4 61.7Latin America and the Caribbean 33.7 31.5 29.2 25.5 24.7 23.5Eastern Asia 43.7 40.6 37.4 33 31.1 28.2Southern Asia 57.2 51.6 45.8 40 38 35South-Eastern Asia 49.5 44.8 39.6 34.2 31.9 31Western Asia 22.5 21.6 20.6 25.8 25.2 24.6Oceania 24.1 24.1 24.1 24.1 24.1 24.1
Source: UN-HABITAT estimates (based on United Nations Population Division, World Urbanization Prospects: The 2007 Revision).
A slum household consists of one or a group of individuals living under the same roof in an urban area, lacking one or more of the following five amenities: (1) durable housing (a permanent structure providing protection from extreme climatic conditions); (2) sufficient living area (no more than three people sharing a room); (3) access to improved water (water that is sufficient, affordable and can be obtained without extreme effort); (4) access to improved sanitation facilities (a private
toilet, or a public one shared with a reasonable number of people); and (5) secure tenure (de facto or de jure secure tenure status and protection against forced eviction). Since information on secure tenure is not available for most countries included in the UN-HABITAT database, however, only the first four indicators are used to define slum households, and then to estimate the proportion of the urban population living in slums.
UN-HABITAT SLUM INDICATORS
s
Kibera, Nairobi, Kenya. Urbanization can result in severe inequality. ©Manoocher Deghati/IRIN
STA
TE
OF
TH
E W
OR
LD
’S C
ITIE
S 20
10/2
011
- OV
ER
VIE
W
10
Slum proportions of selected countries in Africa (1990) Slum proportions of selected countries in Asia (1990)
Slum proportions of selected countries in Asia (2000)
Slum proportions of selected countries in Africa (2000)
Slum proportions of selected countries in Africa (2005) Slum proportions of selected countries in Africa (2010)
Slum proportions of selected countriesin Latin America and The Caribbean (1990)
Slum proportions of selected countriesin Latin America and The Caribbean (2000)
Slum proportions of selected countriesin Latin America and The Caribbean (2005)
Slum proportions of selected countriesin Latin America and The Caribbean (2010)
0 1,500 3,000 Kms
Percentage slum (%) in 1990
Source: UN-HABITAT, Global Urban Observatory, 2009.
No data
< 20.0
20.0 - 40.0
40.1 - 60.0
60.1 - 70.0
> 70.0
N
0 1,500 3,000 Kms
Percentage slum (%) in 2000
Source: UN-HABITAT, Global Urban Observatory, 2009.
No data
< 20.0
20.0 - 40.0
40.1 - 60.0
60.1 - 70.0
> 70.0
N
Percentage slum (%) in 1990
Source: UN-HABITAT, Global Urban Observatory, 2009.
No data
< 10.0
10.0 - 20.0
20.1 - 30.0
30.1 - 40.0
> 40.0 0 1,700 3,400 Kms
NPercentage slum (%) in 2000
Source: UN-HABITAT, Global Urban Observatory, 2009.
No data
< 10.0
10.0 - 20.0
20.1 - 30.0
30.1 - 40.0
> 40.0 0 1,700 3,400 Kms
N Percentage slum (%) in 1990
Source: UN-HABITAT, Global Urban Observatory, 2009.
No data
< 15.0
15.0 - 25.0
25.1 - 35.0
35.1 - 50.0
> 50.0 0 2,500 5,000 Kms
N
Percentage slum (%) in 2000
Source: UN-HABITAT, Global Urban Observatory, 2009.
No data
< 15.0
15.0 - 25.0
25.1 - 35.0
35.1 - 50.0
> 50.0 0 2,500 5,000 Kms
N
Percentage slum (%) in 2005
Source: UN-HABITAT, Global Urban Observatory, 2009.
No data
< 15.0
15.0 - 25.0
25.1 - 35.0
35.1 - 50.0
> 50.0 0 2,500 5,000 Kms
N
Percentage slum (%) in 2010
Source: UN-HABITAT, Global Urban Observatory, 2009.
No data
< 15.0
15.0 - 25.0
25.1 - 35.0
35.1 - 50.0
> 50.0 0 2,500 5,000 Kms
N
Slum proportions of selected countries in Asia (2005)
Slum proportions of selected countries in Asia (2010)
Percentage slum (%) in 2005
Source: UN-HABITAT, Global Urban Observatory, 2009.
No data
< 10.0
10.0 - 20.0
20.1 - 30.0
30.1 - 40.0
> 40.0 0 1,700 3,400 Kms
Percentage slum (%) in 2010
Source: UN-HABITAT, Global Urban Observatory, 2009.
No data
< 10.0
10.0 - 20.0
20.1 - 30.0
30.1 - 40.0
> 40.0 0 1,700 3,400 Kms
N
0 1,500 3,000 Kms
Percentage slum (%) in 2005
Source: UN-HABITAT, Global Urban Observatory, 2009.
No data
< 20.0
20.0 - 40.0
40.1 - 60.0
60.1 - 70.0
> 70.0 0 1,500 3,000 Kms
Percentage slum (%) in 2010
Source: UN-HABITAT, Global Urban Observatory, 2009.
No data
< 20.0
20.0 - 40.0
40.1 - 60.0
60.1 - 70.0
> 70.0
N
MAP 1.2: SLUM PROPORTIONS OF SELECTED COUNTRIES INAFRICA (2005)
MAP 1.2: SLUM PROPORTIONS OF SELECTED COUNTRIES IN LATIN AMERICA AND THE CARIBBEAN (2005)
MAP 1.3: SLUM PROPORTIONS OF SELECTED COUNTRIES IN ASIA (2005)
Slum proportions of selected countries in Africa (1990) Slum proportions of selected countries in Asia (1990)
Slum proportions of selected countries in Asia (2000)
Slum proportions of selected countries in Africa (2000)
Slum proportions of selected countries in Africa (2005) Slum proportions of selected countries in Africa (2010)
Slum proportions of selected countriesin Latin America and The Caribbean (1990)
Slum proportions of selected countriesin Latin America and The Caribbean (2000)
Slum proportions of selected countriesin Latin America and The Caribbean (2005)
Slum proportions of selected countriesin Latin America and The Caribbean (2010)
0 1,500 3,000 Kms
Percentage slum (%) in 1990
Source: UN-HABITAT, Global Urban Observatory, 2009.
No data
< 20.0
20.0 - 40.0
40.1 - 60.0
60.1 - 70.0
> 70.0
N
0 1,500 3,000 Kms
Percentage slum (%) in 2000
Source: UN-HABITAT, Global Urban Observatory, 2009.
No data
< 20.0
20.0 - 40.0
40.1 - 60.0
60.1 - 70.0
> 70.0
N
Percentage slum (%) in 1990
Source: UN-HABITAT, Global Urban Observatory, 2009.
No data
< 10.0
10.0 - 20.0
20.1 - 30.0
30.1 - 40.0
> 40.0 0 1,700 3,400 Kms
NPercentage slum (%) in 2000
Source: UN-HABITAT, Global Urban Observatory, 2009.
No data
< 10.0
10.0 - 20.0
20.1 - 30.0
30.1 - 40.0
> 40.0 0 1,700 3,400 Kms
N Percentage slum (%) in 1990
Source: UN-HABITAT, Global Urban Observatory, 2009.
No data
< 15.0
15.0 - 25.0
25.1 - 35.0
35.1 - 50.0
> 50.0 0 2,500 5,000 Kms
N
Percentage slum (%) in 2000
Source: UN-HABITAT, Global Urban Observatory, 2009.
No data
< 15.0
15.0 - 25.0
25.1 - 35.0
35.1 - 50.0
> 50.0 0 2,500 5,000 Kms
N
Percentage slum (%) in 2005
Source: UN-HABITAT, Global Urban Observatory, 2009.
No data
< 15.0
15.0 - 25.0
25.1 - 35.0
35.1 - 50.0
> 50.0 0 2,500 5,000 Kms
N
Percentage slum (%) in 2010
Source: UN-HABITAT, Global Urban Observatory, 2009.
No data
< 15.0
15.0 - 25.0
25.1 - 35.0
35.1 - 50.0
> 50.0 0 2,500 5,000 Kms
N
Slum proportions of selected countries in Asia (2005)
Slum proportions of selected countries in Asia (2010)
Percentage slum (%) in 2005
Source: UN-HABITAT, Global Urban Observatory, 2009.
No data
< 10.0
10.0 - 20.0
20.1 - 30.0
30.1 - 40.0
> 40.0 0 1,700 3,400 Kms
Percentage slum (%) in 2010
Source: UN-HABITAT, Global Urban Observatory, 2009.
No data
< 10.0
10.0 - 20.0
20.1 - 30.0
30.1 - 40.0
> 40.0 0 1,700 3,400 Kms
N
0 1,500 3,000 Kms
Percentage slum (%) in 2005
Source: UN-HABITAT, Global Urban Observatory, 2009.
No data
< 20.0
20.0 - 40.0
40.1 - 60.0
60.1 - 70.0
> 70.0 0 1,500 3,000 Kms
Percentage slum (%) in 2010
Source: UN-HABITAT, Global Urban Observatory, 2009.
No data
< 20.0
20.0 - 40.0
40.1 - 60.0
60.1 - 70.0
> 70.0
N

11
UR
BA
N T
RE
ND
S
BOX 1.1: FROM BLIND SPOT TO SPOTLIGHT: FIVE POLICY STEPS TO SLUM REDUCTION
Slums have only on occasion proved to be what most public authorities wished they would: a transient phenomenon, which growth and higher incomes would eliminate over time. In too many cities today, all-too visible slums remain blind spots for policymakers - caught as they are between token gestures, clearance or mass eviction, or administrative Ò pass the buckÓ . The odd attempt at institutional response and reform typically founders on lack of support, funding or coordination. Still, municipalities in a number of countries (representing about one-third of those known as “developing”) have managed to reduce the absolute and relative numbers of slum-dwellers among their populations.
How did they do it? The successful governments took the responsibility for slum reduction squarely on their shoulders, backing commitments with bold policy reforms, and preventing future slum growth with equitable planning and economic policies. Recent policy evidence collected by UN-HABITAT in 44 successful countries suggests that slum reduction takes a combination of five specific, complementary approaches: (1) awareness and advocacy; (2) long-term political commitment; (3) policy reforms and institutional strengthening; (4) implementation and monitoring; (5) and scaling-up of successful local projects.
Awareness and advocacy. For local authorities and other stakeholders, awareness requires slum monitoring systems and indicators to collect information and analyse trends, like those that have been successful throughout Viet Nam, Brazil and Indonesia. Advocacy involves disseminating messages on improved living conditions for slum dwellers, as governments
in Brazil, India and Mexico have done. Civil society organizations can also encourage political commitment and champion the views and rights of slum dwellers and the poor in general - either as watchdogs like Réseau Social Watch BŽ nin that monitor Millennium Development Goals and poverty reduction strategies, or as partners in government-funded programmes, like MexicoÕ s Hábitat y Rescate de Espacios Públicos (Reappropriation of public space). Organizations like Shack/Slum Dwellers International on occasion perform both an advocacy and an executing role.
Long-term political commitment. Over the past 15 years, consistent political commitment to large-scale slum upgrading and service provision to the urban poor has enabled China, India, Turkey, Dominican Republic, Colombia, Egypt, Morocco and Tunisia to reduce and stabilize slums. Other countries, including Ghana, Senegal and Argentina have fairly recently stepped up action, and yet others have begun to gather the necessary political support for land and tenure policy reforms, including Burkina Faso, Senegal and Tanzania.
Policy reform and institutional strengthening. The policy reforms required for slum upgrading and prevention involve housing, land and infrastructure provision and finance. Indonesia, Nicaragua and Peru have integrated large numbers of urban poor into the legal and social fabric; other countries, like India, have deployed major pro-poor reforms and programmes for land and housing provision or are adopting more inclusive approaches. Costa Rica, Ecuador and Colombia look to avoid relocations and instead work on settlements in situ, improving existing living conditions. Most of the more successful countries - including Indonesia, Iran, Mexico, Philippines, South Africa and Turkey - look beyond the housing sector and fight slums as part of broader-ranging urban poverty reduction strategies. Policies have tended to shift from entitlement to co-participation, where financial viability and down-payments condition access to public subsidies for both new housing and improvements. Creation of a Human Settlements Ministry gives higher visibility and continuity to the cause as demonstrated in Burkina Faso. Municipal decentralization through community-based consultation mechanisms is another avenue that has succeeded in Cambodia, Malawi and Zambia.
Implementation and monitoring. Countries that performed well on the Millennium slum target (including Indonesia and South Korea) deployed transparent and pro-poor policies backed up by adequate human and technical resources. Others, such as Colombia, Chile, the Philippines and South Africa, also trained urban planning and management professionals and involved them in housing and basic service delivery programmes. The most successful countries (China, Viet Nam, Chile, Sri Lanka and Peru) coordinated slum policy implementation between central regional and municipal authorities and the private sector. Other countries set themselves national targets: Cambodia (100 slum communities upgraded every year); Chile, Brazil, Morocco and Thailand (all of which enacted clear slum targets and benchmarks as part of urban poverty reduction). Indonesia uses results-based monitoring and satisfaction surveys.
Scaling-up. Replication and scaling-up of successful, local one-off or pilot slum-upgrading projects have served Brazil, Mexico, Colombia, South Africa, Sri Lanka and Indonesia well with measurable impacts on national indicators of slum growth. As originally modest-scale programmes were upgraded in Brazil, Egypt, Nicaragua and Turkey, the private sector and civil society became involved, or the schemes benefited from additional funding for replication and mainstreaming into government policies. In Burkina Faso and Senegal, reforms started in the 1980s in the capital city and expanded into large-scale physical and tenure upgrading schemes for irregular settlements across the country. Other countries, including China, Chile and South Africa, engaged in large-scale public subsidies to the housing sector, in a bid to reach the poorest groups and meet the rising costs of social housing. In most cases, success mobilized huge domestic (and, on occasion, external) resources to promote innovative strategies, including for slum prevention.
Policy analysis shows that on top of a combination of these five elements, success on the Millennium slum target involves proper coordination between cohesive, well-designed and adequately resourced centralized interventions on the one hand, and local authorities on the other hand.
Sources: Bazoglu, 2007; Chowdhury, 2006; López Moreno, 2003; UN-HABITAT, 2008.
s
Bogot‡ . In Colombia, an estimated 3.7 million slum dwellers have benefited from well-targeted slum upgrading and prevention strategies.©Tifonimages/Shutterstock

12
STA
TE
OF
TH
E W
OR
LD
’S C
ITIE
S 20
10/2
011
- OV
ER
VIE
W
The urban divide does not just refer to a fragmented space or a community riven by socio-economic disparities. More often than not, economic lines of divide tend to coincide with social, cultural and political barriers. Various forms of exclusion continue to marginalize vast amounts of human capital ready to be mobilized for the sake of a sustainable city. A divided city is one that fails to accommodate its poorer residents, regardless of the social and cultural riches they might contribute. Social divisions can permeate interactions amongst individuals even in the absence of significant ethnic, racial or other factors of segregation. Fresh divisions constantly emerge and become entrenched; patterns of social inclusion and exclusion preserve benefits for specific social segments based on physical location, shared interests, historic inequalities or other criteria.
If the four dimensions of the inclusive city – social, political, economic and cultural – are to be turned from a mere conceptual paradigm into reality, they must be implemented within a rights-based framework, and one that is easy to enforce. Short of this, prevailing patterns of exclusionary development, selective benefit-sharing, marginalization and discrimination will continue unabated in cities. City efforts to design and implement strategies for inclusiveness must be based on a clear and cogent representation of the way these four dimensions can be integrated concurrently into the day-to-day lives of the population.
Only through explicit and deliberately inclusive processes will it be possible to identify the locally appropriate, innovative and high-leverage actions and policies which government, public officials and major institutions can deploy to set in motion self-reinforcing processes that will bridge the urban divide.
Income Inequality in Cities: Contrasting Numbers
In general terms, income inequalities in developed countriesare low. However, altogether, income inequalities in developed countries increased between the mid-1980s and 2005. Little is known about inequalities in European urban areas specifically, as available data is generally not disaggregated to individual cities. Still, nationwide aggregates do not always accurately reflect disparities in general urban or city-specific incomes. The most surprising variations between national and city-specific Gini coefficients of income or consumption disparities are found in the United States of America, where around 2005 the national coefficient stood at 0.38, but
exceeded 0.5 in many major metropolitan areas including Washington, D.C.; New York City; Miami; and others. These values are comparable to the average Gini coefficients of cities in selected Latin American countries, where income inequality is particularly steep.
Income inequalities are higher in the developing world than in developed nations. New data presented by UN-HABITAT on Gini coefficients shows mixed results in the various regions of the South.
In general, urban inequality in Latin America and the Caribbean is declining, although it remains quite high. An analysis of income distribution trends in 17 selected countries in the region shows that in nine of them, urban Gini coefficients have fallen slightly between the late 1990s and 2006. However, in the urban areas of five other Latin American countries, income inequalities have slightly risen or remained stable. The recent improvement in economic conditions in various countries across the region has resulted in a narrower income gap between rich and poor. However, the current financial and food crises are likely to dampen the chances for sustained economic growth in coming years, and short of appropriate pro-poor policies, inequalities may rise again, instead of declining further.
Trends in the economic divide in Africa’s urban areas are mixed. Among the 13 countries under review, eight showed lower values (if only marginally for some) and five featured moderate to significant increases. The region’s urban areas, in sub-Saharan Africa in particular, retain the highest degrees of poverty in the world, together with the highest prevalence of slum populations in urban areas. In African urban areas, progress in poverty reduction has been rather slow overall, but these mixed results in the distribution of income and consumption point to the hope of future improvements.
In Asia, the economic urban divide is widening. Although income and consumption inequality is low to moderate overall, average incomes have increased in almost all Asian countries, and poverty has fallen nearly everywhere in the region, with the exception of Bangladesh.
African cities appear to be the most unequal in the world (sample of 37 cities with an average Gini coefficient of 0.58). Next come Latin American cities (24 cities, with a Gini average of 0.52). Asian cities (30) feature a comparatively low degree of income inequality, as measured by a Gini coefficient of 0.384. Eastern Europe (8) and CIS cities (10) feature the lowest average Gini values and, presumably, the greatest degrees of equality, at 0.298 and 0.322, respectively.
2 The Urban Divide

13
TH
E U
RB
AN
DIV
IDE
Highly unequal income or consumption patterns in cities in the developing world point to institutional and structural failures, as well as to broader economic problems such as imbalanced labour markets or a lack of pro-poor policies. The more unequal the distribution of income or consumption in urban areas, the higher the risk that economic disparities will result in social and political tension. Space Inequality: The Poverty Trap
The spatial divide in developing country cities does not just reflect income inequalities among households; it is also a by-product of inefficient land and housing markets, ineffective financial mechanisms and poor urban planning. While income inequalities are a major divisive social factor, the spatial inequalities visible in so many cities are an outgrowth of both socioeconomic disparities and larger processes of urban development, governance and institutionalized exclusion of specific groups.
When slum areas are physically isolated and disconnected from the main urban fabric, residents become cut off from
the city, often enduring longer commuting times and higher transportation costs than they would if their neighbourhoods were more integrated into urban networks. On top of low incomes and shelter deprivations, these residents find themselves underprivileged in terms of access to the urban advantage. Combined, the physical and social distance between poor and rich neighbourhoods represents a spatial poverty trap marked by six distinct challenges: (a) severe job restrictions; (b) high rates of gender disparities; (c) deteriorated living conditions; (d) social exclusion and marginalization; (e) lack of social interaction, and (f ) high incidence of crime.
Absence of policy coordination between or within national and local government constrains cities’ ability to meet the requirements of urban development and to deploy strategies that mitigate spatial inequality.
More gender-specific schemes, like maternity and childcare benefits, vocational training, protecting women’s rights at the workplace, and micro-credit are required if women are to be lifted out of the spatial poverty trap.
s
Kuala Lumpur. ©Mark Henley/Panos Pictures

14
STA
TE
OF
TH
E W
OR
LD
’S C
ITIE
S 20
10/2
011
- OV
ER
VIE
W
Mexico City
Guatemala City
ManaguaBogotá
Quito
Port-Au-Prince Caracas
Fortazela
Rio de Janeiro
Brasilia
São Paulo
Montevideo
Buenos Aires
Santiago
0 1,500 3,000 Kms
Nairobi
Addis Ababa
Dar es Salaam
Maputo
Durban
Port ElizabethCape Town
Windhoek
Brazzaville
DoualaIkejaAbidjan
Freetown
Bissau
Dakar
")
")
")
")
")
")
")
")
")
")
")
")
")
")
")
")
")
")
")
")
")
")
")
")
") ")
")
")
")
")
")
")
")
Source: UN-HABITAT, Global Urban Observatory, 2009.Note: Data from various sources, and for various years. City Ginis for CAR, Ghana, Malawi, Namibia, Nigeria and Togo are basedon regional/state data.
Urban Gini CoefficientsIncome (1993-2008) Consumption (1997-2007)
Income (1996-2008) Consumption (1998-2007)City Gini Coefficients
No data0.30 - 0.39
0.31 - 0.390.40 - 0.490.50 - 0.580.40 - 0.49
0.50 - 0.590.60 - 0.690.70 - 0.76
0.30 - 0.390.40 - 0.490.50 - 0.590.60 - 0.690.70 - 0.75
0.26 - 0.290.30 - 0.390.40 - 0.490.50 - 0.590.60 - 0.69
")
")
")
")
")
Colombo
Damascus
Karachi
Banda Aceh
Jakarta
Manila
Hong Kong
Ho Chi Minh City
Dhaka
")
")
")
")
")
")
")
")
")
")
")
")
")
") ")
")
")
")
")")
")
")
")
")
")
")
")
")
")
")
")
")
")
")
")")
")
")
")
")
")
")
")
")
")
")
")
") ")
")
")
")
") ")")
")
")
")
")
")
Source: UN-HABITAT, Global Urban Observatory, 2009. Note: Data from various sources, and for various years. City Ginis for India, Indonesia, part of Mongolia, Pakistan, Philippines and Syria are based on provincial data.
Urban Gini CoefficientsIncome (1996-2003) Consumption (1999-2007)
Income (1997-2006) Consumption (2000-2006)
City Gini Coefficients
No data
0.30 - 0.39
0.30 - 0.39
0.40 - 0.43
0.40 - 0.45
0.22 - 0.29
0.30 - 0.39
0.40 - 0.49
0.50 - 0.58
0.25 - 0.29
0.30 - 0.39
0.40 - 0.49
")
")
")0 2,000 4,000 Kms
N
Beijing
Ulaanbaatar
Delhi
0 1,750 3,500 Kms
Urban GiniCoefficient
City GiniCoefficient
No data
0.30 - 0.39 0.30 - 0.39
0.20 - 0.29
0.40 - 0.49
0.50 - 0.59
0.60 - 0.69
0.70 - 0.75
0.40 - 0.49
0.50 - 0.59
0.60 - 0.69
Source: UN-HABITAT, Global Urban Observatory, 2009.Note: Data from various sources, and for various years.All Gini Coefficients are for income.
MAP 2.2: URBAN INEQUALITIES (INCOME) IN SELECTED CITIES AND COUNTRIES IN LATIN AMERICA AND THE CARIBBEAN (1998-2007)
MAP 2.1: URBAN INEQUALITIES (CONSUMPTION/INCOME) IN SELECTED CITIES AND COUNTRIES IN AFRICA (1993-2007)
MAP 2.3: URBAN INEQUALITIES (CONSUMPTION/INCOME) IN SELECTED CITIES AND COUNTRIES IN ASIA (1996-2007)

15
TH
E U
RB
AN
DIV
IDE
Inequality of Opportunities
In every country in the world, access to the “urban advantage” and distribution of the related benefits is largely determined by various organizations and institutions – including, crucially, the formal land and labour markets as well as public utilities. The problem in developing countries is that most of these institutions are weak or dysfunctional, exposing them to undue influence from, or capture by, vested domestic or foreign interests. In some cities, necessary public institutions are lacking altogether, in which case essentially private vested interests fill the void and act as substitutes for institutions that would otherwise prioritize the interests of society at large. In both situations, the markets for land, basic services and labour are skewed in favour of private interests, enabling them to claim more than their fair shares of the benefits of the “urban advantage”. In this process, uneducated people and young slum dwellers, particularly women, are deprived of the formal, secure livelihoods that could lift them up and out of the dire socioeconomic outcomes associated with the informal, insecure conditions in which they are forced to live.
As reflected in the limited resources available for good schooling, health and other facilities in many cities, unequal opportunities create “minorities in the marketplace” whose individual members are automatically excluded from a wide range of outcomes associated with economic growth and globalization – including demand for a skilled and healthy labour force.
The particular ways cities are planned, designed and built says much about what is valued there, and planning processes can either help or hinder development of opportunities for all. Basic services make a significant contribution to the “urban advantage”, and together with employment feature high among the aspirations of those who move to cities in search of a brighter future.
Today, about 85 per cent of all new employment opportunities around the world occur in the informal economy and young people in slums are more likely to work in the informal sector than their non-slum peers. Despite some advantages, informal employment ends up trapping slum-dwelling and other low-income young people in perpetual poverty. Unfortunately, slum areas remain a “blind spot” when it comes to policy interventions, job creation and youth support.
So far, the benefits of the “urban advantage” keep eluding some specific groups, and women in particular. Poverty consistently exposes young urban females to steeper challenges than male peers when it comes to acquiring the knowledge and skills they need to live healthy, fulfilling lives.
Local authorities should adjust laws and regulations to lower the costs and increase the benefits for those willing to formalize their businesses. Local authorities should also provide assistance to small enterprises, enabling them to upgrade skills and improve access to both productive resources and market opportunities.Large-scale, labour-intensive infrastructure and urban improvement works could provide gainful employment to the poor as well as their fair share in the “urban advantage”. These labour-intensive programmes are to be combined with vocational training and skill development activities.
0.0
0.1
0.2
0.3
0.4
0.5
0.6
0.7
0.00
0.02
0.04
0.06
0.08
0.10
0.12
Gini
Coef
ficien
t
Average Gini
Standard Deviation
Standard Deviation
Gini
Coef
ficien
t
Average Gini
Standard Deviation
Standard Deviation
CIS10 cities
Eastern Europe8 cities
LAC24 cities
Asia30 cities
Africa37 cities
0.581
0.384
0.528
0.298
0.322
0.539
0.4300.505
0.306
0.334
0.0
0.1
0.2
0.3
0.4
0.5
0.6
0.7
0.00
0.02
0.04
0.06
0.08
0.10
0.12
CIS10 countries
Eastern Europe9 countries
LAC18 countries
Asia7 countries
Africa12 countries
FIGURE 2.1: REGIONAL GINI AVERAGES FOR INCOME DISTRIBUTION IN SAMPLE CITIES
FIGURE 2.2: REGIONAL GINI AVERAGES FOR URBAN INCOME DISTRIBUTION IN SAMPLE COUNTRIES
Source: UN-HABITAT, Global Urban Observatory, 2009.Data from UN-ECLAC, UN-ESCAP, UNU and other sources.
Source: UN-HABITAT, Global Urban Observatory, 2009.Data from UN-ECLAC, UN-ESCAP, UNU and other sources.
0.0
0.1
0.2
0.3
0.4
0.5
0.6
0.7
0.00
0.02
0.04
0.06
0.08
0.10
0.12
Gini
Coef
ficien
t
Average Gini
Standard Deviation
Standard Deviation
Gini
Coef
ficien
t
Average Gini
Standard Deviation
Standard Deviation
CIS10 cities
Eastern Europe8 cities
LAC24 cities
Asia30 cities
Africa37 cities
0.581
0.384
0.528
0.298
0.322
0.539
0.4300.505
0.306
0.334
0.0
0.1
0.2
0.3
0.4
0.5
0.6
0.7
0.00
0.02
0.04
0.06
0.08
0.10
0.12
CIS10 countries
Eastern Europe9 countries
LAC18 countries
Asia7 countries
Africa12 countries
Unfortunately, slum areas remain a “blind spot” when it comes to policy interventions, job creation and youth support.

16
STA
TE
OF
TH
E W
OR
LD
’S C
ITIE
S 20
10/2
011
- OV
ER
VIE
W
0.2
0.3
0.4
0.5
0.6
0.7
0.8
Manila
(2006
)
Guada
lajara
(2005
)
Daqing
(200
4/5)
Kuala L
umpu
r (199
9)
Yicha
n (20
04/5)
Manag
ua (2
001)
Zambo
anga
(200
3)
Davao C
ity (2
003)
Yaou
ndé (
1996
)
Zhuh
ai (20
04/5)
Librev
ille &
Port G
entil
(1996
)
Brazzav
ille (2
005)
Montev
ideo (
2006
)
Douala
(199
6)
Colombo
(200
2)
Shenzh
en (2
004/5
)
Guatem
ala City
(200
4)
Abidjan
(200
8)
Accra
(1992
)
Chillan
(200
6)
Hong K
ong (
2001
)
Ho Chi
Minh City
(200
2)
Quito (
1999
)
Santia
go (2
006)
Catamarc
a***
* (20
05)
Mexico
City (2
005)
Maseru
(1993
)
Nairob
i (199
9)
Bogotá
*** (
2005
)
Addis A
baba
(200
3)
Goiana
** (2
005)
Joha
nnesb
urg* (
2005
)
Gini
Coe
ffici
ent (
Inco
me-
base
d)
InternationalAlert Line
0.75
0.65
0.61
0.61
0.59
0.58
0.56
0.55
0.55
0.54
0.53
0.53
0.51
0.50
0.50
0.50
0.49
0.46
0.46
0.45
0.45
0.45
0.45
0.44
0.44
0.42
0.42
0.42
0.41
0.41
0.40
0.40
FIGURE 2.3: MOST UNEQUAL CITIES (INCOME-BASED GINI). SELECTED CITIES IN THE DEVELOPING WORLD (1993-2008)
* In addition to other seven South African cities: East London (0.75), Bloemfontein (0.74), East Rand (0.74), Pietermaritzburg (0.73), Pretoria (0.72), Port Elizabeth (0.72), Durban (0.72) and Cape Town (0.67)** In addition to other six Brazilian cities: Fortaleza (0.61), Belo Horizonte (0.61), Brasilia (0.60), Curitiba (0.59), Rio de Janeiro (0.53) and São Paulo (0.50)*** In addition to other three cities in Colombia: Barranquilla (0.57), Calí (0.54) and Medellín ((0.51)**** In addition to other two cities in Argentina: Buenos Aires (0.52) and Formosa (0.44)
Source: UN-HABITAT, Global Urban Observatory, 2009. Data from UN-ECLAC, UN-ESCAP, UNU and other sources.
0.0
0.1
0.2
0.3
0.4
0.5
0.6
Beijing
(200
3)
Benxi (
2004
/5)
Jeras
h & Ajlou
n (19
97)
Irbid
(1997
)
Shang
hai (2
004/5
)
Zarqa
& Mafr
q (19
97)
Fuzho
u (20
04/5)
Baoji (
2004
/5)
Balqa &
Mad
aba (
2004
/5)
Xian (2
004/5
)
Sheng
yan (2
004/5
)
Wuhan
(200
4/5)
Ipoh (
1999
)
Joho
r Bah
ru (19
99)
Kuchin
g (19
99)
Cebu C
ity (2
003)
Point
e-Noir
e (20
05)
Wuxi (2
004/5
)
Hanoi
(2002
)
Amman (1
997)
Caracas
(200
7)
Gini
Coe
ffici
ent (
Inco
me-
base
d) 0.39 0.39 0.39 0.39 0.39
0.37 0.37 0.37 0.370.35 0.35 0.34 0.34
0.31 0.310.29
0.22
0.33 0.32
0.38 0.38
InternationalAlert Line
Source: UN-HABITAT, Global Urban Observatory, 2009.Data from UN-ECLAC, UN-ESCAP, UNU and other sources.
FIGURE 2.4: MOST EQUAL CITIES (INCOME-BASED GINI). SELECTED CITIES IN THE DEVELOPING WORLD (1997-2006)

17
TH
E U
RB
AN
DIV
IDE
The Social Divide
The economic divide does more than deprive the poor of the proper shelter, basic utilities and dignified employment that are typically associated with the “urban advantage” and to which they are entitled. Beyond the functional goods and services that provide for decent living conditions, the repercussions of poverty can reach into life in its most physical and social dimensions.
Based on a systematic comparison of slum with non-slum populations within the same city, and groups of slum dwellers suffering various types of shelter deprivations, this Report demonstrates with compelling evidence that hunger, health and poor education outcomes have strong social class gradients, as measured by the intensity of shelter deprivations.
Hunger in cities. More and more urban populations are experiencing hunger and often with more intensity than those in rural areas. New data presented by UN-HABITAT on malnutrition in urban areas – as measured by the incidence of underweight children – shows significant differences in food security across socioeconomic groups in cities. As the relentless rise in food prices in urban areas combines with persistently low incomes, the urban poor cannot afford to purchase adequate amounts and types of food. Paradoxically, even in those countries with enough food for the whole population, only the richest can access it, while the poorest struggle every day to ensure one meal for their offspring. Based on strong empirical evidence, this Report shows that the current food crisis is not the first of its kind. In many places, food insecurity has affected the daily lives of urban poor and rural families for at least the past two decades. Data reveals that in the developing world, serious malnutrition has been widespread in urban slums and rural areas since 1990, regardless of local food crises. Over the past 15 years, more than four out of 10 children suffered from stunted development in Asia and Africa; in the poorest nations of Latin America and the Caribbean, the proportion was three to five out of 10. Just like poverty, hunger in cities is only the outcome of an inequitable distribution of available resources. Children from poor families are often born into hunger, grow up in hunger, and might die in hunger if no remedial action is taken.
The structural food crises the urban poor keep experiencing on an ongoing basis call for fundamental policy remedies, including with regard to production, marketing, distribution, handling, and control of food for the urban market.
Slum upgrading is strongly linked to health and nutrition programmes, and altogether should be part of a comprehensive approach to improved lives for the urban poor.
Eradicating hunger will require multiple interventions, and not only those related to food availability. Use of safe water, improved sanitation and durable housing materials, combined with provision of sufficient living areas to ease overcrowding, will improve the chances of better health outcomes and life conditions for slum dwellers.
The health divide. The poor are typically driven to the least developed areas of a city, often places that are poorly integrated to the urban fabric, where dilapidated environments lead to worse health outcomes and greater risks of premature deaths than in improved and well-maintained urban areas. This Report argues that cities where a higher degree of equality prevails – including lower income disparities, lower incidence of slums and only small numbers of slum dwellers with various shelter deprivations – the occurrence of ill health tends to be noticeably less frequent. Conversely, public health is generally poorer in more unequal cities that feature stark material differences in housing and basic service provision. Better housing conditions are therefore essential to ensuring a healthy population. For instance, in cities featuring large numbers of households with all four basic shelter deprivations, the prevalence of diseases such as diarrhea rises twofold compared with the whole city, and about threefold or more when compared with the non-slum areas of the same city.
s
India. ©Thefinalmiracle/Shutterstock

18
STA
TE
OF
TH
E W
OR
LD
’S C
ITIE
S 20
10/2
011
- OV
ER
VIE
W
Moreover, child mortality rates remain highly associated with diarrhoeal diseases, malaria and acute respiratory infections related to overcrowding and air pollution; these in turn result from various environmental health hazards such as lack of sanitation and hygiene, lack of access to safe water, poor housing conditions, poor management of solid wastes, and many other hazardous conditions. Children in substandard environments are exposed to contaminated air, food, water and soil, and to conditions where parasite-carrying insects breed.
The fight against childhood diseases must look beyond the traditional realm of the household to encompass the modern environment of disease: the neighbourhood, and the city as a whole, with all their attendant risks and harms.
Education: Opportunities and inequalities. Access to education is greater in cities than in rural areas. In most countries of the South, the “urban advantage” is quite clear for both rich and poor in urban settings. However, not all cities are alike in their accommodation of young people’s education and employment needs. Social and cultural barriers continue to deny slum dwellers the opportunity to complete their basic education. Children from slum communities are less likely to enroll in school and complete primary education; and youth living in the same communities have noticeably fewer opportunities to attend secondary school if compared with their peers in non-slum areas. These initial inequalities intensify at higher levels of education, perpetuating and reproducing an unfair system that restricts the physical and intellectual potential of millions of young urban dwellers, whose future is denied or jeopardized for lack of equitable distribution policies. The dilemma for many children of poor families is not what to study in the future, but a simple and shocking one: food, or school. Education remains a luxury for the urban poor in the face of current crises.
This Report sheds light on the particular challenges faced by slum populations with regard to this fundamental right, highlighting the fact that if the urban/rural gap in education has been reduced over time, the divide between rich and poor populations has been widening, and is cause for great concern. The Report also shows with fresh data that social inequalities are not only a matter of class hierarchy, but also of gender disparities. Still, efforts to improve the education of girls in some countries have resulted in significant increases in their enrolment numbers, but today a slight regression in boys’ enrolment and participation is becoming a worrying trend that calls for gender-sensitive responses.
The education of girls and young women generates powerful poverty-reducing synergies and yields enormous intergenerational gains. It is positively correlated with enhanced economic productivity, more robust labour markets, higher earnings, and improved societal health and well-being.
s
Delhi, India. India experiences a high rate of child malnutrition.©Paul Prescott/Shutterstock

19
TH
E U
RB
AN
DIV
IDE
s
Mopti, Mali. In times of crisis, school attendance always declines in developing countries; the tragedy is that some children may never return. ©Torsius/Shutterstock
20
STA
TE
OF
TH
E W
OR
LD
’S C
ITIE
S 20
10/2
011
- OV
ER
VIE
W
Taking Forward the Right to the City
The “right to the city” has evolved over the past 50 years as a challenge to the exclusionary development, selective benefit-sharing, marginalization and discrimination that are rampant in cities today. More than a new legalistic device, the right to the city is the expression of the deep yearnings of urban dwellers for effective recognition of their various human rights. The concept has been deployed in various ways across regions, countries and cities of the world. In some places it has been used as a theoretical and political framework focusing on enforcement, empowerment, participation, self-fulfillment, self-determination and various forms of human rights protection at the city level. In other places, the concept has served as a platform for action and a practical framework for enforcement, whereas in some cities, the concept is absent from the political discourse, either not used at all or banned outright.
Where the right to the city has been implemented, higher degrees of inclusion have not necessarily ensued, though. Large numbers of people, particularly in the developing world, do not fully benefit from the “urban advantage”, do not participate in decision-making and do not enjoy effective fundamental rights and liberties, while others do, living in decent, healthy and environmentally friendly places with full exercise of their citizenship. Some other countries have made significant efforts to close the urban divide as part of a less specific “rights-based” approach, or only recognizing some particular aspects of the right to the city. Despite these ambiguities, the right to the city remains a powerful vehicle for social change.
Brazil in 1988 was the first country to include the right to the city in its constitution. As an expert from São Paulo commented in the UN-HABITAT policy analysis on the inclusive city, “nowadays, talking about rights is talking about the right to the city”. Ecuador recognized several housing-related rights in its 2008 constitution, including the right to the city. In that country, a respondent to the survey component of the policy analysis in Portoviejo associated this right with unrestricted access to services, freedom of opinion and participation, and equal access to opportunities: “This right is, in its broader sense, endorsed by decision-makers, as well as recognized and implemented by the community in its everyday life through widespread practice.”
Many other cities in the developing world devise and deploy policies in compliance with national legal commitments to more inclusive communities; although they
fall short of explicit references to the right to the city per se, they endorse some particular aspects of the notion. For example, Rosario, Argentina’s third largest city, has declared itself a “Human Rights City” with a formal commitment to openness, transparency and accountability. In Australia, the Victoria Charter of Human Rights and Responsibilities (2006) refers explicitly to equal rights, including freedom, respect, equality and dignity for all. Some other countries and cities endorse aspects of democratic governance that are explicitly or implicitly consistent with the “right to the city” concept: Dakar’s Civic and Citizens’ Pact (2003); India’s Citizen’s Charter (1997); and Porto Alegre’s Participatory Budgeting and Local Solidarity and Governance Programme (2004).
A number of cities in India, Ghana, South Africa, Colombia, Brazil, Ecuador, Peru and other Latin American countries are also taking forward the right to the city concept in a variety of spheres (social, economic, political, and cultural), even if progress is often rather slow and sometimes suffers from repeated setbacks. In some other cities and countries, particularly in South-Eastern and Eastern Asia and North Africa, economic growth policies have gone hand in hand with positive social developments and the populations enjoy a decent quality of life, but political rights and freedom are lagging behind. Other cities and countries, mainly in sub-Saharan Africa and Western Asia, are about to deploy legal and political frameworks based on equality and rights.
This Report identifies the factors hindering implementation of the right to the city and other forms of inclusion needed to bridge the urban divide. In addition to a variety of factors – historical socioeconomic inequalities, grinding poverty, environmental degradation and more frequent climate change-related natural disasters, among other threats – the Report highlights poorly defined inclusive mechanisms and institutions. It also points to deficiencies in the instruments that make it possible to understand and anticipate some of the factors generating further inequalities (i.e. scarcity of land and concentration of ownership in very few hands; lack of redistributive policies; ineffective housing markets, etc.). Moreover, only very few municipal leaders have demonstrated a proper sense of vision or political commitment to overcome the urban divide.
UN-HABITAT policy analysis shows that more often than not, policy aims and processes do not match because they fail to acknowledge the inter-linkages among the four spheres or dimensions of the inclusive city – economic, social, political, and cultural. Admittedly, cities will, time and again, adopt new rules and regulations in a bid to address some exclusion-
3Bridging the Urban Divide

21
BR
IDG
ING
TH
E U
RB
AN
DIV
IDE
related issues; but these fail to spell out specific goalposts, sustained processes or tangible results that can be monitored. Moreover, institutional frameworks tend over time to embed negative instead of positive attitudes, and to entrench informal social arrangements that are impervious to change. The Report details the most important factors that prevent cities from bridging the urban divide and taking forward the right to the city. These include (1) poor coordination among various tiers of government; (2) absence of data for informed policy choices; (3) influence of vested interests; (4) inadequate adjustment to changing economic conditions; and (5) exclusion of marginalized groups and discrimination of minorities.
Against this background, it is not surprising that more than two-thirds of respondents to the UN-HABITAT policy analysis survey perceived urban reforms as serving primarily the interests of the rich, with politicians and civil servants coming next (except in Africa, where they are viewed as the major beneficiaries). The urban poor stand to share only to a minimal extent, if at all, in any benefits accruing from urbanization and related reforms. As one of the experts from Latin America commented, “When one is [economically] poor, one is also poor and excluded in a cultural, social and political sense”. The majority of excluded groups in slum areas typically fall victim to a sort of triple jeopardy: (1) they are poor and uneducated; (2) many are migrants or from ethnic minorities; and (3) many are female.
This Report identifies the key principles underlying the right to the city, providing the basic underpinnings needed by those municipalities interested in a rights-based approach to inclusion that does not overtly endorse the “right to the city” concept. The Report also discusses some critical aspects that are needed to guarantee an effective right to the city for all. In particular, this right must be seen as a vision for an alternative, well-devised, ideal city; instead of a right to any city, especially today’s dominant, defective model, this is an entitlement to an urban environment where mutual respect, tolerance, democracy and social justice prevail.
Adoption and implementation of a strong human rights-based approach upholds the dignity of all urban residents in the face of multiple rights violations, including the right to decent living conditions. The right to the city can provide municipal authorities with the platform they need for a wide range of policies and initiatives that promote an “inclusive” urban environment.
The right to the city calls for a holistic, balanced and multicultural type of urban development. Therefore, it must pervade all policy areas, including land use, planning, management and reform, and it must do so in close cooperation with government agencies and civil society.
s
Shanghai. ©Mark Henley/Panos Pictures

22
STA
TE
OF
TH
E W
OR
LD
’S C
ITIE
S 20
10/2
011
- OV
ER
VIE
W
The Regional Dynamics of Inclusion
The urban divide results from social, economic, political, and cultural exclusion. Taken individually, each of these di-mensions has far-reaching consequences for urban dynamics and the way policy initiatives can influence inequality. How-ever, this Report shows with compelling evidence that these four dimensions overlap and interact to a substantial degree. Therefore, understanding the dynamic linkages among them is essential to any prompt and sustainable transition from a partially to a completely inclusive city. Any government com-Any government com-mitted to promoting inclusiveness should act in a proactive way across the four dimensions. UN-HABITAT policy analy-sis highlights significant associations among them, and these findings can be readily used by municipal and other public authorities to guide their own efforts and policies on the way to more inclusive cities.
Economic inclusion is tied closely to the social and political dimensions of inclusion. Some cities grow and prosper, others are less successful. In any of these cases, genuine economic inclusion leading to equitable allocation of opportunities and income is, to a very large extent, determined by the political, cultural and social equality parameters that are specific to any given city.
UN-HABITAT analysis shows that in African surveyed cities, economic inclusion appears to be strongly associated with the planning functions of municipal, state/provincial and national government, as well as with the active involvement of non-governmental organizations that advocate stronger political will, freedom of expression and human rights. The connection between economic inclusion and social and political freedoms comes as a response to extensive rent-seeking by the political and economic elites that dominate the urban economy. For all purposes and effects, this correlation echoes a call to democratize the business sector in order to open it up and provide opportunities for all, instead of systematically denying these to most citizens due to weak institutions, inadequate regulatory frameworks, and poor government management of the economic sphere.
In Asia, economic inclusiveness in surveyed cities is associated with government-induced employment (through infrastructure development, for example), together with fiscal incentives and sound contractual and legal frameworks. Freedom of expression is also strongly associated with economic inclusiveness in this region. This can be explained by the expansion of the middle class as a result of economic prosperity in various countries, which in turn is accompanied by greater demands not just for the sake of improved social and economic conditions, but also for transparency and accountability.
0.0
0.5
1.0
1.5
2.0
2.5
3.0
3.5
4.0
4.5
5.0
Slum dw
ellers
Peop
le of
specia
l racia
l back
groun
ds
Low-in
come c
atego
ries
Peop
le of
specifi
c cast
e or c
reed
Specifi
c ethn
ic grou
ps
Immigr
ants
from ur
ban a
reas
Immigr
ants
from ru
ral ar
eas
Immigr
ants
from ou
tside
the c
ountr
y
Unedu
cated
peop
le
Disable
d peo
ple
Elderl
y peo
ple
Women
and c
hildren
Abuja Accra Dakar Ibadan Johannesburg Mombasa Nairobi Total
FIGURE 3.1: PERCEIVED DEGREE OF EXCLUSION OF UNDERPRIVILEGED GROUPS (SEVEN AFRICAN CITIES)*
Source: UN-HABITAT, City Monitoring Branch, Policy analysis 2009 * Average of ratings (on a scale of 0 to 5) by local experts responding to the UN-HABITAT 2009 survey.
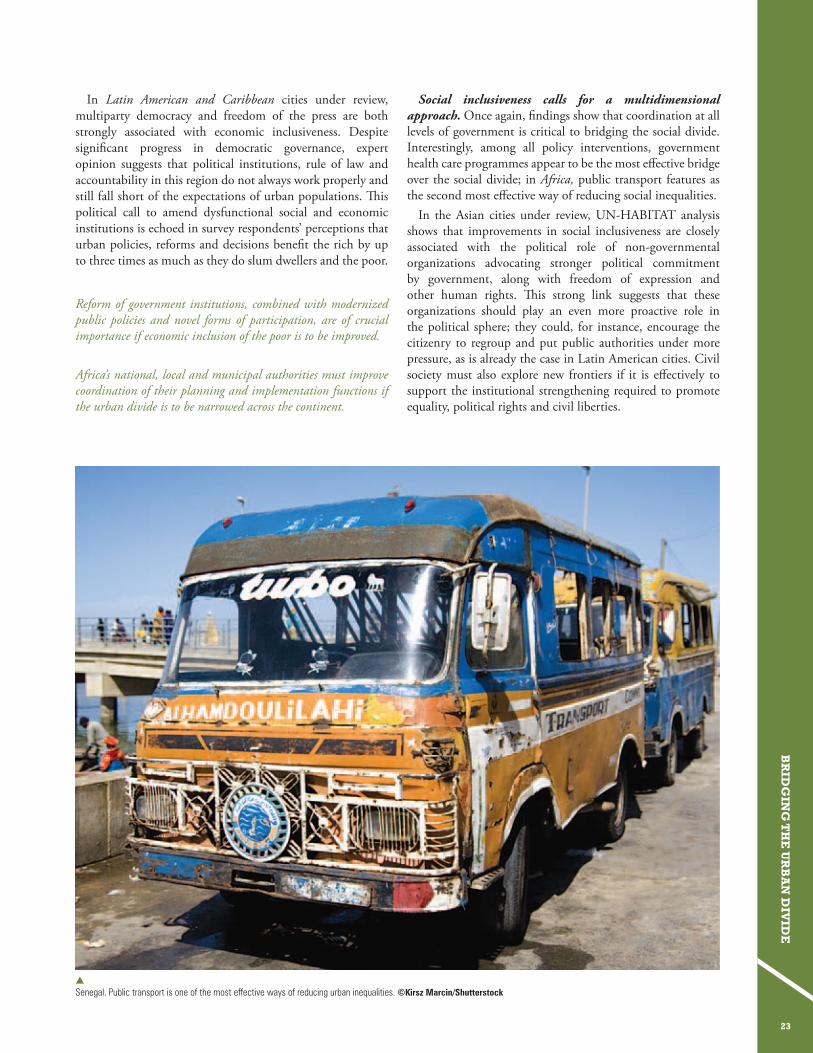
23
BR
IDG
ING
TH
E U
RB
AN
DIV
IDE
In Latin American and Caribbean cities under review, multiparty democracy and freedom of the press are both strongly associated with economic inclusiveness. Despite significant progress in democratic governance, expert opinion suggests that political institutions, rule of law and accountability in this region do not always work properly and still fall short of the expectations of urban populations. This political call to amend dysfunctional social and economic institutions is echoed in survey respondents’ perceptions that urban policies, reforms and decisions benefit the rich by up to three times as much as they do slum dwellers and the poor.
Reform of government institutions, combined with modernized public policies and novel forms of participation, are of crucial importance if economic inclusion of the poor is to be improved.
Africa’s national, local and municipal authorities must improve coordination of their planning and implementation functions if the urban divide is to be narrowed across the continent.
Social inclusiveness calls for a multidimensional approach. Once again, findings show that coordination at all levels of government is critical to bridging the social divide. Interestingly, among all policy interventions, government health care programmes appear to be the most effective bridge over the social divide; in Africa, public transport features as the second most effective way of reducing social inequalities.
In the Asian cities under review, UN-HABITAT analysis shows that improvements in social inclusiveness are closely associated with the political role of non-governmental organizations advocating stronger political commitment by government, along with freedom of expression and other human rights. This strong link suggests that these organizations should play an even more proactive role in the political sphere; they could, for instance, encourage the citizenry to regroup and put public authorities under more pressure, as is already the case in Latin American cities. Civil society must also explore new frontiers if it is effectively to support the institutional strengthening required to promote equality, political rights and civil liberties.
s
Senegal. Public transport is one of the most effective ways of reducing urban inequalities. ©Kirsz Marcin/Shutterstock
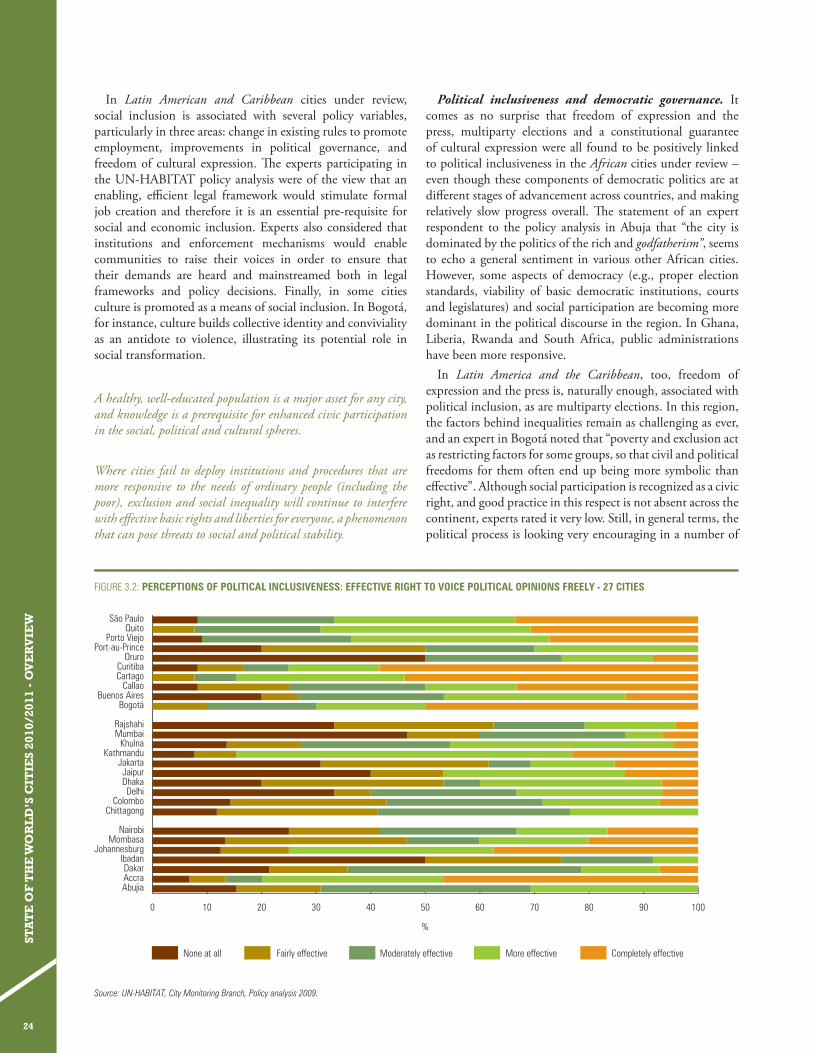
24
STA
TE
OF
TH
E W
OR
LD
’S C
ITIE
S 20
10/2
011
- OV
ER
VIE
W
In Latin American and Caribbean cities under review, social inclusion is associated with several policy variables, particularly in three areas: change in existing rules to promote employment, improvements in political governance, and freedom of cultural expression. The experts participating in the UN-HABITAT policy analysis were of the view that an enabling, efficient legal framework would stimulate formal job creation and therefore it is an essential pre-requisite for social and economic inclusion. Experts also considered that institutions and enforcement mechanisms would enable communities to raise their voices in order to ensure that their demands are heard and mainstreamed both in legal frameworks and policy decisions. Finally, in some cities culture is promoted as a means of social inclusion. In Bogotá, for instance, culture builds collective identity and conviviality as an antidote to violence, illustrating its potential role in social transformation.
A healthy, well-educated population is a major asset for any city, and knowledge is a prerequisite for enhanced civic participation in the social, political and cultural spheres.
Where cities fail to deploy institutions and procedures that are more responsive to the needs of ordinary people (including the poor), exclusion and social inequality will continue to interfere with effective basic rights and liberties for everyone, a phenomenon that can pose threats to social and political stability.
Political inclusiveness and democratic governance. It comes as no surprise that freedom of expression and the press, multiparty elections and a constitutional guarantee of cultural expression were all found to be positively linked to political inclusiveness in the African cities under review – even though these components of democratic politics are at different stages of advancement across countries, and making relatively slow progress overall. The statement of an expert respondent to the policy analysis in Abuja that “the city is dominated by the politics of the rich and godfatherism”, seems to echo a general sentiment in various other African cities. However, some aspects of democracy (e.g., proper election standards, viability of basic democratic institutions, courts and legislatures) and social participation are becoming more dominant in the political discourse in the region. In Ghana, Liberia, Rwanda and South Africa, public administrations have been more responsive.
In Latin America and the Caribbean, too, freedom of expression and the press is, naturally enough, associated with political inclusion, as are multiparty elections. In this region, the factors behind inequalities remain as challenging as ever, and an expert in Bogotá noted that “poverty and exclusion act as restricting factors for some groups, so that civil and political freedoms for them often end up being more symbolic than effective”. Although social participation is recognized as a civic right, and good practice in this respect is not absent across the continent, experts rated it very low. Still, in general terms, the political process is looking very encouraging in a number of
Completely effectiveMore effectiveModerately effectiveFairly effectiveNone at all
%
0 10 20 30 40 50 60 70 80 90 100
Completely effectiveMore effectiveModerately effectiveFairly effectiveNone at all
%
0 10 20 30 40 50 60 70 80 90 100
AbujiaAccraDakar
IbadanJohannesburg
MombasaNairobi
ChittagongColombo
DelhiDhakaJaipur
JakartaKathmandu
KhulnaMumbaiRajshahi
BogotáBuenos Aires
CallaoCartagoCuritiba
OruroPort-au-Prince
Porto ViejoQuito
São Paulo
AbujiaAccraDakar
IbadanJohannesburg
MombasaNairobi
ChittagongColombo
DelhiDhakaJaipur
JakartaKathmandu
KhulnaMumbaiRajshahi
BogotáBuenos Aires
CallaoCartagoCuritiba
OruroPort-au-Prince
Porto ViejoQuito
São Paulo
Completely effectiveMore effectiveModerately effectiveFairly effectiveNone at all
%
0 10 20 30 40 50 60 70 80 90 100
Completely effectiveMore effectiveModerately effectiveFairly effectiveNone at all
%
0 10 20 30 40 50 60 70 80 90 100
AbujiaAccraDakar
IbadanJohannesburg
MombasaNairobi
ChittagongColombo
DelhiDhakaJaipur
JakartaKathmandu
KhulnaMumbaiRajshahi
BogotáBuenos Aires
CallaoCartagoCuritiba
OruroPort-au-Prince
Porto ViejoQuito
São Paulo
AbujiaAccraDakar
IbadanJohannesburg
MombasaNairobi
ChittagongColombo
DelhiDhakaJaipur
JakartaKathmandu
KhulnaMumbaiRajshahi
BogotáBuenos Aires
CallaoCartagoCuritiba
OruroPort-au-Prince
Porto ViejoQuito
São Paulo
FIGURE 3.2: PERCEPTIONS OF POLITICAL INCLUSIVENESS: EFFECTIVE RIGHT TO VOICE POLITICAL OPINIONS FREELY - 27 CITIES
Source: UN-HABITAT, City Monitoring Branch, Policy analysis 2009.

25
BR
IDG
ING
TH
E U
RB
AN
DIV
IDE
cities and countries in this region, as it is beginning to usher in a more positive political and institutional environment. Various instances of best practice demonstrate the close links between political inclusiveness, democratic governance and full exercise of civic and political rights. Other instances show a clear connection between cultural expression and political inclusion (e.g., Bogotá’s Declaration of Cultural Rights).
The empirical link between democratic governance and social inclusion highlights the need for institutions and enforcement mechanisms that favour participatory decision-making, while guaranteeing effective freedom of speech and the press.
Using culture for social, economic and political inclusion. In cities as diverse as Buenos Aires, Port-au-Prince, Chittagong, Abuja or Mombasa, cultural diversity and city inclusion find themselves challenged by a similar set of factors, namely, extremely inequitable provision of cultural facilities and access to culture, technology and information among poorer areas and more affluent neighbourhoods. This cultural divide undermines the capacity of the poor to take advantage of modern-day cultural and other opportunities for self-development and enjoyment.
Numerous cities are, nevertheless, struggling to promote culture in underprivileged areas and enabling some forms of cultural rights and expressions; they do so through three main channels: (1) ad hoc provision of shared spaces for cultural
Completely effectiveMore effectiveModerately effectiveFairly effectiveNone at all
%
0 10 20 30 40 50 60 70 80 90 100
Completely effectiveMore effectiveModerately effectiveFairly effectiveNone at all
%
0 10 20 30 40 50 60 70 80 90 100
AbujiaAccraDakar
IbadanJohannesburg
MombasaNairobi
ChittagongColombo
DelhiDhakaJaipur
JakartaKathmandu
KhulnaMumbaiRajshahi
BogotáBuenos Aires
CallaoCartagoCuritiba
OruroPort-au-Prince
Porto ViejoQuito
São Paulo
AbujiaAccraDakar
IbadanJohannesburg
MombasaNairobi
ChittagongColombo
DelhiDhakaJaipur
JakartaKathmandu
KhulnaMumbaiRajshahi
BogotáBuenos Aires
CallaoCartagoCuritiba
OruroPort-au-Prince
Porto ViejoQuito
São Paulo
Completely effectiveMore effectiveModerately effectiveFairly effectiveNone at all
%
0 10 20 30 40 50 60 70 80 90 100
Completely effectiveMore effectiveModerately effectiveFairly effectiveNone at all
%
0 10 20 30 40 50 60 70 80 90 100
AbujiaAccraDakar
IbadanJohannesburg
MombasaNairobi
ChittagongColombo
DelhiDhakaJaipur
JakartaKathmandu
KhulnaMumbaiRajshahi
BogotáBuenos Aires
CallaoCartagoCuritiba
OruroPort-au-Prince
Porto ViejoQuito
São Paulo
AbujiaAccraDakar
IbadanJohannesburg
MombasaNairobi
ChittagongColombo
DelhiDhakaJaipur
JakartaKathmandu
KhulnaMumbaiRajshahi
BogotáBuenos Aires
CallaoCartagoCuritiba
OruroPort-au-Prince
Porto ViejoQuito
São Paulo
FIGURE 3.3: PERCEPTIONS OF CULTURAL INCLUSIVENESS: EFFECTIVE RIGHT TO ALL SOCIAL AND CULTURAL FACILITIES AND VENUES - 27 CITIES
Source: UN-HABITAT, City Monitoring Branch, Policy analysis 2009.
events; (2) promotion of intercultural programmes; and (3) the protection and celebration of specific monuments and buildings that are part of the architectural heritage. In most such cases, though, the rationale behind the promotion of cultural expression and heritage preservation is to impose fixed values and single, one-way meanings on places and narratives, which are made to reflect only the history of the country’s or city’s ethnic majority and oligarchies. Consequently, various other cultural and ethnic groups fail to recognize themselves in that particular history or local identity, adding to their sense of systematic exclusion. In all developing regions, the poor and slum dwellers appear to be systematically excluded from cultural life, along with the elderly, young people and foreign migrants. Poverty in Asia, Africa and Latin America conspires against cultural inclusion. An expert in Quito characterized this relationship in no uncertain terms: “An individual who is poor economically will very often be poor socially and culturally, too”. In Asian and African cities, where culture is historically entrenched in various forms of inequalities that persist across generations, freedom of expression appears to be strongly linked with cultural inclusion. In the Latin American and Caribbean cities under review, cultural inclusiveness is positively correlated with laws that promote equitable employment, as well as with fiscal incentives, micro-credit and formal municipal promotion of culture. Cities and countries that are bridging the cultural divide combine effective access to education, the judiciary and other public and private services, as well as sports and
26
STA
TE
OF
TH
E W
OR
LD
’S C
ITIE
S 20
10/2
011
- OV
ER
VIE
W
leisure activities and amenities, recognizing that cultural diversity is essential to the construction of citizenship. This recognition is fundamental if traditional behaviour, attitudes and practice are to be transformed for the purposes of an enhanced democratic culture.
Cities should encourage anything that can foster multiple and complementary identities in order to reduce any polarization between various groups, particularly in a multi-cultural, multi-linguistic, multi-ethnic type of society. Recognition of cultural diversity entails the deployment of spaces and conditions that favour various forms of active participation, in accordance with the different societal, cultural and organizational forms that characterize any given population.
Five Strategic Steps to an Inclusive City
An inclusive city can be defined and individually experienced in many different ways by its residents. Still, inclusive cities share a few basic features that can take different forms in various conditions: they provide the opportunities and supportive mechanisms that enable all residents to develop their full potential and gain their fair shares of the “urban advantage”. In an inclusive city, residents perceive themselves as important contributors to decision-making, ranging from political issues to the more mundane routines of daily life. Active participation guarantees all residents a stake in the benefits of urban development. The concepts of human relations, citizenship and civic rights are all inseparable from urban inclusiveness.
UN-HABITAT policy analysis has identified a series of practical strategic steps and catalysts for change that make it easier for municipal authorities to bridge the urban divide. The practical strategic steps that contribute to the promotion of an inclusive city are the following: (1) assessing the past and measuring progress; (2) establishing new, more effective institutions, or strengthening existing ones as needed; (3) building new linkages and alliances among various tiers of government; (4) developing a sustained, comprehensive vision to promote inclusiveness; and (5) ensuring an equitable redistribution of opportunities.
1) Assessing the past and measuring progress. The beauty and the challenge of urban space is that no two cities are alike. Each has its own history, economy, politics, social dynamics, cultural beat and, above all, human potential. Cities do not become divisive overnight; rather, as this report shows, exclusion and marginalization build and reproduce over time due to fierce and unequal competition for land, labour, capital, resources, and the like. Understanding the specific factors behind the urban divide and the way it makes itself felt in any given city is a crucial step for those municipal authorities committed to promoting inclusion. Such understanding can help determine the direction of change and anticipate the institutional and financial requirements for reform. It also
establishes a starting point from which future policies and practices can be assessed, enabling city managers to monitor progress and evaluate performance.
2) More effective, stronger institutions. In the cities of the developing world, existing rules and institutions are generally perceived as creations of the rich and powerful that frequently cater to their sole interests, with little regard for those of other social groups, particularly the poor. However, a new development paradigm is placing institutions at the centre of efforts to promote sustainable development and reduce poverty and inequality, recognizing their moral leverage and power of social transformation. Evidence from successful cities shows that the way municipalities perform their duties is just as important as the nature of what they achieve. Inclusive cities conduct in-depth reviews of their systems, structures and institutional mechanisms to pave the way for genuine change, including the more effective and stronger institutions that are part of a structural and societal transformation process.
3) Building new linkages and alliances among the various tiers of government. Evidence from the UN-HABITAT expert survey shows that it takes no less than the three tiers of government (city, state/provincial and national) to make a city inclusive, and even a fourth one – metropolitan-area coordinating bodies – depending on local circumstances. Unfortunately, in the developing world, reality is all-too-often at odds with this finding, as government coordination remains patchy, poor and informal. Cities that manage both to develop innovative programmes and actions and deploy greater “entrepreneurship” achieve more if they establish strategic alliances that combine policies and resources with other tiers of government as well as the private sector. Efficient linkages among various public authorities and civil society also ensure greater sustainability of local programmes. Experience shows that at the root of successful collaboration lies an institutional and managerial capacity to share resources such as staff, skills, funding, information and knowledge for mutual benefit or gain.
4) Demonstrating a sustained vision to promote inclusiveness. Cities need a clear “vision” of their future – a long-term plan that combines creativity, realism and inspiration on top of providing a framework for strategic planning. A city’s “vision” builds upon its specific identity, comparative advantage, geographic endowments and defining historical and cultural dimensions. It is not just a city’s function, structure and form that its vision projects into the future, but also a community’s dreams and aspirations. For this reason, any city “vision” should always be context-driven and developed with the participation of all segments of the population. Unfortunately, at present, in a majority of cities, urban planning practice seems to be divorced from any long-term city vision, and many major decisions are influenced by pressures from various stakeholders. Thus, an open, transparent process that integrates various kinds of urban stakeholders has more chances to address entrenched problems of exclusion, proposing solutions that are appropriate both culturally and politically. Such inclusive

27
BR
IDG
ING
TH
E U
RB
AN
DIV
IDE
development of a vision and planning in turn enhances the potential for collective ownership, as the proposed action plan is endorsed by the broadest possible constituency. A city’s vision must be optimistic and ambitious, and at the same time realistic. It should be innovative if it is to break with the inertia of the past and bring about a qualitative leap towards the future. A vision should turn into a workable plan with clearly defined funding sources and accounting mechanisms. In this sense, far from being a fiction, a “vision” is a plan, a roadmap, and a commitment that is made by city authorities (who are the leaders, custodians and promoters of the vision) and the other tiers of government and civil society (who are major stakeholders in the process).
5) Ensuring the redistribution of opportunities. Cities are places of opportunity. They act as the engines of national economies, driving wealth creation, social development and employment. The urban environment acts as the primary locus for innovation, industrial and technological progress, entrepreneurship and creativity. Strong empirical evidence confirms that the concentration of people and productive activities in cities generates economies of scale and proxim-ity that stimulate growth and reduce the costs of production, including the delivery of collective basic services such as piped water, sewers and drains, electricity, solid waste collection, public transport, health care, schools and many other pub-lic amenities and services. However, as it concentrates people and productive activities, a city can become a problem if it is inadequately planned or poorly governed, or when distri-butional policies are lacking or dysfunctional. The distribu-tion of opportunities across the population can, therefore, become skewed or inequitable. Still, all these challenges are outnumbered by opportunities: cities will continue to stand at the crossroads of an interdependent world, producing goods, services and ideas within an institutional framework that can either overcome or exacerbate the urban divide.
Equal Opportunities: Catalysts for Distributive Change
The five strategic steps described above provide municipal authorities with the overall strategic framework they need to bridge the urban divide and move towards a more inclusive city. This dynamic framework is designed to support local rights-based policies that tackle exclusion in its various dimensions and redistribute opportunities across urban populations. In this respect, UN-HABITAT policy analysis has identified five catalysts for distributive change that municipal authorities can activate in cooperation with provincial and national government. These catalysts overlap with the four dimensions of exclusion/inclusion as well as with the recognized international rights implicitly subsumed in the “right to the city”. More specifically, improvements in the living conditions of the urban poor, investment in human capital and fostering employment opportunities are designed to affirm social and economic inclusion and rights, and the other two catalysts explicitly focus on political and cultural
inclusion and rights. Socioeconomic inclusion calls for land tenure reform and capital investment in infrastructure, which create the conditions for people to fulfill their individual potential. The catalysts for distributive change involve local government practices that foster political inclusion, as well as budgeting and planning procedures that achieve cultural inclusion through direct involvement of ethnic minorities in decision-making. The five policy catalysts are as follows:
a) Improve quality of life, especially for the urban poor. Creating the conditions for improved access to safe and healthy shelter, secure tenure, basic services and social amenities such as health and education, is essential to any individual’s physical, psychological, social and economic development and well-being.
s
Morocco. ©Silvia Antunes/Shutterstock

28
STA
TE
OF
TH
E W
OR
LD
’S C
ITIE
S 20
10/2
011
- OV
ER
VIE
W
b) Invest in human capital formation. Cities and regions are well-placed to ensure strategic coordination between the institutions and various stakeholders involved in human capital formation, and to design policies that are well-adjusted to local needs. Such capital formation is a condition for socioeconomic development and a more equitable distribution of the urban advantage.
c) Foster sustained economic opportunities. Cities can stimulate sustained economic growth for poor and underprivileged populations through promotion of labour-intensive projects. These include primarily public works and the construction industry, which can give opportunities for support to small-scale enterprises and the informal sector. Moreover, and in close cooperation with national government, a number of cities in the developing world have launched various forms ofsocial security or protection schemes in a bid to expand access to economic opportunities for those traditionally excluded from mainstream wealth creation and economic development. In this respect, conditional cash transfers (CCTs) stand out as the most efficient poverty reduction mechanism. These schemes enhance incomes in the short run and capabilities in the long run.
d) Enhance political inclusion. Today, more and more municipal and national authorities share the same basic philosophy: bringing government within the reach of ordinary people through enhanced mutual engagement. Some of these municipalities are constantly trying out new modes of
political participation, creating permanent fora for dialogue and negotiation. The physical space is becoming a political space in terms of systems of representation and participation, and in this sense is a fundamental aspect of local democracy.
e) Promote cultural inclusion. Culture has historically been left out of the conventional international development agenda, or relegated to its fringes. However, more and more scholars and experts have come to realize that some cities in the South have opted for a more comprehensive perspective on development, one where culture features as one of the levers of success. More and more local development policies and strategies are by now mainstreaming some of the cultural dimensions of urban life, such as social capital, tradition, symbols, meaning, sense of belonging and pride of place, on top of optimal use of local cultural resources by local communities. A number of cities today are using culture as a transformational tool to integrate ethnic minorities, preserve regional values, safeguard linguistic and religious diversity, resolve conflicts, protect the heritage in the built environment, and in the process promote economic development. Beyond the sole cultural sphere, these policies together can go a long way towards bridging the urban divide in its other – social, political and economic – dimensions.
It takes five catalysts to integrate the poor and marginalized into mainstream urban life: improved quality of life, investment in human capital formation, sustained economic opportunities, enhanced political inclusion, and cultural inclusion.
s
Rio de Janeiro, Brazil. The federal government has increased the budget for housing and expanded the supply side of the market through changes to home loan regulations.©AND Inc./Shutterstock

Cities are constantly changing. They are built, rebuilt, destroyed, transformed, occupied by different groups, and used for different functions. In the search for higher returns through better spatial structures, more efficient economies of scale and other benefits, cities generate a diversity of residential patterns. In this process, they are more often than
not divided by visible and invisible borders, splitting “off-centre” and “central” areas, or the “higher” and the “lower” districts, as the Urban Divide is colloquially symbolized in many developing countries.
The Urban Divide can be characterized by various forms of inclusion/exclusion, integration/marginalization, wealth/poverty, equality/inequality, formality and informality. Those on the wrong side of the divide are excluded of the
benefits of urban expansion and prosperity. They are denied the urban advantage.
The most visible and measurable form of inclusion or exclusion is economic, and this Report reviews urban economic inequality based on new data. Other social, political and cultural factors are shown to be at work, too, from the latest
research, policy analysis and available statistics. The urban poor and underprivileged – women and young people in particular – are exposed to various types of inequality, from planning and land policies (or their absence) to a lack of basic services, decent employment, education, nutrition, health care as well as civic and political freedoms and
opportunities.
As this new edition of State of the World’s Cities demonstrates, the “Urban Divide” concept provides a theoretical framework that makes it possible to understand today’s urban realities, particularly in the developing world. From a more practical perspective, the concept highlights the four critical dimensions of the divide – social, economic,
political and cultural – at work in many cities of the world today.
The findings suggest that economic growth cannot, on its own, bring the redistributive change required to address urban exclusion. This Report advocates rights-based policies as the best way of “Bridging the Urban Divide”. These basic rights capture the four dimensions of exclusion/inclusion and are already endorsed, if only formally, in most
national constitutions. Expert opinion from 27 representative cities pinpoints how the dynamics of inclusion can work in three major developing regions, as well as the predictable and less predictable interconnections between
economic, social, political and cultural factors. Public authorities must tackle the four dimensions of inequality simultaneously; and this will not be feasible short of close institutional, policymaking and financial coordination
between municipal, intermediary and central tiers of government.
This Report maps out five major policy steps across the urban divide and suggests how better to integrate the poor and marginalized into mainstream urban life. It shows with compelling evidence that determined governments are
in a position to eliminate the divisions, and pave the way for more tolerance, diversity and social justice in the towns and cities of this world.
www.unhabitat.org