state of the market mining and finance report by intierrarmg - edition 1 2013
TRANSCRIPT

Edition 1, 2013
State of the Market: Mining and Finance ReportExpert review of all aspects of the industry, recent performance and quarterly outlook

02State of the Market: Mining and Finance ReportEdition 1, 2013
Hinde Sight 03
Market for Mining 04
Exploration Hot Spots 06
Assay Share Price Alert 10
Metals Production Outlook 11
Mergers and Acquisitions 15
Mining Finance 16
Special Report: Overview of 2012 18
Special Report: Mining Royalties and Taxation 24
Contents
STATE OF THE MARKET: MINING AND FINANCE REPORTReport is published byIntierraRMG Pty Ltd
IntierraRMGAbbey House, 5th Floor74-76 St John StreetLondon, EC1M 4DZTel: +44 (0)20 7780 7470Website: www.intierraRMG.com
ContactChris HindeEditorial DirectorEmail: [email protected]
Kelly ChanMarketing ManagerEmail: [email protected]
CONTRIBUTORSÅsa BorssénRovino ChaudharyAlexander ElvingMagnus EricssonStuart FergusonNoxy HatungimanaChris HindeViktoriya LarssonOlof LöfJeremy Thompson
This report is supplied on a confidential basis for the subscriber's use only. The contents must not be disclosed to third parties and it must not be copied in whole or in part without the prior written permission of IntierraRMG Pty Limited. Photocopying and electronic forwarding prohibited. Copyright 2013 IntierraRMG.

03State of the Market: Mining and Finance ReportEdition 1, 2013
If the abnormal (and still not complete) Glencore-Xstrata transaction is excluded, there were only US$46.0 billion of mining deals announced last year. The value of these 298 deals contrasts with the US$98.9 billion announced in 2011.
Despite this worrying shortfall, there are signs that, at last, the supporting finance is becoming easier. Funds raised by mining companies in the quarter to end-December rose to US$6.8 billion, compared with only US$5.5 billion in the September quarter, and this represented a welcome increase on the monies raised in the final quarter of 2011 (see p16).
In its forecast for 2013, IntierraRMG expects mergers and acquisitions to gather steam, with cash-rich companies targeting juniors. Meanwhile, the on-going weakness in traditional debt-equity markets will fuel ever more imaginative methods of financing.
The targets will need to be low risk, however, with chief executives feeling the heat from over-valued assets in previous periods of takeover activity. For the past few years it has been the CEOs at junior companies that have been the subject of most sympathy. Suddenly, it is executives who sit at the sharp end of planes that are under pressure, and four of the leading mining companies are in the process of changing their leaders.
Rio Tinto recently announced an US$14 billion asset write down in its aluminium and coal divisions (two days after announcing record iron-ore production). The write down in balance sheet value is equivalent to a shocking 13% of the Anglo-Australian company’s market capitalisation, and the Board announced that chief executive Tom Albanese was resigning with immediate effect, and by “mutual consent”.
The bulk of the write down was the US$10-11 billion impairment of the company’s aluminium assets, most of which were acquired with the US$38 billion purchase of Alcan (a deal that was finally completed in November 2007, coinciding almost precisely with a peak in aluminium prices). The latest write-down brings the total reduction in the carried value of Alcan’s assets to almost US$28 billion.
However, Mr Albanese can’t reasonably be blamed for the Alcan debacle as the acquisition came very early in his tenure, which started in May 2007. What sealed his departure was the scarcely credible US$3 billion charge against the company’s coal assets in Mozambique. This prize was acquired for US$3.7 billion less than two years ago.
Mr Albanese’s demise signals the start of what will be a period of remarkable change at the top of the mining industry. The boss of Anglo American, Cynthia Carroll, is leaving in April (to be replaced by AngloGold Ashanti’s Mark Cutifani), Mick Davis is due to leave Xstrata six months after it merges with Glencore, and BHP Billiton is looking to replace Marius Kloppers.
The new executives will be taking the reins at a challenging time for the industry, with volatile metals prices, increased political attention and widespread unrest amongst stakeholders. There is particular disquiet amongst employees, with strikes being triggered by industry-wide cost-cutting measures that include swingeing redundancies.
The leading mining companies will stick with what they know best, and that means a continued focus on iron ore, copper and coal. However, the real test of the incoming CEOs will be how they reposition their companies to the new operating conditions. They will, surely, be more careful on valuing deals.
Resource-stock investors and city financiers have been risk averse for a few years but suddenly it is the turn of the mining CEOs
Copper prices (US$/t)
Coal prices* (US$/t)Iron ore prices* (US$/t)
Gold prices (US$/oz)
Hinde Sight
Jan 2011 Dec 20128090
100110120130140150 * Australian thermal coal,
(12,000btu/lb, under 1% sulphur, 14% ash, FOB Newcastle/Port Kembla)
* 62% Fe CIF China
Jan 2011 Dec 20121,2001,3001,4001,5001,6001,7001,8001,900
Jan 2011 Dec 20126,8007,3007,8008,3008,8009,3009,800
10,300
Jan 2011 Dec 2012100110120130140150160170180

State of the Market Reports
Each quarterly issue includes:
www.intierraRMG.com
► Market for Mining ► Exploration Hot Spots► Mergers and Acquisitions ► Exploration Results► Mining Finance ► Assay Highlights► Product Updates ► Special Features
The State of the Market Reports detail the state and outlook of the mining industry focusing on data-driven trends in exploration, metals production, mining and finance. The report series provides data and opinion on the closed quarter, plus forward views on the upcoming period. Contributors include Professor Magnus Ericsson and Dr. Chris Hinde.
Upcoming Special Features
• Overview of the mining industry in 2012• Mining royalties and taxation • Special Coverage: Cash cost data• Mid-year examination of the world’s metals stockpiles• Mining methods, and technology developments and trends• Metal prices, grade and tonnage predictions for 2014
State of the Market: Mining and Finance Report
State of the Market: Exploration Report
This quarterly report focuses specifically on exploration activities and trends for the previous and upcoming quarters. It includes data and opinion on exploration hot spots, drilling activity trends and exploration financing.
Each quarterly issue includes:
► Driller’s Log► Feasibility Studies► Capital Raising for Exploration► Exploration Hot Spots and Results► Assay Share Price Alert
Subscription promo price: USD3,060 + Tax
Subscription promo price: USD1,360 +Tax
For limited time only!
For limited time only.
Usual price: USD3,600 + local tax
Usual price: USD1,600 + local taxTo download a free report sample, visit: www.intierraRMG.com
To subscribe, e: [email protected]
For limitedtime only.
15% offAnnual Subscription
(4 editions)
Finance MiningExploration

04State of the Market: Mining and Finance ReportEdition 1, 2013
Market for MiningThe world’s economies have continued to drift but we expect
the mining sector to start its recovery this year
The world economy continued to drift last year, with global growth falling to 2.3% from 3.8% in 2011 (and 5.1% in 2010). The malaise was worst in the ‘advanced’ economies, which grew by only 1.3% last year, from 1.6% in 2011. Unfortunately, the emerging, developing, countries also recorded one of their weakest economic growth rates in ten years, with an overall increase of only 5.1% in 2012.
The lacklustre economic performance was attributed to uncertainty in Europe and the economic slowdown in China, where the growth rate dropped from 9.3% in 2011 to 7.9% in 2012. This decline in GDP growth is attributed to a shift away from intensive manufacturing and capital investments, toward expenditure in the service sector (and intangible assets such as human capital).
In spite of these disappointments, a better overall outcome is projected for 2013. We anticipate an improvement in China’s economic growth, the restoration of fiscal authority in the US, and a stronger euro zone.
FISCaL CLIFF avOIdEdIn the quarter to end-December, the US continued to suffer weak economic and employment growth, declining labour-force participation and shrinking real incomes. Moreover, the US trade deficit unexpectedly grew in November, driven by an increase in imports of consumer goods.
There was some good news from the US, of course, with the White House and Congress finally reaching an agreement on the Federal Budget. This avoided triggering the so-called ‘fiscal cliff’, which would have been the culmination of a series of increasingly contentious fiscal showdowns between the country’s Democratic and Republican parties over the past few years.
Despite the deal, there is still no sign of a comprehensive, long-term, deal on deficit reduction, and the US debt remains unsustainable. The Obama Administration has simply delayed the tough decisions
until March, and the country could still suffer a series of mini crises this year. The growth rate for the US is predicted to fall to 1.9% in 2013 from 2.2% in 2012.
EUROPEaN HOPEEven though unemployment in the euro area rose to a new high in November 2012, the December quarter was generally positive. The European Central Bank (ECB) renewed its bond-purchase programme, which restored confidence in the financial markets and bought time for political leaders. Also, the decision of the German Constitutional Court that the government’s ‘euro-rescue’ strategy was within the German constitution (given certain restrictions), removed uncertainty about the future of the rescue mechanism.
ECB’s chief, Mario Draghi recently gave positive views on the state of the European economy, and believes that the euro area is showing “early signs of improvement”, and should grow modestly by the end of 2013. Elsewhere, the Dutch elections resulted in a stable pro-euro coalition.
The likelihood of a serious crisis of confidence in the euro zone has fallen considerably in the past quarter. However, country-level finances are still vulnerable, with some countries facing being frozen out of the capital markets.
The euro zone is expected to grow by only 0.3% in 2013, and just 1.4% in 2014.
EMERGING COUNTRIESIn the quarter to end-December, leadership issues were settled in China but very little is known about the new leaders’ attitudes. Which form of economic growth the new leadership chooses will be seen from their GDP targets (to be announced in February). If the growth target remains at 7.5%, or above, then more pro-growth policies can be expected. If the growth target is lowered to 7%, say, then the Chinese government may initiate a more gradual transition of the economy.
World
2010 2011 2012 2013f
8
7
6
54
3
2
10
Advanced economies
Emerging anddeveloping countries
GDP Growth (%) Five-year metals prices (US$/t)
2008 2009 2010 2011 20120
1,500
3,000
4,500
6,000
7,500
9,000
10,500
0
5,000
10,000
15,000
20,000
25,000
30,000
35,000 Ni Cu (right scale)Aluminium (right scale)

05State of the Market: Mining and Finance ReportEdition 1, 2013
METAlS PRICE FORECAST
Raw Materials Group (RMG) expects expansionary measures by the European Union and the US in 2013. The world’s Central Banks are also likely to stimulate growth, and will seek to avoid deflation. Moreover, the new political leaders in China are likely to announce new measures to stimulate their economy.
With a growing risk of inflation, and a debasement of currencies, RMG expects a modest increase in the gold price this year to an average of US$1,850/oz, before slipping to US$1,800/oz in 2014.
RMG expects the price of iron ore (62% Fe CIF China) to average US$125/t this year and US$120/t in 2014.
For the other major metals, RMG expects higher average prices this year (compared with last year’s averages) for aluminium, nickel and zinc, but a lower year-on-year average for copper (see table).
The prices of nickel and zinc are expected to continue rising in 2014, while copper will continue its downward trend. Aluminium’s performance is likely to be lacklustre.
RMG tracks a weighted-average price of a basket of nine metals (iron ore, copper, zinc, nickel, lead, gold, silver, platinum and palladium), and this is shown in the chart below (with the average price in 2000 recalibrated to 100).
0
150
300
450
2003 2004 2005 2006 2007 2008 2009 2010 2011 2012 2013f 2014f
Meanwhile, the December quarter saw China’s GDP rise 7.8% (on an annualised basis), compared with 9.3% in the final quarter of 2011.The value of China’s exports grew 14.1%, compared with a year earlier (nearly three times as fast as expected), and were led by shipments to the US.
Chinese imports rose to 6% in the December quarter, partly because of an 11% jump in iron-ore imports as steel production rebounded. However, with China’s imports having grown at a rate less than half as fast as its exports, China did not quite serve as the ‘locomotive’ to pull the rest of the world out of recession.
The main driver of global growth recently has been the world’s developing countries but their growth has also slowed down considerably. Economic growth in both the emerging and developing countries seems likely to be anaemic this year.
Nevertheless, generally improving financial conditions, as well as a loosening of monetary policy, should generate a slow improvement over the course of 2013. Emerging and developing countries are expected to grow by 5.5% in 2013.
METaL PRICE IMPLICaTIONSMost base metals started 2012 on a positive note but this optimism proved to be short lived as prices fell progressively through the year. This was due to the slow growth rate in the global economy, sluggish demand from China, high stocks for most metals and an increase in the supply of some commodities.
Nickel prices rose modestly in early 2012 but subsequently fell back because of a weak market for stainless steel (the end use of more than two-thirds of nickel production), while copper prices fell initially on declining imports from China. The hitherto relatively high copper prices have also led to the substitution of copper in a variety of uses, and to increased rates of recycling and scrap recovery.
Copper demand is expected to pick up this year, with an economic recovery in the euro zone supporting demand driven by China and other emerging Asian markets. The early signs are encouraging, and copper prices hit their highest level in more than two months in January after the US lawmakers avoided the ‘fiscal cliff’.
Aluminium prices dropped below US$2,000/t in the second quarter of 2012, and touched US$1,918/t in the third quarter (near to the pre-2005 levels) due to the global metal-supply surplus and high stocks, but prices picked up again in the December quarter. We believe that the metal will continue to make ground in 2013 following a rebound of the Chinese economy (the country accounts for almost half of global metal consumption).
Major Metals Market2012 2013f 2014f
AluminiumOutput (Mt) 46.86 50.79 54.49Use (Mt) 46.69 50.08 53.48Balance (kt) 190 746 1,121Price (US$/t) 2,018 2,205 2,150CopperOutput (Mt) 20.11 20.91 21.75Use (Mt) 20.06 20.74 21.40Balance (kt) 49 166 338Price (US$/t) 7,950 7,874 6,539NickelOutput (Mt) 1.72 1.81 1.94Use (Mt) 1.67 1.76 1.88Balance (kt) 43 48 56Price (US$/t) 17,527 17,670 18,385ZincOutput (Mt) 13.16 13.71 14.22Use (Mt) 12.86 13.48 13.92Balance (kt) 291 233 298Price (US$/t) 1,946 2,020 2,265
Metals price index

06State of the Market: Mining and Finance ReportEdition 1, 2013
Exploration Hot SpotsThere is hope, at last, for the mining sector despite a new low in exploration activity
Last month’s exploration activity represented the lowest monthly total since February 2010, and meant that the number of drilling reports has fallen for three consecutive months.
According to IntierraRMG’s on-line database, IntierraLive, there was drilling reports from a total of 356 prospects in December 2012 (this total includes reports from more than one drilling prospect per project), compared with 675 in December 2011.
There has been a particular slump in drilling at gold prospects, with only 155 being reported in December, compared with the recent peak of 493 in November 2011; see chart on p7. (Note that the sum of the three one-month amounts in any quarter will be considerably greater than the consolidated three-monthly project total shown in the drilling activity chart on p7, because of multiple reports of drilling from the same prospect, during the period.)
The slump in drilling reports over the past few months left the total for calendar 2012 well behind the number recorded in 2011, but still well ahead of the industry’s nadir in 2010.
GOLd dOMINaTESAs normal, the search for gold dominated the reports of drilling activity during the quarter to end-December, with a total of 702 prospects (1,111 in the final quarter of 2011). The next most significant exploration targets (in terms of individual drilling prospects) were copper (238), silver (174) and zinc (72); see tables opposite.
Canada led the way in the gold sector, with 192 prospects reporting drilling activity, followed by 114 in Australia and 52 in the US. However, these numbers are dramatically lower than the year-ago period, when the figures were 279, 218 and 88, respectively, for the three countries. Indeed, drilling activity for gold in the whole of North and Central America has fallen from 443 in the final three months of 2011 to just 299 in the quarter just ended.
The next most important region for gold-drilling activity in the December quarter was Australasia (with reports from 116 projects), followed by Africa (108) and South America (88). Nevertheless, Australasia has seen a particularly sharp decline in gold exploration, with drilling reports falling 47% since the year-ago quarter.
Australia remains the leading exploration destination for copper, with 64 prospects reporting drilling activity during the quarter just ended. This total is sharply lower, however, than the year ago figure (94), and leaves the country only just ahead of Canada (60 in the December quarter, and 66 a year ago).
Copper exploration has also fallen sharply in the US, with just 18 prospects reporting drilling during the final quarter of 2012, compared with 29 reports in the year-ago period.
Nevertheless, North and Central America again led the way in the search for the metal, with a total of 90 reports during the quarter (113 a year ago), compared
with 64 (94) in Australasia, 33 (23) in Africa and 28 (36) in South America.
These targets are illustrated geographically in the ‘Activity Map’ opposite.
Measuring the drilling reports in terms of the primary-listing location of the company making the announcement, it is clear that Canadian companies are in the ascendancy.
Companies listed on the Toronto Stock Exchange (TSX) and TSX-Venture Exchange (together the TMX) accounted for 53% of the 238 copper reports in the quarter just ended, and 60% of the 702 gold-drilling reports. Companies listed on the Australian Stock Exchange (ASX) accounted for 43% of the copper, and 29% of the gold, reports. Companies listed on the London Stock Exchange and AIM (together abbreviated here as LSE) hardly featured for either metal.
For copper, the year-ago proportions were 48% and 47% for TMX and ASX, respectively, and 55% and 31% for gold drilling.
TMX-listed companies also dominated the drilling reports for lead, silver and zinc; see tables opposite.
SLUMP IN REPORTEd RESOURCESNot surprisingly, the decline in drilling announcements during the past three months had a knock-on effect on the announcement of mineral resources and ore reserves (see tables on p9).
Contained gold in mineral resources announced during the December quarter were little changed from the September quarter at 79.4Moz. This represents a slump, however, compared with the year-ago period, when announced resources contained 232.4Moz.
The shortfall in gold resources came mainly in the US (down from 35.0Moz to 6.9Moz) and in Canada (42.5Moz to 20.8Moz). Together with a shortfall in Mexico, this meant announced gold resources in North and Central America had fallen two-thirds between the December quarters of 2011 and 2012.
There was a similar slump in announced gold reserves, which fell to 15.7Moz (contained metal) in the quarter just ended, compared with 78.2Moz a year ago. The damage was caused by massive reductions in the Americas and Africa.
The picture was scarcely any better for copper. Resources reported in the December quarter contained just 22.3Mt, comparing favourably with 16.7Mt in the September quarter but well down on the 107.4Mt reported a year ago.
The reporting of new copper resources collapsed across the globe, with the contained metal in South American falling from 63.1Mt a year ago to 12.5Mt in the period just ended.
Copper reserves were little changed from the previous quarter (5.2Mt, compared with 6.2Mt in the September quarter) but were dramatically lower than a year ago (35.2Mt). Most of the damage was from exploration projects in South America.
There was a similar story for other metals.

07State of the Market: Mining and Finance ReportEdition 1, 2013
SilverDec Q
2012Sep Q
2012Dec Q
2011Canada 39 31 56Australia 18 23 22USA 21 25 26Mexico 47 48 67Brazil
N&C America 112 110 151S. America 24 56 55Europe 2 10 8Africa 5 14 9Asia 13 15 16Australasia 18 23 22
TSX/TSX-V* 115 151 172ASX* 28 40 49London* 15 15 15
TOTAL 174 228 261* Primary listing of issuing company
ZincDec Q
2012Sep Q
2012Dec Q
2011Canada 23 14 24Australia 15 27 22USA 6 5 9Mexico 5 8 17Brazil
N&C America 37 29 50S. America 6 15 9Europe 4 7 7Africa 5 2 3Asia 5 9 7Australasia 15 27 22
TSX/TSX-V* 44 39 52ASX* 21 35 37London* 2 4 3
TOTAL 72 89 98* Primary listing of issuing company
CopperDec Q
2012Sep Q
2012Dec Q
2011Canada 60 50 66Australia 64 83 94USA 18 17 29Mexico 7 8 16Brazil 2 4 7
N&C America 90 83 113S. America 28 31 36Europe 10 21 10Africa 33 31 23Asia 13 28 40Australasia 64 83 94
TSX/TSX-V* 127 140 151ASX* 103 128 147London* 4 2 4
TOTAL 238 277 316* Primary listing of issuing company
LeadDec Q
2012Sep Q
2012Dec Q
2011Canada 17 10 16Australia 11 17 14USA 4 3 6Mexico 5 7 19Brazil
N&C America 26 20 41S. America 1 9 9Europe 2 4 5Africa 3 2 1Asia 5 9 5Australasia 11 17 14
TSX/TSX-V* 27 31 44ASX* 17 23 24London* 3 3 3
TOTAL 48 61 75* Primary listing of issuing company
GoldDec Q
2012Sep Q
2012Dec Q
2011Canada 192 198 279Australia 114 209 218USA 52 72 88Mexico 42 44 60Brazil 23 21 32
N&C America 299 328 443S. America 88 109 129Europe 37 49 35Africa 108 158 178Asia 54 57 106Australasia 116 210 220
TSX/TSX-V* 422 511 615ASX* 203 313 346London* 47 43 57
TOTAL 702 911 1111* Primary listing of issuing company
GlObAl DRIllING ACTIVITY
QUARTERlY DRIllING REPORTS (Individual Prospects)
ACTIVITY MAP (December Quarter)
Operational Development Exploration

08State of the Market: Mining and Finance ReportEdition 1, 2013
TOP-RANKED ASSAYS (December quarter; grade x intersection)
COPPER Company Project HoleGrade
(%)Intersection
(m)Depth
(m) Project Location1 OZ Minerals Ltd Carrapateena DD12CAR090W1 0.90 1,492.0 609.0 65km E Woomera (Australia)2 Blackthorn Resources Ltd Kitumba KITDD_005 3.02 220.0 206.0 180km WNW Lusaka (Zambia)3 Atico Mining Corp El Roble ATDHR-17 5.41 88.7 71.8 75km SW Medellin (Colombia)4 Africo Resources Ltd Kalukundi BH ANTD006 5.29 80.7 25.8 30km ENE Kolwezi (Congo DR)5 Intrepid Mines Ltd Tumpangpitu Sulphide GTD-12-350 0.68 568.9 498.0 209km SE Surabaya (Indonesia)6 CuDeco Ltd Rocklands Group NVB018 7.45 47.0 165.0 17km WNW Cloncurry (Australia)7 Pilot Gold Inc TV Tower (Kucukdag) KCD056 6.96 46.7 102.7 20km SE Çanakkale (Turkey)8 Reservoir Minerals Inc Brestovac-Metovnica (Chukaru) FMTC 1217 3.17 100.0 584.0 5km S Bor (Serbia)9 NovaCopper Inc Bornite (South Reef Zone) DDH RC12-0216 4.45 55.7 671.0 65km ENE Ambler (US)
10 Peel Mining Ltd Mallee Bull MBDD009 3.48 69.0 533.0 105km SSE Cobar (Australia)
GOLD Company Project HoleGrade (g/t)
Intersection (m)
Depth (m) Project Location
1 Pilot Gold Inc TV Tower (Kucukdag target) KCD-50 193.0 12.0 117.5 20km SE Çanakkale (Turkey)2 ABM Resources NL Old Pirate (Golden Hind prospect) GHRC100014 44.0 42.0 0.0 625km NW Alice Springs (Australia)3 Golden Rim Resources Ltd Balogo (Netiana) BDH012 111.0 13.0 56.0 105km S Ouagadougou (Burkina Faso)4 Northquest Ltd Pistol Bay (Vickers) PB-12-22 8.2 156.5 87.0 60km SSW Rankin Inlet (Canada)5 Gran Colombia Gold Corp Marmato MT-1500 1.6 618.1 394.0 85km S Medellin (Colombia)6 Pretium Resources Inc Brucejack (Valley of the Kings) SU-584 187.0 4.7 135.8 240km N Prince Rupert (Canada)7 Atna Resources Ltd Pinson PRC-12-006 47.4 18.3 1.5 42km ENE Winnemucca (US)8 Unity Mining Ltd Henty (Read zone) Z18553 269.0 3.1 105.7 30km N Queenstown (Australia)9 Centerra Gold Inc Kumtor (SB zone) D1653 7.7 109.3 494.1 180km SSE Almaty (Kyrgyzstan)
10 Bralorne Gold Mines Ltd Bralorne-Pioneer UB12-015 386.0 2.1 163.7 74km N Whistler (Canada)
LEAD Company Project HoleGrade
(%)Intersection
(m)Depth
(m) Project Location1 Eurasian Minerals Inc Balya (Hastanetepe) DB-81 13.80 18.0 33.0 28km WNW Balikesir (Turkey)2 El Nino Ventures Inc Murray Brook MB-2012-138 4.58 45.4 179.6 56km WSW Bathurst (Canada)3 Buchans Minerals Corp Lundberg-Engine House H-12-3475 1.34 134.8 59.5 15k E Buchans (Canada)4 US Silver & Gold Inc Galena (Lead Zone) DH49-196 17.40 6.4 78.6 2km W Wallace (US)5 Rathdowney Resources Ltd Olza OLZ-147 3.88 27.3 134.4 Near Zawiercie (Poland)6 Balamara Resources Ltd Brskovo DH3-12 3.63 28.0 111.0 70km NNE Podgorica (Montenegro)7 Silvercorp Metals Inc Ying/SGX (S7-1) ZK07AS7-103 41.50 2.2 203.6 120km SW Luoyang (China)8 Golden Tag Resources Ltd San Diego SD-12-50W 0.55 152.7 818.8 50km SSW Torreon (Mexico)9 MacPhersons Resources Ltd Nimbus East NBRC216 4.70 17.0 205.0 20km ESE Kalgoorlie (Australia)
10 Red Metal Ltd Maronan MRN12003B 4.79 15.9 1,228.0 155km ESE Mt Isa (Australia)
SILVER Company Project HoleGrade (g/t)
Intersection (m)
Depth (m) Project Location
1 Sierra Metals Inc Promontorio (Cuerpo Oriente) B509 753.0 48.9 376.5 20km SSE Cuauhtemoc (Mexico)2 Tahoe Resources Inc Escobal (East) 375 490.0 70.5 699.0 44km ESE Guatemala City (Guatemala)3 Investigator Resources Ltd Peterlumbo PPDH023 2,591.0 10.0 165.0 165km W Port Augusta (Australia)4 MacPhersons Resources Ltd Nimbus East NBRC216 896.0 28.0 200.0 20km ESE Kalgoorlie (Australia)5 Brixton Metals Corp Thorn THN12-83 165.0 150.5 24.0 98km ENE Juneau (Canada)6 Silver Standard Resources Inc Pirquitas (Cortaderas Breccia) DDH-250 206.0 120.8 76.0 207km NW San Salvador de Jujuy (Argentina)7 GoGold Resources Inc San Diego (Chispa De Oro) GGS-056 87.0 194.3 31.2 110km SW Durango (Mexico)8 Hecla Mining Co Greens Creek (South West Bench) GC3364 603.0 22.3 0.0 28km SW Juneau (US)9 Focus Ventures Ltd El Reventon (Reventon Breccia) RC-08-8 71.3 155.4 13.7 55km NE Cosala (Mexico)
10 Hochschild Mining plc Arcata (Alexia) DDH400-S-12 984.0 9.3 0.0 75km NNW Cabanaconde (Peru)
ZINC Company Project HoleGrade
(%)Intersection
(m)Depth
(m) Project Location1 Silver Standard Resources Inc Pirquitas (Cortaderas Breccia) DDH-250 5.0 120.8 76.0 207km NW San Salvador de Jujuy (Argentina)2 Silver Bull Resources Inc Sierra Mojada (Shallow Silver Zone) T12116 13.9 40.4 0.0 190km N Gómez Palacio (Mexico)3 MacPhersons Resources Ltd Nimbus East NBRC216 26.3 17.0 205.0 20km ESE Kalgoorlie (Australia)4 Buchans Minerals Corp Lundberg-Engine House H-12-3475 3.1 134.8 59.5 15km E Buchans (Canada)5 El Nino Ventures Inc Murray Brook MB-2012-138 8.5 45.4 179.6 56km WSW Bathurst (Canada)6 Venturex Resources Ltd Sulphur Springs (copper/zinc mine) SSR002 19.4 11.0 174.0 112km SSE Port Hedland (Australia)7 Golden Tag Resources Ltd San Diego SD-12-50W 1.4 152.7 818.8 50km SSW Torreon (Mexico)8 Hecla Mining Co Greens Creek (South West Bench) GC3451 10.7 16.8 0.0 28km SW Juneau (US)9 Cazaly Resources Ltd Mt Angelo North HCRC0005 2.8 62.0 24.0 35km WSW Halls Creek (Australia)
10 Imperial Metals Corp Ruddock Creek (V zone) RD-12-V38 24.0 6.4 175.3 100km NNW Revelstoke (Canada)
Exploration ResultsSummary of the best assay results during the past quarter, and new resources/reserves

09State of the Market: Mining and Finance ReportEdition 1, 2013
So, does the level of exploration activity, shown on p7, signal continued doom and gloom? Well, yes, and no. Even allowing for the skewing effect of a few large exploration results, the numbers are clearly awful. But they do not tell the whole picture. There has been a significant increase recently in funds raised for exploration, which suggests that drilling
activity might start rising again in the months ahead.According to calculations by IntierraRMG, funds
raised for exploration rose sharply in the quarter to end-December, reaching over US$3.4 billion. This contrasts with the paltry US$1.8 billion raised in the September quarter and is 19% better than the final three months of 2011 (see p17).
QUARTERlY REVIEw OF RESERVES / RESOURCES ANNOUNCEMENTSGOLD RESOURCES (oz; contained metal) GOLD RESERVES (oz; contained metal)
Dec Q 2012 Sep Q 2012 Dec Q 2011 Dec Q 2012 Sep Q 2012 Dec Q 2011Canada 20,811,907 16,972,667 42,486,655 Canada 5,751,064 7,161,921 5,508,473Australia 9,040,018 3,549,161 10,850,697 Australia 2,451,408 225,951 1,812,461USA 6,918,025 3,463,209 34,990,622 USA 664,142 24,557,733Mexico 106,346 316,357 5,950,056 Mexico 4,142,319 478,032Brazil 8,080,381 4,732,025 8,036,141 Brazil 2,370,125 855,155 2,051,849N&C America 28,875,291 21,378,822 84,217,187 N&C America 7,882,047 12,075,160 33,241,378S. America 21,612,522 9,340,498 35,515,569 S. America 2,370,125 1,706,712 19,929,943Europe 9,619,509 9,148,874 16,790,636 Europe 2,288,185 3,193,644Africa 4,272,516 18,037,167 49,498,731 Africa 1,192,458 2,988,933 15,084,165Asia 5,994,715 16,574,851 33,784,548 Asia 1,769,402 14,566,693 4,952,385Australasia 9,040,018 3,549,161 12,552,027 Australasia 2,451,408 225,951 1,812,461TOTAL 79,414,571 78,029,373 232,358,698 TOTAL 15,665,440 33,851,634 78,213,976COPPER RESOURCES (t; contained metal) COPPER RESERVES (t; contained metal)
Dec Q 2012 Sep Q 2012 Dec Q 2011 Dec Q 2012 Sep Q 2012 Dec Q 2011Canada 344,842 358,759 5,633,152 Canada 2,541,972 943 1,548,578Australia 225,986 1,754,448 2,991,735 Australia 40,488 49,406 445,271USA 381,974 5,927,462 2,085,063 USA 109,864 698,208 358,809Mexico 1,090,298 4,832,905 Mexico 65,592Brazil 319,752 236,138 Brazil 444,449 75,787N&C America 726,816 7,510,007 12,694,538 N&C America 5,172,326 786,847 2,422,510S. America 12,545,239 1,263,608 63,097,753 S. America 670,049 23,168,430Europe 811,350 87,027 1,984,578 EuropeAfrica 4,933,456 737,029 14,210,886 Africa 26,000 83,200 1,631,417Asia 3,024,759 5,334,250 12,393,819 Asia 4,657,200 7,517,888Australasia 225,986 1,754,448 2,991,735 Australasia 40,488 49,406 445,271TOTAL 22,267,606 16,686,369 107,373,309 TOTAL 5,238,814 6,246,702 35,185,516SILVER RESOURCES (oz; contained metal) SILVER RESERVES (oz; contained metal)
Dec Q 2012 Sep Q 2012 Dec Q 2011 Dec Q 2012 Sep Q 2012 Dec Q 2011Canada 59,960,804 45,326,851 86,131,090 Canada 52,063,691 1,919,488Australia 37,421,986 9,672,896 148,594,985 Australia 1,077,214 1,907,375 2,263,412USA 41,424,856 82,496,983 456,390,869 USA 17,574,792 105,952,706Mexico 37,160,251 379,747,649 446,601,438 Mexico 387,150,783 45,002,369 44,776,110Brazil 263,293 BrazilN&C America 139,809,216 514,125,635 1,016,688,374 N&C America 465,968,234 62,577,161 179,565,248S. America 113,629,100 62,203,594 525,615,929 S. America 8,240,753 145,811,332Europe 32,965,357 17,327,272 274,108,874 Europe 9,976,485 4,794,340Africa 33,808,951 16,798,475 16,236,029 Africa 752,649 5,462,092Asia 12,120,759 86,132,977 189,699,267 Asia 1,458,459 52,534,110Australasia 37,421,986 9,672,896 148,594,985 Australasia 1,077,214 1,907,375 2,263,412TOTAL 369,755,369 706,260,849 2,170,943,458 TOTAL 469,256,556 88,163,866 384,968,442ZINC RESOURCES (t; contained metal) ZINC RESERVES (t; contained metal)
Dec Q 2012 Sep Q 2012 Dec Q 2011 Dec Q 2012 Sep Q 2012 Dec Q 2011Canada 336,111 969,705 7,543,713 CanadaAustralia 108,800 3,451 2,591,072 Australia 66,091 77,600USA 20,059 668,954 817,240 USA 60,735Mexico 76,360 2,121,228 1,203,944 Mexico 806,254 30,460Brazil BrazilN&C America 432,530 3,759,887 9,564,897 N&C America 806,254 107,703S. America 27,942 445,421 2,106,765 S. AmericaEurope 1,978,940 214,246 898,035 Europe 32,420Africa 2,106,290 591,939 316,124 Africa 579,600Asia 335,003 25,203 779,889 Asia 35,649Australasia 108,800 3,451 2,591,072 Australasia 66,091 77,600TOTAL 4,989,505 5,040,147 16,256,782 TOTAL 872,345 579,600 253,372

10State of the Market: Mining and Finance ReportEdition 1, 2013
Despite the sharp reduction in drilling activity (as reported) during the quarter just ended, there have been remarkable intersections during the past few months; and some have had an astonishing impact on share prices.
The ten top-ranked assays are shown in the tables on p8 for each of five metals (simply measured by taking the average grade multiplied by the intersection length, and taking no account of depth).
Top of the ranking for the copper assays during the December quarter was a drill hole on OZ Minerals' Carrapateena project in Australia, which returned 0.90% Cu over 1,492m (at a depth of 609m). In second place was an assay at Blackthorn Resources' Kitumba project in Zambia which yielded 3.02% Cu over 220m (at 206m). Ranked third was an 89m intersection grading 5.41% Cu at Atico Mining’s El Roble project in Colombia.
The top gold intersection during the December quarter was Pilot Gold’s 193g/t, over 12m (at a depth of almost 118m) on its TV Tower project in Turkey (for a grade-intersection value of 2,316m.g/t). In second place during the quarter (but noteworthy because the
intersection was from surface) was 44g/t over 42m at ABM Resources’ Old Pirate project in Australia.
Some of the intersections announced during the past quarter had a significant effect on the share price of the owners (see list below). Ten-day share-price gains of over 60% were recorded by Newera Resources and Greenpower Energy for their projects at Shanagan Uul and Mirboo, respectively. A further eight companies saw their share prices appreciate by more than 25% in the ten days following a drilling announcement.
Indicative of the lacklustre exploration activity (and markets) in the final weeks of the year, only one of the 28 instances of share prices rising over 12% (measured ten days after an exploration announcement) was in December. There were 17 such share-price rises in October and 10 in November. Indeed, even this one exploration share-price spike in December was by Newera, which had set the quarter’s record price gain during the previous month. Despite a share-price retreat between the two drilling reports, Newera’s share price doubled; demonstrating the abiding appeal of junior stocks.
IMPACT OF DRIllING RESUlTS ON SHARE PRICES (December Quarter)SHARE PRICE (US$)
COMPANY NAME PROPERTY PRESS RELEASE FROM TO* GAIN (%)Newera Resources Ltd Shanagan Uul East November 0.021 0.035 66.7Greenpower Energy Ltd Mirboo October 0.040 0.064 60.0Aguia Resources Ltd Tres Estradas November 0.130 0.180 38.5Indico Resources Ltd Maria Reyna October 0.180 0.240 33.3Newera Resources Ltd Shanagan Uul East December 0.030 0.039 30.0Cockatoo Coal Ltd Baralaba October 0.140 0.180 28.6Marmota Energy Ltd Angel Wing October 0.072 0.090 25.0Stellar Resources Ltd Heemskirk October 0.080 0.100 25.0Foyson Resources Ltd New Britain November 0.008 0.010 25.0Merah Resources Ltd Lawlers October 0.200 0.250 25.0St George Mining Ltd East Laverton October 0.250 0.310 24.0Navarre Minerals Ltd Bendigo North October 0.130 0.160 23.1Atrum Coal NL Groundhog October 0.180 0.220 22.2Hannans Reward Ltd Pahtohavare November 0.015 0.018 20.0International Goldfields Ltd Latin October 0.027 0.032 18.5Talga Resources Ltd Nunasvaara October 0.300 0.355 18.3Blackthorn Resources Ltd Kitumba October 1.100 1.285 16.8Kalgoorlie Mining Co Bullant October 0.006 0.007 16.7Haranga Resources Ltd Bayantsogt November 0.155 0.180 16.1Eagle Hill Exploration Corp Windfall Lake November 0.125 0.145 16.0Monax Mining Ltd Punt Hill October 0.048 0.055 14.6Northern Minerals Ltd Browns Range October 0.210 0.240 14.3Shaw River Manganese Ltd Otjozondu November 0.014 0.016 14.3Sirius Resources NL Nova October 2.180 2.480 13.8Emmerson Resources Ltd Orlando November 0.120 0.135 12.5International Goldfields Ltd Latin November 0.024 0.027 12.5Latin Resources Ltd Mariela October 0.160 0.180 12.5Eagle Hill Exploration Corp Windfall Lake November 0.125 0.140 12.0Sirius Resources NL Nova October 2.180 2.430 11.5* Share price ten days following assay announcement
assay Share-Price alertMany of the drill intersections announced during the past quarter
had significant share-price impact

11State of the Market: Mining and Finance ReportEdition 1, 2013
Emerging data indicates positive growth in global metals production
Metals Production Outlook
Early production announcements for the three months to end-December (Q4) demonstrate positive growth in metals production, compared with results published for the September Quarter (Q3).
The weighted average of all announced Q4 production showed an 18% increase in gold output, a 6% improvement in copper and 3% rise in iron-ore, compared with production in the prior three-month period. As indicated in the Region chart below, the strongest rises came in Africa and in Asia. The size of the spike in Asian gold being partially due to Centerra Gold’s announcements that they had overcome production delays at Kumtor.
Details of global production can only be confirmed many months after the end of the relevant reporting period as production statistics are slow to be released by producers. Global mine production analysis is therefore best done on an annualised basis. However, viewing consolidated global tables of early production announcements each quarter does provide a more immediate barometer of production results.
The tables below list those mines that have already announced their production for the December quarter, and where this amount is more than 10% different from the production in the September quarter. (Our net figures above include all early-reporting operations, not just those that have signalled the greatest changes.)
Notable changes include operations in the copper sector, where the biggest actual increase in production
(quarter-over-quarter) came at the massive Escondida mine. Production there has benefited from the transition to higher-grade ore feed, and the successful completion of large-scale maintenance programmes to increase concentrator throughput.
In the gold sector, a number of North American and African mines showed strong Q4 production increases. For example, Goldcorp's cornerstone mine, Red Lake, ended the year with operational stability, a strong production result and newly-discovered mineralised zones. The latter hold the potential to contribute to the production profile over the longer term.
Most of last year was a challenge for Centerra Gold’s Kumtor operation in Kyrgyzstan, with extreme weather, and low grades in the Central Pit, impacting on production. However the year ended strongly, and their forecast is positive for 2013.
Two of the most significant Australian iron-ore mines announced sharply higher production for the December quarter, with strong results from Chichester Range and Yandi.
The result from Chichester Range contributed to Fortescue’s announcement that in December 2012 the company's operations had achieved an annualised shipping rate of more than 100Mt/y. The result from Yandi helped BHP Billiton to announce that its Western Australia Iron Ore (WAIO) division had delivered a 12th consecutive December half year production and sales record.
COMMODITY REGIONAl CHANGE QUARTER ON QUARTER
AFRICA ASIA AUSTRALIA EUROPE NORTH AMERICA(inc MEXICO)
SOUTH AMERICA
100%
80%
60%
40%
20%
0%
-20%
-40%
Copper Iron Ore Gold

12State of the Market: Mining and Finance ReportEdition 1, 2013
EARlY PRODUCTION ANNOUNCEMENTS: GOlD (oz)Company Q3,2012 Q4,2012 Rise / Fall Change (%)
AFRICABuzwagi African Barrick Gold plc 30,211 64,828 34,617 115Sukari Centamin plc 60,922 85,543 24,621 40Bogoso-Prestea Golden Star Resources Ltd 39,844 50,230 10,386 26Kansanshi First Quantum Minerals Ltd 35,245 45,410 10,165 29North Mara African Barrick Gold plc 53,120 63,235 10,115 19Kalsaka Amara Mining plc 14,369 11,480 -2,889 20ASIAKumtor Centerra Gold Inc 23,786 189,438 165,652 696Grasberg Freeport-McMoRan C&G 227,000 249,000 22,000 10Lihir Newcrest Mining Ltd 129,311 147,126 17,815 14Boroo Centerra Gold Inc 18,938 29,878 10,940 58AUSTRALIABoddington Newmont Mining Corp 167,000 216,000 49,000 29Macraes OceanaGold Corp 36,874 58,872 21,998 60Telfer Newcrest Mining Ltd 110,372 128,995 18,623 17Pajingo Evolution Mining Ltd 15,651 24,340 8,689 56Bronzewing Navigator Resources Ltd 20,368 17,431 -2,937 14Edna May Evolution Mining Ltd 25,925 22,763 -3,162 12EUROPEBerezitovy High River Gold Mines Ltd 33,241 37,100 3,859 12NORTH AMERICARed Lake Goldcorp Inc 121,200 168,100 46,900 39Mulatos Alamos Gold Inc 43,500 67,800 24,300 56Hycroft Allied Nevada Gold Corp 25,482 46,900 21,418 84Porcupine Goldcorp Inc 53,100 74,100 21,000 40Seabee Claude Resources Inc 15,073 12,760 -2,313 15SOUTH AMERICASao Francisco Aura Minerals Inc 19,814 28,584 8,770 44Andorinhas Troy Resources Ltd 9,975 8,056 -1,919 19
* announcements with change >10%
EaRLy waRNINGA prompt opinion of supply trends can also be gained by assessing new mine openings during each quarter.
The methodology used in this section of the report analyses data from those mines that have formally announced initial metals production during the preceding quarter. The actual metals output will naturally vary as the mines are in various stages of a ramp-up, so we monitor the ore reserves at these new mines. This provides a snapshot of the emerging production potential.
One such mine is Barrick Gold’s 60%-owned Pueblo Viejo gold mine in the Dominican Republic. Initial production was announced during the December quarter from an operation that is exploiting a deposit containing 25.3Moz of gold. Subsequent announcements indicate that ramp-up to full capacity is expected to occur in the second half of
this year, and production for calendar 2013 is anticipated to be 500,000-650,000oz.
Production at Rio Tinto’s Benga coal mine in Mozambique’s Moatize Basin continues to ramp up. The company notes that work has been undertaken to expand capacity on the Sena railway line to eliminate a bottleneck in the system.
With no new iron-ore mines coming on stream during the quarter to end-September, the recent start of production at Karara had a significant impact on the Q3-Q4 comparison table for newly ‘introduced’ ore reserves. Similarly, there was a large jump in gold and silver deposits that have now reached development.
The December quarter was also significant for magnetite, with the mid-November announcement by Gindalbie Metals Ltd that it had produced the first magnetite concentrate from its Karara project.
continued
Metals Production Outlook

13State of the Market: Mining and Finance ReportEdition 1, 2013
EARlY PRODUCTION ANNOUNCEMENTS: IRON ORE (t)Company Q3,2012 Q4,2012 Rise / Fall Change (%)
AFRICAKolomela Kumba Iron Ore Ltd 2,500,000 2,793,000 293,000 12Marampa London Mining plc 373,000 546,000 173,000 46Thabazimbi Kumba Iron Ore Ltd 241,000 182,000 -59,000 24Sishen Kumba Iron Ore Ltd 9,756,000 6,038,000 -3,718,000 38AUSTRALIAChichester Range Fortescue Metals Group 15,400,000 19,100,000 3,700,000 24Yandi BHP Billiton Ltd 16,201,000 18,769,000 2,568,000 16Tallering Peak Mount Gibson Iron Ltd 504,000 672,000 168,000 33Koolan Island Mount Gibson Iron Ltd 793,000 913,000 120,000 15Karara (DSO) Gindalbie Metals Ltd 350,000 406,000 56,000 16Goldsworthy JV BHP Billiton Ltd 508,000 445,000 -63,000 12West Angelas Rio Tinto Ltd 8,037,000 7,183,000 -854,000 11
James Labrador Iron Mines Holdings 1,141,000 327,000 -814,000 71 * announcements with change >10%
EARlY PRODUCTION ANNOUNCEMENTS: COPPER (t)Company Q3, 2012 Q4, 2012 Rise / Fall Change (%)
AFRICAPalabora Palabora Mining Co 5,600 12,100 6,500 116Guelb Moghrein First Quantum Minerals 8,656 11,038 2,382 28Mowana African Copper plc 2,882 2,577 -305 11ASIAGedabek Anglo Asian Mining plc 132 116 -16 12Cayeli Inmet Mining Corp 7,800 7,000 -800 10AUSTRALIANifty Aditya Birla Minerals Ltd 11,075 13,800 2,725 25Boddington Newmont Mining Corp 6,800 8,600 1,800 26Cadia Valley Newcrest Mining Ltd 11,682 13,264 1,582 14DeGrussa Sandfire Resources NL 21,181 16,392 -4,789 23EUROPEKevitsa First Quantum Minerals Ltd. 4,004 6,896 2,892 72Aguablanca Lundin Mining Corp 697 1,563 866 124Neves-Corvo Lundin Mining Corp 14,012 11,988 -2,024 14NORTH AMERICA Bingham Canyon Rio Tinto Ltd 42,900 59,300 16,400 38Safford Freeport-McMoRan C&G 17,000 21,000 4,000 24Chino Freeport-McMoRan C&G 17,500 20,500 3,000 17Pinto Valley BHP Billiton Ltd 1,200 1,700 500 42Bolivar Sierra Metals Inc etc 668 981 313 47Aranzazu Aura Minerals Inc 1,114 927 -187 17Lockerby First Nickel Inc 650 450 -200 31Troy Revett Minerals Inc 1,071 457 -614 57Minto Capstone Mining Corp 5,241 4,069 -1,172 22SOUTH AMERICAEscondida BHP Billiton Ltd 248,000 280,900 32,900 13Spence BHP Billiton Ltd 34,900 40,900 6,000 17Santa Rita Mirabela Nickel Ltd 1,704 1,507 -197 12
* announcements with change >10%

14State of the Market: Mining and Finance ReportEdition 1, 2013
Global Cash Cost Data
www.intierraRMG.com
Assess, benchmark and budget by individual mine or company.
Voisey Bay
For enquiries: [email protected]
• ANALYSE, EVALUATE & BENCHMARK
• FORECAST & MODEL
• COST MODELS & COST CURVES
Identify Trends and OpportunitiesDevelop your strategic business options with IntierraRMG
IntierraRMG databases are the world’s premier tools for evaluating trends and opportunities in the mining sector.
Covers global leases, 90,000 companies, 4,100 listed companies, 50,000 global projects and 190 commodities.
Benchmark projects by searching, filtering, exporting and ranking across key classes of data.
► Equity Interests ► Resource and Reserves Data ► Production Data ► Financial Ratios ► Capital Raisings ► Property Transactions ► Feasibility Reports ► Mergers & Acquisitions ► Financial Reports ► Drill Holes Results ► Mine Cash Costs ► Refineries, Smelters and Plants
Advanced online mapping enables in-depth investigation of projects and properties; displaying data on ownership, infrastructure and geology.
Contact:[email protected]
www.intierraRMG.com
AngloGold Ashanti Limited
“We value the depth and breadth of IntierraRMG’s global data coverage. The integrity of information is highly regarded. The source documentation links are extremely useful.”
Greg FoulisSenior VP Business DevelopmentAngloGold Ashanti Limited

15State of the Market: Mining and Finance ReportEdition 1, 2013
Deals in the mining industry during the December quarter were valued at just US$13.9 billion. Of the 71 deals announced during the three-month period, 33 were for gold assets (worth US$2.7 billion) and 14 were for copper assets (worth US$7.1 billion). This brought deals announced during 2012 to US$80.0 billion, which includes the huge Glencore-Xstrata amalgamation, worth US$34.0 billion.
The 25% quarter-on-quarter increase in mergers and acquisitions (in value terms) during the three months to end-December was buoyed by First Quantum’s hostile offer for Inmet Mining in December. However the number of deals announced fell slightly (see chart on right).
Copper and gold deals topped the list (in terms of value), with nickel in third place (ahead of iron ore).
Canadian companies led the way in the quarter just ended, in terms of both value and the number of deals. Chinese overseas acquisitions (up a remarkable 60% quarter-on-quarter), primarily in lithium and copper, earned them second place, ahead of the UK, the US and Australia.
Mergers and acquisitionsThe december quarter saw a decline in the number of mining deals
but the overall value increased
0
10
20
30
40
50
60
70
80
90
05,000
10,00015,00020,00025,00030,00035,00040,00045,00050,000
March Q June Q September Q December QVa
lue o
f dea
ls (U
S$ m
illion
)
Number of deals announced
Glencore/Xstrata
AA SurFirst
Quantum/Inmet
METAlS M&A (2012)
lARGEST MINING DEAlS (DECEMbER QUARTER 2012)
Announced Status ObjectMain metal
Share (%)
Value (US$m)
Object country Buyer
Buyer’s country Seller
Seller’s country
Dec Pending Inmet Mining Corp Copper 100.0 4,999.5 Canada First Quantum Minerals Canada n/a Dec Pending Norilsk Nickel Nickel 5.9 1,487.0 Russia Millhouse LLC Russia UC Rusal RussiaOct Pending Discovery Metals Ltd Copper 88.3 844.5 Australia Cathay Fortune Corp China n/a Dec Pending Talison Lithium Ltd Lithium 100.0 831.3 Australia Chengdu Tianqi Industry China n/a Oct Closed Ocampo OP gold/silver mine Gold 100.0 735.2 Mexico Minera Frisco SAB de CV Mexico AuRico Gold CanadaDec Closed Camrose Resources Copper 49.5 550.0 UK ENRC UK n/a Dec Pending Mimosa Holdings PGM 51.0 550.0 Zimbabwe Local investors Aquarius Plat AustraliaNov Closed Queenston Mining Inc Gold 100.0 539.2 Canada Osisko Mining Corp Canada n/a Nov Pending Kalagadi manganese deposit Manganese 50.0 447.0 South Africa n/a ArcelorMittal UK
51%
19%
11%1%
18%
Copper
Gold
Nickel
Iron Ore
Other
0
1,000
2,000
3,000
4,000
5,000
6,000
7,000
8,000
March Q June Q September Q December Q
Copper
Gold
Iron Ore
Copper, Gold and Iron Ore (US$ million)
Metals: Deal Value (Dec Q 2012)
MINING DEAlS (December Quarter 2012)
Value(US$ million)
Deals(Number)
Copper 7,076.1 14Gold 2,653.7 33Nickel 1,487.0 1Lithium 831.3 1PGMs 550.0 3Silver 532.9 4Manganese 447.0 1Iron Ore 226.8 8Other 106.0 6TOTAL 13,910.8 71

16State of the Market: Mining and Finance ReportEdition 1, 2013
There are almost 3,500 companies in the international mining industry (see table below), and the sector had a combined market capitalisation of US$2,543 billion at the end of the December quarter.
The majority of these companies are small (1,756 companies had a market capitalisation of under US$10 million at the end of December; see later), and only 20% of the companies (681) had an end-year market capitalisation of over US$100 million.
These largest companies accounted for 98% of the industry’s overall market capitalisation, and 76% of the money raised during the December quarter. Despite taking the lion’s share, the financing by these largest companies represented just 0.2% of their collective market capitalisation.
In contrast, the smallest companies in the industry (50% of the total) raised less than 3% of the total financing in the last quarter, equivalent to just US$102,000 for each company. Nevertheless, this funding for the quarter was equivalent to 3% of the collective end-year market capitalisation of the smallest companies.
With funding scarce, many of these smaller (normally exploration) companies have entered a period of dormancy while they ride out the current weakness in debt and equity markets. The situation remains especially difficult for those with little prospect of early cash flow.
Even those companies with metals production have been battered by investors’ perceptions of disappointing revenue as metals prices fall, narrowing margins as costs continue to rise, and rising operating risk as social tension rise.
At least, and at last, there are indications of easier money for the industry, with funds raised by mining companies rising to US$6.8 billion in the quarter to end-December, compared with US$5.5 billion in the September quarter. This represented a welcome increase, albeit a small one, on the US$6.6 billion raised in the final quarter of 2011(see table opposite).
Moreover, there has been a sharp improvement in the funds raised for exploration. The search for minerals accounted for half of the total financing during the quarter just ended, compared with only 32% in the September quarter and a 44% share in the year-ago period.
Mining companies on the Australian Stock Exchange (ASX) raised US$2.2 billion during the December quarter, with those on the Toronto Stock Exchange (TSX) and TSX-Venture Exchange (abbreviated together as TMX)
raising US$2.7 billion, and those on the London Stock Exchange some US$1.0 billion; all measured in terms of the primary exchanges for each financing. The ASX’s performance was sharply lower than the year-ago period, when US$3.4 billion was raised.
The relatively modest fund-raising by the larger companies (in comparison with their size) reflects an ability to utilise cash flow from operating mines (a luxury not available to the junior companies). It is also indicative of the larger companies’ substantial cash holdings at the end of the September quarter (estimated at US$252 billion, equivalent to over 96% of the industry’s total cash holdings at that time) and also to a period of restrained takeover activity (see table opposite).
With the softer commodity prices, the valuation of smaller companies has weakened. This, in turn, has made it difficult to finance projects by raising equity through public offerings. The larger companies, meanwhile, have been quietly building up their cash holdings; we expect increased takeover interest in struggling juniors that have attractive projects.
PROPERTy PRICINGCost inflation, slowing economic growth, increased geopolitical risk and volatile prices have shifted companies’ focus from growth to cost reduction, and this has affected the number of mining-property transactions (see table opposite).
The total sales value for gold property transactions fell to US$248.1 million in the quarter to end-December, compared with US$349.1 million in the September quarter and US$361.2 million in the year-ago period.
There was a particularly sharp fall in Australia, where IntierraRMG registered an 80% slump in transactions for gold properties, from US$192 million in the September quarter to just US$39.2 million in the period just ended (although this is similar to the level of a year ago).
Gold-property transactions in North and Central America remained at the relatively high level of US$61.0 million, which was similar to the amount spent in the September quarter. This represents a sharp increase on the modest gold-deal value of US$10.4 million in the final quarter of 2011.
There was a significant quarter-on-quarter increase in gold-property transactions in Asia, which accounted for 60% (US$147.9 million) of all such transactions in the December quarter, compared with only 6% (US$19.6 million) in the September quarter. The latest level is similar to that achieved in the final quarter of 2011 (US$234.5 million, representing 65% of the total).
The total sales value for copper properties slumped in the December quarter to US$92.3 million, compared with US$378.1 million a year ago. This overall figure included an 85% drop in the sales value for South American copper properties (from US$351 million in the final quarter of 2011 to US$53.5 million in the quarter just ended).
Mining FinanceHope, at last, as mining-sector financing rose in the december quarter,
and there was an increased allocation for exploration
Company Size(US$ million)
NumberCompanies
End-QuarterMarket Cap
(US$ million)
AverageMarket Cap
(US$ million)<10 1,756 5,864 3.3
10-49 817 19,539 23.9 50-100 232 16,533 71.3 >100 681 2,500,929 3,672.4
TOTAL 3,486 2,542,865 729.5

17State of the Market: Mining and Finance ReportEdition 1, 2013
There has been a similar decline in the value of transactions for coal properties, which was just US$23.2 million in the December quarter, compared with US$390.7 million in the September quarter and US$412.3 million in the December quarter a year ago. Noteworthy was a fall in the quarterly sales value for coal properties in Australia from US$370 million a year ago to just US$18.2 million (although this still represents the bulk of global coal deals during the past quarter).
Australia also saw the value of iron-ore deals halve from the last quarter of 2011 to the last quarter of 2012 (US$382.5 million to US$190.0 million). However, the price paid for insitu resources in that country increased from less than USc1/dmtu (dry metric tonne unit; 1% Fe in a tonne of ore) to almost USc13/dmtu. Canada registered iron-ore purchases
valued at US$4.8 million in the quarter at extremely low prices for insitu metal.
However, summarising the price paid for metal in the ground is problematic, with huge variations from project to project depending upon the individual circumstances (deposit depth, geopolitical risk, availability of infrastructure, etc).
Although comparisons are invidious, the mining industry paid an average of US$36/oz for insitu gold resources during the December quarter, with the highest valuations being paid in Asia.
Making sense of copper valuations in the past quarter was especially problematic, with dramatically different prices being paid in North America – varying from an average of just US$12/t for insitu copper resources in Canada to an average of US$250/t in the US.
FUNDS RAISED CASH HOlDINGSFunds Raised (US$ million) Cash Holdings (US$ million)
Q4, 2012 Q3, 2012 Q4, 2011 Q4, 2012 Q3, 2012 Q4, 2011Company Size (US$ million):
<10 179 170 471 1,954 2,62910-49 955 649 1,013 4,288 5,06950-100 499 657 572 3,040 3,315>100 5,137 4,066 4,497 252,277 253,514
Primary Exchange:TSX/TSX-V 2,725 1,890 2,509 32,791 33,919ASX 2,193 1,456 3,418 31,762 32,934London 1,007 177 106 39,148 41,353Other 843 2,020 521 157,860 156,322
Company Type:Explorer 3,405 1,796 2,852 11,233 13,069Producer 3,364 3,747 3,702 250,326 251,458
TOTAL RAISED / CASH 6,768 5,542 6,553 261,559 264,527
PROPERTY PRICING (December Quarter)*GOlD COPPER IRON ORE COAl
Sales Price (US$/oz resources)
Total Sales Value (US$ million)
Sales Price (US$/t Cu resources)
Total Sales Value (US$ million)
Sales Price (USc/dmtu resources)
Total Sales Value (US$ million)
Total Sales Value (US$ million)
Q4, 2012
Q3, 2012
Q4, 2011
Q4, 2012
Q3, 2012
Q4, 2011
Q4, 2012
Q3, 2012
Q4, 2011
Q4, 2012
Q3, 2012
Q4, 2011
Q4, 2012
Q3, 2012
Q4, 2011
Q4, 2012
Q3, 2012
Q4, 2011
Q4, 2012
Q3, 2012
Q4, 2011
Canada 37.3 18.7 16.7 44.7 62.7 10.3 12.3 3.7 58.5 17.5 0.5 22.9 0.05 4.8 39.5Australia 40.2 39.4 38.5 39.2 192.0 37.5 12.90 0.51 190.0 382.5 18.2 181.9 370.0USA 11.5 7.0 17.0 16.3 4.1 0.1 250.1 1.6 29.1 21.2 1.0 1.9 201.4 2.8MexicoBrazil 14.5 9.7 0.10 30.2
N&C America 23.3 16.9 16.7 61.0 66.8 10.4 25.7 1.9 54.3 38.8 1.4 24.9 0.05 0.26 4.8 6.9 201.4 42.3S. America 11.6 34.8 108.0 344.0 53.5 351.1 0.10 30.2EuropeAfrica 5.6 142.5 35.8 78.8 0.15 64.4 7.4Asia 50.0 1.9 33.1 147.9 19.6 234.5 11.7 2.2 0.67 55.1 5.0Australasia 28.2 39.4 38.5 39.2 192.0 37.5 12.90 0.51 190.0 382.5 18.2 181.9 370.0TOTAL 35.6 11.9 39.1 248.1 349.1 361.2 46.0 1.9 227.1 92.3 1.4 378.1 1.33 0.26 0.32 249.9 6.9 477.2 23.2 390.7 412.3* Geographical breakdown of properties sold (evaluated in terms of the total amount, and per unit of metal in the ground)

18State of the Market: Mining and Finance ReportEdition 1, 2013
As noted earlier in this report (see p16), the 3,486 companies in the mining industry had a combined market capitalisation of US$2,543 billion at the end of last year, for an average corporate valuation of some US$730 million.
This rather bland statistic hides, however, a huge variation in the structure of the industry. On the final trading day of 2012 there were just 681 mining companies (20% of the total) with individual market capitalisations of over US$100 million. These companies were valued by the market at a combined US$2,501 billion (for an average market capitalisation of US$3.67 billion).
At the other extreme of the market, there were 1,756 companies (half of the total) that were each valued at less than US$10 million. At the end of 2012 there were a further 817 companies valued at US$10-49 million and 232 at US$50-100 million (the latter companies had an average market capitalisation of US$71 million).
PROjECT PIPELINELast year saw a slow-down in the hitherto fast pace of mine development. Investment in mining projects* grew 9% in 2012 to US$735 billion, after the growth of 20% in 2011 (see figure, p21). However, the total number of projects in the pipeline fell 3% to under 1,300 (similar to the level of 2010).
*Note: The requirement for inclusion in IntierraRMG's Raw Materials Database (RMD) are that a project must have either an estimated mineral resource or an estimate of capital expenditure.
Several large projects have been put on hold, including BHP Billiton's US$8 billion Olympic Dam expansion in Australia, and the Prioskolskoye iron-ore and Sukhoi Log gold projects in Russia. A number of uranium and nickel projects have also been postponed.
Figures from RMD show that the average project has become more expensive. This is attributed, especially, to an increase in the geological complexity of orebodies and to falling ore grades, making them more difficult to mine and beneficiate. There has also been an increase in the construction of supporting infrastructure, and greater costs associated with securing environmental and community agreements.
The later project stages, for both greenfield and
brownfield developments, have seen the greatest investment growth. This is the result of mining companies pushing for early production to benefit from the still relatively high metals prices. The early-stage exploration projects have lost out, which might create pipeline problems in the future.
METaLS CHOICERMD shows that the investment market last year continued to be dominated by three metals: iron ore, copper and gold. Together these metals accounted for 77% of the total project investment, amounting to US$570 billion (see chart p21).
Iron-ore prices have risen recently after a decline caused by concern over the Chinese economy, and the metal remained the most important investment target in 2012. Annual spending increased 14% to US$245 billion, leaving iron ore accounting for 33% of the industry's total metals investments. However, the growth rate has fallen sharply compared with the 33% jump in annual iron-ore investment in 2011.
The average investment on the almost 1,300 projects in 2012 (slightly down on the total number in 2011) rose 13% (on a year-on-year basis) to US$1.2 billion.
Investment in copper projects grew 12% last year (16% in 2011), reaching US$200 billion. The number of copper projects in the pipeline (which is similar to those recorded in 2011) was higher than for iron ore (see figure at bottom p20). Stable production growth is forecast for the next two years.
Gold prices have remained robust during the recession but investment in gold projects is relatively low. However, the physical number of projects remains very high (see figure) at 410, representing one-third of the total number of mining projects recorded on RMD.
The number of nickel projects fell slightly in 2012, as did the total investment (see figure, p20). Nevertheless, production of the metal remained high despite the difficult market conditions. This is attributed to the complication, and cost, of suspending advanced-stage nickel projects.
M&A: Value and deals announced
Special Report: Overview of 2012Last year saw a slow-down in the pace of mine development, with fewer projects in the pipeline, but increased expenditure
050100150200250300350400450500
0
20,000
40,000
60,000
80,000
100,000
120,000
2011 2012
Value
of de
als (U
S$ m
illion) Number
M&A: Value of deals announced (three major commodities)
05,000
10,00015,00020,00025,00030,00035,00040,00045,00050,000
2011 2012
Value
of d
eals
(US$
milli
on)
Copper Gold Iron Ore
19State of the Market: Mining and Finance ReportEdition 1, 2013
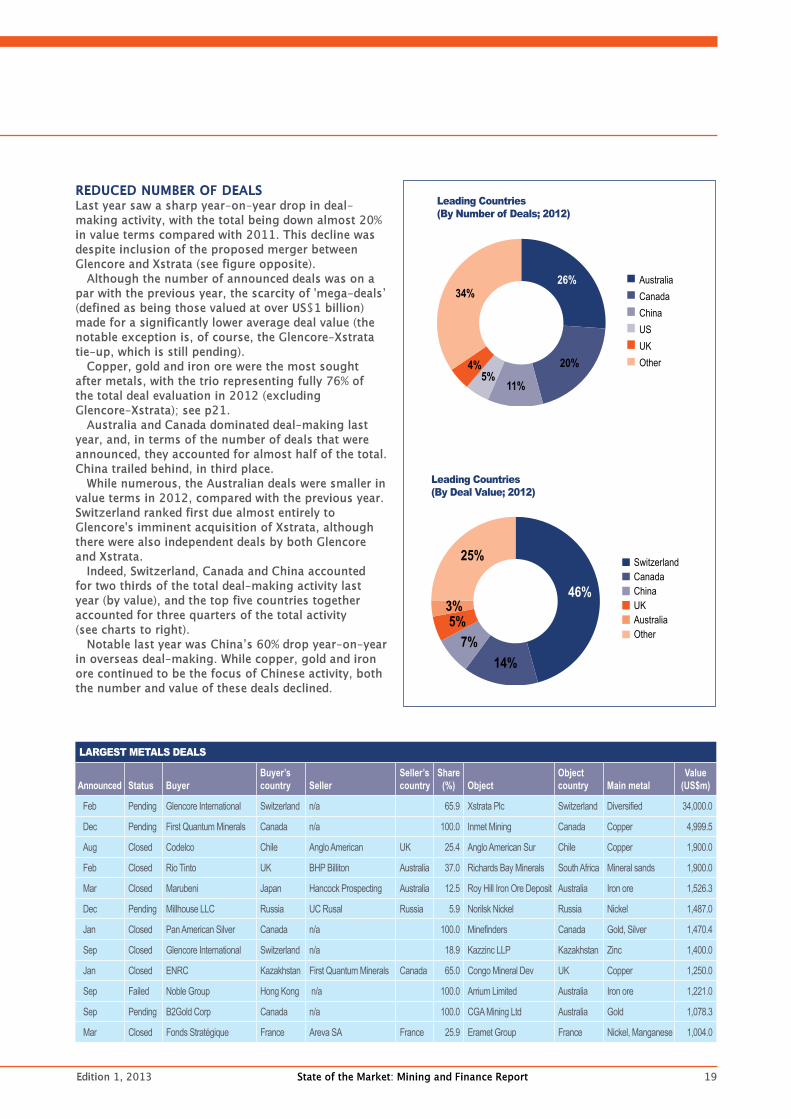
REdUCEd NUMBER OF dEaLSLast year saw a sharp year-on-year drop in deal-making activity, with the total being down almost 20% in value terms compared with 2011. This decline was despite inclusion of the proposed merger between Glencore and Xstrata (see figure opposite).
Although the number of announced deals was on a par with the previous year, the scarcity of 'mega-deals’ (defined as being those valued at over US$1 billion) made for a significantly lower average deal value (the notable exception is, of course, the Glencore-Xstrata tie-up, which is still pending).
Copper, gold and iron ore were the most sought after metals, with the trio representing fully 76% of the total deal evaluation in 2012 (excluding Glencore-Xstrata); see p21.
Australia and Canada dominated deal-making last year, and, in terms of the number of deals that were announced, they accounted for almost half of the total. China trailed behind, in third place.
While numerous, the Australian deals were smaller in value terms in 2012, compared with the previous year. Switzerland ranked first due almost entirely to Glencore's imminent acquisition of Xstrata, although there were also independent deals by both Glencore and Xstrata.
Indeed, Switzerland, Canada and China accounted for two thirds of the total deal-making activity last year (by value), and the top five countries together accounted for three quarters of the total activity (see charts to right).
Notable last year was China’s 60% drop year-on-year in overseas deal-making. While copper, gold and iron ore continued to be the focus of Chinese activity, both the number and value of these deals declined.
leading Countries (by Number of Deals; 2012)
leading Countries (by Deal Value; 2012)
lARGEST METAlS DEAlS
Announced Status Buyer Buyer’s country Seller
Seller’s country
Share (%) Object
Object country Main metal
Value (US$m)
Feb Pending Glencore International Switzerland n/a 65.9 Xstrata Plc Switzerland Diversified 34,000.0
Dec Pending First Quantum Minerals Canada n/a 100.0 Inmet Mining Canada Copper 4,999.5
Aug Closed Codelco Chile Anglo American UK 25.4 Anglo American Sur Chile Copper 1,900.0
Feb Closed Rio Tinto UK BHP Billiton Australia 37.0 Richards Bay Minerals South Africa Mineral sands 1,900.0
Mar Closed Marubeni Japan Hancock Prospecting Australia 12.5 Roy Hill Iron Ore Deposit Australia Iron ore 1,526.3
Dec Pending Millhouse LLC Russia UC Rusal Russia 5.9 Norilsk Nickel Russia Nickel 1,487.0
Jan Closed Pan American Silver Canada n/a 100.0 Minefinders Canada Gold, Silver 1,470.4
Sep Closed Glencore International Switzerland n/a 18.9 Kazzinc LLP Kazakhstan Zinc 1,400.0
Jan Closed ENRC Kazakhstan First Quantum Minerals Canada 65.0 Congo Mineral Dev UK Copper 1,250.0
Sep Failed Noble Group Hong Kong n/a 100.0 Arrium Limited Australia Iron ore 1,221.0
Sep Pending B2Gold Corp Canada n/a 100.0 CGA Mining Ltd Australia Gold 1,078.3
Mar Closed Fonds Stratégique France Areva SA France 25.9 Eramet Group France Nickel, Manganese 1,004.0
26%
20%
11%5%
4%
34%AustraliaCanadaChinaUSUKOther
46%
14%7%
5%3%
25% SwitzerlandCanadaChinaUKAustraliaOther

20State of the Market: Mining and Finance ReportEdition 1, 2013
Special Report: Overview of 2012continued
ANNUAl DEAlS (by Commodity)2012* 2011
Value(US$ million) Number
Value(US$ million) Number
Copper 15,033.0 50 48,307.9 50Gold 14,035.0 142 15,229.2 124Iron Ore 6,043.5 36 20,263.7 54Nickel 2,804.2 10 1,381.4 14Zinc 1,446.3 7 6,715.3 15PGMs 1,224.9 2 598.1 6Silver 716.8 4 456.6 10REO 400.5 3 70.9 4Lead 4.1 3 105.2 5Other# 4,336.8 41 5,722.0 13Glencore-Xstrata 34,000.0 1TOTAL 80,045.1 299 98,850.3 295.0* Includes the multi-commodity Glencore-Xstrata deal (listed separately), which is due to close in 2013.# Includes three lithium deals valued at a total of US$1.65 billion in 2012, and two niobium deals valued at US$3.9 billion in 2011.
DEAl SUMMARY (by Domicile of Acquiring Company; 2012)
ValueUS$ million
Deals(Number)
Switzerland 36,590.8 11Canada 11,514.5 59China 5,696.1 32UK 3,877.7 13Australia 2,485.7 78South Africa 2,217.2 10Japan 1,908.7 4Russia 1,575.1 5USA 1,184.3 14India 561.6 4Brazil 312.7 2Singapore 94.2 6Other 12,026.5 61TOTAL 80,045.1 299
COMMODITY RANK (by Capital Expenditure on Advanced-stage Projects; US$ million)2009 % 2010 % 2011 % 2012 %
Fe 127,339 27 161,606 29 215,272 32 245,346 33Cu 123,548 27 154,552 27 178,695 26 199,789 27Au 75,373 16 83,102 15 111,486 17 125,372 17Ni 64,716 14 68,572 12 63,793 9 59,830 8U 15,126 3 21,994 4 25,168 4 24,545 3Zn,Pb 13,974 3 16,081 3 18,014 3 16,756 2Pt,Pd 13,214 3 15,146 3 16,250 2 16,242 2Dia 8,202 2 6,977 1 8,177 1 8,438 1Ag 4,517 1 9,246 2 7,166 1 8,072 1Others 19,298 4 25,056 4 31,370 5 30,163 4Total Capex 465,307 100 562,332 100 675,391 100 734,551 100
COMMODITY RANK (by Number of Advanced-stage Projects)2009 % 2010 % 2011 % 2012 %
Au 371 30 386 30 401 30 410 32Cu 243 20 246 19 248 19 245 19Fe 169 14 188 15 196 15 198 15Zn,Pb 99 8 104 8 102 8 87 7Ni 98 8 93 7 90 7 77 6U 46 4 52 4 56 4 56 4Ag 40 3 43 3 46 3 41 3Pt,Pd 40 3 40 3 39 3 39 3Dia 24 2 27 2 27 2 22 2Others 91 7 107 8 115 9 107 8Total number 1,221 100 1,286 100 1,320 100 1,282 100

21State of the Market: Mining and Finance ReportEdition 1, 2013
“RMD shows that the investment market last year continued to be dominated by three metals: iron ore, copper and gold. Together these metals accounted for 77% of the total project investment, amounting to US$570 billion.”
33
27
17
8
43
2 21 1
Fe
Cu
Au
Ni
Others
U
Zn,Pb
Pt,Pd
Dia
Ag
INVESTMENTS DISTRIbUTION bY METAl (%)
MINING PROjECT INVESTMENTS bY METAl (US$ MIllION)
NUMbER OF PROjECTS IN PIPElINE
0
50,000
100,000
150,000
200,000
250,000
300,000
2011
2012
Fe Cu Au Ni Others U Zn, Pb Pt, Pd Dia Ag
0
50
100
150
200
250
300
350
400
450
Fe Cu Au Ni Others U Zn, Pb Pt, Pd Dia Ag
2011
2012
22State of the Market: Mining and Finance ReportEdition 1, 2013
continued
SOCIaL TURBULENCELast year was not a quiet one but at least the world did not end on December 21, as predicted by the Mayans.
President Obama was re-elected in the US but there was a change of leadership in the world’s second most powerful nation (China), and President Putin has resumed control in Russia (if he ever left it). The UN, meanwhile, has been powerless to end the civil war in Syria, while Europe remains in crisis, the Chinese economic has slowed and unemployment remains an issue in the Western World.
In the mining industry, there are big changes underway in the top jobs. An early New Year casualty has been Tom Albanese, with the Rio Tinto boss falling on his sword (with the “mutual consent” of his Board) over the company's huge asset write-offs. Anglo American’s Cynthia Carroll had already announced her intention to leave (to be replaced by Mark Cutifani, currently head of AngloGold Ashanti), Mick Davis is set to leave Xstrata (six months after the merger with Glencore International) and, to complete the set, BHP Billiton has begun its search for a successor to Marius Kloppers (although no time frame for his departure has been disclosed). Back in June, Barrick Corp replaced its chief executive Aaron Regent with Jamie Sokalsky.
However, of greater long-term significance to the industry is the social unrest that has blighted many mining economies. It does not take a crystal ball to predict that community relations will be a key issue in 2013.
Social conflict has been especially worrying in Africa and South America. In the latter continent, there have been particular difficulties in Peru, where there has been community unrest at, for example, Newmont Mining’s 51%-owned Minas Conga project in Cajamarca Region.
Barrick Gold, Xstrata, Southern Copper and Anglo American have also seen protests against their projects. This has impacted on inward investment, and, according to the National Society of Mining, Petroleum and Energy (SNMPE), this year’s planned expenditure in Peru has slumped from a previously announced US$6 billion to US$4 billion.
As a matter of urgency, the Peruvian Government is working on legislation that would require prior
consultation before mining development (the new law has been delayed, ironically, due to drawn out consultations with indigenous communities).
There has been more encouraging news from Colombia, which has been torn by internal conflict for decades, with the government setting itself the goal of becoming a top producer of coal and gold by 2019. However, many of the indigenous peoples, especially in the minerals-rich region of Guamocò, are dissatisfied with the proposals. Complicating the picture in Colombia further are allegations that the rebel FARC organisation has been involved in illegal mining, and AngloGold Ashanti has been accused of hiring paramilitaries to relocate residents.
Africa holds enormous promise but much remains to be delivered. For example, progress remains slow at Vale SA’s Simandou iron-ore project in Guinea, and the Brazilian company admitted in October that development is “on hold” pending new regulations.
Nowhere has the continent's social conflict been more pronounced than in South Africa. This came to a head with violent clashes in September at Lonmin’s West Marikana platinum mine (after six weeks of unofficial strikes) which led to 45 miners being shot dead by police.
The unrest spread to the country's other mines, involving 85,000 employees, before the end of the third quarter. In October, Anglo American Platinum dismissed 12,000 striking workers at the Rustenburg mine.
It is not only in South America and Africa where there has been unrest. China has also suffered protests, predominantly centred on environmental complaints at coal mines.
Against this backdrop, the Chinese government has moved to increase environmental protection. China's State Council announced in November that all major projects will have to undergo a social-risk assessment. All government agencies have been ordered to make Environmental Impact Assessments.
Even the Nordic countries have not been spared from social unrest, with protests in both Sweden and Finland from local communities against mining projects.
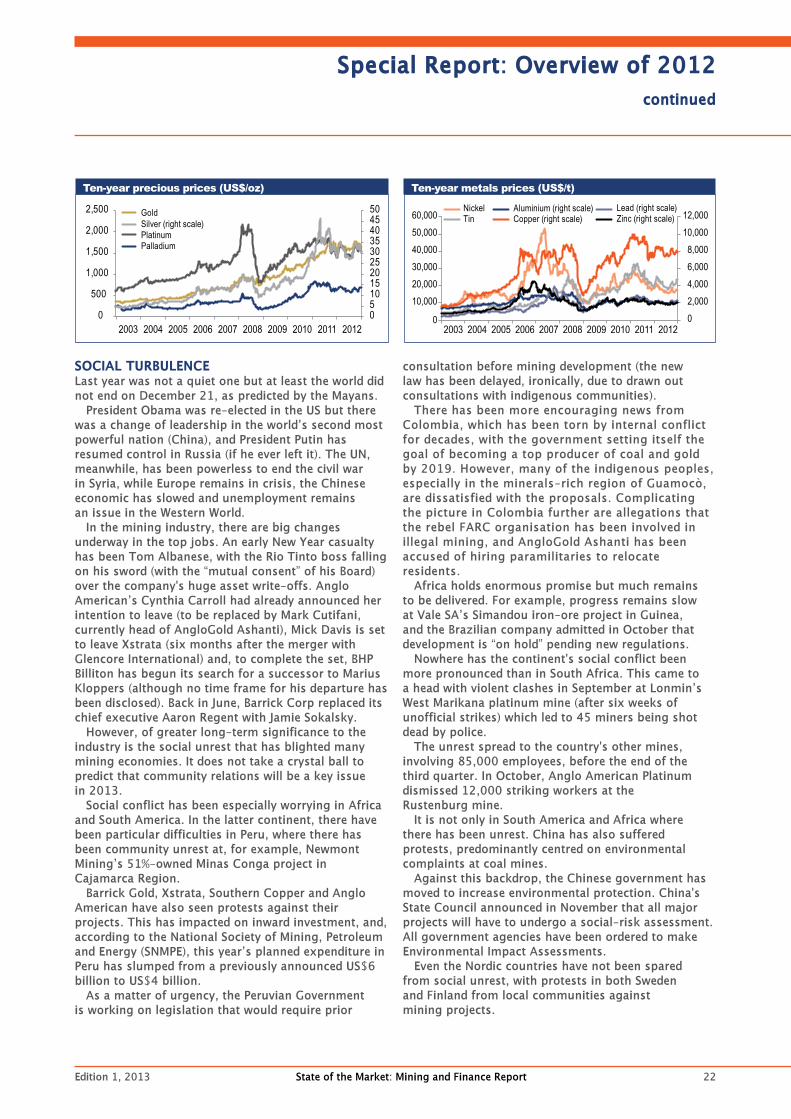
Ten-year metals prices (US$/t)Ten-year precious prices (US$/oz)
2003 2004 2005 2006 2007 2008 2009 2010 2011 20120
10,00020,00030,00040,00050,00060,000
02,0004,0006,0008,000
10,00012,000
NickelTin
Aluminium (right scale)Copper (right scale)
Lead (right scale)Zinc (right scale)
05101520253035404550
0
500
1,000
1,500
2,000
2,500 Gold
PlatinumPalladium
Silver (right scale)
2003 2004 2005 2006 2007 2008 2009 2010 2011 2012
Special Report: Overview of 2012

23State of the Market: Mining and Finance ReportEdition 1, 2013
CORRUPTION: INCREaSEd OPERaTIONaL RISkTransparency International has confirmed that mining remains one of the most corrupt global industries, and two surveys undertaken last year show a clear gap between mining companies’ perception of corruption and their preparedness to heed the risk.
Moreover, according to a recent survey on bribery and corruption by Deloitte, nearly half of the companies operating in high-risk offshore jurisdictions have never conducted an assessment on corruption risk. Some 40% of the respondents said they were "not concerned" with the risks associated with non-compliance.
The same finding was made by Ernst & Young in its 11th Global Fraud Survey, where 42% of the responding companies never, or very infrequently, conduct fraud and corruption risk assessments (post project due-diligence).
According to World Economic Forum's latest Global Risks Report, corruption is perceived as one of the most important geopolitical risks. It is also perceived as one of the most interconnected risks; being linked to global governance failure and major systemic financial failure.
Corruption, and exposure to corruption, is also the most important factor in an assessment of operating risk. This can be demonstrated by comparing five high operational-risk countries with Transparency International’s Corruption Perceptions Index (CPI); see table.
As with political risk, the national influence on operational risk runs from insignificant (eg Norway and New Zealand) to extreme (eg the Kandahar region in Afghanistan).
CORPORaTE advICEWith regard to risk assessment, Transparency International advises mining companies to “monitor, evaluate and report” on a regular basis.
Companies are also advised to:• Publish the findings (transparency is the first line
of defence against corruption).• Commit to a Code of Conduct (on both an internal
and external basis), and provide employees with practical guidance.
• Introduce third party due diligence that is independent. • Build strong relationships with government and
other stakeholders.
Meanwhile, companies are facing burgeoning global anti-corruption regulations (eg the Dodd-Frank Act in the US that relates to the disclosure of payments by resource companies).
Mining companies are clearly facing sharply higher corruption-risk assessments, especially as they move into ever more unstable territories.
Five High Risk* Countries (NRI ranking)Country CPICongo DR 160Guinea 154Papua New Guinea 150Venezuela 165Zimbabwe 163* The operating environment presents persistent and serious challenges for business. For example: Corruption is endemic across all levels of officialdom, there are significant infrastructure deficiencies or regulations are onerous and their implementation is capricious. Sources: Control Risks, Transparency International
HEAT MAP

24State of the Market: Mining and Finance ReportEdition 1, 2013
Special Report: Mining Royalties and TaxationThere is a balancing act, from the perspective of both the investing company
and the host country, when negotiating the terms of mine development
Mining is a global business and there is competition between the various mineral-prospective countries. As a result, investments flows are not only influenced by the geological potential of the host nation but by the risks associated with the project. This includes not only national taxes and legislation but also local community attitudes and levels of corruption, etc.
Given the long-term nature of a mining project and the size of initial expenditure (and which cannot later be moved), the stability of the fiscal regime is of utmost importance.
From a company's perspective, a higher political risk can be off-set by an increased likelihood of finding world-class deposits. For that reason, a country with a long history of stable mining conditions is, of course, a more attractive target for foreign direct investments (FDI) than a country with a limited (or poor) track record.
FDI into relatively stable countries, such as Canada and the US, are at present much higher than what is to be expected given the existing size of the local mining industries.
Also, Latin America remains much more attractive for mine development than Africa, in spite of the higher probability of finding a new deposit in the latter continent. This is simply because much less exploration has been made in Africa, and the perceived risks for international investors are higher. There are also other factors involved, with higher levels of corruption in Africa, and the scarcity of suitable infrastructure. Moreover, the political stability, tax and royalty levels, and free-carried state ownership are a disincentive compared with many Latin American countries.
TaXaTION MEaSURESAll things being equal, any country should attract
mining investment that is proportional to its mineral prospectivity. If this investment is less, it implies faults in the investment climate, such as an excessive tax regime. However, if the investment is greater than would otherwise be expected, it suggests that the investment conditions may be overly generous.
From a national perspective, there has to be a balance between the income (direct and indirect) arising from mining, and the value of the metals extracted. From the company's perspective, the balance is between the potential rewards and the risks associated with the investment.
In recent years, governments have been re-examining their arrangements with mining companies, and have sought to increase the revenues they receive for the extraction of their natural resources.
This has led to three different trends in mining taxation:
1. Regions with an already large share of the mining market have sought to increase taxation on natural resources (Australia being a prime example).
2. Stable regions, which do not have a large market share in mining, are moving towards marginal increases in resource taxation (eg South Africa).
3. Mainly developing countries, unable to offer a reliably-stable business environment, are offering lower resource taxation (eg Kazakhstan).
There are two broad categories of taxation regime within the mining sector:
1. Taxation based on incomeIncome-based taxes are calculated on profit, or cash-flow, and are based on revenue net of qualifying costs. The latter can include royalties based on profits/income, corporate income tax, profit taxes on dividends, and withholding taxes on offshore repayments of debt and equity.
2. Taxation based on productionProduction-based taxes include unit-based royalties, and charges on inputs and services (import duties and licensing or registration fees).
A mix of both types of regimes is commonly used, although differences in mix exist across regions. The major difference between the two categories is in the timing of revenues to the state. Profit, or income-based, taxes will only be generated once mine production starts, and even then may be delayed as mining companies will prefer to recuperate costs/losses that they incurred at the exploration and development stage of the mining cycle.
Taxation on profits encourage risk sharing between the company and the state, and take into account the fluctuations in global prices, changes in the geological and technical determinants of the mining operations as well as financial and political factors over the mining cycle. Effective taxation of profits is dependent on the capacity of the state to recognise (and enforce) this risk sharing, and the associated rules are often not met in developing countries.
Taxes on production, without taking into consideration profitability, can lead to economic disincentives, and can discourage the exploitation of low-grade ore for low-profit operations. While production-based taxes ensure a minimum flow of revenues to the state, they do not take into account the financial risk faced by the mining companies and foreign investors. States that overly rely on production taxes also find they do not gain as much from the associated value benefit when there is a spike in commodity prices.
Although a number of tax systems and tools exist, those most commonly applied include income tax and withholding tax on dividends, loan interest and services. Royalties and land use fees as well as administrative fees are commonly used. Excess profit taxes have been rarely used in the past, but with the Australian Mineral Resource Tax coming into force in

25State of the Market: Mining and Finance ReportEdition 1, 2013
Mining Tax Comparison
CountryCorporate
Tax (%)VAT(%)
Government RoyaltiesOn Mining
Share of Global Mining(By value; %) (a)
EUROPE
Sweden 26.3 25 None 0.82
Poland 19 23 Varies by mineral 0.62
Turkey 20 18 4% for precious metals 0.47
Finland 24.5 23 None 0.15
Bulgaria 10 20 2% to 8%, on profit 0.15
Ireland 12.5 23 Yes (negotiated) 0.09
Norway 28 25 None 0.08
Armenia 20 20 4% of turnover, plus 12.5% of revenue 0.07
Portugal 25 23 Varies by mineral 0.07
Spain 30 18 2% of NSR 0.06
Greece 20 23 2.5% for gold 0.06
Austria 25 20 None 0.05
Macedonia 10 18 2% 0.05
Georgia 15 18 Unavailable 0.03
Azerbaijan 20 18 3% 0.01
Romania 16 24 4% 0.01
UK 24 20 None 0.00
Greenland 30 0 None 0.00
Albania 10 20 5% to 10%, by mineral 0.00
Cyprus 10 17 na 0.00
Czech Republic 19 17.50 Yes 0.00
Hungary 10 to 19 27 12% (e) 0.00
Italy 27.50 23 None 0.00
SELECTED OTHER REGIONS
Western Australia 29 101 6.50% effective rate for gold 15.70 1
Nevada 35 102 2% to 5% 4.86 2
Quebec 26.9 53 16%, on profit 3.00 3
Mexico 30 16 0% 2.34
Ghana 22 to 25 25 5% and higher CIT for mining 0.64
Burkina Faso 27.5 na 3% to 6%, indexed to gold price 0.23
New Zealand 28 15 * 0.15
* 1% of sales revenues less than NZ$1.5 million or 2% of AVR for sales revenues less than NZ$1.5 million(a) Percentage national share of the global mined value of metallic minerals in 2011. Source: IntierraRMG(e) Estimatena Information not available 1 - For the whole of Australia2 - For the whole of the USA3 - For the whole of Canada

26State of the Market: Mining and Finance ReportEdition 1, 2013
2012 (also referred to as Resource Super Profits Tax) we may see more use of this tool. Most mining companies are exempted from import and excise duties for their capital goods and receive VAT refunds.
In order to induce FDI, mining companies are offered a number of fiscal incentives, most commonly an allowance for accelerated depreciation of capital, and consent to carry forward losses. Environmental and closure costs are tax deductible, as well as contributions to community and public infrastructure. There is less use recently of tax holidays and depletion costs, or of tax stabilisation regimes, which have been historically prevalent in, for example, Latin America.
RECENT FISCaL dEvELOPMENTS The Australian government was successful last year in passing its Mineral Resource Rent Tax, despite heavy opposition from mining firms. From July 2012, iron ore and coal miners have been taxed at 30% on profits exceeding A$75 million. The major driver of the resource rent tax was the super profits being experienced by the mining sector, when growth in the rest of the economy was restricted.
This move by Australia has encouraged others to make changes in their tax regimes. For example, Brazil is expected to follow suit by increasing its royalty rate from 2% to 4%, as well as considering the introduction of a ‘Special Participation Tax’, which will be applicable for large mining operations. Peru increased its royalty tax rate in 2011, applying it to operating profits rather than net sales, and Chile is considering raising royalties from 2018 onwards (most current contracts end in 2017).
Within Africa, a number of countries (including Ghana, Gabon, Guinea and Uganda) are looking to increase taxation in the mining sector, although formal directives in this regard have not yet been announced. South Africa has reintroduced a mining royalty tax, which had been on hold during the recession. Tanzania and Namibia are specifically looking at introducing excess profit taxes for mining companies.
India, in an effort to use mining revenue for development and infrastructure projects, is also widely expected to increase mining taxation.
While some countries are looking towards increased mining taxation to increase the sector’s contribution to the economy, others are looking at increased taxation as a means of mitigating the environmental and social costs of the sector. For example, China imposed resource taxation on the mining and oil sectors in November 2011, to counter environmental degradation.
Other countries have imposed taxation on un-refined ore exports in efforts to encourage processing and value addition within the country. For example, in May 2012, Indonesia announced the imposition of a 20% export tax on unprocessed metals (including
nickel, tin and gold). To further encourage domestic value addition, the government has decreed a ban on exporting materials (to be enforced by 2014) from companies that do not have plans to build processing facilities in the country.
While the major trend seems to be geared towards increased taxation of the mining sector, there are other countries looking to use the opportunity to offer relatively lower tax regimes to encourage investment and increase their market shares. This intention has been signalled by Kazakhstan, Russia and Canada.
ROyaLTy PayMENTSThere is a widespread in the rates set for national royalties. In Canada, for example, Quebec imposes a provincial-level royalty on mining operations, as opposed to federal taxation, but does not charge a royalty rate on production. It does, however, charge 16% on profits in addition to corporate tax rates (determined on a mine-to-mine basis).
The Quebec mining royalty scheme was revised in 2010 and was in response to the demand that the state gain a larger share of the gains from its natural resources. The tax on profits allows the state and the mining firm to share the risks associated with mining activity.
In the US, the state of Nevada imposes royalties based on profits, and these vary from 2% to 5% (the latter for gold). The calculation of the royalty rate is a function of the ratio of profit over revenue, and was last set in 1989. The tax is based on the net proceeds from the sale of all minerals mined and produced in Nevada.
Mexico does not apply mining royalties, although there are indications the government is considering their introduction.
Western Australia utilises a combined system; charging a specific rate of A$1/t, plus an Ad Valorem rate (5% of the royalty value for concentrate material, and 2.5% of the royalty value for metals). The rates were set in 2010 and will be reviewed in 2015. The Australian Mineral Resource Rent Tax is levied on iron and coal only.
New Zealand has recently introduced royalties on minerals owned by the state. For gold and silver sales revenue of less than NZ$1.5 million, this rate is either 1% of sales or 2% of Asset Valuation Reserves (AVR), depending on which amount is higher. The government is reviewing proposals to increase these royalties to which ever is higher of 2% AVR or an annual percentage rate (APR) of 10% on accounting profits over NZ$2 million.
In Africa, Ghana revised its Minerals and Mining Act in 2010, and set a flat royalty rate of 5%. Burkina Faso has indexed its royalty rate to the price of gold; with a minimum royalty rate of 3%, increasing to 4% for gold prices of US$1,000-1,300/oz, and to 5% for prices above US$1,300/oz.
Special Report: Mining Royalties and Taxationcontinued

27State of the Market: Mining and Finance ReportEdition 1, 2013
For a number of European countries (Austria, Finland, Germany, Greenland, Norway, Sweden and the UK) there are no federal or provincial mining royalties. While fees can be charged for obtaining permits and licenses for exploration and operations, these are not material costs of investment.
In these seven countries, mining royalty fees are not levied on production or profits. Instead mining companies, like other businesses operating in these countries, are subject to corporate income tax, personal income tax, Value Added Tax, property tax, social contributions and other similar fiscal instruments. The mining sector in these European countries is not subject to specific taxation schemes.
Turkey (one of the largest gold producers in the region) levies a 4% royalty on gold. Other countries in Europe tend to have a different range of mining royalties on production, charged depending on the minerals in question. For example, Albania charges a 10% royalty for gold and 6% for copper. Poland charges PL3.10/t for copper ore and PL1.12/t for lead and zinc. Portugal uses a number of different rates, depending upon the mineral, and upon ore production levels.
Some countries in Europe have chosen to levy royalties on profits, or the market value of the metal at the time of invoice. For example, Macedonia levies a royalty rate of 2% of the market value of the contained metal (as opposed to the ore), Azerbaijan applies a rate of 3% of the whole sale price for all metals, and Spain applies a 2% rate on the net smelter return.
Other European countries have a varying royalty rate, dependent on the international price. For example, Bulgaria is focusing on a rate of 2-8% for profitability ratios of 10-60% for new projects. Ireland, on the other hand, negotiates royalty rates on a mine-to-mine basis.
SETTING a FaIR RaTEThe determination of what is an ‘equitable’ share of a project’s long-term value for host governments is based on a number of complex, inter-dependent factors.
The first concern for a host government has to be to maximise its revenue, and ancillary benefits, from the natural-resource sector (whether such returns are a result of direct or indirect revenue collection). Higher royalty rates can actually reduce financial returns to the state by leading to a fall in long-term revenue (by discouraging further investments, for example to extend the life of a mine).
In an increasingly competitive mining world, governments have to balance an ability to attract investment with generating short-term state revenue. In particular, governments need to consider the mining sector’s role in its larger socio-economic plans.
The question most relevant to host governments on fiscal matters in the mining sector is: How can the state ensure fiscal flexibility, allowing the country to benefit when prices rise, and bear a reasonable share when they fall, while providing the predictability and profitability that investors seek?
State of the Market: Mining and Finance Report
Special features in the next two issues: Edition 2, 2013• Special Coverage: Cash cost data• Annual overview of regional mining activity Edition 3, 2013• Mid-year examination of the world’s metals stockpiles• Mining methods, and technology developments and trends

28State of the Market: Mining and Finance ReportEdition 1, 2013
About IntierraRMG
For 30 years, Intierra and Raw Materials Group have been the mining industry’s preferred sources of data, analysis, consulting, reports and mineral information maps.
We have provided resource sector intelligence for suppliers, financiers, governments, exploration and mining companies.
As IntierraRMG, we deliver respected market and project reports, material flows analysis, mineral economics policy and unrivalled consulting expertise. Our databases and sector-specific modules offer unique insights into lease ownership, company evaluations, M&A, risk management, due diligence, competitor intelligence and project pipeline evaluation.
IntierraRMG provides a range of services, including:
IntierraLive Database Service
Raw Materials Data
Consulting and Analysis
For further information on IntierraRMG, please email us on [email protected]
Other Reports:
State of the Market: Exploration ReportUnderground Mining Mobile EquipmentCopper Quarterly ReportCopper Briefing Report (Monthly)Iron Ore ReportZinc - China and the WorldTop Mining Company ProfilesNickel: The Companies and their MarketsMonthly World Metal StatisticsWorld Metal Statistics YearbookMetallstatistik (2001 – 2011)Quarterly Stainless Steel StatisticsAnnual Stainless Steel Statistics
To purchase any of these reports,email: [email protected]