state of the industry 2012. today’s agenda powerboat data — peter houseworth, info-link sales...
TRANSCRIPT

State of the Industry 2012
Today’s agendaPowerboat Data — Peter Houseworth, Info-Link
Sales Sweet Spot —Robert Grant, ADP Lightspeed
Dealer Metrics —Noel Lais, Spader Business Management
Yacht Brokerage Sales — John Burnham, Dominion Marine Media
Q&A — Submit your questions throughout the webinar!
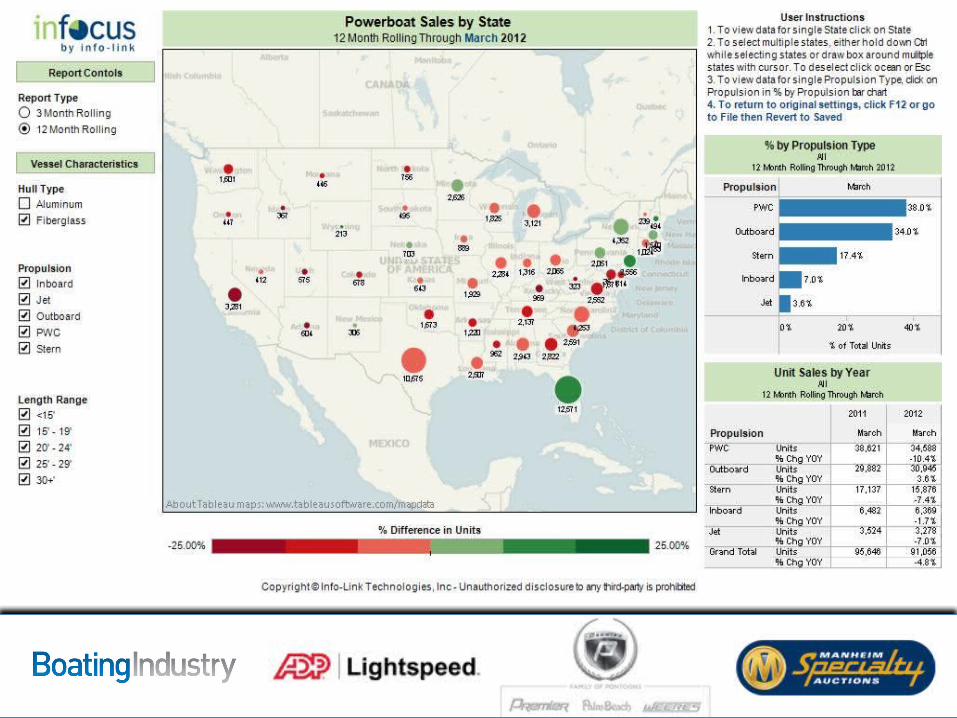
Powerboat Data
Peter Houseworth, Info-Link


Website
• info-link.com
E-mail• [email protected]• [email protected]
Telephone• (305)661-3030• (786)888-8238
Presented by : Robert GrantAugust 23, 2012
Sales Sweet Spot

Quantity vs. Quality
Where would you rather be?• Selling more for less• Selling a few less for more
Data Source: ADP Lightspeed DataBack Study
56% of all units sell between $5k - $15k

The Sweet Spot0-15K: Avg. Margin = 10.6%
15-100K: Avg. Margin = 19.02%
100-400K: Avg. Margin = 15%
Data Source: ADP Lightspeed DataBack Study

Customer Migration
Data Source: ADP Lightspeed DataBack Study
•How do we encourage migration from the lower end of the scale?
• Customer Relations• Encourage Trading Up• Finance Options• Education Events• Other
Presented by
Noel LaisSpader Business Management
Dealer Metrics August 2012
© 2011 Spader Business Management, Inc. All rights reserved.

20
Fulfilling. Success.
20
Annual Net Profit

21
Fulfilling. Success.
© 2011 Spader Business Management, Inc. All rights reserved.21
Annual Net Profit

2001 2002 2003 2004 2005 2006 2007 2008 2009 2010 20110
0.5
1
1.5
2
2.5
3
3.5
4
4.5Annual Net Profit
% o
f S
ale
s
2001 2002 2003 2004 2005 2006 2007 2008 2009 2010 20111,500,000
2,000,000
2,500,000
3,000,000
3,500,000
4,000,000 New Boat Inventory

2001 2002 2003 2004 2005 2006 2007 2008 2009 2010 20111,500,000
2,000,000
2,500,000
3,000,000
3,500,000
4,000,000 New Boat Inventory
2001 2002 2003 2004 2005 2006 2007 2008 2009 2010 20115
7
9
11
13
15
17
19
21New Unit Gross Margins
New
Uni
ts
2001 2002 2003 2004 2005 2006 2007 2008 2009 2010 20112,500,000
3,000,000
3,500,000
4,000,000
4,500,000
5,000,000
5,500,000
6,000,000
6,500,000
7,000,000
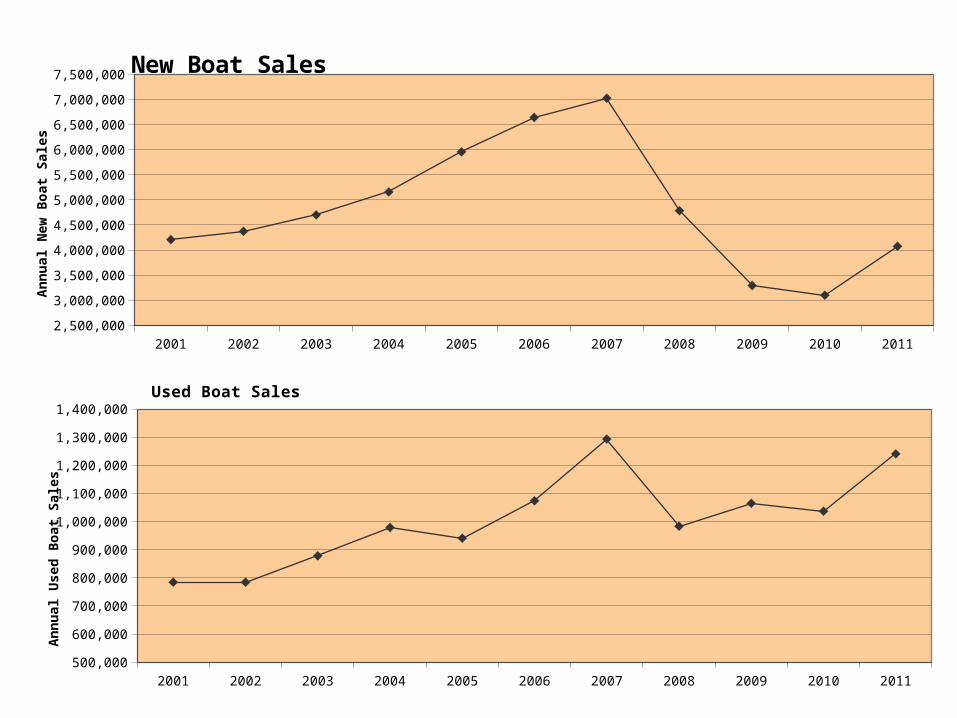
7,500,000New Boat Sales
An
nu
al N
ew B
oat
Sal
es
2001 2002 2003 2004 2005 2006 2007 2008 2009 2010 2011500,000
600,000
700,000
800,000
900,000
1,000,000
1,100,000
1,200,000
1,300,000
1,400,000
Used Boat Sales
An
nu
al U
sed
Bo
at S
ales

2011 Actual Year-end May 2012 Forecast June 2012 Forecast July 2012 Forecast$8,800,000
$9,000,000
$9,200,000
$9,400,000
$9,600,000
$9,800,000
$10,000,000
$10,200,000
$10,400,000
$10,600,000
$10,800,0002012 Total Sales Forecast
2011 Actual Year-end May 2012 Forecast June 2012 Forecast July 2012 Forecast0.0%
0.5%
1.0%
1.5%
2.0%
2.5%
3.0%
3.5%
4.0%
4.5%
5.0%2012 Net Profit Forecast


U.S. Yacht Brokerage Sales, 2012
Strength in smaller boats, weakness in larger

MARKET DATA REVIEW
Boating Industry Market Data Book• 29,000+ boats (June – May ‘09-’10 to ‘11-’12)
• $3.2 billion value (aggregate price paid)

Stories of the year
2011: Superyacht sales drive values2012: Smaller boats carry the market
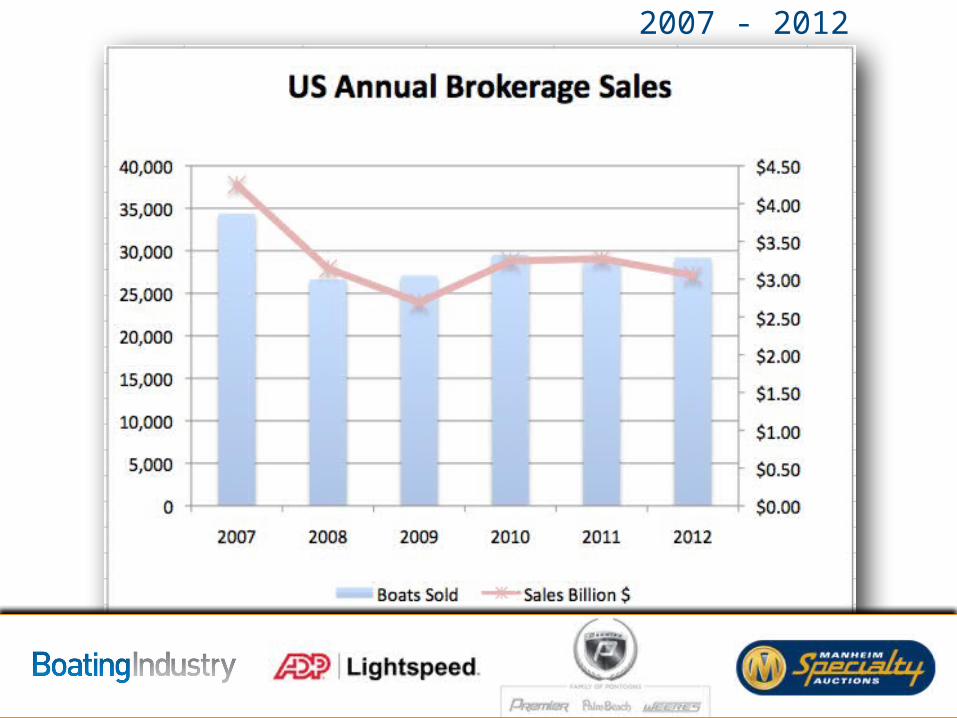
2007 - 2012

June & July Update
• 2011: 6,564 boats sold• 2012: 6,552 boats sold
• 2011: $749 million aggregate sales• 2012: $546 million aggregate sales• Net: - $203 million

Superyacht Market Impact
Superyacht sales value (June + July)• 2011: $197 million• 2012: $59 million• Net: - $138 million
All brokerage sales <80’ (June + July)• 2011 - $552 million• 2012 - $487 million• Net: - $65 million

Sales by Length (through July)
Size 2011 2012 % change
<26’ Boats Sold 5,928 6,587 +11%
Value, Boats Sold $119 million $135 million +14%
26’-35’ Boats Sold 7,385 7,368 0%
Value, Boats Sold $405 million $389 million -4%
36’-45’ Boats Sold 3,670 3,772 +3%
Value, Boats Sold $482 million $498 million +3%
46’-55’ Boats Sold 983 936 -5%
Value, Boats Sold $288 million $260 million -10%
56’-79’ Boats Sold 426 458 +8%
Value, Boats Sold $345 million $342 million -1%
>80’ Boats Sold 113 100 -12%
Value, Boats Sold $571 million $359 million -37%
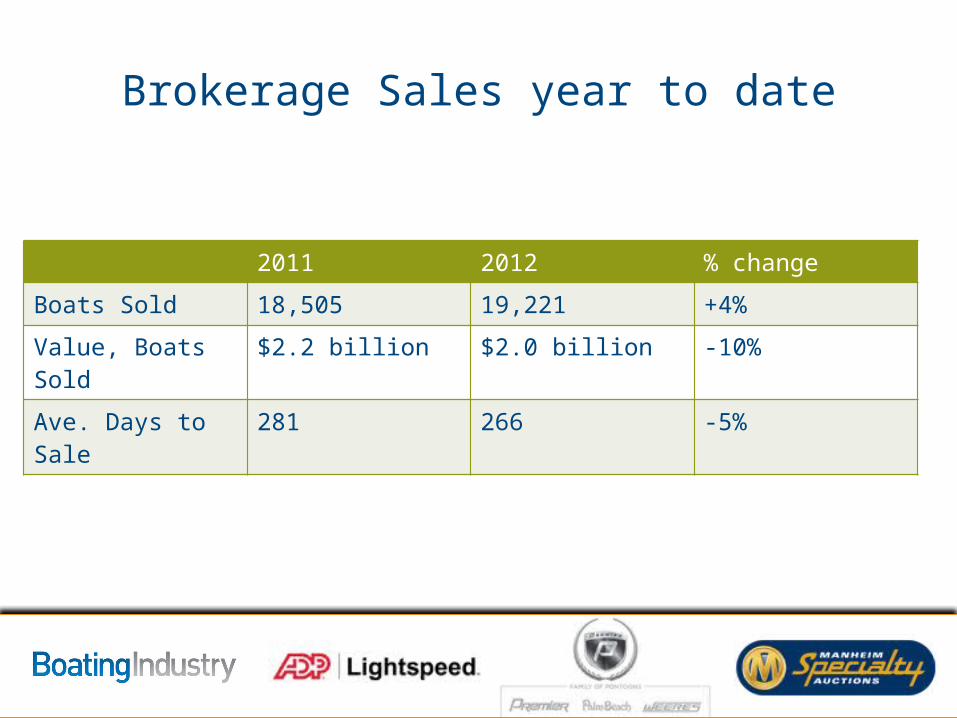
Brokerage Sales year to date
2011 2012 % change
Boats Sold 18,505 19,221 +4%
Value, Boats Sold $2.2 billion $2.0 billion -10%
Ave. Days to Sale 281 266 -5%


Q&ASubmit your questions in the Q&A box now!

Thank you!