state of the indian economy an opportunity for revival · state of the indian economy an...
TRANSCRIPT

State of the Indian Economy An opportunity for revival 1
February 2015www.deloitte.com/in
State of the Indian EconomyAn opportunity for revival

2
The last year has been a fortuitously good one for the Indian economy with a sea change in the macroeconomic parameters and a sustainable turnaround on the cards. At a time when concerns have been raised about global growth prospects, the Indian economy has marched on and has in fact entered a sweet spot. As a start, Gross Domestic Product (GDP) growth, which had plummeted to sub 5% levels in past two fiscal years finally seems to have picked up on the back of a cyclical rebound and some genuine improvement. Growth in the current year, while not spectacular, has moved
up firmly into the 5%+ handle. This improvement has come on the back of improved performance in the industrial sector, stable growth in the services sector and a surprisingly resilient agriculture sector. Further, policy action on the environmental clearances and mining licenses has helped prop up sentiment while a push to some stuck projects have aided growth prospects.
Encouragingly, the pick-up in growth seems to be taking place at a time when inflation is on the downtrend as effects of the past slowdown and the massive fall in global commodity prices is
Introduction

State of the Indian Economy An opportunity for revival 3
filtering through the economy. Inflation levels have continued to surprise on the downside and have printed comfortably under the Central Bank’s comfort zone. Price levels have seen an across the board moderation as food, fuel and service price inflation has come down. This clearly shows that there is still some slack in the economy as it grows below its potential rate of growth.
This moderation in inflation has also had an impact on interest rates as the Reserve Bank of India (RBI) has finally started its rate cutting cycle with its first rate cut in January earlier this year. The RBI had established targets for inflation under its new policy regime and as such those targets have been met comfortably and set the stage for a further easing of policy in the coming months. That said, the RBI continues to remain vigilant on the external front and the possible threat of capital outflows in response to the normalization of monetary policy in the US. Accordingly, while we do expect the RBI to continue easing, the cycle is unlikely to be as deep as some in the markets expect.
The situation is further being buttressed by a perceptible improvement in the external account metrics with the current account deficit coming under control despite the government lifting most of the import restrictions from the
last year. Imports have fallen sharply in response to the halving of global crude oil prices and while exports have suffered too, service exports have held up as growth in the US has rebounded in the current year. Foreign fund flows through the portfolio route have picked up massively after the elections responding to an improvement across most macroeconomic parameters. The more important and stable flows through the Foreign Direct Investment (FDI) route have also picked up as the government increased the level of permissible investments into some sectors.
The capital markets have continued to scale record levels as euphoria has built up on the possible trajectory of the Indian economy. The markets seem to have priced in a favourable policy environment and a consequent increase in corporate performance in the coming years.
Overall there is a real sense that a new set of reforms and the enthusiasm in the markets can lead India towards another prosperous era of high growth. That said, the government’s job is not yet over. Given the high expectations of success it has now become imperative for the government to deliver in order for the growth momentum to be sustained.
4
7.0%
9.5% 9.6% 9.3%
6.7%
8.6% 8.9%
6.7%
4.5%4.7% 5.50%
2004-05 2005-06 2006-07 2007-08 2008-09 2009-10 2010-11 2011-12 2012-13 2013-14 2014-15(E )
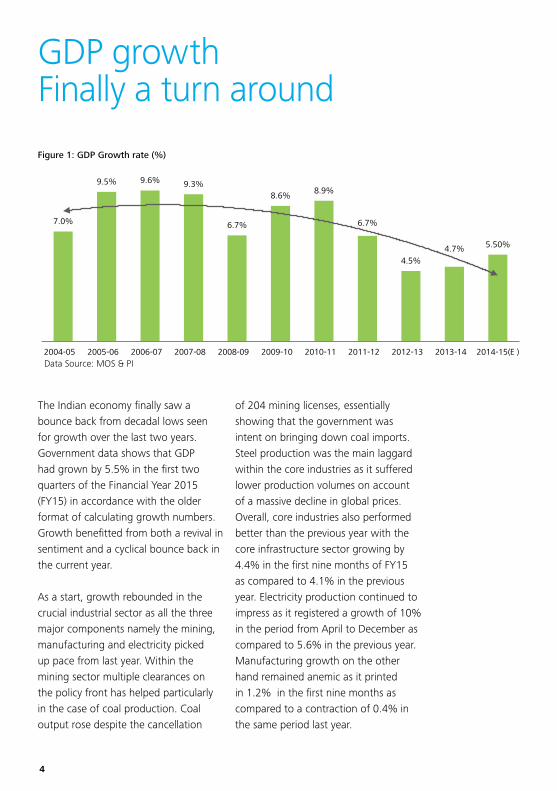
Figure 1: GDP Growth rate (%)
Data Source: MOS & PI
GDP growthFinally a turn around
The Indian economy finally saw a bounce back from decadal lows seen for growth over the last two years. Government data shows that GDP had grown by 5.5% in the first two quarters of the Financial Year 2015 (FY15) in accordance with the older format of calculating growth numbers. Growth benefitted from both a revival in sentiment and a cyclical bounce back in the current year.
As a start, growth rebounded in the crucial industrial sector as all the three major components namely the mining, manufacturing and electricity picked up pace from last year. Within the mining sector multiple clearances on the policy front has helped particularly in the case of coal production. Coal output rose despite the cancellation
of 204 mining licenses, essentially showing that the government was intent on bringing down coal imports. Steel production was the main laggard within the core industries as it suffered lower production volumes on account of a massive decline in global prices. Overall, core industries also performed better than the previous year with the core infrastructure sector growing by 4.4% in the first nine months of FY15 as compared to 4.1% in the previous year. Electricity production continued to impress as it registered a growth of 10% in the period from April to December as compared to 5.6% in the previous year. Manufacturing growth on the other hand remained anemic as it printed in 1.2% in the first nine months as compared to a contraction of 0.4% in the same period last year.

State of the Indian Economy An opportunity for revival 5
A detailed breakup of the manufacturing sector shows that the weakness has primarily emanated from the consumer durables segment that has contracted by 15.2% as compared to a contraction of 12.9% in the previous year. Investments have also remained weak as the volatile capital goods segment has shown a growth of just 4.8%. As such, there are two key points that are evident in the economy. Firstly, consumer demand remains low and is unlikely to see a rebound in a hurry. There is likely to be some lag for consumer demand to pick up as the lower fuel prices and optimism on the economic front filters through. Secondly, the capex cycle has clearly not taken off and the corporate sector still awaits more policy action from the government
before taking forward its investment plans. Separately, the industrial sector was buoyed by a better performance of the construction sector, which saw growth of 4.8% and 4.6% in Q1 and Q2 of FY15. The industrial economy is likely to witness another year of sub par growth and would most probably see improved number from the first quarter of FY16.
The services sector continued to show a stable rate of growth slightly benefitting from the benign revival on the industrial front and largely shrugging off the global slowdown. Growth printed in around the 7% mark driven primarily by higher public expenditure and the financial sector. The trade, hotels and communication sub-sector remains
-1
0
1
2
3
4
5
6
7
8
Q1 Q2 Q3 Q4 Q1 Q2 Q3 Q4 Q1 Q2
2012-13 2013-14 2014-15
Growth in Agriculture (%) Growth in Industry (%) Growth in Services (%) GDP
Data Source: MOS & PI
Figure 2: GDP sectoral growth rate

6
weak growing by barely 2.8% and 3.8% in the first two quarters respectively, another indication that the activity levels on the ground are yet to see a meaningful pickup. We would expect the services sector to continue to show stable rates of growth and gradually improve as the industrial sector witnesses a more sustained pickup.
Moving on to the agriculture side, the performance has been rather impressive given the high base of last year and the erratic monsoons witnessed this year. The agricultural sector has raked up an impressive 3.8% and 3.2% in the first two quarters. While the performance up until now has been impressive, the second half is likely to suffer from lower production levels as sowing of important kharif crops has been lower in the current year. However it is crucial to note that agricultureal output still remains dependent on yearly monsoon rains. At present, approximately 60% of the land remains rain fed and any departure of rains from its historical patterns affects the overall output. There is also a need for large scale use of technology to improve acreage of crops and make them more resillient of pests and insects. Usage of genetacially
modified crops, though controversial, can be a possible solution to the problem once farmers are convinced of its benefits. Lastly, the Indian agricultural sector is woefully short of adequate storage facilities. Inadequate power supply and consequently the lack of cold storage facilities result in almost 40% of total fruits and vegetables being wasted before reaching the markets. A quick resolution to these issues can give an immediate boost of incomes and consumption in the rural economy.
A closer look at the expenditure side estimates of GDP shows that demand still remains feeble. Private consumption growth stood at 5.7% for the first half. While data on private consumption indicates some revival of demand, it is at odds with other lead indicators such as consumer durables that have contracted almost through the year. Recovery in investments still remains a concern as growth in fixed capital formation grew by a meagre 0.2% in the Q2 of FY15 after expanding 7 % in Q1. Government expenditure, which contributes around 11% of the GDP, grew at an impressive 9.6% in Q2FY15 as compared to 9.1% in the previous quarter due to a pick up in expenditure after the budget and
State of the Indian Economy An opportunity for revival 7
a favourable base effect. Overall the demand side estimates corroborate the picture of an economy that was slowly improving.
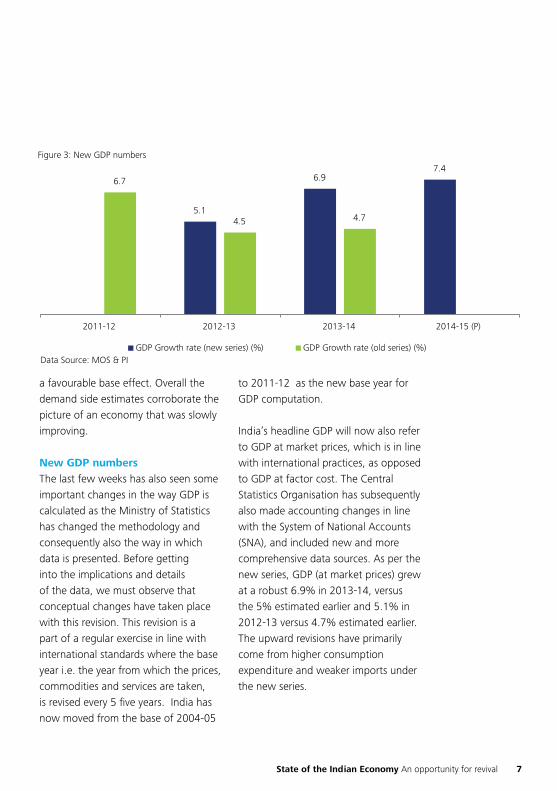
New GDP numbers The last few weeks has also seen some important changes in the way GDP is calculated as the Ministry of Statistics has changed the methodology and consequently also the way in which data is presented. Before getting into the implications and details of the data, we must observe that conceptual changes have taken place with this revision. This revision is a part of a regular exercise in line with international standards where the base year i.e. the year from which the prices, commodities and services are taken, is revised every 5 five years. India has now moved from the base of 2004-05
to 2011-12 as the new base year for GDP computation.
India’s headline GDP will now also refer to GDP at market prices, which is in line with international practices, as opposed to GDP at factor cost. The Central Statistics Organisation has subsequently also made accounting changes in line with the System of National Accounts (SNA), and included new and more comprehensive data sources. As per the new series, GDP (at market prices) grew at a robust 6.9% in 2013-14, versus the 5% estimated earlier and 5.1% in 2012-13 versus 4.7% estimated earlier. The upward revisions have primarily come from higher consumption expenditure and weaker imports under the new series.
Figure 3: New GDP numbers
5.1
6.97.4
6.7
4.5 4.7
2011-12 2012-13 2013-14 2014-15 (P)
GDP Growth rate (new series) (%) GDP Growth rate (old series) (%)Data Source: MOS & PI

8
Further, there are improvements in the way data is collected as there is a more comprehensive coverage of the corporate sector (for both manufacturing and services) through the use of the annual accounts of companies filed with the Ministry of Corporate Affair (in the MCA 21 database). Data on manufacturing and services now comes from almost the universe of approximately 5 lakh companies as compared to only 2500 earlier.
Looking at the details of the revised data we see that the share of manufacturing has been increased significantly, to 17.3% from 12.9% earlier. Mining’s share has also been increased with industry now accounting for 30.7% of GDP from 24.7% estimated earlier. The service sector’s share has reduced to 51.3% from 57% earlier led by a smaller share of the Trade, hotels & restaurants component.
Using the new methodology, the government has put out an advance estimate for India’s growth at 7.4% Year on Year (YoY) from 6.9% in the
previous year. Quarterly estimates have also been released under the new methodology where the government has used tax data for collecting information on services while private corporate performance has been included for compiling industrial estimates.
The Q3FY15 quarter GDP grew by 7.5% following 8.2% in Q2 and 6.5% in Q1 under the new methodology. The Financial Year To Date (FYTD) GDP growth now stands at 7.4% and given the full year expectation of a 7.4% growth, the last quarter growth of FY15 would also have to be 7.4%. A careful look at the disaggregated data would suggest that the higher growth would be driven by domestic demand while government final expenditure and investments are also expected to grow.
Overall, these latest set of numbers raise a lot of questions on the possible slack in the economy and the potential rate of growth, the extent of upmove under the new methodology. Also, while the transition to the new method
State of the Indian Economy An opportunity for revival 9
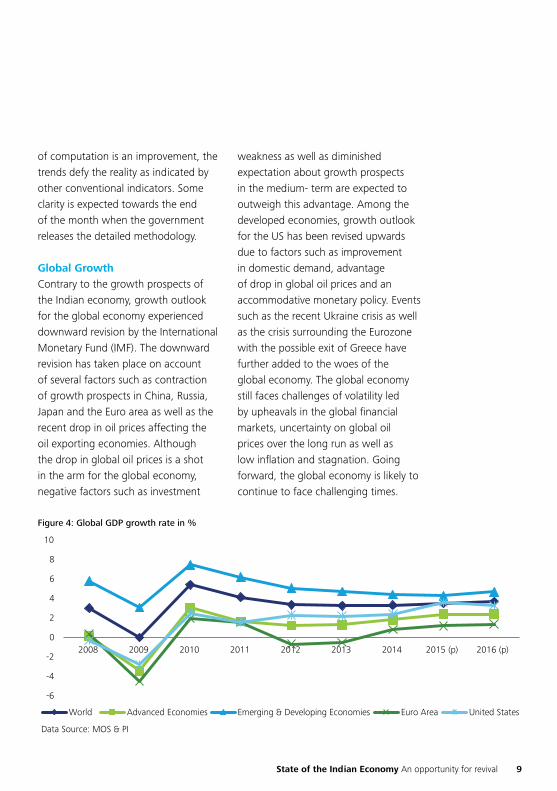
Figure 4: Global GDP growth rate in %
-6
-4
-2
0
2
4
6
8
10
2008 2009 2010 2011 2012 2013 2014 2015 (p) 2016 (p)
World Advanced Economies Emerging & Developing Economies Euro Area United States
Data Source: MOS & PI
of computation is an improvement, the trends defy the reality as indicated by other conventional indicators. Some clarity is expected towards the end of the month when the government releases the detailed methodology.
Global GrowthContrary to the growth prospects of the Indian economy, growth outlook for the global economy experienced downward revision by the International Monetary Fund (IMF). The downward revision has taken place on account of several factors such as contraction of growth prospects in China, Russia, Japan and the Euro area as well as the recent drop in oil prices affecting the oil exporting economies. Although the drop in global oil prices is a shot in the arm for the global economy, negative factors such as investment
weakness as well as diminished expectation about growth prospects in the medium- term are expected to outweigh this advantage. Among the developed economies, growth outlook for the US has been revised upwards due to factors such as improvement in domestic demand, advantage of drop in global oil prices and an accommodative monetary policy. Events such as the recent Ukraine crisis as well as the crisis surrounding the Eurozone with the possible exit of Greece have further added to the woes of the global economy. The global economy still faces challenges of volatility led by upheavals in the global financial markets, uncertainty on global oil prices over the long run as well as low inflation and stagnation. Going forward, the global economy is likely to continue to face challenging times.
10
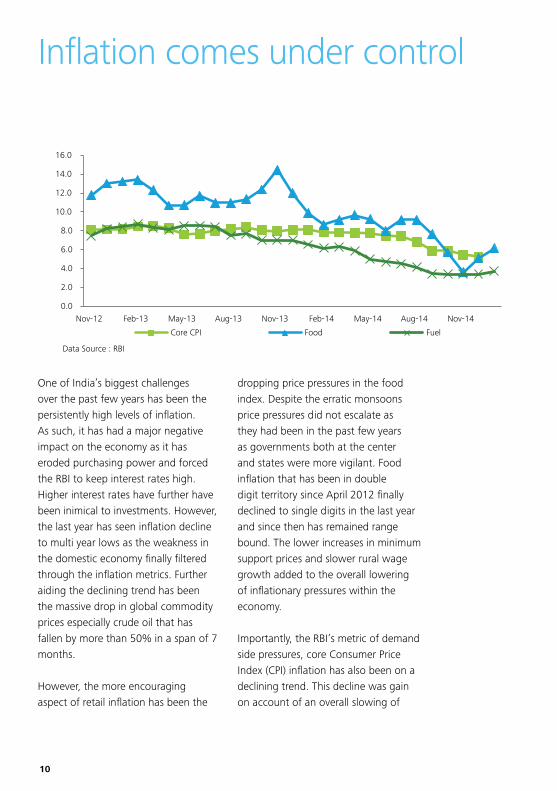
One of India’s biggest challenges over the past few years has been the persistently high levels of inflation. As such, it has had a major negative impact on the economy as it has eroded purchasing power and forced the RBI to keep interest rates high. Higher interest rates have further have been inimical to investments. However, the last year has seen inflation decline to multi year lows as the weakness in the domestic economy finally filtered through the inflation metrics. Further aiding the declining trend has been the massive drop in global commodity prices especially crude oil that has fallen by more than 50% in a span of 7 months.
However, the more encouraging aspect of retail inflation has been the
dropping price pressures in the food index. Despite the erratic monsoons price pressures did not escalate as they had been in the past few years as governments both at the center and states were more vigilant. Food inflation that has been in double digit territory since April 2012 finally declined to single digits in the last year and since then has remained range bound. The lower increases in minimum support prices and slower rural wage growth added to the overall lowering of inflationary pressures within the economy.
Importantly, the RBI’s metric of demand side pressures, core Consumer Price Index (CPI) inflation has also been on a declining trend. This decline was gain on account of an overall slowing of
0.0
2.0
4.0
6.0
8.0
10.0
12.0
14.0
16.0
Nov-12 Feb-13 May-13 Aug-13 Nov-13 Feb-14 May-14 Aug-14 Nov-14
Core CPI Food Fuel
Data Source : RBI
Inflation comes under control

State of the Indian Economy An opportunity for revival 11
demand pressures as service categories that have historically seen constrained supplies. Overall, core inflation declined by almost 300 basis points from January to December of 2014.
Monetary Policy turns accommodativeThe RBI on its part stuck to its guns for most of the last year and kept its key policy rate, the repo, at an elevated level of 8%. Earlier in the calendar year, the central bank had adopted recommendations of the Urjit Patel committee and put in place a rule based system for monetary policy making. The RBI set its sight on rolling targets for CPI inflation, with the first being 8% by January 2015 and 6% by January 2016. Further, it made it very clear that elevated levels of inflation had been a major cause of slowing growth in the economy and further
was inimical to the country’s long term growth prospects. So while inflationary pressures were on the decline, the RBI maintained its stance of a high policy rate explaining to market participants that it was essential to bring down inflation in a sustained way. Towards the end of the year, the RBI started to ease its stance by indicating that a rate cut was a distinct possibility if deflationary pressures continued to take shape. Finally, the RBI initiated its rate cutting cycle with a token 25 basis points cut on January 15th 2015. It also added that further cuts could be on the horizon but that decision would be taken on the basis of the evolving price dynamics and the kind of budget unveiled by the government. We expect another 50-75 basis points cut in the benchmark repo over the course of the current calendar year.
4%
6%
8%
10%
12%
CPI Repo rateData Source: RBI
Figure 6: Consumer price index (%)

12
Capital markets continue bullish trend
As is the case whenever there is a turn in the economy, capital markets take the lead as they price in future improvement in the macroeconomic fundamentals of the economy. The clear mandate given to the central government and the business friendly reforms expected as a result of this has raised the expectation of both domestic and foreign investors. Further, factors such as rising growth prospects, contraction in Current Account Deficit
(CAD) as well as the recent stabilization of the rupee have all contributed to this positive sentiment. Investors have been betting heavily on the economy which has led to high growth of the capital markets. The SENSEX has witnessed a consistent rise in 2014 with a growth of around 40%, reaching record highs and crossing the 29,000 mark in January 2015. The government has done its fair share to support this optimism by further opening sectors
Figure 7: Movement of Sensex (Apr'13- Feb15)
155001750019500215002350025500275002950031500
Apr-13 Jun-13 Aug-13 Oct-13 Dec-13 Feb-14 Apr-14 Jun-14 Aug-14 Oct-14 Dec-14 Feb-15
Data Source: SEBI

State of the Indian Economy An opportunity for revival 13
such as defense, telecommunications, construction services as well as insurance. These developments have further injected a sense of optimism in investors. Mutual funds have pumped in around INR 6 trillion as compared to INR 4.8 trillion in the previous year showing a growth of 28%. It is encouraging to note that the domestic MFs have not been completely overshadowed by Foreign Institutional Investments (FII).
The FII inflows have replicated the overall mood of the global investors towards the Indian market. After experiencing volatile inflows in the previous year, FII inflows have been much more consistent in FY 2014-15, providing reasonable stability in the market as compared to last year. FIIs have poured in roughly US$ 42.4
billion in calendar year 2014 and continued with this streak even in the first two months of 2015 as they poured in another US$ 7.2 billion in 2015. Moving ahead, the upcoming budget could be an eventful one, giving more reason to cheer with some business friendly reforms. Hence, betting on higher profitability in the future, investors are bullish about the Indian market. Within the FIIs, debt inflows have outsized equity inflow with debt inflow at US$ 23.8 billion and equity inflow at US$ 14.5 billion in FY 2014-15.
Policy initiatives such as allowing foreign investors to invest in non-convertible redeemable preference shares or debentures issues by Indian companies as well as allowing foreign investors to take part in buyback of
Figure 8: FII inflows in 2014-15
-6
-4
-2
0
2
4
6
Apr-13 Jun-13 Aug-13 Oct-13 Dec-13 Feb-14 Apr-14 Jun-14 Aug-14 Oct-14 Dec-14
Equity (US$ billion) Debt (US$ billion)
Data Source: SEBI & NSDL

14
securities and disinvestment of shares by the Central and state governments is expected to further increase FII inflows in the coming months. The Indian market has been outperforming most of the global markets in 2015. The Indian capital markets did well to go through the initial bout of volatility in H1 of FY14 and recover smartly in H2 to finish on a high. This positive sentiment continued through 2014-15 and the Indian capital
markets have experienced consistent and stable growth in 2014-15. Factors such as the recent monthly bond-buying stimulus announced the European Central Bank (ECB) to the tune of Euro 1 trillion as well as Japan’s recent announcement of further quantitative easing (QE) is expected to increase liquidity in the global markets. The flow of this liquidity can be directed towards the Emerging Market and Developing Economies (EMDE) as
Figure 9: Performance of global stock markets in 2013 & 2014
-60%
-40%
-20%
0%
20%
40%
60%
Growth in 2014 Growth in 2015 (Till Feb'13)India China Russia Brazil South Africa Indonasia Turkey USA Japan UK Euro Area
Data Source: Bloomberg

State of the Indian Economy An opportunity for revival 15
they offer higher returns. With higher growth prospects than a majority of EMDEs, the Indian market is poised to grow further in the coming months.
Foreign Direct Investment (FDI) inflows have picked up this year and have been much more consistent over the last seven quarters. Inflows have barely fluctuated in the first three quarters with funds of US$ 8.3 billion in Q1, US$ 8.5 billion in Q2 and US$ 8.4 billion in Q3 of 2014-15 coming in respectively. In terms of the sector specific flow, at US$ 2.5 billion the telecommunications sector received the highest FDI inflows with a percentage share of 13%. Factors such as the 3G and 4G spectrum auction as well as investment in network rollout have led to this growth in investment. This is followed by the services sector with FDI inflows to the tune of US$ 1.8 billion.
The overall Infrastructure sector had long been starving for fresh investment with an investment requirement of around US$ 1 trillion. The government’s cabinet has recently cleared a proposal which allows 100% FDI into railway infrastructure. The government has further initiated easier FDI norms for the construction sectors which allow 100 % overseas investment. Another major decision has been to further open up the defense sector with foreign investment cap of 49%. Further, the Union Cabinet has cleared a bill, still pending clearance, to further open up the insurance sector by increasing the foreign investment cap from 26% to 49%. All these reforms have further given a boost to the investor sentiment and higher foreign investment in critical sector can be expected in the coming months giving a boost to the overall growth prospects of the economy.
Figure 10: Foreign Direct Invetsment Inflows (US$ billion)
-1
1
3
5
7
9
11
13
15
Q1 Q2 Q3 Q4 Q1 Q2 Q3 Q4 Q1 Q2 Q3 Q4 Q1 Q2 Q3
2011-12 2012-13 2013-14 2014-15
Data Source : RBI

16
The onset of a global slowdown has had some positive impact on the Indian economy as one of the major pain points, the external sector, has improved markedly over the course of the last year. The improvement has come on the back of a massive contraction of India’s imported energy costs. A closer look at the details shows that total imports have started growing from Q2 of FY15 after contracting in Q1, bringing overall import growth to 3.4% in the first nine months of FY15. However, there is a silver lining to the increasing imports as the majority of the growth has come from the non-oil ex-gold segment. Contrary to some of the other lead indicators, this shows that domestic growth is perhaps turning around as demand for imports have gone up excluding the effects of oil and gold. The figures show that
while oil imports have contracted by 4.5% in the first three quarters, gold imports have risen by 3.2% and non-oil ex gold portion has risen by 8.2%.
A look at the gold import figures the year show that gold imports shot up in September, October and November mainly due to the onset of the festive season. There was fear about the possibility of a further surge in gold import after the government revoked the 80:20 rule in November 2014, wherein, out of the total gold imported, 20% had to be re-exported. Gold imports did not respond to this change and have in fact seen a decline in recent months and are expected to remain subdued in Q4 of 2014-15.
Looking at the other side, exports have registered a growth of 2.3% in
Figure 11: Quarterly trade figures (US$ Bn.)
0
10
20
30
40
50
60
0
20
40
60
80
100
120
140
Q1 Q2 Q3 Q4 Q1 Q2 Q3 Q4 Q1 Q2 Q3 Q4 Q1 Q2 Q3
2011-12 2012-13 2013-14 2014-15Export Import Trade BalanceData Source: RBI
External Sector continues to improve

State of the Indian Economy An opportunity for revival 17
the period from April to December. After an impressive performance in Q1 where exports grew by 7.3%, exports witnessed a steady decline with moderation in growth to 1.0% in Q2 and contraction in exports to -1.0% in Q3. The decline is exports can be largely attributed to the moderation in growth and economic activity of the global economy. Major events such as the Ukraine crisis, the increased possibility of recession in the Eurozone and a slowing Chinese economy have caused the global economy to slow and have further led to a crash in some important commodity prices. Exports have also contracted on account of the major fall in oil prices as oil forms a major component of India’s overall export basket.
Overall trade deficit has risen by 5.8% Y-o-Y in FY15. In line with trends in exports and imports after a contraction in Q1 of 2014-15, trade deficit has bloated in Q2 and Q3. However, it is expected to remain under control over the remainder of the current fiscal year.
The Current Account has also shown improvement for a second year running and the CAD/GDP ratio expected to hit a low of 1.3% in FY 2014-15. In terms of CAD, India is comfortably placed with investment inflows more than sufficient in financing the deficit. Another major contributory factor has been the trade in services. The Services sector has seen consistent trade surplus in the last few years and FY 2014-15 is no exception. Exports of services grew
Figure 12: Non-oil non gold imports (growth rate %)
-20
-15
-10
-5
0
5
10
15
20
25
30
Apr-13 Jun-13 Aug-13 Oct-13 Dec-13 Feb-14 Apr-14 Jun-14 Aug-14 Oct-14 Dec-14
Data Source: Ministry of Commerce
18
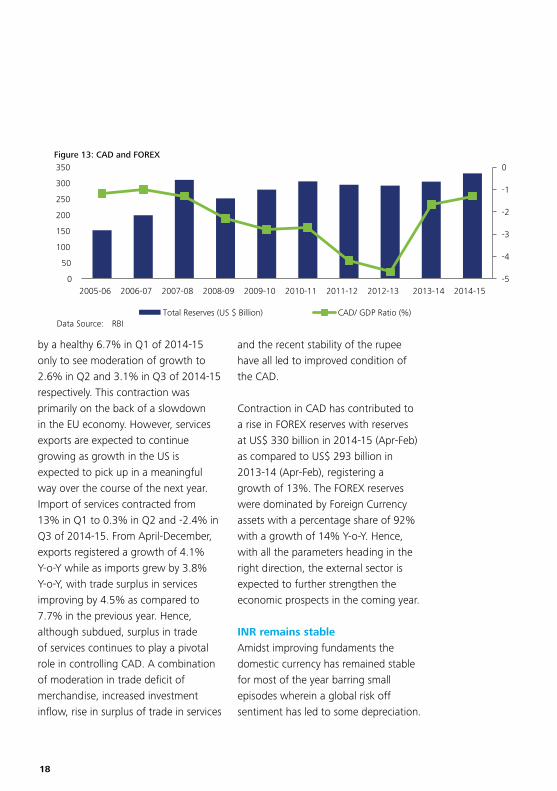
by a healthy 6.7% in Q1 of 2014-15 only to see moderation of growth to 2.6% in Q2 and 3.1% in Q3 of 2014-15 respectively. This contraction was primarily on the back of a slowdown in the EU economy. However, services exports are expected to continue growing as growth in the US is expected to pick up in a meaningful way over the course of the next year. Import of services contracted from 13% in Q1 to 0.3% in Q2 and -2.4% in Q3 of 2014-15. From April-December, exports registered a growth of 4.1% Y-o-Y while as imports grew by 3.8% Y-o-Y, with trade surplus in services improving by 4.5% as compared to 7.7% in the previous year. Hence, although subdued, surplus in trade of services continues to play a pivotal role in controlling CAD. A combination of moderation in trade deficit of merchandise, increased investment inflow, rise in surplus of trade in services
and the recent stability of the rupee have all led to improved condition of the CAD.
Contraction in CAD has contributed to a rise in FOREX reserves with reserves at US$ 330 billion in 2014-15 (Apr-Feb) as compared to US$ 293 billion in 2013-14 (Apr-Feb), registering a growth of 13%. The FOREX reserves were dominated by Foreign Currency assets with a percentage share of 92% with a growth of 14% Y-o-Y. Hence, with all the parameters heading in the right direction, the external sector is expected to further strengthen the economic prospects in the coming year.
INR remains stableAmidst improving fundaments the domestic currency has remained stable for most of the year barring small episodes wherein a global risk off sentiment has led to some depreciation.
Figure 13: CAD and FOREX
-5
-4
-3
-2
-1
0
0
50
100
150
200
250
300
350
2005-06 2006-07 2007-08 2008-09 2009-10 2010-11 2011-12 2012-13 2013-14 2014-15
Total Reserves (US $ Billion) CAD/ GDP Ratio (%)Data Source: RBI

State of the Indian Economy An opportunity for revival 19
The crucial point to note is that while the Rupee has depreciated against the dollar, it has in fact appreciated against most of the other major global currencies. With record inflows into the debt markets coupled with a lower imports figure, the Rupee was poised for appreciation but for the watchful eye of the RBI. The RBI has managed the domestic currency so as to keep it from unduly responding to knee jerk capital inflows and outflows. Accordingly, the currency has seen a high of close to 58 to a dollar in May after the union elections and now
Figure 14: Exchange rate - INR against the USD
50
55
60
65
70
Apr-13 Sep-13 Feb-14 Jul-14 Dec-14
Figure 15: Exhchange rate of rupee against major currencies (Apr'14-Feb'15)
-4.2%
3.5%
13.8%
8.9%
-10%
-5%
0%
5%
10%
15%
USD GBP EURO YEN
USD GBP EURO YEN
Rupee has appriciated against all the major global currencies apart

20
trades in a band of 61.5 to 63 to a dollar.
It is important to note that India continues to have a huge trade deficit which is bridged by a combination of fickle capital flows and services exports and has inflation that is much higher than the developed economies. In line with these fundamentals an appreciation of the domestic currency could undermine external stability in the future. Overall, expect the Rupee to remain stable and trade in the range of 61.50 to 63.50 against the US dollar for most of the year with a possibility of it touching 64 in response to a possible rate hike by the US Federal Reserve.

State of the Indian Economy An opportunity for revival 21
Figure 16: Fiscal Deficit (% of GDP)
2.5
6.06.5
4.8
5.7
4.94.5
4.13.6
0.0
1.0
2.0
3.0
4.0
5.0
6.0
7.0
FY08 FY09 FY10 FY11 FY12 FY13 FY14 FY15 (E ) FY16 (E )
Data Source: Economic Survey
Fiscal Deficit Adhering to targets
The government continues to adhere to the fiscal roadmap according to the all-important Fiscal Responsibility and Budget Management (FRBM) targets. The last year has seen the government’s fiscal fortunes swing from positive to negative. On the positive side, the global crash in crude oil prices has meant that the government’s subsidy outgo will lessen considerably. Further, bringing diesel prices at parity with the market in the first half of the year and subsequently increasing taxes to limit the fall in domestic prices is also helping shore up government finances.
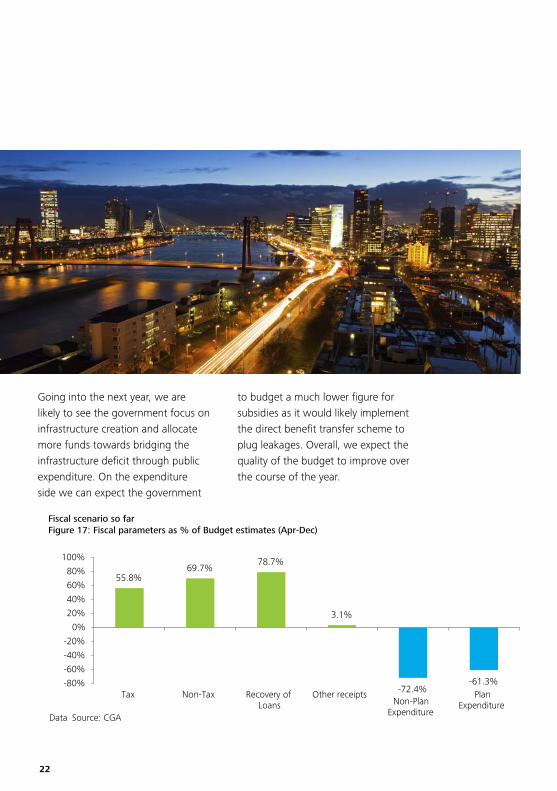
On the negative side, tax revenues have disappointed as the lack of growth in the manufacturing sector has meant lower revenues. In the first nine months of the fiscal year, the government had already run up 100% of its budgeted fiscal deficit as expenditures were on track while tax revenues lagged
behind. A closer look into the detail shows that up until December, tax collections had only reached 58.2% of the budgeted amount while expenditure had touched 68.9% of the budgeted amount. However, as is the case every year, the deficit level will go down in the coming months as disinvestment picks up and ministries cut back on their expenditures.
We expect the government to meet its fiscal target of 4.1% of GDP this year despite lower revenue growth and target 3.6% for next year. As such, the government would enjoy savings on multiple fronts this year on account of food subsidy as there ae still issues being ironed out on food security act. Savings on fuel subsidy, a late push to disinvestments and the RBI paying out a dividend earlier in the year would help the government in achieving its target.
22
Fiscal scenario so farFigure 17: Fiscal parameters as % of Budget estimates (Apr-Dec)
55.8%69.7%
78.7%
3.1%
-72.4%-61.3%-80%
-60%
-40%
-20%
0%
20%
40%
60%
80%
100%
Tax Non-Tax Recovery ofLoans
Other receiptsNon-Plan
Expenditure
PlanExpenditure
Data Source: CGA
Going into the next year, we are likely to see the government focus on infrastructure creation and allocate more funds towards bridging the infrastructure deficit through public expenditure. On the expenditure side we can expect the government
to budget a much lower figure for subsidies as it would likely implement the direct benefit transfer scheme to plug leakages. Overall, we expect the quality of the budget to improve over the course of the year.

State of the Indian Economy An opportunity for revival 23
Make in India
Since coming to power last year the new government’s main concern has been the revival of growth in the Indian economy and crucially enough, it has chosen to give the Industrial sector a structural push to achieve its goal. The government announced the ‘Make in India’ initiative, which intends to make manufacturing the engine of growth and also generate employment. Under the initiative there would be increased focus on new processes, new infrastructure, new sectors and creating a new mindset in order to increase the share of manufacturing in GDP to 25% from the current 16%. Further, the government has set its sight on improving India’s ease of doing business ranking and identified 25 key sectors such as automobiles, aviation, IT, construction and textiles among other to achieve its stated goals.
The ProgressIn line with the stated objectives of the new initiative the government has initiated many reforms and tried to bring in efficacy through administrative changes designed to help the manufacturing sector. Some of the important reforms have been undertaken in an attempt to improve the ease of doing business have been given the attached table and as stated by the government more detailed plans are under the works.
Important measures undertaken under Make in India
Industrial license validity extended to three years
E-filling of Industrial license
Online environmental clearances
Self-certification for all non-risk , non-hazardous businesses
Approval accorded to 17 national investment zones
FDI in defence raised from 26% to 49%
100% FDI allowed in defence sector for modern technology
Portfolio investment in defence sector permitted upto 24% under automatic route
FDI in construction further liberalized
Source:- Government announcements and media reports
ExpectationsWhile the intent is clear and the start seems to be impressive, the initiative deserves some more discussion. The policy in its current avatar lacks crucial operational details as to how the ambitious targets under scheme will be achieved. While the government has put up a website and is organising different forums for discussion, manufacturing is unlikely to take off in the absence of specific policies on how the government intends to promote the sector. Accordingly, we expect the government to come up with incentives and proposals in the form of tax exemptions and excise reductions for particular sectors. Further, initiatives in

24
the form of a coherent export policy for the sector with the government helping out in identifying key countries and markets would also be a big positive. Lastly, incentives for adoption of new technology, creating new products and manpower skilling programs would go a long way in reinvigorating the sector.
These programs, if undertaken can lead to a huge improvement in the supply side infrastructure of the economy.
Overall improvements in infrastructure, that is necessary for the manufacturing sector to grow, can also help get rid of the frictions on the supply side while also reducing costs. Access to newer regions within the country can open up newer markets and bring in new demand into the market. Lastly, important elements from our import basket can possibly be manufactured in India, reducing cost and time involved.

State of the Indian Economy An opportunity for revival 25
Overall Outlook and Expectations from the budget
The last year saw India enter a sweet spot as growth rebounded, inflation declined and the external accounts came under control. From then on there has been a lot of positivity built around the India growth story and India seems to be poised to enjoy another spurt in growth. However, to convert this promise into tangible reality we need the government to institute the correct set of reforms all that would set India on the virtuous cycle of growth. Accordingly we outline some of the major areas of focus for the government.
Address major structural issuesAt the outset, we must note that the government has taken a number of decisions outside of the budget that has helped both global and domestic investors regain confidence in the Indian economy. However, it is imperative that policy makers make the most of the current situation address the major structural issues affecting the economy. It is in this context that the upcoming budget holds a lot of promise in coming up with a budget that would address the chronic supply side constraints of the economy. While the current decline in inflation is on account of global commodity prices and weakness in domestic demand, the government is likely to bring in measures that would help in creating a benign inflationary
environment regardless of the temporary factors.
Increase focus on the Agricultural sectorMore investment in the agricultural sector by setting up irrigation networks and lessening dependence on monsoons, ensuring the creation of a one India market to iron out state wise distortions and a meaningful push to crop insurance would go a long way in addressing some of the structural supply side bottlenecks of the agricultural sector. A push to modernize agriculture and creation of storage facilities would have an impact on inflation and give a boost of rural farm incomes.
Push to infrastructureAnother focus area has to be bridging of the infrastructure deficit in the economy by allocating more funds to the creation of capital assets. Creation of a new public partnership model is a key ingredient in kick starting the capex cycle as the current Private Public Partnership (PPP) model has left the private sector disillusioned. Better infrastructure would also give an impetus to the manufacturing sector thereby aiding the larger goal of make in India. There could be a rationalization of some taxes to help a particular segment develop within the manufacturing sector.

26
More clarity on the Goods and Services TaxIn line with the longer term objectives of the government we would expect some announcements to be made in line with the timely implementation of the Goods & Services Tax (GST). This could include widening the ambit of services that would be taxed and lower excise rates. This would give a boost to growth by making manufacturing more competitive while at the same time boost investor morale.
Adhere to Fiscal target Adherence to the fiscal targets can be expected with improvements in the quality of the budget deficit. Higher expenditure on capital creation and lower outgo on current expenditure is the need of the hour. This could enhance investor confidence over the longer run and could result also result in an upgrade in India’s sovereign credit rating in the coming years.
Make in India and Smart CitiesLastly, a push to the manufacturing sector and furthering the creation of smart cities can set India on the path to higher growth. Specific and targeted developmental policies with support for exports (including help in targeting) can possibly help growth in the manufacturing sector touch double digit levels while also alleviating some
important supply side bottlenecks. Creation of smart cities can be a boon for the fast urbanizing Indian population would also help drive overall growth in the economy by bringing in more efficient practices and reducing wastage to a minimum. We can expect the government to allocate higher funds towards the smart city project.
Progress in these areas is likely to have a dual impact of increasing confidence in the economy while also raising the potential rate of growth (rate of growth at which Inflation remains with the comfort zone of the monetary authority) for the economy.

State of the Indian Economy An opportunity for revival 27
MumbaiIndiabulls Financial CentreTower 3, 27th-32nd Floor,Senapati Bapat Marg, Elphinstone Road (W),Mumbai – 400013Tel: + 91 (022) 6185 4100 Fax: + 91 (022) 6185 4101
BangaloreDeloitte Centre, Anchorage II,100/2, Richmond Road,Bangalore – 560 025Tel: +91 (080) 6627 6000Fax: +91 (080) 6627 6409
Delhi NCRBuilding 10, Tower B, 7th Floor, DLF Cyber City, Gurgaon –122 002Tel : +91 (0124) 679 2000Fax : + 91 (0124) 679 2012
ChennaiNo.52, Venkatanarayana Road, 7th Floor, ASV N Ramana Tower, T-Nagar, Chennai – 600 017Tel: +91 (044) 6688 5000Fax: +91 (044) 6688 5019
KolkataBengal Intelligent Park Building, Alpha, 1st floor, Plot No –A2, M2 & N2, Block – EP & GP Sector – V, Salt Lake Electronics Complex, Kolkata - 700 091Tel : + 91 (033) 6612 1000Fax : + 91 (033) 6612 1001
Ahmedabad“Heritage” 3rd Floor, Near Gujarat Vidyapith, Off Ashram Road, Ahmedabad – 380 014Tel: + 91 (079) 2758 2542Fax: + 91 (079) 2758 2551
Hyderabad1-8-384 & 385, 3rd Floor, Gowra Grand S.P. Road, Begumpet,Secunderabad – 500 003Tel: +91 (040) 4031 2600Fax:+91 (040) 4031 2714
VadodaraChandralok, 31, Nutan Bharat Society,Alkapuri, Vadodara – 390 007Tel: + 91 (0265) 233 3776Fax: +91 (0265) 233 9729
Pune706, ICC Trade Tower,B Wing, 7th Floor,Senapati Bapat Road, Pune – 411016Tel : +91 (020) 6624 4600Fax : + 91 (020) 6624 4605
Contacts

Deloitte refers to one or more of Deloitte Touche Tohmatsu Limited, a UK private company limited by guarantee (“DTTL”), its network of member firms, and their related entities. DTTL and each of its member firms are legally separate and independent entities. DTTL (also referred to as “Deloitte Global”) does not provide services to clients. Please see www.deloitte.com/about for a more detailed description of DTTL and its member firms.
This material and the information contained herein prepared by Deloitte Touche Tohmatsu India Private Limited (DTTIPL) is intended to provide general information on a particular subject or subjects and is not an exhaustive treatment of such subject(s). This material contains information sourced from third party sites (external sites). DTTIPL is not responsible for any loss whatsoever caused due to reliance placed on information sourced from such external sites.None of DTTIPL, Deloitte Touche Tohmatsu Limited, its member firms, or their related entities (collectively, the “Deloitte Network”) is, by means of this material, rendering professional advice or services. The information is not intended to be relied upon as the sole basis for any decision which may affect you or your business. Before making any decision or taking any action that might affect your personal finances or business, you should consult a qualified professional adviser.
No entity in the Deloitte Network shall be responsible for any loss whatsoever sustained by any person who relies on this material.
©2015 Deloitte Touche Tohmatsu India Private Limited. Member of Deloitte Touche Tohmatsu Limited