state of the environment report 2010/2011 … · as with previous soer’s it is difficult to...
TRANSCRIPT

www.begavalley.nsw.gov.au
Bega Valley Shire Council Zingel Place PO Box 492 Bega NSW 2550
Phone (02) 6499 2222 Fax (02) 6499 2200 Email [email protected]
State of the environment report 2010/2011 Supplementary report November 2011
│i│
Contents
Introduction 1
Background ................................................................................................ 1
Integrated reporting .................................................................................... 1
Community Strategic Plan .......................................................................... 2
Driving forces 2
Population change ...................................................................................... 2
Weather and climate ................................................................................... 3
Landuse management ................................................................................ 3
Themes and indicators 4
1. Water management ................................................................................ 4
Water supply and sewerage management: ........................................ 4
On-site Sewage Management (OSM) ................................................ 7
Swimming water quality ................................................................... 10
2. Resource consumption ......................................................................... 12
Background ..................................................................................... 12
Solid waste management ................................................................ 12
Energy consumption ........................................................................ 19
3. Climate change strategy ....................................................................... 20
4. Land resources ..................................................................................... 20
Land quality ..................................................................................... 20
Land use and management ............................................................. 22
5. Biodiversity ........................................................................................... 23
Pest animal management ................................................................ 28
6. Our community ..................................................................................... 28
Air quality ......................................................................................... 28
Noise 29
Where to now? 30

State of the environment report 2010/2011
│1 │
Introduction In line with the principles of ecologically sustainable development (E.S.D.) Council has a major role to play in the protection of the Shire’s natural attributes for this and future generations. State of the Environment Reporting remains the best available mechanism to review and evaluate Council’s work plans in relation to environmental management and ESD and to ensure that new goals are set for coming years.
In this the 2010 /2011 Supplementary State of Environment (SoE) Report Council has moved towards the direction established in the 2010 SoE Report. This based future reports on the framework recommendations derived from the last Regional comprehensive SoER of reporting sustainability themes, driving forces and environmental indicators. Not only does this meet the current legal requirements but it also places Council in a stronger position in regard the reporting required in the new integrated reporting framework. This supplementary 2011 SoER establishes the reporting framework for future reports. The first comprehensive state of the environment report to address the new requirements in the NSW Local Government Amendment (Planning and Reporting) Act 2009 will be the 2012 SoER.
In terms of SoE reporting, under the new requirements, Council must prepare a SoE report that addresses the environmental objectives that are identified in the council’s ten year Community Strategic Plan (also introduced through the reforms). The new SoE requirements provide councils with increased flexibility compared to the previous more prescriptive system.
Background
The first formal assessment and reporting of environmental quality in the Shire occurred in 1994. State of Environment (SoE) reports have been completed annually, in accordance with the Local Government Act 1993, each year since.
In 1997 Council resolved to approach reporting on the state of our environment on a regional basis and the required comprehensive report was completed in conjunction with the Australian Capital Region. The 2000, 2004, 2008 and 2009 SoE Reports continued this process and will be used as Council’s baseline for reporting into the future.
All reports since 2000 are available on Council’s website.
www.begavalley.nsw.gov.au/Environment/Environment_Reports/Environment_Reports.htm
Integrated reporting
This report uses a framework based on three driving forces, six themes as well as a number of specific environmental indicators. Driving forces, such as population growth, land-use change, and climate variability, influence overall levels of production and consumption, which in turn exert pressures on the environment. The indicators variously
State of the environment report 2010/2011
│2 │
address environmental condition (or state), key pressures, and responses in the same way as all previous reports have.
Community Strategic Plan
Integrated Planning takes a long term outlook and is based around a Community Strategic Plan which has to reflect the community’s aspirations. The aim of this new integrated planning model is to ensure that councils are taking a strategic long term approach to their activities and that these reflect the desires of the communities they represent. In order to ensure this occurs the Integrated Planning Model advocates a ‘three tier’ hierarchy of plans consisting of a Community Strategic Plan, a Delivery Program and an Operational Plan.
One of the 5 Strategic Priorities identified in Council’s Community Strategic Plan, is ‘A Sustainable Place’. The key directions goals identified under the Sustainable Place Strategic Priority include:
· S1. Has natural areas that are protected and enhanced.
· S2. Manages development to minimise impact on the natural environment.
· S3. Is a community that lives in a clean and environmentally sustainable way
· S4. Towns and villages are visually unique & centred around a green spaces and natural areas.
· S5. Commits to total water cycle management
· S6. Plans for and takes action to minimise the impact of climate change and other natural events.
· S7. Maintains and improves the health of natural systems that support agriculture.
As Council’s Community Strategic Plan 2010-2030 was finalised in June 2011 it therefore cannot be reported against for 2010 / 2011. Although these key directions will be reported against specifically in future SoER many outcomes and key results areas of these key directions are reported in this 2010 / 2011 SoER.
Driving forces Population change
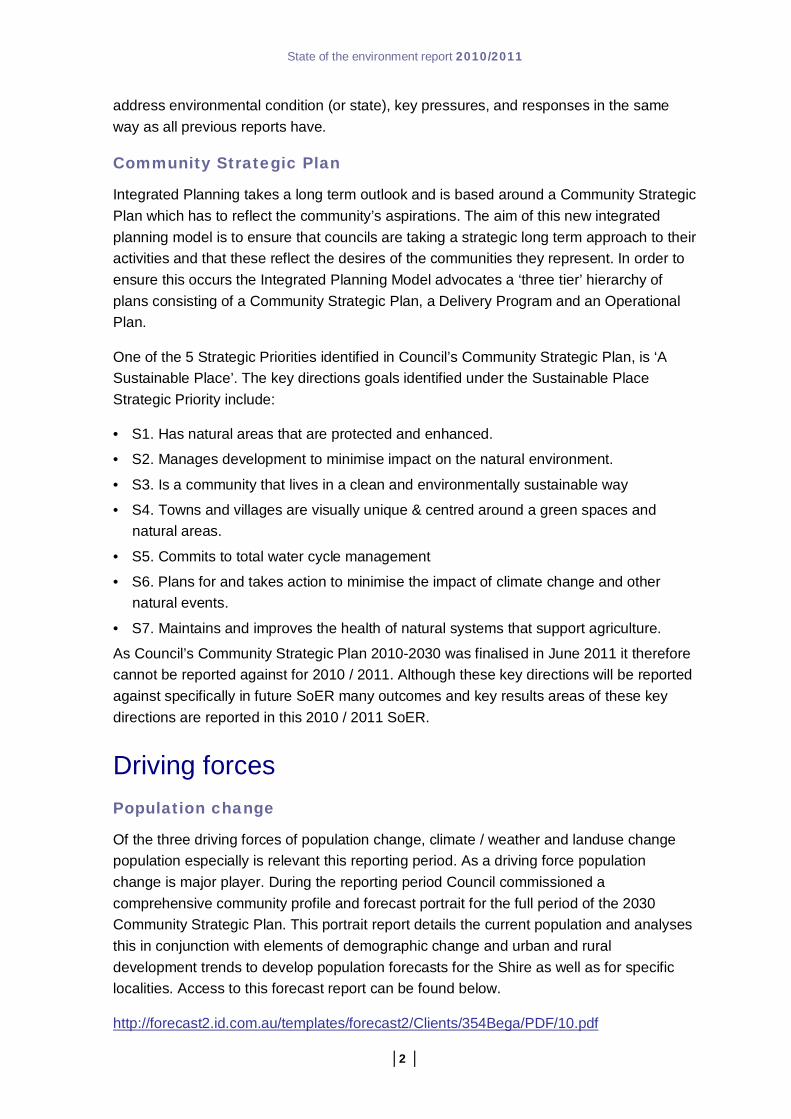
Of the three driving forces of population change, climate / weather and landuse change population especially is relevant this reporting period. As a driving force population change is major player. During the reporting period Council commissioned a comprehensive community profile and forecast portrait for the full period of the 2030 Community Strategic Plan. This portrait report details the current population and analyses this in conjunction with elements of demographic change and urban and rural development trends to develop population forecasts for the Shire as well as for specific localities. Access to this forecast report can be found below.
http://forecast2.id.com.au/templates/forecast2/Clients/354Bega/PDF/10.pdf
State of the environment report 2010/2011
│3 │
In terms of detail the population of the Shire for the reporting period was approximately 33,133. Although the 2011 Census will occur in the next reporting period, and will provide detailed population figures, the growth since the last reporting period is significant. The Forecast.id (2010) report predicts sustained growth in the Shire of 1.1%p.a.
Weather and climate
Weather and climate as driving forces are reported in the Comprehensive SoER, the last of which was 2008. Details of trends can be found in the 2008 SoER as well as the 2009 Supplementary Report.
Any change in climate and its variability is a potentially serious issue for regional and national economies particularly those with reliance on the agricultural sector, itself reliant on climate for continued profitability. In addition to natural climate variability is the issue of human induced climate change now known as the enhanced greenhouse effect. This is discussed in greater detail in the 2004 SoE report.
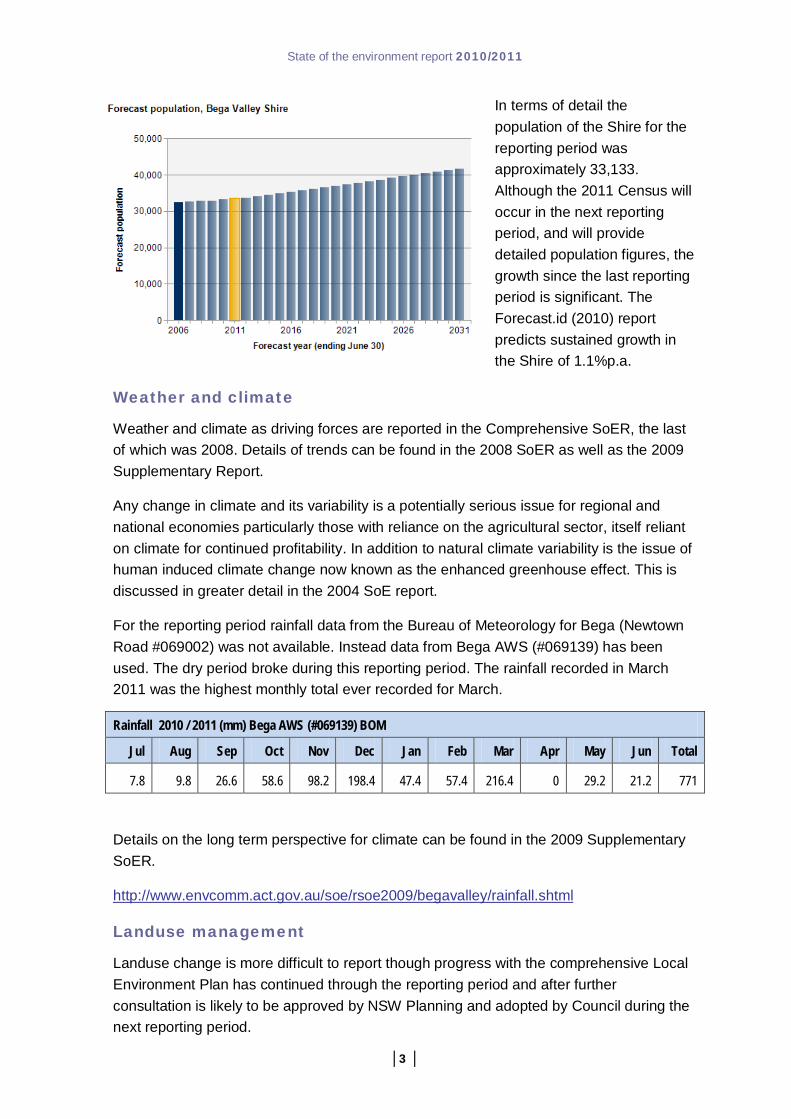
For the reporting period rainfall data from the Bureau of Meteorology for Bega (Newtown Road #069002) was not available. Instead data from Bega AWS (#069139) has been used. The dry period broke during this reporting period. The rainfall recorded in March 2011 was the highest monthly total ever recorded for March.
Rainfall 2010 / 2011 (mm) Bega AWS (#069139) BOM
Jul Aug Sep Oct Nov Dec Jan Feb Mar Apr May Jun Total
7.8 9.8 26.6 58.6 98.2 198.4 47.4 57.4 216.4 0 29.2 21.2 771
Details on the long term perspective for climate can be found in the 2009 Supplementary SoER.
http://www.envcomm.act.gov.au/soe/rsoe2009/begavalley/rainfall.shtml
Landuse management
Landuse change is more difficult to report though progress with the comprehensive Local Environment Plan has continued through the reporting period and after further consultation is likely to be approved by NSW Planning and adopted by Council during the next reporting period.
State of the environment report 2010/2011
│4 │
In general terms the majority of the Shire has simply been changed to the closest comparable zone available in the new Statewide standard template. This means that the majority of land owners wanting to develop or improve their properties will not be affected by the draft plan.
Where there are changes proposed the focus is on improving opportunities for economic development and jobs in the town centres, through the expansion of business, mixed use and industrial zones. Protection of productive agricultural land through the use of new RU-1 Primary Production and RU2 - Rural Landscape zonings is also proposed. The introduction of a “rural workers dwelling” definition as a permissible land use in the RU1- Primary Production and RU2 Rural Landscape zones is also proposed.
The establishment of minimum allotment sizes through the “Lot Size Map” is also proposed in the draft. This will determine subdivision and dwelling entitlements.
Recognition is given to environmentally sensitive land through the environmental zoning E3 -Environmental Management and E4- Environmental Living. Sensitive foreshore areas and bushland public reserves are proposed to be zoned E2- Environmental Conservation.
Themes and indicators 1. Water management
Water supply and sewerage management:
Assessment
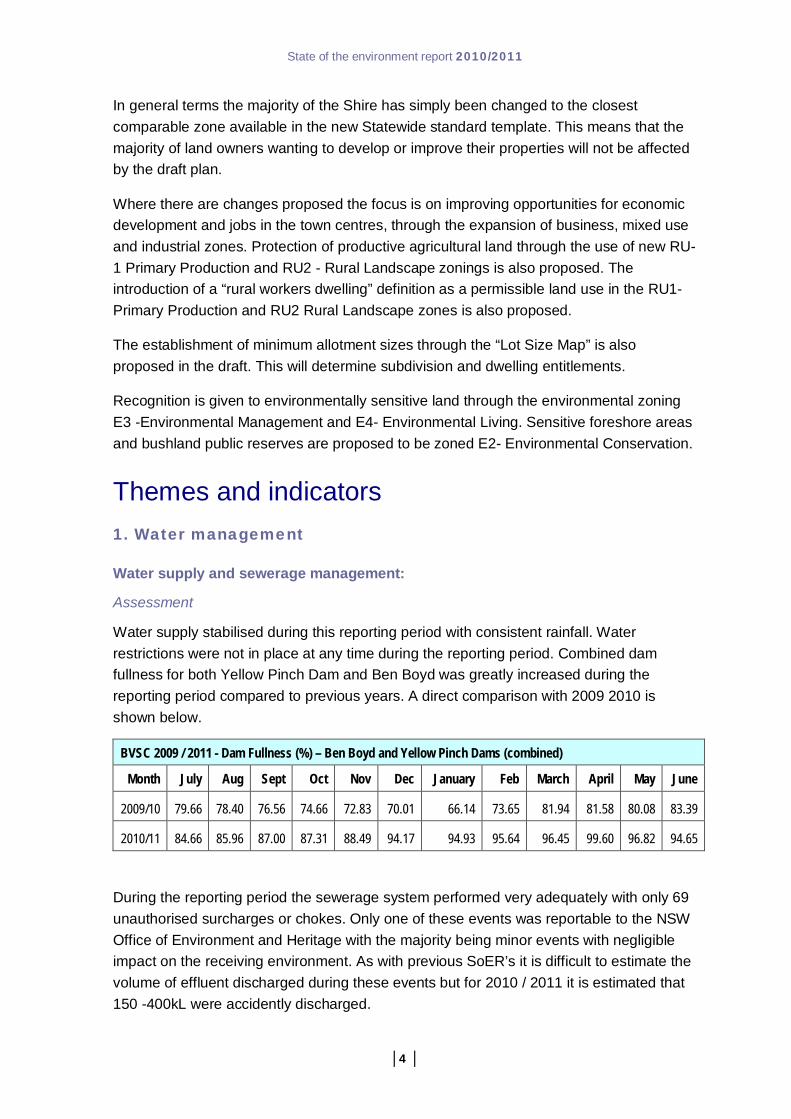
Water supply stabilised during this reporting period with consistent rainfall. Water restrictions were not in place at any time during the reporting period. Combined dam fullness for both Yellow Pinch Dam and Ben Boyd was greatly increased during the reporting period compared to previous years. A direct comparison with 2009 2010 is shown below.
BVSC 2009 / 2011 - Dam Fullness (%) – Ben Boyd and Yellow Pinch Dams (combined)
Month July Aug Sept Oct Nov Dec January Feb March April May June
2009/10 79.66 78.40 76.56 74.66 72.83 70.01 66.14 73.65 81.94 81.58 80.08 83.39
2010/11 84.66 85.96 87.00 87.31 88.49 94.17 94.93 95.64 96.45 99.60 96.82 94.65
During the reporting period the sewerage system performed very adequately with only 69 unauthorised surcharges or chokes. Only one of these events was reportable to the NSW Office of Environment and Heritage with the majority being minor events with negligible impact on the receiving environment. As with previous SoER’s it is difficult to estimate the volume of effluent discharged during these events but for 2010 / 2011 it is estimated that 150 -400kL were accidently discharged.

State of the environment report 2010/2011
│5 │
Council discharged 1450ML of treated effluent to the environment from Council’s 10 licensed Sewerage Treatment Plants in accordance with Pollution Control Licences and discharged 447ML to reuse schemes at Bermagui, Tathra, Kalaru, Bega, Tura Beach, Merimbula, Eden, Wolumla, Cobargo and Candelo.
Council’s efforts with trade waste connection to the sewerage systems across the Shire continued during the reporting period with 5 new trade waste connections occurring resulting in over 400 trade waste connections from industry and businesses across the Shire.
Works on addressing the water supply issues in the southern part of the Shire continued during the reporting period with construction of the Bega to Yellow Pinch water transfer pipeline nearing completion. The pipeline will be completed and commissioned early in the next reporting period and will pump water from Bega to the Tantawangalo / Kiah water system to supply villages and towns in the southern part of the Shire.
The pipeline, at a cost of $28 million, is one of the largest infrastructure projects in the Shires history. Funding included $10 million from the Federal Government’s Water for the Future initiative as part of the Water Smart Australia Program. It involved the construction of a 20 kilometre 450mm diameter pipeline, a new pump station at Bega and new reservoirs at Wolumla and Bega. Nearly 62,000 person hours went into construction works.
Planning for this project commenced in 1995 when the NSW Department of Public Works identified the need for a system that would improve water supply to the southern part of the Shire and reduce the reliance on water drawn from Tantawangalo Creek to fill Yellow Pinch Dam.
Further information regarding the commissioning of the project will be included in the next State of Environment Report and can also be found at the following link.
http://www.begavalley.nsw.gov.au/Environment/Water_Sewerage/bega-yellow_pipeline/pipeline.htm
State of the environment report 2010/2011
│6 │
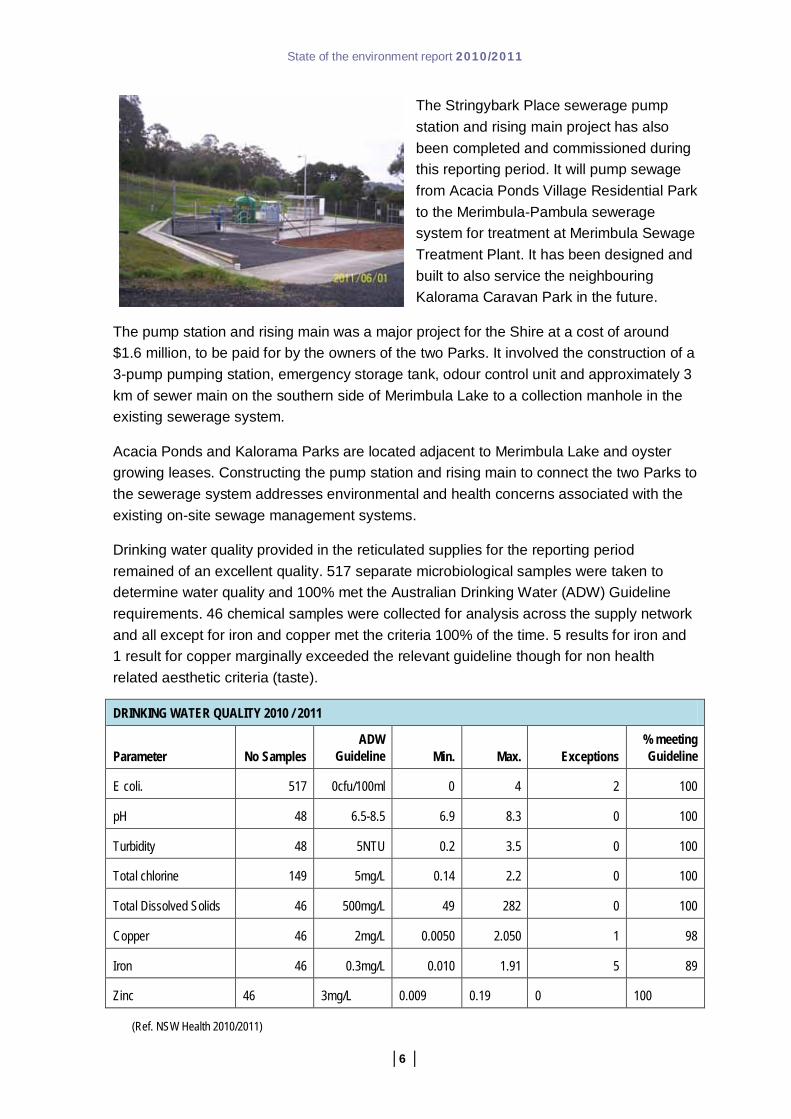
The Stringybark Place sewerage pump station and rising main project has also been completed and commissioned during this reporting period. It will pump sewage from Acacia Ponds Village Residential Park to the Merimbula-Pambula sewerage system for treatment at Merimbula Sewage Treatment Plant. It has been designed and built to also service the neighbouring Kalorama Caravan Park in the future.
The pump station and rising main was a major project for the Shire at a cost of around $1.6 million, to be paid for by the owners of the two Parks. It involved the construction of a 3-pump pumping station, emergency storage tank, odour control unit and approximately 3 km of sewer main on the southern side of Merimbula Lake to a collection manhole in the existing sewerage system.
Acacia Ponds and Kalorama Parks are located adjacent to Merimbula Lake and oyster growing leases. Constructing the pump station and rising main to connect the two Parks to the sewerage system addresses environmental and health concerns associated with the existing on-site sewage management systems.
Drinking water quality provided in the reticulated supplies for the reporting period remained of an excellent quality. 517 separate microbiological samples were taken to determine water quality and 100% met the Australian Drinking Water (ADW) Guideline requirements. 46 chemical samples were collected for analysis across the supply network and all except for iron and copper met the criteria 100% of the time. 5 results for iron and 1 result for copper marginally exceeded the relevant guideline though for non health related aesthetic criteria (taste).
DRINKING WATER QUALITY 2010 / 2011
Parameter No Samples ADW
Guideline Min. Max. Exceptions % meeting Guideline
E coli. 517 0cfu/100ml 0 4 2 100
pH 48 6.5-8.5 6.9 8.3 0 100
Turbidity 48 5NTU 0.2 3.5 0 100
Total chlorine 149 5mg/L 0.14 2.2 0 100
Total Dissolved Solids 46 500mg/L 49 282 0 100
Copper 46 2mg/L 0.0050 2.050 1 98
Iron 46 0.3mg/L 0.010 1.91 5 89
Zinc 46 3mg/L 0.009 0.19 0 100
(Ref. NSW Health 2010/2011)
State of the environment report 2010/2011
│7 │
Implications
Strategic Business Plans remain current for both Water and Sewerage management. The Bega Valley Sewer Project continues to have a very large positive environmental impact through the increased number of dwellings and businesses able to connect to the reticulated sewerage schemes across the major areas of the Shire.
447ML of treated effluent was reused across Council’s 10 reuse schemes. This volume of beneficial reuse has a direct benefit to the environment. Further work in regard increasing volumes for reuse will continue during the next reporting period.
Work on improving trade waste connections for businesses in the sewered areas of the Shire continued during the reporting period and this will continue to improve the environmental performance of Council’s sewerage treatment plants by improving the quality of effluent discharged to the sewer through pre-treatment.
The Bega to Yellow Pinch Pipeline project will improve water supply issues for the southern part of the Shire but will also address concerns regarding environmental flows at the Tantawangalo Creek supply. The Stringybark Place sewer main extension and pump station project connects one caravan park to the sewerage system and provides capacity for an adjacent caravan park to also connect to the main. This will remove concern relating to the existing on-site sewage management schemes (septics) that have operated at both parks for over 25 years.
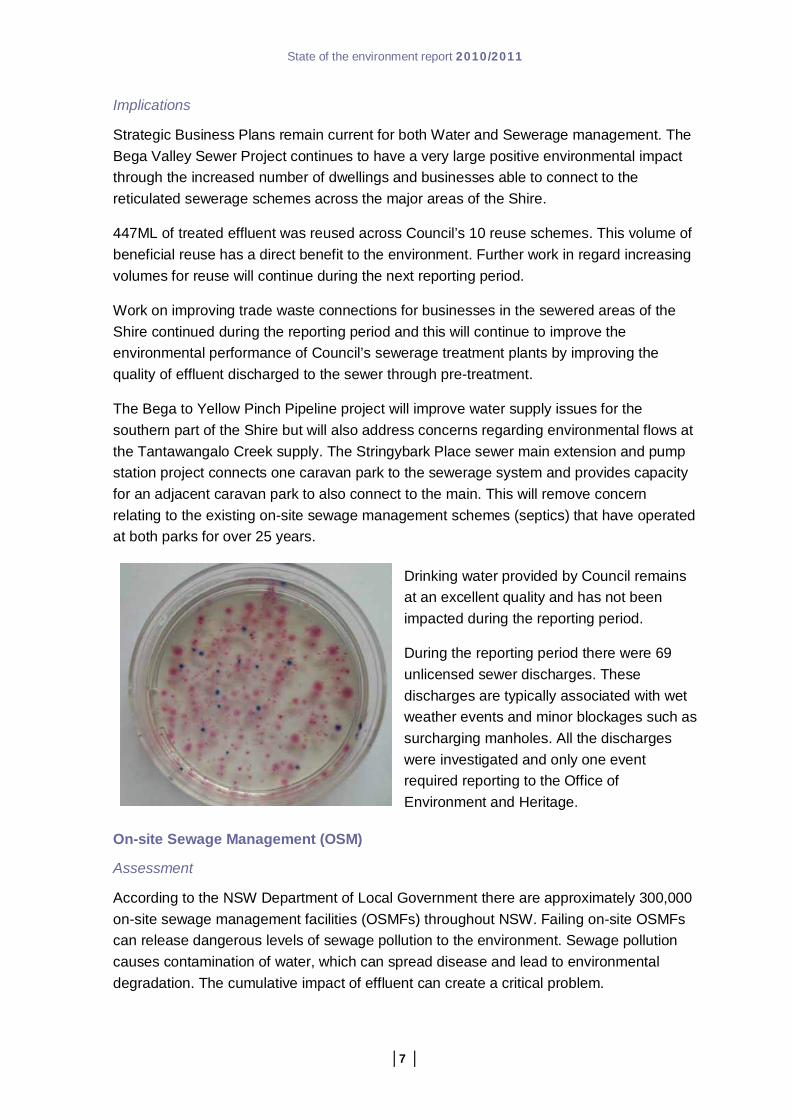
Drinking water provided by Council remains at an excellent quality and has not been impacted during the reporting period.
During the reporting period there were 69 unlicensed sewer discharges. These discharges are typically associated with wet weather events and minor blockages such as surcharging manholes. All the discharges were investigated and only one event required reporting to the Office of Environment and Heritage.
On-site Sewage Management (OSM)
Assessment
According to the NSW Department of Local Government there are approximately 300,000 on-site sewage management facilities (OSMFs) throughout NSW. Failing on-site OSMFs can release dangerous levels of sewage pollution to the environment. Sewage pollution causes contamination of water, which can spread disease and lead to environmental degradation. The cumulative impact of effluent can create a critical problem.

State of the environment report 2010/2011
│8 │
Since the introduction of a package of local government regulatory reforms by the NSW Government in 1998, Council has been conducting assessments of the operation of domestic and small commercial sewage management systems.
It is essential that these systems are operated and maintained in accordance with public health and environmental legislation to mitigate potential adverse public health and environmental impacts. Accordingly, Council’s On-Site Sewage Management Policy (Development Control Plan No. 5) was developed to provide assistance to achieve this outcome.
Within the Bega Valley Sire there are approximately 5600 on-site sewage management systems that include a range of human waste storage facilities. They include pump-out systems, septic tanks, aerated wastewater treatment systems, composting toilets, effluent soak-away trenches, mounds and irrigation areas, greywater application systems and domestic grease traps. It is essential that these systems be operated efficiently to maintain our local environment and public health. On-going development in rural and semi-rural areas will result in more systems being installed; however, the implementation of recent new sewerage schemes within a range of small villages and settlements has resulted in a decrease in the overall number of systems in the Bega Valley Shire.
· Number of OSM inspections undertaken in the reporting period - 1054,
· Number of OSMs in Shire at 30 June 2011 – 5644,
· Number of new approved OSMs for the reporting period – 112,
· Number of improvement orders served for reporting period - 111 x Notice of intention to serve order 1 x Order,
· Number of OSMs connected to sewer during reporting period – 6.
Council has implemented an approvals and inspection regime aimed at achieving environmental and public health performance objectives, while minimising cost to the community. Following this process an ongoing monitoring regime is conducted, based on the level of potential hazard determined for each property/ facility. Council aims to inspect each facility and issue a one to five year approval to operate a sewage management facility. Inspections of existing facilities and all new applications are assessed with consideration of the following:
· Prevention of public health risks;
· Protection of lands;
· Protection of surface waters;
· Protection of ground waters;
· Conservation and reuse of resources; and
· Protection of community amenity.
State of the environment report 2010/2011
│9 │
Implications
Council’s Onsite Sewage Management Policy will be reviewed in order to ensure the programs identified have an effective and practical approach. In order to adequately measure the outcomes of this policy, selected indicators have been identified and monitored and where possible Council will maintain and develop programs in cooperation with relevant authorities, State agencies, and community groups, to monitor the impact of on-site sewage management facilities on the environment.
It should be noted that significant benefits will be realised where environmental assessment and monitoring activities can be conducted on a regional or catchment basis.
Initially, assessments were completed in localities where poorly operated OSMFs would pose the highest potential risk to public health and the environment. The highest priority areas included the catchments of Merimbula Lake, Pambula Lake, Wonboyn Lake, Wapengo Lake, Nelson Lake and the Bermagui River where oyster harvesting is undertaken and the small rural villages of Wyndham, Quaama and Bemboka.
Progression throughout the Shire shall continue with the larger unsewered and environmentally sensitive areas continued to be given priority. Priority will also be given to systems where a monitoring regime has not yet been established and an initial inspection is still required.
The Onsite Sewage Management Facility program provides effective education, support and supervision to landowners, so that their systems operate in accordance with the health and environmental performance standards. The program also monitors and manages the cumulative impact of sewage pollution across the Shire.
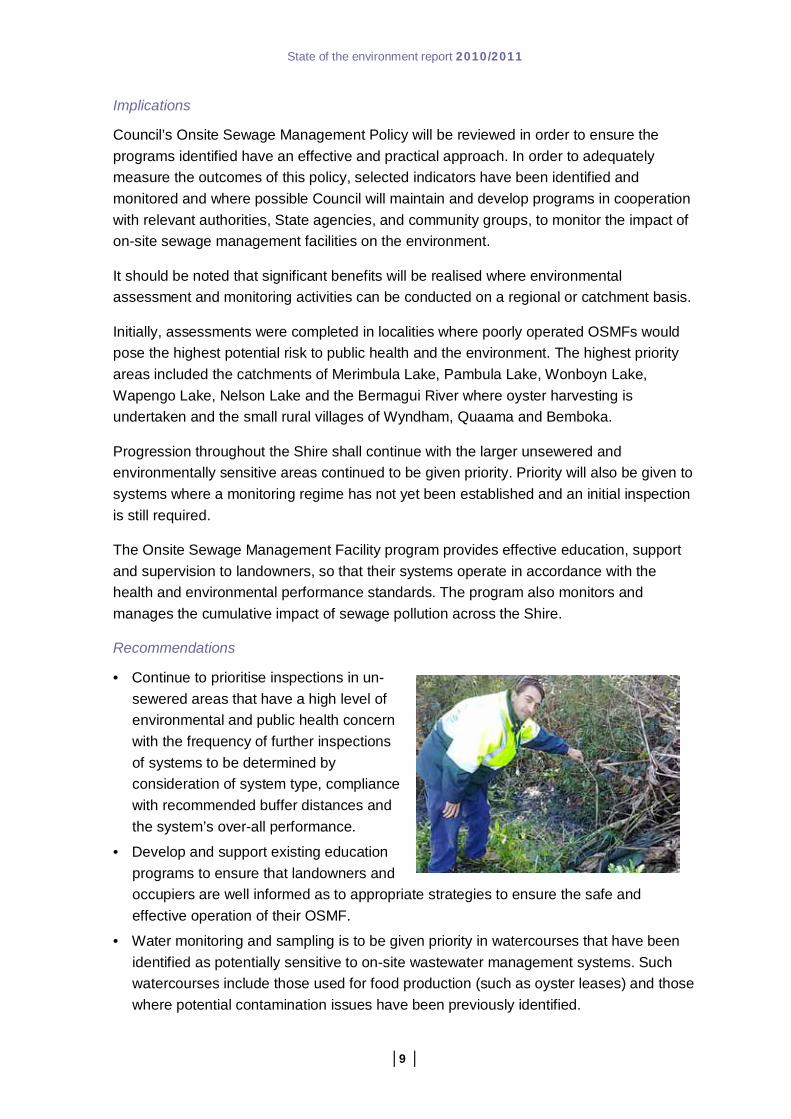
Recommendations
· Continue to prioritise inspections in un-sewered areas that have a high level of environmental and public health concern with the frequency of further inspections of systems to be determined by consideration of system type, compliance with recommended buffer distances and the system’s over-all performance.
· Develop and support existing education programs to ensure that landowners and occupiers are well informed as to appropriate strategies to ensure the safe and effective operation of their OSMF.
· Water monitoring and sampling is to be given priority in watercourses that have been identified as potentially sensitive to on-site wastewater management systems. Such watercourses include those used for food production (such as oyster leases) and those where potential contamination issues have been previously identified.

State of the environment report 2010/2011
│10 │
· Continue to minimise overflows from the sewerage system especially during wet weather events and particularly close to sensitive or critical risk areas such as oyster producing estuaries.
· Maintain inspection of Council owned and operated OSM’s to ensure minimal impact of operation on the environment.
Swimming water quality
Assessment
Despite above average rainfall, the water quality at beaches in the Bega Valley Shire Council area has been in top shape over the summer 2010/11 swimming season. All sites monitored were suitable for swimming for most of the season. The swimming sites monitored in the program include eight ocean beaches; Camel Rock Beach, Horseshoe Bay, Tathra Beach, Short Point Beach, Main Beach Merimbula, Pambula Beach, Aslings Beach and Cocora Beach, as well as sites at Beares Beach, Bruce Steer Pool Bermagui, Bar Beach, Pambula River Mouth, and an estuary area at Mogareeka Inlet.
Site Site Type Sanitary Survey Microbial Assessment Beach Suitability
Camel Rock Beach Ocean beach Low Category A Very Good
Bruce Steer Pool Estuarine Moderate Category A Good
Horseshoe Bay Ocean beach Low Category A Very Good
Beares Beach Ocean beach Low Category A Very Good
Mogareeka Inlet Lagoon/lake Low Category A Very Good
Tathra Beach Ocean beach Low Category A Very Good
Short Point Beach Ocean beach Low Category A Very Good
Bar Beach Estuarine Moderate Category A Good
Main Beach (Merimbula) Ocean beach Low Category A Very Good
Pambula Beach Ocean beach Low Category A Very Good
Pambula River Mouth Estuarine Low Category A Very Good
Aslings Beach Ocean beach Low Category A Very Good
Cocora Beach Ocean Beach Low Category A Very Good
(From Beachwatch Report OEH 2010/11)
All of the sampled swimming sites, performed well when compared to the National Health and Medical Research Council’s (NHMRC) recreational water quality guidelines. Despite above average rainfall from December to February, all sites monitored generally remained safe for swimming. Elevated results at Bar Beach on two occasions over summer, posed

State of the environment report 2010/2011
│11 │
an increased risk of illness to swimmers. Heavy rainfall was associated with the occasionally poor results seen at this site.
The full report from Beachwatch can be found at the following link.
http://www.environment.nsw.gov.au/resources/beach/bwsob1011/9SouthCoast1011.pdf
Implications
Monitoring of beach swimming water quality has been undertaken by Council since 1994 and has been had been conducted with Beachwatch since 2004 to better inform the local community of when and where it is safe to swim. The results of Council’s monitoring program are posted weekly on Council’s website during the swimming season as well as on the OEH Beachwatch website (above) for all historic results.
For the 2010/11 reporting period water quality has been very good at all of the sites monitored. The results did confirm though that after periods of heavy rain beach water quality can be impacted on by stormwater runoff. As a consequence Council staff advise the community to avoid swimming for a day or so after heavy rainfall at ocean beaches, and for up to three days in estuarine sites due to potential impacts from stormwater.
Although this supplementary report does not include an update on coastal management issues the NSW State of Catchment Report (SOCR) 2010 was released during the reporting period and does have some relevance especially in regard to future SoER’s in the Bega Valley Shire.
Indicators used in the 2010SoCR, although based at a catchment or regional scale, will have relevance to future state of environment reporting. These indicators cover condition and pressure areas and include eutrophication, turbidity, chlorophyll a, and macro-algae, habitat distribution, seagrasses, mangroves and salt-marsh, and fish assemblages etc.
In the NSW SoCR 2010 these indicators have been used at a regional level to prepare a score or condition and pressure index for each estuary. Pressure indicators used include population growth, cleared land, sediment inputs, nutrient inputs, freshwater flows, habitat disturbance, tidal flows and fishing.
Trends in terms of pressures will not be able to be reported for some time though the 2010 SoCR does conclude that the main pressures occur along the south coast along the more developed and populated areas in the Illawarra and Shoalhaven regions.
Council’s response to estuary management will be reported in the next comprehensive SoER though continual effort in regard estuary management planning and works in the Bega River Pambula Lake and Wapengo catchments.
· Specifically during the reporting period Council has undertaken significant monitoring efforts in the following estuaries for chlorophyll a, nutrients, algal species, and turbidity as part of the BVSC Environmental Monitoring in Coastal Lakes and Lagoons Report. (ELGIN P/L).
State of the environment report 2010/2011
│12 │
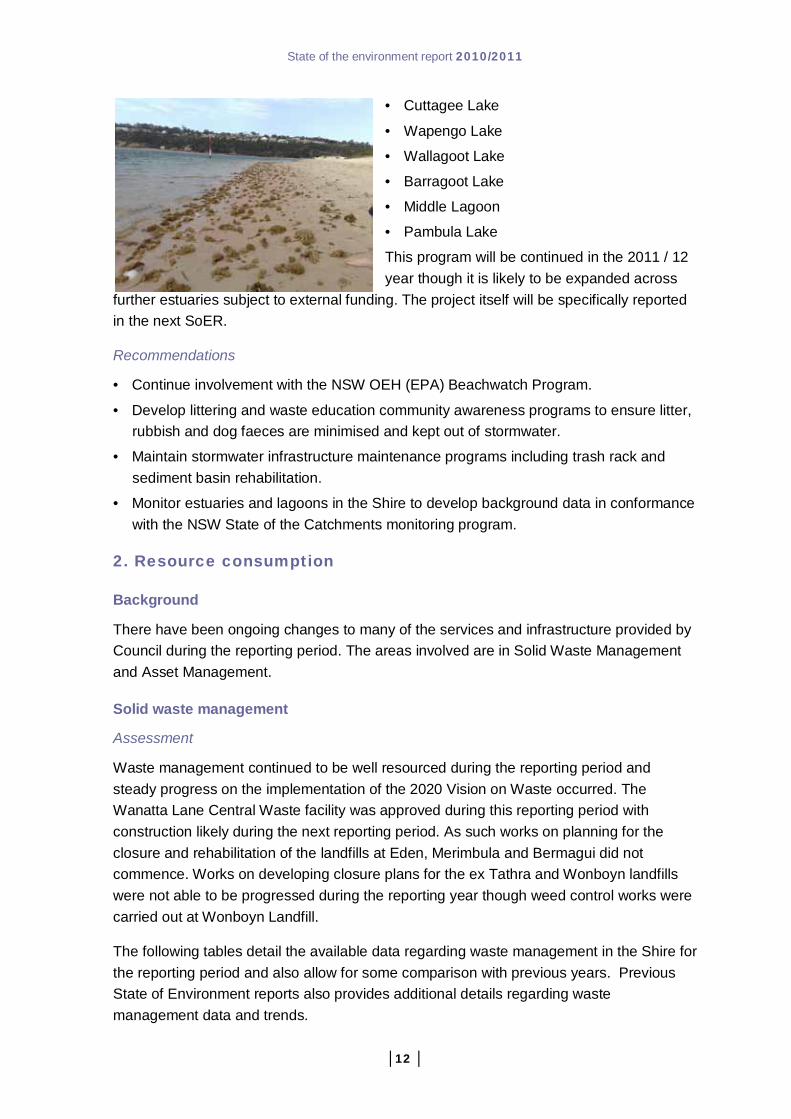
· Cuttagee Lake
· Wapengo Lake
· Wallagoot Lake
· Barragoot Lake
· Middle Lagoon
· Pambula Lake
This program will be continued in the 2011 / 12 year though it is likely to be expanded across
further estuaries subject to external funding. The project itself will be specifically reported in the next SoER.
Recommendations
· Continue involvement with the NSW OEH (EPA) Beachwatch Program.
· Develop littering and waste education community awareness programs to ensure litter, rubbish and dog faeces are minimised and kept out of stormwater.
· Maintain stormwater infrastructure maintenance programs including trash rack and sediment basin rehabilitation.
· Monitor estuaries and lagoons in the Shire to develop background data in conformance with the NSW State of the Catchments monitoring program.
2. Resource consumption
Background
There have been ongoing changes to many of the services and infrastructure provided by Council during the reporting period. The areas involved are in Solid Waste Management and Asset Management.
Solid waste management
Assessment
Waste management continued to be well resourced during the reporting period and steady progress on the implementation of the 2020 Vision on Waste occurred. The Wanatta Lane Central Waste facility was approved during this reporting period with construction likely during the next reporting period. As such works on planning for the closure and rehabilitation of the landfills at Eden, Merimbula and Bermagui did not commence. Works on developing closure plans for the ex Tathra and Wonboyn landfills were not able to be progressed during the reporting year though weed control works were carried out at Wonboyn Landfill.
The following tables detail the available data regarding waste management in the Shire for the reporting period and also allow for some comparison with previous years. Previous State of Environment reports also provides additional details regarding waste management data and trends.

State of the environment report 2010/2011
│13 │
Waste to landfill (tonnes)
Category 2004-05 2005-06 2006-07 2007-08 2009-10 2010-11
Commercial & industrial 192.75 8852.6 2557 4180 4152 Not available
Building & demolition 4747 Incl above 1600 1726 1378 Not available
Domestic collection 1165 5147.4 8812 15766 13976 Not available
Private delivery Not available Incl above Incl above Incl above Incl above Not available
Total household* 1165 5147.4 8812 15766 13976 Not available
Total 6104.75 13,999.60 12,969.00 21,672 19,505 32,623
(*domestic collection plus private delivery)
Unfortunately during the reporting year changes in waste management data recording occurred and prevented the separate waste volumes to landfill for waste categories being recorded. The total waste to landfill figure though was recorded. Anecdotally the Waste Manager reports a very large spike across the Demolition and Commercial/ Industrial categories deposited to landfill for this reporting year. This accounted for an approximate 13,000T increase on the 2009/10 reporting period. Although this is unable to be further defined there were a number of major redevelopments undertaken during the reporting period and it is likely that demolition materials accounted for a large percentage of this increase.
The Waste Manager also reports that some 81 tonnes of asbestos containing material were received by Council and disposed of to the Pambula Landfill. Asbestos records for previous years were not available so trends for this hazardous waste material were not available.
It needs to be noted again however that Council still does not have a weigh station so
all figures used are based on estimates of volume converted to tonnages using the DECCW conversion factor.
During the reporting period 4,012 tonnes of co-mingled recyclables were delivered to the Materials Recovery Facility in Moruya. This figure is almost identical to the recyclables diverted from landfill for the 2009/10 SoER and represents the highest mass recorded for Bega Valley Shire Council since recycling commenced.
The below table provides data on resource recovery by type or waste stream in tonnes. Trends are unfortunately hard to detect due to the inconsistent data collection though it is very apparent that garden organic collection continues to grow and have a large positive impact on the volume of material being disposed of at landfill.

State of the environment report 2010/2011
│14 │
Resource Recovery by type/stream (Tonnes)
2005/06 2006/07 2007/08 2008/09 2009/10 2010/11
Paper NA NA NA NA 15,644 NA
Glass NA NA NA NA 1,709 NA
Plastic NA NA NA NA 295 NA
Liquid paperboard NA NA NA NA NA NA
Aluminium NA NA NA NA 56 NA
Steel Cans NA NA NA NA 125 NA
Garden Organics 2,190 2,214 2,294 NA 3135 1421.28
Demolition NA NA NA NA NA NA
Steel (ferrous) 1,408 800 500 NA 796.25 503
Cooking Oil & Fat NA NA NA NA NA NA
Clothing NA NA NA NA NA NA
Salvage and Reuse NA NA 2.5 NA 243.64 NA
Motor Oil NA NA 300 NA 8.08 3.0
Tyres (Units) NA NA 243 NA NA NA
Acid Lead batteries NA NA 1.0 NA NA NA
(NA = Data Not Available)
Unfortunately, as the above table shows, data collection in waste management has not been able to be maintained during the current reporting period. Data relating to categories or types of waste is very important in defining activities and functions to manage trends which may be occurring. This would appear to be the case during this reporting period particularly for demolition waste which has had a very large spike though this has not been quantified.
Interestingly an approximate 50% reduction in garden organics from the previous year occurred during this reporting period. As this occurred in a year where garden growth has been prolific due to the break in the drought the impact of this large volume of garden organics going straight to landfill or being dumped in local reserves and similar is likely to be significant. Data on garden organics being dropped off at Council facilities was not recorded during this reporting period.
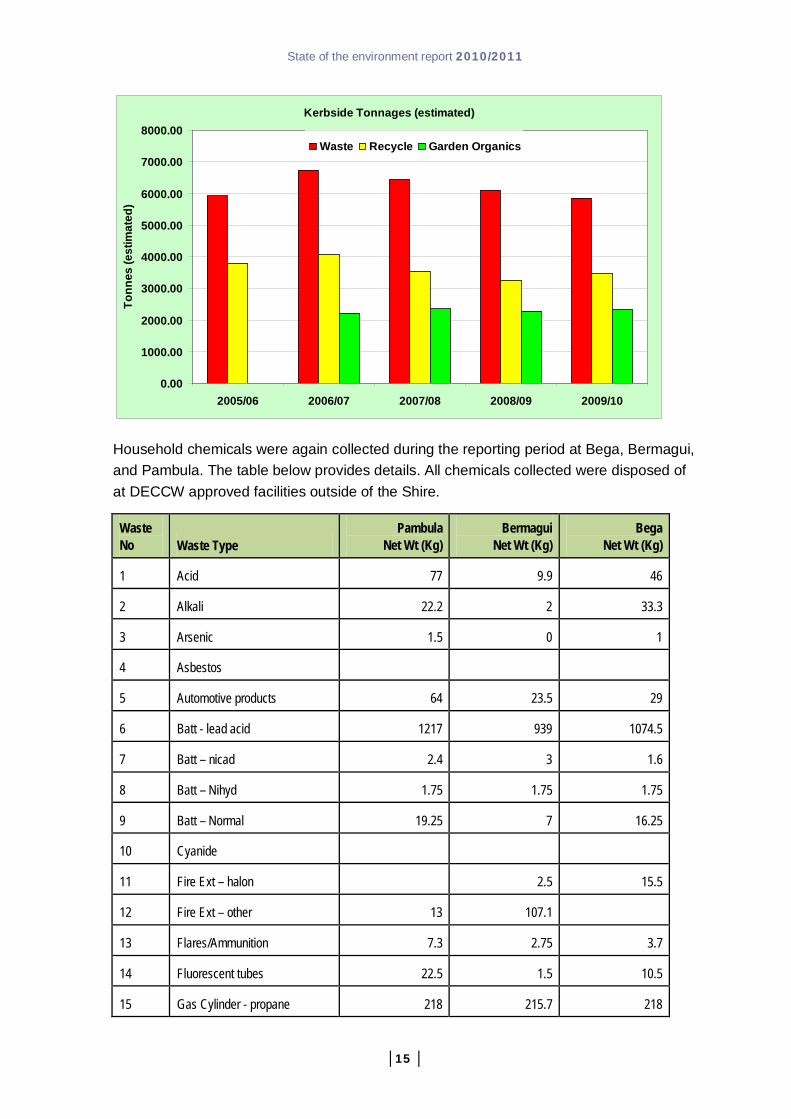
The table below shows kerbside waste, recycling and garden organic tonnages since the 2005/06 year. Unfortunately kerbside tonnages for the 2010/11 reporting period are not available.
State of the environment report 2010/2011
│15 │
Kerbside Tonnages (estimated)
0.00
1000.00
2000.00
3000.00
4000.00
5000.00
6000.00
7000.00
8000.00
2005/06 2006/07 2007/08 2008/09 2009/10
Tonn
es (e
stim
ated
)
Waste Recycle Garden Organics
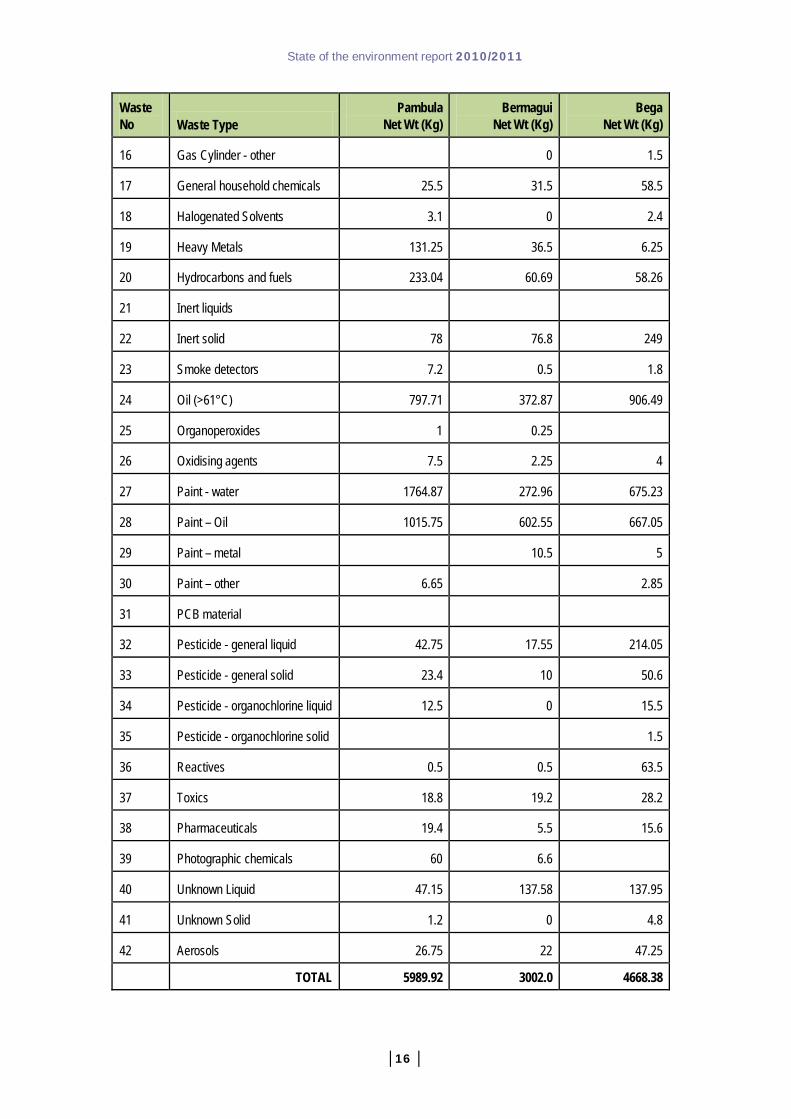
Household chemicals were again collected during the reporting period at Bega, Bermagui, and Pambula. The table below provides details. All chemicals collected were disposed of at DECCW approved facilities outside of the Shire.
Waste No Waste Type
Pambula Net Wt (Kg)
Bermagui Net Wt (Kg)
Bega Net Wt (Kg)
1 Acid 77 9.9 46
2 Alkali 22.2 2 33.3
3 Arsenic 1.5 0 1
4 Asbestos
5 Automotive products 64 23.5 29
6 Batt - lead acid 1217 939 1074.5
7 Batt – nicad 2.4 3 1.6
8 Batt – Nihyd 1.75 1.75 1.75
9 Batt – Normal 19.25 7 16.25
10 Cyanide
11 Fire Ext – halon 2.5 15.5
12 Fire Ext – other 13 107.1
13 Flares/Ammunition 7.3 2.75 3.7
14 Fluorescent tubes 22.5 1.5 10.5
15 Gas Cylinder - propane 218 215.7 218
State of the environment report 2010/2011
│16 │
Waste No Waste Type
Pambula Net Wt (Kg)
Bermagui Net Wt (Kg)
Bega Net Wt (Kg)
16 Gas Cylinder - other 0 1.5
17 General household chemicals 25.5 31.5 58.5
18 Halogenated Solvents 3.1 0 2.4
19 Heavy Metals 131.25 36.5 6.25
20 Hydrocarbons and fuels 233.04 60.69 58.26
21 Inert liquids
22 Inert solid 78 76.8 249
23 Smoke detectors 7.2 0.5 1.8
24 Oil (>61°C) 797.71 372.87 906.49
25 Organoperoxides 1 0.25
26 Oxidising agents 7.5 2.25 4
27 Paint - water 1764.87 272.96 675.23
28 Paint – Oil 1015.75 602.55 667.05
29 Paint – metal 10.5 5
30 Paint – other 6.65 2.85
31 PCB material
32 Pesticide - general liquid 42.75 17.55 214.05
33 Pesticide - general solid 23.4 10 50.6
34 Pesticide - organochlorine liquid 12.5 0 15.5
35 Pesticide - organochlorine solid 1.5
36 Reactives 0.5 0.5 63.5
37 Toxics 18.8 19.2 28.2
38 Pharmaceuticals 19.4 5.5 15.6
39 Photographic chemicals 60 6.6
40 Unknown Liquid 47.15 137.58 137.95
41 Unknown Solid 1.2 0 4.8
42 Aerosols 26.75 22 47.25
TOTAL 5989.92 3002.0 4668.38
State of the environment report 2010/2011
│17 │
This valuable hazardous waste collection program again removed over 13,600 kilograms from the waste stream, almost the same mass collected during the 2009/10 reporting period.
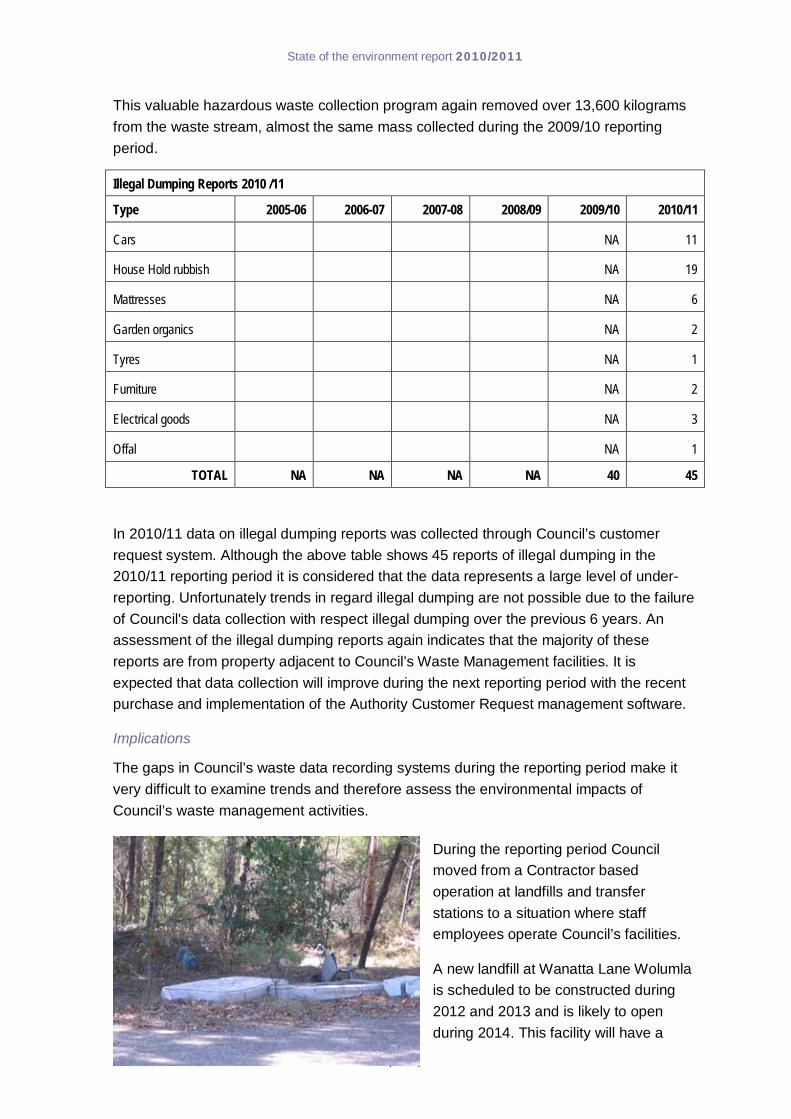
Illegal Dumping Reports 2010 /11
Type 2005-06 2006-07 2007-08 2008/09 2009/10 2010/11
Cars NA 11
House Hold rubbish NA 19
Mattresses NA 6
Garden organics NA 2
Tyres NA 1
Furniture NA 2
Electrical goods NA 3
Offal NA 1
TOTAL NA NA NA NA 40 45
In 2010/11 data on illegal dumping reports was collected through Council’s customer request system. Although the above table shows 45 reports of illegal dumping in the 2010/11 reporting period it is considered that the data represents a large level of under-reporting. Unfortunately trends in regard illegal dumping are not possible due to the failure of Council's data collection with respect illegal dumping over the previous 6 years. An assessment of the illegal dumping reports again indicates that the majority of these reports are from property adjacent to Council’s Waste Management facilities. It is expected that data collection will improve during the next reporting period with the recent purchase and implementation of the Authority Customer Request management software.
Implications
The gaps in Council’s waste data recording systems during the reporting period make it very difficult to examine trends and therefore assess the environmental impacts of Council’s waste management activities.
During the reporting period Council moved from a Contractor based operation at landfills and transfer stations to a situation where staff employees operate Council’s facilities.
A new landfill at Wanatta Lane Wolumla is scheduled to be constructed during 2012 and 2013 and is likely to open during 2014. This facility will have a

State of the environment report 2010/2011
│18 │
weigh bridge and this will greatly improve Council’s understanding of the waste stream in the Bega Valley. Closure and rehabilitation plans will also be developed for 3 current operational landfills.
Council is also recruiting a Waste Education Officer (who will commence early during the next reporting period) in an initiative aimed at improving waste minimisation and education activities. In addition during the next reporting period a new waste collection contract will be negotiated (2012) with expanded kerbside recycling (up to 1900 more collections) likely.
Illegal dumping again appears to be under-reported and until this is addressed it is very difficult to examine the implications of this activity. Other Council’s in the SE NSW region also report an ongoing issue in regard illegal dumping and are examining a proposal to establish a Regional Illegal Dumping Program (RID). Bega Valley Shire Council is also involved in this initiative and a decision in regard the implementation of a RID squad in this Shire will be made in 2012.
The reported data for the monthly kerbside garden organics collection was almost down 50% from the previous reporting year. This occurred in a year when the drought broke and when urban garden areas especially were producing much stronger growth and where subsequently a growth in the volume of material diverted from landfill would have been expected. Data on garden organics dropped off at Council’s landfills and transfer stations was not collected in this reporting period though the reduced volume trend in kerbside collection is likely to apply to ‘drop offs’. Mulch produced from this resource is popular. There is though a potential for this product to impact on weed management with weeds and garden escapees viable from mulch made with weed contaminated garden organics.
Household chemical collections were well supported during the reporting period and continue to reduce the mass of unwanted chemicals being disposed of to landfill.
Whilst waste collection and recycling has progressed more information on the volume of waste produced per capita is required to ensure sustainable management. Data on dumping reported in the Shire is of concern owing to the extent of dumping around and adjacent to Council waste management facilities. In addition as full cost recovery remains a valid goal in managing waste, the costs of controlling and regulating a growing waste dumping problem need also to be recovered.
Recommendations
· Review progress on implementation of the 2020 Vision on Waste.
· Adequately resource staff to effectively manage the growing waste dumping problem. Continue investigations into the establishment of a RID squad approach with the NSW OEH.
· Expand waste minimisation education and awareness programs to include changing community member’s consumption behaviour.

State of the environment report 2010/2011
│19 │
· Continue to provide household hazardous chemical collections across the Shire on at least an annual basis.
Energy consumption
Assessment
Council’s energy use (excluding fuel and street lighting) for 2010/11 totalled 20,750GJ. The proportion of this energy use that was from Green Power was over 95 %.These figures are based on some estimates and are not accurate but do give a good indication of Council’s energy use.
Energy use in Council facilities is being monitored by Planet Footprint to enable it to track progress and report back to Council staff on our usage.
(Source Planet Footprint)
The above table summarises Council’s total energy consumption since the 2005 / 06 financial year. Energy costs are for all electrical charges excluding street lighting. Council energy use and costs have risen steadily over this period to $1,235,000 for the 2010 /11 financial year. The above table also shows the impact of the purchase of Green Power for most of Council’s operations has had on the emission of greenhouse gases since the 2007/08 financial year. During the last year your use of green electricity has avoided the emission of 5,631 tonnes of CO2.
Council is responsible for Greenhouse gas emissions (GHG) from a number of sources including:
· Waste Management,
· Electricity use,
· Fuel for fleet and equipment,
· Tertiary emissions from purchase of items (e.g. stationary, furniture, food), &
· Operation of a sewerage treatment plants.
State of the environment report 2010/2011
│20 │
At this stage Council is only able to report on GHG emissions for electricity use (excluding street lighting) for this reporting period as per the above. It is hoped that details for all the above sources will be reported with the next SoER.
Council demonstrated its green credentials and played a role in leading and educating residents and businesses through its purchase of green power in 2007/08. Purchasing renewable energy is a simple way that we can all help protect the environment. Green Power offers councils a simple and less expensive means to demonstrate their commitment to the environment, while also presenting an opportunity for ratepayers to reduce their impact.
3. Climate change strategy
Council has adopted a climate change position and a draft climate change Policy and Strategy have been identified for delivery during the next reporting period.
Sustainability advantage
In 2010 Council became a partner / member of Sustainability Advantage, a business support service from the then Department of Environment and Climate Change NSW (now Office of Environment and Heritage. This program is designed to assist Council understand sustainability, successfully manage for a better environment and add business value.
Council has been working on the resource efficiency module during the reporting period across two asset areas; the Bega Administration Centre (Zingel Place) and the Eden Sewerage Treatment Plant, to identify and take advantage of opportunities to lower costs (eg. resources, energy), improve productivity and to enhance Council’s reputation as a community leader and supplier and employer of choice. The lessons learnt from this program with the Eden STP and the Bega Administration Building will be built on and expanded across the organisation in future reports.
Recommendations
· Continue efforts in determining Council’s carbon footprint and use this data to implement energy efficiency and renewable energy initiatives.
· Implement actions from the Sustainability Advantage modules across Council assets to reduce Council’s operation costs and carbon and other greenhouse gas emissions.
4. Land resources
Land quality
Background
Healthy land is needed to sustainably support a range of important landuses such as agriculture, urban development, waste disposal or transport infrastructure. For this reason, land quality, or the extent to which the soil resource is free from depletion or degradation, is important.
State of the environment report 2010/2011
│21 │
Ideally, land quality would be assessed on the basis of fundamental soil properties which reflect the condition of the soil, as well as the extent of degradation such as soil erosion and dryland salinity. Factors such as the occurrence of known contaminated sites or the detrimental effects of landfill would also be considered.
Declines in land quality can often be remediated once the problem and its causes have been identified. This may mean applying lime or fertilisers, restricting areas to stock access, revegetating some agricultural catchments, imposing erosion control measures in urban development areas, changing to a more appropriate landuse, or simply not developing some areas of land identified as having a high risk of developing dryland salinity for instance.
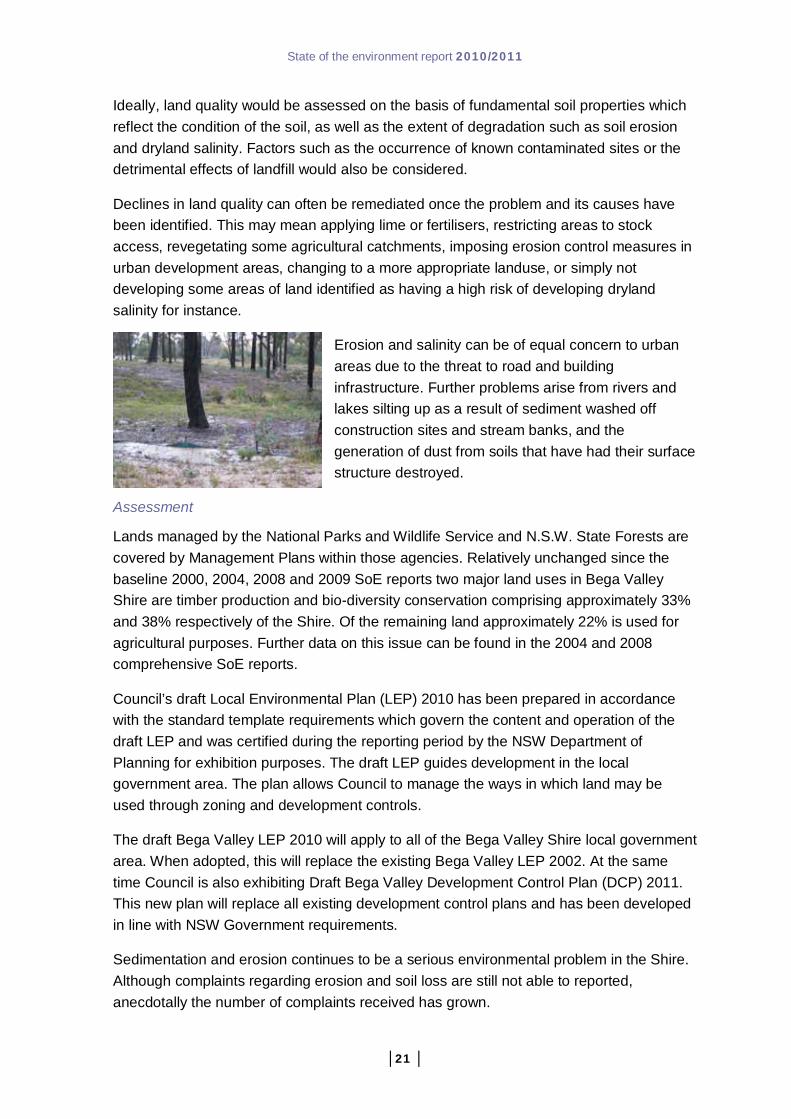
Erosion and salinity can be of equal concern to urban areas due to the threat to road and building infrastructure. Further problems arise from rivers and lakes silting up as a result of sediment washed off construction sites and stream banks, and the generation of dust from soils that have had their surface structure destroyed.
Assessment
Lands managed by the National Parks and Wildlife Service and N.S.W. State Forests are covered by Management Plans within those agencies. Relatively unchanged since the baseline 2000, 2004, 2008 and 2009 SoE reports two major land uses in Bega Valley Shire are timber production and bio-diversity conservation comprising approximately 33% and 38% respectively of the Shire. Of the remaining land approximately 22% is used for agricultural purposes. Further data on this issue can be found in the 2004 and 2008 comprehensive SoE reports.
Council’s draft Local Environmental Plan (LEP) 2010 has been prepared in accordance with the standard template requirements which govern the content and operation of the draft LEP and was certified during the reporting period by the NSW Department of Planning for exhibition purposes. The draft LEP guides development in the local government area. The plan allows Council to manage the ways in which land may be used through zoning and development controls.
The draft Bega Valley LEP 2010 will apply to all of the Bega Valley Shire local government area. When adopted, this will replace the existing Bega Valley LEP 2002. At the same time Council is also exhibiting Draft Bega Valley Development Control Plan (DCP) 2011. This new plan will replace all existing development control plans and has been developed in line with NSW Government requirements.
Sedimentation and erosion continues to be a serious environmental problem in the Shire. Although complaints regarding erosion and soil loss are still not able to reported, anecdotally the number of complaints received has grown.

State of the environment report 2010/2011
│22 │
Land contamination remains relatively unchanged since the 2008 report. Works on the investigation and remediation of the BP and Mobil sites at Eden, as well as a number of ex-service station sites at North Bega, Bega and Merimbula commenced during this reporting period. Greater emphasis has been afforded existing and ex service station sites due to the introduction of the underground petroleum storage requirements in the
Protection of the Environment Operations Act.
Acid sulphate soils remain unchanged from previous reports.
Implications
The implications of sedimentation and erosion, acid sulphate soils, and land contamination remain of concern. Changes since the 2004 and 2008 SoE reports have not been substantial though a review of Council’s Soil and Water Management Policy was commenced during the reporting period. Increased demands on staff in regard the management of underground petroleum storage systems at service stations and ex service station sites will continue.
Recommendations
· Develop and implement a new Erosion and Sediment Control Policy and Guidelines based on the, “NSW Soils and Construction - Managing Urban Stormwater”, Volume 1 & 2 (the Blue Book).(DECCW 2004 & 2008).
Land use and management
Background
Using and managing land sustainably is fundamental to maintaining an acceptable quality of life. However, past landuse and land management practices and competition for land as the population grows have resulted in a legacy of lands that now have some landuse limitations due to development or varying levels of degradation.
Resolving conflicts over landuse is likely to become more of an issue as population growth increases demand for land for housing in otherwise high productivity farmlands, water supply catchments, lands of high conservation value, or previously contaminated lands.
The concept of best management practice is not new, but the actual practices that constitute best management change as our knowledge improves. We do know, now, for example, that managing vegetation cover effectively is an important step in caring for our land as well as native species and ecosystems, whether that cover is native forests, woodlands or agricultural crops and pastures.
Assessment
Development of the comprehensive Local Environment Plan and Development Control Plan have, as reported above, continued throughout the reporting period. It is likely the
State of the environment report 2010/2011
│23 │
new plans will be approved and adopted during 2012 and impacts will be reported in the next State of Environment Report.
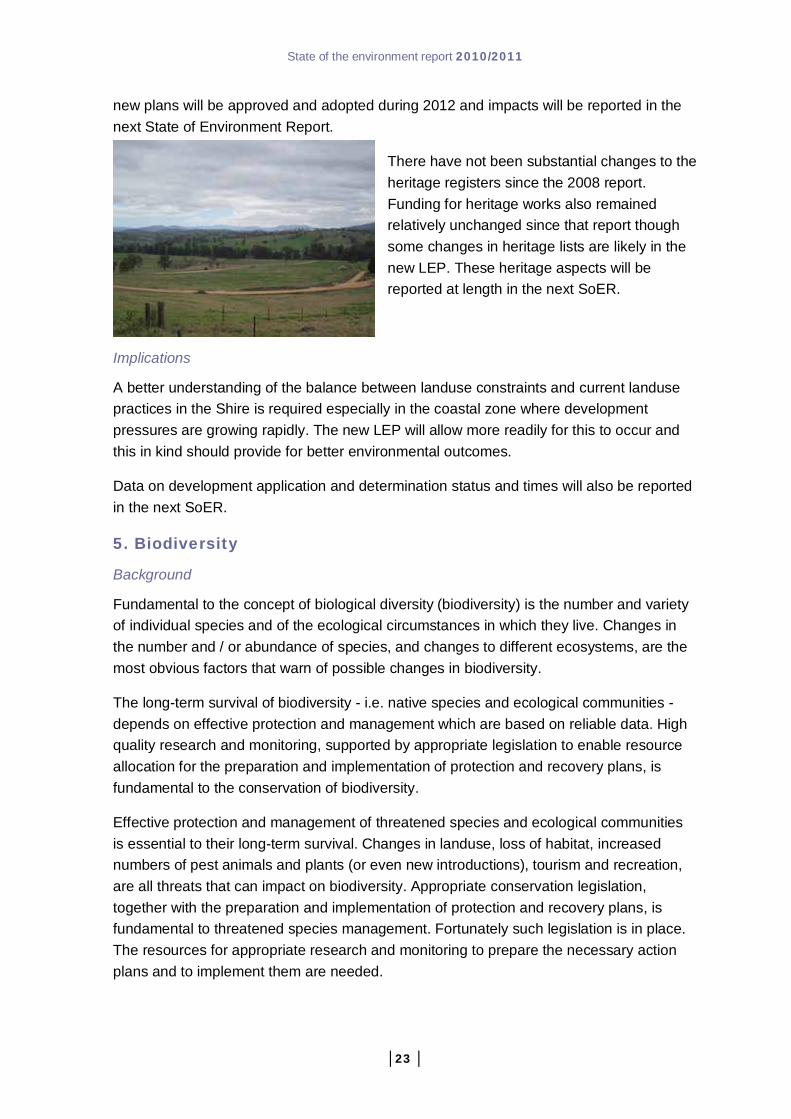
There have not been substantial changes to the heritage registers since the 2008 report. Funding for heritage works also remained relatively unchanged since that report though some changes in heritage lists are likely in the new LEP. These heritage aspects will be reported at length in the next SoER.
Implications
A better understanding of the balance between landuse constraints and current landuse practices in the Shire is required especially in the coastal zone where development pressures are growing rapidly. The new LEP will allow more readily for this to occur and this in kind should provide for better environmental outcomes.
Data on development application and determination status and times will also be reported in the next SoER.
5. Biodiversity
Background
Fundamental to the concept of biological diversity (biodiversity) is the number and variety of individual species and of the ecological circumstances in which they live. Changes in the number and / or abundance of species, and changes to different ecosystems, are the most obvious factors that warn of possible changes in biodiversity.
The long-term survival of biodiversity - i.e. native species and ecological communities - depends on effective protection and management which are based on reliable data. High quality research and monitoring, supported by appropriate legislation to enable resource allocation for the preparation and implementation of protection and recovery plans, is fundamental to the conservation of biodiversity.
Effective protection and management of threatened species and ecological communities is essential to their long-term survival. Changes in landuse, loss of habitat, increased numbers of pest animals and plants (or even new introductions), tourism and recreation, are all threats that can impact on biodiversity. Appropriate conservation legislation, together with the preparation and implementation of protection and recovery plans, is fundamental to threatened species management. Fortunately such legislation is in place. The resources for appropriate research and monitoring to prepare the necessary action plans and to implement them are needed.
State of the environment report 2010/2011
│24 │
Assessment
Progress towards better management and understanding of biodiversity conservation in Bega Valley Shire continued during the reporting period. Projects using incentive programs for freehold land continued under the Southern Rivers Catchment Management Authority’s Voluntary Biological Diversity Conservation Strategy and the Bega Cheese Environmental Management System Project. Council is actively involved in these projects and provided significant grant funded expertise through the Vegetation Recovery Project as well as significant staff contributions. This project and vegetation management roles generally are being reviewed in late 2011 and 2012 and will be reported on specifically in the next SoER.
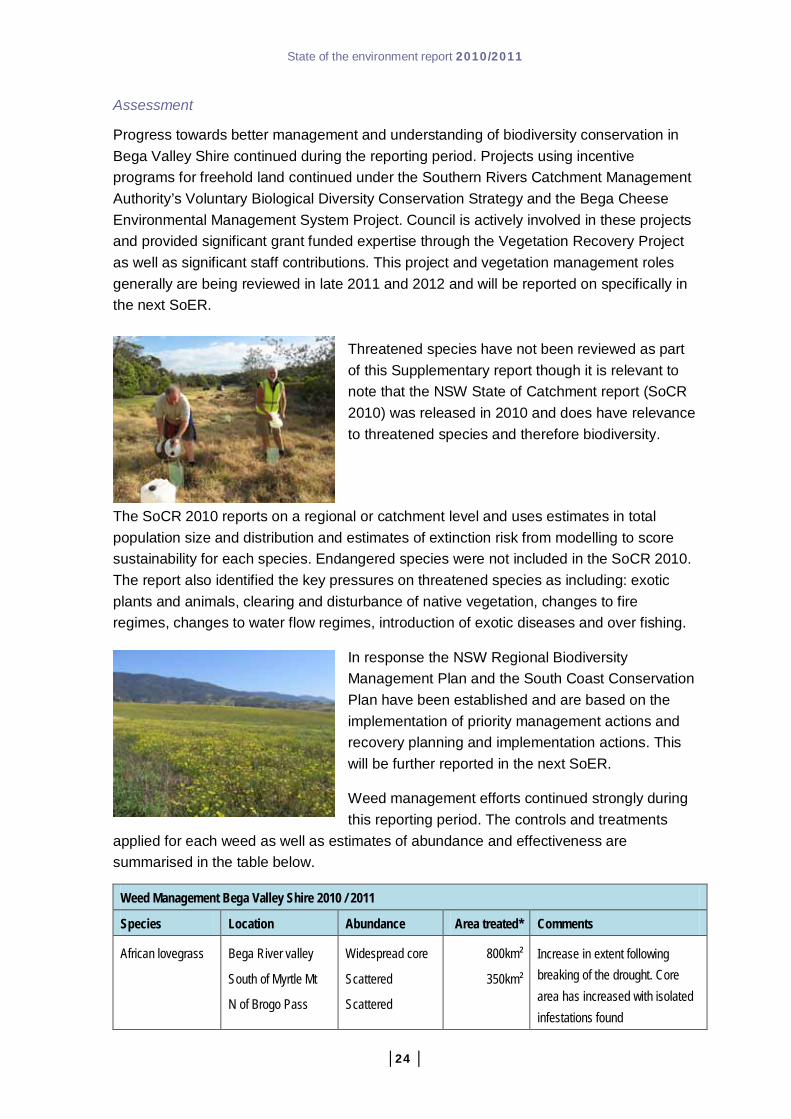
Threatened species have not been reviewed as part of this Supplementary report though it is relevant to note that the NSW State of Catchment report (SoCR 2010) was released in 2010 and does have relevance to threatened species and therefore biodiversity.
The SoCR 2010 reports on a regional or catchment level and uses estimates in total population size and distribution and estimates of extinction risk from modelling to score sustainability for each species. Endangered species were not included in the SoCR 2010. The report also identified the key pressures on threatened species as including: exotic plants and animals, clearing and disturbance of native vegetation, changes to fire regimes, changes to water flow regimes, introduction of exotic diseases and over fishing.
In response the NSW Regional Biodiversity Management Plan and the South Coast Conservation Plan have been established and are based on the implementation of priority management actions and recovery planning and implementation actions. This will be further reported in the next SoER.
Weed management efforts continued strongly during this reporting period. The controls and treatments
applied for each weed as well as estimates of abundance and effectiveness are summarised in the table below.
Weed Management Bega Valley Shire 2010 / 2011
Species Location Abundance Area treated* Comments
African lovegrass Bega River valley
South of Myrtle Mt
N of Brogo Pass
Widespread core
Scattered
Scattered
800km²
350km²
Increase in extent following breaking of the drought. Core area has increased with isolated infestations found

State of the environment report 2010/2011
│25 │
Weed Management Bega Valley Shire 2010 / 2011
Species Location Abundance Area treated* Comments
Serrated tussock Towamba River valley
Rest of Shire
Widespread marginal
Isolated and widely scattered
120ha
2,400ha
Effective program resulting in reduction of dense infestations; increase in areas with isolated plants - controlled as found
St John’s wort Shire-wide Isolated infestations
210ha All known infestations targeted; some increases found on private lands; seasonal increase
Chilean needle grass
Angledale Isolated 15ha Spraying and pasture rehabilitation program effectively controlling the weed
Bitou bush Parts coastline Isolated 85ha All know areas inspected and controlled; reduction in area and densities
Boneseed Nullica Isolated 2ha All known plants fully controlled
Lantana Wallaga Lake
Bermagui, Tathra
Isolated infestation
Isolated plants
12ha On-going program targeted all known infestations - reduction in density
Blackberry Shire-wide Core
Widespread
2,800ha
8,,000ha
On-going programs – infestation area and density remained static due to break in drought
Blue hound’s tongue
Towamba River at Kiah and mouth
Scattered infestations
150ha All infestations controlled; new infestation on NPWS land fully controlled
Broom and gorse Shire-wide Isolated infestations
45ha Mostly coastal towns; some rural roadsides. Reduction in broom infestations; new gorse infestation covering approx 10ha found
Fireweed Shire-wide Core and marginal 1,000km² Areas affected increasing with an increase in density. Change in management Plan requirements requires education and awareness programs only.

State of the environment report 2010/2011
│26 │
Weed Management Bega Valley Shire 2010 / 2011
Species Location Abundance Area treated* Comments
Environmental weeds and garden escapes
Coastal townships focus
Widespread infestations in and around coastal towns and settlements
250kms Part of Coastal Weeds project – two sweeps per
Year have reduced areas and extent
* Roadside management and inspection programs
Pest plant infestations of the following weeds were located and management actions implemented during the reporting period: African lovegrass, Serrated tussock, blackberry, St John’s Wort, Bitou bush, boneseed, bridal creeper, lantana, Paterson’s Curse, broom species, gorse, Blue Hound’s Tongue, Crofton weed, Fireweed, Chilean Needle-grass, nodding thistle, Paterson’s curse, Prickly and Tiger pear, willows, and environmental weeds including garden escapees.
In addition pest plant control in partnership with government and other agencies continued through this reporting period with specific projects including: Weed Action Program for the South Coast – part funded by NSW DPI, environmental weed programs such as the Bega Shire Coastal Weeds Project, the Tathra Littoral Rainforest Project, the Towamba Valley Community Weed Management Project partly funded by Southern Rivers CMA, and a number of smaller NSW Crown Lands projects partially funded by NSW Department of Lands.
The South Coast Weeds Action program 2010 – 2015 is a program jointly funded by NSW Department of Primary Industries, the South Coast Group of Councils and other program partners including Landcare, other community groups and land management agencies who may participate in specific projects or other weed management activities.
Funding covers programs for both noxious and environmental weeds with a focus on those listed as noxious. In the Bega Valley Shire, noxious weeds include African lovegrass, St. John’s Wort, broom and gorse, lantana, Bitou bush and Boneseed, Serrated tussock, blackberry, Chilean needle grass, blue hound’s tongue and fireweed. Funding provides for roadside and Council owned and managed land control and on-going blue hound’s tongue control programs on the lower Towamba River.
Council maintained general private property inspection activities under the Noxious Weeds Act 1993 targeting properties with known noxious weeds infestations and inspections of properties not visited for several years as well as coastal weed management and sea spurge projects, farming for weed suppression projects (partly funded through Southern Rivers CMA), and blackberry and willow control program in the Genoa River catchment partly funded through Federal NHT.

State of the environment report 2010/2011
│27 │
Implications
Pest plants are a key threatening process that does impact the biodiversity of the Shire. The main threatening processes identified during this reporting period have been identified as: Grassy weeds, woody weeds, coastal weeds, garden escapees and riparian weeds threatening coastal vegetation communities, riparian areas, grassy woodlands and other high conservation value areas.
Eleven plant species continue to be identified as priority noxious weeds in Bega Valley Shire since the previous reporting period: African lovegrass (Eragrostis curvula), bitou bush (Chrysanthemoides monilifera ssp rotundata), boneseed ( Chrysanthemoides monilifera ssp monilifera), blackberry (Rubus fruticosus), several broom species including Cape (Genista monspessulana) and English (Scotch) brooms (Cytisus scoparius), Chilean needle grass (Nassella neesiana),Crofton weed (Ageratina adenophora), fireweed (Senecio madagascariensis), gorse (Ulex europaeus) lantana (Lantana species), St John's Wort (Hypericum perforatum) and serrated tussock (Nassella trichotoma).
Many of the species have the potential to adversely impact on the conservation values of native vegetation communities and primary production. St John's Wort and fireweed are poisonous to livestock while Crofton weed is poisonous for horses.
The area of infestation of four of the priority weeds decreased since the 2010-11 report:
· Bitou bush, by five hectares; densities of known infestations was also reduced,
· Blackberry, by approximately 800 hectares ,
· Serrated tussock, in areas where it was previously classed as ‘core’, has been controlled to a level where it can now be classed as marginal on approximately 50 hectares, and
· Chilean needle grass by 15 hectares through control and pasture rehabilitation.
Seasonal conditions following the break in the drought, however, have seen a significant increase in the area, density and extent of fireweed and, while densities of serrated tussock continue to be reduced, new scattered and isolated infestations have been identified on a number of properties covering 500ha north of Brogo Pass and south and west of Quaama.
African lovegrass has also spread, colonising over-grazed paddocks in areas where it has previously been absent or only occurred as isolated scattered plants. It has spread into the Towamba Valley and north of Brogo Pass, with isolated scattered infestations found on an increasing number of properties.
State of the environment report 2010/2011
│28 │
Pest animal management
The only pest animal species managed actively by Council is rabbits. Council undertakes control programs on its own land or that managed by it. It provides information and advice other land managers, such as National Parks, and community members in towns who have rabbits on their own land and want to control them.
Changes in rabbit densities are seasonal with a noticeable build-up in numbers affecting towns and public areas during drought and population fluctuations throughout the year.
Recommendation
· Develop and implement a community education and awareness program regarding the impacts of pest plants and animals.
· Review the Weed Management Policy and ensure that it reflects best practice principles and also supplements the Southern Rivers Regional Weed Management Strategy 2010 2014.
6. Our community
The quality of life of people, or their well being, is as much a result of the quality of our natural environment as of social and economic factors. Air quality, water quality, biodiversity, pest plants and animals, access to open space and bushland for recreation, and access to estuaries, lakes and beaches for recreation are but a few examples of how much the natural environment affects us.
Social and economic factors are important too. We have come to expect a certain standard of service provision as key to our well being, such as education, health, housing and many more. The well being of the community provides a basis for growth and development. The way in which we interact socially, at work or conducting business will have a significant impact on the nature of settlement and on the state of environment resulting from settlement.
Council Social Plan also reports on many initiatives that have relevance to the potential impacts our community way of life have on the local environment. Two more direct indicators are though reported on below for this reporting period. Further information on the BVSC Social Plan can be found at the following link.
http://www.begavalley.nsw.gov.au/Community/2006-2011-social-plan/Social-Plan-2006-2011.pdf
Air quality
Poor air quality affects us all. It can also have effects on most other living things, on ecosystems, on buildings and facilities as well as detracting from our enjoyment of our Shire.
Air quality is usually assessed by continuous or at least regular monitoring of various pollutants usually chosen because of their impact on health or because they contribute to

State of the environment report 2010/2011
│29 │
the formation of other pollutants. Air quality monitoring is not conducted in the Bega Valley Shire. Motor vehicles are the main source of many air pollutants.
Also considered under air quality is the global issue of ozone depletion in the upper atmosphere. Ozone depletion results in increased amounts of ultra violet radiation reaching ground level. National and international controls are relevant to this aspect and were discussed in the 2008 comprehensive SoE Report.
Assessment
Since the 2000 report air quality in the Shire has not generally been thought to have changed. Little specific information about air quality in the shire is known though there are obvious occasions where air quality may be impacted through activities such as road transport and preventative burning. With the wetter weather in the reporting period the impact of bushfires has not been significant.
Previous concerns with ‘backyard’ burning in the urban areas of the Shire saw Council move to prohibit such burning in the Shire during this reporting period. Bega Valley Shire Council is now listed in the Schedule of the Protection of the Environment Operations (Clear Air) Regulation 2010 as a shire where ‘backyard ‘ burning is prohibited.
Industrial sources remain relatively unchanged since the 2008 report and larger industries such as SEFE and Bega Cheese remain regulated by the NSW Office of Environment and Heritage (EPA).
Implications
It is likely that there is little impact on human health in the Shire owing to air quality but without data potential impacts remain difficult to assess. Further data on the implications of the backyard burning prohibition will be provided in the next state of environment report.
Noise
Assessment
Barking dogs continued to be the major source of noise complaint in the community as was reported in the 2009 report. Council had the services of four rangers during the reporting period and a large percentage of their time was spent dealing with companion animal management issues. All barking dog complaints received during the period were investigated and resolved, some with nuisance dog control orders or penalty infringement notices issued under the Companion Animal Act 1997. These have been utilised in each instance where the complaints were justified.
State of the environment report 2010/2011
│30 │
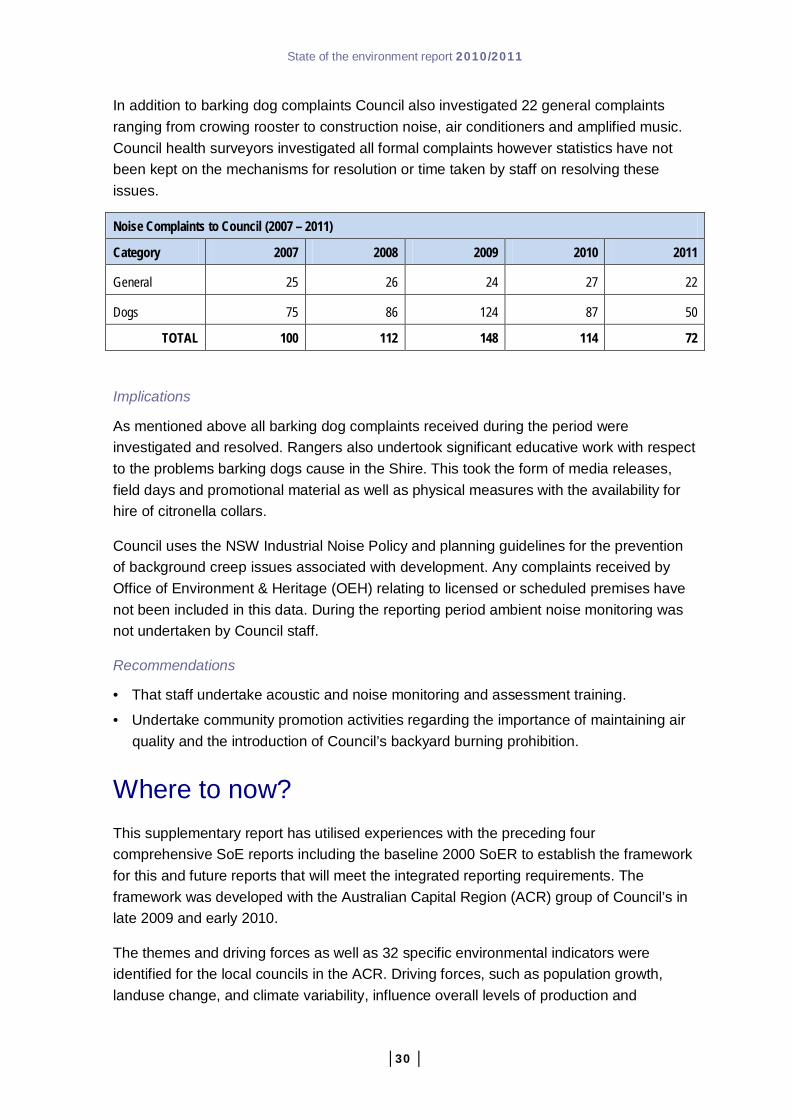
In addition to barking dog complaints Council also investigated 22 general complaints ranging from crowing rooster to construction noise, air conditioners and amplified music. Council health surveyors investigated all formal complaints however statistics have not been kept on the mechanisms for resolution or time taken by staff on resolving these issues.
Noise Complaints to Council (2007 – 2011)
Category 2007 2008 2009 2010 2011
General 25 26 24 27 22
Dogs 75 86 124 87 50
TOTAL 100 112 148 114 72
Implications
As mentioned above all barking dog complaints received during the period were investigated and resolved. Rangers also undertook significant educative work with respect to the problems barking dogs cause in the Shire. This took the form of media releases, field days and promotional material as well as physical measures with the availability for hire of citronella collars.
Council uses the NSW Industrial Noise Policy and planning guidelines for the prevention of background creep issues associated with development. Any complaints received by Office of Environment & Heritage (OEH) relating to licensed or scheduled premises have not been included in this data. During the reporting period ambient noise monitoring was not undertaken by Council staff.
Recommendations
· That staff undertake acoustic and noise monitoring and assessment training.
· Undertake community promotion activities regarding the importance of maintaining air quality and the introduction of Council’s backyard burning prohibition.
Where to now? This supplementary report has utilised experiences with the preceding four comprehensive SoE reports including the baseline 2000 SoER to establish the framework for this and future reports that will meet the integrated reporting requirements. The framework was developed with the Australian Capital Region (ACR) group of Council’s in late 2009 and early 2010.
The themes and driving forces as well as 32 specific environmental indicators were identified for the local councils in the ACR. Driving forces, such as population growth, landuse change, and climate variability, influence overall levels of production and
State of the environment report 2010/2011
│31 │
consumption, which in turn exert pressures on the environment. The 32 indicators variously address environmental condition (or state), key pressures, and responses.
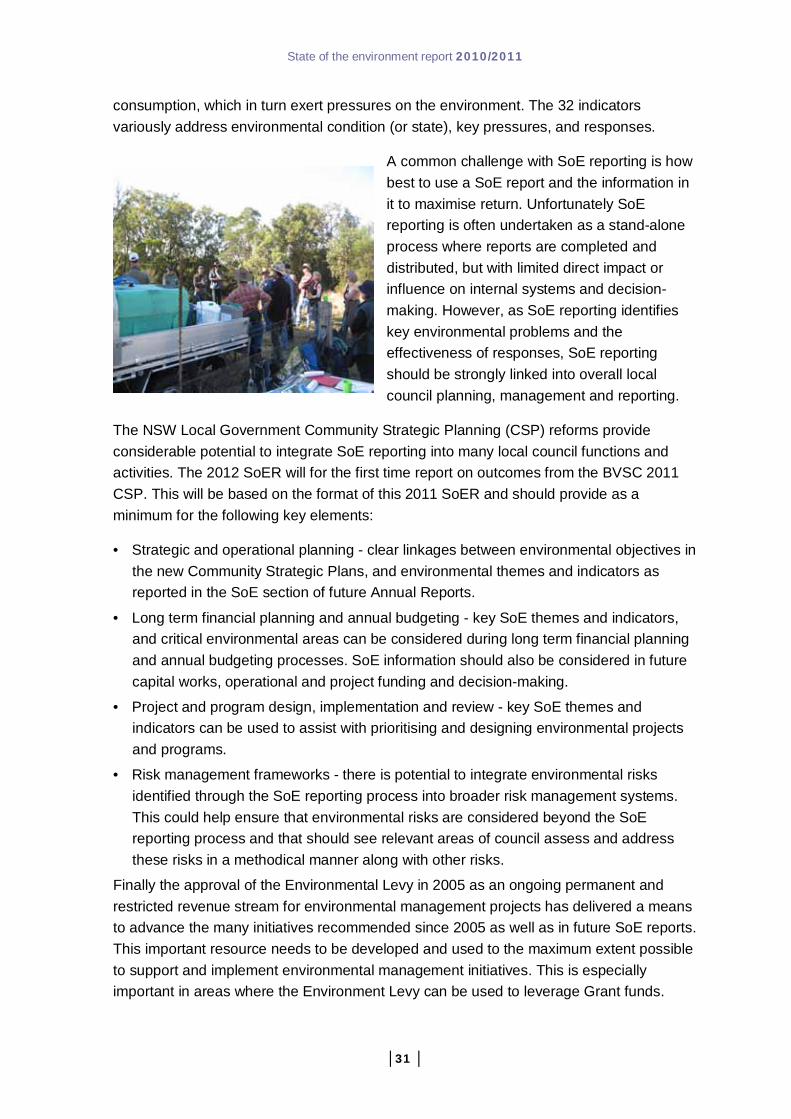
A common challenge with SoE reporting is how best to use a SoE report and the information in it to maximise return. Unfortunately SoE reporting is often undertaken as a stand-alone process where reports are completed and distributed, but with limited direct impact or influence on internal systems and decision-making. However, as SoE reporting identifies key environmental problems and the effectiveness of responses, SoE reporting should be strongly linked into overall local council planning, management and reporting.
The NSW Local Government Community Strategic Planning (CSP) reforms provide considerable potential to integrate SoE reporting into many local council functions and activities. The 2012 SoER will for the first time report on outcomes from the BVSC 2011 CSP. This will be based on the format of this 2011 SoER and should provide as a minimum for the following key elements:
· Strategic and operational planning - clear linkages between environmental objectives in the new Community Strategic Plans, and environmental themes and indicators as reported in the SoE section of future Annual Reports.
· Long term financial planning and annual budgeting - key SoE themes and indicators, and critical environmental areas can be considered during long term financial planning and annual budgeting processes. SoE information should also be considered in future capital works, operational and project funding and decision-making.
· Project and program design, implementation and review - key SoE themes and indicators can be used to assist with prioritising and designing environmental projects and programs.
· Risk management frameworks - there is potential to integrate environmental risks identified through the SoE reporting process into broader risk management systems. This could help ensure that environmental risks are considered beyond the SoE reporting process and that should see relevant areas of council assess and address these risks in a methodical manner along with other risks.
Finally the approval of the Environmental Levy in 2005 as an ongoing permanent and restricted revenue stream for environmental management projects has delivered a means to advance the many initiatives recommended since 2005 as well as in future SoE reports. This important resource needs to be developed and used to the maximum extent possible to support and implement environmental management initiatives. This is especially important in areas where the Environment Levy can be used to leverage Grant funds.