state of the confectionery industry. second half growth carries category retail sales – iri 52...
TRANSCRIPT

State of the Confectionery Industry

State of the Confectionery IndustrySecond half growth carries category
Retail Sales – IRI 52 WeeksJune 16 +1.1%December 28 +2.2%
Manufacturers YTD ShipmentsJune 30 -3.1% Lbs. +1.4% $
December 31 -0.5% Lbs +3.2% $

• Total $24.8 Billion• Chocolate $13.5 Billion• Non-Chocolate $7.6 Billion• Gum $3.0 Billion
NCA Estimates base on U.S. Dpt. Of Commerce 311D Report
2003 Retail Confectionery Sales

Candy & Gum Retail Performance
2003 2002 2001 2000
Total Candy & Gum +2.2% +1.5% +2.9% +3.3%
Supermarkets +3.0 +1.7% +1.5% +2.4%
Mass & Wal-Mart +0.9% -0.8% +6.7% +6.3%
Drug Stores +4.4% +5.3% +0.8% +0.3%
Convenience +5.5% +3.5% +6.1% +7.3%
IRI $ Sales as of 12/28/03
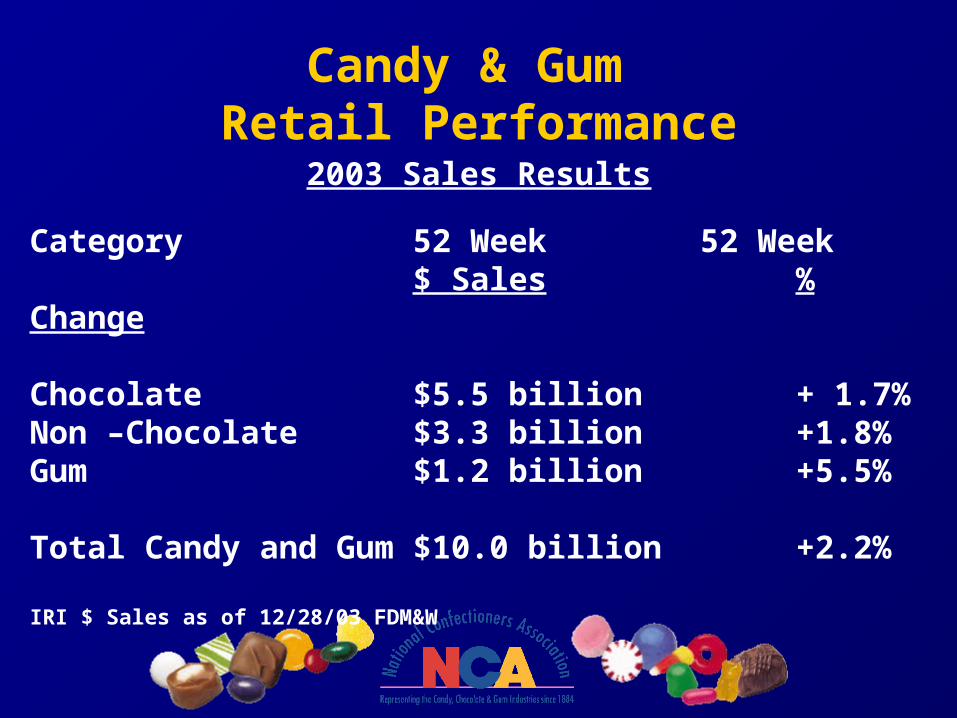
Candy & Gum Retail Performance
2003 Sales Results
Category 52 Week 52 Week $ Sales % Change
Chocolate $5.5 billion + 1.7%Non –Chocolate $3.3 billion +1.8%Gum $1.2 billion +5.5%
Total Candy and Gum $10.0 billion +2.2%
IRI $ Sales as of 12/28/03 FDM&W
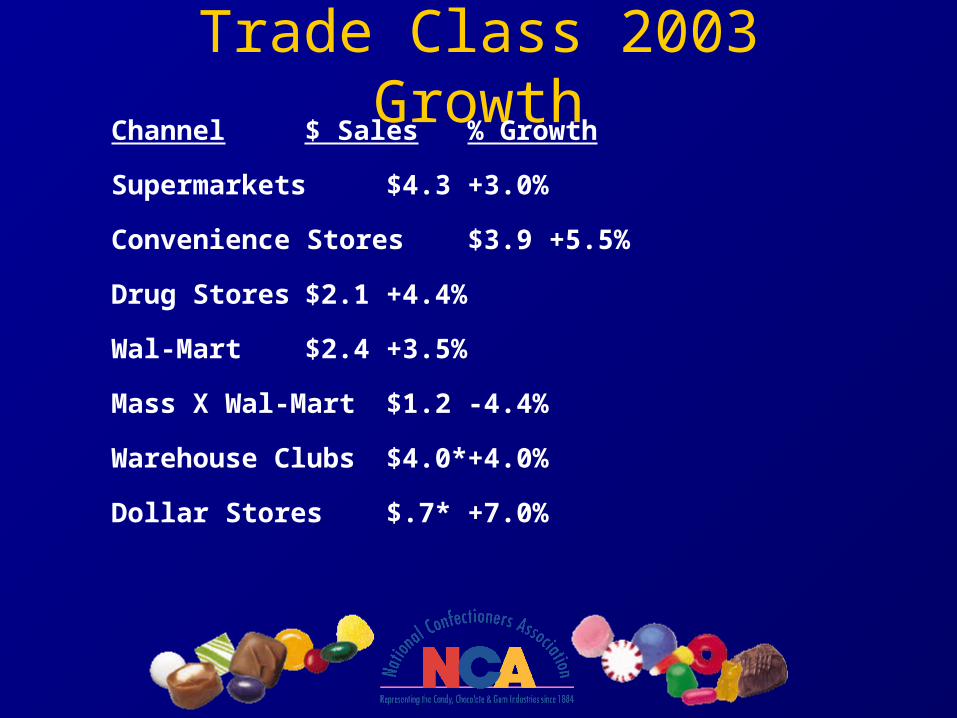
Trade Class 2003 GrowthChannel $ Sales % Growth
Supermarkets $4.3 +3.0%
Convenience Stores $3.9 +5.5%
Drug Stores $2.1 +4.4%
Wal-Mart $2.4 +3.5%
Mass X Wal-Mart $1.2 -4.4%
Warehouse Clubs $4.0* +4.0%
Dollar Stores $.7* +7.0%

Seasonal Confectionery Trends 2003 2002 2001 2000 1999 1998
VALENTINE’S -7.6% +6.5% -0.5% +4.7% -2.1% +7.9%
EASTER +2.2% -2.2% -2.4% +11.0% -0.1% +10.5%
HALLOWEEN +0.7% -0.4% +0.2% +4.7% +6.1% +4.6%
CHRISTMAS -1.4% -3.0% +0.7% +1.7% -0.8% -2.9%
* IRI FD&M

Candy & Gum Retail Performance
2003 Sales Results 12/28/03
Confectionery +2.2%Chocolate +1.7%
Everyday Sales +4.3%Seasonal Sales -2.7%
Non-Chocolate +5.1%Everyday Sales +5.1%Seasonal Sales -3.2%Breath Fresheners -10.6%
Gum +5.5%IRI $ Sales as of 12/28/03 FDM&W
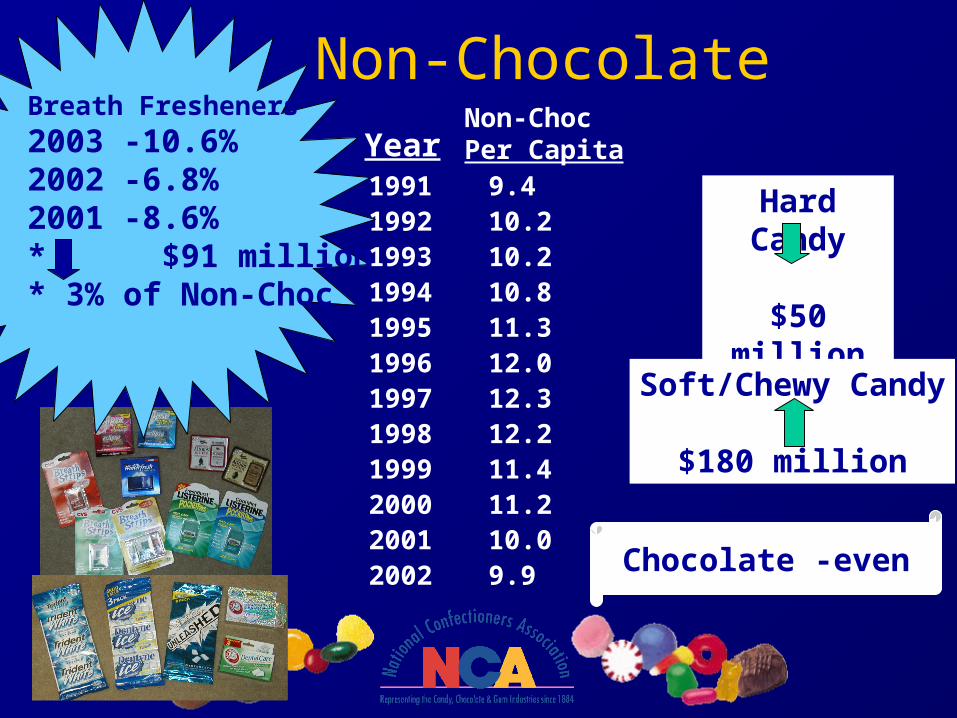
Non-Chocolate
9.410.210.210.811.312.012.312.211.411.210.09.9
199119921993199419951996199719981999200020012002
YearNon-ChocPer Capita
Breath Fresheners
2003 -10.6%2002 -6.8%2001 -8.6%* $91 million * 3% of Non-Choc
Hard Candy
$50 million
Soft/Chewy Candy
$180 million
Chocolate -even

Candy and Gum Ranked 3rdAmong 2003 Food Categories
$10.80
$7.60
$7.40
$6.80
$4.90
$4.20
$15.10
$0.0 $4.0 $8.0 $12.0 $16.0
Carbonated Beverages
Milk
Candy& Gum
Salty Snacks
Cereal
Ice Cream
Cookies
Pro
du
ct C
ateg
orie
s
$ Billions
-1.9%
-0.2%
+2.2%
Even%
+1.2%
-3.0%
IRI Food, Drug & MassExcluding Wal-Mart 12/28/03
+8.5%
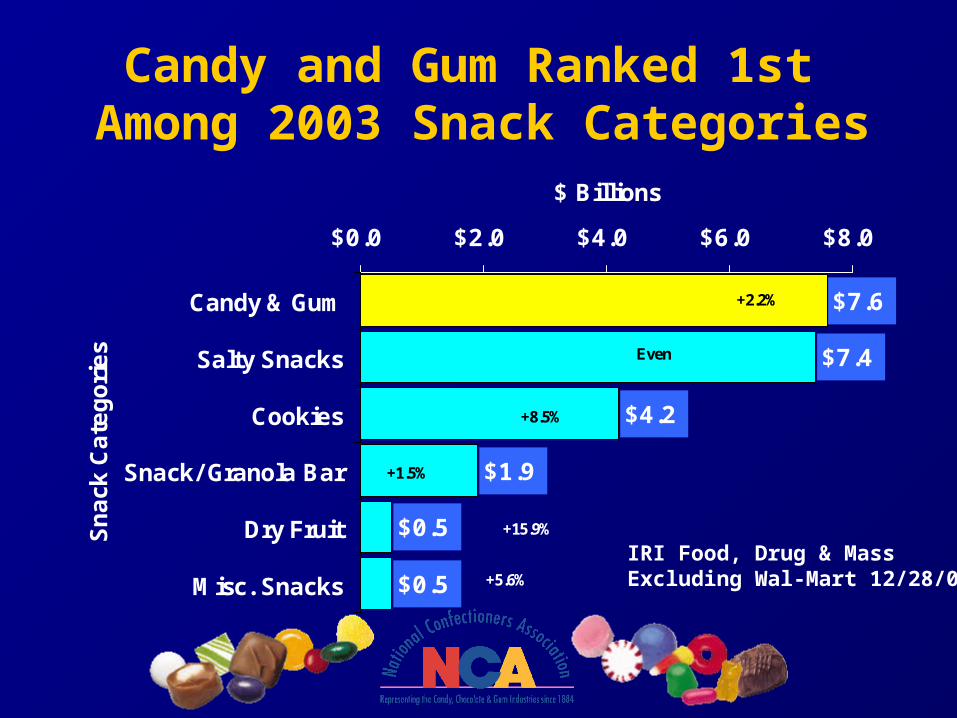
Candy and Gum Ranked 1st Among 2003 Snack Categories
$4.2
$1.9
$0.5
$0.5
$7.4
$7.6
$0.0 $2.0 $4.0 $6.0 $8.0
Candy & Gum
Salty Snacks
Cookies
Snack/ Granola Bar
Dry Fruit
Misc. Snacks
Snack
Cate
gories
$ Billions
+2.2%
Even
+8.5%
+1.5%
+15.9%
+5.6%
IRI Food, Drug & MassExcluding Wal-Mart 12/28/03

Candy & Gum 2003 Manufacturer
PerformanceDomestic Production and Imports
December 31, 2003$ Lbs. % Change
Billions Billions $ Lbs.
Total Confectionery $16.2 7.1 +5.2% +3.0%
Chocolate Candy $9.3 3.4 +6.4% +1.2%
Non-Chocolate Candy $5.0 3.0 +4.0% +5.3%
Gum $1.9 0.5 +3.6% +3.2%U.S. Department of Commerce Data

Candy & Gum 2003 Manufacturer
PerformanceDomestic Production Only
December 31, 2003$ Lbs. % Change
Billions Billions $ Lbs.
Total Confectionery $15.5 6.2 +3.2% -0.5%
Chocolate Candy $8.9 3.3 +4.8% -0.2%
Non-Chocolate Candy $4.3 2.3 +1.4% -0.3%
Gum $1.7 0.4 +1.3% +0.8%U.S. Department of Commerce Data

Non-Chocolate Import Growth
Non-Choc. Non-Choc. Non-Choc. Non-Choc Non-ChocRetail NCA/CMA Import Imports Imports %
Year Growth % Shipments Growth % % of Total of US Production*2003 +1.8% -0.3% +21.3% 30.1% 40.1%
2002 +0.3% -5.5% +15.2% 26.7% 33.4%
2001 +0.9% -1.2% +10.4% 21.0% 24.4%
2000 +3.2% -4.3% +9.9% 19.2% 21.8%
1999 +5.8% -3.3% +19.3% 17.1% 19.6%
1998 +6.3% -1.1% +17.7% 13.9% 14.9%
1997 +6.7% +8.8% +7.6% 11.7% 12.4%
1996 +7.6% +5.8% +8.5% 10.7% 11.4%
•2003 Estimates2002 U.S. Department of Commerce

Confectionery Imports & Exports
Category Imports Exports 2003 $ Growth 2003 $ Growth
Confectionery $1,970 +23.8% $725 +10.3%
Chocolate $633 +28.7% $357 +2.5%
Non-Chocolate $844 +21.35 $215 +14.6%
Gum $159 +24.9% $63 +26.3%
Global Trade Atlas November 2003

Confectionery ImportsTrading Partner2003 Shipments GrowthWorld $1,970 +23.8%Canada $1,002 +38.7%Mexico $250 +27.2%UK $111 - 13.7%Germany $67 - 3.4%Brazil $62 +68.5%Belgium $61 +19.2%China $47 +15.3%Netherlands $42 +18.0%Argentina $40 - 9.8%Switzerland $36 +9.8%
Sales in $millions January – November 2003

Confectionery ExportsTrading Partner2003 Shipments GrowthWorld $725 +10.3%Canada $348 +13.9%Mexico $102 +20.6%Japan $29 +2.6%South Korea $27 - 4.8%UK $20 +58.2%Germany $14 +29.3%Philippines $12 - 37.0%Taiwan $11 +28.7%France $11 +410.6%China $11 +9.9%
Sales in $millions January – November 2003