state of the city 2013 - logan city council · our intent is to highlight areas of concern to...
TRANSCRIPT
State of the City
2013
LOGAN : City of Choice
BUILDING OUR COMMUNITIESBUSINESSES AND PRIDE
CONTENTS
LOGAN : City of Choice
Acknowledgements:We acknowledge the people and clans of the Jagera and Yugambeh language groups as the Traditional Custodians of the Logan City area. We pay our respects to the elders, both past, present and future for they hold the memories, the traditions, the culture and hopes for Aboriginal people in Logan City and have made an important contribution to the community. We acknowledge there are also other Aboriginal and Torres Strait Islander people who live, work in and contribute to the cultural heritage of Logan City.
Disclaimer: The information contained in this publication is for general information only and has been taken by Logan City Council and the Logan: City of Choice Leadership Team from other public sources. Council or the Leadership team do not warrant the accuracy, completeness or currency of the information in this publication. It is your responsibility to evaluate the accuracy, completeness and currency of any information in this publication. To the full extent permitted by law, Council disclaims all liability for or in connection with any loss or damage suffered by you or any other person arising directly or indirectly from or in connection with your use of or reliance on the information contained in this publication. The leadership team acknowledge that the information in this report may not represent local neighbourhoods or select communities within Logan City who experience prosperity and affluence. Our intent is to highlight areas of concern to advocate for the interests of our neighbourhoods and communities who experience disadvantage and to improve on the city wide performance results outlined in this report.
Messages .........................................................................................3
Key Statistics ....................................................................................5
Education .........................................................................................9
Employment ...................................................................................17
Housing ..........................................................................................23
Safety .............................................................................................31
Social Infrastructure .......................................................................37
Communication and Community Involvement .................................43
Cultures ..........................................................................................51
Transport ........................................................................................57
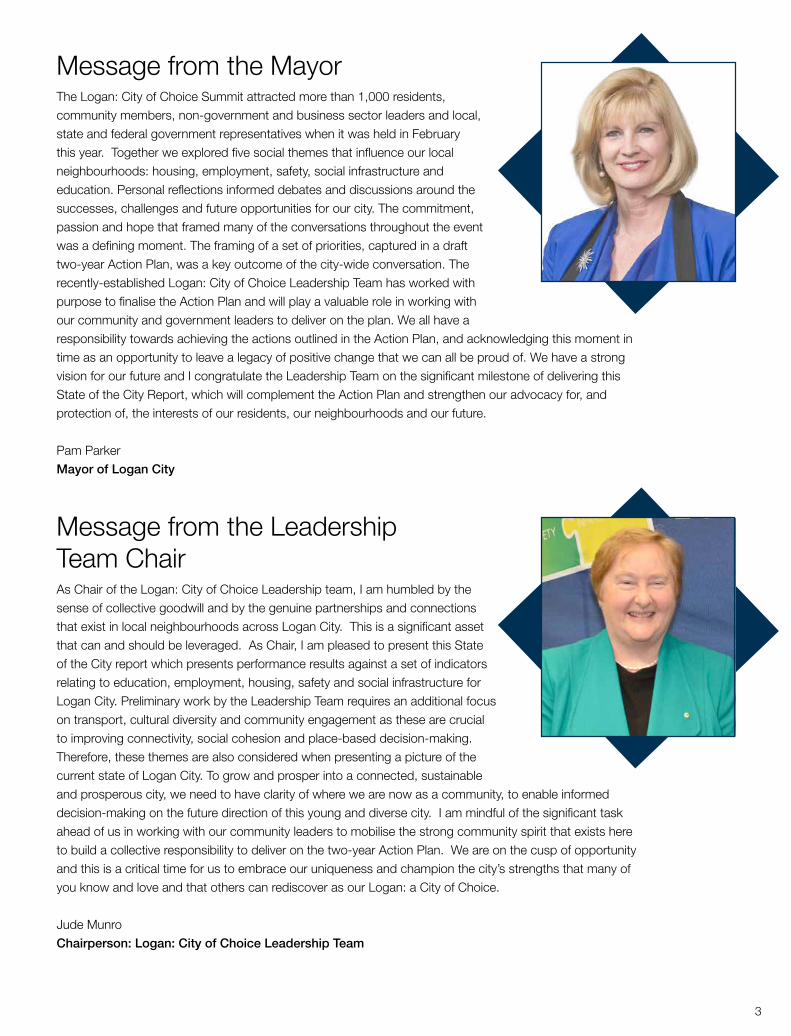
Message from the Mayor The Logan: City of Choice Summit attracted more than 1,000 residents, community members, non-government and business sector leaders and local, state and federal government representatives when it was held in February this year. Together we explored five social themes that influence our local neighbourhoods: housing, employment, safety, social infrastructure and education. Personal reflections informed debates and discussions around the successes, challenges and future opportunities for our city. The commitment, passion and hope that framed many of the conversations throughout the event was a defining moment. The framing of a set of priorities, captured in a draft two-year Action Plan, was a key outcome of the city-wide conversation. The recently-established Logan: City of Choice Leadership Team has worked with purpose to finalise the Action Plan and will play a valuable role in working with our community and government leaders to deliver on the plan. We all have a responsibility towards achieving the actions outlined in the Action Plan, and acknowledging this moment in time as an opportunity to leave a legacy of positive change that we can all be proud of. We have a strong vision for our future and I congratulate the Leadership Team on the significant milestone of delivering this State of the City Report, which will complement the Action Plan and strengthen our advocacy for, and protection of, the interests of our residents, our neighbourhoods and our future.
Pam ParkerMayor of Logan City
Message from the Leadership Team ChairAs Chair of the Logan: City of Choice Leadership team, I am humbled by the sense of collective goodwill and by the genuine partnerships and connections that exist in local neighbourhoods across Logan City. This is a significant asset that can and should be leveraged. As Chair, I am pleased to present this State of the City report which presents performance results against a set of indicators relating to education, employment, housing, safety and social infrastructure for Logan City. Preliminary work by the Leadership Team requires an additional focus on transport, cultural diversity and community engagement as these are crucial to improving connectivity, social cohesion and place-based decision-making. Therefore, these themes are also considered when presenting a picture of the current state of Logan City. To grow and prosper into a connected, sustainable and prosperous city, we need to have clarity of where we are now as a community, to enable informed decision-making on the future direction of this young and diverse city. I am mindful of the significant task ahead of us in working with our community leaders to mobilise the strong community spirit that exists here to build a collective responsibility to deliver on the two-year Action Plan. We are on the cusp of opportunity and this is a critical time for us to embrace our uniqueness and champion the city’s strengths that many of you know and love and that others can rediscover as our Logan: a City of Choice.
Jude MunroChairperson: Logan: City of Choice Leadership Team
3
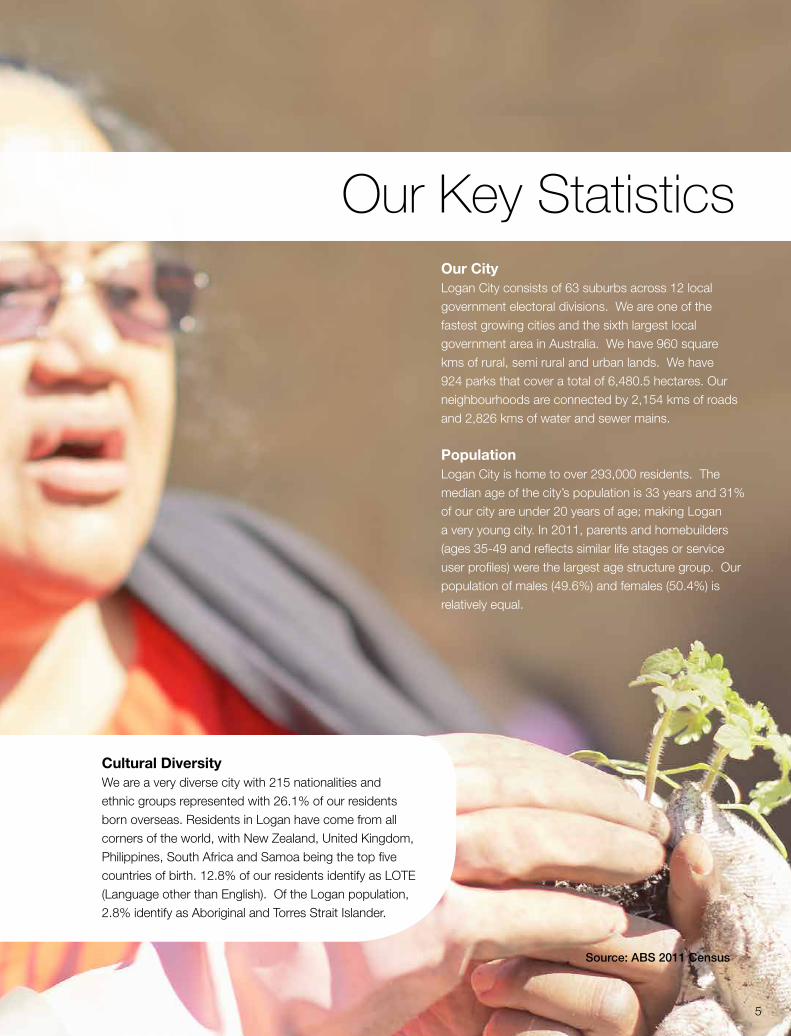
Our Key StatisticsOur CityLogan City consists of 63 suburbs across 12 local government electoral divisions. We are one of the fastest growing cities and the sixth largest local government area in Australia. We have 960 square kms of rural, semi rural and urban lands. We have 924 parks that cover a total of 6,480.5 hectares. Our neighbourhoods are connected by 2,154 kms of roads and 2,826 kms of water and sewer mains.
PopulationLogan City is home to over 293,000 residents. The median age of the city’s population is 33 years and 31% of our city are under 20 years of age; making Logan a very young city. In 2011, parents and homebuilders (ages 35-49 and reflects similar life stages or service user profiles) were the largest age structure group. Our population of males (49.6%) and females (50.4%) is relatively equal.
Cultural DiversityWe are a very diverse city with 215 nationalities and ethnic groups represented with 26.1% of our residents born overseas. Residents in Logan have come from all corners of the world, with New Zealand, United Kingdom, Philippines, South Africa and Samoa being the top five countries of birth. 12.8% of our residents identify as LOTE (Language other than English). Of the Logan population, 2.8% identify as Aboriginal and Torres Strait Islander.
Source: ABS 2011 Census
5
Household StructureIn Logan, we have diverse households. In 2011, 36.4% of our couples have children, 24% of our couples are without children and 14.5% of our households are one parent families. Of our households, 16.9% are lone person households. Of the couples with children, a quarter of couples have three or more children.
Our modes of TransportWe have 2,154 kms of roads, 245 kms of cycle networks and 1,053 kms of footpaths. We are connected regionally by two motorways (Pacific and Logan) and the Mt Lindesay Highway. 67% of us drive to work, while 6.4% of us are passengers in a car. 7.1% of us use public transport (4.5% by bus, 2.6% by train). 36.5% of us own two motor vehicles, while 21.1% of us own three or more vehicles, which indicates that our community is highly dependent on motor vehicles as a mode of transport.
SEIFA: (measures socio-economic disadvantage and a low score indicates a disadvantage)Overall, Logan City scored 970.9 on the SEIFA index of disadvantage, compared with Brisbane at 1047.7. However, there is a range in the SEIFA index across suburbs in Logan, with some areas experiencing some of the highest levels of disadvantage in the region and some areas experiencing the lowest levels of disadvantage in the region and state. This indicates that there are diverse levels of prosperity, needs and interests across the City.
Population GrowthFrom 2001-2011, the fastest growing areas were: Jimboomba to Logan Village, Marsden, Browns Plains, Eagleby and Bethania to Waterford. By 2031, the City is expected to grow by 175,564 people. Logan Village - Jimboomba SLA (Statistical Local Area) is expected to account for 40% of the population growth. This will be the result of the two Priority Development Areas of Greater Flagstone and Yarrabilba.
Emerging GroupsFrom 2006 to 2011, the largest increases in age structure groups occurred with empty nesters and retirees (60-69), young workforce (25-34), babies and preschoolers (0-4), and parents and homebuilders (35 -49).
SustainabilityThe percentage of Logan households with solar power installed has increased from around 2% to over 20% since 2010. Council handles 190,113 tonnes of waste each year and, of that total, 36,970 tonnes is recycled. One of our landfill sites is fitted with a gas collection system and Queensland’s first gas-powered cogeneration plant, which produces enough electricity to power approximately 2,000 homes.
7
Education
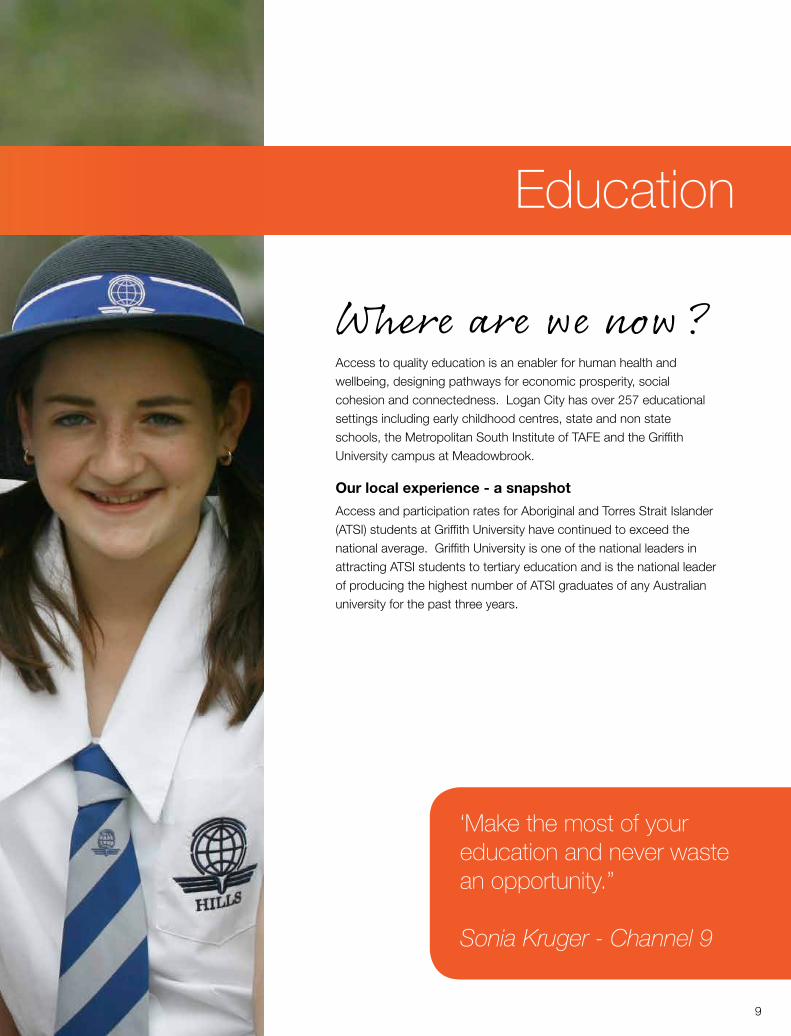
Where are we now?Access to quality education is an enabler for human health and wellbeing, designing pathways for economic prosperity, social cohesion and connectedness. Logan City has over 257 educational settings including early childhood centres, state and non state schools, the Metropolitan South Institute of TAFE and the Griffith University campus at Meadowbrook.
Our local experience - a snapshot
Access and participation rates for Aboriginal and Torres Strait Islander (ATSI) students at Griffith University have continued to exceed the national average. Griffith University is one of the national leaders in attracting ATSI students to tertiary education and is the national leader of producing the highest number of ATSI graduates of any Australian university for the past three years.
‘Make the most of your education and never waste an opportunity.”
Sonia Kruger - Channel 9
9
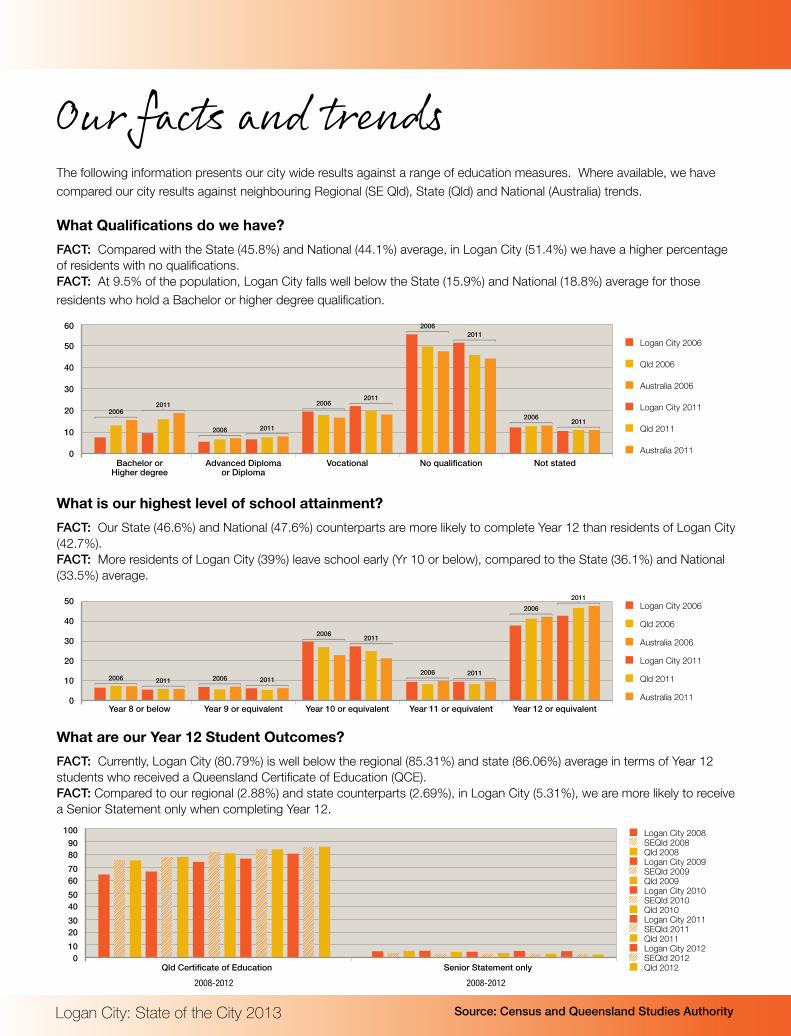
Our facts and trendsThe following information presents our city wide results against a range of education measures. Where available, we have compared our city results against neighbouring Regional (SE Qld), State (Qld) and National (Australia) trends.
What Qualifications do we have?
FACT: Compared with the State (45.8%) and National (44.1%) average, in Logan City (51.4%) we have a higher percentage of residents with no qualifications.FACT: At 9.5% of the population, Logan City falls well below the State (15.9%) and National (18.8%) average for those residents who hold a Bachelor or higher degree qualification.
What is our highest level of school attainment?
FACT: Our State (46.6%) and National (47.6%) counterparts are more likely to complete Year 12 than residents of Logan City (42.7%).FACT: More residents of Logan City (39%) leave school early (Yr 10 or below), compared to the State (36.1%) and National (33.5%) average.
What are our Year 12 Student Outcomes?
FACT: Currently, Logan City (80.79%) is well below the regional (85.31%) and state (86.06%) average in terms of Year 12 students who received a Queensland Certificate of Education (QCE).FACT: Compared to our regional (2.88%) and state counterparts (2.69%), in Logan City (5.31%), we are more likely to receive a Senior Statement only when completing Year 12.
Logan City: State of the City 2013 Source: Census and Queensland Studies Authority
0
10
20
30
40
50
60
Logan City 2006
Not statedNo qualificationVocationalAdvanced Diplomaor Diploma
Bachelor orHigher degree
Qld 2006
Australia 2006
Logan City 2011
Qld 2011
Australia 2011
20062011
2006 2011
20062011
2006 2011
20062011
Year 12 or equivalentYear 11 or equivalentYear 10 or equivalentYear 9 or equivalentYear 8 or below
2006 2011 2006 2011
2006 2011
2006 2011
20062011
0
10
20
30
40
50 Logan City 2006
Qld 2006
Australia 2006
Logan City 2011
Qld 2011
Australia 2011
0
20
40
60
80
10090
70
50
30
10
Senior Statement onlyQld Certificate of Education
Logan City 2008SEQld 2008Qld 2008Logan City 2009SEQld 2009Qld 2009Logan City 2010SEQld 2010Qld 2010Logan City 2011SEQld 2011Qld 2011Logan City 2012SEQld 2012Qld 2012
2008-2012 2008-2012
Education
How satisfied are our students, parents and teachers?
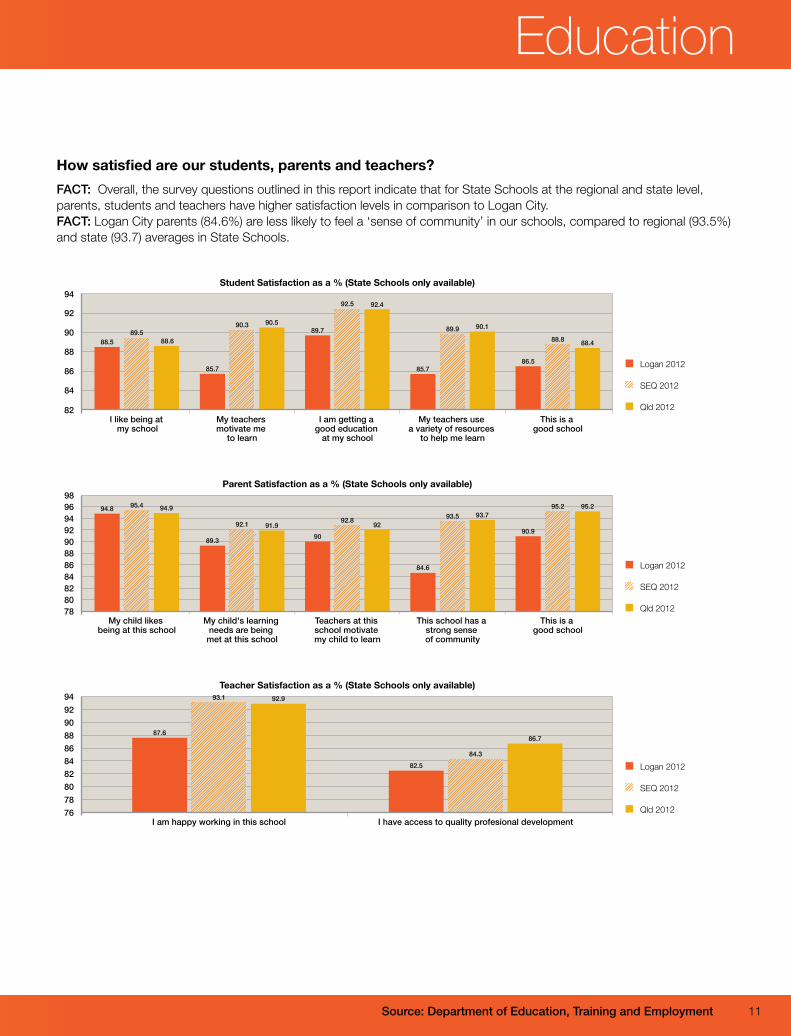
FACT: Overall, the survey questions outlined in this report indicate that for State Schools at the regional and state level, parents, students and teachers have higher satisfaction levels in comparison to Logan City.FACT: Logan City parents (84.6%) are less likely to feel a ‘sense of community’ in our schools, compared to regional (93.5%) and state (93.7) averages in State Schools.
Source: Department of Education, Training and Employment
Student Satisfaction as a % (State Schools only available)
82
84
86
88
90
92
94
Logan 2012
SEQ 2012
Qld 2012
88.589.5
88.6
85.7
90.3 90.589.7
92.5 92.4
85.7
89.9 90.1
86.5
88.8 88.4
This is a good school
My teachers use a variety of resources
to help me learn
I am getting a good education
at my school
My teachers motivate me
to learn
I like being at my school
Parent Satisfaction as a % (State Schools only available)
7880828486889092949698
Logan 2012
SEQ 2012
Qld 2012
94.8 95.4 94.9
89.3
92.1 91.990
92.8 92
84.6
93.5 93.7
90.9
95.2 95.2
This is a good school
This school has a strong sense of community
Teachers at this school motivate my child to learn
My child's learning needs are being met at this school
My child likes being at this school
Teacher Satisfaction as a % (State Schools only available)
76788082848688909294
Logan 2012
SEQ 2012
Qld 2012
87.6
92.993.1
82.584.3
86.7
I have access to quality profesional developmentI am happy working in this school
11
Logan City: State of the City 2013
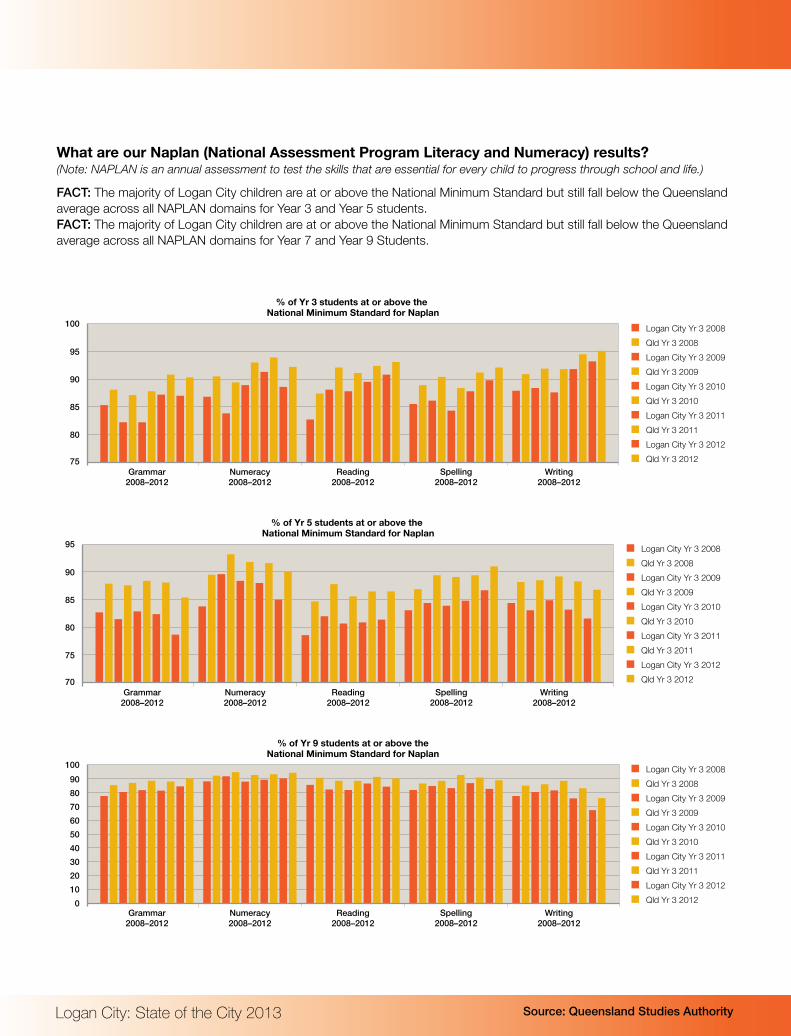
What are our Naplan (National Assessment Program Literacy and Numeracy) results? (Note: NAPLAN is an annual assessment to test the skills that are essential for every child to progress through school and life.)
FACT: The majority of Logan City children are at or above the National Minimum Standard but still fall below the Queensland average across all NAPLAN domains for Year 3 and Year 5 students. FACT: The majority of Logan City children are at or above the National Minimum Standard but still fall below the Queensland average across all NAPLAN domains for Year 7 and Year 9 Students.
Source: Queensland Studies Authority
75
85
95
100
90
80
Grammar2008–2012
Numeracy2008–2012
Reading2008–2012
Spelling2008–2012
Writing2008–2012
Logan City Yr 3 2008Qld Yr 3 2008Logan City Yr 3 2009Qld Yr 3 2009Logan City Yr 3 2010Qld Yr 3 2010Logan City Yr 3 2011Qld Yr 3 2011Logan City Yr 3 2012Qld Yr 3 2012
% of Yr 3 students at or above the National Minimum Standard for Naplan
70
80
90
95
85
75
Logan City Yr 3 2008Qld Yr 3 2008Logan City Yr 3 2009Qld Yr 3 2009Logan City Yr 3 2010Qld Yr 3 2010Logan City Yr 3 2011Qld Yr 3 2011Logan City Yr 3 2012Qld Yr 3 2012
% of Yr 5 students at or above the National Minimum Standard for Naplan
Grammar2008–2012
Numeracy2008–2012
Reading2008–2012
Spelling2008–2012
Writing2008–2012
0102030405060708090
100 Logan City Yr 3 2008Qld Yr 3 2008Logan City Yr 3 2009Qld Yr 3 2009Logan City Yr 3 2010Qld Yr 3 2010Logan City Yr 3 2011Qld Yr 3 2011Logan City Yr 3 2012Qld Yr 3 2012
% of Yr 9 students at or above theNational Minimum Standard for Naplan
Grammar2008–2012
Numeracy2008–2012
Reading2008–2012
Spelling2008–2012
Writing2008–2012
Education
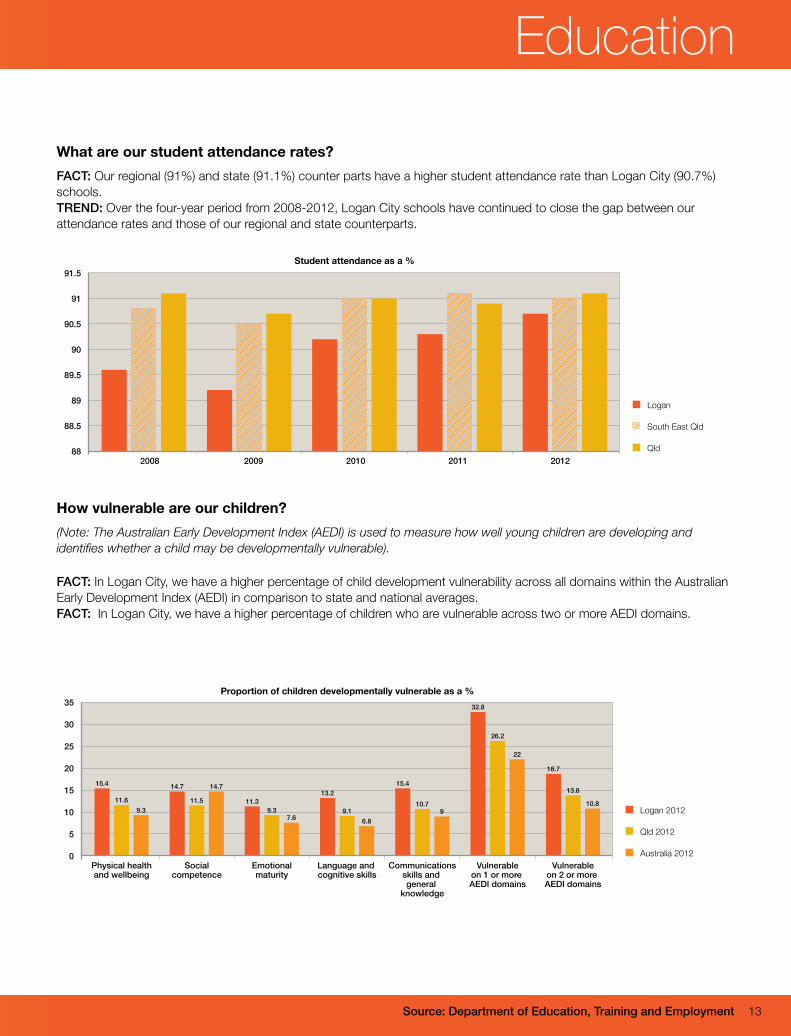
What are our student attendance rates?
FACT: Our regional (91%) and state (91.1%) counter parts have a higher student attendance rate than Logan City (90.7%) schools. TREND: Over the four-year period from 2008-2012, Logan City schools have continued to close the gap between our attendance rates and those of our regional and state counterparts.
Source: Department of Education, Training and Employment
Proportion of children developmentally vulnerable as a %
0
5
10
15
20
25
30
35
Logan 2012
Qld 2012
Australia 2012
15.4
11.69.3
14.7
11.5
14.7
11.39.3
7.6
13.2
9.16.8
15.4
10.79
32.8
26.2
22
18.7
13.8
10.8
Communicationsskills and general
knowledge
Vulnerableon 1 or more AEDI domains
Vulnerableon 2 or more AEDI domains
Language and cognitive skills
Emotionalmaturity
Socialcompetence
Physical healthand wellbeing
How vulnerable are our children?
(Note: The Australian Early Development Index (AEDI) is used to measure how well young children are developing and identifies whether a child may be developmentally vulnerable).
FACT: In Logan City, we have a higher percentage of child development vulnerability across all domains within the Australian Early Development Index (AEDI) in comparison to state and national averages. FACT: In Logan City, we have a higher percentage of children who are vulnerable across two or more AEDI domains.
88
88.5
89
89.5
90
90.5
91
91.5
2008 2009 2010 2011 2012
Student attendance as a %
Logan
South East Qld
Qld
13
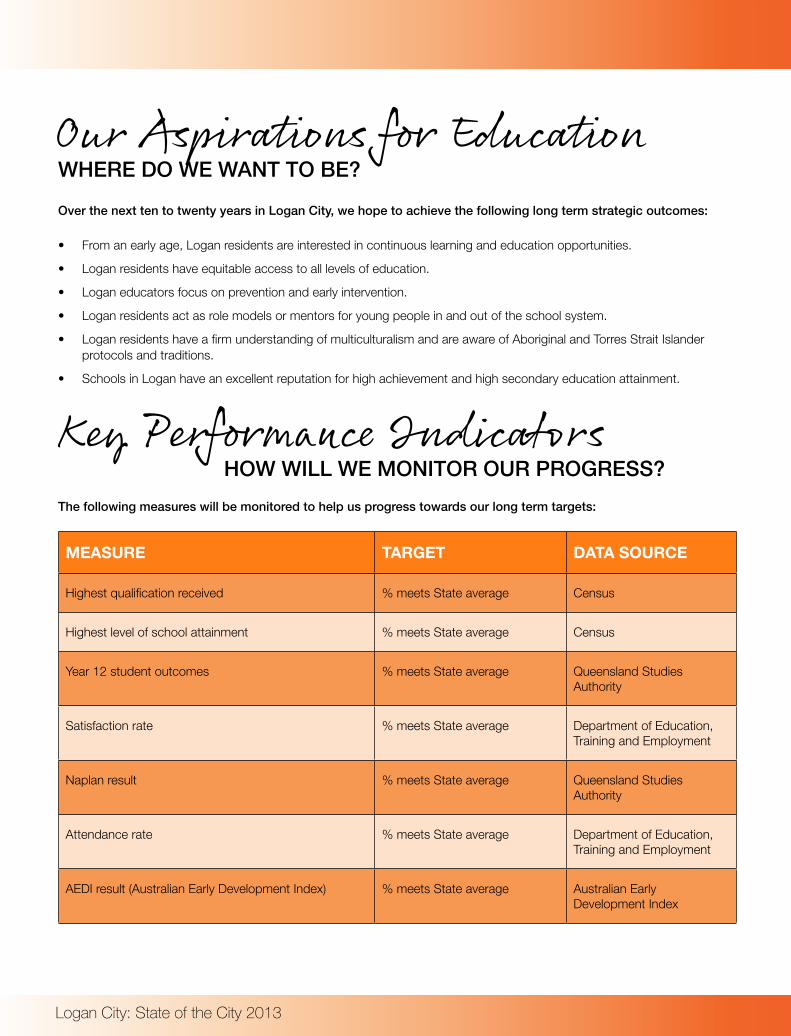
The following measures will be monitored to help us progress towards our long term targets:
MEASURE TARGET DATA SOURCE
Highest qualification received % meets State average Census
Highest level of school attainment % meets State average Census
Year 12 student outcomes % meets State average Queensland Studies Authority
Satisfaction rate % meets State average Department of Education, Training and Employment
Naplan result % meets State average Queensland Studies Authority
Attendance rate % meets State average Department of Education, Training and Employment
AEDI result (Australian Early Development Index) % meets State average Australian Early Development Index
Logan City: State of the City 2013
Our Aspirations for EducationWHERE DO WE WANT TO BE?
Key Performance IndicatorsHOW WILL WE MONITOR OUR PROGRESS?
Over the next ten to twenty years in Logan City, we hope to achieve the following long term strategic outcomes:
• From an early age, Logan residents are interested in continuous learning and education opportunities.
• Logan residents have equitable access to all levels of education.
• Logan educators focus on prevention and early intervention.
• Logan residents act as role models or mentors for young people in and out of the school system.
• Logan residents have a firm understanding of multiculturalism and are aware of Aboriginal and Torres Strait Islander protocols and traditions.
• Schools in Logan have an excellent reputation for high achievement and high secondary education attainment.
Education
John Paul College, Daisy Hill
15
Where are we now?Employment is crucial to addressing disadvantage and is a key enabler for individuals and families to participate fully in society, build strong self esteem and reduce the burden on the social welfare system. In 2012, Logan City had approximately 98,652 local jobs, 20,787 local businesses and a Gross Regional Product (GRP) of $9.26 billion.
Our Local experience: - A snapshot
Kingston Park Raceway is Australia’s largest and most technologically advanced go-karting venue and is a local employer of approximately 55 people. BDS, based in Crestmead, dominates the shelf fitting market in Australia. Intermix Australia at Beenleigh recently entered into a $130 million agreement to export baby formula to China. Work is underway on Southwest 2; the much anticipated $100 million Enterprise Park and is expected to create more than 1,000 jobs in Logan.
Employment
‘I never felt that being an Aboriginal boy from Logan was going to stop me from doing anything.”
Wesley Enoch Qld Theatre Company
17
Logan City: State of the City 2013
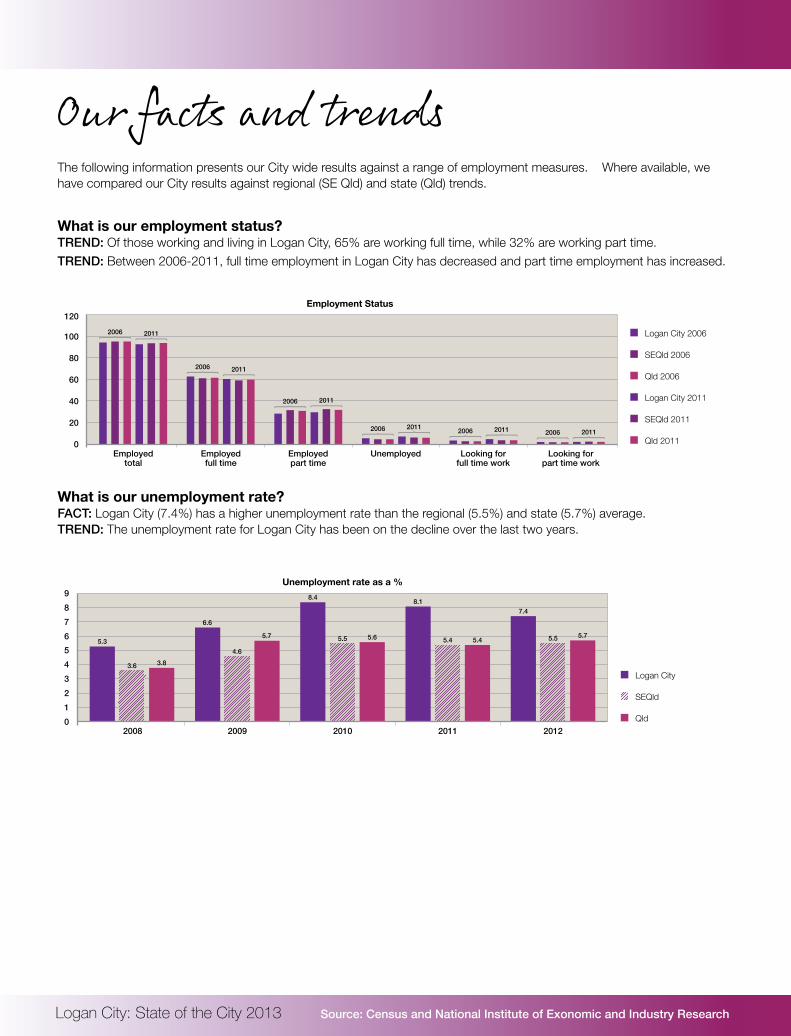
Our facts and trendsThe following information presents our City wide results against a range of employment measures. Where available, we have compared our City results against regional (SE Qld) and state (Qld) trends.
What is our employment status?TREND: Of those working and living in Logan City, 65% are working full time, while 32% are working part time. TREND: Between 2006-2011, full time employment in Logan City has decreased and part time employment has increased.
Source: Census and National Institute of Exonomic and Industry Research
0
20
40
60
80
100
120
Logan City 2006
Looking forfull time work
Looking forpart time work
UnemployedEmployedpart time
Employedfull time
Employedtotal
SEQld 2006
Qld 2006
Logan City 2011
SEQld 2011
Qld 2011
2006 2011
2006 2011
2006 2011
2006 2011 2006 2011 2006 2011
Employment Status
What is our unemployment rate?FACT: Logan City (7.4%) has a higher unemployment rate than the regional (5.5%) and state (5.7%) average. TREND: The unemployment rate for Logan City has been on the decline over the last two years.
Unemployment rate as a %
0123456789
Logan City
SEQld
Qld20122011201020092008
5.3
3.6 3.8
6.6
4.6
5.7
8.4
5.5 5.6
8.1
5.4 5.4
7.4
5.5 5.7
Employment
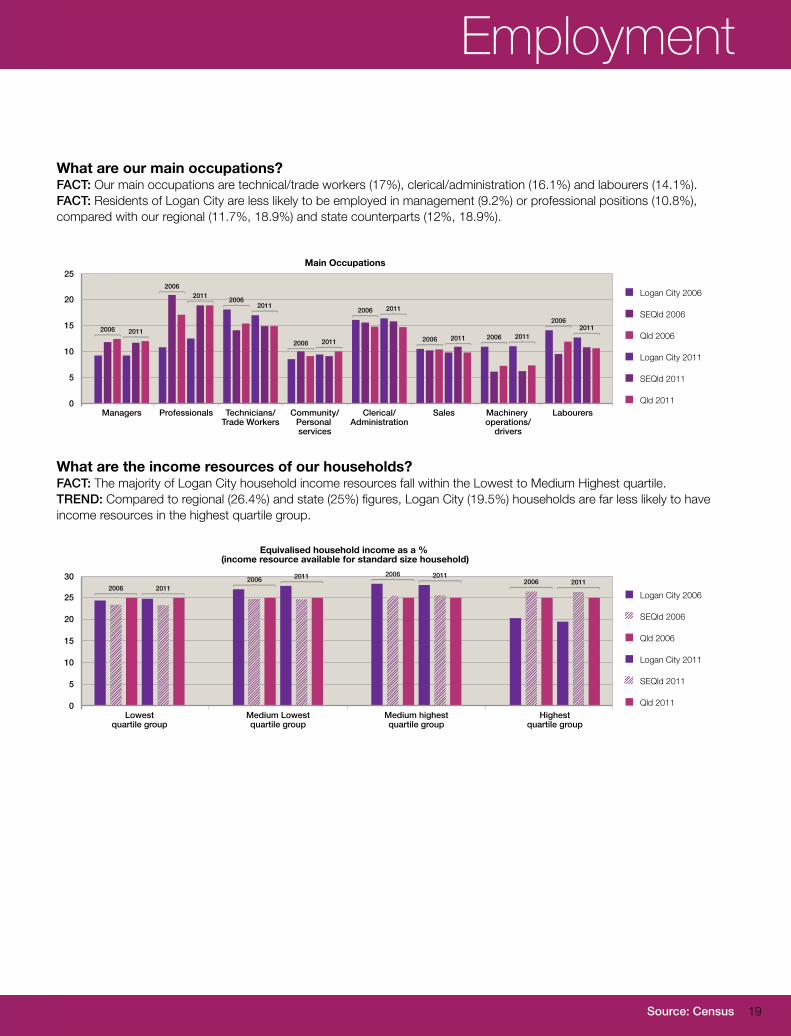
What are our main occupations?FACT: Our main occupations are technical/trade workers (17%), clerical/administration (16.1%) and labourers (14.1%). FACT: Residents of Logan City are less likely to be employed in management (9.2%) or professional positions (10.8%), compared with our regional (11.7%, 18.9%) and state counterparts (12%, 18.9%).
0
5
10
15
20
25
Logan City 2006
Clerical/Administration
Sales Machinery operations/
drivers
LabourersCommunity/Personal services
Technicians/Trade Workers
ProfessionalsManagers
SEQld 2006
Qld 2006
Logan City 2011
SEQld 2011
Qld 2011
2006 2011
20062011 2006
2011
2006 2011
2006 2011
2006 2011 2006 2011
20062011
Main Occupations
What are the income resources of our households?FACT: The majority of Logan City household income resources fall within the Lowest to Medium Highest quartile. TREND: Compared to regional (26.4%) and state (25%) figures, Logan City (19.5%) households are far less likely to have income resources in the highest quartile group.
0
5
10
15
20
25
30
Highestquartile group
Medium highestquartile group
Medium Lowestquartile group
Lowestquartile group
Equivalised household income as a % (income resource available for standard size household)
Logan City 2006
SEQld 2006
Qld 2006
Logan City 2011
SEQld 2011
Qld 2011
2006 2011
2006 20112006 20112006 2011
Source: Census 19
05
101520253035404550
Logan City 2012
Workingfull time
Workingpart-time
Seekingwork
TraineeApprenticeVETCert I−IV
University(degree)
Brisbane Region 2012Qld 2012
Qld 2011Brisbane Region 2011Logan City 2011Qld 2010Brisbane Region 2010Logan City 2010Qld 2009Brisbane Region 2009Logan City 20092009−2012
2009−2012
2009−20122009−2012
2009−2012
2009−20122009−2012
Main destination of Yr 12 Completers
Logan City: State of the City 2013 Source: Census and Deparment of Education, Training and Employment
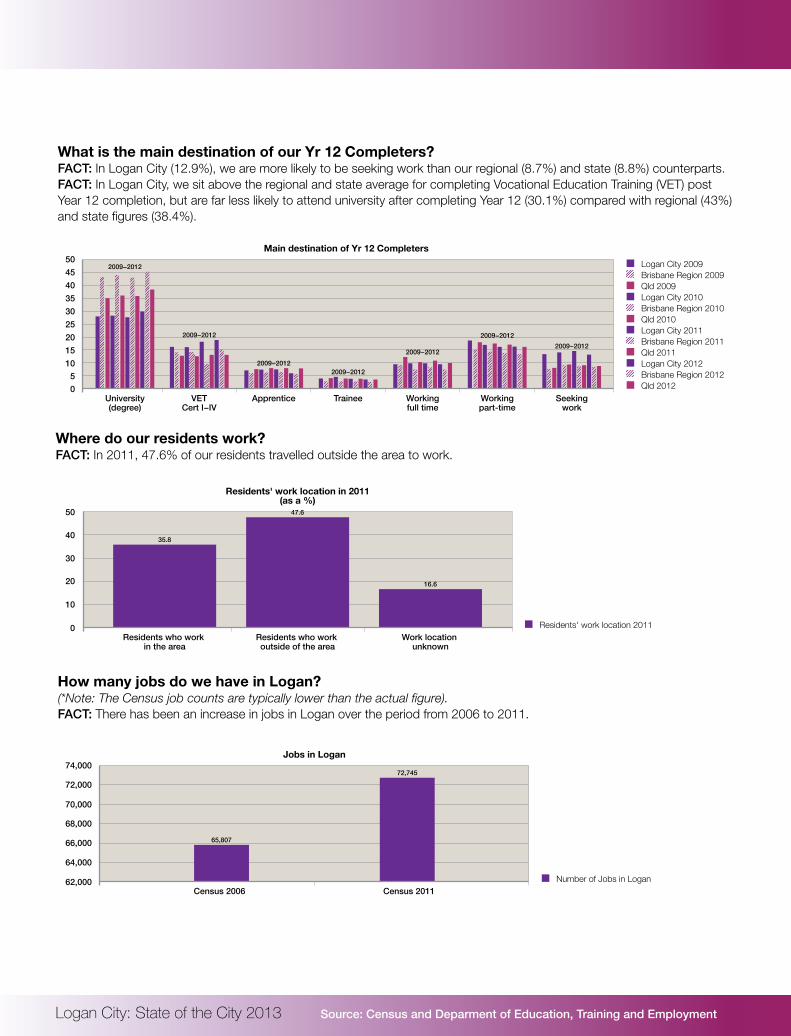
What is the main destination of our Yr 12 Completers?FACT: In Logan City (12.9%), we are more likely to be seeking work than our regional (8.7%) and state (8.8%) counterparts. FACT: In Logan City, we sit above the regional and state average for completing Vocational Education Training (VET) post Year 12 completion, but are far less likely to attend university after completing Year 12 (30.1%) compared with regional (43%) and state figures (38.4%).
Where do our residents work?FACT: In 2011, 47.6% of our residents travelled outside the area to work.
Residents' work location in 2011(as a %)
0
10
20
30
40
50
Residents' work location 2011
35.8
47.6
16.6
Work location unknown
Residents who work in the area
Residents who work outside of the area
Jobs in Logan
62,000
64,000
66,000
68,000
70,000
72,000
74,000
Number of Jobs in Logan
72,745
65,807
Census 2011Census 2006
How many jobs do we have in Logan?(*Note: The Census job counts are typically lower than the actual figure).FACT: There has been an increase in jobs in Logan over the period from 2006 to 2011.
Employment
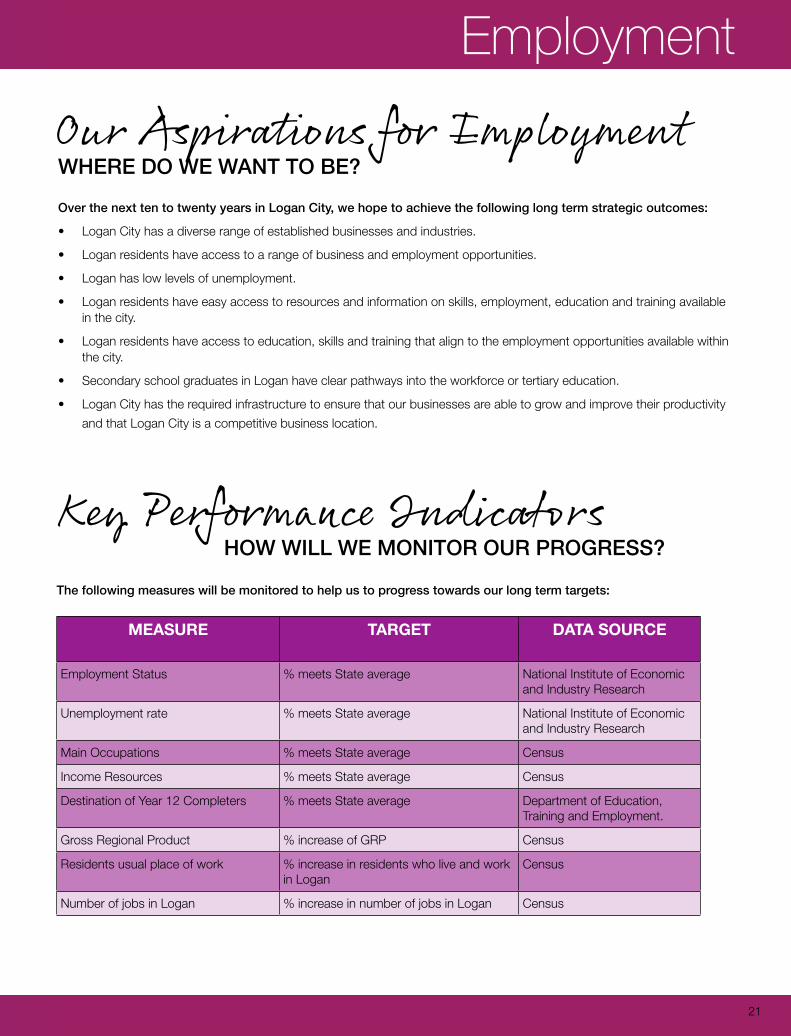
Our Aspirations for EmploymentWHERE DO WE WANT TO BE?
Key Performance IndicatorsHOW WILL WE MONITOR OUR PROGRESS?
Over the next ten to twenty years in Logan City, we hope to achieve the following long term strategic outcomes:
• Logan City has a diverse range of established businesses and industries.
• Logan residents have access to a range of business and employment opportunities.
• Logan has low levels of unemployment.
• Logan residents have easy access to resources and information on skills, employment, education and training available in the city.
• Logan residents have access to education, skills and training that align to the employment opportunities available within the city.
• Secondary school graduates in Logan have clear pathways into the workforce or tertiary education.
• Logan City has the required infrastructure to ensure that our businesses are able to grow and improve their productivity
and that Logan City is a competitive business location.
The following measures will be monitored to help us to progress towards our long term targets:
MEASURE TARGET DATA SOURCE
Employment Status % meets State average National Institute of Economic and Industry Research
Unemployment rate % meets State average National Institute of Economic and Industry Research
Main Occupations % meets State average Census
Income Resources % meets State average Census
Destination of Year 12 Completers % meets State average Department of Education, Training and Employment.
Gross Regional Product % increase of GRP Census
Residents usual place of work % increase in residents who live and work in Logan
Census
Number of jobs in Logan % increase in number of jobs in Logan Census
21
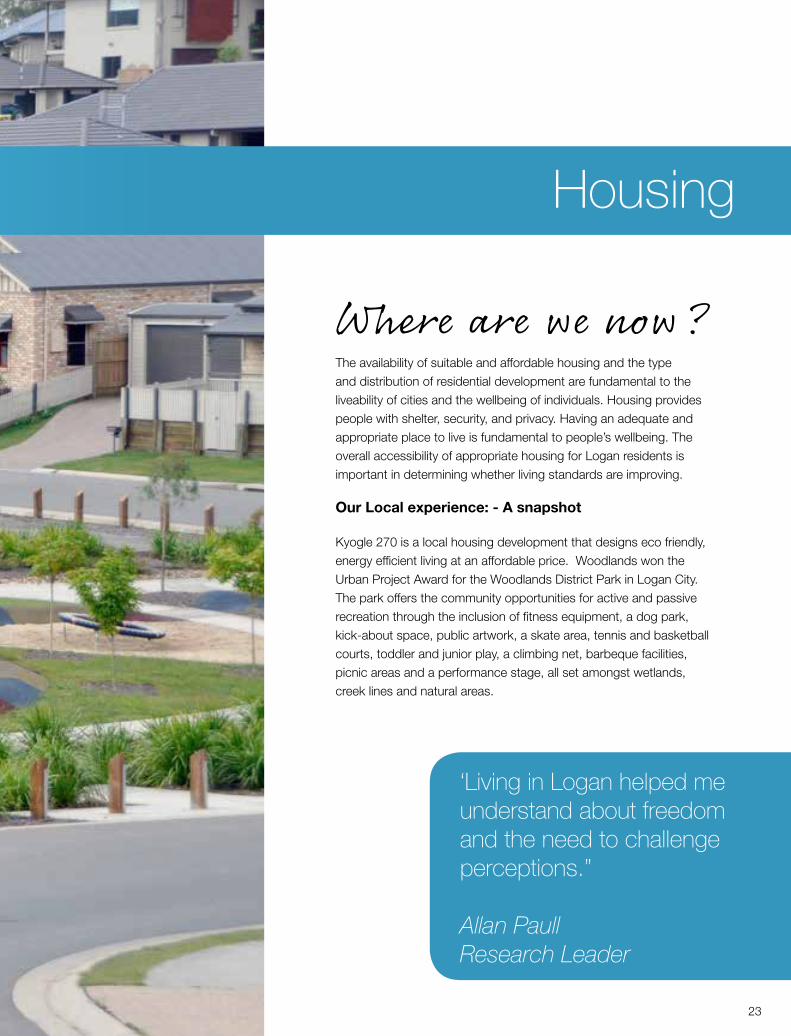
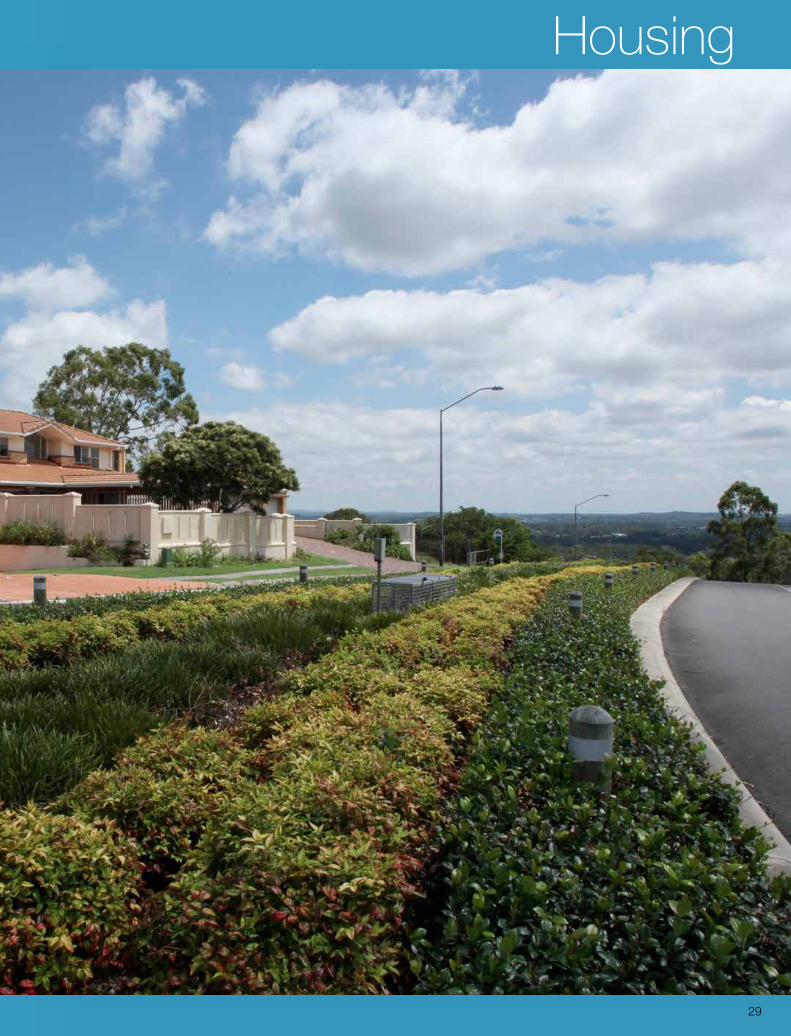
Where are we now?The availability of suitable and affordable housing and the type and distribution of residential development are fundamental to the liveability of cities and the wellbeing of individuals. Housing provides people with shelter, security, and privacy. Having an adequate and appropriate place to live is fundamental to people’s wellbeing. The overall accessibility of appropriate housing for Logan residents is important in determining whether living standards are improving.
Our Local experience: - A snapshot
Kyogle 270 is a local housing development that designs eco friendly, energy efficient living at an affordable price. Woodlands won the Urban Project Award for the Woodlands District Park in Logan City. The park offers the community opportunities for active and passive recreation through the inclusion of fitness equipment, a dog park, kick-about space, public artwork, a skate area, tennis and basketball courts, toddler and junior play, a climbing net, barbeque facilities, picnic areas and a performance stage, all set amongst wetlands, creek lines and natural areas.
Housing
‘Living in Logan helped me understand about freedom and the need to challenge perceptions.”
Allan PaullResearch Leader
23
Logan City: State of the City 2013 Source: Census
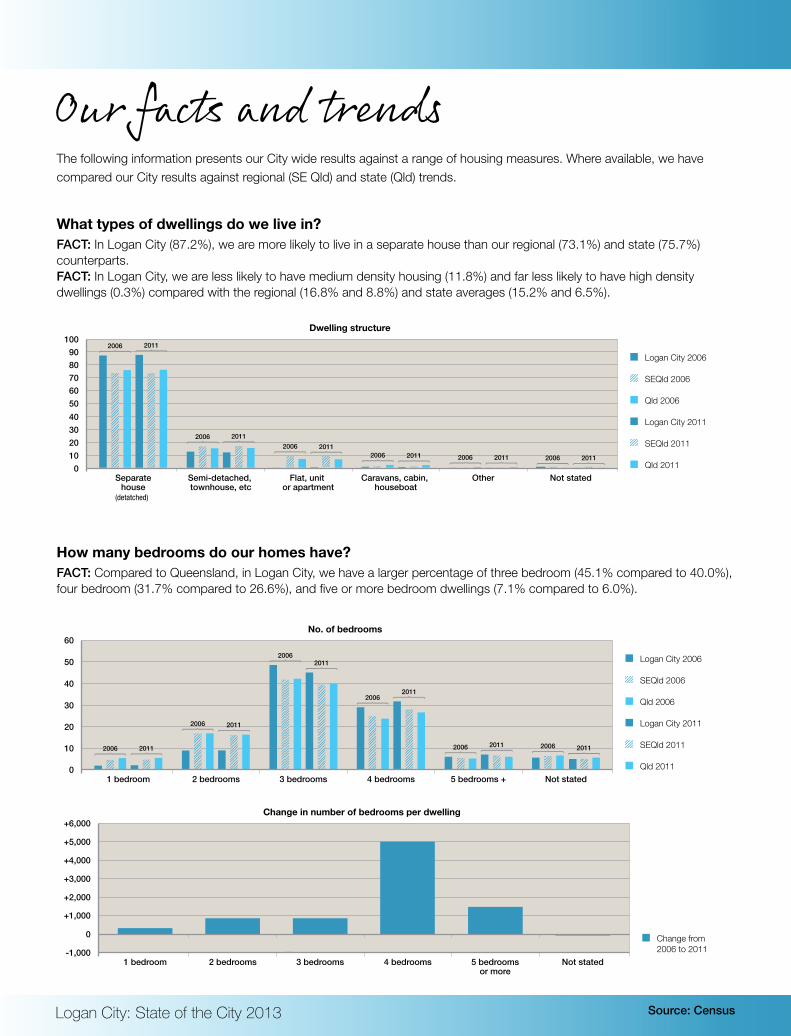
Our facts and trendsThe following information presents our City wide results against a range of housing measures. Where available, we have compared our City results against regional (SE Qld) and state (Qld) trends.
What types of dwellings do we live in?FACT: In Logan City (87.2%), we are more likely to live in a separate house than our regional (73.1%) and state (75.7%) counterparts. FACT: In Logan City, we are less likely to have medium density housing (11.8%) and far less likely to have high density dwellings (0.3%) compared with the regional (16.8% and 8.8%) and state averages (15.2% and 6.5%).
How many bedrooms do our homes have?FACT: Compared to Queensland, in Logan City, we have a larger percentage of three bedroom (45.1% compared to 40.0%), four bedroom (31.7% compared to 26.6%), and five or more bedroom dwellings (7.1% compared to 6.0%).
0
10
20
30
40
50
60
Logan City 2006
5 bedrooms + Not stated4 bedrooms3 bedrooms2 bedrooms1 bedroom
SEQld 2006
Qld 2006
Logan City 2011
SEQld 2011
Qld 2011
2006 2011
2006 2011
20062011
20062011
2006 2011 2006 2011
No. of bedrooms
-1,000
0
+1,000
+2,000
+3,000
+4,000
+5,000
+6,000
5 bedroomsor more
Not stated4 bedrooms3 bedrooms2 bedrooms1 bedroom
Change from2006 to 2011
Change in number of bedrooms per dwelling
0102030405060708090
100
Logan City 2006
Other Not statedCaravans, cabin, houseboat
Flat, unit or apartment
Semi-detached, townhouse, etc
Separatehouse
SEQld 2006
Qld 2006
Logan City 2011
SEQld 2011
Qld 2011
2006 2011
2006 20112006 2011
2006 2011 2006 2011 2006 2011
Dwelling structure
(detatched)
Housing
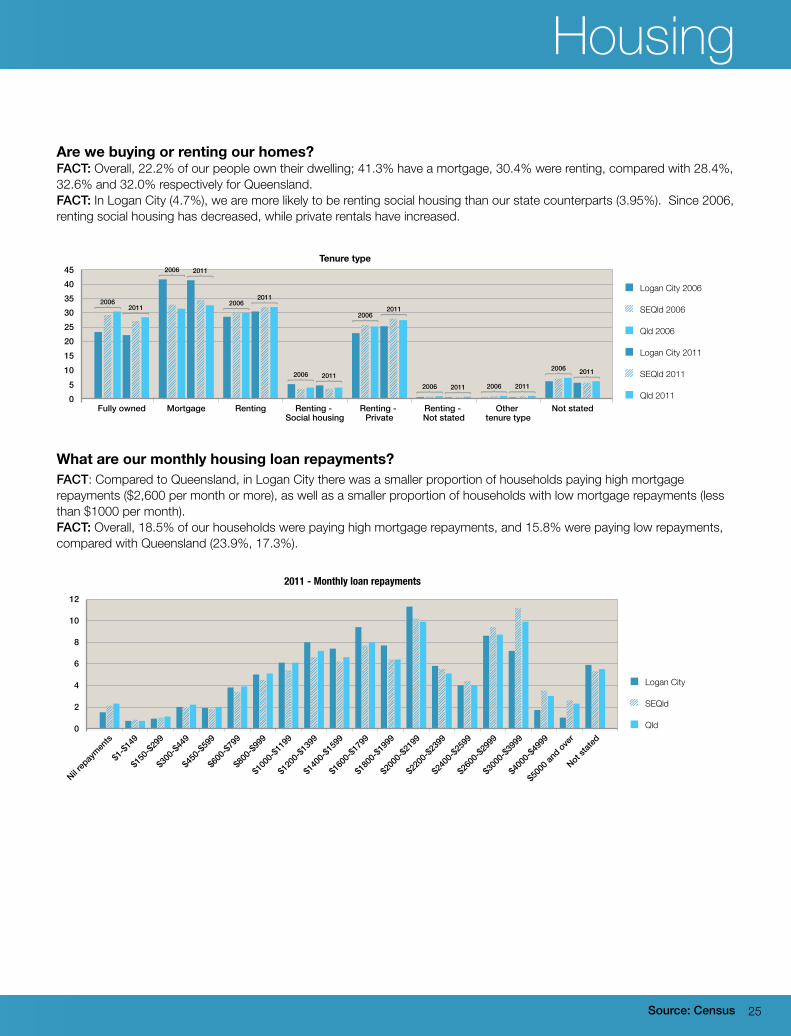
Are we buying or renting our homes?FACT: Overall, 22.2% of our people own their dwelling; 41.3% have a mortgage, 30.4% were renting, compared with 28.4%, 32.6% and 32.0% respectively for Queensland. FACT: In Logan City (4.7%), we are more likely to be renting social housing than our state counterparts (3.95%). Since 2006, renting social housing has decreased, while private rentals have increased.
05
1015202530354045
Renting - Private
Renting - Not stated
Other tenure type
Not statedRenting - Social housing
RentingMortgageFully owned
20062011
2006 2011
20062011
2006 2011
20062011
2006 2011 2006 2011
2006 2011
Tenure type
Logan City 2006
SEQld 2006
Qld 2006
Logan City 2011
SEQld 2011
Qld 2011
What are our monthly housing loan repayments?FACT: Compared to Queensland, in Logan City there was a smaller proportion of households paying high mortgage repayments ($2,600 per month or more), as well as a smaller proportion of households with low mortgage repayments (less than $1000 per month).FACT: Overall, 18.5% of our households were paying high mortgage repayments, and 15.8% were paying low repayments, compared with Queensland (23.9%, 17.3%).
0
2
4
6
8
10
12
Nil rep
aymen
ts
$1-$1
49
$150
-$299
$300
-$449
$450
-$599
$600
-$799
$800
-$999
$100
0-$11
99
$120
0-$13
99
$140
0-$15
99
$160
0-$17
99
$180
0-$19
99
$200
0-$21
99
$220
0-$23
99
$240
0-$25
99
$260
0-$29
99
$300
0-$39
99
$400
0-$49
99
$500
0 and
over
Not stat
ed
Loan repayment
Logan City
SEQld
Qld
Source: Census
2011 - Monthly loan repayments
25
Logan City: State of the City 2013 Source: Census
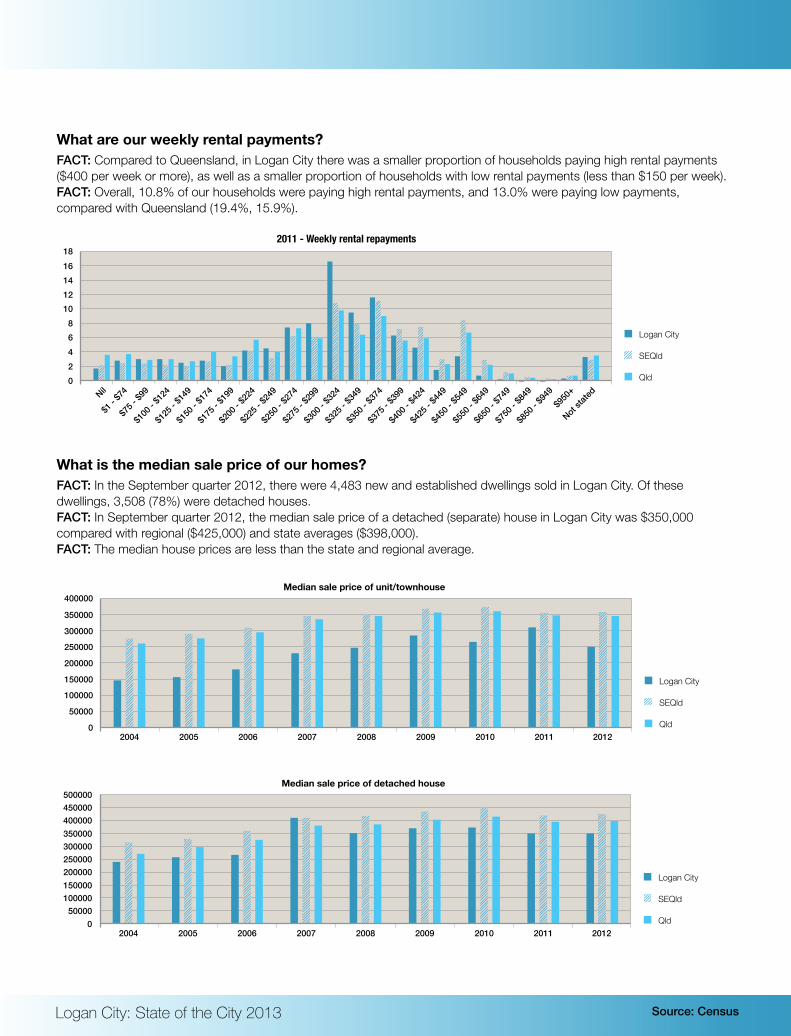
What are our weekly rental payments?FACT: Compared to Queensland, in Logan City there was a smaller proportion of households paying high rental payments ($400 per week or more), as well as a smaller proportion of households with low rental payments (less than $150 per week). FACT: Overall, 10.8% of our households were paying high rental payments, and 13.0% were paying low payments, compared with Queensland (19.4%, 15.9%).
02468
1012141618
Nil
$1 - $
74
$75 -
$99
$100
- $12
4
$125
- $14
9
$150
- $17
4
$175
- $19
9
$200
- $22
4
$225
- $24
9
$250
- $27
4
$275
- $29
9
$300
- $32
4
$325
- $34
9
$350
- $37
4
$375
- $39
9
$400
- $42
4
$425
- $44
9
$450
- $54
9
$550
- $64
9
$650
- $74
9
$750
- $84
9
$850
- $94
9$9
50+
Not stat
ed
Monthly to Weekly
Logan City
SEQld
Qld
What is the median sale price of our homes?FACT: In the September quarter 2012, there were 4,483 new and established dwellings sold in Logan City. Of these dwellings, 3,508 (78%) were detached houses. FACT: In September quarter 2012, the median sale price of a detached (separate) house in Logan City was $350,000 compared with regional ($425,000) and state averages ($398,000).FACT: The median house prices are less than the state and regional average.
0
50000
100000
150000
200000
250000
300000
350000
400000
2004 2005 2006 2007 2008 2009 2010 2011 2012
Logan City
SEQld
Qld
Median sale price of unit/townhouse
050000
100000150000200000250000300000350000400000450000500000
2004 2005 2006 2007 2008 2009 2010 2011 2012
Logan City
SEQld
Qld
Median sale price of detached house
2011 - Weekly rental repayments
Housing
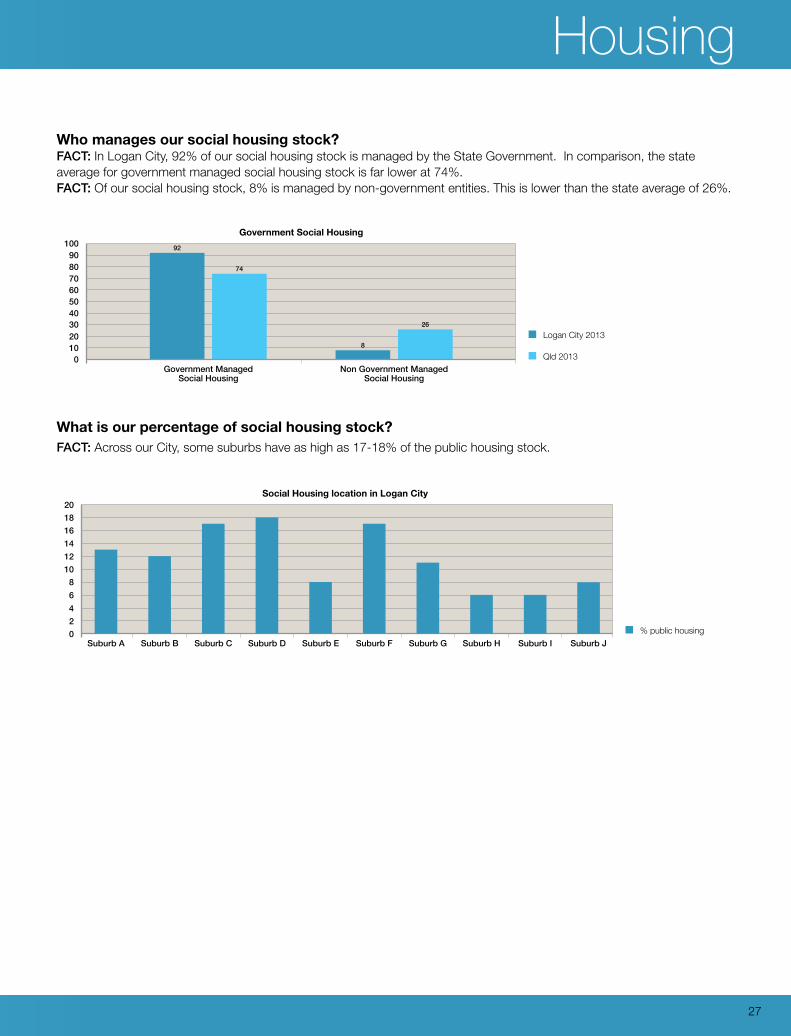
Who manages our social housing stock?FACT: In Logan City, 92% of our social housing stock is managed by the State Government. In comparison, the state average for government managed social housing stock is far lower at 74%. FACT: Of our social housing stock, 8% is managed by non-government entities. This is lower than the state average of 26%.
Logan City 2013
Qld 2013
Government Social Housing
0102030405060708090
100 92
74
8
26
Non Government ManagedSocial Housing
Government ManagedSocial Housing
02468
101214161820
Social Housing location in Logan City
% public housingSuburb B Suburb C Suburb D Suburb E Suburb F Suburb G Suburb H Suburb I Suburb JSuburb A
What is our percentage of social housing stock?FACT: Across our City, some suburbs have as high as 17-18% of the public housing stock.
27
Logan City: State of the City 2013
Our Aspirations for HousingWHERE DO WE WANT TO BE?
Key Performance IndicatorsHOW WILL WE MONITOR OUR PROGRESS?
Over the next ten to twenty years in Logan City, we hope to achieve the following long term strategic outcomes:
• Logan has a diverse range of housing choices that are well located, affordable, energy efficient and responsive to the needs of our diverse community.
• Logan has social housing that is renewed, secure and affordable for low and moderate income families and individuals.
• Logan provides for real and sustainable pathways out of homelessness to long-term housing.
• Logan residents have access to information and support services to facilitate opportunities and remove barriers to
secure private rental housing.
The following measures will be monitored to help us to progress towards our long term targets:
MEASURE TARGET DATA SOURCE
Housing diversity % increase in semi-attached and attached housing units Census
% increase in the number of one and two bedroom units Census
% decrease in government managed social house Department of Housing and Public Works
% increase in non government managed social housing Department of Housing and Public Works
No net increase on % of social housing stock in the top 10 suburbs
Department of Housing and Public Works
Housing cost Median sale price for a detached house is lower than the State average
Census
Median sale price for a unit/townhouse is lower than the State average
Census
Median weekly rent for a detached house is lower than the State average
Census
Median weekly rent for a unit/townhouse is lower than the State average
Census
Median sale price of detached house is lower than the State average
Department of Housing and Public Works
Median sale price of a unit/townhouse is lower than the State average
Department of Housing and Public Works
Housing
29
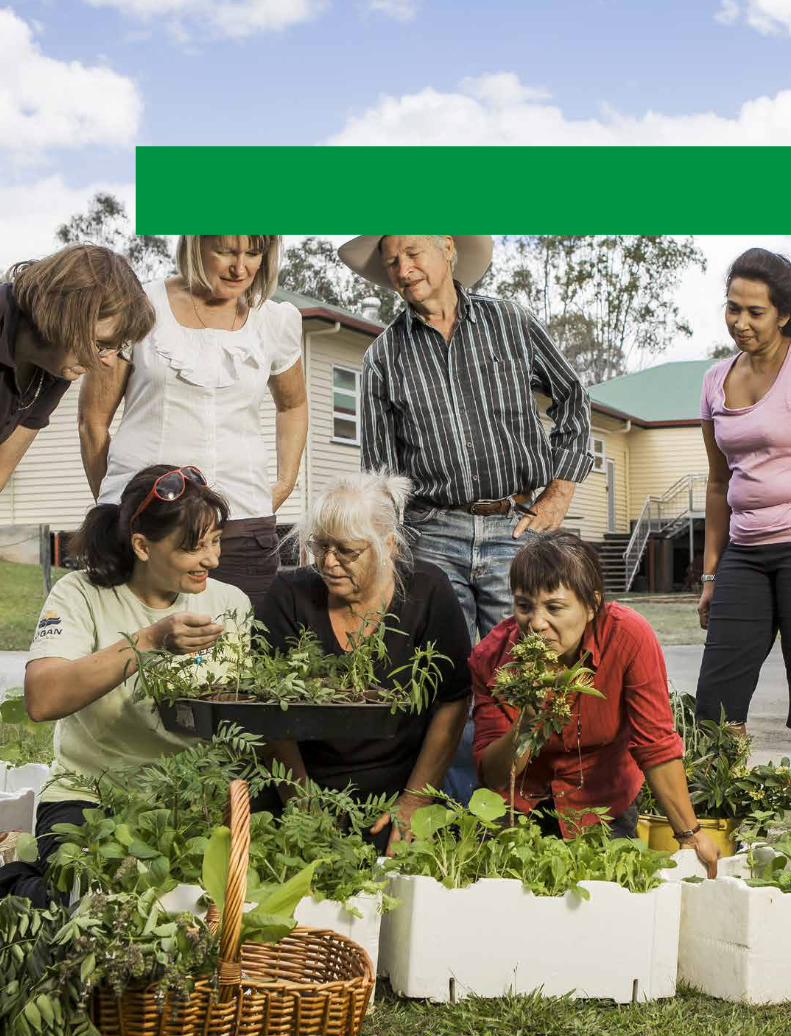
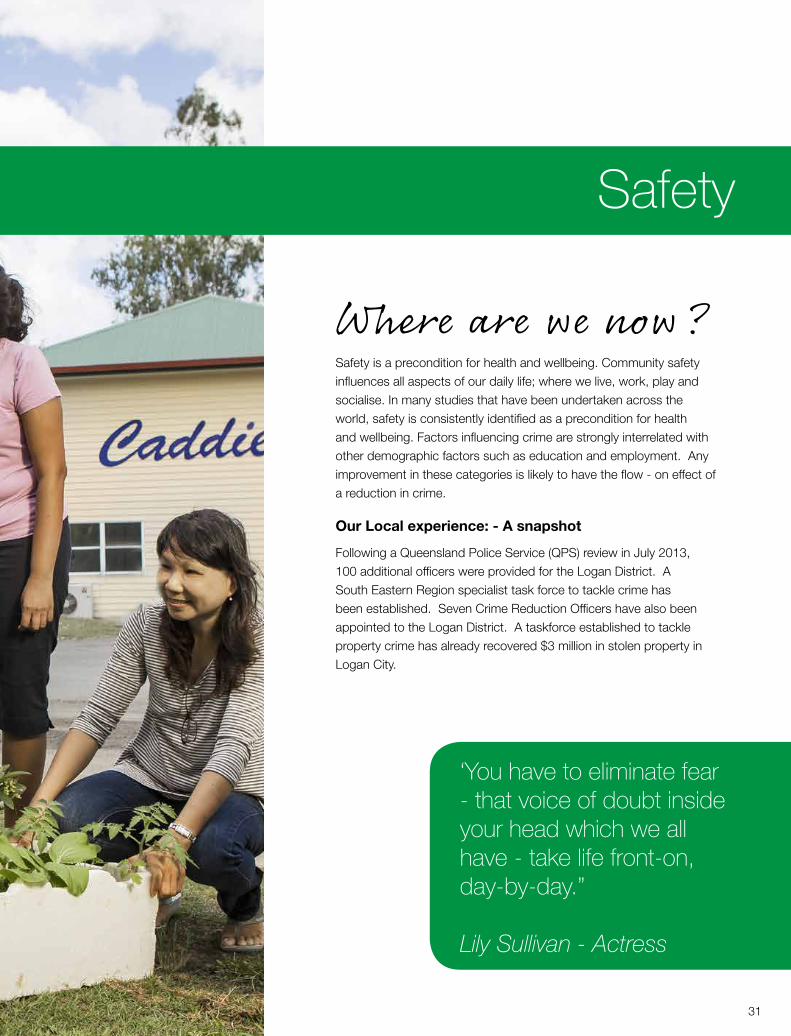
Where are we now?Safety is a precondition for health and wellbeing. Community safety influences all aspects of our daily life; where we live, work, play and socialise. In many studies that have been undertaken across the world, safety is consistently identified as a precondition for health and wellbeing. Factors influencing crime are strongly interrelated with other demographic factors such as education and employment. Any improvement in these categories is likely to have the flow - on effect of a reduction in crime.
Our Local experience: - A snapshot
Following a Queensland Police Service (QPS) review in July 2013, 100 additional officers were provided for the Logan District. A South Eastern Region specialist task force to tackle crime has been established. Seven Crime Reduction Officers have also been appointed to the Logan District. A taskforce established to tackle property crime has already recovered $3 million in stolen property in Logan City.
Safety
‘You have to eliminate fear - that voice of doubt inside your head which we all have - take life front-on, day-by-day.”
Lily Sullivan - Actress
31
Logan City: State of the City 2013 Source: Qld Police Service
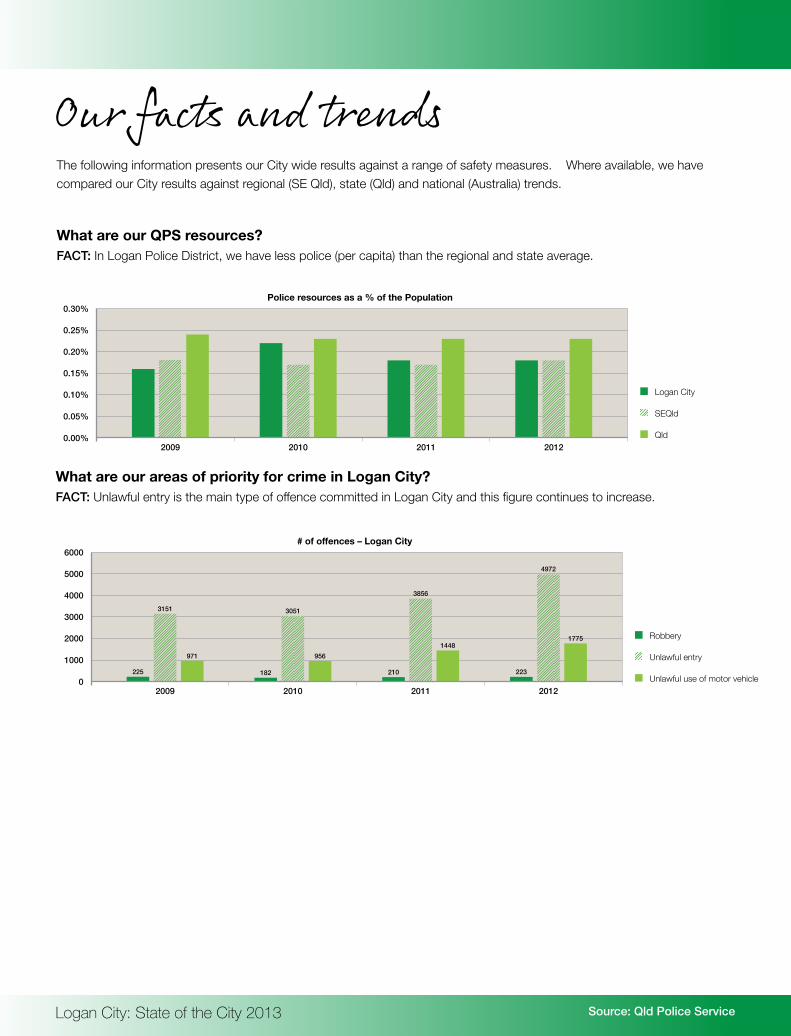
Our facts and trendsThe following information presents our City wide results against a range of safety measures. Where available, we have compared our City results against regional (SE Qld), state (Qld) and national (Australia) trends.
What are our QPS resources?FACT: In Logan Police District, we have less police (per capita) than the regional and state average.
What are our areas of priority for crime in Logan City?FACT: Unlawful entry is the main type of offence committed in Logan City and this figure continues to increase.
0.00%
0.05%
0.10%
0.15%
0.20%
0.25%
0.30%Police resources as a % of the Population
2009 2010 2011 2012
Logan City
SEQld
Qld
0
1000
2000
3000
4000
5000
6000# of offences – Logan City
2009 2010 2011 2012
Robbery
Unlawful entry
Unlawful use of motor vehicle225
3151
971
182
3051
956
210
3856
1448
223
4972
1775
Safety
Source: Census and Qld Police Service
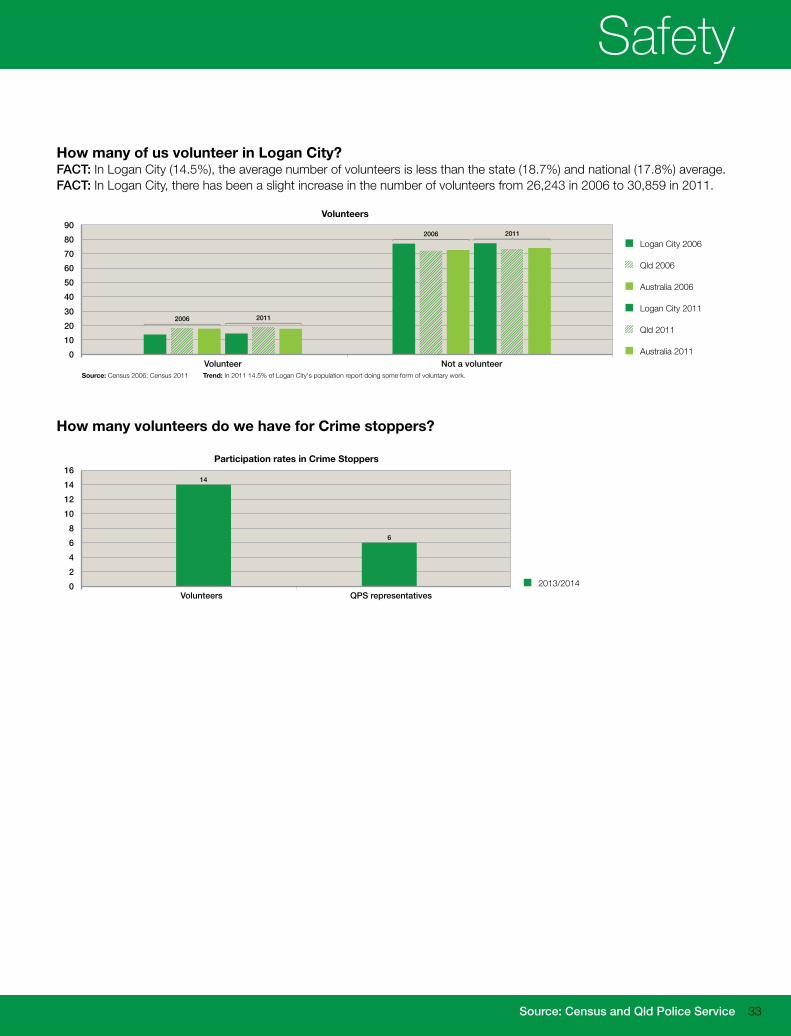
How many of us volunteer in Logan City?FACT: In Logan City (14.5%), the average number of volunteers is less than the state (18.7%) and national (17.8%) average. FACT: In Logan City, there has been a slight increase in the number of volunteers from 26,243 in 2006 to 30,859 in 2011.
How many volunteers do we have for Crime stoppers?
Participation rates in Crime Stoppers
02468
10121416
2013/2014
6
14
QPS representativesVolunteers
0102030405060708090
Volunteers
Volunteer Not a volunteer
2006 2011
2006 2011
Source: Census 2006; Census 2011 Trend: In 2011 14.5% of Logan City's population report doing some form of voluntary work.
Logan City 2006
Qld 2006
Australia 2006
Logan City 2011
Qld 2011
Australia 2011
33
Logan City: State of the City 2013
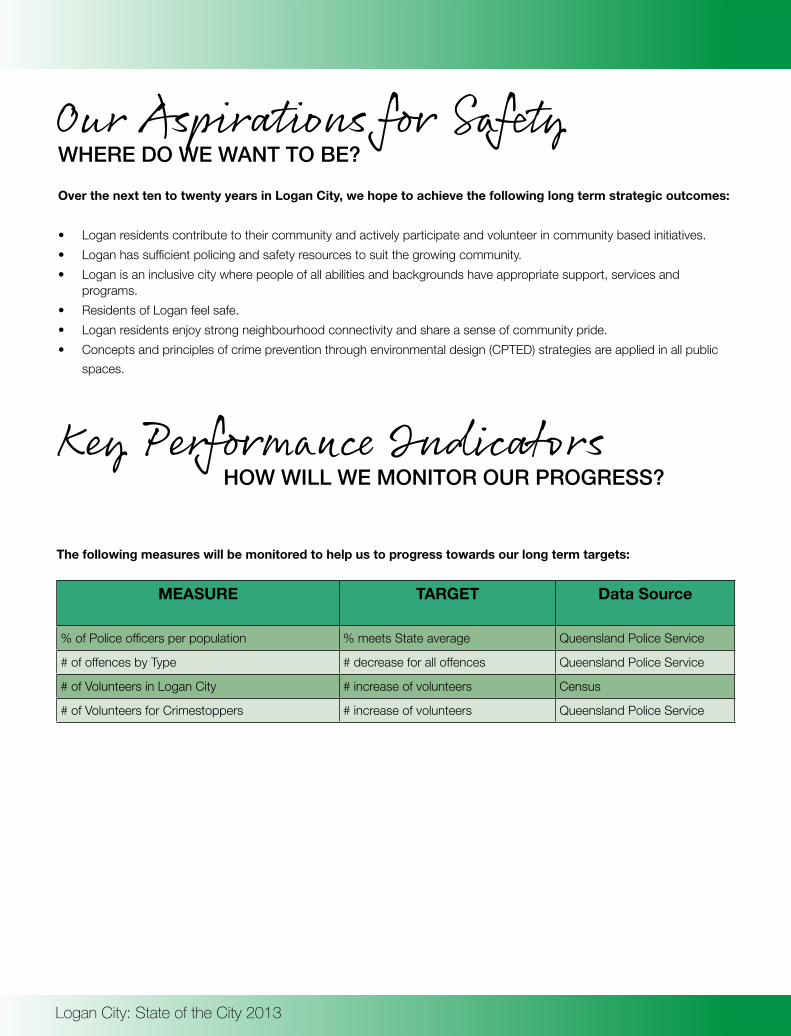
Our Aspirations for SafetyWHERE DO WE WANT TO BE?
Key Performance IndicatorsHOW WILL WE MONITOR OUR PROGRESS?
Over the next ten to twenty years in Logan City, we hope to achieve the following long term strategic outcomes:
• Logan residents contribute to their community and actively participate and volunteer in community based initiatives.
• Logan has sufficient policing and safety resources to suit the growing community.
• Logan is an inclusive city where people of all abilities and backgrounds have appropriate support, services and programs.
• Residents of Logan feel safe.
• Logan residents enjoy strong neighbourhood connectivity and share a sense of community pride.
• Concepts and principles of crime prevention through environmental design (CPTED) strategies are applied in all public
spaces.
The following measures will be monitored to help us to progress towards our long term targets:
MEASURE TARGET Data Source
% of Police officers per population % meets State average Queensland Police Service
# of offences by Type # decrease for all offences Queensland Police Service
# of Volunteers in Logan City # increase of volunteers Census
# of Volunteers for Crimestoppers # increase of volunteers Queensland Police Service
Safety
35
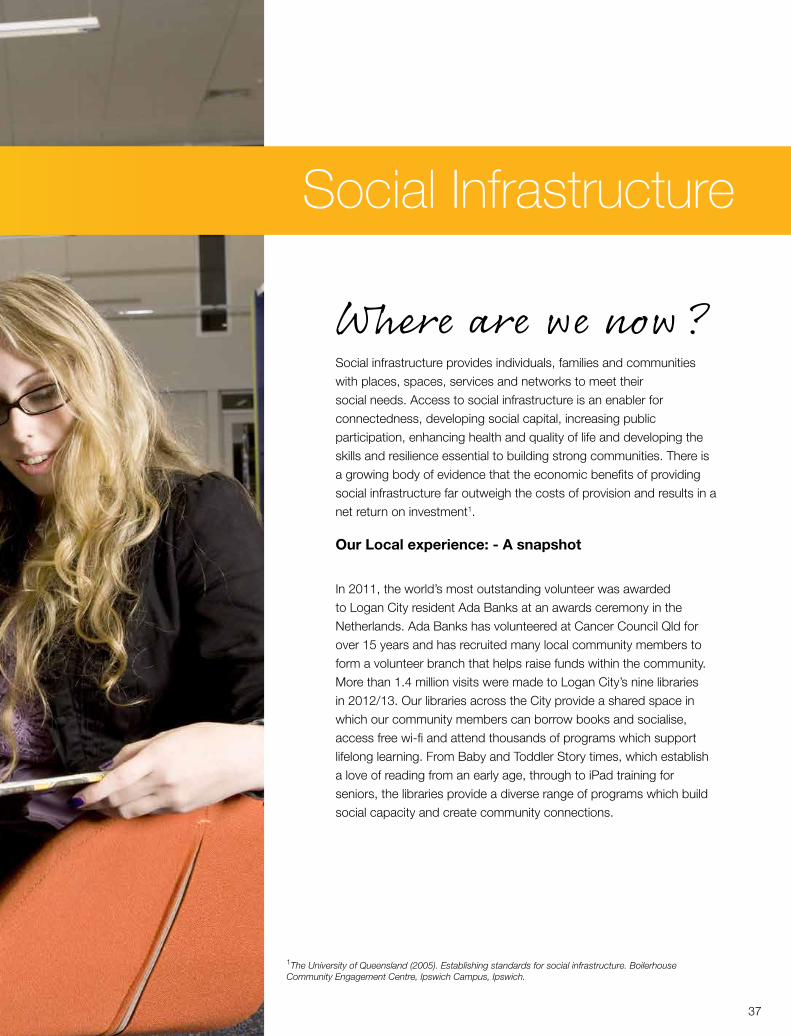
Where are we now?Social infrastructure provides individuals, families and communities with places, spaces, services and networks to meet their social needs. Access to social infrastructure is an enabler for connectedness, developing social capital, increasing public participation, enhancing health and quality of life and developing the skills and resilience essential to building strong communities. There is a growing body of evidence that the economic benefits of providing social infrastructure far outweigh the costs of provision and results in a net return on investment1.
Our Local experience: - A snapshot
In 2011, the world’s most outstanding volunteer was awarded to Logan City resident Ada Banks at an awards ceremony in the Netherlands. Ada Banks has volunteered at Cancer Council Qld for over 15 years and has recruited many local community members to form a volunteer branch that helps raise funds within the community. More than 1.4 million visits were made to Logan City’s nine libraries in 2012/13. Our libraries across the City provide a shared space in which our community members can borrow books and socialise, access free wi-fi and attend thousands of programs which support lifelong learning. From Baby and Toddler Story times, which establish a love of reading from an early age, through to iPad training for seniors, the libraries provide a diverse range of programs which build social capacity and create community connections.
Social Infrastructure
1The University of Queensland (2005). Establishing standards for social infrastructure. Boilerhouse Community Engagement Centre, Ipswich Campus, Ipswich.
37
Logan City: State of the City 2013
Our facts and trendsThe following information presents our City wide results against a range of social infrastructure measures. Where available, we have compared our City results against regional (SE Qld), state (Qld) and national (Australia) trends.
Source: Census and Social Health Atlas
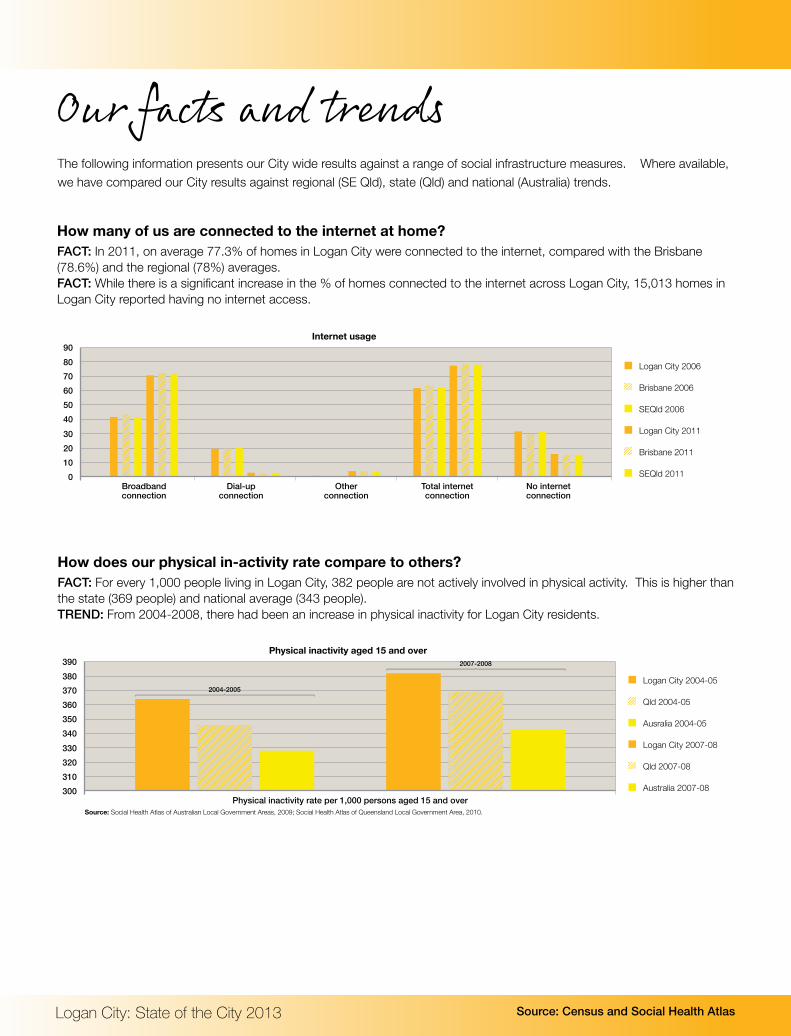
How many of us are connected to the internet at home?FACT: In 2011, on average 77.3% of homes in Logan City were connected to the internet, compared with the Brisbane (78.6%) and the regional (78%) averages. FACT: While there is a significant increase in the % of homes connected to the internet across Logan City, 15,013 homes in Logan City reported having no internet access.
How does our physical in-activity rate compare to others?FACT: For every 1,000 people living in Logan City, 382 people are not actively involved in physical activity. This is higher than the state (369 people) and national average (343 people).TREND: From 2004-2008, there had been an increase in physical inactivity for Logan City residents.
0102030405060708090
Internet usage
No internetconnection
Total internetconnection
Otherconnection
Dial-upconnection
Broadbandconnection
Logan City 2006
Brisbane 2006
SEQld 2006
Logan City 2011
Brisbane 2011
SEQld 2011
300310320330340350360370380390
Physical inactivity aged 15 and over
Physical inactivity rate per 1,000 persons aged 15 and over
Logan City 2004-05
Qld 2004-05
Ausralia 2004-05
Logan City 2007-08
Qld 2007-08
Australia 2007-08
2004-2005
2007-2008
Source: Social Health Atlas of Australian Local Government Areas, 2009; Social Health Atlas of Queensland Local Government Area, 2010.
Social Infrastructure
Source: Queensland Health and Social Health Atlas
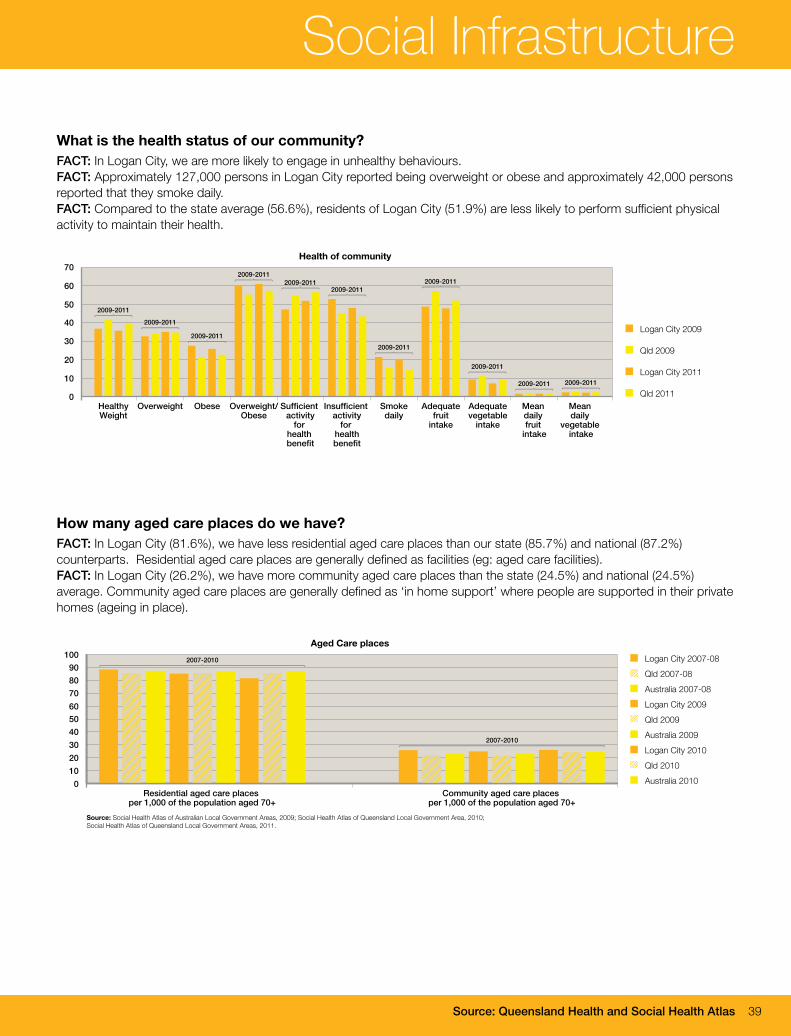
What is the health status of our community?FACT: In Logan City, we are more likely to engage in unhealthy behaviours. FACT: Approximately 127,000 persons in Logan City reported being overweight or obese and approximately 42,000 persons reported that they smoke daily.FACT: Compared to the state average (56.6%), residents of Logan City (51.9%) are less likely to perform sufficient physical activity to maintain their health.
How many aged care places do we have?FACT: In Logan City (81.6%), we have less residential aged care places than our state (85.7%) and national (87.2%) counterparts. Residential aged care places are generally defined as facilities (eg: aged care facilities).FACT: In Logan City (26.2%), we have more community aged care places than the state (24.5%) and national (24.5%) average. Community aged care places are generally defined as ‘in home support’ where people are supported in their private homes (ageing in place).
HealthyWeight
Overweight Obese Overweight/Obese
Sufficient activity
for health benefit
Insufficient activity
for healthbenefit
Smokedaily
Adequatefruit
intake
Adequatevegetable
intake
Mean daily fruit
intake
Mean daily
vegetable intake
0
10
20
30
40
50
60
70Health of community
Logan City 2009
Qld 2009
Logan City 2011
Qld 2011
2009-2011
2009-2011
2009-2011
2009-20112009-2011
2009-2011
2009-2011
2009-2011
2009-2011
2009-2011 2009-2011
Residential aged care places per 1,000 of the population aged 70+
Community aged care places per 1,000 of the population aged 70+
0102030405060708090
100 Logan City 2007-08Qld 2007-08Australia 2007-08Logan City 2009Qld 2009Australia 2009Logan City 2010Qld 2010Australia 2010
2007-2010
2007-2010
Aged Care places
Source: Social Health Atlas of Australian Local Government Areas, 2009; Social Health Atlas of Queensland Local Government Area, 2010; Social Health Atlas of Queensland Local Government Areas, 2011.
39
Logan City: State of the City 2013
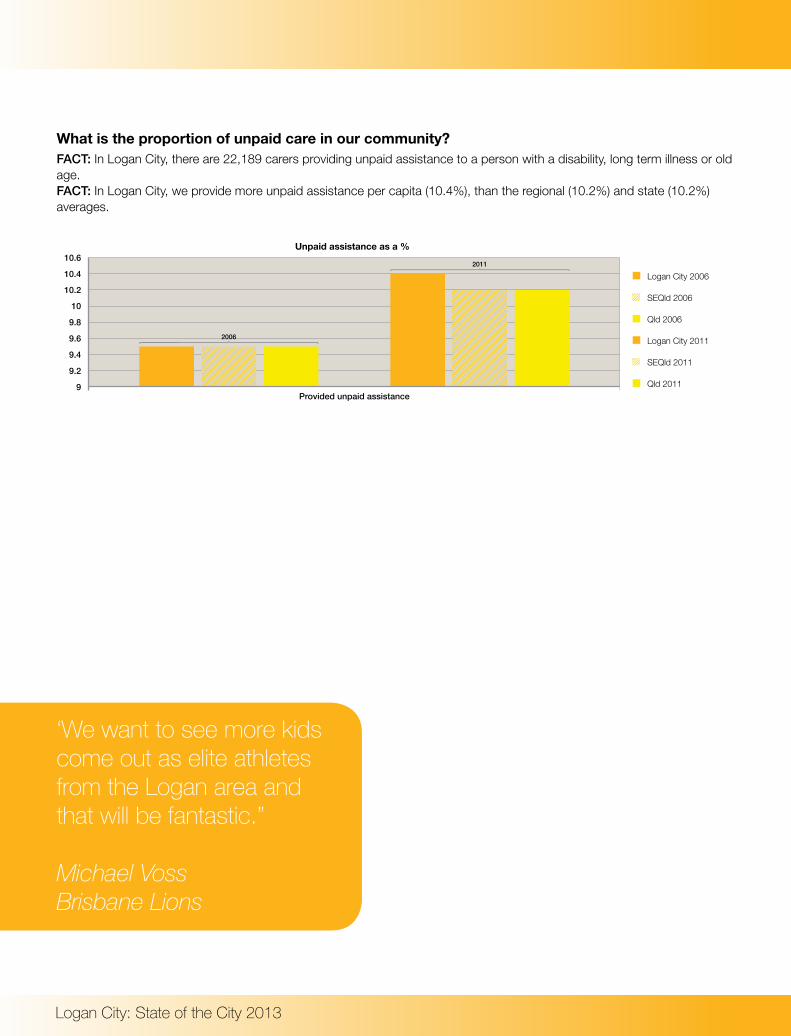
What is the proportion of unpaid care in our community?FACT: In Logan City, there are 22,189 carers providing unpaid assistance to a person with a disability, long term illness or old age.FACT: In Logan City, we provide more unpaid assistance per capita (10.4%), than the regional (10.2%) and state (10.2%) averages.
‘We want to see more kids come out as elite athletes from the Logan area and that will be fantastic.”
Michael Voss Brisbane Lions
9
9.2
9.4
9.6
9.8
10
10.2
10.4
10.6Unpaid assistance as a %
Provided unpaid assistance
Logan City 2006
SEQld 2006
Qld 2006
Logan City 2011
SEQld 2011
Qld 2011
2006
2011
Social Infrastructure
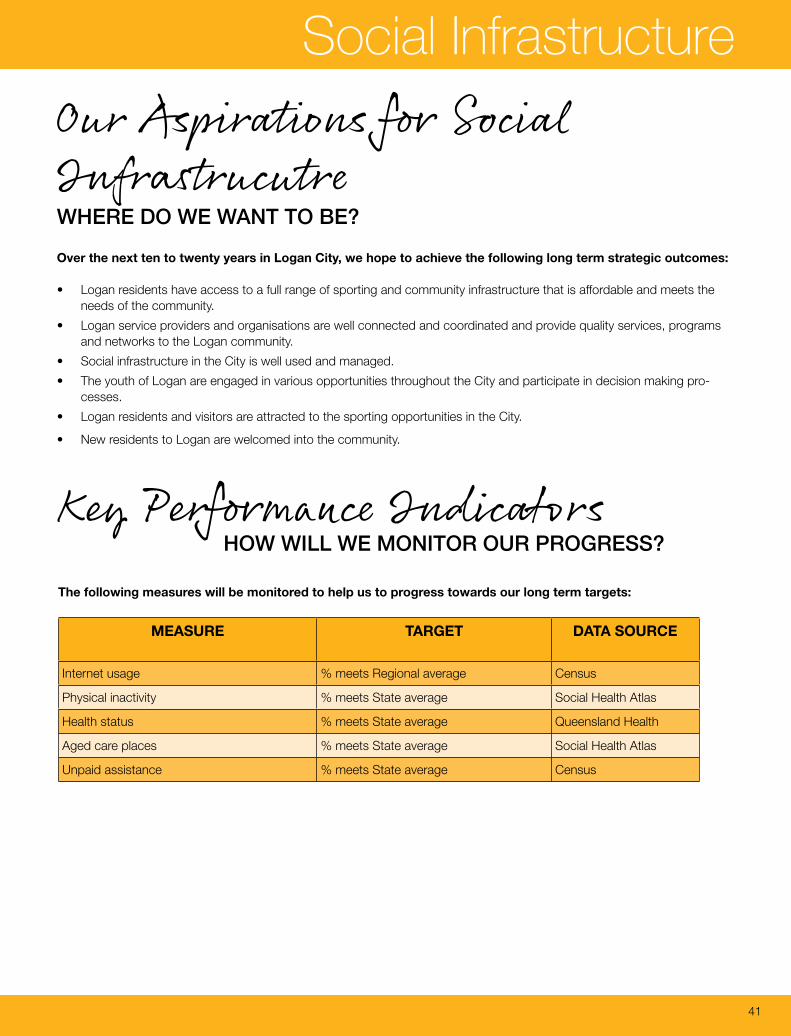
Our Aspirations for Social InfrastrucutreWHERE DO WE WANT TO BE?
Key Performance IndicatorsHOW WILL WE MONITOR OUR PROGRESS?
Over the next ten to twenty years in Logan City, we hope to achieve the following long term strategic outcomes:
• Logan residents have access to a full range of sporting and community infrastructure that is affordable and meets the needs of the community.
• Logan service providers and organisations are well connected and coordinated and provide quality services, programs and networks to the Logan community.
• Social infrastructure in the City is well used and managed.
• The youth of Logan are engaged in various opportunities throughout the City and participate in decision making pro-cesses.
• Logan residents and visitors are attracted to the sporting opportunities in the City.
• New residents to Logan are welcomed into the community.
The following measures will be monitored to help us to progress towards our long term targets:
MEASURE TARGET DATA SOURCE
Internet usage % meets Regional average Census
Physical inactivity % meets State average Social Health Atlas
Health status % meets State average Queensland Health
Aged care places % meets State average Social Health Atlas
Unpaid assistance % meets State average Census
41

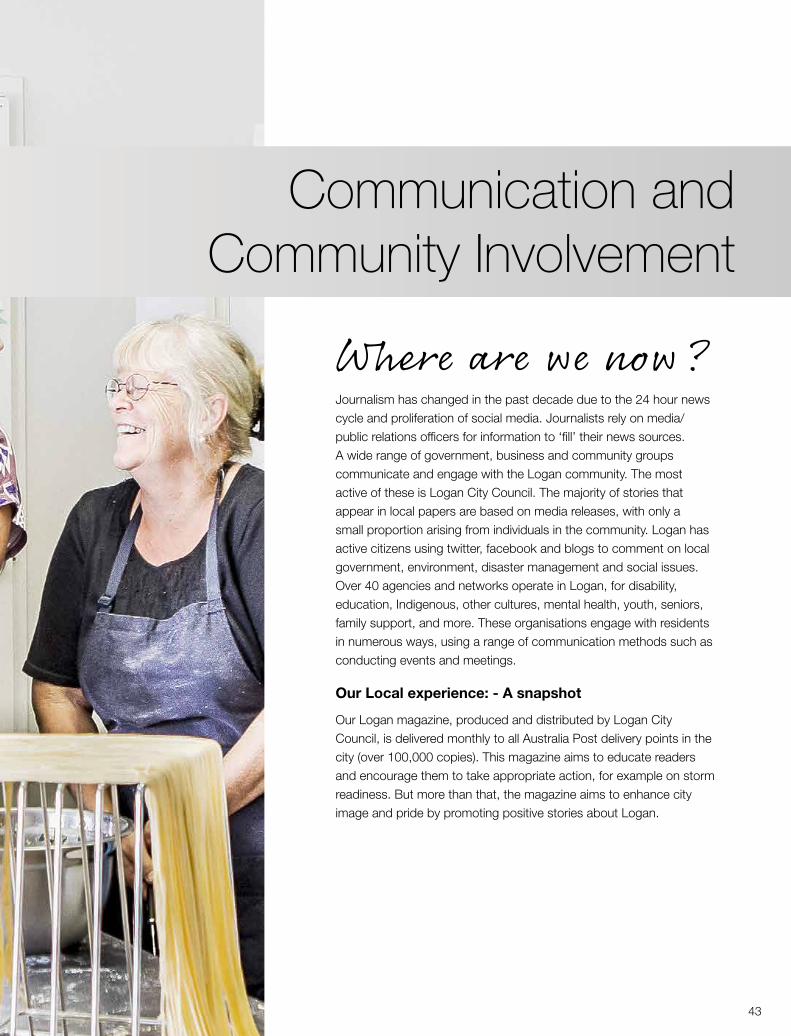
Where are we now?Journalism has changed in the past decade due to the 24 hour news cycle and proliferation of social media. Journalists rely on media/public relations officers for information to ‘fill’ their news sources. A wide range of government, business and community groups communicate and engage with the Logan community. The most active of these is Logan City Council. The majority of stories that appear in local papers are based on media releases, with only a small proportion arising from individuals in the community. Logan has active citizens using twitter, facebook and blogs to comment on local government, environment, disaster management and social issues. Over 40 agencies and networks operate in Logan, for disability, education, Indigenous, other cultures, mental health, youth, seniors, family support, and more. These organisations engage with residents in numerous ways, using a range of communication methods such as conducting events and meetings.
Our Local experience: - A snapshot
Our Logan magazine, produced and distributed by Logan City Council, is delivered monthly to all Australia Post delivery points in the city (over 100,000 copies). This magazine aims to educate readers and encourage them to take appropriate action, for example on storm readiness. But more than that, the magazine aims to enhance city image and pride by promoting positive stories about Logan.
Communication and Community Involvement
43
Logan City: State of the City 2013
Our facts and trendsThe following information presents our city-wide results against a range of communication and community involvement measures. Where available, we have compared our city results against regional (SE Qld), state and national trends. Logan has three local papers and one community radio station. How Logan is perceived by residents and businesses here, and further afield, is a matter of debate. What is clear is that with so few local media outlets, any broadcast image of the city is filtered via metropolitan agencies. This makes it difficult to influence how messages about Logan are conveyed both locally and to broader audiences outside of the city.
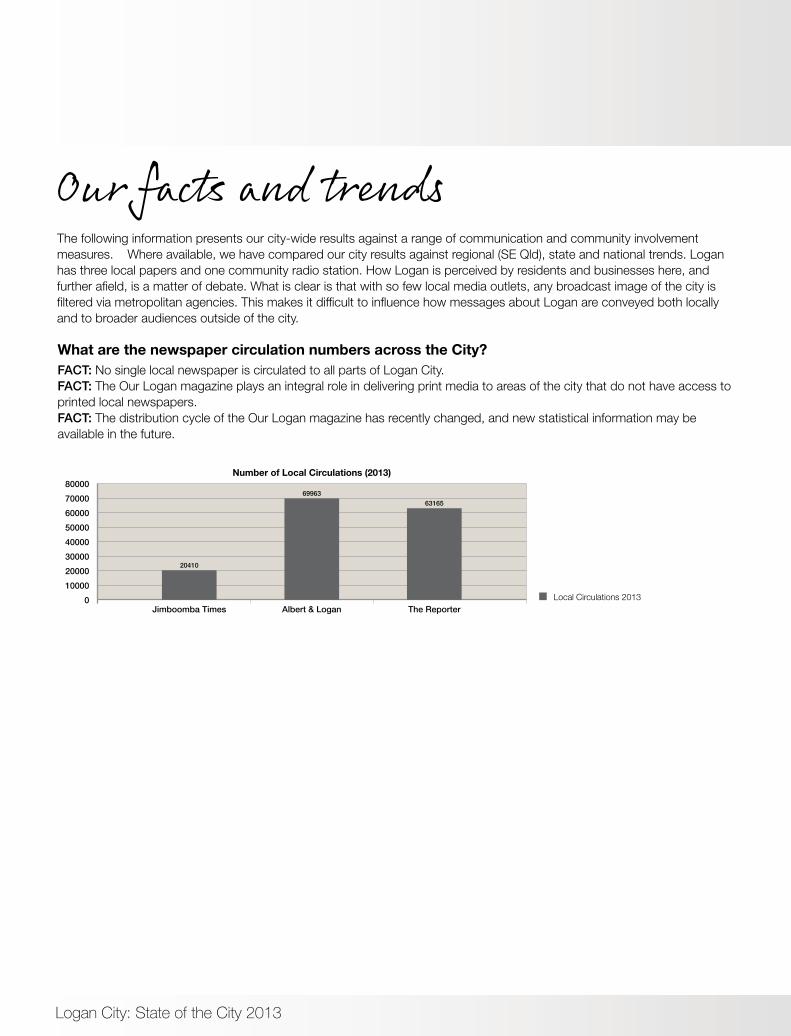
What are the newspaper circulation numbers across the City?FACT: No single local newspaper is circulated to all parts of Logan City. FACT: The Our Logan magazine plays an integral role in delivering print media to areas of the city that do not have access to printed local newspapers. FACT: The distribution cycle of the Our Logan magazine has recently changed, and new statistical information may be available in the future.
Number of Local Circulations (2013)
01000020000300004000050000600007000080000
Local Circulations 2013
20410
6996363165
Jimboomba Times Albert & Logan The Reporter
Communication and Community Involvement
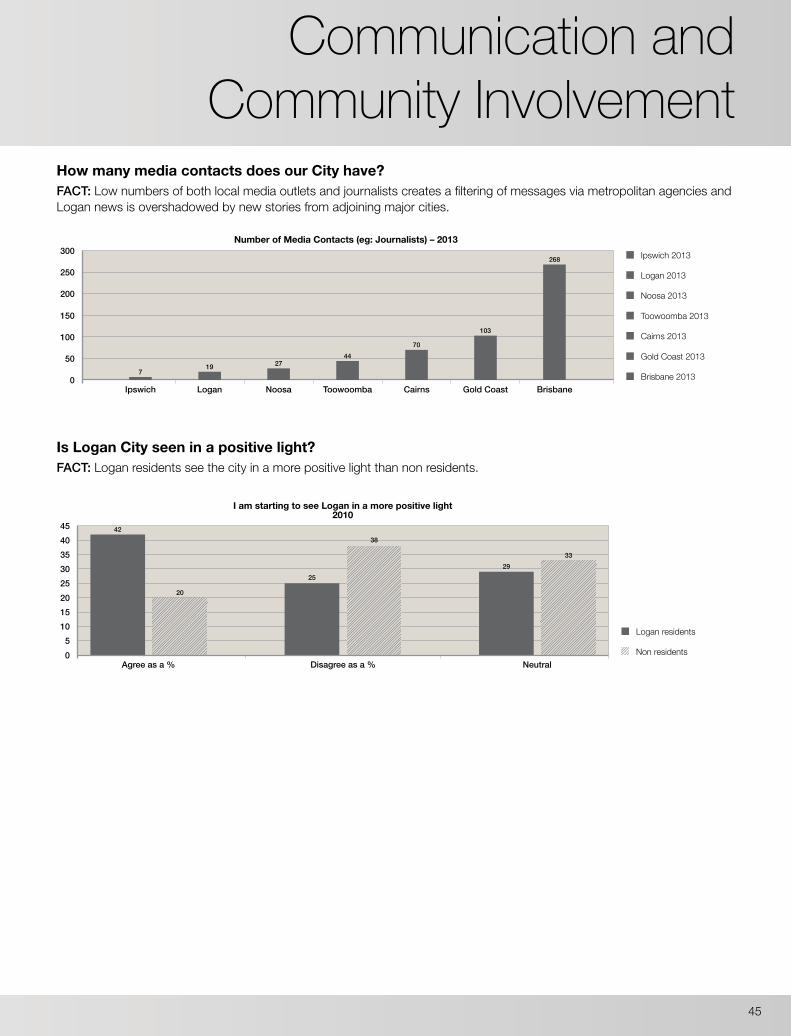
How many media contacts does our City have?FACT: Low numbers of both local media outlets and journalists creates a filtering of messages via metropolitan agencies and Logan news is overshadowed by new stories from adjoining major cities.
Is Logan City seen in a positive light?FACT: Logan residents see the city in a more positive light than non residents.
0
50
100
150
200
250
300Number of Media Contacts (eg: Journalists) – 2013
Brisbane 2013
Gold Coast 2013
Cairns 2013
Toowoomba 2013
Noosa 2013
Logan 2013
Ipswich 2013
Ipswich Logan Noosa Toowoomba Cairns Gold Coast Brisbane
719 27
4470
103
268
05
1015202530354045
I am starting to see Logan in a more positive light2010
Non residents
Logan residents
Agree as a % Disagree as a % Neutral
42
25
38
2933
20
45
Logan City: State of the City 2013
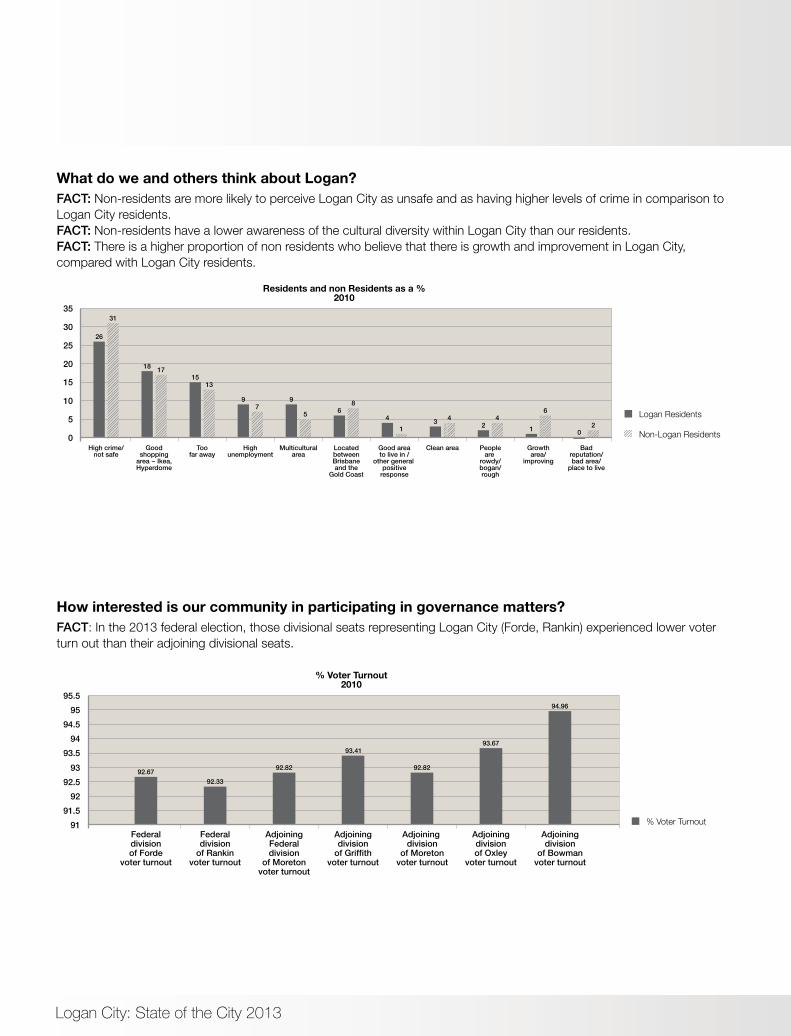
What do we and others think about Logan?FACT: Non-residents are more likely to perceive Logan City as unsafe and as having higher levels of crime in comparison to Logan City residents.FACT: Non-residents have a lower awareness of the cultural diversity within Logan City than our residents.FACT: There is a higher proportion of non residents who believe that there is growth and improvement in Logan City, compared with Logan City residents.
How interested is our community in participating in governance matters?FACT: In the 2013 federal election, those divisional seats representing Logan City (Forde, Rankin) experienced lower voter turn out than their adjoining divisional seats.
0
5
10
15
20
25
30
35
Residents and non Residents as a %2010
Non-Logan Residents
Logan Residents
High crime/not safe
Goodshopping
area − Ikea,Hyperdome
Toofar away
Highunemployment
Multiculturalarea
LocatedbetweenBrisbaneand the
Gold Coast
Good areato live in /
other general positive
response
Clean area Peopleare
rowdy/bogan/rough
Growtharea/
improving
Badreputation/bad area/
place to live
26
31
1815
17
13
97
9
5 68
41
43 42 1
6
02
9191.5
9292.5
9393.5
9494.5
9595.5
% Voter Turnout2010
% Voter TurnoutFederaldivisionof Forde
voter turnout
Federaldivision
of Rankinvoter turnout
AdjoiningFederaldivision
of Moretonvoter turnout
Adjoiningdivision
of Griffithvoter turnout
Adjoining division
of Moretonvoter turnout
Adjoiningdivisionof Oxley
voter turnout
Adjoiningdivision
of Bowmanvoter turnout
92.6792.33
92.82
93.41
92.82
93.67
94.96
Communication and Community Involvement
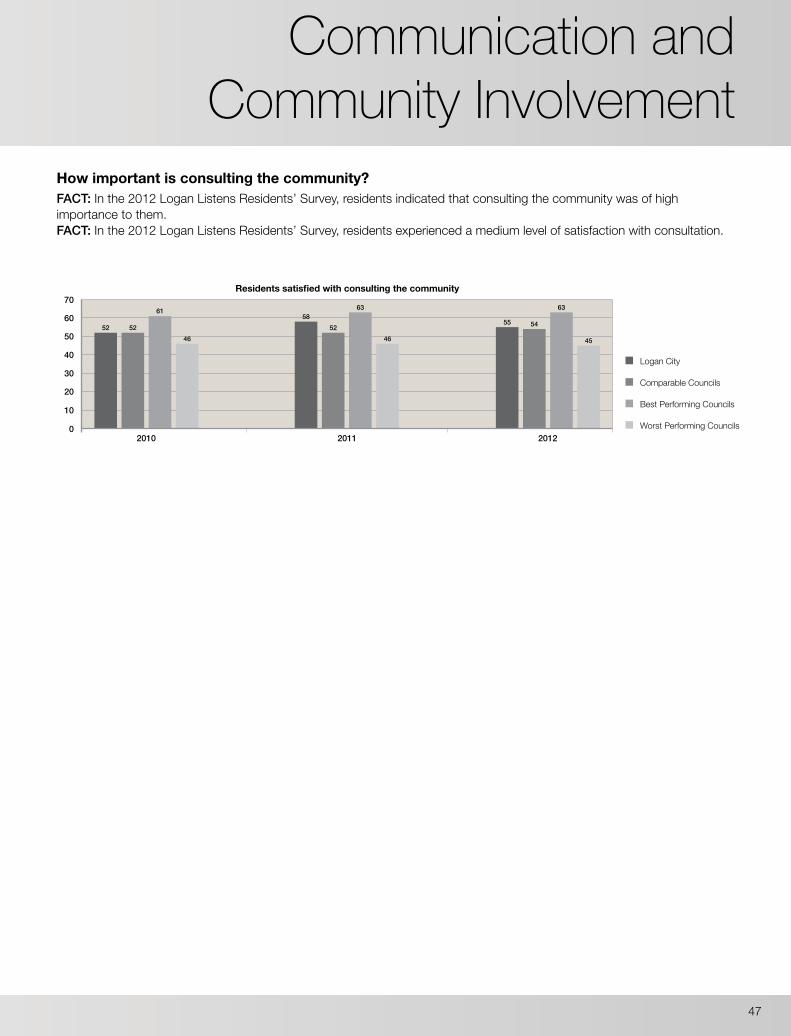
How important is consulting the community?FACT: In the 2012 Logan Listens Residents’ Survey, residents indicated that consulting the community was of high importance to them.FACT: In the 2012 Logan Listens Residents’ Survey, residents experienced a medium level of satisfaction with consultation.
0
10
20
30
40
50
60
70Residents satisfied with consulting the community
2010 2011 2012
52 52
61
46
5852
63
46
55 54
63
45
Logan City
Comparable Councils
Best Performing Councils
Worst Performing Councils
47
Logan City: State of the City 2013
Our Aspirations for Communication and Community Involvement
Key Performance IndicatorsHOW WILL WE MONITOR OUR PROGRESS?
Over the next ten to twenty years in Logan City, we hope to achieve the following long term strategic outcomes:
• Logan is widely known as an attractive place where people want to live, work, visit, and recreate.
• The Logan community is actively involved in civic opportunities and celebrations (as an indication of city pride).
The following measures will be monitored to help us to progress towards our long term targets:
MEASURE TARGET DATA SOURCE
Perceptions of City image % improvement (as measured by community research commissioned by Logan City Council)
Logan City Council -Community Research
Resident involvement in Civic activities % increase (as measured by engagement and event data collected by Logan City Council)
Logan City Council - Engagement and events
Satisfaction with community consultation Residents satisfaction with consulting the community meets or exceeds comparable councils
Logan City Council - Logan Listens Residents’ Survey
WHERE DO WE WANT TO BE?
Communication and Community Involvement
49

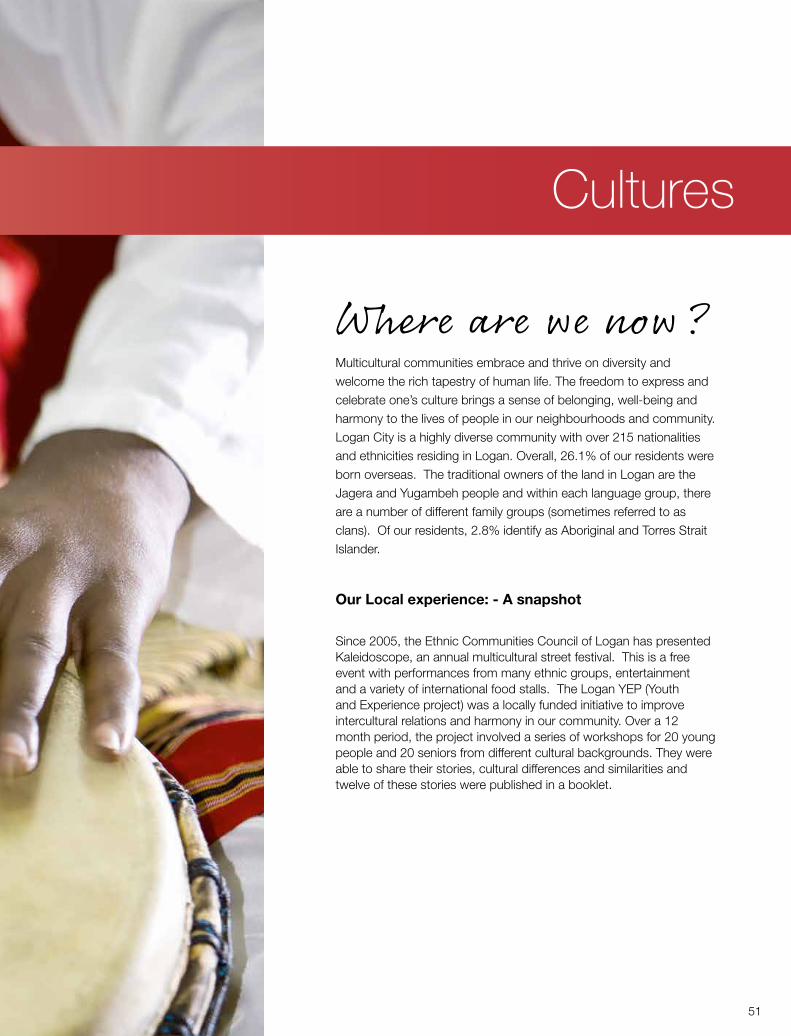
Where are we now?Multicultural communities embrace and thrive on diversity and welcome the rich tapestry of human life. The freedom to express and celebrate one’s culture brings a sense of belonging, well-being and harmony to the lives of people in our neighbourhoods and community. Logan City is a highly diverse community with over 215 nationalities and ethnicities residing in Logan. Overall, 26.1% of our residents were born overseas. The traditional owners of the land in Logan are the Jagera and Yugambeh people and within each language group, there are a number of different family groups (sometimes referred to as clans). Of our residents, 2.8% identify as Aboriginal and Torres Strait Islander.
Our Local experience: - A snapshot
Since 2005, the Ethnic Communities Council of Logan has presented Kaleidoscope, an annual multicultural street festival. This is a free event with performances from many ethnic groups, entertainment and a variety of international food stalls. The Logan YEP (Youth and Experience project) was a locally funded initiative to improve intercultural relations and harmony in our community. Over a 12 month period, the project involved a series of workshops for 20 young people and 20 seniors from different cultural backgrounds. They were able to share their stories, cultural differences and similarities and twelve of these stories were published in a booklet.
Cultures
51
Logan City: State of the City 2013
Our facts and trendsThe following information presents our City wide results against a range of culture measures. Where available, we have compared our City results against regional (SE Qld), state and national trends.
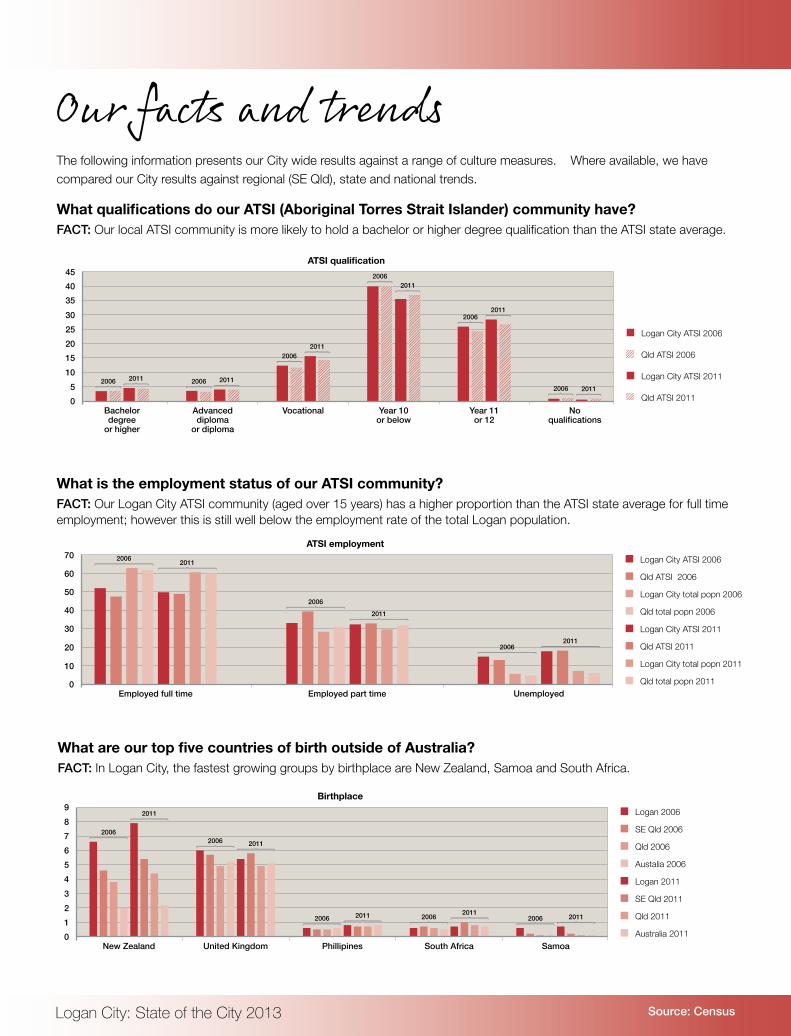
What qualifications do our ATSI (Aboriginal Torres Strait Islander) community have?FACT: Our local ATSI community is more likely to hold a bachelor or higher degree qualification than the ATSI state average.
Source: Census
What is the employment status of our ATSI community?FACT: Our Logan City ATSI community (aged over 15 years) has a higher proportion than the ATSI state average for full time employment; however this is still well below the employment rate of the total Logan population.
What are our top five countries of birth outside of Australia?FACT: In Logan City, the fastest growing groups by birthplace are New Zealand, Samoa and South Africa.
05
1015202530354045
Bachelordegree
or higher
Advanceddiploma
or diploma
Vocational Year 10or below
Year 11or 12
Noqualifications
Logan City ATSI 2006
Qld ATSI 2006
Logan City ATSI 2011
Qld ATSI 2011
2006 2011
ATSI qualification
20062011
20062011
2006 2011
20062011
2006 2011
0
10
20
30
40
50
60
70
Employed full time
ATSI employment2006 2011
2006
2011
20062011
Employed part time Unemployed
Logan City ATSI 2011
Qld ATSI 2011
Logan City total popn 2011
Qld total popn 2011
Logan City ATSI 2006
Qld ATSI 2006
Logan City total popn 2006
Qld total popn 2006
0123456789
New Zealand
Birthplace
Logan 2011
SE Qld 2011
Qld 2011
Australia 2011
Logan 2006
SE Qld 2006
Qld 2006
Austalia 2006
United Kingdom Phillipines South Africa Samoa
2006
2011
2006 2011
2006 2011 2006 20112006 2011
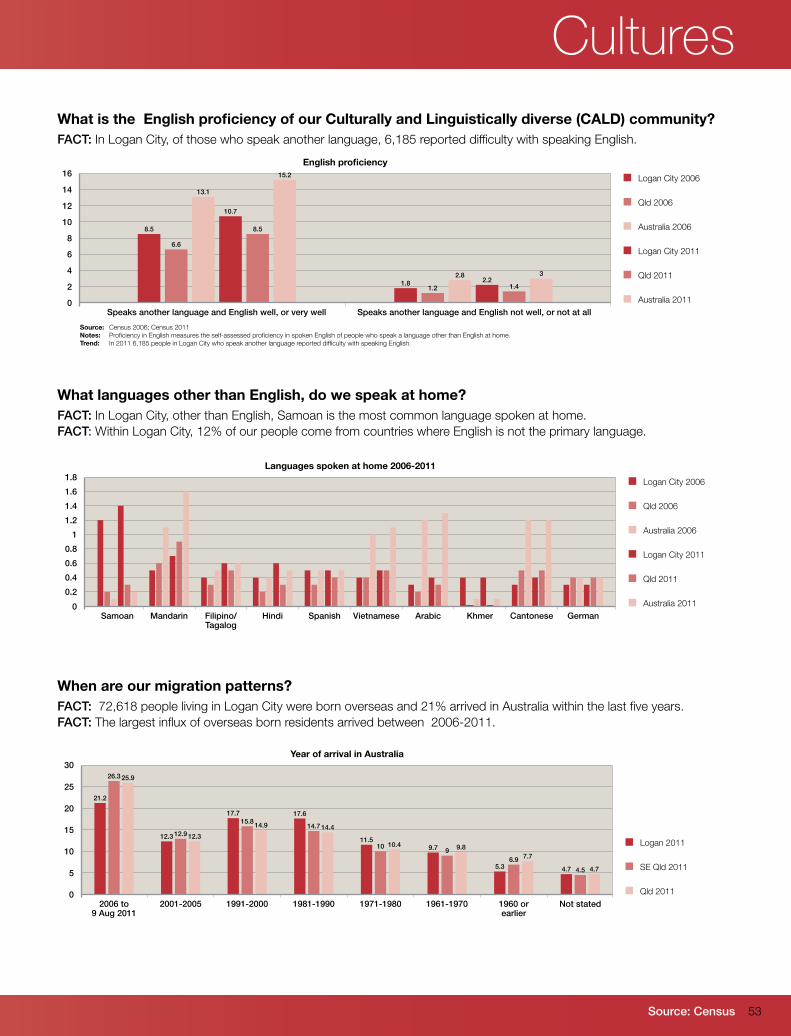
CulturesWhat is the English proficiency of our Culturally and Linguistically diverse (CALD) community?FACT: In Logan City, of those who speak another language, 6,185 reported difficulty with speaking English.
What languages other than English, do we speak at home?FACT: In Logan City, other than English, Samoan is the most common language spoken at home. FACT: Within Logan City, 12% of our people come from countries where English is not the primary language.
When are our migration patterns?FACT: 72,618 people living in Logan City were born overseas and 21% arrived in Australia within the last five years. FACT: The largest influx of overseas born residents arrived between 2006-2011.
Source: Census
0
2
4
6
8
10
12
14
16
Speaks another language and English well, or very well
English proficiency
Speaks another language and English not well, or not at all
8.5
6.6
13.1
10.7
8.5
15.2
1.81.2
2.82.2
1.4
3
Logan City 2006
Qld 2006
Australia 2006
Logan City 2011
Qld 2011
Australia 2011
Source:Notes:Trend:
Census 2006; Census 2011Proficiency in English measures the self-assessed proficiency in spoken English of people who speak a language other than English at home.In 2011 6,185 people in Logan City who speak another language reported difficulty with speaking English.
0
5
10
15
20
25
30
2006 to9 Aug 2011
2001-2005 1991-2000 1981-1990 1971-1980 1961-1970 1960 orearlier
Not stated
Year of arrival in Australia
12.3 12.9 12.3
17.715.8 14.9
17.6
14.7 14.4
11.510 10.4 9.7 9 9.8
5.36.9 7.7
4.7 4.5 4.7
21.2
26.3 25.9
Logan 2011
SE Qld 2011
Qld 2011
00.20.40.60.8
11.21.41.61.8
Samoan
Languages spoken at home 2006-2011Logan City 2006
Qld 2006
Australia 2006
Logan City 2011
Qld 2011
Australia 2011Mandarin Filipino/
TagalogHindi Spanish Vietnamese Arabic Khmer Cantonese German
53
Logan City: State of the City 2013
Our Aspirations for CulturesWHERE DO WE WANT TO BE?
Key Performance IndicatorsHOW WILL WE MONITOR OUR PROGRESS?
Over the next ten to twenty years in Logan City, we hope to achieve the following long term strategic outcomes:
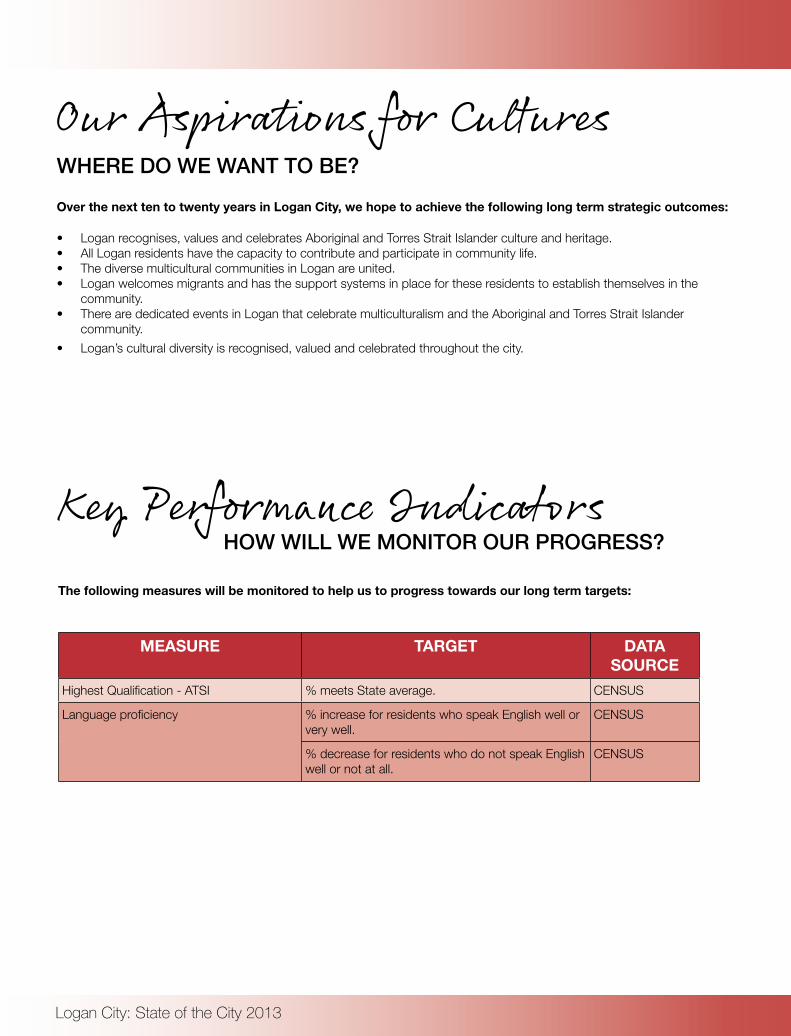
• Logan recognises, values and celebrates Aboriginal and Torres Strait Islander culture and heritage.• All Logan residents have the capacity to contribute and participate in community life.• The diverse multicultural communities in Logan are united. • Logan welcomes migrants and has the support systems in place for these residents to establish themselves in the
community. • There are dedicated events in Logan that celebrate multiculturalism and the Aboriginal and Torres Strait Islander
community.
• Logan’s cultural diversity is recognised, valued and celebrated throughout the city.
The following measures will be monitored to help us to progress towards our long term targets:
MEASURE TARGET DATA SOURCE
Highest Qualification - ATSI % meets State average. CENSUS
Language proficiency % increase for residents who speak English well or very well.
CENSUS
% decrease for residents who do not speak English well or not at all.
CENSUS

Cultures
55
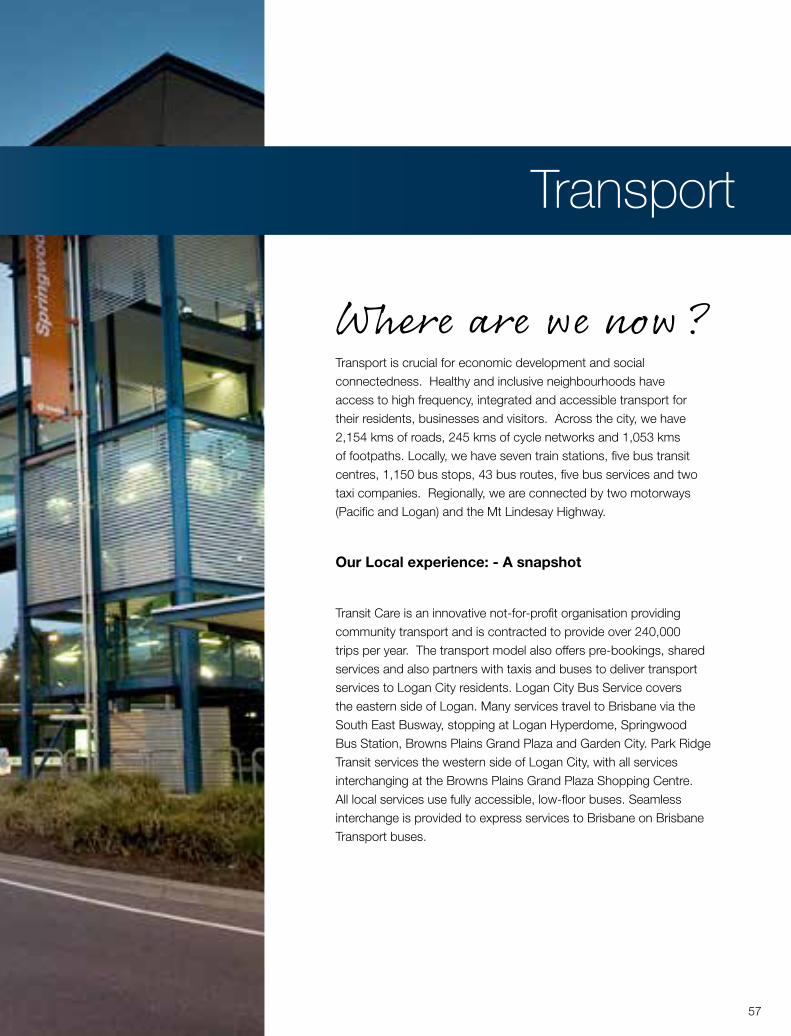
Where are we now?Transport is crucial for economic development and social connectedness. Healthy and inclusive neighbourhoods have access to high frequency, integrated and accessible transport for their residents, businesses and visitors. Across the city, we have 2,154 kms of roads, 245 kms of cycle networks and 1,053 kms of footpaths. Locally, we have seven train stations, five bus transit centres, 1,150 bus stops, 43 bus routes, five bus services and two taxi companies. Regionally, we are connected by two motorways (Pacific and Logan) and the Mt Lindesay Highway.
Our Local experience: - A snapshot
Transit Care is an innovative not-for-profit organisation providing community transport and is contracted to provide over 240,000 trips per year. The transport model also offers pre-bookings, shared services and also partners with taxis and buses to deliver transport services to Logan City residents. Logan City Bus Service covers the eastern side of Logan. Many services travel to Brisbane via the South East Busway, stopping at Logan Hyperdome, Springwood Bus Station, Browns Plains Grand Plaza and Garden City. Park Ridge Transit services the western side of Logan City, with all services interchanging at the Browns Plains Grand Plaza Shopping Centre. All local services use fully accessible, low-floor buses. Seamless interchange is provided to express services to Brisbane on Brisbane Transport buses.
Transport
57
Logan City: State of the City 2013
Our facts and trendsThe following information presents our city wide results against a range of transport measures. Where available, we have compared our city results against regional (SE Qld), state (Qld) and national (Australia) trends.
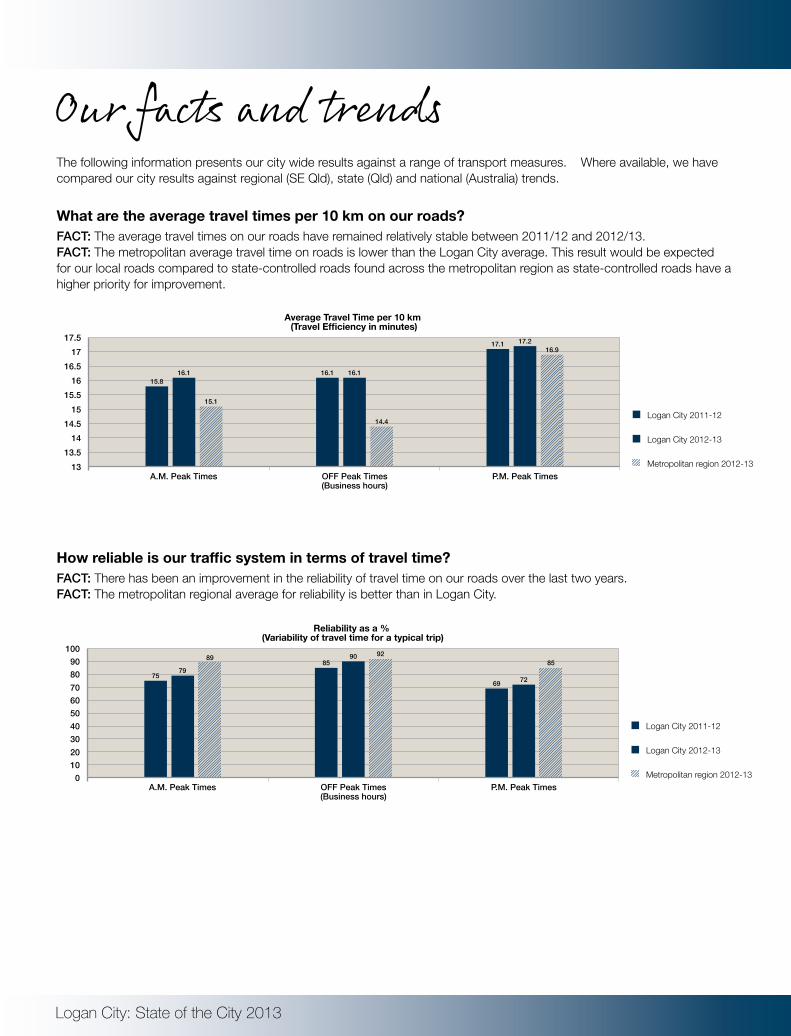
What are the average travel times per 10 km on our roads?FACT: The average travel times on our roads have remained relatively stable between 2011/12 and 2012/13.FACT: The metropolitan average travel time on roads is lower than the Logan City average. This result would be expected for our local roads compared to state-controlled roads found across the metropolitan region as state-controlled roads have a higher priority for improvement.
How reliable is our traffic system in terms of travel time?FACT: There has been an improvement in the reliability of travel time on our roads over the last two years.FACT: The metropolitan regional average for reliability is better than in Logan City.
Logan City 2011-12
Logan City 2012-13
Metropolitan region 2012-131313.5
1414.5
1515.5
1616.5
1717.5
Average Travel Time per 10 km (Travel Efficiency in minutes)
A.M. Peak Times OFF Peak Times(Business hours)
P.M. Peak Times
15.816.1 16.1
14.4
17.1 17.216.9
16.1
15.1
Logan City 2011-12
Logan City 2012-13
Metropolitan region 2012-130102030405060708090
100
Reliability as a % (Variability of travel time for a typical trip)
A.M. Peak Times OFF Peak Times(Business hours)
P.M. Peak Times
7579
8985
90 92
69 72
85
Transport
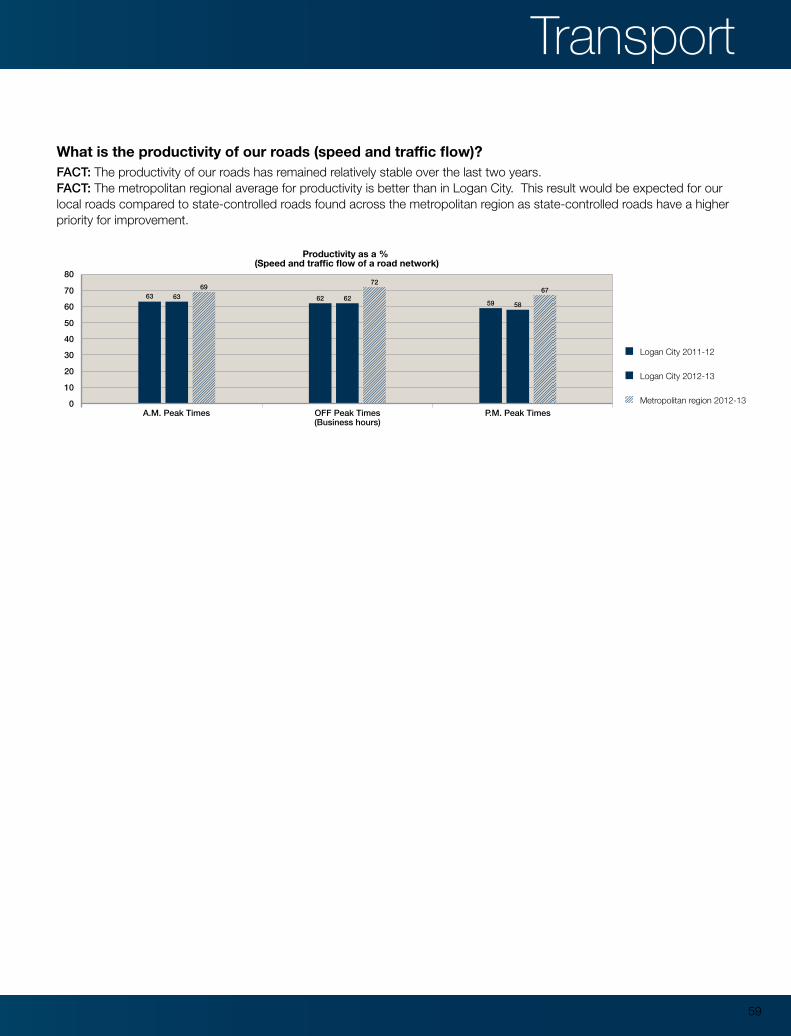
What is the productivity of our roads (speed and traffic flow)?FACT: The productivity of our roads has remained relatively stable over the last two years.FACT: The metropolitan regional average for productivity is better than in Logan City. This result would be expected for our local roads compared to state-controlled roads found across the metropolitan region as state-controlled roads have a higher priority for improvement.
Logan City 2011-12
Logan City 2012-13
Metropolitan region 2012-130
10
20
30
40
50
60
70
80
Productivity as a % (Speed and traffic flow of a road network)
A.M. Peak Times OFF Peak Times(Business hours)
P.M. Peak Times
63 6369
62 62
72
59 58
67
59
Logan City: State of the City 2013 Source: Queensland Police Service and Qld Health 2012
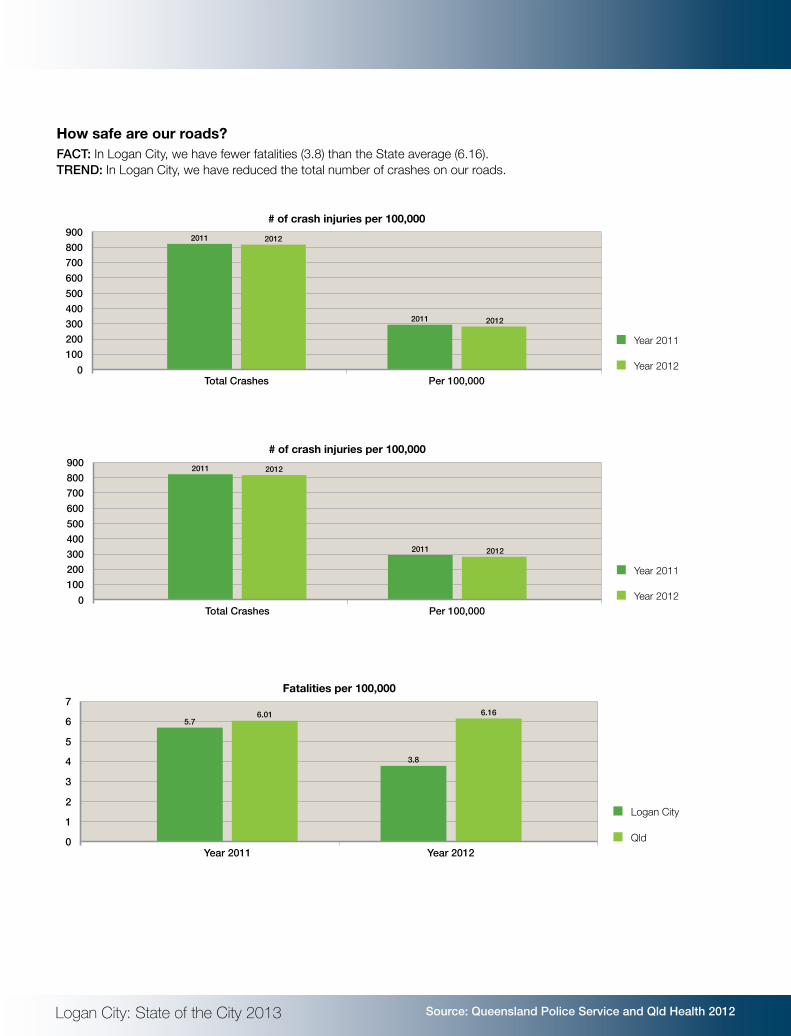
How safe are our roads?FACT: In Logan City, we have fewer fatalities (3.8) than the State average (6.16).TREND: In Logan City, we have reduced the total number of crashes on our roads.
Fatalities per 100,000
0
1
2
3
4
5
6
7
Year 2012Year 2011
5.76.01
3.8
6.16
2011 2012
Logan City
Qld
# of crash injuries per 100,000
0100200300400500600700800900
Per 100,000Total Crashes
2011 2012
2011 2012
Year 2011
Year 2012
# of crash injuries per 100,000
0100200300400500600700800900
Per 100,000Total Crashes
2011 2012
2011 2012
Year 2011
Year 2012
Transport
Source: Transport and Main Roads
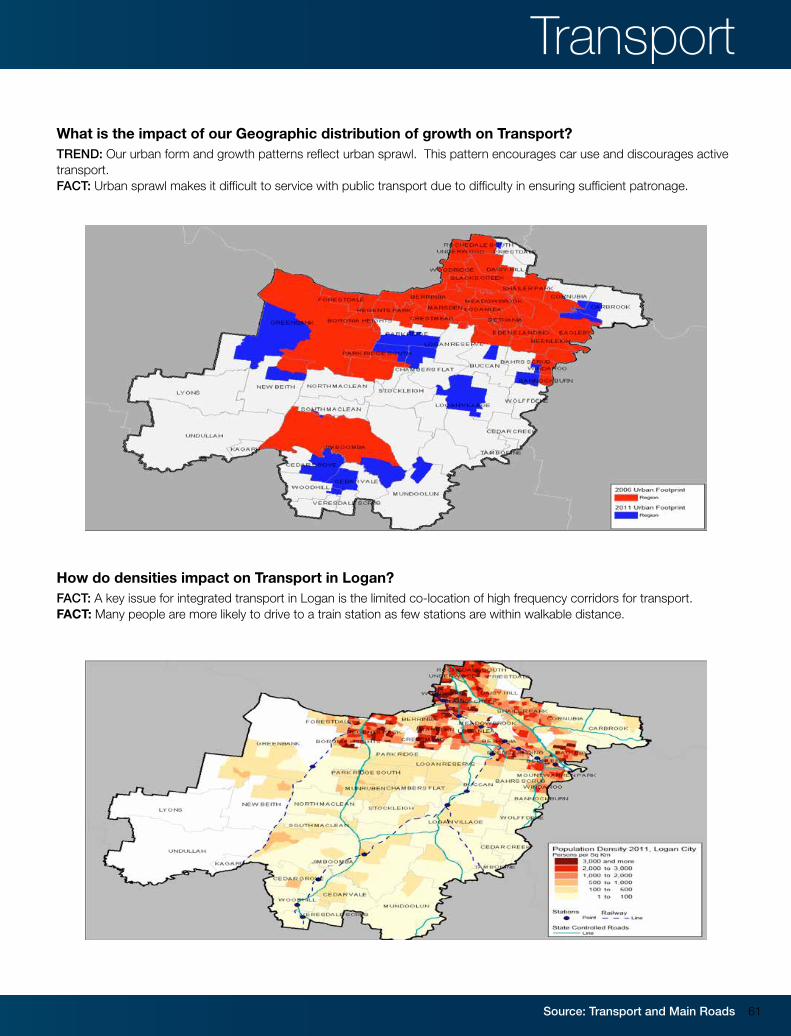
What is the impact of our Geographic distribution of growth on Transport?TREND: Our urban form and growth patterns reflect urban sprawl. This pattern encourages car use and discourages active transport. FACT: Urban sprawl makes it difficult to service with public transport due to difficulty in ensuring sufficient patronage.
How do densities impact on Transport in Logan?FACT: A key issue for integrated transport in Logan is the limited co-location of high frequency corridors for transport. FACT: Many people are more likely to drive to a train station as few stations are within walkable distance.
61
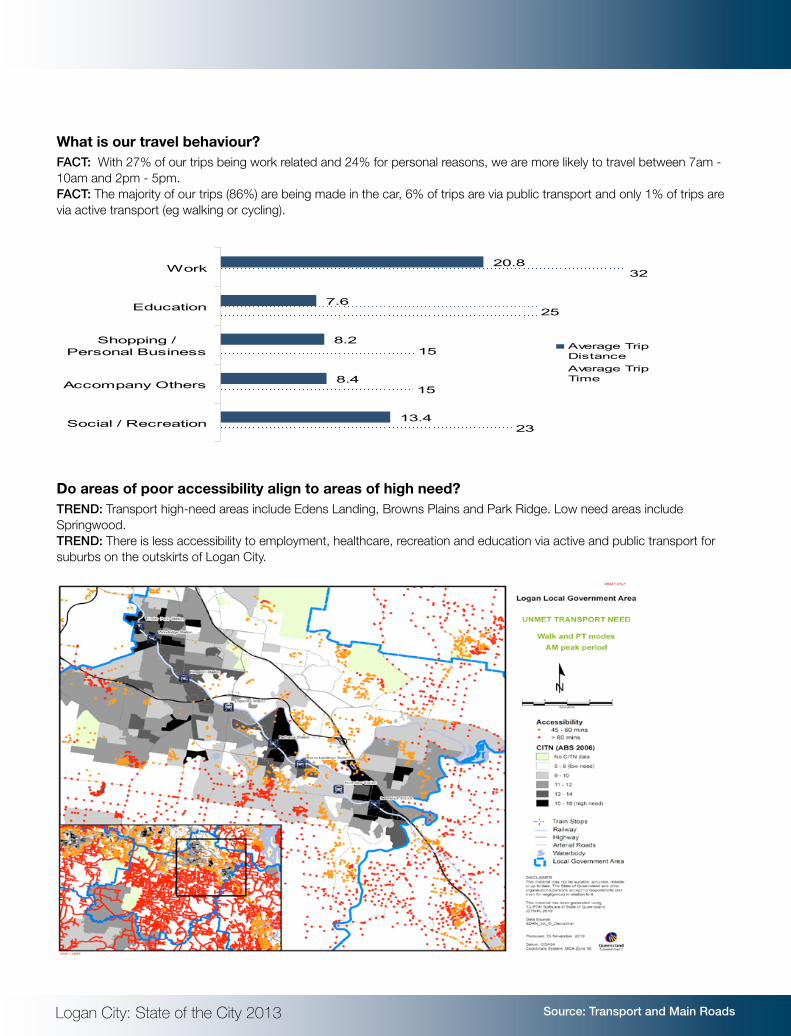
20.8
7.6
8.2
8.4
13.4
32
25
15
15
23
Work
Education
Shopping /Personal Business
Accompany Others
Social / Recreation
Average TripDistanceAverage TripTime
Logan City: State of the City 2013 Source: Transport and Main Roads
What is our travel behaviour?FACT: With 27% of our trips being work related and 24% for personal reasons, we are more likely to travel between 7am - 10am and 2pm - 5pm. FACT: The majority of our trips (86%) are being made in the car, 6% of trips are via public transport and only 1% of trips are via active transport (eg walking or cycling).
Do areas of poor accessibility align to areas of high need?TREND: Transport high-need areas include Edens Landing, Browns Plains and Park Ridge. Low need areas include Springwood. TREND: There is less accessibility to employment, healthcare, recreation and education via active and public transport for suburbs on the outskirts of Logan City.
Transport
Source: Transport and Main Roads
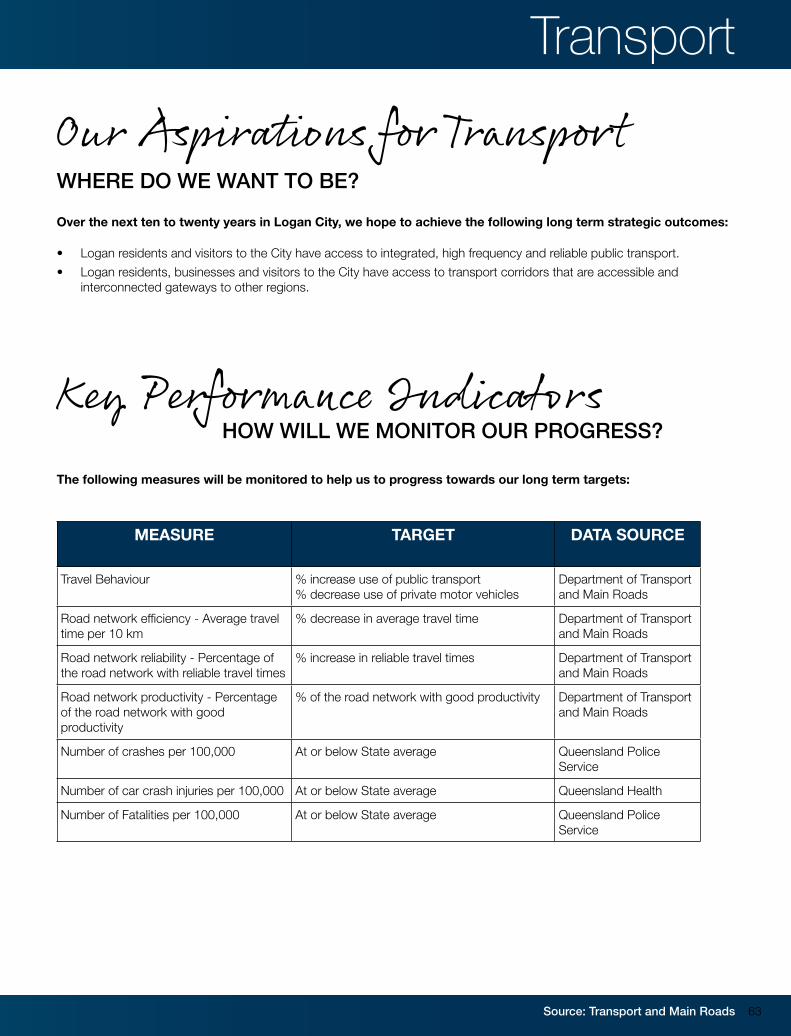
Our Aspirations for TransportWHERE DO WE WANT TO BE?
Key Performance IndicatorsHOW WILL WE MONITOR OUR PROGRESS?
Over the next ten to twenty years in Logan City, we hope to achieve the following long term strategic outcomes:
• Logan residents and visitors to the City have access to integrated, high frequency and reliable public transport.
• Logan residents, businesses and visitors to the City have access to transport corridors that are accessible and interconnected gateways to other regions.
The following measures will be monitored to help us to progress towards our long term targets:
MEASURE TARGET DATA SOURCE
Travel Behaviour % increase use of public transport% decrease use of private motor vehicles
Department of Transport and Main Roads
Road network efficiency - Average travel time per 10 km
% decrease in average travel time Department of Transport and Main Roads
Road network reliability - Percentage of the road network with reliable travel times
% increase in reliable travel times Department of Transport and Main Roads
Road network productivity - Percentage of the road network with good productivity
% of the road network with good productivity Department of Transport and Main Roads
Number of crashes per 100,000 At or below State average Queensland Police Service
Number of car crash injuries per 100,000 At or below State average Queensland Health
Number of Fatalities per 100,000 At or below State average Queensland Police Service
63
LOGAN : City of Choice
BUILDING OUR COMMUNITIESBUSINESSES AND PRIDE