state of the beaches 2013–2014
TRANSCRIPT

Bronte Beach, Sydney
State of the Beaches 2013–2014
Sydney Region New South Wales
For technical information about this report contact: Beachwatch, Office of Environment and Heritage NSW 59–61 Goulburn Street, Sydney PO Box A290, Sydney South NSW 1232
Phone: (02) 9995 5344
Email: [email protected] Web: www.environment.nsw.gov.au/beach
Published by: Office of Environment and Heritage NSW 59 Goulburn Street, Sydney PO Box A290, Sydney South NSW 1232
Phone: (02) 9995 5000 (switchboard) Phone: 131 555 (information and publications requests)
Email: [email protected] Website: www.environment.nsw.gov.au
The Office of Environment and Heritage NSW is pleased to allow this material to be reproduced in whole or part, provided the meaning is unchanged and its source, publisher and authorship are acknowledged.
ISSN 1441–4147 OEH 2014/0600
October 2014

- -
-
Sydney RegionSUMMARY 2013–2014
Beach monitoring in NSW The water quality of beaches and other swimming locations is monitored under the NSW Government’s Beachwatch programs to provide the community with accurate information on the cleanliness of the water and to enable individuals to make informed decisions about where and when to swim. Routine assessment also measures the impact of pollution sources, enables the effectiveness of stormwater and wastewater management practices to be assessed and highlights areas where further work is needed.
Statistics for 2013–2014:
94 sites
19 councils
Swimming sites in NSW are graded as Very Good, Good, Fair, Poor or Very Poor in accordance with the National Health and Medical Research Council’s 2008 Guidelines for Managing Risks in Recreational Waters. These Beach Suitability Grades provide a long-term assessment of how suitable a beach is for swimming. The grades are determined from the most recent 100 water quality results (two to four years’ worth of data depending on the sampling frequency) and a risk assessment of potential pollution sources.
The Sydney region includes swimming sites monitored in Pittwater, Sydney Harbour, Botany Bay and Port Hacking, and ocean beaches from Palm Beach in the north to Oak Park in the south.
A guide on to how to read the report is provided on pages 116–119.
Rainfall impacts Rainfall is the major driver of pollution to recreational waters, generating stormwater runoff and triggering discharges from the wastewater treatment and transport systems. Changes in rainfall patterns are reflected in beach water quality over time due to variation in the frequency and extent of stormwater and wastewater inputs.
The Beach Suitability Grades for 2013–2014 are based on water quality data collected over the last two to four years. Rainfall over this period has been diverse, beginning with sustained wet weather conditions and flooding in many areas along the NSW coast, and ending with well-below average rainfall across the state and a lack of significant rainfall events:
2010–2011: fifth wettest spring and summer on record
2011–2012: ninth-wettest summer on record
2012–2013: high levels of rainfall recorded in many areas
2013–2014: driest summer in almost 30 years.
Health risks Contamination of recreational waters with faecal material from animal and human sources can pose significant health problems to beach users owing to the presence of pathogens (disease causing micro organisms) in the faecal material. The most common groups of pathogens found in recreational waters are bacteria, protozoans and viruses.
Exposure to contaminated water can cause gastroenteritis, with symptoms including vomiting, diarrhoea, stomach ache, nausea, headache and fever. Eye, ear, skin and upper respiratory tract infections can also be contracted when pathogens come into contact with small breaks and tears in the skin or ruptures of the delicate membranes in the ear or nose.
Certain groups of users may be more vulnerable to the threat of microbial infection than others. Children, the elderly, people with compromised immune systems, tourists, and people from culturally and linguistically diverse backgrounds are generally most at risk.
1

Sanitary Microbial Beach Beach Suitability Grades for Sydney Region Inspection Assessment Suitability Site type Category Category Grade
VG
VG
Northern Palm Beach Ocean beach Low Category A Sydney
Whale Beach Ocean beach Low Category A
Avalon Beach Ocean beach Low Category A
Bilgola Beach Ocean beach Low Category A
Newport Beach Ocean beach Low Category A
Bungan Beach Ocean beach Low Category A
Mona Vale Beach Ocean beach Low Category A
Warriewood Beach Ocean beach Moderate Category A
Turimetta Beach Ocean beach Moderate Category A
North Narrabeen Beach Ocean beach Moderate Category A
Narrabeen Lagoon Lagoon Moderate Category B
Collaroy Beach Ocean beach Moderate Category A
Long Reef Beach Ocean beach Moderate Category A
Dee Why Beach Ocean beach Low Category A
North Curl Curl Beach Ocean beach Moderate Category B
South Curl Curl Beach Ocean beach Low Category A
Freshwater Beach Ocean beach Moderate Category B
Queenscliff Beach Ocean beach Moderate Category B
North Steyne Beach Ocean beach Low Category B
South Steyne Beach Ocean beach Moderate Category B
Shelly Beach Ocean beach Low Category A
Barrenjoey Beach Estuarine Low Category B
Paradise Beach Baths Estuarine Low Category B
Clareville Beach Estuarine Moderate Category B
Taylors Point Baths Estuarine Moderate Category B
Bayview Baths Estuarine Moderate Category C
Elvina Bay Estuarine Low Category B
North Scotland Island Estuarine Moderate Category B
South Scotland Island Estuarine Moderate Category A
The Basin Estuarine Low Category A
Great Mackerel Beach Estuarine Low Category B
VG
VG
VG
VG
VG
G
G
G
G
G
G
VG
G
VG
G
G
G
G
VG
G
G
G
G
P
G
G
G
VG
G
Very Good VG G Good F Fair P Poor Very Poor VP
2

Sanitary Microbial Beach Beach Suitability Grades for Sydney Region Inspection Assessment Suitability
Site type Category Category Grade
G
G
Central Bondi Beach Ocean beach Moderate Category B Sydney
Tamarama Beach Ocean beach Moderate Category B
Bronte Beach Ocean beach Moderate Category B
Clovelly Beach Ocean beach Low Category A
Gordons Bay Ocean beach Moderate Category B
Coogee Beach Ocean beach Moderate Category B
Maroubra Beach Ocean beach Low Category B
South Maroubra Beach Ocean beach Moderate Category B
Malabar Beach Ocean beach Moderate Category B
Little Bay Beach Ocean beach Moderate Category B
Watsons Bay Estuarine Low Category A
Parsley Bay Estuarine Moderate Category B
Nielsen Park Estuarine Low Category A
Rose Bay Beach Estuarine Moderate Category C
Murray Rose Pool Estuarine Moderate Category B
Dawn Fraser Pool Estuarine Moderate Category B
Chiswick Baths Estuarine Moderate Category B
Cabarita Beach Estuarine Moderate Category B
Woolwich Baths Estuarine Moderate Category B
Tambourine Bay Estuarine Moderate Category C
Woodford Bay Estuarine Moderate Category B
Greenwich Baths Estuarine Moderate Category B
Hayes St Beach Estuarine Moderate Category B
Clifton Gardens Estuarine Moderate Category B
Balmoral Baths Estuarine Moderate Category B
Edwards Beach Estuarine Moderate Category A
Chinamans Beach Estuarine Moderate Category B
Northbridge Baths Estuarine High Category C
Davidson Reserve Estuarine High Category C
Gurney Crescent Baths Estuarine High Category B
Clontarf Pool Estuarine High Category B
Forty Baskets Pool Estuarine Moderate Category A
Fairlight Beach Estuarine Moderate Category A
Manly Cove Estuarine Moderate Category B
Little Manly Cove Estuarine Moderate Category B
G
VG
G
G
G
G
G
G
VG
G
VG
P
G
G
G
G
G
P
G
G
G
G
G
G
G
P
P
F
G
F
G
G
G
3
Very Good VG G Good F Fair P Poor Very Poor VP

Beach Suitability Grades for Sydney Region Sanitary Microbial Beach Inspection Assessment Suitability
Site type Category Category Grade
P
VG
Southern Boat Harbour Ocean beach Moderate Category C Sydney
Greenhills Ocean beach Low Category A
Wanda Beach Ocean beach Low Category A
Elouera Beach Ocean beach Low Category A
North Cronulla Beach Ocean beach Low Category A
South Cronulla Beach Ocean beach Low Category B
Shelly Beach Ocean beach Low Category A
Oak Park Ocean beach Low Category A
Silver Beach Estuarine Moderate Category B
Como Baths Estuarine Moderate Category B
Jew Fish Bay Baths Estuarine Moderate Category B
Oatley Bay Baths Estuarine Moderate Category B
Carss Point Baths Estuarine Moderate Category B
Sandringham Baths Estuarine Moderate Category A
Dolls Point Baths Estuarine Moderate Category B
Ramsgate Baths Estuarine Moderate Category B
Monterey Baths Estuarine Moderate Category B
Brighton-Le-Sands Baths Estuarine Moderate Category B
Kyeemagh Baths Estuarine Moderate Category B
Foreshores Beach Estuarine High Category D
Yarra Bay Estuarine Moderate Category B
Frenchmans Bay Estuarine Moderate Category B
Congwong Bay Estuarine Low Category A
Jibbon Beach Estuarine Low Category A
Horderns Beach Estuarine Moderate Category B
Gymea Bay Baths Estuarine High Category C
Lilli Pilli Baths Estuarine Moderate Category B
Gunnamatta Bay Baths Estuarine Moderate Category B
VG
VG
VG
G
VG
VG
G
G
G
G
G
G
G
G
G
G
G
VP
G
G
VG
VG
G
P
G
G
Very Good VG G Good F Fair P Poor Very Poor VP
4

– – – –
Northern Sydney (Pittwater to Manly) State of the Beaches 2013–2014
Overall results Percentage of sites graded as Good or Very Good:
97% 2010 11
97% 2011 12
97% 2012 13
97% 2013 14
Thirty of the 31 swimming sites were graded as Very Good or Good in 2013–2014. Excellent results were also recorded in previous years.
Ocean beaches
Good / Very Good Fair Poor / Very Poor
All 20 ocean beaches were graded as Very Good or Good.
Palm, Whale, Avalon, Bilgola, Newport, Bungan, Mona Vale, Dee Why, South Curl Curl and Shelly (Manly) beaches were graded as Very Good. The water quality at these sites was of a very high standard and suitable for swimming almost all of the time.
Warriewood, Turimetta, North Narrabeen, Collaroy, Long Reef, North Curl Curl, Freshwater, Queenscliff, North Steyne and South Steyne beaches were graded as Good. Water quality was suitable for swimming during dry weather conditions, but swimming should be avoided during and for up to one day following heavy rainfall.
Estuarine beaches
Good / Very Good Fair Poor / Very Poor
The Basin in Pittwater was graded as Very Good. This site had excellent water quality and was suitable for swimming almost all of the time.
Eight of the 10 estuarine beaches in Pittwater were graded as Good: Barrenjoey Beach, Paradise Beach Baths, Clareville Beach, Taylors Point Baths, Elvina Bay, North Scotland Island, South Scotland Island and Great Mackerel Beach. The water quality at these locations was generally of a high standard, although elevated levels of enterococci were recorded at most locations following rainfall.
Best beaches Palm Beach, Whale Beach, Avalon Beach, Bilgola Beach, Newport Beach, Bungan Beach, Mona Vale Beach, Dee Why Beach, South Curl Curl Beach and Shelly Beach
These sites had excellent water quality and were suitable for swimming almost all of the time.
31 sites
1526 samples
year round*
every 6 days*
* Beachwatch samples the ocean beaches and Narrabeen Lagoon every sixth day throughout the year, and estuarine beaches every sixth day between October and April, and monthly from May to September.
See How to Read this Report for explanations of graphs and Beach
Suitability Grades.
5

Bayview Baths was graded as Poor. This site had generally good water quality during dry weather but elevated enterococci levels were regularly measured following low levels of rainfall. Bayview Baths was downgraded from a Good grade in 2012– 2013.
As a precaution, swimming should be avoided at Pittwater swimming sites during and for up to three days following heavy rainfall or if there are signs of stormwater pollution such as discoloured water or floating debris.
Lake/lagoon swimming sites
Good / Very Good Fair Poor / Very Poor
The swimming location at the entrance to Narrabeen Lagoon (Birdwood Park) was graded as Good, upgraded from a Poor grade in 2012–2013. This site had generally good water quality during dry weather but elevated enterococci levels were measured following low levels of rainfall. Outflow from Narrabeen Lagoon is a significant source of faecal contamination. It is recommended that swimming be avoided during and following rainfall and when the lagoon is closed.
Management To reduce the incidence of wet weather sewage overflows in beach catchments between Narrabeen and Manly, Sydney Water is increasing the capacity of pipes and pumps and incorporating storage tanks into the sewerage system. An 18 million litre storage tank in the Brookvale industrial area to reduce overflows to Manly Lagoon and Curl Curl Lagoon was completed in 2013.
Sydney Water has inspected, cleaned and repaired sewer mains that have a high likelihood of discharging sewage to waterways if they become blocked. When significant tree root intrusion to the public sewer from the private sewer was identified, property owners were requested to remedy the problem.
Manly Council has continued with the Dry Weather Sewer Leak Program, which was developed with Sydney Water to locate and rectify sewer leaks. Under this program all stormwater pipe outlets with dry weather water discharges are tested for chemicals and microbes that could indicate a sewer leak. Manly Council continued to monitor stormwater pipes in areas of higher residential density.
Warringah Council has investigated dry weather sewer leaks in stormwater drains discharging into Narrabeen Lagoon. Council continues to measure bacteria levels in stormwater to determine the influence of stormwater on recreational water quality. No evidence has been found to suggest sewage was discharging into the lagoon during dry weather.
Warringah Council is making changes to policies to improve the water quality of receiving water bodies. Stormwater quality improvements assets have been constructed, including rain gardens along a residential street in the Collaroy Basin, bioretention at Middle Creek and Collaroy Beach recreational area and the Cromer Park stormwater harvesting scheme.
Warringah Council has installed a number of gross pollutant traps and water quality devices, and has recently installed a bioswale adjacent to Dee Why Lagoon. On average, 1000 tonnes of sediment and 17 cubic metres of floating debris are removed from these devices each year. Warringah Council is also investigating gross pollutant trap efficiencies and where improvements in cleaning and maintenance regimes can be made to make them more effective.
Pittwater Council’s Stormwater Management Service Charge has helped fund various stormwater management schemes and the construction and maintenance of stormwater quality improvement devices throughout the Pittwater area. Currently there are 49 stormwater quality improvement devices which prevent around 235 tonnes of sediment and floating debris from entering the waterways each year.
Manly Council removed 139 tonnes of sediment, litter and debris from stormwater quality improvement devices during 2012– 2013 and this has been repeated in 2013–2014. An additional 415 tonnes of intercepted sediment and litter was removed from upper Burnt Bridge Creek in early 2014.
6

Sampling sites and Beach Suitability Grades at Sydney’s Northern Beaches
7

Sampling sites and Beach Suitability Grades in Pittwater
8

Palm Beach Beach Suitability Grade: .VG
Palm Beach is 2.3 kilometres long, with rock baths in the southern corner. Samples are collected near the surf club at the southern end of the beach. Lifeguards patrol the beach from September to April.
The Beach Suitability Grade of Very Good indicates that microbial water quality is considered suitable for swimming almost all of the time, with few potential sources of significant faecal contamination.
The response to rainfall graph indicates that enterococci levels increased slightly with increasing rainfall, occasionally exceeding the safe swimming limit in response to 20 mm of rainfall or more.
The site has been monitored since 1989. Water quality has generally been of a very high standard over the last ten years.
See ‘How to read this report’ for key to map
Sanitary Inspection: Low Microbial Assessment: A SSourourcce:e: VVereryy LoLoww LowLow ModerModeratatee HHigighh Monitoring period for 2013–14 result is June 2012 to April 2014.
Hig
h ^ 600
50 10 10 34 22
D500
400 C
300
20095th
%ile
En
tero
cocc
i cfu
/100
mL
Mic
robi
al A
sses
smen
tCa
tego
ry
B100
A0 2009-10 2010-11 2011-12 2012-13 2013-14
Response to rainfall Rainfall from Avalon rain gauge
10000
0 0.1–4.9 5–9.9 10–19.9 20+
Ente
roco
cci (
cfu/
100m
L)
1000
100
10
1
24-hour rainfall (mm)Mod
erat
e
Trends in enterococci data through time 100%
% E
nter
ococ
ci s
ampl
es 80%
60%
40%
20%
0%
Low
Ve
ry
Low
Hawkesbury River Stormwater
Sewage Overflows
Bathers
Toilet Facilities
94-9
5
95-9
6
96-9
7
97-9
8
98-9
9
99-0
0
00-0
1
01-0
2
02-0
3
03-0
4
04-0
5
05-0
6
06-0
7
07-0
8
08-0
9
09-1
0
10-1
1
11-1
2
12-1
3
13-1
4
<=40 cfu/100mL 41-200 cfu/100mL 201-500 cfu/100mL >500 cfu/100mL
9

Whale Beach Beach Suitability Grade: .VG
Whale Beach is 600 metres long, with rock baths located on the southern rock platform. Swimming is potentially hazardous because of persistent rips. Lifeguards patrol the beach from September to April.
The Beach Suitability Grade of Very Good indicates that microbial water quality is considered suitable for swimming almost all of the time, with few potential sources of faecal contamination.
The response to rainfall graph indicates that enterococci levels increased slightly with increasing rainfall, occasionally exceeding the safe swimming limit in response to 20 mm of rainfall or more.
The site has been monitored since 1989. Water quality has generally been of a very high standard over the last ten years.
See ‘How to read this report’ for key to map
Sanitary Inspection: Low Microbial Assessment: A SSourourcce:e: VVereryy LoLoww LowLow ModerModeratatee HHigighh Monitoring period for 2013–14 result is June 2012 to April 2014.
Very
Low
Low
M
oder
ate
Hig
h ^ 600
5 5 9 40 24
A
B
C
D
Mic
robi
al A
sses
smen
tCa
tego
ry
95th
%ile
En
tero
cocc
i cfu
/100
mL 500
400
300
200
100
0 2009-10 2010-11 2011-12 2012-13 2013-14
Response to rainfall Rainfall from Avalon rain gauge
10000
0 0.1–4.9 5–9.9 10–19.9 20+
Ente
roco
cci (
cfu/
100m
L)
1000
100
10
1
24-hour rainfall (mm)
Trends in enterococci data through time 100%
% E
nter
ococ
ci s
ampl
es 80%
60%
40%
20%
0%Stormwater Sewage Overflows
Bathers
Toilet Facilities 94-9
5
95-9
6
96-9
7
97-9
8
98-9
9
99-0
0
00-0
1
01-0
2
02-0
3
03-0
4
04-0
5
05-0
6
06-0
7
07-0
8
08-0
9
09-1
0
10-1
1
11-1
2
12-1
3
13-1
4
<=40 cfu/100mL 41-200 cfu/100mL 201-500 cfu/100mL >500 cfu/100mL
10

Avalon Beach Beach Suitability Grade: .VG
Avalon Beach is 500 metres long and backed by a park and picnic area. Swimming can be hazardous because of persistent rips. Lifeguards patrol the beach from September to April.
The Beach Suitability Grade of Very Good indicates that microbial water quality is considered suitable for swimming almost all of the time, with few potential sources of significant faecal contamination.
The response to rainfall graph indicates that enterococci levels increased slightly with increasing rainfall, and occasionally exceeded the safe swimming limit in response to 20 mm of rainfall or more.
The site has been monitored since 1989. Water quality has generally been of a very high standard over the last ten years.
See ‘How to read this report’ for key to map
Sanitary Inspection: Low Microbial Assessment: A SSourourcce:e: VVereryy LoLoww LowLow ModerModeratatee HHigighh Monitoring period for 2013–14 result is June 2012 to April 2014.
^ 600
Very
Low
Low
M
oder
ate
Hig
h
8 2 6 16 12 A0
2009-10 2010-11 2011-12 2012-13 2013-14
95th
%ile
En
tero
cocc
i cfu
/100
mL D
C
B
Mic
robi
al A
sses
smen
tCa
tego
ry
500
400
300
200
100
Response to rainfall Rainfall from Avalon rain gauge
10000
0 0.1–4.9 5–9.9 10–19.9 20+
Ente
roco
cci (
cfu/
100m
L)
1000
100
10
1
24-hour rainfall (mm)
Trends in enterococci data through time 100%
% E
nter
ococ
ci s
ampl
es 80%
60%
40%
20%
0%Stormwater Sewer Chokes
Sewage Overflows
Bathers
Toilet Facilities 94-9
5
95-9
6
96-9
7
97-9
8
98-9
9
99-0
0
00-0
1
01-0
2
02-0
3
03-0
4
04-0
5
05-0
6
06-0
7
07-0
8
08-0
9
09-1
0
10-1
1
11-1
2
12-1
3
13-1
4
<=40 cfu/100mL 41-200 cfu/100mL 201-500 cfu/100mL >500 cfu/100mL
11

Bilgola Beach Beach Suitability Grade: .VG
Bilgola Beach is 500 metres long, with rock baths located at the southern end. Swimming can be hazardous because of shifting and permanent rips. Lifeguards patrol the beach from September to April.
The Beach Suitability Grade of Very Good indicates that microbial water quality is considered suitable for swimming almost all of the time, with few potential sources of significant faecal contamination.
The response to rainfall graph indicates that enterococci levels increased slightly with increasing rainfall, often exceeding the safe swimming limit in response to 20 mm or more of rainfall.
The site has been monitored since 1989. Water quality has generally been of a very high standard over the last ten years.
See ‘How to read this report’ for key to map
Sanitary Inspection: Low Microbial Assessment: A SSourourcce:e: VVereryy LoLoww LowLow ModerModeratatee HHigighh Monitoring period for 2013–14 result is June 2012 to April 2014.
Very
Low
Low
M
oder
ate
Hig
h ^ 600
18 10 36 60
24 A
B
C
D
Mic
robi
al A
sses
smen
tCa
tego
ry
95th
%ile
En
tero
cocc
i cfu
/100
mL 500
400
300
200
100
0 2009-10 2010-11 2011-12 2012-13 2013-14
Response to rainfall Rainfall from Avalon rain gauge
10000
0 0.1–4.9 5–9.9 10–19.9 20+
Ente
roco
cci (
cfu/
100m
L)
1000
100
10
1
24-hour rainfall (mm)
Trends in enterococci data through time 100%
% E
nter
ococ
ci s
ampl
es 80%
60%
40%
20%
0% Stormwater
Bathers
Toilet Facilities 94-9
5
95-9
6
96-9
7
97-9
8
98-9
9
99-0
0
00-0
1
01-0
2
02-0
3
03-0
4
04-0
5
05-0
6
06-0
7
07-0
8
08-0
9
09-1
0
10-1
1
11-1
2
12-1
3
13-1
4
<=40 cfu/100mL 41-200 cfu/100mL 201-500 cfu/100mL >500 cfu/100mL
12

Newport Beach Beach Suitability Grade: .VG
Newport Beach is 1.3 kilometres long. Several rips occur north of the surf club, and as a result beach conditions are safest in the patrolled area and in the southern corner. Lifeguards patrol the beach from September to April.
The Beach Suitability Grade of Very Good indicates that microbial water quality is considered suitable for swimming almost all of the time, with few potential sources of significant faecal contamination.
The response to rainfall graph indicates that enterococci levels increased with increasing rainfall, often exceeding the safe swimming limit in response to 20 mm of rainfall or more.
The site has been monitored since 1989. Water quality has generally been of a very high standard over the last ten years.
See ‘How to read this report’ for key to map
Sanitary Inspection: Low Microbial Assessment: A SSourourcce:e: VVereryy LoLoww LowLow ModerModeratatee HHigighh Monitoring period for 2013–14 result is June 2012 to April 2014.
^ 600
Very
Low
Low
Mod
erat
eH
igh
45 22 55 60
32
A
B
C
D
Mic
robi
al A
sses
smen
tCa
tego
ry
95th
%ile
En
tero
cocc
i cfu
/100
mL 500
400
300
200
100
0 2009-10 2010-11 2011-12 2012-13 2013-14
Response to rainfall Rainfall from Warriewood STP rain gauge
10000
0 0.1–4.9 5–9.9 10–19.9 20+
Ente
roco
cci (
cfu/
100m
L)
1000
100
10
1
24-hour rainfall (mm)
Trends in enterococci data through time 100%
% E
nter
ococ
ci s
ampl
es 80%
60%
40%
20%Stormwater
Sewer Chokes
Bathers
Toilet Facilities
Sewage Overflows 0%
94-9
5
95-9
6
96-9
7
97-9
8
98-9
9
99-0
0
00-0
1
01-0
2
02-0
3
03-0
4
04-0
5
05-0
6
06-0
7
07-0
8
08-0
9
09-1
0
10-1
1
11-1
2
12-1
3
13-1
4
<=40 cfu/100mL 41-200 cfu/100mL 201-500 cfu/100mL >500 cfu/100mL
13

Bungan Beach Beach Suitability Grade: .VG
Bungan Beach is 600 metres long and backed by a steep escarpment. Swimming can be hazardous because of several shifting rips. Lifeguards patrol the beach from late December to the end of January.
The Beach Suitability Grade of Very Good indicates that microbial water quality is considered suitable for swimming almost all of the time, with few potential sources of significant faecal contamination.
The response to rainfall graph indicates that enterococci levels increased slightly with increasing rainfall, occasionally exceeding the safe swimming limit in response to 20 mm or more of rainfall.
The site has been monitored since 1989. Water quality has generally been of a very high standard over the last ten years.
See ‘How to read this report’ for key to map
Sanitary Inspection: Low Microbial Assessment: A SSourourcce:e: VVereryy LoLoww LowLow ModerModeratatee HHigighh Monitoring period for 2013–14 result is June 2012 to April 2014.
Very
Low
Lo
w
Mod
erat
e H
igh ^ 600
22 14 34 45 14
A
B
C
D
Mic
robi
al A
sses
smen
tCa
tego
ry
95th
%ile
En
tero
cocc
i cfu
/100
mL 500
400
300
200
100
0 2009-10 2010-11 2011-12 2012-13 2013-14
Response to rainfall Rainfall from Warriewood STP rain gauge
10000
0 0.1–4.9 5–9.9 10–19.9 20+
Ente
roco
cci (
cfu/
100m
L)
1000
100
10
1
24-hour rainfall (mm)
Trends in enterococci data through time 100%
% E
nter
ococ
ci s
ampl
es 80%
60%
40%
20%
0%
Sewage Overflows Toilet Facilities
Bathers
Stormwater
94-9
5
95-9
6
96-9
7
97-9
8
98-9
9
99-0
0
00-0
1
01-0
2
02-0
3
03-0
4
04-0
5
05-0
6
06-0
7
07-0
8
08-0
9
09-1
0
10-1
1
11-1
2
12-1
3
13-1
4
<=40 cfu/100mL 41-200 cfu/100mL 201-500 cfu/100mL >500 cfu/100mL
14

Mona Vale Beach Beach Suitability Grade: .VG
Mona Vale Beach is one kilometre long. Swimming is potentially hazardous because of a number of rips. Lifeguards patrol the beach from September to April.
The Beach Suitability Grade of Very Good indicates that microbial water quality is considered suitable for swimming almost all of the time, with few potential sources of significant faecal contamination.
The response to rainfall graph indicates that enterococci levels increased slightly with increasing rainfall, often exceeding the safe swimming limit in response to more than 20 mm of rainfall.
The site has been monitored since 1989. Water quality has generally been of a very high standard over the last ten years.
See ‘How to read this report’ for key to map
Sanitary Inspection: Low Microbial Assessment: A SSourourcce:e: VVereryy LoLoww LowLow ModerModeratatee HHigighh Monitoring period for 2013–14 result is June 2012 to April 2014.
Very
Low
Low
M
oder
ate
Hig
h ^ 600
22 10 14 50
18 A
B
C
D
Mic
robi
al A
sses
smen
tCa
tego
ry
95th
%ile
En
tero
cocc
i cfu
/100
mL 500
400
300
200
100
0 2009-10 2010-11 2011-12 2012-13 2013-14
Response to rainfall Rainfall from Warriewood STP rain gauge
10000
0 0.1–4.9 5–9.9 10–19.9 20+
Ente
roco
cci (
cfu/
100m
L)
1000
100
10
1
24-hour rainfall (mm)
Trends in enterococci data through time 100%
% E
nter
ococ
ci s
ampl
es 80%
60%
40%
20%
0% Stormwater
Bathers
Toilet Facilities 94-9
5
95-9
6
96-9
7
97-9
8
98-9
9
99-0
0
00-0
1
01-0
2
02-0
3
03-0
4
04-0
5
05-0
6
06-0
7
07-0
8
08-0
9
09-1
0
10-1
1
11-1
2
12-1
3
13-1
4
<=40 cfu/100mL 41-200 cfu/100mL 201-500 cfu/100mL >500 cfu/100mL
15

.
Warriewood Beach Beach Suitability Grade: G
See ‘How to read this report’ for key to map
Sanitary Inspection: Moderate SSourourcce:e: VVereryy LoLoww LowLow ModerModeratatee HHigighh
Warriewood Beach is 500 metres long and is situated below a steep bluff. Swimming can be hazardous because of rips. Lifeguards patrol the beach from December to February.
The Beach Suitability Grade of Good indicates that microbial water quality is suitable for swimming most of the time, but the water may be susceptible to pollution after rain, with several potential sources of faecal contamination including bypasses from Warriewood Wastewater Treatment Plant.
The response to rainfall graph indicates that enterococci levels increased slightly with increasing rainfall, often exceeding the safe swimming limit in response to 20 mm of rainfall or more.
The site has been monitored since 1989. Water quality has generally been of a very high standard over the last ten years.
Microbial Assessment: A Monitoring period for 2013–14 result is June 2012 to April 2014.
WWTP Bypass
Hig
hM
oder
ate
Low
Ve
ry
Low
Bathers
Toilet Facilities
WWTP Discharge
^ 600
95th
%ile
En
tero
cocc
i cfu
/100
mL
65 22 34 55
20
D500
400 C
300
200
Mic
robi
al A
sses
smen
tCa
tego
ry
100 B
A0 2009-10 2010-11 2011-12 2012-13 2013-14
Response to rainfall Rainfall from Warriewood STP rain gauge
10000
Ente
roco
cci (
cfu/
100m
L)
0 0.1–4.9 5–9.9 10–19.9 20+
1000
100
10
1
24-hour rainfall (mm)
Trends in enterococci data through time 100%
% E
nter
ococ
ci s
ampl
es 80%
60%
40%
20%
0%
Stormwater
94-9
5
95-9
6
96-9
7
97-9
8
98-9
9
99-0
0
00-0
1
01-0
2
02-0
3
03-0
4
04-0
5
05-0
6
06-0
7
07-0
8
08-0
9
09-1
0
10-1
1
11-1
2
12-1
3
13-1
4
<=40 cfu/100mL 41-200 cfu/100mL 201-500 cfu/100mL >500 cfu/100mL
16

Turimetta Beach Beach Suitability Grade: .G
Turimetta Beach is 350 metres long and is backed by steep bluffs. Swimming can be hazardous because of rips at the centre and both ends of the beach. The beach is not patrolled by lifeguards.
The Beach Suitability Grade of Good indicates that microbial water quality is suitable for swimming most of the time, but the water may be susceptible to pollution after rain, with several potential sources of faecal contamination including bypasses from Warriewood Wastewater Treatment Plant.
The response to rainfall graph indicates that enterococci levels increased slightly with rainfall, occasionallyexceeding the safe swimming limit in response to 20 mm of rainfall or more.
The site has been monitored since 1994. Water quality has generally been of a very high standard over the last ten years.
Sanitary Inspection: Moderate Microbial Assessment: A SSourourcce:e: VVereryy LoLoww LowLow ModerModeratatee HHigighh Monitoring period for 2013–14 result is June 2012 to April 2014.
See ‘How to read this report’ for key to map
Hig
h ^ 600
500
400
300
200
100 32 8 14 45
12 A0
2009-10 2010-11 2011-12 2012-13 2013-14
95th
%ile
En
tero
cocc
i cfu
/100
mL D
C
B
Mic
robi
al A
sses
smen
tCa
tego
ry
Response to rainfall Rainfall from Warriewood STP rain gauge
10000
0 0.1–4.9 5–9.9 10–19.9 20+
Ente
roco
cci (
cfu/
100m
L)
1000
100
10
1
24-hour rainfall (mm)Mod
erat
e
Trends in enterococci data through time 100%
% E
nter
ococ
ci s
ampl
es 80%
60%
40%
20%
0%
Bathers
WWTP Bypass
WWTP Discharge
Low
94-9
5
95-9
6
96-9
7
97-9
8
98-9
9
99-0
0
00-0
1
01-0
2
02-0
3
03-0
4
04-0
5
05-0
6
06-0
7
07-0
8
08-0
9
09-1
0
10-1
1
11-1
2
12-1
3
13-1
4
Very
Lo
w <=40 cfu/100mL 41-200 cfu/100mL 201-500 cfu/100mL >500 cfu/100mL
17

North Narrabeen Beach Beach Suitability Grade: .G
North Narrabeen Beach is located at the northern end of the 3.5 kilometre-long Narrabeen Beach. Strong rips can create hazardous swimming conditions and lifeguards patrol the beach from September to April.
The Beach Suitability Grade of Good indicates that microbial water quality is suitable for swimming most of the time, but the water may be susceptible to pollution after rain, with several potential sources of faecal contamination including discharge from Narrabeen Lagoon.
The response to rainfall graph indicates that enterococci levels increased with increasing rainfall, frequently exceeding the safe swimming limit in response to 20 mm of rainfall or more.
The site has been monitored since 1989. Water quality has generally been of a very high standard over the last ten years.
See ‘How to read this report’ for key to map
Sanitary Inspection: Moderate Microbial Assessment: A SSourourcce:e: VVereryy LoLoww LowLow ModerModeratatee HHigighh Monitoring period for 2013–14 result is June 2012 to April 2014.
Very
Low
Low
M
oder
ate
Hig
h ^ 600
55 30 28 2845
D500
400 C
300
200
Ente
roco
cci c
fu/1
00m
L
Mic
robi
al A
sses
smen
tCa
tego
ry
95th
%ile
100 B
A0 2009-10 2010-11 2011-12 2012-13 2013-14
Response to rainfall Rainfall from Warriewood STP rain gauge
10000
Ente
roco
cci (
cfu/
100m
L)
0 0.1–4.9 5–9.9 10–19.9 20+
1000
100
10
1
24-hour rainfall (mm)
Trends in enterococci data through time 100%
% E
nter
ococ
ci s
ampl
es 80%
60%
40%
20%
0%WWTP Bypass WWTP Discharge
Bathers
Toilet Facilities
Stormwater
Narrabeen Lagoon
94-9
5
95-9
6
96-9
7
97-9
8
98-9
9
99-0
0
00-0
1
01-0
2
02-0
3
03-0
4
04-0
5
05-0
6
06-0
7
07-0
8
08-0
9
09-1
0
10-1
1
11-1
2
12-1
3
13-1
4
<=40 cfu/100mL 41-200 cfu/100mL 201-500 cfu/100mL >500 cfu/100mL
18

Narrabeen Lagoon (Birdwood Park) Beach Suitability Grade: G
See ‘How to read this report’ for key to map
Sanitary Inspection: Moderate SSourourcce:e: VVereryy LoLoww LowLow ModerModeratatee HHigighh
The Birdwood Park swimming site is a sandy stretch of beach located on the southern side of the entrance to Narrabeen Lagoon. The site is backed by a popular picnic area.
The Beach Suitability Grade of Good indicates that microbial water quality is suitable for swimming most of the time, but the water may be susceptible to pollution after rain, with several potential sources of faecal contamination including the lagoon itself.
The response to rainfall graph indicates that enterococci levels increased with increasing rainfall, occasionally exceeding the safe swimming limit in dry weather conditions and sometimes after only light rain. The safe swimming limit was frequently exceeded after 5 mm of rainfall or more.
The site has been monitored since 2004. Water quality has generally been highest during periods when the lagoon is open to the ocean.
Microbial Assessment: B Monitoring period for 2013–14 result is June 2012 to April 2014.
^
Very
Low Bathers
Sewage Overflows
Sewer Chokes
Hig
hM
oder
ate
Low
Stormwater
Narrabeen Lagoon
600 D500
400
250 250 260 310
195
2009-10 2010-11 2011-12 2012-13 2013-14
95th
%ile
En
tero
cocc
i cfu
/100
mL
Mic
robi
al A
sses
smen
tCa
tego
ry
C300
200 B100
A0
Response to rainfall Rainfall from Warriewood STP rain gauge
10000
0 0.1–4.9 5–9.9 10–19.9 20+
Ente
roco
cci (
cfu/
100m
L)
1000
100
10
1
24-hour rainfall (mm)
Trends in enterococci data through time 100%
% E
nter
ococ
ci s
ampl
es 80%
60%
40%
20%
0%
94-9
5
95-9
6
96-9
7
97-9
8
98-9
9
99-0
0
00-0
1
01-0
2
02-0
3
03-0
4
04-0
5
05-0
6
06-0
7
07-0
8
08-0
9
09-1
0
10-1
1
11-1
2
12-1
3
13-1
4
<=40 cfu/100mL 41-200 cfu/100mL 201-500 cfu/100mL >500 cfu/100mL
19

Collaroy Beach Beach Suitability Grade: .G
Collaroy Beach is backed by a park and picnic area, and rock baths are located at the southern end. Beach conditions are relatively safe south of the stormwater drain. Lifeguards patrol the beach from late September to April.
The Beach Suitability Grade of Good indicates that microbial water quality is suitable for swimming most of the time, but the water may be susceptible to pollution from several potential sources of faecal contamination including stormwater.
The response to rainfall graph indicates that enterococci levels generally increased with increasing rainfall, often exceeding the safe swimming limit in response to 10 mm of rainfall or more.
The site has been monitored since 1989. Water quality has generally been of a very high standard over the last ten years.
See ‘How to read this report’ for key to map
Sanitary Inspection: Moderate Microbial Assessment: A SSourourcce:e: VVereryy LoLoww LowLow ModerModeratatee HHigighh Monitoring period for 2013–14 result is June 2012 to April 2014.
^ 600
Very
Low
Low
M
oder
ate
Hig
h
55 45 28 50 24
A
B
C
D
Mic
robi
al A
sses
smen
tCa
tego
ry
95th
%ile
En
tero
cocc
i cfu
/100
mL 500
400
300
200
100
0 2009-10 2010-11 2011-12 2012-13 2013-14
Response to rainfall Rainfall from Dee Why rain gauge
10000
0 0.1–4.9 5–9.9 10–19.9 20+
Ente
roco
cci (
cfu/
100m
L)
1000
100
10
1
24-hour rainfall (mm)
Trends in enterococci data through time 100%
% E
nter
ococ
ci s
ampl
es 80%
60%
40%
20%
Stormwater
Sewer Chokes
Bathers
Toilet Facilities
Sewage Overflows 0%
94-9
5
95-9
6
96-9
7
97-9
8
98-9
9
99-0
0
00-0
1
01-0
2
02-0
3
03-0
4
04-0
5
05-0
6
06-0
7
07-0
8
08-0
9
09-1
0
10-1
1
11-1
2
12-1
3
13-1
4
<=40 cfu/100mL 41-200 cfu/100mL 201-500 cfu/100mL >500 cfu/100mL
20

Long Reef Beach Beach Suitability Grade: .G
Long Reef Beach is backed by a golf course and a reserve. Strong rips create hazardous swimming conditions, and lifeguards patrol the beach from late September to April.
The Beach Suitability Grade of Good indicates that microbial water quality is suitable for swimming most of the time, but the water may be susceptible to pollution from several potential sources of faecal contamination, including discharge from Dee Why Lagoon.
The response to rainfall graph indicates that enterococci levels generally increased with increasing rainfall, regularly exceeding the safe swimming limit in response to 20 mm of rainfall or more.
The site has been monitored since 1989. Water quality has generally been of a very high standard over the last ten years.
See ‘How to read this report’ for key to map
Sanitary Inspection: Moderate Microbial Assessment: A SSourourcce:e: VVereryy LoLoww LowLow ModerModeratatee HHigighh Monitoring period for 2013–14 result is June 2012 to April 2014.
Hig
h ^ 600
22 18 40 34 65
D500
400 C
300
20095th
%ile
En
tero
cocc
i cfu
/100
mL
Mic
robi
al A
sses
smen
tCa
tego
ry
B100
A0 2009-10 2010-11 2011-12 2012-13 2013-14
Response to rainfall Rainfall from Dee Why rain gauge
10000
0 0.1–4.9 5–9.9 10–19.9 20+
Ente
roco
cci (
cfu/
100m
L)
1000
100
10
1
24-hour rainfall (mm)Mod
erat
e
Trends in enterococci data through time 100%
% E
nter
ococ
ci s
ampl
es 80%
60%
40%
20%
0%
Bathers
Toilet Facilities
Dee Why LagoonLow
94-9
5
95-9
6
96-9
7
97-9
8
98-9
9
99-0
0
00-0
1
01-0
2
02-0
3
03-0
4
04-0
5
05-0
6
06-0
7
07-0
8
08-0
9
09-1
0
10-1
1
11-1
2
12-1
3
13-1
4
Very
Lo
w <=40 cfu/100mL 41-200 cfu/100mL 201-500 cfu/100mL >500 cfu/100mL
21

Dee Why Beach Beach Suitability Grade: V .G
Dee Why Beach is backed in part by a park and picnic area and there is an ocean pool at the southern end. Swimming can be hazardous because of strong rips and lifeguards patrol the beach from late September to April.
The Beach Suitability Grade of Very Good indicates that microbial water quality is considered suitable for swimming almost all of the time, with few potential sources of significant faecal contamination.
The response to rainfall graph indicates that enterococci levels generally increased slightly with increasing rainfall, but mostly remained below the safe swimming limit across all rainfall categories.
The site has been monitored since 1989. Water quality has generally been of a high standard over the last ten years.
See ‘How to read this report’ for key to map
Sanitary Inspection: Low Microbial Assessment: A SSourourcce:e: VVereryy LoLoww LowLow ModerModeratatee HHigighh Monitoring period for 2013–14 result is June 2012 to April 2014.
^
Sewer Chokes
Hig
hM
oder
ate
Low
Stormwater
Very
Low Bathers
Toilet Facilities
Sewage Overflows
95th
%ile
En
tero
cocc
i cfu
/100
mL
600
50 26 20 75
38
D500
400 C
300
200
Mic
robi
al A
sses
smen
tCa
tego
ry
100 B
A0 2009-10 2010-11 2011-12 2012-13 2013-14
Response to rainfall Rainfall from Dee Why rain gauge
10000
Ente
roco
cci (
cfu/
100m
L)
1000
100
10
1
24-hour rainfall (mm) 0 0.1–4.9 5–9.9 10–19.9 20+
Trends in enterococci data through time 100%
% E
nter
ococ
ci s
ampl
es 80%
60%
40%
20%
0%
94-9
5
95-9
6
96-9
7
97-9
8
98-9
9
99-0
0
00-0
1
01-0
2
02-0
3
03-0
4
04-0
5
05-0
6
06-0
7
07-0
8
08-0
9
09-1
0
10-1
1
11-1
2
12-1
3
13-1
4
<=40 cfu/100mL 41-200 cfu/100mL 201-500 cfu/100mL >500 cfu/100mL
22

North Curl Curl Beach Beach Suitability Grade: .G
North Curl Curl Beach is safest in the northern corner. Lifeguards patrol the beach on weekends between late September and April and on weekdays as well between December and March.
The Beach Suitability Grade of Good indicates that microbial water quality is suitable for swimming most of the time, but the water may be susceptible to pollution after heavy rain, with several potential sources of faecal contamination, including discharge from Curl Curl Lagoon.
The response to rainfall graph indicates that enterococci levels increased with increasing rainfall, usually exceeding the safe swimming limit in response to 20 mm or more of rainfall.
The site has been monitored since 1989. Water quality has generally been of a high standard, with year to year variations the result of lagoon openings and rainfall.
See ‘How to read this report’ for key to map
Sanitary Inspection: Moderate Microbial Assessment: B SSourourcce:e: VVereryy LoLoww LowLow ModerModeratatee HHigighh Monitoring period for 2013–14 result is June 2012 to April 2014.
^ 600
Very
Low
Low
M
oder
ate
Hig
h
50 65 70 90 70
A
B
C
D
Mic
robi
al A
sses
smen
tCa
tego
ry
95th
%ile
En
tero
cocc
i cfu
/100
mL 500
400
300
200
100
0 2009-10 2010-11 2011-12 2012-13 2013-14
Response to rainfall Rainfall from Harbord rain gauge
10000
0 0.1–4.9 5–9.9 10–19.9 20+
Ente
roco
cci (
cfu/
100m
L)
1000
100
10
1
24-hour rainfall (mm)
Trends in enterococci data through time 100%
% E
nter
ococ
ci s
ampl
es 80%
60%
40%
20%
0%
Animals
Bathers
Toilet Facilities
Lagoons
94-9
5
95-9
6
96-9
7
97-9
8
98-9
9
99-0
0
00-0
1
01-0
2
02-0
3
03-0
4
04-0
5
05-0
6
06-0
7
07-0
8
08-0
9
09-1
0
10-1
1
11-1
2
12-1
3
13-1
4
<=40 cfu/100mL 41-200 cfu/100mL 201-500 cfu/100mL >500 cfu/100mL
23

South Curl Curl Beach Beach Suitability Grade: .VG
South Curl Curl Beach is at the southern end of Curl Curl Beach. Swimming can be hazardous because of rips, and lifeguards patrol the beach from late September to April.
The Beach Suitability Grade of Very Good indicates that microbial water quality is considered suitable for swimming almost all of the time, with few potential sources of significant faecal contamination.
The response to rainfall graph indicates that enterococci levels increased with increasing rainfall, often exceeding the safe swimming limit in response to 10 mm or more of rainfall.
The site has been monitored since 1989. Water quality has been of a high standard over the last ten years.
See ‘How to read this report’ for key to map
Sanitary Inspection: Low Microbial Assessment: A SSourourcce:e: VVereryy LoLoww LowLow ModerModeratatee HHigighh Monitoring period for 2013–14 result is June 2012 to April 2014.
Very
Low
Low
M
oder
ate
Hig
h ^ 600
50 28 30 55
24 A
B
C
D
Mic
robi
al A
sses
smen
tCa
tego
ry
95th
%ile
En
tero
cocc
i cfu
/100
mL 500
400
300
200
100
0 2009-10 2010-11 2011-12 2012-13 2013-14
Response to rainfall Rainfall from Harbord rain gauge
10000
0 0.1–4.9 5–9.9 10–19.9 20+
Ente
roco
cci (
cfu/
100m
L)
1000
100
10
1
24-hour rainfall (mm)
Trends in enterococci data through time 100%
% E
nter
ococ
ci s
ampl
es 80%
60%
40%
20%
0%
Bathers
Toilet Facilities
Stormwater
94-9
5
95-9
6
96-9
7
97-9
8
98-9
9
99-0
0
00-0
1
01-0
2
02-0
3
03-0
4
04-0
5
05-0
6
06-0
7
07-0
8
08-0
9
09-1
0
10-1
1
11-1
2
12-1
3
13-1
4
<=40 cfu/100mL 41-200 cfu/100mL 201-500 cfu/100mL >500 cfu/100mL
24

Freshwater Beach Beach Suitability Grade: .G
Freshwater Beach is approximately 350 metres long. Rock baths are located on the northern rock platform. Lifeguards patrol the beach from late September to April.
The Beach Suitability Grade of Good indicates that microbial water quality is suitable for swimming most of the time, but the water may be susceptible to pollution from several potential sources of faecal contamination, including stormwater.
The response to rainfall graph indicates that enterococci levels increased with increasing rainfall, occasionally exceeding the safe swimming limit in response to 5 mm of rainfall or more, and regularly in response to 20 mm or more.
The site has been monitored since 1989. Water quality has been of a high standard over the last ten years.
See ‘How to read this report’ for key to map
Sanitary Inspection: Moderate Microbial Assessment: B SSourourcce:e: VVereryy LoLoww LowLow ModerModeratatee HHigighh Monitoring period for 2013–14 result is June 2012 to April 2014.
^ 600
Very
Low
Low
M
oder
ate
Hig
h
60 60 80 125
60
A
B
C
D
Mic
robi
al A
sses
smen
tCa
tego
ry
95th
%ile
En
tero
cocc
i cfu
/100
mL 500
400
300
200
100
0 2009-10 2010-11 2011-12 2012-13 2013-14
Response to rainfall Rainfall from Harbord rain gauge
10000
0 0.1–4.9 5–9.9 10–19.9 20+
Ente
roco
cci (
cfu/
100m
L)
1000
100
10
1
24-hour rainfall (mm)
Trends in enterococci data through time 100%
% E
nter
ococ
ci s
ampl
es 80%
60%
40%
20%
0%
Lagoons
Bathers
Toilet Facilities
Stormwater
94-9
5
95-9
6
96-9
7
97-9
8
98-9
9
99-0
0
00-0
1
01-0
2
02-0
3
03-0
4
04-0
5
05-0
6
06-0
7
07-0
8
08-0
9
09-1
0
10-1
1
11-1
2
12-1
3
13-1
4
<=40 cfu/100mL 41-200 cfu/100mL 201-500 cfu/100mL >500 cfu/100mL
25

Queenscliff Beach Beach Suitability Grade: .G
Queenscliff Beach is located at the northern end of Manly Beach. Swimming may be hazardous because of rips. Lifeguards patrol the beach from October to April.
The Beach Suitability Grade of Good indicates that microbial water quality is suitable for swimming most of the time, but the water may be susceptible to pollution after rain, with several potential sources of faecal contamination.
The response to rainfall graph indicates that enterococci levels increased with increasing rainfall, regularly exceeding the safe swimming limit after 5 mm of rainfall or more.
The site has been monitored since 1989, with variation in results since 1990 due to rainfall patterns and lagoon openings.
See ‘How to read this report’ for key to map
Sanitary Inspection: Moderate Microbial Assessment: B SSourourcce:e: VVereryy LoLoww LowLow ModerModeratatee HHigighh Monitoring period for 2013–14 result is June 2012 to April 2014.
Hig
h ^ 600
110 70 85
170 120
D500
400 C
300
95th
%ile
En
tero
cocc
i cfu
/100
mL
Mic
robi
al A
sses
smen
tCa
tego
ry
200 B100
A0 2009-10 2010-11 2011-12 2012-13 2013-14
Response to rainfall Rainfall from Manly rain gauge
10000
0 0.1–4.9 5–9.9 10–19.9 20+
Ente
roco
cci (
cfu/
100m
L)
1000
100
10
1
24-hour rainfall (mm)Mod
erat
e
Trends in enterococci data through time 100%
% E
nter
ococ
ci s
ampl
es 80%
60%
40%
20%
0%
Sewage Overflows Toilet Facilities
Bathers
Manly LagoonLow
94-9
5
95-9
6
96-9
7
97-9
8
98-9
9
99-0
0
00-0
1
01-0
2
02-0
3
03-0
4
04-0
5
05-0
6
06-0
7
07-0
8
08-0
9
09-1
0
10-1
1
11-1
2
12-1
3
13-1
4
Very
Lo
w <=40 cfu/100mL 41-200 cfu/100mL 201-500 cfu/100mL >500 cfu/100mL
26

North Steyne Beach Beach Suitability Grade: .G
North Steyne Beach is the middle section of Manly Beach. Swimming can be hazardous, as rips occur along the beach. Lifeguards patrol the beach from October to April.
The Beach Suitability Grade of Good indicates that microbial water quality is suitable for swimming most of the time, but the water may be susceptible to pollution after heavy rain, with several potential sources of faecal contamination, including stormwater and discharge from Manly Lagoon.
The response to rainfall graph indicates that enterococci levels increased with increasing rainfall, regularly exceeding the safe swimming limit after 20 mm of rainfall or more.
The site has been monitored since 1989.
See ‘How to read this report’ for key to map
Sanitary Inspection: Low Microbial Assessment: B SSourourcce:e: VVereryy LoLoww LowLow ModerModeratatee HHigighh Monitoring period for 2013–14 result is June 2012 to April 2014.
Hig
h ^ 600
70 40 45
80 95
D500
400 C
300
20095th
%ile
En
tero
cocc
i cfu
/100
mL
Mic
robi
al A
sses
smen
tCa
tego
ry
B100
A0 2009-10 2010-11 2011-12 2012-13 2013-14
Response to rainfall Rainfall from Manly rain gauge
10000
0 0.1–4.9 5–9.9 10–19.9 20+
Ente
roco
cci (
cfu/
100m
L)
1000
100
10
1
24-hour rainfall (mm)Mod
erat
e
Trends in enterococci data through time 100%
% E
nter
ococ
ci s
ampl
es 80%
60%
40%
20%
0%
Low
Ve
ry
Low
Sewage Overflows
Manly Lagoon
Bathers
Toilet Facilities
Stormwater
94-9
5
95-9
6
96-9
7
97-9
8
98-9
9
99-0
0
00-0
1
01-0
2
02-0
3
03-0
4
04-0
5
05-0
6
06-0
7
07-0
8
08-0
9
09-1
0
10-1
1
11-1
2
12-1
3
13-1
4
<=40 cfu/100mL 41-200 cfu/100mL 201-500 cfu/100mL >500 cfu/100mL
27

South Steyne Beach Beach Suitability Grade: .G
South Steyne Beach is the southern end of Manly Beach., where waves tend to be lower, but rips still persist. Lifeguards patrol the beach year round.
The Beach Suitability Grade of Good indicates that microbial water quality is suitable for swimming most of the time, but the water may be susceptible to pollution from several potential sources of faecal contamination, including stormwater.
The response to rainfall graph indicates that enterococci levels generally increased with increasing rainfall, often exceeding the safe swimming limit after 10 mm of rainfall or more.
The site has been monitored since 1989.
See ‘How to read this report’ for key to map
Sanitary Inspection: Moderate Microbial Assessment: B SSourourcce:e: VVereryy LoLoww LowLow ModerModeratatee HHigighh Monitoring period for 2013–14 result is June 2012 to April 2014.
^ 600
Very
Low
Low
M
oder
ate
Hig
h
120 60 45
95 95
A
B
C
D
Mic
robi
al A
sses
smen
tCa
tego
ry
95th
%ile
En
tero
cocc
i cfu
/100
mL 500
400
300
200
100
0 2009-10 2010-11 2011-12 2012-13 2013-14
Response to rainfall Rainfall from Manly rain gauge
10000
0 0.1–4.9 5–9.9 10–19.9 20+
Ente
roco
cci (
cfu/
100m
L)
1000
100
10
1
24-hour rainfall (mm)
Trends in enterococci data through time 100%
% E
nter
ococ
ci s
ampl
es 80%
60%
40%
20%
0%
Stormwater
Sewage Overflows
Bathers
Toilet Facilities 94-9
5
95-9
6
96-9
7
97-9
8
98-9
9
99-0
0
00-0
1
01-0
2
02-0
3
03-0
4
04-0
5
05-0
6
06-0
7
07-0
8
08-0
9
09-1
0
10-1
1
11-1
2
12-1
3
13-1
4
<=40 cfu/100mL 41-200 cfu/100mL 201-500 cfu/100mL >500 cfu/100mL
28

Shelly Beach Beach Suitability Grade: .VG
Shelly Beach is backed by a picnic area and reserve. The beach offers no surf and apart from the deep water close to shore, it is relatively safe for swimming. The beach is not patrolled by lifeguards.
The Beach Suitability Grade of Very Good indicates that microbial water quality is considered suitable for swimming almost all of the time, with few potential sources of significant faecal contamination.
The response to rainfall graph indicates that enterococci levels generally increased with increasing rainfall, often exceeding the safe swimming limit in response to 10 mm of rain or more.
The site has been monitored since 1989. Microbial water quality improved in 2000–2001 when sewage overflows to the bay were diverted to North Head Wastewater Treatment Plant.
See ‘How to read this report’ for key to map
Sanitary Inspection: Low Microbial Assessment: A SSourourcce:e: VVereryy LoLoww LowLow ModerModeratatee HHigighh Monitoring period for 2013–14 result is June 2012 to April 2014.
Very
Low
Low
M
oder
ate
Hig
h ^ 600
105 70
36 55 20
A
B
C
D
Mic
robi
al A
sses
smen
tCa
tego
ry
95th
%ile
En
tero
cocc
i cfu
/100
mL 500
400
300
200
100
0 2009-10 2010-11 2011-12 2012-13 2013-14
Response to rainfall Rainfall from Manly rain gauge
10000
0 0.1–4.9 5–9.9 10–19.9 20+
Ente
roco
cci (
cfu/
100m
L)
1000
100
10
1
24-hour rainfall (mm)
Trends in enterococci data through time 100%
% E
nter
ococ
ci s
ampl
es 80%
60%
40%
20%
0%
Bathers
Toilet Facilities
Stormwater
94-9
5
95-9
6
96-9
7
97-9
8
98-9
9
99-0
0
00-0
1
01-0
2
02-0
3
03-0
4
04-0
5
05-0
6
06-0
7
07-0
8
08-0
9
09-1
0
10-1
1
11-1
2
12-1
3
13-1
4
<=40 cfu/100mL 41-200 cfu/100mL 201-500 cfu/100mL >500 cfu/100mL
29

Barrenjoey Beach Beach Suitability Grade: .G
Barrenjoey Beach is approximately 1.5 kilometres long and located on the north-eastern foreshore of Pittwater. The beach is backed by Palm Beach Reserve.
The Beach Suitability Grade of Good indicates that the water quality is safe for swimming most of the time but can be susceptible to pollution after heavy rain, with several minor sources of faecal contamination.
The response to rainfall graph indicates that enterococci levels increased slightly with increasing rainfall, but generally remained below the safe swimming limit across all rainfall categories.
The site has been monitored since 1996. Microbial water quality improved significantly in 2000 when the toilet facilities at the beach were connected to the reticulated sewerage system.
See ‘How to read this report’ for key to map
Sanitary Inspection: Low VVereryy LoLoww LowLow ModerModeratateeSSourourcce:e: HHigighh
Microbial Assessment: B Monitoring period for 2013–14 result is November 2011 to April 2014.
Very
Low
Lo
w
Mod
erat
e H
igh ^ 600
10 2 22 50 50
D500
400 C
300
200
Ente
roco
cci c
fu/1
00m
L
Mic
robi
al A
sses
smen
tCa
tego
ry
95th
%ile
100 B
A0 2009-10 2010-11 2011-12 2012-13 2013-14
Response to rainfall Rainfall from Avalon rain gauge
10000
Ente
roco
cci (
cfu/
100m
L)
0 0.1–4.9 5–9.9 10–19.9 20+
1000
100
10
1
24-hour rainfall (mm)
Trends in enterococci data through time 100%
% E
nter
ococ
ci s
ampl
es 80%
60%
40%
20%
0%Boats Hawkesbury River
Stormwater Sewage Overflows
Toilet Facilities Bathers
94-9
5
95-9
6
96-9
7
97-9
8
98-9
9
99-0
0
00-0
1
01-0
2
02-0
3
03-0
4
04-0
5
05-0
6
06-0
7
07-0
8
08-0
9
09-1
0
10-1
1
11-1
2
12-1
3
13-1
4
<=40 cfu/100mL 41-200 cfu/100mL 201-500 cfu/100mL >500 cfu/100mL
30

Paradise Beach Baths Beach Suitability Grade: .G
Paradise Beach Baths are a 30 by 20 metre netted swimming enclosure on the eastern foreshore of Pittwater, backed by a narrow sandy beach and a small park.
The Beach Suitability Grade of Good indicates that microbial water quality is suitable for swimming most of the time but the water may be susceptible to pollution from several minor sources of faecal contamination.
The response to rainfall graph indicates that enterococci levels increased with increasing rainfall, frequently exceeding the safe swimming limit in response to 20 mm of rainfall or more.
The site has been monitored since 1996. Microbial water quality improved slightly in 2000–2001 when much of the catchment was connected to reticulated sewerage.
See ‘How to read this report’ for key to map
Sanitary Inspection: Low VVereryy LoLoww LowLow ModerModeratateeSSourourcce:e: HHigighh
Microbial Assessment: B Monitoring period for 2013–14 result is November 2011 to April 2014.
Very
Low
Low
M
oder
ate
Hig
h ^ 600
32 36
105 110 160
A
B
C
D
Mic
robi
al A
sses
smen
tCa
tego
ry
95th
%ile
En
tero
cocc
i cfu
/100
mL 500
400
300
200
100
0 2009-10 2010-11 2011-12 2012-13 2013-14
Response to rainfall Rainfall from Avalon rain gauge
10000
0 0.1–4.9 5–9.9 10–19.9 20+
Ente
roco
cci (
cfu/
100m
L)
1000
100
10
1
24-hour rainfall (mm)
Trends in enterococci data through time 100%
% E
nter
ococ
ci s
ampl
es 80%
60%
40%
20%
0%
Sewer Chokes Sewage Overflows
Bathers
Stormwater
Boats
94-9
5
95-9
6
96-9
7
97-9
8
98-9
9
99-0
0
00-0
1
01-0
2
02-0
3
03-0
4
04-0
5
05-0
6
06-0
7
07-0
8
08-0
9
09-1
0
10-1
1
11-1
2
12-1
3
13-1
4
<=40 cfu/100mL 41-200 cfu/100mL 201-500 cfu/100mL >500 cfu/100mL
31

Clareville Beach Beach Suitability Grade: .G
Clareville Beach is a narrow 250 metre long beach located on the eastern foreshore of Pittwater. A grassy park area backs the beach, with picnic facilities at the northern end.
The Beach Suitability Grade of Good indicates that microbial water quality is suitable for swimming most of the time but the water may be susceptible to pollution from several potential sources of faecal contamination including stormwater.
The response to rainfall graph indicates that enterococci levels increased with increasing rainfall, often exceeding the safe swimming limit in response to 5 mm of rainfall or more.
The site has been monitored since 1995. Microbial water quality improved in 2000–2001 when much of the catchment was connected to reticulated sewerage.
See ‘How to read this report’ for key to map
Sanitary Inspection: Moderate Microbial Assessment: B SSourourcce:e: VVereryy LoLoww LowLow ModerModeratatee HHigighh Monitoring period for 2013–14 result is November 2011 to April 2014.
^ 600
Very
Low
Low
M
oder
ate
Hig
h
55 55 95 95
125
A
B
C
D
Mic
robi
al A
sses
smen
tCa
tego
ry
95th
%ile
En
tero
cocc
i cfu
/100
mL 500
400
300
200
100
0 2009-10 2010-11 2011-12 2012-13 2013-14
Response to rainfall Rainfall from Avalon rain gauge
10000
0 0.1–4.9 5–9.9 10–19.9 20+
Ente
roco
cci (
cfu/
100m
L)
1000
100
10
1
24-hour rainfall (mm)
Trends in enterococci data through time 100%
% E
nter
ococ
ci s
ampl
es 80%
60%
40%
20%
0%Sewer Chokes Sewage Overflows
Boats
Bathers
Toilet Facilities
Stormwater
94-9
5
95-9
6
96-9
7
97-9
8
98-9
9
99-0
0
00-0
1
01-0
2
02-0
3
03-0
4
04-0
5
05-0
6
06-0
7
07-0
8
08-0
9
09-1
0
10-1
1
11-1
2
12-1
3
13-1
4
<=40 cfu/100mL 41-200 cfu/100mL 201-500 cfu/100mL >500 cfu/100mL
32

Taylors Point Baths Beach Suitability Grade: .G
Taylors Point Baths are a 15 by 20 metre netted swimming enclosure on the eastern foreshore of Pittwater. The baths are backed by a narrow beach with a small grassed area.
The Beach Suitability Grade of Good indicates that microbial water quality is suitable for swimming most of the time but the water may be susceptible to pollution from several potential sources of faecal contamination including stormwater.
The response to rainfall graph indicates that enterococci levels increased with increasing rainfall, often exceeding the safe swimming limit in response to 5 mm of rainfall or more.
The site has been monitored since 2010 and water quality has generally been of a high standard.
See ‘How to read this report’ for key to map
Sanitary Inspection: Moderate Microbial Assessment: B SSourourcce:e: VVereryy LoLoww LowLow ModerModeratatee HHigighh Monitoring period for 2013–14 result is November 2011 to April 2014.
^
Sewer Chokes Sewage Overflows
Bathers
Hig
hM
oder
ate
Low
Ve
ryLo
w
Boats
Stormwater
95th
%ile
En
tero
cocc
i cfu
/100
mL
600
4 65 60 70
D500
400 C
300
200
Mic
robi
al A
sses
smen
tCa
tego
ry
100 B
A0 2009-10 2010-11 2011-12 2012-13 2013-14
Response to rainfall Rainfall from Avalon rain gauge
10000
Ente
roco
cci (
cfu/
100m
L)
0 0.1–4.9 5–9.9 10–19.9 20+
1000
100
10
1
24-hour rainfall (mm)
Trends in enterococci data through time 100%
% E
nter
ococ
ci s
ampl
es 80%
60%
40%
20%
0%
94-9
5
95-9
6
96-9
7
97-9
8
98-9
9
99-0
0
00-0
1
01-0
2
02-0
3
03-0
4
04-0
5
05-0
6
06-0
7
07-0
8
08-0
9
09-1
0
10-1
1
11-1
2
12-1
3
13-1
4
<=40 cfu/100mL 41-200 cfu/100mL 201-500 cfu/100mL >500 cfu/100mL
33

Bayview Baths Beach Suitability Grade: .P
Bayview Baths are a 20 by 40 metre netted swimming enclosure on the southern foreshore of Pittwater. The baths are backed by a narrow beach with a small park. The baths are considerably silted up.
The Beach Suitability Grade of Poor indicates that microbial water quality is influenced by faecal pollution, usually triggered by rainfall, with potential faecal contamination from stormwater and sewage overflows.
The response to rainfall graph indicates that enterococci levels increased with increasing rainfall, often exceeding the safe swimming limit in response to 5 mm of rainfall or more.
The site has been monitored since 1995. Microbial water quality improved in 2000–2001 when much of the catchment was connected to reticulated sewerage.
See ‘How to read this report’ for key to map
Sanitary Inspection: Moderate Microbial Assessment: C SSourourcce:e: VVereryy LoLoww LowLow ModerModeratatee HHigighh Monitoring period for 2013–14 result is November 2011 to April 2014.
Very
Low
Lo
w
Mod
erat
eH
igh ^
65
150 125
200
270
0
100
200
300
400
500
600
95th
%ile
En
tero
cocc
i cfu
/100
mL
A
B
C
D
Mic
robi
al A
sses
smen
tCa
tego
ry
2009-10 2010-11 2011-12 2012-13 2013-14
Response to rainfall Rainfall from Avalon rain gauge
10000
Ente
roco
cci (
cfu/
100m
L)
1000
100
10
1
24-hour rainfall (mm) 0 0.1–4.9 5–9.9 10–19.9 20+
OnSite Systems Sewer Chokes
Stormwater
Boats
Trends in enterococci data through time 100%
% E
nter
ococ
ci s
ampl
es 80%
60%
40%
20%
0%Sewage Overflows
<=40 cfu/100mL 41-200 cfu/100mL 201-500 cfu/100mL >500 cfu/100mL Bathers
94-9
5
95-9
6
96-9
7
97-9
8
98-9
9
99-0
0
00-0
1
01-0
2
02-0
3
03-0
4
04-0
5
05-0
6
06-0
7
07-0
8
08-0
9
09-1
0
10-1
1
11-1
2
12-1
3
13-1
4
34

Elvina Bay Beach Suitability Grade: .G
Elvina Bay is on the south-western foreshore of Pittwater. The swimming area is not netted. Water quality samples are collected from Elvina South Wharf on the southern side of Elvina Bay.
The Beach Suitability Grade of Good indicates that the water quality is safe for swimming, but can be susceptible to pollution after heavy rain, with several potential sources of minor faecal contamination.
The response to rainfall graph indicates that enterococci levels increase with increasing rainfall, often exceeding the safe swimming limit in response to 20 mm of rainfall or more.
Microbial water quality improved slightly in 2000–2001 when much of the eastern side of Pittwater was connected to reticulated sewerage.
See ‘How to read this report’ for key to map
Sanitary Inspection: Low Microbial Assessment: B SSourourcce:e: VVereryy LoLoww LowLow ModerModeratatee HHigighh Monitoring period for 2013–14 result is November 2011 to April 2014.
Very
Low
Low
M
oder
ate
Hig
h ^ 600
28 40 36 75 65
A
B
C
D
Mic
robi
al A
sses
smen
tCa
tego
ry
95th
%ile
En
tero
cocc
i cfu
/100
mL 500
400
300
200
100
0 2009-10 2010-11 2011-12 2012-13 2013-14
Response to rainfall Rainfall from Avalon rain gauge
10000
0 0.1–4.9 5–9.9 10–19.9 20+
Ente
roco
cci (
cfu/
100m
L)
1000
100
10
1
24-hour rainfall (mm)
Trends in enterococci data through time 100%
% E
nter
ococ
ci s
ampl
es 80%
60%
40%
20%
0%
OnSite Systems
Stormwater
Boats
94-9
5
95-9
6
96-9
7
97-9
8
98-9
9
99-0
0
00-0
1
01-0
2
02-0
3
03-0
4
04-0
5
05-0
6
06-0
7
07-0
8
08-0
9
09-1
0
10-1
1
11-1
2
12-1
3
13-1
4
<=40 cfu/100mL 41-200 cfu/100mL 201-500 cfu/100mL >500 cfu/100mL Bathers
35

North Scotland Island Beach Suitability Grade: .G
The North Scotland Island swimming site is a 15 by 50 metre netted enclosure located on the north side of Scotland Island in Pittwater. A park with picnic facilities backs the swimming area.
The Beach Suitability Grade of Good indicates that microbial water quality is suitable for swimming most of the time but the water may be susceptible to pollution from several potential sources of faecal contamination including on-site sewage management systems.
The response to rainfall graph indicates that enterococci levels increase with increasing rainfall, often exceeding the safe swimming limit in response to 20 mm of rainfall or more.
The site has been monitored since 1995. Microbial water quality improved slightly in 2000–2001 when much of the eastern side of Pittwater was connected to reticulated sewerage.
See ‘How to read this report’ for key to map
Sanitary Inspection: Moderate Microbial Assessment: B SSourourcce:e: VVereryy LoLoww LowLow ModerModeratatee HHigighh Monitoring period for 2013–14 result is November 2011 to April 2014.
Very
Low
Lo
w
Mod
erat
eH
igh ^ 600
38 40 75 85 75
A
B
C
D
Mic
robi
al A
sses
smen
tCa
tego
ry
95th
%ile
En
tero
cocc
i cfu
/100
mL 500
400
300
200
100
0 2009-10 2010-11 2011-12 2012-13 2013-14
Response to rainfall Rainfall from Avalon rain gauge
10000
0 0.1–4.9 5–9.9 10–19.9 20+
Ente
roco
cci (
cfu/
100m
L)
1000
100
10
1
24-hour rainfall (mm)
Trends in enterococci data through time 100%
% E
nter
ococ
ci s
ampl
es 80%
60%
40%
20%
0%
Animals
Stormwater
Boats
OnSite Systems
<=40 cfu/100mL 41-200 cfu/100mL 201-500 cfu/100mL >500 cfu/100mL Bathers
94-9
5
95-9
6
96-9
7
97-9
8
98-9
9
99-0
0
00-0
1
01-0
2
02-0
3
03-0
4
04-0
5
05-0
6
06-0
7
07-0
8
08-0
9
09-1
0
10-1
1
11-1
2
12-1
3
13-1
4
36

South Scotland Island Beach Suitability Grade: .G
The South Scotland Island swimming site is located at Carols Wharf on the southern side of Scotland Island. The location is not netted and is backed by a reserve.
The Beach Suitability Grade of Good indicates that microbial water quality is suitable for swimming most of the time but the water may be susceptible to pollution from several potential sources of faecal contamination including on-site sewage management systems.
The response to rainfall graph indicates that enterococci levels increased with increasing rainfall, occasionally exceeding the safe swimming limit in response to 5 mm of rainfall or more.
The site has been monitored since 1996. Microbial water quality improved slightly in 2000–2001 when much of the eastern side of Pittwater was connected to reticulated sewerage.
See ‘How to read this report’ for key to map
Sanitary Inspection: Moderate Microbial Assessment: A SSourourcce:e: VVereryy LoLoww LowLow ModerModeratatee HHigighh Monitoring period for 2013–14 result is November 2011 to April 2014.
^ 600
Very
Low
Lo
w
Mod
erat
eH
igh
34 20 18 24 34
A
B
C
D
Mic
robi
al A
sses
smen
tCa
tego
ry
95th
%ile
En
tero
cocc
i cfu
/100
mL 500
400
300
200
100
0 2009-10 2010-11 2011-12 2012-13 2013-14
Response to rainfall Rainfall from Avalon rain gauge
10000
0 0.1–4.9 5–9.9 10–19.9 20+
Ente
roco
cci (
cfu/
100m
L)
1000
100
10
1
24-hour rainfall (mm)
Trends in enterococci data through time 100%
% E
nter
ococ
ci s
ampl
es 80%
60%
40%
20%
0%
Animals
Stormwater
Boats
OnSite Systems
<=40 cfu/100mL 41-200 cfu/100mL 201-500 cfu/100mL >500 cfu/100mL Bathers
94-9
5
95-9
6
96-9
7
97-9
8
98-9
9
99-0
0
00-0
1
01-0
2
02-0
3
03-0
4
04-0
5
05-0
6
06-0
7
07-0
8
08-0
9
09-1
0
10-1
1
11-1
2
12-1
3
13-1
4
37
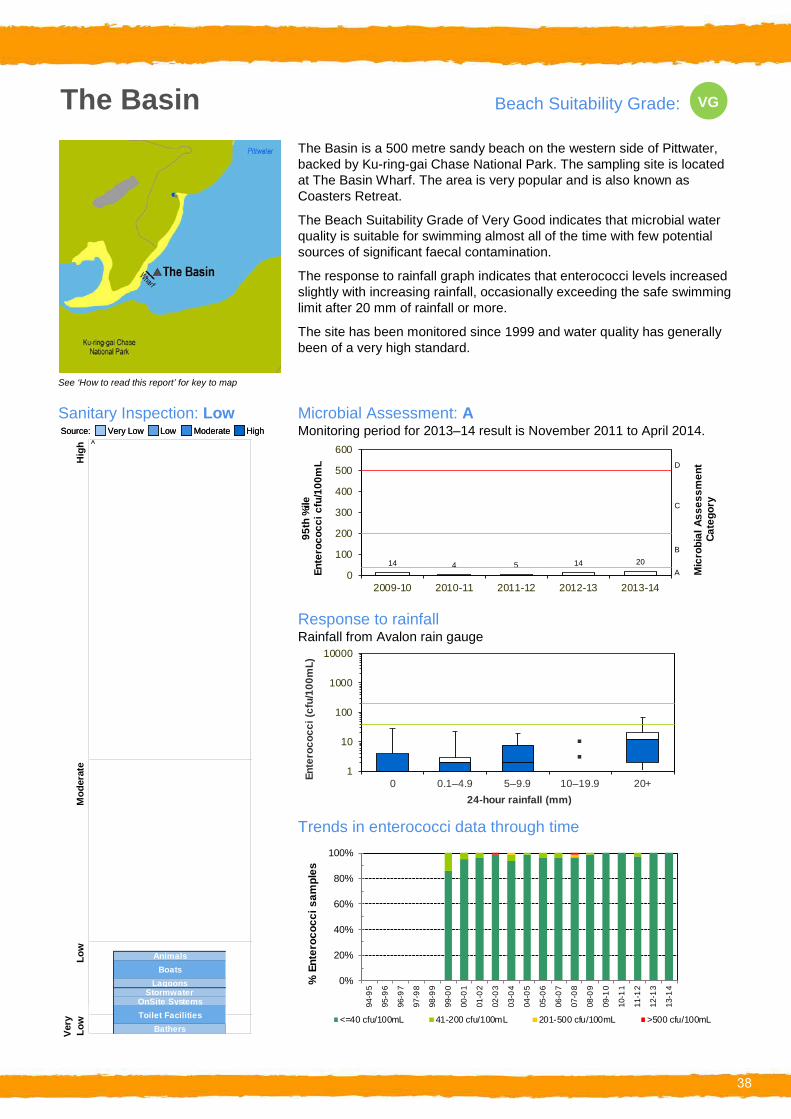
Animals
The Basin Beach Suitability Grade: V .G
The Basin is a 500 metre sandy beach on the western side of Pittwater, backed by Ku-ring-gai Chase National Park. The sampling site is located at The Basin Wharf. The area is very popular and is also known as Coasters Retreat.
The Beach Suitability Grade of Very Good indicates that microbial water quality is suitable for swimming almost all of the time with few potential sources of significant faecal contamination.
The response to rainfall graph indicates that enterococci levels increased slightly with increasing rainfall, occasionally exceeding the safe swimming limit after 20 mm of rainfall or more.
The site has been monitored since 1999 and water quality has generally been of a very high standard.
See ‘How to read this report’ for key to map
Sanitary Inspection: Low Microbial Assessment: A SSourourcce:e: VVereryy LoLoww LowLow ModerModeratatee HHigighh Monitoring period for 2013–14 result is November 2011 to April 2014.
Very
Low
Low
M
oder
ate
Hig
h ^
Bathers Toilet Facilities
600
14 14 204 5 A0
2009-10 2010-11 2011-12 2012-13 2013-14
Ente
roco
cci c
fu/1
00m
L 500
400
300
200
100
D
C
B
Mic
robi
al A
sses
smen
tCa
tego
ry
95th
%ile
Response to rainfall Rainfall from Avalon rain gauge
10000
0 0.1–4.9 5–9.9 10–19.9 20+
Ente
roco
cci (
cfu/
100m
L)
1000
100
10
1
24-hour rainfall (mm)
Trends in enterococci data through time 100%
% E
nter
ococ
ci s
ampl
es 80%
60%
40%
20%Animals
Boats 0%Lagoons
Stormwater OnSite Systems 94
-95
95-9
6
96-9
7
97-9
8
98-9
9
99-0
0
00-0
1
01-0
2
02-0
3
03-0
4
04-0
5
05-0
6
06-0
7
07-0
8
08-0
9
09-1
0
10-1
1
11-1
2
12-1
3
13-1
4
<=40 cfu/100mL 41-200 cfu/100mL 201-500 cfu/100mL >500 cfu/100mL
38

Great Mackerel Beach Beach Suitability Grade: .G
Great Mackerel Beach is a 500 metre long sandy beach on the northwestern side of Pittwater. The northern end is backed by Ku-ring-gai Chase National Park and the southern end by a residential area. Samples are collected in the centre of the beach near Mackerel Beach Wharf.
The Beach Suitability Grade of Good indicates that the water quality is safe for swimming most of the time but can be susceptible to pollution after heavy rain, with several minor sources of faecal contamination.
The response to rainfall graph indicates that enterococci levels increased slightly with increasing rainfall, occasionally exceeding the safe swimming limit in response to 20 mm of rainfall or more.
The site has been monitored since 1999. Water quality has generally been of a very high standard, with variation in results due to rainfall.
See ‘How to read this report’ for key to map
Sanitary Inspection: Low Microbial Assessment: B SSourourcce:e: VVereryy LoLoww LowLow ModerModeratatee HHigighh Monitoring period for 2013–14 result is November 2011 to April 2014.
Very
Low
Low
M
oder
ate
Hig
h ^
Hawkesbury River
Bathers OnSite Systems
Lagoons
600
7 2 24 55 45
D500
400 C
300
200
Ente
roco
cci c
fu/1
00m
L
Mic
robi
al A
sses
smen
tCa
tego
ry
95th
%ile
100 B
A0 2009-10 2010-11 2011-12 2012-13 2013-14
Response to rainfall Rainfall from Avalon rain gauge
10000
Ente
roco
cci (
cfu/
100m
L)
0 0.1–4.9 5–9.9 10–19.9 20+
1000
100
10
1
24-hour rainfall (mm)
Trends in enterococci data through time 100%
% E
nter
ococ
ci s
ampl
es 80%
60%
40%
20%
0% Animals
Boats
94-9
5
95-9
6
96-9
7
97-9
8
98-9
9
99-0
0
00-0
1
01-0
2
02-0
3
03-0
4
04-0
5
05-0
6
06-0
7
07-0
8
08-0
9
09-1
0
10-1
1
11-1
2
12-1
3
13-1
4
<=40 cfu/100mL 41-200 cfu/100mL 201-500 cfu/100mL >500 cfu/100mL
39

– – – –
Central Sydney (Bondi to Little Bay & Sydney Harbour) State of the Beaches 2013–2014
Overall results Percentage of sites graded as Good or Very Good:
73% 2010 11
70% 2011 12
82% 2012 13
Best beaches Clovelly Beach, Watsons Bay and Nielsen Park.
These sites had excellent water quality and were suitable for swimming almost all of the time.
83% 2013 14
Twenty nine of the 35 swimming sites were graded as Very Good or Good in 2013–2014, an improvement from previous years.
Ocean beaches
Good / Very Good Fair Poor / Very Poor
All ten ocean beaches were graded as Very Good or Good.
Clovelly Beach was graded as Very Good. The water quality at this site was of a very high standard and suitable for swimming almost all of the time.
Bondi, Tamarama, Bronte, Gordons Bay, Coogee, Maroubra, South Maroubra, Malabar and Little Bay were graded as Good. These sites were suitable for swimming during dry weather conditions, but elevated enterococci levels were often recorded following rainfall. Swimming should be avoided at these sites during and for up to one day following rainfall or when there are signs of stormwater pollution such as discoloured water or floating debris.
Estuarine beaches
35 sites
1370 samples
year round*
every 6 days*
Good / Very Good Fair Poor / Very Poor
Nielsen Park and Watsons Bay in Sydney Harbour were graded as Very Good. These sites had excellent water quality and were suitable for swimming almost all of the time. Elevated enterococci levels were occasionally recorded following heavy rainfall and swimming should be avoided at these times.
* Beachwatch samples the ocean beaches every sixth day throughout the year, and the estuarine beaches every sixth day between October and April, and monthly from May to September.
See How to Read this Report for explanations of graphs and Beach
Suitability Grades.
A further 17 of the 25 swimming locations in Sydney Harbour were graded as Good: Parsley Bay, Murray Rose Pool, Dawn Fraser Pool, Chiswick Baths, Cabarita Beach, Woolwich Baths, Woodford Bay, Greenwich Baths, Hayes Street Beach, Clifton
40

Gardens, Balmoral Baths, Edwards Beach, Chinamans Beach, Forty Baskets Pool, Fairlight Beach, Manly Cove and Little Manly Cove. Woolwich Baths was upgraded to Good from its 2012–2013 rating of Fair. These sites had mostly good water quality, although elevated enterococci levels were recorded following rainfall.
Two swimming locations were graded as Fair: Gurney Crescent Baths and Clontarf Pool. Gurney Crescent Baths was upgraded to Fair from its 2012–2013 rating of Poor. These sites had generally good water quality, but had more significant potential sources of microbial contamination.
Four swimming locations were graded as Poor: Rose Bay Beach in Port Jackson, Tambourine Bay in the lower Lane Cove River, and Northbridge Baths and Davidson Reserve in the upper reaches of Middle Harbour. Rose Bay Beach was downgraded to Poor from its 2012–2013 rating of Good. Although microbial water quality at these sites is generally suitable for swimming during dry weather conditions, elevated enterococci levels were frequently measured following light rainfall. These sites also have relatively low levels of tidal flushing.
As a precaution, swimming should be avoided at Sydney Harbour swimming sites during and for up to three days following rainfall or if there are signs of stormwater pollution such as discoloured water or floating debris.
Management Ocean beaches Sydney Water investigated wet weather sewage overflows in the Coogee Beach catchment and found that silt was accumulating within the Coogee Diversion Sewer (CDS) due to the very low slope of this sewer. As a result, Sydney Water is undertaking more frequent de-silting of the CDS and the grit pits at the northern end of the beach. This work will increase the capacity of the CDS and reduce the occurrence of overflows.
Sydney Water has inspected, cleaned and repaired sewer mains that have a high likelihood of discharging sewage to waterways if they become blocked. When significant tree root intrusion to the public sewer from the private sewer was identified, property owners were requested to remedy the problem.
Gross pollutant traps have been installed in the Bondi Beach, Tamarama Beach, Bronte Beach, Clovelly Beach, Coogee Beach, Maroubra Beach and Malabar Beach catchments. Sydney Water operates two gross pollutant traps at Bondi Beach that prevent about 180 tonnes of sediment and floating debris from entering the ocean each year.
The Bronte Stormwater Harvesting Scheme collects and treats stormwater which is then re-used for toilets, park irrigation, ocean pool cleaning, and general cleaning of public places. The scheme saves over 15 million litres of water each year and reduces the volume of stormwater discharged to Bronte Beach.
The Bondi Stormwater Harvesting Scheme commenced in 2012 and supplies approximately 50 million litres of treated stormwater for park irrigation and toilets in Bondi Pavilion and South Bondi. An underground filtration system has also been installed to treat excess stormwater runoff from Campbell Parade, resulting in cleaner water at Bondi Beach.
Both Bronte and Bondi stormwater schemes were built by Waverley Council with support from the NSW Government’s Climate Change Fund.
Randwick City Council operates and maintains two stormwater harvesting treatment systems at Clovelly Beach harvesting approximately 15 mega litres of stormwater per year. This system treats stormwater by removing suspended solids, bacteria and other organic and inorganic materials before being used for irrigation in surrounding landscaped and garden areas.
A jointly funded project was completed in January 2013 installing a new stormwater harvesting system (including UV filtration) on the Coogee foreshore, treating up to 80 mega litres of stormwater for re-use along the foreshore. This water would otherwise have been discharged directly into Coogee Beach untreated.
Randwick City Council installed and operates a stormwater harvesting system at Pioneers Park treating and reusing approximately 25 mega litres of stormwater, irrigating Pioneers Park, Cromwell Park and Malabar beachfront. This would otherwise have been discharged directly and untreated into Malabar headland.
Randwick City Council maintains a total of 17 gross pollutant traps along the coastline beside coastal beaches, which are all cleaned as necessary. There is also systemic cleaning of all drainage pits and regular street sweeping to reduce stormwater pollution into the local beaches.
The Commonwealth Government has recently completed installing a leachate capture system to the northern end of Malabar
41

Headland collecting and discharging approximately 800 megalitres of leachate into the Sydney Water infrastructure.
North Sydney Harbour The Northside Storage Tunnel was constructed by Sydney Water in 2000 and captures wet weather overflows from the four major overflow sites at Lane Cove, Quakers Hat Bay, Tunks Park and Scotts Creek. The tunnel has reduced the frequency of sewage overflows to less than 20 in an average 10-year period. Since the commissioning of the tunnel, about 73.1 billion litres of diluted sewage has been prevented from entering Sydney Harbour1.
Sydney Water has constructed a new pumping station and transfer tunnel at Hayes Street Beach to reduce the incidence of wet weather sewage overflows in the catchment.
Sydney Water has inspected, cleaned and repaired sewer mains on the northern side of Port Jackson that have a high likelihood of discharging sewage to waterways if they become blocked. Where significant tree root intrusion to the public sewer from the private sewer was identified, property owners were requested to remedy the problem.
Sydney Water undertakes dry weather monitoring of main stormwater drains to identify sewer leaks. Leaks from public sewers are repaired by Sydney Water and leaks from private sewers are referred to local councils. Sydney Water worked with Manly Council to do a more intense program to reduce leakage. Under this program, all stormwater drains discharging to beaches on North Harbour were investigated and the detected leaks fixed.
Mosman Council’s Botanic Road Stormwater Re-use Scheme is an underground storage system which captures stormwater and provides UV disinfection, after which it is pumped to Balmoral oval for irrigation.
Mosman Council has installed educational signage at beaches in the area advising not to swim up to three days after heavy rain due to the potential for pollution from stormwater. Stormwater quality improvement devices are installed at Balmoral Beach, Clifton Gardens, Edwards Beach and Chinamans Beach to capture sediment and floating debris.
Mosman Council commenced the ‘There’s no such thing as the Dog Poo Fairy’ education campaign. This program raises awareness of dog owners responsibilities in picking up after their dog, to keep beaches and waterways clean.
Willoughby City Council has installed signage at Northbridge Baths advising not to swim during rain and up to 48 hours after the rain has ceased due to the potential for pollution from stormwater. Ongoing education includes stormwater drain stencilling in the Sailors Bay catchment. Council has a Stormwater Asset Management Plan to improve and manage stormwater infrastructure including the maintenance of gross pollutant traps.
North Sydney Council’s Stormwater Re-use Project continues to harvest, treat and re-use stormwater for the irrigation of sports fields and recreational parks, including St Leonards Park, Cammeray Park, Forsyth Park, Primrose Park and Tunks Park. This saves millions of litres of potable water and reduces the amount of stormwater entering the waterways.
South Sydney Harbour City of Canada Bay maintains over 25 stormwater quality improvement devices which prevent over 80 tonnes of pollutants (sediments, leaves and litter) from reaching the Parramatta River each year. Stormwater harvesting, rainwater re-use and rain gardens have been constructed in the Drummoyne Oval precinct to reduce stormwater and pollutant loads reaching Five Dock Bay. A stormwater recycling system is being constructed in Cintra Park to harvest and re-use stormwater for irrigation. This will reduce the City of Canada Bay’s reliance on potable water and improve the quality of runoff into Canada Bay itself. Full operation is planned for late 2014.
Woollahra Council’s Environmental and Infrastructure Levy funds a number of projects aimed at restoring ageing infrastructure and protecting the local environment. Woollahra Council has an increasing focus on Water Sensitive Urban Design (WSUD) with a view to improved stormwater management. Projects include upgrading infrastructure; installing and maintaining gross pollutant traps and pit baskets; installing flow diversion structures to reduce sediment loads; installing litter nets; bio-retention systems to remove contaminants from stormwater; porous paving infiltration systems; and harvesting stormwater for irrigation. Specific projects include bio-retention systems at Bellevue Hill shops, Hopetoun Avenue, Lyne Park and O’Sullivan Road and stormwater harvesting systems at Rose Bay and Cooper Park. An additional stormwater harvesting system is planned for Parsley Bay. Woollahra Council is also continuing efforts to restore the bushland within Woollahra to further improve water quality in waterways draining to the harbour. 1 Northside storage tunnel – Tunnel status. Sydney Water, Parramatta, NSW. [Available at sydneywater.com.au/SW/water-the-environment/how-wemanage-sydney-s-water/wastewater-network/northside-storage-tunnel/tunnel-status/index.htm. Accessed on 10/06/14]
42

Sydney Water operates a gross pollutant trap at Rose Bay Beach that prevents about 75 tonnes of sediment and floating debris from entering Sydney Harbour each year. Sydney Water also operates a gross pollutant trap at Murray Rose Pool that prevents about five tonnes of sediment and floating debris per year from entering the harbour.
Sydney Water operates six more gross pollutant traps to improve stormwater flowing into Sydney Harbour, including two at Iron Cove, two at Rozelle Bay and two at Rushcutters Bay.
Sydney Water has inspected, cleaned and repaired sewer mains on about half of the southern side of Port Jackson that have a high likelihood of discharging sewage to waterways if they become blocked. Where significant tree root intrusion to the public sewer from the private sewer was identified, property owners were asked to remedy the problem.
43

Sampling sites and Beach Suitability Grades at Sydney’s Ocean Beaches
44
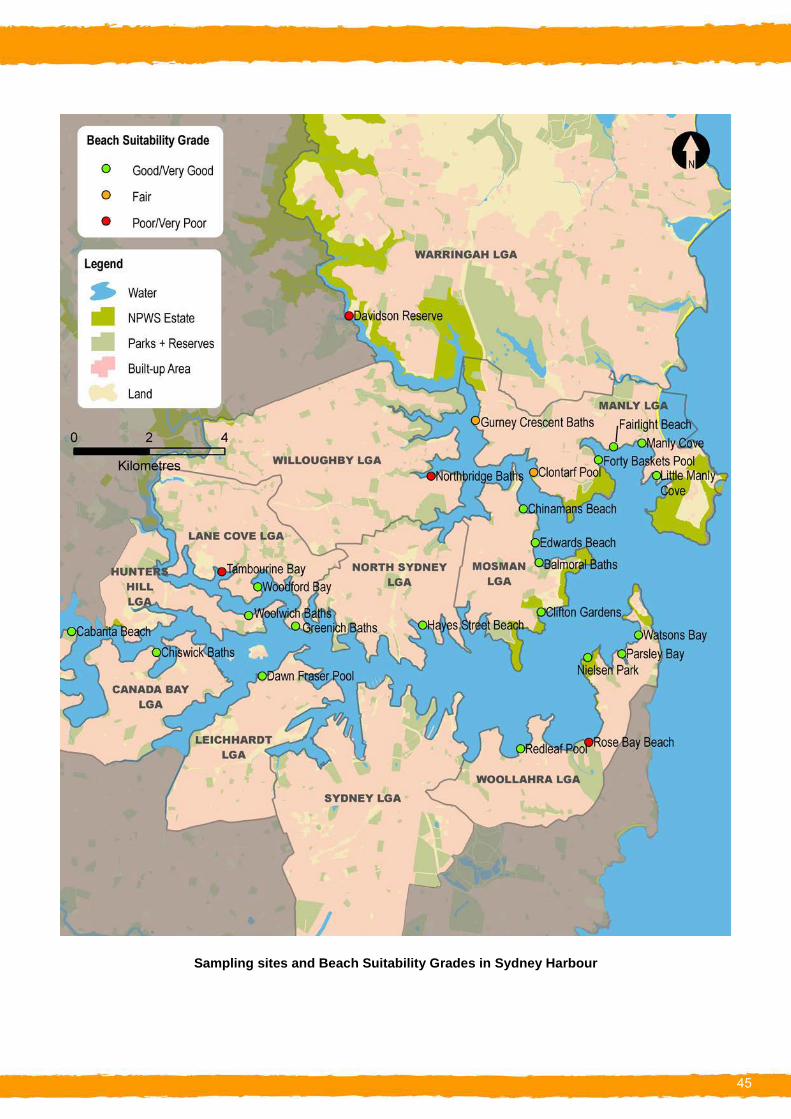
Sampling sites and Beach Suitability Grades in Sydney Harbour
45

.
Bondi Beach
See ‘How to read this report’ for key to map
Sanitary Inspection: Moderate SSourourcce:e: VVereryy LoLoww LowLow ModerModeratatee HHigighh
Beach Suitability Grade: G
Bondi Beach is 800 metres long and backed by a promenade, car park and parklands. Beach conditions are safest at the northern end and lifeguards patrol the beach year round.
The Beach Suitability Grade of Good indicates that microbial water quality is suitable for swimming most of the time, but the water may be susceptible to pollution from several potential sources of faecal contamination including stormwater.
The response to rainfall graph indicates that enterococci levels increased with increasing rainfall, regularly exceeding the safe swimming limit in response to 5 mm of rainfall or more.
The site has been monitored since 1989.
Microbial Assessment: B Monitoring period for 2013–14 result is June 2012 to April 2014.
^ 600
Very
Low
Low
M
oder
ate
Hig
h
80 80 75 75 70
A
B
C
D
Mic
robi
al A
sses
smen
tCa
tego
ry
95th
%ile
En
tero
cocc
i cfu
/100
mL 500
400
300
200
100
0 2009-10 2010-11 2011-12 2012-13 2013-14
Response to rainfall Rainfall from Waverly rain gauge
10000
0 0.1–4.9 5–9.9 10–19.9 20+
Ente
roco
cci (
cfu/
100m
L)
1000
100
10
1
24-hour rainfall (mm)
Trends in enterococci data through time 100%
% E
nter
ococ
ci s
ampl
es 80%
60%
40%
20%
0%
Animals
Sewer Chokes Sewage Overflows
STP Bypass
Bathers
Toilet Facilities
Stormwater
94-9
5
95-9
6
96-9
7
97-9
8
98-9
9
99-0
0
00-0
1
01-0
2
02-0
3
03-0
4
04-0
5
05-0
6
06-0
7
07-0
8
08-0
9
09-1
0
10-1
1
11-1
2
12-1
3
13-1
4
<=40 cfu/100mL 41-200 cfu/100mL 201-500 cfu/100mL >500 cfu/100mL
46

.
Tamarama Beach Beach Suitability Grade: G
See ‘How to read this report’ for key to map
Sanitary Inspection: Moderate SSourourcce:e: VVereryy LoLoww LowLow ModerModeratatee HHigighh
Tamarama Beach is approximately 80 metres long and is closed to board riders during patrol hours. Swimming can be very hazardous because of the rips. Lifeguards patrol the beach from late September to April.
The Beach Suitability Grade of Good indicates that microbial water quality is suitable for swimming most of the time, but the water may be susceptible to pollution from several potential sources of faecal contamination, including stormwater.
The response to rainfall graph indicates that enterococci levels increased with increasing rainfall, often exceeding the safe swimming limit in response to 5 mm of rainfall or more.
The site has been monitored since 1989.
Microbial Assessment: B Monitoring period for 2013–14 result is June 2012 to April 2014.
Very
Low
Low
M
oder
ate
Hig
h ^ 600
95 80 105
80 50
A
B
C
D
Mic
robi
al A
sses
smen
tCa
tego
ry
95th
%ile
En
tero
cocc
i cfu
/100
mL 500
400
300
200
100
0 2009-10 2010-11 2011-12 2012-13 2013-14
Response to rainfall Rainfall from Waverly rain gauge
10000
0 0.1–4.9 5–9.9 10–19.9 20+
Ente
roco
cci (
cfu/
100m
L)
1000
100
10
1
24-hour rainfall (mm)
Trends in enterococci data through time 100%
% E
nter
ococ
ci s
ampl
es 80%
60%
40%
20%
0%
Animals
Bathers Toilet Facilities
Stormwater
94-9
5
95-9
6
96-9
7
97-9
8
98-9
9
99-0
0
00-0
1
01-0
2
02-0
3
03-0
4
04-0
5
05-0
6
06-0
7
07-0
8
08-0
9
09-1
0
10-1
1
11-1
2
12-1
3
13-1
4
<=40 cfu/100mL 41-200 cfu/100mL 201-500 cfu/100mL >500 cfu/100mL
47

.
Bronte Beach
See ‘How to read this report’ for key to map
Sanitary Inspection: Moderate SSourourcce:e: VVereryy LoLoww LowLow ModerModeratatee HHigighh
Beach Suitability Grade: G
Bronte Beach is 250 metres long and backed by a large park and picnic area. Lifeguards patrol the beach between late September and mid-May.
The Beach Suitability Grade of Good indicates that microbial water quality is suitable for swimming most of the time, but the water may be susceptible to pollution from several potential sources of faecal contamination including stormwater.
The response to rainfall graph indicates that enterococci levels generally increased with increasing rainfall, often exceeding the safe swimming limit after 5 mm of rainfall or more.
The site has been monitored since 1989.
Microbial Assessment: B Monitoring period for 2013–14 result is June 2012 to April 2014.
Very
Low
Low
M
oder
ate
Hig
h ^
80 50
105 70 65
0
100
200
300
400
500
600
95th
%ile
En
tero
cocc
i cfu
/100
mL
A
B
C
D
Mic
robi
al A
sses
smen
tCa
tego
ry
2009-10 2010-11 2011-12 2012-13 2013-14
Response to rainfall Rainfall from Waverly rain gauge
10000
Ente
roco
cci (
cfu/
100m
L)
1000
100
10
1
24-hour rainfall (mm) 0 0.1–4.9 5–9.9 10–19.9 20+
Trends in enterococci data through time
0%
20%
40%
60%
80%
100%
% E
nter
ococ
ci s
ampl
es
Stormwater
Sewer Chokes
Bathers
Toilet Facilities
Sewage Overflows
94-9
5
95-9
6
96-9
7
97-9
8
98-9
9
99-0
0
00-0
1
01-0
2
02-0
3
03-0
4
04-0
5
05-0
6
06-0
7
07-0
8
08-0
9
09-1
0
10-1
1
11-1
2
12-1
3
13-1
4
<=40 cfu/100mL 41-200 cfu/100mL 201-500 cfu/100mL >500 cfu/100mL
48

.
Clovelly Beach
See ‘How to read this report’ for key to map
Sanitary Inspection: Low SSourourcce:e: VVereryy LoLoww LowLow ModerModeratatee HHigighh
Beach Suitability Grade: VG
Clovelly Beach is at the end of a long and narrow bay and is protected from ocean swells. Wheelchair access to the water is provided. It is one of the safest beaches in Sydney and is patrolled from late September to April.
The Beach Suitability Grade of Very Good indicates that microbial water quality is suitable for swimming most of the time, with few potential sources of faecal contamination.
The response to rainfall graph indicates that enterococci levels increased slightly with increasing rainfall but rarely exceeded the safe swimming limit in any rainfall category.
The site has been monitored since 1989.
Microbial Assessment: A Monitoring period for 2013–14 result is June 2012 to April 2014.
Very
Low
Low
M
oder
ate
Hig
h ^ 600
70 70 40 55 34
A
B
C
D
Mic
robi
al A
sses
smen
tCa
tego
ry
95th
%ile
En
tero
cocc
i cfu
/100
mL 500
400
300
200
100
0 2009-10 2010-11 2011-12 2012-13 2013-14
Response to rainfall Rainfall from Waverly rain gauge
10000
0 0.1–4.9 5–9.9 10–19.9 20+
Ente
roco
cci (
cfu/
100m
L)
1000
100
10
1
24-hour rainfall (mm)
Trends in enterococci data through time 100%
% E
nter
ococ
ci s
ampl
es 80%
60%
40%
20%
0%
Animals Stormwater
Bathers
Toilet Facilities
Sewage Overflows
94-9
5
95-9
6
96-9
7
97-9
8
98-9
9
99-0
0
00-0
1
01-0
2
02-0
3
03-0
4
04-0
5
05-0
6
06-0
7
07-0
8
08-0
9
09-1
0
10-1
1
11-1
2
12-1
3
13-1
4
<=40 cfu/100mL 41-200 cfu/100mL 201-500 cfu/100mL >500 cfu/100mL
49
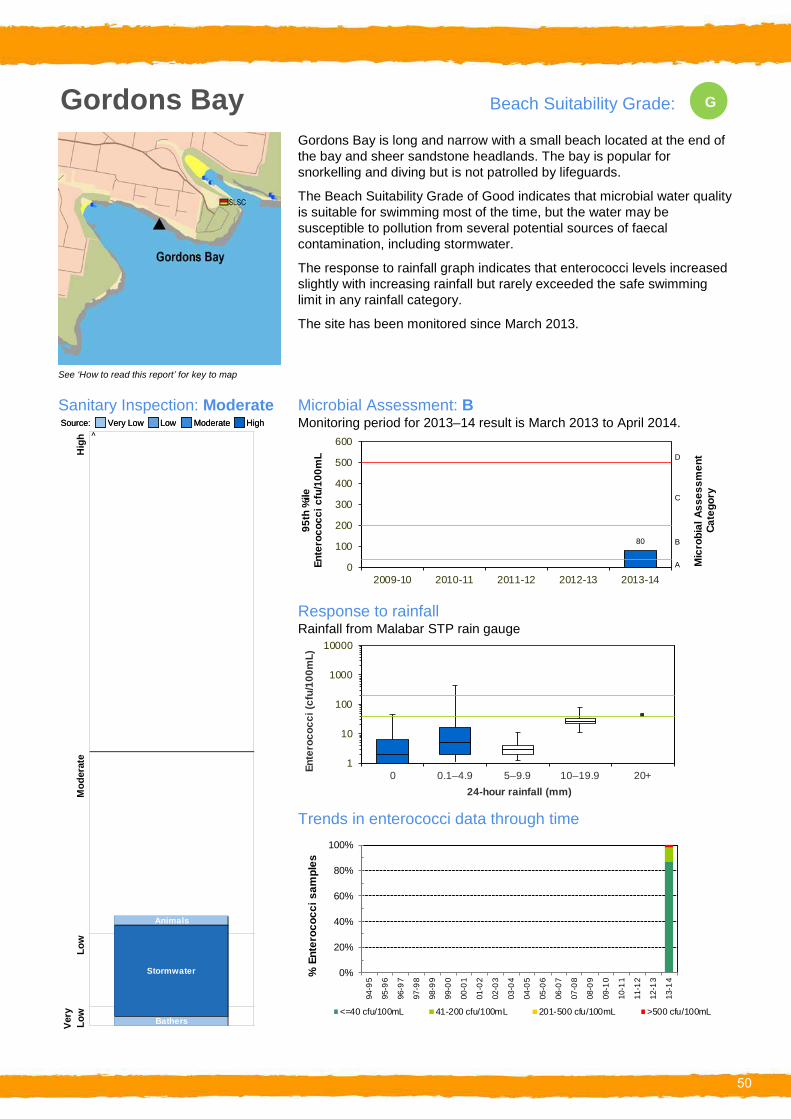
.
Gordons Bay
See ‘How to read this report’ for key to map
Sanitary Inspection: Moderate SSourourcce:e: VVereryy LoLoww LowLow ModerModeratatee HHigighh
Beach Suitability Grade: G
Gordons Bay is long and narrow with a small beach located at the end of the bay and sheer sandstone headlands. The bay is popular for snorkelling and diving but is not patrolled by lifeguards.
The Beach Suitability Grade of Good indicates that microbial water quality is suitable for swimming most of the time, but the water may be susceptible to pollution from several potential sources of faecal contamination, including stormwater.
The response to rainfall graph indicates that enterococci levels increased slightly with increasing rainfall but rarely exceeded the safe swimming limit in any rainfall category.
The site has been monitored since March 2013.
Microbial Assessment: B Monitoring period for 2013–14 result is March 2013 to April 2014.
^
Animals
Bathers
Low
Ve
ryLo
w
Hig
hM
oder
ate
Stormwater
95th
%ile
En
tero
cocc
i cfu
/100
mL
600
80
D500
400 C
300
200
Mic
robi
al A
sses
smen
tCa
tego
ry
100 B
A0 2009-10 2010-11 2011-12 2012-13 2013-14
Response to rainfall Rainfall from Malabar STP rain gauge
10000
Ente
roco
cci (
cfu/
100m
L)
0 0.1–4.9 5–9.9 10–19.9 20+
1000
100
10
1
24-hour rainfall (mm)
Trends in enterococci data through time 100%
% E
nter
ococ
ci s
ampl
es 80%
60%
40%
20%
0%
94-9
5
95-9
6
96-9
7
97-9
8
98-9
9
99-0
0
00-0
1
01-0
2
02-0
3
03-0
4
04-0
5
05-0
6
06-0
7
07-0
8
08-0
9
09-1
0
10-1
1
11-1
2
12-1
3
13-1
4
<=40 cfu/100mL 41-200 cfu/100mL 201-500 cfu/100mL >500 cfu/100mL
50

.
Coogee Beach
See ‘How to read this report’ for key to map
Sanitary Inspection: Moderate SSourourcce:e: VVereryy LoLoww LowLow ModerModeratatee HHigighh
Beach Suitability Grade: G
Coogee Beach is 400 metres long and is backed by a promenade and parklands. The beach has a reputation for safe swimming and lifeguards patrol the beach all year round.
The Beach Suitability Grade of Good indicates that microbial water quality is suitable for swimming most of the time, but the water may be susceptible to pollution from several potential sources of faecal contamination, including stormwater.
The response to rainfall graph indicates that enterococci levels increased with increasing rainfall, regularly exceeding the safe swimming limit after 5 mm of rainfall or more.
The site has been monitored since 1989.
Microbial Assessment: B Monitoring period for 2013–14 result is June 2012 to April 2014.
^ 600
Very
Low
Low
M
oder
ate
Hig
h
130 80
145 170 150
A
B
C
D
Mic
robi
al A
sses
smen
tCa
tego
ry
95th
%ile
En
tero
cocc
i cfu
/100
mL 500
400
300
200
100
0 2009-10 2010-11 2011-12 2012-13 2013-14
Response to rainfall Rainfall from Malabar STP rain gauge
10000
0 0.1–4.9 5–9.9 10–19.9 20+
Ente
roco
cci (
cfu/
100m
L)
1000
100
10
1
24-hour rainfall (mm)
Trends in enterococci data through time 100%
% E
nter
ococ
ci s
ampl
es 80%
60%
40%
20%
Stormwater
Sewer Chokes
Bathers
Toilet Facilities
Sewage Overflows 0%
94-9
5
95-9
6
96-9
7
97-9
8
98-9
9
99-0
0
00-0
1
01-0
2
02-0
3
03-0
4
04-0
5
05-0
6
06-0
7
07-0
8
08-0
9
09-1
0
10-1
1
11-1
2
12-1
3
13-1
4
<=40 cfu/100mL 41-200 cfu/100mL 201-500 cfu/100mL >500 cfu/100mL
51

.
Maroubra Beach
See ‘How to read this report’ for key to map
Sanitary Inspection: Low SSourourcce:e: VVereryy LoLoww LowLow ModerModeratatee HHigighh
Beach Suitability Grade: G
Maroubra Beach is one kilometre long. Strong rips create hazardous conditions at the beach, particularly in the centre and north. Lifeguards patrol the beach all year round.
The Beach Suitability Grade of Good indicates that microbial water quality is suitable for swimming most of the time, but the water may be susceptible to pollution following rainfall.
The response to rainfall graph indicates that enterococci levels increased slightly with increasing rainfall, often exceeding the safe swimming limit in response to 5 mm of rainfall.
The site has been monitored since 1989.
Microbial Assessment: B Monitoring period for 2013–14 result is June 2012 to April 2014.
Very
Low
Low
M
oder
ate
Hig
h ^ 600
55 14 26 36 50
A
B
C
D
Mic
robi
al A
sses
smen
tCa
tego
ry
95th
%ile
En
tero
cocc
i cfu
/100
mL 500
400
300
200
100
0 2009-10 2010-11 2011-12 2012-13 2013-14
Response to rainfall Rainfall from Malabar STP rain gauge
10000
0 0.1–4.9 5–9.9 10–19.9 20+
Ente
roco
cci (
cfu/
100m
L)
1000
100
10
1
24-hour rainfall (mm)
Trends in enterococci data through time 100%
% E
nter
ococ
ci s
ampl
es 80%
60%
40%
20%
Stormwater 0%
94-9
5
95-9
6
96-9
7
97-9
8
98-9
9
99-0
0
00-0
1
01-0
2
02-0
3
03-0
4
04-0
5
05-0
6
06-0
7
07-0
8
08-0
9
09-1
0
10-1
1
11-1
2
12-1
3
13-1
4
<=40 cfu/100mL 41-200 cfu/100mL 201-500 cfu/100mL >500 cfu/100mL
Sewage Overflows
Bathers
Toilet Facilities
52

.
South Maroubra Beach Beach Suitability Grade: G
See ‘How to read this report’ for key to map
Sanitary Inspection: Moderate SSourourcce:e: VVereryy LoLoww LowLow ModerModeratatee HHigighh
Maroubra Beach is one kilometre long. Strong rips create hazardous conditions at the beach, particularly in the centre and north. Lifeguards patrol the beach all year round.
The Beach Suitability Grade of Good indicates that microbial water quality is suitable for swimming most of the time, but the water may be susceptible to pollution following rainfall.
The response to rainfall graph indicates that enterococci levels increased slightly with increasing rainfall. There is currently insufficient data available to adequately define trends.
The site has been monitored since December 2012.
Microbial Assessment: B Monitoring period for 2013–14 result is June 2012 to April 2014.
^
Sewage Overflows Toilet Facilities
Bathers
Low
Ve
ryLo
w
Hig
hM
oder
ate
Stormwater
95th
%ile
En
tero
cocc
i cfu
/100
mL
600
150
70
D500
400 C
300
Mic
robi
al A
sses
smen
tCa
tego
ry
200
100 B
A0 2009-10 2010-11 2011-12 2012-13 2013-14
Response to rainfall Rainfall from Malabar STP rain gauge
10000
Ente
roco
cci (
cfu/
100m
L)
1000
100
10
1
24-hour rainfall (mm) 0 0.1–4.9 5–9.9 10–19.9 20+
Trends in enterococci data through time 100%
% E
nter
ococ
ci s
ampl
es 80%
60%
40%
20%
0%
94-9
5
95-9
6
96-9
7
97-9
8
98-9
9
99-0
0
00-0
1
01-0
2
02-0
3
03-0
4
04-0
5
05-0
6
06-0
7
07-0
8
08-0
9
09-1
0
10-1
1
11-1
2
12-1
3
13-1
4
<=40 cfu/100mL 41-200 cfu/100mL 201-500 cfu/100mL >500 cfu/100mL
53

.
Malabar Beach
See ‘How to read this report’ for key to map
Sanitary Inspection: Moderate SSourourcce:e: VVereryy LoLoww LowLow ModerModeratatee HHigighh
Beach Suitability Grade: G
Malabar Beach is 150 metres long and situated at the end of a long, narrow bay. It is backed by a small park and picnic area. The beach is not patrolled.
The Beach Suitability Grade of Good indicates that microbial water quality is suitable for swimming most of the time, but the water may be susceptible to pollution, with several potential sources of contamination, including stormwater.
The response to rainfall graph indicates that enterococci levels increased with increasing rainfall, regularly exceeding the safe swimming limit after 5 mm of rainfall or more.
The site has been monitored since 1989, with significant improvements in water quality since 2012–2013 due to the diversion of the large stormwater drain at the northern end of the beach.
Microbial Assessment: B Monitoring period for 2013–14 result is June 2012 to April 2014.
^ 1000
Very
Low
Lo
w
Mod
erat
e H
igh
660 760
580
155 195
A
B
C
D
Mic
robi
al A
sses
smen
tCa
tego
ry
95th
%ile
En
tero
cocc
i cfu
/100
mL
800
600
400
200
0 2009-10 2010-11 2011-12 2012-13 2013-14
Response to rainfall Rainfall from Malabar STP rain gauge
10000
0 0.1–4.9 5–9.9 10–19.9 20+
Ente
roco
cci (
cfu/
100m
L)
1000
100
10
1
24-hour rainfall (mm)
Trends in enterococci data through time 100%
% E
nter
ococ
ci s
ampl
es 80%
60%
40%
20%
0%
Animals
STP Bypass Toilet Facilities
Bathers
Sewage Overflows
Stormwater
94-9
5
95-9
6
96-9
7
97-9
8
98-9
9
99-0
0
00-0
1
01-0
2
02-0
3
03-0
4
04-0
5
05-0
6
06-0
7
07-0
8
08-0
9
09-1
0
10-1
1
11-1
2
12-1
3
13-1
4
<=40 cfu/100mL 41-200 cfu/100mL 201-500 cfu/100mL >500 cfu/100mL
54

.
Little Bay Beach
See ‘How to read this report’ for key to map
Sanitary Inspection: Moderate SSourourcce:e: VVereryy LoLoww LowLow ModerModeratatee HHigighh
Beach Suitability Grade: G
Little Bay Beach is a small, crescent-shaped beach bounded by rocky headlands to the north and south. Beach conditions are generally calm and the beach is not patrolled. The bay is backed by a golf course and a new residential development.
The Beach Suitability Grade of Good indicates that water quality is safe for swimming most of the time, but the water can be susceptible to pollution, with several potential sources of faecal contamination.
The response to rainfall graph indicates that enterococci levels increased with increasing rainfall, regularly exceeding the safe swimming limit after 5 mm of rainfall or more.
The site was monitored between 1989 and 1995. Sampling recommenced in 2006 in response to the increased popularity of the beach as a result of surrounding urban development.
Microbial Assessment: B Monitoring period for 2013–14 result is June 2012 to April 2014.
^
Animals
STP Bypass
Bathers
Low
Ve
ryLo
w
Toilet Facilities
Stormwater
Hig
hM
oder
ate
600 D500
400 C
300
135 110 125
195 155
2009-10 2010-11 2011-12 2012-13 2013-14
95th
%ile
En
tero
cocc
i cfu
/100
mL
Mic
robi
al A
sses
smen
tCa
tego
ry
200 B100
A0
Response to rainfall Rainfall from Malabar STP rain gauge
10000
Ente
roco
cci (
cfu/
100m
L)
0 0.1–4.9 5–9.9 10–19.9 20+
1000
100
10
1
24-hour rainfall (mm)
Trends in enterococci data through time 100%
% E
nter
ococ
ci s
ampl
es 80%
60%
40%
20%
0%
94-9
5
95-9
6
96-9
7
97-9
8
98-9
9
99-0
0
00-0
1
01-0
2
02-0
3
03-0
4
04-0
5
05-0
6
06-0
7
07-0
8
08-0
9
09-1
0
10-1
1
11-1
2
12-1
3
13-1
4
<=40 cfu/100mL 41-200 cfu/100mL 201-500 cfu/100mL >500 cfu/100mL
55

Watsons Bay Beach Suitability Grade: .VG
The swimming site is a 20 by 40 metre enclosed tidal swimming area next to the Vaucluse Yacht Club. The baths are backed by a narrow sandy beach and parklands with picnic facilities.
The Beach Suitability Grade of Very Good indicates that microbial water quality is suitable for swimming most of the time, with few potential sources of significant faecal contamination.
The response to rainfall graph indicates that enterococci levels increased with increasing rainfall, regularly exceeding the safe swimming limit in response to 20 mm of rainfall or more.
The site has been monitored since 1994. Microbial water quality has generally improved since 2000–2001 owing to licensing of discharges from the sewerage system and improved management of stormwater.
See ‘How to read this report’ for key to map
Sanitary Inspection: Low Microbial Assessment: A SSourourcce:e: VVereryy LoLoww LowLow ModerModeratatee HHigighh Monitoring period for 2013–14 result is December 2011 to April 2014.
Very
Low
Lo
w
Mod
erat
eH
igh ^ 600
26 60
26 22 36
A
B
C
D
Mic
robi
al A
sses
smen
tCa
tego
ry
95th
%ile
En
tero
cocc
i cfu
/100
mL 500
400
300
200
100
0 2009-10 2010-11 2011-12 2012-13 2013-14
Response to rainfall Rainfall from Mosman rain gauge
10000
0 0.1–4.9 5–9.9 10–19.9 20+
Ente
roco
cci (
cfu/
100m
L)
1000
100
10
1
24-hour rainfall (mm)
Trends in enterococci data through time 100%
% E
nter
ococ
ci s
ampl
es 80%
60%
40%
20%Boats
Port Jackson 0%
Stormwater Sewage Overflows
Toilet Facilities Bathers
94-9
5
95-9
6
96-9
7
97-9
8
98-9
9
99-0
0
00-0
1
01-0
2
02-0
3
03-0
4
04-0
5
05-0
6
06-0
7
07-0
8
08-0
9
09-1
0
10-1
1
11-1
2
12-1
3
13-1
4
<=40 cfu/100mL 41-200 cfu/100mL 201-500 cfu/100mL >500 cfu/100mL
56

.
Boats Port Jackson
Toilet Facilities
Sewer Chokes
Stormwater
Very
Low
Low
M
oder
ate
Hig
h ^
Bathers
600
95th
%ile
80 8560
90 105
D500
400 C
300
200
Ente
roco
cci c
fu/1
00m
L
B
Mic
robi
al A
sses
smen
tCa
tego
ry
A0 2009-10 2010-11 2011-12 2012-13 2013-14
100
Response to rainfall Rainfall from Mosman rain gauge
10000
Ente
roco
cci (
cfu/
100m
L)
1000
100
10
1
24-hour rainfall (mm) 0 0.1–4.9 5–9.9 10–19.9 20+
Trends in enterococci data through time 100%
% E
nter
ococ
ci s
ampl
es 80%
60%
40%
20%
0%
Parsley Bay
See ‘How to read this report’ for key to map
Sanitary Inspection: Moderate SSourourcce:e: VVereryy LoLoww LowLow ModerModeratatee HHigighh
Beach Suitability Grade: G
The southern end of Parsley Bay is netted from September to May to provide a large and safe swimming area. The sandy beach is backed by Parsley Bay Reserve, which contains picnic facilities and a playground.
The Beach Suitability Grade of Good indicates that microbial water quality is suitable for swimming most of the time but the water may be susceptible to pollution from several potential sources of faecal contamination, including stormwater.
The response to rainfall graph indicates that enterococci levels increased with increasing rainfall, regularly exceeding the safe swimming limit in response to 20 mm of rainfall or more.
The site has been monitored since 1994. Microbial water quality has generally improved since 2000–2001 owing to licensing of discharges from the sewerage system and improved management of stormwater.
Microbial Assessment: B Monitoring period for 2013–14 result is December 2011 to April 2014.
94-9
5
95-9
6
96-9
7
97-9
8
98-9
9
99-0
0
00-0
1
01-0
2
02-0
3
03-0
4
04-0
5
05-0
6
06-0
7
07-0
8
08-0
9
09-1
0
10-1
1
11-1
2
12-1
3
13-1
4
<=40 cfu/100mL 41-200 cfu/100mL 201-500 cfu/100mL >500 cfu/100mL
57

Nielsen Park Beach Suitability Grade: V .G
The Nielsen Park swimming area is approximately 150 metres long and enclosed by a shark net between October and April. The sandy beach and surrounding parklands are part of Sydney Harbour National Park. There are toilet and shower facilities, a café and a restaurant.
The Beach Suitability Grade of Very Good indicates that microbial water quality is considered suitable for swimming almost all of the time, with few significant sources of faecal contamination.
The response to rainfall graph indicates that enterococci levels increased slightly with increasing rainfall, often exceeding the safe swimming limit in response to 20 mm of rainfall or more.
The site has been monitored since 1994. Microbial water quality has generally improved since 2000–2001 owing to licensing of discharges from the sewerage system and improved management of stormwater.
See ‘How to read this report’ for key to map
Sanitary Inspection: Low Microbial Assessment: A SSourourcce:e: VVereryy LoLoww LowLow ModerModeratatee HHigighh Monitoring period for 2013–14 result is December 2011 to April 2014.
Very
Low
Low
M
oder
ate
Hig
h ^
Port Jackson
Sewage Overflows Stormwater
600
16 18 36 28 32
D500
400 C
300
200 B
Ente
roco
cci c
fu/1
00m
L
Mic
robi
al A
sses
smen
tCa
tego
ry
95th
%ile
100 A0
2009-10 2010-11 2011-12 2012-13 2013-14
Response to rainfall Rainfall from Mosman rain gauge
10000
Ente
roco
cci (
cfu/
100m
L)
0 0.1–4.9 5–9.9 10–19.9 20+
1000
100
10
1
24-hour rainfall (mm)
Trends in enterococci data through time 100%
% E
nter
ococ
ci s
ampl
es 80%
60%
40%
20%
0%
Bathers
Toilet Facilities 94-9
5
95-9
6
96-9
7
97-9
8
98-9
9
99-0
0
00-0
1
01-0
2
02-0
3
03-0
4
04-0
5
05-0
6
06-0
7
07-0
8
08-0
9
09-1
0
10-1
1
11-1
2
12-1
3
13-1
4
<=40 cfu/100mL 41-200 cfu/100mL 201-500 cfu/100mL >500 cfu/100mL
58
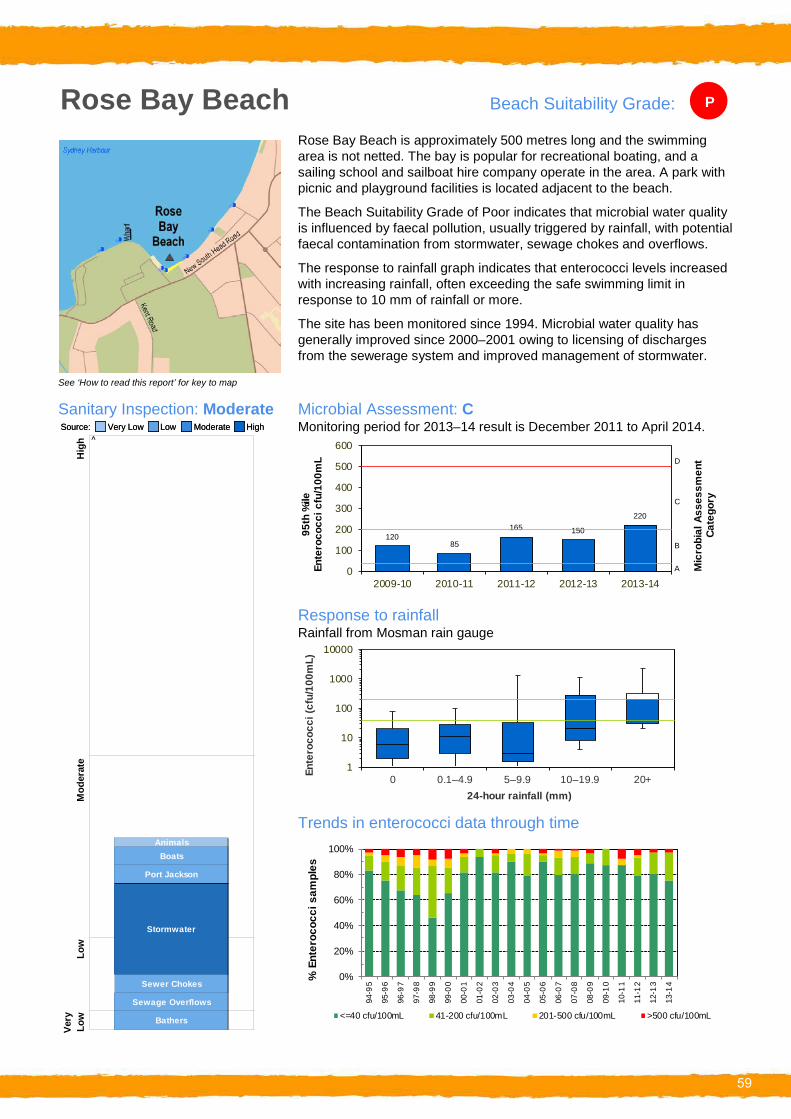
Rose Bay Beach Beach Suitability Grade: .P
Rose Bay Beach is approximately 500 metres long and the swimming area is not netted. The bay is popular for recreational boating, and a sailing school and sailboat hire company operate in the area. A park with picnic and playground facilities is located adjacent to the beach.
The Beach Suitability Grade of Poor indicates that microbial water quality is influenced by faecal pollution, usually triggered by rainfall, with potential faecal contamination from stormwater, sewage chokes and overflows.
The response to rainfall graph indicates that enterococci levels increased with increasing rainfall, often exceeding the safe swimming limit in response to 10 mm of rainfall or more.
The site has been monitored since 1994. Microbial water quality has generally improved since 2000–2001 owing to licensing of discharges from the sewerage system and improved management of stormwater.
See ‘How to read this report’ for key to map
Sanitary Inspection: Moderate Microbial Assessment: C SSourourcce:e: VVereryy LoLoww LowLow ModerModeratatee HHigighh Monitoring period for 2013–14 result is December 2011 to April 2014.
Very
Low
Low
M
oder
ate
Hig
h ^ 600
120 85
165 150
220
D500
400 C
300
Ente
roco
cci c
fu/1
00m
L
Mic
robi
al A
sses
smen
tCa
tego
ry
95th
%ile
200
100 B
A0 2009-10 2010-11 2011-12 2012-13 2013-14
Response to rainfall Rainfall from Mosman rain gauge
10000
Ente
roco
cci (
cfu/
100m
L)
0 0.1–4.9 5–9.9 10–19.9 20+
1000
100
10
1
24-hour rainfall (mm)
Trends in enterococci data through time Animals
Boats
Port Jackson
100%
% E
nter
ococ
ci s
ampl
es 80%
60%
40%
20%
0%
Bathers
Sewage Overflows
Sewer Chokes
Stormwater
94-9
5
95-9
6
96-9
7
97-9
8
98-9
9
99-0
0
00-0
1
01-0
2
02-0
3
03-0
4
04-0
5
05-0
6
06-0
7
07-0
8
08-0
9
09-1
0
10-1
1
11-1
2
12-1
3
13-1
4
<=40 cfu/100mL 41-200 cfu/100mL 201-500 cfu/100mL >500 cfu/100mL
59

Murray Rose Pool Beach Suitability Grade: .G
Murray Rose Pool (formerly Redleaf Pool) is a netted swimming enclosure located in Double Bay, at the end of Seven Shillings Beach. The pool is bordered on three sides by a narrow sun deck and is backed by a park and Woollahra Council office.
The Beach Suitability Grade of Good indicates that microbial water quality is suitable for swimming most of the time but the water may be susceptible to pollution from several potential sources of faecal contamination, including stormwater.
The response to rainfall graph indicates that enterococci levels increased with increasing rainfall, regularly exceeding the safe swimming limit in response to 10 mm of rainfall or more.
The site has been monitored since 1994. Microbial water quality has generally improved since 2000–2001 owing to licensing of discharges from the sewerage system and improved management of stormwater.
See ‘How to read this report’ for key to map
Sanitary Inspection: Moderate Microbial Assessment: B SSourourcce:e: VVereryy LoLoww LowLow ModerModeratatee HHigighh Monitoring period for 2013–14 result is December 2011 to April 2014.
Hig
h ^ 600
90 9570
100 100
D500
400 C
300
20095th
%ile
En
tero
cocc
i cfu
/100
mL
Mic
robi
al A
sses
smen
tCa
tego
ry
B100 A0
2009-10 2010-11 2011-12 2012-13 2013-14
Response to rainfall Rainfall from Mosman rain gauge
10000
0 0.1–4.9 5–9.9 10–19.9 20+
Ente
roco
cci (
cfu/
100m
L)
1000
100
10
1
24-hour rainfall (mm)Mod
erat
e
Trends in enterococci data through time 100%
Sewer Chokes
Stormwater
Port Jackson
Boats
Bathers
Toilet Facilities
Sewage Overflows
% E
nter
ococ
ci s
ampl
es 80%
60%
40%
20%
0%
Low
94-9
5
95-9
6
96-9
7
97-9
8
98-9
9
99-0
0
00-0
1
01-0
2
02-0
3
03-0
4
04-0
5
05-0
6
06-0
7
07-0
8
08-0
9
09-1
0
10-1
1
11-1
2
12-1
3
13-1
4
Very
Lo
w <=40 cfu/100mL 41-200 cfu/100mL 201-500 cfu/100mL >500 cfu/100mL
60

Dawn Fraser Pool Beach Suitability Grade: .G
Dawn Fraser Pool in Balmain is the oldest pool and swimming club in Australia and is listed on the NSW State Heritage Register. Boardwalks and a pavilion surround the enclosed tidal swimming area. The pool is open between October and April each year.
The Beach Suitability Grade of Good indicates that microbial water quality is suitable for swimming most of the time but the water may be susceptible to pollution from several potential sources of faecal contamination including upstream sources in the Parramatta River.
The response to rainfall graph indicates that enterococci levels increase with increasing rainfall, regularly exceeding the safe swimming limit in response to 10 mm of rainfall or more.
The site has been monitored since 1994. Microbial water quality has generally improved since 2000–2001 owing to licensing of discharges from the sewerage system and improved management of stormwater.
See ‘How to read this report’ for key to map
Sanitary Inspection: Moderate Microbial Assessment: B SSourourcce:e: VVereryy LoLoww LowLow ModerModeratatee HHigighh Monitoring period for 2013–14 result is December 2011 to April 2014.
Hig
h ^ 600
80 105 100
70 75
D500
400 C
300
20095th
%ile
En
tero
cocc
i cfu
/100
mL
Mic
robi
al A
sses
smen
tCa
tego
ry
B100 A0
2009-10 2010-11 2011-12 2012-13 2013-14
Response to rainfall Rainfall from Lilyfield rain gauge
10000
0 0.1–4.9 5–9.9 10–19.9 20+
Ente
roco
cci (
cfu/
100m
L)
1000
100
10
1
24-hour rainfall (mm)Mod
erat
e
Trends in enterococci data through time 100%
Boats
Sewage Overflows
Stormwater
Parramatta River
Bathers
Toilet Facilities
Sewer Chokes % E
nter
ococ
ci s
ampl
es 80%
60%
40%
20%
0%
Low
94-9
5
95-9
6
96-9
7
97-9
8
98-9
9
99-0
0
00-0
1
01-0
2
02-0
3
03-0
4
04-0
5
05-0
6
06-0
7
07-0
8
08-0
9
09-1
0
10-1
1
11-1
2
12-1
3
13-1
4
Very
Lo
w <=40 cfu/100mL 41-200 cfu/100mL 201-500 cfu/100mL >500 cfu/100mL
61

Chiswick Baths Beach Suitability Grade: .G
Chiswick Baths are a netted swimming enclosure in Five Dock Bay. The swimming site is backed by a narrow sandy beach and a park with picnic and barbeque facilities.
The Beach Suitability Grade of Good indicates that the water quality is safe for swimming most of the time but can be susceptible to pollution after heavy rain, with potential faecal contamination from stormwater and upstream sources in the Parramatta River.
The response to rainfall graph indicates that enterococci levels increased with increasing rainfall, often exceeding the safe swimming limit in response to 5 mm of rainfall or more.
The site has been monitored since 1998. Microbial water quality has generally improved since 2000–2001 owing to licensing of discharges from the sewerage system and improved management of stormwater.
See ‘How to read this report’ for key to map
Sanitary Inspection: Moderate Microbial Assessment: B SSourourcce:e: VVereryy LoLoww LowLow ModerModeratatee HHigighh Monitoring period for 2013–14 result is December 2011 to April 2014.
^
Hig
h
70 110
210 155
110
0
100
200
300
400
500
600
95th
%ile
En
tero
cocc
i cfu
/100
mL
A
B
C
D
Mic
robi
al A
sses
smen
tCa
tego
ry
2009-10 2010-11 2011-12 2012-13 2013-14
Response to rainfall Rainfall from Gladesville rain gauge
10000
0 0.1–4.9 5–9.9 10–19.9 20+
Ente
roco
cci (
cfu/
100m
L)
1000
100
10
1
24-hour rainfall (mm)Mod
erat
e
Trends in enterococci data through time 100%
% E
nter
ococ
ci s
ampl
es 80%
60%
40%
20%
0%
Boats
Stormwater
Parramatta River
Low
Sewer Chokes
94-9
5
95-9
6
96-9
7
97-9
8
98-9
9
99-0
0
00-0
1
01-0
2
02-0
3
03-0
4
04-0
5
05-0
6
06-0
7
07-0
8
08-0
9
09-1
0
10-1
1
11-1
2
12-1
3
13-1
4
Toilet Facilities
Sewage Overflows
Very
Lo
w <=40 cfu/100mL 41-200 cfu/100mL 201-500 cfu/100mL >500 cfu/100mL Bathers
62

Cabarita Beach Beach Suitability Grade: .G
Cabarita Beach is located at the end of Cabarita Point. The beach is 120 metres long and is backed by parklands with picnic and barbeque facilities and a playground.
The Beach Suitability Grade of Good indicates that the water quality is safe for swimming most of the time but can be susceptible to pollution after heavy rain, with potential faecal contamination from sewage overflows and discharge from the Parramatta River.
The response to rainfall graph indicates that enterococci levels increased with increasing rainfall, often exceeding the safe swimming limit in response to 10 mm of rainfall or more.
The site has been monitored since 1996. Microbial water quality has generally improved since 2000–2001 owing to licensing of discharges from the sewerage system and improved management of stormwater.
See ‘How to read this report’ for key to map
Sanitary Inspection: Moderate Microbial Assessment: B SSourourcce:e: VVereryy LoLoww LowLow ModerModeratatee HHigighh Monitoring period for 2013–14 result is December 2011 to April 2014.
^
Hig
h 600
115 115 170 175
145
2009-10 2010-11 2011-12 2012-13 2013-14
95th
%ile
En
tero
cocc
i cfu
/100
mL D500
400 C
300
Mic
robi
al A
sses
smen
tCa
tego
ry
200 B100 A0
Response to rainfall Rainfall from Gladesville rain gauge
10000
0 0.1–4.9 5–9.9 10–19.9 20+
Ente
roco
cci (
cfu/
100m
L)
1000
100
10
1
Mod
erat
e
Boats
Parramatta River
24-hour rainfall (mm)
Trends in enterococci data through time 100%
80%
60%
40%
20%
0%% E
nter
ococ
ci s
ampl
es
Bathers
Sewage Overflows
Sewer Chokes
Stormwater
Low
94-9
5
95-9
6
96-9
7
97-9
8
98-9
9
99-0
0
00-0
1
01-0
2
02-0
3
03-0
4
04-0
5
05-0
6
06-0
7
07-0
8
08-0
9
09-1
0
10-1
1
11-1
2
12-1
3
13-1
4
Very
Lo
w <=40 cfu/100mL 41-200 cfu/100mL 201-500 cfu/100mL >500 cfu/100mL
63

Woolwich Baths Beach Suitability Grade: .G
Woolwich Baths are a 20 by 30 metre netted swimming area in the lower Lane Cove River. The baths are backed by a narrow sandy beach and are adjacent to a reserve.
The Beach Suitability Grade of Good indicates that the water quality is safe for swimming most of the time but can be susceptible to pollution after heavy rain, with potential faecal contamination from stormwater, sewage overflows and discharge from the Lane Cove River.
The response to rainfall graph indicates that enterococci levels increased with increasing rainfall, frequently exceeding the safe swimming limit in response to 5 mm of rainfall or more.
The site has been monitored since 1994. Microbial water quality has generally improved since 2000–2001 owing to licensing of discharges from the sewerage system and improved management of stormwater.
See ‘How to read this report’ for key to map
Sanitary Inspection: Moderate Microbial Assessment: B SSourourcce:e: VVereryy LoLoww LowLow ModerModeratatee HHigighh Monitoring period for 2013–14 result is December 2011 to April 2014.
Very
Low
H
igh
Mod
erat
eLo
w
^
105
175
260
145 150
D500
400
Ente
roco
cci c
fu/1
00m
L
Mic
robi
al A
sses
smen
tCa
tego
ry
95th
%ile C
300
200 B100 A0
2009-10 2010-11 2011-12 2012-13 2013-14
Response to rainfall Rainfall from Gladesville rain gauge
10000
0 0.1–4.9 5–9.9 10–19.9 20+
Ente
roco
cci (
cfu/
100m
L)
1000
100
10
1
Boats
Lane Cove River
Stormwater
24-hour rainfall (mm)
600
Trends in enterococci data through time 100%
80%
60%
40%
20%
0%% E
nter
ococ
ci s
ampl
es
Sewer Chokes
Toilet Facilities
Sewage Overflows
94-9
5
95-9
6
96-9
7
97-9
8
98-9
9
99-0
0
00-0
1
01-0
2
02-0
3
03-0
4
04-0
5
05-0
6
06-0
7
07-0
8
08-0
9
09-1
0
10-1
1
11-1
2
12-1
3
13-1
4
<=40 cfu/100mL 41-200 cfu/100mL 201-500 cfu/100mL >500 cfu/100mL Bathers
64

Tambourine Bay Beach Suitability Grade: .P
This pool is in Tambourine Bay in the lower Lane Cove River. It is backed by parklands with picnic and barbeque facilities and a playground. Lane Cove Council has currently closed the baths and the long-term future of the site is yet to be determined.
The Beach Suitability Grade of Poor indicates that microbial water quality is influenced by faecal pollution, usually triggered by rainfall, with potential faecal contamination from stormwater, sewage overflows and discharge from the Lane Cove River.
The response to rainfall graph indicates that enterococci levels increased with increasing rainfall, occasionally exceeding the safe swimming limit in response to light rain, and regularly after 5 mm of rainfall or more.
The site has been monitored since 1994. Microbial water quality has generally improved since 2000–2001 owing to licensing of discharges from the sewerage system and improved management of stormwater.
Sanitary Inspection: Moderate Microbial Assessment: C SSourourcce:e: VVereryy LoLoww LowLow ModerModeratatee HHigighh Monitoring period for 2013–14 result is December 2011 to April 2014.
See ‘How to read this report’ for key to map
Very
Low
H
igh
Mod
erat
eLo
w
^ 600
220 240
360 310
350
2009-10 2010-11 2011-12 2012-13 2013-14
95th
%ile
En
tero
cocc
i cfu
/100
mL D500
Mic
robi
al A
sses
smen
tCa
tego
ry 400
300
200
C
B100 A0
Response to rainfall Rainfall from Gladesville rain gauge
10000
Ente
roco
cci (
cfu/
100m
L)
0 0.1–4.9 5–9.9 10–19.9 20+
1000
100
10
1
24-hour rainfall (mm) Animals
Boats
Sewage Overflows
Sewer Chokes
Stormwater
Lane Cove River
Trends in enterococci data through time 100%
% E
nter
ococ
ci s
ampl
es 80%
60%
40%
20%
0%
94-9
5
95-9
6
96-9
7
97-9
8
98-9
9
99-0
0
00-0
1
01-0
2
02-0
3
03-0
4
04-0
5
05-0
6
06-0
7
07-0
8
08-0
9
09-1
0
10-1
1
11-1
2
12-1
3
13-1
4
<=40 cfu/100mL 41-200 cfu/100mL 201-500 cfu/100mL >500 cfu/100mL Bathers
65

Woodford Bay Beach Suitability Grade: .G
This site is a 20 by 25 metre enclosed swimming area on the western side of Woodford Bay in the lower Lane Cove River. The swimming area is backed by a narrow sandy beach and park.
The Beach Suitability Grade of Good indicates that microbial water quality is suitable for swimming most of the time but the water may be susceptible to pollution from several potential sources of faecal contamination.
The response to rainfall graph indicates that enterococci levels increased with increasing rainfall, often exceeding the safe swimming limit in response to 5 mm of rainfall or more, and frequently after 20 mm or more.
The site has been monitored since 1994. Microbial water quality has improved slightly since 2000–2001 owing to licensing of discharges from the sewerage system and improved management of stormwater.
See ‘How to read this report’ for key to map
Sanitary Inspection: Moderate Microbial Assessment: B SSourourcce:e: VVereryy LoLoww LowLow ModerModeratatee HHigighh Monitoring period for 2013–14 result is December 2011 to April 2014.
^
Stormwater
Lane Cove River
Very
Low Bathers
Sewage Overflows
Sewer Chokes
Boats
Hig
hM
oder
ate
Low
75 115
155 120 100
0
100
200
300
400
500
600
95th
%ile
En
tero
cocc
i cfu
/100
mL
A
B
C
D
Mic
robi
al A
sses
smen
tCa
tego
ry
2009-10 2010-11 2011-12 2012-13 2013-14
Response to rainfall Rainfall from Gladesville rain gauge
10000
Ente
roco
cci (
cfu/
100m
L)
1000
100
10
1
24-hour rainfall (mm) 0 0.1–4.9 5–9.9 10–19.9 20+
Trends in enterococci data through time
0%
20%
40%
60%
80%
100%
% E
nter
ococ
ci s
ampl
es
94-9
5
95-9
6
96-9
7
97-9
8
98-9
9
99-0
0
00-0
1
01-0
2
02-0
3
03-0
4
04-0
5
05-0
6
06-0
7
07-0
8
08-0
9
09-1
0
10-1
1
11-1
2
12-1
3
13-1
4
<=40 cfu/100mL 41-200 cfu/100mL 201-500 cfu/100mL >500 cfu/100mL
66

Greenwich Baths Beach Suitability Grade: .G
Greenwich Baths are a 40 metre long netted swimming area backed by a sandy beach. The baths are next to a park and are open during the swimming season. There are toilet and shower facilities and a kiosk.
The Beach Suitability Grade of Good indicates that microbial water quality is suitable for swimming most of the time but the water may be susceptible to pollution from several potential sources of faecal contamination, including discharge from Lane Cove River.
The response to rainfall graph indicates that enterococci levels increased with increasing rainfall, regularly exceeding the safe swimming limit in response to 10 mm of rainfall or more.
The site has been monitored since 1994. Microbial water quality has generally improved since 2000–2001 owing to licensing of discharges from the sewerage system and improved management of stormwater.
See ‘How to read this report’ for key to map
Sanitary Inspection: Moderate Microbial Assessment: B SSourourcce:e: VVereryy LoLoww LowLow ModerModeratatee HHigighh Monitoring period for 2013–14 result is December 2011 to April 2014.
Very
Low
Low
M
oder
ate
Hig
h ^ 600
75 115
155 120 100
D500
400 C
300
Ente
roco
cci c
fu/1
00m
L
Mic
robi
al A
sses
smen
tCa
tego
ry
95th
%ile
200 B100 A0
2009-10 2010-11 2011-12 2012-13 2013-14
Response to rainfall Rainfall from Lilyfield rain gauge
10000
0 0.1–4.9 5–9.9 10–19.9 20+
Ente
roco
cci (
cfu/
100m
L)
1000
100
10
1
24-hour rainfall (mm)
Trends in enterococci data through time 100%Boats
Sewer Chokes
Stormwater
River Discharge
% E
nter
ococ
ci s
ampl
es 80%
60%
40%
20%
0% Sewage Overflows
94-9
5
95-9
6
96-9
7
97-9
8
98-9
9
99-0
0
00-0
1
01-0
2
02-0
3
03-0
4
04-0
5
05-0
6
06-0
7
07-0
8
08-0
9
09-1
0
10-1
1
11-1
2
12-1
3
13-1
4
<=40 cfu/100mL 41-200 cfu/100mL 201-500 cfu/100mL >500 cfu/100mLBathers
Toilets
67

Hayes Street Beach Beach Suitability Grade: .G
Hayes Street Beach is approximately 50 metres long and is located adjacent to the Hayes Street Ferry Wharf in Neutral Bay. The area is not netted.
The Beach Suitability Grade of Good indicates that the water quality is safe for swimming most of the time but can be susceptible to pollution from several potential sources of contamination.
The response to rainfall graph indicates that enterococci levels increased with increasing rainfall, frequently exceeding the safe swimming limit in response to 5 mm of rainfall or more.
The site has been monitored since 1994. Microbial water quality has generally improved since 2000–2001 owing to the licensing of discharges from the sewerage system and improved management of stormwater.
See ‘How to read this report’ for key to map
Sanitary Inspection: Moderate Microbial Assessment: B SSourourcce:e: VVereryy LoLoww LowLow ModerModeratatee HHigighh Monitoring period for 2013–14 result is December 2011 to April 2014.
Very
Low
Lo
w
Mod
erat
eH
igh ^
Sewer Chokes
Bathers Sewage Overflows
600
165 210 220
175 135
2009-10 2010-11 2011-12 2012-13 2013-14
Ente
roco
cci c
fu/1
00m
L D500
400 C
300
Mic
robi
al A
sses
smen
tCa
tego
ry
95th
%ile
200 B100 A0
Response to rainfall Rainfall from Mosman rain gauge
10000
Ente
roco
cci (
cfu/
100m
L)
0 0.1–4.9 5–9.9 10–19.9 20+
1000
100
10
1
24-hour rainfall (mm)
Trends in enterococci data through time 100%
Stormwater
Boats
Port Jackson
% E
nter
ococ
ci s
ampl
es 80%
60%
40%
20%
0%
94-9
5
95-9
6
96-9
7
97-9
8
98-9
9
99-0
0
00-0
1
01-0
2
02-0
3
03-0
4
04-0
5
05-0
6
06-0
7
07-0
8
08-0
9
09-1
0
10-1
1
11-1
2
12-1
3
13-1
4
<=40 cfu/100mL 41-200 cfu/100mL 201-500 cfu/100mL >500 cfu/100mL
68

Clifton Gardens Beach Suitability Grade: .G
Clifton Gardens is a large netted swimming area at the western end of a 250 metre long beach in Chowder Bay. The beach is backed by Sydney Harbour National Park and a park with picnic and toilet facilities.
The Beach Suitability Grade of Good indicates that microbial water quality is suitable for swimming most of the time but the water may be susceptible to pollution from several minor sources of faecal contamination.
The response to rainfall graph indicates that enterococci levels increased with increasing rainfall, often exceeding the safe swimming limit in response to 5 mm of rainfall or more, and frequently after 20 mm or more.
The site has been monitored since 1994. Microbial water quality has generally improved since 2000–2001 due to licensing of discharges from the sewerage system (and associated works such as the Northside
See ‘How to read this report’ for key to map Storage Tunnel) and improved management of stormwater.
Sanitary Inspection: Moderate Microbial Assessment: B SSourourcce:e: VVereryy LoLoww LowLow ModerModeratatee HHigighh Monitoring period for 2013–14 result is December 2011 to April 2014.
Animals Boats
Port Jackson
Sewer Chokes Sewer Overflows
Stormwater
Very
Low Bathers
Toilets
Hig
hM
oder
ate
Low
^
45 50 110
80 55
0
100
200
300
400
500
600
95th
%ile
En
tero
cocc
i cfu
/100
mL
A
B
C
D
Mic
robi
al A
sses
smen
tCa
tego
ry
2009-10 2010-11 2011-12 2012-13 2013-14
Response to rainfall Rainfall from Mosman rain gauge
10000
Ente
roco
cci (
cfu/
100m
L)
1000
100
10
1
24-hour rainfall (mm) 0 0.1–4.9 5–9.9 10–19.9 20+
Trends in enterococci data through time 100%
% E
nter
ococ
ci s
ampl
es 80%
60%
40%
20%
0%
94-9
5
95-9
6
96-9
7
97-9
8
98-9
9
99-0
0
00-0
1
01-0
2
02-0
3
03-0
4
04-0
5
05-0
6
06-0
7
07-0
8
08-0
9
09-1
0
10-1
1
11-1
2
12-1
3
13-1
4
<=40 cfu/100mL 41-200 cfu/100mL 201-500 cfu/100mL >500 cfu/100mL
69

Balmoral Baths Beach Suitability Grade: .G
Balmoral Baths are a netted swimming area towards the eastern end of Balmoral Beach, backed by a park with picnic and toilet facilities.
The Beach Suitability Grade of Good indicates that microbial water quality is suitable for swimming most of the time but the water may be susceptible to pollution from a number of potential sources of faecal contamination, including stormwater.
The response to rainfall graph indicates that enterococci levels generally increased with increasing rainfall, often exceeding the safe swimming limit in response to 5 mm of rainfall or more, and frequently after 20 mm or more.
The site has been monitored since 1994. Microbial water quality has generally improved since 2000–2001 owing to licensing of discharges from the sewerage system (and associated works such as the Northside Storage Tunnel) and improved management of stormwater.
Sanitary Inspection: Moderate Microbial Assessment: B SSourourcce:e: VVereryy LoLoww LowLow ModerModeratatee HHigighh Monitoring period for 2013–14 result is December 2011 to April 2014.
See ‘How to read this report’ for key to map
Hig
h ^
70 75 85 75 75
0
100
200
300
400
500
600
95th
%ile
En
tero
cocc
i cfu
/100
mL
A
B
C
D
Mic
robi
al A
sses
smen
tCa
tego
ry
2009-10 2010-11 2011-12 2012-13 2013-14
Response to rainfall Rainfall from Mosman rain gauge
10000
0 0.1–4.9 5–9.9 10–19.9 20+
Ente
roco
cci (
cfu/
100m
L)
1000
100
10
1
24-hour rainfall (mm)Mod
erat
e
Trends in enterococci data through time 100%
Sewer Chokes Sewage Overflows
Middle Harbour
Boats
Bathers
Toilet Facilities
Stormwater
% E
nter
ococ
ci s
ampl
es 80%
60%
40%
20%
0%
Low
94-9
5
95-9
6
96-9
7
97-9
8
98-9
9
99-0
0
00-0
1
01-0
2
02-0
3
03-0
4
04-0
5
05-0
6
06-0
7
07-0
8
08-0
9
09-1
0
10-1
1
11-1
2
12-1
3
13-1
4
Very
Lo
w <=40 cfu/100mL 41-200 cfu/100mL 201-500 cfu/100mL >500 cfu/100mL
70

Edwards Beach Beach Suitability Grade: .G
Edwards Beach is a popular swimming area located at the southern end of the beach backed by a walking track, park and café facilities.
The Beach Suitability Grade of Good indicates that microbial water quality is suitable for swimming most of the time but the water may be susceptible to pollution from a number of potential sources of faecal contamination.
The response to rainfall graph indicates that enterococci levels increased slightly with increasing rainfall, often exceeding the safe swimming limit in response to 20 mm of rainfall or more.
The site has been monitored since 1994. Microbial water quality has generally improved since 2000–2001 owing to licensing of discharges from the sewerage system (and associated works such as the Northside Storage Tunnel) and improved management of stormwater.
See ‘How to read this report’ for key to map
Sanitary Inspection: Moderate Microbial Assessment: A SSourourcce:e: VVereryy LoLoww LowLow ModerModeratatee HHigighh Monitoring period for 2013–14 result is December 2011 to April 2014.
Hig
h ^
28 45 65 24 28
0
100
200
300
400
500
600
95th
%ile
En
tero
cocc
i cfu
/100
mL
A
B
C
D
Mic
robi
al A
sses
smen
tCa
tego
ry
2009-10 2010-11 2011-12 2012-13 2013-14
Response to rainfall Rainfall from Mosman rain gauge
10000
0 0.1–4.9 5–9.9 10–19.9 20+
Ente
roco
cci (
cfu/
100m
L)
1000
100
10
1
24-hour rainfall (mm)Mod
erat
e
Trends in enterococci data through time 100%
% E
nter
ococ
ci s
ampl
es 80%
60%
40%
20%
0%
Low
Sewer Chokes Sewage Overflows
Middle Harbour
Bathers
Toilet Facilities
Stormwater
94-9
5
95-9
6
96-9
7
97-9
8
98-9
9
99-0
0
00-0
1
01-0
2
02-0
3
03-0
4
04-0
5
05-0
6
06-0
7
07-0
8
08-0
9
09-1
0
10-1
1
11-1
2
12-1
3
13-1
4
Very
Lo
w <=40 cfu/100mL 41-200 cfu/100mL 201-500 cfu/100mL >500 cfu/100mL
71

Chinamans Beach Beach Suitability Grade: .G
Chinamans Beach is approximately 250 metres long and is a popular swimming area in Middle Harbour. It is backed by Rosherville Reserve.
The Beach Suitability Grade of Good indicates that microbial water quality is suitable for swimming most of the time but the water may be susceptible to pollution from a number of potential sources of faecal contamination, including discharge from Middle Harbour.
The response to rainfall graph indicates that enterococci levels increased with increasing rainfall, frequently exceeding the safe swimming limit in response to 20 mm of rainfall or more.
The site has been monitored since 1998. Microbial water quality has generally improved since 2000–2001 owing to licensing of discharges from the sewerage system (and associated works such as the Northside Storage Tunnel) and improved management of stormwater.
See ‘How to read this report’ for key to map
Sanitary Inspection: Moderate Microbial Assessment: B SSourourcce:e: VVereryy LoLoww LowLow ModerModeratatee HHigighh Monitoring period for 2013–14 result is December 2011 to April 2014.
Hig
h ^ 600
50 75 85
40 50
D500
400 C
300
20095th
%ile
En
tero
cocc
i cfu
/100
mL
Mic
robi
al A
sses
smen
tCa
tego
ry
B100 A0
2009-10 2010-11 2011-12 2012-13 2013-14
Response to rainfall Rainfall from Mosman rain gauge
10000
0 0.1–4.9 5–9.9 10–19.9 20+
Ente
roco
cci (
cfu/
100m
L)
1000
100
10
1
24-hour rainfall (mm)Mod
erat
e
Trends in enterococci data through time 100%
% E
nter
ococ
ci s
ampl
es 80%
60%
40%
20%
0%
Animals Boats
Middle Harbour
Low
Stormwater
Sewage Overflows 94-9
5
95-9
6
96-9
7
97-9
8
98-9
9
99-0
0
00-0
1
01-0
2
02-0
3
03-0
4
04-0
5
05-0
6
06-0
7
07-0
8
08-0
9
09-1
0
10-1
1
11-1
2
12-1
3
13-1
4
Bathers
Toilet Facilities
Very
Lo
w <=40 cfu/100mL 41-200 cfu/100mL 201-500 cfu/100mL >500 cfu/100mL
72

Northbridge Baths Beach Suitability Grade: .P
Northbridge Baths are a 30 by 65 metre enclosed swimming area in Sailors Bay, Middle Harbour. The baths are open year round; however, signage advises not to swim during and for up to 48 hours after rainfall.
The Beach Suitability Grade of Poor indicates that microbial water quality is influenced by faecal pollution, particularly after rainfall, with potential faecal contamination from stormwater, sewage overflows and upstream sources in Middle Harbour.
The response to rainfall graph indicates that enterococci levels increased with increasing rainfall, often exceeding the safe swimming limit in response to only light rainfall, and frequently after 5 mm or more.
The site has been monitored since 1994. Microbial water quality has improved slightly since 2000–2001 owing to licensing of discharges from the sewerage system (and associated works such as the Northside Storage Tunnel) and improved management of stormwater.
Sanitary Inspection: High VVereryy LoLoww LowLow ModerModeratateeSSourourcce:e: HHigighh
Microbial Assessment: C Monitoring period for 2013–14 result is December 2011 to April 2014.
See ‘How to read this report’ for key to map
Hig
h ^ 600
115 100
260 260 260
D500
400
95th
%ile
En
tero
cocc
i cfu
/100
mL
Mic
robi
al A
sses
smen
tCa
tego
ry
C300
200 B100 A0
2009-10 2010-11 2011-12 2012-13 2013-14
Response to rainfall Rainfall from Mosman rain gauge
10000
0 0.1–4.9 5–9.9 10–19.9 20+
Ente
roco
cci (
cfu/
100m
L)
1000
100
10
1
24-hour rainfall (mm)
Sewer Chokes
Stormwater
Middle Harbour
Boats
Bathers
Toilet Facilities
Sewage Overflows
Mod
erat
eLo
w
Trends in enterococci data through time 100%
% E
nter
ococ
ci s
ampl
es 80%
60%
40%
20%
0%
94-9
5
95-9
6
96-9
7
97-9
8
98-9
9
99-0
0
00-0
1
01-0
2
02-0
3
03-0
4
04-0
5
05-0
6
06-0
7
07-0
8
08-0
9
09-1
0
10-1
1
11-1
2
12-1
3
13-1
4
Very
Lo
w <=40 cfu/100mL 41-200 cfu/100mL 201-500 cfu/100mL >500 cfu/100mL
73
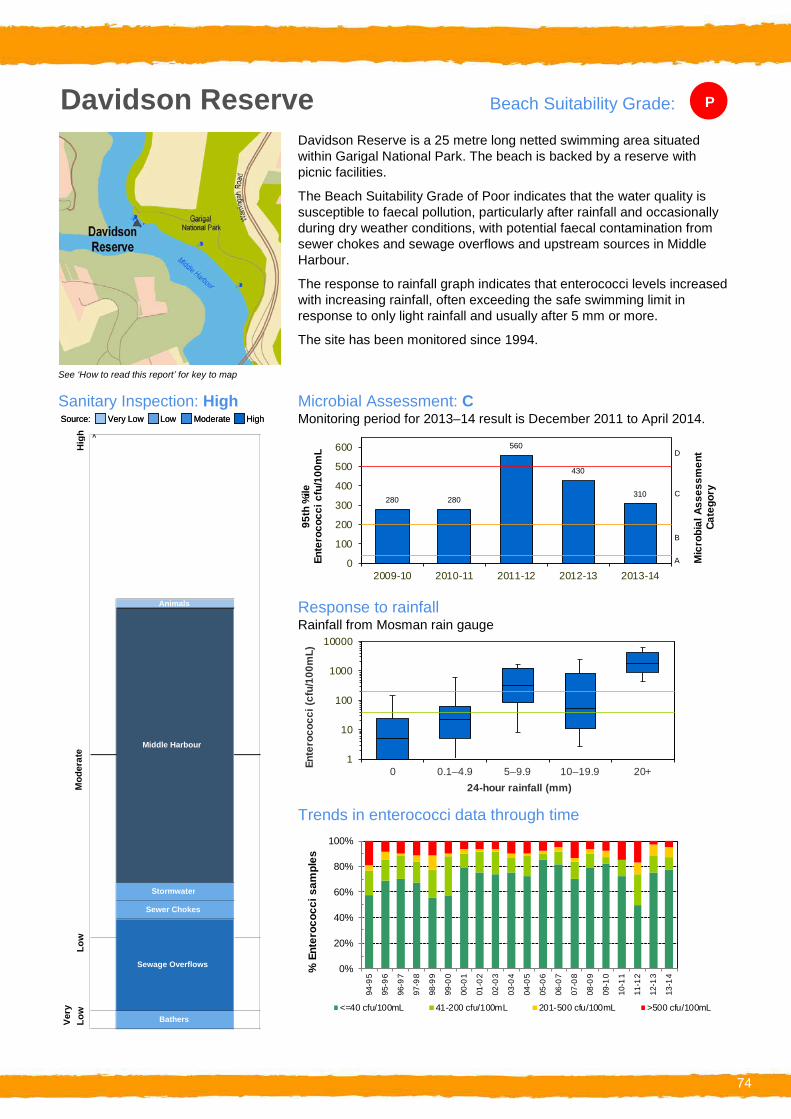
Davidson Reserve Beach Suitability Grade: .P
Davidson Reserve is a 25 metre long netted swimming area situated within Garigal National Park. The beach is backed by a reserve with picnic facilities.
The Beach Suitability Grade of Poor indicates that the water quality is susceptible to faecal pollution, particularly after rainfall and occasionally during dry weather conditions, with potential faecal contamination from sewer chokes and sewage overflows and upstream sources in Middle Harbour.
The response to rainfall graph indicates that enterococci levels increased with increasing rainfall, often exceeding the safe swimming limit in response to only light rainfall and usually after 5 mm or more.
The site has been monitored since 1994.
See ‘How to read this report’ for key to map
Sanitary Inspection: High Microbial Assessment: C SSourourcce:e: VVereryy LoLoww LowLow ModerModeratatee HHigighh Monitoring period for 2013–14 result is December 2011 to April 2014.
Hig
h ^
280 280
560
430
310
2009-10 2010-11 2011-12 2012-13 2013-14
600
500
400
300
20095th
%ile
En
tero
cocc
i cfu
/100
mL D
C
Mic
robi
al A
sses
smen
tCa
tego
ry
B100
A0
Animals
Middle Harbour
Response to rainfall Rainfall from Mosman rain gauge
10000
0 0.1–4.9 5–9.9 10–19.9 20+
Ente
roco
cci (
cfu/
100m
L)
1000
100
10
1
24-hour rainfall (mm)Mod
erat
e
Trends in enterococci data through time 100%
% E
nter
ococ
ci s
ampl
es 80%
60%
40%
20%
0%
Stormwater
Bathers
Sewage Overflows
Sewer Chokes
Low
94-9
5
95-9
6
96-9
7
97-9
8
98-9
9
99-0
0
00-0
1
01-0
2
02-0
3
03-0
4
04-0
5
05-0
6
06-0
7
07-0
8
08-0
9
09-1
0
10-1
1
11-1
2
12-1
3
13-1
4
Very
Lo
w <=40 cfu/100mL 41-200 cfu/100mL 201-500 cfu/100mL >500 cfu/100mL
74

Gurney Crescent Baths Beach Suitability Grade: .F
Gurney Crescent Baths are a 20 metre square netted swimming area located at Pickering Point, Middle Harbour. The baths are backed by a bush reserve and are not a popular swimming location.
The Beach Suitability Grade of Fair indicates that microbial water quality is occasionally influenced by faecal pollution, usually triggered by rainfall, with several potential sources of faecal contamination including river discharge and stormwater.
The response to rainfall graph indicates that enterococci levels increased with increasing rainfall, regularly exceeding the safe swimming limit in response to 5 mm of rainfall or more.
The site has been monitored since 1996.
See ‘How to read this report’ for key to map
Sanitary Inspection: High Microbial Assessment: B SSourourcce:e: VVereryy LoLoww LowLow ModerModeratatee HHigighh Monitoring period for 2013–14 result is December 2011 to April 2014.
Hig
h ^ 600
150 120
200 220 195
2009-10 2010-11 2011-12 2012-13 2013-14
95th
%ile
En
tero
cocc
i cfu
/100
mL D500
400 C
300
Mic
robi
al A
sses
smen
tCa
tego
ry
200 B100 A0
Response to rainfall Rainfall from Mosman rain gauge
10000
0 0.1–4.9 5–9.9 10–19.9 20+
Ente
roco
cci (
cfu/
100m
L)
1000
100
10
1
24-hour rainfall (mm)
Boats
Sewer Chokes Sewage Overflows
Bathers
Stormwater
Middle Harbour
Mod
erat
e Lo
w
Trends in enterococci data through time 100%
% E
nter
ococ
ci s
ampl
es 80%
60%
40%
20%
0%
94-9
5
95-9
6
96-9
7
97-9
8
98-9
9
99-0
0
00-0
1
01-0
2
02-0
3
03-0
4
04-0
5
05-0
6
06-0
7
07-0
8
08-0
9
09-1
0
10-1
1
11-1
2
12-1
3
13-1
4
Very
Lo
w <=40 cfu/100mL 41-200 cfu/100mL 201-500 cfu/100mL >500 cfu/100mL
75
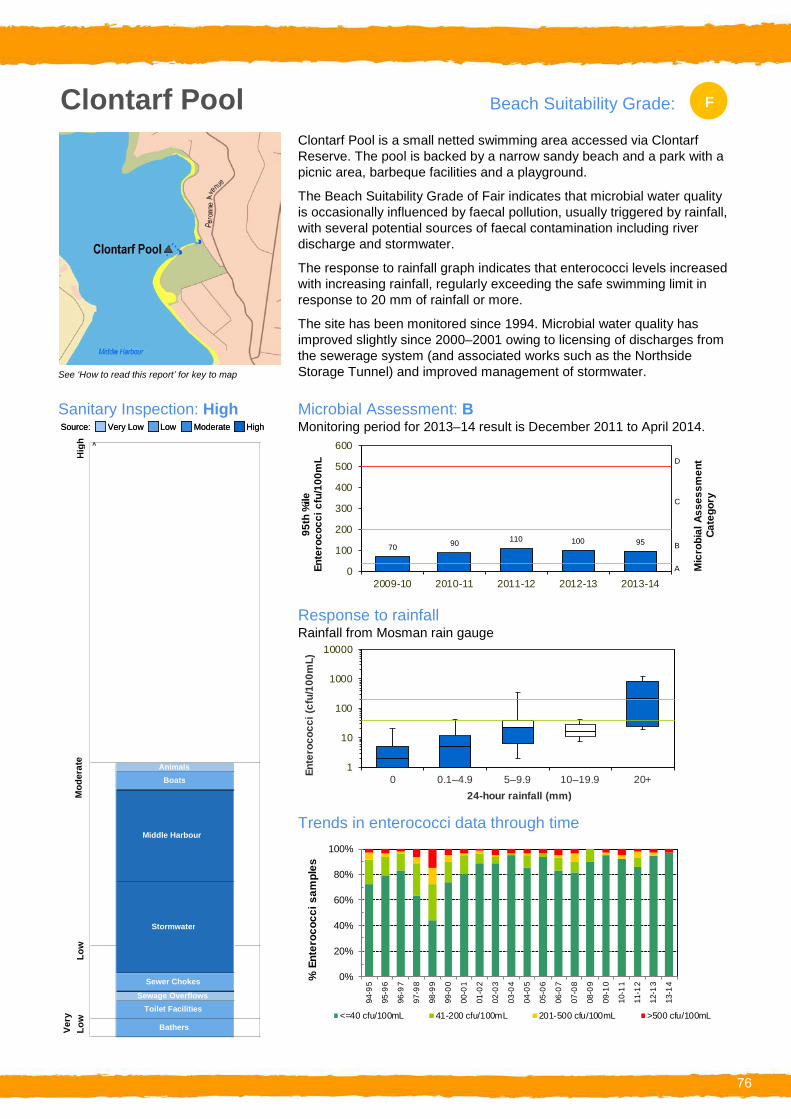
Clontarf Pool Beach Suitability Grade: .F
Clontarf Pool is a small netted swimming area accessed via Clontarf Reserve. The pool is backed by a narrow sandy beach and a park with a picnic area, barbeque facilities and a playground.
The Beach Suitability Grade of Fair indicates that microbial water quality is occasionally influenced by faecal pollution, usually triggered by rainfall, with several potential sources of faecal contamination including river discharge and stormwater.
The response to rainfall graph indicates that enterococci levels increased with increasing rainfall, regularly exceeding the safe swimming limit in response to 20 mm of rainfall or more.
The site has been monitored since 1994. Microbial water quality has improved slightly since 2000–2001 owing to licensing of discharges from the sewerage system (and associated works such as the Northside Storage Tunnel) and improved management of stormwater.
Sanitary Inspection: High Microbial Assessment: B SSourourcce:e: VVereryy LoLoww LowLow ModerModeratatee HHigighh Monitoring period for 2013–14 result is December 2011 to April 2014.
See ‘How to read this report’ for key to map
Hig
h ^ 600
70 90 95110 100
D500
400 C
300
20095th
%ile
En
tero
cocc
i cfu
/100
mL
Mic
robi
al A
sses
smen
tCa
tego
ry
B100 A0
2009-10 2010-11 2011-12 2012-13 2013-14
Response to rainfall Rainfall from Mosman rain gauge
10000
0 0.1–4.9 5–9.9 10–19.9 20+
Ente
roco
cci (
cfu/
100m
L)
1000
100
10
1
Mod
erat
eLo
w
Animals
Stormwater
Middle Harbour
Boats
24-hour rainfall (mm)
Trends in enterococci data through time 100%
% E
nter
ococ
ci s
ampl
es 80%
60%
40%
20%
0%Sewer Chokes
Sewage Overflows 94-9
5
95-9
6
96-9
7
97-9
8
98-9
9
99-0
0
00-0
1
01-0
2
02-0
3
03-0
4
04-0
5
05-0
6
06-0
7
07-0
8
08-0
9
09-1
0
10-1
1
11-1
2
12-1
3
13-1
4
Bathers
Toilet Facilities
Very
Lo
w <=40 cfu/100mL 41-200 cfu/100mL 201-500 cfu/100mL >500 cfu/100mL
76
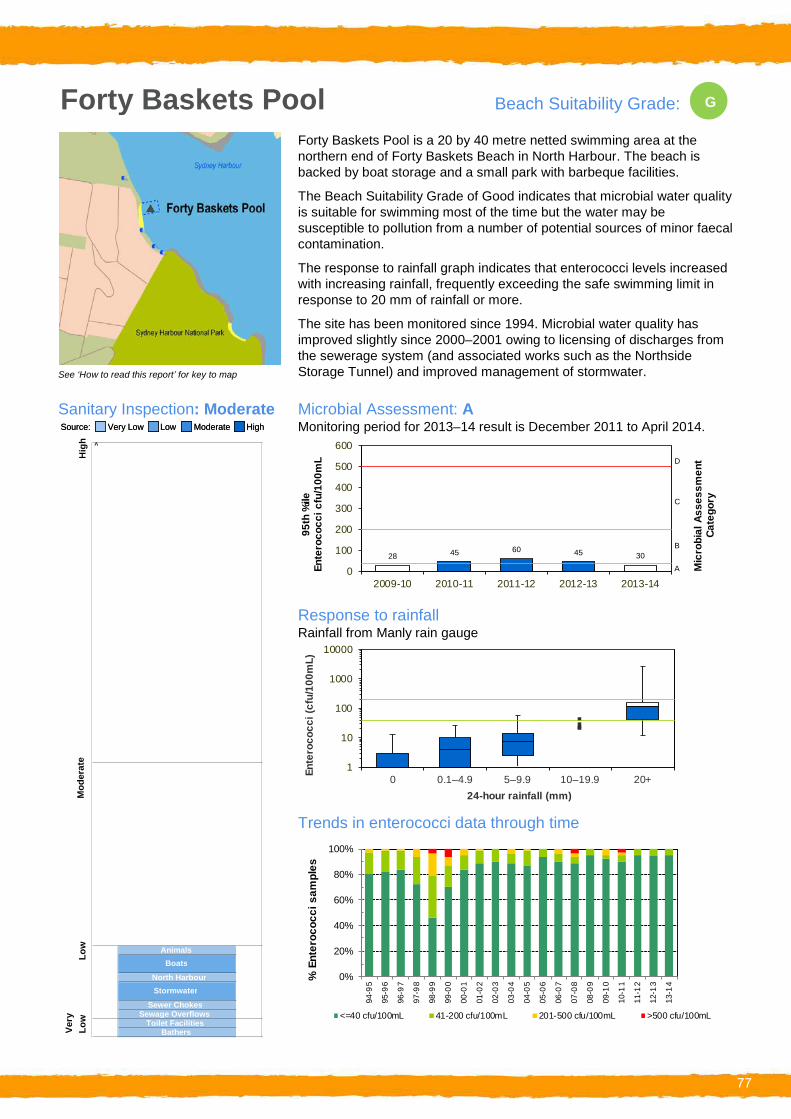
Forty Baskets Pool Beach Suitability Grade: .G
Forty Baskets Pool is a 20 by 40 metre netted swimming area at the northern end of Forty Baskets Beach in North Harbour. The beach is backed by boat storage and a small park with barbeque facilities.
The Beach Suitability Grade of Good indicates that microbial water quality is suitable for swimming most of the time but the water may be susceptible to pollution from a number of potential sources of minor faecal contamination.
The response to rainfall graph indicates that enterococci levels increased with increasing rainfall, frequently exceeding the safe swimming limit in response to 20 mm of rainfall or more.
The site has been monitored since 1994. Microbial water quality has improved slightly since 2000–2001 owing to licensing of discharges from the sewerage system (and associated works such as the Northside Storage Tunnel) and improved management of stormwater.
Sanitary Inspection: Moderate Microbial Assessment: A SSourourcce:e: VVereryy LoLoww LowLow ModerModeratatee HHigighh Monitoring period for 2013–14 result is December 2011 to April 2014.
See ‘How to read this report’ for key to map
Hig
h ^ 600
28 3045 4560
D500
400 C
300
20095th
%ile
En
tero
cocc
i cfu
/100
mL
Mic
robi
al A
sses
smen
tCa
tego
ry
B100 A0
2009-10 2010-11 2011-12 2012-13 2013-14
Response to rainfall Rainfall from Manly rain gauge
10000
0 0.1–4.9 5–9.9 10–19.9 20+
Ente
roco
cci (
cfu/
100m
L)
1000
100
10
1
24-hour rainfall (mm)Mod
erat
e
Trends in enterococci data through time 100%
% E
nter
ococ
ci s
ampl
es 80%
60%
40%
20%
0%
Low Animals
North Harbour
Sewer Chokes Sewage Overflows
Toilet Facilities Bathers
Stormwater
Boats
94-9
5
95-9
6
96-9
7
97-9
8
98-9
9
99-0
0
00-0
1
01-0
2
02-0
3
03-0
4
04-0
5
05-0
6
06-0
7
07-0
8
08-0
9
09-1
0
10-1
1
11-1
2
12-1
3
13-1
4
Very
Lo
w <=40 cfu/100mL 41-200 cfu/100mL 201-500 cfu/100mL >500 cfu/100mL
77

Fairlight Beach Beach Suitability Grade: .G
Fairlight Beach is a narrow beach located in North Harbour. The beach is backed by a small reserve and picnic area. A 25 metre pool filled with water from the harbour is adjacent to the beach.
The Beach Suitability Grade of Good indicates that microbial water quality is suitable for swimming most of the time but the water may be susceptible to pollution from a number of minor sources of faecal contamination.
The response to rainfall graph indicates that enterococci levels generally increased with increasing rainfall, regularly exceeding the safe swimming limit in response to 20 mm of rainfall or more.
The site has been monitored since 1996. Microbial water quality has generally improved since 2000–2001 owing to licensing of discharges from the sewerage system and improved management of stormwater.
See ‘How to read this report’ for key to map
Sanitary Inspection: Moderate Microbial Assessment: A SSourourcce:e: VVereryy LoLoww LowLow ModerModeratatee HHigighh Monitoring period for 2013–14 result is December 2011 to April 2014.
Hig
h ^
16 16 55 45 30
0
100
200
300
400
500
600
95th
%ile
En
tero
cocc
i cfu
/100
mL
A
B
C
D
Mic
robi
al A
sses
smen
tCa
tego
ry
2009-10 2010-11 2011-12 2012-13 2013-14
Response to rainfall Rainfall from Manly rain gauge
10000
0 0.1–4.9 5–9.9 10–19.9 20+
Ente
roco
cci (
cfu/
100m
L)
1000
100
10
1
24-hour rainfall (mm)Mod
erat
e
Trends in enterococci data through time 100%
% E
nter
ococ
ci s
ampl
es 80%
60%
40%
20%
0%
Low Boats
North Harbour
Sewer Chokes Sewage Overflows
Bathers
Toilet Facilities
Stormwater
94-9
5
95-9
6
96-9
7
97-9
8
98-9
9
99-0
0
00-0
1
01-0
2
02-0
3
03-0
4
04-0
5
05-0
6
06-0
7
07-0
8
08-0
9
09-1
0
10-1
1
11-1
2
12-1
3
13-1
4
Very
Lo
w <=40 cfu/100mL 41-200 cfu/100mL 201-500 cfu/100mL >500 cfu/100mL
78

Manly Cove Beach Suitability Grade: .G
Manly Cove is a netted swimming enclosure near the centre of the 250 metre long beach that stretches to the west of the Manly Ferry Terminal. The beach is backed by a walking track and park.
The Beach Suitability Grade of Good indicates that microbial water quality is suitable for swimming most of the time but the water may be susceptible to pollution from a number of minor sources of faecal contamination.
The response to rainfall graph indicates that enterococci levels generally increased with increasing rainfall, frequently exceeding the safe swimming limit in response to 20 mm of rainfall or more.
The site has been monitored since 1994. Microbial water quality has generally improved since 2000–2001 owing to licensing of discharges from the sewerage system and improved management of stormwater.
See ‘How to read this report’ for key to map
Sanitary Inspection: Moderate Microbial Assessment: B SSourourcce:e: VVereryy LoLoww LowLow ModerModeratatee HHigighh Monitoring period for 2013–14 result is December 2011 to April 2014.
Hig
h ^ 600
18 2210 40 45
D500
400 C
300
200 B
95th
%ile
En
tero
cocc
i cfu
/100
mL
Mic
robi
al A
sses
smen
tCa
tego
ry
100 A0
2009-10 2010-11 2011-12 2012-13 2013-14
Response to rainfall Rainfall from Manly rain gauge
10000
0 0.1–4.9 5–9.9 10–19.9 20+
Ente
roco
cci (
cfu/
100m
L)
1000
100
10
1
24-hour rainfall (mm)Mod
erat
e
Trends in enterococci data through time 100%
% E
nter
ococ
ci s
ampl
es 80%
60%
40%
20%
0%
Low Boats
North Harbour
Sewer Chokes Sewage Overflows
Bathers
Toilet Facilities
Stormwater
94-9
5
95-9
6
96-9
7
97-9
8
98-9
9
99-0
0
00-0
1
01-0
2
02-0
3
03-0
4
04-0
5
05-0
6
06-0
7
07-0
8
08-0
9
09-1
0
10-1
1
11-1
2
12-1
3
13-1
4
Very
Lo
w <=40 cfu/100mL 41-200 cfu/100mL 201-500 cfu/100mL >500 cfu/100mL
79
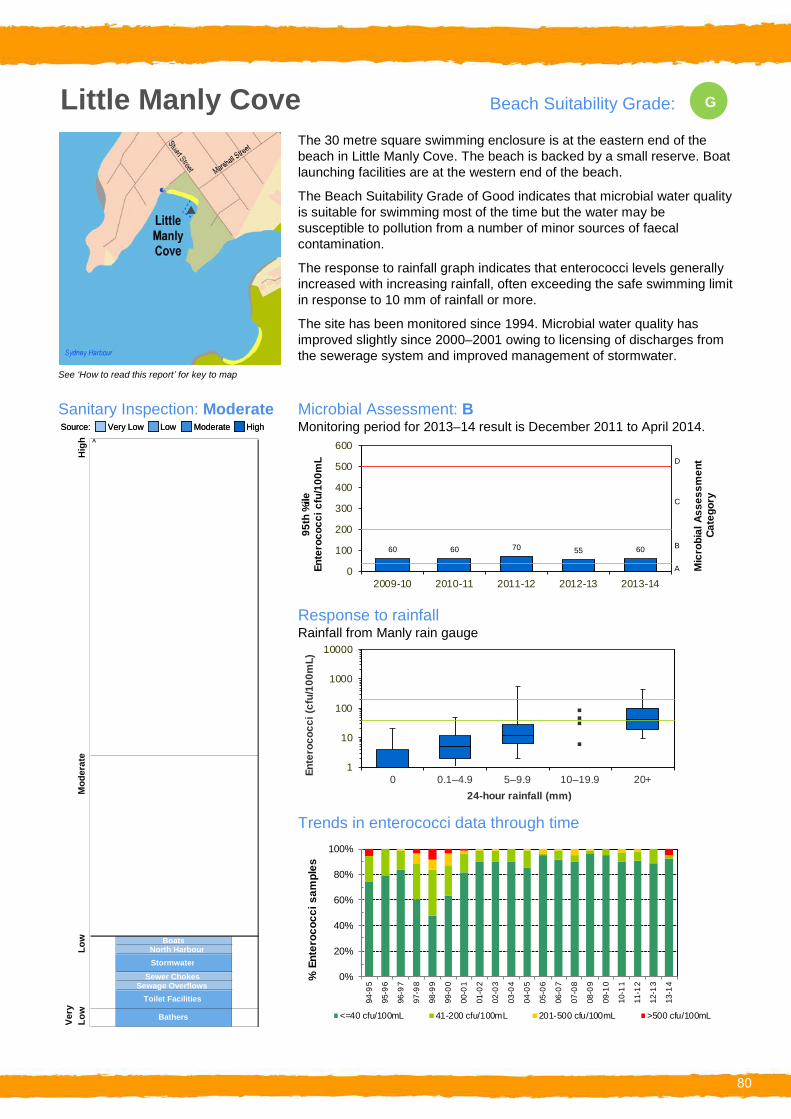
Little Manly Cove Beach Suitability Grade: .G
The 30 metre square swimming enclosure is at the eastern end of the beach in Little Manly Cove. The beach is backed by a small reserve. Boat launching facilities are at the western end of the beach.
The Beach Suitability Grade of Good indicates that microbial water quality is suitable for swimming most of the time but the water may be susceptible to pollution from a number of minor sources of faecal contamination.
The response to rainfall graph indicates that enterococci levels generally increased with increasing rainfall, often exceeding the safe swimming limit in response to 10 mm of rainfall or more.
The site has been monitored since 1994. Microbial water quality has improved slightly since 2000–2001 owing to licensing of discharges from the sewerage system and improved management of stormwater.
See ‘How to read this report’ for key to map
Sanitary Inspection: Moderate Microbial Assessment: B SSourourcce:e: VVereryy LoLoww LowLow ModerModeratatee HHigighh Monitoring period for 2013–14 result is December 2011 to April 2014.
Hig
h ^ 600
60 60 55 6070
D500
400 C
300
20095th
%ile
En
tero
cocc
i cfu
/100
mL
Mic
robi
al A
sses
smen
tCa
tego
ry
B100 A0
2009-10 2010-11 2011-12 2012-13 2013-14
Response to rainfall Rainfall from Manly rain gauge
10000
0 0.1–4.9 5–9.9 10–19.9 20+
Ente
roco
cci (
cfu/
100m
L)
1000
100
10
1
24-hour rainfall (mm)Mod
erat
e
Trends in enterococci data through time 100%
% E
nter
ococ
ci s
ampl
es 80%
60%
40%
20%
0%
Low Boats
North Harbour
Sewer Chokes Sewage Overflows
Bathers
Toilet Facilities
Stormwater
94-9
5
95-9
6
96-9
7
97-9
8
98-9
9
99-0
0
00-0
1
01-0
2
02-0
3
03-0
4
04-0
5
05-0
6
06-0
7
07-0
8
08-0
9
09-1
0
10-1
1
11-1
2
12-1
3
13-1
4
Very
Lo
w <=40 cfu/100mL 41-200 cfu/100mL 201-500 cfu/100mL >500 cfu/100mL
80

– – – –
Southern Sydney (Sutherland and Southern Harbours) State of the Beaches 2013–2014
Overall results Percentage of sites graded as Good or Very Good:
68% 2010 11
64% 2011 12
75% 2012 13
89% 2013 14
Twenty-five of the 28 swimming sites in Bate Bay, Botany Bay, lower Georges River and Port Hacking were graded as Very Good or Good in 2013–2014, an improvement on results from previous years.
Ocean beaches
Good / Very Good Fair Poor / Very Poor
Seven of the eight ocean beaches in Bate Bay were graded as Very Good or Good.
Greenhills Beach, Wanda beach, Eleoura beach, North Cronulla Beach, Shelly Beach and Oak Park were graded as Very Good. These sites all had excellent water quality and were suitable for swimming almost all of the time.
South Cronulla was graded as Good. Microbial water quality was suitable for swimming most of the time, with enterococci levels rarely exceeding the safe swimming limit.
Boat Harbour was classified as Poor. While microbial water quality was generally suitable for swimming for up to 75 per cent of the time, elevated enterococci levels were occasionally measured during dry weather conditions and following low levels of rainfall.
In November 2013, Beachwatch commenced intensive sampling of Boat Harbour to investigate the potential source of pollution, including a small creek located at the north corner of the beach, and groundwater. Results indicate that the microbial contamination in Boat Harbour is originating from the creek. Sources of contamination within the creek’s catchment are being investigated.
Best beaches Greenhills Beach, Wanda Beach, Eleoura Beach, North Cronulla Beach, Shelly Beach Oak Park, Jibbon Beach and Congwong Bay
These sites had excellent water quality and were suitable for swimming almost all of the time.
28 sites
every 6 days*
1153 samples
year round*
* Beachwatch samples the ocean beaches every sixth day throughout the year, and estuarine beaches every sixth day between October and April, and monthly from May to September.
8
20
8 Ocean Beaches
20 Estuarine Sites
No Lake/Lagoon Sites
No Ocean Baths
See How to Read this Report for explanations of graphs and Beach
Suitability Grades.
81

Estuarine beaches
Good / Very Good Fair Poor / Very Poor
Jibbon Beach in Port Hacking and Congwong Bay in Botany Bay were graded as Very Good. These sites had excellent water quality and were suitable for swimming almost all of the time.
Sixteen of the 20 estuarine beaches were graded as Good: Silver Beach, Como Baths, Jew Fish Bay Baths, Oatley Bay Baths, Carss Point Baths, Sandringham Baths, Dolls Point Baths, Ramsgate Baths, Monterey Baths, Brighton-Le-Sands Baths, Kyeemagh Baths, Yarra Bay and Frenchmans Bay in Botany Bay and lower Georges River, and Hordens Beach, Lilli Pilli Baths and Gunnamatta Bay Baths in Port Hacking. These sites had mostly good water quality, although elevated enterococci levels were recorded following rainfall. Four sites showed much improvement, and were upgraded to Good in 2013–2014: Oatley Bay Baths (from Poor in 2012–2013) and Carrs Point Baths (from Fair in 2013–2014) in lower Georges River; Kyeemagh Baths (from Fair in 2012–2013) in Botany Bay and Hordens Beach (from Poor in 2012–2013) in Port Hacking.
Gymea Bay Baths in Port Hacking was graded as Poor. Water quality was suitable for swimming during dry weather only, with elevated enterococci levels frequently measured following light rainfall.
As a precaution, swimming should be avoided at sites in Botany Bay, lower Georges River and Port Hacking during and for up to three days following rainfall or if there are signs of stormwater pollution, such as discoloured water or floating debris.
Foreshores Beach was graded as Very Poor. Although microbial water quality was often suitable for swimming during dry weather conditions, the site is very susceptible to faecal contamination from the sewage overflows which discharge into Mill Pond Creek. To reduce the risk of contracting swimming related illnesses at this site, carefully follow the pollution advisories in the Beachwatch Pollution Forecast (www.environment.nsw.gov.au/beach), avoid swimming during and up to three days following light rainfall, of if there are signs of pollution such as discoloured water, odour or floating debris.
Signficant pollution incidents In November 2013 a major sewage overflow event occurred from the Glenfield Wastewater Treatment Plant, with around 150 million litres of untreated wastewater discharging to Bunbury Curran Creek, which flows to the Georges River. Water quality testing showed that the impacted area extended to Chipping Norton Lakes and a health warning was in place for the Georges River to Botany Bay for the duration of the event. In addition to requiring a thorough clean-up at the time, the Environment Protection Authority investigation of the incident is on-going.
Management Ocean beaches To reduce the incidence of wet weather sewage overflows in beach catchments across the Cronulla Peninsula, Sydney Water has amplified sewer pipes and pumps and included storage tanks.
Sydney Water has inspected, cleaned and repaired sewer mains that have a high likelihood of discharging sewage to waterways if they become blocked. When significant tree root intrusion to the public sewer from the private sewer was identified, property owners were requested to remedy the problem.
Sutherland Shire Council has installed more than 20 systems to improve stormwater quality, including artificial wetlands, gross pollutant traps, continuous deflective separators and natural sand drainage systems. It has also undertaken education programs, drain stencilling and water quality monitoring of the drainage system.
Botany Bay and lower Georges River To reduce the incidence of wet weather sewage overflows in the catchments of Lime Kiln Bay, Jew Fish Bay, Gungal Bay, Oatley Bay and Neverfail Bay, Sydney Water has increased the capacity of sewer pipes and pumps and included storage tanks.
82

Sydney Water has inspected, cleaned and repaired sewer mains that have a high likelihood of discharging sewage to waterways if they become blocked in the catchment of Brighton-Le-Sands and Oatley Bay Baths. When significant tree root intrusion to the public sewer from the private sewer was identified, property owners were requested to remedy the problem.
Sydney Water operates seven gross pollutant traps across the Botany Wetlands and Penrhyn Estuary that prevent about 630 tonnes of sediment and floating debris from entering the Botany Bay and Foreshores Beach each year. A boom at Carss Park prevents about 20 cubic metres of floating debris from entering Carss Point Baths each year.
Randwick City Council recently completed the installation of a jointly funded stormwater harvesting system in Bicentennial Park which captures approximately 27 mega litres of stormwater from Phillip Bay catchment per year for treatment and reuse. This water is used to irrigate the surrounding parks and vegetation, significantly reducing the amount of stormwater entering Yarra Bay.
A stormwater harvesting system operates at Little Bay collecting up to 40 megalitres per year for re-use to the surrounding landscaped areas located in the Prince Henry development.
Randwick City Council maintains a total of 16 gross pollutant traps along its coastline on stormwater lines leading to the local bays, which are all cleaned as necessary. There is also a systematic cleaning program for all drainage pits including a regular street sweeping program which assists with reducing stormwater pollution to the local bays.
Kogarah City Council is in the process of designing and constructing a stormwater harvesting plant in Carlton. Water from the plant will be used at Council’s works depot for irrigation, vehicle wash-down, street sweeping and other uses. The system may be expanded to supply local industry and irrigation systems within the area. This will reduce stormwater entering Kogarah Bay, improving water quality.
Kogarah City Council also continues to develop water sensitive urban design projects, including the recent completion of a greenroof on its new customer service centre. This project not only treats and reduces stormwater, but provides a green space and habitat for organisms within the urban environment.
Rockdale Council completed a comprehensive water quality program across 17 sites. Parameters monitored included nutrients, turbidity, heavy metals and sewage bacteria. The report identified stormwater as a significant source of pollution and a number of actions to reduce water pollution are currently being assessed for implementation.
Rockdale Council has installed a large gross pollutant trap at Wolli Creek to remove floating debris entering Cooks River and then Botany Bay. Council is also in the planning stages to upgrade aerators at Scarborough Ponds to improve the habitat value of these ponds for fish and the installation of floating reed beds in Bicentennial Ponds to remove excess nutrients before they reach Botany Bay.
Hurstville Council implemented the Peakhurst Light Industrial Stormwater Harvesting and Re-use Scheme in February 2014. This project involved the installation of stormwater harvesting, treatment and re-use infrastructure to provide irrigation at Hurstville Golf Course. The treatment includes a gross pollutant trap, bioretention system, storage pond, filtration and UV disinfection. The project will capture and re-use 51 megalitres of stormwater each year, improve water quality draining to Lime Kiln Bay and the Georges River, and reduce stormwater runoff discharged to the Georges River. Improvement works are also being conducted at the constructed Lime Kiln Bay wetlands which are designed to treat stormwater. A new hydraulic pathway is being installed to increase residence time of water in the sedimentation ponds, and improve circulation and dissolved oxygen levels. This project will ultimately improve the quality of stormwater discharged from the wetlands into the Georges River.
Sutherland Shire Council’s stormwater levy funds projects such as the installation of pipes, drains and stormwater quality improvement devices, as well as riparian revegetation works to alleviate flooding and improve water quality in creeks and rivers. The levy also funds stormwater infrastructure maintenance.
Port Hacking There are 430 registered on-site sewage management systems in the Port Hacking catchment. The majority of these systems dispose of sewage by pumping it to the sewer main. Sutherland Shire Council inspects these systems to ensure they are operating correctly and to identify risks to human health or the environment.
To reduce the incidence of wet weather sewage overflows in the catchments of Gunnamatta Bay Baths, Sydney Water has amplified pipes and pumps and included storage tanks across the Cronulla Peninsula.
Sydney Water has inspected, cleaned and repaired sewer mains on the northern side of Port Hacking that have a high
83

likelihood of discharging sewage to waterways if they become blocked. When significant tree root intrusion to the public sewer from the private sewer was identified, property owners were requested to remedy the problem.
The Hacking River Stormwater Management Plan was developed by Wollongong and Sutherland councils and identifies and prioritises actions to improve stormwater quality and reduce flooding in the Port Hacking catchment.
Sutherland Shire Council is implementing a sewage pump-out system at Wally’s Wharf. This will enable private vessels to properly dispose of their wastewater. The installation will be completed by August 2014.
84

Sampling sites and Beach Suitability Grades at Sydney’s Southern Beaches
85

Sampling sites and Beach Suitability Grades in Botany Bay and lower Georges River
86

Sampling locations and Beach Suitability Grades in Port Hacking
87
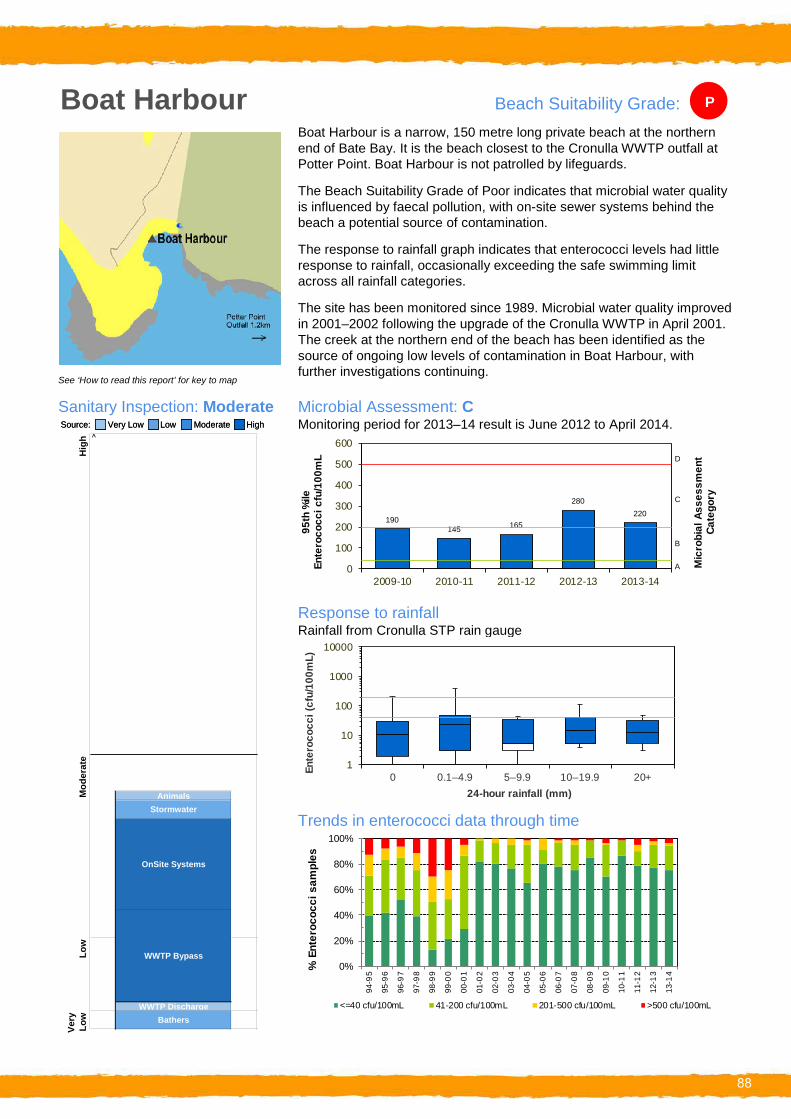
Boat Harbour Beach Suitability Grade: .P
Boat Harbour is a narrow, 150 metre long private beach at the northern end of Bate Bay. It is the beach closest to the Cronulla WWTP outfall at Potter Point. Boat Harbour is not patrolled by lifeguards.
The Beach Suitability Grade of Poor indicates that microbial water quality is influenced by faecal pollution, with on-site sewer systems behind the beach a potential source of contamination.
The response to rainfall graph indicates that enterococci levels had little response to rainfall, occasionally exceeding the safe swimming limit across all rainfall categories.
The site has been monitored since 1989. Microbial water quality improved in 2001–2002 following the upgrade of the Cronulla WWTP in April 2001. The creek at the northern end of the beach has been identified as the source of ongoing low levels of contamination in Boat Harbour, with further investigations continuing.
Sanitary Inspection: Moderate Microbial Assessment: C SSourourcce:e: VVereryy LoLoww LowLow ModerModeratatee HHigighh Monitoring period for 2013–14 result is June 2012 to April 2014.
See ‘How to read this report’ for key to map
^ 600
Very
Low
Low
M
oder
ate
Hig
h
190 145 165
280 220
2009-10 2010-11 2011-12 2012-13 2013-14
95th
%ile
En
tero
cocc
i cfu
/100
mL D500
400
Mic
robi
al A
sses
smen
tCa
tego
ry
C300
200 B100
A0
Response to rainfall Rainfall from Cronulla STP rain gauge
10000
0 0.1–4.9 5–9.9 10–19.9 20+
Ente
roco
cci (
cfu/
100m
L)
1000
100
10
1
WWTP Discharge Bathers
24-hour rainfall (mm)Animals
WWTP Bypass
OnSite Systems
Stormwater Trends in enterococci data through time
100%
% E
nter
ococ
ci s
ampl
es 80%
60%
40%
20%
0%
94-9
5
95-9
6
96-9
7
97-9
8
98-9
9
99-0
0
00-0
1
01-0
2
02-0
3
03-0
4
04-0
5
05-0
6
06-0
7
07-0
8
08-0
9
09-1
0
10-1
1
11-1
2
12-1
3
13-1
4
<=40 cfu/100mL 41-200 cfu/100mL 201-500 cfu/100mL >500 cfu/100mL
88

.
Greenhills Beach Beach Suitability Grade: VG
See ‘How to read this report’ for key to map
Sanitary Inspection: Low SSourourcce:e: VVereryy LoLoww LowLow ModerModeratatee HHigighh
Greenhills Beach is three kilometres long and situated at the northern end of Bate Bay. Merries Reef protects the beach at the north end from the larger waves and rips common at the southern end. The beach is not patrolled.
The Beach Suitability Grade of Very Good indicates that microbial water quality is suitable for swimming almost all of the time, with few potential sources of faecal contamination.
The response to rainfall graph indicates that enterococci levels had little response to rainfall and generally remained below the safe swimming limit across all rainfall categories.
The site has been monitored since 1989. Microbial water quality improved in 2001–2002 following the upgrade of the Cronulla WWTP in April 2001. Since then, small variations between years have been due to rainfall patterns.
Microbial Assessment: A Monitoring period for 2013–14 result is June 2012 to April 2014.
Very
Low
Low
M
oder
ate
Hig
h ^
20 28 30 24 9 0
100
200
300
400
500
600
95th
%ile
En
tero
cocc
i cfu
/100
mL
A
B
C
D
Mic
robi
al A
sses
smen
tCa
tego
ry
2009-10 2010-11 2011-12 2012-13 2013-14
Response to rainfall Rainfall from Cronulla STP rain gauge
10000
Ente
roco
cci (
cfu/
100m
L)
1000
100
10
1
24-hour rainfall (mm) 0 0.1–4.9 5–9.9 10–19.9 20+
Trends in enterococci data through time 100%
% E
nter
ococ
ci s
ampl
es 80%
60%
40%
20%
0% Animals
Bathers
WWTP Bypass 94-9
5
95-9
6
96-9
7
97-9
8
98-9
9
99-0
0
00-0
1
01-0
2
02-0
3
03-0
4
04-0
5
05-0
6
06-0
7
07-0
8
08-0
9
09-1
0
10-1
1
11-1
2
12-1
3
13-1
4
<=40 cfu/100mL 41-200 cfu/100mL 201-500 cfu/100mL >500 cfu/100mL
89
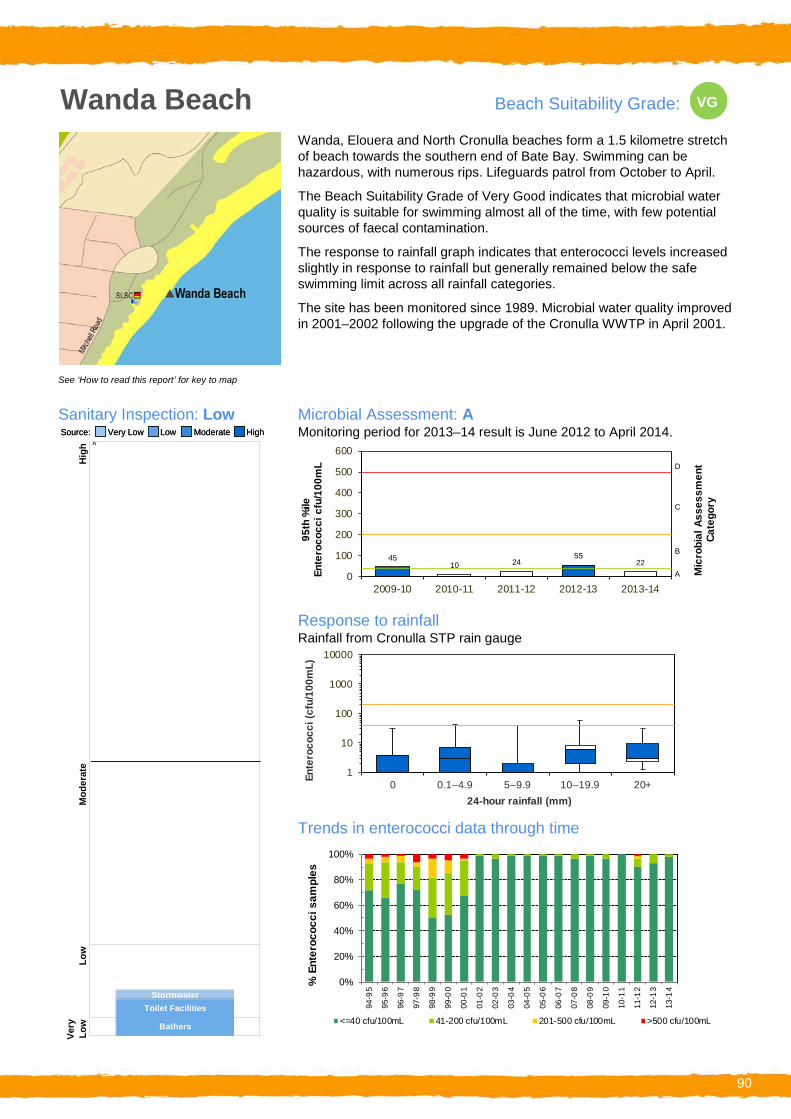
.
Wanda Beach
See ‘How to read this report’ for key to map
Sanitary Inspection: Low SSourourcce:e: VVereryy LoLoww LowLow ModerModeratatee HHigighh
Beach Suitability Grade: VG
Wanda, Elouera and North Cronulla beaches form a 1.5 kilometre stretch of beach towards the southern end of Bate Bay. Swimming can be hazardous, with numerous rips. Lifeguards patrol from October to April.
The Beach Suitability Grade of Very Good indicates that microbial water quality is suitable for swimming almost all of the time, with few potential sources of faecal contamination.
The response to rainfall graph indicates that enterococci levels increased slightly in response to rainfall but generally remained below the safe swimming limit across all rainfall categories.
The site has been monitored since 1989. Microbial water quality improved in 2001–2002 following the upgrade of the Cronulla WWTP in April 2001.
Microbial Assessment: A Monitoring period for 2013–14 result is June 2012 to April 2014.
Very
Low
Low
M
oder
ate
Hig
h ^
45 10 24
55 22
0
100
200
300
400
500
600
95th
%ile
En
tero
cocc
i cfu
/100
mL
A
B
C
D
Mic
robi
al A
sses
smen
tCa
tego
ry
2009-10 2010-11 2011-12 2012-13 2013-14
Response to rainfall Rainfall from Cronulla STP rain gauge
10000
Ente
roco
cci (
cfu/
100m
L)
1000
100
10
1
24-hour rainfall (mm) 0 0.1–4.9 5–9.9 10–19.9 20+
Trends in enterococci data through time 100%
% E
nter
ococ
ci s
ampl
es 80%
60%
40%
20%
0% Stormwater
Bathers
Toilet Facilities 94-9
5
95-9
6
96-9
7
97-9
8
98-9
9
99-0
0
00-0
1
01-0
2
02-0
3
03-0
4
04-0
5
05-0
6
06-0
7
07-0
8
08-0
9
09-1
0
10-1
1
11-1
2
12-1
3
13-1
4
<=40 cfu/100mL 41-200 cfu/100mL 201-500 cfu/100mL >500 cfu/100mL
90

.
Elouera Beach
See ‘How to read this report’ for key to map
Sanitary Inspection: Low SSourourcce:e: VVereryy LoLoww LowLow ModerModeratatee HHigighh
Beach Suitability Grade: VG
Wanda, Elouera and North Cronulla beaches form a 1.5 kilometre stretch of beach towards the southern end of Bate Bay. Swimming can be hazardous, with numerous rips, and lifeguards patrol the beach from October to April.
The Beach Suitability Grade of Very Good indicates that microbial water quality is suitable for swimming almost all of the time, with few potential sources of faecal contamination.
The response to rainfall graph indicates that enterococci levels had little response to rainfall and generally remained below the safe swimming limit across all rainfall categories.
The site has been monitored since 1989. Microbial water quality improved in 2001–2002 following the upgrade of the Cronulla WWTP in April 2001.
Microbial Assessment: A Monitoring period for 2013–14 result is June 2012 to April 2014.
Very
Low
Low
M
oder
ate
Hig
h ^ 600
40 10
45 60 16
A
B
C
D
Mic
robi
al A
sses
smen
tCa
tego
ry
95th
%ile
En
tero
cocc
i cfu
/100
mL 500
400
300
200
100
0 2009-10 2010-11 2011-12 2012-13 2013-14
Response to rainfall Rainfall from Cronulla STP rain gauge
10000
0 0.1–4.9 5–9.9 10–19.9 20+
Ente
roco
cci (
cfu/
100m
L)
1000
100
10
1
24-hour rainfall (mm)
Trends in enterococci data through time 100%
% E
nter
ococ
ci s
ampl
es 80%
60%
40%
20%
0%
Bathers
Toilet Facilities 94-9
5
95-9
6
96-9
7
97-9
8
98-9
9
99-0
0
00-0
1
01-0
2
02-0
3
03-0
4
04-0
5
05-0
6
06-0
7
07-0
8
08-0
9
09-1
0
10-1
1
11-1
2
12-1
3
13-1
4
<=40 cfu/100mL 41-200 cfu/100mL 201-500 cfu/100mL >500 cfu/100mL
91

:
North Cronulla Beach Beach Suitability Grade: VG
See ‘How to read this report’ for key to map
Sanitary Inspection: Low SSourourcce:e: VVereryy LoLoww LowLow ModerModeratatee HHigighh
North Cronulla Beach is at the southern end of a 1.5 kilometre stretch of beach in Bate Bay. Swimming can be hazardous, with numerous rips. Lifeguards patrol the beach all year round.
The Beach Suitability Grade of Very Good indicates that microbial water quality is suitable for swimming almost all of the time, with few potential sources of faecal contamination.
The response to rainfall graph indicates that enterococci levels increased slightly in response to increasing rainfall, often exceeding the safe swimming limit in response to 20 mm or more of rainfall.
The site has been monitored since 1989. Microbial water quality improved in 2001–2002 following the upgrade of the Cronulla WWTP in April 2001.
Microbial Assessment: A Monitoring period for 2013–14 result is June 2012 to April 2014.
Very
Low
Low
M
oder
ate
Hig
h ^ 600
45 28
105 60 40
A
B
C
D
Mic
robi
al A
sses
smen
tCa
tego
ry
95th
%ile
En
tero
cocc
i cfu
/100
mL 500
400
300
200
100
0 2009-10 2010-11 2011-12 2012-13 2013-14
Response to rainfall Rainfall from Cronulla STP rain gauge
10000
0 0.1–4.9 5–9.9 10–19.9 20+
Ente
roco
cci (
cfu/
100m
L)
1000
100
10
1
24-hour rainfall (mm)
Trends in enterococci data through time 100%
% E
nter
ococ
ci s
ampl
es 80%
60%
40%
20%
0%
Bathers
Toilet Facilities
Stormwater
94-9
5
95-9
6
96-9
7
97-9
8
98-9
9
99-0
0
00-0
1
01-0
2
02-0
3
03-0
4
04-0
5
05-0
6
06-0
7
07-0
8
08-0
9
09-1
0
10-1
1
11-1
2
12-1
3
13-1
4
<=40 cfu/100mL 41-200 cfu/100mL 201-500 cfu/100mL >500 cfu/100mL
92
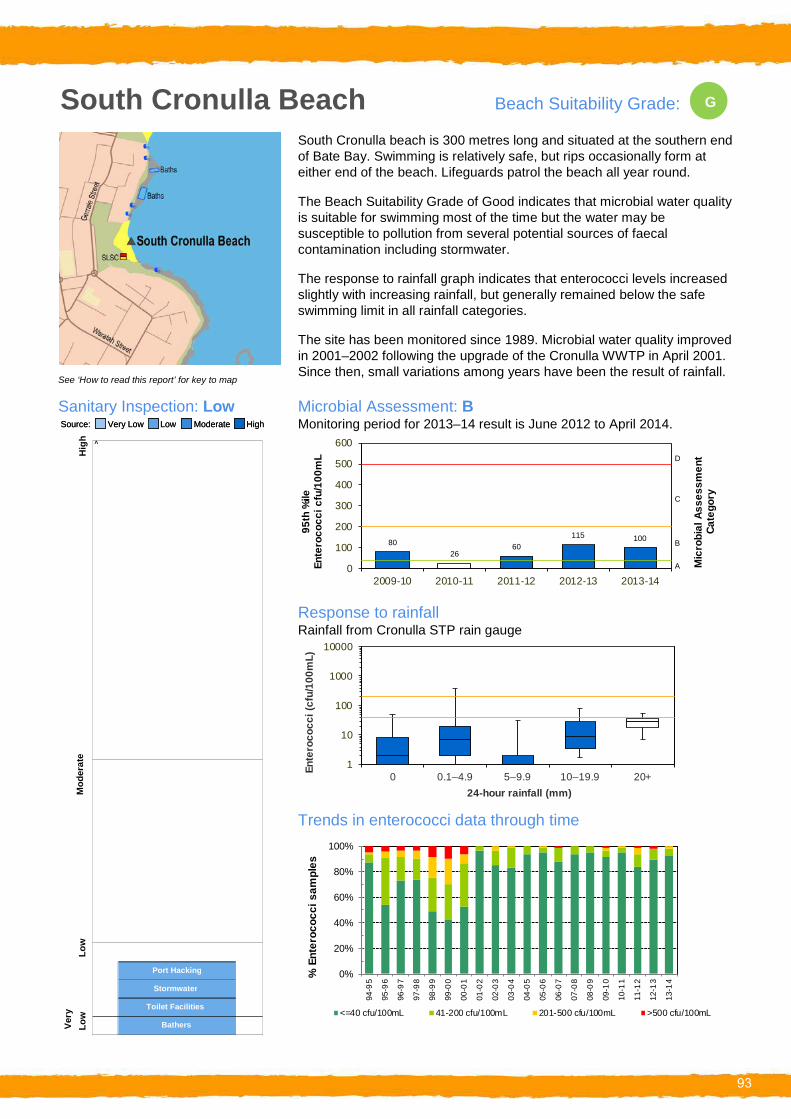
.
South Cronulla Beach Beach Suitability Grade: G
See ‘How to read this report’ for key to map
Sanitary Inspection: Low SSourourcce:e: VVereryy LoLoww LowLow ModerModeratatee HHigighh
South Cronulla beach is 300 metres long and situated at the southern end of Bate Bay. Swimming is relatively safe, but rips occasionally form at either end of the beach. Lifeguards patrol the beach all year round.
The Beach Suitability Grade of Good indicates that microbial water quality is suitable for swimming most of the time but the water may be susceptible to pollution from several potential sources of faecal contamination including stormwater.
The response to rainfall graph indicates that enterococci levels increased slightly with increasing rainfall, but generally remained below the safe swimming limit in all rainfall categories.
The site has been monitored since 1989. Microbial water quality improved in 2001–2002 following the upgrade of the Cronulla WWTP in April 2001. Since then, small variations among years have been the result of rainfall.
Microbial Assessment: B Monitoring period for 2013–14 result is June 2012 to April 2014.
Hig
h ^ 600
95th
%ile
En
tero
cocc
i cfu
/100
mL
80 26
60 115 100
D500
400 C
300
200
Mic
robi
al A
sses
smen
tCa
tego
ry
100 B
A0 2009-10 2010-11 2011-12 2012-13 2013-14
Response to rainfall Rainfall from Cronulla STP rain gauge
10000
Ente
roco
cci (
cfu/
100m
L)
0 0.1–4.9 5–9.9 10–19.9 20+
1000
100
10
1
24-hour rainfall (mm)Mod
erat
e
Trends in enterococci data through time 100%
% E
nter
ococ
ci s
ampl
es 80%
60%
40%
20%
0%
Low
Ve
ry
Low
Port Hacking
Bathers
Toilet Facilities
Stormwater
94-9
5
95-9
6
96-9
7
97-9
8
98-9
9
99-0
0
00-0
1
01-0
2
02-0
3
03-0
4
04-0
5
05-0
6
06-0
7
07-0
8
08-0
9
09-1
0
10-1
1
11-1
2
12-1
3
13-1
4
<=40 cfu/100mL 41-200 cfu/100mL 201-500 cfu/100mL >500 cfu/100mL
93
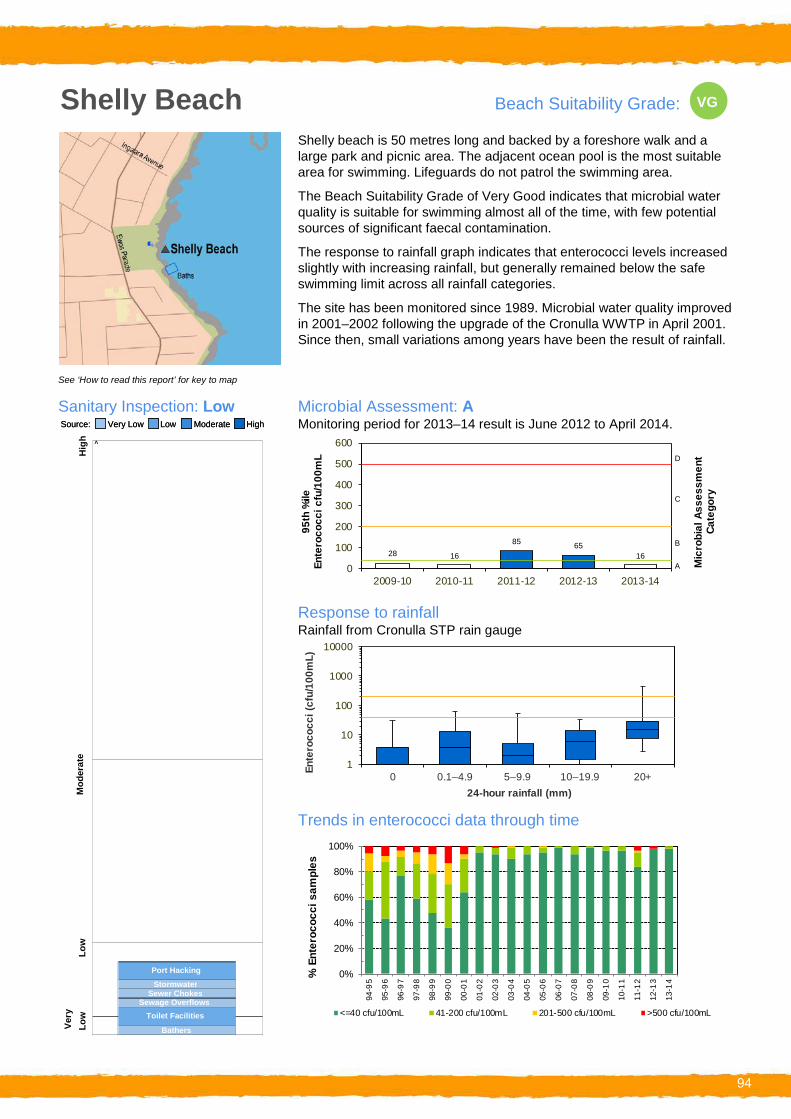
.
Shelly Beach
See ‘How to read this report’ for key to map
Sanitary Inspection: Low SSourourcce:e: VVereryy LoLoww LowLow ModerModeratatee HHigighh
Beach Suitability Grade: VG
Shelly beach is 50 metres long and backed by a foreshore walk and a large park and picnic area. The adjacent ocean pool is the most suitable area for swimming. Lifeguards do not patrol the swimming area.
The Beach Suitability Grade of Very Good indicates that microbial water quality is suitable for swimming almost all of the time, with few potential sources of significant faecal contamination.
The response to rainfall graph indicates that enterococci levels increased slightly with increasing rainfall, but generally remained below the safe swimming limit across all rainfall categories.
The site has been monitored since 1989. Microbial water quality improved in 2001–2002 following the upgrade of the Cronulla WWTP in April 2001. Since then, small variations among years have been the result of rainfall.
Microbial Assessment: A Monitoring period for 2013–14 result is June 2012 to April 2014.
Hig
h ^ 600
95th
%ile
En
tero
cocc
i cfu
/100
mL
28 16
85 65 16
D500
400 C
300
200
Mic
robi
al A
sses
smen
tCa
tego
ry
100 B
A0 2009-10 2010-11 2011-12 2012-13 2013-14
Response to rainfall Rainfall from Cronulla STP rain gauge
10000
Ente
roco
cci (
cfu/
100m
L)
0 0.1–4.9 5–9.9 10–19.9 20+
1000
100
10
1
24-hour rainfall (mm)Mod
erat
e
Trends in enterococci data through time 100%
% E
nter
ococ
ci s
ampl
es 80%
60%
40%
20%
0%
Low
Ve
ry
Low
Stormwater Sewer Chokes
Sewage Overflows
Bathers
Toilet Facilities
Port Hacking
94-9
5
95-9
6
96-9
7
97-9
8
98-9
9
99-0
0
00-0
1
01-0
2
02-0
3
03-0
4
04-0
5
05-0
6
06-0
7
07-0
8
08-0
9
09-1
0
10-1
1
11-1
2
12-1
3
13-1
4
<=40 cfu/100mL 41-200 cfu/100mL 201-500 cfu/100mL >500 cfu/100mL
94
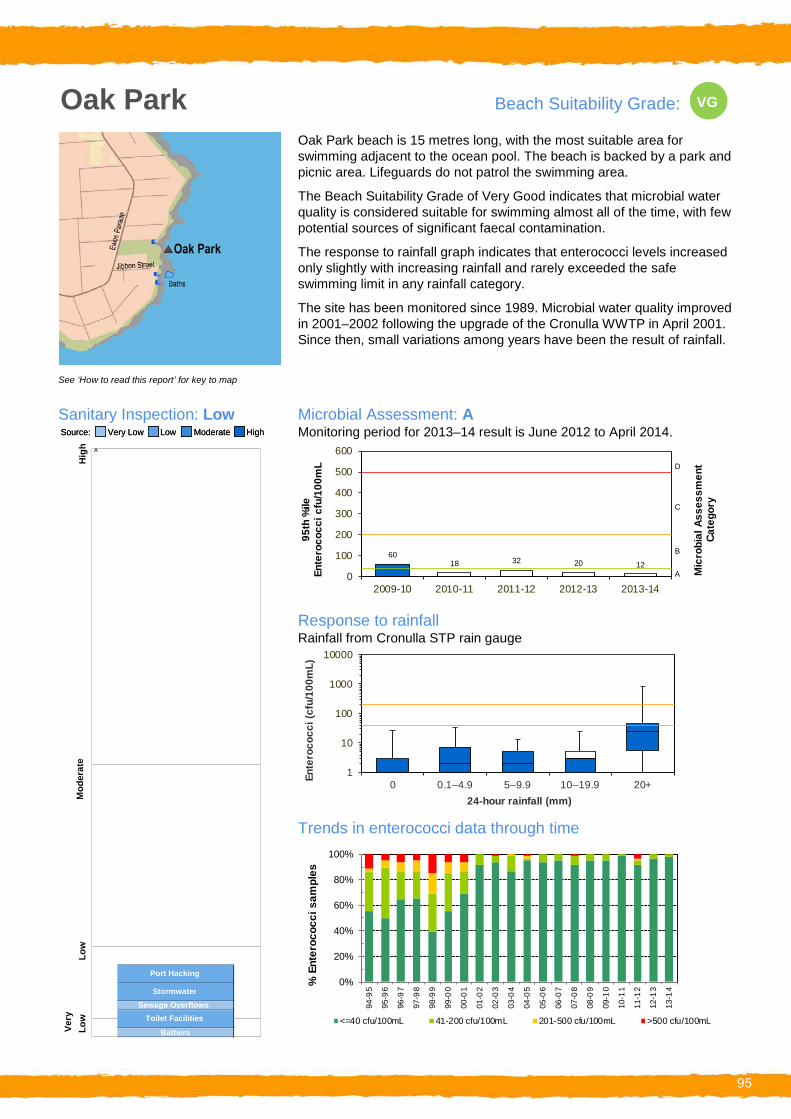
.
Oak Park
See ‘How to read this report’ for key to map
Sanitary Inspection: Low SSourourcce:e: VVereryy LoLoww LowLow ModerModeratatee HHigighh
Beach Suitability Grade: VG
Oak Park beach is 15 metres long, with the most suitable area for swimming adjacent to the ocean pool. The beach is backed by a park and picnic area. Lifeguards do not patrol the swimming area.
The Beach Suitability Grade of Very Good indicates that microbial water quality is considered suitable for swimming almost all of the time, with few potential sources of significant faecal contamination.
The response to rainfall graph indicates that enterococci levels increased only slightly with increasing rainfall and rarely exceeded the safe swimming limit in any rainfall category.
The site has been monitored since 1989. Microbial water quality improved in 2001–2002 following the upgrade of the Cronulla WWTP in April 2001. Since then, small variations among years have been the result of rainfall.
Microbial Assessment: A Monitoring period for 2013–14 result is June 2012 to April 2014.
Hig
h ^ 600
95th
%ile
En
tero
cocc
i cfu
/100
mL
60 18 20 1232
D500
400 C
300
200
Mic
robi
al A
sses
smen
tCa
tego
ry
100 B
A0 2009-10 2010-11 2011-12 2012-13 2013-14
Response to rainfall Rainfall from Cronulla STP rain gauge
10000
Ente
roco
cci (
cfu/
100m
L)
0 0.1–4.9 5–9.9 10–19.9 20+
1000
100
10
1
24-hour rainfall (mm)Mod
erat
e
Trends in enterococci data through time 100%
% E
nter
ococ
ci s
ampl
es 80%
60%
40%
20%
0%
Low
Ve
ry
Low
Sewage Overflows
Bathers
Toilet Facilities
Stormwater
Port Hacking
94-9
5
95-9
6
96-9
7
97-9
8
98-9
9
99-0
0
00-0
1
01-0
2
02-0
3
03-0
4
04-0
5
05-0
6
06-0
7
07-0
8
08-0
9
09-1
0
10-1
1
11-1
2
12-1
3
13-1
4
<=40 cfu/100mL 41-200 cfu/100mL 201-500 cfu/100mL >500 cfu/100mL
95
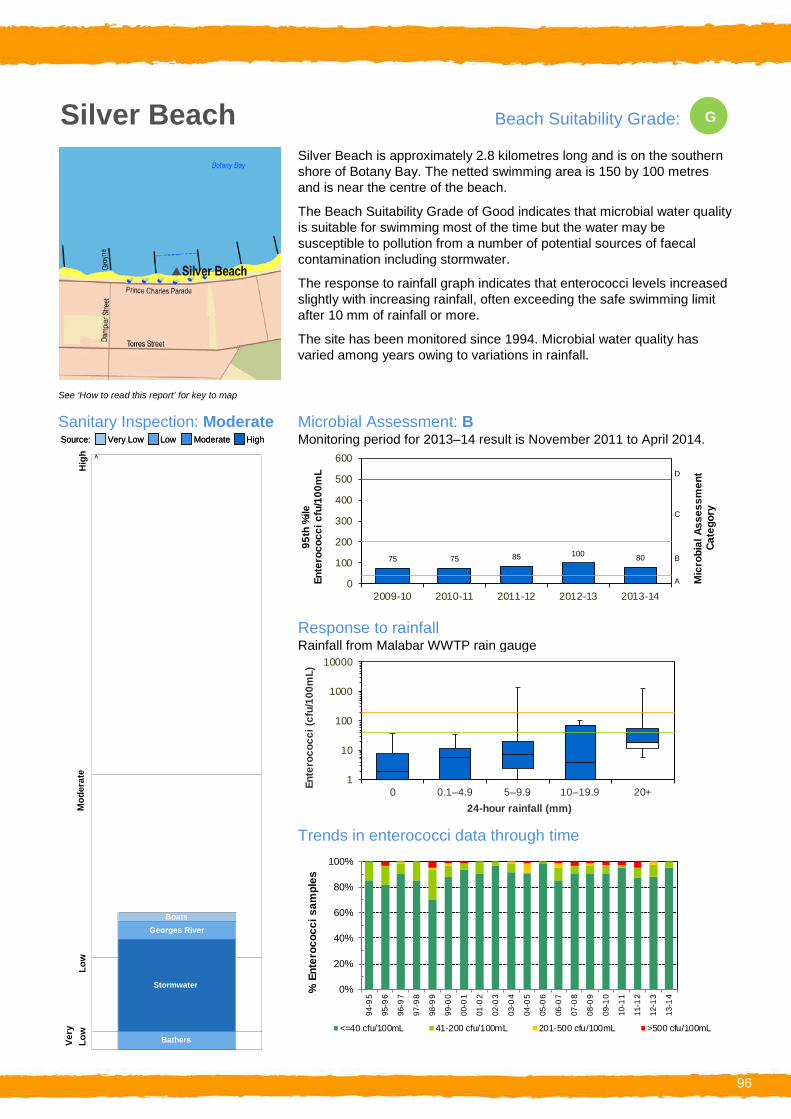
.
Silver Beach
See ‘How to read this report’ for key to map
Sanitary Inspection: Moderate SSourourcce:e: VVereryy LoLoww LowLow ModerModeratatee HHigighh
Beach Suitability Grade: G
Silver Beach is approximately 2.8 kilometres long and is on the southern shore of Botany Bay. The netted swimming area is 150 by 100 metres and is near the centre of the beach.
The Beach Suitability Grade of Good indicates that microbial water quality is suitable for swimming most of the time but the water may be susceptible to pollution from a number of potential sources of faecal contamination including stormwater.
The response to rainfall graph indicates that enterococci levels increased slightly with increasing rainfall, often exceeding the safe swimming limit after 10 mm of rainfall or more.
The site has been monitored since 1994. Microbial water quality has varied among years owing to variations in rainfall.
Microbial Assessment: B Monitoring period for 2013–14 result is November 2011 to April 2014.
Hig
h ^ 600
75 75 85 80100
D500
400 C
300
20095th
%ile
En
tero
cocc
i cfu
/100
mL
Mic
robi
al A
sses
smen
tCa
tego
ry
100 B
A0 2009-10 2010-11 2011-12 2012-13 2013-14
Response to rainfall Rainfall from Malabar WWTP rain gauge
10000
Ente
roco
cci (
cfu/
100m
L)
0 0.1–4.9 5–9.9 10–19.9 20+
1000
100
10
1
24-hour rainfall (mm)Mod
erat
e
Trends in enterococci data through time 100%
% E
nter
ococ
ci s
ampl
es 80%
60%
40%
20%
0%
Boats
Bathers
Stormwater
Georges River
Low
94-9
5
95-9
6
96-9
7
97-9
8
98-9
9
99-0
0
00-0
1
01-0
2
02-0
3
03-0
4
04-0
5
05-0
6
06-0
7
07-0
8
08-0
9
09-1
0
10-1
1
11-1
2
12-1
3
13-1
4
<=40 cfu/100mL 41-200 cfu/100mL 201-500 cfu/100mL >500 cfu/100mL
Very
Lo
w
96

.
Como Baths
See ‘How to read this report’ for key to map
Sanitary Inspection: Moderate SSourourcce:e: VVereryy LoLoww LowLow ModerModeratatee HHigighh
Beach Suitability Grade: G
Como Baths are approximately 25 metres wide and backed by a narrow sandy beach in the lower Georges River. Adjacent to the baths is Como Pleasure Grounds, a heritage-listed park established in the 1880s.
The Beach Suitability Grade of Good indicates that the water quality is safe for swimming most of the time but can be susceptible to pollution after heavy rain, with potential faecal contamination from sources upstream in the Georges River.
The response to rainfall graph indicates that enterococci levels increased with increasing rainfall, frequently exceeding the safe swimming limit in response to 10 mm of rainfall or more.
The site has been monitored since 1994. Microbial water quality has varied among years owing to variations in rainfall.
Microbial Assessment: B Monitoring period for 2013–14 result is November 2011 to April 2014.
Very
Low
Low
Mod
erat
eH
igh ^ 600
210
140
220
130 120
2009-10 2010-11 2011-12 2012-13 2013-14
95th
%ile
En
tero
cocc
i cfu
/100
mL D500
400 C
300
Mic
robi
al A
sses
smen
tCa
tego
ry
200 B100 A0
Response to rainfall Rainfall from Kyle Bay rain gauge
10000
0 0.1–4.9 5–9.9 10–19.9 20+
Ente
roco
cci (
cfu/
100m
L)
1000
100
10
1
24-hour rainfall (mm)
Trends in enterococci data through time 100%
Animals Boats
OnSite Systems
Bathers
Stormwater
River Discharge
Toilet Facilities
Sewage Overflows
Sewer Chokes % E
nter
ococ
ci s
ampl
es 80%
60%
40%
20%
0%
94-9
5
95-9
6
96-9
7
97-9
8
98-9
9
99-0
0
00-0
1
01-0
2
02-0
3
03-0
4
04-0
5
05-0
6
06-0
7
07-0
8
08-0
9
09-1
0
10-1
1
11-1
2
12-1
3
13-1
4
<=40 cfu/100mL 41-200 cfu/100mL 201-500 cfu/100mL >500 cfu/100mL
97

.
Jew Fish Bay Baths Beach Suitability Grade: G
See ‘How to read this report’ for key to map
Sanitary Inspection: Moderate SSourourcce:e: VVereryy LoLoww LowLow ModerModeratatee HHigighh
The baths are a 200 metre long netted swimming area located in Jew Fish Bay in the lower Georges River. The swimming area is backed by a narrow sandy beach and the extensive bushland of Oatley Park.
The Beach Suitability Grade of Good indicates that microbial water quality is suitable for swimming most of the time but the water may be susceptible to pollution from a number of potential sources of faecal contamination including discharge from the Georges River.
The response to rainfall graph indicates that enterococci levels increased with increasing rainfall, regularly exceeding the safe swimming limit in response to 10 mm of rainfall or more.
The site has been monitored since 1994. Microbial water quality has varied among years owing to variations in rainfall.
Microbial Assessment: B Monitoring period for 2013–14 result is November 2011 to April 2014.
Very
Low
Low
M
oder
ate
Hig
h ^
105 130 135
170 155
0
100
200
300
400
500
600
95th
%ile
En
tero
cocc
i cfu
/100
mL
A
B
C
D
Mic
robi
al A
sses
smen
tCa
tego
ry
2009-10 2010-11 2011-12 2012-13 2013-14
Response to rainfall Rainfall from Kyle Bay rain gauge
10000
Ente
roco
cci (
cfu/
100m
L)
0 0.1–4.9 5–9.9 10–19.9 20+
1000
100
10
1
24-hour rainfall (mm)
Trends in enterococci data through time Animals
River Discharge
100%
% E
nter
ococ
ci s
ampl
es 80%
60%
40%
20%
0% Sewer Chokes
Stormwater
Bathers
Toilet Facilities
Sewage Overflows
94-9
5
95-9
6
96-9
7
97-9
8
98-9
9
99-0
0
00-0
1
01-0
2
02-0
3
03-0
4
04-0
5
05-0
6
06-0
7
07-0
8
08-0
9
09-1
0
10-1
1
11-1
2
12-1
3
13-1
4
<=40 cfu/100mL 41-200 cfu/100mL 201-500 cfu/100mL >500 cfu/100mL
98

.
Oatley Bay Baths Beach Suitability Grade: G
See ‘How to read this report’ for key to map
Sanitary Inspection: Moderate SSourourcce:e: VVereryy LoLoww LowLow ModerModeratatee HHigighh
Oatley Bay Baths are located on the western shore of Oatley Bay in the lower Georges River. The netted swimming area is approximately 50 metres long and backed by a small beach and Oatley Pleasure Grounds.
The Beach Suitability Grade of Good indicates that microbial water quality is suitable for swimming most of the time but the water may be susceptible to pollution from a number of potential sources of faecal contamination including discharge from the Georges River.
The response to rainfall graph indicates that enterococci levels increased with increasing rainfall, often exceeding the safe swimming limit after 5mm of rainfall or more.
The site has been monitored since 1994. Microbial water quality has varied among years owing to variations in rainfall.
Microbial Assessment: B Monitoring period for 2013–14 result is November 2011 to April 2014.
Hig
h ^ 600
210 160
260 230
120
2009-10 2010-11 2011-12 2012-13 2013-14
95th
%ile
En
tero
cocc
i cfu
/100
mL D500
400
Mic
robi
al A
sses
smen
tCa
tego
ry
300
200
C
B100 A0
Response to rainfall Rainfall from Kyle Bay rain gauge
10000
Ente
roco
cci (
cfu/
100m
L)
0 0.1–4.9 5–9.9 10–19.9 20+
1000
100
10
1
24-hour rainfall (mm)Mod
erat
eLo
w
Animals Boats
Sewage Overflows
Bathers
Georges River
Toilet Facilities
Sewer Chokes
Stormwater
Trends in enterococci data through time 100%
% E
nter
ococ
ci s
ampl
es 80%
60%
40%
20%
0%
94-9
5
95-9
6
96-9
7
97-9
8
98-9
9
99-0
0
00-0
1
01-0
2
02-0
3
03-0
4
04-0
5
05-0
6
06-0
7
07-0
8
08-0
9
09-1
0
10-1
1
11-1
2
12-1
3
13-1
4
<=40 cfu/100mL 41-200 cfu/100mL 201-500 cfu/100mL >500 cfu/100mL
Very
Lo
w
99

.
Carss Point Baths Beach Suitability Grade: G
See ‘How to read this report’ for key to map
Sanitary Inspection: Moderate SSourourcce:e: VVereryy LoLoww LowLow ModerModeratatee HHigighh
Carss Point Baths are a 100 by 60 metre netted swimming enclosure on the western shore of Kogarah Bay in the lower Georges River. The swimming area is backed by a narrow beach and Carss Bush Park.
The Beach Suitability Grade of Good indicates that microbial water quality is suitable for swimming most of the time but the water may be susceptible to pollution from a number of potential sources of faecal contamination including stormwater, sewer chokes and sources upstream in the Georges River.
The response to rainfall graph indicates that enterococci levels increased with increasing rainfall, often exceeding the safe swimming limit in response to low levels of rainfall and frequently after 5 mm of rain or more.
The site has been monitored since 1994. Microbial water quality has varied considerably among years with variations in rainfall.
Microbial Assessment: B Monitoring period for 2013–14 result is November 2011 to April 2014.
Very
Low
Hig
hM
oder
ate
Low
^ 600
200 175
260 200
165
2009-10 2010-11 2011-12 2012-13 2013-14
Ente
roco
cci c
fu/1
00m
L D500
400
Mic
robi
al A
sses
smen
tCa
tego
ry
95th
%ile
300
200
C
B100 A0
Response to rainfall Rainfall from Kyle Bay rain gauge
10000
Ente
roco
cci (
cfu/
100m
L)
0 0.1–4.9 5–9.9 10–19.9 20+
1000
100
10
1
24-hour rainfall (mm)
Animals Boats
Georges River
Stormwater
Toilet Facilities
Sewage Overflows
Sewer Chokes
Trends in enterococci data through time 100%
% E
nter
ococ
ci s
ampl
es 80%
60%
40%
20%
0%
94-9
5
95-9
6
96-9
7
97-9
8
98-9
9
99-0
0
00-0
1
01-0
2
02-0
3
03-0
4
04-0
5
05-0
6
06-0
7
07-0
8
08-0
9
09-1
0
10-1
1
11-1
2
12-1
3
13-1
4
<=40 cfu/100mL 41-200 cfu/100mL 201-500 cfu/100mL >500 cfu/100mL Bathers
100

.
Sandringham Baths Beach Suitability Grade: G
See ‘How to read this report’ for key to map
Sanitary Inspection: Moderate SSourourcce:e: VVereryy LoLoww LowLow ModerModeratatee HHigighh
Sandringham Baths are a 30 by 40 metre netted swimming area near the mouth of the Georges River, backed by a small beach and walking track.
The Beach Suitability Grade of Good indicates that microbial water quality is suitable for swimming most of the time but the water may be susceptible to pollution following heavy rain, with potential faecal contamination from river discharge.
The response to rainfall graph indicates that enterococci levels generally increased with increasing rainfall, regularly exceeding the safe swimming limit in response to 10 mm of rain or more.
The site has been monitored since 1994. Microbial water quality has varied between years owing to variations in rainfall.
Microbial Assessment: A Monitoring period for 2013–14 result is November 2011 to April 2014.
Hig
h ^
100 80 120
70 40
D500
400 C
300
200
600
95th
%ile
En
tero
cocc
i cfu
/100
mL
Mic
robi
al A
sses
smen
tCa
tego
ry
100 B
A0 2009-10 2010-11 2011-12 2012-13 2013-14
Response to rainfall Rainfall from Kyeemagh rain gauge
10000
Ente
roco
cci (
cfu/
100m
L)
0 0.1–4.9 5–9.9 10–19.9 20+
1000
100
10
1
24-hour rainfall (mm)Mod
erat
e
Trends in enterococci data through time 100%
Boats
% E
nter
ococ
ci s
ampl
es 80%
60%
40%
20%
0% Sewer Chokes
Sewage Overflows
Georges River
Bathers
Toilet Facilities
Stormwater
Low
94-9
5
95-9
6
96-9
7
97-9
8
98-9
9
99-0
0
00-0
1
01-0
2
02-0
3
03-0
4
04-0
5
05-0
6
06-0
7
07-0
8
08-0
9
09-1
0
10-1
1
11-1
2
12-1
3
13-1
4
Very
Lo
w <=40 cfu/100mL 41-200 cfu/100mL 201-500 cfu/100mL >500 cfu/100mL
101

.
Dolls Point Baths Beach Suitability Grade: G
See ‘How to read this report’ for key to map
Sanitary Inspection: Moderate SSourourcce:e: VVereryy LoLoww LowLow ModerModeratatee HHigighh
Dolls Point Baths are a 50 by 30 metre netted swimming area at the southern end of Lady Robinsons Beach in Botany Bay. The baths are backed by a sandy beach and park with barbeque and picnic facilities.
The Beach Suitability Grade of Good indicates that microbial water quality is suitable for swimming most of the time but the water may be susceptible to pollution after heavy rain, with potential faecal contamination from river discharge.
The response to rainfall graph indicates that enterococci levels increased with increasing rainfall, frequently exceeding the safe swimming limit in response to 20 mm of rainfall or more.
The site has been monitored since 1994. Microbial water quality has varied among years owing to variations in rainfall.
Microbial Assessment: B Monitoring period for 2013–14 result is November 2011 to April 2014.
Hig
h ^ 600
95th
%ile
En
tero
cocc
i cfu
/100
mL
65 75 135 120 120
D500
400 C
300
Mic
robi
al A
sses
smen
tCa
tego
ry
200
100 B
A0 2009-10 2010-11 2011-12 2012-13 2013-14
Response to rainfall Rainfall from Kyeemagh rain gauge
10000
Ente
roco
cci (
cfu/
100m
L)
0 0.1–4.9 5–9.9 10–19.9 20+
1000
100
10
1
24-hour rainfall (mm)Mod
erat
e
Trends in enterococci data through time 100%
% E
nter
ococ
ci s
ampl
es 80%
60%
40%
20%
0%
Boats
Sewage Overflows
Bathers
Toilet Facilities
Stormwater
Georges River
Low
94-9
5
95-9
6
96-9
7
97-9
8
98-9
9
99-0
0
00-0
1
01-0
2
02-0
3
03-0
4
04-0
5
05-0
6
06-0
7
07-0
8
08-0
9
09-1
0
10-1
1
11-1
2
12-1
3
13-1
4
<=40 cfu/100mL 41-200 cfu/100mL 201-500 cfu/100mL >500 cfu/100mL
Very
Lo
w
102

.
Ramsgate Baths
See ‘How to read this report’ for key to map
Sanitary Inspection: Moderate SSourourcce:e: VVereryy LoLoww LowLow ModerModeratatee HHigighh
Beach Suitability Grade: G
Ramsgate Baths are a 50 metre square swimming enclosure near the southern end of Lady Robinsons Beach in Botany Bay. The baths are backed by a sandy beach, a walking track and a small park.
The Beach Suitability Grade of Good indicates that the water quality is safe for swimming most of the time but can be susceptible to pollution after heavy rain, with potential faecal contamination from river discharge.
The response to rainfall graph indicates that enterococci levels increased with increasing rainfall, regularly exceeding the safe swimming limit in response to 10 mm of rainfall or more.
The site has been monitored since 1994.
Microbial Assessment: B Monitoring period for 2013–14 result is November 2011 to April 2014.
Hig
h ^ 600
95th
%ile
En
tero
cocc
i cfu
/100
mL
120 180
230
150 90
D500
400 C
300
200
Mic
robi
al A
sses
smen
tCa
tego
ry
100 B
A0 2009-10 2010-11 2011-12 2012-13 2013-14
Response to rainfall Rainfall from Kyeemagh rain gauge
10000
Ente
roco
cci (
cfu/
100m
L)
0 0.1–4.9 5–9.9 10–19.9 20+
1000
100
10
1
24-hour rainfall (mm)Mod
erat
e
Trends in enterococci data through time 100%
% E
nter
ococ
ci s
ampl
es
Georges River
80%
60%
40%
20%
0%
Low
Stormwater
Sewage Overflows
94-9
5
95-9
6
96-9
7
97-9
8
98-9
9
99-0
0
00-0
1
01-0
2
02-0
3
03-0
4
04-0
5
05-0
6
06-0
7
07-0
8
08-0
9
09-1
0
10-1
1
11-1
2
12-1
3
13-1
4
Bathers
Toilet Facilities
Very
Lo
w <=40 cfu/100mL 41-200 cfu/100mL 201-500 cfu/100mL >500 cfu/100mL
103

.
Monterey Baths
See ‘How to read this report’ for key to map
Sanitary Inspection: Moderate SSourourcce:e: VVereryy LoLoww LowLow ModerModeratatee HHigighh
Beach Suitability Grade: G
Monterey Baths are located towards the southern end of Lady Robinsons Beach in Botany Bay. The sampling site is just north of the baths, near a large stormwater drain, backed by a sandy beach.
The Beach Suitability Grade of Good indicates that microbial water quality is suitable for swimming most of the time but the water may be susceptible to pollution after heavy rain, with potential faecal contamination from river discharge and stormwater.
The response to rainfall graph indicates that enterococci levels increased with increasing rainfall, regularly exceeding the safe swimming limit after 20 mm or more.
The site has been monitored since 1994.
Microbial Assessment: B Monitoring period for 2013–14 result is November 2011 to April 2014.
Hig
h ^ 600
75 70
140 95 80
D500
400 C
300
95th
%ile
En
tero
cocc
i cfu
/100
mL
Mic
robi
al A
sses
smen
tCa
tego
ry
200
100 B
A0 2009-10 2010-11 2011-12 2012-13 2013-14
Response to rainfall Rainfall from Kyeemagh rain gauge
10000
0 0.1–4.9 5–9.9 10–19.9 20+
Ente
roco
cci (
cfu/
100m
L)
1000
100
10
1
24-hour rainfall (mm)Mod
erat
e
Trends in enterococci data through time 100%
Sewage Overflows Bathers
Stormwater
Georges River
% E
nter
ococ
ci s
ampl
es 80%
60%
40%
20%
0%
Low
94-9
5
95-9
6
96-9
7
97-9
8
98-9
9
99-0
0
00-0
1
01-0
2
02-0
3
03-0
4
04-0
5
05-0
6
06-0
7
07-0
8
08-0
9
09-1
0
10-1
1
11-1
2
12-1
3
13-1
4
<=40 cfu/100mL 41-200 cfu/100mL 201-500 cfu/100mL >500 cfu/100mL
Very
Lo
w
104

.
Brighton-Le-Sands Baths Beach Suitability Grade: G
See ‘How to read this report’ for key to map
Sanitary Inspection: Moderate SSourourcce:e: VVereryy LoLoww LowLow ModerModeratatee HHigighh
Brighton-Le-Sands Baths are located towards the centre of Lady Robinsons Beach. The baths are netted and backed by a sandy beach and restaurant.
The Beach Suitability Grade of Good indicates that microbial water quality is suitable for swimming most of the time but the water may be susceptible to pollution from a number of potential sources of faecal contamination including sewage overflows and river discharge.
The response to rainfall graph indicates that enterococci levels generally increased with increasing rainfall, regularly exceeding the safe swimming limit in response to 20 mm of rainfall or more.
The site has been monitored since 1994.
Microbial Assessment: B Monitoring period for 2013–14 result is November 2011 to April 2014.
Very
Low
Low
M
oder
ate
Hig
h ^ 600
130 115 175 165
135
2009-10 2010-11 2011-12 2012-13 2013-14
Ente
roco
cci c
fu/1
00m
L D500
400 C
300
Mic
robi
al A
sses
smen
tCa
tego
ry
95th
%ile
200 B100 A0
Response to rainfall Rainfall from Kyeemagh rain gauge
10000
Ente
roco
cci (
cfu/
100m
L)
0 0.1–4.9 5–9.9 10–19.9 20+
1000
100
10
1
24-hour rainfall (mm)
Trends in enterococci data through time 100%
Georges River
% E
nter
ococ
ci s
ampl
es 80%
60%
40%
20%Stormwater Sewer Chokes
0% Sewage Overflows
Bathers
Toilet Facilities 94-9
5
95-9
6
96-9
7
97-9
8
98-9
9
99-0
0
00-0
1
01-0
2
02-0
3
03-0
4
04-0
5
05-0
6
06-0
7
07-0
8
08-0
9
09-1
0
10-1
1
11-1
2
12-1
3
13-1
4
<=40 cfu/100mL 41-200 cfu/100mL 201-500 cfu/100mL >500 cfu/100mL
105

.
Kyeemagh Baths
See ‘How to read this report’ for key to map
Sanitary Inspection: Moderate SSourourcce:e: VVereryy LoLoww LowLow ModerModeratatee HHigighh
Beach Suitability Grade: G
Kyeemagh Baths are located at the northern end of Lady Robinsons Beach. The baths are netted and backed by a sandy beach and reserve.
The Beach Suitability Grade of Good indicates that microbial water quality is suitable for swimming most of the time but the water may be susceptible to pollution from a number of potential sources of faecal contamination including from the Cooks River, stormwater and sewage overflows.
The response to rainfall graph indicates that enterococci levels increased with increasing rainfall, occasionally exceeding the safe swimming limit in response to light rainfall and frequently after 10 mm of rainfall or more.
The site has been monitored since 1994.
Microbial Assessment: B Monitoring period for 2013–14 result is November 2011 to April 2014.
Very
Low
Lo
w
Mod
erat
e H
igh
Cooks River
24-hour rainfall (mm)Animals
Trends in enterococci data through time
^ 600
230 280
320
200 140
2009-10 2010-11 2011-12 2012-13 2013-14
Ente
roco
cci c
fu/1
00m
L D500
400
Mic
robi
al A
sses
smen
tCa
tego
ry
95th
%ile C
300
200 B100 A0
Response to rainfall Rainfall from Kyeemagh rain gauge
10000
0 0.1–4.9 5–9.9 10–19.9 20+
Ente
roco
cci (
cfu/
100m
L)
1000
100
10
1
100%
80%
60%
% E
nter
ococ
ci s
ampl
es
Stormwater Sewer Chokes
Toilet Facilities Bathers
Sewage Overflows
40%
20%
0%
94-9
5
95-9
6
96-9
7
97-9
8
98-9
9
99-0
0
00-0
1
01-0
2
02-0
3
03-0
4
04-0
5
05-0
6
06-0
7
07-0
8
08-0
9
09-1
0
10-1
1
11-1
2
12-1
3
13-1
4
<=40 cfu/100mL 41-200 cfu/100mL 201-500 cfu/100mL >500 cfu/100mL
106

Foreshores Beach Beach Suitability Grade: .VP
Foreshores Beach is adjacent to Sydney Airport’s third runway and the Port Botany Terminal 3 completed in late 2013. The swimming area is not netted and has recently been redeveloped to include toilets, a car park and boat launching facilities.
The Beach Suitability Grade of Very Poor indicates that microbial water quality is highly influenced by faecal pollution, particularly after rainfall, and is very susceptible to faecal contamination from the sewage overflows which discharge into Mill Pond Creek.
The response to rainfall graph indicates that enterococci levels increased with increasing rainfall, often exceeding the safe swimming limit in response to little or no rain, and frequently after 5 mm or more.
The site has been monitored since 1994.
See ‘How to read this report’ for key to map
Sanitary Inspection: High Microbial Assessment: D SSourourcce:e: VVereryy LoLoww LowLow ModerModeratatee HHigighh Monitoring period for 2013–14 result is November 2011 to April 2014.
Very
Low
Low
M
oder
ate
Hig
h ^
520 450
760 680
780
2009-10 2010-11 2011-12 2012-13 2013-14
95th
%ile
En
tero
cocc
i cfu
/100
mL 800
700 600 500
D
C
Mic
robi
al A
sses
smen
tCa
tego
ry
400 300 200 B 100
A0
River Discharge
Boats
Toilet Facilities
Sewage Overflows
Stormwater
Response to rainfall Rainfall from Malabar WWTP rain gauge
10000
0 0.1–4.9 5–9.9 10–19.9 20+
Ente
roco
cci (
cfu/
100m
L)
1000
100
10
1
24-hour rainfall (mm)
Trends in enterococci data through time 100%
% E
nter
ococ
ci s
ampl
es 80%
60%
40%
20%
0%
94-9
5
95-9
6
96-9
7
97-9
8
98-9
9
99-0
0
00-0
1
01-0
2
02-0
3
03-0
4
04-0
5
05-0
6
06-0
7
07-0
8
08-0
9
09-1
0
10-1
1
11-1
2
12-1
3
13-1
4
<=40 cfu/100mL 41-200 cfu/100mL 201-500 cfu/100mL >500 cfu/100mL Bathers
107

.
Yarra Bay
See ‘How to read this report’ for key to map
Sanitary Inspection: Moderate SSourourcce:e: VVereryy LoLoww LowLow ModerModeratatee HHigighh
Beach Suitability Grade: G
Yarra Bay is approximately 750 metres long, with a rock groyne 100 metres from the southern end. The swimming area is not netted. The southern half of the beach is bordered by Yarra Bay Bicentennial Park and Yarra Bay Sailing Club.
The Beach Suitability Grade of Good indicates that microbial water quality is suitable for swimming most of the time but the water may be susceptible to pollution from a number of potential sources of faecal contamination including stormwater.
The response to rainfall graph indicates that enterococci levels generally increased with increasing rainfall, regularly exceeding the safe swimming limit after 5 mm or more of rainfall.
The site has been monitored since 1994.
Microbial Assessment: B Monitoring period for 2013–14 result is November 2011 to April 2014.
Hig
h ^ 600
180 120
155 175 200
2009-10 2010-11 2011-12 2012-13 2013-14
95th
%ile
En
tero
cocc
i cfu
/100
mL D500
400 C
300
Mic
robi
al A
sses
smen
tCa
tego
ry
200 B100 A0
Response to rainfall Rainfall from Malabar WWTP rain gauge
10000
Ente
roco
cci (
cfu/
100m
L)
0 0.1–4.9 5–9.9 10–19.9 20+
1000
100
10
1
24-hour rainfall (mm)Mod
erat
e
Trends in enterococci data through time 100%
% E
nter
ococ
ci s
ampl
es 80%
60%
40%
20%
0%
Animals Boats
OnSite Systems
Toilet Facilities Bathers
Sewage Overflows
Stormwater
Botany Bay
Low
94-9
5
95-9
6
96-9
7
97-9
8
98-9
9
99-0
0
00-0
1
01-0
2
02-0
3
03-0
4
04-0
5
05-0
6
06-0
7
07-0
8
08-0
9
09-1
0
10-1
1
11-1
2
12-1
3
13-1
4
Very
Lo
w <=40 cfu/100mL 41-200 cfu/100mL 201-500 cfu/100mL >500 cfu/100mL
108

.
Frenchmans Bay Beach Suitability Grade: G
See ‘How to read this report’ for key to map
Sanitary Inspection: Moderate SSourourcce:e: VVereryy LoLoww LowLow ModerModeratatee HHigighh
Frenchmans Bay is approximately 500 metres long, with a rock wall towards the northern end. The swimming area is not netted. A small recreational reserve is located behind the southern end of the beach.
The Beach Suitability Grade of Good indicates that the water quality is safe for swimming most of the time but can be susceptible to pollution after heavy rain, from a number of potential sources of faecal contamination including stormwater.
The response to rainfall graph indicates that enterococci levels increased with increasing rainfall, often exceeding the safe swimming limit after 10 mm of rainfall or more.
The site has been monitored since 1994.
Microbial Assessment: B Monitoring period for 2013–14 result is November 2011 to April 2014.
Hig
h ^ 600
340 320 300
165 145
2009-10 2010-11 2011-12 2012-13 2013-14
95th
%ile
En
tero
cocc
i cfu
/100
mL D500
Mic
robi
al A
sses
smen
tCa
tego
ry 400
300
200
C
B100 A0
Response to rainfall Rainfall from Malabar WWTP rain gauge
10000
Ente
roco
cci (
cfu/
100m
L)
0 0.1–4.9 5–9.9 10–19.9 20+
1000
100
10
1
24-hour rainfall (mm)Mod
erat
e
Trends in enterococci data through time 100%
% E
nter
ococ
ci s
ampl
es 80%
60%
40%
20%
0%
Boats
Sewage Overflows
Bathers
Toilet Facilities
Stormwater
Botany Bay
Low
94-9
5
95-9
6
96-9
7
97-9
8
98-9
9
99-0
0
00-0
1
01-0
2
02-0
3
03-0
4
04-0
5
05-0
6
06-0
7
07-0
8
08-0
9
09-1
0
10-1
1
11-1
2
12-1
3
13-1
4
Very
Lo
w <=40 cfu/100mL 41-200 cfu/100mL 201-500 cfu/100mL >500 cfu/100mL
109

.
Congwong Bay
See ‘How to read this report’ for key to map
Sanitary Inspection: Low SSourourcce:e: VVereryy LoLoww LowLow ModerModeratatee HHigighh
Beach Suitability Grade: VG
Congwong Bay is near the mouth of Botany Bay and is backed by the Botany Bay National Park. The beach is approximately 150 metres long and the swimming area is not netted.
The Beach Suitability Grade of Very Good indicates that microbial water quality is considered suitable for swimming almost all of the time, with few significant sources of faecal contamination.
The response to rainfall graph indicates that enterococci levels increased with increasing rainfall, often exceeding the safe swimming limit in response to 20 mm of rainfall or more.
The site has been monitored since 1994.
Microbial Assessment: A Monitoring period for 2013–14 result is November 2011 to April 2014.
Hig
h ^ 600
95th
%ile
En
tero
cocc
i cfu
/100
mL
70 65 60 55 20
D500
400 C
300
200
Mic
robi
al A
sses
smen
tCa
tego
ry
100 B
A0 2009-10 2010-11 2011-12 2012-13 2013-14
Response to rainfall Rainfall from Malabar WWTP rain gauge
10000
Ente
roco
cci (
cfu/
100m
L)
0 0.1–4.9 5–9.9 10–19.9 20+
1000
100
10
1
24-hour rainfall (mm)Mod
erat
e
Trends in enterococci data through time 100%
% E
nter
ococ
ci s
ampl
es 80%
60%
40%
20%
0%
Low
Ve
ry
Low
Boats
Stormwater
Bathers
Toilet Facilities
Botany Bay
94-9
5
95-9
6
96-9
7
97-9
8
98-9
9
99-0
0
00-0
1
01-0
2
02-0
3
03-0
4
04-0
5
05-0
6
06-0
7
07-0
8
08-0
9
09-1
0
10-1
1
11-1
2
12-1
3
13-1
4
<=40 cfu/100mL 41-200 cfu/100mL 201-500 cfu/100mL >500 cfu/100mL
110
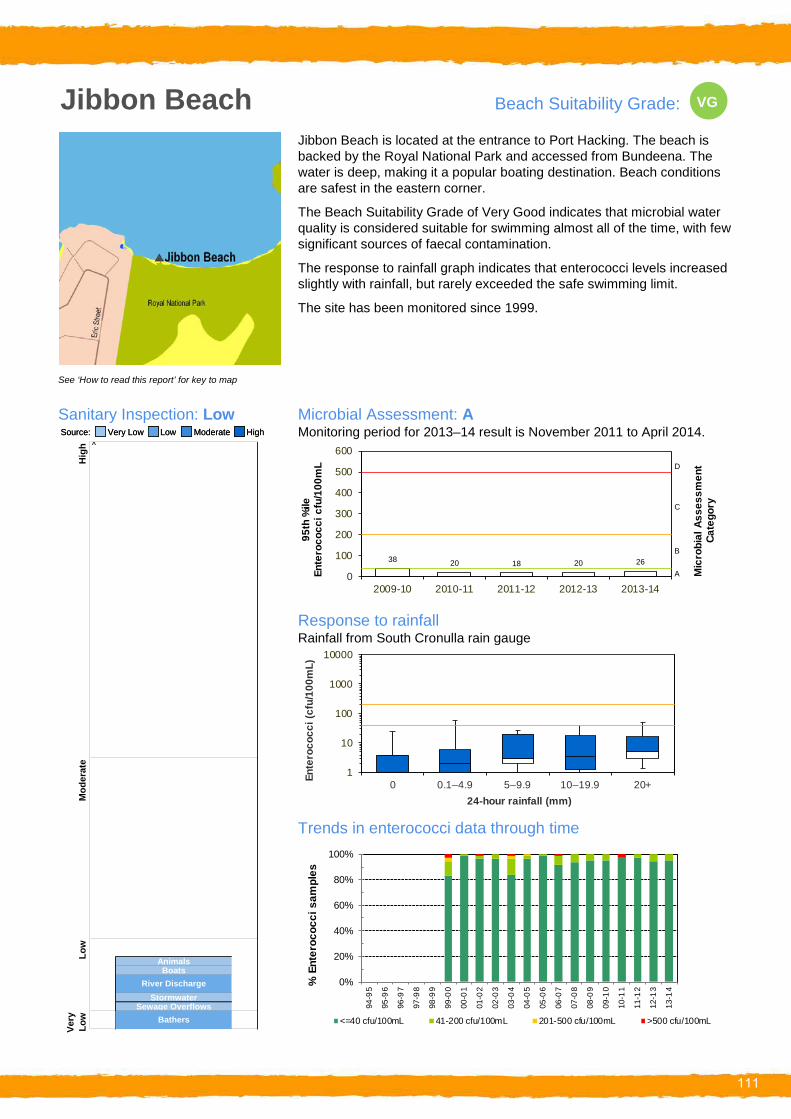
.
Jibbon Beach
See ‘How to read this report’ for key to map
Sanitary Inspection: Low SSourourcce:e: VVereryy LoLoww LowLow ModerModeratatee HHigighh
Beach Suitability Grade: VG
Jibbon Beach is located at the entrance to Port Hacking. The beach is backed by the Royal National Park and accessed from Bundeena. The water is deep, making it a popular boating destination. Beach conditions are safest in the eastern corner.
The Beach Suitability Grade of Very Good indicates that microbial water quality is considered suitable for swimming almost all of the time, with few significant sources of faecal contamination.
The response to rainfall graph indicates that enterococci levels increased slightly with rainfall, but rarely exceeded the safe swimming limit.
The site has been monitored since 1999.
Microbial Assessment: A Monitoring period for 2013–14 result is November 2011 to April 2014.
Very
Low
Low
M
oder
ate
Hig
h ^
38 20 18 20 26
0
100
200
300
400
500
600
95th
%ile
En
tero
cocc
i cfu
/100
mL
A
B
C
D
Mic
robi
al A
sses
smen
tCa
tego
ry
2009-10 2010-11 2011-12 2012-13 2013-14
Response to rainfall Rainfall from South Cronulla rain gauge
10000
Ente
roco
cci (
cfu/
100m
L)
0 0.1–4.9 5–9.9 10–19.9 20+
1000
100
10
1
24-hour rainfall (mm)
Trends in enterococci data through time 100%
% E
nter
ococ
ci s
ampl
es 80%
60%
40%
20%
0%
Animals Boats
Stormwater Sewage Overflows
Bathers
River Discharge
94-9
5
95-9
6
96-9
7
97-9
8
98-9
9
99-0
0
00-0
1
01-0
2
02-0
3
03-0
4
04-0
5
05-0
6
06-0
7
07-0
8
08-0
9
09-1
0
10-1
1
11-1
2
12-1
3
13-1
4
<=40 cfu/100mL 41-200 cfu/100mL 201-500 cfu/100mL >500 cfu/100mL
111

.
Horderns Beach
See ‘How to read this report’ for key to map
Sanitary Inspection: Moderate SSourourcce:e: VVereryy LoLoww LowLow ModerModeratatee HHigighh
Beach Suitability Grade: G
Horderns Beach is located on the southern shore of Port Hacking and is backed by the town of Bundeena. The Cronulla–Bundeena wharf is located at the eastern end of the beach.
The Beach Suitability Grade of Good indicates that the water quality is safe for swimming most of the time but can be susceptible to pollution after heavy rain, from a number of potential sources of faecal contamination including creek discharge.
The response to rainfall graph indicates that enterococci levels increased with increasing rainfall, often exceeding the safe swimming limit after 10 mm of rainfall or more and occasionally after little or no rain.
The site has been monitored since 1999.
Microbial Assessment: B Monitoring period for 2013–14 result is November 2011 to April 2014.
112
Response to rainfall Rainfall from South Cronulla rain gauge
Trends in enterococci data through time
110
250 290
230
95
0
100
200
300
400
500
600
2009-10 2010-11 2011-12 2012-13 2013-14
95th
%ile
En
tero
cocc
i cfu
/100
mL
A
B
C
D
Mic
robi
al A
sses
smen
tCa
tego
ry
1
10
100
1000
10000
0 0.1–4.9 5–9.9 10–19.9 20+
Ente
roco
cci (
cfu/
100m
L)
24-hour rainfall (mm)
0%
20%
40%
60%
80%
100%
94-9
5
95-9
6
96-9
7
97-9
8
98-9
9
99-0
0
00-0
1
01-0
2
02-0
3
03-0
4
04-0
5
05-0
6
06-0
7
07-0
8
08-0
9
09-1
0
10-1
1
11-1
2
12-1
3
13-1
4
% E
nter
ococ
ci s
ampl
es
<=40 cfu/100mL 41-200 cfu/100mL 201-500 cfu/100mL >500 cfu/100mL
^
Sewage Overflows Toilet Facilities
Bathers
Hig
hM
oder
ate
Low
Ve
ry
Low
Bundeena Creek
Port Hacking

Gymea Bay Baths Beach Suitability Grade: .P
Gymea Bay Baths are an enclosed tidal swimming area backed by a narrow sandy beach in the upper reaches of Port Hacking. Two small recreation reserves lead to the beach.
The Beach Suitability Grade of Poor indicates that microbial water quality is influenced by faecal pollution, particularly after rainfall, with potential faecal contamination from stormwater.
The response to rainfall graph indicates that enterococci levels increased with increasing rainfall, regularly exceeding the safe swimming limit after low levels of rainfall.
The site has been monitored since 1999.
See ‘How to read this report’ for key to map
Sanitary Inspection: High Microbial Assessment: C SSourourcce:e: VVereryy LoLoww LowLow ModerModeratatee HHigighh Monitoring period for 2013–14 result is November 2011 to April 2014.
113
Response to rainfall Rainfall from Caringbah rain gauge
Trends in enterococci data through time
250 240
500
380 320
0
100
200
300
400
500
600
2009-10 2010-11 2011-12 2012-13 2013-14
95th
%ile
En
tero
cocc
i cfu
/100
mL
A
B
C
D
Mic
robi
al A
sses
smen
tCa
tego
ry
1
10
100
1000
10000
0 0.1–4.9 5–9.9 10–19.9 20+
Ente
roco
cci (
cfu/
100m
L)
24-hour rainfall (mm)
0%
20%
40%
60%
80%
100%
94-9
5
95-9
6
96-9
7
97-9
8
98-9
9
99-0
0
00-0
1
01-0
2
02-0
3
03-0
4
04-0
5
05-0
6
06-0
7
07-0
8
08-0
9
09-1
0
10-1
1
11-1
2
12-1
3
13-1
4
% E
nter
ococ
ci s
ampl
es
<=40 cfu/100mL 41-200 cfu/100mL 201-500 cfu/100mL >500 cfu/100mL
^
Boats
OnSite Systems
Sewage Overflows
Bathers
Low
Port Hacking
Very
Lo
w Toilet Facilities
Sewer Chokes
Stormwater
Hig
hM
oder
ate

.
Lilli Pilli Baths Beach Suitability Grade: G
See ‘How to read this report’ for key to map
Sanitary Inspection: Moderate SSourourcce:e: VVereryy LoLoww LowLow ModerModeratatee HHigighh
Lilli Pilli Baths is a tidal swimming area on the western side of Lilli Pilli Point in the middle reaches of Port Hacking. The pool is netted and is backed by a narrow strip of recreation reserve.
The Beach Suitability Grade of Good indicates that microbial water quality is suitable for swimming most of the time but the water may be susceptible to pollution after heavy rain because of several potential sources of faecal contamination.
The response to rainfall graph indicates that enterococci levels increased with increasing rainfall, regularly exceeding the safe swimming limit after 5 mm of rainfall or more.
The site has been monitored since 1999.
Microbial Assessment: B Monitoring period for 2013–14 result is November 2011 to April 2014.
^
Boats
OnSite Systems
Sewage Overflows
Bathers
Hig
hM
oder
ate
Low
Ve
ryLo
w Toilet Facilities
Sewer Chokes
Port Hacking
Stormwater
95th
%ile
En
tero
cocc
i cfu
/100
mL
600
70 36
110 140 125
D500
400 C
300
Mic
robi
al A
sses
smen
tCa
tego
ry
200
100 B
A0 2009-10 2010-11 2011-12 2012-13 2013-14
Response to rainfall Rainfall from Caringbah rain gauge
10000
Ente
roco
cci (
cfu/
100m
L)
1000
100
10
1
24-hour rainfall (mm) 0 0.1–4.9 5–9.9 10–19.9 20+
Trends in enterococci data through time 100%
% E
nter
ococ
ci s
ampl
es 80%
60%
40%
20%
0%
94-9
5
95-9
6
96-9
7
97-9
8
98-9
9
99-0
0
00-0
1
01-0
2
02-0
3
03-0
4
04-0
5
05-0
6
06-0
7
07-0
8
08-0
9
09-1
0
10-1
1
11-1
2
12-1
3
13-1
4
<=40 cfu/100mL 41-200 cfu/100mL 201-500 cfu/100mL >500 cfu/100mL
114

.
Gunnamatta Bay Baths Beach Suitability Grade: G
See ‘How to read this report’ for key to map
Sanitary Inspection: Moderate SSourourcce:e: VVereryy LoLoww LowLow ModerModeratatee HHigighh
Gunnamatta Bay Baths are an enclosed tidal swimming area located in Gunnamatta Bay. The baths are backed by a narrow sandy beach and a large reserve with picnic facilities.
The Beach Suitability Grade of Good indicates that microbial water quality is generally suitable for swimming, but the water can be susceptible to pollution from a number of potential sources of faecal contamination.
The response to rainfall graph indicates that enterococci levels increased with increasing rainfall, often exceeding the safe swimming limit in response to 5 mm of rainfall or more, and occasionally after light rainfall.
The site has been monitored since 1994. Microbial water quality has improved since 2000–2001 due to sewage overflow abatement works in the catchment.
Microbial Assessment: B Monitoring period for 2013–14 result is November 2011 to April 2014.
Hig
h ^ 600
170
100 125 140
180
D500
400 C
300
95th
%ile
En
tero
cocc
i cfu
/100
mL
Mic
robi
al A
sses
smen
tCa
tego
ry
200
B100
A0 2009-10 2010-11 2011-12 2012-13 2013-14
Response to rainfall Rainfall from South Cronulla rain gauge
10000
0 0.1–4.9 5–9.9 10–19.9 20+
Ente
roco
cci (
cfu/
100m
L)
1000
100
10
1
24-hour rainfall (mm)Mod
erat
e
Trends in enterococci data through time 100%
OnSite Systems
Bathers
Toilet Facilities
Sewage Overflows
Sewer Chokes
Stormwater
Port Hacking
Boats
% E
nter
ococ
ci s
ampl
es 80%
60%
40%
20%
0%
Low
94-9
5
95-9
6
96-9
7
97-9
8
98-9
9
99-0
0
00-0
1
01-0
2
02-0
3
03-0
4
04-0
5
05-0
6
06-0
7
07-0
8
08-0
9
09-1
0
10-1
1
11-1
2
12-1
3
13-1
4
Very
Lo
w <=40 cfu/100mL 41-200 cfu/100mL 201-500 cfu/100mL >500 cfu/100mL
115

–
–
-
State of the Beaches HOW TO READ THIS REPORT
Beach Suitability Grades Beach Suitability Grades provide an assessment of the suitability of a swimming location for recreation over time and are based on a combination of sanitary inspection (identification and rating of potential pollution sources at a beach) and microbial assessment (water quality measurements gathered over previous years). There are five grades ranging from Very Good to Very Poor:
Very Good Location has generally excellent microbial water quality and very few potential sources of faecal pollution. Water is considered suitable for swimming almost all of the time.
Good Location has generally good microbial water quality and water is considered suitable for swimming most of the time. Swimming should be avoided during and for up to one day following heavy rain at ocean beaches and up to three days at estuarine sites.
Fair Microbial water quality is generally suitable for swimming, but because of the presence of significant sources of faecal contamination, extra care should be taken to avoid swimming during and for up to three days following rainfall or if there are signs of pollution such as discoloured water or odour or debris in the water.
Poor Location is susceptible to faecal pollution and microbial water quality is not always suitable for swimming. During dry weather conditions, ensure that the swimming location is free of signs of pollution, such as discoloured water, odour or debris in the water, and avoid swimming at all times during and for up to three days following rainfall.
Very Poor Location is very susceptible to faecal pollution and microbial water quality may often be unsuitable for swimming. It is generally recommended to avoid swimming at these sites.
Some of the Beach Suitability Grades in this report are provisional, as the information required for the analysis is incomplete due to limited bacterial data or limited information on potential pollution sources in a beach catchment.
Beach Suitability Grades are determined by using the following matrix:
The guidelines The National Health and Medical Research Council’s Guidelines for managing risks in recreational water1 were adopted for use in NSW in May 2009. These guidelines have been adopted in all Australian states and territories and are supported by guidance notes developed by the Department of Health Western Australia2 .
1NHMRC (2008). Guidelines for managing risks in recreational water. National Health and Medical Research Council. Australian Government Publishing Service, Canberra, ACT.
2Department of Health, Western Australia (2007) Microbial water quality of recreational water guidance notes in support of chapter 5 of the National Health and Medical Research Council guidelines for managing risks in recreational water, 2006. Department of Health, Western Australia and The University of Western Australia, October 2007. [Available at www.public.health.wa.gov.au/3/1287/2/public ations.pm. Accessed on 6/06/14]
Enterococci The national guidelines advocate the use of enterococci as the single preferred faecal indicator in marine waters. These bacteria are excreted in faeces and are rarely present in unpolluted waters. Enterococci have shown a clear dose response relationship to disease outcomes in marine waters in the northern hemisphere. In accordance with the guidelines, Beachwatch tests for enterococci only. The enterococci density in water samples is analysed in the laboratory using method AS/NZS 4276.9:20073 .
Enterococci are measured in colony forming units per 100 mL of sample (cfu/100mL).
3AS/NZS 4276.9:2007. Water microbiology Method 9: Enterococci Membrane filtration method (ISO 7899 2:2000, MOD). Standards Australia International Ltd, Sydney and Standards New Zealand, Wellington.
116

Matrix used to determine Beach Suitability Grades
Sanitary Inspection Category
Very Low
Low
Moderate
High
Very High
Microbial Assessment Category (MAC)
A B C D Very Good Very Good Follow Up Follow Up
Very Good Good Follow Up Follow Up
Good Good Poor Poor
Good Fair Poor Very Poor
Follow Up Fair Poor Very Poor
Microbial Assessment Category (MAC) There are four Microbial Assessment Categories (A to D) and these are determined from the 95th percentile of an enterococci dataset of at least 100 data points. Each MAC is associated with a risk of illness determined from epidemiological studies. The risks of illness shown below are not those associated with a single data point but are the overall risk of illness associated with an enterococci dataset with that 95th percentile4.
Enterococci Illness risk* Category (cfu/100mL)
A GI illness risk: <1% ≤40 AFR illness risk: <0.3%
B GI illness risk: <1–5% 41–200 AFR illness risk: <0.3–1.9%
C GI illness risk: <5–10% 201–500 AFR illness risk: <1.9–3.9%
D GI illness risk: >10% >500 AFR illness risk: >3.9%
* GI = gastrointestinal; AFR = acute fever and rash
Sanitary Inspection Category (SIC)
The aim of a sanitary inspection is to identify all sources of faecal contamination that could affect a swimming location and assess the risk to public health posed by these sources. It is an assessment of the likelihood of bacterial contamination from identified pollution sources and should, to some degree, correlate with the bacterial water quality results obtained from sampling.
Through the sanitary inspection process5, beaches are categorised to reflect the likelihood of faecal contamination. There are five categories: Very Low, Low, Moderate, High and Very High.
Calculating the MAC The 95th percentile is a useful statistic for summarising the distribution of enterococci data at a site. It embodies elements of both the location of the distribution (how high/low the enterococci counts are) and the scale of the distribution (how variable the enterococci counts are).
The 95th percentile values for each of the four Microbial Assessment Categories were determined by the World Health Organization using enterococci data collected from swimming locations across Europe. These values will represent different probabilities of illness if the distribution of enterococci data from swimming locations in NSW differs from the European distribution.
In recognition of this issue, Dr Richard Lugg (Department of Health, Western Australia) has developed a Microsoft® Excel tool for calculating a modified 95th percentile that takes into account the distribution of data. This tool has been used to calculate the 95th percentile values presented in this report and has been adopted for use by other state governments in Australia.
The tool can be downloaded from: www.public.health.wa.gov.au/3/1287/2/public ations.pm under Forms and Templates [accessed 06/06/14].
4 Wyer, MD, Kay, D, Fleisher, JM, Salmon, RL, Jones F, Godfree, AF, Jackson G and Rogers, A (1999). ‘An experimental health related classification for marine waters’. Water Research 33(3):715–722. 5 Office of Environment and Heritage 2013, Sanitary Inspections, Office of Environment and Heritage, Sydney, NSW, viewed 10 June 2014, www.environment.nsw.gov.au/beach/sanitaryinspections.htm.
117

Explanation of graphs and charts on beach pages Microbial Assessment Category (MAC) chart
On each beach page, the MACs for the last five years are displayed on a simple bar chart. The bar is labelled with the 95th percentile value for each year and the thresholds dividing the A, B, C and D categories are marked for reference.
^
Sewage Overflows
Bathers
Hig
hM
oder
ate
Low
Boats
Ver
yLo
w
Toilet Facilities
Stormwater
River Discharge
Sanitary Inspection Category (SIC) chart
The results of the sanitary inspection for each swimming location are presented in a vertical bar chart, such as the one to the right. The graph shows the likelihood that each identified pollution source will contribute to faecal contamination at a swimming site, as indicated by the size and colour of the components of the bar, with the sum of these contributions being the overall likelihood, or Sanitary Inspection Category.
Response to rainfall plots Trends in enterococci levels in response to rainfall are shown using a box plot (see below). For reference, enterococci levels of 40 cfu/100 mL and 200 cfu/100 mL are indicated with a green and orange line, respectively. The 40 cfu/100 mL level is referred to as the ‘safe swimming limit’. The enterococci data were obtained from the last five years of monitoring. Rainfall data were obtained from rain gauges situated close to the sample site and are 24 hour totals to 9:00 am on the day of sampling. If there are fewer than five enterococci data points in a rainfall category, individual data points are presented instead of a box plot. At sites where many results are below the detection limit (1 cfu/100 mL), only the upper portion of the box plots will be visible.
10000
0 0.1–4.9 5–9.9 10–19.9 20+ 24-hour rainfall (mm)
SSourourcce:e: VVereryy LoLoww LowLow ModerModeratatee HHigig
Ente
roco
cci (
cfu/
100m
L)
1000
100
10 9955%%iilele
1
7755%%iilele
Each part of the box plot represents a significant percentile value of the sample population:
• 5% of the samples lie below the bottom whisker 5500%%iilele• 25% of the samples lie below the bottom of the box
• half the samples are on each side of the middle line of the box (median or 50%ile) 2255%%iilele• 75% of the samples lie below the top of the box
• 95% of the samples lie below the top whisker. 55%%ililee
118

Historical enterococci data graphs Trends in enterococci levels through time are presented for each swimming location as a bar graph. Each year’s bar is colour coded to show the percentage of enterococci results less up to 40 cfu/100 mL, between 41 and 200 cfu/100 mL, between 201 and 500 cfu/100 mL and greater than 500 cfu/100 mL. These categories reflect the Microbial Assessment Category thresholds and are coloured on the graph by dark green, light green, amber and red respectively.
100%
Key to maps
Sampling site
Surf lifesaving club
Wastewater treatment plant
Storm sewage treatment plant
Sewage pumping station
Stormwater drain
Water
Baths
National park
Other park/reserve
Built-up area
Sand
Land
Roads
Rock/cliff/reef
Baths – netted area
Breakwater/wharf
% E
nter
ococ
ci s
ampl
es
80%
60%
40%
20%
0%
94-9
5
95-9
6
96-9
7
97-9
8
98-9
9
99-0
0
00-0
1
01-0
2
02-0
3
03-0
4
04-0
5
05-0
6
06-0
7
07-0
8
08-0
9
09-1
0
10-1
1
11-1
2
12-1
3
13-1
4 <=40 cfu/100mL 41-200 cfu/100mL 201-500 cfu/100mL >500 cfu/100
Explanation of maps A map of individual swimming locations is presented on each beach page. The scale of the maps is 1:15,000. Each map shows the location of the sampling site, land use and features such as surf lifesaving clubs. Potential pollution sources such as stormwater drains, sewage pumping stations, wastewater treatment plants, lagoons, rivers and creeks, are shown where accurate data is held.
119