state-of-the-art paper imagingoflow ...imaging.onlinejacc.org/content/jimg/6/2/184.full.pdf ·...
TRANSCRIPT
aCma
MCT1
J A C C : C A R D I O V A S C U L A R I M A G I N G V O L . 6 , N O . 2 , 2 0 1 3
© 2 0 1 3 B Y T H E A M E R I C A N C O L L E G E O F C A R D I O L O G Y F O U N D A T I O N I S S N 1 9 3 6 - 8 7 8 X / $ 3 6 . 0 0
P U B L I S H E D B Y E L S E V I E R I N C . h t t p : / / d x . d o i . o r g / 1 0 . 1 0 1 6 / j . j c m g . 2 0 1 2 . 1 1 . 0 0 5
S T A T E - O F - T H E - A R T P A P E R
Imaging of Low-Gradient Severe Aortic Stenosis
Anumeha Tandon, MD, Paul A. Grayburn, MD
Dallas, Texas
JACC: CARDIOVASCULAR IMAGING CME
CME Editor: Ragavendra R. Baliga, MD
This article has been selected as this issue’s CME activity,available online at http://imaging.onlinejacc.org by select-ing the CME tab on the top navigation bar.
Accreditation and Designation StatementThe American College of Cardiology Foundation(ACCF) is accredited by the Accreditation Councilfor Continuing Medical Education (ACCME) toprovide continuing medical education for physicians.
The ACCF designates this Journal-based CMEctivity for a maximum of 1 AMA PRA Category 1redit(s)™. Physicians should only claim credit com-ensurate with the extent of their participation in the
ctivity.
ethod of Participation and Receipt ofME Certificateo obtain credit for this CME activity, you must:. Be an ACC member or JACC: Cardiovascular
Imaging subscriber.2. Carefully read the CME-designated article avail-
able online and in this issue of the journal.3. Answer the post-test questions. At least 2 out of
the 3 questions provided must be answered cor-rectly to obtain CME credit.
4. Complete a brief evaluation.
Manuscript received August 31, 2012; revised manuscript received No
icate electronically by following the instructionsgiven at the conclusion of the activity.
CME Objective for This Article: At the end of thisactivity the reader should be able to: 1) understandthe hemodynamic mechanisms underlying low gra-dient severe aortic stenosis (LGSAS); 2) understandhow dobutamine stress echocardiography can beuseful in evaluating whether LGSAS is due to trueaortic stenosis or pseudo-aortic stenosis (failure ofmoderately thickened leaflets to fully open becauseof low forward stroke volume); and 3) apply currentguidelines for determining when surgery is indicatedfor patients with LGSAS.
CME Editor Disclosure: JACC: Cardiovascular Im-aging CME Editor Ragavendra R. Baliga, MD, hasreported that he has no relationships to disclose.
Author Disclosure: Dr. Tandon has reported thathe has no relationships relevant to the contents ofthis paper to disclose. Dr. Grayburn has receivedgrant support from Abbott Vascular and Medtronic,has consulted for Abbott Vascular and Bracco Di-agnostics, and serves as the Echo Core Lab forValTech Cardio and Guided Delivery Systems.
Medium of Participation: Print (article only);online (article and quiz).
CME Term of Approval:Issue Date: February 2013
5. Claim your CME credit and receive your certif- Expiration Date: January 31, 2014
From the Baylor University Medical Center, Baylor Heart and Vascular Hospital, Dallas, Texas. Dr. Tandon has reportedthat he has no relationships relevant to the contents of this paper to disclose. Dr. Grayburn has received grant support fromAbbott Vascular and Medtronic, has consulted for Abbott Vascular and Bracco Diagnostics, and serves as the Echo CoreLab for ValTech Cardio and Guided Delivery Systems.
vember 20, 2012, accepted November 26, 2012.
Apvi
J A C C : C A R D I O V A S C U L A R I M A G I N G , V O L . 6 , N O . 2 , 2 0 1 3
F E B R U A R Y 2 0 1 3 : 1 8 4 – 9 5
Tandon and Grayburn
Imaging of Low-Gradient Severe Aortic Stenosis
185
Imaging of Low-Gradient Severe Aortic Stenosis
Although most patients with severe aortic stenosis (AS) have high peak velocity and mean transvalvular
gradient, there is a subset of patients with low-flow, low-gradient severe AS (LGSAS). Assessment and
management of such patients can be difficult and dobutamine echocardiography has been recommended
to distinguish those with pseudo-AS (low calculated AVA due to insufficient flow to fully open the valve)
from those with contractile reserve and true LGSAS, who may have good outcomes with surgery. More
recently, a group of patients with LGSAS and preserved LV function have been identified. These patients
are often elderly with hypertension, small left ventricular cavities, and concentric left ventricular hypertro-
phy. Because cardiac imaging plays a vital role in hemodynamic classification of patients with suspected
LGSAS and determining appropriate management, this review was undertaken to summarize the current
state of knowledge of this important but complex condition. (J Am Coll Cardiol Img 2013;6:184 –95)
© 2013 by the American College of Cardiology Foundation
ortic stenosis (AS) is one of the most commonvalvular disorders encountered in clinicalpractice, and its prevalence is expected to
increase in the United States as the “babyboomer” generation ages (1,2). It is the mostcommon indication for aortic valve replacement(AVR), which is recommended for symptomaticsevere AS (3,4). Severe AS has been defined as acalculated aortic valve area (AVA) �1.0 cm2, mean
ressure gradient (MPG) �40 mm Hg and peakelocity �4 m/s (3,4). It is often recommended tondex the AVA for body surface area (�0.6 cm2/m2),which corresponds better with left ventricularstroke work loss than AVA.
Most patients with severe AS maintain normalleft ventricular ejection fraction (LVEF) despitesignificant afterload mismatch. In such patients, thepresence of an elevated MPG and/or peak velocity,along with a decreased calculated AVA is sufficientto diagnose severe AS. However, there is a subset ofpatients with depressed LVEF, either due to long-standing severe AS or due to other causes such asischemic cardiomyopathy, in whom the calculatedAVA, MPG, and peak velocity are all low. Thiscondition was first described in 1980 by Carabelloet al. (5) and has been termed low-flow, low-gradient AS. A more appropriate term might below-gradient severe aortic stenosis (LGSAS), asmild AS is expected to have a low gradient. Morerecently, LGSAS has been shown to also occur inpatients with preserved LVEF and low forwardstroke volume (6). Although much has been learnedabout LGSAS since 1980, it remains a complicated
problem for which cardiac imaging plays a crucialrole. This review will cover the use of variousimaging modalities to evaluate hemodynamics, LVfunction, and outcomes in patients with LGSAS.Hemodynamics. By definition, LGSAS includesboth severe AS and a low gradient, which may seemcontradictory. To fully understand the relationshipbetween AVA, flow, and gradient in LGSAS, it ishelpful to consider the Gorlin hydraulic orificeequation (7). It is based on the principle thateffective orifice area (EOA) is dependent on flowand velocity across the valve as shown in Equation1, where
EOA � Flow/Velocity
Gorlin and Gorlin used cardiac output to derivesystolic flow across the aortic valve and velocity wasestimated from the MPG using Torricelli’s law.Thus, the Gorlin equation describes the relation-ship between AVA, flow, and gradient in ASderived by Equation 2,
AVA � CO � �HR � SEP�/44.3 � �MPG
where CO � cardiac output, HR � heart rate, andSEP � systolic ejection period.
The constant value 44.3 is empirical and includesboth a contraction coefficient and a discharge coef-ficient. The discharge coefficient accounts for theenergy loss that occurs from conversion of potentialenergy (pressure) to kinetic energy (velocity). Thecalculated AVA is the EOA of the flow stream,
which is smaller than the anatomic orifice area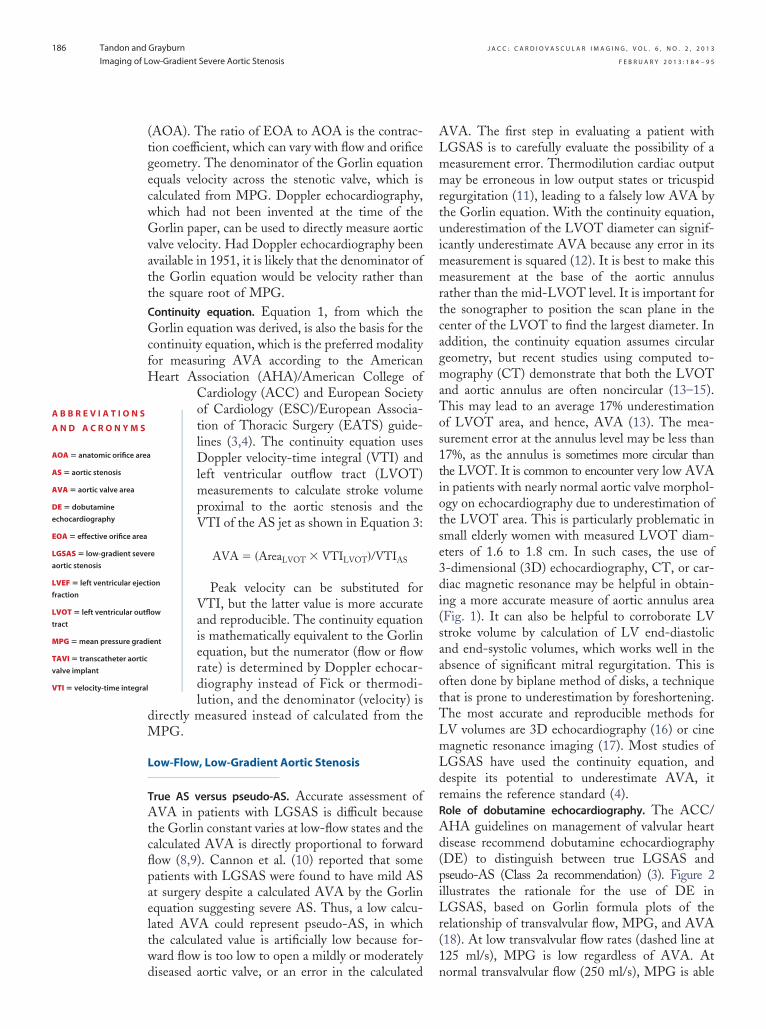
Ad(piLr(1
A
a
L
f
L
t
M
T
v
VTI � velocity-time integral
J A C C : C A R D I O V A S C U L A R I M A G I N G , V O L . 6 , N O . 2 , 2 0 1 3
F E B R U A R Y 2 0 1 3 : 1 8 4 – 9 5
Tandon and Grayburn
Imaging of Low-Gradient Severe Aortic Stenosis
186
(AOA). The ratio of EOA to AOA is the contrac-tion coefficient, which can vary with flow and orificegeometry. The denominator of the Gorlin equationequals velocity across the stenotic valve, which iscalculated from MPG. Doppler echocardiography,which had not been invented at the time of theGorlin paper, can be used to directly measure aorticvalve velocity. Had Doppler echocardiography beenavailable in 1951, it is likely that the denominator ofthe Gorlin equation would be velocity rather thanthe square root of MPG.Continuity equation. Equation 1, from which theGorlin equation was derived, is also the basis for thecontinuity equation, which is the preferred modalityfor measuring AVA according to the AmericanHeart Association (AHA)/American College of
Cardiology (ACC) and European Societyof Cardiology (ESC)/European Associa-tion of Thoracic Surgery (EATS) guide-lines (3,4). The continuity equation usesDoppler velocity-time integral (VTI) andleft ventricular outflow tract (LVOT)measurements to calculate stroke volumeproximal to the aortic stenosis and theVTI of the AS jet as shown in Equation 3:
AVA � �AreaLVOT � VTILVOT�/VTIAS
Peak velocity can be substituted forVTI, but the latter value is more accurateand reproducible. The continuity equationis mathematically equivalent to the Gorlinequation, but the numerator (flow or flowrate) is determined by Doppler echocar-diography instead of Fick or thermodi-lution, and the denominator (velocity) is
directly measured instead of calculated from theMPG.
Low-Flow, Low-Gradient Aortic Stenosis
True AS versus pseudo-AS. Accurate assessment ofAVA in patients with LGSAS is difficult becausethe Gorlin constant varies at low-flow states and thecalculated AVA is directly proportional to forwardflow (8,9). Cannon et al. (10) reported that somepatients with LGSAS were found to have mild ASat surgery despite a calculated AVA by the Gorlinequation suggesting severe AS. Thus, a low calcu-lated AVA could represent pseudo-AS, in whichthe calculated value is artificially low because for-ward flow is too low to open a mildly or moderately
re
ion
ow
ient
diseased aortic valve, or an error in the calculated n
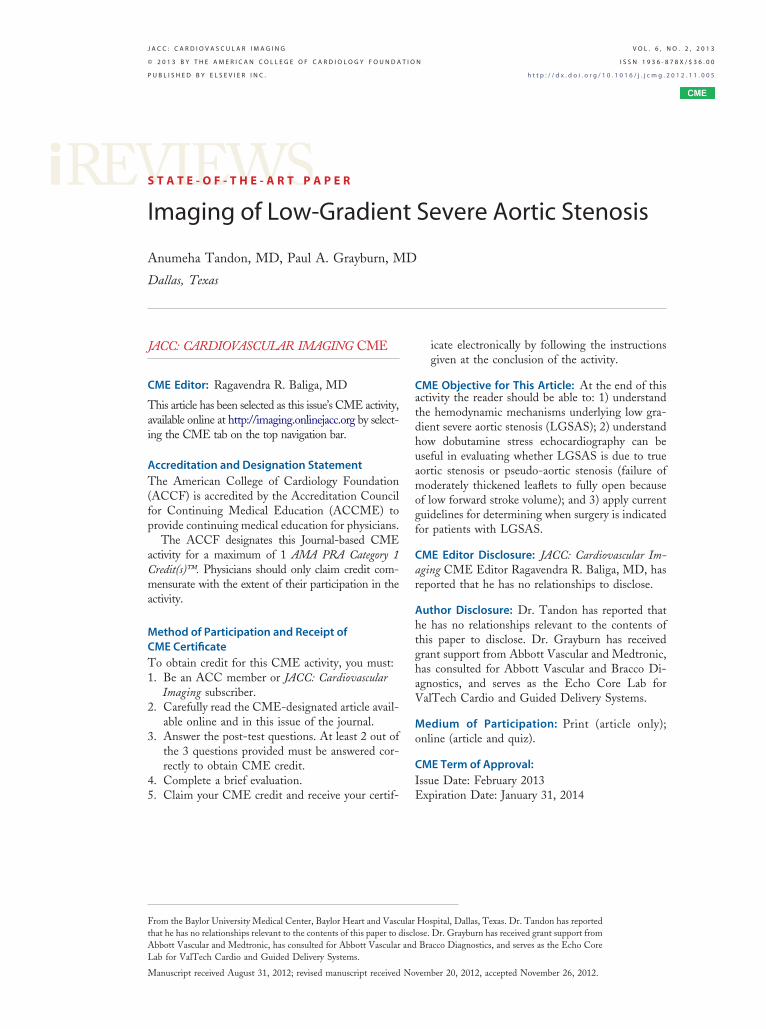
AVA. The first step in evaluating a patient withLGSAS is to carefully evaluate the possibility of ameasurement error. Thermodilution cardiac outputmay be erroneous in low output states or tricuspidregurgitation (11), leading to a falsely low AVA bythe Gorlin equation. With the continuity equation,underestimation of the LVOT diameter can signif-icantly underestimate AVA because any error in itsmeasurement is squared (12). It is best to make thismeasurement at the base of the aortic annulusrather than the mid-LVOT level. It is important forthe sonographer to position the scan plane in thecenter of the LVOT to find the largest diameter. Inaddition, the continuity equation assumes circulargeometry, but recent studies using computed to-mography (CT) demonstrate that both the LVOTand aortic annulus are often noncircular (13–15).This may lead to an average 17% underestimationof LVOT area, and hence, AVA (13). The mea-surement error at the annulus level may be less than17%, as the annulus is sometimes more circular thanthe LVOT. It is common to encounter very low AVAin patients with nearly normal aortic valve morphol-ogy on echocardiography due to underestimation ofthe LVOT area. This is particularly problematic insmall elderly women with measured LVOT diam-eters of 1.6 to 1.8 cm. In such cases, the use of3-dimensional (3D) echocardiography, CT, or car-diac magnetic resonance may be helpful in obtain-ing a more accurate measure of aortic annulus area(Fig. 1). It can also be helpful to corroborate LVstroke volume by calculation of LV end-diastolicand end-systolic volumes, which works well in theabsence of significant mitral regurgitation. This isoften done by biplane method of disks, a techniquethat is prone to underestimation by foreshortening.The most accurate and reproducible methods forLV volumes are 3D echocardiography (16) or cinemagnetic resonance imaging (17). Most studies ofLGSAS have used the continuity equation, anddespite its potential to underestimate AVA, itremains the reference standard (4).Role of dobutamine echocardiography. The ACC/
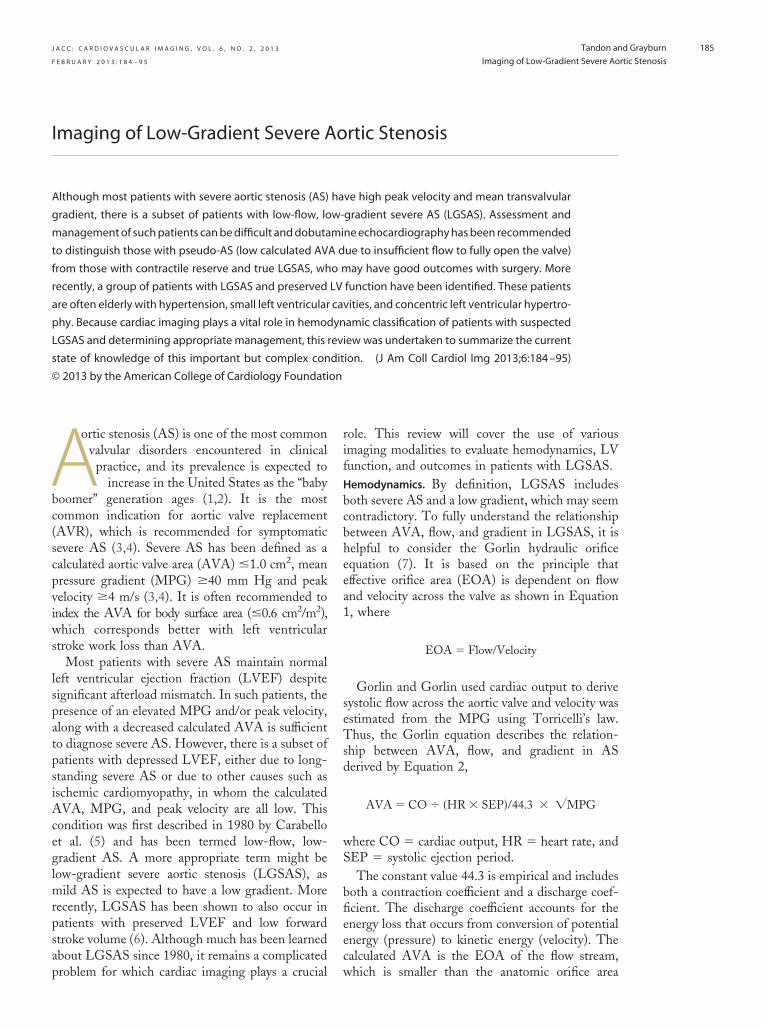
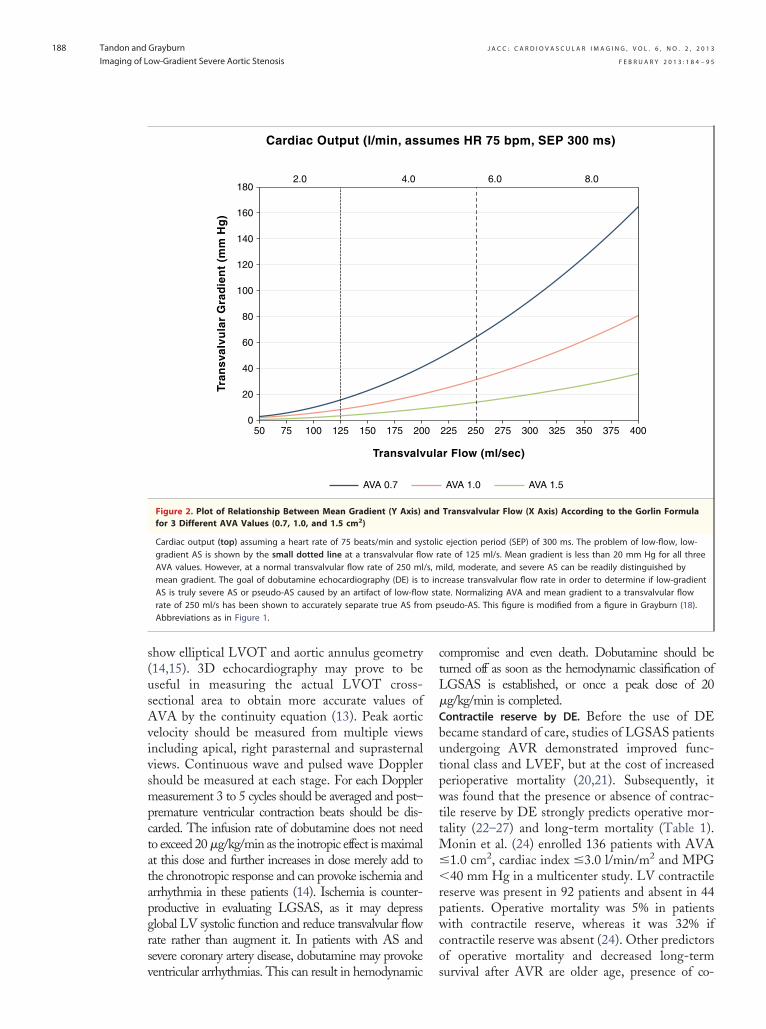
HA guidelines on management of valvular heartisease recommend dobutamine echocardiographyDE) to distinguish between true LGSAS andseudo-AS (Class 2a recommendation) (3). Figure 2llustrates the rationale for the use of DE inGSAS, based on Gorlin formula plots of the
elationship of transvalvular flow, MPG, and AVA18). At low transvalvular flow rates (dashed line at25 ml/s), MPG is low regardless of AVA. At
A B B R E V I A T I O N S
A N D A C R O N YM S
AOA � anatomic orifice area
S � aortic stenosis
AVA � aortic valve area
DE � dobutamine
echocardiography
EOA � effective orifice area
LGSAS � low-gradient seve
ortic stenosis
VEF � left ventricular eject
raction
VOT � left ventricular outfl
ract
PG � mean pressure grad
AVI � transcatheter aortic
alve implant
ormal transvalvular flow (250 ml/s), MPG is able
s
w
mm
J A C C : C A R D I O V A S C U L A R I M A G I N G , V O L . 6 , N O . 2 , 2 0 1 3
F E B R U A R Y 2 0 1 3 : 1 8 4 – 9 5
Tandon and Grayburn
Imaging of Low-Gradient Severe Aortic Stenosis
187
to clearly separate mild, moderate or severe AS. In1995, deFilippi et al. (19) first reported the use ofDE to evaluate LGSAS in 18 patients with severesymptoms and LV dysfunction. All patients had acalculated AVA �0.5cm2/m2, mean gradient �30mm Hg and LVEF �45%. Dobutamine wastarted at 5 �g/kg/min and increased to a peak of 20
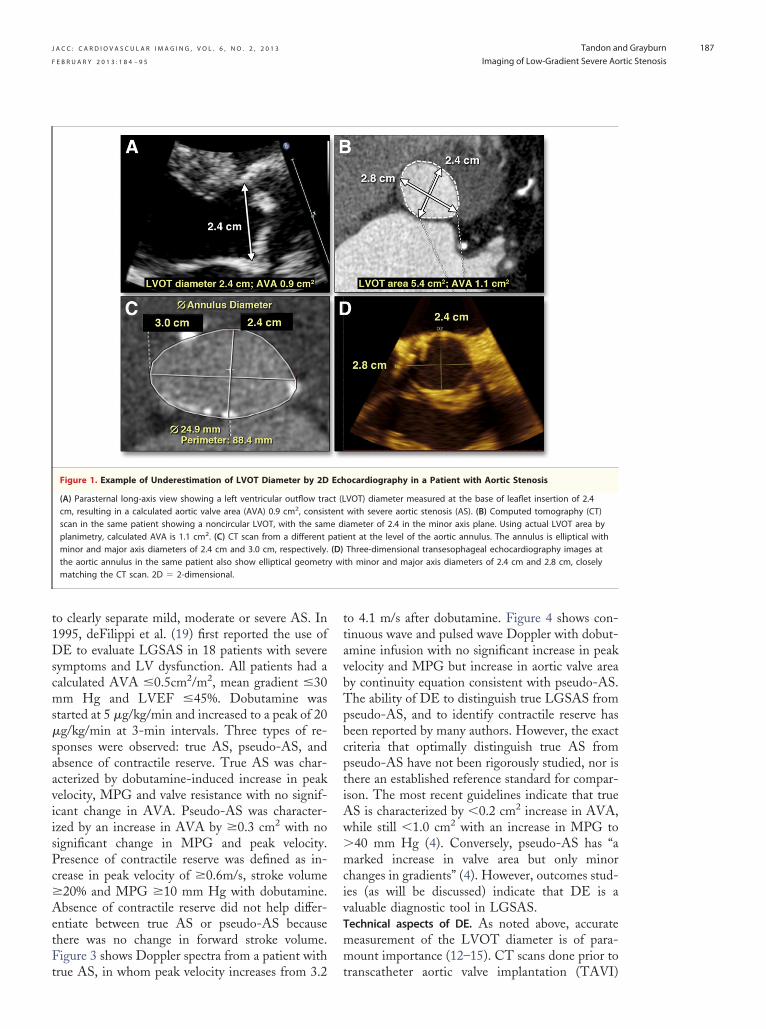
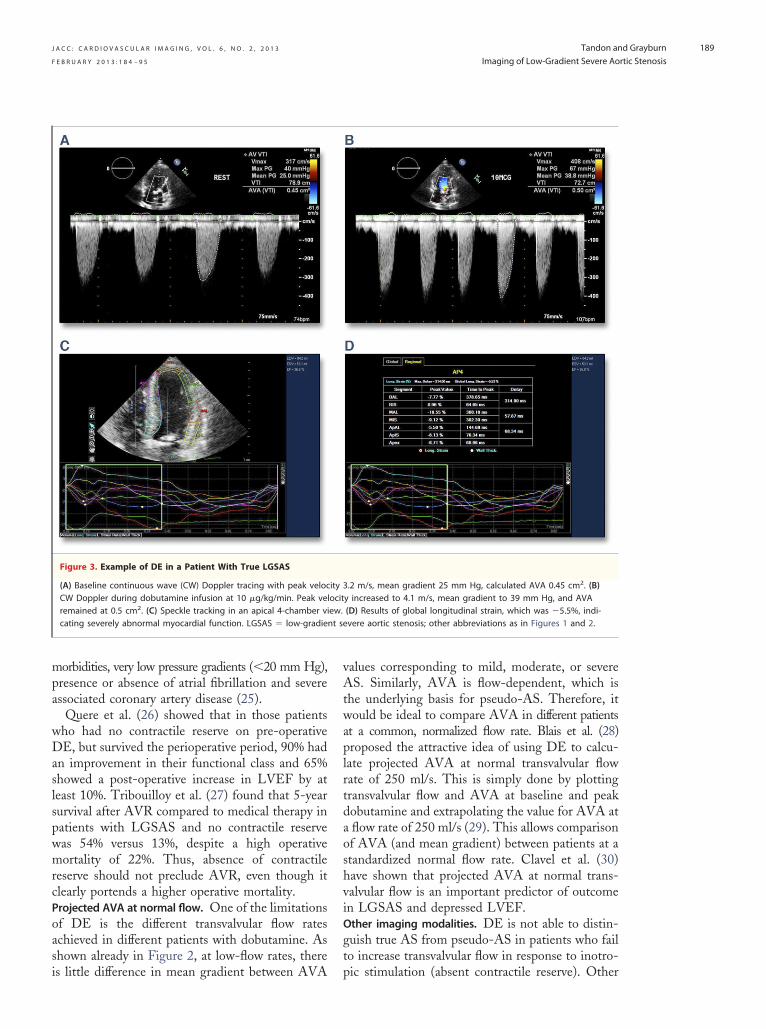
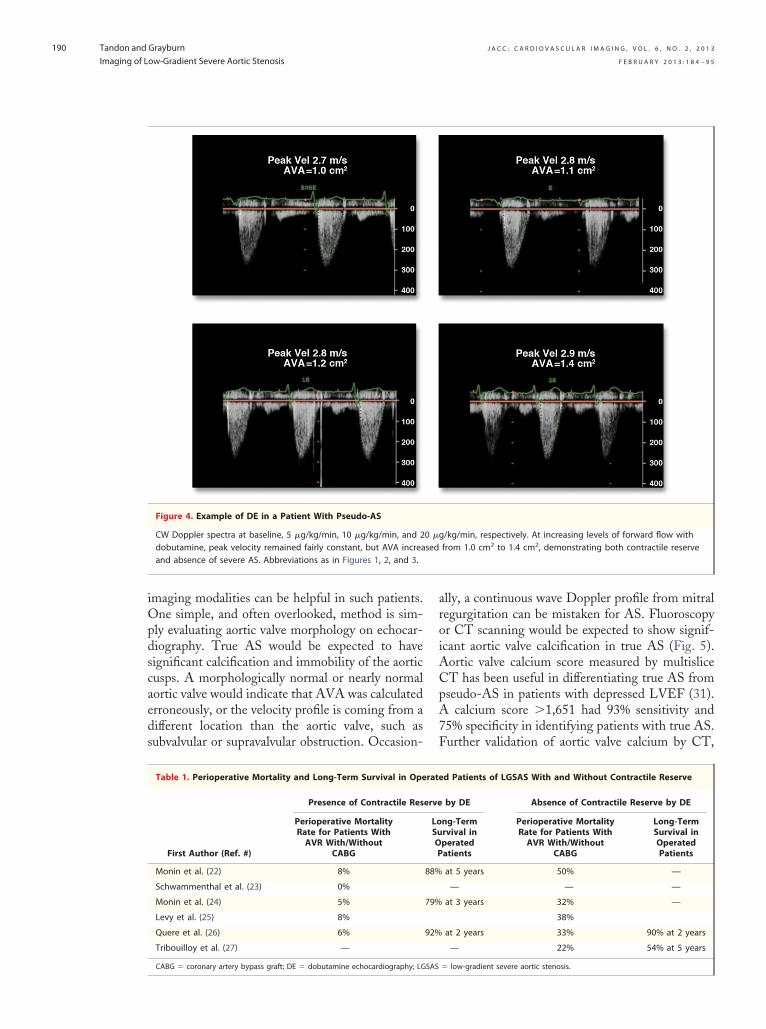
�g/kg/min at 3-min intervals. Three types of re-sponses were observed: true AS, pseudo-AS, andabsence of contractile reserve. True AS was char-acterized by dobutamine-induced increase in peakvelocity, MPG and valve resistance with no signif-icant change in AVA. Pseudo-AS was character-ized by an increase in AVA by �0.3 cm2 with nosignificant change in MPG and peak velocity.Presence of contractile reserve was defined as in-crease in peak velocity of �0.6m/s, stroke volume�20% and MPG �10 mm Hg with dobutamine.Absence of contractile reserve did not help differ-entiate between true AS or pseudo-AS becausethere was no change in forward stroke volume.Figure 3 shows Doppler spectra from a patient with
Figure 1. Example of Underestimation of LVOT Diameter by 2D
(A) Parasternal long-axis view showing a left ventricular outflow tracm, resulting in a calculated aortic valve area (AVA) 0.9 cm2, consisscan in the same patient showing a noncircular LVOT, with the samplanimetry, calculated AVA is 1.1 cm2. (C) CT scan from a differentminor and major axis diameters of 2.4 cm and 3.0 cm, respectively.the aortic annulus in the same patient also show elliptical geometrmatching the CT scan. 2D � 2-dimensional.
true AS, in whom peak velocity increases from 3.2 t
to 4.1 m/s after dobutamine. Figure 4 shows con-tinuous wave and pulsed wave Doppler with dobut-amine infusion with no significant increase in peakvelocity and MPG but increase in aortic valve areaby continuity equation consistent with pseudo-AS.The ability of DE to distinguish true LGSAS frompseudo-AS, and to identify contractile reserve hasbeen reported by many authors. However, the exactcriteria that optimally distinguish true AS frompseudo-AS have not been rigorously studied, nor isthere an established reference standard for compar-ison. The most recent guidelines indicate that trueAS is characterized by �0.2 cm2 increase in AVA,
hile still �1.0 cm2 with an increase in MPG to�40 mm Hg (4). Conversely, pseudo-AS has “amarked increase in valve area but only minorchanges in gradients” (4). However, outcomes stud-ies (as will be discussed) indicate that DE is avaluable diagnostic tool in LGSAS.Technical aspects of DE. As noted above, accurate
easurement of the LVOT diameter is of para-ount importance (12–15). CT scans done prior to
ocardiography in a Patient with Aortic Stenosis
VOT) diameter measured at the base of leaflet insertion of 2.4with severe aortic stenosis (AS). (B) Computed tomography (CT)iameter of 2.4 in the minor axis plane. Using actual LVOT area bynt at the level of the aortic annulus. The annulus is elliptical withThree-dimensional transesophageal echocardiography images atth minor and major axis diameters of 2.4 cm and 2.8 cm, closely
Ech
ct (Ltente dpatie(D)y wi
ranscatheter aortic valve implantation (TAVI)
atapgrsv
ctL
butpwttM�
J A C C : C A R D I O V A S C U L A R I M A G I N G , V O L . 6 , N O . 2 , 2 0 1 3
F E B R U A R Y 2 0 1 3 : 1 8 4 – 9 5
Tandon and Grayburn
Imaging of Low-Gradient Severe Aortic Stenosis
188
show elliptical LVOT and aortic annulus geometry(14,15). 3D echocardiography may prove to beuseful in measuring the actual LVOT cross-sectional area to obtain more accurate values ofAVA by the continuity equation (13). Peak aorticvelocity should be measured from multiple viewsincluding apical, right parasternal and suprasternalviews. Continuous wave and pulsed wave Dopplershould be measured at each stage. For each Dopplermeasurement 3 to 5 cycles should be averaged and post–premature ventricular contraction beats should be dis-carded. The infusion rate of dobutamine does not needto exceed 20 �g/kg/min as the inotropic effect is maximalt this dose and further increases in dose merely add tohe chronotropic response and can provoke ischemia andrrhythmia in these patients (14). Ischemia is counter-roductive in evaluating LGSAS, as it may depresslobal LV systolic function and reduce transvalvular flowate rather than augment it. In patients with AS andevere coronary artery disease, dobutamine may provoke
AVA 0.7
Tran
sval
vula
r G
rad
ien
t (m
m H
g)
Transvalv
Cardiac Output (l/min, ass
50 75 100 125 150 175 200
20
40
60
80
100
120
140
160
1802.0 4.0
Figure 2. Plot of Relationship Between Mean Gradient (Y Axis)for 3 Different AVA Values (0.7, 1.0, and 1.5 cm2)
Cardiac output (top) assuming a heart rate of 75 beats/min and sysgradient AS is shown by the small dotted line at a transvalvular floAVA values. However, at a normal transvalvular flow rate of 250 mlmean gradient. The goal of dobutamine echocardiography (DE) is tAS is truly severe AS or pseudo-AS caused by an artifact of low-flowrate of 250 ml/s has been shown to accurately separate true AS froAbbreviations as in Figure 1.
entricular arrhythmias. This can result in hemodynamic
ompromise and even death. Dobutamine should beurned off as soon as the hemodynamic classification ofGSAS is established, or once a peak dose of 20
�g/kg/min is completed.Contractile reserve by DE. Before the use of DEecame standard of care, studies of LGSAS patientsndergoing AVR demonstrated improved func-ional class and LVEF, but at the cost of increasederioperative mortality (20,21). Subsequently, itas found that the presence or absence of contrac-
ile reserve by DE strongly predicts operative mor-ality (22–27) and long-term mortality (Table 1).
onin et al. (24) enrolled 136 patients with AVA1.0 cm2, cardiac index �3.0 l/min/m2 and MPG
�40 mm Hg in a multicenter study. LV contractilereserve was present in 92 patients and absent in 44patients. Operative mortality was 5% in patientswith contractile reserve, whereas it was 32% ifcontractile reserve was absent (24). Other predictorsof operative mortality and decreased long-term
r Flow (ml/sec)
es HR 75 bpm, SEP 300 ms)
225 250 275 300 325 350 375 400
6.0 8.0
AVA 1.0 AVA 1.5
Transvalvular Flow (X Axis) According to the Gorlin Formula
ejection period (SEP) of 300 ms. The problem of low-flow, low-ate of 125 ml/s. Mean gradient is less than 20 mm Hg for all threeild, moderate, and severe AS can be readily distinguished bycrease transvalvular flow rate in order to determine if low-gradientte. Normalizing AVA and mean gradient to a transvalvular flowseudo-AS. This figure is modified from a figure in Grayburn (18).
ula
um
0
and
tolicw r/s, mo insta
m p
survival after AVR are older age, presence of co-
gt
nt se
J A C C : C A R D I O V A S C U L A R I M A G I N G , V O L . 6 , N O . 2 , 2 0 1 3
F E B R U A R Y 2 0 1 3 : 1 8 4 – 9 5
Tandon and Grayburn
Imaging of Low-Gradient Severe Aortic Stenosis
189
morbidities, very low pressure gradients (�20 mm Hg),presence or absence of atrial fibrillation and severeassociated coronary artery disease (25).
Quere et al. (26) showed that in those patientswho had no contractile reserve on pre-operativeDE, but survived the perioperative period, 90% hadan improvement in their functional class and 65%showed a post-operative increase in LVEF by atleast 10%. Tribouilloy et al. (27) found that 5-yearsurvival after AVR compared to medical therapy inpatients with LGSAS and no contractile reservewas 54% versus 13%, despite a high operativemortality of 22%. Thus, absence of contractilereserve should not preclude AVR, even though itclearly portends a higher operative mortality.Projected AVA at normal flow. One of the limitationsof DE is the different transvalvular flow ratesachieved in different patients with dobutamine. Asshown already in Figure 2, at low-flow rates, there
Figure 3. Example of DE in a Patient With True LGSAS
(A) Baseline continuous wave (CW) Doppler tracing with peak velocCW Doppler during dobutamine infusion at 10 �g/kg/min. Peak veremained at 0.5 cm2. (C) Speckle tracking in an apical 4-chamber vicating severely abnormal myocardial function. LGSAS � low-gradie
is little difference in mean gradient between AVA p
values corresponding to mild, moderate, or severeAS. Similarly, AVA is flow-dependent, which isthe underlying basis for pseudo-AS. Therefore, itwould be ideal to compare AVA in different patientsat a common, normalized flow rate. Blais et al. (28)proposed the attractive idea of using DE to calcu-late projected AVA at normal transvalvular flowrate of 250 ml/s. This is simply done by plottingtransvalvular flow and AVA at baseline and peakdobutamine and extrapolating the value for AVA ata flow rate of 250 ml/s (29). This allows comparisonof AVA (and mean gradient) between patients at astandardized normal flow rate. Clavel et al. (30)have shown that projected AVA at normal trans-valvular flow is an important predictor of outcomein LGSAS and depressed LVEF.Other imaging modalities. DE is not able to distin-uish true AS from pseudo-AS in patients who failo increase transvalvular flow in response to inotro-
.2 m/s, mean gradient 25 mm Hg, calculated AVA 0.45 cm2. (B)y increased to 4.1 m/s, mean gradient to 39 mm Hg, and AVA(D) Results of global longitudinal strain, which was �5.5%, indi-vere aortic stenosis; other abbreviations as in Figures 1 and 2.
ity 3locitew.
ic stimulation (absent contractile reserve). Other
J A C C : C A R D I O V A S C U L A R I M A G I N G , V O L . 6 , N O . 2 , 2 0 1 3
F E B R U A R Y 2 0 1 3 : 1 8 4 – 9 5
Tandon and Grayburn
Imaging of Low-Gradient Severe Aortic Stenosis
190
imaging modalities can be helpful in such patients.One simple, and often overlooked, method is sim-ply evaluating aortic valve morphology on echocar-diography. True AS would be expected to havesignificant calcification and immobility of the aorticcusps. A morphologically normal or nearly normalaortic valve would indicate that AVA was calculatederroneously, or the velocity profile is coming from adifferent location than the aortic valve, such assubvalvular or supravalvular obstruction. Occasion-
Table 1. Perioperative Mortality and Long-Term Survival in Ope
First Author (Ref. #)
Presence of Contractile Res
Perioperative MortalityRate for Patients WithAVR With/Without
CABG
Monin et al. (22) 8%
Schwammenthal et al. (23) 0%
Monin et al. (24) 5%
Levy et al. (25) 8%
Quere et al. (26) 6%
Tribouilloy et al. (27) —
Figure 4. Example of DE in a Patient With Pseudo-AS
CW Doppler spectra at baseline, 5 �g/kg/min, 10 �g/kg/min, and 2dobutamine, peak velocity remained fairly constant, but AVA increaand absence of severe AS. Abbreviations as in Figures 1, 2, and 3.
CABG � coronary artery bypass graft; DE � dobutamine echocardiography; LGSAS
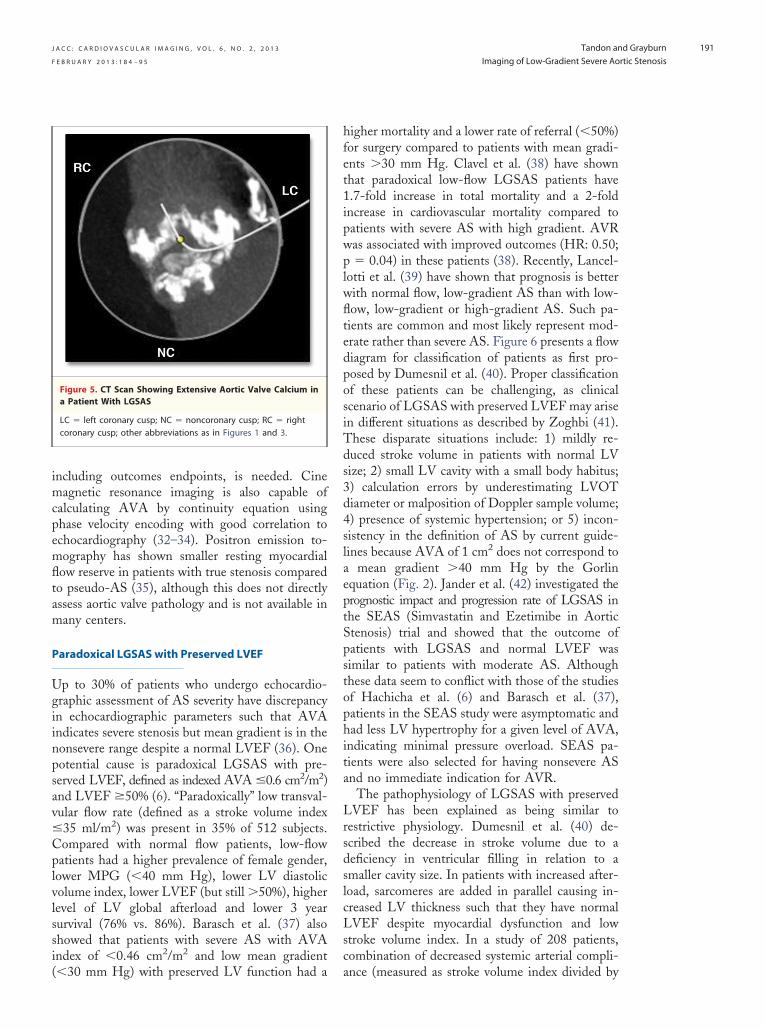
ally, a continuous wave Doppler profile from mitralregurgitation can be mistaken for AS. Fluoroscopyor CT scanning would be expected to show signif-icant aortic valve calcification in true AS (Fig. 5).Aortic valve calcium score measured by multisliceCT has been useful in differentiating true AS frompseudo-AS in patients with depressed LVEF (31).A calcium score �1,651 had 93% sensitivity and75% specificity in identifying patients with true AS.Further validation of aortic valve calcium by CT,
d Patients of LGSAS With and Without Contractile Reserve
by DE Absence of Contractile Reserve by DE
ng-Termrvival inperatedatients
Perioperative MortalityRate for Patients WithAVR With/Without
CABG
Long-TermSurvival inOperatedPatients
at 5 years 50% —
— — —
at 3 years 32% —
38%
at 2 years 33% 90% at 2 years
— 22% 54% at 5 years
/kg/min, respectively. At increasing levels of forward flow withfrom 1.0 cm2 to 1.4 cm2, demonstrating both contractile reserve
rate
erve
LoSuOP
88%
79%
92%
0 �gsed
� low-gradient severe aortic stenosis.
lwfltedposiTds3d4slaeptSpstophita
LrsdslcLsc
J A C C : C A R D I O V A S C U L A R I M A G I N G , V O L . 6 , N O . 2 , 2 0 1 3
F E B R U A R Y 2 0 1 3 : 1 8 4 – 9 5
Tandon and Grayburn
Imaging of Low-Gradient Severe Aortic Stenosis
191
including outcomes endpoints, is needed. Cinemagnetic resonance imaging is also capable ofcalculating AVA by continuity equation usingphase velocity encoding with good correlation toechocardiography (32–34). Positron emission to-mography has shown smaller resting myocardialflow reserve in patients with true stenosis comparedto pseudo-AS (35), although this does not directlyassess aortic valve pathology and is not available inmany centers.
Paradoxical LGSAS with Preserved LVEF
Up to 30% of patients who undergo echocardio-graphic assessment of AS severity have discrepancyin echocardiographic parameters such that AVAindicates severe stenosis but mean gradient is in thenonsevere range despite a normal LVEF (36). Onepotential cause is paradoxical LGSAS with pre-served LVEF, defined as indexed AVA �0.6 cm2/m2)and LVEF �50% (6). “Paradoxically” low transval-vular flow rate (defined as a stroke volume index�35 ml/m2) was present in 35% of 512 subjects.Compared with normal flow patients, low-flowpatients had a higher prevalence of female gender,lower MPG (�40 mm Hg), lower LV diastolicvolume index, lower LVEF (but still �50%), higherlevel of LV global afterload and lower 3 yearsurvival (76% vs. 86%). Barasch et al. (37) alsoshowed that patients with severe AS with AVAindex of �0.46 cm2/m2 and low mean gradient
Figure 5. CT Scan Showing Extensive Aortic Valve Calcium ina Patient With LGSAS
LC � left coronary cusp; NC � noncoronary cusp; RC � rightcoronary cusp; other abbreviations as in Figures 1 and 3.
(�30 mm Hg) with preserved LV function had a a
higher mortality and a lower rate of referral (�50%)for surgery compared to patients with mean gradi-ents �30 mm Hg. Clavel et al. (38) have shownthat paradoxical low-flow LGSAS patients have1.7-fold increase in total mortality and a 2-foldincrease in cardiovascular mortality compared topatients with severe AS with high gradient. AVRwas associated with improved outcomes (HR: 0.50;p � 0.04) in these patients (38). Recently, Lancel-otti et al. (39) have shown that prognosis is betterith normal flow, low-gradient AS than with low-ow, low-gradient or high-gradient AS. Such pa-ients are common and most likely represent mod-rate rather than severe AS. Figure 6 presents a flowiagram for classification of patients as first pro-osed by Dumesnil et al. (40). Proper classificationf these patients can be challenging, as clinicalcenario of LGSAS with preserved LVEF may arisen different situations as described by Zoghbi (41).hese disparate situations include: 1) mildly re-uced stroke volume in patients with normal LVize; 2) small LV cavity with a small body habitus;) calculation errors by underestimating LVOTiameter or malposition of Doppler sample volume;) presence of systemic hypertension; or 5) incon-istency in the definition of AS by current guide-ines because AVA of 1 cm2 does not correspond to
mean gradient �40 mm Hg by the Gorlinquation (Fig. 2). Jander et al. (42) investigated therognostic impact and progression rate of LGSAS inhe SEAS (Simvastatin and Ezetimibe in Aortictenosis) trial and showed that the outcome ofatients with LGSAS and normal LVEF wasimilar to patients with moderate AS. Althoughhese data seem to conflict with those of the studiesf Hachicha et al. (6) and Barasch et al. (37),atients in the SEAS study were asymptomatic andad less LV hypertrophy for a given level of AVA,
ndicating minimal pressure overload. SEAS pa-ients were also selected for having nonsevere ASnd no immediate indication for AVR.
The pathophysiology of LGSAS with preservedVEF has been explained as being similar to
estrictive physiology. Dumesnil et al. (40) de-cribed the decrease in stroke volume due to aeficiency in ventricular filling in relation to amaller cavity size. In patients with increased after-oad, sarcomeres are added in parallel causing in-reased LV thickness such that they have normalVEF despite myocardial dysfunction and low
troke volume index. In a study of 208 patients,ombination of decreased systemic arterial compli-
nce (measured as stroke volume index divided by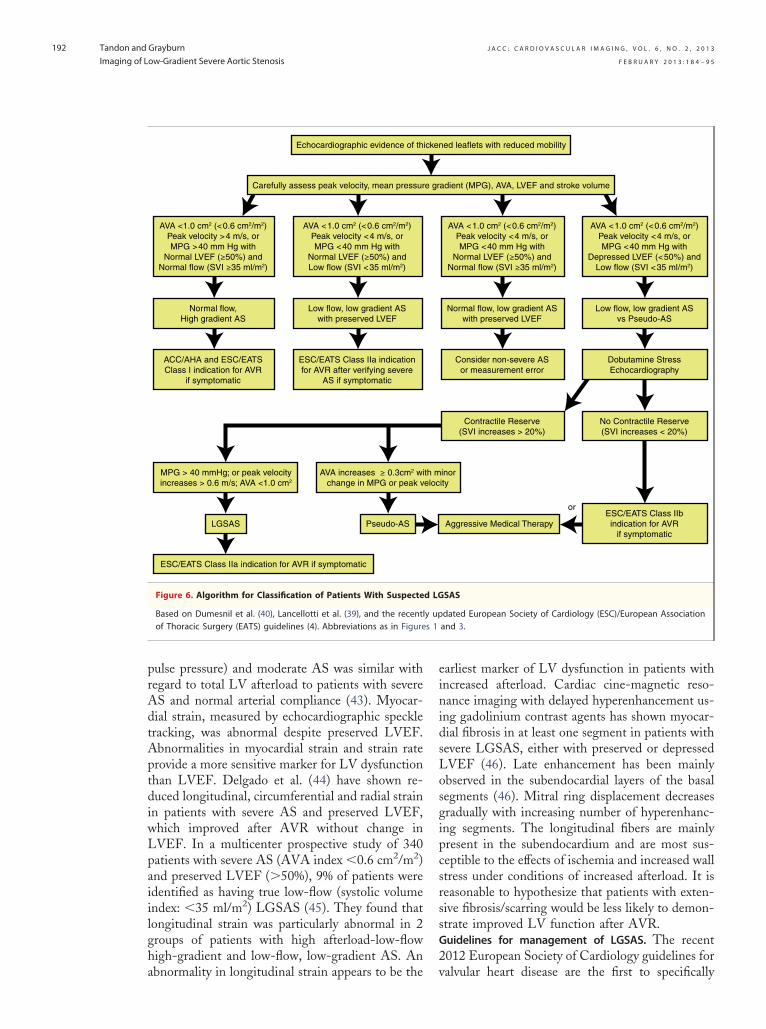
s 1
J A C C : C A R D I O V A S C U L A R I M A G I N G , V O L . 6 , N O . 2 , 2 0 1 3
F E B R U A R Y 2 0 1 3 : 1 8 4 – 9 5
Tandon and Grayburn
Imaging of Low-Gradient Severe Aortic Stenosis
192
pulse pressure) and moderate AS was similar withregard to total LV afterload to patients with severeAS and normal arterial compliance (43). Myocar-dial strain, measured by echocardiographic speckletracking, was abnormal despite preserved LVEF.Abnormalities in myocardial strain and strain rateprovide a more sensitive marker for LV dysfunctionthan LVEF. Delgado et al. (44) have shown re-duced longitudinal, circumferential and radial strainin patients with severe AS and preserved LVEF,which improved after AVR without change inLVEF. In a multicenter prospective study of 340patients with severe AS (AVA index �0.6 cm2/m2)and preserved LVEF (�50%), 9% of patients wereidentified as having true low-flow (systolic volumeindex: �35 ml/m2) LGSAS (45). They found thatlongitudinal strain was particularly abnormal in 2groups of patients with high afterload-low-flowhigh-gradient and low-flow, low-gradient AS. An
Echocardiographic evidence of th
ESC/EATS Class IIa indication for AVR if symptomatic
LGSAS Pseudo-AS
Carefully assess peak velocity, mean pressur
AVA <1.0 cm2 (<0.6 cm2/m2)Peak velocity >4 m/s, orMPG >40 mm Hg with
Normal LVEF (≥50%) andNormal flow (SVI ≥35 ml/m2)
AVA <1.0 cm2 (<0.6 cm2/m2)Peak velocity <4 m/s, orMPG <40 mm Hg with
Normal LVEF (≥50%) andLow flow (SVI <35 ml/m2)
Normal flow,High gradient AS
Low flow, low gradient ASwith preserved LVEF
ACC/AHA and ESC/EATSClass I indication for AVR
if symptomatic
ESC/EATS Class IIa indicationfor AVR after verifying severe
AS if symptomatic
MPG > 40 mmHg; or peak velocityincreases > 0.6 m/s; AVA <1.0 cm2
AVA increases ≥ 0.3cm2 wichange in MPG or peak v
Figure 6. Algorithm for Classification of Patients With Suspecte
Based on Dumesnil et al. (40), Lancellotti et al. (39), and the recentlof Thoracic Surgery (EATS) guidelines (4). Abbreviations as in Figure
abnormality in longitudinal strain appears to be the
earliest marker of LV dysfunction in patients withincreased afterload. Cardiac cine-magnetic reso-nance imaging with delayed hyperenhancement us-ing gadolinium contrast agents has shown myocar-dial fibrosis in at least one segment in patients withsevere LGSAS, either with preserved or depressedLVEF (46). Late enhancement has been mainlyobserved in the subendocardial layers of the basalsegments (46). Mitral ring displacement decreasesgradually with increasing number of hyperenhanc-ing segments. The longitudinal fibers are mainlypresent in the subendocardium and are most sus-ceptible to the effects of ischemia and increased wallstress under conditions of increased afterload. It isreasonable to hypothesize that patients with exten-sive fibrosis/scarring would be less likely to demon-strate improved LV function after AVR.Guidelines for management of LGSAS. The recent2012 European Society of Cardiology guidelines for
ed leaflets with reduced mobility
Aggressive Medical Therapy
adient (MPG), AVA, LVEF and stroke volume
AVA <1.0 cm2 (<0.6 cm2/m2)Peak velocity <4 m/s, orMPG <40 mm Hg with
Normal LVEF (≥50%) andNormal flow (SVI ≥35 ml/m2)
AVA <1.0 cm2 (<0.6 cm2/m2)Peak velocity <4 m/s, orMPG <40 mm Hg with
Depressed LVEF (<50%) andLow flow (SVI <35 ml/m2)
Normal flow, low gradient ASwith preserved LVEF
Low flow, low gradient ASvs Pseudo-AS
Consider non-severe ASor measurement error
Dobutamine StressEchocardiography
Contractile Reserve(SVI increases > 20%)
inority
No Contractile Reserve(SVI increases < 20%)
ESC/EATS Class IIbindication for AVR
if symptomatic
or
SAS
dated European Society of Cardiology (ESC)/European Associationand 3.
icken
e gr
th meloc
d LG
y up
valvular heart disease are the first to specifically
bH
J A C C : C A R D I O V A S C U L A R I M A G I N G , V O L . 6 , N O . 2 , 2 0 1 3
F E B R U A R Y 2 0 1 3 : 1 8 4 – 9 5
Tandon and Grayburn
Imaging of Low-Gradient Severe Aortic Stenosis
193
mention indications for AVR in patients withLGSAS (4). AVR may be considered a Class IIarecommendation in the following two circum-stances: 1) “symptomatic patients with low-flow,low-gradient (�40 mm Hg) AS with normal EFonly after careful confirmation of severe AS”; and2) “symptomatic patients with severe AS, low flow,low gradient with reduced EF, and evidence of flowreserve” (4).
Furthermore, AVR may be considered a ClassIIb recommendation in “symptomatic patients withsevere AS, low flow, low gradient with LV dysfunc-tion without flow reserve.” In patients with pseudo-AS, management should be targeted to the under-lying LV dysfunction (47), and should includeaggressive heart failure therapy and cardiac resyn-chronization if indicated by LVEF �35% and leftbundle branch block.Role of TAVI in LGSAS. The development of TAVI asan alternative to AVR for high-risk patients may bewell suited to this group of patients. Clavel et al.(48) reported that TAVI was superior to AVR in asubset of patients with low LVEF at baseline,although not all of the patients had LGSAS.Ben-Dor et al. (49) reported the outcomes of highrisk patients with LVEF �40% undergoing eitherTAVI or AVR. Late mortality was higher withLGSAS (54%) than with high gradient (41%) butLV functional recovery occurred with both TAVIand AVR in survivors. Lauten et al. (50) publishedtheir results of TAVI in 149 patients (from the GermanTAVI registry) with LGSAS (�40 mm Hg) with low
et al. Guidelines on the management 115:2856 – 64.
for the LGSAS group compared with 18% inpatients with normal LV function. This clearlydemonstrates that TAVI is feasible in this group ofpatients, although the mortality rate was high andtypical of that expected for open AVR. The ulti-mate role of TAVI in LGSAS without contractilereserve will need to be evaluated in a randomizedcontrolled trial.
Conclusions
Low-gradient AS presents a challenging clinicalsituation. In patients who have depressed LV sys-tolic function (LVEF �45%), DE helps in differ-entiating true AS from pseudo-AS and also givesvaluable prognostic information. In general, pa-tients with true AS can undergo surgery with a lowoperative mortality and improved long-term out-comes. In patients with preserved LVEF (LVEF�50%) it is important to determine the cause of lowforward stroke volume, and to distinguish LGSASfrom an erroneous calculation of AVA. Otherimaging techniques, including speckle tracking toevaluate LV myocardial performance, cine-magnetic res-onance imaging to evaluate LV scarring/fibrosis andCT scanning to assess aortic valve morphology mayhelp in evaluating LGSAS.
Reprint requests and correspondence: Dr. Paul A. Gray-urn, Baylor Heart and Vascular Institute, 621 Northall Street, Suite H030, Dallas, Texas 75226. E-mail:
LVEF (�40%). The mortality at 1 year was 37% [email protected].
R E F E R E N C E S
1. Iung B, Vahanian A. Epidemiology ofvalvular heart disease in the adult. NatRev Cardiol 2011;8:162–72.
2. Nkomo VT, Gardin JM, Skelton TN,Gottdiener JS, Scott CG, Enriquez-Sarano M. Burden of valvular heartdisease: a population-based study.Lancet 2006;368:1005–11.
3. Bonow RO, Carabello BA, ChatterjeeK, et al. ACC/AHA 2006 guidelinesfor the management of patients withvalvular heart disease: a report of theAmerican College of Cardiology/American Heart Association TaskForce on Practice Guidelines (WritingCommittee to Develop Guidelines forthe Management of Patients WithValvular Heart Disease). J Am CollCardiol 2006;48;1–148.
4. Vahanian A, Alfieri O, Andreotti F,
of valvular heart disease (version2012): The Joint Task Force on theManagement of Valvular Heart Dis-ease of the European Society of Car-diology (ESC) and the European As-sociation for Cardio-Thoracic Surgery(EACTS). Eur J Cardiothorac Surg2012;42:S1–44.
5. Carabello BA, Green LH, GrossmanW, Cohn LH, Koster JK, Collins JJJr. Hemodynamic determinants ofprognosis of aortic valve replacementin critical aortic stenosis and advancedcongestive heart failure. Circulation1980:62:42–8.
6. Hachicha Z, Dumesnil JG, Bogaty P,Pibarot P. Paradoxical low-flow, low-gradient severe aortic stenosis despitepreserved ejection fraction is associ-ated with higher afterload and re-duced survival. Circulation 2007;
7. Gorlin R, Gorlin SG: Hydraulic for-mula for calculation of the area of thestenotic mitral valve, other cardiacvalves, and central circulatory shunts.Am Heart J 1951:41:1–29.
8. Cannon SR, Richards KL, CrawfordM. Hydraulic estimation of stenoticorifice area: a correction of the gorlinformula. Circulation 1985:71:1170–8.
9. Burwash IG, Thomas DD, SadahiroM, et al. Dependence of Gorlin for-mula and continuity equation valveareas on transvalvular volume flow ratein valvular aortic stenosis. Circulation1994:89:827–35.
10. Cannon JD, Zile MR, Crawford FA,Carabello BA. Aortic valve resistanceas an adjunct to the gorlin formula inassessing the severity of aortic stenosisin symptomatic patients. J Am Coll
Cardiol 1992:20:1517–23.
1
1
1
1
1
1
1
1
2
2
2
2
2
2
2
2
2
2
3
3
J A C C : C A R D I O V A S C U L A R I M A G I N G , V O L . 6 , N O . 2 , 2 0 1 3
F E B R U A R Y 2 0 1 3 : 1 8 4 – 9 5
Tandon and Grayburn
Imaging of Low-Gradient Severe Aortic Stenosis
194
11. Cigarroa RG, Lange RA, WilliamsRH, Bedotto JB, Hillis LD. Underes-timation of cardiac output by ther-modilution in patients with tricuspidregurgitation. Am J Med 1989;86:417–20.
2. Quiñones MA, Otto CM, StoddardM, Waggoner A, Zoghbi WA. Rec-ommendations for quantification ofDoppler echocardiography: a reportfrom the Doppler quantification taskforce of the nomenclature and stan-dards committee of the American So-ciety of Echocardiography. J Am SocEchocardiogr 2002;15:176–84.
3. Gaspar T, Adawi S, Sachner R, et al.Three-dimensional imaging of the leftventricular outflow tract: impact onaortic valve area estimation by thecontinuity equation. J Am Soc Echo-cardiogr 2012;25:749–57.
4. Leipsic J, Gurvitch R, Labounty TM,et al. Multidetector computed tomog-raphy in transcatheter aortic valve im-plantation. J Am Coll Cardiol Img2011;4:416–29.
5. Altiok E, Koos R, Schroder J, et al.Comparison of two-dimensional andthree-dimensional imaging techniquesfor measurement of aortic annulus di-ameters before transcatheter aorticvalve implantation. Heart 2011;97:1578–84.
6. Lang RM, Badano LP, Tsang W, et al.EAE/ASE recommendations for imageacquisition and display using three-dimensional echocardiography. J AmSoc Echocardiogr 2012;25:3–46.
7. Konstam MA, Kramer DG, PatelAR, Maron MS, Udelson JE. Leftventricular remodeling in heart failure:current concepts in clinical signifi-cance and assessment. J Am Coll Car-diol Img 2011;4:98–108.
8. Grayburn PA. Assessment of low-gradient aortic stenosis with dobut-amine. Circulation 2006;113:604–6.
9. deFilippi CR, Willett DL, BricknerME, et al. Usefulness of dobutamineechocardiography in distinguishingsevere from non-severe valvular aorticstenosis in patients with depressed leftventricular function and low transval-vular gradients. Am J Cardiol 1995;75:191–4.
0. Brogan WC, Grayburn PA, LangeRA, Hillis LD. Prognosis after valvereplacement in patients with severeaortic stenosis and a low transvalvularpressure gradient. J Am Coll Cardiol1993;21:1657–60.
1. Connolly HM, Oh JK, Schaff HV, etal. Severe aortic stenosis with lowtransvalvular gradient and severe leftventricular dysfunction: results of aor-tic valve replacement in 52 patients.
Circulation 2000;101:1940–6.2. Monin J-L, Monchi M, Gest V,Duval-Moulin AM, Dubois-RandeJL, Gueret P. Aortic stenosis withsevere left ventricular dysfunction andlow transvalvular pressure gradients:risk stratification by low-dose dobut-amine echocardiography. J Am CollCardiol 2001;37:2101–7.
3. Schwammenthal E, Vered Z, Mosh-kowitz Y, et al. Dobutamine echocar-diography in patients with aortic ste-nosis and left ventricular dysfunction:predicting outcome as a function ofmanagement strategy. Chest 2001;119:1766–7.
4. Monin JL, Quere JP, Monchi M, et al.Low-gradient aortic stenosis: operativerisk stratification and predictors forlong-term outcome: a multicenter studyusing dobutamine stress hemodynamics.Circulation 2003;108:319–24.
5. Levy F, Laurent M, Monin JL, et al.Aortic valve replacement for low-flow/low gradient aortic stenosis: op-erative risk stratification and long termoutcome: a European multicenterstudy. J Am Coll Cardiol 2008;51:1466–72.
6. Quere JP, Monin JL, Levy F, et al.Influence of pre-operative left ventric-ular contractile reserve on postopera-tive ejection fraction in low gradientaortic stenosis. Circulation 2006;113:1738–44.
7. Tribouilloy C, Lévy F, Rusinaru D, etal. Outcome after aortic valve replace-ment for low flow/low gradient aorticstenosis without contractile reserve ondobutamine stress echocardiography.J Am Coll Cardiol 2009;53:1865–73.
8. Blais C, Burwash IG, Mundigler G,et al. The projected valve area at nor-mal flow rate improves the assessmentof stenosis severity in patients withlow flow, low gradient aortic stenosis.The multicenter TOPAS (Truly OrPseudo Severe Aortic Stenosis) study.Circulation 2006;113:711–21.
9. Clavel MA, Burwash IG, MundiglerG, et al. Validation of conventionaland simplified methods to calculateprojected valve area at normal flowrate in patients with low flow, lowgradient aortic stenosis: the multi-center TOPAS (True or Pseudo Se-vere Aortic Stenosis) study. J Am SocEchocardiogr 2010;23:380–6.
0. Clavel MA, Fuchs C, Burwash IG, etal. Predictors of outcomes in low-flow, low-gradient aortic stenosis: re-sults of the multicenter TOPASStudy. Circulation 2008;118:234–42.
1. Cueff C, Serfaty JM, Cimadevilla C,et al. Measurement of aortic valvecalcification using multislice com-puted tomography: correlation withhemodynamic severity of aortic steno-
sis and clinical implication for patientswith low ejection fraction. Heart2011;97:721–6.
32. Caruthers SD, Lin SJ, Brown P, et al.Practical value of cardiac magneticresonance imaging for clinical quanti-fication of aortic valve stenosis: com-parison with echocardiography. Cir-culation 2003;108:2236–43.
33. Yap SC, van Geuns RJ, Meijboom FJ.et al. A simplified continuity equationapproach to the quantification of ste-notic bicuspid aortic valves usingvelocity-encoded cardiovascular mag-netic resonance. J Cardiovasc MagnReson 2007;9:899–906.
34. Garcia J, Kadem L, Larose E, ClavelMA, Pibarot P. Comparison betweencardiovascular magnetic resonanceand transthoracic Doppler echocardi-ography for the estimation of effectiveorifice area in aortic stenosis. J Car-diovasc Magn Reson 2011;13:25.
35. Burwash IG, Lortie M, Pibarot P, etal. Myocardial blood flow in patientswith low flow, low gradient aorticstenosis: differences between true andpseudo severe aortic stenosis. Resultsfrom the multicenter TOPAS study.Heart 2008;94:1627–33.
36. Minners J, Allgeier M, Gohlke-Baerwolf C, Kienzle RP, NeumannFJ, Jander N. Inconsistent grading ofaortic valve stenosis by current guide-lines: haemodynamic studies in pa-tients with apparently normal left ven-tricular function. Eur Heart J 2008;29:1043–8.
37. Barasch E, Fan D, Chukwu EO, et al.Severe isolated aortic stenosis withnormal left systolic function and lowtransvalvular gradient: pathophysio-logic and prognostic insights. J HeartValv Dis 2008;17:81–8.
38. Clavel MA, Dumesnil JG, CapouladeR, Mathieu P, Sénéchal M, Pibarot P.Outcome of patients with aortic ste-nosis, small valve area, and low flow,low gradient despite preserved leftventricular ejection fraction. J AmColl Cardiol 2012;60:1259–67.
39. Lancellotti P, Magne J, Donal E, et al.Clinical outcome in asymptomatic se-vere aortic stenosis: insights from thenew proposed aortic stenosis gradingclassification. J Am Coll Cardiol2012;59:235–43.
40. Dumesnil JG, Pibarot P, Carabello B.Paradoxical low flow and/or low gra-dient severe aortic stenosis despitepreserved left ventricular ejection frac-tion: implications for diagnosis andtreatment. Eur Heart J 2010;31:281–9.
41. Zoghbi WA. Low gradient “severe”aortic stenosis with normal systolicfunction: time to refine the guidelines?
Circulation 2011;123:838–40.
4
4
4
4
4
4
4
5
J A C C : C A R D I O V A S C U L A R I M A G I N G , V O L . 6 , N O . 2 , 2 0 1 3
F E B R U A R Y 2 0 1 3 : 1 8 4 – 9 5
Tandon and Grayburn
Imaging of Low-Gradient Severe Aortic Stenosis
195
42. Jander N, Minners J, Holme I, et al.Outcome of patients with low-gradient “severe” aortic stenosis andpreserved ejection fraction. Circula-tion 2011;123:887–95.
3. Lancellotti P, Donal E, Magne J, et al.Impact of global left ventricular after-load on left ventricular function inasymptomatic severe aortic stenosis: atwo-dimensional speckle-trackingstudy. Eur J Echocardiogr 2010;11:537–43.
4. Delgado V, Tops LF, van BommelRJ, et al. Strain analysis in patientswith severe aortic stenosis and pre-served left ventricular ejection fractionundergoing surgical valve replace-ment. Eur Heart J 2009;30:3037–47.
5. Adda J, Mielot C, Giorgi R, et al.Low flow, low gradient severe aortic
stenosis despite normal ejection frac-tion is associated with severe left ven-tricular dysfunction as assessed byspeckle-tracking echocardiography: amulticenter study. Circ CardiovascImaging 2012;5:27–35.
6. Herrmann S, Stork S, Niemann M, etal. Low-gradient aortic valve stenosismyocardial fibrosis and its influenceon function and outcome. J Am CollCardiol 2011;58:402–12.
7. Fougeres E, Tribouilloy C, MonchiM, et al. Outcomes of pseudo-severeaortic stenosis under conservativetreatment. Eur Heart J 2012;33:2426–33.
8. Clavel MA, Webb JG, Rodes-CabauJ, et al. Comparison between trans-catheter and surgical prosthetic valveimplantation in patients with severe
aortic stenosis and reduced left ven-tricular ejection fraction. Circulation2010;122:1928–36.
9. Ben-Dor I, Maluenda G, Iyasu GD,et al. Comparison of outcome ofhigher versus lower transvalvular gra-dients in patients with severe aorticstenosis and low (�40%) left ventric-ular ejection fraction. Am J Cardiol2012;109:1031–7.
0. Lauten A, Zahn R, Horack M, et al.Transcatheter aortic valve implanta-tion in patients with low-flow, low-gradient aortic stenosis. J Am CollCardiol Intv 2012;5:552–9.
Key Words: cardiac imaging ydobutamine echocardiography ylow gradient aortic stenosis y
valvular heart disease.To participate in this CME activity by taking the quizand claiming your CME credit certificate, please go to
www.imaging.onlinejacc.organd select the CME tab on the top navigation bar.