state of new hampshire department of … of two hundred and fifty million dollars ($250,000,000). in...
TRANSCRIPT

STATE OF NEW HAMPSHIREDEPARTMENT OF REVENUE ADMINISTRATION
PO BOX 457CONCORD NH 03302-0457
2012ANNUAL REPORT


MISSION The mission of the Department of Revenue Administration is to collect the proper amount of taxes due, incurring the least cost to the taxpayers, and in a manner that merits the highest degree of public confidence in our integrity, efficiency and fairness. Further, it must provide prompt and constructive assistance to the municipal units of government in matters of budget, finance, and the appraisal of real estate. This report is submitted to Governor John Lynch and Members of the Executive Council: 1st District - Raymond S. Burton 2nd District - Daniel St. Hilaire 3rd District - Christopher T. Sununu 4th District - Raymond J. Wieczorek 5th District - David K. Wheeler


Letter from the Commissioner October 2012 In Fiscal Year 2010 the Department of Revenue Administration (DRA) was awarded a capital appropriation of seven million dollars ($7,000,000) to modernize and automate its internal processing systems. From 2010 to 2011 the DRA engaged in the necessary project planning, design and procurement processes to arrange for final implementation of these systems improvements during the 2012-2013 biennium. Fiscal Year 2012 was both a challenging and a rewarding year for the DRA. In anticipation of the implementation of new computer systems, the Governor recommended an Operating Budget that would have reduced the DRA staffing by thirty-six (36) employees, a twenty percent (-20%) reduction. Although considered an aggressive reduction this would have allowed the DRA to implement its new systems in a timely manner and in accordance with industry best practice. However, the Operating Budget enacted by the Legislature actually resulted in fifty-one (51) employees having to be laid-off and no money being appropriated for either overtime or temporary help for systems implementation. Faced with significant reductions in both its Operating Budget (-30%) and its staffing (-43%) a reduction of 98 positions, and -31% in actual employees, the DRA reorganized and re-engineered its operations, and introduced the new systems aimed at making the DRA more efficient. The system and process reengineering efforts that are being painstakingly developed and implemented will allow DRA to work smarter, think differently, and react differently, with greater customer service/convenience value potential. The analytics capability that is now being built into the DRA’s “legacy” computer systems will provide for better informed tax policy discussions and decisions throughout the State. These efforts by the DRA experienced some delay in implementation primarily due to the lack of employees. The reduction in DRA employees has stressed the systems implementation process and has also contributed to a reduction or approximately $20 million in audit revenue. During Fiscal Year 2012, the DRA continued to implement and refine the various elements of its multi-year business plan for modernizing its operations. The DRA successfully launched the electronic deposit function of its new scanning equipment and has, to date, processed over 200,000 checks totaling in excess of two hundred and fifty million dollars ($250,000,000). In addition, the DRA put into full production the document processing component of the new remittance processing system. To date, over one hundred thousand (100,000) transactions have been processed. While there is still a significant backlog of approximately sixty thousand (60,000) transactions that need to be processed, the preliminary results associated with this exercise are very promising. The DRA has a series of initiatives including reassignment of resources within the DRA, awarding of an outside consultant data entry contract, and shared resources from other state agencies to address this final data verification phase of the project which should be completed by the end of Fiscal Year 2013. While the systems implementation process, to date, has been perhaps inconsistent with best practice and slightly off schedule, it is nonetheless, nearing successful completion. Also, it is important to note that what has been accomplished by the DRA over the past two years has been recognized nationally. The State Tax Notes recognized the Assistant Commissioner of Revenue, Margaret “Missy” Fulton, of the State of New Hampshire with the national recognition of “Tax Administrator of the Year” for her role in implementing the wide array of new and innovative systems enhancements at the DRA. Government Technology Magazine (website) recognized the State when it awarded its “Best Integrator of the Year Award” to a vendor partnering with the State on its State’s Tax Management Information System (ITIMS). Harvard University honored the State/DRA with one of its “Bright Idea Awards” for the implementation of the country’s first sustained statewide Geospatial Information System (GIS). It is also important to note that the State’s return on its seven million dollar ($7,000,000) investment (ROI) has already been realized and that beginning with Fiscal Year 2014 ongoing savings will now be net of investment. This is a significant accomplishment in any government or business setting and would have been realized under either the Governor’s Recommended Budget or the actual Adopted Budget. The key here is that the employees of the DRA have made the difference. They have been extremely dedicated and resourceful, they have learned new systems and procedures and they have also cross-trained to cover other divisions’ peak periods. They have embraced LEAN processing to streamline internal functions to achieve better customer satisfaction. In spite of the gauntlet of obstacles placed in front of it, the DRA has ended Fiscal Year 2012 within its Budget and is poised to deliver state-of-the-art systems improvements that will benefit the State well into the future.

The State should seriously consider these systems applications beyond the DRA to include other state agencies, for example statewide electronic remittance processing, electronic accounts receivable/collections (to include centralized bankruptcy management), and of course electronic document processing and retention. The State should also move toward the creation of a centralized database for identifying and tracking all businesses of any type or size operating within the State. Such a system would not only benefit state agencies, but all of the State’s local political sub-divisions as well. As a result of the most recent 2012 Legislative Session, several laws were enacted that will have an impact in Fiscal Year 2013 revenue. The Adopted Budget resulted in a reduction in audit personnel and as a consequence, $22 million less in audit revenue in Fiscal Year 2012. It is estimated that a reduction in the Tobacco Tax rate from 1.7% to 1.6% (without any reduction in price by the vendors) will result in approximately $20 million less revenue. This decline is anticipated to continue until the end of Fiscal Year 2013 when a statutory review and possible rate increase is scheduled. Legislation adopted in Fiscal Year 2012, but not taking effect until Fiscal Year 2013, involves: increasing the allowance for net operating loss (NOL) from $1 million to $10 million, increasing the filing threshold for Business Enterprise Tax (BET), and adoption of the Education Tax Credit program with a cap of $3.4 million in credits available for the first year. Also repeal of certain sections of the Communications Services Tax will affect payments collected from taxpayers and remitted by telecommunications companies. The projected combined impact of these changes is consistently estimated at approximately $37 million less revenue. During Fiscal Years 2011 and 2012, Medicaid Enhancement Tax (MET) payments, (October) and tax returns (July) received from hospitals were substantially less than Department of Health and Human Services (DHHS) revenue estimates for the respective periods. DRA continues to work with these taxpayers (28 hospitals) to try and resolve their disputed claims. Many of these claims are either within the statutory hearings/appeals process or the court system. The State’s ranking in the Tax Foundation’s Annual State Business Tax Climate Index Report slipped from the fourth (4th) best in the country to the sixth (6th) best. This was due primarily to the State’s Business Enterprise Tax (BET) now being considered by the Foundation as an Alternative Minimum Tax (AMT) whereas it had not been categorized as such in the past. Pages 95 to 97 of this year’s report provides some comparative tax information about New Hampshire and New England. Fiscal Year 2013 presents a similar challenge to the DRA, completing the Granite-to-Green Project while sustaining existing operations with fewer resources will once again be difficult. The DRA has achieved remarkable accomplishments under the most difficult circumstances this past year. The DRA’s employees have reacted in a positive, professional and dedicated fashion that is admirable. However, it would be folly to think that this level of achievement can be sustained for much longer. People working tirelessly in the DRA are getting burned out. Equally important, as good a job as has been done, there are things that just are not being addressed due to the shortage of employees. Over time these unattended duties and functions will compound and become seriously problematic for the State. Needless to say the State does not need to restore the DRA back to its previous funding and staffing levels. However, in order for the DRA to operate, at least somewhat efficiently, in the future, there is a need to introduce several strategically placed positions throughout the organization that require either different knowledge or experience than is currently present in the DRA. The New Hampshire Certified Public Accountants Society, New Hampshire Bar Association, Department of Information Technology, New Hampshire Tax Collectors Association and Executive Council have all been supportive throughout Fiscal Year 2012 and their contributions to the systems improvements in particular have helped the DRA to produce significant results under such difficult circumstances. Their help is very much appreciated. Respectfully Submitted
Kevin A. Clougherty Commissioner

I. TABLE OF CONTENTS II. Division Primary Functions and Organizational Chart ................................................. 6 III. Technology Developments .......................................................................................... 7 IV. Property Tax Developments ........................................................................................ 10 V. Voluntary Compliance – Document Processing & Central Tax Services .................... 17 VI. Enforcement Compliance – Audits & Collections ........................................................ 18 VII. Legal Developments .................................................................................................... 21 VIII. Summary of Taxes ....................................................................................................... 25 IX. Revenue and Statistics ................................................................................................ 79 X. Supporting Details........................................................................................................ 85 XI. Property Tax Tables by County ................................................................................... 99 XII. Equalization Survey ..................................................................................................... 131 XIII. Assessment Review Report ......................................................................................... 177

II. ORGANIZATIONAL CHART DIVISION PRIMARY FUNCTIONS
Administration Unit - Performs administrative functions necessary to support Department operations including accounting, adjudicative and administrative hearings, legislative support, fleet and facility maintenance, human resources, project management, purchasing and taxpayer advocacy. Audit Division - Conducts audits of tax returns of individuals, partnerships, estates, trusts, corporations, and documents filed with the Department to ensure compliance with New Hampshire tax laws and rules. Central Tax Services Unit - Provides general assistance to the public for all taxes administered by the Department and acts within the Department as an advocate for taxpayers. Collections Division - Initiates collection activities in pursuit of delinquent tax returns and payments for all taxes administered by the Department. Document Processing Division - Receives, sends, processes, stores, and retrieves all tax documents, return payments and electronic transactions filed with the Department. Municipal Services Division - Establishes and approves municipal, school, county and village district tax rates. Provides technical assistance, relative to taxation and finance, to the political subdivisions of the state; and prescribes a uniform chart of accounts for all municipalities, schools, counties and village districts. Office of Information Technology (Embedded Personnel) - Designs, develops and maintains computerized systems to support the administration of taxes and to automate labor intensive functions. Property Appraisal Division – Assists and educates municipalities with the methods of appraisal and assessment of real property. Provides appraisal revaluation services statewide to municipalities. Equalizes the local assessed valuation of each municipality to bring such valuations to the full and true market value of the property. Advises and assists municipalities and taxpayers in full and true appraisals and timely collection of timber yield tax. Appraises public utility and railroad property for equalization, as well as local tax purposes. Assists local municipalities with the administration of the Current Use law (RSA 79-A).
NH DRA 2012 Annual Report - Page 6

“GRANITE TO GREEN”
III TECHNOLOGY DEVELOPMENTS The DRA’s modernization program continues to evolve and enable the State’s administration of its various taxes in a more automated fashion leveraging systems and applications to extract and validate tax form data. The State’s Tax Information Management System (TIMS) continues to serve as the centerpiece of the transactional backend along with additional software programs tailored to manage the implementation of a particular new tax. While the loosely integrated software applications are rich with transactional data related to each specific tax, an enhanced business intelligence application enables data mining, reporting and forecasting across the entire network. DRA now has the ability to perform detailed analysis across a single or multiple tax systems and derive actionable information from disparate data sources. Figure A is a graphic diagram of the previous manual processing system under which mail was manually opened and processed, followed by manual data entry of a subset of form data into the respective tax system (over the ensuing eight (8) months) and finally daily manual deposit via an armored car service. With so many disparate systems it is no wonder that the Department struggled with basic functions such as accounts receivable and case management.
Figure A
The limitations of the past systems not only restricted the DRA’s ability to fulfill its mission to ensure taxpayer compliance with state tax laws (by limiting the number, scope and timeliness of audit programs), it also impeded the Department’s ability to be responsive to legislative policy inquiries due to limited query and an analytical capabilities. Several proposals for replacement of the old system were advanced ranging in price from $20 million up to $50 million. Undoubtedly, the complete replacement of the system (s) with modern sophisticated software would result in better and more accurate and timely processing and information. However, the approach that DRA recommended and that the Legislature adopted in the 2009 session envisioned a different strategy at a much lower price tag of $7 million. Rather than replace the core of the system, the DRA modified the way it processes information through the system(s) and added features that will allow for more user-friendly applications for the production of better information.
NH DRA 2012 Annual Report - Page 7

As of third quarter 2012, the DRA is well on its way to meet its goal of modernizing critical aspects of their operations. Data is now universally accessed via a business intelligence and integration application and is easily managed and analyzed to ensure informed decision making. Performance management capabilities allow for dynamic workflow allocation and both individual and organizational productivity measures critical to the Department whose staffing was so significantly reduced. PROGRAM SCOPE AND TIMING: This program was designed and managed by the DRA with assistance from the Department of Information Technology (DoIT) and the University of New Hampshire (UNH). SCOPE: The proposed improvements to the Department of Revenue Administration data processing systems are comprised of four basic components: enhancements to the central processing system (s), addition of a graphics/statistical package, creation of a statewide GIS, and electronic remittance and deposit enhancements. The proposed project, dubbed the “Granite to Green Program” because of the antiquity and inflexibility of the existing system (s), is proceeding through four (4) phases over a two-year period. The 4 phases are broken out into sixteen (16) separate projects impacting virtually every DRA division. With the help of DoIT and UNH work plans, timelines, and work assignments for each project have been adopted and build up to a master time table and budget for the entire project. The planning and equipment efforts undertaken in FY 2010 will be followed up in FY 2011/12 with hardware, software, implementation, development and training. Chart A illustrates the “Granite to Green” initiatives, associated costs, and spending schedule.
Chart A
The Document Processing Division’s transformation from a manual document/data processing and deposit center to a systems based data processing and remote deposit center is near complete. The modernization effort began with the redesign of existing work space and the enhancement of HAZMAT systems. Research tools, including business intelligence, were deployed to each user. Tax specific Smartforms were implemented representing 80% of total volume received. Each form was redesigned and perfected with the addition of 1D and 2D bar codes to enhance form identification and data capture. The Smartforms include error and omission checking assisting the taxpayer with form completion while also creating a platform for e-file in upcoming tax years. All DRA forms have save and restore capabilities further enhancing the customer experience.
$1
05
,91
7
$1
,19
2,4
98
$1
,20
9,6
00
$1
,91
6,2
62
$1
,97
1,9
63
$2
,22
5,0
76
$2
,25
8,3
85
$2
,29
9,0
48
$2
,38
1,5
12
$2
,46
9,2
10
$2
,55
1,5
05
$2
,60
4,5
66
$2
,95
4,7
39
$7
,00
0,0
00
$0
$1,000,000
$2,000,000
$3,000,000
$4,000,000
$5,000,000
$6,000,000
$7,000,000
$8,000,000 E-Pay Cisco VoIP Call Center BPA & Forms FairFax Server Upgrades BI & FTI Migration Mainframe & DR
NH DRA 2012 Annual Report - Page 8

Mail extraction and image capture systems, both in production, allow for performance management and dynamic workforce allocation. The image capture system includes scanning each document and check and extracting 100% of the data from each. The data is system validated but also includes a workflow management component for those data elements that fail to meet acceptable confidence levels. The check image and associated data components allow for remote deposit via Check 21 minimizing processing fees while negating the costs and inefficiencies associated with manual deposit. Business Intelligence (BI), Integration, and new Systems: The first BI initiative, the Single View of the Taxpayer, was launched in July 2011 and encompasses all tax systems providing a 360 degree view of a tax entity. Dashboards have been created for each applicable Division and multiple automated reports are cast out to their respective users at scheduled intervals. Revenue modeling and forecasting are underway to guide policy decisions and enhance responses to legislative inquiries. A case management application has been implemented in the Audit division standardizing audit practices and procedures and enabling performance management. Research tools have been acquired to assist various divisions throughout DRA perform their functions with increased efficiency.
DRA’s GIS system: Entitled “Mosaic”, DRA’s GIS system is now in its third iteration. Named a “Bright Idea” by Harvard’s Ash Center for Democratic Governance and Innovation at the John F. Kennedy School of Government, Mosaic is on the leading edge of sustainable statewide land record systems. Mosaic contains parcel map and assessment information for 98% of the 680,000 taxable properties statewide. The information is served to over 60 trained DRA users via a user friendly intranet application. The audit, collections, property appraisal and municipal services division leverage Mosaic to improve productivity in many daily activities. Mosaic is integrated into the DRA Property Tax Equalization System which is used by DRA and all municipalities to validate real estate transaction statewide. Mosaic is served to other state agencies to minimize duplication of efforts and capitalize on the need for parcel information. Mosaic is currently utilized in the Emergency Operations Center (EOC) as a disaster assessment tool.
Figure B
NH DRA 2012 Annual Report - Page 9

IV PROPERTY TAX DEVELOPMENTS Low and Moderate Income Homeowners Property Tax Relief The Education Property Tax Hardship Relief provisions were designed to lessen the economic burden of the education property tax on certain at-risk taxpayers. Eligible claimants apply for relief to the New Hampshire Department of Revenue using Form DP-8. Claimants must include a copy of their final property tax bill and federal income tax return for the claim year and any additional documentation as required by law. Completed Forms DP-8 must be postmarked no earlier than May 1, and no later than June 30 following the due date of the final property tax bill. In an effort to improve the processing of claims, the Department implemented a software application and an on-line claim status check. The software application allows the claims to be processed faster by implementation of several automated features such as pre-filled data entry fields for previous filers and the ability to generate request letters within the application, using the pre-filled information. The on-line claim status check allows applicants to log-in and view the status of their claims at any time. The Department strives to process all claims within the time prescribed by the Legislature. Some claims processing may be delayed as a result of incomplete claims. The amount of claims filed and relief granted is directly tied to the State Education Property Tax rate. As the State Education Property Tax rate drops, so do the number of claims filed and the amount of relief granted. Forms are available at municipal offices and on our web site at www.revenue.nh.gov. Claim Year 2002 23,666 claims granted $7.7 million total relief paid Claim Year 2003 27,208 claims granted $7.5 million total relief paid Claim Year 2004 25,059 claims granted $4.9 million total relief paid Claim Year 2005 22,381 claims granted $3.9 million total relief paid Claim Year 2006 19,570 claims granted $3.3 million total relief paid Claim Year 2007 18,579 claims granted $3.1 million total relief paid Claim Year 2008 17,600 claims granted $3.1 million total relief paid Claim Year 2009 16.066 claims granted $3.1 million total relief paid Claim Year 2010 12,100 claims granted $2.3 million total relief paid Claim Year 2011 11,622 claims granted $2.3 million total relief paid
PROPERTY APPRAISAL The Property Appraisal Division is divided into five basic areas of responsibility: assisting and supervising municipalities and appraisers in valuing property for property taxation; equalization of local assessed property values; administration of the state utility property tax; administration of timber and gravel taxes; and, the administration of the current use, and assessing standards boards. While carrying out these core functions, the Division also provides extensive technical support and education to municipal agents in the area of state and local property taxation. The Division also carries out an assessment review of approximately 1/5 of municipalities each year. Assisting Municipalities with Assessing For the 2011 tax year, the Division monitored 4 full revaluations, 11 partial revaluations, 109 cyclical review programs, and 47 statistical updates. In addition, the staff responsible for this monitoring provided technical assistance and information as requested from virtually every town or city.
NH DRA 2012 Annual Report - Page 10

The Property Appraisal Division has created a number of workshops for municipalities. The topics for these workshops are derived from input received from the monitoring staff as well as from municipal employees. Presentations are then made on a regional basis. Over the past year, 24 regional workshops were attended by 372 people covering a wide variety of assessing topics. In addition, the Property Appraisal Division taught a 4-day educational seminar that comprised the second half of the new State Statutes course. The seminar was co-sponsored with the New Hampshire Association of Assessing Officials (NHAAO). The Division has also:
developed and twice presented a 3-day class covering the basic principles of appraisal;
developed and twice presented a 2-day class covering statistics, modeling and finance in the completion of mass appraisals; and,
developed and presented a 1-day class update of the state statutes class. Equalization The Equalization staff of the Property Appraisal Division computed ratios for 234 towns and cities, and 25 unincorporated jurisdictions for the 2011 tax year. The work was performed in accordance with the methods and procedures contained in an equalization manual that was reviewed, revised, and approved by the Equalization Standards Board (now part of the duties of the Assessing Standards Board). A jurisdiction may appeal the calculated ratio and resulting total equalized value. In 2011, no appeals were filed. A declaratory judgment petition has been filed in Merrimack County Superior Court by a taxpayer and town together challenging the method for equalizing a payment in lieu of taxes that may be received by the town at some date in the future. The efficient equalization of the cities and towns is dependent on the number of transactions that occur on an annual basis. In many cases, the fewer sales the easier task it becomes. There is a point, however, at which a small number of sales creates a much larger task. That point is about 20 valid sales, as fewer than that number causes us to have to complete more detailed analysis of historical sales. The reduction in the number of transactions has resulted in a much higher number of towns that have less than 20 sales in the past few years.
0
20
40
60
80
100
120
140
160
2007 2008 2009 2010 2011
Cyclical Data Review
Full Revaluation
Partial Revaluation
Update
NH DRA 2012 Annual Report - Page 11

In addition to the ratio study, the Equalization staff has been working closely with the Municipal Services Division, assisting in the review of all Summary Inventory MS-1 filings, as well as other administrative duties. An effort has been ongoing to encourage municipalities to submit data for these ratio studies electronically. Electronic filings by municipalities mean less data entry, fewer errors, and faster results. For the 2011 tax year, 215 of the municipalities filed electronically. The legacy equalization software we have been using for many years is in the process of being replaced with the NH Mosaic Equalization tool. The University of New Hampshire Technology Transfer Center has been working most of the year on a new system that has been deployed for tax year 2012. Many cities and towns are using the new tool, and beginning on October 1, 2012, all new equalization is completed on this new system. Some of the final calculations will be validated on our legacy Real Data Corporation system. The complete 2011 equalization survey is attached to the back of this report on page 133. Appraisal of Railroads and Utility Properties The Division is responsible for the valuation of railroads and utility properties for the statewide education tax. The entities appraised are 1 nuclear power plant, 11 electric companies, 8 gas companies, 14 “renewable energy” companies, 40 hydroelectric companies, 19 water and sewer companies, 12 railroads, and 43 private railcars. The combined valuation in 2011 was over $5.04 billion, generating $33.5 million in tax revenue.
0
20
40
60
80
100
120
2006 2007 2008 2009 2010 2011
Number of Municipalities with Supplemental Sales
$0
$5,000,000
$10,000,000
$15,000,000
$20,000,000
$25,000,000
$30,000,000
$35,000,000
2006 2007 2008 2009 2010 2011
Utility Tax Revenue
NH DRA 2012 Annual Report - Page 12

Gravel and Timber Taxes The staff processed 3,378 “Intent to Cut” forms for timber harvesting, and 716 “Intent to Excavate” forms for gravel extraction. To assist municipalities, the Property Appraisal Division continues to make available a Timber and Gravel Certification worksheet for their use. It provides an easy and accurate method to calculate the timber and gravel taxes due. Most of New Hampshire’s municipalities are taking advantage of this program. The Property Appraisal Division also makes use of a timber and gravel tax database to monitor the timber and gravel activities in each municipality. The database provides timber species and excavated material totals that are initially planned for removal as well as the actual final totals when each operation is completed. Reports can be generated to give totals by municipality, county, and/or statewide totals. The timber information is provided to the Department of Resources and Economic Development. The information also summarizes the total volume cut by municipality as well as statewide. The Timber and Gravel taxes provide a method to exempt from taxation the value of standing timber and unexcavated materials. These are administered as “severance” taxes, where the tax is paid upon the cutting of trees and excavation of material.
Gravel Appraiser provides direct assistance to the 235 municipalities in the administration of land use change taxes. These are often directly related to excavation activities.
Complete bi-annual surveys of timber stumpage values for use by municipalities and the Current Use Board.
Current use values account for 2.9 million of the 5.7 million acres reported by municipalities. These valuable programs together provide for the protection of extensive natural resources. In addition, they ensure that administration of taxes paid is fair. While these programs do not generate impressive amounts of revenue compared to the balance of property taxes, they do provide a critical function of assuring that all taxes on this property are paid fairly. In addition, these programs are providing a direct benefit to municipalities. Our Timber and Gravel Appraisers are constantly visiting with municipalities, taxpayer and operators to assure fair compliance with existing laws. Without these services, municipalities would be left without an ability to efficiently administer these taxes, and would have an additional cost burden. Administratively Attached Boards The Property Appraisal Division supported three legislatively created boards that were administratively attached to the Department of Revenue Administration: the Current Use Board; the Assessing Standards Board; and the Equalization Standards Board. The Equalization Standards Board has been dissolved by the legislature, and the duties are now assigned to the Assessing Standards Board. Personnel from the Property Appraisal Division provide administrative and technical support on the production of procedural manuals, preparation of agendas, allocating meeting room space, posting of public meeting dates, taking and transcribing minutes, providing various clerical services, and providing day-to-day answers to inquiries about each board’s multiple functions and duties. The assessment review process began in tax year 2003, following adoption of guidelines by the Assessing Standards Board. The process of assessment review is now entering the second full cycle in the 2008 tax year. The process is largely standardized, and a procedure has been put in place to allow municipalities to move forward the year of review to coincide with their five year statutorily required valuation anew. Results of assessment reviews are attached to the back of the report on page 177. The Assessing Standards Board is responsible for establishing the educational requirements and experience for all assessing personnel working in the state. To ensure compliance, the Property Appraisal Division annually certifies and recertifies individuals who are permitted to perform assessing work. Currently, there are 370 certified individuals in NH. These include 105 building measurer and listers, 76 property assessor assistants, 59 property assessors and 130 property assessor supervisors. Of the certified individuals, 45 are due for recertification in 2012, 53 in 2013, 86 in 2014, 87 in 2014, 80 in 2015, and 56 in 2016. A year ago, a new database was successfully installed to track status levels, required education and experience, reducing the workload and improving our efficiency.
NH DRA 2012 Annual Report - Page 13

Mosaic Parcel Layer Project In addition to these statutory duties, the Division has also undertaken the development and implementation of a state-wide Mosaic Parcel Layer Project through a contract with the Technology Transfer Center at the University of New Hampshire. The project is developing a basic layer for a geographical information system (GIS) that will cover the entire state. This is an exciting project that puts New Hampshire on the leading edge in digitizing every parcel in the state. While this system has initially supported the DRA in the development of a new primary equalization system, the ability to access this system will be available to municipalities and agencies within the State. Geographic Information Systems (GIS) are powerful analytical and visual tools that will provide better decision making abilities at all levels of government. The implementation in the first year was a great success. The following chart depicts the total number of assessing records and parcel depictions from tax maps collected in the first two years of the map, as well as the total number collected this year since September 1, 2012. The total CAMA records estimate for the state is 688,000. The 2011 version of the map involved 99% of the CAMA and 98% of the map parcels in the state.
The Mosaic Parcel Map is being shared by numerous state agencies, all nine of the regional planning commissions, and a pilot data sharing pool for municipalities. The ability to collect, correlate and share this data from and through multiple levels of government is unique. The Ash Center for Democratic Governance at Harvard University’s Kennedy School of Government has recognized the Mosaic Parcel map project as one of 111 “Bright Idea” winners for 2012. The DRA and the University of New Hampshire Technology Transfer center are proud of the recognition, and are grateful for the donors of the information that is the foundation of this sustainable GIS map. The following chart illustrates the pace at which data collection has proceeded in this the third year of the map:
0
100000
200000
300000
400000
500000
600000
700000
800000
CAMA Records Parcels
2010
2011
2012 YTD
NH DRA 2012 Annual Report - Page 14

MUNICIPAL SERVICES Under RSA 21-J:24, the Municipal Services Division provides year-round technical assistance to towns, cities, and other political subdivisions to guide them in the areas of finance and taxation thereby providing an efficient, smooth road toward timely property tax rates. The Division administers an annual property tax assessment of over $3 billion (see the chart below), calculates the state education tax rate, and issues a warrant to each municipality, authorizing them to assess and collect the tax. In addition, the local school rate, plus the locally assessed state education rate, county, town or city, and applicable village district rates are calculated by this Division. To establish tax rates in accordance with RSA 21-J:35, the Municipal Services Division reviews the appropriations and revenues, financial reports, and budget documents for the State’s 234 towns and cities, 25 unincorporated places, 148 single school districts, 33 regional school districts, 10 counties, and 91 village districts. To ensure timely receipt of all these reports, the Division developed two interactive tools. The Queue, developed in the fall of 2011, is accessible on the Department’s web site. Now municipal officials and the public can check the status of property tax rates. It was developed to promote transparency in the tax rate setting process and increase awareness of the importance of timely submittal of property tax rate documents required under RSA 21-J:34. The second tool, the Annual Meeting Submittal Checklist, was made available on the Department’s web site shortly after the 2012 annual town meetings. Again, it promoted public awareness about the required steps necessary for timely processing of the property tax rate calculations. This year the Municipal Services Division continued to solidify working relationships with municipalities and associations and also with the legislature. The Division provided technical assistance on property tax legislation that could potentially affect the entire state including all municipalities. In past years, the Division worked with the NH Society of CPA's, the legislature, and municipal organizations to ensure the passage of the law clarifying the requirement for municipal audits. The Division provided audit training this year and is working to ensure 100% compliance in this area. In April of 2012, the Division published the first version of the report on the Department’s web site to show which municipalities had complied by submitting audits and which audits were still outstanding. The posting resulted in the receipt of 47.7% of the outstanding audits within just a few weeks.
NH DRA 2012 Annual Report - Page 15

The Division continued to work closely with the Tax Collectors Association Executive Board on tax collecting issues. This year no inspections were conducted of the state’s tax collectors, however, the staff monitored the tax collection process by examining the tax warrant and a sample bill of every town and city to ensure the correct tax rate was billed on both the semi-annual and final bills. Any errors discovered through this process were corrected by the municipalities. The Division continues to be involved with the NH Public Deposit Investment Pool (PDIP) Advisory committee, the NH Municipal Records Board, village district officials, school officials, town and city officials, the Government Finance Officers Association, Association of School Business Officials and also assisted in the auditing and processing of the Low and Moderate claims. In preparation for the Department’s on-going automation initiatives, the Municipal Services and Property Appraisal divisions participated in a LEAN project. The goal was to streamline the process flow for required reports, work together more efficiently, and gain better information from the municipalities without duplicity. The Divisions continue to rethink their process flow, review procedures, and work with municipal user groups to determine the most functional electronic reporting and tax rate distribution formats for the future.
NH DRA 2012 Annual Report - Page 16

V VOLUNTARY COMPLIANCE – CENTRAL TAX SERVICES & DOCUMENT PROCESSING As a result of restructuring of the Audit and Document Processing Divisions during the 2012 fiscal year, the Audit Support Group and a number of Tax Auditor Is and IIs merged with Document Processing’s former Resolution Group and Maintenance Group and the former Centralized Taxpayer Services Unit to create a more streamlined and efficient Central Tax Services Unit. This unit comprises 21 employees and is responsible for the maintenance of taxpayer accounts, resolution of issues concerning taxpayer accounts, and responding to taxpayer inquiries through the Department’s new VoIP system. The Department-wide modernization project has demanded a lot of attention from the CTS unit employees. The unit has been heavily involved in testing forms for optical character recognition, testing the Taxpayer Information Maintenance System for 2012 form changes, and testing the new systems prior to going live. During fiscal year 2012, CTS worked 29,919 taxpayer accounts, of which 21,890 were refund or abatement requests, 3,615 tax notices, and 2,163 required further resolution activity. 321 of the accounts worked were the result of federal Reports of Change affecting state tax liabilities, which netted the State $2,611,717. The remaining accounts worked netted the State $2,145,448. The unit also handled in excess of 49,000 telephone calls concerning taxpayer questions.
NH DRA 2012 Annual Report - Page 17

VI ENFORCEMENT COMPLIANCE – AUDITS & COLLECTIONS AUDIT ACTIVITY When voluntary compliance efforts fail to produce the desired results, enforcement through audit and collection efforts must be pursued. The Department’s Audit Division and Collections Division worked diligently to ascertain and pursue those with a tax obligation who failed to file or pay as required by law. While most taxpayers voluntarily file and pay the proper amount of taxes when due, those who do not create an unfair burden on the public, resulting in inequities, which must be remedied. The Audit Division continued to see significant changes in fiscal year 2012. Priorities were re-evaluated and human resources were reallocated. The Department-wide modernization project compounded with the loss of a significant percentage of staff has required the Division to be particularly flexible. As much as 35% of the Division’s resources have had to be diverted to non-audit activity during fiscal year 2012. This non-audit activity comprises everything from opening and sorting mail to keying documents to testing forms and systems. The Division has also been engaged in its own modernization project. The Division is adopting industry best practices and professional standards. A new electronic case management system and inventory system has been implemented. These changes are expected to enhance audit quality and auditor accountability, as well as to provide management with performance metrics. Audit Division, as newly restructured, is staffed by 28 employees: a director and assistant director, 24 auditors and two shared computer programmers. The Division is responsible for tax compliance activities affecting the 2,000 multi-state and multi-national companies and the multitude of regional companies that do business in New Hampshire, as well as, compliance activities affecting New Hampshire residents and businesses. Auditors conduct both desk and field audits depending on the nature and scope of the audit and the proficiency of the auditor. They handle all tax types, but primarily Business Profits, Business Enterprise, Real Estate Transfer, Interest and Dividends, Meals and Rooms, and Medicaid Enhancement. Nexus and Discovery activities have been absorbed into general audit activity. The Division is also responsible for the Voluntary Disclosure Program. Last year’s annual report cautioned that the Department-wide down-sizing and modernization would result in lower revenues for the Division.1 This prediction has been realized. The Division assessed a total of $22,944,531 in tax, penalties and interest through 1268 assessments during the fiscal year. Discovery and voluntary compliance activity brought in 412 new taxpayers. Taxpayers paid $22,821,045 into the general fund as a result of Audit Division activity in fiscal year 2012. Of that total, $15,806,443 is attributable to Multi-State activity, $114,338 is attributable to Discovery activity, and $4,054,424 is attributable to complex In-State desk reviews and field audits. In the first quarter of fiscal year 2013, the Division is already experiencing the results of enhanced accountabilities and efficiencies. Even with all the current distractions from task, Audit revenue is tracking $950,000 above the first quarter of 2012. It is anticipated that as the modernization project becomes less resource consuming, Audit activity and revenues will increase.
1 Note that prior to FY 2012 revenues brought in by the ASG unit (now known as CTS) were Audit Division
revenues. In 2012 forward, monies brought in by the CTS unit are separately stated in the Annual Report.
NH DRA 2012 Annual Report - Page 18

COLLECTION ACTIVITY The Collection Division is tasked with the collection of all overdue tax notices issued by the Department of Revenue Administration. The Division also promotes compliance through an understanding of the various tax codes with taxpayers, meals & rooms licensees and tobacco wholesalers and retailers through our work in the field. At the outset of Fiscal Year 2012, the division was challenged to perform with 40% fewer Senior Compliance Officers (CO-II), (a reduction from 8 to 5 CO-IIs) as well as the elimination of the Assistant Director’s position and a support position responsible for liens, tobacco stamp sales and refunds. Business and Interest & Dividend Tax Compliance Regions were reduced from 11 to 4. One CO-II assumed primary responsibility for collection of all overdue Meals & Rentals Taxes and tobacco retailer compliance checks. Despite the staff reduction, the implementation of a new “Single View of the Taxpayer” and “Voice over Internet” phone system allowed our highly motivated staff to increase contact records with taxpayers and meals & rentals operator from the prior year (6,929 contacts) to 7842 contacts initiated between January and June of 2012. The Division continued to conduct field compliance operations, performing tobacco stamp checks at retailers, recording-keeping checks at meals & rentals licensees and identifying businesses that did not obtain the required meals and rentals license prior to opening. Thank you also to the observant citizens of our state who assisted in the process of identifying unlicensed businesses. Our main focus continued to be delinquent tax collections as our effectiveness going forward was contingent upon reducing the inventory of aged unpaid tax notices. The Department’s developing technologies were integrated by collection officers into asset research and skip tracing procedures resulting in increased effectiveness in resolving older tax notices. Tax liens allow the Division to secure tax accounts that were not satisfied in 90 days based upon certain criteria. During the past year, the division reduced tax lien filings by 57%, while continuing to secure tax accounts determined to be at risk of default. This step resulted in savings of $15,300 in filing fee expense. Meals & Rentals Licenses were due for renewal July 1, 2011. Although 80% of Licensees renewed their license timely, follow-up was necessary on the remaining 20%. This continued throughout the fiscal year due to the seasonal nature of many of New Hampshire’s restaurants, fair vendors and lodging businesses. During the year, department staff participated in a LEAN initiative that determined ways to streamline this process and deliver increased customer service within our licensing functions..By year end efficiencies were being measured approaching the benchmarks identified by the LEAN team. The Department’s goal of improved reporting has refined the collection reports that follow. Close examination resulted in the elimination of lien fees from tax notice statistics and more accurate identification of assignment and close dates of tax notices. A new focus on accountability identified ten critical success measures during the year which are being measured monthly and shared with staff and executive management.
NH DRA 2012 Annual Report - Page 19

Other statistics: Abatement of penalties and uncollectible balances processed: 2,751 20% decrease Average Number of delinquent tax notices assigned to CO: 483 5% increase Tobacco stamps sold 123,753,400 1% increase New Meals and Rentals Licenses Issued 1,078 Total Meals and Rentals Licensees Active during FY 2012 9,091
NH DRA 2012 Annual Report - Page 20

VII LEGAL DEVELOPMENTS Office of Revenue Counsel The Office of Revenue Counsel provides legal advice and representation to the Department, serving as its general legal counsel. Revenue Counsel also coordinates the representation provided to the Department by the Department of Justice, provides assistance, and acts as co-counsel in certain cases. Revenue Counsel performs a wide range of other services which include: rendering advice and legal opinions to Department personnel and other governmental officials; managing bankruptcy cases; drafting and coordinating the adoption of administrative rules by the Commissioner; assisting with Department informational publications; handling Right-to-Know Law requests; and providing assistance and advice in connection with audits, hearings before the Department’s Hearings Bureau, and other stages of the enforcement and administration of tax laws. During this fiscal year, the Office of Revenue Counsel defended civil cases filed in administrative appeal tribunals and state courts, concerning appeals of tax assessments and challenges to state taxing statutes, managed bankruptcy cases in which the Department is a creditor, and managed the administrative rules process. Often, the cases managed by the Office of Revenue Counsel have a substantial potential fiscal impact or significant precedential value. A few of these cases are discussed below by topic.
SIGNIFICANT CASES FOR FY 2012
1. Court Decisions During FY 2012
ADMINISTRATIVE PROCEDURE: 5 Tallwood Drive Realty, LLC v. Department of Revenue Administration, Board of Tax and Land Appeals Docket No. 26097-12BP. The Petitioner brought this action to appeal a Final Order, dismissing its adjudicative proceeding because it failed to appear at the scheduled hearing before the Department’s Hearings Bureau. The Department moved for summary judgment, asserting that the Petitioner’s appeal should be dismissed because the Petitioner failed to appear at a duly scheduled hearing in violation of the Department’s rule requiring such an appearance. The BTLA granted the Department’s motion and dismissed the appeal, finding that the Petitioner must exhaust its administrative remedies, which includes attending the Department hearing prior to appealing the substantive tax issues.
MEALS & RENTALS TAX: Scott A. Chesley d/b/a C. Chesley Food Service, LLC v. Department of Revenue Administration, Board of Tax and Land Appeals Docket No. 25457-11MR. The Petitioner brought this action to appeal a Final Order, upholding the assessment of additional Meals and Rentals Taxes, penalties and interest. The Petitioner claimed that the Department acted improperly when it audited the Petitioner’s tax filings and determined that additional Meals and Rentals Tax, penalties and interest was due. After a hearing, the BTLA found that the Petitioner did not meet his burden and upheld the Department’s assessment. Specifically, the BTLA held that the Petitioner failed to meet his statutory and regulatory obligations to keep separate books and records for his operations and failed to make any records available for the Department’s inspection. As a result, the BTLA held that the Department was entitled to implement a methodology using records obtained from third parties to ensure that the State’s Meals and Rentals Tax revenue is remitted to the Department after it is collected. Thereafter, the BTLA denied the Petitioner’s motion for reconsideration and he appealed to the NH Supreme Court, which declined his administrative appeal. REAL ESTATE TRANSFER TAX: Say Pease IV LLC, et al. v. New Hampshire Department of Revenue Administration, Supreme Court Docket No. 2011-174. The Petitioners challenged the Department’s assessments of Real Estate Transfer Tax for property transferred between them. The parties filed cross motions for summary judgment, where the Superior Court ruled in favor of the Petitioner, finding that the transfer was not a “contractual transfer” and not taxable pursuant to RSA Chapter 78-B. The Department appealed the Superior Court’s Order to the New Hampshire Supreme Court, which affirmed the Superior Court’s Order, finding that there was no adequate benefit to the Petitioners sufficient to be a “contractual transfer” when they transferred an interest in an entity between them for the benefit of the entity to obtain financing because the Petitioners did not directly benefit from the entity’s improved ability to obtain financing after the transfer occurred.
NH DRA 2012 Annual Report - Page 21

2. Cases Pending During FY 2012
BUSINESS PROFITS TAX: Capital One Auto Finance, Inc. v. Kevin A. Clougherty, Commissioner of the New Hampshire Department of Revenue Administration, Superior Court Docket No. 217-2010-CV-00708. The Petitioner filed an appeal, challenging the Department’s assessment that increased the New Hampshire sales factor numerator due to the Petitioner’s failure to include substantial receipts by claiming that it is not required to include such receipts as it was not conducting “business activity” related to such receipts in New Hampshire. BUSINESS PROFITS TAX: Woodland Management Associates, LLC v. New Hampshire Department of Revenue Administration, Superior Court Docket No. 09-E-0032. This matter is related to the Lyme Timber cases, discussed below. The Petitioner is the general partner of the Lyme Timber Company and this matter concerns the effect of options on gross business profits and compensation paid to the members of the LLC who are also limited partners of the Lyme Timber Company. BUSINESS PROFITS TAX: Reid & Company Executive Search, LLC v. New Hampshire Department of Revenue Administration, Superior Court Docket No. 218-2012-CV-00240. The Petitioner filed an appeal of the Department’s Final Order, which held that it owed additional Business Profits Tax after reducing its reported compensation deduction, but increasing the compensation deduction upon which the assessment was based. The initial pleadings have been filed and the case remains pending. GAMBLING TAX: David P. Eby, et al. v. State of New Hampshire, Superior Court Docket No. 217-2010-CV-0300. The Petitioners filed a petition for declaratory judgment, challenging the constitutionality of the Gambling Tax (RSA Chapter 77). The parties filed cross motions for summary judgment. As to Petitioner Eby, who is a non-professional gambler, the Superior Court found that the statute is constitutional. As to Petitioner Willey, who claims to be a professional gambler, the Superior Court denied the motions and ruled that the record did not support Mr. W illey’s allegation that he is a professional gambler; therefore, a genuine issue of material fact exists and the case remains pending. GAMBLING TAX: Kenneth M. Brown v. New Hampshire Department of Revenue Administration, Superior Court Docket No. 217-2010-CV-0300. The Petitioner filed an appeal, challenging the constitutionality of the Gambling Tax (RSA Chapter 77). The parties filed cross motions for summary judgment, which are currently pending. INTEREST & DIVIDENDS TAX: Lorrain, et al. v. New Hampshire Department of Revenue Administration, Superior Court Docket No. 226-2012-CV-00477. The Petitioners filed an appeal of the Department’s Final Order, which found that they did not meet their burden to show that distributions were repayment of loans and not dividends subject to Interest and Dividends Tax. The initial pleadings have been filed and the case remains pending. INTEREST & DIVIDENDS TAX: Lyme Timber Co. v. New Hampshire Department of Revenue Administration and Lyme Timber Co. NH Ltd Partners v. New Hampshire Department of Revenue Administration, Superior Court Docket No. 215-2008-EQ-00185 and 215-2008-EQ-00185. These are interrelated cases concerning whether the Interest and Dividends Tax should be imposed on the entity or the interest holders of the entity. The issue is whether the interest holder possessed transferable shares in the entity. Cross partial motions for summary judgment were filed. After the Superior Court granted the Petitioners’ partial motion for summary judgment and denied the Department’s partial motion for summary judgment, the Department appealed to the New Hampshire Supreme Court, which reversed the Superior Court’s decision in favor of the Department, finding that the interest holders possessed transferable shares based on the language in the partnership agreement, and remanded the case back to Superior Court for further proceedings on the issue of penalties.
MEDICAID ENHANCEMENT TAX: Catholic Medical Center, Exeter Hospital and St. Joseph Hospital v. New Hampshire Department of Revenue Administration, Superior Court Docket Nos. 216-2011-CV-955; 226-2011-CV-00850; and 218-2011-CV-01394. The Petitioners filed this action seeking a refund of their Medicaid Enhancement Tax payments on the basis that the Medical Enhancement Tax statute (RSA Chapter 84-A) violates the federal and state constitution. The parties plan to file dispositive motions.
NH DRA 2012 Annual Report - Page 22

MEDICAID ENHANCEMENT TAX: Northeast Rehabilitation Hospital v. New Hampshire Department of Revenue Administration, Superior Court Docket No. 218-2012-CV-00185. The Petitioner filed this action seeking a refund of its Medicaid Enhancement Tax payments on the basis that the Medical Enhancement Tax statute (RSA Chapter 84-A) violates the federal and state constitution. The parties plan to file dispositive motions.
ADMINISTRATIVE RULEMAKING FOR FYE 2012 Source # Rule Number and Tax Effective Date Expiration Date
10015 Rev 2301.05 & 2301.07 (Medicaid Enhancement Tax) 10/28/2011 10/28/2019
10062 Rev 807.02-807.05 & 809.04-809.05 (Real Estate Transfer Tax) 12/24/2011 12/24/2021
10096 Rev 2903.07 (Offset of Refund or Credit) 3/3/2012 3/3/2022 TECHNICAL INFORMAITON RELEASES ISSUED FYE 6/30/12 TIR Number Description Date Issued
2011-002 Tobacco Tax Decrease 07/01/11 2011-003 Legislative Session in Review 07/27/11 2011-003 Updated – Legislative Session in Review 07/28/11 2011-004 New Interest Rates 08/03/11 2011-005 Municipal Law Changes 08/03/11
2012-001 Tax Form Changes 2011 Tax Period 03/27/12
NH DRA 2012 Annual Report - Page 23
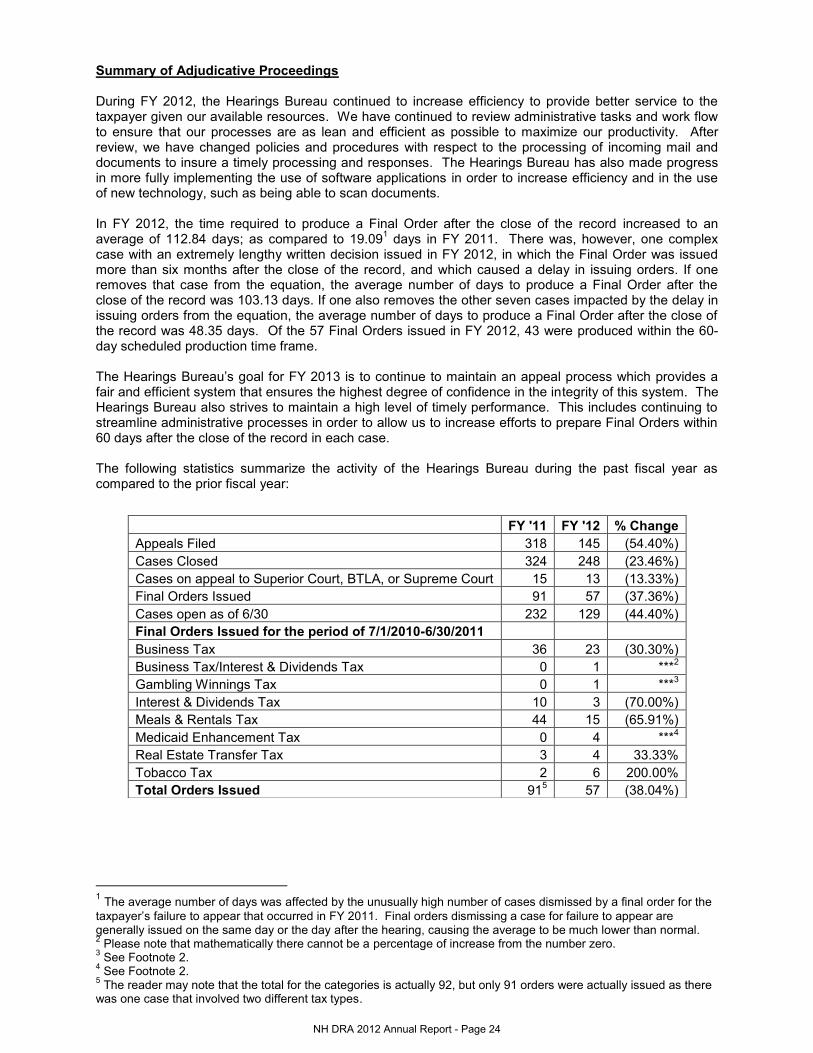
Summary of Adjudicative Proceedings During FY 2012, the Hearings Bureau continued to increase efficiency to provide better service to the taxpayer given our available resources. We have continued to review administrative tasks and work flow to ensure that our processes are as lean and efficient as possible to maximize our productivity. After review, we have changed policies and procedures with respect to the processing of incoming mail and documents to insure a timely processing and responses. The Hearings Bureau has also made progress in more fully implementing the use of software applications in order to increase efficiency and in the use of new technology, such as being able to scan documents. In FY 2012, the time required to produce a Final Order after the close of the record increased to an average of 112.84 days; as compared to 19.091 days in FY 2011. There was, however, one complex case with an extremely lengthy written decision issued in FY 2012, in which the Final Order was issued more than six months after the close of the record, and which caused a delay in issuing orders. If one removes that case from the equation, the average number of days to produce a Final Order after the close of the record was 103.13 days. If one also removes the other seven cases impacted by the delay in issuing orders from the equation, the average number of days to produce a Final Order after the close of the record was 48.35 days. Of the 57 Final Orders issued in FY 2012, 43 were produced within the 60-day scheduled production time frame. The Hearings Bureau’s goal for FY 2013 is to continue to maintain an appeal process which provides a fair and efficient system that ensures the highest degree of confidence in the integrity of this system. The Hearings Bureau also strives to maintain a high level of timely performance. This includes continuing to streamline administrative processes in order to allow us to increase efforts to prepare Final Orders within 60 days after the close of the record in each case.
The following statistics summarize the activity of the Hearings Bureau during the past fiscal year as compared to the prior fiscal year:
1 The average number of days was affected by the unusually high number of cases dismissed by a final order for the taxpayer’s failure to appear that occurred in FY 2011. Final orders dismissing a case for failure to appear are generally issued on the same day or the day after the hearing, causing the average to be much lower than normal. 2 Please note that mathematically there cannot be a percentage of increase from the number zero. 3 See Footnote 2. 4 See Footnote 2. 5 The reader may note that the total for the categories is actually 92, but only 91 orders were actually issued as there was one case that involved two different tax types.
FY '11 FY '12 % Change Appeals Filed 318 145 (54.40%) Cases Closed 324 248 (23.46%) Cases on appeal to Superior Court, BTLA, or Supreme Court 15 13 (13.33%) Final Orders Issued 91 57 (37.36%) Cases open as of 6/30 232 129 (44.40%) Final Orders Issued for the period of 7/1/2010-6/30/2011 Business Tax 36 23 (30.30%) Business Tax/Interest & Dividends Tax 0 1 ***2 Gambling Winnings Tax 0 1 ***3 Interest & Dividends Tax 10 3 (70.00%) Meals & Rentals Tax 44 15 (65.91%) Medicaid Enhancement Tax 0 4 ***4 Real Estate Transfer Tax 3 4 33.33% Tobacco Tax 2 6 200.00% Total Orders Issued 915 57 (38.04%)
NH DRA 2012 Annual Report - Page 24

VIII SUMMARY OF TAXES ADMINSTERED BY THE DEPARTMENT OF REVENUE (FY2012) This is only a brief summary of certain New Hampshire taxes administered by the Department of Revenue
Administration. This summary is not intended to be relied upon as a full and complete text. Please refer
to the applicable forms, instructions, rules and to the laws cited below to determine how this information
applies to specific persons or situations. BUSINESS PROFITS TAX - RSA CHAPTER 77-A The Business Profits Tax (BPT) has historically been one of the largest sources of general fund revenue. Enacted in 1970 as a replacement for the municipal property tax on stock-in-trade, farm livestock, poultry, fuel pumps, mills and machinery, the initial rate was established at 6%. The rate steadily increased to a high of 9.56% in Fiscal Year (FY) 1983. The rate then decreased to 7% beginning FY 1995, then increased to 8% for tax years ending on or after July 1, 1999. The current rate of 8.5% was effective for all returns and taxes due on account of taxable periods ending on or after July 1, 2001. This tax is assessed on income from conducting business activity within the state. For multi-state businesses, income is apportioned using a weighted sales factor of two and the standard payroll and property factors. Organizations operating a unitary business must use combined reporting in filing their NH return. Four annual estimate payments are required on liabilities greater than $200, paid at 25% each. Proprietorship, partnership and fiduciary returns are due on April 15th or the 15th day of the 4th month following the end of the taxable year. Corporate returns are due on March 15th or the 15th day of the 3rd month following the end of the taxable year. Business organizations with $50,000 or less of gross business income from all their activities are not required to file a return. Business organizations, however, that realize a gain or loss on the sale or exchange of an interest in the business organization shall file a return for the taxable period, regardless of whether or not the business organization's gross business income is in excess of $50,000 during the taxable period. BUSINESS ENTERPRISE TAX - RSA CHAPTER 77-E In 1993, a 0.25% (.0025) tax was enacted on taxable enterprise value tax base, which is the sum of all compensation paid or accrued, interest paid or accrued, and dividends paid by the business enterprise after special adjustments and apportionment. Chapter 17, Laws of 1999 increased the rate from 0.25% to 0.5%. The rate was increased to 0.75% in 2001. Also in 2001, the filing threshold increased to $150,000 (from $100,000) of gross business receipts or $75,000 (from $50,000) of the enterprise value tax base. Four annual estimate payments are required on liabilities greater than $200, paid at 25% each on the 15th day of the 4th, 6th, 9th and 12th months of the taxable year. The Business Enterprise Tax return is due at the same time the Business Profits Tax return is due. The Business Enterprise Tax may be used as a credit against the Business Profits Tax under RSA 77-A:5. Any unused portion of the credit may be carried forward and allowed against the Business Profits Tax for five taxable periods from the taxable period in which the Business Enterprise Tax was paid. COMMUNICATIONS SERVICES TAX - RSA CHAPTER 82-A First enacted in 1990 at 5.5%, this tax was assessed upon two-way communications services. Chapter 158, Laws of 2001, increased the permanent portion of the tax to 4.5% and continued the surtax of 2.5%, resulting in an overall tax rate of 7% for the period beginning July 1, 2001 and ending June 30, 2003. A permanent rate of 7% was passed effective July 1, 2003. Retailers must register with the Department and are required to collect and remit the tax. Communications Services Tax returns must be filed by the provider on the 15th day of the month for the preceding calendar month unless the average monthly liability is less than $100. Any provider/retailer who can reasonably estimate its average monthly liability to be in excess of $10,000 is required to make an estimated payment equal to 90% of the actual tax collected. This payment is due on or before the 15th day of the month during which the liability is incurred. EDUCATION TAX - RSA 76:3 Under Chapter 17, Laws of 1999, the Education Property Tax was established. The tax is assessed and collected by municipalities to be retained for use by their local school districts. The rate was originally $6.60 per thousand of equalized valuation without utilities. The tax appears on the same bill with the other property taxes administered at the local level. The effective date of this tax was April 1, 1999. Chapter 158, Laws of 2001 reduced the rate from $6.60 per $1,000 of value to $4.92 per $1,000 of value
NH DRA 2012 Annual Report - Page 25

beginning with the April 1, 2003 tax year (school year 7/1/03-6/30/04). The sunset provision of the Education Property Tax was repealed, making the tax a permanent revenue source dedicated to funding education. As of April 1, 2005, the rate was $3.33 per $1,000. Beginning in July of 2005, and every fiscal year thereafter, the Commissioner is required to set the tax rate at a level sufficient to generate revenue of $363,000,000. ELECTRICITY CONSUMPTION TAX - RSA CHAPTER 83-E Effective May 1, 2001, the Electricity Consumption Tax is imposed at a rate of $ .00055 per kilowatt hour on persons, including government units, distributing, redistributing or transmitting electrical energy for consumption in this state. The tax is paid by the consumer, collected and submitted by distribution companies, except in the case of consumers who generate their own power. These self-generating companies or individuals must submit tax returns on their own behalf. Returns (Form DP-133) must be filed on the 15th day of the second month following the month in which the electrical energy was provided to a consumer and for which tax is due. INTEREST & DIVIDENDS TAX - RSA CHAPTER 77 The Interest & Dividends (I&D) Tax, which was first enacted in 1923, applied a tax based on the “average rate of property taxation” upon the income and dividend income received by NH residents from sources other than NH and Vermont banks. The tax was changed significantly in FY 1995 to eliminate the exemption on income from NH and Vermont banks. In conjunction with this change, the personal exemption was increased from $1,200 to $2,400. The exemption for joint filers increased from $2,400 to $4,800. Estimated I&D Tax payments are due April 15th, June 15th, September 15th and January 15th on tax liabilities greater than $500. The I&D Tax return is due on April 15th. Additional exemptions are available for residents who are 65 years of age, who are blind, and who are handicapped and unable to work, provided they have not reached their 65th birthday. The current tax rate of 5% has remained the same since FY 1977. LOCAL PROPERTY TAX - RSA CHAPTER 76 Property taxes, based upon local assessed valuations, are administered and collected by the individual cities and towns. The majority of property taxes collected are based on the market value of the property at its highest and best use. Some property taxes, however, are based on the market value of a property’s actual use, such as:
Current Use assessments under RSA chapter 79-A are available for certain Farm Land, Forrest Land, and Unproductive Land. The program is for the properties dedicated to remain as open space. A Land Use Change tax of 10% of the market value of the property is charged upon the occurrence of a disqualifying event (usually a development, use or sale of a portion of a property). Typically ten acres or more of dedicated land is required. Application to local officials on or before April 15th is required.
Taxes on the value of standing timber are assessed under RSA chapter 79. These are assessed by local officials, at a rate of 10% of the value of the standing timber. The annual filing of an intent to cut and the subsequent report of timber cut are required.
Taxes on the value of gravel and excavated materials are assessed under RSA chapter 72-B. These are assessed at a rate of at the rate of $.02 per cubic yard of earth excavated.
Local Property tax exemptions, credits and deferrals: Elderly Exemption: Effective July 23, 1996, RSA 72:39-a replaced the Standard, Expanded, Adjusted and Optional Adjusted Elderly Exemptions. The statute sets the minimum exemptions, and the cities and towns may modify them. The statutory exemption levels for all municipalities are adopted by each individual municipality.
o Amount of exemption from value of residential real estate: Ages 65-74; 75-79; and 80+ o Net Income Limits, including Social Security Income or pension payment Net Asset Limits
NH DRA 2012 Annual Report - Page 26

Blind Exemption - RSA 72:37 The exemption for the legally blind must be adopted by the municipality. The exemption is a minimum $15,000 reduction of the assessed value of the residential real estate (RSA 72:29) and could be higher if amended through referendum vote. Deferral for the Elderly or Disabled - RSA 72:38-a The assessing officials “... may annually grant a person qualified under this paragraph a tax deferral...” Property taxes are deferred and accrue interest at the rate of 5% per annum. The deferred property tax may not exceed more than 85% of the equity value of the residence. If granted by the assessing officials, the deferral is available to any resident property owner who is 65 years or older, or eligible for benefits for the totally and permanently disabled under the federal social security act, has owned the home for at least five years, and is currently residing there. Veterans Tax Credit - RSA 72:28 Qualifying residents shall receive the following amounts deducted from their tax bills:
o $ 50:Basic credit available to all veterans. o $700:For the surviving spouse of a veteran, pursuant to RSA 72:29-a, and veterans having a
total and permanent service-connected disability pursuant to RSA 72:35 Towns may adopt a local option to increase the above dollar amounts to $100 and $1,400. Disability Exemption - Residents who qualify under RSA 72:36-a as totally and permanently disabled from service connection, and is paraplegic or having double amputation from military service connected disability or blind (5/200 vision or less) as a result of service connection, and owning a specially adapted home acquired with V.A. assistance are exempt from all taxation on that home. Tax Exemption for Improvements to Assist Persons with Disabilities - RSA 72:37-a This exemption is limited to a physically handicapped person who resides at the residential real estate, and is applicable only upon the value of any special aids required by the resident to enable them to propel themselves. Tax Exemption for Wind-Powered, Solar and Wood Heating Energy System - RSAs 72:66, 72:62, 72:70 These exemptions are optional to the cities and towns, and must be voted upon locally. If further information is required, contact the assessing officials of the municipality. Tax Exemption for the Disabled - RSA 72:37-b Available to persons eligible under the Social Security Act for benefits to the Totally & Permanently Disabled. Applicable only on the applicant’s principal place of abode. The exemption is optional and must be voted on by the municipality, which also determines the amount of the exemption and the income/asset limitations. Proration for Certain Damaged Buildings – RSA 76:21 Under new section RSA 76:21, whenever a taxable building is damaged due to unintended fire or natural disaster to the extent that it renders the building not able to be used for its intended use, the assessing officials shall prorate the assessment for the building for the current tax year. MEALS & RENTALS TAX - RSA CHAPTER 78-A The Meals and Rentals (M&R) Tax was enacted in 1967 at a rate of 5%. The tax is assessed upon patrons of hotels and restaurants, on certain rentals, and upon meals costing $.36 or more. Chapter 144, Laws of 2009, increased the rate from 8% to the current rate of 9%. An M&R Tax Operators License is required. The M&R Tax is required to be remitted to the State on the 15th day of the month following the
NH DRA 2012 Annual Report - Page 27

collection of tax. The M&R Tax return is also required to be filed with the State on the 15th day of the month following the collection of tax. An M&R Operator is required to maintain books and records showing the amount of tax collected and to remit the tax monthly to the State, less a 3% commission. MEDICAID ENHANCEMENT TAX – RSA CHAPTER 84-A
The Medicaid Enhancement Tax (MET) was enacted in 1991 at a rate of 8% of gross patient services revenue of every hospital. In 1993 the rate was changed to be established by legislation each biennium upon the gross patient services revenue of every hospital for the hospital's fiscal year ending during the first full calendar year preceding the taxable period. If the Legislature failed to set the rate of tax on or before April 1, preceding the first fiscal year of the biennium, the tax rate was to be zero for that biennium. In no event was the rate of the tax be greater than 6 percent for any biennium. In 1998, the law was amended to require the Legislature to set the tax rate on or before May 1. In 2003, the tax rate was changed to 6% of gross patient services revenue. In 2004, the 6% tax on gross patient services revenue was changed to a 6% tax upon the “net” patient services revenue of every hospital. In 2007, the tax rate was reduced to the current rate of 5.5% of net patient services revenue. Hospitals are required to pay 100% of the tax due for the taxable period no later than the 15th day of the fourth month of the taxable period. Hospitals are required to file a tax return with the Department on or before the 10th day of the month following the expiration of the taxable period.
REAL ESTATE TRANSFER TAX - RSA CHAPTER 78-B The Real Estate Transfer Tax (RETT) was first enacted in 1967. Chapter 17, Laws of 1999, increased the permanent tax rate assessed on the sale, granting, and transfer of real estate and any interest in real estate to $.75 per $100, or fractional part thereof, of the price or consideration. This rate is assessed on both the buyer and seller for a combined tax rate of $1.50 per $100. Where the price or consideration is $4,000 or less, there is a minimum tax of $20 assessed on both the buyer and seller. Chapter 158, Laws of 2001, removed the exception from the tax on transfer of real property for transfers of title pursuant to a merger, consolidation or other reorganization qualifying as a tax-free reorganization. It also removed the exception of the transfer of title from one business entity to another, the ownership interest of which may be the same. These changes were effective for transfers occurring on or after July 1, 2001. The tax is paid at the Registry of Deeds office in the county where the property is located. A Declaration of Consideration (Form CD-57-P and Form CD-57-S) must be filed with the Department of Revenue Administration by both the purchaser and seller no later than 30 days from the recording of the deed at the Registry of Deeds or transfer of real estate, whichever is later. RAILROAD TAX - RSA CHAPTER 82 Every railroad, railway, express, and every parlor, sleeping or dining car company, or other company not a railroad company owning any cars operated for profit on any railroad in the State of New Hampshire shall pay an annual Railroad Tax as of April 1 of each year. The Railroad Tax is on the market value of the property’s full and true value as defined in RSA 75:1. The tax is imposed at the average rate of taxation at that time upon other property throughout the State. Railroad “property” applies to both railroad companies (an enterprise, corporation, partnership, etc.) and private rail cars operated for profit on any railroad in the State of New Hampshire. TOBACCO TAX - RSA CHAPTER 78 The Tobacco Tax is a direct tax upon the consumer at retail. However, it is pre-collected and paid by the wholesaler for the purpose of convenience and facility. It is presumed the Tobacco Tax has been pre-collected and paid by the wholesaler by the affixing of a Tobacco Tax Stamp on the tobacco product. Consumers who purchase unstamped tobacco products will be taxed directly for the Tobacco Tax on such product. The Tobacco Tax was first enacted in 1939. Originally the tax was based upon the value at the usual selling price of all tobacco products. In 1975, the tax was changed to a flat rate of $0.12 per package of 20 cigarettes. At that time, there was no tax on other tobacco products. Over the next 34 years the tax was increased from $0.12 to $1.78 per package. In 2011, the Tobacco Tax rate was decreased from $1.78 to $1.68 for each package containing 20 cigarettes or at a rate proportional to such rate for packages containing more or less than 20 cigarettes. In 1991, the Legislature enacted a tax on tobacco products other than cigarettes (Smokeless Tobacco Tax) at the rate “proportional to the cigarette tax, having such ratio to the usual wholesale price of the tobacco product other than cigarettes as the cigarette tax bears to the usual wholesale price of the cigarettes.” In 2003, the Smokeless Tobacco Tax
NH DRA 2012 Annual Report - Page 28

was changed to 19% of the wholesale sales price. The Smokeless Tobacco Tax rate was changed again in 2009 to 48.59% of the wholesale sales price, and then in 2010 to a rate of 65.03% of the wholesale sales price. In 2011, the Smokeless Tobacco Tax rate was decreased to its current rate of 48% of the wholesale sales price. Wholesalers are required to report their tax liability for the collection of the Smokeless Tobacco Tax on a monthly basis. The return is due on or before the fifteenth day of the month following the end of the reporting period. Wholesalers may file quarterly, but permission to file quarterly must be pre-approved by the Department in writing. UTILITY PROPERTY TAX - RSA CHAPTER 83-F Utility property is defined as “all real estate, buildings, and structures, machinery, dynamos, apparatus, poles, wires, fixtures of all kinds and descriptions, and pipe lines located within New Hampshire employed in the generation, production, supply, distribution, transmission, or transportation of electric powered or natural gas, crude petroleum and refined petroleum products or combination thereof, water, or sewage.” In 2011, “utility property” was amended to exclude: the electrical generation, production, and supply equipment of an “eligible customer-generator” as defined in RSA 362-A:1-a, II-b; property used for the retail distribution of fuel for personal, non-commercial use, use as a fuel in a motorized vehicle, home cooking, or heating; and that portion of a manufacturing establishment’s generation, production, supply, distribution, transmission, or transportation of electric power or natural gas, crude petroleum and refined petroleum products or combinations thereof, water, or sewage subject to tax under RSA 72:6, 72:7, and 72:8, but not exempt under RSA 72:23, that is expended, used, or consumed on-site primarily for the operation of the manufacturing establishment and that does not otherwise enter the stream of commerce. The Utility Property Tax rate is $6.60 per $1,000 of value of utility property. On December 1 of each year the Department determines the value of utility property as of the previous April 1. The effective date was April 1, 1999. The tax is due annually on or before January 15th. Every corporation or company required to pay Utility Property Tax must file a declaration of its estimated Utility Property Tax for the subsequent taxable period. Quarterly estimated payments of the Utility Property Tax are due on April 15th, June 15th, September 15th, and December 15th.
NH DRA 2012 Annual Report - Page 29

TAX DATES
Estimates Returns or Extensionsby the 10th for County RETTby the 15th for everything else
JULY M & R, RETT, CST & EC
AUGUST M & R, RETT, CST & EC
SEPTEMBER Corporate Business M & R, RETT, CST & ECPart, Prop & Trust BusinessInterest and DividendsUtility Property
OCTOBER M & R, RETT, CST & ECCorporate Business on Extension
NOVEMBER M & R, RETT, CST & ECPart, Prop & Trust Business on Extension
DECEMBER Corporate Business M & R, RETT, CST, EC Part, Prop & Trust BusinessUtility Property
JANUARY Interest and Dividends M & R, RETT, CST & ECUtility Property
FEBRUARY M & R, RETT, CST & EC
MARCH M & R, RETT, CST & ECCorporate Business
APRIL Corporate Business M & R, RETT, CST & ECPart, Prop & Trust Business Part, Prop & Trust BusinessInterest and Dividends Interest and DividendsUtility Property
MAY M & R, RETT, CST & EC
JUNE Corporate Business M & R, RETT, CST & ECPart, Prop & Trust BusinessInterest and DividendsUtility Property
Tax Terms: CST: Communications Service TaxEC: Electricity Consumption TaxM&R: Meals & Rentals TaxPart: PartnershipProp: ProprietorshipRETT: Real Estate Transfer Tax
NH DRA 2012 Annual Report - Page 30

NH
DEP
ARTM
ENT
OF
REV
ENU
E AD
MIN
ISTR
ATIO
N:
R
efer
ence
Doc
umen
t
DO
CU
MEN
T TI
TLE:
H
isto
rical
Sum
mar
y
L
AST
DAT
E R
EVIS
ED:
J
uly
2012
BU
SIN
ESS
PRO
FITS
TAX
: R
SA 7
7-A
- Ena
cted
Apr
il 27
, 197
0
SESS
ION
YEA
REF
FEC
TIVE
DAT
EC
HAP
TER
FILI
NG
TH
RES
HO
LDTA
X R
ATE
QU
ARTE
RLY
EST
IMAT
E PA
YMEN
TS
1970
Spe
cial
Se
ssio
n4/
27/7
0 In
cept
ion
of th
e la
wC
H 5
:1$3
,000
, Gro
ss B
usin
ess
Inco
me
6%N
one
1971
7/1/
71C
H 5
15:1
4N
o ch
ange
7%N
one
1973
Ret
urns
due
on
perio
ds e
ndin
g on
or a
fter 1
2/31
/73
CH
579
:1$6
,000
, Gro
ss B
usin
ess
Inco
me
7%N
one
1977
7/1/
77C
H 5
93:1
No
chan
ge8%
Non
e
1979
8/24
/79
CH
446
:4N
o ch
ange
8%25
% e
ach
quar
ter
1981
7/1/
81 C
H 4
61:1
[Rev
305
.01(
a),
Doc
.#41
92]
$12,
000,
Gro
ss B
usin
ess
Inco
me
9.08
% e
ff. F
or
year
s en
ding
on
or a
fter 7
/1/8
1 an
d be
fore
7/1
/83
8% p
lus,
sur
tax
of 1
3.5%
Effe
ctiv
e ra
te 9
.08%
No
chan
ge
1982
7/1/
82C
H 5
68:6
5,II,
CH
42:
70$1
2,00
0, G
ross
Bus
ines
s In
com
e M
inim
um ta
x of
$25
0, re
peal
ed th
e 19
82 la
w D
RA
orde
red
to re
fund
$N
o ch
ange
1983
7/1/
83C
H 4
69.4
2 [R
ev 3
05.0
1 (b
), D
oc.#
4192
]$1
2,00
0, G
ross
Bus
ines
s In
com
e fo
r all
tax
year
s en
ding
on
and
afte
r 7/1
/83
and
on o
r bef
ore
6/30
/84
8% p
lus,
sur
tax
of 1
9.5%
Effe
ctiv
e ra
te 9
.56%
No
chan
ge
1983
7/1/
84C
H 4
69.4
2 [R
ev 3
05.0
1 (b
), D
oc.#
4192
]$1
2,00
0, G
ross
Bus
ines
s In
com
e fo
r all
tax
year
s en
ding
on
and
afte
r 7/1
/84
and
on o
r bef
ore
6/30
/85
8% p
lus,
sur
tax
of 1
3.5%
Effe
ctiv
e ra
te 9
.08%
(sur
tax
ende
d /3
0/85
)N
o ch
ange
1985
7/1/
85C
H 4
08:1
$12,
000,
Gro
ss B
usin
ess
Inco
me
An e
ffect
ive
rate
that
dec
lines
mon
thly
du
ring
the
Stat
e of
NH
's fi
scal
yea
r en
ding
6/3
0/86
No
chan
ge
1985
7/1/
85C
H 4
08
1985
Shor
t per
iod
tax
year
s be
ginn
ing
befo
re 7
/1/8
5 an
d en
ding
afte
r 6/
30/8
6. T
he e
ff ra
te s
hall
be a
s fo
llow
s:
CH
469
:42
1986
6/30
/86
CH
153
$12,
000,
Gro
ss B
usin
ess
Inco
me
Effe
ctiv
e ra
te 8
.25%
for t
ax y
ears
en
ding
on
or a
fter 7
/1/8
6 an
d be
fore
7/
1/87
No
chan
ge
1988
6/30
/88
$12,
000,
Gro
ss B
usin
ess
Inco
me
8%N
o ch
ange
Mul
tiply
the
num
ber o
f mon
ths
of th
e ta
x pe
riod
occu
rrin
g pr
ior t
o 7/
1/85
by
the
mon
thly
eff.
tax
rate
(.00
7566
) for
suc
h pe
riod.
M
ultip
ly th
e nu
mbe
r of m
onth
s of
the
tax
perio
d oc
curr
ing
subs
eque
nt to
7/1
/85
by th
e m
onth
ly e
ff. T
ax ra
te (.
0068
75) f
or s
uch
perio
d. A
dd th
e pr
oduc
t of t
hese
cal
cula
tions
; div
ide
this
sum
by
the
tota
l num
ber o
f mon
ths
in th
e sh
ort p
erio
d ta
x ye
ar, a
nd;
mul
tiply
the
resu
lting
pro
duct
by
12.
This
doc
umen
t is
only
a b
rief s
umm
ary
of th
e su
bjec
t mat
ter,
curr
ent a
s of
the
last
revi
sion
dat
e. I
t is
not i
nten
ded
to b
e re
lied
upon
as
the
full
and
com
plet
e te
xt.
Ple
ase
refe
r to
the
appl
icab
le fo
rms,
inst
ruct
ions
, rul
es a
nd to
the
law
s ci
ted
belo
w to
det
erm
ine
how
this
info
rmat
ion
appl
ies
to s
peci
fic p
erso
ns o
r situ
atio
ns.
Cur
rent
Due
Dat
e: C
orpo
rate
retu
rns
are
due
Mar
ch 1
5 or
the
15th
day
of t
he 3
rd m
onth
follo
win
g th
e en
d of
the
taxa
ble
year
.
Pro
prie
tors
hip,
Par
tner
ship
and
Fid
ucia
ry re
turn
s ar
e du
e A
pril
15 o
r the
15t
h da
y of
the
4th
mon
th fo
llow
ing
the
end
of th
e ta
xabl
e ye
ar.
All t
ax y
ears
end
ing
on o
r afte
r 7/1
/85
and
on o
r bef
ore
6/30
/86
exce
pt s
hort
perio
d ta
x ye
ars.
The
eff.
Rat
e sh
all b
e as
follo
ws:
7/31
/85
9
.01%
8/3
1/85
8
.94%
9/3
0/85
8
.87%
10/
31/8
5
8.8
0%
1
1/30
/85
8
.73%
12
/31/
85
8.66
%
1
/31/
86
8.6
0%
2
/28/
86
8.5
3%
3
/31/
86
8
.46%
4/3
0/86
8.3
9%
5/31
/86
8
.32%
6/3
0/86
8
.25%

NH
DEP
ARTM
ENT
OF
REV
ENU
E AD
MIN
ISTR
ATIO
N:
R
efer
ence
Doc
umen
t
DO
CU
MEN
T TI
TLE:
H
isto
rical
Sum
mar
y
L
AST
DAT
E R
EVIS
ED:
J
uly
2012
This
doc
umen
t is
only
a b
rief s
umm
ary
of th
e su
bjec
t mat
ter,
curr
ent a
s of
the
last
revi
sion
dat
e. I
t is
not i
nten
ded
to b
e re
lied
upon
as
the
full
and
com
plet
e te
xt.
Ple
ase
refe
r to
the
appl
icab
le fo
rms,
inst
ruct
ions
, rul
es a
nd to
the
law
s ci
ted
belo
w to
det
erm
ine
how
this
info
rmat
ion
appl
ies
to s
peci
fic p
erso
ns o
r situ
atio
ns.
BU
SIN
ESS
PRO
FITS
TAX
: R
SA 7
7-A
(Con
tinue
d)
SESS
ION
YEA
REF
FEC
TIVE
DAT
EC
HAP
TER
FILI
NG
TH
RES
HO
LDTA
X R
ATE
QU
ARTE
RLY
EST
IMAT
E PA
YMEN
TS
1990
4/1/
90C
H 3
:71
$12,
000,
Gro
ss B
usin
ess
Inco
me
8%30
%,
30%
, 20
%,
20%
1991
3/28
/91
CH
5:1
C
H 3
54
C
H 3
54:7
$12,
000,
Gro
ss B
usin
ess
Inco
me
Busi
ness
tax
cred
its e
xpan
ded,
RSA
77-
A:5-
IV
Sale
s ap
porti
onm
ent f
acto
r x 1
.5 P
ayro
ll,
Prop
erty
& S
ales
÷ 3
.5 e
ff 1/
1/92
8%35
%,
35%
, 15
%,
15%
1991
5/27
/91
CH
163
:17
$12,
000,
Gro
ss B
usin
ess
Inco
me
8%30
%,
30%
, 20
%,
20%
1993
7/1/
94 &
7/1
/99
CH
350
:11
CH
350
:12
1993
7/1/
93C
H 2
02:1
CH
350
:8
C
H 3
50:9
CH
313
CH
350
:18
$50,
000,
Gro
ss B
usin
ess
Inco
me
appl
ies
to
retu
rns
endi
ng a
fter 6
/30/
93
Allo
win
g &
Reg
ulat
ing
LLC
s ef
f 7/1
/93
7.5%
for F
Y 94
7.
0% fo
r FY
95
ef
f 7/1
/94
25%
, 25
%,
25%
, 25
%
Effe
ctiv
e 7/
1/93
1995
7/1/
95C
H 1
88
C
H 3
08:9
3
CH
172
,
sect
ion
162L
:9
Rep
eale
d al
l cre
dits
:
R
epea
led
the
CH
188
repe
als,
but
did
not
re
inst
ate
the
rese
arch
& d
evel
opm
ent t
ax c
redi
t, R
SA 7
7-A:
5, IX
Exte
nded
CD
FA to
8 y
ears
7%N
o ch
ange
1996
7/1/
96C
H 1
54:1
Mod
ified
QIC
def
initi
on
1997
7/1/
97C
H 3
51:4
3
1998
8/1/
98C
H 1
05
1998
7/1/
98C
H 1
63
1998
7/1/
99C
H 3
38R
e-es
tabl
ishe
s an
inve
stm
ent t
ax c
redi
t und
er R
SA 1
62-L
:10,
whi
ch c
an b
e ap
plie
d to
BPT
or B
ET.
1999
7/1/
99C
H 1
7In
crea
sed
the
BPT
tax
rate
on
the
entir
e ta
x pe
riod
and
not j
ust t
he m
onth
s af
ter J
une
30,
1999
8%N
o ch
ange
2001
7/1/
01C
H 1
58A
tax
is im
pose
d at
the
rate
of 8
.5%
upo
n th
e ta
xabl
e bu
sine
ss p
rofit
s of
eve
ry b
usin
ess
orga
niza
tion
8.5%
No
chan
ge
Sale
s ap
porti
onm
ent f
acto
r x 2
, plu
s Pa
yrol
l & P
rope
rty ÷
4 E
ffect
ive
for f
eder
al ta
x ye
ar e
ndin
g 7/
1/94
For t
ax y
ears
end
ing
on o
r afte
r 7/1
/99
the
fact
ors
reve
rt ba
ck to
: Sal
es a
ppor
tionm
ent f
acto
r x 1
.5, p
lus
Payr
oll &
Pro
perty
/ 3.
5
Auth
oriz
ed a
Tax
Am
nest
y Pr
ogra
m to
run
from
Dec
. 1, 1
997
to F
eb. 1
5, 1
998
Adop
ted
the
IRC
of 1
986
in e
ff on
12/
31/9
7 ex
cept
NO
L ca
rryo
ver w
hich
is e
ff 12
/31/
96.
The
chan
ges
are
eff f
or ta
x ye
ars
begi
nnin
g af
ter 1
/1/9
7. M
ay n
ot e
xcee
d $2
50,0
00 in
a ta
x ye
ar.
Rep
eals
the
tax
on Q
ualif
ied
Vent
ure
Cap
ital F
unds
and
als
o re
late
d de
finiti
ons.
It a
lso
expa
nds
the
activ
ities
of Q
ualif
ied
Inve
stm
ent C
ompa
nies
to in
clud
e a
QIC
C.
Appl
y to
taxa
ble
perio
ds e
ndin
g af
ter 6
/3/9
8.

NH
DEP
ARTM
ENT
OF
REV
ENU
E AD
MIN
ISTR
ATIO
N:
R
efer
ence
Doc
umen
t
DO
CU
MEN
T TI
TLE:
H
isto
rical
Sum
mar
y
L
AST
DAT
E R
EVIS
ED:
J
uly
2012
This
doc
umen
t is
only
a b
rief s
umm
ary
of th
e su
bjec
t mat
ter,
curr
ent a
s of
the
last
revi
sion
dat
e. I
t is
not i
nten
ded
to b
e re
lied
upon
as
the
full
and
com
plet
e te
xt.
Ple
ase
refe
r to
the
appl
icab
le fo
rms,
inst
ruct
ions
, rul
es a
nd to
the
law
s ci
ted
belo
w to
det
erm
ine
how
this
info
rmat
ion
appl
ies
to s
peci
fic p
erso
ns o
r situ
atio
ns.
BU
SIN
ESS
PRO
FITS
TAX
: R
SA 7
7-A
(Con
tinue
d)
SESS
ION
YEA
REF
FEC
TIVE
DAT
EC
HAP
TER
FILI
NG
TH
RES
HO
LDTA
X R
ATE
QU
ARTE
RLY
EST
IMAT
E PA
YMEN
TS
2002
7/1/
02C
H 2
11N
et o
pera
ting
loss
may
onl
y be
car
ried
forw
ard
for
the
10 y
ears
follo
win
g th
e lo
ss y
ear.
For
taxa
ble
perio
ds e
ndin
g: (
a) o
n or
bef
ore
June
30,
200
3,
the
amou
nt o
f net
ope
ratin
g lo
ss g
ener
ated
in a
ta
x ye
ar th
at m
ay b
e ca
rrie
d fo
rwar
d m
ay n
ot
exce
ed $
250,
000;
(b)
on
or a
fter J
uly
1, 2
003,
an
d on
or b
efor
e Ju
ne 3
0, 2
004,
the
amou
nt o
f ne
t ope
ratin
g lo
ss g
ener
ated
in a
tax
year
that
m
ay b
e ca
rrie
d fo
rwar
d m
ay n
ot e
xcee
d $5
00,0
00;
(c) o
n or
afte
r Jul
y 1,
200
4, a
nd o
n or
be
fore
Jun
e 30
, 200
5, th
e am
ount
of n
et o
pera
ting
loss
gen
erat
ed in
a ta
x ye
ar th
at m
ay b
e ca
rrie
d fo
rwar
d m
ay n
ot e
xcee
d $7
50,0
00;
(d) o
n or
afte
r Ju
ly 1
, 200
5, th
e am
ount
of n
et o
pera
ting
loss
ge
nera
ted
in a
tax
year
that
may
be
carr
ied
forw
ard
may
not
exc
eed
$750
,000
. A
dedu
ctio
n fo
r the
am
ount
of t
he n
et o
pera
ting
loss
car
ryov
er
shal
l be
limite
d to
loss
es in
curr
ed o
n or
afte
r Jul
y 1,
199
7.
No
chan
geN
o ch
ange
2003
7/1/
03C
H 3
01 7
7A:4
XIII
2003
7/1/
0377
:55
XII
2004
5/24
/04
CH
143
2005
No
chan
ge
2006
No
chan
ge
2007
7/1/
07C
H 2
63
2007
7/1/
07C
H 2
71-4
-6 1
22
2007
8/17
/07
CH
146
Amen
ded
by in
clud
ing
CR
OP
zone
tax
cred
it
Gra
ntin
g bu
sine
ss ta
x cr
edits
for i
nves
tmen
ts in
cro
p zo
ne p
roje
cts
adde
d.
Eff 8
/21/
07 -
Rep
eals
and
reen
acte
d in
RSA
162-
N:6
Eco
nom
ic R
ev. T
ax Z
one
Cre
dit
Rep
eals
fore
ign
divi
dend
ded
uctio
ns o
f gro
ss b
usin
ess
prof
its.
Res
earc
h &
Dev
elop
men
t Cre
dit:
(1) a
pplie
s to
tax
perio
ds e
ndin
g on
or a
fter 9
/7/0
7; (2
) R
epea
ls R
&D c
redi
t eff
7/1/
13
Amen
ds d
efin
ition
of Q
IC
N
o pa
rt of
dis
tribu
tion
incl
uded
in h
olde
r's g
ross
bus
ines
s pr
ofits
Elec
tion
& re
porti
ng fo
r QIC

NH
DEP
ARTM
ENT
OF
REV
ENU
E AD
MIN
ISTR
ATIO
N:
R
efer
ence
Doc
umen
t
DO
CU
MEN
T TI
TLE:
H
isto
rical
Sum
mar
y
L
AST
DAT
E R
EVIS
ED:
J
uly
2012
This
doc
umen
t is
only
a b
rief s
umm
ary
of th
e su
bjec
t mat
ter,
curr
ent a
s of
the
last
revi
sion
dat
e. I
t is
not i
nten
ded
to b
e re
lied
upon
as
the
full
and
com
plet
e te
xt.
Ple
ase
refe
r to
the
appl
icab
le fo
rms,
inst
ruct
ions
, rul
es a
nd to
the
law
s ci
ted
belo
w to
det
erm
ine
how
this
info
rmat
ion
appl
ies
to s
peci
fic p
erso
ns o
r situ
atio
ns.
BU
SIN
ESS
PRO
FITS
TAX
: R
SA 7
7-A
(Con
tinue
d)
SESS
ION
YEA
REF
FEC
TIVE
DAT
EC
HAP
TER
FILI
NG
TH
RES
HO
LDTA
X R
ATE
QU
ARTE
RLY
EST
IMAT
E PA
YMEN
TS
2008
No
chan
ge
2009
7/17
/09
CH
144
:273
RSA
77-
A:6.
I-a, F
ile o
n a
sale
or e
xcha
nge
of in
tere
st w
heth
er o
r not
gro
ss in
com
e
is in
exc
ess
of $
50,0
00 d
urin
g ta
xabl
e pe
riod
endi
ng o
n or
afte
r 7/1
/09
2009
7/15
/09
CH
223
Esta
blis
h a
com
mitt
ee to
stu
dy b
usin
ess
tax
cred
its a
nd re
port
findi
ngs
12/1
/200
9.
2010
7/8/
10C
H 2
86
2010
7/13
/10
CH
311
2010
7/20
/10
CH
324
:2, 4
and
5
2011
6/14
/11
CH
181
:2
2011
6/25
/11
CH
207
RSA
77-
A:4,
III,
for t
axab
le p
erio
ds b
egin
ning
on
or a
fter J
anua
ry 1
, 201
1:
M
odifi
ed th
e st
anda
rds
and
burd
en o
f pro
of w
ith re
spec
t to
the
Busi
ness
Pro
fits
Tax
dedu
ctio
n fo
r rea
sona
ble
com
pens
atio
n at
tribu
tabl
e to
ow
ners
of p
artn
ersh
ips,
lim
ited
liabi
lity
com
pani
es, a
nd s
ole
prop
rieto
rshi
ps th
at fi
le a
bus
ines
s ta
x re
turn
as
a pa
rtner
ship
or p
ropr
ieto
rshi
p. K
eeps
the
stan
dard
s se
t for
th in
IRC
§16
2(a)
(1) a
nd th
e $5
0,00
0 "r
ecor
d-ke
epin
g sa
fe h
arbo
r." A
men
ds th
e bu
rden
of p
rovi
ng th
e re
ason
able
ness
of t
he c
ompe
nsat
ion
dedu
ctio
n:
A
busi
ness
org
aniz
atio
n cl
aim
ing
a de
duct
ion
bear
s th
e bu
rden
of p
rovi
ng th
at a
ll pr
oprie
tors
, par
tner
s, o
r mem
bers
for w
hom
a d
educ
tion
is b
eing
cla
imed
pro
vide
d ac
tual
pe
rson
al s
ervi
ces
to th
e bu
sine
ss o
rgan
izat
ion
at a
ny ti
me
durin
g th
e ta
xabl
e pe
riod.
O
nce
a bu
sine
ss o
rgan
izat
ion
satis
fies
this
bur
den
of p
roof
, the
am
ount
cla
imed
as
a de
duct
ion
shal
l be
pres
umed
to b
e re
ason
able
, unl
ess
the
Dep
artm
ent p
rove
s by
a
prep
onde
ranc
e of
the
evid
ence
that
the
dedu
ctio
n cl
aim
ed b
y th
e bu
sine
ss o
rgan
izat
ion
is c
lear
ly u
nrea
sona
ble.
RSA
77-
A:4,
III
the
amou
nt o
f the
ded
uctio
n fo
r com
pens
atio
n fo
r per
sona
l ser
vice
s sh
all
be d
eter
min
ed, a
s ap
plic
able
to N
H's
tax
stru
ctur
e, u
sing
the
stan
dard
s se
t for
th in
IRC
§1
62(a
)(1)
. Be
ginn
ing
on o
r afte
r 1/1
/11
ther
e is
a re
cord
-kee
ping
saf
e ha
rbor
for
dedu
ctio
ns u
p to
$50
,000
as
tota
l com
pens
atio
n fo
r the
tax
year
. Al
so c
reat
es a
stu
dy
com
mitt
ee to
stu
dy s
afe
harb
ors
and
the
taxa
tion
of in
vest
men
t org
aniz
atio
ns (r
epor
t due
11
/1/1
1).
RSA
77:
4-b,
allo
ws
a bu
sine
ss o
rgan
izat
ion
enga
ged
in a
n IR
C §
1031
Lik
e-Ki
nd
Exch
ange
to u
tiliz
e a
sing
le m
embe
r lim
ited
liabi
lity
com
pany
, rev
ocab
le tr
ust o
r oth
er
entit
y di
sreg
arde
d fo
r fed
eral
tax
purp
oses
as
the
reci
pien
t ent
ity. U
nder
the
spec
ial r
ule,
th
e re
cipi
ent e
ntity
take
s th
e ba
sis
of th
e re
linqu
ishe
d pr
oper
ty a
s he
ld b
y th
e pa
rent
or
gani
zatio
n as
com
pute
d fo
r fed
eral
inco
me
tax
purp
oses
.
RSA
Cha
pter
162
-N E
cono
mic
Rev
italiz
atio
n Zo
ne T
ax C
redi
t am
ende
d to
ext
end
the
avai
labi
lity
of th
e cr
edits
for f
our y
ears
and
mak
es c
erta
in c
hang
es to
the
elig
ibilit
y fo
r and
de
term
inat
ion
of th
e el
igib
le a
mou
nts
for t
he c
redi
ts.
RSA
77-
A:1,
XXI
(a),
to in
clud
e un
der t
he d
efin
ition
of "
Qua
lifie
d In
vest
men
t Com
pany
" a
Qua
lifie
d C
omm
unity
Dev
elop
men
t Ent
ity (a
s de
fined
in s
ectio
n 45
D o
f the
US
Inte
rnal
R
even
ue C
ode)
, whi
ch is
ow
ned,
con
trolle
d, o
r man
aged
, dire
ctly
or i
ndire
ctly
, by
the
NH
Bu
sine
ss F
inan
ce A
utho
rity.

NH
DEP
ARTM
ENT
OF
REV
ENU
E AD
MIN
ISTR
ATIO
N:
R
efer
ence
Doc
umen
t
DO
CU
MEN
T TI
TLE:
H
isto
rical
Sum
mar
y
L
AST
DAT
E R
EVIS
ED:
J
uly
2012
This
doc
umen
t is
only
a b
rief s
umm
ary
of th
e su
bjec
t mat
ter,
curr
ent a
s of
the
last
revi
sion
dat
e. I
t is
not i
nten
ded
to b
e re
lied
upon
as
the
full
and
com
plet
e te
xt.
Ple
ase
refe
r to
the
appl
icab
le fo
rms,
inst
ruct
ions
, rul
es a
nd to
the
law
s ci
ted
belo
w to
det
erm
ine
how
this
info
rmat
ion
appl
ies
to s
peci
fic p
erso
ns o
r situ
atio
ns.
BU
SIN
ESS
PRO
FITS
TAX
: R
SA 7
7-A
(Con
tinue
d)
SESS
ION
YEA
REF
FEC
TIVE
DAT
EC
HAP
TER
FILI
NG
TH
RES
HO
LDTA
X R
ATE
QU
ARTE
RLY
EST
IMAT
E PA
YMEN
TS
2011
7/1/
13C
H 2
24:3
63
2011
7/1/
14C
H 2
25
2012
6/27
/12
CH
287
:2
2012
5/23
/12
CH
71
2012
8/4/
12C
H 1
16
2012
7/1/
12C
H 2
53R
SA 7
7-A:
7, I
(a) p
uts
into
sta
tute
the
curr
ent p
ract
ice
of a
llow
ing
a ta
xpay
er
to a
pply
the
BET
cred
it ag
ains
t the
BPT
on
a q
uarte
rly b
asis
whe
n m
akin
g es
timat
e pa
ymen
ts.
2012
6/21
/12
CH
279
:10
RSA
77-
G, e
stab
lishe
s an
Edu
catio
n Ta
x C
redi
t aga
inst
the
BPT
equa
l to
85%
of a
bu
sine
ss o
rgan
izat
ion'
s do
natio
n to
a s
chol
arsh
ip o
rgan
izat
ion
unde
r new
cha
pter
RSA
77
-G. F
irst y
ear o
f pro
gram
to b
egin
Jan
uary
1, 2
013.
RSA
77-
A:4,
XIII
(e),
chan
ges
the
appl
icab
ility
date
for C
H 2
24:3
63, L
aws
of 2
011
(see
ab
ove)
from
Jul
y 1,
201
3 to
Jan
uary
1, 2
013.
Cha
nges
the
pros
pect
ive
repe
al d
ate
for t
he R
esea
rch
and
Dev
elop
men
t Tax
Cre
dit
unde
r RSA
77-
A:5,
XIII
from
Jul
y 1,
201
3 to
Jul
y 1,
201
5.
Cre
ates
new
sec
tion
RSA
77-
A:3-
a "E
xpen
se D
educ
tions
," w
hich
allo
ws
an IR
C §
179
dedu
ctio
n no
t to
exce
ed $
25,0
00.
Appl
icab
le to
any
qua
lifyi
ng IR
C §
179
prop
erty
pla
ced
into
ser
vice
on
or a
fter J
anua
ry 1
, 201
2.
RSA
77-
A:4,
XIII
, inc
reas
es th
e am
ount
of N
et O
pera
ting
Loss
that
may
be
gene
rate
d in
a
tax
year
from
$1,
000,
000
to $
10,0
00,0
00.
RSA
77-
A:5,
X, a
pplic
able
for t
axab
le p
erio
ds e
ndin
g on
or a
fter J
uly
1, 2
014,
cha
nges
th
e ca
rryf
orw
ard
perio
ds fo
r the
BET
cre
dit a
gain
st th
e BP
T fro
m fi
ve ta
xabl
e pe
riods
to
ten
taxa
ble
perio
ds.

NH
DEP
ARTM
ENT
OF
REV
ENU
E AD
MIN
ISTR
ATIO
N:
R
efer
ence
Doc
umen
t
DO
CU
MEN
T TI
TLE:
H
isto
rical
Sum
mar
y
L
AST
DAT
E R
EVIS
ED:
J
uly
2012
BU
SIN
ESS
ENTE
RPR
ISE
TAX:
RSA
77-
E
SE
SS
ION
YE
AR
EFF
EC
TIV
E D
ATE
CH
AP
TER
FILI
NG
TH
RE
SH
OLD
TAX
RA
TEQ
UA
RTE
RLY
ES
TIM
ATE
PA
YM
EN
TS
1993
7/1/
93C
H 3
50To
tal G
ross
Rec
eipt
s in
exc
ess
of $
100,
000,
or
the
ente
rpris
e va
lue
tax
base
of w
hich
is g
reat
er
than
$50
,000
.
The
sum
of a
ll co
mpe
nsat
ion
paid
or a
ccru
ed,
inte
rest
pai
d or
acc
rued
and
div
iden
ds p
aid
by th
e bu
sine
ss e
nter
pris
e, b
efor
e sp
ecia
l adj
ustm
ents
or
app
ortio
nmen
ts.
.25%
of t
he e
nter
pris
e va
lue
tax
base
, ca
lcul
ated
usi
ng th
ree
com
pone
nts:
C
ompe
nsat
ion,
Div
iden
ds a
nd In
tere
st
& %
of t
otal
sal
es.
No
estim
ate
paym
ents
are
requ
ired.
1996
7/1/
96C
H 2
35:2
Am
ende
d R
SA
77-
E:5
to e
stab
lish
estim
ate
paym
ents
and
to re
quire
a d
ecla
ratio
n of
es
timat
ed ta
x; a
nd R
SA
7-E
:6 to
est
ablis
h 25
%
quar
terly
pay
men
t sch
edul
e. A
pply
to re
turn
s &
ta
xes
due
endi
ng o
n or
afte
r 1/1
/97
No
chan
geE
stim
ate
paym
ents
est
ablis
hed
in 1
996
at 2
5% e
ach
quar
ter.
If th
e es
timat
ed
tax
is le
ss th
an $
200
a de
clar
atio
n ne
ed
not b
e fil
ed.
1999
7/1/
99C
H 1
7In
crea
sed
the
tax
rate
on
BE
T.2
5% to
.5%
for e
ntire
tax
perio
d an
d no
t jus
t for
the
mon
ths
afte
r 6/3
/99.
No
chan
ge
2001
7/1/
01C
H 1
58In
crea
sed
the
tax
rate
Incr
ease
d fil
ing
thre
shol
d to
gro
ss b
usin
ess
rece
ipts
in e
xces
s of
$15
0,00
0 or
the
ente
rpris
e va
lue
tax
base
gre
ater
than
$75
,000
From
5%
to .7
5% (t
hree
qua
rters
of
1%) f
or p
erio
ds e
ndin
g on
or a
fter
7/1/
01.
No
chan
ge
2003
7/1/
03C
H 3
01 7
7E:3
-aC
rop
Zone
Cre
dit
2004
5/24
/04
CH
143
77E
1,5
QIC
2005
No
chan
ge
2006
No
chan
ge
2007
7/1/
07C
H 2
63 3
-a
CH
271
3b
Rep
eale
d an
d re
enac
ted
Eco
nom
ic R
evita
lizat
ion
Zone
tax
cred
it ef
f. 7/
1/07
R&
D C
redi
t un
used
por
tion
avai
labl
e to
app
ly to
BE
T ef
f 7/
1/07
2008
No
chan
ge
2009
7/15
/09
CH
223
Est
ablis
h a
stud
y co
mm
ittee
to s
tudy
bus
ines
s ta
x cr
edits
. R
epor
t due
12/
1/09
.
This
doc
umen
t is
only
a b
rief s
umm
ary
of th
e su
bjec
t mat
ter,
curr
ent a
s of
the
last
revi
sion
dat
e. I
t is
not i
nten
ded
to b
e re
lied
upon
as
the
full
and
com
plet
e te
xt.
Plea
se
refe
r to
the
appl
icab
le fo
rms,
inst
ruct
ions
, rul
es a
nd to
the
law
s ci
ted
belo
w to
det
erm
ine
how
this
info
rmat
ion
appl
ies
to s
peci
fic p
erso
ns o
r situ
atio
ns.
CH
350
, Law
s of
199
3 en
acte
d th
e B
usin
ess
Ent
erpr
ise
Tax,
RS
A 7
7-E
, effe
ctiv
e 7/
1/93
C
urre
nt D
ue D
ate:
-
Cor
pora
te re
turn
s ar
e du
e M
arch
15t
h or
the
15th
day
of t
he 3
rd m
onth
follo
win
g th
e en
d of
the
taxa
ble
year
.
- Pro
prie
tors
hip,
Par
tner
ship
and
Fid
ucia
ry re
turn
s ar
e du
e A
pril
15 o
r the
15t
h da
y of
the
4th
mon
th fo
llow
ing
the
end
of th
e ta
xabl
e ye
ar.
N
on-p
rofit
org
aniz
atio
n re
turn
s ar
e du
e th
e 15
th d
ay o
f the
5th
mon
th fo
llow
ing
the
end
of th
e ta
xabl
e ye
ar.

NH
DEP
ARTM
ENT
OF
REV
ENU
E AD
MIN
ISTR
ATIO
N:
R
efer
ence
Doc
umen
t
DO
CU
MEN
T TI
TLE:
H
isto
rical
Sum
mar
y
L
AST
DAT
E R
EVIS
ED:
J
uly
2012
This
doc
umen
t is
only
a b
rief s
umm
ary
of th
e su
bjec
t mat
ter,
curr
ent a
s of
the
last
revi
sion
dat
e. I
t is
not i
nten
ded
to b
e re
lied
upon
as
the
full
and
com
plet
e te
xt.
Plea
se
refe
r to
the
appl
icab
le fo
rms,
inst
ruct
ions
, rul
es a
nd to
the
law
s ci
ted
belo
w to
det
erm
ine
how
this
info
rmat
ion
appl
ies
to s
peci
fic p
erso
ns o
r situ
atio
ns.
BU
SIN
ESS
ENTE
RPR
ISE
TAX:
RSA
77-
E (C
ontin
ued)
SE
SS
ION
YE
AR
EFF
EC
TIV
E D
ATE
CH
AP
TER
FILI
NG
TH
RE
SH
OLD
TAX
RA
TEQ
UA
RTE
RLY
ES
TIM
ATE
PA
YM
EN
TS20
107/
13/1
0C
H 3
11R
SA
Cha
pter
162
-N E
cono
mic
Rev
italiz
atio
n Zo
ne T
ax C
redi
t am
ende
d to
ext
end
the
avai
labi
lity
of th
e cr
edits
for f
our m
ore
year
s an
d m
akes
cer
tain
cha
nges
to th
e el
igib
ility
for a
nd
dete
rmin
atio
n of
the
elig
ible
am
ount
s fo
r the
cr
edits
.
2011
7/1/
14C
H 2
25R
SA
77-
A:5
, X, a
pplic
able
for t
axab
le p
erio
ds
endi
ng o
n or
afte
r Jul
y 1,
201
4 ch
ange
s th
e ca
rryfo
rwar
d pe
riods
for t
he B
ET
cred
it ag
ains
t th
e B
PT
from
five
taxa
ble
perio
ds to
ten
taxa
ble
perio
ds.
2011
6/14
/11
CH
181
:3R
SA
77-
E:1
, XIV
(a) t
o in
clud
e un
der t
he d
efin
ition
of
"Qua
lifie
d In
vest
men
t Com
pany
" a Q
ualif
ied
Com
mun
ity D
evel
opm
ent E
ntity
(as
defin
ed in
se
ctio
n 45
D o
f the
US
Inte
rnal
Rev
enue
Cod
e),
whi
ch is
ow
ned,
con
trolle
d, o
r man
aged
, dire
ctly
or
indi
rect
ly, b
y th
e N
H B
usin
ess
Fina
nce
Aut
horit
y.
2012
6/27
/12
CH
287
:3R
SA
77-
G, e
stab
lishe
s an
Edu
catio
n Ta
x C
redi
t ag
ains
t the
BE
T eq
ual t
o 85
% o
f a b
usin
ess
ente
rpris
e's
dona
tion
to a
sch
olar
ship
or
gani
zatio
n un
der n
ew c
hapt
er R
SA
77-
G. T
he
cred
it is
not
dee
med
taxe
s pa
id fo
r pur
pose
s of
R
SA
77-
A:5
, X. F
irst y
ear o
f pro
gram
to b
egin
Ja
nuar
y 1,
201
3.
2012
12/3
1/13
CH
279
:1R
SA
77-
E:5
, effe
ctiv
e fo
r tax
able
per
iods
end
ing
on o
r afte
r Dec
embe
r 31,
201
3, in
crea
ses
the
BE
T fil
ing
thre
shol
d to
gro
ss b
usin
ess
rece
ipts
in
exce
ss o
f $20
0,00
0 or
the
ente
rpris
e va
lue
tax
base
gre
ater
than
$10
0,00
0.
RS
A 7
7-E
:5, e
ffect
ive
for t
axab
le
perio
ds e
ndin
g on
or a
fter D
ecem
ber
31, 2
013,
if th
e es
timat
ed ta
x is
less
th
an $
260
a de
clar
atio
n ne
ed n
ot b
e fil
ed.
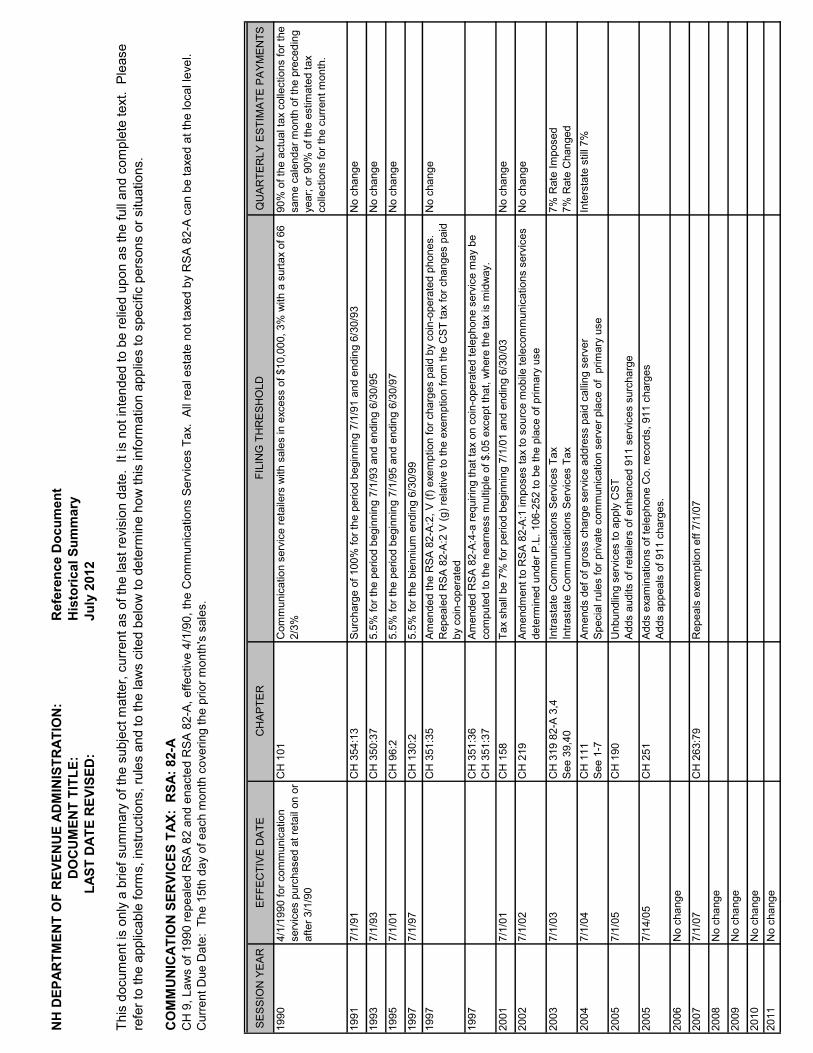
NH
DEP
ARTM
ENT
OF
REV
ENU
E AD
MIN
ISTR
ATIO
N:
R
efer
ence
Doc
umen
t
DO
CU
MEN
T TI
TLE:
H
isto
rical
Sum
mar
y
L
AST
DAT
E R
EVIS
ED:
J
uly
2012
CO
MM
UN
ICAT
ION
SER
VIC
ES T
AX:
RSA
: 82-
A
SE
SS
ION
YE
AR
EFF
EC
TIV
E D
ATE
CH
AP
TER
QU
AR
TER
LY E
STI
MA
TE P
AY
ME
NTS
1990
4/1/
1990
for c
omm
unic
atio
n se
rvic
es p
urch
ased
at r
etai
l on
or
afte
r 3/1
/90
CH
101
90%
of t
he a
ctua
l tax
col
lect
ions
for t
he
sam
e ca
lend
ar m
onth
of t
he p
rece
ding
ye
ar; o
r 90%
of t
he e
stim
ated
tax
colle
ctio
ns fo
r the
cur
rent
mon
th.
1991
7/1/
91C
H 3
54:1
3N
o ch
ange
1993
7/1/
93C
H 3
50:3
7N
o ch
ange
1995
7/1/
01C
H 9
6:2
No
chan
ge
1997
7/1/
97C
H 1
30:2
1997
CH
351
:35
No
chan
ge
1997
CH
351
:36
C
H 3
51:3
720
017/
1/01
CH
158
No
chan
ge
2002
7/1/
02C
H 2
19N
o ch
ange
2003
7/1/
03C
H 3
19 8
2-A
3,4
S
ee 3
9,40
7% R
ate
Impo
sed
7%
Rat
e C
hang
ed20
047/
1/04
CH
111
See
1-7
Inte
rsta
te s
till 7
%
2005
7/1/
05C
H 1
90
2005
7/14
/05
CH
251
2006
No
chan
ge
2007
7/1/
07C
H 2
63:7
9
2008
No
chan
ge
2009
No
chan
ge
2010
No
chan
ge20
11N
o ch
ange
This
doc
umen
t is
only
a b
rief s
umm
ary
of th
e su
bjec
t mat
ter,
curr
ent a
s of
the
last
revi
sion
dat
e. I
t is
not i
nten
ded
to b
e re
lied
upon
as
the
full
and
com
plet
e te
xt.
Plea
se
refe
r to
the
appl
icab
le fo
rms,
inst
ruct
ions
, rul
es a
nd to
the
law
s ci
ted
belo
w to
det
erm
ine
how
this
info
rmat
ion
appl
ies
to s
peci
fic p
erso
ns o
r situ
atio
ns.
CH
9, L
aws
of 1
990
repe
aled
RS
A 8
2 an
d en
acte
d R
SA
82-
A, e
ffect
ive
4/1/
90, t
he C
omm
unic
atio
ns S
ervi
ces
Tax.
All
real
est
ate
not t
axed
by
RS
A 8
2-A
can
be
taxe
d at
the
loca
l lev
el.
C
urre
nt D
ue D
ate:
The
15t
h da
y of
eac
h m
onth
cov
erin
g th
e pr
ior m
onth
's s
ales
.
Am
endm
ent t
o R
SA
82-
A:1
impo
ses
tax
to s
ourc
e m
obile
tele
com
mun
icat
ions
ser
vice
s de
term
ined
und
er P
.L. 1
06-2
52 to
be
the
plac
e of
prim
ary
use
Com
mun
icat
ion
serv
ice
reta
ilers
with
sal
es in
exc
ess
of $
10,0
00, 3
% w
ith a
sur
tax
of 6
6 2/
3%
Sur
char
ge o
f 100
% fo
r the
per
iod
begi
nnin
g 7/
1/91
and
end
ing
6/30
/93
5.5%
for t
he p
erio
d be
ginn
ing
7/1/
93 a
nd e
ndin
g 6/
30/9
5
5.5%
for t
he b
ienn
ium
end
ing
6/30
/99
Am
ende
d R
SA
82-
A:4
-a re
quiri
ng th
at ta
x on
coi
n-op
erat
ed te
leph
one
serv
ice
may
be
com
pute
d to
the
near
ness
mul
tiple
of $
.05
exce
pt th
at, w
here
the
tax
is m
idw
ay.
Tax
shal
l be
7% fo
r per
iod
begi
nnin
g 7/
1/01
and
end
ing
6/30
/03
5.5%
for t
he p
erio
d be
ginn
ing
7/1/
95 a
nd e
ndin
g 6/
30/9
7
Am
ende
d th
e R
SA
82-
A:2
, V (f
) exe
mpt
ion
for c
harg
es p
aid
by c
oin-
oper
ated
pho
nes.
R
epea
led
RS
A 8
2-A
:2 V
(g) r
elat
ive
to th
e ex
empt
ion
from
the
CS
T ta
x fo
r cha
nges
pai
d by
coi
n-op
erat
ed
FILI
NG
TH
RE
SH
OLD
Am
ends
def
of g
ross
cha
rge
serv
ice
addr
ess
paid
cal
ling
serv
er
S
peci
al ru
les
for p
rivat
e co
mm
unic
atio
n se
rver
pla
ce o
f pr
imar
y us
e
Unb
undl
ing
serv
ices
to a
pply
CS
T
A
dds
audi
ts o
f ret
aile
rs o
f enh
ance
d 91
1 se
rvic
es s
urch
arge
Intra
stat
e C
omm
unic
atio
ns S
ervi
ces
Tax
Intra
stat
e C
omm
unic
atio
ns S
ervi
ces
Tax
Rep
eals
exe
mpt
ion
eff 7
/1/0
7
Add
s ex
amin
atio
ns o
f tel
epho
ne C
o. re
cord
s, 9
11 c
harg
es
A
dds
appe
als
of 9
11 c
harg
es.

NH
DEP
ARTM
ENT
OF
REV
ENU
E AD
MIN
ISTR
ATIO
N:
R
efer
ence
Doc
umen
t
DO
CU
MEN
T TI
TLE:
H
isto
rical
Sum
mar
y
L
AST
DAT
E R
EVIS
ED:
J
uly
2012
This
doc
umen
t is
only
a b
rief s
umm
ary
of th
e su
bjec
t mat
ter,
curr
ent a
s of
the
last
revi
sion
dat
e. I
t is
not i
nten
ded
to b
e re
lied
upon
as
the
full
and
com
plet
e te
xt.
Plea
se
refe
r to
the
appl
icab
le fo
rms,
inst
ruct
ions
, rul
es a
nd to
the
law
s ci
ted
belo
w to
det
erm
ine
how
this
info
rmat
ion
appl
ies
to s
peci
fic p
erso
ns o
r situ
atio
ns.
CO
MM
UN
ICAT
ION
SER
VIC
ES T
AX:
RSA
: 82-
A (C
ontin
ued)
2012
6/21
/12
CH
279
:4 th
roug
h 27
9:8
Add
s th
e de
finiti
on o
f "In
tern
et" a
nd "I
nter
net a
cces
s" to
RS
A 8
2-A
:2; t
hen
excl
udes
"In
tern
et a
cces
s" fr
om th
e de
finiti
on o
f "co
mm
unic
atio
n se
rvic
es" u
nder
RS
A 8
2-A
:2, I
II an
d ex
clud
es c
harg
es fo
r Int
erne
t acc
ess
from
the
defin
ition
of "
gros
s ch
arge
s" u
nder
R
SA
82-
A:2
,V. C
H 2
79:8
, Law
s of
201
2 in
stru
cts
the
DR
A n
ot to
enf
orce
any
exi
stin
g as
sess
men
ts, t
o pr
ompt
ly w
ithdr
aw a
ny p
endi
ng a
sses
smen
ts a
nd p
rohi
bits
the
DR
A
from
issu
ing
any
addi
tiona
l ass
essm
ents
with
resp
ect t
o In
tern
et a
cces
s an
d C
ST.
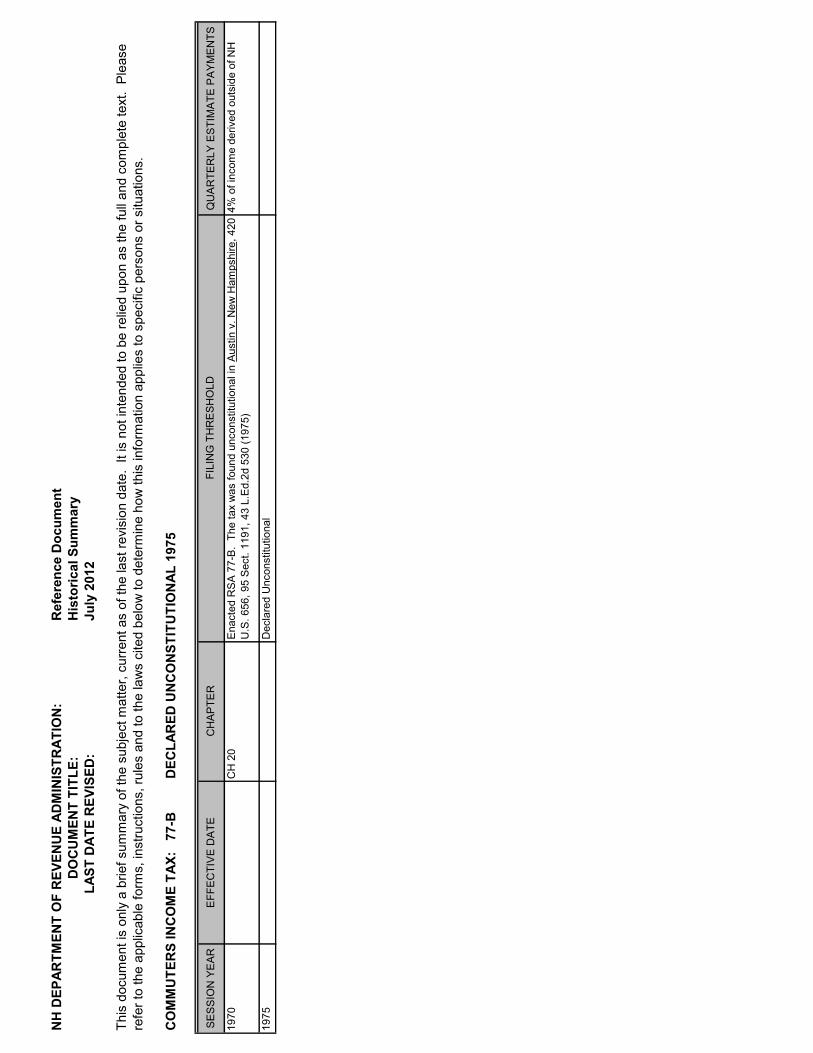
NH
DEP
ARTM
ENT
OF
REV
ENU
E AD
MIN
ISTR
ATIO
N:
R
efer
ence
Doc
umen
t
DO
CU
MEN
T TI
TLE:
H
isto
rical
Sum
mar
y
L
AST
DAT
E R
EVIS
ED:
J
uly
2012
CO
MM
UTE
RS
INC
OM
E TA
X:
77-B
DEC
LAR
ED U
NC
ON
STIT
UTI
ON
AL 1
975
SE
SS
ION
YE
AR
EFF
EC
TIV
E D
ATE
CH
AP
TER
QU
AR
TER
LY E
STI
MA
TE P
AY
ME
NTS
1970
CH
20
4% o
f inc
ome
deriv
ed o
utsi
de o
f NH
1975
This
doc
umen
t is
only
a b
rief s
umm
ary
of th
e su
bjec
t mat
ter,
curr
ent a
s of
the
last
revi
sion
dat
e. I
t is
not i
nten
ded
to b
e re
lied
upon
as
the
full
and
com
plet
e te
xt.
Plea
se
refe
r to
the
appl
icab
le fo
rms,
inst
ruct
ions
, rul
es a
nd to
the
law
s ci
ted
belo
w to
det
erm
ine
how
this
info
rmat
ion
appl
ies
to s
peci
fic p
erso
ns o
r situ
atio
ns.
Ena
cted
RS
A 7
7-B
. Th
e ta
x w
as fo
und
unco
nstit
utio
nal i
n A
ustin
v. N
ew H
amps
hire
, 420
U
.S. 6
56, 9
5 S
ect.
1191
, 43
L.E
d.2d
530
(197
5)
FILI
NG
TH
RE
SH
OLD
Dec
lare
d U
ncon
stitu
tiona
l

NH
DEP
ARTM
ENT
OF
REV
ENU
E AD
MIN
ISTR
ATIO
N:
R
efer
ence
Doc
umen
t
DO
CU
MEN
T TI
TLE:
H
isto
rical
Sum
mar
y
L
AST
DAT
E R
EVIS
ED:
J
uly
2012
ELEC
TRIC
ITY
CO
NSU
MPT
ION
TAX
: R
SA 8
3-E
[A
n ac
t rep
ealin
g th
e Fr
anch
ise
Tax
on E
lect
rical
Util
ities
and
repl
acin
g it
with
a ta
x on
Ele
ctric
ity C
onsu
mpt
ion]
SE
SS
ION
YE
AR
EFF
EC
TIV
E D
ATE
CH
AP
TER
QU
AR
TER
LY E
STI
MA
TE P
AY
ME
NTS
1997
5/1/
01C
H 3
47 (H
B 6
02)
A ta
x is
impo
sed
on th
e co
nsum
ptio
n in
th
is s
tate
of e
lect
rical
ene
rgy
at th
e ra
te
of $
.000
55 p
er k
ilow
att-h
our.
2005
No
chan
ge
2006
No
chan
ge
2007
No
chan
ge
2008
No
chan
ge
2009
No
chan
ge
2010
No
chan
ge20
11N
o ch
ange
2012
No
chan
ge
This
doc
umen
t is
only
a b
rief s
umm
ary
of th
e su
bjec
t mat
ter,
curr
ent a
s of
the
last
revi
sion
dat
e. I
t is
not i
nten
ded
to b
e re
lied
upon
as
the
full
and
com
plet
e te
xt.
Plea
se
refe
r to
the
appl
icab
le fo
rms,
inst
ruct
ions
, rul
es a
nd to
the
law
s ci
ted
belo
w to
det
erm
ine
how
this
info
rmat
ion
appl
ies
to s
peci
fic p
erso
ns o
r situ
atio
ns.
All
pers
ons,
incl
udin
g go
vern
men
tal u
nits
, dis
tribu
ting,
redi
strib
utin
g or
tran
smitt
ing
elec
trica
l ene
rgy
for c
onsu
mpt
ion
in th
is s
tate
E
ffect
ive
30 d
ays
afte
r PU
C c
ertif
ied
(5/1
/01)
E
nact
ed a
new
RS
A 8
3-E
, Ele
ctric
ity C
onsu
mpt
ion
tax
repl
acin
g R
SA
83-
C, F
ranc
hise
Ta
x ef
fect
ive
whe
n el
ectri
c ut
ility
der
egul
atio
n is
impl
emen
ted
FILI
NG
TH
RE
SH
OLD

NH
DEP
ARTM
ENT
OF
REV
ENU
E AD
MIN
ISTR
ATIO
N:
R
efer
ence
Doc
umen
t
DO
CU
MEN
T TI
TLE:
H
isto
rical
Sum
mar
y
L
AST
DAT
E R
EVIS
ED:
J
uly
2012
ESTA
TE T
AX: R
SA 8
7
SE
SS
ION
YE
AR
EFF
EC
TIV
E D
ATE
CH
AP
TER
QU
AR
TER
LY E
STI
MA
TE P
AY
ME
NTS
1931
CH
125
:1Th
e am
ount
of t
he fe
dera
l cre
dit t
aken
fo
r sta
te d
eath
taxe
s pa
id is
wha
t is
sent
to N
H
1995
8/18
/95
CH
246
No
chan
ge
2005
No
chan
ge
2006
No
chan
ge
2007
No
chan
ge
2008
No
chan
ge
2009
No
chan
ge
2010
No
chan
ge20
11N
o ch
ange
2012
No
chan
ge
Cur
rent
Due
Dat
e: F
or d
eced
ents
who
die
d be
fore
8/3
1/91
, 12
mon
ths
from
the
date
of d
eath
.
For d
eced
ents
who
die
d on
or a
fter 9
/1/9
1, 9
mon
ths
from
the
date
of d
eath
.
App
ortio
nmen
t of c
redi
t bet
wee
n st
ates
and
repo
rt of
fede
ral c
hang
es
This
doc
umen
t is
only
a b
rief s
umm
ary
of th
e su
bjec
t mat
ter,
curr
ent a
s of
the
last
revi
sion
dat
e. I
t is
not i
nten
ded
to b
e re
lied
upon
as
the
full
and
com
plet
e te
xt.
Plea
se
refe
r to
the
appl
icab
le fo
rms,
inst
ruct
ions
, rul
es a
nd to
the
law
s ci
ted
belo
w to
det
erm
ine
how
this
info
rmat
ion
appl
ies
to s
peci
fic p
erso
ns o
r situ
atio
ns.
A re
side
nt d
eced
ent's
est
ate,
whi
ch h
as a
tota
l gro
ss e
stat
e of
$60
0,00
0 or
mor
e an
d fil
es a
fede
ral F
orm
706
, mus
t file
with
NH
. A
non
-resi
dent
dec
eden
t's e
stat
e, w
hich
has
re
al e
stat
e in
NH
and
file
s a
fede
ral F
orm
706
, mus
t file
with
NH
.
FILI
NG
TH
RE
SH
OLD

NH
DEP
ARTM
ENT
OF
REV
ENU
E AD
MIN
ISTR
ATIO
N:
R
efer
ence
Doc
umen
t
DO
CU
MEN
T TI
TLE:
H
isto
rical
Sum
mar
y
L
AST
DAT
E R
EVIS
ED:
J
uly
2012
EXC
AVAT
ION
TAX
: RSA
72-
B:3
-11,
& 1
3-17
SE
SS
ION
YE
AR
EFF
EC
TIV
E D
ATE
CH
AP
TER
QU
AR
TER
LY E
STI
MA
TE P
AY
ME
NTS
1997
7/29
/97
CH
219
$.02
per
cub
ic y
ard
asse
ssed
at t
he
time
of e
xcav
atio
n by
the
loca
l as
sess
ing
offic
ial w
ithin
30
days
afte
r re
ceip
t of a
repo
rt of
exc
avat
ed m
ater
ial
2005
No
chan
ge
2006
No
chan
ge
2007
No
chan
ge
2008
No
chan
ge
2009
No
chan
ge
2010
No
chan
ge20
11N
o ch
ange
2012
No
chan
ge
This
doc
umen
t is
only
a b
rief s
umm
ary
of th
e su
bjec
t mat
ter,
curr
ent a
s of
the
last
revi
sion
dat
e. I
t is
not i
nten
ded
to b
e re
lied
upon
as
the
full
and
com
plet
e te
xt.
Plea
se
refe
r to
the
appl
icab
le fo
rms,
inst
ruct
ions
, rul
es a
nd to
the
law
s ci
ted
belo
w to
det
erm
ine
how
this
info
rmat
ion
appl
ies
to s
peci
fic p
erso
ns o
r situ
atio
ns.
A $
.02
per c
ubic
yar
d of
mat
eria
l cha
rge
on e
arth
take
n fro
m a
"tax
able
exc
avat
ion"
A
notic
e of
Inte
nt to
Exc
avat
e w
ill h
ave
to b
e fil
ed w
ith th
e m
unic
ipal
ass
essi
ng o
ffici
al.
Afte
r the
ope
ratio
n is
com
plet
e or
no
late
r tha
n 4/
15 o
f eac
h ye
ar a
Rep
ort o
f Exc
avat
ed
Mat
eria
l mus
t be
filed
with
the
mun
icip
ality
and
DR
A
FILI
NG
TH
RE
SH
OLD

NH
DEP
ARTM
ENT
OF
REV
ENU
E AD
MIN
ISTR
ATIO
N:
R
efer
ence
Doc
umen
t
DO
CU
MEN
T TI
TLE:
H
isto
rical
Sum
mar
y
L
AST
DAT
E R
EVIS
ED:
J
uly
2012
EXC
AVAT
ION
AC
TIVI
TY T
AX: R
SA 7
2-B
:1,2
,12
& 1
3-17
SE
SS
ION
YE
AR
EFF
EC
TIV
E D
ATE
CH
AP
TER
QU
AR
TER
LY E
STI
MA
TE P
AY
ME
NTS
1997
1/1/
98C
H 2
19B
ased
on
size
of p
it ar
ea
2005
No
chan
ge
2006
No
chan
ge
2007
No
chan
ge
2008
No
chan
ge
2009
No
chan
ge
2010
No
chan
ge20
11N
o ch
ange
2012
No
chan
ge
This
doc
umen
t is
only
a b
rief s
umm
ary
of th
e su
bjec
t mat
ter,
curr
ent a
s of
the
last
revi
sion
dat
e. I
t is
not i
nten
ded
to b
e re
lied
upon
as
the
full
and
com
plet
e te
xt.
Plea
se
refe
r to
the
appl
icab
le fo
rms,
inst
ruct
ions
, rul
es a
nd to
the
law
s ci
ted
belo
w to
det
erm
ine
how
this
info
rmat
ion
appl
ies
to s
peci
fic p
erso
ns o
r situ
atio
ns.
The
tax
is im
pose
d on
the
pit a
rea
and
shal
l be
dete
rmin
ed a
s of
4/1
eac
h ye
ar, w
hich
is
the
area
from
whi
ch th
e ea
rth h
as b
een
exca
vate
d. O
wne
r mus
t pro
vide
this
info
rmat
ion
annu
ally
to th
eir l
ocal
ass
essi
ng o
ffici
al s
o th
ey c
an c
alcu
late
the
size
of t
he p
it ar
ea.
Pro
vide
d ho
wev
er, t
hat t
his
para
grap
h sh
all n
ot a
pply
to a
ny e
xcav
atio
n w
hich
cea
sed
com
mer
cial
ly u
sefu
l ope
ratio
n pr
ior t
o 8/
24/7
7.
FILI
NG
TH
RE
SH
OLD

NH
DEP
ARTM
ENT
OF
REV
ENU
E AD
MIN
ISTR
ATIO
N:
R
efer
ence
Doc
umen
t
DO
CU
MEN
T TI
TLE:
H
isto
rical
Sum
mar
y
L
AST
DAT
E R
EVIS
ED:
J
uly
2012
FRAN
CH
ISE
TAX:
(E
lect
ric)
RSA
83-
C
R
EPEA
LED
200
1
SE
SS
ION
YE
AR
EFF
EC
TIV
E D
ATE
CH
AP
TER
FILI
NG
RE
QU
IRE
ME
NTS
AN
D P
AY
ME
NT
TAX
RA
TEE
STI
MA
TE P
AY
ME
NTS
1959
1/1/
60C
H 8
6:2
RS
A 8
3-A
Fra
nchi
se T
ax w
as re
peal
ed
Non
e
1983
7/1/
83C
H 4
69:1
00R
SA
83-
B F
ranc
hise
Tax
was
repe
aled
9% o
f the
net
util
ity o
pera
ting
inco
me
Non
e
7/1/
83C
H 4
69:9
8E
nact
ed th
e pr
esen
t RS
A 8
3-C
. P
ublic
util
ities
en
gage
d in
the
man
ufac
ture
, gen
erat
ion,
di
strib
utio
n, tr
ansm
issi
on o
r sal
e of
gas
or
elec
trici
ty p
ursu
ant t
o fra
nchi
ses
gran
ted
by th
is
stat
e
1%25
% d
ue o
n th
e fif
teen
th d
ay o
f the
4th
, 6t
h, 9
th a
nd 1
2th
mon
ths.
1991
7/1/
91C
H 3
54:4
Rem
oved
"ele
ctric
ity" f
rom
the
lang
uage
No
chan
geN
o ch
ange
1993
4/16
/93
CH
49:
2R
eins
erte
d "e
lect
ricity
" int
o th
e la
ngua
geN
o ch
ange
No
chan
ge
1994
6/2/
94C
H 2
63: 1
, 2R
emov
ed "G
as" f
rom
the
lang
uage
No
chan
geN
o ch
ange
1997
7/1/
97C
H 3
47R
epea
led
5/1/
01
Ena
cted
a n
ew R
SA
83-
E, E
lect
ricity
C
onsu
mpt
ion
tax
repl
acin
g R
SA
83-
C, F
ranc
hise
Ta
x ef
fect
ive
whe
n el
ectri
city
util
ity d
ereg
ulat
ion
is
impl
emen
ted
2001
Rep
eale
d
This
doc
umen
t is
only
a b
rief s
umm
ary
of th
e su
bjec
t mat
ter,
curr
ent a
s of
the
last
revi
sion
dat
e. I
t is
not i
nten
ded
to b
e re
lied
upon
as
the
full
and
com
plet
e te
xt.
Plea
se
refe
r to
the
appl
icab
le fo
rms,
inst
ruct
ions
, rul
es a
nd to
the
law
s ci
ted
belo
w to
det
erm
ine
how
this
info
rmat
ion
appl
ies
to s
peci
fic p
erso
ns o
r situ
atio
ns.
Cur
rent
Due
Dat
e: M
arch
15t
h
CH
5 L
aws
of 1
958
- 4%
of t
he in
com
e su
ch u
tility
der
ives
from
the
exer
cise
of s
uch
franc
hise
in th
is s
tate
dur
ing
the
cale
ndar
of a
sses
smen
t.
In 1
991
the
Fran
chis
e Ta
x w
as in
clud
ed w
ith
the
Rai
lroad
Tax
and
Pub
lic U
tiliti
es T
ax u
nder
Cha
pter
83.
It t
hen
was
rem
oved
in 1
931
to C
hapt
er 8
4 as
a F
ranc
hise
Tax
on
its o
wn.

NH
DEP
ARTM
ENT
OF
REV
ENU
E AD
MIN
ISTR
ATIO
N:
R
efer
ence
Doc
umen
t
DO
CU
MEN
T TI
TLE:
H
isto
rical
Sum
mar
y
L
AST
DAT
E R
EVIS
ED:
J
uly
2012
GAM
BLI
NG
WIN
NIN
GS
TAX:
RSA
77:
38-5
0 - R
EPEA
LED
201
1
SE
SS
ION
YE
AR
EFF
EC
TIV
E D
ATE
CH
AP
TER
ES
TIM
ATE
PA
YM
EN
TS20
097/
1/09
CH
144
:249
-253
2010
7/23
/10
CH
371
2011
5/23
/11
CH
47
Rep
eale
d. A
pplic
able
to a
ll ga
mbl
ing
win
ning
s re
ceiv
ed o
n or
afte
r May
23,
201
1.
Ena
cted
this
tax.
The
New
Ham
pshi
re G
ambl
ing
Tax
is a
10%
tax
on a
ny a
nd a
ll ga
mbl
ing
win
nin
gs.
RS
A 7
7:3
8,
III
defin
es “
gam
blin
g w
innin
gs”
as w
innin
gs f
rom
lo
tterie
s a
nd g
am
es
of c
hanc
e in
clud
ing,
but
not
lim
ited
to b
ingo
, slo
t mac
hine
s, k
eno,
pok
er to
urna
men
ts, a
nd
any
othe
r gam
blin
g w
inni
ngs
subj
ect t
o fe
dera
l inc
ome
tax
with
hold
ing.
Am
ends
RS
A 7
7:41
, II e
xem
ptin
g th
e ga
mbl
ing
tax
on g
ambl
ing
win
ning
s w
on p
rior t
o 1/
1/19
99 a
nd d
istri
bute
d in
ann
uity
pay
men
ts.
This
doc
umen
t is
only
a b
rief s
umm
ary
of th
e su
bjec
t mat
ter,
curr
ent a
s of
the
last
revi
sion
dat
e. I
t is
not i
nten
ded
to b
e re
lied
upon
as
the
full
and
com
plet
e te
xt.
Plea
se re
fer t
o th
e ap
plic
able
form
s, in
stru
ctio
ns, r
ules
and
to th
e la
ws
cite
d be
low
to d
eter
min
e ho
w th
is in
form
atio
n ap
plie
s to
spe
cific
per
sons
or s
ituat
ions
.
Cur
rent
Due
Dat
e: A
pril
15th
FILI
NG
TH
RE
SH
OLD

NH
DEP
ARTM
ENT
OF
REV
ENU
E AD
MIN
ISTR
ATIO
N:
R
efer
ence
Doc
umen
t
DO
CU
MEN
T TI
TLE:
H
isto
rical
Sum
mar
y
L
AST
DAT
E R
EVIS
ED:
J
uly
2012
INTE
RES
T AN
D D
IVID
END
S TA
X: R
SA 7
7
SE
SS
ION
YE
AR
EFF
EC
TIV
E D
ATE
CH
AP
TER
ES
TIM
ATE
PA
YM
EN
TS
1923
CH
65:
1N
one
1955
to 6
/30/
771/
1/56
CH
309
:1N
one
7/1/
1977
CH
561
:1
CH
561
:2N
one
1977
6/21
/77
CH
251
:1N
one
1981
9/1/
81C
H 3
14:1
Non
e
CH
314
:3
CH
314
:4
CH
314
:6
1983
12/3
1/83
CH
469
:93
1/4
due
on 4
th, 6
th, 9
th, a
nd 1
2th
mon
ths.
CH
469
:93
III(a
)
CH
469
:95
1986
CH
197
:1N
o ch
ange
Tran
sitio
n ye
ar -
estim
ated
taxe
s ar
e to
be
paid
as
follo
ws:
12½
% o
f the
est
imat
ed ta
x is
du
e 4t
h m
onth
, 12½
% th
e 6t
h m
onth
, 12½
% 9
th m
onth
and
12½
% th
e 12
th m
onth
.
Join
t file
rs w
ith le
ss th
an $
2,40
0 fro
m N
H a
nd V
erm
ont b
anks
or c
redi
t uni
ons
are
not
taxa
ble.
This
doc
umen
t is
only
a b
rief s
umm
ary
of th
e su
bjec
t mat
ter,
curr
ent a
s of
the
last
revi
sion
dat
e. I
t is
not i
nten
ded
to b
e re
lied
upon
as
the
full
and
com
plet
e te
xt.
Plea
se
refe
r to
the
appl
icab
le fo
rms,
inst
ruct
ions
, rul
es a
nd to
the
law
s ci
ted
belo
w to
det
erm
ine
how
this
info
rmat
ion
appl
ies
to s
peci
fic p
erso
ns o
r situ
atio
ns.
Est
ablis
hed
due
date
of r
etur
n on
or b
efor
e th
e 15
th d
ay o
f the
4th
mon
th fo
llow
ing
the
expi
ratio
n of
the
tax
year
Effe
ctiv
e fo
r the
firs
t yea
r end
ing
afte
r 12/
31/8
3
4.25
% A
nnot
atio
n: O
pini
on o
f the
Jus
tices
(195
5) 9
9 N
H 5
15, 1
12 A
2d, 4
6, a
ffirm
ed
how
the
tax
was
bei
ng a
sses
sed;
but
allo
wed
the
Legi
slat
ure
to s
et a
fixe
d ra
te.
5%
A
dded
an
addi
tiona
l $60
0 ex
empt
ion
for e
lder
ly, b
lind
or h
andi
capp
ed p
erso
ns
Exp
ande
d ex
empt
ion
to in
tere
st fr
om d
epos
its in
Ver
mon
t ban
ks
Incr
ease
d ex
empt
ion
to $
1,20
0 fo
r ind
ivid
uals
, par
tner
ship
s, a
ssoc
iatio
ns, t
rust
s &
fid
ucia
ries
Add
ed a
n ad
ditio
nal $
1,20
0 if
both
or e
ither
taxp
ayer
s ar
e 65
or o
lder
, is
blin
d or
ha
ndic
appe
d
Allo
wed
mar
ried
taxp
ayer
s to
file
join
t ret
urns
; with
a fi
ling
thre
shol
d of
$2,
400
Am
ende
d R
SA
77:
18 a
nd m
ade
the
retu
rns
due
on o
r bef
ore
the
first
day
of t
he 5
th
mon
th fo
llow
ing
the
expi
ratio
n of
the
tax
year
.
5%
Prio
r to
1923
, an
inta
ngib
les
tax
was
levi
ed b
y th
e lo
cal a
sses
sing
offi
cial
s. T
he d
ue d
ate
was
May
1st
.
Cur
rent
Due
Dat
e: A
pril
15 o
r the
15t
h da
y of
the
4th
mon
th fo
llow
ing
the
end
of th
e ye
ar.
FILI
NG
TH
RE
SH
OLD
Ena
cted
this
tax.
Exe
mpt
ed in
tere
st in
com
e fro
m N
H b
anks
to p
reve
nt d
oubl
e ta
xatio
n, a
s th
ese
mon
ies
are
alre
ady
taxe
d un
der R
SA
84.
$60
0 of
indi
vidu
al in
com
e

NH
DEP
ARTM
ENT
OF
REV
ENU
E AD
MIN
ISTR
ATIO
N:
R
efer
ence
Doc
umen
t
DO
CU
MEN
T TI
TLE:
H
isto
rical
Sum
mar
y
L
AST
DAT
E R
EVIS
ED:
J
uly
2012
This
doc
umen
t is
only
a b
rief s
umm
ary
of th
e su
bjec
t mat
ter,
curr
ent a
s of
the
last
revi
sion
dat
e. I
t is
not i
nten
ded
to b
e re
lied
upon
as
the
full
and
com
plet
e te
xt.
Plea
se
refe
r to
the
appl
icab
le fo
rms,
inst
ruct
ions
, rul
es a
nd to
the
law
s ci
ted
belo
w to
det
erm
ine
how
this
info
rmat
ion
appl
ies
to s
peci
fic p
erso
ns o
r situ
atio
ns.
INTE
RES
T AN
D D
IVID
END
S TA
X: R
SA 7
7 (C
ontin
ued)
SE
SS
ION
YE
AR
EFF
EC
TIV
E D
ATE
CH
AP
TER
ES
TIM
ATE
PA
YM
EN
TS
1995
Effe
ctiv
e fo
r tax
able
per
iods
on
or a
fter 1
/1/9
5C
H 1
88:2
C
H 1
88:4
C
H 1
88:5
C
H 1
60:1
Am
ends
RS
A 7
7:18
1/4
due
on 4
th, 6
th, 9
th, a
nd 1
2th
mon
ths
Cal
enda
r yea
r tax
paye
rs, f
inal
1/4
due
Ja
nuar
y in
stea
d of
Dec
embe
r
1998
7/1/
98C
H 1
63
CH
163
:8
2002
1/1/
04C
H 4
5N
o ch
ange
2003
7/1/
03C
H 6
4 S
ectio
n 1
2004
5/24
/04
CH
143
2005
No
chan
ge
2006
No
chan
ge
2007
8/17
/07
CH
152
:1
2008
No
chan
ge
2009
App
ly to
t/p
endi
ng o
n or
CH
144
:275
RS
A 7
7:1-
a, N
ew d
efin
ition
s of
acc
umul
ated
pro
fits
and
divi
dend
saf
ter 1
2/31
/09
2009
CH
144
:276
RS
A 7
7:3,
I-b, E
limin
ates
par
tner
ship
s, L
LCs,
ass
ocia
tions
, and
com
pani
es.
2009
CH
144
:277
RS
A 7
7:4,
III,
Div
iden
ds o
ther
than
sto
ck o
r cha
nges
in o
wne
rshi
p of
ent
ity n
ot
2009
CH
144
:278
Rep
eal R
SA
77:
14, T
ax o
f par
tner
ship
s an
d LL
Cs
Rep
eal R
SA
77:
15, T
ax o
f par
tner
s an
d m
embe
rsR
epea
l RS
A 7
7:16
, Tax
of o
ut o
f sta
te p
artn
ersh
ips
and
LLC
s
2010
1/1/
11C
H 3
24:5
Taxp
ayer
reco
rds
adde
d R
SA
77:
37
evid
ence
d th
roug
h ac
tual
dis
tribu
tions
.
Rep
eal R
SA
77:
17, R
e to
77:
14-1
6
Am
ends
RS
A 7
7:11
del
etin
g a
prov
isio
n su
bjec
ting
certa
in in
com
e ac
cum
ulat
ed in
trus
t fo
r the
ben
efit
of u
nbor
n or
una
scer
tain
ed p
erso
ns to
taxa
tion
Rep
eal R
SA
77-
A:2
-c re
lativ
e to
the
tax
on Q
ualif
ied
Ven
ture
Cap
ital F
und
Incr
ease
s th
e th
resh
old
annu
al ta
x lia
bilit
y am
ount
for w
hich
qua
rterly
pay
men
ts o
f es
timat
ed in
tere
st a
nd d
ivid
ends
tax
are
requ
ired
from
$20
0 to
$50
0I&
D fr
om fu
nds
inve
sted
in c
olle
ge tu
ition
sav
ings
pla
n no
t tax
ed
Allo
ws
dedu
ctio
n fro
m ta
xabl
e I&
D in
com
e an
am
ount
equ
al to
any
cas
h di
strib
utio
n m
ade
to a
QIC
C.
Als
o re
quire
s re
capt
ure
of a
pre
viou
sly
take
n de
duct
ion
rela
ting
to
dist
ribut
ion
or re
turn
of c
apita
l with
in 3
taxa
ble
perio
ds a
fter t
he ta
xabl
e pe
riod
is w
hich
it
was
ded
ucte
d. E
ffect
ive
to ta
xabl
e pe
riods
end
ing
afte
r 6/3
0/98
QIC
tran
sitio
n R
SA
's in
effe
ct a
s en
acte
d pr
ior t
o ef
fect
ive
date
for q
ualif
ied
QIC
who
su
bmits
val
id e
lect
ion
prio
r to
5/24
/04
FILI
NG
TH
RE
SH
OLD
Incr
ease
d to
$2,
400
exem
ptio
n fo
r ind
ivid
uals
, par
tner
ship
s, L
LC, a
ssoc
iatio
ns, t
rust
s &
fid
ucia
ries.
Rep
eale
d R
SA
77:
4a re
lativ
e to
the
taxa
bilit
y of
inte
rest
from
dep
osits
in V
T ba
nks

NH
DEP
ARTM
ENT
OF
REV
ENU
E AD
MIN
ISTR
ATIO
N:
R
efer
ence
Doc
umen
t
DO
CU
MEN
T TI
TLE:
H
isto
rical
Sum
mar
y
L
AST
DAT
E R
EVIS
ED:
J
uly
2012
This
doc
umen
t is
only
a b
rief s
umm
ary
of th
e su
bjec
t mat
ter,
curr
ent a
s of
the
last
revi
sion
dat
e. I
t is
not i
nten
ded
to b
e re
lied
upon
as
the
full
and
com
plet
e te
xt.
Plea
se
refe
r to
the
appl
icab
le fo
rms,
inst
ruct
ions
, rul
es a
nd to
the
law
s ci
ted
belo
w to
det
erm
ine
how
this
info
rmat
ion
appl
ies
to s
peci
fic p
erso
ns o
r situ
atio
ns.
INTE
RES
T AN
D D
IVID
END
S TA
X: R
SA 7
7 (C
ontin
ued)
SE
SS
ION
YE
AR
EFF
EC
TIV
E D
ATE
CH
AP
TER
ES
TIM
ATE
PA
YM
EN
TS
2010
7/1/
10C
H 1
:50-
54
2011
6/14
/11
CH
181
:4
CH
181
:5
2011
6/25
/11
CH
207
:4
2012
6/27
/12
CH
286
:3 th
roug
h 28
6:8
For t
axab
le p
erio
ds e
ndin
g on
or a
fter D
ecem
ber 3
1, 2
013,
elim
inat
es th
e ta
xatio
n of
tru
sts
unde
r RS
A C
hp. 7
7. U
nder
the
new
law
, int
eres
t and
div
iden
d in
com
e re
ceiv
ed b
y es
tate
s he
ld b
y tru
stee
s tre
ated
as
gran
tor t
rust
s un
der s
ectio
n 67
1 of
the
Uni
ted
Sta
tes
Inte
rnal
Rev
enue
Cod
e sh
all b
e in
clud
ed in
the
retu
rn o
f the
ir gr
anto
r, to
the
exte
nt th
at
the
gran
tor i
s an
inha
bita
nt o
r res
iden
t of N
ew H
amps
hire
. Inc
ome
repo
rted
by, a
nd ta
xed
fede
rally
as
inte
rest
or d
ivid
ends
to, a
trus
t ben
efic
iary
who
is a
n in
divi
dual
inha
bita
nt o
r re
side
nt o
f New
Ham
pshi
re w
ith re
spec
t to
dist
ribut
ions
from
a tr
ust t
hat i
s no
t tre
ated
as
a gr
anto
r tru
st u
nder
sec
tion
671
of th
e U
nite
d S
tate
s In
tern
al R
even
ue C
ode
shal
l be
incl
uded
as
inte
rest
or d
ivid
ends
in th
e re
turn
of s
uch
bene
ficia
ry a
nd s
ubje
ct to
taxa
tion
in a
ccor
danc
e w
ith th
e pr
ovis
ions
of R
SA
Chp
. 77.
Rep
eals
CH
144
, Law
s of
200
9 th
at m
ade
dist
ribut
ions
from
lim
ited
liabi
lity
com
pani
es,
partn
ersh
ips
and
asso
ciat
ions
with
non
-tran
sfer
able
sha
res
subj
ect t
o th
e In
tere
st a
nd
Div
iden
ds T
ax. T
he re
peal
is e
ffect
ive
for t
axab
le p
erio
ds e
ndin
g on
or a
fter D
ecem
ber
31, 2
010.
FILI
NG
TH
RE
SH
OLD
For t
axab
le p
erio
ds b
egin
ning
on
or a
fter J
anua
ry 1
, 201
1 an
d al
so ta
xabl
e pe
riods
en
ding
bef
ore
Janu
ary
1, 2
011
if th
e ta
xabl
e pe
riod
is s
ubje
ct to
ass
essm
ent o
f tax
and
ap
peal
und
er R
SA
21-
J:28
-b.
RS
A 7
7:4,
V, a
mou
nts
repo
rted
and
taxe
d fe
dera
lly a
s in
tere
st o
r div
iden
ds to
a h
olde
r of
an o
wne
rshi
p in
tere
st in
a Q
ualif
ied
Inve
stm
ent C
ompa
ny (Q
IC),
a m
utua
l fun
d, o
r a u
nit
inve
stm
ent t
rust
are
taxa
ble
unde
r the
Inte
rest
and
Div
iden
ds T
ax.
R
SA
77:
4-d,
I, am
ount
s ac
crui
ng to
the
hold
er o
f an
owne
rshi
p in
tere
st in
a Q
IC o
r a
mut
ual f
und,
or i
nves
tmen
t inc
ome
earn
ed o
r dis
tribu
tions
rece
ived
by
the
hold
er o
f an
owne
rshi
p in
tere
st in
a u
nit i
nves
tmen
t tru
st, w
hich
QIC
, mut
ual f
und,
or u
nit i
nves
tmen
t tru
st in
vest
s so
lely
in N
ew H
amps
hire
tax-
exem
pt ta
x an
ticip
atio
n no
tes,
bon
d an
ticip
atio
n no
tes,
and
oth
er in
stru
men
ts e
xem
pt u
nder
New
Ham
pshi
re la
w a
re n
ot
treat
ed a
s in
tere
st o
r div
iden
d in
com
e fo
r Int
eres
t and
Div
iden
d Ta
x pu
rpos
es.
R
SA
77:
4-d,
II, a
mou
nts
repo
rted
and
taxe
d fe
dera
lly a
s ca
pita
l gai
ns to
the
hold
er o
f an
owne
rshi
p in
tere
st in
a Q
IC, a
mut
ual f
und,
or a
uni
t inv
estm
ent t
rust
are
not
trea
ted
as
inte
rest
or d
ivid
end
inco
me
for I
nter
est a
nd D
ivid
end
Tax
purp
oses
.
For t
axab
le p
erio
ds b
egin
ning
on
or a
fter J
anua
ry 1
, 201
1, e
xces
s co
mpe
nsat
ion
dete
rmin
ed b
y an
aud
it of
the
Dep
artm
ent s
hall
not b
e co
nsid
ered
a d
ivid
end
unde
r RS
A
chp.
77,
unl
ess
such
det
erm
inat
ion
is a
ccep
ted
by th
e In
tern
al R
even
ue S
ervi
ce.

NH
DEP
ARTM
ENT
OF
REV
ENU
E AD
MIN
ISTR
ATIO
N:
R
efer
ence
Doc
umen
t
DO
CU
MEN
T TI
TLE:
H
isto
rical
Sum
mar
y
L
AST
DAT
E R
EVIS
ED:
J
uly
2012
LEG
ACY
& S
UC
CES
SIO
N T
AX :
RSA
86
SE
SS
ION
YE
AR
EFF
EC
TIV
E D
ATE
CH
AP
TER
TAX
RA
TES
1905
8.50
%
1965
CH
65:
1In
crea
sed
the
rate
to 1
0%
1970
CH
5:4
Incr
ease
d th
e ra
te to
15%
1977
6/30
/97
CH
467
1991
7/31
/91
CH
348
Incr
ease
d th
e ra
te to
18%
1991
7/2/
91C
H 3
53:1
1995
7/1/
95C
H 2
50:6
1995
7/1/
95C
H 2
50
No
chan
ge
1997
7/1/
97C
H 1
28
2001
1/1/
03C
H 1
58
2004
1/1/
05C
H 9
9 S
ectio
n 3
2005
No
chan
ge
2006
No
chan
ge
2007
No
chan
ge
2008
No
chan
ge
2009
No
chan
ge
Cha
nge
refe
renc
e fro
m N
atur
al P
aren
t to
Birt
h P
aren
t
This
doc
umen
t is
only
a b
rief s
umm
ary
of th
e su
bjec
t mat
ter,
curr
ent a
s of
the
last
revi
sion
dat
e. I
t is
not i
nten
ded
to b
e re
lied
upon
as
the
full
and
com
plet
e te
xt.
Plea
se
refe
r to
the
appl
icab
le fo
rms,
inst
ruct
ions
, rul
es a
nd to
the
law
s ci
ted
belo
w to
det
erm
ine
how
this
info
rmat
ion
appl
ies
to s
peci
fic p
erso
ns o
r situ
atio
ns.
Rep
eal R
SA
86:
6, re
lativ
e to
taxa
ble
prop
erty
und
er a
nd ta
x ra
te o
f the
lega
cies
and
su
cces
sion
s ta
x, is
repe
aled
.
This
act
sha
ll ap
ply
only
to e
stat
es e
stab
lishe
d as
the
resu
lt of
dea
ths
on o
r afte
r Jan
uary
1,
200
3.
Am
ende
d 86
:6 I
to re
ad: A
ll pr
oper
ty w
ithin
the
juris
dict
ion
of th
e st
ate,
real
or p
erso
nal
and
any
inte
rest
ther
ein,
bel
ongi
ng to
dom
icill
iarie
s of
the
stat
e.
A
men
ded
86:6
II to
incl
ude
the
dece
dent
's s
hare
of a
hom
este
ad, w
hich
for a
per
iod
of
one
year
imm
edia
tely
pre
cedi
ng th
e da
te o
f dea
th o
f the
dec
eden
t, w
as jo
intly
ow
ned
and
occu
pied
as
a pl
ace
of re
side
nce
by th
e de
cede
nt a
nd b
y th
e br
othe
r or s
iste
r or b
oth,
sh
all b
e ex
empt
from
the
tax
if sa
id h
omes
tead
pas
ses
to o
r for
the
use
of s
aid
brot
her o
r si
ster
.
Sig
nific
antly
rest
ruct
ured
how
this
tax
is a
dmin
iste
red,
resu
lting
in e
xten
sive
rede
sign
of
the
tax
form
s
RS
A 8
6:21
am
ende
d, e
ffect
ive
7/1/
95 re
quiri
ng e
xecu
tors
, adm
inis
trato
rs a
nd tr
uste
es to
fil
e an
inve
ntor
y w
ith P
roba
te a
nd D
RA
Cla
rific
atio
ns o
n ad
opte
d or
ste
p ch
ildre
n, a
llow
ed c
ompe
nsat
ion
and
dedu
ctio
ns, r
epor
ts
of
trusts
…
Cur
rent
Due
Dat
e: F
or d
eced
ents
who
die
d be
fore
8/3
1/91
, 12
mon
ths
from
the
date
of d
eath
.
For d
eced
ents
who
die
d on
or a
fter 9
/1/9
1, 9
mon
ths
from
the
date
of d
eath
.
FILI
NG
TH
RE
SH
OLD
RS
A 8
6, fi
rst e
nact
ed in
190
5, a
s fa
r as
can
be d
eter
min
ed, i
t was
ena
cted
at 8
½%
E
xecu
tors
or a
dmin
istra
tors
of e
very
est
ate
subj
ect t
o ta
x un
der t
his
chap
ter.
A ta
x lia
bilit
y oc
curs
whe
n a
bequ
est,
join
t tra
nsfe
r, or
the
rest
and
resi
due
is g
rant
ed to
a ta
xabl
e le
gate
e su
ch a
s, b
ut n
ot li
mite
d to
bro
ther
s, s
iste
rs,
aunt
s, u
ncle
s, c
ousi
ns, f
riend
s an
d ne
ighb
ors.
If a
retu
rn is
not
file
d w
ithin
9 m
onth
s, p
enal
ties
shal
l not
acc
rue
as o
f the
dat
e an
es
timat
ed ta
x pa
ymen
t is
mad
e of
a le
ast 9
0% o
f the
tax
due

NH
DEP
ARTM
ENT
OF
REV
ENU
E AD
MIN
ISTR
ATIO
N:
R
efer
ence
Doc
umen
t
DO
CU
MEN
T TI
TLE:
H
isto
rical
Sum
mar
y
L
AST
DAT
E R
EVIS
ED:
J
uly
2012
This
doc
umen
t is
only
a b
rief s
umm
ary
of th
e su
bjec
t mat
ter,
curr
ent a
s of
the
last
revi
sion
dat
e. I
t is
not i
nten
ded
to b
e re
lied
upon
as
the
full
and
com
plet
e te
xt.
Plea
se
refe
r to
the
appl
icab
le fo
rms,
inst
ruct
ions
, rul
es a
nd to
the
law
s ci
ted
belo
w to
det
erm
ine
how
this
info
rmat
ion
appl
ies
to s
peci
fic p
erso
ns o
r situ
atio
ns.
LEG
ACY
& S
UC
CES
SIO
N T
AX :
RSA
86
(Con
tinue
d)
SE
SS
ION
YE
AR
EFF
EC
TIV
E D
ATE
CH
AP
TER
TAX
RA
TES
2010
No
chan
ge20
11N
o ch
ange
2012
No
chan
ge
FILI
NG
TH
RE
SH
OLD
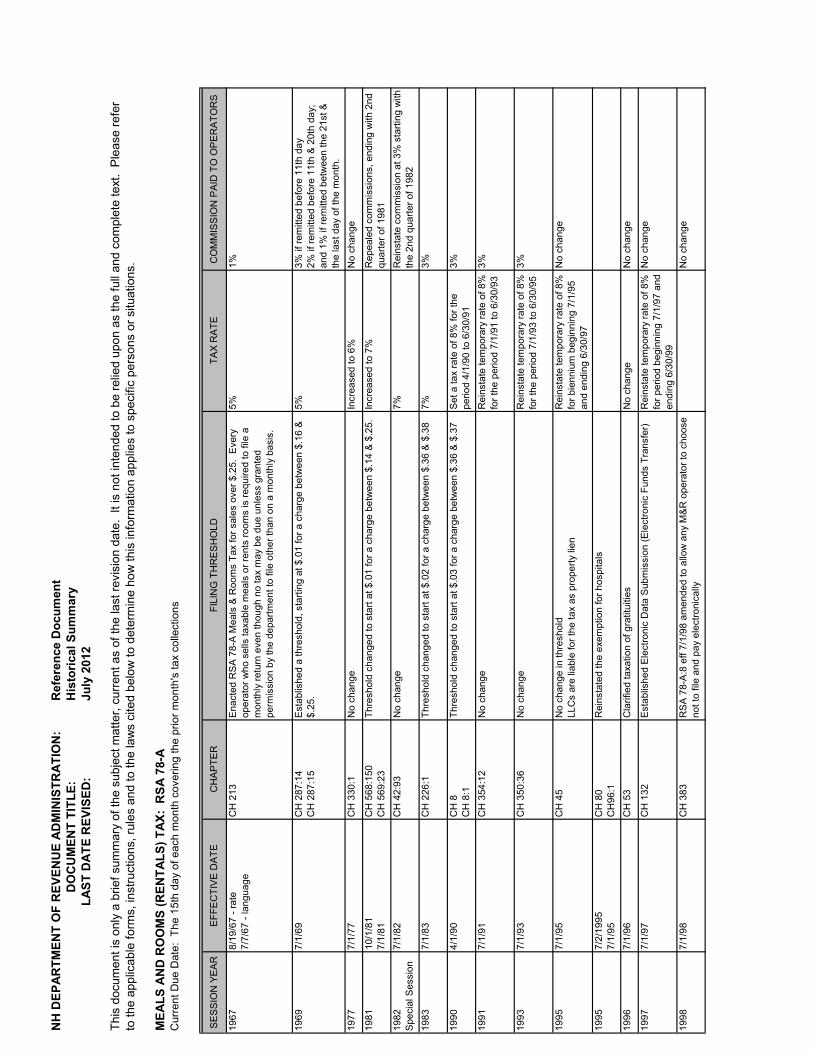
NH
DEP
ARTM
ENT
OF
REV
ENU
E AD
MIN
ISTR
ATI
ON
:
Ref
eren
ce D
ocum
ent
D
OC
UM
ENT
TITL
E:
His
toric
al S
umm
ary
LA
ST D
ATE
REV
ISED
:
Jul
y 20
12
MEA
LS A
ND
RO
OM
S (R
ENTA
LS) T
AX:
RSA
78-
A
SE
SS
ION
YE
AR
EFF
EC
TIV
E D
ATE
CH
AP
TER
FILI
NG
TH
RE
SH
OLD
TAX
RA
TEC
OM
MIS
SIO
N P
AID
TO
OP
ER
ATO
RS
1967
8/19
/67
- rat
e
7/
7/67
- la
ngua
geC
H 2
13E
nact
ed R
SA
78-
A M
eals
& R
oom
s Ta
x fo
r sal
es o
ver $
.25.
Eve
ry
oper
ator
who
sel
ls ta
xabl
e m
eals
or r
ents
room
s is
requ
ired
to fi
le a
m
onth
ly re
turn
eve
n th
ough
no
tax
may
be
due
unle
ss g
rant
ed
perm
issi
on b
y th
e de
partm
ent t
o fil
e ot
her t
han
on a
mon
thly
bas
is.
5%1%
1969
7/1/
69C
H 2
87:1
4
C
H 2
87:1
5E
stab
lishe
d a
thre
shol
d, s
tarti
ng a
t $.0
1 fo
r a c
harg
e be
twee
n $.
16 &
$.
25.
5%3%
if re
mitt
ed b
efor
e 11
th d
ay
2% if
rem
itted
bef
ore
11th
& 2
0th
day;
an
d 1%
if re
mitt
ed b
etw
een
the
21st
&
the
last
day
of t
he m
onth
.19
777/
1/77
CH
330
:1N
o ch
ange
Incr
ease
d to
6%
No
chan
ge
1981
10/1
/81
7/
1/81
CH
568
:150
CH
569
:23
Thre
shol
d ch
ange
d to
sta
rt at
$.0
1 fo
r a c
harg
e be
twee
n $.
14 &
$.2
5.In
crea
sed
to 7
%R
epea
led
com
mis
sion
s, e
ndin
g w
ith 2
nd
quar
ter o
f 198
119
82
Spe
cial
Ses
sion
7/1/
82C
H 4
2:93
No
chan
ge7%
Rei
nsta
te c
omm
issi
on a
t 3%
sta
rting
with
th
e 2n
d qu
arte
r of 1
982
1983
7/1/
83C
H 2
26:1
Thre
shol
d ch
ange
d to
sta
rt at
$.0
2 fo
r a c
harg
e be
twee
n $.
36 &
$.3
87%
3%
1990
4/1/
90C
H 8
C
H 8
:1Th
resh
old
chan
ged
to s
tart
at $
.03
for a
cha
rge
betw
een
$.36
& $
.37
Set
a ta
x ra
te o
f 8%
for t
he
perio
d 4/
1/90
to 6
/30/
913%
1991
7/1/
91C
H 3
54:1
2N
o ch
ange
Rei
nsta
te te
mpo
rary
rate
of 8
%
for t
he p
erio
d 7/
1/91
to 6
/30/
933%
1993
7/1/
93C
H 3
50:3
6N
o ch
ange
Rei
nsta
te te
mpo
rary
rate
of 8
%
for t
he p
erio
d 7/
1/93
to 6
/30/
953%
1995
7/1/
95C
H 4
5
N
o ch
ange
in th
resh
old
LLC
s ar
e lia
ble
for t
he ta
x as
pro
perty
lien
Rei
nsta
te te
mpo
rary
rate
of 8
%
for b
ienn
ium
beg
inni
ng 7
/1/9
5 an
d en
ding
6/3
0/97
No
chan
ge
1995
7/2/
1995
7/1/
95C
H 8
0
CH
96:1
Rei
nsta
ted
the
exem
ptio
n fo
r hos
pita
ls
1996
7/1/
96C
H 5
3C
larif
ied
taxa
tion
of g
ratit
uitie
sN
o ch
ange
No
chan
ge
1997
7/1/
97C
H 1
32E
stab
lishe
d E
lect
roni
c D
ata
Sub
mis
sion
(Ele
ctro
nic
Fund
s Tr
ansf
er)
Rei
nsta
te te
mpo
rary
rate
of 8
%
for p
erio
d be
ginn
ing
7/1/
97 a
nd
endi
ng 6
/30/
99
No
chan
ge
1998
7/1/
98C
H 3
83R
SA
78-
A:8
eff
7/1/
98 a
men
ded
to a
llow
any
M&
R o
pera
tor t
o ch
oose
no
t to
file
and
pay
elec
troni
cally
No
chan
ge
This
doc
umen
t is
only
a b
rief s
umm
ary
of th
e su
bjec
t mat
ter,
curre
nt a
s of
the
last
revi
sion
dat
e. I
t is
not i
nten
ded
to b
e re
lied
upon
as
the
full
and
com
plet
e te
xt.
Ple
ase
refe
r to
the
appl
icab
le fo
rms,
inst
ruct
ions
, rul
es a
nd to
the
law
s ci
ted
belo
w to
det
erm
ine
how
this
info
rmat
ion
appl
ies
to s
peci
fic p
erso
ns o
r situ
atio
ns.
Cur
rent
Due
Dat
e: T
he 1
5th
day
of e
ach
mon
th c
over
ing
the
prio
r mon
th's
tax
colle
ctio
ns
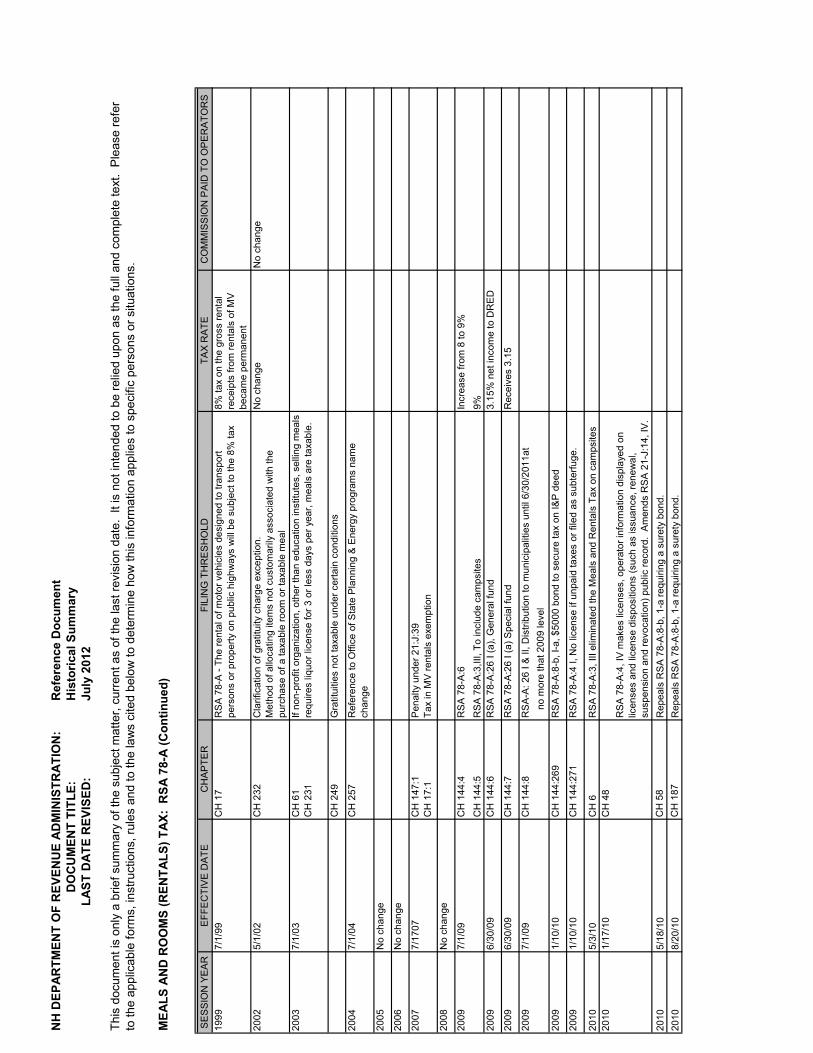
NH
DEP
ARTM
ENT
OF
REV
ENU
E AD
MIN
ISTR
ATI
ON
:
Ref
eren
ce D
ocum
ent
D
OC
UM
ENT
TITL
E:
His
toric
al S
umm
ary
LA
ST D
ATE
REV
ISED
:
Jul
y 20
12
This
doc
umen
t is
only
a b
rief s
umm
ary
of th
e su
bjec
t mat
ter,
curre
nt a
s of
the
last
revi
sion
dat
e. I
t is
not i
nten
ded
to b
e re
lied
upon
as
the
full
and
com
plet
e te
xt.
Ple
ase
refe
r to
the
appl
icab
le fo
rms,
inst
ruct
ions
, rul
es a
nd to
the
law
s ci
ted
belo
w to
det
erm
ine
how
this
info
rmat
ion
appl
ies
to s
peci
fic p
erso
ns o
r situ
atio
ns.
MEA
LS A
ND
RO
OM
S (R
ENTA
LS) T
AX:
RSA
78-
A (C
ontin
ued)
SE
SS
ION
YE
AR
EFF
EC
TIV
E D
ATE
CH
AP
TER
FILI
NG
TH
RE
SH
OLD
TAX
RA
TEC
OM
MIS
SIO
N P
AID
TO
OP
ER
ATO
RS
1999
7/1/
99C
H 1
7R
SA
78-
A -
The
rent
al o
f mot
or v
ehic
les
desi
gned
to tr
ansp
ort
pers
ons
or p
rope
rty o
n pu
blic
hig
hway
s w
ill b
e su
bjec
t to
the
8% ta
x8%
tax
on th
e gr
oss
rent
al
rece
ipts
from
rent
als
of M
V
beca
me
perm
anen
t20
025/
1/02
CH
232
Cla
rific
atio
n of
gra
titui
ty c
harg
e ex
cept
ion.
M
etho
d of
allo
catin
g ite
ms
not c
usto
mar
ily a
ssoc
iate
d w
ith th
e pu
rcha
se o
f a ta
xabl
e ro
om o
r tax
able
mea
l
No
chan
geN
o ch
ange
2003
7/1/
03C
H 6
1
CH
231
If no
n-pr
ofit
orga
niza
tion,
oth
er th
an e
duca
tion
inst
itute
s, s
ellin
g m
eals
re
quire
s liq
uor l
icen
se fo
r 3 o
r les
s da
ys p
er y
ear,
mea
ls a
re ta
xabl
e.
CH
249
Gra
titui
ties
not t
axab
le u
nder
cer
tain
con
ditio
ns
2004
7/1/
04C
H 2
57R
efer
ence
to O
ffice
of S
tate
Pla
nnin
g &
Ene
rgy
prog
ram
s na
me
chan
ge20
05N
o ch
ange
2006
No
chan
ge
2007
7/17
07C
H 1
47:1
CH
17:
1P
enal
ty u
nder
21:
J:39
Tax
in M
V re
ntal
s ex
empt
ion
2008
No
chan
ge
2009
7/1/
09C
H 1
44:4
RS
A 7
8-A
:6In
crea
se fr
om 8
to 9
%C
H 1
44:5
RS
A 7
8-A
:3,II
I, To
incl
ude
cam
psite
s9%
2009
6/30
/09
CH
144
:6R
SA
78-
A:2
6 I (
a), G
ener
al fu
nd
3.15
% n
et in
com
e to
DR
ED
2009
6/30
/09
CH
144
:7R
SA
78-
A:2
6 I (
a) S
peci
al fu
ndR
ecei
ves
3.15
2009
7/1/
09C
H 1
44:8
RS
A-A
: 26
I & II
, Dis
tribu
tion
to m
unic
ipal
ities
unt
il 6/
30/2
011a
t
no m
ore
that
200
9 le
vel
2009
1/10
/10
CH
144
:269
RS
A 7
8-A
:8-b
, I-a
, $50
00 b
ond
to s
ecur
e ta
x on
I&P
dee
d
2009
1/10
/10
CH
144
:271
RS
A 7
8-A
:4 I,
No
licen
se if
unp
aid
taxe
s or
file
d as
sub
terfu
ge.
2010
5/3/
10C
H 6
CH
231
RS
A 7
8-A
:3, I
II el
imin
ated
the
Mea
ls a
nd R
enta
ls T
ax o
n ca
mps
ites
2010
1/17
/10
CH
48
RS
A 7
8-A
:4, I
V m
akes
lice
nses
, ope
rato
r inf
orm
atio
n di
spla
yed
on
licen
ses
and
licen
se d
ispo
sitio
ns (s
uch
as is
suan
ce, r
enew
al,
susp
ensi
on a
nd re
voca
tion)
pub
lic re
cord
. A
men
ds R
SA
21-
J:14
, IV
.20
105/
18/1
0C
H 5
8R
epea
ls R
SA
78-
A:8
-b, 1
-a re
quiri
ng a
sur
ety
bond
.20
108/
20/1
0C
H 1
87R
epea
ls R
SA
78-
A:8
-b, 1
-a re
quiri
ng a
sur
ety
bond
.

NH
DEP
ARTM
ENT
OF
REV
ENU
E AD
MIN
ISTR
ATI
ON
:
Ref
eren
ce D
ocum
ent
D
OC
UM
ENT
TITL
E:
His
toric
al S
umm
ary
LA
ST D
ATE
REV
ISED
:
Jul
y 20
12
This
doc
umen
t is
only
a b
rief s
umm
ary
of th
e su
bjec
t mat
ter,
curre
nt a
s of
the
last
revi
sion
dat
e. I
t is
not i
nten
ded
to b
e re
lied
upon
as
the
full
and
com
plet
e te
xt.
Ple
ase
refe
r to
the
appl
icab
le fo
rms,
inst
ruct
ions
, rul
es a
nd to
the
law
s ci
ted
belo
w to
det
erm
ine
how
this
info
rmat
ion
appl
ies
to s
peci
fic p
erso
ns o
r situ
atio
ns.
MEA
LS A
ND
RO
OM
S (R
ENTA
LS) T
AX:
RSA
78-
A (C
ontin
ued)
SE
SS
ION
YE
AR
EFF
EC
TIV
E D
ATE
CH
AP
TER
FILI
NG
TH
RE
SH
OLD
TAX
RA
TEC
OM
MIS
SIO
N P
AID
TO
OP
ER
ATO
RS
2011
7/1/
11C
H 2
24:1
,2
C
H 2
24:3
16R
SA
78-
A:2
6, fo
r eac
h fis
cal y
ear o
f the
bie
nniu
m e
ndin
g Ju
ne 3
0,
2013
, the
Sta
te T
reas
urer
sha
ll fu
nd th
e di
strib
utio
n of
reve
nue
at n
o m
ore
than
the
fisca
l yea
r 201
1 di
strib
utio
n.
For t
he b
ienn
ium
end
ing
June
30,
201
3, d
istri
butio
n of
net
inco
me
purs
uant
to R
SA
78-
A:2
6, I(
a)(2
) cre
dite
d to
the
Dep
artm
ent o
f R
esou
rces
and
Eco
nom
ic D
evel
opm
ent,
Div
isio
n of
Tra
vel a
nd
Tour
ism
Dev
elop
men
t is
supe
nded
.R
SA
78
-A:4
, II, re
pe
als
the
$5
.00
fee
for
a M
eals
& R
enta
ls O
pera
tor’
s
Lice
nse.
2012
5/23
/12
CH
73:
3 th
roug
h 73
:6R
SA
78-
A:5
, II c
larif
ies
that
an
M&
R L
icen
se s
hall
rem
ain
valid
dur
ing
the
pend
ency
of a
n ap
peal
for a
refu
sal t
o re
new
suc
h lic
ense
. R
SA
78
-A:7
, I(a
) and
RS
A 7
8-A
:7, I
V c
larif
ies
the
curre
nt ta
x ra
te a
t 9%
. R
SA
78-
A:8
-b, I
cla
rifie
s th
e tim
ing
of fi
ling
a su
rety
bon
d to
be
aft
er a
he
arin
g.

NH
DEP
ARTM
ENT
OF
REV
ENU
E AD
MIN
ISTR
ATIO
N:
R
efer
ence
Doc
umen
t
DO
CU
MEN
T TI
TLE:
H
isto
rical
Sum
mar
y
L
AST
DAT
E R
EVIS
ED:
J
uly
2012
MED
ICAI
D E
NH
ANC
EMEN
T TA
X: R
SA 8
4-A
SESS
ION
YEA
REF
FEC
TIVE
DAT
EC
HAP
TER
FILI
NG
TH
RES
HO
LD
1991
6/20
/91
CH
299
Med
icai
d En
hanc
emen
t Tax
ena
cted
RSA
84-
A. T
his
tax
was
de
sign
ed to
be
paid
by
elec
troni
c tra
nsfe
r to
the
Stat
e Tr
easu
rer
1991
11/1
2/91
CH
390
Supp
lem
enta
l Med
icai
d Ta
x en
acte
d R
SA 8
4-B
1993
7/1/
93C
H 4
:16
Supp
lem
enta
l Med
icai
d Ta
x re
peal
ed R
SA 8
4-B
1995
5/10
/95
CH
80
Setti
ng th
e ra
te o
n or
bef
ore
4/1
prec
edin
g th
e fir
st fi
scal
yea
r of t
he
bien
nium
, the
rate
of t
ax fo
r the
per
iod
begi
nnin
g 7/
1/95
and
end
ing
6/30
/97
1999
2003
7/1/
03C
H 3
19
2004
7/1/
05C
H 2
60
2005
No
chan
ge
2006
No
chan
ge
2007
7/1/
07C
H 2
63:5
0
2008
No
chan
ge
2009
No
chan
ge
2010
7/1/
10C
H 1
:12
Amen
ds R
SA 8
4-A:
3, II
-a, t
ax d
ue n
o la
ter t
han
the
15th
day
of t
he
4th
mon
th o
f the
taxa
ble
perio
d.
2011
7/1/
11C
H 2
24:3
4
C
H 2
24:3
8-40
Tran
sfer
s th
e au
thor
ity fo
r the
Med
icai
d En
hanc
emen
t Tax
Acc
ount
fro
m th
e D
HH
S to
the
DR
A.
A
mends the d
efinitio
n o
f “h
ospital” u
nder
RS
A 8
4-A
:1, III and the
definitio
n o
f “n
et patient serv
ices r
evenue”
under
RS
A 8
4-A
:1, IV
-a
In a
dditi
on, p
arag
raph
s I a
nd II
of R
SA 8
4-A:
3, a
s th
ey w
ere
appl
ied
in 1
991
and
1992
, wer
e de
clar
ed n
ull a
nd v
oid.
2012
No
chan
ge
6% o
f gro
ss p
atie
nt s
ervi
ces
reve
nue
Impo
se 6
% u
pon
gros
s pa
tient
ser
vice
s re
venu
e
This
doc
umen
t is
only
a b
rief s
umm
ary
of th
e su
bjec
t mat
ter,
curr
ent a
s of
the
last
revi
sion
dat
e. I
t is
not i
nten
ded
to b
e re
lied
upon
as
the
full
and
com
plet
e te
xt.
Ple
ase
refe
r to
the
appl
icab
le fo
rms,
inst
ruct
ions
, rul
es a
nd to
the
law
s ci
ted
belo
w to
det
erm
ine
how
this
info
rmat
ion
appl
ies
to s
peci
fic p
erso
ns o
r situ
atio
ns.
TAX
RAT
E
8% o
f gro
ss p
atie
nt s
ervi
ces
reve
nue
Impo
sed
on m
edic
al p
atie
nt d
isch
arge
s in
the
amou
nt o
f $25
0 M
, tim
es
the
num
ber o
f Med
icai
d pa
tient
dis
char
ges
of e
ach
hosp
ital f
or th
e sa
me
perio
d du
ring
each
hos
pita
l's fi
scal
yea
r end
ing
durin
g th
e fir
st fu
ll ca
lend
ar y
ear p
rece
ding
the
taxa
ble
perio
d.
No
chan
ge
No
chan
ge
Impo
se ta
x of
5.5
%
Impo
se 6
% u
pon
gros
s pa
tient
ser
vice
s re
venu
e
6% u
pon
the
gros
s pa
tient
ser
vice
s re
venu
e of
eve
ry h
ospi
tal

NH
DEP
ARTM
ENT
OF
REV
ENU
E AD
MIN
ISTR
ATIO
N:
R
efer
ence
Doc
umen
t
DO
CU
MEN
T TI
TLE:
H
isto
rical
Sum
mar
y
L
AST
DAT
E R
EVIS
ED:
J
uly
2012
NO
N-R
ESID
ENT
PER
SON
AL P
RO
PER
TY T
RAN
SFER
TAX
: RSA
89
Cur
rent
Due
Dat
e:Fo
r dec
eden
ts w
ho d
ied
befo
re 8
/31/
91, 1
2 m
onth
s fro
m th
e da
te o
f dea
thFo
r dec
eden
ts w
ho d
ied
on o
r afte
r 9/1
/91,
9 m
onth
s fro
m th
e da
te o
f dea
th
SE
SS
ION
YE
AR
1921
2005
2006
2007
2008
2009
2010
2011
2012
No
chan
ge
No
chan
ge
No
chan
ge
No
chan
ge
This
doc
umen
t is
only
a b
rief s
umm
ary
of th
e su
bjec
t mat
ter,
curr
ent a
s of
the
last
revi
sion
dat
e. I
t is
not i
nten
ded
to b
e re
lied
upon
as
the
full
and
com
plet
e te
xt.
Plea
se re
fer t
o th
e ap
plic
able
form
s, in
stru
ctio
ns, r
ules
and
to th
e la
ws
cite
d be
low
to d
eter
min
e ho
w th
is in
form
atio
n ap
plie
s to
spe
cific
per
sons
or s
ituat
ions
.
TAX
RA
TEFI
LIN
G R
EQ
UIR
EM
EN
TS
CH
70,
Law
s of
192
1 -
A
non
-resi
dent
dec
eden
t's
esta
te o
wni
ng ta
ngib
le p
erso
nal p
rope
rty in
NH
mus
t file
2%
No
chan
ge
No
chan
ge
No
chan
ge
No
chan
ge

NH
DEP
ARTM
ENT
OF
REV
ENU
E AD
MIN
ISTR
ATIO
N:
R
efer
ence
Doc
umen
t
DO
CU
MEN
T TI
TLE:
H
isto
rical
Sum
mar
y
L
AST
DAT
E R
EVIS
ED:
J
uly
2012
NU
RSI
NG
FAC
ILIT
Y Q
UAL
ITY
ASSE
SSM
ENT
TAX:
RSA
84-
C
SE
SS
ION
YE
AR
EFF
EC
TIV
E D
ATE
CH
AP
TER
FILI
NG
TH
RE
SH
OLD
2004
6/16
/04
CH
260
Impo
se 6
% ta
x ne
t pat
ient
reve
nue
2005
No
chan
ge
2006
No
chan
ge
2007
7/1/
07C
H 2
63:5
1
2008
No
chan
ge
2009
No
chan
ge
2010
8/13
/10
CH
152
:1A
men
d R
SA
21-
J:3,
XXI
exe
mpt
ing
RS
A 8
4-C
:5 fr
om
elec
troni
c pa
ymen
t thr
esho
ld o
f $10
0,00
0.
2010
8/13
/10
CH
152
:5A
men
d R
SA
84-
C:3
, no
pena
lties
or i
nter
est f
or la
te
paym
ents
if p
aid
by th
e la
st d
ay o
f the
mon
th d
ue.
2011
7/1/
11C
H 2
24:4
6-48
Pro
vide
s a
cont
inge
ncy
for t
he b
ienn
ium
end
ing
June
30
, 201
3, th
at n
o N
ursi
ng F
acili
ty Q
ualit
y A
sses
smen
t (N
FQA
) sha
ll be
ass
esse
d an
d no
retu
rn s
hall
be
requ
ired.
Fo
r the
bie
nniu
m e
ndin
g Ju
ne 3
0, 2
013,
25%
of t
he
rece
ipts
from
the
NFQ
A a
nd th
e IC
F Q
ualit
y A
sses
smen
t sha
ll be
dep
osite
d as
rest
ricte
d re
venu
e in
acc
ount
s of
the
DH
HS
.Th
e as
sess
men
t per
iod
begi
ning
Apr
il 1s
t sha
ll be
Apr
il 1
to M
ay 3
1, 2
011;
the
retu
rns
shal
l be
filed
on
or
befo
re J
une
27, 2
011;
the
rem
aind
er o
f the
as
sess
men
t per
iod
(Jun
e 1
- Jun
e 30
, 201
1) s
hall
be
carri
ed o
ut a
s w
ould
oth
erw
ise
have
bee
n, e
xcep
t tha
t th
e re
turn
s fil
ed in
Jul
y, 2
011
shal
l onl
y co
ver t
he
perio
d Ju
ne 1
- Jun
e 30
, 201
1.
2012
No
chan
ge
No
chan
ge
This
doc
umen
t is
only
a b
rief s
umm
ary
of th
e su
bjec
t mat
ter,
curr
ent a
s of
the
last
revi
sion
dat
e. I
t is
not i
nten
ded
to b
e re
lied
upon
as
the
full
and
com
plet
e te
xt.
Plea
se
refe
r to
the
appl
icab
le fo
rms,
inst
ruct
ions
, rul
es a
nd to
the
law
s ci
ted
belo
w to
det
erm
ine
how
this
info
rmat
ion
appl
ies
to s
peci
fic p
erso
ns o
r situ
atio
ns.
TAX
RA
TE
6% o
f net
pat
ient
ser
vice
s re
venu
e
5.5%
of n
et p
atie
nt s
ervi
ces
reve
nue

NH
DEP
ARTM
ENT
OF
REV
ENU
E AD
MIN
ISTR
ATIO
N:
R
efer
ence
Doc
umen
t
DO
CU
MEN
T TI
TLE:
H
isto
rical
Sum
mar
y
L
AST
DAT
E R
EVIS
ED:
J
uly
2012
NU
CLE
AR S
TATI
ON
PR
OPE
RTY
TAX
: R
SA 8
3-D
REP
EALE
D 1
999
SE
SS
ION
YE
AR
EFF
EC
TIV
E D
ATE
CH
AP
TER
FILI
NG
TH
RE
SH
OLD
1991
7/1/
91C
H 3
54:1
Ena
cted
RS
A 8
3-D
, and
am
ende
d R
SA
83-
C to
rem
ove
elec
tric
com
pani
es19
925/
19/9
2C
H 1
3:10
Rep
eale
d re
lativ
e to
the
adm
inis
tratio
n of
the
tax
on n
ucle
ar
stat
ion
prop
erty
1993
For t
axab
le p
erio
ds
endi
ng b
efor
e 1/
1/93
CH
49:
4A
tax
is im
pose
d up
on th
e va
lue
of
nucl
ear s
tatio
n pr
oper
tyFo
r tax
able
per
iods
en
ding
12/
31/9
3A
tax
is im
pose
d up
on th
e va
lue
of
nucl
ear s
tatio
n pr
oper
tyFo
r tax
able
per
iods
en
ding
12/
31/9
4A
tax
is im
pose
d up
on th
e va
lue
of
nucl
ear s
tatio
n pr
oper
ty19
931/
1/93
CH
83-
D:4
1999
4/1/
99C
H 1
7Th
e N
ucle
ar S
tatio
n P
rope
rty T
ax is
re
peal
ed e
ff. 4
/1/9
9
This
doc
umen
t is
only
a b
rief s
umm
ary
of th
e su
bjec
t mat
ter,
curr
ent a
s of
the
last
revi
sion
dat
e. I
t is
not i
nten
ded
to b
e re
lied
upon
as
the
full
and
com
plet
e te
xt.
Plea
se re
fer t
o th
e ap
plic
able
form
s, in
stru
ctio
ns, r
ules
and
to th
e la
ws
cite
d be
low
to d
eter
min
e ho
w th
is in
form
atio
n ap
plie
s to
spe
cific
per
sons
or s
ituat
ions
.
TAX
RA
TE
For t
axab
le p
erio
ds e
ndin
g be
fore
1/1
/93,
0.6
4 pe
rcen
t of v
alua
tion
as o
f Apr
il 1.
For t
axab
le p
erio
d en
ding
12/
31/9
3, 0
.491
per
cent
of v
alua
tion
as o
f Apr
il 1.
For t
axab
le p
erio
ds e
ndin
g af
ter 1
2/31
/94,
0.2
5 pe
rcen
t of v
alua
tion
as o
f Apr
il 1.
Sub
ject
to th
e ut
ility
pro
perty
tax
.64%
of v
alua
tion,
to b
e as
sess
ed a
nnua
lly a
s of
4/1
.491
% o
f val
uatio
n, to
be
asse
ssed
as
of 4
/1/9
3
.491
% o
f val
uatio
n, to
be
asse
ssed
as
of 4
/1/9
4. F
or ta
xabl
e pe
riods
end
ing
afte
r 12
/31/
94 a
tax
is im
pose
d up
on th
e va
lue
of
Val
uatio
n - f
or th
e pu
rpos
es o
f the
tax
asse
ssed
prio
r to
4/1/
93, t
he C
omm
issi
oner
of
DR
A s
hall
dete
rmin
e th
e va
luat
ion
of n
ucle
ar s
tatio
n pr
oper
ty u
sing
the
stan
dard
est
imat
e pu
rsua
nt to
RS
A 7
5:1.
For
pur
pose
s of
the
tax
impo
sed
by th
is c
hapt
er a
sses
sed
as o
f 4/
1/93
and
for e
very
yea
r the
reaf
ter,
the
valu
atio
n of
nuc
lear
pro
perty
sha
ll be
$3
,000
,000
,000
.

NH
DEP
ARTM
ENT
OF
REV
ENU
E AD
MIN
ISTR
ATIO
N:
R
efer
ence
Doc
umen
t
DO
CU
MEN
T TI
TLE:
H
isto
rical
Sum
mar
y
L
AST
DAT
E R
EVIS
ED:
J
uly
2012
REA
L ES
TATE
TR
ANSF
ER T
AX:
RSA
78-
BC
urre
nt D
ue D
ate:
Tax
to b
e pa
id w
hen
the
trans
fer i
s re
cord
ed a
t the
Cou
nty
Reg
iste
r of D
eeds
Offi
ce, w
hich
affi
xes
the
trans
fer s
tam
ps to
the
docu
men
t.
SE
SS
ION
YE
AR
EFF
EC
TIV
E D
ATE
CH
AP
TER
TAX
RA
TE
This
was
a F
eder
al T
ax $
1.10
per
$1,
000,
or
fract
ion
ther
eof,
asse
ssed
to b
uyer
onl
y.1/
2/68
-6/3
0/72
CH
320
, Law
s of
196
7E
nact
ed R
SA
78-
B, w
ith a
rate
of $
0.10
per
$10
0,
or fr
actio
n th
ereo
f, as
sess
ed to
buy
er o
nly.
7/1/
72-9
/11/
77$0
.15
per $
100,
or f
ract
ion
ther
eof,
asse
ssed
to
buye
r onl
y9/
12/7
7-6/
30/8
19/
12/7
7C
H 4
95$0
.25
per $
100,
or f
ract
ion
ther
eof,
asse
ssed
to
buye
r onl
y.7/
1/81
-6/3
0/83
7/1/
81C
H 5
68:1
52,I
$0.2
5 pe
r $10
0, o
r fra
ctio
n th
ereo
f, as
sess
ed to
bo
th th
e bu
yer a
nd s
elle
r.19
837/
1/83
CH
469
:97
For t
he b
ienn
ium
end
ing
6/30
/85
$0.5
0 pe
r $10
0,
or fr
actio
nal p
art t
here
of, a
sses
sed
to b
oth
buye
r an
d se
ller.
7/1/
85-6
/30/
877/
1/85
CH
407
:IFo
r the
bie
nniu
m e
ndin
g 6/
30/8
7of $
0.37
5 pe
r $1
00, o
r fra
ctio
nal p
art t
here
of, a
sses
sed
to b
oth
buye
r and
sel
ler.
7/1/
87-6
/30/
897/
1/87
CH
308
:IFo
r the
bie
nniu
m e
ndin
g 6/
30/8
9 of
$0.
35 p
er
$100
, or f
ract
ion
ther
eof,
asse
ssed
to b
oth
buye
r an
d se
ller.
1989
1/1/
90C
H 4
16C
hang
ed p
erm
anen
t rat
e fro
m $
0.25
to $
0.35
, and
se
t rat
e fo
r the
bie
nniu
m e
ndin
g 6/
30/9
1 of
$0.
475
per $
100,
or f
ract
ion
ther
eof,
asse
ssed
to b
oth
buye
r and
sel
ler.
(See
4/1
/90
chan
ge to
the
tax
rate
per
CH
2, b
elow
)19
902/
20/9
0C
H 2
For t
he b
ienn
ium
beg
inni
ng 4
/1/9
0 an
d en
ding
6/
30/9
1 of
$0.
525
per $
100,
or f
ract
ion
ther
eof,
asse
ssed
to b
oth
buye
r and
sel
ler
7/1/
91-6
/30/
937/
1/91
CH
354
:11
For t
he b
ienn
ium
end
ing
6/30
/93
of $
0.52
5 pe
r $1
00, o
r fra
ctio
n th
ereo
f, as
sess
ed to
bot
h bu
yer
and
selle
r
Non
e
Est
ablis
hed
Min
imum
Tax
of $
10
$10
to b
oth
buye
r and
sel
ler
$14
to b
oth
buye
r and
sel
ler
$15
to b
oth
the
buye
r and
sel
ler
$20
to b
oth
buye
r and
sel
ler
$21
to b
oth
buye
r and
sel
ler
$21
to b
oth
buye
r and
sel
ler
This
doc
umen
t is
only
a b
rief s
umm
ary
of th
e su
bjec
t mat
ter,
curr
ent a
s of
the
last
revi
sion
dat
e. I
t is
not i
nten
ded
to b
e re
lied
upon
as
the
full
and
com
plet
e te
xt.
Plea
se
refe
r to
the
appl
icab
le fo
rms,
inst
ruct
ions
, rul
es a
nd to
the
law
s ci
ted
belo
w to
det
erm
ine
how
this
info
rmat
ion
appl
ies
to s
peci
fic p
erso
ns o
r situ
atio
ns.
MIN
IMU
M P
AY
ME
NT
Non
e
If th
e tra
nsfe
r was
less
than
$10
0. N
ot ta
x w
as d
ue.
$19
to b
oth
buye
r and
sel
ler

NH
DEP
ARTM
ENT
OF
REV
ENU
E AD
MIN
ISTR
ATIO
N:
R
efer
ence
Doc
umen
t
DO
CU
MEN
T TI
TLE:
H
isto
rical
Sum
mar
y
L
AST
DAT
E R
EVIS
ED:
J
uly
2012
REA
L ES
TATE
TR
ANSF
ER T
AX:
RSA
78-
BC
urre
nt D
ue D
ate:
Tax
to b
e pa
id w
hen
the
trans
fer i
s re
cord
ed a
t the
Cou
nty
Reg
iste
r of D
eeds
Offi
ce, w
hich
affi
xes
the
trans
fer s
tam
ps to
the
docu
men
t.
SE
SS
ION
YE
AR
EFF
EC
TIV
E D
ATE
CH
AP
TER
TAX
RA
TE
This
doc
umen
t is
only
a b
rief s
umm
ary
of th
e su
bjec
t mat
ter,
curr
ent a
s of
the
last
revi
sion
dat
e. I
t is
not i
nten
ded
to b
e re
lied
upon
as
the
full
and
com
plet
e te
xt.
Plea
se
refe
r to
the
appl
icab
le fo
rms,
inst
ruct
ions
, rul
es a
nd to
the
law
s ci
ted
belo
w to
det
erm
ine
how
this
info
rmat
ion
appl
ies
to s
peci
fic p
erso
ns o
r situ
atio
ns.
MIN
IMU
M P
AY
ME
NT
1994
7/1/
93C
H 3
50:3
8Fo
r the
bie
nniu
m e
ndin
g 6/
30/9
5 of
$0.
50 p
er
$100
, or f
ract
iona
l par
t the
reof
, ass
esse
d to
bot
h bu
yer a
nd s
elle
r
1994
7/1/
93C
H 3
25E
stab
lishe
d th
e re
al e
stat
e tra
nsfe
r que
stio
nnai
re.
1995
7/1/
95C
H 9
6:3
For t
he b
ienn
ium
end
ing
6/30
/97
of $
0.50
per
$1
00, o
r fra
ctio
n th
ereo
f, as
sess
ed to
bot
h bu
yer
and
selle
r19
977/
1/97
CH
130
:3Fo
r the
per
iod
begi
nnin
g 7/
1/97
and
end
ing
6/30
/99,
the
tax
is $
0.50
per
$10
0 or
frac
tiona
l par
t th
ereo
f ass
esse
d to
bot
h bu
yer a
nd s
elle
r
1998
7/18
/98
CH
91
Req
uire
the
filin
g of
a q
uest
ionn
aire
with
DR
A a
nd
the
loca
l ass
esso
r or s
elec
tmen
.6/
20/1
905
6/25
/98
CH
238
Pro
vide
s an
exe
mpt
ion
from
the
trans
fer t
ax fo
r co
nvey
ance
s of
real
pro
perty
from
a m
unic
ipal
ity
whe
n th
e pr
oper
ty is
repu
rcha
sed
by th
e fo
rmer
ow
ner a
fter t
he m
unic
ipal
ity's
acq
uisi
tion
by ta
x de
ed.
1999
7/1/
99C
H 1
7In
crea
sed
the
perm
anen
t tax
rate
ass
esse
d on
the
sale
, gra
ntin
g, a
nd tr
ansf
er o
f rea
l est
ate
and
any
inte
rest
in re
al e
stat
e to
$0.
75 p
er $
100,
or
fract
iona
l par
t the
reof
, of t
he p
rice
or c
onsi
dera
tion.
2001
7/1/
01C
H 1
58D
ecla
ratio
n of
Con
side
ratio
n A
men
ded.
Tra
nsfe
rs
exem
pted
by
RS
A 7
8-B
:2, e
xcep
t tra
nsfe
rs
exem
pted
by
RS
A 7
8-B
:220
047/
1/04
CH
195
Man
ufac
ture
d ho
usin
g re
al e
stat
e tra
nsfe
r tax
2005
7/1/
05C
H 1
77G
ave
tax
amne
sty
to P
&I
2005
7/9/
05C
H 3
1A
dded
pro
cedu
re fo
r Ass
essm
ent o
r ref
und
of ta
x
2006
7/1/
06C
H 1
49:1
1-aV
CH
149
:1V
1C
H 2
19:1
2 XI
X - n
ew
Def
initi
on o
f "sa
le, g
rant
ing
and
trans
fer"
Min
imum
tax
of $
20 to
bot
h bu
yer a
nd s
elle
r
12/1
/05-
2/15
/06
due
by u
npai
d on
or b
efor
e 7/
1/06
This
rate
is a
sses
sed
on b
oth
the
buye
r and
sel
ler f
or a
tota
l tax
rate
of $
1.50
per
$1
00.
Whe
re th
e pr
ice
or c
onsi
dera
tion
is $
4,00
0 or
less
, the
re s
hall
be a
min
imum
ta
x of
$20
, whi
ch is
ass
esse
d, o
n bo
th th
e bu
yer a
nd s
elle
r, fo
r a to
tal t
ax o
f $40
.
Min
imum
tax
of $
20 to
bot
h bu
yer a
nd s
elle
r
Min
imum
tax
of $
20 to
bot
h bu
yer a
nd s
elle
r
A "r
eal e
stat
e ho
ldin
g co
mpa
ny"
Exe
mpt
s ce
rtain
tran
sfer
bet
wee
n ch
arita
ble
orga
niza
tions

NH
DEP
ARTM
ENT
OF
REV
ENU
E AD
MIN
ISTR
ATIO
N:
R
efer
ence
Doc
umen
t
DO
CU
MEN
T TI
TLE:
H
isto
rical
Sum
mar
y
L
AST
DAT
E R
EVIS
ED:
J
uly
2012
REA
L ES
TATE
TR
ANSF
ER T
AX:
RSA
78-
BC
urre
nt D
ue D
ate:
Tax
to b
e pa
id w
hen
the
trans
fer i
s re
cord
ed a
t the
Cou
nty
Reg
iste
r of D
eeds
Offi
ce, w
hich
affi
xes
the
trans
fer s
tam
ps to
the
docu
men
t.
SE
SS
ION
YE
AR
EFF
EC
TIV
E D
ATE
CH
AP
TER
TAX
RA
TE
This
doc
umen
t is
only
a b
rief s
umm
ary
of th
e su
bjec
t mat
ter,
curr
ent a
s of
the
last
revi
sion
dat
e. I
t is
not i
nten
ded
to b
e re
lied
upon
as
the
full
and
com
plet
e te
xt.
Plea
se
refe
r to
the
appl
icab
le fo
rms,
inst
ruct
ions
, rul
es a
nd to
the
law
s ci
ted
belo
w to
det
erm
ine
how
this
info
rmat
ion
appl
ies
to s
peci
fic p
erso
ns o
r situ
atio
ns.
MIN
IMU
M P
AY
ME
NT
2007
7/1/
07C
H 2
63:4
6 &
48
8 1V
4
6 ad
ded
/ 48
repe
aled
2007
8/17
/07
CH
146
1V
2 XI
X re
peal
ed
2008
No
chan
ge
2009
No
chan
ge
2010
No
chan
ge
2011
8/13
/11
CH
179
RS
A 7
8-B
:10,
requ
ires
a pu
rcha
ser a
nd s
elle
r in
a re
al e
stat
e tra
nsfe
r (or
tran
sfer
of i
nter
est t
here
in)
to e
ach
file
a se
para
te D
ecla
ratio
n of
Con
side
ratio
n (F
orm
CD
-57-
P a
nd F
orm
CD
-57-
S) w
ith th
e D
epar
tmen
t.20
12N
o ch
ange
Rep
eale
d46
- C
omm
. Her
itage
Inv.
Pro
gram
. S
urch
arge
adm
in

NH
DEP
ARTM
ENT
OF
REV
ENU
E AD
MIN
ISTR
ATIO
N:
R
efer
ence
Doc
umen
t
DO
CU
MEN
T TI
TLE:
H
isto
rical
Sum
mar
y
L
AST
DAT
E R
EVIS
ED:
J
uly
2012
SAVI
NG
S B
ANK
TAX
: R
SA 8
4R
EPEA
LED
199
3
SE
SS
ION
YE
AR
EFF
EC
TIV
E D
ATE
CH
AP
TER
FILI
NG
TH
RE
SH
OLD
1923
CH
22
RS
A 8
4 ap
pear
s to
hav
e be
en fi
rst e
nact
ed b
y
1935
Sin
ce 1
935,
it w
as b
ased
upo
n C
apita
l Sto
ck
valu
e, p
lus
inte
rest
, Div
iden
ds, a
nd o
ther
div
ided
pr
ofits
for t
he 1
2 m
onth
s pr
eced
ing
Apr
il 1s
t, le
ss
$10,
000,
mul
tiplie
d by
1%
1961
3/31
/62
CH
249
:2R
epea
led
84:8
- 84
:16,
Sav
ings
Ban
ks, T
rust
C
ompa
nies
, Bui
ldin
g an
d Lo
an a
ssoc
iatio
ns, e
tc.
A
dded
84:
16 a
-e19
896/
18/8
9C
H 5
0A
men
ded
84:1
6 - b
, c &
d
1993
7/1/
93C
H 3
50:4
1,IV
Rep
eale
d R
SA
84.
The
ban
ks a
re n
ow p
ayin
g th
e B
ET
and
incl
uded
in th
eir e
nter
pris
e ba
se is
the
inte
rest
, whi
ch th
ey p
ay to
dep
osito
rs.
Est
ablis
hed
a D
ecla
ratio
n of
Est
imat
ed T
ax, w
ith p
aym
ent o
f 1/4
of t
he
estim
ated
tax
to b
e m
ade
on 6
/15,
9/1
5, 1
2/15
and
3/1
5
This
doc
umen
t is
only
a b
rief s
umm
ary
of th
e su
bjec
t mat
ter,
curr
ent a
s of
the
last
revi
sion
dat
e. I
t is
not i
nten
ded
to b
e re
lied
upon
as
the
full
and
com
plet
e te
xt.
Plea
se re
fer t
o th
e ap
plic
able
form
s, in
stru
ctio
ns, r
ules
and
to th
e la
ws
cite
d be
low
to d
eter
min
e ho
w th
is in
form
atio
n ap
plie
s to
spe
cific
per
sons
or
situ
atio
ns.
TAX
RA
TE

NH
DEP
ARTM
ENT
OF
REV
ENU
E AD
MIN
ISTR
ATIO
N:
R
efer
ence
Doc
umen
t
DO
CU
MEN
T TI
TLE:
H
isto
rical
Sum
mar
y
L
AST
DAT
E R
EVIS
ED:
J
uly
2012
STAT
E ED
UC
ATIO
N P
RO
PER
TY T
AX:
RSA
76
SE
SS
ION
YE
AR
EFF
EC
TIV
E D
ATE
CH
AP
TER
1999
4/1/
99C
H 1
7 - R
SA
76:
3 is
re
peal
ed a
nd re
enac
ted
to
read
as
follo
ws:
(see
Tax
R
ate)
2001
4/1/
02H
B 1
70
2003
7/1/
05C
H 2
41
2004
7/1/
04C
H 1
95
2005
7/1/
05C
H 2
57:2
1,22
2006
No
chan
ge
2007
No
chan
ge20
08N
o ch
ange
2009
7/1/
09C
H 1
44:2
70R
SA
21-
J:43
, Cha
nges
inst
allm
ent p
lan
time
leng
th fr
om 6
mon
ths
to n
o am
ount
of t
ime
7/1/
09C
H 1
44:2
85R
SA
72:
28, T
ax e
xem
ptio
n on
Com
mer
cial
Indu
stria
l Con
stru
ctio
n ch
ange
d to
pre
cedi
ng th
e ta
x ye
ar fo
r whi
ch
2010
6/14
/10
CH
153
2011
7/1/
11C
H 2
58
2011
7/13
/11
CH
262
2012
7/1/
12C
H 2
9
2012
4/1/
13C
H 1
69
RS
A 7
6:11
- A
llow
s an
y to
wn,
with
the
appr
oval
of t
he g
over
ning
bod
y, to
sen
d ta
x bi
lls o
r not
ices
by
elec
troni
c m
eans
to
thos
e ta
xpay
ers
who
hav
e sp
ecifi
cally
requ
este
d su
ch d
eliv
ery.
RS
A 7
6:2
and
RS
A 7
6:21
- E
stab
lishe
s th
e pr
oced
ure
for t
he p
rora
tion
of a
sses
smen
ts fo
r pro
perty
taxe
s fo
r tax
able
bu
ildin
gs d
amag
ed d
ue to
uni
nten
ded
fire
or n
atur
al d
isas
ter t
o th
e ex
tent
that
the
build
ing
can
no lo
nger
be
used
for i
ts
inte
nded
use
.
RS
A 7
6:15
-a a
nd R
SA
76:
15-a
a - A
llow
s fo
r the
adj
ustm
ent i
n th
e m
etho
d of
cal
cula
ting
the
parti
al p
aym
ent o
f tax
es re
late
d to
an in
cre
ase o
r decre
ase in
lo
cal educatio
n t
axes r
esultin
g f
rom
a c
hange t
o t
he t
ow
n’s
or
city’s
adequate
educatio
n g
rant
or e
xces
s ta
x am
ount
. The
cha
nges
app
ly to
bot
h se
mi-a
nnua
l and
qua
rterly
col
lect
ion
of ta
xes.
Sta
te w
ide
enha
nced
edu
catio
n ta
x. S
et ra
te to
rais
e $3
63,6
77,5
47
Tax
rate
$3.
24 o
n ea
ch $
1,00
0 va
lue
of ta
xabl
e pr
oper
ty
RS
A 1
98 a
nd R
SA
76 -
Changes t
he n
am
e o
f th
e “
Sta
te E
ducatio
n P
ropert
y T
ax”
to “
Educatio
n T
ax”
and r
epeals
the
requ
irem
ent f
or e
xces
s pa
ymen
ts to
be
rem
itted
to th
e D
epar
tmen
t, th
ereb
y al
low
ing
mun
icip
aliti
es to
reta
in a
ll of
the
stat
e ta
x ac
cess
ed.
It al
so re
peal
s R
SA
198
:47
rega
rdin
g th
e D
P-5
form
and
am
ends
the
calc
ulat
ion
of a
dequ
ate
educ
atio
n gr
ants
an
d m
akes
oth
er c
hang
es to
the
educ
atio
n gr
ant f
orm
ula
and
dist
ribut
ion.
RS
A 7
6:15
-aa,
I, al
low
ing
tow
ns c
onve
rting
to q
uarte
rly p
rope
rty ta
x bi
lling
to m
ake
the
first
bill
due
on
a da
te o
ther
than
Apr
il 1s
t.
exem
ptio
n is
cla
imed
This
doc
umen
t is
only
a b
rief s
umm
ary
of th
e su
bjec
t mat
ter,
curr
ent a
s of
the
last
revi
sion
dat
e. I
t is
not i
nten
ded
to b
e re
lied
upon
as
the
full
and
com
plet
e te
xt.
Plea
se re
fer t
o th
e ap
plic
able
form
s, in
stru
ctio
ns, r
ules
and
to th
e la
ws
cite
d be
low
to d
eter
min
e ho
w th
is in
form
atio
n ap
plie
s to
spe
cific
per
sons
or
situ
atio
ns.
TAX
RA
TE
RS
A 7
6:3
- An
annu
al e
duca
tion
prop
erty
tax
at th
e un
iform
rate
of $
6.60
on
each
$1,
000
of th
e va
lue
of ta
xabl
e pr
oper
ty is
he
reby
impo
sed
on a
ll pe
rson
s an
d pr
oper
ty ta
xabl
e pu
rsua
nt to
RS
A 7
2 an
d R
SA
73,
exc
ept
prop
erty
sub
ject
to ta
x un
der
RS
A 8
2 an
d R
SA
83-
F
Uni
form
rate
of $
5.80
on
each
$1,
000
of th
e va
lue
of ta
xabl
e pr
oper
ty, e
xcep
t pro
perty
sub
ject
to ta
x un
der R
SA
82
and
RS
A
83-F
Con
stitu
tiona
lly o
f law
C
H 9
6:1
Rep
eale
d R
SA
198
:40
& 4
9 an
d co
ntin
gent
app
licab
ility

NH
DEP
ARTM
ENT
OF
REV
ENU
E AD
MIN
ISTR
ATIO
N:
R
efer
ence
Doc
umen
t
DO
CU
MEN
T TI
TLE:
H
isto
rical
Sum
mar
y
L
AST
DAT
E R
EVIS
ED:
J
uly
2012
TELE
PHO
NE
TAX
(Pro
pert
y Ta
x) R
SA 8
2R
EPEA
LED
199
0
SE
SS
ION
YE
AR
EFF
EC
TIV
E D
ATE
CH
AP
TER
1911
RS
A 8
2
1990
CH
9:3
This
doc
umen
t is
only
a b
rief s
umm
ary
of th
e su
bjec
t mat
ter,
curr
ent a
s of
the
last
revi
sion
dat
e. I
t is
not i
nten
ded
to b
e re
lied
upon
as
the
full
and
com
plet
e te
xt.
Plea
se re
fer t
o th
e ap
plic
able
form
s, in
stru
ctio
ns, r
ules
and
to th
e la
ws
cite
d be
low
to d
eter
min
e ho
w th
is in
form
atio
n ap
plie
s to
spe
cific
per
sons
or
situ
atio
ns.
TAX
RA
TE
Ena
cted
Tax
was
repe
aled
by
CH
9:3
, Law
s of
199
0

NH
DEP
ARTM
ENT
OF
REV
ENU
E AD
MIN
ISTR
ATIO
N:
R
efer
ence
Doc
umen
t
DO
CU
MEN
T TI
TLE:
H
isto
rical
Sum
mar
y
L
AST
DAT
E R
EVIS
ED:
J
uly
2012
TIM
BER
TAX
: R
SA 7
9
SE
SS
ION
YE
AR
EFF
EC
TIV
E D
ATE
CH
AP
TER
FILI
NG
TH
RE
SH
OLD
TAX
RA
TE
1949
CH
295
:1Fo
rest
Con
serv
atio
n an
d Ta
xatio
n st
atut
e en
acte
d.10
% o
f stu
mpa
ge v
alue
taxa
ble
at ti
me
of c
uttin
g
1955
RS
A 7
9:20
and
RS
A
79:2
3 C
H 2
87:1
Add
ition
of s
peci
al a
id to
hea
vily
tim
bere
d to
wns
12%
of s
tum
page
val
ue
1975
CH
457
:3R
epea
led
spec
ial a
id to
hea
vily
tim
bere
d to
wns
Effe
ctiv
e 4/
1/80
. Ta
x ra
te re
turn
ed to
10%
of
stum
page
val
ue19
99C
urre
nt re
quire
men
ts fo
r filin
g: A
ll tim
ber i
s ta
xabl
e ex
cept
as
prov
ided
in R
SA
79:
1,II,
b,1-
5 an
d R
SA
79:
2Th
e no
rmal
yie
ld ta
x sh
all b
e de
posi
ted
into
the
gene
ral f
und
with
in th
e to
wn
the
timbe
r was
cut
.
2003
Am
end
lang
uage
no
tax
chan
ge
2004
Inte
nt to
cut
2005
No
chan
ge
2006
No
chan
ge
2007
No
chan
ge
2008
No
chan
ge
2009
No
chan
ge
2010
No
chan
ge20
11N
o ch
ange
2012
7/1/
12C
H 1
41R
SA
79:
1, II
(a),
chan
ges
the
defin
ition
of a
n ow
ner o
f tim
ber r
ight
to a
ddre
ss jo
int t
enan
ts a
nd te
nant
s in
co
mm
on.
This
doc
umen
t is
only
a b
rief s
umm
ary
of th
e su
bjec
t mat
ter,
curr
ent a
s of
the
last
revi
sion
dat
e. I
t is
not i
nten
ded
to b
e re
lied
upon
as
the
full
and
com
plet
e te
xt.
Plea
se re
fer t
o th
e ap
plic
able
form
s, in
stru
ctio
ns, r
ules
and
to th
e la
ws
cite
d be
low
to d
eter
min
e ho
w th
is in
form
atio
n ap
plie
s to
spe
cific
per
sons
or s
ituat
ions
.
QU
AR
TER
LY E
STI
MA
TE P
AYM
EN
TS

NH
DEP
ARTM
ENT
OF
REV
ENU
E AD
MIN
ISTR
ATIO
N:
R
efer
ence
Doc
umen
t
DO
CU
MEN
T TI
TLE:
H
isto
rical
Sum
mar
y
L
AST
DAT
E R
EVIS
ED:
J
uly
2012
TOB
ACC
O T
AX:
RSA
78
RSA
78,
firs
t ena
cted
in 1
939
SE
SS
ION
YE
AR
EFF
EC
TIV
E D
ATE
CH
AP
TER
TAX
RA
TE A
ND
LIC
EN
SE
FE
ES
1939
RS
A 7
8 C
H 1
67:1
15%
, bas
ed o
n th
e va
lue
at u
sual
sel
ling
pric
e of
all
Toba
cco
Pro
duct
s19
65C
H 1
32In
crea
sed
to 2
1%
1967
CH
159
Incr
ease
d to
30%
1970
CH
5In
crea
sed
to 3
4%
1971
7/1/
71C
H 4
75In
crea
sed
to 4
2%
1975
7/1/
75C
H 4
66C
hang
ed th
e fla
t rat
e of
$0.
12 p
er p
acka
ge o
f 20
ciga
rette
s;
no ta
x on
oth
er to
bacc
o pr
oduc
ts.
1983
7/1/
83C
H 4
69:1
03In
crea
sed
to $
0.17
per
pac
kage
(to
mat
ch th
e S
tate
of
Ver
mon
t)19
858/
25/8
5C
H 3
96:1
Con
tinge
ncy
plan
to a
djus
t the
tax
rate
onl
y if
Ver
mon
t ch
ange
d th
eir t
ax ra
te.
1986
CH
75:
1R
ate
fixed
at $
0.17
per
pac
kage
of 2
0 ci
gare
ttes,
and
$0
.21p
er p
acka
ge o
f 25
ciga
rette
s.
1989
7/1/
89C
H 3
36:1
Rat
e fix
ed a
t $0.
21 p
er p
acka
ge o
f 20
ciga
rette
s, a
nd $
0.26
½
per p
acka
ge o
f 25
ciga
rette
s, a
nd p
ropo
rtion
al to
pac
kage
s of
m
ore
or le
ss.
1990
2/20
/90
CH
5:1
Incr
ease
d to
$0.
25 p
er p
acka
ge o
f 20
ciga
rette
s, a
nd $
0.31
¼
per p
acka
ge o
f 25
ciga
rette
s.
1991
7/1/
91C
H 2
92E
nact
ed a
Sm
okel
ess
Toba
cco
Tax,
with
a ra
te
"…p
rop
ort
ion
al to
th
e c
iga
rette
ta
x, h
avin
g s
uch
ra
tio
to
th
e
usua
l who
lesa
le p
rice
of th
e to
bacc
o pr
oduc
t oth
er th
an
ciga
rette
s as
the
ciga
rette
tax
bear
s to
the
usua
l who
lesa
le
pric
e of
the
ciga
rette
s."
This
is a
rate
that
mus
t be
perio
dica
lly
calc
ulat
ed b
y th
e C
olle
ctio
n D
ivis
ion.
1993
1/1/
94C
H 1
14
1995
8/18
/95
CH
259
:2
1997
1/1/
97C
H 3
51:5
7
Res
truct
ured
lice
nsin
g pr
oces
s so
the
licen
se w
ill e
xpire
in e
ach
even
-num
bere
d ye
ar (g
ood
for t
wo
year
s), w
ith p
rices
as
follo
ws:
M
anuf
actu
rer
$10
0
W
hole
sale
rs
$
250
S
ub-jo
bber
$15
0
V
endi
ng M
achi
ne O
pera
tor
$70
R
etai
ler
$
10
Ven
ding
Mac
hine
$10
Ena
cted
a p
rohi
bitio
n ag
ains
t the
sal
e or
dis
tribu
tion
to p
erso
ns u
nder
18
year
s of
age
; any
one
not c
ompl
ying
is g
uilty
of a
vio
latio
n w
ith a
fine
of
$10
0 fo
r eac
h of
fens
e. A
lso
enac
ted
rest
rictio
ns o
n sa
le o
f tob
acco
pro
duct
s th
roug
h ve
ndin
g m
achi
nes.
Incr
ease
d th
e ta
x ra
te fr
om $
0.25
to $
0.37
.
2-3/
4% s
ales
up
to th
e fir
st $
500,
000
2-3/
8% s
ales
from
$50
1,00
0 to
$1M
2% s
ales
in e
xces
s of
$1M
The
abov
e di
scou
nts
are
base
d on
ann
ual s
ales
from
Jul
y 1s
t thr
ough
Jun
e 30
th.
This
doc
umen
t is
only
a b
rief s
umm
ary
of th
e su
bjec
t mat
ter,
curr
ent a
s of
the
last
revi
sion
dat
e. I
t is
not i
nten
ded
to b
e re
lied
upon
as
the
full
and
com
plet
e te
xt.
Plea
se
refe
r to
the
appl
icab
le fo
rms,
inst
ruct
ions
, rul
es a
nd to
the
law
s ci
ted
belo
w to
det
erm
ine
how
this
info
rmat
ion
appl
ies
to s
peci
fic p
erso
ns o
r situ
atio
ns.
For c
igar
ette
s, th
e D
epar
tmen
t sel
ls to
bacc
o ta
x st
amps
to li
cens
ed
who
lesa
lers
.R
SA
78:
9 es
tabl
ishe
s a
disc
ount
rate
, bas
ed o
n th
e vo
lum
e of
sal
es, a
s fo
llow
s:

NH
DEP
ARTM
ENT
OF
REV
ENU
E AD
MIN
ISTR
ATIO
N:
R
efer
ence
Doc
umen
t
DO
CU
MEN
T TI
TLE:
H
isto
rical
Sum
mar
y
L
AST
DAT
E R
EVIS
ED:
J
uly
2012
TOB
ACC
O T
AX:
RSA
78
RSA
78,
firs
t ena
cted
in 1
939
SE
SS
ION
YE
AR
EFF
EC
TIV
E D
ATE
CH
AP
TER
TAX
RA
TE A
ND
LIC
EN
SE
FE
ES
This
doc
umen
t is
only
a b
rief s
umm
ary
of th
e su
bjec
t mat
ter,
curr
ent a
s of
the
last
revi
sion
dat
e. I
t is
not i
nten
ded
to b
e re
lied
upon
as
the
full
and
com
plet
e te
xt.
Plea
se
refe
r to
the
appl
icab
le fo
rms,
inst
ruct
ions
, rul
es a
nd to
the
law
s ci
ted
belo
w to
det
erm
ine
how
this
info
rmat
ion
appl
ies
to s
peci
fic p
erso
ns o
r situ
atio
ns.
For c
igar
ette
s, th
e D
epar
tmen
t sel
ls to
bacc
o ta
x st
amps
to li
cens
ed
who
lesa
lers
.19
971/
1/98
CH
338
:2C
H 3
38:7
1999
CH
351
:57
2003
7/1/
03C
H 1
52C
H 3
1920
057/
1/05
CH
177
Incr
ease
d ta
x fro
m $
0.52
to $
0.80
2006
No
chan
ge
2007
7/1/
07C
H 2
63
2008
No
chan
ge20
097/
1/09
CH
144
:2 (H
B 2
)R
SA
78:
7, $
0.45
incr
ease
in ta
x fro
m $
1.33
to $
1.78
CH
144
:3R
SA
78:
2, In
vent
ory
CH
144
:177
RS
A 7
8:1
XIV
, Add
ed: I
nclu
des
snuf
f and
cig
ars
but n
ot p
rem
ium
cig
ars
CH
144
:178
RS
A 7
8:1
XX, A
dds
defin
ition
of p
rem
ium
cig
ars
CH
144
:179
RS
A 7
8:7-
C, R
ate
incr
ease
from
19%
to 4
8.59
% o
f who
lesa
le p
rice.
No
tax
on p
rem
ium
cig
ars
CH
144
:257
RS
A:3
2, A
mou
nt c
hang
ed fr
om $
0.37
to $
1.00
2010
6/10
/10
CH
1:4
520
116/
27/1
1C
H 2
7
2011
7/1/
11C
H 2
24:3
77-3
81
2012
No
chan
ge
RS
A 7
8:12
, sub
stitu
ting
the
wor
d "r
etur
n" fo
r the
wor
d "r
epor
t."
RS
A 7
8:7,
$0.
10 d
ecre
ase
in ta
x fro
m $
1.78
to $
1.68
R
SA
78:
7-c,
dec
reas
e in
tax
from
65.
03%
to 4
8% o
f who
lesa
le p
rice.
Con
itgen
cy fo
r dec
reas
e in
tax
to re
mai
n - i
f the
DR
A re
ports
that
the
amou
nt o
f Tob
acco
Tax
reve
nue
rece
ived
for J
uly
1, 2
011
thro
ugh
June
30
, 201
3 w
as e
qual
to o
r abo
ve th
e am
ount
rece
ived
for t
he p
erio
d of
Jul
y 1,
200
9 th
roug
h Ju
ne 3
0, 2
011,
then
the
Toba
cco
Tax
rate
s sh
all
rem
ain
at th
e de
crea
sed
rate
s.
Add
ed li
cens
e fe
es fo
r tob
acco
sam
pler
s an
d fo
r eac
h ve
ndin
g m
achi
ne lo
catio
n.E
nact
ed fu
rther
rest
rictio
ns o
n sa
le o
f tob
acco
pro
duct
s th
roug
h ve
ndin
g m
achi
nes.
Tax
stam
ps d
isco
unt r
emov
ed.
Rep
eale
d co
mp
for c
olle
ctin
g ta
x.A
dded
"loo
se to
bacc
o" to
def
initi
on o
f tob
acco
pro
duct
s.
Incr
ease
d th
e ra
te o
f tob
acco
to $
0.52
per
pac
k of
20
not t
o in
clud
e ci
gars
, pip
e to
bacc
o an
d lo
ose
toba
cco.
Rat
e $0
.52
per p
ack.
19%
tax
on to
bacc
o ot
her t
han
ciga
rette
s.
RS
A 7
8:7-
c, ra
te in
crea
se fr
om 4
8.59
% to
65.
03%
of w
hole
sale
pric
e. N
o ta
x on
pre
miu
m c
igar
s.
1.08
tax
impo
sed
Inve
ntor
y su
bmitt
ed a
s of
20
days
of e
ffect
ive
date
.

NH
DEP
ARTM
ENT
OF
REV
ENU
E AD
MIN
ISTR
ATIO
N:
R
efer
ence
Doc
umen
t
DO
CU
MEN
T TI
TLE:
H
isto
rical
Sum
mar
y
L
AST
DAT
E R
EVIS
ED:
J
uly
2012
UTI
LITI
ES: (
Rai
lroad
s) R
SA 8
2
This
tax
is h
andl
ed b
asic
ally
the
sam
e as
the
tele
phon
e ta
x w
as h
andl
ed b
efor
e th
e en
actm
ent o
f the
Com
mun
icat
ions
Ser
vice
s Ta
x.Th
e D
epar
tmen
t app
rais
es th
e en
tire
com
pany
to d
eter
min
e th
e "C
urre
nt M
arke
t Val
ue" o
f the
com
pany
. A
por
tion
of th
is v
alue
is th
en a
lloca
ted
to th
e st
ate,
bas
ed o
n th
e or
igin
al c
ost o
f inv
estm
ent i
n N
H c
ompa
red
to th
e or
igin
al c
ost o
f inv
estm
ent e
very
whe
re.
The
resu
lt is
the
"Mar
ket V
alue
in N
H".
Fro
m th
is v
alue
, the
am
ount
taxa
ble
at th
e lo
cal l
evel
is d
educ
ted
by c
ompa
ring
the
tota
l orig
inal
cos
t of l
and
and
build
ings
at t
he lo
cal l
evel
, to
the
tota
l orig
inal
cos
t in
NH
. Th
is re
sult
is th
e "M
arke
t Val
ue T
axab
le a
t the
sta
te le
vel (t
he ite
ms t
axable
at
the s
tate
le
vel w
ould
in
clu
de lin
es p
ole
s s
witchin
g e
quip
ment…
).
Th
is v
alu
e m
ust
be r
educed t
o t
he a
vera
ge le
vel of
assessm
ent
in t
he
stat
e (fo
r 198
9 it
was
63%
). T
hen
the
"Ave
rage
Sta
te T
ax R
ate
is a
pplie
d to
cal
cula
te th
e ta
xes
due
in N
H. 1,
000,
000
50,0
002,
000,
000
25,0
00
20
,000
50,0
00
50,0
00
30,0
00
30,0
00
18,9
00
$470
.03
SE
SS
ION
YE
AR
EFF
EC
TIV
E D
ATE
CH
AP
TER
QU
AR
TER
LY E
STI
MA
TE P
AY
ME
NTS
2005
7/1/
05C
H L
aw 9
3
2006
No
chan
ge
2007
No
chan
ge
2008
No
chan
ge
2009
No
chan
ge
X A
VER
AGE
STAT
E TA
X R
ATE
(PER
TH
OU
SAN
D )
$24.
87 =
TAX
ES D
UE
THE
STAT
E
FILI
NG
TH
RE
SH
OLD
This
doc
umen
t is
only
a b
rief s
umm
ary
of th
e su
bjec
t mat
ter,
curr
ent a
s of
the
last
revi
sion
dat
e. I
t is
not i
nten
ded
to b
e re
lied
upon
as
the
full
and
com
plet
e te
xt.
Plea
se re
fer t
o th
e ap
plic
able
form
s, in
stru
ctio
ns, r
ules
and
to th
e la
ws
cite
d be
low
to d
eter
min
e ho
w th
is in
form
atio
n ap
plie
s to
spe
cific
per
sons
or s
ituat
ions
.
OR
IGIN
AL
CO
ST E
VER
YWH
ER
E =
O
RIG
INAL
CO
ST IN
NH
=
EX.
MAR
KET
VALU
E O
F EN
TIR
E C
OM
PAN
Y=
OR
IGIN
AL
CO
ST IN
NH
=
A
LLO
CAT
ION
FAC
TOR
FO
R N
H =
(50,
000/
2,00
0,00
0) =
.025
M
ARKE
T VA
LUE
IN N
H =
(1,0
00,0
00 X
.025
) =
M
ARKE
T VA
LUE
TAX
ABLE
AT
STAT
E LE
VEL
= A
SSES
SED
VAL
UE
O
RIG
INAL
CO
ST T
AXAB
LE A
T TH
E LO
CAL
LEV
EL =
A
LLO
CAT
ION
FAC
TOR
FO
R S
TATE
PO
RTI
ON
= (1
-(20
,000
/50,
000)
) = 6
0%
MAR
KET
VALU
E IN
NH
X S
TATE
PO
RTI
ON
FAC
TOR
- 60
% =
MAR
KET
VALU
E TA
XAB
LE A
T ST
ATE
LEVE
L
X S
TATE
RAT
IO (A
VER
AGE
LEVE
L O
F AS
SESS
MEN
T) -
63%
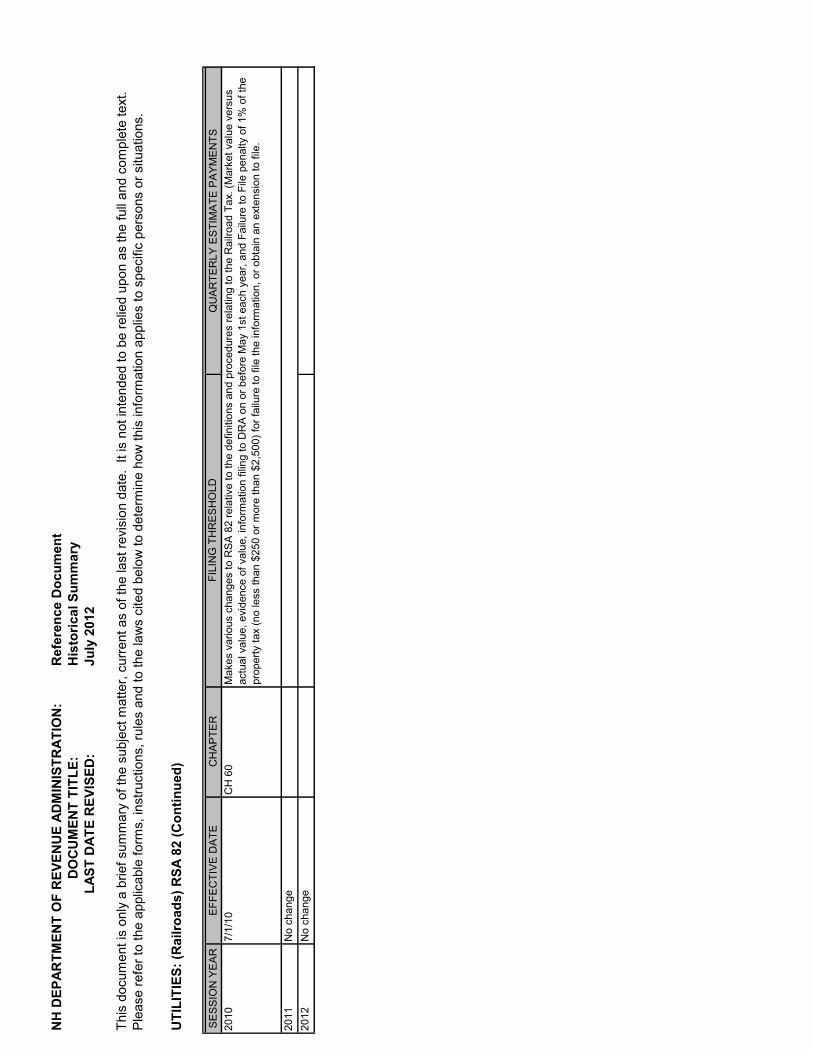
NH
DEP
ARTM
ENT
OF
REV
ENU
E AD
MIN
ISTR
ATIO
N:
R
efer
ence
Doc
umen
t
DO
CU
MEN
T TI
TLE:
H
isto
rical
Sum
mar
y
L
AST
DAT
E R
EVIS
ED:
J
uly
2012
This
doc
umen
t is
only
a b
rief s
umm
ary
of th
e su
bjec
t mat
ter,
curr
ent a
s of
the
last
revi
sion
dat
e. I
t is
not i
nten
ded
to b
e re
lied
upon
as
the
full
and
com
plet
e te
xt.
Plea
se re
fer t
o th
e ap
plic
able
form
s, in
stru
ctio
ns, r
ules
and
to th
e la
ws
cite
d be
low
to d
eter
min
e ho
w th
is in
form
atio
n ap
plie
s to
spe
cific
per
sons
or s
ituat
ions
.
UTI
LITI
ES: (
Rai
lroad
s) R
SA 8
2 (C
ontin
ued)
SE
SS
ION
YE
AR
EFF
EC
TIV
E D
ATE
CH
AP
TER
QU
AR
TER
LY E
STI
MA
TE P
AY
ME
NTS
2010
7/1/
10C
H 6
0
2011
No
chan
ge20
12N
o ch
ange
Mak
es v
ario
us c
hang
es to
RS
A 8
2 re
lativ
e to
the
defin
ition
s an
d pr
oced
ures
rela
ting
to th
e R
ailro
ad T
ax. (
Mar
ket v
alue
ver
sus
actu
al v
alue
, evi
denc
e of
val
ue, i
nfor
mat
ion
filin
g to
DR
A o
n or
bef
ore
May
1st
eac
h ye
ar, a
nd F
ailu
re to
File
pen
alty
of 1
% o
f the
pr
oper
ty ta
x (n
o le
ss th
an $
250
or m
ore
than
$2,
500)
for f
ailu
re to
file
the
info
rmat
ion,
or o
btai
n an
ext
ensi
on to
file
.
FILI
NG
TH
RE
SH
OLD

NH
DEP
ARTM
ENT
OF
REV
ENU
E AD
MIN
ISTR
ATIO
N:
R
efer
ence
Doc
umen
t
DO
CU
MEN
T TI
TLE:
H
isto
rical
Sum
mar
y
L
AST
DAT
E R
EVIS
ED:
J
uly
2012
UTI
LITY
PR
OPE
RTY
TAX
: 83
-F
SE
SS
ION
YE
AR
EFF
EC
TIV
E D
ATE
CH
AP
TER
FILI
NG
TH
RE
SH
OLD
TAX
RA
TE &
PA
YM
EN
TS E
STI
MA
TES
1999
CH
17
RS
A 8
3-F
was
ado
pted
The
rate
is $
6.60
per
$1,
000
of v
alue
of
util
ity p
rope
rty.
On
Dec
embe
r 1st
of
eac
h ye
ar th
e D
RA
will
det
erm
ine
the
valu
e of
util
ity p
rope
rty a
s of
the
prev
ious
Apr
il 1s
t.
Due
on
7/1/
, 9/1
5 an
d 12
/15,
for t
he
first
yea
r est
imat
es s
hall
be in
the
amou
nt o
f one
-third
of t
he e
stim
ated
ta
x.
2003
7/1/
04C
H 2
41
2004
7/1/
04C
H 2
00E
xem
pt fr
om e
nhan
ced
stat
ewid
e ed
ucat
ion
tax.
2005
7/1/
05C
H 9
3:4,
1,23
Det
erm
ine
valu
e A
ppea
ls p
aym
ents
and
tax
notic
eR
epea
led
publ
ic h
earin
gs20
06N
o ch
ange
2007
8/24
/07
CH
216
:25
VII
& V
III a
dded
Info
filin
g pe
nalti
esC
hang
e of
ow
ners
hip
2008
No
chan
ge
2009
No
chan
ge
2010
8/27
/10
CH
219
:2
2010
8/27
/10
CH
219
:3
2011
7/1/
11C
H 5
9
2012
No
chan
ge
This
doc
umen
t is
only
a b
rief s
umm
ary
of th
e su
bjec
t mat
ter,
curr
ent a
s of
the
last
revi
sion
dat
e. I
t is
not i
nten
ded
to b
e re
lied
upon
as
the
full
and
com
plet
e te
xt.
Plea
se re
fer t
o th
e ap
plic
able
form
s, in
stru
ctio
ns, r
ules
and
to th
e la
ws
cite
d be
low
to d
eter
min
e ho
w th
is in
form
atio
n ap
plie
s to
spe
cific
per
sons
or s
ituat
ions
.
RS
A 8
3-F:
3 am
ende
d to
requ
ire u
tility
pro
perty
to b
e ap
prai
sed
at m
arke
t val
ue u
sing
ge
nera
lly a
ccep
ted
appr
aisa
l met
hods
and
tech
niqu
es a
nd to
requ
ire th
e C
omm
issi
oner
to
hold
one
ann
ual p
ublic
hea
ring
prio
r to
perfo
rmin
g as
sess
men
ts fo
r val
uatio
n of
util
ity
prop
erty
of r
egul
ated
pub
lic u
tiliti
es.
RS
A 8
3-F:
5, V
III a
men
ded
to re
quire
a ta
xpay
er a
cqui
ring
utili
ty p
rope
rty o
r ass
ets
to
notif
y th
e C
omm
issi
oner
, in
writ
ing,
no
late
r tha
n 30
day
s su
bseq
uent
to th
e sa
le o
r tra
nsfe
r of t
he u
tility
's p
rope
rty o
r ass
et.
RS
A 8
3-F:
1, V
am
ende
d to
exc
lude
from
the
defin
ition
of "
utili
ty p
rope
rty" a
nyth
ing
that
do
es n
ot g
o in
to th
e st
ream
of c
omm
erce
.

2012 Legislative Review This Legislative Review is published as a convenient reference guide of relevant statutory changes made during the 2012 Legislative Session by the New Hampshire General Court. This review is intended to provide a summary or synopsis of enacted legislation. It is not intended to be relied upon as full and complete text or as a substitute for the actual state law. Please refer to the applicable statute and rules to determine how this information applies to specific persons or situations. BUSINESS TAX: Senate Bill 372 (Chapter 287, Laws of 2012) establishes an Education Tax Credit against the Business Profits Tax (RSA Chp. 77-A) and/or the Business Enterprise Tax (RSA 77-E) for business organizations and business enterprises that contribute to scholarship organizations, which award scholarships to be used by students to defray educational expenses. For each contribution made to a scholarship organization, a business organization or business enterprise may claim a tax credit equal to 85% of the contribution against the Business Profits Tax or against the Business Enterprise Tax, or apportioned against both, provided the total tax credit granted against both shall not exceed the maximum Education Tax Credit allowed. The Education Tax Credit is not deemed taxes paid for the purposes of RSA 77-A:5, X. The Department of Revenue Administration shall not grant an Education Tax Credit without a Scholarship Receipt. The aggregate amount of Education Tax Credits to be issued in the first year is capped at $3,400,000 (for total contributions of $4,000,000). The aggregate amount of Education Tax Credits to be issued in the second year is capped at $5,100,000 (for total contributions of $6,000,000). The aggregate amount of Education Tax Credits to be issued in the third year (and beyond) is contingent upon whether or not the total amount of donations used for scholarships exceeds 80% of the tax credits allowed in the prior year and if the Community Development Finance Authority (CDFA) provides confirmation to the Department of Revenue Administration that the CDFA have received sufficient contributions. If the 80% threshold is exceeded and the CDFA has received sufficient contributions, then the Education Tax Credits aggregate amount of credits available would increase by 25%. For the third year this could result in an increase of the Education Tax Credits available to $6,375,000 (for total contributions of $7,500,000). Effective: June 27, 2012. The first program year of the Education Tax Credit pursuant to RSA 77-G shall begin on January 1, 2013. Amended: new paragraph RSA 77-A:5, XV; new section RSA 77-E:3-d and new chapter RSA 77-G. House Bill 242 (Chapter 71, Laws of 2012) changes the applicability date for which the increase in the amount of Net Operating Loss (NOL) that may be generated in a tax year would increase from $1,000,000 to $10,000,000. Currently, the NOL statute reads, “On or after July 1, 2013, the amount of net operating loss generated in a tax year that may be carried forward may not exceed $10,000,000.” (emphasis added) HB 242 changes the date to “On or after January 1, 2013…” (emphasis added). Effective: May 23, 2012 Amended: new paragraph RSA 77-A:4, XIII(e) House Bill 518 (Chapter 116, Laws of 2012) changes the prospective repeal date for the Research and Development Tax Credit from July 1, 2013 to July 1, 2015. Effective: August 4, 2012 Amended: Chapter 271:7, Laws of 2007 (referring to RSA 77-A:5, XIII) House Bill 1221 (Chapter 253, Laws of 2012) simply puts into statute the current practice of allowing a taxpayer to apply the Business Enterprise Tax credit against the Business Profits Tax on a quarterly basis when making estimated tax payments. Effective: July 1, 2012 Amended: RSA 77-A:7, I(a)
House Bill 1418 (Chapter 279:1 and 279:10, Laws of 2012) Section 1 increases the Business Enterprise Tax (BET) filing thresholds under RSA 77-E:5. Under the new law, every business enterprise having gross business receipts in excess of $200,000 during the taxable period or the enterprise value
NH DRA 2012 Annual Report - Page 71

tax base greater than $100,000 shall, on or before the 15th day of the 3rd month in the case of enterprises required to file a United States corporation tax return, and the 15th day of the 4th month in the case of all other business enterprises, following expiration of its taxable period, make a return to the Commissioner. The thresholds of gross business receipts in excess of $200,000 and enterprise value tax base greater than $100,000 shall be adjusted biennially for inflation and rounded to the nearest $1,000 by the Commissioner of the Department of Revenue Administration using the Consumer Price Index, Northeast Region as defined by RSA 77-E:1, X.
Section 1 also amends the BET threshold providing that if the estimated tax is less than $260, a declaration need not be filed and further provides that a declaration shall be filed at the end of any quarter thereafter in which estimated tax exceeds $260.
Section 10 creates a new section, RSA 77-A:3-a “Expense Deductions,” under the Business Profits Tax that allows an expense in determining gross business profits before net operating loss and special deductions, wherein a business organization shall calculate expense deductions not to exceed $25,000 as permitted under Internal Revenue Code Section 179 using the version of the Internal Revenue Code in effect as of January 1, 2012. Current law allows a $20,000 deduction.
Section 10 will apply to any qualifying Section 179 property as that term is defined in the Internal Revenue Code with respect to property placed into service on or after January 1, 2012.
Effective: Section 1 is effective for taxable periods ending on or after December 31, 2013. Section 10 is effective June 21, 2012 for any qualifying Section 179 property as that term is defined in the Internal Revenue Code with respect to property placed into service on or after January 1, 2012. Amended: RSA 77-E:5 and new section RSA 77-A:3-a
Senate Bill 203 (Chapter 232, Laws of 2012) although this bill does not directly amend the business tax statutes, it is worth including as it completely revises the laws governing limited liability companies. Section 1 sets for the intent of SB 203 as follows:
232:1 Intent.
I. The current version of the New Hampshire limited liability company act was originally enacted in 1993 and was significantly amended in 1997. In recent years, LLCs have become, by a wide margin, the entity of choice both for small New Hampshire businesses and for many larger ones.
II. This bill retains most of the provisions of the current act, but it adds numerous important new features that will make the act significantly more user-friendly for small New Hampshire businesses. At the same time, the revised act fully preserves, and in fact increases, the usefulness of the act for larger businesses.
III. The new features of the revised act include (i) a new overall structure that will make it substantially easier for LLC members and managers and their attorneys to find provisions relevant to their concerns; (ii) new provisions comprehensively defining the fiduciary duties of members and managers; (iii) revisions of numerous provisions of the current act to eliminate possible ambiguities; (iv) maximum use of plain English and the elimination of numerous legalisms in the current the act; and (v) definitions of several key technical terms, such as “allocation,” “distribution,” “dissociation,” and “dissolution” whose meaning is not self-evident but which are not defined in the current act.
IV. This bill also contains a number of new provisions that will increase the flexibility of the act and thus will enhance the ability of both small and large New Hampshire businesses to tailor their LLCs to meet members’ and managers’ needs and interests. These include provisions validating oral and implied operating agreements of LLCs that lack written agreements.
Effective: Sections 1-11 take effect January 1, 2013, Section 14 takes effect December 1, 2012; and the remainder takes effect June 18, 2012. Amended: RSA 304-C is repealed and replaced in its entirety.
NH DRA 2012 Annual Report - Page 72

INTEREST & DIVIDENDS TAX: Senate Bill 326 (Chapter 286:3 through 286:8, Laws of 2012) Sections 3 through 8 eliminate the taxation of trusts under the Interest and Dividends Tax, RSA Chp. 77. Under the new law, interest and dividend income received by estates held by trustees treated as grantor trusts under section 671 of the United States Internal Revenue Code shall be included in the return of their grantor, to the extent that the grantor is an inhabitant or resident of New Hampshire. Income reported by, and taxed federally as interest or dividends to, a trust beneficiary who is an individual inhabitant or resident of New Hampshire with respect to distributions from a trust that is not treated as a grantor trust under section 671 of the United States Internal Revenue Code shall be included as interest or dividends in the return of such beneficiary and subject to taxation in accordance with the provisions of RSA Chp. 77. Effective: Sections 3 through 8 are effective June 27, 2012 and apply to taxable periods ending on or after December 31, 2013. Amended: RSA 77:3, I(b) and (c), RSA 77:4, III, RSA 77:10, RSA 77:13, RSA 77-14-d and repeals RSA 77:12. COMMUNICATIONS SERVICES TAX: House Bill 1418 (Chapter 279:4 through 279:8, Laws of 2012) Section 5 excludes “Internet access” from the definition of “communications services” under RSA 82-A:2, III. Section 6 adds the definition of “Internet” and “Internet access” to RSA 82-A:2. The definition of Internet access includes both services or features that are considered to be part of Internet access, as well as services or features which are not included under the definition of Internet access. Section 7 excludes charges for Internet access from the definition of “gross charge” under RSA 82-A:2. The definition of “gross charge” is used to determine the basis for which the Communications Services Tax (CST) rate is applied. This section excludes Internet access from the CST. Currently, Internet access is only taxed when providers do not disaggregate or unbundle their charges in order to only include the taxable two-way communication portion. Section 8 instructs the Department of Revenue Administration not to enforce any existing assessments, to promptly withdraw any pending assessments and prohibits the Department from issuing any additional assessments with respect to Internet access and CST. Effective: June 21, 2012 Amended: RSA 82-A:1, RSA 82-A:2, III(b) and (c), RSA 82-A:2, V and new paragraphs RSA 82-A:2, XXV and XXVI. MEALS & RENTALS TAX: House Bill 1204 (Chapter 73:3 through 73:6, Laws of 2012) Section 3 clarifies that a Meals and Rentals Operator’s License shall remain valid during the pendency of an appeal of a refusal to renew the Meals and Rentals Operator’s License.
Sections 4 and 5 clarify in all applicable sections of RSA Chp. 78-A that the Meals and Rentals Tax rate is 9%.
Section 6 simply clarifies the timing of filing a surety bond to be after a hearing, not before. Effective: May 23, 2012 Amended: RSA 78-A:5, II, RSA 78-A:7, I(a), RSA 78-A:7, IV and RSA 78-A:8-b, I. MUNICIPAL:
Senate Bill 83 (Chapter 219, Laws of 2012) a municipality that has created an actuarial liability to pay “other post-employment benefits” to employees (on or before 1/1/12) may establish an “irrevocable trust” under GASB 43 to pay those benefits. For purposes of this law, “other post-employment benefits” are those other than pensions and could include medical, disability, or other health benefits. Refer to GASB 43 and 45 for further detail.
Effective: July 1, 2012
NH DRA 2012 Annual Report - Page 73

Amended: new section RSA 31:19c, RSA 198:20-c, III, and new paragraph RSA 198:20-c, VII.
Senate Bill 254 (Chapter 181, Laws of 2012) clarifies that appropriations from a separate fund created pursuant to statute, including but not limited to a capital reserve fund under RSA Chp. 35, or trust fund under RSA 31:19-a, is now a special, non-transferable warrant article. The new law also clarifies that no change shall be made to a special revenue fund adopted under RSA 31:95-c unless the town has voted to consider changing the source or fractional portion of revenues or specific purpose of expenditures of the fund in the manner described in RSA 31:95-d I(a) and (b) and authorized such change by a vote of 2/3 of all the voters present and voting at an annual town or district meeting. In addition, if a majority of those voting on the question vote “Yes,” RSA 31:95-c shall not apply within the town, and any remaining amounts in the rescinded fund shall become part of the general fund accumulated surplus.
The new law clarifies that if a recreation revolving fund is rescinded by vote of the local legislative body, any remaining amounts in the fund shall become part of the general fund accumulated surplus. Effective: August 10, 2012 Amended: RSA 32:3, VI(c), RSA 31:95-d and RSA 35-B:2, II. Senate Bill 255 (Chapter 104, Laws of 2012) amends RSA 79-A:7 and RSA 80:85 to provide an additional six months for the town to perfect a lien for any unpaid Land Use Change Tax. Effective: July 28, 2012 Amended: RSA 79-A:7, II(e) and RSA 80:85. Senate Bill 373 (Chapter 221, Laws of 2012) school districts can vote (until rescinded) to retain year-end unassigned general funds in an amount not to exceed, in any fiscal year, 2.5% of the current fiscal year’s net assessment pursuant to RSA 198:5, for the purpose of having funds on hand to use as a revenue source for emergency expenditures and over-expenditures under RSA 32:11, or to be used as a revenue source to reduce the tax rate. The new law also provides that the legislative body of Manchester, upon recommendation of the school committee, may authorize (indefinitely until specific rescission) the school district to retain year-end unassigned general funds. Effective: Section 1 is effective August 12, 2012 and Section 2 (Manchester) is effective June 13, 2012. Applicable to the 2012-2013 school year. Amended: RSA 198:4-b, new paragraph RSA 194:23, II-a and RSA 188-E:5, II.
Senate Bill 401 (Chapter 198, Laws of 2012) amends the definition of “determination year” for the purpose of calculating adequate education grants and authorizes the Commissioner of the Department of Education to make adjustments in adequate education grants based on variations in the average daily membership in attendance data.
School districts, when filing the revised estimate of revenue report for tax rates, are allowed to estimate any applicable adequate education grant amounts within 5% of the Department of Education estimate. For cooperative school districts, variances between actual adequacy grants and estimates will be reconciled as part of the apportionment the following year in a town-specific adjustment.
Effective: July 1, 2012 and applicable beginning with the 2013-2014 school year. Amended: RSA 198:38, I, RSA 198:38, IV, RSA 198:42, I, RSA 198:40-a, IV(a), RSA 198:40-a, V, new paragraph RSA 198:40-a:VI, RSA 198:4-d, II, and new paragraph RSA 195:14, III(a) and (b). House Bill 1170 (Chapter 6, Laws of 2012) allows any town to vote to require that the annual budget and all special warrant articles having a tax impact, as determined by the governing body, must contain a notation stating the estimated tax impact of the article. The determination of the estimated tax impact shall be subject to approval by the governing body. Effective: May 21, 2012 Amended: new paragraph RSA 32:5, V-b.
NH DRA 2012 Annual Report - Page 74

House Bill 1224 (Chapter 29, Laws of 2012) allows any town, with the approval of the governing body, to send tax bills or notices by electronic means to those taxpayers who have specifically requested such delivery. Any request for electronic delivery of tax bills or notices shall contain the physical signature of the taxpayer or an electronic signature conforming to the requirements of the federal “Electronic Signatures Act” or its successor. Any agreement executed by a taxpayer to receive tax bills or notices by electronic means shall contain a description of the delivery system proposed to be used and shall contain clear instructions on the method for terminating such delivery. The statute states that there is no charge for delivery of tax bills or notices by electronic means and there is no penalty for not choosing to elect delivery by electronic means.
The new law provides that in the event that the tax collector has any reason to believe that tax bills or notices sent by electronic means have failed to be delivered, the tax collector shall promptly send a duplicate of the bills or notices by first class mail. A duplicate tax bill or notice mailed in compliance shall be at no cost to the taxpayer. Second and subsequent notices of payments due, or notices of tax delinquency, shall be sent by first class mail. Subsequent sending of a tax bill shall not change the last date that taxes may be paid without penalty.
Effective: July 1, 2012 Amended: RSA 76:11
House Bill 1633 (Chapter 217, Laws of 2012) allows school districts and village districts in addition to any towns to require the numerical tally of the recommendation of the governing body, and any advisory or official budget committee, be placed on school or village district warrant articles.
Effective: July 1, 2013 Amended: RSA 32:5, V-a and RSA 40:13, V-a.
PROPERTY APPRAISAL:
Senate Bill 306 (Chapter 186, Laws of 2012) makes the application procedure for the property tax exemption for commercial and industrial construction prospective and permanently extends the authority for the exemption. Under the new law, an owner must apply for the exemption under RSA 72:76 prior to construction, but not after December 31 before the beginning of the tax year for which the exemption is sought.
The selectmen or assessors shall notify the applicant of their decision no later than February 28 before the beginning of the tax year for which the exemption is sought. The decision shall specify the amount of the exemption, which it is effective with the new tax year and the number of years for which the exemption applies to qualified construction. The decision of the selectmen or assessors may be appealed in the manner set forth in RSA 72:34-a.
The new law also expands the municipal budget law to include municipal economic development and revitalization districts. Effective: June 11, 2012 Amended: RSA 72:78, RSA 32:2, RSA 32:3, IV, RSA 162-K:12 and repeals Chapter 224:4, Laws of 2008.
Senate Bill 326 (Chapter 286:1 and 286:2, Laws of 2012) Section 1 repeals RSA 122:4, II, relative to reimbursement to towns and cities of moneys owed by other states. In Section 2, notwithstanding RSA 122:4, II, if any other state in a river management compact with the State of New Hampshire makes a payment in any amount on an arrearage to the State of New Hampshire, then within 30 days of receiving such payment, the State Treasurer shall distribute such money to the towns affected by RSA Chp. 484 in the manner prescribed by RSA 122:4, I for the fiscal years ending June 30, 2012 and June 30, 2013. Any additional funds shall lapse to the general fund on June 30, 2013.
Effective: Section 1 is effective July 1, 2013 and Section 2 is effective June 27, 2012. Amended: repeals RSA 122:4, II with contingency.
NH DRA 2012 Annual Report - Page 75

Senate Bill 382 (Chapter 169, Laws of 2012) establishes the procedure for the proration of assessments for property taxes for taxable buildings damaged due to unintended fire or natural disaster to the extent that the building can no longer be used for its intended use. Under new section RSA 76:21, whenever a taxable building is damaged due to unintended fire or natural disaster to the extent that it renders the building not able to be used for its intended use, the assessing officials shall prorate the assessment for the building for the current tax year. A person aggrieved of a property tax for a building damaged due to unintended fire or natural disaster to the extent that it renders the building not able to be used for its intended use shall file an application with the assessing officials in writing within 60 days of the event that damaged the building. The proration of the building assessment will be based on the number of days the building was available for its intended use divided by the number of days in the tax year, multiplied by the building assessment. The total tax reduction from this proration for any city or town shall be limited to an amount equal to ½ of 1% of the total property taxes committed in the tax year. If the assessing officials determine that it is likely that this limit will be reached, the proration shall not be applied to any additional properties.
Proration of the assessment will be denied if the assessing officials determine that the applicant did not meet the requirements of RSA 76:2 or acted in bad faith. Nothing in this new law limits the ability of the assessing officials to abate taxes for good cause shown pursuant to RSA 76:16.
Effective: April 1, 2013 Amended: RSA 76:2 and new section RSA 76:21
House Bill 1207 (Chapter 141, Laws of 2012) changes the definition of an owner of timber rights for purposes of the Timber Tax under RSA Chp. 79 to address joint tenants and tenants in common. More specifically, for purposes of joint tenants or joint tenants with rights of survivorship, “owner” is every owner that holds title to the subject property. And, for purposes of tenants-in-common, “owner” is any one or more of the tenants-in-common that hold title to the subject property. Any one or more of tenants-in-common may sign an Intent to Cut provided, however, that non-signing tenants-in-common shall have been notified by certified mail by the applicant of the Intent to Cut at least 30 days prior to cutting and that a bond or surety is filed to secure payment of the yield tax if any tenant-in-common does not sign or give a power of attorney to sign a notice of Intent to Cut.
Effective: July 1, 2012 Amended: RSA 79:1, II(a) House Bill 1266 (Chapter 30, Laws of 2012) requires the Assessing Standards Board to recommend “standards” rather than “guidelines.” Effective: April 1, 2013 Amended: RSA 21-J:14-b, I and II House Bill 1302 (Chapter 14:3, Laws of 2012) Section 3 allows the Department of Revenue Administration to annually equalize the valuation of property which is subject to tax relief under RSA Chp. 79-E, Community Revitalization Tax Relief Incentive. Effective: July 1, 2012 Amended: RSA 21-J:3, XIII House Bill 1311 (Chapter 31, Laws of 2012) updates a reference to the homestead exemption amount in the notice provided to homeowners prior to an execution sale of the property. The exemption reference is increased from $30,000 to $100,000 for a single person and increased from $60,000 to $200,000 for a married couple. Effective: July 1, 2012 Amended: RSA 529:20-a
RSA CHAPTER 21-J ADMINISTRATIVE:
Senate Bill 307 (Chapter 154, Laws of 2012) addresses taxpayers who have been, or may be in the future, affected by fraudulent investment schemes (Ponzi Schemes). The new law provides mechanisms
NH DRA 2012 Annual Report - Page 76

for a taxpayer to request a refund for taxes paid on fictitious income, particularly when that request may be outside the statute of limitations.
Under the new law, any taxpayer may petition the Department of Revenue Administration for a refund of overpayment of taxes resulting from a fraudulent investment scheme for which an amended federal tax return has been filed claiming a theft loss for the fraudulent investment scheme under Internal Revenue Code section 165. The petition for refund of overpayment of taxes shall be made within 180 days of the taxpayer filing the amended federal tax return.
“Fraudulent investment scheme” is defined to mean “. . . a transaction in which the party perpetrating the fraud receives cash or property from investors, purports to earn income for the investors, and reports to the investors income amounts that are wholly or partially fictitious. In a fraudulent investment scheme the party perpetrating the fraud criminally appropriates some or all of the investors’ cash or property.”
If, after review, the Department issues a notice of denial, the taxpayer may file an appeal with the Department’s Hearings Bureau as provided in RSA 21-J:28-b. Effective: June 7, 2012 Amended: new section RSA 21-J:28-e and new subparagraph RSA 21-J:29, I(e). House Bill 1302 (Chapter 14:1, Laws of 2012) Section 1 amends RSA 21-J:32, the Penalty for Underpayment of Estimated Taxes, by changing the term “taxable year” to “taxable period” and including a definition of the term “taxable period” for that section of the statute. The changes to RSA 21-J:32 clarify the statute with respect to the penalty for underpayment of estimated tax for tax periods that are less than a full calendar or fiscal year (short period). Effective: December 31, 2012 and applicable to taxable periods ending on or after December 31, 2012. Amended: RSA 21-J:32, I and II and new paragraph RSA 21-J:32, II-a.
MISCELLANEOUS ADMINISTRATIVE:
House Bill 1448 (Chapter 62, Laws of 2012) upon request for a copy of any document or Internet content incorporated by reference in a state agency’s rules the state agency shall make any such document or downloaded Internet content available for inspection. Internet content is defined to mean “. . .material that exists only on a website on the Internet.”
The new law further requires each agency to include a statement signed by the adopting authority explaining how the text of the incorporated document or Internet content can be obtained by the public, and at what cost as an appendix with each filing of the proposed or adopted rule. The agency shall make the information available to the public with a proposed or adopted rule whenever the rule is made available to or requested by the public. When the rule is published pursuant to RSA 541-A:15, the information shall be published as an appendix to the rule chapter containing the rule with a reference in the rule to the appendix. The information shall not be required to be filed on a separate page.
Effective: July 13, 2012 Amended: new paragraph RSA 541-A:1, VII-b, new paragraphs RSA 541-A:12, VI and VII and new paragraph RSA 541-A:21, VIII. House Bill 1510 (Chapter 262, Laws of 2012) allows any taxpayer of a taxing district in this State to have standing to bring a declaratory judgment action in superior court when it is alleged that the taxing district or any agency or authority thereof has engaged, or proposes to engage, in conduct that is unlawful or unauthorized, and in such a case the taxpayer shall not have to demonstrate that his or her personal rights were impaired or prejudiced. The new law further states that a taxpayer shall have standing to challenge a decision of any State court if the person was not a party to the action in which the decision was rendered, or to challenge the decision of any board, commission, agency, or other authority of the state or any municipality, school district, village district, or county if there exists a right to appeal the decision under RSA chp. 541 or any other statute and the person seeking to challenge the decision is not entitled to appeal under the applicable statute. Effective: January 1, 2013 Amended: RSA 491:22, I
NH DRA 2012 Annual Report - Page 77

The new law further requires each agency to include a statement signed by the adopting authority explaining how the text of the incorporated document or Internet content can be obtained by the public, and at what cost as an appendix with each filing of the proposed or adopted rule. The agency shall make the information available to the public with a proposed or adopted rule whenever the rule is made available to or requested by the public. When the rule is published pursuant to RSA 541-A:15, the information shall be published as an appendix to the rule chapter containing the rule with a reference in the rule to the appendix. The information shall not be required to be filed on a separate page.
Effective: July 13, 2012 Amended: new paragraph RSA 541-A:1, VII-b, new paragraphs RSA 541-A:12, VI and VII and new paragraph RSA 541-A:21, VIII. House Bill 1510 (Chapter 262, Laws of 2012) allows any taxpayer of a taxing district in this State to have standing to bring a declaratory judgment action in superior court when it is alleged that the taxing district or any agency or authority thereof has engaged, or proposes to engage, in conduct that is unlawful or unauthorized, and in such a case the taxpayer shall not have to demonstrate that his or her personal rights were impaired or prejudiced. The new law further states that a taxpayer shall have standing to challenge a decision of any State court if the person was not a party to the action in which the decision was rendered, or to challenge the decision of any board, commission, agency, or other authority of the state or any municipality, school district, village district, or county if there exists a right to appeal the decision under RSA chp. 541 or any other statute and the person seeking to challenge the decision is not entitled to appeal under the applicable statute. Effective: January 1, 2013 Amended: RSA 491:22, I
NH DRA 2012 Annual Report - Page 78

IX REVENUE AND STATISTICS RECEIPTS AND EXPENDITURES AS OF JUNE 30, 2012
RECEIPTS FY 11 FY 12 % of Change Tax Collections 1,256,180,848 1,235,675,079 (1.66%)
TOTAL 1,256,180,848 1,235,675,079 (1.66%)
EXPENDITURES FY 11 FY 12 % of Change CLASSIFIED 6,770,552 5,100,672 (24.66%)
UNCLASSIFIED 1,678,759 1,475,889 (12.26%) BENEFITS 4,533,490 3,614,966 (20.26%)
SUBTOTAL 12,982,801 10,188,527 (21.52%) Current Expense 3,212,074 2,804,623 (12.68%)
Equipment 20,407 0 (100.00%) SUBTOTAL 3,232,481 2,804,623 (13.24%)
In-State 55,636 30,000 (46.08%) Out-of-State 115,489 66,742 (42.21%)
Miscellaneous 19,847 113,696 472.86% SUBTOTAL 190,972 210,438 10.19%
TOTAL 16,406,254 13,203,588 (19.52%)
DISBURSEMENT/TOWNS FY 11 FY 12 % of Change Flood Control 811,515 221,952 (72.65%)
Forest Land 142,995 137,750 (3.67%) Recreational 0 0
TOTAL 954,510 359,702 (62.32%) Source Data – Cash Basis from fiscal year end reconciliation
NH DRA 2012 Annual Report - Page 79
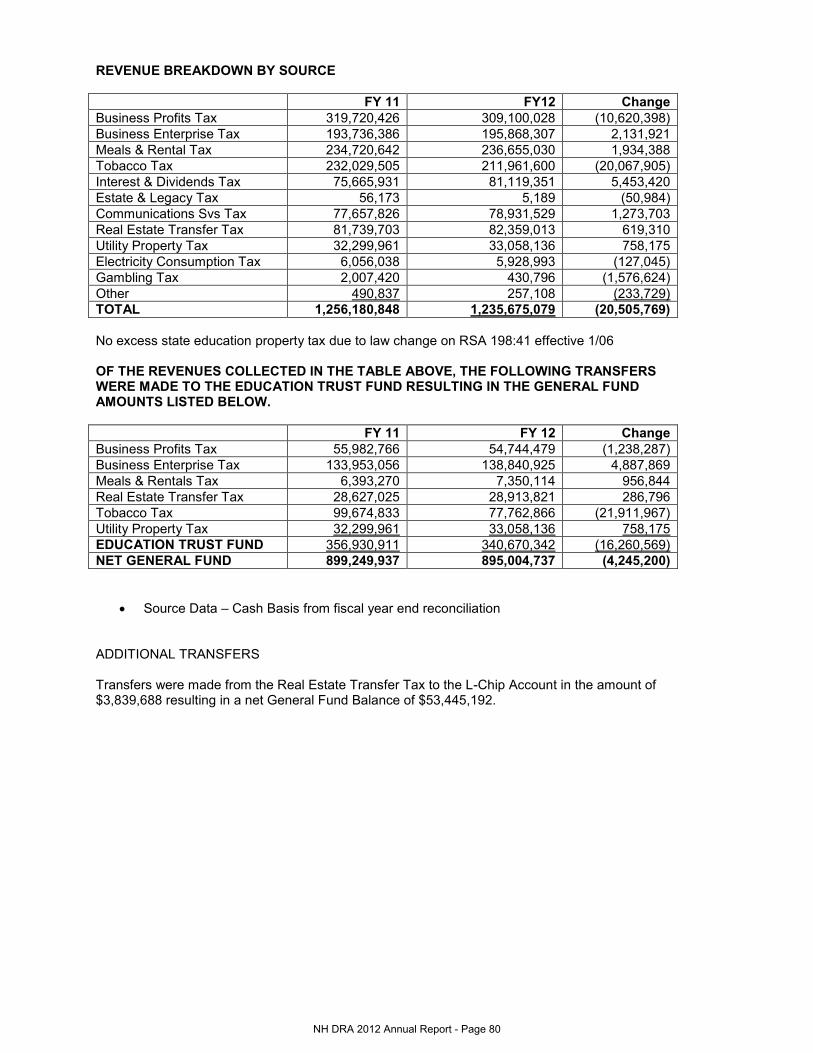
REVENUE BREAKDOWN BY SOURCE FY 11 FY12 Change Business Profits Tax 319,720,426 309,100,028 (10,620,398) Business Enterprise Tax 193,736,386 195,868,307 2,131,921 Meals & Rental Tax 234,720,642 236,655,030 1,934,388 Tobacco Tax 232,029,505 211,961,600 (20,067,905) Interest & Dividends Tax 75,665,931 81,119,351 5,453,420 Estate & Legacy Tax 56,173 5,189 (50,984) Communications Svs Tax 77,657,826 78,931,529 1,273,703 Real Estate Transfer Tax 81,739,703 82,359,013 619,310 Utility Property Tax 32,299,961 33,058,136 758,175 Electricity Consumption Tax 6,056,038 5,928,993 (127,045) Gambling Tax 2,007,420 430,796 (1,576,624) Other 490,837 257,108 (233,729) TOTAL 1,256,180,848 1,235,675,079 (20,505,769) No excess state education property tax due to law change on RSA 198:41 effective 1/06 OF THE REVENUES COLLECTED IN THE TABLE ABOVE, THE FOLLOWING TRANSFERS WERE MADE TO THE EDUCATION TRUST FUND RESULTING IN THE GENERAL FUND AMOUNTS LISTED BELOW. FY 11 FY 12 Change Business Profits Tax 55,982,766 54,744,479 (1,238,287) Business Enterprise Tax 133,953,056 138,840,925 4,887,869 Meals & Rentals Tax 6,393,270 7,350,114 956,844 Real Estate Transfer Tax 28,627,025 28,913,821 286,796 Tobacco Tax 99,674,833 77,762,866 (21,911,967) Utility Property Tax 32,299,961 33,058,136 758,175 EDUCATION TRUST FUND 356,930,911 340,670,342 (16,260,569) NET GENERAL FUND 899,249,937 895,004,737 (4,245,200)
Source Data – Cash Basis from fiscal year end reconciliation ADDITIONAL TRANSFERS Transfers were made from the Real Estate Transfer Tax to the L-Chip Account in the amount of $3,839,688 resulting in a net General Fund Balance of $53,445,192.
NH DRA 2012 Annual Report - Page 80

NET INCOME ON A CASH BASIS FOR 2005 – 2008
TYPE OF REVENUE Fiscal Year Ending 6/30/05
Fiscal Year Ending 6/30/06
Fiscal Year Ending 6/30/07
Fiscal Year Ending 6/30/08
BPT 209,747,332 341,351,280 332,902,093 373,427,632 BET 236,162,258 212,115,406 252,499,583 222,225,230 M & R Tax 192,196,642 204,907,639 207,287,472 214,258,477 Tobacco Tax 99,307,075 145,022,895 139,510.631 165,821,083 I & D Tax 66,929,900 80,256,331 106,017,526 115,928,152 Estate & Legacy Tax 11,909,724 3,925,281 445,818 111,396 CST Tax 69,557,473 70,330,594 73,369,315 79,509,885 Real Estate Transfer Tax 160,430,527 157,941,376 140,630,984 117,153,685 Utilities Property Tax 20,087,776 20,789,572 21,801,715 24,209,319 Excess Education Property Tax 20,934,231 n/a n/a n/a Electric Consumption Tax 6,229,864 6,344,187 6,258,150 6,285,323 Gambling Tax n/a n/a n/a n/a Other Revenue 871,900 360,933 288,579 515,220 TOTAL 1,094,364,702 1,243,345,494 1,281,011,866 1,319,445,402 NET INCOME ON A CASH BASIS FOR 2009 – 2012
TYPE OF REVENUE Fiscal Year Ending 6/30/09
Fiscal Year Ending 6/30/10
Fiscal Year Ending 6/30/11
Fiscal Year Ending 6/30/12
BPT 305,497,834 290,777,382 319,720,426 309,100,028 BET 174,855,792 168,004,685 193,736,386 195,868,307 M & R Tax 210,069,413 229,325,552 234,720,642 236,655,030 Tobacco Tax 193,893,330 239,904,386 232,029,505 211,961,600 I & D Tax 97,372,040 83,007,576 75,665,931 81,119,351 Estate & Legacy Tax 61,887 23,970 56,173 5,189 CST Tax 80,932,268 78,367,621 77,657,826 78,931,529 Real Estate Transfer Tax 83,477,646 83,036,064 81,739,703 82,359,013 Utilities Property Tax 28,942,542 29,923,585 32,299,961 33,058,136 Electric Consumption Tax 6,073,712 5,957,300 6,056,038 5,928,993 Gambling Tax n/a 821,049 2,007,420 430,796 Other Revenue 672,438 470,432 490,837 257,108 TOTAL 1,181,848,902 1,209,619,602 1,256,180,848 1,235,675,079
Source Data – Cash Basis from fiscal year end reconciliation
NH DRA 2012 Annual Report - Page 81

PERSONNEL & REVENUE ADMINISTRATION STATISTICS
Personnel Expenditure FY 2012
Revenue Collected FY 2012
Estimated Cost of Collection FY 2012
$10,188,527 $1,235,675,079 0.82%
PERSONNEL DATA CURRENT # OF EMPLOYEES AS OF
JUNE 30, 2012 Unclassified Employees 17 Classified Employees 102 Full Time Temporary Employees 0 Temporary Employees 0 Total Number of Employees 119
PHYSICAL PLANT AND PROPERTY VALUE AS OF JUNE 30, 2012 Equipment $882,354 Motor Vehicles $15,887 Physical Plant $0 Farm $0 Highways $0 Total Property Value $898,241
REVOLVING FUND RSA 9:15 APPROVED BY G&C 4/15/82 – LAST AMENDED BY G&C 3/3/93 FOR PERIOD JULY 1, 2011 THROUGH JUNE 30, 2012
Beginning Fund Balance 7/1/11 $7,635.54 Expenditure $0 Revenues $1,271.50 Ending Fund Balance 6/30/12 $8,907.04
REVOLVING FUND RSA 21-J:24-a,VII, FOR PERIOD JULY 1, 2010 THROUGH JUNE 30, 2012 Beginning Fund Balance 7/1/11 $3,303.26 Expenditure $0 Revenues $0 Ending Fund Balance 6/30/12 $3,303.26
Source Data – Cash Basis from fiscal year end reconciliation
SUMMARY OF EXPENDITURES
FY08 FY09 FY10 FY11 FY12Classified 6,637,589 6,982,512 7,163,277 6,770,552 5,100,672 Unclassified 1,536,758 1,580,880 1,624,355 1,678,759 1,472,889 Benefits 3,777,189 3,978,307 4,546,017 4,533,490 3,614,966 Other - - - - - Subtotal 11,951,536 12,541,699 13,333,649 12,982,801 10,188,527 Current Expense 2,658,295 3,733,515 3,295,138 3,212,074 2,804,623 Equipment 161,378 448,560 - 20,407 - Subtotal 2,819,673 4,182,075 3,295,138 3,232,481 2,804,623 In-State 87,053 94,570 68,497 55,636 30,000 Out-of-State 153,980 114,425 127,670 115,489 66,742 Miscellaneous 274,655 6,602 - 19,847 113,696 Subtotal 515,688 215,597 196,167 190,972 210,438 TOTAL 15,286,897 16,939,371 16,824,954 16,406,254 13,203,588
Source: Cash Basis from fiscal year end reconciliation as presented in Annual Reports
ACTUAL
NH DRA 2012 Annual Report - Page 82

Annual Reports - Historical Data
FYE Tobacco Change BPT/BET Change M&R Change I&D Change Inherit Change RETT Change
1973 $24,946,507 $24,397,020 $17,987,701 $4,169,840 $7,055,524 $942,662
1974 $23,504,946 -5.78% $30,072,497 23.26% $18,090,062 0.57% $5,036,721 20.79% $5,785,708 -18.00% $745,290 -20.94%
1975 $23,876,124 1.58% $26,843,979 -10.74% $12,813,408 -29.17% $5,794,286 15.04% $5,882,019 1.66% $518,338 -30.45%
1976 $27,526,968 15.29% $24,169,700 -9.96% $14,098,938 10.03% $6,151,735 6.17% $5,936,160 0.92% $662,408 27.79%
1977 $26,838,701 -2.50% $32,556,760 34.70% $15,749,858 11.71% $7,004,073 13.86% $7,339,690 23.64% $912,850 37.81%
1978 $26,807,244 -0.12% $52,453,232 61.11% $21,248,439 34.91% $8,934,421 27.56% $6,980,010 -4.90% $2,623,754 187.42%
1979 $25,948,944 -3.20% $64,017,845 22.05% $25,542,747 20.21% $10,028,131 12.24% $7,527,734 7.85% $3,303,553 25.91%
1980 $25,611,731 -1.30% $62,786,373 -1.92% $27,048,739 5.90% $11,637,871 16.05% $8,255,749 9.67% $3,308,599 0.15%
1981 $26,753,946 4.46% $57,339,717 -8.67% $30,231,760 11.77% $14,021,728 20.48% $10,371,777 25.63% $3,031,327 -8.38%
1982 $26,249,960 -1.88% $79,737,252 39.06% $37,246,943 23.20% $15,070,913 7.48% $9,476,041 -8.64% $5,164,164 70.36%
1983 $25,992,045 -0.98% $73,625,927 -7.66% $43,119,834 15.77% $16,762,818 11.23% $10,582,542 11.68% $7,021,612 35.97%
1984 $33,610,893 29.31% $103,791,353 40.97% $57,409,639 33.14% $22,509,584 34.28% $11,894,496 12.40% $21,604,174 207.68%
1985 $32,755,456 -2.55% $108,522,266 4.56% $56,644,696 -1.33% $24,688,791 9.68% $12,002,575 0.91% $28,615,918 32.46%
1986 $32,389,000 -1.12% $110,497,000 1.82% $61,672,000 8.88% $24,973,000 1.15% $14,121,000 17.65% $33,810,000 18.15%
1987 $31,788,225 -1.85% $150,293,655 36.02% $68,938,740 11.78% $27,010,105 8.16% $20,824,464 47.47% $43,147,975 27.62%
1988 $31,816,530 0.09% $138,398,145 -7.91% $76,324,821 10.71% $29,994,574 11.05% $20,397,785 -2.05% $35,710,318 -17.24%
1989 $31,758,544 -0.18% $143,170,703 3.45% $81,654,391 6.98% $36,165,831 20.57% $30,428,049 49.17% $29,507,058 -17.37%
1990 $37,574,259 18.31% $113,170,448 -20.95% $82,690,546 1.27% $41,185,227 13.88% $25,093,842 -17.53% $30,422,231 3.10%
1991 $39,182,468 4.28% $111,889,162 -1.13% $89,806,369 8.61% $36,874,798 -10.47% $22,882,849 -8.81% $31,531,363 3.65%
1992 $39,409,121 0.58% $88,642,475 -20.78% $92,055,899 2.50% $34,985,058 -5.12% $25,524,248 11.54% $34,758,217 10.23%
1993 $40,991,088 4.01% $119,454,080 34.76% $95,064,348 3.27% $35,662,683 1.94% $32,006,083 25.39% $27,276,954 -21.52%
1994 $42,859,252 4.56% $144,403,149 20.89% $101,263,635 6.52% $35,980,018 0.89% $33,219,462 3.79% $28,985,629 6.26%
1995 $44,489,670 3.80% $163,953,839 13.54% $107,328,262 5.99% $37,958,245 5.50% $30,266,348 -8.89% $28,992,391 0.02%
1996 $45,420,240 2.09% $180,114,322 9.86% $112,454,174 4.78% $51,658,363 36.09% $31,707,415 4.76% $30,077,586 3.74%
1997 $49,837,126 9.72% $209,896,593 16.54% $118,721,973 5.57% $52,698,495 2.01% $41,234,484 30.05% $32,423,790 7.80%
1998 $75,244,227 50.98% $240,329,945 14.50% $127,720,467 7.58% $61,833,319 17.33% $42,774,343 3.73% $42,587,934 31.35%
1999 $73,327,818 -2.55% $257,267,608 7.05% $136,499,008 6.87% $62,911,196 1.74% $47,482,309 11.01% $51,066,185 19.91%
2000 $92,570,165 26.24% $313,738,870 21.95% $153,311,197 12.32% $65,203,307 3.64% $60,635,156 27.70% $82,864,095 62.27%
2001 $87,959,255 -4.98% $352,471,608 12.35% $163,049,648 6.35% $76,842,273 17.85% $57,064,323 -5.89% $90,350,287 9.03%
2002 $84,976,512 -3.39% $382,873,659 8.63% $169,703,721 4.08% $71,470,243 -6.99% $57,088,030 0.04% $97,371,970 7.77%
2003 $93,267,036 9.76% $393,381,018 2.74% $175,114,686 3.19% $56,417,343 -21.06% $68,193,847 19.45% $117,003,621 20.16%
2004 $100,040,497 7.26% $408,195,387 3.77% $184,259,685 5.22% $53,769,043 -4.69% $35,050,805 -48.60% $137,018,703 17.11%
2005 $99,307,075 -0.73% $445,909,590 9.24% $192,196,642 4.31% $66,929,900 24.48% $11,909,724 -66.02% $160,430,527 17.09%
2006 $145,022,895 46.03% $553,466,686 24.12% $204,907,639 6.61% $80,256,331 19.91% $3,925,281 -67.04% $157,941,376 -1.55%
2007 $139,510,631 -3.80% $585,401,676 5.77% $207,287,472 1.16% $106,017,526 32.10% $445,818 -88.64% $140,630,984 -10.96%
2008 $165,821,083 18.86% $595,652,862 1.75% $214,258,477 3.36% $115,928,152 9.35% $111,396 -75.01% $117,153,685 -16.69%
2009 $193,893,330 16.93% $480,353,626 -19.36% $210,069,413 -1.96% $97,372,040 -16.01% $61,887 -44.44% $83,477,646 -28.75%
2010 $239,904,386 23.73% $458,782,067 -4.49% $229,325,552 9.17% $83,007,576 -14.75% $23,970 -61.27% $83,036,064 -0.53%
2011 $232,102,486 -3.25% $527,641,934 15.01% $241,701,762 5.40% $77,387,749 -6.77% $91,853 283.20% 6,171,206 3.78%
2012 $212,001,647 -8.66% $514,625,113 -2.47% $252,811,105 4.60% $82,481,401 -6.58% $6,094 -93.37% $86,317,662 0.17%
Net Income, Cash Basis
NH DRA 2012 Annual Report - Page 83

Annual Reports - Historical Data Utility Misc Total
FYE CST Change Prop Change ECT Change Taxes Change Taxes Change % Change FYE
1973 $333,678 $79,834,905 1973
1974 $359,720 7.80% $84,979,557 $5,144,652 6.44% 1974
1975 $7,710,438 2043.46% $85,005,761 $26,204 0.03% 1975
1976 $8,815,505 14.33% $89,128,838 $4,123,077 4.85% 1976
1977 $8,872,647 0.65% $101,081,603 $11,952,765 13.41% 1977
1978 $9,138,967 3.00% $130,565,844 $29,484,241 29.17% 1978
1979 $12,042,285 31.77% $151,147,613 $20,581,769 15.76% 1979
1980 $10,538,922 -12.48% $152,573,529 $1,425,916 0.94% 1980
1981 $10,156,720 -3.63% $156,418,864 $3,845,335 2.52% 1981
1982 $8,533,012 -15.99% $187,200,276 $30,781,412 19.68% 1982
1983 $6,433,211 -24.61% $189,651,857 $2,451,581 1.31% 1983
1984 $6,233,320 -3.11% $281,137,838 $91,485,981 48.24% 1984
1985 $6,914,946 10.94% $287,831,332 $6,693,494 2.38% 1985
1986 $7,262,188 5.02% $303,191,188 $15,359,856 5.34% 1986
1987 $6,697,750 -7.77% $365,527,760 $62,336,572 20.56% 1987
1988 $7,605,989 13.56% $358,790,194 -$6,737,566 -1.84% 1988
1989 $8,809,300 15.82% $381,900,647 $23,110,453 6.44% 1989
1990 $8,482,072 -3.71% $363,060,271 -$18,840,376 -4.93% 1990
1991 $22,205,619 $637,500 -92.48% $377,330,276 $14,270,005 3.93% 1991
1992 $26,681,057 20.15% $803,428 26.03% $373,837,793 -$3,492,483 -0.93% 1992
1993 $29,621,244 11.02% $791,530 -1.48% $405,330,148 $31,492,355 8.42% 1993
1994 $30,430,075 2.73% $877,211 10.82% $438,656,024 $33,325,876 8.22% 1994
1995 $32,900,476 8.12% $878,303 0.12% $463,841,048 $25,185,024 5.74% 1995
1996 $35,266,871 7.19% $1,424,895 62.23% $505,612,212 $41,771,164 9.01% 1996
1997 $38,263,312 8.50% $1,995,890 40.07% $562,633,582 $57,021,370 11.28% 1997
1998 $40,219,738 5.11% $1,918,204 -3.89% $650,358,868 $87,725,286 15.59% 1998
1999 $45,824,952 13.94% $1,277,630 -33.39% $686,058,317 $35,699,449 5.49% 1999
2000 $47,416,610 3.47% $31,167,539 $1,027,627 -19.57% $882,058,932 $196,000,615 28.57% 2000
2001 $49,256,789 3.88% $15,625,403 -49.87% $1,210,757 17.82% $927,090,749 $45,031,817 5.11% 2001
2002 $62,508,517 26.90% $18,192,984 16.43% $5,735,676 $1,226,191 1.27% $980,409,577 $53,318,828 5.75% 2002
2003 $63,452,424 1.51% $18,833,596 3.52% $6,024,844 5.04% $815,634 -33.48% $1,025,170,080 $44,760,503 4.57% 2003
2004 $65,595,263 3.38% $20,159,763 7.04% $6,217,227 3.19% $923,468 13.22% $1,041,073,752 $15,903,672 1.55% 2004
2005 $69,557,473 6.04% $20,087,776 -0.36% $6,229,864 0.20% $871,900 -5.58% $1,094,364,702 $53,290,950 5.12% 2005
2006 $70,330,594 1.11% $20,789,572 3.49% $6,344,187 1.84% $360,933 -58.60% $1,243,345,494 $148,980,792 13.61% 2006
2007 $73,369,315 4.32% $21,801,715 4.87% $6,258,150 -1.36% $288,579 -20.05% $1,281,011,866 $37,666,372 3.03% 2007
2008 $79,509,885 8.37% $24,209,319 11.04% $6,285,323 0.43% $515,220 78.54% $1,319,445,402 $38,433,536 3.00% 2008
2009 $80,932,268 1.79% $28,942,542 19.55% $6,073,712 -3.37% $672,438 30.51% $1,181,848,901 -$137,596,501 -10.43% 2009
2010 $78,367,621 -3.17% $29,923,585 3.39% $5,957,300 -1.92% $470,432 -30.04% $1,208,798,552 $26,949,651 2.28% 2010
2011 $78,199,323 -0.21% $32,327,619 8.03% $6,060,651 1.73% $2,361,824 402.05% $1,284,046,410 $75,247,858 6.2250% 2011
2012 $79,224,930 1.31% $33,067,183 2.29% $5,931,854 -2.13% $745,445 -68.44% $1,267,212,929 -$16,833,481 -1.3110% 2012
Net Income, Cash Basis
NH DRA 2012 Annual Report - Page 84

X SUPPORTING DETAILS
History of Tax Types as a Percent of Total Tax Received
1975 - Tobacco tax changed from 42% to a flat rate of $0.12 per package 1994 - BPT rate of 7.5% for FY94
1977 - BPT rate increased from 7.0% to 8.0% RETT decreased from .525% to .5% to both buyer and seller
I&D rate increased from 4.25% to 5.0% 1995 - BPT rate of 7.0% for FY95
M&R rate increased from 5% to 6% 1997 - Tobacco tax increase to $0.37 per package of 20
RETT rate increased from .15% to .25% to buyer only 1999 - BPT rate increased from 7.0% to 8.0%
1981 - M&R rate increased from 6% to 7% BET rate increased from .25% to .5%
0%
10%
20%
30%
40%
50%
60%
70%
80%
90%
100%
Fiscal Year
Other
CST
RETT
I&D
M&R
BET
BPT
Tobacco
1981 - M&R rate increased from 6% to 7% BET rate increased from .25% to .5%
RETT modified to .25% to both buyer and seller RETT increased from .5% to .75% to both buyer and seller
1983 - RETT increased from .25% to .5% to both buyer and seller Tobacco tax increase to $0.52 per package of 20
Tobacco tax increased to $0.17 per package 2001 - BPT rate increase from 8.0% to 8.5%
1985 - RETT decreased from .5% to .375% to both buyer and seller BET rate increased from .5% to .75%
1986 - Tobacco modified to $0.17 per package of 20 and $0.21 per package of 25 CST rate increased from 5.5% to 7%
1987 - RETT decreased from .375% to .35% to both buyer and seller 2003 - Tobacco tax of $0.52 per pack with 19% tax on tobacco other than cigarettes
1989 - RETT increased from .35% to .475% to both buyer and seller 2005 - Tobacco tax increase to $0.80 per pack
Tobacco tax increased to $0.21 per package of 20 and $0.261/2
per package of 25 2007 - Tobacco tax increase to $1.08
1990 - M&R rate increased from 7% to 8% 2009 - M&R rate increased from 8% to 9%
RETT increased from .475% to .525% to both buyer and seller Tobacco tax increase to $1.78
Tobacco tax increased to $0.25 per package of 20 and $0.311/4
per package of 25 Tobacco tax increase from 19% t o 48.59% of wholesale price
1993 - BET introduced at a rate of .0025% 2010 - Tobacco tax rate increase from 48.59% to 65.03% of wholesale price
CST rate of 5.5% 2011 - Gambling tax repealed for winnings received on or after May 23, 2011
Tobacco tax decrease from $1.78 to $1.68
Tobacco tax decrese from 65.03% to 48% of wholesale price
NH DRA 2012 Annual Report - Page 85

Monthly Business Tax Analysis Documents with money onlyBusiness Taxes OnlyControl Amount of Payment Batches - Cash Basis
FY 08 Returns FY 09 Returns % change FY 10 Returns % change FY 11 Returns % change FY 12 Returns % change Year TD change
July 2,481,128 2,442,542 -2% 1,612,494 -34% 982,914 -39% $1,368,763 39% 39.26%August 3,258,693 3,398,504 4% 1,294,187 -62% 1,186,541 -8% $3,276,192 176% 114.11%September 5,524,775 5,262,101 -5% 6,736,791 28% 4,812,668 -29% $4,274,076 -11% 27.74%October 24,601,627 10,323,728 -58% 8,005,382 -22% 8,812,444 10% $10,182,422 16% 20.94%November 1,876,402 1,891,936 1% 2,587,646 37% 1,413,778 -45% $1,475,742 4% 19.58%December 2,616,751 2,877,439 10% 1,502,829 -48% 1,292,618 -14% $2,068,608 60% 22.40%January 1,816,006 3,267,382 80% 1,195,203 -63% 7,331,582 513% $3,313,649 -55% 0.49%February 3,138,444 2,061,645 -34% 1,897,101 -8% 1,689,275 -11% $1,989,578 18% 1.55%March 16,257,976 13,864,702 -15% 13,525,604 -2% 13,418,235 -1% $14,113,148 5% 2.74%April 20,238,148 18,655,148 -8% 11,976,806 -36% 15,191,278 27% $16,191,480 7% 3.78%May 3,495,992 1,437,468 -59% 1,346,401 -6% 2,284,898 70% $1,799,302 -21% 2.80%June 1,897,245 2,283,086 20% 1,370,224 -40% 1,922,491 40% $2,248,021 17% 3.25%Total $87,203,187 $67,765,682 -22% $53,050,669 -22% $60,338,723 14% $62,300,983 3%
FY 08 Estimates FY 09 Estimates % change FY 10 Estimates % change FY 11 Estimates % change FY 12 Estimates % change Year TD change
July 11,988,558 12,382,147 3% 11,162,844 -10% 49,734,333 346% $12,927,510 -74% -74.01%August 6,779,914 5,331,185 -21% 5,744,370 8% 5,137,261 -11% $5,582,993 9% -66.27%September 84,929,294 74,390,077 -12% 66,303,341 -11% 71,302,529 8% $84,345,456 18% -18.48%October 26,567,358 13,469,531 -49% 14,202,249 5% 12,309,524 -13% $12,758,635 4% -16.51%November 5,876,500 4,156,418 -29% 7,239,856 74% 7,566,933 5% $5,914,634 -22% -19.79%December 87,187,881 77,322,308 -11% 70,588,783 -9% 75,276,929 7% $77,097,189 2% -10.26%January 24,031,937 12,213,208 -49% 19,362,571 59% 14,245,653 -26% $17,500,014 23% -8.26%February 6,527,712 5,121,780 -22% 7,155,328 40% 5,645,147 -21% $5,151,209 -9% -8.27%March 18,737,798 17,100,614 -9% 18,193,810 6% 20,848,852 15% $19,870,253 -5% -7.98%April 46,005,522 45,644,649 -1% 38,655,064 -15% 42,711,663 10% $43,954,425 3% -6.46%May 9,672,631 8,243,013 -15% 7,983,889 -3% 10,256,424 28% $13,140,578 28% -5.33%June 75,765,811 68,954,059 -9% 79,692,497 16% 69,740,351 -12% $75,629,123 8% -2.83%Total $404,070,916 $344,328,990 -15% $346,284,601 1% $384,775,599 11% $373,872,021 -3%
FY 08 Extensions FY 09 Extensions % change FY 10 Extensions % change FY 11 Extensions % change FY 12 Extensions % change Year TD change
July 703,532 975,359 39% 725,404 -26% 975,409 34% $606,527 -38% -37.82%August 1,975,157 2,699,557 37% 1,697,856 -37% 3,107,124 83% $4,141,034 33% 16.29%September 2,541,840 3,152,706 24% 2,505,338 -21% 2,372,105 -5% $1,706,956 -28% 0.00%October 1,204,703 3,348,704 178% 3,525,245 5% 2,312,750 -34% $1,201,351 -48% -12.68%November 1,844,524 2,120,911 15% 656,102 -69% 1,241,465 89% $588,783 -53% -17.63%December 7,640,263 3,677,301 -52% 2,201,613 -40% 5,803,472 164% $3,633,009 -37% -24.88%January 653,350 1,331,362 104% 1,379,287 4% 978,888 -29% $6,414,720 555% 8.94%February 1,287,661 8,202,325 537% 4,373,541 -47% 688,422 -84% $835,314 21% 9.43%March 61,994,927 44,141,135 -29% 44,647,055 1% 47,019,416 5% $47,216,469 0% 2.86%April 29,140,510 15,418,466 -47% 14,389,590 -7% 14,638,600 2% $13,708,290 -6% 1.16%May 1,647,579 1,391,973 -16% 1,286,066 -8% 2,082,272 62% $1,879,824 -10% 0.88%June 9,718,586 1,819,286 -81% 4,386,353 141% 3,985,037 -9% $2,927,985 -27% -0.40%Total $120,352,632 $88,279,085 -27% $81,773,448 -7% $85,204,960 4% $84,860,261 0%
FY 08 Tax Notices FY 09 Tax Notices % change FY 10 Tax Notices % change FY 11 Tax Notices % change FY 12 Tax Notices % change Year TD change
July 2,900,319 2,482,495 -14% 4,335,485 75% 2,145,386 -51% $1,747,818 -19% -18.53%August 2,651,423 2,124,242 -20% 2,018,179 -5% 4,810,562 138% $1,890,608 -61% -47.69%September 1,643,195 1,674,229 2% 5,744,363 243% 3,323,595 -42% $2,383,484 -28% -41.42%October 3,013,001 5,089,814 69% 3,889,055 -24% 5,408,442 39% $1,729,867 -68% -50.59%November 4,354,468 1,655,252 -62% 3,154,057 91% 3,276,064 4% $7,335,000 124% -20.45%December 5,650,328 4,037,974 -29% 3,925,989 -3% 4,797,930 22% $2,906,907 -39% -24.28%January 4,499,675 2,516,170 -44% 2,595,452 3% 2,877,750 11% $1,948,598 -32% -25.14%February 7,332,404 6,616,127 -10% 3,375,819 -49% 2,596,196 -23% $842,447 -68% -28.91%March 2,802,357 4,995,864 78% 3,345,778 -33% 5,787,010 73% $1,391,281 -76% -36.68%April 12,087,041 7,069,855 -42% 5,272,074 -25% 2,889,140 -45% $870,148 -70% -39.21%May 3,706,210 2,282,527 -38% 2,656,268 16% 6,682,230 152% $1,540,524 -77% -44.87%June 2,161,912 2,510,757 16% 3,089,067 23% 2,922,203 -5% $1,703,637 -42% -44.67%Total $52,802,333 $43,055,304 -18% $43,401,586 1% $47,516,506 9% $26,290,320 -45%
FY thru June $52,802,333 $43,055,034 -18% $43,401,586 1% $47,516,506 9% $26,290,320 -45%
Total FYTD $664,429,068 $543,429,061 -18% $524,510,304 -3% $577,835,786 10% $547,323,584 -5%
FY 08 Refunds FY 09 Refunds % change FY 10 Refunds FY 11 Refunds FY 12 Refunds % change Year TD change
July 1,836,415 1,329,134 -28% 1,601,975 21% 3,382,644 111% $1,178,158 -65% -65.17%August 4,636,805 1,406,649 -70% 1,193,374 -15% 932,906 -22% $1,584,631 70% -35.98%September 1,638,091 1,476,808 -10% 2,125,457 44% 3,532,641 66% $3,269,009 -7% -23.14%October 3,324,016 5,323,837 60% 3,559,447 -33% 5,210,636 46% $1,793,990 -66% -40.07%November 8,325,444 11,355,518 36% 6,291,101 -45% 6,139,894 -2% $5,491,781 -11% -30.63%December 3,333,459 3,632,762 9% 5,211,797 43% 2,476,738 -52% $3,784,590 53% -21.10%January 9,566,719 4,748,612 -50% 7,243,848 53% 14,964,619 107% $3,978,815 -73% -42.46%February 2,184,143 6,203,516 184% 6,394,490 3% 3,478,690 -46% $1,303,002 -63% -44.21%March 3,595,908 3,323,731 -8% 3,713,867 12% 3,289,882 -11% $1,496,288 -55% -44.99%April 3,511,164 3,017,477 -14% 6,579,147 118% 2,147,670 -67% $1,233,705 -43% -44.87%May 2,913,463 3,523,941 21% 2,785,218 -21% 2,686,399 -4% $3,542,382 32% -40.60%June 2,540,342 3,062,245 21% 1,620,726 -47% 2,200,979 36% $4,072,579 85% -35.12%Total $47,405,969 $48,404,230 2% $48,320,447 0% $50,443,698 4% $32,728,929 -35%
FY thru June $47,405,969 $48,404,230 2% $48,320,447 0% $50,443,698 4% $32,728,929 -35%
FYTD Net $617,023,099 $495,024,831 -20% $476,189,857 -4% $527,392,088 11% $514,594,655 -2%
NH DRA 2012 Annual Report - Page 86
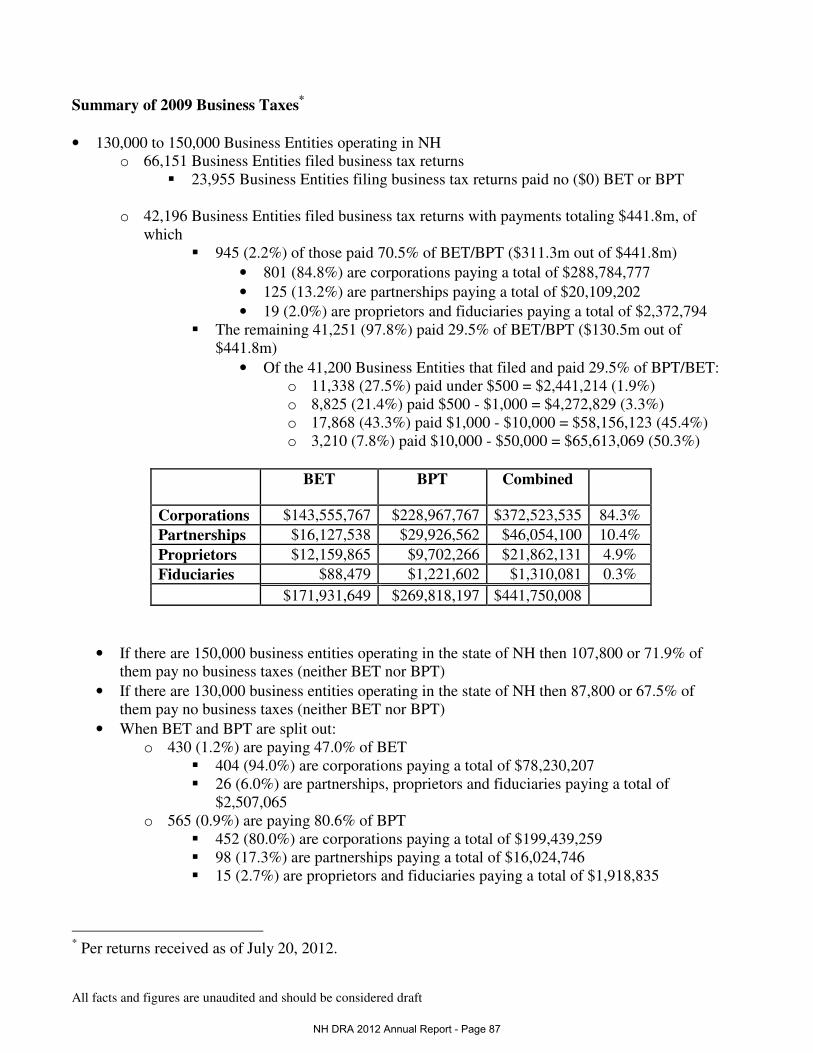
All facts and figures are unaudited and should be considered draft
Summary of 2009 Business Taxes* • 130,000 to 150,000 Business Entities operating in NH
o 66,151 Business Entities filed business tax returns � 23,955 Business Entities filing business tax returns paid no ($0) BET or BPT
o 42,196 Business Entities filed business tax returns with payments totaling $441.8m, of
which � 945 (2.2%) of those paid 70.5% of BET/BPT ($311.3m out of $441.8m)
• 801 (84.8%) are corporations paying a total of $288,784,777 • 125 (13.2%) are partnerships paying a total of $20,109,202 • 19 (2.0%) are proprietors and fiduciaries paying a total of $2,372,794
� The remaining 41,251 (97.8%) paid 29.5% of BET/BPT ($130.5m out of $441.8m)
• Of the 41,200 Business Entities that filed and paid 29.5% of BPT/BET: o 11,338 (27.5%) paid under $500 = $2,441,214 (1.9%) o 8,825 (21.4%) paid $500 - $1,000 = $4,272,829 (3.3%) o 17,868 (43.3%) paid $1,000 - $10,000 = $58,156,123 (45.4%) o 3,210 (7.8%) paid $10,000 - $50,000 = $65,613,069 (50.3%)
BET BPT Combined
Corporations $143,555,767 $228,967,767 $372,523,535 84.3% Partnerships $16,127,538 $29,926,562 $46,054,100 10.4%
Proprietors $12,159,865 $9,702,266 $21,862,131 4.9% Fiduciaries $88,479 $1,221,602 $1,310,081 0.3%
$171,931,649 $269,818,197 $441,750,008
• If there are 150,000 business entities operating in the state of NH then 107,800 or 71.9% of
them pay no business taxes (neither BET nor BPT) • If there are 130,000 business entities operating in the state of NH then 87,800 or 67.5% of
them pay no business taxes (neither BET nor BPT) • When BET and BPT are split out:
o 430 (1.2%) are paying 47.0% of BET � 404 (94.0%) are corporations paying a total of $78,230,207 � 26 (6.0%) are partnerships, proprietors and fiduciaries paying a total of
$2,507,065 o 565 (0.9%) are paying 80.6% of BPT
� 452 (80.0%) are corporations paying a total of $199,439,259 � 98 (17.3%) are partnerships paying a total of $16,024,746 � 15 (2.7%) are proprietors and fiduciaries paying a total of $1,918,835
* Per returns received as of July 20, 2012.
NH DRA 2012 Annual Report - Page 87

Tax Year 2009 Range in Tax Paid COUNT Sum BE TAX % of POP
% of Tax Liability
by POP$0 28,844 $0 43.6% 0.0%
$1 - $500 11,186 $2,413,727 16.9% 1.4%$500 - $1K 8,907 $6,445,719 13.5% 3.7%$1K - $10K 14,838 $43,225,350 22.4% 25.1%$10K - $50K 1,946 $39,109,744 2.9% 22.7%
$50K - $100K 240 $16,427,924 0.4% 9.6%$100K - $MIL 181 $44,787,957 0.3% 26.0%
>$1MIL 9 $19,521,391 0.0% 11.4%Totals: 66,151 $171,931,811
2009 COUNT Sum BE TAX % of Total POP
% of Total Tax
Liability by POPCorporations 24,978 $65,913,641 37.8% 38.3%Water's Edge 2,813 $77,642,127 4.3% 45.2%Partnerships 10,588 $16,127,538 16.0% 9.4%Proprietors 27,478 $12,160,027 41.5% 7.1%Fiduciaries 294 $88,479 0.4% 0.1%
Totals: 66,151 $171,931,811
Business Profits Tax Stats by Tax Year and Amount of Tax Liability
All BPT Entity Types
This Population includes all Corporations, Partnerships, Proprietorships, and any other Entity that Files BET
DRAFT as of 7/20/12
This Population includes all Corporations, Partnerships, Proprietorships, and any other Entity that Files BPT
DRAFT as of 7/20/12
All BET Entity Types
Business Enterprise Tax Stats by Tax Year and Amount of Tax Liability
Tax Year 2009 Range in Tax Paid COUNT Sum BP TAX % of POP
% of Tax Liability
by POP$0 53,220 $0 80.5% 0.0%
$1 - $500 4,120 $675,761 6.2% 0.3%$500 - $1K 1,439 $1,052,106 2.2% 0.4%$1K - $10K 5,306 $18,919,511 8.0% 7.0%$10K - $50K 1,501 $31,787,978 2.3% 11.8%
$50K - $100K 234 $16,382,790 0.4% 6.1%$100K - $MIL 299 $76,798,323 0.5% 28.5%
>$1MIL 32 $124,201,728 0.0% 46.0%Totals: 66,151 $269,818,197
2009 COUNT Sum BP TAX % of Total POP
% of Total Tax
Liability by POPCorporations 24,978 $67,010,308 37.8% 24.8%Water's Edge 2,813 $161,957,459 4.3% 60.0%Partnerships 10,588 $29,926,562 16.0% 11.1%Proprietors 27,478 $9,702,266 41.5% 3.6%Fiduciaries 294 $1,221,602 0.4% 0.5%
Totals: 66,151 $269,818,197
DRAFT as of 7/20/12
Any and all figures are unaudited and should be considered draft
NH DRA 2012 Annual Report - Page 88

All facts and figures are unaudited and should be considered draft
Summary of 2010 Business Taxes* • 130,000 to 150,000 Business Entities operating in NH
o 61,276 Business Entities filed business tax returns � 21,659 Business Entities filing business tax returns paid no ($0) BET or BPT
o 39,617 Business Entities filed business tax returns with payments totaling $367.1m, of
which � 860 (2.2%) of those paid 66.2% of BET/BPT ($242.9m out of $367.1m)
• 687 (79.9%) are corporations paying a total of $210,808,158 • 141 (16.4%) are partnerships paying a total of $28,039,029 • 32 (3.7%) are proprietors and fiduciaries paying a total of $4,014,806
� The remaining 38,757 (97.8%) paid 33.8% of BET/BPT ($124.3m out of $367.1m)
• Of the 38,757 Business Entities that filed and paid 33.8% of BPT/BET: o 10,605 (27.4%) paid under $500 = $2,298,543 (1.8%) o 8,221 (21.2%) paid $500 - $1,000 = $5,973,739 (4.8%) o 16,936 (43.7%) paid $1,000 - $10,000 = $53,600,225 (43.1%) o 2,995 (7.7%) paid $10,000 - $50,000 = $62,403,524 (50.2%)
BET BPT Combined
Corporations $122,691,888 $165,551,576 $288,243,465 78.5% Partnerships $15,496,131 $38,058,609 $53,554,740 14.6%
Proprietors $11,985,166 $11,660,234 $23,645,400 6.4% Fiduciaries $70,518 $1,623,902 $1,694,420 0.5%
$150,243,703 $216,894,322 $367,138,025
• If there are 150,000 business entities operating in the state of NH then 110,400 or 73.6% of
them pay no business taxes (neither BET nor BPT) • If there are 130,000 business entities operating in the state of NH then 90,400 or 69.5% of
them pay no business taxes (neither BET nor BPT) • When BET and BPT are split out:
o 362 (1.0%) are paying 44.6% of BET � 332 (91.7%) are corporations paying a total of $64,369,597 � 30 (8.3%) are partnerships, proprietors and fiduciaries paying a total of
$2,649,412 o 549 (0.9%) are paying 75.6% of BPT
� 417 (76.0%) are corporations paying a total of $137,182,573 � 106 (19.3%) are partnerships paying a total of $23,440,593 � 26 (4.7%) are proprietors and fiduciaries paying a total of $3,382,631
* Per returns received as of July 20, 2012.
NH DRA 2012 Annual Report - Page 89

Tax Year 2010 Range in Tax Paid COUNT Sum BE TAX % of POP
% of Tax Liability
by POP$0 26,589 $0 43.4% 0.0%
$1 - $500 10,514 $2,275,382 17.2% 1.5%$500 - $1K 8,276 $5,997,260 13.5% 4.0%$1K - $10K 13,816 $40,103,375 22.5% 26.7%$10K - $50K 1,719 $34,848,676 2.8% 23.2%
$50K - $100K 193 $13,069,994 0.3% 8.7%$100K - $MIL 163 $39,019,288 0.3% 26.0%
>$1MIL 6 $14,929,727 0.0% 9.9%Totals: 61,276 $150,243,703
2010 COUNT Sum BE TAX % of Total POP
% of Total Tax
Liability by POPCorporations 22,705 $58,557,584 37.1% 39.0%Water's Edge 2,340 $64,134,304 3.8% 42.7%Partnerships 10,121 $15,496,131 16.5% 10.3%Proprietors 25,829 $11,985,166 42.2% 8.0%Fiduciaries 281 $70,518 0.5% 0.0%
Totals: 61,276 $150,243,703
Business Profits Tax Stats by Tax Year and Amount of Tax Liability
All BPT Entity Types
All BET Entity Types
Business Enterprise Tax Stats by Tax Year and Amount of Tax Liability
This Population includes all Corporations, Partnerships, Proprietorships, and any other Entity that Files BET
DRAFT as of 7/20/12
This Population includes all Corporations, Partnerships, Proprietorships, and any other Entity that Files BPT
DRAFT as of 7/20/12
Tax Year 2010 Range in Tax Paid COUNT Sum BP TAX % of POP
% of Tax Liability
by POP$0 48,404 $0 79.0% 0.0%
$1 - $500 4,059 $675,823 6.6% 0.3%$500 - $1K 1,411 $1,024,331 2.3% 0.5%$1K - $10K 5,341 $19,094,785 8.7% 8.8%$10K - $50K 1,512 $32,093,586 2.5% 14.8%
$50K - $100K 247 $17,175,216 0.4% 7.9%$100K - $MIL 274 $74,685,456 0.4% 34.4%
>$1MIL 28 $72,145,126 0.0% 33.3%Totals: 61,276 $216,894,322
2010 COUNT Sum BP TAX % of Total POP
% of Total Tax
Liability by POPCorporations 22,705 $54,165,924 37.1% 25.0%Water's Edge 2,340 $111,385,652 3.8% 51.4%Partnerships 10,121 $38,058,609 16.5% 17.5%Proprietors 25,829 $11,660,234 42.2% 5.4%Fiduciaries 281 $1,623,902 0.5% 0.7%
Totals: 61,276 $216,894,322
DRAFT as of 7/20/12
Any and all figures are unaudited and should be considered draft
NH DRA 2012 Annual Report - Page 90

7/20/2012 MEALS & RENTALS TAX
Tax received in Fiscal Years, not net of refunds
FY2012 Meals Rooms Motor Total Commissions Net Net Change
71,158 $207,868,172 $41,728,060 $7,864,009 $257,460,242 $6,996,814 $250,463,427 4.53%9% rate 80.74% 16.21% 3.05% 100.00%
FY2011 Meals Rooms Motor Total Commissions Net Net Change
74,698 $198,730,993 $39,641,866 $7,950,288 $246,323,147 $6,715,704 $239,607,442 4.58%9% rate 80.68% 16.09% 3.23% 100.00%
FY2010 Meals Rooms Motor Total Commissions Net Net Change
74,580 $191,001,895 $37,184,922 $7,330,483 $235,517,299 $6,405,593 $229,111,707 8.89%9% rate 81.10% 15.79% 3.11% 100.00%
FY2009 Meals Rooms Motor Total Commissions Net Net Change
70,777 $173,947,910 $34,806,937 $7,659,466 $216,414,313 $6,016,506 $210,397,806 -1.64%9% rate 80.38% 16.08% 3.54% 100.00%
FY2008 Meals Rooms Motor Total Commissions Net Net Change
69,348 $175,670,645 $36,158,205 $8,279,773 $220,108,624 $6,199,607 $213,909,016 3.40%8% rate 79.81% 16.43% 3.76% 100.00%
FY2007 Meals Rooms Motor Total Commissions Net Net Change
68,622 $171,843,315 $33,596,627 $7,366,347 $212,806,290 $5,931,358 $206,874,932 3.53%8% rate 80.75% 15.79% 3.46% 100.00%
FY2006 Meals Rooms Motor Total Commissions Net Net Change
67,204 $165,947,696 $32,181,390 $7,430,528 $205,559,613 $5,738,251 $199,821,362 3.84%8% rate 80.73% 15.66% 3.61% 100.00%
FY2005 Meals Rooms Motor Total Commissions Net Net Change
65,325 $159,148,320 $31,219,485 $7,576,571 $197,944,376 $5,503,777 $192,440,599 4.33%8% rate 80.40% 15.77% 3.83% 100.00%
FY2004 Meals Rooms Motor Total Commissions Net Net Change
64,738 $151,649,546 $30,836,386 $7,174,861 $189,660,792 $5,211,100 $184,449,692 5.06%8% rate 79.96% 16.26% 3.78% 100.00%
FY2003 Meals Rooms Motor Total Commissions Net Net Change
63,389 $142,942,089 $30,599,999 $6,901,698 $180,443,787 $4,879,641 $175,564,146 3.14%8% rate 79.22% 16.96% 3.82% 100.00%
FY2002 Meals Rooms Motor Total Commissions Net
62,620 $138,132,209 $30,101,180 $6,749,164 $174,982,553 $4,762,565 $170,219,9878% rate 78.94% 17.20% 3.86% 100.00%
NH DRA 2012 Annual Report - Page 91

FEDERATION OF TAX ADMINISTRATORS -- MARCH 2012
Comparison of State Tobacco Products Taxes
(January 1, 2012)
State Tax Rate/Base (1) State Tax Rate/Base (1)Alabama (2) Michigan 32% Wholesale Price Cigars 3.0¢-40.5¢/ 10 cigars Minnesota 70% Wholesale Price Tobacco/Snuff 1¢-8¢/ ounce Mississippi 15% Manufacturer's PriceAlaska 75% Wholesale Price Missouri 10% Manufacturer's PriceArizona Montana 50% Wholesale Price Cigars 33.7¢-$1.10/10 cigars Nebraska 20% Wholesale Price Tobacco/Snuff 23.8¢/ounce Nevada 30% Wholesale PriceArkansas 68% Manufacturer's Price New Hampshire 48% Wholesale PriceCalifornia (3) 31.73% Wholesale Price New Jersey 30% Wholesale PriceColorado 40% Manufacturer's Price New Mexico 25% Product valueConnecticut (4) 50% Wholesale Price New York 75% Wholesale PriceDelaware 15% Wholesale Price North Carolina 12.8% Wholesale PriceFlorida (5) North Dakota Tobacco/Snuff 85% Wholesale Price Cigars & Tobacco 28% Wholesale PriceGeorgia Chew Tobacco & Snuff 16¢-60¢ /ounce Little Cigars 2.5¢/10 cigars Ohio 17% Wholesale Price Other Cigars 23% Wholesale Price Oklahoma Tobacco 10% Wholesale Price Cigars Little&Large 36¢-$1.20/ 10 cigarsHawaii (6) Snuff&Tobacco 60%-80% Factory list price Large Cigars 50% Wholesale Price Oregon 65% Wholesale Price Tobacco/Snuff 70% Wholesale Price Rhode Island 80% Wholesale PriceIdaho 40% Wholesale Price South Carolina 5% Manufacturer's PriceIllinois 18% Wholesale Price South Dakota 35% Wholesale PriceIndiana 24% Wholesale Price Tennessee 6.6% Wholesale Price Iowa (6) 50% Wholesale Price Texas (7)Kansas 10% Wholesale Price Cigar 1.0¢-15.0¢ /10 cigarsKentucky 15.0% Wholesale Price Tobacco/Snuff $1.16 /ounceLouisiana Utah 86% Manufacturer's Price Cigars 8%-20% Manufacturer's Price Virginia 10% Manufacturer's Price Snuff/Smoking Tobacco 20%-33% Manufacturer's Price Vermont 92% Wholesale PriceMaine Washington 95% Wholesale Price Chewing Tob./Snuff $2.02/ounce West Virginia 7% Wholesale Price Smoking Tob./Cigars 20% Wholesale Price Wisconsin 71% Manufacturer's PriceMaryland 15% Wholesale Price Wyoming (8) 20% Wholesale PriceMassachusetts Smokeless Tobacco 90% Wholesale Price Dist.of Columbia 75¢/ounce Smoking Tob./Cigars 30% Wholesale Price
Source: Compiled by FTA from various sources.Notes: (1) The volume-based tax rates were converted to cents per 10 cigars or per ounce for consistency.(2) Alabama's cigar tax rate rises with the retail price; the rate on smoking tobacco and snuff depends on package weight.(3) California adjusts the tax rate annually, effective July 1st each year.(4) Connecticut taxes snuff tobacco at $1.00 per ounce.(5) Florida's rate includes a 60% surtax.(6) Little cigars are taxed as cigarettes.(7) The Texas rate on tobacco is scheduled to increase on September 1, 2012.(8) Or 10% of retail price in Wyoming.
NH DRA 2012 Annual Report - Page 92

FEDERATION OF TAX ADMINISTRATORS -- January 2012
STATE EXCISE TAX RATES ON CIGARETTES
(January 1, 2012)TAX RATE TAX RATE
STATE (¢ per pack) RANK STATE (¢ per pack) RANKAlabama (a) 42.5 47 Nebraska 64 38Alaska 200 11 Nevada 80 35Arizona 200 11 New Hampshire 168 18Arkansas 115 29 New Jersey 270 6California 87 33 New Mexico 166 19Colorado 84 34 New York (a) 435 1Connecticut 340 3 North Carolina 45 45Delaware 160 20 North Dakota 44 46Florida (b) 133.9 25 Ohio 125 26Georgia 37 48 Oklahoma 103 30Hawaii 320 4 Oregon 118 28Idaho 57 42 Pennsylvania 160 20Illinois (a) 98 32 Rhode Island 346 2Indiana 99.5 31 South Carolina 57 42Iowa 136 24 South Dakota 153 22Kansas 79 36 Tennessee (a) (e) 62 39Kentucky (c) 60 40 Texas 141 23Louisiana 36 49 Utah 170 16Maine 200 11 Vermont 262 7Maryland 200 11 Virginia (a) 30 50Massachusetts 251 9 Washington 302.5 5Michigan 200 11 West Virginia 55 44Minnesota (d) 123 27 Wisconsin 252 8Mississippi 68 37 Wyoming 60 40Missouri (a) 17 51Montana 170 16 Dist. of Columbia (e) 250 10
U. S. Median 125
Source: Compiled by FTA from state sources. (a) Counties and cities may impose an additional tax on a pack of cigarettes: in Alabama, 1¢ to 6¢; Illinois, 10¢ to 15¢; Missouri, 4¢ to 7¢; New York City, $1.50; Tennessee, 1¢; and Virginia, 2¢ to 15¢.(b) Florida's rate includes a surcharge of $1 per pack.(c) Dealers pay an additional enforcement and administrative fee of 0.1¢ per pack in Kentucky and 0.05¢ in Tennessee. (d) In addition, Minnesota imposes an in lieu cigarette sales tax determined annually by the Department. The current rate is 37¢ through July 31, 2012.(e) In addition, District of Columbia imposes an in lieu cigarette sales tax calculated every March 31. The curent rate is 36¢.
NH DRA 2012 Annual Report - Page 93

Mon
thFY
2011
FY 2
010
FY 2
009
FY 2
008
FY 2
007
Stam
p Sa
les
Stam
p Sa
les
Stam
p Sa
les
Mai
ne67
.9-3
%69
.81%
68.8
-5%
72.7
-6%
77.4
Mas
sach
uset
ts22
3.7
1%22
2.0
-1%
224.
7-1
9%27
7.9
0%27
7.1
New
Ham
pshi
re12
2.2
-5%
128.
6-1
6%15
3.4
3%14
9.3
-14%
173.
1V
erm
ont
30.5
3%29
.7-2
%30
.4-5
%32
.0-6
%34
.0
TOB
AC
CO
TA
X ST
AM
P R
ATE
INC
REA
SE D
UR
ING
5 Y
EAR
AN
ALY
SIS
PER
IOD
Mai
ne
9/19
/05
(FY
06)-
$1.
00 to
$2.
00 (
prev
ious
incr
ease
10/
1/01
(FY
02))
Mas
sach
uset
ts
7/1/
08 (F
Y 0
9)- $
1.51
to $
2.51
(pr
evio
us in
crea
se 7
/25/
02)
New
Ham
pshi
re(F
Y11
) Jul
y 20
11 to
Cur
rent
- A
sta
mp
rate
$2.
10, B
sta
mp
rate
$1.
68(F
Y10
) Jul
y 20
09 to
Jun
e 30
, 201
1 - A
sta
mp
rate
$2.
23, B
sta
mp
rate
= $
1.78
(FY
09) O
ctob
er 2
008
to J
une
2009
cur
rent
- A
sta
mp
rate
= 1
.65
B s
tam
p ra
te =
$1.
33(F
Y08
) Jul
y 20
07 to
Sep
tem
ber 2
008
- A s
tam
p ra
te =
1.3
5
B s
tam
p ra
te =
$1.
08(F
Y06
) Jul
y 20
05 to
Jun
e 20
07 -
A s
tam
p ra
te =
$1.
00,
B s
tam
p ra
te =
80
cent
s
Not
es -
July
- S
epte
mbe
r 200
8 (F
Y09
) are
incr
ease
d du
e to
the
legi
slat
ion
on ra
tein
crea
se b
ased
on
July
- S
epte
mbe
r sta
mp
sale
s.
Verm
ont
7/1/
06 (F
Y 0
7)- $
1.19
to $
1.79
7/1/
08 (F
Y08
)- $
1.79
to $
1.99
7/1/
09 (F
Y10
)- $
1.99
to $
2.24
7/1/
11(F
Y11
) - $
2.24
to $
2.62
Fede
ral C
igar
ette
Tax
Incr
ease
4/1/
09 (F
Y09
)- 3
9cen
ts to
$1.
01 (
prev
ious
incr
ease
1/1
/02)
Surr
ound
ing
Stat
es' T
obac
co T
ax S
tam
ps S
ales
Ana
lysi
s - 5
Yea
rs(In
Mill
ions
) O
ne s
tam
p pe
r pac
k
NH DRA 2012 Annual Report - Page 94

Interest and Dividends Tax Stats by Tax Year and Amount of Tax Liability
Tax Year 2009 Range in Tax Paid COUNT Sum TAX % of POP
% of Tax Liability
by POP$0 13,236 - 19.4% 0.0%
$1 - $500 32,439 5,946,375 47.5% 7.4%$500 - $1K 9,194 6,536,770 13.5% 8.1%$1K - $10K 12,383 32,363,687 18.1% 40.1%$10K - $50K 897 16,770,242 1.3% 20.8%
$50K - $100K 72 5,087,095 0.1% 6.3%$100K - $250K 41 6,402,273 0.1% 7.9%
>$250K 16 7,663,404 0.0% 9.5%Totals: 68,278 $80,769,845
2009 COUNT Sum TAX % of Total POP
% of Total Tax
Liability by POPPartnerships and Corporations 522 $40,584 0.8% 0.1%Individuals and Proprietors 59,041 $76,283,211 86.5% 94.4%Fiduciaries and Non-Profits 8,715 $4,446,050 12.8% 5.5%
Totals: 68,278 $80,769,845
Interest and Dividends Tax Stats by Tax Year and Amount of Tax Liability
This Population includes all Individuals, Partnerships, Fiduciaries, and any other Entity that File I&D
DRAFT as of 7/20/12
This Population includes all Individuals, Partnerships, Fiduciaries, and any other Entity that File I&D
All I&D Entity Types
All I&D Entity Types
Tax Year 2010 Range in Tax Paid COUNT Sum TAX % of POP
% of Tax Liability
by POP$0 12,381 - 20.2% 0.0%
$1 - $500 28,243 5,197,626 46.1% 6.9%$500 - $1K 8,251 5,889,005 13.5% 7.9%$1K - $10K 11,398 29,581,930 18.6% 39.5%$10K - $50K 804 15,657,520 1.3% 20.9%
$50K - $100K 74 5,081,917 0.1% 6.8%$100K - $250K 33 4,803,230 0.1% 6.4%
>$250K 18 8,640,802 0.0% 11.5%Totals: 61,202 $74,852,029
2010 COUNT Sum TAX % of Total POP
% of Total Tax
Liability by POPPartnerships and Corporations 1,098 $759,737 1.8% 1.0%Individuals and Proprietors 51,905 $69,550,552 84.8% 92.9%Fiduciaries and Non-Profits 8,199 $4,541,740 13.4% 6.1%
Totals: 61,202 $74,852,029
This Population includes all Individuals, Partnerships, Fiduciaries, and any other Entity that File I&D
DRAFT as of 7/20/12
Any and all figures are unaudited and should be considered draft
NH DRA 2012 Annual Report - Page 95

The
Tax
Fou
nd
atio
n is
a n
on
par
tisa
n t
ax r
esea
rch
gro
up
wh
ose
mis
sio
n is
to
ed
uca
te t
axp
ayer
s ab
ou
t so
un
d t
ax
po
licy
and
th
e si
ze o
f th
e ta
x b
urd
en b
orn
e b
y A
mer
ican
s at
all
leve
ls.
The
Fou
nd
atio
n p
ub
lish
es a
rep
ort
an
nu
ally
en
titl
ed:
“Th
e St
ate
Bu
sin
ess
Tax
Clim
ate
Ind
ex”
Tax
Fou
nd
atio
n R
anki
ngs
2
01
2 B
usi
nes
s C
limat
e In
dex
Ja
nu
ary
20
12
Re
aso
ns
for
Tax
Fou
nd
atio
n’s
Po
ints
De
du
ctio
ns
NO
L –
Cap
on
am
ou
nt
of
carr
y fo
rwar
d
Tax
Cre
dit
s –
Res
earc
h &
Dev
elo
pm
ent
cred
its;
Jo
b T
ax c
red
its
Alt
ern
ativ
e M
inim
um
Tax
(A
mt)
– B
usi
nes
s En
terp
rise
Tax
(B
ET)
Rat
es
Ded
uct
ibili
ty o
f D
eple
tio
n (s
imila
r to
dep
reci
atio
n)
– in
con
sist
ent
wit
h f
eder
al d
eple
tio
n s
ched
ule
s
Co
rpo
rate
Tax
U
ne
mp
loym
ent
Tax
Pro
pe
rty
Tax
Sale
s Ta
x In
com
e T
ax
Ove
rall
Ran
kin
g
C
on
nec
ticu
t 2
5
V
erm
on
t 1
9
M
ain
e 3
8
N
ew H
amp
shir
e n
o
N
ew H
amp
shir
e n
o
N
ew H
amp
shir
e 6
M
assa
chu
sett
s 3
4
C
on
nec
ticu
t 3
2
N
ew H
amp
shir
e 4
1
M
ain
e ye
s
Mai
ne
yes
M
assa
chu
sett
s 2
4
R
ho
de
Isla
nd
4
0
N
ew H
amp
shir
e 3
9
V
erm
on
t 4
3
V
erm
on
t ye
s
Ver
mo
nt
yes
M
ain
e 3
7
V
erm
on
t 4
1
M
ain
e 4
0
R
ho
de
Isla
nd
4
6
M
assa
chu
sett
s ye
s
Mas
sach
use
tts
yes
C
on
nec
ticu
t 4
0
N
ew H
amp
shir
e 4
6
M
assa
chu
sett
s 4
9
M
assa
chu
sett
s 4
7
R
ho
de
Isla
nd
ye
s
Rh
od
e Is
lan
d
yes
R
ho
de
Isla
nd
4
6
M
ain
e 4
7
R
ho
de
Isla
nd
5
0
C
on
nec
ticu
t 5
0
C
on
nec
ticu
t ye
s
Co
nn
ecti
cut
yes
V
erm
on
t 4
7
NH DRA 2012 Annual Report - Page 96

Iow
a –
12
%
Pen
nsy
lvan
ia –
9.9
9%
N
ew J
erse
y –
9%
M
ain
e 3
.50
% t
o 8
.95
%
Ver
mo
nt
6.0
0%
to
8.5
0%
Co
nn
ecti
cut
8.2
5%
fla
t ra
te
Mas
sach
use
tts
8.2
5%
fla
t ra
te o
r 9
.5%
fo
r fi
nan
cial
inst
itu
tio
ns
(Mas
sach
use
tts’
rat
e
fel
l fro
m 8
.8%
to
8.2
5%
in 2
01
1 a
nd
is s
et t
o f
all t
o 8
.0%
in 2
01
2)
New
Ham
psh
ire
8.5
0%
fla
t ra
te o
r A
MT
- B
ET .7
5%
Rh
od
e Is
lan
d 9
.00
% f
lat
rate
Hig
he
st C
orp
ora
te T
ax R
ate
s:
Low
est
Co
rpo
rate
Tax
Rat
e:
C
olo
rad
o –
4.6
3%
Ne
w E
ngl
and
Co
rpo
rate
Tax
Rat
es
July
20
11
Sou
rce:
Tax
Fo
un
dat
ion
: “T
he
Stat
e B
usi
nes
s Ta
x C
limat
e In
dex
”
NH DRA 2012 Annual Report - Page 97

Esti
mat
ed B
urd
en o
f M
ajo
r Ta
xes
for
a
Hyp
oth
etic
al F
amily
of
Thre
e, 2
01
1 @
$7
5,0
00
Bu
rden
Ran
k C
ity
Inco
me
P
rop
erty
Sa
les
Au
to
Am
ou
nt
Per
cen
t
1
Bri
dge
po
rt, C
T 2
,71
4
11
,01
6
1,2
19
1
,15
6
16
,10
5
21
.5%
12
P
rovi
den
ce, R
I 1
,85
7
4,2
24
1
,16
5
99
1
8,2
36
1
1.0
%
13
Po
rtla
nd
, ME
2,4
31
4
,25
6
81
0
72
5
8,2
23
1
1.0
%
14
B
ost
on
, MA
3
,11
1
3,4
92
7
51
5
79
7
,93
2
10
.6%
15
B
url
ingt
on
, VT
1,4
57
4
,94
4
1,0
02
3
44
7
,74
8
10
.3%
43
M
anch
este
r, N
H
0
4,6
45
0
4
90
5
,13
4
6.8
%
Ave
rage
2
,50
2
3,0
92
1
,30
3
58
9
7,0
41
9
.4%
Med
ian
2
,44
3
2,7
87
1
,22
8
55
6
7,0
09
9
.3%
Each
yea
r th
e G
ove
rnm
ent
of
the
Dis
tric
t o
f C
olu
mb
ia, O
ffic
e o
f th
e C
hie
f Fi
nan
cial
Off
icer
, Off
ice
of
Rev
enu
e A
nal
ysis
pu
blis
hes
sev
eral
rep
ort
s to
pro
vid
e in
form
atio
n t
o t
he
citi
zen
s an
d t
axp
ayer
s o
f th
e D
istr
ict
of
Co
lum
bia
ab
ou
t th
e ta
x ra
tes
of
stat
es a
nd
th
e la
rge
citi
es.
The
rep
ort
s co
nta
in in
form
atio
n a
bo
ut
the
rate
s an
d b
urd
ens
of
maj
or
taxe
s in
th
e D
istr
ict
of
Co
lum
bia
co
mp
ared
wit
h s
tate
s an
d t
he
larg
est
citi
es in
th
ose
st
ates
. Th
is p
ub
licat
ion
co
nta
ins
two
rep
ort
s: (
I) T
ax B
urd
ens
in W
ash
ingt
on
, D.C
. Co
mp
ared
wit
h T
ho
se in
th
e La
rges
t C
ity
in E
ach
Sta
te, 2
01
1 a
nd
(II)
A c
om
par
iso
n o
f Se
lect
ed T
ax R
ates
in t
he
Dis
tric
t o
f C
olu
mb
ia w
ith
Th
ose
in
the
50
Sta
tes
as o
f Ja
nu
ary
1, 2
01
2.
This
info
rmat
ion
is r
equ
este
d a
nn
ual
ly b
y co
mm
itte
es o
f th
e U
.S.
Co
ngr
ess
and
th
e D
istr
ict
of
Co
lum
bia
Co
un
cil.
It is
pro
vid
ed p
urs
uan
t to
Pu
blic
Law
93
-40
7.
Sou
rce:
“Ta
x R
ates
An
d T
ax B
urd
ens
In T
he
Dis
tric
t o
f C
olu
mb
ia:
A N
atio
nw
ide
Co
mp
aris
on
20
12
.
NH DRA 2012 Annual Report - Page 98

THE STATE OF NEW HAMPSHIRE
DEPARTMENT OF REVENUE
ADMINISTRATION
2011
PROPERTY TAX
TABLES BY COUNTY
VALUATIONS, TAXES AND TAX RATES
(AS REQUIRED BY RSA 21-J:3 XII)
NH DRA 2012 Annual Report - Page 99
2011
T A B L E S B Y C O U N T Y
This report presents the 2011 Tables by Counties as compiled by the New Hampshire
Department of Revenue Administration pursuant to RSA 21-J:3 XII, which states:
“XII. File with the secretary of state his report showing all the taxable property in the state
and its assessed value, in tabulated form, and such other statistics and information as may
be deemed of interest. This report shall be filed not later than 30 days after all necessary
figures become available.”
Annually, each municipality is required to certify to the Department of Revenue
Administration the assessed valuation of all taxable property in that municipality. This
information is reported on the Summary Inventory of Valuation, MS-1 Form.
Assessment information is also gathered regarding exemptions and tax credits as well as
taxes raised by each municipality. An exemption is an amount deducted from a taxpayer’s
assessment vs. a tax credit which is an amount deducted from the taxes due by a taxpayer.
The following is an explanation of the information contained in this report.
LAND VALUATION: The sum of the taxable land valuations for the following land subcategories:
CURRENT USE: RSA 79-A
CONSERVATION RESTRICTION: RSA 79-B
DISCRETIONARY EASEMENT: RSA 79-C
DISCRETIONARY PRESERVATION EASEMENT: RSA 79-D
TAXATION OF FARM STRUCTURES & LAND UNDER FARM STRUCTURES: RSA 79-F
RESIDENTIAL
COMMERCIAL/INDUSTRIAL
The values in the above columns are prior to the application of any exemption and do not
include any utility land value.
BUILDING VALUATION: The sum of the taxable building valuations for the following building
subcategories:
RESIDENTIAL
MANUFACTURED (MFG) HOUSING: RSA 674:31
COMMERCIAL/INDUSTRIAL
DISCRETIONARY PRESERVATION EASEMENT: RSA 79-D
TAXATION OF FARM STRUCTURES & LAND UNDER FARM STRUCTURES: RSA 79-F
The values in the above columns are prior to the application of any exemptions and do
not include any utility building value.
NH DRA 2012 Annual Report - Page 100

PUBLIC UTILITIES: The sum of all utility values classified as PUBLIC WATER,
GAS, ELECTRIC, OIL, PIPELINE or OTHER pursuant to RSA 83-F. OTHER
utilities include utilities that the Department of Revenue Administration has not
appraised. Some examples of OTHER utilities include hydro plants, water and
certain gas companies.
MATURE WOOD & TIMBER: RSA 79:5
GROSS VALUATION: The valuation of all taxable property in each municipality
prior to adjustments for property tax exemptions.
EDUCATIONAL & SPECIAL EXEMPTIONS: The sum of the following
exemptions:
RSA 72:36-a, Certain Disabled Veterans
RSA 72:38-b, Improvements to Assist the Deaf
RSA 72:37-a, Improvements to Assist Persons with Disabilities
RSA 72:23 IV, School Dining, Dormitory and Kitchen Exemption
(maximum $150,000 per property)
RSA 72:12-a, Water & Air Pollution Control Facilities Exemption
MODIFIED ASSESSED VALUATION: The sum of the gross valuation minus the
educational and special exemptions. The modified assessed valuation is the basis for
calculating the equalized values for each municipality.
LOCAL OPTIONAL EXEMPTIONS OR EXEMPTIONS WITH OPTIONAL ELEMENTS:
Each municipality has adopted an elderly exemption. The amount of the exemption and the
specific criteria (asset and income limits) to qualify are determined locally within statutory
requirements. Each municipality may adopt the other exemptions listed below in this section:
RSA 72:37, Blind Exemption
RSA 72:39-a & b, Elderly Exemption
RSA 72:38-b, Deaf Exemption
RSA 72:37-b, Disabled Exemption
RSA 72:70, Wood-Heating Energy Systems Exemption
RSA 72:62, Solar Energy Systems Exemption
RSA 72:66, Wind-Powered Energy Systems Exemption
RSA 72:23 IV, Additional School Dining, Dormitory and Kitchen Exemption
(amount > $150,000 per property)
NET LOCAL ASSESSED VALUATION: The sum of the modified assessed valuation
minus the value of the blind, elderly and local optional exemptions.
GROSS PROPERTY TAXES: The sum of the net tax commitment plus the veteran’s tax
credits. The Department of Revenue’s Municipal Services Division establishes the property
tax rate using this figure.
LESS VETERANS TAX CREDITS: The sum of tax credits granted pursuant to RSA
NH DRA 2012 Annual Report - Page 101

72:28; 72:29-a 72:32 and RSA 72:35.
NET TAX COMMITMENT: The sum of the gross property taxes minus the sum of the
veteran’s credits. The amount a municipality must actually raise in taxes equals the sum of
the amount appropriated by the municipal legislative body minus any revenues.
ACTUAL TAX RATE: The sum of the municipal, county, local and state school education
tax rate. This tax rate does not include any village district or precinct tax rates.
RESIDENTS TAX: The sum of monies collected by a municipality for the Resident’s Tax
pursuant to RSA 72:1.
COUNTY SUMMARY: The total of each of the above listed columns for all ten counties in
the state. The county tax rate listed is the average county tax rate and is calculated by
taking the sum of the tax rates for all municipalities in a county and dividing by the
number of municipalities.
EDUCATIONAL & SPECIAL EXEMPTIONS REPORT: A breakdown of the
educational and special exemptions granted by municipalities. These are not optional.
LOCAL OPTIONAL EXEMPTIONS REPORT: A breakdown of what each municipality
currently grants. These are optional, and must be adopted by the legislative body of the
municipality.
For further explanation about any information contained in this report, please contact the
Department of Revenue Administration, Property Appraisal Division at (603) 230-5950.
This document may be found on our web site at:
http://www.nh.gov/revenue/munc_prop/propertyappraisal.htm
NH DRA 2012 Annual Report - Page 102

CURRENT USE
CONSERVATION RESTRICTION
DISCRETIONARY EASEMENT
DISCRETIONARY PRESERVATION
EASEMENT
RESIDENTIAL LAND
COMMERCIAL INDUSTRIAL
TOTAL LOCAL ASSESSED VALUATION - LAND
(PAGE 1 OF 4)
COUNTY
2011 COUNTY SUMMARY
RSA 79-F FARM LAND
14,922,358 215,477 440,462 35,392 4,204,266,553 397,649,986BELKNAP 277
20,675,537 466,348 172,436 8,900 5,716,450,847 361,410,080CARROLL 0
30,324,881 622,844 8,320 18,750 2,124,845,203 325,940,194CHESHIRE 0
38,304,269 84,755 0 13,305 758,061,565 117,429,430COOS 0
48,068,633 359,539 252,800 56,006 3,612,722,297 690,188,169GRAFTON 0
31,125,509 460,979 25,458 336,009 10,062,802,521 2,295,238,279HILLSBOROUGH 16,100
37,207,247 671,306 212,473 69,505 4,356,952,490 926,421,807MERRIMACK 654
18,329,926 394,319 435,283 52,700 12,803,524,345 2,493,275,752ROCKINGHAM 0
12,817,323 428,212 54,138 23,775 2,876,267,022 527,631,747STRAFFORD 0
24,565,395 457,973 155,951 2,700 1,523,353,215 101,648,520SULLIVAN 0
276,341,078STATE TOTALS 4,161,752 1,757,321 617,042 48,039,246,058 8,236,833,96417,031
NH DRA 2012 Annual Report - Page 103

RESIDENTIAL MFG HOUSING COMMERCIAL INDUSTRIAL
DISCRETIONARY PRESERVATION
EASEMENT
TOTAL LOCAL ASSESSED VALUATION - BUILDINGS
(PAGE 2 OF 4)
COUNTY
2011 COUNTY SUMMARY
RSA 79-F FARM STRUCTURES
4,509,118,945 128,804,759 771,253,759 140,067BELKNAP 103,500
5,505,309,540 116,962,672 685,624,870 228,808CARROLL 0
3,662,765,774 104,485,115 839,889,546 182,248CHESHIRE 0
1,578,746,809 59,746,640 358,449,570 74,114COOS 0
6,417,601,944 159,281,800 1,552,179,286 298,219GRAFTON 0
20,166,392,982 176,501,070 6,240,370,754 892,759HILLSBOROUGH 336,299
7,105,859,146 189,076,940 1,923,925,236 433,258MERRIMACK 87,300
18,083,404,967 391,452,338 4,606,267,675 954,659ROCKINGHAM 0
5,142,458,421 210,350,400 1,204,190,194 119,437STRAFFORD 0
2,543,923,855 84,701,200 357,326,212 212,610SULLIVAN 0
74,715,582,383 1,621,362,934 18,539,477,102 3,536,179STATE TOTALS 527,099
NH DRA 2012 Annual Report - Page 104

PUBLIC WATER
GAS ELECTRIC OIL OTHER
MATURE WOOD TIMBER
TOTAL LOCAL ASSESSED VALUATION - PUBLIC UTILITIES
(PAGE 3 OF 4)
GROSS VALUATION
MODIFIED ASSESSED VALUATION
EDUCATIONAL SPECIAL
EXEMTPIONSCOUNTY
2011 COUNTY SUMMARY
3,186,359 18,036,800 94,219,692 0 27,000 1,897 341,245,144 1,717,940 10,140,705,343BELKNAP
2,994,389 0 110,447,258 0 0 0 912,444,466 1,606,227 12,519,145,458CARROLL
267,000 1,121,000 289,082,749 0 0 0 64,935,184 6,190,563 7,373,363,061CHESHIRE
415,960 169,612,700 242,760,424 24,618,800 276,093 0 67,025,904 5,390,680 3,343,203,754COOS
232,312 0 812,945,855 0 226,900 0 111,414,279 1,935,700 13,292,478,060GRAFTON
137,896,413 164,592,870 637,968,701 0 1,873,900 0 8,637,513,711 6,503,076 39,910,327,527HILLSBOROUGH
3,458,958 70,296,900 642,254,394 0 275,100 0 569,730,550 61,243,706 15,195,959,008MERRIMACK
50,588,749 201,685,141 3,352,439,961 0 125,432 0 1,206,570,770 310,022,083 41,692,909,164ROCKINGHAM
397,200 32,212,416 127,236,117 0 15,800 0 418,205,920 1,787,700 10,132,414,502STRAFFORD
482,700 0 133,458,311 0 0 0 75,290,246 2,560,900 4,767,727,742SULLIVAN
199,920,040STATE TOTALS 657,557,827 6,442,813,462 24,618,800 2,820,225 1,897 158,767,192,194 398,958,575 158,368,233,619
NH DRA 2012 Annual Report - Page 105

NET VALUATION
2011
GROSS PROPERTY
TAXES
LESS VETERANS
CREDITS
EXEMPTIONS
(PAGE 4 OF 4)
NET TAX COMMITMENT
2011 RESIDENTS
TAX
2011 ACTUAL
TAX RATE
BLIND ELDERLY LOCAL OPTIONAL
EXEMPTIONS
COUNTY
2011 COUNTY SUMMARY
825,200 30,524,966 1,684,256 10,107,670,921 175,280,052 2,059,903 173,220,149 017.14BELKNAP
765,000 20,067,000 1,066,067 12,497,247,391 148,875,294 1,732,244 147,143,050 011.77CARROLL
610,500 25,522,789 4,308,494 7,342,921,278 181,715,851 1,163,775 180,552,076 024.59CHESHIRE
465,000 10,201,390 178,790 3,332,358,574 64,436,643 395,525 64,041,118 019.22COOS
1,104,000 42,751,796 2,348,808 13,246,273,456 243,682,405 1,629,270 242,053,135 34,09018.27GRAFTON
14,352,700 418,504,968 95,745,038 39,381,724,821 851,305,449 7,722,335 843,583,114 021.42HILLSBOROUGH
5,899,449 91,805,538 6,438,149 15,091,815,872 344,669,109 2,775,911 341,893,198 022.65MERRIMACK
4,236,600 343,157,851 27,719,526 41,317,795,187 800,925,281 7,038,035 793,887,246 1,58019.21ROCKINGHAM
3,854,300 105,064,572 9,582,574 10,013,913,056 246,624,278 2,480,957 244,143,321 13,00024.38STRAFFORD
540,000 13,899,700 6,617,690 4,746,670,352 102,507,964 838,885 101,669,079 021.42SULLIVAN
32,652,749STATE TOTALS 1,101,500,570 155,689,392 157,078,390,908 3,160,022,327 27,836,840 3,132,185,487 48,67019.94
NH DRA 2012 Annual Report - Page 106
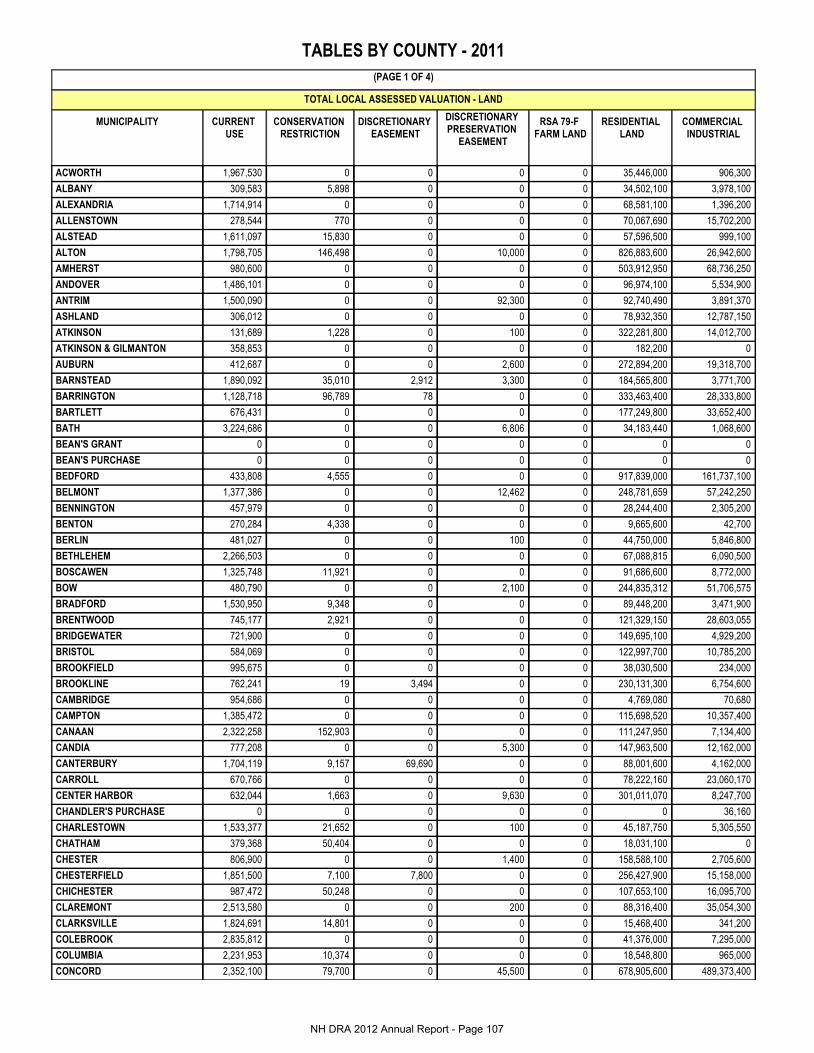
CURRENT USE
CONSERVATION RESTRICTION
DISCRETIONARY EASEMENT
DISCRETIONARY PRESERVATION
EASEMENT
RESIDENTIAL LAND
COMMERCIAL INDUSTRIAL
TOTAL LOCAL ASSESSED VALUATION - LAND
(PAGE 1 OF 4)
TABLES BY COUNTY - 2011
RSA 79-F FARM LAND
MUNICIPALITY
ACWORTH 1,967,530 0 0 0 35,446,000 906,3000
ALBANY 309,583 5,898 0 0 34,502,100 3,978,1000
ALEXANDRIA 1,714,914 0 0 0 68,581,100 1,396,2000
ALLENSTOWN 278,544 770 0 0 70,067,690 15,702,2000
ALSTEAD 1,611,097 15,830 0 0 57,596,500 999,1000
ALTON 1,798,705 146,498 0 10,000 826,883,600 26,942,6000
AMHERST 980,600 0 0 0 503,912,950 68,736,2500
ANDOVER 1,486,101 0 0 0 96,974,100 5,534,9000
ANTRIM 1,500,090 0 0 92,300 92,740,490 3,891,3700
ASHLAND 306,012 0 0 0 78,932,350 12,787,1500
ATKINSON 131,689 1,228 0 100 322,281,800 14,012,7000
ATKINSON & GILMANTON 358,853 0 0 0 182,200 00
AUBURN 412,687 0 0 2,600 272,894,200 19,318,7000
BARNSTEAD 1,890,092 35,010 2,912 3,300 184,565,800 3,771,7000
BARRINGTON 1,128,718 96,789 78 0 333,463,400 28,333,8000
BARTLETT 676,431 0 0 0 177,249,800 33,652,4000
BATH 3,224,686 0 0 6,806 34,183,440 1,068,6000
BEAN'S GRANT 0 0 0 0 0 00
BEAN'S PURCHASE 0 0 0 0 0 00
BEDFORD 433,808 4,555 0 0 917,839,000 161,737,1000
BELMONT 1,377,386 0 0 12,462 248,781,659 57,242,2500
BENNINGTON 457,979 0 0 0 28,244,400 2,305,2000
BENTON 270,284 4,338 0 0 9,665,600 42,7000
BERLIN 481,027 0 0 100 44,750,000 5,846,8000
BETHLEHEM 2,266,503 0 0 0 67,088,815 6,090,5000
BOSCAWEN 1,325,748 11,921 0 0 91,686,600 8,772,0000
BOW 480,790 0 0 2,100 244,835,312 51,706,5750
BRADFORD 1,530,950 9,348 0 0 89,448,200 3,471,9000
BRENTWOOD 745,177 2,921 0 0 121,329,150 28,603,0550
BRIDGEWATER 721,900 0 0 0 149,695,100 4,929,2000
BRISTOL 584,069 0 0 0 122,997,700 10,785,2000
BROOKFIELD 995,675 0 0 0 38,030,500 234,0000
BROOKLINE 762,241 19 3,494 0 230,131,300 6,754,6000
CAMBRIDGE 954,686 0 0 0 4,769,080 70,6800
CAMPTON 1,385,472 0 0 0 115,698,520 10,357,4000
CANAAN 2,322,258 152,903 0 0 111,247,950 7,134,4000
CANDIA 777,208 0 0 5,300 147,963,500 12,162,0000
CANTERBURY 1,704,119 9,157 69,690 0 88,001,600 4,162,0000
CARROLL 670,766 0 0 0 78,222,160 23,060,1700
CENTER HARBOR 632,044 1,663 0 9,630 301,011,070 8,247,7000
CHANDLER'S PURCHASE 0 0 0 0 0 36,1600
CHARLESTOWN 1,533,377 21,652 0 100 45,187,750 5,305,5500
CHATHAM 379,368 50,404 0 0 18,031,100 00
CHESTER 806,900 0 0 1,400 158,588,100 2,705,6000
CHESTERFIELD 1,851,500 7,100 7,800 0 256,427,900 15,158,0000
CHICHESTER 987,472 50,248 0 0 107,653,100 16,095,7000
CLAREMONT 2,513,580 0 0 200 88,316,400 35,054,3000
CLARKSVILLE 1,824,691 14,801 0 0 15,468,400 341,2000
COLEBROOK 2,835,812 0 0 0 41,376,000 7,295,0000
COLUMBIA 2,231,953 10,374 0 0 18,548,800 965,0000
CONCORD 2,352,100 79,700 0 45,500 678,905,600 489,373,4000
NH DRA 2012 Annual Report - Page 107

RESIDENTIAL MFG HOUSING COMMERCIAL INDUSTRIAL
DISCRETIONARY PRESERVATION
EASEMENT
TOTAL LOCAL ASSESSED VALUATION - BUILDINGS
(PAGE 2 OF 4)
TABLES BY COUNTY - 2011
RSA 79-F FARM STRUCTURES
MUNICIPALITY
ACWORTH 51,220,100 1,421,400 2,684,400 0 0
ALBANY 53,297,400 2,187,500 8,699,300 0 0
ALEXANDRIA 105,652,600 3,860,000 3,457,000 0 0
ALLENSTOWN 133,273,400 18,557,200 23,066,900 0 0
ALSTEAD 109,185,100 2,836,900 4,053,700 0 0
ALTON 545,507,600 9,630,800 32,131,400 62,100 0
AMHERST 824,863,950 2,949,900 134,239,850 0 0
ANDOVER 130,537,300 4,555,500 16,751,500 0 0
ANTRIM 135,036,090 1,120,650 11,418,470 43,740 0
ASHLAND 136,163,850 4,010,100 27,020,400 0 0
ATKINSON 469,009,003 28,100 30,264,900 17,697 0
ATKINSON & GILMANTON 206,150 0 0 0 0
AUBURN 280,198,614 1,171,200 30,119,100 31,886 0
BARNSTEAD 257,204,583 5,916,300 5,956,300 13,117 0
BARRINGTON 453,584,200 22,931,300 61,817,800 0 0
BARTLETT 635,809,700 2,133,100 56,608,700 0 0
BATH 65,595,433 1,229,000 1,024,900 14,267 0
BEAN'S GRANT 0 0 0 0 0
BEAN'S PURCHASE 0 0 20,650 0 0
BEDFORD 1,834,186,100 156,700 425,601,500 0 0
BELMONT 309,525,978 37,320,500 70,970,950 27,475 0
BENNINGTON 71,917,300 1,928,600 6,702,700 0 0
BENTON 15,179,600 1,189,800 17,000 0 0
BERLIN 229,915,842 2,001,400 48,715,300 20,351 0
BETHLEHEM 126,633,400 3,480,500 22,259,219 0 0
BOSCAWEN 137,588,700 8,382,000 24,150,100 0 0
BOW 460,112,225 0 87,549,975 14,600 0
BRADFORD 110,043,500 1,519,000 8,801,100 0 0
BRENTWOOD 268,830,632 2,147,500 45,173,730 15,750 0
BRIDGEWATER 155,254,400 2,652,800 7,599,600 0 0
BRISTOL 267,229,000 18,339,800 31,527,500 0 0
BROOKFIELD 62,513,322 38,100 954,600 0 0
BROOKLINE 329,643,100 1,184,900 15,108,500 0 0
CAMBRIDGE 2,251,880 6,730 110,450 0 0
CAMPTON 240,311,000 9,953,300 22,951,688 0 0
CANAAN 142,422,415 14,396,200 36,912,300 0 0
CANDIA 227,382,000 1,337,400 14,485,100 84,400 0
CANTERBURY 136,843,096 257,000 8,454,000 55,804 0
CARROLL 241,421,670 1,147,380 52,281,680 0 0
CENTER HARBOR 150,941,657 1,733,100 10,867,500 19,675 0
CHANDLER'S PURCHASE 0 0 11,050 0 0
CHARLESTOWN 157,401,842 22,948,200 30,132,058 39,700 0
CHATHAM 31,732,900 629,400 216,100 0 0
CHESTER 276,785,900 1,072,900 6,901,700 6,600 0
CHESTERFIELD 254,795,400 1,193,100 29,195,000 0 0
CHICHESTER 140,176,400 3,068,900 25,828,200 0 0
CLAREMONT 456,379,600 19,719,500 169,353,914 22,700 0
CLARKSVILLE 20,446,000 1,194,200 651,100 0 0
COLEBROOK 91,290,300 4,261,100 27,275,500 0 0
COLUMBIA 37,855,191 2,573,300 2,190,700 16,909 0
CONCORD 1,425,959,100 32,169,100 929,859,800 49,200 0
NH DRA 2012 Annual Report - Page 108

PUBLIC WATER
GAS ELECTRIC OIL OTHERMATURE WOOD TIMBER
TOTAL LOCAL ASSESSED VALUATION - PUBLIC UTILITIES
(PAGE 3 OF 4)
GROSS VALUATION
MODIFIED ASSESSED VALUATION
EDUCATIONAL SPECIAL
EXEMTPIONS
TABLES BY COUNTY - 2011
MUNICIPALITY
ACWORTH 0 0 1,342,032 0 0 0 94,987,762 0 94,987,762
ALBANY 78,900 0 741,600 0 0 0 103,800,381 0 103,800,381
ALEXANDRIA 0 0 17,187,100 0 0 0 201,848,914 0 201,848,914
ALLENSTOWN 0 2,576,900 5,739,140 0 0 0 269,262,744 0 269,262,744
ALSTEAD 0 0 2,807,800 0 0 0 179,106,027 0 179,106,027
ALTON 0 0 4,924,700 0 27,000 0 1,448,065,003 10,000 1,448,055,003
AMHERST 6,946,300 3,467,800 27,080,100 0 0 0 1,573,177,700 0 1,573,177,700
ANDOVER 0 0 12,755,500 0 0 0 268,594,901 150,000 268,444,901
ANTRIM 0 0 7,493,800 0 0 0 253,337,000 150,000 253,187,000
ASHLAND 0 0 5,838,730 0 0 0 265,058,592 0 265,058,592
ATKINSON 2,834,100 198,300 3,982,000 0 0 0 842,761,617 179,900 842,581,717
ATKINSON & GILMANTON 0 0 0 0 0 0 747,203 0 747,203
AUBURN 0 83,800 7,440,900 0 0 0 611,673,687 109,896 611,563,791
BARNSTEAD 2,421,219 0 3,321,400 0 0 0 465,101,733 212,700 464,889,033
BARRINGTON 0 0 14,323,100 0 0 0 915,679,185 0 915,679,185
BARTLETT 0 0 5,472,200 0 0 0 911,602,331 0 911,602,331
BATH 0 0 21,788,700 0 0 0 128,135,832 0 128,135,832
BEAN'S GRANT 0 0 462 0 0 0 462 0 462
BEAN'S PURCHASE 0 0 0 0 0 0 20,650 0 20,650
BEDFORD 4,340,288 1,830,300 31,026,400 0 0 0 3,377,155,751 742,000 3,376,413,751
BELMONT 357,800 1,473,600 7,339,900 0 0 0 734,429,960 0 734,429,960
BENNINGTON 0 0 965,800 0 1,873,900 0 114,395,879 0 114,395,879
BENTON 0 0 772,866 0 0 0 27,142,188 0 27,142,188
BERLIN 0 15,901,000 95,179,000 0 0 0 442,810,820 3,499,280 439,311,540
BETHLEHEM 54,996 0 4,841,500 0 226,900 0 232,942,333 150,000 232,792,333
BOSCAWEN 0 661,100 5,451,200 0 0 0 278,029,369 0 278,029,369
BOW 616,500 4,348,000 252,186,900 0 58,100 0 1,101,911,077 50,021,249 1,051,889,828
BRADFORD 0 0 4,127,500 0 0 0 218,951,498 0 218,951,498
BRENTWOOD 0 0 16,201,800 0 0 0 483,049,715 2,400 483,047,315
BRIDGEWATER 0 0 13,001,083 0 0 0 333,854,083 0 333,854,083
BRISTOL 0 0 19,034,900 0 0 0 470,498,169 0 470,498,169
BROOKFIELD 0 0 1,345,800 0 0 0 104,111,997 0 104,111,997
BROOKLINE 0 0 7,876,800 0 0 0 591,464,954 0 591,464,954
CAMBRIDGE 0 0 155,266 0 0 0 8,318,772 0 8,318,772
CAMPTON 25,616 0 7,968,082 0 0 0 408,651,078 0 408,651,078
CANAAN 0 0 7,941,300 0 0 0 322,529,726 150,000 322,379,726
CANDIA 0 0 4,501,982 0 0 0 408,698,890 0 408,698,890
CANTERBURY 0 439,000 4,277,300 0 0 0 244,272,766 4,000 244,268,766
CARROLL 415,960 0 2,294,620 0 0 0 399,514,406 0 399,514,406
CENTER HARBOR 0 0 1,273,442 0 0 0 474,737,481 997,200 473,740,281
CHANDLER'S PURCHASE 0 0 1,942 0 0 0 49,152 0 49,152
CHARLESTOWN 0 0 8,703,368 0 0 0 271,273,597 0 271,273,597
CHATHAM 0 0 597,000 0 0 0 51,636,272 0 51,636,272
CHESTER 103,900 0 21,565,800 0 0 0 468,538,800 150,000 468,388,800
CHESTERFIELD 0 0 4,130,814 0 0 0 562,766,614 0 562,766,614
CHICHESTER 0 0 4,305,500 0 0 0 298,165,520 704,555 297,460,965
CLAREMONT 0 0 14,726,700 0 0 0 786,086,894 124,900 785,961,994
CLARKSVILLE 0 0 919,600 0 0 0 40,859,992 0 40,859,992
COLEBROOK 0 9,975,000 5,963,600 0 0 0 190,272,312 0 190,272,312
COLUMBIA 0 19,117,000 1,824,800 0 0 0 85,334,027 0 85,334,027
CONCORD 0 31,262,300 134,078,600 0 0 0 3,724,134,400 9,007,850 3,715,126,550
NH DRA 2012 Annual Report - Page 109

NET VALUATION 2011
GROSS PROPERTY
TAXES
LESS VETERANS
CREDITS
EXEMPTIONS
(PAGE 4 OF 4)
NET TAX COMMITMENT
2011 RESIDENTS
TAX
2011 ACTUAL
TAX RATEBLIND ELDERLYLOCAL
OPTIONAL EXEMPTIONS
TABLES BY COUNTY - 2011
MUNICIPALITY
ACWORTH 30,000 244,700 0 94,713,062 2,003,601 6,800 1,996,801 021.19
ALBANY 0 158,800 0 103,641,581 1,113,133 24,500 1,088,633 010.76
ALEXANDRIA 30,000 1,086,000 127,500 200,605,414 4,442,857 39,550 4,403,307 022.37
ALLENSTOWN 45,000 2,088,300 0 267,129,444 7,807,432 127,369 7,680,063 029.30
ALSTEAD 0 197,200 0 178,908,827 3,739,668 5,350 3,734,318 020.94
ALTON 30,000 1,788,400 216,400 1,446,020,203 18,886,976 220,200 18,666,776 013.07
AMHERST 129,000 10,042,600 475,500 1,562,530,600 39,544,666 310,100 39,234,566 025.37
ANDOVER 0 280,000 90,000 268,074,901 4,887,283 68,600 4,818,683 018.34
ANTRIM 15,000 1,272,500 0 251,899,500 5,810,595 76,500 5,734,095 023.14
ASHLAND 60,000 743,333 0 264,255,259 5,301,386 29,550 5,271,836 020.11
ATKINSON 30,000 7,886,200 190,665 834,474,852 15,670,731 205,250 15,465,481 018.80
ATKINSON & GILMANTON 0 0 0 747,203 0 0 0 00.00
AUBURN 50,000 6,808,900 550,000 604,154,891 11,424,032 169,500 11,254,532 018.94
BARNSTEAD 30,000 985,000 0 463,874,033 10,853,580 169,150 10,684,430 023.43
BARRINGTON 75,000 8,046,300 1,336,000 906,221,885 18,798,633 232,300 18,566,333 020.78
BARTLETT 0 529,100 0 911,073,231 9,533,656 57,100 9,476,556 010.48
BATH 0 10,000 0 128,125,832 2,110,803 15,300 2,095,503 6,09016.92
BEAN'S GRANT 0 0 0 462 0 0 0 00.00
BEAN'S PURCHASE 0 0 0 20,650 0 0 0 00.00
BEDFORD 420,000 13,408,150 1,008,093 3,361,577,508 68,960,505 549,500 68,411,005 020.54
BELMONT 120,000 6,550,816 34,786 727,724,358 15,668,185 238,200 15,429,985 021.56
BENNINGTON 15,000 950,000 0 113,430,879 2,629,346 34,750 2,594,596 023.20
BENTON 0 15,000 0 27,127,188 406,705 1,350 405,355 015.06
BERLIN 120,000 2,966,000 0 436,225,540 13,583,974 95,325 13,488,649 031.70
BETHLEHEM 15,000 2,178,700 0 230,598,633 6,875,055 109,500 6,765,555 029.87
BOSCAWEN 45,000 1,034,900 0 276,949,469 5,816,707 29,200 5,787,507 021.05
BOW 386,900 8,759,200 865,931 1,041,877,797 27,727,502 188,000 27,539,502 027.15
BRADFORD 0 265,000 9,555 218,676,943 4,997,342 47,600 4,949,742 022.90
BRENTWOOD 125,000 1,012,000 250,000 481,660,315 11,045,253 57,900 10,987,353 023.01
BRIDGEWATER 0 220,000 0 333,634,083 3,253,403 5,250 3,248,153 09.85
BRISTOL 60,000 720,500 203,100 469,514,569 9,424,806 114,400 9,310,406 020.17
BROOKFIELD 120,000 0 90,000 103,901,997 1,631,055 10,300 1,620,755 015.73
BROOKLINE 15,000 3,363,000 672,000 587,414,954 14,128,490 85,000 14,043,490 024.08
CAMBRIDGE 0 0 0 8,318,772 0 0 0 00.00
CAMPTON 30,000 2,604,600 315,300 405,701,178 7,685,800 106,500 7,579,300 018.99
CANAAN 0 1,036,400 90,200 321,253,126 7,477,481 51,400 7,426,081 023.34
CANDIA 0 3,672,400 280,000 404,746,490 7,832,778 74,850 7,757,928 019.38
CANTERBURY 60,000 1,016,000 890,700 242,302,066 6,125,013 68,700 6,056,313 025.33
CARROLL 0 700,000 3,900 398,810,506 5,398,244 32,000 5,366,244 013.55
CENTER HARBOR 15,000 75,000 2,600 473,647,681 5,188,339 42,253 5,146,086 010.96
CHANDLER'S PURCHASE 0 0 0 49,152 0 0 0 00.00
CHARLESTOWN 45,000 786,600 105,000 270,336,997 7,420,880 137,600 7,283,280 027.53
CHATHAM 0 5,000 0 51,631,272 680,009 17,500 662,509 013.20
CHESTER 90,000 10,239,200 3,217,500 454,842,100 11,156,164 106,000 11,050,164 024.66
CHESTERFIELD 0 1,280,000 0 561,486,614 9,721,393 72,600 9,648,793 017.33
CHICHESTER 0 1,020,400 355,435 296,085,130 5,705,401 78,200 5,627,201 019.30
CLAREMONT 180,000 6,179,700 419,850 779,182,444 25,817,194 127,875 25,689,319 033.18
CLARKSVILLE 0 15,000 0 40,844,992 375,711 9,700 366,011 09.25
COLEBROOK 45,000 165,000 5,000 190,057,312 4,090,613 20,850 4,069,763 021.70
COLUMBIA 0 115,900 15,000 85,203,127 1,355,440 8,000 1,347,440 016.54
CONCORD 4,072,549 24,050,480 0 3,687,003,521 91,124,117 276,108 90,848,009 024.60
NH DRA 2012 Annual Report - Page 110

CURRENT USE
CONSERVATION RESTRICTION
DISCRETIONARY EASEMENT
DISCRETIONARY PRESERVATION
EASEMENT
RESIDENTIAL LAND
COMMERCIAL INDUSTRIAL
TOTAL LOCAL ASSESSED VALUATION - LAND
(PAGE 1 OF 4)
TABLES BY COUNTY - 2011
RSA 79-F FARM LAND
MUNICIPALITY
CONWAY 2,744,600 4,300 0 0 301,638,900 143,316,9000
CORNISH 3,365,345 0 0 1,800 64,371,100 635,6000
CRAWFORD'S PURCHASE 0 0 0 0 49,360 112,7500
CROYDON 1,143,709 0 0 0 35,927,300 1,264,9000
CUTT'S GRANT 0 0 0 0 0 00
DALTON 1,339,204 0 0 0 32,022,400 1,512,5000
DANBURY 1,662,030 0 0 0 37,782,614 1,140,6770
DANVILLE 337,754 23,336 0 0 98,498,800 3,816,8000
DEERFIELD 2,031,237 779 0 7,600 193,087,600 5,526,5000
DEERING 1,885,786 11,854 0 0 83,824,125 1,160,5000
DERRY 868,670 0 15,600 0 873,071,960 113,789,5400
DIX GRANT 364,446 0 0 0 116,000 00
DIXVILLE 927,507 0 0 0 862,720 2,373,8900
DORCHESTER 1,612,449 0 0 0 17,167,500 00
DOVER 879,440 0 0 0 630,070,060 164,918,8000
DUBLIN 1,226,699 47,154 0 4,800 90,193,900 8,571,4000
DUMMER 1,356,301 0 0 0 9,080,400 74,0000
DUNBARTON 1,028,031 0 0 0 79,607,200 1,285,2040
DURHAM 1,043,422 0 0 0 249,200,100 34,279,7440
EAST KINGSTON 358,678 108,477 0 0 95,698,600 1,891,5000
EASTON 379,369 0 0 0 28,061,600 126,1000
EATON 987,300 0 0 0 45,683,420 1,712,2800
EFFINGHAM 979,069 34,205 0 0 65,819,500 2,454,2000
ELLSWORTH 99,290 0 0 0 5,108,900 00
ENFIELD 1,211,233 0 0 0 221,071,800 17,040,1000
EPPING 879,800 0 0 0 179,651,600 43,718,3000
EPSOM 1,812,672 0 0 3,400 127,744,400 19,958,0000
ERROL 840,965 0 0 0 34,290,030 881,7200
ERVING'S GRANT 76,880 0 0 0 0 00
EXETER 297,538 0 2,600 0 376,964,700 109,257,6000
FARMINGTON 1,128,440 84,620 54,060 0 132,745,630 18,174,5000
FITZWILLIAM 1,452,858 30,567 0 13,650 90,606,025 3,927,3000
FRANCESTOWN 1,704,441 0 0 0 79,210,600 2,345,5000
FRANCONIA 715,655 8,360 0 0 92,045,500 7,386,4000
FRANKLIN 878,100 54,600 46,000 1,200 121,944,650 20,680,1000
FREEDOM 1,116,359 16,965 0 0 244,879,200 4,983,8000
FREMONT 780,889 0 0 100 114,815,992 6,618,6000
GILFORD 850,990 17,460 0 0 648,293,980 49,270,2500
GILMANTON 2,775,975 1,889 0 0 199,342,500 1,766,3000
GILSUM 887,846 2,762 0 0 19,473,600 1,020,1000
GOFFSTOWN 1,042,800 0 1,200 0 437,697,800 59,966,0000
GORHAM 350,500 0 0 0 42,498,400 29,083,9000
GOSHEN 904,486 23,966 0 0 28,673,233 941,2600
GRAFTON 1,681,266 0 0 0 47,036,000 470,1000
GRANTHAM 698,460 0 0 600 138,029,191 3,958,8000
GREENFIELD 1,379,285 3,690 0 0 56,379,600 2,117,5000
GREENLAND 410,200 0 98,800 0 246,884,200 36,696,8000
GREEN'S GRANT 0 0 0 0 0 2,005,5800
GREENVILLE 396,946 0 0 0 36,655,300 6,666,2000
GROTON 1,124,416 0 0 0 25,831,300 00
HADLEY'S PURCHASE 0 0 0 0 0 00
NH DRA 2012 Annual Report - Page 111

RESIDENTIAL MFG HOUSING COMMERCIAL INDUSTRIAL
DISCRETIONARY PRESERVATION
EASEMENT
TOTAL LOCAL ASSESSED VALUATION - BUILDINGS
(PAGE 2 OF 4)
TABLES BY COUNTY - 2011
RSA 79-F FARM STRUCTURES
MUNICIPALITY
CONWAY 637,740,200 14,346,300 270,886,900 0 0
CORNISH 109,082,533 2,210,800 2,854,200 55,967 0
CRAWFORD'S PURCHASE 0 0 0 0 0
CROYDON 49,539,100 1,536,100 3,258,100 0 0
CUTT'S GRANT 0 0 0 0 0
DALTON 48,581,300 5,494,700 899,900 0 0
DANBURY 59,835,542 3,174,300 4,085,192 0 0
DANVILLE 203,886,400 13,649,500 5,255,900 0 0
DEERFIELD 261,821,300 5,184,300 10,855,600 66,600 0
DEERING 95,980,135 4,522,500 4,338,100 0 0
DERRY 1,152,876,957 20,576,265 330,393,377 0 0
DIX GRANT 445,640 0 0 0 0
DIXVILLE 2,787,860 19,260 9,641,140 0 0
DORCHESTER 19,477,400 1,435,600 741,300 0 0
DOVER 1,267,410,100 26,527,900 513,741,600 0 0
DUBLIN 143,146,519 535,300 10,072,600 41,303 0
DUMMER 19,883,500 934,000 533,800 0 0
DUNBARTON 197,179,096 60,800 4,295,900 0 0
DURHAM 534,119,000 112,300 70,459,747 0 0
EAST KINGSTON 175,458,100 1,957,900 3,723,600 0 0
EASTON 36,245,500 0 314,300 0 0
EATON 51,071,500 53,370 2,983,770 0 0
EFFINGHAM 90,862,826 4,321,900 12,594,200 0 0
ELLSWORTH 7,747,200 120,500 251,800 0 0
ENFIELD 279,102,700 5,293,800 19,830,700 0 0
EPPING 295,947,000 17,033,100 75,823,100 0 0
EPSOM 194,531,795 19,363,900 36,651,900 54,886 0
ERROL 34,376,980 916,830 5,249,260 0 0
ERVING'S GRANT 0 0 0 0 0
EXETER 821,080,700 34,203,500 236,360,524 72,800 0
FARMINGTON 278,989,960 0 39,352,340 0 0
FITZWILLIAM 155,632,856 7,516,700 14,807,300 50,344 0
FRANCESTOWN 118,670,000 455,800 4,529,000 0 0
FRANCONIA 152,933,238 1,293,600 25,980,900 0 0
FRANKLIN 313,467,400 11,843,000 71,985,200 28,300 0
FREEDOM 208,444,336 17,929,900 7,217,700 20,064 0
FREMONT 211,013,400 8,353,500 17,461,100 12,100 0
GILFORD 694,152,790 16,233,000 110,994,400 0 0
GILMANTON 260,262,400 988,200 3,647,000 0 0
GILSUM 38,654,558 1,152,200 2,514,900 0 0
GOFFSTOWN 703,947,800 15,264,700 82,805,800 34,000 0
GORHAM 104,606,200 7,036,700 65,166,600 0 0
GOSHEN 40,879,070 1,900,960 1,277,290 0 0
GRAFTON 69,898,750 4,239,000 2,501,500 10,850 0
GRANTHAM 354,561,200 894,700 8,167,100 24,300 0
GREENFIELD 88,028,300 1,942,200 6,159,600 0 0
GREENLAND 283,208,900 8,700 87,665,800 0 0
GREEN'S GRANT 27,700 0 2,008,420 0 0
GREENVILLE 55,878,500 13,419,100 19,914,600 0 0
GROTON 33,271,600 3,016,300 756,700 0 0
HADLEY'S PURCHASE 0 0 0 0 0
NH DRA 2012 Annual Report - Page 112

PUBLIC WATER
GAS ELECTRIC OIL OTHERMATURE WOOD TIMBER
TOTAL LOCAL ASSESSED VALUATION - PUBLIC UTILITIES
(PAGE 3 OF 4)
GROSS VALUATION
MODIFIED ASSESSED VALUATION
EDUCATIONAL SPECIAL
EXEMTPIONS
TABLES BY COUNTY - 2011
MUNICIPALITY
CONWAY 1,218,900 0 22,066,965 0 0 0 1,393,963,965 0 1,393,963,965
CORNISH 0 0 4,516,800 0 0 0 187,094,145 0 187,094,145
CRAWFORD'S PURCHASE 0 0 347 0 0 0 162,457 0 162,457
CROYDON 0 0 1,760,200 0 0 0 94,429,409 0 94,429,409
CUTT'S GRANT 0 0 0 0 0 0 0 0 0
DALTON 0 0 3,712,704 0 0 0 93,562,708 0 93,562,708
DANBURY 0 0 1,580,799 0 0 0 109,261,154 0 109,261,154
DANVILLE 157,034 0 4,888,100 0 76,400 0 330,590,024 0 330,590,024
DEERFIELD 0 0 58,848,400 0 0 0 537,429,916 0 537,429,916
DEERING 0 0 10,236,200 0 0 0 201,959,200 0 201,959,200
DERRY 2,292,600 1,735,400 20,115,500 0 42,900 0 2,515,778,769 0 2,515,778,769
DIX GRANT 0 0 0 0 0 0 926,086 0 926,086
DIXVILLE 0 0 78,808 0 0 0 16,691,185 0 16,691,185
DORCHESTER 0 0 486,200 0 0 0 40,920,449 0 40,920,449
DOVER 0 13,978,300 24,624,800 0 0 0 2,642,151,000 341,500 2,641,809,500
DUBLIN 0 0 3,195,700 0 0 0 257,035,375 300,000 256,735,375
DUMMER 0 8,981,100 14,525,600 0 0 0 55,368,701 0 55,368,701
DUNBARTON 0 0 21,971,000 0 0 0 305,427,231 0 305,427,231
DURHAM 0 3,461,616 9,257,014 0 0 0 901,932,943 0 901,932,943
EAST KINGSTON 395,500 15,885,600 3,798,900 0 0 0 299,276,855 0 299,276,855
EASTON 0 0 600,188 0 0 0 65,727,057 0 65,727,057
EATON 0 0 805,460 0 0 0 103,297,100 0 103,297,100
EFFINGHAM 0 0 4,213,000 0 0 0 181,278,900 173,000 181,105,900
ELLSWORTH 0 0 348,800 0 0 0 13,676,490 148,200 13,528,290
ENFIELD 0 0 2,788,400 0 0 0 546,338,733 0 546,338,733
EPPING 221,000 0 10,914,900 0 0 0 624,188,800 0 624,188,800
EPSOM 0 0 6,617,400 0 0 0 406,738,353 0 406,738,353
ERROL 0 0 9,333,000 0 0 0 85,888,785 0 85,888,785
ERVING'S GRANT 0 0 0 0 0 0 76,880 0 76,880
EXETER 73,615 14,136,663 11,862,453 0 0 0 1,604,312,693 823,400 1,603,489,293
FARMINGTON 0 0 5,498,603 0 0 0 476,028,153 0 476,028,153
FITZWILLIAM 0 0 34,892,700 0 0 0 308,930,300 267,300 308,663,000
FRANCESTOWN 0 0 3,168,100 0 0 0 210,083,441 0 210,083,441
FRANCONIA 0 0 3,675,000 0 0 0 284,038,653 0 284,038,653
FRANKLIN 0 2,438,700 26,246,300 0 117,000 0 569,730,550 0 569,730,550
FREEDOM 124,100 0 3,094,300 0 0 0 487,826,724 0 487,826,724
FREMONT 6,000 0 5,982,900 0 0 0 365,044,581 0 365,044,581
GILFORD 263,140 436,000 6,261,100 0 0 0 1,526,773,110 194,640 1,526,578,470
GILMANTON 0 0 7,712,400 0 0 0 476,496,664 3,400 476,493,264
GILSUM 0 0 1,744,900 0 0 0 65,450,866 0 65,450,866
GOFFSTOWN 0 1,521,900 34,717,500 0 0 0 1,336,999,500 525,400 1,336,474,100
GORHAM 0 13,323,000 43,003,100 5,725,600 0 0 310,794,000 6,400 310,787,600
GOSHEN 0 0 689,981 0 0 0 75,290,246 0 75,290,246
GRAFTON 0 0 2,711,900 0 0 0 128,549,366 0 128,549,366
GRANTHAM 482,700 0 4,560,900 0 0 0 511,377,951 286,000 511,091,951
GREENFIELD 0 0 2,728,700 0 0 0 158,738,875 468,700 158,270,175
GREENLAND 0 8,660,127 8,219,400 0 0 0 671,852,927 0 671,852,927
GREEN'S GRANT 0 0 45,420 0 7,993 0 4,095,113 0 4,095,113
GREENVILLE 0 0 3,860,100 0 0 0 136,790,746 0 136,790,746
GROTON 0 0 10,774,800 0 0 0 74,775,116 0 74,775,116
HADLEY'S PURCHASE 0 0 0 0 0 0 0 0 0
NH DRA 2012 Annual Report - Page 113

NET VALUATION 2011
GROSS PROPERTY
TAXES
LESS VETERANS
CREDITS
EXEMPTIONS
(PAGE 4 OF 4)
NET TAX COMMITMENT
2011 RESIDENTS
TAX
2011 ACTUAL
TAX RATEBLIND ELDERLYLOCAL
OPTIONAL EXEMPTIONS
TABLES BY COUNTY - 2011
MUNICIPALITY
CONWAY 125,000 4,018,400 391,300 1,389,429,265 23,839,038 294,196 23,544,842 017.20
CORNISH 45,000 1,035,000 0 186,014,145 3,587,487 46,000 3,541,487 019.34
CRAWFORD'S PURCHASE 0 0 0 162,457 0 0 0 00.00
CROYDON 0 210,000 0 94,219,409 1,215,829 4,800 1,211,029 012.95
CUTT'S GRANT 0 0 0 0 0 0 0 00.00
DALTON 0 205,900 0 93,356,808 1,725,585 36,700 1,688,885 018.58
DANBURY 45,000 370,000 15,000 108,831,154 2,766,288 18,867 2,747,421 025.46
DANVILLE 75,000 3,841,150 0 326,673,874 9,081,232 107,500 8,973,732 027.84
DEERFIELD 15,000 2,766,600 0 534,648,316 11,335,209 93,500 11,241,709 021.45
DEERING 15,000 3,316,700 0 198,627,500 5,171,221 57,100 5,114,121 026.16
DERRY 594,100 29,186,575 0 2,485,998,094 67,733,051 388,700 67,344,351 027.27
DIX GRANT 0 0 0 926,086 0 0 0 00.00
DIXVILLE 0 0 0 16,691,185 50,554 0 50,554 03.04
DORCHESTER 0 18,000 0 40,902,449 841,502 11,100 830,402 020.60
DOVER 2,033,000 42,354,900 4,815,000 2,592,606,600 65,029,771 679,656 64,350,115 025.12
DUBLIN 30,000 70,000 7,425 256,627,950 5,776,981 37,900 5,739,081 022.54
DUMMER 0 360,000 0 55,008,701 996,681 6,750 989,931 019.11
DUNBARTON 0 341,650 0 305,085,581 6,487,206 62,800 6,424,406 021.44
DURHAM 180,000 3,275,000 305,774 898,172,169 25,298,820 68,200 25,230,620 028.20
EAST KINGSTON 45,000 30,200 0 299,201,655 6,892,504 84,300 6,808,204 023.19
EASTON 0 0 0 65,727,057 710,419 2,950 707,469 010.83
EATON 0 0 0 103,297,100 1,171,457 19,500 1,151,957 011.36
EFFINGHAM 0 235,000 26,767 180,844,133 3,454,736 47,125 3,407,611 019.16
ELLSWORTH 0 0 0 13,528,290 179,613 400 179,213 013.34
ENFIELD 15,000 1,623,300 300,000 544,400,433 11,213,067 54,600 11,158,467 020.61
EPPING 60,000 5,711,600 0 618,417,200 14,982,705 145,000 14,837,705 024.27
EPSOM 45,000 740,300 436,300 405,516,753 8,764,616 146,750 8,617,866 021.65
ERROL 0 0 0 85,888,785 878,780 3,300 875,480 010.50
ERVING'S GRANT 0 0 0 76,880 0 0 0 00.00
EXETER 120,000 36,331,443 2,661,600 1,564,376,250 39,483,293 358,700 39,124,593 025.28
FARMINGTON 45,000 6,080,850 10,000 469,892,303 9,384,925 228,500 9,156,425 020.00
FITZWILLIAM 15,000 1,480,400 300,000 306,867,600 7,474,693 104,000 7,370,693 024.59
FRANCESTOWN 0 280,000 0 209,803,441 4,345,533 49,700 4,295,833 020.75
FRANCONIA 0 130,000 93,431 283,815,222 4,614,126 23,000 4,591,126 016.29
FRANKLIN 60,000 5,548,800 0 564,121,750 12,069,335 113,367 11,955,968 021.52
FREEDOM 0 523,000 20,000 487,283,724 5,590,940 35,800 5,555,140 011.49
FREMONT 15,000 1,613,333 150,000 363,266,248 9,892,077 96,500 9,795,577 027.27
GILFORD 60,000 3,800,700 0 1,522,717,770 28,227,344 288,500 27,938,844 018.55
GILMANTON 15,000 2,256,700 155,300 474,066,264 11,126,633 130,500 10,996,133 023.51
GILSUM 15,000 370,000 0 65,065,866 1,684,219 3,900 1,680,319 025.95
GOFFSTOWN 150,000 14,065,000 0 1,322,259,100 31,867,680 448,750 31,418,930 024.17
GORHAM 75,000 2,012,300 77,600 308,622,700 8,128,989 15,100 8,113,889 026.80
GOSHEN 15,000 60,000 0 75,215,246 1,635,090 24,100 1,610,990 021.76
GRAFTON 0 165,000 70,000 128,314,366 2,294,413 56,000 2,238,413 017.93
GRANTHAM 0 360,000 0 510,731,951 9,844,619 87,200 9,757,419 019.30
GREENFIELD 15,000 320,000 0 157,935,175 3,297,837 21,000 3,276,837 020.92
GREENLAND 45,000 3,200,000 50,000 668,557,927 9,155,537 127,500 9,028,037 013.75
GREEN'S GRANT 0 0 0 4,095,113 27,861 0 27,861 06.83
GREENVILLE 45,000 411,100 0 136,334,646 2,798,521 48,000 2,750,521 020.59
GROTON 0 40,000 0 74,735,116 888,899 20,500 868,399 012.24
HADLEY'S PURCHASE 0 0 0 0 0 0 0 00.00
NH DRA 2012 Annual Report - Page 114

CURRENT USE
CONSERVATION RESTRICTION
DISCRETIONARY EASEMENT
DISCRETIONARY PRESERVATION
EASEMENT
RESIDENTIAL LAND
COMMERCIAL INDUSTRIAL
TOTAL LOCAL ASSESSED VALUATION - LAND
(PAGE 1 OF 4)
TABLES BY COUNTY - 2011
RSA 79-F FARM LAND
MUNICIPALITY
HALE'S LOCATION 0 0 0 0 28,855,700 1,073,4000
HAMPSTEAD 101,959 0 0 2,100 269,223,500 38,546,5000
HAMPTON 91,000 35,500 0 4,800 920,355,275 147,648,5250
HAMPTON FALLS 505,200 0 0 3,900 170,159,900 12,345,1000
HANCOCK 1,039,926 0 0 0 84,027,000 1,034,7000
HANOVER 1,760,600 3,100 0 5,200 524,581,300 105,754,8000
HARRISVILLE 659,950 123,293 0 0 101,549,500 1,213,4000
HART'S LOCATION 4,067 0 0 0 6,444,400 223,0000
HAVERHILL 3,717,169 0 0 3,000 55,269,000 12,705,8000
HEBRON 210,478 0 0 0 145,572,000 2,402,3000
HENNIKER 1,675,524 0 0 13,395 143,901,815 18,832,4100
HILL 1,163,454 8,852 0 0 37,129,000 377,5000
HILLSBOROUGH 1,831,178 108,956 0 0 199,829,395 21,974,3060
HINSDALE 1,006,210 0 0 0 59,833,276 17,364,6240
HOLDERNESS 882,951 26,219 0 0 371,896,990 25,600,1100
HOLLIS 1,157,070 0 0 170,000 430,204,700 15,312,7000
HOOKSETT 556,071 0 0 0 422,461,973 139,990,2800
HOPKINTON 2,030,249 267,144 16,168 2,850 202,498,900 7,826,9660
HUDSON 506,513 0 807 0 849,121,217 171,052,3450
JACKSON 536,346 54,522 0 0 127,490,900 6,897,4000
JAFFREY 1,484,939 62,868 0 0 127,447,562 16,680,9550
JEFFERSON 1,349,549 4,710 0 0 31,177,000 2,024,1000
KEENE 1,173,900 0 0 0 343,572,600 175,733,9000
KENSINGTON 773,988 88,855 0 1,800 146,571,500 2,133,5000
KILKENNY 0 0 0 0 0 00
KINGSTON 449,475 0 0 0 304,431,100 31,053,1000
LACONIA 462,397 12,597 0 0 498,628,505 91,795,0750
LANCASTER 2,910,170 600 0 13,130 55,301,280 17,312,1100
LANDAFF 1,307,938 0 0 0 15,840,400 238,7000
LANGDON 1,017,169 0 0 0 19,623,631 1,327,6100
LEBANON 1,093,960 0 0 0 307,014,612 285,917,8390
LEE 913,178 184,771 0 8,000 114,222,400 15,829,1000
LEMPSTER 1,590,852 29,976 0 0 41,298,200 861,4000
LINCOLN 85,200 0 0 0 155,336,600 38,376,0000
LISBON 1,644,921 0 0 0 28,096,100 2,017,8000
LITCHFIELD 429,598 2,053 0 0 297,115,200 10,906,2000
LITTLETON 1,524,400 0 0 0 91,973,400 59,557,8000
LIVERMORE 0 0 0 0 117,040 00
LONDONDERRY 766,015 0 284,200 21,400 668,211,542 179,299,2580
LOUDON 2,189,595 22,290 10,770 300 160,615,600 29,379,8000
LOW & BURBANK GRANT 0 0 0 0 0 00
LYMAN 1,645,668 0 0 0 17,274,100 235,0000
LYME 2,539,000 20,000 0 30,800 116,903,200 5,816,9000
LYNDEBOROUGH 1,417,730 0 0 30,628 60,673,600 3,054,7000
MADBURY 660,273 33,437 0 0 85,054,300 7,131,3000
MADISON 1,573,559 0 0 0 183,971,700 7,829,7000
MANCHESTER 118,800 0 0 0 1,484,125,133 597,342,2670
MARLBOROUGH 1,224,260 0 520 0 44,081,800 7,064,5400
MARLOW 1,028,260 0 0 0 24,633,830 493,8600
MARTIN'S LOCATION 0 0 0 0 0 00
MASON 1,011,216 16,485 0 0 51,746,100 00
NH DRA 2012 Annual Report - Page 115

RESIDENTIAL MFG HOUSING COMMERCIAL INDUSTRIAL
DISCRETIONARY PRESERVATION
EASEMENT
TOTAL LOCAL ASSESSED VALUATION - BUILDINGS
(PAGE 2 OF 4)
TABLES BY COUNTY - 2011
RSA 79-F FARM STRUCTURES
MUNICIPALITY
HALE'S LOCATION 38,624,500 0 5,338,200 0 0
HAMPSTEAD 569,406,446 31,015,900 81,556,800 16,754 0
HAMPTON 1,329,279,775 14,534,300 228,572,225 197,300 0
HAMPTON FALLS 216,743,700 82,800 25,269,700 11,800 0
HANCOCK 146,903,800 459,400 2,858,600 0 0
HANOVER 923,104,000 0 408,719,700 35,600 0
HARRISVILLE 100,949,516 997,700 4,203,100 0 0
HART'S LOCATION 7,525,400 0 1,302,000 0 0
HAVERHILL 192,837,679 15,209,000 49,114,300 48,621 0
HEBRON 104,924,900 292,000 3,490,500 0 0
HENNIKER 177,616,700 2,706,900 33,530,300 65,025 0
HILL 56,090,853 2,496,400 905,700 0 0
HILLSBOROUGH 281,510,204 7,328,600 66,185,400 5,012 0
HINSDALE 123,824,694 26,874,600 41,829,486 0 0
HOLDERNESS 252,577,600 6,921,200 29,571,061 0 0
HOLLIS 749,416,100 4,918,400 40,528,600 456,300 0
HOOKSETT 707,064,627 22,806,900 305,463,124 0 0
HOPKINTON 365,191,400 14,714,800 36,733,000 61,800 0
HUDSON 1,465,316,526 10,537,600 330,888,858 0 0
JACKSON 221,068,000 103,300 28,141,000 0 0
JAFFREY 274,469,772 4,248,310 24,108,911 0 0
JEFFERSON 71,368,200 3,371,200 10,064,200 0 0
KEENE 798,417,800 6,104,000 490,647,000 0 0
KENSINGTON 180,378,420 931,500 5,747,400 155,680 0
KILKENNY 0 0 0 0 0
KINGSTON 317,849,395 3,937,800 44,352,200 44,305 0
LACONIA 1,018,316,931 24,732,159 222,357,340 0 0
LANCASTER 146,325,420 3,153,710 46,288,440 23,750 0
LANDAFF 30,698,500 691,800 200,600 0 0
LANGDON 34,983,000 785,300 1,987,200 0 0
LEBANON 713,520,307 5,702,400 448,854,713 0 0
LEE 242,362,032 5,541,600 34,357,100 46,968 0
LEMPSTER 65,880,100 4,607,000 4,164,700 0 0
LINCOLN 469,851,930 2,426,740 74,341,830 0 0
LISBON 55,934,780 3,598,100 17,749,000 17,578 0
LITCHFIELD 447,402,900 4,376,500 18,376,200 0 0
LITTLETON 247,859,600 10,157,800 123,239,900 0 0
LIVERMORE 28,040 0 0 0 0
LONDONDERRY 1,621,329,634 16,549,900 388,910,266 58,000 0
LOUDON 252,404,424 16,764,700 56,241,800 72,676 0
LOW & BURBANK GRANT 0 0 0 0 0
LYMAN 37,847,800 1,418,800 1,303,200 0 0
LYME 181,737,100 991,400 13,218,600 99,300 0
LYNDEBOROUGH 95,310,200 1,474,400 2,293,000 53,900 0
MADBURY 122,398,300 2,731,300 4,438,300 0 0
MADISON 238,260,800 2,324,000 14,211,700 0 0
MANCHESTER 3,789,451,943 2,392,700 2,361,516,257 0 0
MARLBOROUGH 109,982,867 971,690 15,903,500 45,683 0
MARLOW 34,717,470 970,090 2,174,050 0 0
MARTIN'S LOCATION 0 0 0 0 0
MASON 105,873,700 618,200 389,300 0 0
NH DRA 2012 Annual Report - Page 116

PUBLIC WATER
GAS ELECTRIC OIL OTHERMATURE WOOD TIMBER
TOTAL LOCAL ASSESSED VALUATION - PUBLIC UTILITIES
(PAGE 3 OF 4)
GROSS VALUATION
MODIFIED ASSESSED VALUATION
EDUCATIONAL SPECIAL
EXEMTPIONS
TABLES BY COUNTY - 2011
MUNICIPALITY
HALE'S LOCATION 0 0 128,100 0 0 0 74,019,900 0 74,019,900
HAMPSTEAD 2,964,100 0 8,683,400 0 0 0 1,001,517,459 0 1,001,517,459
HAMPTON 14,563,200 18,705,100 76,927,500 0 0 0 2,750,914,500 0 2,750,914,500
HAMPTON FALLS 0 29,000 9,621,800 0 0 0 434,772,900 0 434,772,900
HANCOCK 0 0 5,708,600 0 0 0 242,032,026 0 242,032,026
HANOVER 0 0 12,400,800 0 0 0 1,976,365,100 150,000 1,976,215,100
HARRISVILLE 0 0 2,253,500 0 0 0 211,949,959 0 211,949,959
HART'S LOCATION 0 0 237,333 0 0 0 15,736,200 0 15,736,200
HAVERHILL 0 0 24,250,400 0 0 0 353,154,969 0 353,154,969
HEBRON 0 0 4,223,000 0 0 0 261,115,178 0 261,115,178
HENNIKER 0 0 10,035,800 0 0 0 388,377,869 227,570 388,150,299
HILL 0 0 9,118,600 0 0 0 107,290,359 0 107,290,359
HILLSBOROUGH 0 0 28,500,200 0 0 0 607,273,251 0 607,273,251
HINSDALE 0 0 100,688,000 0 0 0 371,420,890 0 371,420,890
HOLDERNESS 0 0 3,822,300 0 0 0 691,298,431 600,000 690,698,431
HOLLIS 250,500 107,900 6,405,000 0 0 0 1,248,927,270 440,600 1,248,486,670
HOOKSETT 289,200 15,364,100 42,304,600 0 0 0 1,656,300,875 150,000 1,656,150,875
HOPKINTON 0 0 22,875,900 0 0 0 652,219,177 5,182 652,213,995
HUDSON 0 20,712,100 97,909,300 0 0 0 2,946,045,266 916,300 2,945,128,966
JACKSON 0 0 1,391,600 0 0 0 385,683,068 0 385,683,068
JAFFREY 0 0 5,293,549 0 0 0 453,796,866 0 453,796,866
JEFFERSON 0 0 1,482,900 2,677,500 0 0 123,519,359 0 123,519,359
KEENE 0 1,121,000 49,832,700 0 0 0 1,866,602,900 9,100 1,866,593,800
KENSINGTON 0 1,377,100 10,037,720 0 0 0 348,197,463 0 348,197,463
KILKENNY 0 0 11,747 0 0 0 11,747 0 11,747
KINGSTON 98,500 0 11,159,280 0 0 0 713,375,155 334,600 713,040,555
LACONIA 72,700 7,075,100 13,557,500 0 0 1,897 1,877,012,201 0 1,877,012,201
LANCASTER 0 0 7,389,600 6,700,000 0 0 285,418,210 0 285,418,210
LANDAFF 0 0 2,003,200 0 0 0 50,981,138 0 50,981,138
LANGDON 0 0 739,700 0 0 0 60,463,610 0 60,463,610
LEBANON 0 0 89,848,600 0 0 0 1,851,952,431 562,500 1,851,389,931
LEE 68,900 0 4,106,900 0 0 0 417,640,949 238,600 417,402,349
LEMPSTER 0 0 47,861,100 0 0 0 166,293,328 0 166,293,328
LINCOLN 0 0 9,378,700 0 0 0 749,797,000 0 749,797,000
LISBON 0 0 2,356,000 0 0 0 111,414,279 0 111,414,279
LITCHFIELD 9,051,900 455,100 22,245,700 0 0 0 810,361,351 35,600 810,325,751
LITTLETON 0 0 221,608,900 0 0 0 755,921,800 0 755,921,800
LIVERMORE 0 0 0 0 0 0 145,080 0 145,080
LONDONDERRY 7,510,000 37,150,000 478,717,304 0 0 0 3,398,807,519 0 3,398,807,519
LOUDON 0 3,058,000 8,690,200 0 0 0 529,450,155 43,800 529,406,355
LOW & BURBANK GRANT 0 0 0 0 0 0 0 0 0
LYMAN 0 0 970,000 0 0 0 60,694,568 0 60,694,568
LYME 0 0 4,050,900 0 0 0 325,407,200 0 325,407,200
LYNDEBOROUGH 0 0 1,772,500 0 0 0 166,080,658 3,500 166,077,158
MADBURY 0 268,700 11,815,600 0 0 0 234,531,510 370,000 234,161,510
MADISON 0 0 9,612,900 0 0 0 457,784,359 0 457,784,359
MANCHESTER 664,600 54,298,600 125,175,500 0 0 0 8,415,085,800 150,000 8,414,935,800
MARLBOROUGH 0 0 4,099,940 0 0 0 183,374,800 526,730 182,848,070
MARLOW 0 0 917,624 0 0 0 64,935,184 0 64,935,184
MARTIN'S LOCATION 0 0 36,618 0 0 0 36,618 0 36,618
MASON 0 0 1,760,100 0 0 0 161,415,101 0 161,415,101
NH DRA 2012 Annual Report - Page 117
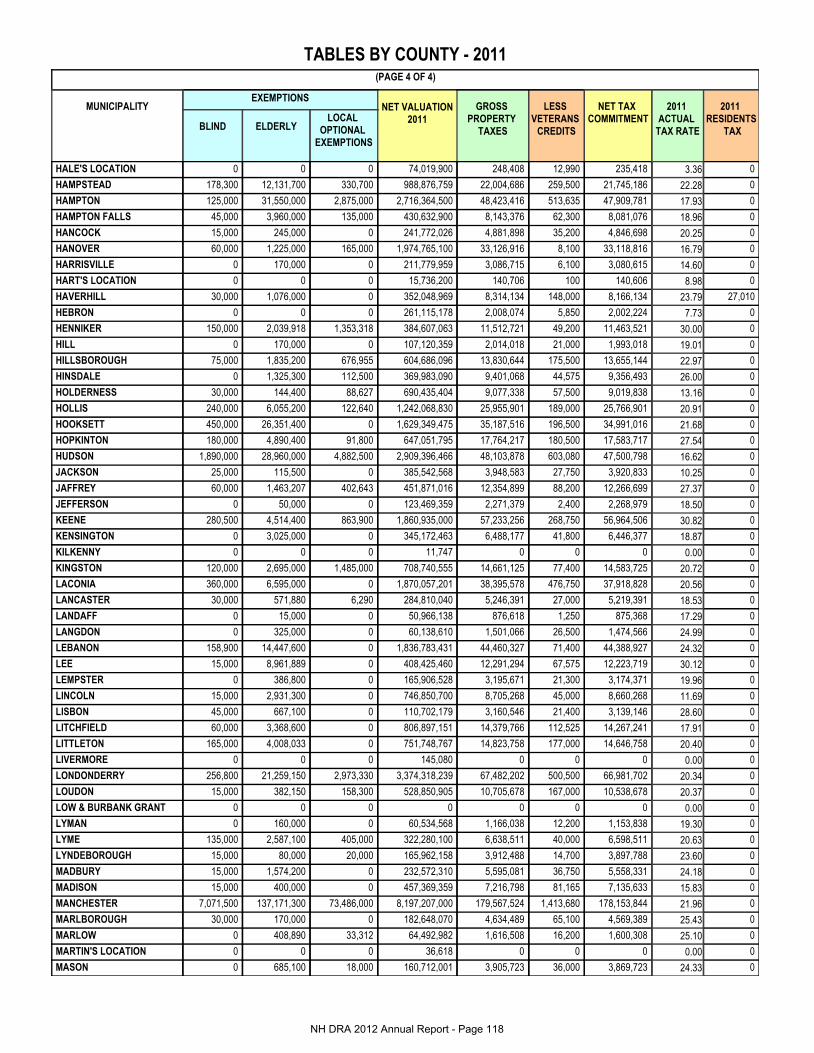
NET VALUATION 2011
GROSS PROPERTY
TAXES
LESS VETERANS
CREDITS
EXEMPTIONS
(PAGE 4 OF 4)
NET TAX COMMITMENT
2011 RESIDENTS
TAX
2011 ACTUAL
TAX RATEBLIND ELDERLYLOCAL
OPTIONAL EXEMPTIONS
TABLES BY COUNTY - 2011
MUNICIPALITY
HALE'S LOCATION 0 0 0 74,019,900 248,408 12,990 235,418 03.36
HAMPSTEAD 178,300 12,131,700 330,700 988,876,759 22,004,686 259,500 21,745,186 022.28
HAMPTON 125,000 31,550,000 2,875,000 2,716,364,500 48,423,416 513,635 47,909,781 017.93
HAMPTON FALLS 45,000 3,960,000 135,000 430,632,900 8,143,376 62,300 8,081,076 018.96
HANCOCK 15,000 245,000 0 241,772,026 4,881,898 35,200 4,846,698 020.25
HANOVER 60,000 1,225,000 165,000 1,974,765,100 33,126,916 8,100 33,118,816 016.79
HARRISVILLE 0 170,000 0 211,779,959 3,086,715 6,100 3,080,615 014.60
HART'S LOCATION 0 0 0 15,736,200 140,706 100 140,606 08.98
HAVERHILL 30,000 1,076,000 0 352,048,969 8,314,134 148,000 8,166,134 27,01023.79
HEBRON 0 0 0 261,115,178 2,008,074 5,850 2,002,224 07.73
HENNIKER 150,000 2,039,918 1,353,318 384,607,063 11,512,721 49,200 11,463,521 030.00
HILL 0 170,000 0 107,120,359 2,014,018 21,000 1,993,018 019.01
HILLSBOROUGH 75,000 1,835,200 676,955 604,686,096 13,830,644 175,500 13,655,144 022.97
HINSDALE 0 1,325,300 112,500 369,983,090 9,401,068 44,575 9,356,493 026.00
HOLDERNESS 30,000 144,400 88,627 690,435,404 9,077,338 57,500 9,019,838 013.16
HOLLIS 240,000 6,055,200 122,640 1,242,068,830 25,955,901 189,000 25,766,901 020.91
HOOKSETT 450,000 26,351,400 0 1,629,349,475 35,187,516 196,500 34,991,016 021.68
HOPKINTON 180,000 4,890,400 91,800 647,051,795 17,764,217 180,500 17,583,717 027.54
HUDSON 1,890,000 28,960,000 4,882,500 2,909,396,466 48,103,878 603,080 47,500,798 016.62
JACKSON 25,000 115,500 0 385,542,568 3,948,583 27,750 3,920,833 010.25
JAFFREY 60,000 1,463,207 402,643 451,871,016 12,354,899 88,200 12,266,699 027.37
JEFFERSON 0 50,000 0 123,469,359 2,271,379 2,400 2,268,979 018.50
KEENE 280,500 4,514,400 863,900 1,860,935,000 57,233,256 268,750 56,964,506 030.82
KENSINGTON 0 3,025,000 0 345,172,463 6,488,177 41,800 6,446,377 018.87
KILKENNY 0 0 0 11,747 0 0 0 00.00
KINGSTON 120,000 2,695,000 1,485,000 708,740,555 14,661,125 77,400 14,583,725 020.72
LACONIA 360,000 6,595,000 0 1,870,057,201 38,395,578 476,750 37,918,828 020.56
LANCASTER 30,000 571,880 6,290 284,810,040 5,246,391 27,000 5,219,391 018.53
LANDAFF 0 15,000 0 50,966,138 876,618 1,250 875,368 017.29
LANGDON 0 325,000 0 60,138,610 1,501,066 26,500 1,474,566 024.99
LEBANON 158,900 14,447,600 0 1,836,783,431 44,460,327 71,400 44,388,927 024.32
LEE 15,000 8,961,889 0 408,425,460 12,291,294 67,575 12,223,719 030.12
LEMPSTER 0 386,800 0 165,906,528 3,195,671 21,300 3,174,371 019.96
LINCOLN 15,000 2,931,300 0 746,850,700 8,705,268 45,000 8,660,268 011.69
LISBON 45,000 667,100 0 110,702,179 3,160,546 21,400 3,139,146 028.60
LITCHFIELD 60,000 3,368,600 0 806,897,151 14,379,766 112,525 14,267,241 017.91
LITTLETON 165,000 4,008,033 0 751,748,767 14,823,758 177,000 14,646,758 020.40
LIVERMORE 0 0 0 145,080 0 0 0 00.00
LONDONDERRY 256,800 21,259,150 2,973,330 3,374,318,239 67,482,202 500,500 66,981,702 020.34
LOUDON 15,000 382,150 158,300 528,850,905 10,705,678 167,000 10,538,678 020.37
LOW & BURBANK GRANT 0 0 0 0 0 0 0 00.00
LYMAN 0 160,000 0 60,534,568 1,166,038 12,200 1,153,838 019.30
LYME 135,000 2,587,100 405,000 322,280,100 6,638,511 40,000 6,598,511 020.63
LYNDEBOROUGH 15,000 80,000 20,000 165,962,158 3,912,488 14,700 3,897,788 023.60
MADBURY 15,000 1,574,200 0 232,572,310 5,595,081 36,750 5,558,331 024.18
MADISON 15,000 400,000 0 457,369,359 7,216,798 81,165 7,135,633 015.83
MANCHESTER 7,071,500 137,171,300 73,486,000 8,197,207,000 179,567,524 1,413,680 178,153,844 021.96
MARLBOROUGH 30,000 170,000 0 182,648,070 4,634,489 65,100 4,569,389 025.43
MARLOW 0 408,890 33,312 64,492,982 1,616,508 16,200 1,600,308 025.10
MARTIN'S LOCATION 0 0 0 36,618 0 0 0 00.00
MASON 0 685,100 18,000 160,712,001 3,905,723 36,000 3,869,723 024.33
NH DRA 2012 Annual Report - Page 118

CURRENT USE
CONSERVATION RESTRICTION
DISCRETIONARY EASEMENT
DISCRETIONARY PRESERVATION
EASEMENT
RESIDENTIAL LAND
COMMERCIAL INDUSTRIAL
TOTAL LOCAL ASSESSED VALUATION - LAND
(PAGE 1 OF 4)
TABLES BY COUNTY - 2011
RSA 79-F FARM LAND
MUNICIPALITY
MEREDITH 1,113,911 0 0 0 894,447,039 58,534,3610
MERRIMACK 480,709 0 0 300 911,652,700 166,019,8000
MIDDLETON 494,847 0 0 0 74,099,400 1,184,4000
MILAN 1,739,399 7,478 0 0 35,801,400 1,035,3000
MILFORD 753,803 0 0 6,500 256,926,765 66,404,3357,800
MILLSFIELD 840,567 0 0 0 2,377,950 208,0000
MILTON 1,318,345 19,079 0 900 118,074,800 5,943,8000
MONROE 890,187 0 0 0 24,154,700 996,6000
MONT VERNON 681,100 0 350 0 93,466,970 1,433,8900
MOULTONBOROUGH 819,402 9,306 0 6,400 1,670,500,400 36,384,6000
NASHUA 107,428 0 0 1,200 1,406,770,885 812,821,0800
NELSON 839,260 53,396 0 0 62,311,861 00
NEW BOSTON 1,719,547 0 0 2,000 191,114,050 7,404,9000
NEW CASTLE 182 11,962 387 0 379,821,300 15,637,0000
NEW DURHAM 1,196,104 9,516 0 1,800 216,232,830 2,619,4700
NEW HAMPTON 1,509,284 360 0 0 115,735,500 13,578,2500
NEW IPSWICH 1,601,471 193,798 2,699 0 142,561,100 7,181,6000
NEW LONDON 867,332 2,936 0 0 446,563,955 23,505,3450
NEWBURY 878,239 0 0 0 364,533,140 8,572,960654
NEWFIELDS 216,113 68,638 8,426 0 118,812,800 10,663,8000
NEWINGTON 112,840 14 0 0 69,007,570 94,619,7000
NEWMARKET 500,264 878 0 0 170,487,121 40,649,5690
NEWPORT 2,146,603 0 155,951 0 129,058,900 31,467,7000
NEWTON 268,184 12,365 0 0 154,145,800 10,577,2000
NORTH HAMPTON 315,500 800 22,900 1,500 358,452,400 58,889,1000
NORTHFIELD 1,332,147 4,032 0 0 110,654,081 8,574,6000
NORTHUMBERLAND 1,260,677 27,770 0 0 23,268,400 3,661,6000
NORTHWOOD 1,039,131 0 0 0 231,989,400 19,225,5000
NOTTINGHAM 1,543,644 0 0 0 208,380,400 2,610,5000
ODELL 485,578 0 0 0 52,500 00
ORANGE 797,523 0 0 0 8,036,900 199,0000
ORFORD 1,930,310 31,416 0 0 46,098,200 3,427,7000
OSSIPEE 1,980,177 0 0 0 285,650,700 36,303,3000
PELHAM 493,448 0 0 0 544,296,238 40,126,4200
PEMBROKE 1,469,934 1,436 69,845 0 159,845,700 26,977,4900
PETERBOROUGH 1,376,279 16,181 10,160 32,781 126,539,319 26,942,7160
PIERMONT 2,280,339 22,149 0 0 34,083,400 401,5000
PINKHAM'S GRANT 0 0 0 0 0 158,0000
PITTSBURG 5,504,667 0 0 0 118,729,400 7,849,3000
PITTSFIELD 1,404,540 0 0 0 77,966,680 6,197,9000
PLAINFIELD 2,843,833 270,849 0 0 84,105,300 3,080,1000
PLAISTOW 82,151 2,322 0 0 236,458,170 105,701,2800
PLYMOUTH 1,054,855 0 0 200 85,992,560 38,166,5700
PORTSMOUTH 79,320 300 200 0 867,642,000 424,445,1000
RANDOLPH 239,726 0 0 0 20,038,700 359,6000
RAYMOND 503,486 0 1,410 0 244,498,950 38,880,7400
RICHMOND 1,453,200 0 0 0 31,063,060 128,7100
RINDGE 1,628,002 278 0 0 200,289,749 18,062,6420
ROCHESTER 1,365,870 0 0 10,175 448,274,513 172,971,6120
ROLLINSFORD 422,825 0 0 0 80,764,040 9,395,4000
ROXBURY 480,263 24,944 0 0 7,083,900 145,2000
NH DRA 2012 Annual Report - Page 119

RESIDENTIAL MFG HOUSING COMMERCIAL INDUSTRIAL
DISCRETIONARY PRESERVATION
EASEMENT
TOTAL LOCAL ASSESSED VALUATION - BUILDINGS
(PAGE 2 OF 4)
TABLES BY COUNTY - 2011
RSA 79-F FARM STRUCTURES
MUNICIPALITY
MEREDITH 774,341,981 9,754,800 104,542,419 0 0
MERRIMACK 1,286,827,600 7,043,200 423,296,500 5,300 0
MIDDLETON 92,499,416 7,734,200 4,276,500 10,584 0
MILAN 57,365,900 4,788,900 5,241,100 0 0
MILFORD 745,281,895 14,483,050 177,756,255 28,200 274,400
MILLSFIELD 2,726,750 0 234,560 0 0
MILTON 202,117,315 13,676,400 19,875,200 4,685 0
MONROE 57,061,600 2,225,900 4,583,300 0 0
MONT VERNON 155,523,570 2,147,870 1,596,210 0 0
MOULTONBOROUGH 961,200,000 16,900,200 52,613,500 42,900 0
NASHUA 4,267,068,600 50,539,600 1,852,614,188 10,650 0
NELSON 51,581,236 380,200 0 0 0
NEW BOSTON 311,664,869 2,398,500 11,643,400 39,831 0
NEW CASTLE 189,305,300 0 51,262,700 0 0
NEW DURHAM 182,738,660 4,347,700 8,578,040 4,700 0
NEW HAMPTON 145,388,250 4,398,300 34,390,750 0 0
NEW IPSWICH 235,651,600 6,614,000 15,520,700 0 0
NEW LONDON 543,444,270 0 60,838,230 0 0
NEWBURY 292,999,660 274,400 21,075,240 0 87,300
NEWFIELDS 112,037,700 247,700 15,962,400 0 0
NEWINGTON 83,191,500 145,800 253,074,233 0 0
NEWMARKET 441,157,060 9,280,900 85,028,990 0 0
NEWPORT 221,646,728 14,048,100 91,752,200 0 0
NEWTON 265,210,600 2,329,600 21,421,200 1,000 0
NORTH HAMPTON 475,887,600 26,318,100 84,935,100 47,000 0
NORTHFIELD 191,087,700 11,218,400 26,590,300 0 0
NORTHUMBERLAND 61,011,700 4,550,000 16,739,100 0 0
NORTHWOOD 185,324,825 11,639,600 22,410,900 29,375 0
NOTTINGHAM 310,925,500 3,300,800 8,256,800 0 0
ODELL 1,642,860 0 0 0 0
ORANGE 17,589,200 1,148,700 325,700 0 0
ORFORD 82,835,097 2,251,900 7,022,500 39,503 0
OSSIPEE 295,433,500 14,310,302 62,139,800 0 0
PELHAM 708,971,366 363,000 52,778,492 0 0
PEMBROKE 324,661,300 2,005,700 74,438,705 0 0
PETERBOROUGH 335,686,440 448,800 106,780,424 176,922 0
PIERMONT 57,174,100 1,226,600 1,309,700 0 0
PINKHAM'S GRANT 0 0 2,603,020 0 0
PITTSBURG 124,822,800 4,212,400 14,882,700 0 0
PITTSFIELD 140,657,500 6,139,500 26,919,300 6,000 0
PLAINFIELD 178,044,157 4,347,800 9,460,700 69,943 0
PLAISTOW 325,636,900 319,300 149,125,240 0 0
PLYMOUTH 201,217,165 12,620,700 97,209,735 17,200 0
PORTSMOUTH 1,391,181,600 13,569,500 1,128,512,700 0 0
RANDOLPH 41,215,300 555,400 1,834,300 0 0
RAYMOND 420,501,970 32,149,900 75,489,630 23,600 0
RICHMOND 66,457,480 1,171,440 195,860 0 0
RINDGE 294,818,232 4,392,400 35,858,968 0 0
ROCHESTER 966,459,574 105,582,900 277,655,726 17,500 0
ROLLINSFORD 147,783,900 1,009,500 22,078,100 0 0
ROXBURY 16,293,300 547,800 702,200 0 0
NH DRA 2012 Annual Report - Page 120

PUBLIC WATER
GAS ELECTRIC OIL OTHERMATURE WOOD TIMBER
TOTAL LOCAL ASSESSED VALUATION - PUBLIC UTILITIES
(PAGE 3 OF 4)
GROSS VALUATION
MODIFIED ASSESSED VALUATION
EDUCATIONAL SPECIAL
EXEMTPIONS
TABLES BY COUNTY - 2011
MUNICIPALITY
MEREDITH 0 0 5,961,700 0 0 0 1,848,696,211 0 1,848,696,211
MERRIMACK 4,110,300 11,344,600 32,347,000 0 0 0 2,843,128,009 675,700 2,842,452,309
MIDDLETON 209,700 0 2,714,300 0 0 0 183,223,347 0 183,223,347
MILAN 0 15,701,500 3,180,400 0 0 0 124,861,377 0 124,861,377
MILFORD 1,789,425 2,906,670 11,576,784 0 0 0 1,278,195,882 602,456 1,277,593,426
MILLSFIELD 0 0 38,535 0 0 0 6,426,362 0 6,426,362
MILTON 0 0 5,927,200 0 0 0 366,957,724 0 366,957,724
MONROE 0 0 267,594,200 0 0 0 357,506,487 0 357,506,487
MONT VERNON 0 0 2,096,220 0 0 0 256,946,180 0 256,946,180
MOULTONBOROUGH 927,089 0 7,015,200 0 0 0 2,746,418,997 18,761 2,746,400,236
NASHUA 105,499,300 50,407,700 91,673,080 0 0 0 8,637,513,711 867,150 8,636,646,561
NELSON 0 0 2,405,200 0 0 0 117,571,153 0 117,571,153
NEW BOSTON 0 0 9,084,800 0 0 0 535,071,897 68,370 535,003,527
NEW CASTLE 0 0 1,283,100 0 0 0 637,321,931 0 637,321,931
NEW DURHAM 0 0 2,477,100 0 0 0 418,205,920 0 418,205,920
NEW HAMPTON 0 0 26,244,450 0 0 0 341,245,144 150,000 341,095,144
NEW IPSWICH 0 0 8,968,438 0 0 0 418,295,406 0 418,295,406
NEW LONDON 0 0 6,224,208 0 0 0 1,081,446,276 362,900 1,081,083,376
NEWBURY 0 0 5,000,000 0 0 0 693,421,593 0 693,421,593
NEWFIELDS 0 0 1,560,600 0 0 0 259,578,177 20,000 259,558,177
NEWINGTON 0 20,826,700 487,892,805 0 0 0 1,008,871,162 46,030,800 962,840,362
NEWMARKET 228,000 0 4,787,500 0 0 0 752,120,282 0 752,120,282
NEWPORT 0 0 12,086,900 0 0 0 502,363,082 0 502,363,082
NEWTON 150,000 9,797,000 4,491,900 0 0 0 468,404,849 373,452 468,031,397
NORTH HAMPTON 8,298,000 364,800 5,058,500 0 0 0 1,018,591,300 0 1,018,591,300
NORTHFIELD 0 1,146,300 5,025,500 0 0 0 355,633,060 559,100 355,073,960
NORTHUMBERLAND 0 13,202,000 11,052,280 0 0 0 134,773,527 1,885,000 132,888,527
NORTHWOOD 0 0 3,756,300 0 0 0 475,415,031 19,405 475,395,626
NOTTINGHAM 126,700 0 7,577,200 0 0 0 542,721,544 2,500 542,719,044
ODELL 0 0 0 0 0 0 2,180,938 0 2,180,938
ORANGE 0 0 752,000 0 0 0 28,849,023 0 28,849,023
ORFORD 0 0 3,059,800 0 0 0 146,696,426 0 146,696,426
OSSIPEE 48,700 0 14,844,400 0 0 0 710,710,879 0 710,710,879
PELHAM 4,749,100 17,540,200 16,952,200 0 0 0 1,386,270,464 251,000 1,386,019,464
PEMBROKE 0 9,002,500 15,762,600 0 100,000 0 614,335,210 7,500 614,327,710
PETERBOROUGH 0 0 9,581,200 0 0 0 607,591,222 43,000 607,548,222
PIERMONT 0 0 2,511,650 0 0 0 99,009,438 0 99,009,438
PINKHAM'S GRANT 0 0 117,854 0 0 0 2,878,874 0 2,878,874
PITTSBURG 0 2,297,800 9,300,800 0 0 0 287,599,867 0 287,599,867
PITTSFIELD 2,553,258 0 3,406,719 0 0 0 265,251,397 0 265,251,397
PLAINFIELD 0 0 7,129,900 0 0 0 289,352,582 150,000 289,202,582
PLAISTOW 859,500 15,750,290 7,195,400 0 6,132 0 841,136,685 0 841,136,685
PLYMOUTH 0 0 11,859,200 0 0 0 448,138,185 0 448,138,185
PORTSMOUTH 0 25,034,461 169,802,017 0 0 0 4,020,267,198 27,000,000 3,993,267,198
RANDOLPH 0 0 1,418,200 2,775,000 0 0 68,436,226 0 68,436,226
RAYMOND 1,765,400 0 17,361,800 0 0 0 831,176,886 200,000 830,976,886
RICHMOND 0 0 4,322,400 0 0 0 104,792,150 0 104,792,150
RINDGE 0 0 7,049,552 0 0 0 562,099,823 4,615,361 557,484,462
ROCHESTER 0 9,968,800 34,214,100 0 0 0 2,016,520,770 0 2,016,520,770
ROLLINSFORD 0 66,500 2,908,300 0 0 0 264,428,565 657,800 263,770,765
ROXBURY 0 0 572,900 0 0 0 25,850,507 0 25,850,507
NH DRA 2012 Annual Report - Page 121

NET VALUATION 2011
GROSS PROPERTY
TAXES
LESS VETERANS
CREDITS
EXEMPTIONS
(PAGE 4 OF 4)
NET TAX COMMITMENT
2011 RESIDENTS
TAX
2011 ACTUAL
TAX RATEBLIND ELDERLYLOCAL
OPTIONAL EXEMPTIONS
TABLES BY COUNTY - 2011
MUNICIPALITY
MEREDITH 139,200 2,184,400 949,961 1,845,422,650 23,330,884 227,250 23,103,634 012.65
MERRIMACK 90,000 35,014,700 3,371,400 2,803,976,209 65,310,846 703,750 64,607,096 023.43
MIDDLETON 15,000 265,000 0 182,943,347 3,553,352 48,400 3,504,952 019.46
MILAN 15,000 980,000 0 123,866,377 2,136,136 9,900 2,126,236 017.59
MILFORD 105,000 5,785,900 26,400 1,271,676,126 31,407,380 171,050 31,236,330 024.73
MILLSFIELD 0 0 0 6,426,362 0 0 0 00.00
MILTON 30,000 3,594,233 0 363,333,491 8,711,148 149,550 8,561,598 024.02
MONROE 0 90,000 0 357,416,487 3,152,601 7,600 3,145,001 010.55
MONT VERNON 45,000 1,148,920 17,750 255,734,510 6,797,716 57,500 6,740,216 026.60
MOULTONBOROUGH 150,000 1,645,200 100,000 2,744,505,036 22,841,633 184,013 22,657,620 08.33
NASHUA 3,609,200 125,071,600 10,277,200 8,497,688,561 177,607,288 1,703,000 175,904,288 020.97
NELSON 0 262,800 0 117,308,353 2,404,866 8,600 2,396,266 020.55
NEW BOSTON 33,000 2,496,800 360,100 532,113,627 12,487,734 113,000 12,374,734 023.51
NEW CASTLE 50,000 600,000 0 636,671,931 4,065,345 36,500 4,028,845 06.39
NEW DURHAM 15,000 1,547,900 132,200 416,510,820 9,324,071 93,400 9,230,671 022.40
NEW HAMPTON 30,000 991,950 0 340,073,194 5,747,050 42,100 5,704,950 017.07
NEW IPSWICH 45,000 2,302,300 0 415,948,106 8,406,213 120,000 8,286,213 020.26
NEW LONDON 45,000 850,000 500,000 1,079,688,376 18,403,985 190,000 18,213,985 017.06
NEWBURY 0 120,000 60,000 693,241,593 10,164,486 64,250 10,100,236 014.68
NEWFIELDS 0 3,199,800 80,000 256,278,377 5,680,587 38,500 5,642,087 022.18
NEWINGTON 0 4,303,800 0 958,536,562 7,461,872 26,000 7,435,872 08.95
NEWMARKET 120,000 6,062,800 695,900 745,241,582 18,850,177 179,000 18,671,177 025.31
NEWPORT 180,000 2,040,800 17,700 500,124,582 12,662,778 166,460 12,496,318 025.37
NEWTON 90,000 929,000 374,900 466,637,497 11,223,098 82,800 11,140,298 024.12
NORTH HAMPTON 0 12,022,100 106,000 1,006,463,200 16,181,876 179,500 16,002,376 016.11
NORTHFIELD 15,000 4,467,500 717,000 349,874,460 6,861,454 130,650 6,730,804 019.65
NORTHUMBERLAND 90,000 350,000 0 132,448,527 3,409,554 16,900 3,392,654 026.16
NORTHWOOD 30,000 5,031,300 476,950 469,857,376 11,553,687 66,100 11,487,587 024.61
NOTTINGHAM 66,300 5,227,800 690,900 536,734,044 10,844,314 126,500 10,717,814 020.24
ODELL 0 0 0 2,180,938 0 0 0 00.00
ORANGE 0 125,000 0 28,724,023 600,373 4,400 595,973 020.97
ORFORD 0 35,000 5,000 146,656,426 3,791,454 32,500 3,758,954 025.91
OSSIPEE 30,000 3,931,400 0 706,749,479 11,121,896 174,500 10,947,396 015.79
PELHAM 150,000 9,051,900 122,300 1,376,695,264 29,376,942 225,250 29,151,692 021.41
PEMBROKE 210,000 379,900 607,000 613,130,810 16,150,503 185,750 15,964,753 026.44
PETERBOROUGH 45,000 6,260,600 0 601,242,622 16,408,942 152,700 16,256,242 027.34
PIERMONT 0 130,000 1,950 98,877,488 2,179,617 21,700 2,157,917 99022.10
PINKHAM'S GRANT 0 0 0 2,878,874 19,114 0 19,114 06.74
PITTSBURG 0 105,000 0 287,494,867 3,969,385 12,800 3,956,585 013.90
PITTSFIELD 15,000 2,544,700 0 262,691,697 8,039,823 73,200 7,966,623 030.66
PLAINFIELD 0 1,223,100 5,988,800 281,990,682 6,708,723 20,050 6,688,673 023.85
PLAISTOW 60,000 10,546,500 2,177,526 828,352,659 20,404,082 184,500 20,219,582 024.71
PLYMOUTH 165,100 1,461,100 2,700 446,509,285 9,462,469 92,250 9,370,219 021.25
PORTSMOUTH 265,200 20,652,300 905,000 3,971,444,698 68,173,972 559,500 67,614,472 017.27
RANDOLPH 30,000 55,000 18,000 68,333,226 1,008,743 2,800 1,005,943 014.91
RAYMOND 200,000 9,157,000 2,732,600 818,887,286 18,623,960 297,500 18,326,460 022.80
RICHMOND 0 160,000 0 104,632,150 2,394,244 13,600 2,380,644 023.00
RINDGE 0 8,186,992 2,256,850 547,040,620 13,833,586 174,000 13,659,586 025.32
ROCHESTER 1,156,300 23,524,900 2,863,600 1,988,975,970 49,330,626 476,026 48,854,600 024.86
ROLLINSFORD 0 3,142,800 0 260,627,965 5,611,732 78,800 5,532,932 13,00021.56
ROXBURY 0 50,000 0 25,800,507 606,107 1,400 604,707 023.55
NH DRA 2012 Annual Report - Page 122

CURRENT USE
CONSERVATION RESTRICTION
DISCRETIONARY EASEMENT
DISCRETIONARY PRESERVATION
EASEMENT
RESIDENTIAL LAND
COMMERCIAL INDUSTRIAL
TOTAL LOCAL ASSESSED VALUATION - LAND
(PAGE 1 OF 4)
TABLES BY COUNTY - 2011
RSA 79-F FARM LAND
MUNICIPALITY
RUMNEY 1,097,676 3,908 0 0 68,631,900 6,279,0000
RYE 231,500 0 0 0 896,131,400 35,465,9000
SALEM 236,111 0 0 0 1,127,030,350 490,689,0500
SALISBURY 1,727,722 71,720 0 0 58,630,000 328,5000
SANBORNTON 2,114,910 0 35,808 0 208,428,000 4,466,400277
SANDOWN 472,840 0 760 100 249,333,535 5,231,8650
SANDWICH 1,833,689 211,880 0 2,100 235,780,439 452,9000
SARGENT'S PURCHASE 0 0 0 0 982,640 535,3500
SEABROOK 20,850 100 0 0 520,960,680 196,289,8200
SECOND COLLEGE GRANT 785,152 0 0 0 396,360 00
SHARON 1,045,833 0 0 0 18,931,000 273,2000
SHELBURNE 619,311 0 0 75 13,334,400 1,486,5000
SOMERSWORTH 114,261 0 0 0 177,247,749 64,803,1210
SOUTH HAMPTON 503,404 19,216 0 0 77,126,900 5,640,6000
SPRINGFIELD 1,298,653 14,442 0 0 66,619,100 4,114,4000
STARK 714,404 0 0 0 19,343,800 958,8000
STEWARTSTOWN 2,646,841 19,022 0 0 39,491,555 1,491,3000
STODDARD 1,091,940 95,260 0 0 147,105,690 1,088,5100
STRAFFORD 2,151,600 0 0 2,900 216,817,800 2,046,7000
STRATFORD 1,969,783 0 0 0 8,078,800 598,4000
STRATHAM 494,242 16,628 0 0 302,277,500 52,959,1000
SUCCESS 801,116 0 0 0 6,994,110 00
SUGAR HILL 631,269 77,434 252,800 10,000 61,846,600 2,503,0000
SULLIVAN 833,190 18,299 0 0 16,754,300 299,7000
SUNAPEE 739,760 0 0 0 563,696,200 11,894,4000
SURRY 558,847 0 0 0 24,272,000 744,8000
SUTTON 1,731,429 0 0 0 108,842,090 4,617,6400
SWANZEY 2,622,387 0 0 0 157,754,139 26,673,3530
TAMWORTH 1,974,120 0 0 0 93,654,988 15,723,3000
TEMPLE 1,192,778 3,254 0 100 46,204,200 1,815,7008,300
THOM & MES PURCHASE 0 0 0 0 2,391,790 1,964,4800
THORNTON 920,143 0 0 0 104,605,700 1,839,7000
TILTON 396,664 0 401,742 0 78,148,900 82,035,1000
TROY 605,881 0 0 0 26,924,111 2,390,2000
TUFTONBORO 1,173,000 32,330 0 0 635,643,100 11,859,9000
UNITY 1,301,410 0 0 0 52,024,710 00
WAKEFIELD 1,169,507 32,659 0 0 492,121,800 7,405,5000
WALPOLE 2,215,291 139,230 0 300 119,732,900 14,004,9000
WARNER 2,153,250 0 0 560 82,756,890 8,999,2600
WARREN 737,468 0 0 0 23,162,800 480,4000
WASHINGTON 1,500,628 97,088 0 0 130,976,200 836,2000
WATERVILLE VALLEY 29,409 0 0 0 58,276,500 6,532,1000
WEARE 1,768,711 100,134 6,748 200 266,905,000 12,118,8000
WEBSTER 1,454,338 77,152 0 200 92,070,300 1,650,7000
WENTWORTH 1,464,353 9,712 0 0 26,473,800 1,364,7000
WENTWORTH LOCATION 279,258 0 0 0 5,236,210 00
WESTMORELAND 2,566,712 0 0 0 46,813,600 5,860,9000
WHITEFIELD 1,544,480 0 0 0 52,829,320 4,127,2400
WILMOT 1,046,766 0 0 0 53,831,300 2,707,8000
WILTON 1,499,911 0 0 0 124,774,484 16,338,4000
WINCHESTER 1,822,389 1,863 0 0 69,323,400 8,314,1000
NH DRA 2012 Annual Report - Page 123

RESIDENTIAL MFG HOUSING COMMERCIAL INDUSTRIAL
DISCRETIONARY PRESERVATION
EASEMENT
TOTAL LOCAL ASSESSED VALUATION - BUILDINGS
(PAGE 2 OF 4)
TABLES BY COUNTY - 2011
RSA 79-F FARM STRUCTURES
MUNICIPALITY
RUMNEY 91,958,300 3,731,300 11,159,600 0 0
RYE 793,432,390 2,200,000 36,375,500 0 0
SALEM 1,475,550,800 29,921,200 646,820,000 19,700 0
SALISBURY 81,963,200 1,399,300 2,721,200 0 0
SANBORNTON 200,883,175 2,986,400 9,610,900 17,700 103,500
SANDOWN 323,786,010 15,161,200 5,094,690 10,000 0
SANDWICH 194,662,050 722,300 1,505,500 56,850 0
SARGENT'S PURCHASE 0 0 334,730 0 0
SEABROOK 384,269,880 66,219,900 156,221,620 0 0
SECOND COLLEGE GRANT 252,510 0 0 0 0
SHARON 32,799,400 0 775,500 0 0
SHELBURNE 24,691,296 636,500 9,809,900 13,104 0
SOMERSWORTH 430,678,364 17,424,100 143,390,941 0 0
SOUTH HAMPTON 71,739,918 1,666,773 4,571,600 0 0
SPRINGFIELD 103,804,500 3,023,700 9,079,400 0 0
STARK 30,844,300 1,807,200 2,152,600 0 0
STEWARTSTOWN 46,152,500 4,292,300 5,529,000 0 0
STODDARD 124,525,260 876,230 2,621,710 0 0
STRAFFORD 221,317,600 2,731,200 4,168,800 35,000 0
STRATFORD 24,987,400 2,127,800 3,564,100 0 0
STRATHAM 712,134,688 3,142,300 111,643,600 32,312 0
SUCCESS 3,155,050 0 0 0 0
SUGAR HILL 77,603,300 105,800 4,891,600 15,300 0
SULLIVAN 34,181,000 1,995,100 1,136,900 0 0
SUNAPEE 537,700,860 1,246,400 21,138,200 0 0
SURRY 54,187,400 772,500 1,490,800 0 0
SUTTON 143,113,020 127,560 8,324,050 0 0
SWANZEY 307,340,082 18,336,655 56,913,261 3,150 0
TAMWORTH 195,312,300 7,863,300 29,206,200 84,200 0
TEMPLE 94,937,694 710,500 5,946,150 22,004 61,899
THOM & MES PURCHASE 0 0 1,093,810 0 0
THORNTON 248,581,300 5,024,100 6,570,600 0 0
TILTON 152,593,600 15,111,200 165,784,800 0 0
TROY 80,615,600 3,247,400 4,708,800 0 0
TUFTONBORO 340,847,900 10,512,200 14,363,600 0 0
UNITY 71,244,630 4,877,340 226,250 0 0
WAKEFIELD 374,827,200 11,134,800 20,311,100 0 0
WALPOLE 238,716,232 2,989,700 49,848,200 41,768 0
WARNER 160,431,360 1,875,080 20,441,420 6,445 0
WARREN 40,624,000 2,506,900 2,743,600 0 0
WASHINGTON 111,556,435 1,133,900 1,790,500 0 0
WATERVILLE VALLEY 273,341,200 0 22,518,500 0 0
WEARE 444,747,800 15,763,400 32,373,700 16,900 0
WEBSTER 116,815,678 2,845,000 2,011,400 18,522 0
WENTWORTH 49,731,500 1,857,000 5,002,600 0 0
WENTWORTH LOCATION 3,725,510 18,810 0 0 0
WESTMORELAND 108,649,200 480,500 8,761,500 0 0
WHITEFIELD 104,363,100 4,646,820 23,322,460 0 0
WILMOT 112,769,900 751,600 6,211,700 0 0
WILTON 196,125,500 450,000 24,968,300 0 0
WINCHESTER 141,624,200 15,894,600 38,141,800 0 0
NH DRA 2012 Annual Report - Page 124

PUBLIC WATER
GAS ELECTRIC OIL OTHERMATURE WOOD TIMBER
TOTAL LOCAL ASSESSED VALUATION - PUBLIC UTILITIES
(PAGE 3 OF 4)
GROSS VALUATION
MODIFIED ASSESSED VALUATION
EDUCATIONAL SPECIAL
EXEMTPIONS
TABLES BY COUNTY - 2011
MUNICIPALITY
RUMNEY 0 0 9,722,400 0 0 0 192,584,084 0 192,584,084
RYE 2,366,000 0 4,980,900 0 0 0 1,771,183,590 0 1,771,183,590
SALEM 541,000 11,290,300 51,386,000 0 0 0 3,833,484,511 0 3,833,484,511
SALISBURY 0 0 9,651,100 0 0 0 156,492,742 0 156,492,742
SANBORNTON 0 25,700 2,282,100 0 0 0 430,954,870 0 430,954,870
SANDOWN 723,000 0 4,521,100 0 0 0 604,335,100 0 604,335,100
SANDWICH 0 0 6,962,100 0 0 0 442,189,808 887,400 441,302,408
SARGENT'S PURCHASE 0 0 0 0 0 0 1,852,720 0 1,852,720
SEABROOK 0 9,801,200 1,781,323,400 0 0 0 3,115,107,450 234,302,300 2,880,805,150
SECOND COLLEGE GRANT 0 0 0 0 0 0 1,434,022 0 1,434,022
SHARON 0 0 715,300 0 0 0 54,540,233 0 54,540,233
SHELBURNE 0 19,712,800 5,092,700 6,740,700 0 0 82,137,286 0 82,137,286
SOMERSWORTH 0 4,468,500 6,275,600 0 0 0 844,402,636 179,800 844,222,836
SOUTH HAMPTON 0 0 2,400,900 0 0 0 163,669,311 0 163,669,311
SPRINGFIELD 0 0 12,627,100 0 0 0 200,581,295 2,000,000 198,581,295
STARK 0 10,018,900 1,185,900 0 0 0 67,025,904 0 67,025,904
STEWARTSTOWN 0 17,257,000 4,633,200 0 268,100 0 121,780,818 0 121,780,818
STODDARD 0 0 5,508,170 0 0 0 282,912,770 0 282,912,770
STRAFFORD 118,600 0 3,093,500 0 15,800 0 452,499,500 0 452,499,500
STRATFORD 0 24,125,600 1,529,500 0 0 0 66,981,383 0 66,981,383
STRATHAM 1,230,600 9,624,300 13,015,500 0 0 0 1,206,570,770 0 1,206,570,770
SUCCESS 0 0 12,537 0 0 0 10,962,813 0 10,962,813
SUGAR HILL 0 0 1,311,948 0 0 0 149,249,051 0 149,249,051
SULLIVAN 0 0 1,338,100 0 0 0 56,556,589 0 56,556,589
SUNAPEE 0 0 9,551,400 0 0 0 1,145,967,220 0 1,145,967,220
SURRY 0 0 1,403,100 0 0 0 83,429,447 0 83,429,447
SUTTON 0 0 2,471,298 0 0 0 269,227,087 0 269,227,087
SWANZEY 267,000 0 16,931,300 0 0 0 586,841,327 296,430 586,544,897
TAMWORTH 213,700 0 15,491,100 0 0 0 359,523,208 278,366 359,244,842
TEMPLE 0 0 2,604,000 0 0 0 153,506,579 0 153,506,579
THOM & MES PURCHASE 0 0 684 0 0 0 5,450,764 0 5,450,764
THORNTON 151,700 0 5,421,900 0 0 0 373,115,143 25,000 373,090,143
TILTON 71,500 9,026,400 15,341,000 0 0 0 518,910,906 150,000 518,760,906
TROY 0 0 10,104,200 0 0 0 128,596,192 0 128,596,192
TUFTONBORO 383,000 0 10,883,400 0 0 0 1,025,698,430 0 1,025,698,430
UNITY 0 0 3,299,130 0 0 0 132,973,470 0 132,973,470
WAKEFIELD 0 0 5,441,900 0 0 0 912,444,466 73,700 912,370,766
WALPOLE 0 0 18,568,200 0 0 0 446,256,721 0 446,256,721
WARNER 0 0 5,564,930 0 0 0 282,229,195 0 282,229,195
WARREN 0 0 8,726,300 0 0 0 78,981,468 0 78,981,468
WASHINGTON 0 0 3,863,100 0 0 0 251,754,051 0 251,754,051
WATERVILLE VALLEY 0 0 1,264,100 0 0 0 361,961,809 150,000 361,811,809
WEARE 494,700 0 29,491,700 0 0 0 803,787,793 413,300 803,374,493
WEBSTER 0 0 15,251,100 0 0 0 232,194,390 0 232,194,390
WENTWORTH 0 0 3,364,100 0 0 0 89,267,765 0 89,267,765
WENTWORTH LOCATION 0 0 66,000 0 0 0 9,325,788 0 9,325,788
WESTMORELAND 0 0 1,400,000 0 0 0 174,532,412 0 174,532,412
WHITEFIELD 0 0 19,172,700 0 0 0 210,006,120 0 210,006,120
WILMOT 0 0 1,534,700 0 0 0 178,853,766 0 178,853,766
WILTON 0 0 3,612,679 0 0 0 367,769,274 150,000 367,619,274
WINCHESTER 0 0 9,622,400 0 0 0 284,744,752 175,642 284,569,110
NH DRA 2012 Annual Report - Page 125

NET VALUATION 2011
GROSS PROPERTY
TAXES
LESS VETERANS
CREDITS
EXEMPTIONS
(PAGE 4 OF 4)
NET TAX COMMITMENT
2011 RESIDENTS
TAX
2011 ACTUAL
TAX RATEBLIND ELDERLYLOCAL
OPTIONAL EXEMPTIONS
TABLES BY COUNTY - 2011
MUNICIPALITY
RUMNEY 15,000 410,000 29,600 192,129,484 3,666,330 59,370 3,606,960 019.20
RYE 45,000 7,727,500 96,155 1,763,314,935 18,673,359 196,500 18,476,859 010.60
SALEM 1,080,900 18,135,400 259,100 3,814,009,111 76,663,054 705,125 75,957,929 1,58020.14
SALISBURY 0 1,260,000 240,000 154,992,742 2,901,648 43,600 2,858,048 018.87
SANBORNTON 0 760,000 192,309 430,002,561 8,457,051 114,000 8,343,051 019.68
SANDOWN 30,000 9,784,400 0 594,520,700 12,324,925 136,000 12,188,925 020.75
SANDWICH 0 140,000 340,000 440,822,408 4,959,689 68,790 4,890,899 011.29
SARGENT'S PURCHASE 0 0 0 1,852,720 0 0 0 00.00
SEABROOK 105,000 21,849,500 2,280,700 2,856,569,950 35,508,044 285,000 35,223,044 013.88
SECOND COLLEGE GRANT 0 0 0 1,434,022 0 0 0 00.00
SHARON 0 90,000 0 54,450,233 1,011,530 1,900 1,009,630 018.61
SHELBURNE 0 80,000 53,000 82,004,286 1,120,607 4,000 1,116,607 014.50
SOMERSWORTH 275,000 2,221,700 0 841,726,136 23,399,238 278,300 23,120,938 027.83
SOUTH HAMPTON 0 2,480,000 50,000 161,139,311 2,363,442 19,175 2,344,267 014.70
SPRINGFIELD 0 230,000 27,250 198,324,045 3,937,434 41,000 3,896,434 019.98
STARK 30,000 50,000 0 66,945,904 956,928 9,500 947,428 014.70
STEWARTSTOWN 0 112,500 0 121,668,318 1,918,317 7,700 1,910,617 016.15
STODDARD 0 380,000 30,000 282,502,770 4,049,777 19,800 4,029,977 014.38
STRAFFORD 0 474,900 120,000 451,904,600 10,295,587 43,500 10,252,087 022.80
STRATFORD 30,000 312,900 0 66,638,483 1,493,757 5,250 1,488,507 023.54
STRATHAM 45,000 3,538,800 0 1,202,986,970 22,740,985 206,000 22,534,985 018.95
SUCCESS 0 0 0 10,962,813 0 0 0 00.00
SUGAR HILL 15,000 30,000 0 149,204,051 2,776,642 5,400 2,771,242 018.63
SULLIVAN 0 425,000 240,000 55,891,589 1,496,240 4,000 1,492,240 026.83
SUNAPEE 30,000 540,000 0 1,145,397,220 16,172,993 96,000 16,076,993 014.14
SURRY 0 5,000 21,674 83,402,773 1,410,310 9,700 1,400,610 016.95
SUTTON 0 690,000 0 268,537,087 5,837,510 68,000 5,769,510 021.76
SWANZEY 75,000 1,754,300 25,190 584,690,407 14,747,094 62,100 14,684,994 025.29
TAMWORTH 30,000 900,000 9,000 358,305,842 6,617,304 88,500 6,528,804 018.57
TEMPLE 0 75,000 0 153,431,579 3,360,300 7,900 3,352,400 021.94
THOM & MES PURCHASE 0 0 0 5,450,764 6,812 0 6,812 01.25
THORNTON 15,000 750,000 451,400 371,873,743 6,424,036 74,300 6,349,736 017.31
TILTON 26,000 4,537,000 132,900 514,065,006 9,398,432 111,000 9,287,432 018.40
TROY 30,000 250,000 0 128,316,192 3,606,189 28,400 3,577,789 028.30
TUFTONBORO 180,000 438,300 0 1,025,080,130 8,901,409 106,165 8,795,244 08.71
UNITY 0 98,000 0 132,875,470 2,809,372 12,200 2,797,172 021.20
WAKEFIELD 30,000 2,786,800 19,000 909,534,966 10,873,638 222,000 10,651,638 011.97
WALPOLE 30,000 495,400 0 445,731,321 8,412,444 52,100 8,360,344 018.97
WARNER 60,000 1,435,290 11,810 280,722,095 6,996,164 88,200 6,907,964 024.97
WARREN 0 237,000 0 78,744,468 1,601,109 25,900 1,575,209 020.62
WASHINGTON 15,000 180,000 59,090 251,499,961 3,995,227 21,000 3,974,227 015.92
WATERVILLE VALLEY 0 0 0 361,811,809 4,049,347 9,500 4,039,847 011.20
WEARE 30,000 5,157,798 208,200 797,978,495 16,368,189 162,600 16,205,589 020.60
WEBSTER 0 599,250 6,000 231,589,140 4,052,137 59,000 3,993,137 017.64
WENTWORTH 15,000 40,000 0 89,212,765 1,845,666 12,300 1,833,366 020.78
WENTWORTH LOCATION 0 0 0 9,325,788 79,766 50 79,716 08.57
WESTMORELAND 0 185,000 0 174,347,412 3,565,224 7,200 3,558,024 020.47
WHITEFIELD 0 994,010 0 209,012,110 4,187,823 69,500 4,118,323 020.25
WILMOT 0 110,000 30,000 178,713,766 3,799,007 33,500 3,765,507 021.28
WILTON 15,000 220,000 0 367,384,274 9,340,970 41,100 9,299,870 025.45
WINCHESTER 45,000 1,918,900 15,000 282,590,210 8,465,881 70,200 8,395,681 030.03
NH DRA 2012 Annual Report - Page 126

CURRENT USE
CONSERVATION RESTRICTION
DISCRETIONARY EASEMENT
DISCRETIONARY PRESERVATION
EASEMENT
RESIDENTIAL LAND
COMMERCIAL INDUSTRIAL
TOTAL LOCAL ASSESSED VALUATION - LAND
(PAGE 1 OF 4)
TABLES BY COUNTY - 2011
RSA 79-F FARM LAND
MUNICIPALITY
WINDHAM 184,100 0 0 0 910,285,050 75,956,2500
WINDSOR 348,484 0 0 0 9,181,900 00
WOLFEBORO 1,423,285 13,879 172,436 400 1,030,502,200 46,925,4000
WOODSTOCK 203,040 0 0 0 47,071,320 9,760,8000
276,341,078 4,161,752 1,757,321 617,042 48,039,246,058 8,236,833,96417,031STATE TOTALS
NH DRA 2012 Annual Report - Page 127

RESIDENTIAL MFG HOUSING COMMERCIAL INDUSTRIAL
DISCRETIONARY PRESERVATION
EASEMENT
TOTAL LOCAL ASSESSED VALUATION - BUILDINGS
(PAGE 2 OF 4)
TABLES BY COUNTY - 2011
RSA 79-F FARM STRUCTURES
MUNICIPALITY
WINDHAM 959,644,450 63,700 81,168,650 0 0
WINDSOR 11,770,000 488,300 466,600 0 0
WOLFEBORO 866,075,706 11,452,700 96,331,000 24,794 0
WOODSTOCK 155,844,860 4,663,360 15,891,640 0 0
74,715,582,383 1,621,362,934 18,539,477,102 3,536,179 527,099STATE TOTALS
NH DRA 2012 Annual Report - Page 128

PUBLIC WATER
GAS ELECTRIC OIL OTHERMATURE WOOD TIMBER
TOTAL LOCAL ASSESSED VALUATION - PUBLIC UTILITIES
(PAGE 3 OF 4)
GROSS VALUATION
MODIFIED ASSESSED VALUATION
EDUCATIONAL SPECIAL
EXEMTPIONS
TABLES BY COUNTY - 2011
MUNICIPALITY
WINDHAM 3,081,000 1,235,000 10,575,000 0 0 0 2,042,193,200 473,430 2,041,719,770
WINDSOR 0 0 634,900 0 0 0 22,890,184 0 22,890,184
WOLFEBORO 0 0 102,900 0 0 0 2,053,024,700 175,000 2,052,849,700
WOODSTOCK 0 0 2,685,908 0 0 0 236,120,928 0 236,120,928
199,920,040 657,557,827 6,442,813,462 24,618,800 2,820,225 1,897 158,767,192,194 398,958,575 158,368,233,619STATE TOTALS
NH DRA 2012 Annual Report - Page 129

NET VALUATION 2011
GROSS PROPERTY
TAXES
LESS VETERANS
CREDITS
EXEMPTIONS
(PAGE 4 OF 4)
NET TAX COMMITMENT
2011 RESIDENTS
TAX
2011 ACTUAL
TAX RATEBLIND ELDERLYLOCAL
OPTIONAL EXEMPTIONS
TABLES BY COUNTY - 2011
MUNICIPALITY
WINDHAM 60,000 14,989,400 1,645,000 2,025,025,370 46,700,954 243,500 46,457,454 023.08
WINDSOR 0 0 0 22,890,184 329,183 2,500 326,683 014.48
WOLFEBORO 60,000 4,240,500 70,000 2,048,479,200 24,991,206 260,250 24,730,956 012.20
WOODSTOCK 30,000 1,591,330 0 234,499,598 4,054,898 55,000 3,999,898 017.32
32,652,749 1,101,500,570 155,689,392 157,078,390,908 3,160,022,827 27,836,840 3,132,185,987 48,67019.94STATE TOTALS
NH DRA 2012 Annual Report - Page 130

2011
EQUALIZATION
SURVEY
STATE OF NEW HAMPSHIRE
DEPARTMENT
OF
REVENUE ADMINISTRATION
PROPERTY APPRAISAL DIVISION
NH DRA 2012 Annual Report - Page 131

NEW HAMPSHIRE PROPERTY TAX SYSTEM
SUMMARY
May 1, 2012
The following explanation summarizes the budget, assessment, equalization and assessment review
processes to assist taxpayers in understanding New Hampshire’s property tax system.
STEP I: THE BUDGET PROCESS Every property owner is responsible for paying a portion of the money necessary to operate their town or
city, their school district, their village district (if any) and their county. Each town or city, school district,
village district and county must establish a budget, hold public hearings on the budget and submit the
budget to their legislative body for approval.
Who are the legislative bodies that vote the appropriations necessary to fund the town or city, school and
county budgets? For a town, the annual town meeting is the legislative body, which appropriates money
to operate the town. The annual school district meeting does the same for the schools, and the annual
village district meeting does the same for districts. Generally for a city, or a town with a town council
form of government, the council or board of mayor and alderman vote the appropriations. The county
delegation comprised of the State Representatives from the county, appropriate the money necessary to
fund county government. This amount is apportioned to each town or city in that county based on its
proportion of the total equalized property value in that county.
It is these appropriations, voted by either your elected representatives at county delegation meetings and
council meetings, or voted by you at your annual town and annual school district meetings, which
establish the basis for property taxes in New Hampshire.
STEP II: THE ASSESSMENT PROCESS Your property taxes are based upon the assessed value of your property as of April 1. This means that
your tax bill, generally due in December, reflects the assessment of your property on the previous April 1.
For example, if you built a garage on May 15 of this year, you would not be assessed taxes on that garage
until next year, since the garage did not exist on April 1.
It is the responsibility of the selectmen or the assessor to annually determine the local assessed value of
the property within your municipality as of April 1 each year. This assessment is best determined by a
complete revaluation or update of all property within your town or city.
During a revaluation, property is physically reviewed and then valued based upon either the sale prices of
other comparable properties or by other means. Theoretically, the intent of a revaluation is to assess
property at its “full and true” value, often referred to as “market” value. But more importantly, the
purpose of a revaluation is to insure that property within your municipality is assessed proportionally so
that each property owner bears their share of the property tax burden based upon the “value” of their
property.
A complete annual revaluation can be costly and time consuming. Consequently, a complete revaluation
is not conducted every year. A revaluation establishes base year property values. In the years following a
revaluation, the assessors value the pick-ups: the new construction, the subdivisions, and other changes to
the property. Depending on the amount of change reflected in current sales, assessors may also conduct
partial revaluations or statistical updates. In any event assessors must maintain proportionality among all
property values on an annual basis.
Pick-ups (new construction and improvements) are assessed as of April l. Unless all properties are
NH DRA 2012 Annual Report - Page 132

updated to current market value; pick-ups are valued not at current year values, but valued at the
revaluation year values. That way, if a revaluation had been done in 2011, a 3-bedroom cape style home
built in 2010 will be assessed comparably to a 3-bedroom cape style home built in 2010. This assumes all
other factors affecting the value of the home are the same, such as the neighborhood, the amount of land,
the quality of construction, the number of bathrooms, etc.
STEP III: THE TAX RATE The appropriations voted by the town or city, the school district, village district (if any) and the county,
less revenue from all other sources, equals the amount of money needed to be raised by taxes. The money
needed to be raised by taxes is then divided by the local assessed property values to arrive at the property
tax rates.
For example, if an annual town meeting appropriated $1,000,000 to fund town appropriations and
anticipates receiving $300,000 from motor vehicle registrations, other fees, gifts and grants to the town,
then the balance of money needed to be raised by taxes would be $700,000. This amount divided by a
local assessed property value of $25,000,000, for example, would equal a tax rate of $28.00. Property tax
rates are normally expressed per $1,000 of valuation.
The equation for determining the local property tax rate is as follows:
VOTED APPROPRIATIONS minus ALL OTHER REVENUE x 1,000 = PROPERTY TAX RATE
LOCAL ASSESSED PROPERTY VALUE
By law, your property tax bill must show the assessed value of your property, along with the tax rate for
each component of the tax: the town/city, village districts (if any), county, local education and state
education tax rates.
STEP IV: EXEMPTIONS AND TAX CREDITS An exemption is a reduction in the local assessed value of property, while a credit is a reduction of the
amount of tax due.
Every municipality offers some form of an exemption for elderly property owners meeting certain
qualifications, and a tax credit for veterans. In addition, municipalities may adopt and grant the following
exemptions: blind exemption, deaf exemption, solar, wind-powered, wood-heating energy systems
exemptions, and exemptions for the totally and permanently disabled. In addition, property tax credits are
available to qualifying veterans or their surviving spouses.
Applications for an exemption or a tax credit must be made to the municipality by April 15th prior to that
year’s tax bill.
Education property tax relief is available to low and moderate income homeowners who:
Own a homestead or an interest in a homestead subject to the education property tax;
Have resided in the homestead on April 1 of the year for which the claim is made; and
Had a total “household income” of
1. $20,000 or less if a single person;
2. $40,000 or less if married or head of a New Hampshire household.
Forms for the low and moderate income homeowners property tax relief program are available each
spring once all the equalization ratios are completed.
NH DRA 2012 Annual Report - Page 133

Pursuant to RSA 198:57, VI, education property tax relief claims must be filed with the Department of
Revenue between May 1st and June 30th following the due date of the final tax bill. Since a required
element of the claim form is the equalization ratio for the municipality in which the property is located,
claim forms cannot be completed for release to the public until the annual ratio setting process is
complete. Ratios for each municipality are issued by the department generally in April as a result of the
Equalization Process described below. For more information, contact the Department at (603) 230-5950
or visit our web site at www.nh.gov/revenue
STEP V: THE EQUALIZATION PROCESS
All towns and cities do not conduct revaluations in the same year. Some may be assessing property close
to full value (because they just conducted a revaluation) while other towns and cities are assessing
property at more or less than full value (because their revaluation is not current). This inconsistency
makes it difficult to compare towns and cities to one another since the local assessed valuations are based
upon different revaluation years.
The annual equalization survey conducted by the Department of Revenue Administration addresses this
inconsistency by adjusting each municipality’s total local assessed property value to full value.
The sole purpose for equalizing local assessed property values is to ensure that public taxes and state
revenues shared by towns and cities will be reasonably apportioned. This includes state education tax,
county tax, some cooperative school district taxes and some village districts taxes. The equalization
process involves a detailed study of property sales throughout the state and compares those sales with the
local property assessments. A by-product of the equalization process is the determination of a ratio.
Generally, the ratio shows the average level at which the town or city assessed property in the previous
year in comparison to full value.
For example, a ratio of 90% would indicate that the town generally assessed property at approximately
90% of full value. The ratio does not necessarily apply to any specific property assessment, but rather
indicates the average level of assessment throughout the town or city.
Over a period of several years, as the value of property increases or decreases due to market fluctuations,
the ratio (the comparison of the local assessed value to full value) also fluctuates. A ratio of 100%
indicates that, on the average, the municipality is assessing at full value. A ratio below 100% indicates
average assessments are below full value, and a ratio above 100% indicates average assessments are
above full value.
Neither a high nor a low ratio, in itself, should be cause for alarm. Whether a town or city is assessing at
110% or 90% of full value is really not significant. What’s important is that the assessments are
proportional, so that each property owner bears their share of the property tax burden based upon the
value of their property.
STEP VI: ASSESSMENT REVIEW
As a result of the Supreme Court’s decision in Sirrell v. State of New Hampshire, RSA 75:8-a was
adopted which requires all towns and cities in New Hampshire to reappraise all real estate within the
municipality so that the assessments are at the full and true value at least as often as every fifth year. The
Department of Revenue Administration is mandated by RSA 21:J II-a & b to review and report the degree
to which assessments of municipalities achieve compliance with applicable statutes and rules. The
second five-year cycle was concluded in 2011. Approximately one-fourth of the towns and cities have
been scheduled for this Assessment Review in 2013, 2014, 2015, and 2016 respectively. The Assessing
Standards Board (ASB) has adopted recommended guidelines to be met by towns and cities for their
assessment review. The Department’s staff conducts field reviews of the records and assessing practices
of all towns and cities in accordance with the ASB recommended guidelines, and reports their findings to
the municipalities and to the ASB. This report becomes a public document upon its issuance.
NH DRA 2012 Annual Report - Page 134

STEP VII: PROPERTY ASSESSMENT APPEAL PROCESS
There is a two-level appeal process available to any property owner who believes the assessment of their
property is in error.
The first level of appeal to request an abatement of property taxes must be made to the local assessing
officials. The request for abatement must be made in writing by March 1st after the date the tax bills were
mailed. If the local assessing officials neglect or refuse to satisfactorily abate the tax, the second level of
appeal is either to the Board of Tax and Land Appeals or to the Superior Court in the county where the
property is located.
An opinion that property taxes are “too high” is not adequate grounds to justify an abatement. The
“amount of tax” is usually not appealable since the amount of money needed to fund local government
operations is determined by the local legislative bodies through the budget process. Generally, there must
be an error in the assessment of your property in order to qualify for an abatement.
CONCLUSION Property taxation in New Hampshire is a process involving all levels of government, from the voters at
town and school district meeting, city councilors, and local assessing officials, to state legislators and
court officials. It is a yearly process beginning with the preparation of the budget and voting of
appropriations, continuing with the assessment of property and the setting of the tax rates, and concluding
with the appeal process. Residents and non-residents, homeowners and landlords, commercial and
industrial businesses, all bear the responsibility for paying their proportional share of property taxes.
NH DRA 2012 Annual Report - Page 135

2011
EQUALIZATION SURVEY
“Including Utility & Railroad”
STATE OF NEW HAMPSHIRE
DEPARTMENT OF
REVENUE ADMINISTRATION
NH DRA 2012 Annual Report - Page 136

I
2 0 1 1 E Q U A L I Z A T I O N S U R V E Y
“INCLUDING UTILTIES AND RAILROADS”
May 1, 2012 This report presents the results of the 2011 Equalization Survey “including utilities and railroads”. It was conducted by the New Hampshire Department of Revenue Administration pursuant to RSA 21-J:3 XIII (Revised 4/1/99) which states: “XIII. Equalize annually by May 1 the valuation of the property as assessed in the several towns, cities, and unincorporated places in the state including the value of property exempt pursuant to RSA 72:37, 72:37-b, 72:39-a, 72:62, 72:66 and 72:70, and property which is the subject of a payment in lieu of taxes under RSA 72:74 by adding to or deducting from the aggregate valuation of the property in towns, cities and unincorporated places such sums as will bring such valuations to the true and market value of the property, and by making such adjustments in the value of other property from which the towns, cities, and unincorporated places receive taxes or payments in lieu of taxes as may be equitable and just, so that any public taxes that may be apportioned among them shall be equal and just. In carrying out the duty to equalize the valuation of property, the commissioner shall follow the procedures set forth in RSA 21-J:9-a.” To accomplish the foregoing, assessment ratio studies were conducted to determine how the average level of assessment for all cities and towns compares with the statutory 100% ratio so that taxes can be apportioned equitably. The Department of Revenue Administration has completed its process of calculating the total equalized valuation of all the municipalities and unincorporated places throughout the state. The ratios reported for each municipality in this survey were derived by comparing the sale prices of sales of land, land and buildings and manufactured housing, covering the period of October 1, 2010, to September 30, 2011, against the actual assessments levied by the municipalities. Sales information was verified by the grantee whenever possible by means of the Inventory of Property Transfer, Form PA-34. Our goal is to use only arm’s-length sales that transferred for market value in this analysis. Every effort has been made to exclude non-arms length transactions including but not limited to: sales involving courts and government agencies, sales between relatives or corporate affiliates, sales settling an estate, forced sales, etc. Every municipality was notified of its 2011 sales assessment ratio. These ratios were used in conjunction with other Department of Revenue adjustments to determine each municipality’s total equalized value for purposes of RSA 21-J:3 XIII. The following is an explanation of the information contained in this report. MODIFIED ASSESSED VALUATION: The modified assessed valuation for each municipality as reported to the Department of Revenue Administration on the municipality’s 2011 Summary of Inventory Valuation (MS-1 Form).
NH DRA 2012 Annual Report - Page 137
II
GROSS LOCAL ASSESSED VALUATION: The sum of all assessed values in the municipality.
- Certain Disabled Veterans Exemption: RSA 72:36-a. - Improvements to Assist the Deaf Exemption: RSA 72:38-b V - Improvements to Assist Persons with Disabilities Exemption: RSA 72:37-a - School/Dining/Dormitory/Kitchen Exemption: RSA 72:23 IV
($150,000 maximum per exemption) - Water & Air Pollution Control Exemption: RSA 72:12-a
= “MODIFIED ASSESSED VALUATION”
- Blind Exemption: RSA 72:37 - Elderly Exemption: RSA 72:39-a, -b - Deaf Exemption: RSA 72:38-b - Disabled Exemption: RSA 72:37-b - Wood-Heating Energy Systems Exemption: RSA 72:70 - Solar Energy System Exemption: RSA 72:62 - Additional School Dining/Dormitory/Kitchen Exemption: RSA 72:23 IV
(Exemption Amount >$150,000)
= “NET LOCAL ASSESSED VALUATION” The municipal, county, and local school tax rates are computed using the net local assessed valuation
D.R.A. INVENTORY ADJUSTMENT: The sum of the adjustments of the net local assessed valuation divided into three categories: Category 1: The total modified local assessed value of land (excluding land in current use, conservation restriction assessment, discretionary easement, discretionary preservation easement, taxation of farm structures and land under farm structures, and utilities), buildings and manufactured housing is equalized by the 2011 equalization ratio. The difference between the modified local assessed value of land, buildings and manufactured housing and the equalized value equals the D.R.A. adjustment for land, buildings and manufactured housing. Category 2: Pursuant to RSA 79-A:6-a, RSA 79-B:8, RSA 79-C, RSA 79-D and RSA 79-F, an adjustment for land in current use, conservation restriction assessment, discretionary easement, discretionary preservation easement, and taxes of farm structures and land under farm structures is made by dividing the total local assessed value of land in current use by the 2010 equalization ratio to obtain the equalized value of current use, conservation restriction assessment, discretionary easement, discretionary preservation easement and taxation of farm structures and land under farm structures. If a municipality has had a full revaluation as defined by Rev 603.01 (d), a ratio of 100.0 is used. The difference between the local assessed value of land and the equalized value equals the D.R.A. adjustment for current use, conservation restriction assessment, discretionary easement, discretionary preservation easement, and taxes of farm structures and land under farm structures.
NH DRA 2012 Annual Report - Page 138

III
Category 3: A D.R.A. adjustment for public utilities, as defined by RSA 83-F, is made by comparing the market value of the utility as determined by the D.R.A. to the net local assessed value of the utility. The difference between the assessed value and the market value equals the adjustment. The value of public utilities is not added into the “Total Equalized Value Not Including Utility Value or Equalized Railroad Taxes. EQUALIZED ASSESSED VALUATION: The sum of the “modified local assessed valuation” and the D.R.A. inventory adjustment. PAYMENT IN LIEU OF TAXES: The equalized value for payments received in lieu of taxes including State and Federal Forest Reimbursements, Recreational Land Reimbursements, Flood Land Reimbursements, and others. RAILROAD TAX: The equalized value for monies received from the railroad tax. This figure is not added into the “Total Equalized Valuation Not Including Utility Values and Railroad Taxes.” TOTAL EQUALIZED VALUATION Including UTILITY VALUE AND EQUALIZED RAILROAD TAXES: The sum of the equalized assessed valuation, the equalized value of payments in lieu of taxes and the equalized value of railroad tax monies. The 2009 total equalized valuation including utilities will be used to apportion the 2011 county taxes LOCAL TAX RATE: The actual tax rate as calculated by the Department of Revenue Administration, Municipal Services Division. This tax includes the municipal, county, local school and state education property tax rates. EQUALIZATION RATIO: The 2011 equalization ratio as determined by a ratio study conducted by the Department of Revenue Administration’s equalization staff. FULL VALUE TAX RATE: The 2011 gross local property taxes to be raised as reported by the Department of Revenue Administration, Municipal Services Division, divided by the total equalized valuation including utility values and equalized railroad taxes. This figure represents the estimated tax rate for a municipality if all the taxable property was assessed at 100% and includes the equalized value of properties for which a payment in lieu of property taxes is made. % PROPORTION TO COUNTY TAX: The percentage of proportion to $1,000 of tax that is to be allocated to each town within the county comparing each town’s total equalized value to the total equalized value of the county. % PROPORTION TO STATE TAX: The percentage of proportion to $1,000 of tax that is to be allocated to each town within the state by comparing each town’s total equalized value to the total equalized value of the state. COUNTY & STATE TAX RATE: The sum of the 2011 gross property taxes to be raised by each municipality in each county and the state divided by the total net local assessed value for each municipality in each county and the state.
NH DRA 2012 Annual Report - Page 139
IV
STATE & COUNTY RATIOS: The state and county gross assessed values divided by the total equalized valuation. The state and county ratios are calculated for statistical purposes only. They are not applied to any figure as part of the equalization process.
APPEAL OF TOTAL EQUALIZED VALUATION
Municipalities were sent their 2011 Notification of Total Equalized Valuation on April 30, 2012. Per RSA 71-B:5 II, any municipality aggrieved by the total equalized valuation as determined by the D.R.A. must appeal to the Board of Tax and Land Appeals in writing within 30 days of the town’s notification of the municipality’s total equalized valuation. The appeal period is not extended due to any communication, either verbal or written, between the D.R.A. and a municipality with regards to the total equalized valuation.
NH DRA 2012 Annual Report - Page 140
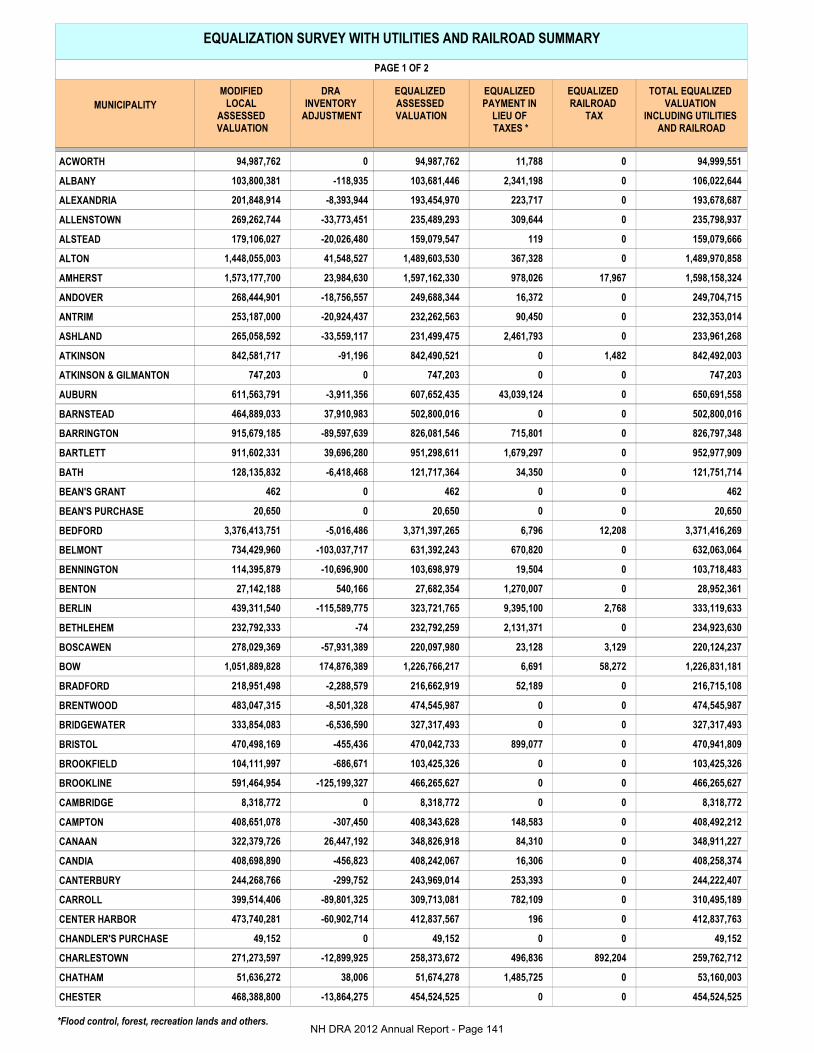
EQUALIZATION SURVEY WITH UTILITIES AND RAILROAD SUMMARY
PAGE 1 OF 2
MUNICIPALITY
MODIFIED LOCAL
ASSESSED VALUATION
DRA INVENTORY
ADJUSTMENT
EQUALIZED ASSESSED VALUATION
EQUALIZED PAYMENT IN
LIEU OF TAXES *
EQUALIZED RAILROAD
TAX
TOTAL EQUALIZED VALUATION
INCLUDING UTILITIES AND RAILROAD
94,987,762 0 94,987,762 11,788 94,999,5510ACWORTH
103,800,381 -118,935 103,681,446 2,341,198 106,022,6440ALBANY
201,848,914 -8,393,944 193,454,970 223,717 193,678,6870ALEXANDRIA
269,262,744 -33,773,451 235,489,293 309,644 235,798,9370ALLENSTOWN
179,106,027 -20,026,480 159,079,547 119 159,079,6660ALSTEAD
1,448,055,003 41,548,527 1,489,603,530 367,328 1,489,970,8580ALTON
1,573,177,700 23,984,630 1,597,162,330 978,026 1,598,158,32417,967AMHERST
268,444,901 -18,756,557 249,688,344 16,372 249,704,7150ANDOVER
253,187,000 -20,924,437 232,262,563 90,450 232,353,0140ANTRIM
265,058,592 -33,559,117 231,499,475 2,461,793 233,961,2680ASHLAND
842,581,717 -91,196 842,490,521 0 842,492,0031,482ATKINSON
747,203 0 747,203 0 747,2030ATKINSON & GILMANTON
611,563,791 -3,911,356 607,652,435 43,039,124 650,691,5580AUBURN
464,889,033 37,910,983 502,800,016 0 502,800,0160BARNSTEAD
915,679,185 -89,597,639 826,081,546 715,801 826,797,3480BARRINGTON
911,602,331 39,696,280 951,298,611 1,679,297 952,977,9090BARTLETT
128,135,832 -6,418,468 121,717,364 34,350 121,751,7140BATH
462 0 462 0 4620BEAN'S GRANT
20,650 0 20,650 0 20,6500BEAN'S PURCHASE
3,376,413,751 -5,016,486 3,371,397,265 6,796 3,371,416,26912,208BEDFORD
734,429,960 -103,037,717 631,392,243 670,820 632,063,0640BELMONT
114,395,879 -10,696,900 103,698,979 19,504 103,718,4830BENNINGTON
27,142,188 540,166 27,682,354 1,270,007 28,952,3610BENTON
439,311,540 -115,589,775 323,721,765 9,395,100 333,119,6332,768BERLIN
232,792,333 -74 232,792,259 2,131,371 234,923,6300BETHLEHEM
278,029,369 -57,931,389 220,097,980 23,128 220,124,2373,129BOSCAWEN
1,051,889,828 174,876,389 1,226,766,217 6,691 1,226,831,18158,272BOW
218,951,498 -2,288,579 216,662,919 52,189 216,715,1080BRADFORD
483,047,315 -8,501,328 474,545,987 0 474,545,9870BRENTWOOD
333,854,083 -6,536,590 327,317,493 0 327,317,4930BRIDGEWATER
470,498,169 -455,436 470,042,733 899,077 470,941,8090BRISTOL
104,111,997 -686,671 103,425,326 0 103,425,3260BROOKFIELD
591,464,954 -125,199,327 466,265,627 0 466,265,6270BROOKLINE
8,318,772 0 8,318,772 0 8,318,7720CAMBRIDGE
408,651,078 -307,450 408,343,628 148,583 408,492,2120CAMPTON
322,379,726 26,447,192 348,826,918 84,310 348,911,2270CANAAN
408,698,890 -456,823 408,242,067 16,306 408,258,3740CANDIA
244,268,766 -299,752 243,969,014 253,393 244,222,4070CANTERBURY
399,514,406 -89,801,325 309,713,081 782,109 310,495,1890CARROLL
473,740,281 -60,902,714 412,837,567 196 412,837,7630CENTER HARBOR
49,152 0 49,152 0 49,1520CHANDLER'S PURCHASE
271,273,597 -12,899,925 258,373,672 496,836 259,762,712892,204CHARLESTOWN
51,636,272 38,006 51,674,278 1,485,725 53,160,0030CHATHAM
468,388,800 -13,864,275 454,524,525 0 454,524,5250CHESTER
*Flood control, forest, recreation lands and others.NH DRA 2012 Annual Report - Page 141

EQUALIZATION SURVEY WITH UTILITIES AND RAILROAD SUMMARY
PAGE 2 OF 2
2011 LOCAL
TAX RATE
2011 EQUALIZATION
RATIO
FULL VALUE
TAX RATE
% PROPORTION TO COUNTY
TAX
% PROPORTION TO STATE TAX
MUNICIPALITY
100.0 $21.09 1.9884% 0.0615%ACWORTH $21.19
100.0 $10.50 0.8364% 0.0687%ALBANY $10.76
100.0 $22.94 1.5020% 0.1254%ALEXANDRIA $22.37
112.6 $33.11 1.5980% 0.1527%ALLENSTOWN $29.30
112.5 $23.51 2.2738% 0.1030%ALSTEAD $20.94
97.2 $12.68 14.6286% 0.9649%ALTON $13.07
97.8 $24.74 4.1380% 1.0349%AMHERST $25.37
103.9 $19.57 1.6922% 0.1617%ANDOVER $18.34
107.5 $25.01 0.6016% 0.1505%ANTRIM $23.14
113.7 $22.66 1.8144% 0.1515%ASHLAND $20.11
100.0 $18.60 2.0708% 0.5456%ATKINSON $18.80
100.0 $0.00 0.0265% 0.0005%ATKINSON & GILMANTON $0.00
100.0 $17.56 1.5994% 0.4214%AUBURN $18.94
92.4 $21.59 4.9365% 0.3256%BARNSTEAD $23.43
110.0 $22.74 8.3244% 0.5354%BARRINGTON $20.78
95.8 $10.00 7.5179% 0.6171%BARTLETT $10.48
100.0 $17.34 0.9442% 0.0788%BATH $16.92
100.0 $0.00 0.0000% 0.0000%BEAN'S GRANT $0.00
100.0 $0.00 0.0007% 0.0000%BEAN'S PURCHASE $0.00
100.0 $20.45 8.7294% 2.1833%BEDFORD $20.54
116.3 $24.79 6.2056% 0.4093%BELMONT $21.56
110.5 $25.35 0.2686% 0.0672%BENNINGTON $23.20
98.0 $14.05 0.2245% 0.0187%BENTON $15.06
113.9 $40.78 11.7949% 0.2157%BERLIN $31.70
100.0 $29.27 1.8219% 0.1521%BETHLEHEM $29.87
126.9 $26.42 1.4918% 0.1425%BOSCAWEN $21.05
95.1 $22.60 8.3142% 0.7945%BOW $27.15
100.0 $23.06 1.4687% 0.1403%BRADFORD $22.90
100.0 $23.28 1.1664% 0.3073%BRENTWOOD $23.01
100.0 $9.94 2.5384% 0.2120%BRIDGEWATER $9.85
97.2 $20.01 3.6522% 0.3050%BRISTOL $20.17
100.0 $15.77 0.8159% 0.0670%BROOKFIELD $15.73
126.3 $30.30 1.2073% 0.3019%BROOKLINE $24.08
100.0 $0.00 0.2945% 0.0054%CAMBRIDGE $0.00
100.0 $18.82 3.1679% 0.2645%CAMPTON $18.99
90.9 $21.43 2.7059% 0.2259%CANAAN $23.34
100.0 $19.19 1.0035% 0.2644%CANDIA $19.38
100.0 $25.08 1.6551% 0.1582%CANTERBURY $25.33
129.1 $17.39 10.9938% 0.2011%CARROLL $13.55
114.8 $12.57 4.0533% 0.2673%CENTER HARBOR $10.96
100.0 $0.00 0.0017% 0.0000%CHANDLER'S PURCHASE $0.00
105.2 $28.57 5.4370% 0.1682%CHARLESTOWN $27.53
100.0 $12.79 0.4194% 0.0344%CHATHAM $13.20
100.0 $24.54 1.1172% 0.2943%CHESTER $24.66
NH DRA 2012 Annual Report - Page 142

EQUALIZATION SURVEY WITH UTILITIES AND RAILROAD SUMMARY
PAGE 1 OF 2
MUNICIPALITY
MODIFIED LOCAL
ASSESSED VALUATION
DRA INVENTORY
ADJUSTMENT
EQUALIZED ASSESSED VALUATION
EQUALIZED PAYMENT IN
LIEU OF TAXES *
EQUALIZED RAILROAD
TAX
TOTAL EQUALIZED VALUATION
INCLUDING UTILITIES AND RAILROAD
562,766,614 -80,943,482 481,823,132 730,379 482,553,5110CHESTERFIELD
297,460,965 -45,569,277 251,891,688 0 251,891,6880CHICHESTER
822,522,920 4,730,146 827,253,066 2,546,564 829,832,94533,316CLAREMONT
40,859,992 21,994 40,881,986 4,811,664 45,693,6500CLARKSVILLE
190,272,312 -21,594,083 168,678,229 0 168,678,2290COLEBROOK
85,334,027 -9,121,541 76,212,486 250,708 76,463,1940COLUMBIA
3,730,396,850 -41,648,763 3,688,748,087 20,143,171 3,708,962,52371,265CONCORD
1,393,963,965 51,151,781 1,445,115,746 1,280,424 1,446,396,1700CONWAY
187,094,145 -1,226,064 185,868,081 499,483 186,376,5008,935CORNISH
162,457 0 162,457 0 162,4570CRAWFORD'S PURCHASE
94,429,409 -5,087,461 89,341,948 0 89,341,9480CROYDON
0 0 0 0 00CUTT'S GRANT
93,562,708 -10,901,697 82,661,011 20,806 82,681,8170DALTON
109,261,154 6,527,668 115,788,822 0 115,788,8220DANBURY
330,590,024 0 330,590,024 227 330,590,2510DANVILLE
537,429,916 -67,510,098 469,919,818 117,156 470,036,9740DEERFIELD
201,959,200 -18,108,104 183,851,096 11,501 183,862,5970DEERING
2,517,294,869 1,721,603 2,519,016,472 2,661,458 2,521,677,9300DERRY
926,086 0 926,086 0 926,0860DIX GRANT
16,691,185 0 16,691,185 6,462 16,697,6470DIXVILLE
40,920,449 -3,657,147 37,263,302 25,458 37,288,7600DORCHESTER
2,641,809,500 72,444,493 2,714,253,993 2,336,878 2,716,654,84063,969DOVER
256,735,375 -29,491,865 227,243,510 632,480 227,875,9900DUBLIN
55,368,701 -11,161,760 44,206,941 0 44,207,498556DUMMER
305,427,231 -16,796,734 288,630,497 1,024,032 289,654,5300DUNBARTON
901,932,943 -5,983,432 895,949,511 2,096,028 898,068,75823,219DURHAM
299,276,855 -7,824,807 291,452,048 2,301 291,478,97924,630EAST KINGSTON
65,727,057 250 65,727,307 703,097 66,430,4040EASTON
103,297,100 2,868,106 106,165,206 0 106,165,2060EATON
181,105,900 -2,051,272 179,054,628 1,269,779 180,324,4080EFFINGHAM
13,528,290 -90,940 13,437,350 619,717 14,057,0680ELLSWORTH
555,004,079 261,608 555,265,687 0 555,265,6870ENFIELD
624,188,800 -27,097,686 597,091,114 0 597,091,1140EPPING
406,738,353 -2,864,401 403,873,952 854,781 404,728,7330EPSOM
85,888,785 -5,442,021 80,446,764 1,371,648 81,818,4120ERROL
76,880 0 76,880 0 76,8800ERVING'S GRANT
1,603,489,293 467 1,603,489,760 1,463,608 1,604,981,47328,105EXETER
476,028,153 -83,668,670 392,359,483 228,951 392,588,4340FARMINGTON
308,663,000 -61,101,933 247,561,067 28,019 247,589,0860FITZWILLIAM
210,083,441 -11,778,989 198,304,452 0 198,304,4520FRANCESTOWN
284,038,653 -1,809,761 282,228,892 1,616,291 283,845,1830FRANCONIA
569,730,550 -7,473,061 562,257,489 7,050,816 569,308,3050FRANKLIN
487,826,724 -70 487,826,654 0 487,826,6540FREEDOM
365,044,581 -3,427,506 361,617,075 0 361,617,0750FREMONT
*Flood control, forest, recreation lands and others.NH DRA 2012 Annual Report - Page 143

EQUALIZATION SURVEY WITH UTILITIES AND RAILROAD SUMMARY
PAGE 2 OF 2
2011 LOCAL
TAX RATE
2011 EQUALIZATION
RATIO
FULL VALUE
TAX RATE
% PROPORTION TO COUNTY
TAX
% PROPORTION TO STATE TAX
MUNICIPALITY
116.9 $20.15 6.8973% 0.3125%CHESTERFIELD $17.33
118.0 $22.65 1.7071% 0.1631%CHICHESTER $19.30
100.0 $31.11 17.3689% 0.5374%CLAREMONT $33.18
100.0 $8.22 1.6179% 0.0296%CLARKSVILLE $9.25
110.3 $24.25 5.9724% 0.1092%COLEBROOK $21.70
100.0 $17.73 2.7074% 0.0495%COLUMBIA $16.54
100.0 $24.57 25.1355% 2.4019%CONCORD $24.60
96.4 $16.48 11.4105% 0.9367%CONWAY $17.20
100.0 $19.25 3.9010% 0.1207%CORNISH $19.34
100.0 $0.00 0.0058% 0.0001%CRAWFORD'S PURCHASE $0.00
104.8 $13.61 1.8700% 0.0579%CROYDON $12.95
100.0 $0.00 0.0000% 0.0000%CUTT'S GRANT $0.00
112.5 $20.87 2.9275% 0.0535%DALTON $18.58
94.2 $23.89 0.7847% 0.0750%DANBURY $25.46
100.0 $27.47 0.8126% 0.2141%DANVILLE $27.84
108.2 $24.12 1.1553% 0.3044%DEERFIELD $21.45
108.2 $28.13 0.4761% 0.1191%DEERING $26.16
100.0 $26.86 6.1981% 1.6330%DERRY $27.27
100.0 $0.00 0.0328% 0.0006%DIX GRANT $0.00
100.0 $3.03 0.5912% 0.0108%DIXVILLE $3.04
110.4 $22.57 0.2892% 0.0241%DORCHESTER $20.60
97.1 $23.94 27.3521% 1.7593%DOVER $25.12
112.5 $25.35 3.2571% 0.1476%DUBLIN $22.54
104.5 $22.55 1.5653% 0.0286%DUMMER $19.11
100.0 $22.40 1.9630% 0.1876%DUNBARTON $21.44
100.0 $28.17 9.0420% 0.5816%DURHAM $28.20
100.0 $23.65 0.7164% 0.1888%EAST KINGSTON $23.19
100.0 $10.69 0.5152% 0.0430%EASTON $10.83
97.2 $11.03 0.8375% 0.0688%EATON $11.36
100.0 $19.16 1.4226% 0.1168%EFFINGHAM $19.16
99.4 $12.78 0.1090% 0.0091%ELLSWORTH $13.34
100.0 $20.19 4.3062% 0.3596%ENFIELD $20.61
103.6 $25.09 1.4676% 0.3867%EPPING $24.27
100.0 $21.66 2.7428% 0.2621%EPSOM $21.65
100.0 $10.74 2.8970% 0.0530%ERROL $10.50
100.0 $0.00 0.0027% 0.0000%ERVING'S GRANT $0.00
100.0 $24.60 3.9449% 1.0394%EXETER $25.28
121.3 $23.91 3.9527% 0.2542%FARMINGTON $20.00
121.8 $30.19 3.5388% 0.1603%FITZWILLIAM $24.59
105.1 $21.91 0.5135% 0.1284%FRANCESTOWN $20.75
100.0 $16.26 2.2013% 0.1838%FRANCONIA $16.29
100.0 $21.20 3.8582% 0.3687%FRANKLIN $21.52
100.0 $11.46 3.8484% 0.3159%FREEDOM $11.49
100.0 $27.36 0.8888% 0.2342%FREMONT $27.27
NH DRA 2012 Annual Report - Page 144

EQUALIZATION SURVEY WITH UTILITIES AND RAILROAD SUMMARY
PAGE 1 OF 2
MUNICIPALITY
MODIFIED LOCAL
ASSESSED VALUATION
DRA INVENTORY
ADJUSTMENT
EQUALIZED ASSESSED VALUATION
EQUALIZED PAYMENT IN
LIEU OF TAXES *
EQUALIZED RAILROAD
TAX
TOTAL EQUALIZED VALUATION
INCLUDING UTILITIES AND RAILROAD
1,526,578,470 101,852,043 1,628,430,513 946,512 1,629,377,0250GILFORD
476,493,264 -4,526,650 471,966,614 121,329 472,087,9430GILMANTON
65,450,866 -740,108 64,710,758 0 64,710,7580GILSUM
1,336,474,100 -17,314,718 1,319,159,382 0 1,319,159,3820GOFFSTOWN
310,787,600 -60,153,177 250,634,423 925,296 251,562,8723,153GORHAM
75,290,246 0 75,290,246 31,897 75,322,1430GOSHEN
128,549,366 -1,362,263 127,187,103 0 127,187,1030GRAFTON
511,091,951 -2,035,538 509,056,413 0 509,056,4130GRANTHAM
158,270,175 -13,502,930 144,767,245 9,689,592 154,485,65828,820GREENFIELD
671,852,927 -2,437,205 669,415,722 0 669,430,92015,198GREENLAND
4,095,113 0 4,095,113 109,999 4,205,1120GREEN'S GRANT
136,790,746 -35,056,013 101,734,733 1,097,360 102,832,0930GREENVILLE
74,775,116 -7,652,846 67,122,270 57,194 67,179,4640GROTON
0 0 0 0 00HADLEY'S PURCHASE
74,019,900 6,717 74,026,617 72,701 74,099,3180HALE'S LOCATION
1,001,517,459 -44,813,055 956,704,404 1,507,597 958,212,0000HAMPSTEAD
2,750,914,500 62,403,533 2,813,318,033 0 2,813,332,46614,433HAMPTON
434,772,900 -21,796,018 412,976,882 0 412,976,8820HAMPTON FALLS
242,032,026 -2,361,847 239,670,179 1,577,905 241,248,0840HANCOCK
1,976,215,100 -6,108,742 1,970,106,358 2,831,566 1,972,937,9240HANOVER
211,949,959 -14,753,881 197,196,078 61,562 197,257,6400HARRISVILLE
15,736,200 381,172 16,117,372 518,775 16,636,1460HART'S LOCATION
353,154,969 -5,886,013 347,268,956 805,530 348,074,4860HAVERHILL
261,115,178 -11,576,335 249,538,843 5,931,361 255,470,2040HEBRON
388,150,299 -20,232,436 367,917,863 1,436,451 369,354,3140HENNIKER
107,290,359 -19,681,393 87,608,966 758,368 88,367,3340HILL
607,273,251 -136,378,427 470,894,824 116,732 471,011,5560HILLSBOROUGH
371,420,890 -45,197,584 326,223,306 76,479 326,299,7850HINSDALE
690,698,431 -1,577,800 689,120,631 305,495 689,426,1250HOLDERNESS
1,248,486,670 -67,235,875 1,181,250,795 1,836 1,181,253,262630HOLLIS
1,668,833,071 -162,988,846 1,505,844,225 49,810 1,505,950,37156,336HOOKSETT
652,213,995 -15,920,817 636,293,178 5,534,778 641,827,9560HOPKINTON
2,945,128,966 -391,187,694 2,553,941,272 0 2,553,941,2720HUDSON
385,683,068 -55,751,334 329,931,734 1,421,181 331,352,9160JACKSON
453,796,866 0 453,796,866 279,947 454,076,8130JAFFREY
123,519,359 -53,963 123,465,396 911,699 124,377,0950JEFFERSON
1,881,801,200 -62,402,439 1,819,398,761 2,224,976 1,821,623,7370KEENE
348,197,463 -54,637,408 293,560,055 0 293,560,0550KENSINGTON
11,747 0 11,747 0 11,7470KILKENNY
713,040,555 -66,791,775 646,248,780 2,635 646,269,73618,320KINGSTON
1,884,462,851 56,061,315 1,940,524,166 21,612,191 1,962,136,3570LACONIA
285,418,210 -48,534,691 236,883,519 2,824,172 239,707,6900LANCASTER
50,981,138 -1,411,903 49,569,235 205,646 49,774,8810LANDAFF
60,463,610 -117,834 60,345,776 29,625 60,375,4010LANGDON
*Flood control, forest, recreation lands and others.NH DRA 2012 Annual Report - Page 145

EQUALIZATION SURVEY WITH UTILITIES AND RAILROAD SUMMARY
PAGE 2 OF 2
2011 LOCAL
TAX RATE
2011 EQUALIZATION
RATIO
FULL VALUE
TAX RATE
% PROPORTION TO COUNTY
TAX
% PROPORTION TO STATE TAX
MUNICIPALITY
93.7 $17.32 15.9973% 1.0552%GILFORD $18.55
100.0 $23.57 4.6350% 0.3057%GILMANTON $23.51
100.0 $26.03 0.9249% 0.0419%GILSUM $25.95
100.0 $24.16 3.4156% 0.8543%GOFFSTOWN $24.17
108.9 $32.31 8.9072% 0.1629%GORHAM $26.80
100.0 $21.71 1.5765% 0.0488%GOSHEN $21.76
100.0 $18.04 0.9864% 0.0824%GRAFTON $17.93
100.0 $19.34 10.6548% 0.3297%GRANTHAM $19.30
108.6 $21.35 0.4000% 0.1000%GREENFIELD $20.92
100.0 $13.68 1.6454% 0.4335%GREENLAND $13.75
100.0 $6.63 0.1489% 0.0027%GREEN'S GRANT $6.83
132.8 $27.21 0.2663% 0.0666%GREENVILLE $20.59
100.0 $13.23 0.5210% 0.0435%GROTON $12.24
100.0 $0.00 0.0000% 0.0000%HADLEY'S PURCHASE $0.00
100.0 $3.35 0.5846% 0.0480%HALE'S LOCATION $3.36
104.2 $22.96 2.3552% 0.6205%HAMPSTEAD $22.28
96.9 $17.21 6.9150% 1.8219%HAMPTON $17.93
105.2 $19.72 1.0151% 0.2674%HAMPTON FALLS $18.96
100.0 $20.24 0.6246% 0.1562%HANCOCK $20.25
100.0 $16.79 15.3005% 1.2776%HANOVER $16.79
107.0 $15.65 2.8195% 0.1277%HARRISVILLE $14.60
97.6 $8.46 0.1312% 0.0108%HART'S LOCATION $8.98
96.3 $23.89 2.6994% 0.2254%HAVERHILL $23.79
103.6 $7.86 1.9812% 0.1654%HEBRON $7.73
104.0 $31.17 2.5031% 0.2392%HENNIKER $30.00
115.6 $22.79 0.5989% 0.0572%HILL $19.01
127.4 $29.36 1.2196% 0.3050%HILLSBOROUGH $22.97
111.5 $28.81 4.6639% 0.2113%HINSDALE $26.00
100.0 $13.17 5.3466% 0.4465%HOLDERNESS $13.16
105.7 $21.97 3.0585% 0.7650%HOLLIS $20.91
109.5 $23.37 10.2058% 0.9752%HOOKSETT $21.68
100.0 $27.68 4.3496% 0.4156%HOPKINTON $27.54
112.5 $18.84 6.6127% 1.6539%HUDSON $16.62
117.0 $11.92 2.6140% 0.2146%JACKSON $10.25
100.0 $27.21 6.4902% 0.2941%JAFFREY $27.37
100.0 $18.26 4.4039% 0.0805%JEFFERSON $18.50
101.9 $31.42 26.0369% 1.1797%KEENE $30.82
117.4 $22.10 0.7216% 0.1901%KENSINGTON $18.87
100.0 $0.00 0.0004% 0.0000%KILKENNY $0.00
110.1 $22.69 1.5885% 0.4185%KINGSTON $20.72
97.1 $19.57 19.2643% 1.2706%LACONIA $20.56
118.7 $21.89 8.4874% 0.1552%LANCASTER $18.53
100.0 $17.61 0.3860% 0.0322%LANDAFF $17.29
100.0 $24.86 1.2637% 0.0391%LANGDON $24.99
NH DRA 2012 Annual Report - Page 146

EQUALIZATION SURVEY WITH UTILITIES AND RAILROAD SUMMARY
PAGE 1 OF 2
MUNICIPALITY
MODIFIED LOCAL
ASSESSED VALUATION
DRA INVENTORY
ADJUSTMENT
EQUALIZED ASSESSED VALUATION
EQUALIZED PAYMENT IN
LIEU OF TAXES *
EQUALIZED RAILROAD
TAX
TOTAL EQUALIZED VALUATION
INCLUDING UTILITIES AND RAILROAD
1,851,389,931 -37,022,389 1,814,367,542 51,530,839 1,865,898,3810LEBANON
417,402,349 -24,426,378 392,975,971 102,011 393,077,9820LEE
166,293,328 -193,605 166,099,723 19,383 166,119,1060LEMPSTER
749,797,000 32,056,167 781,853,167 5,170,811 787,023,9780LINCOLN
111,414,279 233,033 111,647,312 0 111,647,3120LISBON
810,325,751 -34,911,762 775,413,989 1,702,562 777,116,5510LITCHFIELD
755,921,800 -136,146,872 619,774,928 2,254,902 622,029,8300LITTLETON
145,080 0 145,080 0 145,0800LIVERMORE
3,398,807,519 -485,340,761 2,913,466,758 25,546,368 2,939,013,1270LONDONDERRY
529,406,355 -27,390,566 502,015,789 3,819,111 505,834,9000LOUDON
0 0 0 0 00LOW & BURBANK GRANT
60,694,568 -62,259 60,632,309 0 60,632,3090LYMAN
325,407,200 -2,204,999 323,202,201 0 323,202,2010LYME
166,077,158 -185,623 165,891,535 712 165,892,2470LYNDEBOROUGH
234,161,510 -5,967,863 228,193,647 0 228,213,81220,165MADBURY
457,784,359 -5,081,930 452,702,429 892,356 453,594,7860MADISON
8,414,935,800 -20,019,401 8,394,916,399 36,321,563 8,431,293,78855,827MANCHESTER
182,848,070 -1,483,049 181,365,021 126,111 181,491,1320MARLBOROUGH
64,935,184 -9,196,534 55,738,650 31,470 55,770,1200MARLOW
36,618 0 36,618 0 36,6180MARTIN'S LOCATION
161,415,101 -407,668 161,007,433 29,557 161,036,9890MASON
1,848,696,211 -302,409 1,848,393,802 24,680 1,848,418,4810MEREDITH
2,842,452,309 -77,492,317 2,764,959,992 259,628 2,765,309,12889,508MERRIMACK
183,223,347 -20,242,438 162,980,909 0 162,980,9090MIDDLETON
124,861,377 -18,658,181 106,203,196 212,330 106,421,1585,632MILAN
1,277,593,426 56,625,646 1,334,219,072 1,081,010 1,335,344,56844,486MILFORD
6,426,362 0 6,426,362 0 6,426,3620MILLSFIELD
366,957,724 -1,380,176 365,577,548 0 365,577,5480MILTON
357,506,487 -173,801,400 183,705,087 0 183,705,0870MONROE
256,946,180 -378,380 256,567,800 0 256,567,8000MONT VERNON
2,746,400,236 178,077,927 2,924,478,163 4,684,302 2,929,162,4650MOULTONBOROUGH
8,640,947,461 -392,947,543 8,247,999,918 0 8,248,187,902187,984NASHUA
117,571,153 3,327,090 120,898,243 0 120,898,2430NELSON
535,003,527 -4,840,657 530,162,870 14,117 530,176,9870NEW BOSTON
637,321,931 -588,309 636,733,622 0 636,733,6220NEW CASTLE
418,205,920 44 418,205,964 0 418,205,9640NEW DURHAM
341,095,144 -19,364,338 321,730,806 496,024 322,226,8300NEW HAMPTON
418,295,406 -56,585,006 361,710,400 6,130 361,716,5300NEW IPSWICH
1,081,083,376 66,511 1,081,149,887 0 1,081,149,8870NEW LONDON
693,421,593 19,620,928 713,042,521 69,036 713,111,5570NEWBURY
259,558,177 -202,007 259,356,170 0 259,375,64119,471NEWFIELDS
962,840,362 8,438,448 971,278,810 1,117 971,307,94528,018NEWINGTON
760,757,364 -42,829,402 717,927,962 683,621 718,640,19728,614NEWMARKET
504,115,212 -57,408,930 446,706,282 2,256,346 448,962,6270NEWPORT
*Flood control, forest, recreation lands and others.NH DRA 2012 Annual Report - Page 147

EQUALIZATION SURVEY WITH UTILITIES AND RAILROAD SUMMARY
PAGE 2 OF 2
2011 LOCAL
TAX RATE
2011 EQUALIZATION
RATIO
FULL VALUE
TAX RATE
% PROPORTION TO COUNTY
TAX
% PROPORTION TO STATE TAX
MUNICIPALITY
100.0 $23.83 14.4704% 1.2083%LEBANON $24.32
106.1 $31.27 3.9576% 0.2546%LEE $30.12
100.0 $19.24 3.4770% 0.1076%LEMPSTER $19.96
95.0 $11.06 6.1035% 0.5097%LINCOLN $11.69
100.0 $28.31 0.8658% 0.0723%LISBON $28.60
102.7 $18.50 2.0121% 0.5032%LITCHFIELD $17.91
100.0 $23.83 4.8240% 0.4028%LITTLETON $20.40
100.0 $0.00 0.0011% 0.0001%LIVERMORE $0.00
112.7 $22.96 7.2239% 1.9033%LONDONDERRY $20.34
104.3 $21.16 3.4280% 0.3276%LOUDON $20.37
100.0 $0.00 0.0000% 0.0000%LOW & BURBANK GRANT $0.00
100.0 $19.23 0.4702% 0.0393%LYMAN $19.30
100.0 $20.54 2.5065% 0.2093%LYME $20.63
100.0 $23.58 0.4295% 0.1074%LYNDEBOROUGH $23.60
100.0 $24.52 2.2977% 0.1478%MADBURY $24.18
100.0 $15.91 3.5784% 0.2937%MADISON $15.83
100.0 $21.30 21.8305% 5.4600%MANCHESTER $21.96
100.0 $25.54 2.5941% 0.1175%MARLBOROUGH $25.43
117.2 $28.99 0.7971% 0.0361%MARLOW $25.10
100.0 $0.00 0.0013% 0.0000%MARTIN'S LOCATION $0.00
100.0 $24.25 0.4170% 0.1043%MASON $24.33
100.0 $12.62 18.1478% 1.1970%MEREDITH $12.65
102.3 $23.62 7.1600% 1.7908%MERRIMACK $23.43
111.7 $21.80 1.6409% 0.1055%MIDDLETON $19.46
108.9 $20.07 3.7681% 0.0689%MILAN $17.59
95.7 $23.52 3.4575% 0.8647%MILFORD $24.73
100.0 $0.00 0.2275% 0.0042%MILLSFIELD $0.00
100.0 $23.83 3.6807% 0.2367%MILTON $24.02
119.8 $17.16 1.4247% 0.1190%MONROE $10.55
100.0 $26.49 0.6643% 0.1661%MONT VERNON $26.60
93.9 $7.80 23.1079% 1.8969%MOULTONBOROUGH $8.33
103.9 $21.53 21.3564% 5.3414%NASHUA $20.97
96.0 $19.89 1.7280% 0.0783%NELSON $20.55
100.0 $23.55 1.3727% 0.3433%NEW BOSTON $23.51
100.0 $6.38 1.5650% 0.4123%NEW CASTLE $6.39
100.0 $22.30 4.2106% 0.2708%NEW DURHAM $22.40
100.0 $17.84 3.1636% 0.2087%NEW HAMPTON $17.07
114.3 $23.24 0.9366% 0.2342%NEW IPSWICH $20.26
100.0 $17.02 7.3269% 0.7001%NEW LONDON $17.06
96.9 $14.25 4.8327% 0.4618%NEWBURY $14.68
100.0 $21.90 0.6375% 0.1680%NEWFIELDS $22.18
100.0 $7.68 2.3874% 0.6290%NEWINGTON $8.95
105.8 $26.23 1.7664% 0.4654%NEWMARKET $25.31
111.3 $28.20 9.3970% 0.2907%NEWPORT $25.37
NH DRA 2012 Annual Report - Page 148

EQUALIZATION SURVEY WITH UTILITIES AND RAILROAD SUMMARY
PAGE 1 OF 2
MUNICIPALITY
MODIFIED LOCAL
ASSESSED VALUATION
DRA INVENTORY
ADJUSTMENT
EQUALIZED ASSESSED VALUATION
EQUALIZED PAYMENT IN
LIEU OF TAXES *
EQUALIZED RAILROAD
TAX
TOTAL EQUALIZED VALUATION
INCLUDING UTILITIES AND RAILROAD
468,031,397 -38,560,493 429,470,904 0 429,491,60820,704NEWTON
1,018,591,300 -2,287,650 1,016,303,650 0 1,016,338,24034,590NORTH HAMPTON
355,073,960 -55,963,320 299,110,640 2,067,984 301,178,6240NORTHFIELD
132,888,527 -24,457,500 108,431,027 305,812 108,739,9703,131NORTHUMBERLAND
475,395,626 -16,671,685 458,723,941 311,854 459,035,7950NORTHWOOD
542,719,044 18,296,519 561,015,563 444,014 561,459,5770NOTTINGHAM
2,180,938 0 2,180,938 0 2,180,9380ODELL
28,849,023 -382,675 28,466,348 259,368 28,725,7160ORANGE
146,696,426 -10,652,610 136,043,816 0 136,043,8160ORFORD
710,710,879 -8,033,946 702,676,933 98,702 702,775,6350OSSIPEE
1,386,019,464 13,463,848 1,399,483,312 1,103,892 1,400,587,2040PELHAM
616,819,836 -75,848,843 540,970,993 1,207,127 542,178,1200PEMBROKE
619,223,887 20,751,186 639,975,073 1,507,480 641,482,5530PETERBOROUGH
99,009,438 -1,372,841 97,636,597 122,239 97,758,8350PIERMONT
2,878,874 0 2,878,874 123,533 3,002,4070PINKHAM'S GRANT
287,599,867 -21,218,909 266,380,958 4,178,066 270,559,0240PITTSBURG
265,251,397 -36,452,628 228,798,769 261,039 229,059,8080PITTSFIELD
289,202,582 -3,488,383 285,714,199 47,998 285,762,1970PLAINFIELD
841,136,685 37,588,664 878,725,349 0 878,755,74430,394PLAISTOW
448,138,185 -51,552,671 396,585,514 3,014,556 399,600,0700PLYMOUTH
3,993,267,198 135,749,616 4,129,016,814 45,668,511 4,174,795,440110,114PORTSMOUTH
68,436,226 -6,926,604 61,509,622 1,860,542 63,370,1650RANDOLPH
830,976,886 -11,618,928 819,357,958 438,684 819,796,6430RAYMOND
104,792,150 -2,904,029 101,888,121 76,087 101,964,2080RICHMOND
557,484,462 -32,649,670 524,834,792 133,671 524,968,4630RINDGE
2,016,520,770 -8,405,676 2,008,115,094 15,162,751 2,023,277,8460ROCHESTER
263,770,765 -14,982,799 248,787,966 0 248,807,56519,599ROLLINSFORD
25,850,507 -481,212 25,369,295 3,208,285 28,577,5800ROXBURY
192,584,084 -18,055,004 174,529,080 633,981 175,163,0610RUMNEY
1,771,183,590 -2,179,356 1,769,004,234 1,032,453 1,770,040,6293,942RYE
3,833,484,511 -31,875,959 3,801,608,552 3,475,670 3,805,084,2220SALEM
156,492,742 -29,884,869 126,607,873 1,182,885 127,790,7580SALISBURY
430,954,870 -25,895,759 405,059,111 715,359 405,774,4700SANBORNTON
604,335,100 -81,080,436 523,254,664 0 523,254,6640SANDOWN
441,302,408 -3,937,111 437,365,297 1,063,932 438,429,2290SANDWICH
1,852,720 0 1,852,720 0 1,852,7200SARGENT'S PURCHASE
2,880,805,150 -283,105,986 2,597,699,164 0 2,597,699,1640SEABROOK
1,434,022 0 1,434,022 0 1,434,0220SECOND COLLEGE GRANT
54,540,233 -2,138,698 52,401,535 10,777 52,412,3120SHARON
82,137,286 -13,337,559 68,799,727 875,762 69,684,4618,972SHELBURNE
844,222,836 -41,627,929 802,594,907 3,112,003 805,706,9100SOMERSWORTH
163,669,311 -21,753,825 141,915,486 3,886 141,919,3720SOUTH HAMPTON
198,581,295 -16,216,828 182,364,467 457,075 182,821,826284SPRINGFIELD
67,025,904 -3,541,009 63,484,895 1,195,560 64,690,3329,877STARK
*Flood control, forest, recreation lands and others.NH DRA 2012 Annual Report - Page 149

EQUALIZATION SURVEY WITH UTILITIES AND RAILROAD SUMMARY
PAGE 2 OF 2
2011 LOCAL
TAX RATE
2011 EQUALIZATION
RATIO
FULL VALUE
TAX RATE
% PROPORTION TO COUNTY
TAX
% PROPORTION TO STATE TAX
MUNICIPALITY
108.8 $26.13 1.0557% 0.2781%NEWTON $24.12
100.0 $15.92 2.4981% 0.6582%NORTH HAMPTON $16.11
118.6 $22.78 2.0411% 0.1950%NORTHFIELD $19.65
114.3 $31.36 3.8502% 0.0704%NORTHUMBERLAND $26.16
103.7 $25.17 1.1283% 0.2973%NORTHWOOD $24.61
96.1 $19.31 1.3800% 0.3636%NOTTINGHAM $20.24
100.0 $0.00 0.0772% 0.0014%ODELL $0.00
100.0 $20.90 0.2228% 0.0186%ORANGE $20.97
106.8 $27.87 1.0550% 0.0881%ORFORD $25.91
100.0 $15.83 5.5441% 0.4551%OSSIPEE $15.79
97.7 $20.97 3.6264% 0.9070%PELHAM $21.41
111.3 $29.79 3.6743% 0.3511%PEMBROKE $26.44
96.2 $25.58 1.6609% 0.4154%PETERBOROUGH $27.34
100.0 $22.30 0.7581% 0.0633%PIERMONT $22.10
100.0 $6.37 0.1063% 0.0019%PINKHAM'S GRANT $6.74
107.9 $14.67 9.5798% 0.1752%PITTSBURG $13.90
116.2 $35.10 1.5523% 0.1483%PITTSFIELD $30.66
100.0 $23.48 5.9812% 0.1851%PLAINFIELD $23.85
94.6 $23.22 2.1599% 0.5691%PLAISTOW $24.71
111.3 $23.68 3.0990% 0.2588%PLYMOUTH $21.25
96.7 $16.33 10.2614% 2.7035%PORTSMOUTH $17.27
109.0 $15.92 2.2438% 0.0410%RANDOLPH $14.91
100.0 $22.72 2.0150% 0.5309%RAYMOND $22.80
100.0 $23.48 1.4574% 0.0660%RICHMOND $23.00
106.1 $26.35 7.5035% 0.3400%RINDGE $25.32
100.0 $24.38 20.3709% 1.3102%ROCHESTER $24.86
105.5 $22.55 2.5051% 0.1611%ROLLINSFORD $21.56
101.0 $21.21 0.4085% 0.0185%ROXBURY $23.55
106.5 $20.93 1.3584% 0.1134%RUMNEY $19.20
100.0 $10.55 4.3506% 1.1463%RYE $10.60
100.0 $20.15 9.3526% 2.4641%SALEM $20.14
119.0 $22.71 0.8660% 0.0828%SALISBURY $18.87
106.5 $20.84 3.9839% 0.2628%SANBORNTON $19.68
115.5 $23.55 1.2861% 0.3389%SANDOWN $20.75
100.0 $11.31 3.4587% 0.2839%SANDWICH $11.29
100.0 $0.00 0.0656% 0.0012%SARGENT'S PURCHASE $0.00
96.0 $13.67 6.3850% 1.6822%SEABROOK $13.88
100.0 $0.00 0.0508% 0.0009%SECOND COLLEGE GRANT $0.00
103.4 $19.30 0.1357% 0.0339%SHARON $18.61
100.0 $16.08 2.4673% 0.0451%SHELBURNE $14.50
105.1 $29.04 8.1121% 0.5218%SOMERSWORTH $27.83
115.0 $16.65 0.3488% 0.0919%SOUTH HAMPTON $14.70
106.1 $21.54 3.8266% 0.1184%SPRINGFIELD $19.98
106.0 $14.79 2.2905% 0.0419%STARK $14.70
NH DRA 2012 Annual Report - Page 150

EQUALIZATION SURVEY WITH UTILITIES AND RAILROAD SUMMARY
PAGE 1 OF 2
MUNICIPALITY
MODIFIED LOCAL
ASSESSED VALUATION
DRA INVENTORY
ADJUSTMENT
EQUALIZED ASSESSED VALUATION
EQUALIZED PAYMENT IN
LIEU OF TAXES *
EQUALIZED RAILROAD
TAX
TOTAL EQUALIZED VALUATION
INCLUDING UTILITIES AND RAILROAD
121,780,818 -30,898,112 90,882,706 88,048 90,970,7540STEWARTSTOWN
282,912,770 -3,208,449 279,704,321 64,110 279,768,4310STODDARD
452,499,500 -282,019 452,217,481 0 452,217,4810STRAFFORD
66,981,383 -11,005,805 55,975,578 826,950 57,020,796218,268STRATFORD
1,206,570,770 -95,259,986 1,111,310,784 0 1,111,316,2155,431STRATHAM
10,962,813 0 10,962,813 0 10,962,8130SUCCESS
149,249,051 132,229 149,381,280 0 149,381,2800SUGAR HILL
56,556,589 -645,485 55,911,104 0 55,911,1040SULLIVAN
1,145,967,220 74,270,936 1,220,238,156 0 1,220,238,1560SUNAPEE
83,429,447 300,191 83,729,638 568,735 84,298,3720SURRY
269,227,087 125,154 269,352,241 1,819 269,354,0600SUTTON
593,015,042 -51,467,363 541,547,679 1,315,608 542,863,2870SWANZEY
359,244,842 -53,964,484 305,280,358 941,624 306,221,9830TAMWORTH
153,506,579 -1,070,048 152,436,531 35,151 152,471,6830TEMPLE
5,450,764 0 5,450,764 592,735 6,043,4990THOM & MES PURCHASE
373,090,143 -2,200,147 370,889,996 3,125,879 374,015,8750THORNTON
518,760,906 -11,355,067 507,405,839 244,185 507,650,0230TILTON
128,596,192 -5,069,171 123,527,021 8,815 123,535,8360TROY
1,025,698,430 -6,655,992 1,019,042,438 1,293,571 1,020,336,0080TUFTONBORO
132,973,470 -1,773,090 131,200,380 24,623 131,225,0020UNITY
912,370,766 -6,859 912,363,907 668,338 913,032,2450WAKEFIELD
446,256,721 -3,439,084 442,817,637 0 442,828,55610,919WALPOLE
282,229,195 -3,116,725 279,112,470 833,283 279,945,7530WARNER
78,981,468 -10,827,891 68,153,577 851,271 69,004,8470WARREN
251,754,051 -14,497,449 237,256,602 246,141 237,502,7430WASHINGTON
361,811,809 -38,613,465 323,198,344 2,085,884 325,284,2280WATERVILLE VALLEY
803,374,493 -34,070,512 769,303,981 1,069,106 770,373,0870WEARE
232,194,390 -44,229,624 187,964,766 488,552 188,453,3190WEBSTER
89,267,765 4,908,930 94,176,695 239,504 94,416,1990WENTWORTH
9,325,788 0 9,325,788 17,807 9,343,5950WENTWORTH LOCATION
174,532,412 5,456,780 179,989,192 1,073 179,990,2650WESTMORELAND
210,006,120 -50,763,787 159,242,333 2,269,570 161,511,9040WHITEFIELD
178,853,766 -360,450 178,493,316 82,818 178,576,1340WILMOT
367,619,274 -904,185 366,715,089 271,347 366,989,1732,737WILTON
284,569,110 6,945,674 291,514,784 867,569 292,382,3530WINCHESTER
2,041,719,770 26,547,052 2,068,266,822 540,600 2,068,807,4220WINDHAM
22,890,184 -83,081 22,807,103 3,832,838 26,639,9410WINDSOR
2,052,849,700 3,613 2,052,853,313 1,246,590 2,054,099,9020WOLFEBORO
236,120,928 17,299,836 253,420,764 1,633,962 255,054,7260WOODSTOCK
STATE TOTALS 158,500,914,585 -4,602,270,090 447,568,976 2,337,585 154,348,551,055153,898,644,495
*Flood control, forest, recreation lands and others.NH DRA 2012 Annual Report - Page 151

EQUALIZATION SURVEY WITH UTILITIES AND RAILROAD SUMMARY
PAGE 2 OF 2
2011 LOCAL
TAX RATE
2011 EQUALIZATION
RATIO
FULL VALUE
TAX RATE
% PROPORTION TO COUNTY
TAX
% PROPORTION TO STATE TAX
MUNICIPALITY
122.6 $21.09 3.2210% 0.0589%STEWARTSTOWN $16.15
100.0 $14.48 3.9988% 0.1812%STODDARD $14.38
100.0 $22.77 4.5531% 0.2928%STRAFFORD $22.80
100.0 $26.20 2.0190% 0.0369%STRATFORD $23.54
108.3 $20.46 2.7315% 0.7197%STRATHAM $18.95
100.0 $0.00 0.3882% 0.0071%SUCCESS $0.00
100.0 $18.59 1.1585% 0.0967%SUGAR HILL $18.63
100.0 $26.76 0.7992% 0.0362%SULLIVAN $26.83
93.5 $13.25 25.5403% 0.7902%SUNAPEE $14.14
100.0 $16.73 1.2049% 0.0546%SURRY $16.95
100.0 $21.67 1.8254% 0.1744%SUTTON $21.76
108.2 $27.17 7.7593% 0.3515%SWANZEY $25.29
118.0 $21.61 2.4158% 0.1983%TAMWORTH $18.57
100.0 $22.04 0.3948% 0.0987%TEMPLE $21.94
100.0 $1.13 0.2140% 0.0039%THOM & MES PURCHASE $1.25
100.0 $17.18 2.9006% 0.2422%THORNTON $17.31
100.0 $18.51 4.9841% 0.3287%TILTON $18.40
100.0 $29.19 1.7657% 0.0800%TROY $28.30
100.0 $8.72 8.0493% 0.6608%TUFTONBORO $8.71
100.0 $21.41 2.7466% 0.0850%UNITY $21.20
100.0 $11.91 7.2028% 0.5913%WAKEFIELD $11.97
100.0 $19.00 6.3295% 0.2868%WALPOLE $18.97
100.0 $24.99 1.8972% 0.1813%WARNER $24.97
108.0 $23.20 0.5351% 0.0447%WARREN $20.62
105.2 $16.82 4.9711% 0.1538%WASHINGTON $15.92
112.0 $12.45 2.5226% 0.2106%WATERVILLE VALLEY $11.20
103.0 $21.25 1.9947% 0.4989%WEARE $20.60
118.3 $21.50 1.2771% 0.1220%WEBSTER $17.64
94.4 $19.55 0.7322% 0.0611%WENTWORTH $20.78
100.0 $8.54 0.3308% 0.0061%WENTWORTH LOCATION $8.57
96.9 $19.81 2.5726% 0.1166%WESTMORELAND $20.47
126.2 $25.93 5.7187% 0.1046%WHITEFIELD $20.25
100.0 $21.27 1.2102% 0.1156%WILMOT $21.28
100.0 $25.45 0.9502% 0.2377%WILTON $25.45
95.8 $28.95 4.1791% 0.1893%WINCHESTER $30.03
98.6 $22.57 5.0850% 1.3397%WINDHAM $23.08
99.1 $12.36 0.0690% 0.0173%WINDSOR $14.48
100.0 $12.17 16.2046% 1.3302%WOLFEBORO $12.20
93.1 $15.90 1.9780% 0.1652%WOODSTOCK $17.32
$20.12 103.2 $20.46STATE TOTALS 100.00%100.00%
NH DRA 2012 Annual Report - Page 152

MUNICIPALITY
TOTAL EQUALIZED
VALUATION INCLUDING
UTILITIES USED TO
APPORTION LOCAL
SCHOOL TAX
TOTAL EQUALIZED
VALUATION NOT
INCLUDING UTILITIES USED
TO APPORTION STATE
SCHOOL TAX
BASE VALUATION FOR
DEBT LIMIT FOR SCHOOL
PURPOSES ONLY
CONCORD - CONCORD UNION
SCHOOL DISTRICT 3,342,391,397 3,298,379,942 3,324,187,030
PENACOOK - MERRIMACK
VALLEY SCHOOL DISTRICT 370,106,926 298,958,729 368,096,857
LOUDON SCHOOL DISTRICT 502,481,972 496,839,557 498,662,861
2011 SCHOOL SET-OFF DISTRICTS TOTAL EQUALIZED VALUATION
FOR SCHOOL PURPOSES
NH DRA 2012 Annual Report - Page 153

2011
EQUALIZATION SURVEY
“Not Including Utility & Railroad”
STATE OF NEW HAMPSHIRE
DEPARTMENT OF
REVENUE ADMINISTRATION
NH DRA 2012 Annual Report - Page 154

I
2 0 1 1 E Q U A L I Z A T I O N S U R V E Y
“NOT INCLUDING UTILTIES AND RAILROADS”
May 1, 2012 This report presents the results of the 2011 Equalization Survey “not including utilities and railroads”. It was conducted by the New Hampshire Department of Revenue Administration pursuant to RSA 21-J:3 XIII (Revised 4/1/99) which states: “XIII. Equalize annually by May 1 the valuation of the property as assessed in the several towns, cities, and unincorporated places in the state including the value of property exempt pursuant to RSA 72:37, 72:37-b, 72:39-a, 72:62, 72:66 and 72:70, and property which is the subject of a payment in lieu of taxes under RSA 72:74 by adding to or deducting from the aggregate valuation of the property in towns, cities and unincorporated places such sums as will bring such valuations to the true and market value of the property, and by making such adjustments in the value of other property from which the towns, cities, and unincorporated places receive taxes or payments in lieu of taxes as may be equitable and just, so that any public taxes that may be apportioned among them shall be equal and just. In carrying out the duty to equalize the valuation of property, the commissioner shall follow the procedures set forth in RSA 21-J:9-a.” To accomplish the foregoing, assessment ratio studies were conducted to determine how the average level of assessment for all cities and towns compares with the statutory 100% ratio so that taxes can be apportioned equitably. The Department of Revenue Administration has completed its process of calculating the total equalized valuation of all the municipalities and unincorporated places throughout the state. The ratios reported for each municipality in this survey were derived by comparing the sale prices of sales of land, land and buildings and manufactured housing, covering the period of October 1, 2010, to September 30, 2011, against the actual assessments levied by the municipalities. Sales information was verified by the grantee whenever possible by means of the Inventory of Property Transfer, Form PA-34. Our goal is to use only arm’s-length sales that transferred for market value in this analysis. Every effort has been made to exclude non-arms length transactions including but not limited to: sales involving courts and government agencies, sales between relatives or corporate affiliates, sales settling an estate, forced sales, etc. Every municipality was notified of its 2011 sales assessment ratio. These ratios were used in conjunction with other Department of Revenue adjustments to determine each municipality’s total equalized value for purposes of RSA 21-J:3 XIII. The following is an explanation of the information contained in this report. MODIFIED LOCAL ASSESSED VALUATION: The modified assessed valuation for each municipality as reported to the Department of Revenue Administration on the municipality’s 2011 Summary of Inventory Valuation (MS-1 Form) “not including utility values taxed pursuant
NH DRA 2012 Annual Report - Page 155

II
to RSA 83-F.” GROSS LOCAL ASSESSED VALUATION: Sum of all assessed values not including utility values in the municipality.
- Certain Disabled Veterans Exemption: RSA 72:36-a. - Improvements to Assist the Deaf Exemption: RSA 72:38-b V - Improvements to Assist Persons with Disabilities Exemption: RSA 72:37-a - School/Dining/Dormitory/Kitchen Exemption: RSA 72:23 IV
($150,000 maximum per exemption) - Water & Air Pollution Control Exemption: RSA 72:12-a
= “MODIFIED ASSESSED VALUATION”
- Blind Exemption: RSA 72:37 - Elderly Exemption: RSA 72:39-a, b - Deaf Exemption: RSA 72:38-b - Disabled Exemption: RSA 72:37-b - Wood-Heating Energy Systems Exemption: RSA 72:70 - Solar Energy System Exemption: RSA 72:62 - Additional School Dining/Dormitory/Kitchen Exemption: RSA 72:23 IV
(Exemption Amount >$150,000)
= “NET LOCAL ASSESSED VALUATION Not Including Utility Valuation” The education property tax rate is computed using the Net Local Assessed Valuation Not Including Utility Valuation. D.R.A. INVENTORY ADJUSTMENT: The sum of the adjustments of the net local assessed valuation divided into two categories: Category 1: The total modified local assessed value of land (excluding land in current use, conservation restriction assessment, discretionary easement, discretionary preservation easement, taxation of farm structures and land under farm structures and utilities), buildings and manufactured housing is equalized by the 2011 equalization ratio. The difference between the net local assessed value of land, buildings and manufactured housing and the equalized value equals the D.R.A. adjustment for land, buildings and manufactured housing. Category 2: Pursuant to RSA 79-A:6-a, RSA 79-B:8, RSA 79-C, RSA 79-D and RSA 79-F, an adjustment for land in current use, conservation restriction assessment, discretionary easement, discretionary preservation easement, and taxes of farm structures and land under farm structures is made by dividing the total local assessed value of land in current use by the 2010 equalization ratio to obtain the equalized value of current use, conservation restriction assessment, discretionary easement, discretionary preservation easement and taxation of farm structures and land under farm structures. If a municipality has had a full revaluation as defined by Rev 603.01
NH DRA 2012 Annual Report - Page 156
III
(d), a ratio of 100.0 is used. The difference between the assessed value of land in current use and the equalized current use value equals the D.R.A. adjustment for current use, conservation restriction assessment, discretionary easement, discretionary preservation easement, and taxes of farm structures and land under farm structures. EQUALIZED ASSESSED VALUATION: The sum of the modified assessed valuation and the D.R.A. inventory adjustment. PAYMENT IN LIEU OF TAXES: The equalized value for payments received in lieu of taxes including State and Federal Forest Reimbursements, Recreational Land Reimbursements, Flood Land Reimbursements, and others. TOTAL EQUALIZED VALUATION Not Including UTILITY VALUE AND EQUALIZED RAILROAD: The sum of the equalized assessed valuation and the equalized value of payments in lieu of taxes. The 2009 “total equalized valuation not including utility and equalized value of railroad monies reimbursed to municipalities” was used to apportion the education property tax for the tax year 2011. EQUALIZATION RATIO: The 2011 sales assessment ratio as determined by a ratio study conducted by the Department of Revenue Administration’s equalization staff. % PROPORTION TO STATE TAX: The percentage of proportion to $1,000 of tax that is to be allocated to each town within the state by comparing each town’s total equalized value to the total equalized value of the state. STATE & COUNTY RATIOS: The state and county gross assessed values divided by the total equalized valuation. The state and county ratios are calculated for statistical purposes only. They are not applied to any figure as part of the equalization process.
APPEAL OF TOTAL EQUALIZED VALUATION
Municipalities were sent their 2011 Notification of Total Equalized Valuation on April 30, 2012. Per RSA 71-B:5 II, any municipality aggrieved by the total equalized valuation as determined by the D.R.A. must appeal to the Board of Tax and Land Appeals in writing within 30 days of the town’s notification of the municipality’s total equalized valuation. The appeal period is not extended due to any communication, either verbal or written, between the D.R.A. and a municipality with regards to the total equalized valuation.
NH DRA 2012 Annual Report - Page 157

EQUALIZATION SURVEY Not Including UTILITIES AND RAILROAD
MODIFIED LOCAL
ASSESSED VALUATION
DRA INVENTORY
ADJUSTMENT
EQUALIZED ASSESSED VALUATION
EQUALIZED PAYMENT IN
LIEU OF TAXES *
TOTAL EQUALIZED VALUATION Not
Including UTILITIES and RAILROADS
2011 EQ
RATIO
% PROPORTION
TO STATE TAX
MUNICIPALITY
ACWORTH 0 93,645,730 93,657,51811,78893,645,730 100.0 0.0627%
ALBANY 10,429 102,990,310 105,331,5082,341,198102,979,881 100.0 0.0705%
ALEXANDRIA 0 184,661,814 184,885,531223,717184,661,814 100.0 0.1238%
ALLENSTOWN -29,168,820 231,777,884 232,087,528309,644260,946,704 112.6 0.1554%
ALSTEAD -19,586,116 156,712,111 156,712,230119176,298,227 112.5 0.1049%
ALTON 41,547,653 1,484,678,733 1,485,046,062367,3281,443,131,081 97.2 0.9941%
AMHERST 34,437,077 1,570,120,577 1,571,098,604978,0261,535,683,500 97.8 1.0517%
ANDOVER -9,690,275 245,999,126 246,015,49816,372255,689,401 103.9 0.1647%
ANTRIM -17,027,237 228,665,963 228,756,41390,450245,693,200 107.5 0.1531%
ASHLAND -31,216,935 228,002,927 230,464,7202,461,793259,219,862 113.7 0.1543%
ATKINSON 0 835,567,317 835,567,3170835,567,317 100.0 0.5593%
ATKINSON & GILMANTON 0 747,203 747,2030747,203 100.0 0.0005%
AUBURN 0 604,039,091 647,078,21543,039,124604,039,091 100.0 0.4331%
BARNSTEAD 37,671,714 496,818,128 496,818,1280459,146,414 92.4 0.3326%
BARRINGTON -81,916,611 819,439,474 820,155,275715,801901,356,085 110.0 0.5490%
BARTLETT 39,696,300 945,826,431 947,505,7281,679,297906,130,131 95.8 0.6342%
BATH 0 106,347,132 106,381,48234,350106,347,132 100.0 0.0712%
BEAN'S GRANT 0 0 000 100.0 0.0000%
BEAN'S PURCHASE 0 20,650 20,650020,650 100.0 0.0000%
BEDFORD -14,824 3,339,201,939 3,339,208,7356,7963,339,216,763 100.0 2.2352%
BELMONT -101,599,410 623,659,250 624,330,070670,820725,258,660 116.3 0.4179%
BENNINGTON -10,589,190 102,662,826 102,682,32919,504113,252,016 110.5 0.0687%
BENTON 540,165 26,909,487 28,179,4951,270,00726,369,322 98.0 0.0189%
BERLIN -39,995,152 288,236,388 297,631,4879,395,100328,231,540 113.9 0.1992%
BETHLEHEM 0 227,895,837 230,027,2082,131,371227,895,837 100.0 0.1540%
BOSCAWEN -57,519,076 214,397,993 214,421,12123,128271,917,069 126.9 0.1435%
BOW 43,493,015 888,171,137 888,177,8286,691844,678,122 95.1 0.5945%
BRADFORD 0 214,823,998 214,876,18752,189214,823,998 100.0 0.1438%
BRENTWOOD 0 466,845,515 466,845,5150466,845,515 100.0 0.3125%
BRIDGEWATER -49,740 320,803,260 320,803,2600320,853,000 100.0 0.2147%
BRISTOL 12,988,290 464,451,559 465,350,635899,077451,463,269 97.2 0.3115%
BROOKFIELD 0 102,766,197 102,766,1970102,766,197 100.0 0.0688%
BROOKLINE -121,483,744 462,104,410 462,104,4100583,588,154 126.3 0.3093%
CAMBRIDGE 0 8,163,506 8,163,50608,163,506 100.0 0.0055%
CAMPTON 0 400,657,380 400,805,963148,583400,657,380 100.0 0.2683%
CANAAN 31,230,646 345,669,072 345,753,38284,310314,438,426 90.9 0.2314%
CANDIA -73,763 404,123,145 404,139,45216,306404,196,908 100.0 0.2705%
CANTERBURY 0 239,552,466 239,805,859253,393239,552,466 100.0 0.1605%
CARROLL -89,365,560 307,438,266 308,220,374782,109396,803,826 129.1 0.2063%
CENTER HARBOR -60,902,713 411,564,126 411,564,322196472,466,839 114.8 0.2755%
CHANDLER'S PURCHASE 0 47,210 47,210047,210 100.0 0.0000%
CHARLESTOWN -12,899,925 249,670,304 250,167,141496,836262,570,229 105.2 0.1675%
CHATHAM 16,976 51,056,248 52,541,9741,485,72551,039,272 100.0 0.0352%
CHESTER -132,404 446,586,696 446,586,6960446,719,100 100.0 0.2989%
*Flood control, forest, recreation lands and others.NH DRA 2012 Annual Report - Page 158

EQUALIZATION SURVEY Not Including UTILITIES AND RAILROAD
MODIFIED LOCAL
ASSESSED VALUATION
DRA INVENTORY
ADJUSTMENT
EQUALIZED ASSESSED VALUATION
EQUALIZED PAYMENT IN
LIEU OF TAXES *
TOTAL EQUALIZED VALUATION Not
Including UTILITIES and RAILROADS
2011 EQ
RATIO
% PROPORTION
TO STATE TAX
MUNICIPALITY
CHESTERFIELD -80,491,042 478,144,758 478,875,136730,379558,635,800 116.9 0.3205%
CHICHESTER -44,714,136 248,441,329 248,441,3290293,155,465 118.0 0.1663%
CLAREMONT -165,938 807,630,282 810,176,8462,546,564807,796,220 100.0 0.5423%
CLARKSVILLE 0 39,940,392 44,752,0564,811,66439,940,392 100.0 0.0300%
COLEBROOK -16,263,155 158,070,557 158,070,5570174,333,712 110.3 0.1058%
COLUMBIA 0 64,392,227 64,642,935250,70864,392,227 100.0 0.0433%
CONCORD 0 3,573,659,700 3,593,802,87120,143,1713,573,659,700 100.0 2.4056%
CONWAY 50,634,535 1,421,312,635 1,422,593,0591,280,4241,370,678,100 96.4 0.9522%
CORNISH 0 182,577,345 183,076,828499,483182,577,345 100.0 0.1225%
CRAWFORD'S PURCHASE 0 162,110 162,1100162,110 100.0 0.0001%
CROYDON -4,131,812 88,537,397 88,537,397092,669,209 104.8 0.0593%
CUTT'S GRANT 0 0 000 100.0 0.0000%
DALTON -9,939,448 79,910,556 79,931,36220,80689,850,004 112.5 0.0535%
DANBURY 6,527,668 114,208,023 114,208,0230107,680,355 94.2 0.0764%
DANVILLE 0 325,544,890 325,545,117227325,544,890 100.0 0.2179%
DEERFIELD -36,109,958 442,471,558 442,588,714117,156478,581,516 108.2 0.2963%
DEERING -14,386,025 177,336,975 177,348,47611,501191,723,000 108.2 0.1187%
DERRY 0 2,493,151,369 2,495,812,8272,661,4582,493,151,369 100.0 1.6706%
DIX GRANT 0 926,086 926,0860926,086 100.0 0.0006%
DIXVILLE 0 16,612,377 16,618,8396,46216,612,377 100.0 0.0111%
DORCHESTER -3,657,126 36,777,123 36,802,58125,45840,434,249 110.4 0.0246%
DOVER 77,762,842 2,680,969,242 2,683,306,1202,336,8782,603,206,400 97.1 1.7961%
DUBLIN -28,024,413 225,515,262 226,147,742632,480253,539,675 112.5 0.1514%
DUMMER -1,314,998 30,547,003 30,547,003031,862,001 104.5 0.0204%
DUNBARTON 0 283,456,231 284,480,2631,024,032283,456,231 100.0 0.1904%
DURHAM 0 889,214,313 891,310,3412,096,028889,214,313 100.0 0.5966%
EAST KINGSTON 0 279,196,855 279,199,1562,301279,196,855 100.0 0.1869%
EASTON 0 65,126,869 65,829,966703,09765,126,869 100.0 0.0441%
EATON 2,868,108 105,359,748 105,359,7480102,491,640 97.2 0.0705%
EFFINGHAM 0 176,892,900 178,162,6791,269,779176,892,900 100.0 0.1193%
ELLSWORTH 80,672 13,260,162 13,879,879619,71713,179,490 99.4 0.0093%
ENFIELD 0 552,215,679 552,215,6790552,215,679 100.0 0.3696%
EPPING -21,248,939 591,803,961 591,803,9610613,052,900 103.6 0.3961%
EPSOM 47,973 400,168,926 401,023,707854,781400,120,953 100.0 0.2684%
ERROL 0 76,555,785 77,927,4331,371,64876,555,785 100.0 0.0522%
ERVING'S GRANT 0 76,880 76,880076,880 100.0 0.0001%
EXETER 8,000 1,577,424,562 1,578,888,1691,463,6081,577,416,562 100.0 1.0569%
FARMINGTON -82,521,805 388,007,745 388,236,697228,951470,529,550 121.3 0.2599%
FITZWILLIAM -48,880,084 224,890,216 224,918,23528,019273,770,300 121.8 0.1506%
FRANCESTOWN -10,069,408 196,845,933 196,845,9330206,915,341 105.1 0.1318%
FRANCONIA 0 280,363,653 281,979,9441,616,291280,363,653 100.0 0.1887%
FRANKLIN 0 541,045,550 548,096,3667,050,816541,045,550 100.0 0.3669%
FREEDOM 0 484,608,324 484,608,3240484,608,324 100.0 0.3244%
FREMONT 0 359,055,681 359,055,6810359,055,681 100.0 0.2403%
*Flood control, forest, recreation lands and others.NH DRA 2012 Annual Report - Page 159

EQUALIZATION SURVEY Not Including UTILITIES AND RAILROAD
MODIFIED LOCAL
ASSESSED VALUATION
DRA INVENTORY
ADJUSTMENT
EQUALIZED ASSESSED VALUATION
EQUALIZED PAYMENT IN
LIEU OF TAXES *
TOTAL EQUALIZED VALUATION Not
Including UTILITIES and RAILROADS
2011 EQ
RATIO
% PROPORTION
TO STATE TAX
MUNICIPALITY
GILFORD 102,206,671 1,621,824,901 1,622,771,413946,5121,519,618,230 93.7 1.0862%
GILMANTON 0 468,780,864 468,902,193121,329468,780,864 100.0 0.3139%
GILSUM 0 63,705,966 63,705,966063,705,966 100.0 0.0426%
GOFFSTOWN -38,463 1,300,196,237 1,300,196,23701,300,234,700 100.0 0.8703%
GORHAM -20,332,075 228,403,825 229,329,121925,296248,735,900 108.9 0.1535%
GOSHEN 0 74,600,265 74,632,16231,89774,600,265 100.0 0.0500%
GRAFTON 0 125,837,466 125,837,4660125,837,466 100.0 0.0842%
GRANTHAM 0 506,048,351 506,048,3510506,048,351 100.0 0.3387%
GREENFIELD -12,306,639 143,234,836 152,924,4289,689,592155,541,475 108.6 0.1024%
GREENLAND 0 654,973,400 654,973,4000654,973,400 100.0 0.4384%
GREEN'S GRANT 0 4,049,693 4,159,692109,9994,049,693 100.0 0.0028%
GREENVILLE -32,816,885 100,113,761 101,211,1211,097,360132,930,646 132.8 0.0677%
GROTON 0 64,000,316 64,057,51057,19464,000,316 100.0 0.0429%
HADLEY'S PURCHASE 0 0 000 100.0 0.0000%
HALE'S LOCATION 0 73,891,800 73,964,50172,70173,891,800 100.0 0.0495%
HAMPSTEAD -39,893,920 949,976,039 951,483,6361,507,597989,869,959 104.2 0.6369%
HAMPTON 84,446,626 2,725,165,326 2,725,165,32602,640,718,700 96.9 1.8242%
HAMPTON FALLS -20,987,892 404,134,208 404,134,2080425,122,100 105.2 0.2705%
HANCOCK -98,816 236,224,610 237,802,5151,577,905236,323,426 100.0 0.1592%
HANOVER 0 1,963,814,300 1,966,645,8662,831,5661,963,814,300 100.0 1.3164%
HARRISVILLE -13,667,220 196,029,239 196,090,80161,562209,696,459 107.0 0.1313%
HART'S LOCATION 381,172 15,880,039 16,398,813518,77515,498,867 97.6 0.0110%
HAVERHILL 12,492,237 341,396,806 342,202,336805,530328,904,569 96.3 0.2291%
HEBRON -8,919,441 247,972,737 253,904,0985,931,361256,892,178 103.6 0.1700%
HENNIKER -14,379,198 363,735,301 365,171,7521,436,451378,114,499 104.0 0.2444%
HILL -13,183,719 84,988,040 85,746,408758,36898,171,759 115.6 0.0574%
HILLSBOROUGH -124,462,575 454,310,476 454,427,209116,732578,773,051 127.4 0.3042%
HINSDALE -27,886,049 242,846,841 242,923,32176,479270,732,890 111.5 0.1626%
HOLDERNESS 0 686,876,131 687,181,626305,495686,876,131 100.0 0.4600%
HOLLIS -66,913,829 1,174,809,441 1,174,811,2771,8361,241,723,270 105.7 0.7864%
HOOKSETT -139,730,975 1,471,144,196 1,471,194,00649,8101,610,875,171 109.5 0.9848%
HOPKINTON 117,288 629,455,383 634,990,1615,534,778629,338,095 100.0 0.4250%
HUDSON -314,056,797 2,512,450,769 2,512,450,76902,826,507,566 112.5 1.6818%
JACKSON -55,751,369 328,540,099 329,961,2801,421,181384,291,468 117.0 0.2209%
JAFFREY 0 448,503,317 448,783,264279,947448,503,317 100.0 0.3004%
JEFFERSON 0 119,358,959 120,270,658911,699119,358,959 100.0 0.0805%
KEENE -34,115,602 1,796,731,898 1,798,956,8742,224,9761,830,847,500 101.9 1.2042%
KENSINGTON -49,833,167 286,949,476 286,949,4760336,782,643 117.4 0.1921%
KILKENNY 0 0 000 100.0 0.0000%
KINGSTON -64,375,023 637,407,752 637,410,3872,635701,782,775 110.1 0.4267%
LACONIA 55,663,202 1,919,420,753 1,941,032,94421,612,1911,863,757,551 97.1 1.2993%
LANCASTER -42,538,929 228,789,681 231,613,8522,824,172271,328,610 118.7 0.1550%
LANDAFF 0 48,977,938 49,183,584205,64648,977,938 100.0 0.0329%
LANGDON -117,815 59,606,095 59,635,72029,62559,723,910 100.0 0.0399%
*Flood control, forest, recreation lands and others.NH DRA 2012 Annual Report - Page 160

EQUALIZATION SURVEY Not Including UTILITIES AND RAILROAD
MODIFIED LOCAL
ASSESSED VALUATION
DRA INVENTORY
ADJUSTMENT
EQUALIZED ASSESSED VALUATION
EQUALIZED PAYMENT IN
LIEU OF TAXES *
TOTAL EQUALIZED VALUATION Not
Including UTILITIES and RAILROADS
2011 EQ
RATIO
% PROPORTION
TO STATE TAX
MUNICIPALITY
LEBANON 23,466 1,761,564,797 1,813,095,63651,530,8391,761,541,331 100.0 1.2136%
LEE -23,900,771 389,325,778 389,427,789102,011413,226,549 106.1 0.2607%
LEMPSTER 0 118,432,228 118,451,61119,383118,432,228 100.0 0.0793%
LINCOLN 38,964,900 779,383,200 784,554,0115,170,811740,418,300 95.0 0.5252%
LISBON 0 109,058,279 109,058,2790109,058,279 100.0 0.0730%
LITCHFIELD -20,457,466 758,115,585 759,818,1471,702,562778,573,051 102.7 0.5086%
LITTLETON 0 534,312,900 536,567,8022,254,902534,312,900 100.0 0.3592%
LIVERMORE 0 145,080 145,0800145,080 100.0 0.0001%
LONDONDERRY -323,953,543 2,551,476,672 2,577,023,04025,546,3682,875,430,215 112.7 1.7250%
LOUDON -21,246,969 496,411,186 500,230,2973,819,111517,658,155 104.3 0.3348%
LOW & BURBANK GRANT 0 0 000 100.0 0.0000%
LYMAN 13,272 59,737,840 59,737,840059,724,568 100.0 0.0400%
LYME 0 321,356,300 321,356,3000321,356,300 100.0 0.2151%
LYNDEBOROUGH 77,403 164,382,061 164,382,774712164,304,658 100.0 0.1100%
MADBURY -33,034 222,044,176 222,044,1760222,077,210 100.0 0.1486%
MADISON 0 448,171,459 449,063,815892,356448,171,459 100.0 0.3006%
MANCHESTER -19,469 8,234,777,631 8,271,099,19436,321,5638,234,797,100 100.0 5.5365%
MARLBOROUGH 0 178,748,130 178,874,241126,111178,748,130 100.0 0.1197%
MARLOW -9,226,381 54,791,179 54,822,65031,47064,017,560 117.2 0.0367%
MARTIN'S LOCATION 0 0 000 100.0 0.0000%
MASON -77,885 159,577,116 159,606,67329,557159,655,001 100.0 0.1068%
MEREDITH -35,585 1,842,698,926 1,842,723,60624,6801,842,734,511 100.0 1.2335%
MERRIMACK -62,820,894 2,731,829,515 2,732,089,143259,6282,794,650,409 102.3 1.8288%
MIDDLETON -18,873,794 161,425,553 161,425,5530180,299,347 111.7 0.1081%
MILAN -8,518,550 97,460,927 97,673,256212,330105,979,477 108.9 0.0654%
MILFORD 56,625,646 1,317,946,193 1,319,027,2031,081,0101,261,320,547 95.7 0.8829%
MILLSFIELD 0 6,387,827 6,387,82706,387,827 100.0 0.0043%
MILTON 0 361,030,524 361,030,5240361,030,524 100.0 0.2417%
MONROE -14,804,981 75,107,306 75,107,306089,912,287 119.8 0.0503%
MONT VERNON 0 254,849,960 254,849,9600254,849,960 100.0 0.1706%
MOULTONBOROUGH 177,865,949 2,916,323,896 2,921,008,1984,684,3022,738,457,947 93.9 1.9552%
NASHUA -315,049,736 8,078,317,645 8,078,317,64508,393,367,381 103.9 5.4074%
NELSON 4,761,387 119,927,340 119,927,3400115,165,953 96.0 0.0803%
NEW BOSTON 0 525,918,727 525,932,84414,117525,918,727 100.0 0.3520%
NEW CASTLE 0 636,038,831 636,038,8310636,038,831 100.0 0.4257%
NEW DURHAM 0 415,728,820 415,728,8200415,728,820 100.0 0.2783%
NEW HAMPTON 0 314,850,694 315,346,718496,024314,850,694 100.0 0.2111%
NEW IPSWICH -51,160,946 358,166,022 358,172,1526,130409,326,968 114.3 0.2398%
NEW LONDON 66,511 1,074,925,679 1,074,925,67901,074,859,168 100.0 0.7195%
NEWBURY 21,992,897 710,414,490 710,483,52669,036688,421,593 96.9 0.4756%
NEWFIELDS -23,465 257,974,112 257,974,1120257,997,577 100.0 0.1727%
NEWINGTON 0 497,410,857 497,411,9741,117497,410,857 100.0 0.3330%
NEWMARKET -41,402,610 714,339,254 715,022,875683,621755,741,864 105.8 0.4786%
NEWPORT -49,965,450 442,062,862 444,319,2082,256,346492,028,312 111.3 0.2974%
*Flood control, forest, recreation lands and others.NH DRA 2012 Annual Report - Page 161

EQUALIZATION SURVEY Not Including UTILITIES AND RAILROAD
MODIFIED LOCAL
ASSESSED VALUATION
DRA INVENTORY
ADJUSTMENT
EQUALIZED ASSESSED VALUATION
EQUALIZED PAYMENT IN
LIEU OF TAXES *
TOTAL EQUALIZED VALUATION Not
Including UTILITIES and RAILROADS
2011 EQ
RATIO
% PROPORTION
TO STATE TAX
MUNICIPALITY
NEWTON -36,664,856 416,927,641 416,927,6410453,592,497 108.8 0.2791%
NORTH HAMPTON 0 1,004,870,000 1,004,870,00001,004,870,000 100.0 0.6726%
NORTHFIELD -54,725,763 294,176,397 296,244,3812,067,984348,902,160 118.6 0.1983%
NORTHUMBERLAND -13,549,222 95,085,025 95,390,837305,812108,634,247 114.3 0.0639%
NORTHWOOD -16,789,894 454,849,432 455,161,286311,854471,639,326 103.7 0.3047%
NOTTINGHAM 21,707,374 556,722,518 557,166,533444,014535,015,144 96.1 0.3730%
ODELL 0 2,180,938 2,180,93802,180,938 100.0 0.0015%
ORANGE 0 28,097,023 28,356,391259,36828,097,023 100.0 0.0190%
ORFORD -9,111,464 134,525,162 134,525,1620143,636,626 106.8 0.0900%
OSSIPEE -112,085 695,705,694 695,804,39698,702695,817,779 100.0 0.4658%
PELHAM 31,693,494 1,378,471,458 1,379,575,3501,103,8921,346,777,964 97.7 0.9235%
PEMBROKE -60,016,543 532,028,040 533,235,1671,207,127592,044,583 111.3 0.3569%
PETERBOROUGH 24,017,831 633,660,518 635,167,9981,507,480609,642,687 96.2 0.4252%
PIERMONT 0 96,497,788 96,620,027122,23996,497,788 100.0 0.0647%
PINKHAM'S GRANT 0 2,761,020 2,884,553123,5332,761,020 100.0 0.0019%
PITTSBURG -20,051,768 255,949,499 260,127,5654,178,066276,001,267 107.9 0.1741%
PITTSFIELD -36,047,150 223,244,270 223,505,309261,039259,291,420 116.2 0.1496%
PLAINFIELD 0 282,072,682 282,120,68047,998282,072,682 100.0 0.1888%
PLAISTOW 46,659,188 863,991,033 863,991,0330817,331,845 94.6 0.5783%
PLYMOUTH -44,229,615 392,049,370 395,063,9253,014,556436,278,985 111.3 0.2644%
PORTSMOUTH 130,546,681 3,955,977,401 4,001,645,91245,668,5113,825,430,720 96.7 2.6786%
RANDOLPH -5,312,443 58,930,583 60,791,1251,860,54264,243,026 109.0 0.0407%
RAYMOND -72,503 811,777,183 812,215,867438,684811,849,686 100.0 0.5437%
RICHMOND 0 100,469,750 100,545,83776,087100,469,750 100.0 0.0673%
RINDGE -31,552,502 518,882,408 519,016,079133,671550,434,910 106.1 0.3474%
ROCHESTER 43,099 1,972,380,969 1,987,543,72115,162,7511,972,337,870 100.0 1.3304%
ROLLINSFORD -13,573,955 247,222,010 247,222,0100260,795,965 105.5 0.1655%
ROXBURY -250,273 25,027,334 28,235,6183,208,28525,277,607 101.0 0.0189%
RUMNEY -11,093,339 171,768,345 172,402,325633,981182,861,684 106.5 0.1154%
RYE 0 1,763,836,690 1,764,869,1431,032,4531,763,836,690 100.0 1.1814%
SALEM -46,130 3,770,221,081 3,773,696,7513,475,6703,770,267,211 100.0 2.5260%
SALISBURY -23,323,070 123,518,572 124,701,4571,182,885146,841,642 119.0 0.0835%
SANBORNTON -26,022,880 402,624,190 403,339,549715,359428,647,070 106.5 0.2700%
SANDOWN -80,392,355 518,698,645 518,698,6450599,091,000 115.5 0.3472%
SANDWICH 218,350 434,558,658 435,622,5901,063,932434,340,308 100.0 0.2916%
SARGENT'S PURCHASE 0 1,852,720 1,852,72001,852,720 100.0 0.0012%
SEABROOK 55,165,079 1,379,147,929 1,379,147,92901,323,982,850 96.0 0.9232%
SECOND COLLEGE GRANT 0 1,434,022 1,434,02201,434,022 100.0 0.0010%
SHARON -1,812,952 52,011,981 52,022,75810,77753,824,933 103.4 0.0348%
SHELBURNE -61,651 50,529,435 51,405,198875,76250,591,086 100.0 0.0344%
SOMERSWORTH -40,439,190 793,039,546 796,151,5493,112,003833,478,736 105.1 0.5329%
SOUTH HAMPTON -21,022,837 140,245,574 140,249,4603,886161,268,411 115.0 0.0939%
SPRINGFIELD -10,730,544 177,223,651 177,680,726457,075187,954,195 106.1 0.1189%
STARK -3,119,247 52,701,857 53,897,4171,195,56055,821,104 106.0 0.0361%
*Flood control, forest, recreation lands and others.NH DRA 2012 Annual Report - Page 162

EQUALIZATION SURVEY Not Including UTILITIES AND RAILROAD
MODIFIED LOCAL
ASSESSED VALUATION
DRA INVENTORY
ADJUSTMENT
EQUALIZED ASSESSED VALUATION
EQUALIZED PAYMENT IN
LIEU OF TAXES *
TOTAL EQUALIZED VALUATION Not
Including UTILITIES and RAILROADS
2011 EQ
RATIO
% PROPORTION
TO STATE TAX
MUNICIPALITY
STEWARTSTOWN -18,256,369 81,584,827 81,672,87588,04899,841,197 122.6 0.0547%
STODDARD 0 277,404,600 277,468,71064,110277,404,600 100.0 0.1857%
STRAFFORD 0 449,287,400 449,287,4000449,287,400 100.0 0.3007%
STRATFORD 0 41,326,283 42,153,233826,95041,326,283 100.0 0.0282%
STRATHAM -90,613,069 1,092,087,301 1,092,087,30101,182,700,370 108.3 0.7310%
SUCCESS 0 10,950,276 10,950,276010,950,276 100.0 0.0073%
SUGAR HILL 84,644 148,021,747 148,021,7470147,937,103 100.0 0.0991%
SULLIVAN 0 55,218,489 55,218,489055,218,489 100.0 0.0370%
SUNAPEE 78,997,961 1,215,413,781 1,215,413,78101,136,415,820 93.5 0.8136%
SURRY 0 82,026,347 82,595,082568,73582,026,347 100.0 0.0553%
SUTTON 72,143 266,827,932 266,829,7511,819266,755,789 100.0 0.1786%
SWANZEY -43,439,629 532,377,113 533,692,7201,315,608575,816,742 108.2 0.3572%
TAMWORTH -52,090,432 291,449,610 292,391,234941,624343,540,042 118.0 0.1957%
TEMPLE 0 150,902,579 150,937,73035,151150,902,579 100.0 0.1010%
THOM & MES PURCHASE 0 5,450,080 6,042,815592,7355,450,080 100.0 0.0040%
THORNTON -46,313 367,470,230 370,596,1093,125,879367,516,543 100.0 0.2481%
TILTON 0 494,322,006 494,566,191244,185494,322,006 100.0 0.3310%
TROY 0 118,491,992 118,500,8078,815118,491,992 100.0 0.0793%
TUFTONBORO 0 1,014,432,030 1,015,725,6011,293,5711,014,432,030 100.0 0.6799%
UNITY 0 129,674,340 129,698,96324,623129,674,340 100.0 0.0868%
WAKEFIELD 0 906,928,866 907,597,204668,338906,928,866 100.0 0.6075%
WALPOLE -177,525 427,510,996 427,510,9960427,688,521 100.0 0.2862%
WARNER 0 276,664,265 277,497,548833,283276,664,265 100.0 0.1857%
WARREN -5,149,459 65,105,709 65,956,980851,27170,255,168 108.0 0.0441%
WASHINGTON -12,256,047 235,634,904 235,881,045246,141247,890,951 105.2 0.1579%
WATERVILLE VALLEY -38,626,961 321,920,748 324,006,6322,085,884360,547,709 112.0 0.2169%
WEARE -22,470,740 750,917,353 751,986,4591,069,106773,388,093 103.0 0.5034%
WEBSTER -33,501,446 183,441,844 183,930,396488,552216,943,290 118.3 0.1231%
WENTWORTH 5,008,536 90,912,201 91,151,705239,50485,903,665 94.4 0.0610%
WENTWORTH LOCATION 0 9,259,788 9,277,59517,8079,259,788 100.0 0.0062%
WESTMORELAND 5,456,694 178,589,106 178,590,1801,073173,132,412 96.9 0.1195%
WHITEFIELD -39,449,506 151,383,914 153,653,4842,269,570190,833,420 126.2 0.1029%
WILMOT 0 177,319,066 177,401,88482,818177,319,066 100.0 0.1187%
WILTON -305,714 363,700,881 363,972,228271,347364,006,595 100.0 0.2436%
WINCHESTER 11,974,053 286,920,763 287,788,333867,569274,946,710 95.8 0.1926%
WINDHAM 28,783,759 2,055,612,529 2,056,153,128540,6002,026,828,770 98.6 1.3763%
WINDSOR 198,952 22,454,236 26,287,0743,832,83822,255,284 99.1 0.0176%
WOLFEBORO 0 2,052,746,800 2,053,993,3901,246,5902,052,746,800 100.0 1.3749%
WOODSTOCK 17,299,836 250,734,856 252,368,8191,633,962233,435,020 93.1 0.1689%
103.2STATE TOTALS 151,540,903,690 -2,666,446,787 148,874,456,903 447,568,976 149,322,025,879 100.00%
*Flood control, forest, recreation lands and others.NH DRA 2012 Annual Report - Page 163

BASE VALUATION FOR DEBT LIMITS
RSA 33:4-b Debt Limit; Computation. The debt limitations hereinbefore prescribed,
except for counties, shall be based upon the applicable last locally assessed valuation of
the municipality as last equalized by the commissioner of revenue administration under
RSA 21-J:3, XIII and shall include the equalized value of property formerly taxed
pursuant to the provisions of RSA 72:7; 72:15, I, V, VII, VIII, IX, X and XI; 72:16;
72:17; 73:26; 73:27 and 73:11 through 16 inclusive, all as amended, which was relieved
from taxation by 1970, 5:3, 5:8, and 57:12, as determined under the provisions of RSA
71:11 as amended. Whenever several municipalities possessing the power to incur
indebtedness cover or extend over identical territory, each such municipality shall so
exercise the power to incur indebtedness of such municipalities shall not exceed 9.75
percent of the valuation of the taxable property as hereinbefore determined, except as
provided for cooperative school districts under RSA 195:6. A written certificate signed
by the commissioner of the department of revenue administration shall be conclusive
evidence of the base valuation of municipalities for computing debt limits hereunder.
NH DRA 2012 Annual Report - Page 164

MODIFIED LOCAL
ASSESSED VALUATION
DRA INVENTORY
ADJUSTMENT
EQUALIZED ASSESSED VALUATION
SHARED REVENUES
ADJUSTMENT RSA 31-A
BASE VALUATION FOR DEBT
LIMITS
MUNICIPALITY
2011 BASE VALUATION FOR DEBT LIMITS
ACWORTH 94,987,762 0 94,987,762 0 94,987,762
ALBANY 103,800,381 -118,935 103,681,446 0 103,681,446
ALEXANDRIA 201,848,914 -8,393,944 193,454,970 0 193,454,970
ALLENSTOWN 269,262,744 -33,773,451 235,489,293 0 235,489,293
ALSTEAD 179,106,027 -20,026,480 159,079,547 0 159,079,547
ALTON 1,448,055,003 41,548,527 1,489,603,530 0 1,489,603,530
AMHERST 1,573,177,700 23,984,630 1,597,162,330 0 1,597,162,330
ANDOVER 268,444,901 -18,756,557 249,688,344 0 249,688,344
ANTRIM 253,187,000 -20,924,437 232,262,563 0 232,262,563
ASHLAND 265,058,592 -33,559,117 231,499,475 0 231,499,475
ATKINSON 842,581,717 -91,196 842,490,521 0 842,490,521
ATKINSON & GILMANTON 747,203 0 747,203 0 747,203
AUBURN 611,563,791 -3,911,356 607,652,435 0 607,652,435
BARNSTEAD 464,889,033 37,910,983 502,800,016 0 502,800,016
BARRINGTON 915,679,185 -89,597,639 826,081,546 0 826,081,546
BARTLETT 911,602,331 39,696,280 951,298,611 0 951,298,611
BATH 128,135,832 -6,418,468 121,717,364 0 121,717,364
BEAN'S GRANT 462 0 462 0 462
BEAN'S PURCHASE 20,650 0 20,650 0 20,650
BEDFORD 3,376,413,751 -5,016,486 3,371,397,265 0 3,371,397,265
BELMONT 734,429,960 -103,037,717 631,392,243 0 631,392,243
BENNINGTON 114,395,879 -10,696,900 103,698,979 0 103,698,979
BENTON 27,142,188 540,166 27,682,354 0 27,682,354
BERLIN 439,311,540 -115,589,775 323,721,765 0 323,721,765
BETHLEHEM 232,792,333 -74 232,792,259 0 232,792,259
BOSCAWEN 278,029,369 -57,931,389 220,097,980 0 220,097,980
BOW 1,051,889,828 174,876,389 1,226,766,217 0 1,226,766,217
BRADFORD 218,951,498 -2,288,579 216,662,919 0 216,662,919
BRENTWOOD 483,047,315 -8,501,328 474,545,987 0 474,545,987
BRIDGEWATER 333,854,083 -6,536,590 327,317,493 0 327,317,493
BRISTOL 470,498,169 -455,436 470,042,733 0 470,042,733
BROOKFIELD 104,111,997 -686,671 103,425,326 0 103,425,326
BROOKLINE 591,464,954 -125,199,327 466,265,627 0 466,265,627
CAMBRIDGE 8,318,772 0 8,318,772 0 8,318,772
CAMPTON 408,651,078 -307,450 408,343,628 0 408,343,628
CANAAN 322,379,726 26,447,192 348,826,918 0 348,826,918
CANDIA 408,698,890 -456,823 408,242,067 0 408,242,067
CANTERBURY 244,268,766 -299,752 243,969,014 0 243,969,014
CARROLL 399,514,406 -89,801,325 309,713,081 0 309,713,081
CENTER HARBOR 473,740,281 -60,902,714 412,837,567 0 412,837,567
CHANDLER'S PURCHASE 49,152 0 49,152 0 49,152
CHARLESTOWN 271,273,597 -12,899,925 258,373,672 0 258,373,672
CHATHAM 51,636,272 38,006 51,674,278 0 51,674,278
CHESTER 468,388,800 -13,864,275 454,524,525 0 454,524,525
CHESTERFIELD 562,766,614 -80,943,482 481,823,132 0 481,823,132
CHICHESTER 297,460,965 -45,569,277 251,891,688 0 251,891,688
CLAREMONT 822,522,920 4,730,146 827,253,066 0 827,253,066
CLARKSVILLE 40,859,992 21,994 40,881,986 0 40,881,986
NH DRA 2012 Annual Report - Page 165

MODIFIED LOCAL
ASSESSED VALUATION
DRA INVENTORY
ADJUSTMENT
EQUALIZED ASSESSED VALUATION
SHARED REVENUES
ADJUSTMENT RSA 31-A
BASE VALUATION FOR DEBT
LIMITS
MUNICIPALITY
2011 BASE VALUATION FOR DEBT LIMITS
COLEBROOK 190,272,312 -21,594,083 168,678,229 0 168,678,229
COLUMBIA 85,334,027 -9,121,541 76,212,486 0 76,212,486
CONCORD 3,730,396,850 -41,648,763 3,688,748,087 0 3,688,748,087
CONWAY 1,393,963,965 51,151,781 1,445,115,746 0 1,445,115,746
CORNISH 187,094,145 -1,226,064 185,868,081 0 185,868,081
CRAWFORD'S PURCHASE 162,457 0 162,457 0 162,457
CROYDON 94,429,409 -5,087,461 89,341,948 0 89,341,948
CUTT'S GRANT 0 0 0 0 0
DALTON 93,562,708 -10,901,697 82,661,011 0 82,661,011
DANBURY 109,261,154 6,527,668 115,788,822 0 115,788,822
DANVILLE 330,590,024 0 330,590,024 0 330,590,024
DEERFIELD 537,429,916 -67,510,098 469,919,818 0 469,919,818
DEERING 201,959,200 -18,108,104 183,851,096 0 183,851,096
DERRY 2,517,294,869 1,721,603 2,519,016,472 0 2,519,016,472
DIX GRANT 926,086 0 926,086 0 926,086
DIXVILLE 16,691,185 0 16,691,185 0 16,691,185
DORCHESTER 40,920,449 -3,657,147 37,263,302 0 37,263,302
DOVER 2,641,809,500 72,444,493 2,714,253,993 0 2,714,253,993
DUBLIN 256,735,375 -29,491,865 227,243,510 0 227,243,510
DUMMER 55,368,701 -11,161,760 44,206,941 0 44,206,941
DUNBARTON 305,427,231 -16,796,734 288,630,497 0 288,630,497
DURHAM 901,932,943 -5,983,432 895,949,511 0 895,949,511
EAST KINGSTON 299,276,855 -7,824,807 291,452,048 0 291,452,048
EASTON 65,727,057 250 65,727,307 0 65,727,307
EATON 103,297,100 2,868,106 106,165,206 0 106,165,206
EFFINGHAM 181,105,900 -2,051,272 179,054,628 0 179,054,628
ELLSWORTH 13,528,290 -90,940 13,437,350 0 13,437,350
ENFIELD 555,004,079 261,608 555,265,687 0 555,265,687
EPPING 624,188,800 -27,097,686 597,091,114 0 597,091,114
EPSOM 406,738,353 -2,864,401 403,873,952 0 403,873,952
ERROL 85,888,785 -5,442,021 80,446,764 0 80,446,764
ERVING'S GRANT 76,880 0 76,880 0 76,880
EXETER 1,603,489,293 467 1,603,489,760 0 1,603,489,760
FARMINGTON 476,028,153 -83,668,670 392,359,483 0 392,359,483
FITZWILLIAM 308,663,000 -61,101,933 247,561,067 0 247,561,067
FRANCESTOWN 210,083,441 -11,778,989 198,304,452 0 198,304,452
FRANCONIA 284,038,653 -1,809,761 282,228,892 0 282,228,892
FRANKLIN 569,730,550 -7,473,061 562,257,489 0 562,257,489
FREEDOM 487,826,724 -70 487,826,654 0 487,826,654
FREMONT 365,044,581 -3,427,506 361,617,075 0 361,617,075
GILFORD 1,526,578,470 101,852,043 1,628,430,513 0 1,628,430,513
GILMANTON 476,493,264 -4,526,650 471,966,614 0 471,966,614
GILSUM 65,450,866 -740,108 64,710,758 0 64,710,758
GOFFSTOWN 1,336,474,100 -17,314,718 1,319,159,382 0 1,319,159,382
GORHAM 310,787,600 -60,153,177 250,634,423 0 250,634,423
GOSHEN 75,290,246 0 75,290,246 0 75,290,246
GRAFTON 128,549,366 -1,362,263 127,187,103 0 127,187,103
GRANTHAM 511,091,951 -2,035,538 509,056,413 0 509,056,413
NH DRA 2012 Annual Report - Page 166

MODIFIED LOCAL
ASSESSED VALUATION
DRA INVENTORY
ADJUSTMENT
EQUALIZED ASSESSED VALUATION
SHARED REVENUES
ADJUSTMENT RSA 31-A
BASE VALUATION FOR DEBT
LIMITS
MUNICIPALITY
2011 BASE VALUATION FOR DEBT LIMITS
GREENFIELD 158,270,175 -13,502,930 144,767,245 0 144,767,245
GREENLAND 671,852,927 -2,437,205 669,415,722 0 669,415,722
GREEN'S GRANT 4,095,113 0 4,095,113 0 4,095,113
GREENVILLE 136,790,746 -35,056,013 101,734,733 0 101,734,733
GROTON 74,775,116 -7,652,846 67,122,270 0 67,122,270
HADLEY'S PURCHASE 0 0 0 0 0
HALE'S LOCATION 74,019,900 6,717 74,026,617 0 74,026,617
HAMPSTEAD 1,001,517,459 -44,813,055 956,704,404 0 956,704,404
HAMPTON 2,750,914,500 62,403,533 2,813,318,033 0 2,813,318,033
HAMPTON FALLS 434,772,900 -21,796,018 412,976,882 0 412,976,882
HANCOCK 242,032,026 -2,361,847 239,670,179 0 239,670,179
HANOVER 1,976,215,100 -6,108,742 1,970,106,358 0 1,970,106,358
HARRISVILLE 211,949,959 -14,753,881 197,196,078 0 197,196,078
HART'S LOCATION 15,736,200 381,172 16,117,372 0 16,117,372
HAVERHILL 353,154,969 -5,886,013 347,268,956 0 347,268,956
HEBRON 261,115,178 -11,576,335 249,538,843 0 249,538,843
HENNIKER 388,150,299 -20,232,436 367,917,863 0 367,917,863
HILL 107,290,359 -19,681,393 87,608,966 0 87,608,966
HILLSBOROUGH 607,273,251 -136,378,427 470,894,824 0 470,894,824
HINSDALE 371,420,890 -45,197,584 326,223,306 0 326,223,306
HOLDERNESS 690,698,431 -1,577,800 689,120,631 0 689,120,631
HOLLIS 1,248,486,670 -67,235,875 1,181,250,795 0 1,181,250,795
HOOKSETT 1,668,833,071 -162,988,846 1,505,844,225 0 1,505,844,225
HOPKINTON 652,213,995 -15,920,817 636,293,178 0 636,293,178
HUDSON 2,945,128,966 -391,187,694 2,553,941,272 0 2,553,941,272
JACKSON 385,683,068 -55,751,334 329,931,734 0 329,931,734
JAFFREY 453,796,866 0 453,796,866 0 453,796,866
JEFFERSON 123,519,359 -53,963 123,465,396 0 123,465,396
KEENE 1,881,801,200 -62,402,439 1,819,398,761 0 1,819,398,761
KENSINGTON 348,197,463 -54,637,408 293,560,055 0 293,560,055
KILKENNY 11,747 0 11,747 0 11,747
KINGSTON 713,040,555 -66,791,775 646,248,780 0 646,248,780
LACONIA 1,884,462,851 56,061,315 1,940,524,166 0 1,940,524,166
LANCASTER 285,418,210 -48,534,691 236,883,519 0 236,883,519
LANDAFF 50,981,138 -1,411,903 49,569,235 0 49,569,235
LANGDON 60,463,610 2,842,170 63,305,780 0 63,305,780
LEBANON 1,851,389,931 -37,022,389 1,814,367,542 0 1,814,367,542
LEE 417,402,349 -24,426,378 392,975,971 0 392,975,971
LEMPSTER 166,293,328 -193,605 166,099,723 0 166,099,723
LINCOLN 749,797,000 32,056,167 781,853,167 0 781,853,167
LISBON 111,414,279 233,033 111,647,312 0 111,647,312
LITCHFIELD 810,325,751 -34,911,762 775,413,989 0 775,413,989
LITTLETON 755,921,800 -136,146,872 619,774,928 0 619,774,928
LIVERMORE 145,080 0 145,080 0 145,080
LONDONDERRY 3,398,807,519 -485,340,761 2,913,466,758 0 2,913,466,758
LOUDON 529,406,355 -27,390,566 502,015,789 0 502,015,789
LOW & BURBANK GRANT 0 0 0 0 0
LYMAN 60,694,568 -62,259 60,632,309 0 60,632,309
NH DRA 2012 Annual Report - Page 167

MODIFIED LOCAL
ASSESSED VALUATION
DRA INVENTORY
ADJUSTMENT
EQUALIZED ASSESSED VALUATION
SHARED REVENUES
ADJUSTMENT RSA 31-A
BASE VALUATION FOR DEBT
LIMITS
MUNICIPALITY
2011 BASE VALUATION FOR DEBT LIMITS
LYME 325,407,200 -2,204,999 323,202,201 0 323,202,201
LYNDEBOROUGH 166,077,158 -185,623 165,891,535 0 165,891,535
MADBURY 234,161,510 -5,967,863 228,193,647 0 228,193,647
MADISON 457,784,359 -5,081,930 452,702,429 0 452,702,429
MANCHESTER 8,414,935,800 -20,019,401 8,394,916,399 0 8,394,916,399
MARLBOROUGH 182,848,070 -1,483,049 181,365,021 0 181,365,021
MARLOW 64,935,184 -9,196,534 55,738,650 0 55,738,650
MARTIN'S LOCATION 36,618 0 36,618 0 36,618
MASON 161,415,101 -407,668 161,007,433 0 161,007,433
MEREDITH 1,848,696,211 -302,409 1,848,393,802 0 1,848,393,802
MERRIMACK 2,842,452,309 -77,492,317 2,764,959,992 0 2,764,959,992
MIDDLETON 183,223,347 -20,242,438 162,980,909 0 162,980,909
MILAN 124,861,377 -18,658,181 106,203,196 0 106,203,196
MILFORD 1,277,593,426 56,625,646 1,334,219,072 0 1,334,219,072
MILLSFIELD 6,426,362 0 6,426,362 0 6,426,362
MILTON 366,957,724 -1,380,176 365,577,548 0 365,577,548
MONROE 357,506,487 -173,801,400 183,705,087 0 183,705,087
MONT VERNON 256,946,180 -378,380 256,567,800 0 256,567,800
MOULTONBOROUGH 2,746,400,236 178,077,927 2,924,478,163 0 2,924,478,163
NASHUA 8,640,947,461 -392,947,543 8,247,999,918 0 8,247,999,918
NELSON 117,571,153 3,327,090 120,898,243 0 120,898,243
NEW BOSTON 535,003,527 -4,840,657 530,162,870 0 530,162,870
NEW CASTLE 637,321,931 -588,309 636,733,622 0 636,733,622
NEW DURHAM 418,205,920 44 418,205,964 0 418,205,964
NEW HAMPTON 341,095,144 -19,364,338 321,730,806 0 321,730,806
NEW IPSWICH 418,295,406 -56,585,006 361,710,400 0 361,710,400
NEW LONDON 1,081,083,376 66,511 1,081,149,887 0 1,081,149,887
NEWBURY 693,421,593 19,620,928 713,042,521 0 713,042,521
NEWFIELDS 259,558,177 -202,007 259,356,170 0 259,356,170
NEWINGTON 962,840,362 8,438,448 971,278,810 0 971,278,810
NEWMARKET 760,757,364 -42,829,402 717,927,962 0 717,927,962
NEWPORT 504,115,212 -57,408,930 446,706,282 0 446,706,282
NEWTON 468,031,397 -38,560,493 429,470,904 0 429,470,904
NORTH HAMPTON 1,018,591,300 -2,287,650 1,016,303,650 0 1,016,303,650
NORTHFIELD 355,073,960 -55,963,320 299,110,640 0 299,110,640
NORTHUMBERLAND 132,888,527 -24,457,500 108,431,027 0 108,431,027
NORTHWOOD 475,395,626 -16,671,685 458,723,941 0 458,723,941
NOTTINGHAM 542,719,044 18,296,519 561,015,563 0 561,015,563
ODELL 2,180,938 0 2,180,938 0 2,180,938
ORANGE 28,849,023 -382,675 28,466,348 0 28,466,348
ORFORD 146,696,426 -10,652,610 136,043,816 0 136,043,816
OSSIPEE 710,710,879 -8,033,946 702,676,933 0 702,676,933
PELHAM 1,386,019,464 13,463,848 1,399,483,312 0 1,399,483,312
PEMBROKE 616,819,836 -75,848,843 540,970,993 0 540,970,993
PETERBOROUGH 619,223,887 20,751,186 639,975,073 0 639,975,073
PIERMONT 99,009,438 -1,372,841 97,636,597 0 97,636,597
PINKHAM'S GRANT 2,878,874 0 2,878,874 0 2,878,874
PITTSBURG 287,599,867 -21,218,909 266,380,958 0 266,380,958
NH DRA 2012 Annual Report - Page 168

MODIFIED LOCAL
ASSESSED VALUATION
DRA INVENTORY
ADJUSTMENT
EQUALIZED ASSESSED VALUATION
SHARED REVENUES
ADJUSTMENT RSA 31-A
BASE VALUATION FOR DEBT
LIMITS
MUNICIPALITY
2011 BASE VALUATION FOR DEBT LIMITS
PITTSFIELD 265,251,397 -36,452,628 228,798,769 0 228,798,769
PLAINFIELD 289,202,582 -3,488,383 285,714,199 0 285,714,199
PLAISTOW 841,136,685 37,588,664 878,725,349 0 878,725,349
PLYMOUTH 448,138,185 -51,552,671 396,585,514 0 396,585,514
PORTSMOUTH 3,993,267,198 135,749,616 4,129,016,814 0 4,129,016,814
RANDOLPH 68,436,226 -6,926,604 61,509,622 0 61,509,622
RAYMOND 830,976,886 -11,618,928 819,357,958 0 819,357,958
RICHMOND 104,792,150 -2,904,029 101,888,121 0 101,888,121
RINDGE 557,484,462 -32,649,670 524,834,792 0 524,834,792
ROCHESTER 2,016,520,770 -8,405,676 2,008,115,094 0 2,008,115,094
ROLLINSFORD 263,770,765 -14,982,799 248,787,966 0 248,787,966
ROXBURY 25,850,507 -481,212 25,369,295 0 25,369,295
RUMNEY 192,584,084 -18,055,004 174,529,080 0 174,529,080
RYE 1,771,183,590 -2,179,356 1,769,004,234 0 1,769,004,234
SALEM 3,833,484,511 -31,875,959 3,801,608,552 0 3,801,608,552
SALISBURY 156,492,742 -29,884,869 126,607,873 0 126,607,873
SANBORNTON 430,954,870 -25,895,759 405,059,111 0 405,059,111
SANDOWN 604,335,100 -81,080,436 523,254,664 0 523,254,664
SANDWICH 441,302,408 -3,937,111 437,365,297 0 437,365,297
SARGENT'S PURCHASE 1,852,720 0 1,852,720 0 1,852,720
SEABROOK 2,880,805,150 -283,105,986 2,597,699,164 0 2,597,699,164
SECOND COLLEGE GRANT 1,434,022 0 1,434,022 0 1,434,022
SHARON 54,540,233 -2,138,698 52,401,535 0 52,401,535
SHELBURNE 82,137,286 -13,337,559 68,799,727 0 68,799,727
SOMERSWORTH 844,222,836 -41,627,929 802,594,907 0 802,594,907
SOUTH HAMPTON 163,669,311 -21,753,825 141,915,486 0 141,915,486
SPRINGFIELD 198,581,295 -16,216,828 182,364,467 0 182,364,467
STARK 67,025,904 -3,541,009 63,484,895 0 63,484,895
STEWARTSTOWN 121,780,818 -30,898,112 90,882,706 0 90,882,706
STODDARD 282,912,770 -3,208,449 279,704,321 0 279,704,321
STRAFFORD 452,499,500 -282,019 452,217,481 0 452,217,481
STRATFORD 66,981,383 -11,005,805 55,975,578 0 55,975,578
STRATHAM 1,206,570,770 -95,259,986 1,111,310,784 0 1,111,310,784
SUCCESS 10,962,813 0 10,962,813 0 10,962,813
SUGAR HILL 149,249,051 132,229 149,381,280 0 149,381,280
SULLIVAN 56,556,589 -645,485 55,911,104 0 55,911,104
SUNAPEE 1,145,967,220 74,270,936 1,220,238,156 0 1,220,238,156
SURRY 83,429,447 300,191 83,729,638 0 83,729,638
SUTTON 269,227,087 125,154 269,352,241 0 269,352,241
SWANZEY 593,015,042 -51,467,363 541,547,679 0 541,547,679
TAMWORTH 359,244,842 -53,964,484 305,280,358 0 305,280,358
TEMPLE 153,506,579 -1,070,048 152,436,531 0 152,436,531
THOM & MES PURCHASE 5,450,764 0 5,450,764 0 5,450,764
THORNTON 373,090,143 -2,200,147 370,889,996 0 370,889,996
TILTON 518,760,906 -11,355,067 507,405,839 0 507,405,839
TROY 128,596,192 -5,069,171 123,527,021 0 123,527,021
TUFTONBORO 1,025,698,430 -6,655,992 1,019,042,438 0 1,019,042,438
UNITY 132,973,470 -1,773,090 131,200,380 0 131,200,380
NH DRA 2012 Annual Report - Page 169

MODIFIED LOCAL
ASSESSED VALUATION
DRA INVENTORY
ADJUSTMENT
EQUALIZED ASSESSED VALUATION
SHARED REVENUES
ADJUSTMENT RSA 31-A
BASE VALUATION FOR DEBT
LIMITS
MUNICIPALITY
2011 BASE VALUATION FOR DEBT LIMITS
WAKEFIELD 912,370,766 -6,859 912,363,907 0 912,363,907
WALPOLE 446,256,721 -3,439,084 442,817,637 0 442,817,637
WARNER 282,229,195 -3,116,725 279,112,470 0 279,112,470
WARREN 78,981,468 -5,678,432 73,303,036 0 73,303,036
WASHINGTON 251,754,051 -14,497,449 237,256,602 0 237,256,602
WATERVILLE VALLEY 361,811,809 -38,613,465 323,198,344 0 323,198,344
WEARE 803,374,493 -34,070,512 769,303,981 0 769,303,981
WEBSTER 232,194,390 -44,229,624 187,964,766 0 187,964,766
WENTWORTH 89,267,765 4,908,930 94,176,695 0 94,176,695
WENTWORTH LOCATION 9,325,788 0 9,325,788 0 9,325,788
WESTMORELAND 174,532,412 5,456,780 179,989,192 0 179,989,192
WHITEFIELD 210,006,120 -50,763,787 159,242,333 0 159,242,333
WILMOT 178,853,766 -360,450 178,493,316 0 178,493,316
WILTON 367,619,274 -904,185 366,715,089 0 366,715,089
WINCHESTER 284,569,110 6,945,674 291,514,784 0 291,514,784
WINDHAM 2,041,719,770 26,547,052 2,068,266,822 0 2,068,266,822
WINDSOR 22,890,184 -83,081 22,807,103 0 22,807,103
WOLFEBORO 2,052,849,700 3,613 2,052,853,313 0 2,052,853,313
WOODSTOCK 236,120,928 17,299,836 253,420,764 0 253,420,764
158,500,914,585STATE TOTALS -4,594,160,627 153,906,753,958 0 153,906,753,958
NH DRA 2012 Annual Report - Page 170

2011 COMPARISON OF
FULL VALUE TAX RATES
The full value tax rate represents the estimated tax rate for a municipality if all the taxable property was assessed at 100% and includes the equalized value of properties for which a payment in lieu of property taxes is made.
The full value tax rate is calculated as follows: The 2011 gross local property taxes to be raised as reported by the Department of Revenue Administration, Municipal Services Division divided by the total equalized valuation including utility values and equalized railroad taxes.
The full value rates are ranked in ascending order from lowest to highest (1-224 for 2011). If two municipalities have the same full value tax rate they are ranked with the same number. The unincorporated towns (signified by ***) have no 2011 tax rate, and thus are not ranked.
The full value tax rate can only be used to make a limited comparison of what a property in one municipality would pay for taxes to a property of equal value in another municipality.
For example: Town A 100,000 X 21.95 1000 = $2,195.00
Town B 100,000 X 26.56 1000 = $2,656.00
Due to diverse real estate values in New Hampshire, properties of equal value do not equate to properties of equal size or quality.
Prior to making any assumptions or decisions regarding a property owner’s tax burden in a municipality, other factors should be considered such as real estate values, municipal services, schools, community make-up, and locational factors including proximity to urban areas, medical facilities, highways, recreation areas, etc.
NH DRA 2012 Annual Report - Page 171

MUNICIPALITY MODIFIED LOCAL
ASSESSED VALUATION
TOTAL EQUALIZED VALUATION INCLUDING
UTILITIES AND RAILROAD
2011 LOCAL
TAX RATE2011 EQ
RATIO
FULL VALUE
TAX RATERANKING
*
2011 VALUATION COMPARATIVE TAX RATES AND RANKINGS
2011 COMPARISON OF FULL VALUE TAX RATES RANKING(AVERAGE LEVEL OF ASSESSMENTS (RATIO) SHOWN IN COLM. 4)
PREPARED BY NEW HAMPSHIRE DEPARTMENT OF REVENUE ADMINISTRATION
ACWORTH 94,987,762 94,999,551 $21.19 100.0 $21.09 105ALBANY 103,800,381 106,022,644 $10.76 100.0 $10.50 16ALEXANDRIA 201,848,914 193,678,687 $22.37 100.0 $22.94 144ALLENSTOWN 269,262,744 235,798,937 $29.30 112.6 $33.11 222ALSTEAD 179,106,027 159,079,666 $20.94 112.5 $23.51 153ALTON 1,448,055,003 1,489,970,858 $13.07 97.2 $12.68 31AMHERST 1,573,177,700 1,598,158,324 $25.37 97.8 $24.74 173ANDOVER 268,444,901 249,704,715 $18.34 103.9 $19.57 88ANTRIM 253,187,000 232,353,014 $23.14 107.5 $25.01 177ASHLAND 265,058,592 233,961,268 $20.11 113.7 $22.66 136ATKINSON 842,581,717 842,492,003 $18.80 100.0 $18.60 75ATKINSON & GILMANTON 747,203 747,203 $0.00 100.0 $0.00 ****AUBURN 611,563,791 650,691,558 $18.94 100.0 $17.56 66BARNSTEAD 464,889,033 502,800,016 $23.43 92.4 $21.59 118BARRINGTON 915,679,185 826,797,348 $20.78 110.0 $22.74 140BARTLETT 911,602,331 952,977,909 $10.48 95.8 $10.00 15BATH 128,135,832 121,751,714 $16.92 100.0 $17.34 64BEAN'S GRANT 462 462 $0.00 100.0 $0.00 ****BEAN'S PURCHASE 20,650 20,650 $0.00 100.0 $0.00 ****BEDFORD 3,376,413,751 3,371,416,269 $20.54 100.0 $20.45 97BELMONT 734,429,960 632,063,064 $21.56 116.3 $24.79 174BENNINGTON 114,395,879 103,718,483 $23.20 110.5 $25.35 181BENTON 27,142,188 28,952,361 $15.06 98.0 $14.05 40BERLIN 439,311,540 333,119,633 $31.70 113.9 $40.78 224BETHLEHEM 232,792,333 234,923,630 $29.87 100.0 $29.27 211BOSCAWEN 278,029,369 220,124,237 $21.05 126.9 $26.42 191BOW 1,051,889,828 1,226,831,181 $27.15 95.1 $22.60 134BRADFORD 218,951,498 216,715,108 $22.90 100.0 $23.06 146BRENTWOOD 483,047,315 474,545,987 $23.01 100.0 $23.28 150BRIDGEWATER 333,854,083 327,317,493 $9.85 100.0 $9.94 14BRISTOL 470,498,169 470,941,809 $20.17 97.2 $20.01 92BROOKFIELD 104,111,997 103,425,326 $15.73 100.0 $15.77 46BROOKLINE 591,464,954 466,265,627 $24.08 126.3 $30.30 215CAMBRIDGE 8,318,772 8,318,772 $0.00 100.0 $0.00 ****CAMPTON 408,651,078 408,492,212 $18.99 100.0 $18.82 76CANAAN 322,379,726 348,911,227 $23.34 90.9 $21.43 114CANDIA 408,698,890 408,258,374 $19.38 100.0 $19.19 80CANTERBURY 244,268,766 244,222,407 $25.33 100.0 $25.08 178CARROLL 399,514,406 310,495,189 $13.55 129.1 $17.39 65CENTER HARBOR 473,740,281 412,837,763 $10.96 114.8 $12.57 29CHANDLER'S PURCHASE 49,152 49,152 $0.00 100.0 $0.00 ****CHARLESTOWN 271,273,597 259,762,712 $27.53 105.2 $28.57 205CHATHAM 51,636,272 53,160,003 $13.20 100.0 $12.79 33CHESTER 468,388,800 454,524,525 $24.66 100.0 $24.54 170CHESTERFIELD 562,766,614 482,553,511 $17.33 116.9 $20.15 94CHICHESTER 297,460,965 251,891,688 $19.30 118.0 $22.65 135CLAREMONT 822,522,920 829,832,945 $33.18 100.0 $31.11 216CLARKSVILLE 40,859,992 45,693,650 $9.25 100.0 $8.22 10COLEBROOK 190,272,312 168,678,229 $21.70 110.3 $24.25 167COLUMBIA 85,334,027 76,463,194 $16.54 100.0 $17.73 68CONCORD 3,730,396,850 3,708,962,523 $24.60 100.0 $24.57 171CONWAY 1,393,963,965 1,446,396,170 $17.20 96.4 $16.48 54*RANKING BASED ON LOWEST TO HIGHEST FULL VALUE TAX RATE.
NH DRA 2012 Annual Report - Page 172

MUNICIPALITY MODIFIED LOCAL
ASSESSED VALUATION
TOTAL EQUALIZED VALUATION INCLUDING
UTILITIES AND RAILROAD
2011 LOCAL
TAX RATE2011 EQ
RATIO
FULL VALUE
TAX RATERANKING
*
2011 VALUATION COMPARATIVE TAX RATES AND RANKINGS
2011 COMPARISON OF FULL VALUE TAX RATES RANKING(AVERAGE LEVEL OF ASSESSMENTS (RATIO) SHOWN IN COLM. 4)
PREPARED BY NEW HAMPSHIRE DEPARTMENT OF REVENUE ADMINISTRATION
CORNISH 187,094,145 186,376,500 $19.34 100.0 $19.25 83CRAWFORD'S PURCHASE 162,457 162,457 $0.00 100.0 $0.00 ****CROYDON 94,429,409 89,341,948 $12.95 104.8 $13.61 37CUTT'S GRANT 0 0 $0.00 100.0 $0.00 ****DALTON 93,562,708 82,681,817 $18.58 112.5 $20.87 101DANBURY 109,261,154 115,788,822 $25.46 94.2 $23.89 162DANVILLE 330,590,024 330,590,251 $27.84 100.0 $27.47 198DEERFIELD 537,429,916 470,036,974 $21.45 108.2 $24.12 165DEERING 201,959,200 183,862,597 $26.16 108.2 $28.13 201DERRY 2,517,294,869 2,521,677,930 $27.27 100.0 $26.86 194DIX GRANT 926,086 926,086 $0.00 100.0 $0.00 ****DIXVILLE 16,691,185 16,697,647 $3.04 100.0 $3.03 2DORCHESTER 40,920,449 37,288,760 $20.60 110.4 $22.57 133DOVER 2,641,809,500 2,716,654,840 $25.12 97.1 $23.94 164DUBLIN 256,735,375 227,875,990 $22.54 112.5 $25.35 181DUMMER 55,368,701 44,207,498 $19.11 104.5 $22.55 132DUNBARTON 305,427,231 289,654,530 $21.44 100.0 $22.40 131DURHAM 901,932,943 898,068,758 $28.20 100.0 $28.17 202EAST KINGSTON 299,276,855 291,478,979 $23.19 100.0 $23.65 159EASTON 65,727,057 66,430,404 $10.83 100.0 $10.69 18EATON 103,297,100 106,165,206 $11.36 97.2 $11.03 20EFFINGHAM 181,105,900 180,324,408 $19.16 100.0 $19.16 79ELLSWORTH 13,528,290 14,057,068 $13.34 99.4 $12.78 32ENFIELD 555,004,079 555,265,687 $20.61 100.0 $20.19 95EPPING 624,188,800 597,091,114 $24.27 103.6 $25.09 179EPSOM 406,738,353 404,728,733 $21.65 100.0 $21.66 120ERROL 85,888,785 81,818,412 $10.50 100.0 $10.74 19ERVING'S GRANT 76,880 76,880 $0.00 100.0 $0.00 ****EXETER 1,603,489,293 1,604,981,473 $25.28 100.0 $24.60 172FARMINGTON 476,028,153 392,588,434 $20.00 121.3 $23.91 163FITZWILLIAM 308,663,000 247,589,086 $24.59 121.8 $30.19 214FRANCESTOWN 210,083,441 198,304,452 $20.75 105.1 $21.91 126FRANCONIA 284,038,653 283,845,183 $16.29 100.0 $16.26 52FRANKLIN 569,730,550 569,308,305 $21.52 100.0 $21.20 107FREEDOM 487,826,724 487,826,654 $11.49 100.0 $11.46 23FREMONT 365,044,581 361,617,075 $27.27 100.0 $27.36 197GILFORD 1,526,578,470 1,629,377,025 $18.55 93.7 $17.32 63GILMANTON 476,493,264 472,087,943 $23.51 100.0 $23.57 156GILSUM 65,450,866 64,710,758 $25.95 100.0 $26.03 186GOFFSTOWN 1,336,474,100 1,319,159,382 $24.17 100.0 $24.16 166GORHAM 310,787,600 251,562,872 $26.80 108.9 $32.31 221GOSHEN 75,290,246 75,322,143 $21.76 100.0 $21.71 122GRAFTON 128,549,366 127,187,103 $17.93 100.0 $18.04 70GRANTHAM 511,091,951 509,056,413 $19.30 100.0 $19.34 86GREENFIELD 158,270,175 154,485,658 $20.92 108.6 $21.35 112GREENLAND 671,852,927 669,430,920 $13.75 100.0 $13.68 39GREEN'S GRANT 4,095,113 4,205,112 $6.83 100.0 $6.63 6GREENVILLE 136,790,746 102,832,093 $20.59 132.8 $27.21 196GROTON 74,775,116 67,179,464 $12.24 100.0 $13.23 35HADLEY'S PURCHASE 0 0 $0.00 100.0 $0.00 ****HALE'S LOCATION 74,019,900 74,099,318 $3.36 100.0 $3.35 3HAMPSTEAD 1,001,517,459 958,212,000 $22.28 104.2 $22.96 145*RANKING BASED ON LOWEST TO HIGHEST FULL VALUE TAX RATE.
NH DRA 2012 Annual Report - Page 173

MUNICIPALITY MODIFIED LOCAL
ASSESSED VALUATION
TOTAL EQUALIZED VALUATION INCLUDING
UTILITIES AND RAILROAD
2011 LOCAL
TAX RATE2011 EQ
RATIO
FULL VALUE
TAX RATERANKING
*
2011 VALUATION COMPARATIVE TAX RATES AND RANKINGS
2011 COMPARISON OF FULL VALUE TAX RATES RANKING(AVERAGE LEVEL OF ASSESSMENTS (RATIO) SHOWN IN COLM. 4)
PREPARED BY NEW HAMPSHIRE DEPARTMENT OF REVENUE ADMINISTRATION
HAMPTON 2,750,914,500 2,813,332,466 $17.93 96.9 $17.21 62HAMPTON FALLS 434,772,900 412,976,882 $18.96 105.2 $19.72 89HANCOCK 242,032,026 241,248,084 $20.25 100.0 $20.24 96HANOVER 1,976,215,100 1,972,937,924 $16.79 100.0 $16.79 57HARRISVILLE 211,949,959 197,257,640 $14.60 107.0 $15.65 45HART'S LOCATION 15,736,200 16,636,146 $8.98 97.6 $8.46 11HAVERHILL 353,154,969 348,074,486 $23.79 96.3 $23.89 162HEBRON 261,115,178 255,470,204 $7.73 103.6 $7.86 9HENNIKER 388,150,299 369,354,314 $30.00 104.0 $31.17 217HILL 107,290,359 88,367,334 $19.01 115.6 $22.79 143HILLSBOROUGH 607,273,251 471,011,556 $22.97 127.4 $29.36 212HINSDALE 371,420,890 326,299,785 $26.00 111.5 $28.81 206HOLDERNESS 690,698,431 689,426,125 $13.16 100.0 $13.17 34HOLLIS 1,248,486,670 1,181,253,262 $20.91 105.7 $21.97 127HOOKSETT 1,668,833,071 1,505,950,371 $21.68 109.5 $23.37 151HOPKINTON 652,213,995 641,827,956 $27.54 100.0 $27.68 199HUDSON 2,945,128,966 2,553,941,272 $16.62 112.5 $18.84 77JACKSON 385,683,068 331,352,916 $10.25 117.0 $11.92 25JAFFREY 453,796,866 454,076,813 $27.37 100.0 $27.21 196JEFFERSON 123,519,359 124,377,095 $18.50 100.0 $18.26 71KEENE 1,881,801,200 1,821,623,737 $30.82 101.9 $31.42 220KENSINGTON 348,197,463 293,560,055 $18.87 117.4 $22.10 129KILKENNY 11,747 11,747 $0.00 100.0 $0.00 ****KINGSTON 713,040,555 646,269,736 $20.72 110.1 $22.69 137LACONIA 1,884,462,851 1,962,136,357 $20.56 97.1 $19.57 88LANCASTER 285,418,210 239,707,690 $18.53 118.7 $21.89 124LANDAFF 50,981,138 49,774,881 $17.29 100.0 $17.61 67LANGDON 60,463,610 60,375,401 $24.99 100.0 $24.86 175LEBANON 1,851,389,931 1,865,898,381 $24.32 100.0 $23.83 161LEE 417,402,349 393,077,982 $30.12 106.1 $31.27 218LEMPSTER 166,293,328 166,119,106 $19.96 100.0 $19.24 82LINCOLN 749,797,000 787,023,978 $11.69 95.0 $11.06 21LISBON 111,414,279 111,647,312 $28.60 100.0 $28.31 204LITCHFIELD 810,325,751 777,116,551 $17.91 102.7 $18.50 72LITTLETON 755,921,800 622,029,830 $20.40 100.0 $23.83 161LIVERMORE 145,080 145,080 $0.00 100.0 $0.00 ****LONDONDERRY 3,398,807,519 2,939,013,127 $20.34 112.7 $22.96 145LOUDON 529,406,355 505,834,900 $20.37 104.3 $21.16 106LOW & BURBANK GRANT 0 0 $0.00 100.0 $0.00 ****LYMAN 60,694,568 60,632,309 $19.30 100.0 $19.23 81LYME 325,407,200 323,202,201 $20.63 100.0 $20.54 99LYNDEBOROUGH 166,077,158 165,892,247 $23.60 100.0 $23.58 157MADBURY 234,161,510 228,213,812 $24.18 100.0 $24.52 169MADISON 457,784,359 453,594,786 $15.83 100.0 $15.91 49MANCHESTER 8,414,935,800 8,431,293,788 $21.96 100.0 $21.30 111MARLBOROUGH 182,848,070 181,491,132 $25.43 100.0 $25.54 183MARLOW 64,935,184 55,770,120 $25.10 117.2 $28.99 208MARTIN'S LOCATION 36,618 36,618 $0.00 100.0 $0.00 ****MASON 161,415,101 161,036,989 $24.33 100.0 $24.25 167MEREDITH 1,848,696,211 1,848,418,481 $12.65 100.0 $12.62 30MERRIMACK 2,842,452,309 2,765,309,128 $23.43 102.3 $23.62 158MIDDLETON 183,223,347 162,980,909 $19.46 111.7 $21.80 123*RANKING BASED ON LOWEST TO HIGHEST FULL VALUE TAX RATE.
NH DRA 2012 Annual Report - Page 174

MUNICIPALITY MODIFIED LOCAL
ASSESSED VALUATION
TOTAL EQUALIZED VALUATION INCLUDING
UTILITIES AND RAILROAD
2011 LOCAL
TAX RATE2011 EQ
RATIO
FULL VALUE
TAX RATERANKING
*
2011 VALUATION COMPARATIVE TAX RATES AND RANKINGS
2011 COMPARISON OF FULL VALUE TAX RATES RANKING(AVERAGE LEVEL OF ASSESSMENTS (RATIO) SHOWN IN COLM. 4)
PREPARED BY NEW HAMPSHIRE DEPARTMENT OF REVENUE ADMINISTRATION
MILAN 124,861,377 106,421,158 $17.59 108.9 $20.07 93MILFORD 1,277,593,426 1,335,344,568 $24.73 95.7 $23.52 154MILLSFIELD 6,426,362 6,426,362 $0.00 100.0 $0.00 ****MILTON 366,957,724 365,577,548 $24.02 100.0 $23.83 161MONROE 357,506,487 183,705,087 $10.55 119.8 $17.16 60MONT VERNON 256,946,180 256,567,800 $26.60 100.0 $26.49 192MOULTONBOROUGH 2,746,400,236 2,929,162,465 $8.33 93.9 $7.80 8NASHUA 8,640,947,461 8,248,187,902 $20.97 103.9 $21.53 116NELSON 117,571,153 120,898,243 $20.55 96.0 $19.89 91NEW BOSTON 535,003,527 530,176,987 $23.51 100.0 $23.55 155NEW CASTLE 637,321,931 636,733,622 $6.39 100.0 $6.38 5NEW DURHAM 418,205,920 418,205,964 $22.40 100.0 $22.30 130NEW HAMPTON 341,095,144 322,226,830 $17.07 100.0 $17.84 69NEW IPSWICH 418,295,406 361,716,530 $20.26 114.3 $23.24 149NEW LONDON 1,081,083,376 1,081,149,887 $17.06 100.0 $17.02 59NEWBURY 693,421,593 713,111,557 $14.68 96.9 $14.25 41NEWFIELDS 259,558,177 259,375,641 $22.18 100.0 $21.90 125NEWINGTON 962,840,362 971,307,945 $8.95 100.0 $7.68 7NEWMARKET 760,757,364 718,640,197 $25.31 105.8 $26.23 189NEWPORT 504,115,212 448,962,627 $25.37 111.3 $28.20 203NEWTON 468,031,397 429,491,608 $24.12 108.8 $26.13 187NORTH HAMPTON 1,018,591,300 1,016,338,240 $16.11 100.0 $15.92 50NORTHFIELD 355,073,960 301,178,624 $19.65 118.6 $22.78 142NORTHUMBERLAND 132,888,527 108,739,970 $26.16 114.3 $31.36 219NORTHWOOD 475,395,626 459,035,795 $24.61 103.7 $25.17 180NOTTINGHAM 542,719,044 561,459,577 $20.24 96.1 $19.31 85ODELL 2,180,938 2,180,938 $0.00 100.0 $0.00 ****ORANGE 28,849,023 28,725,716 $20.97 100.0 $20.90 102ORFORD 146,696,426 136,043,816 $25.91 106.8 $27.87 200OSSIPEE 710,710,879 702,775,635 $15.79 100.0 $15.83 47PELHAM 1,386,019,464 1,400,587,204 $21.41 97.7 $20.97 104PEMBROKE 616,819,836 542,178,120 $26.44 111.3 $29.79 213PETERBOROUGH 619,223,887 641,482,553 $27.34 96.2 $25.58 184PIERMONT 99,009,438 97,758,835 $22.10 100.0 $22.30 130PINKHAM'S GRANT 2,878,874 3,002,407 $6.74 100.0 $6.37 4PITTSBURG 287,599,867 270,559,024 $13.90 107.9 $14.67 43PITTSFIELD 265,251,397 229,059,808 $30.66 116.2 $35.10 223PLAINFIELD 289,202,582 285,762,197 $23.85 100.0 $23.48 152PLAISTOW 841,136,685 878,755,744 $24.71 94.6 $23.22 148PLYMOUTH 448,138,185 399,600,070 $21.25 111.3 $23.68 160PORTSMOUTH 3,993,267,198 4,174,795,440 $17.27 96.7 $16.33 53RANDOLPH 68,436,226 63,370,165 $14.91 109.0 $15.92 50RAYMOND 830,976,886 819,796,643 $22.80 100.0 $22.72 139RICHMOND 104,792,150 101,964,208 $23.00 100.0 $23.48 152RINDGE 557,484,462 524,968,463 $25.32 106.1 $26.35 190ROCHESTER 2,016,520,770 2,023,277,846 $24.86 100.0 $24.38 168ROLLINSFORD 263,770,765 248,807,565 $21.56 105.5 $22.55 132ROXBURY 25,850,507 28,577,580 $23.55 101.0 $21.21 108RUMNEY 192,584,084 175,163,061 $19.20 106.5 $20.93 103RYE 1,771,183,590 1,770,040,629 $10.60 100.0 $10.55 17SALEM 3,833,484,511 3,805,084,222 $20.14 100.0 $20.15 94SALISBURY 156,492,742 127,790,758 $18.87 119.0 $22.71 138*RANKING BASED ON LOWEST TO HIGHEST FULL VALUE TAX RATE.
NH DRA 2012 Annual Report - Page 175
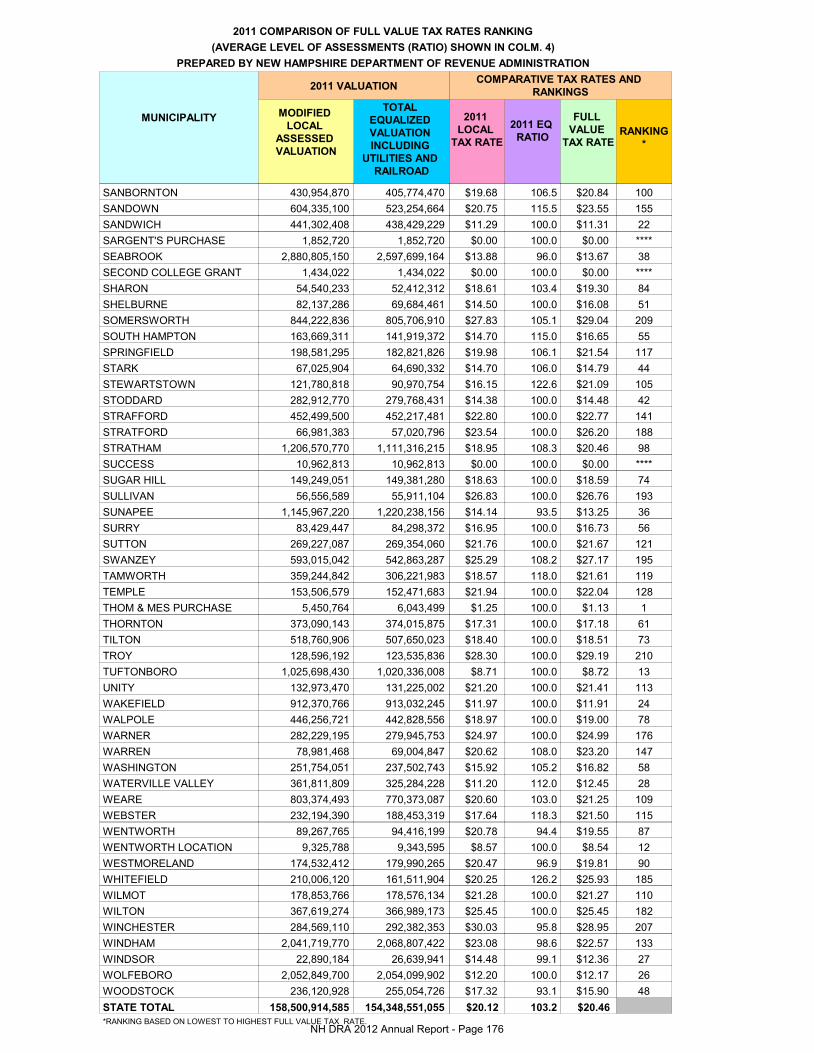
MUNICIPALITY MODIFIED LOCAL
ASSESSED VALUATION
TOTAL EQUALIZED VALUATION INCLUDING
UTILITIES AND RAILROAD
2011 LOCAL
TAX RATE2011 EQ
RATIO
FULL VALUE
TAX RATERANKING
*
2011 VALUATION COMPARATIVE TAX RATES AND RANKINGS
2011 COMPARISON OF FULL VALUE TAX RATES RANKING(AVERAGE LEVEL OF ASSESSMENTS (RATIO) SHOWN IN COLM. 4)
PREPARED BY NEW HAMPSHIRE DEPARTMENT OF REVENUE ADMINISTRATION
SANBORNTON 430,954,870 405,774,470 $19.68 106.5 $20.84 100SANDOWN 604,335,100 523,254,664 $20.75 115.5 $23.55 155SANDWICH 441,302,408 438,429,229 $11.29 100.0 $11.31 22SARGENT'S PURCHASE 1,852,720 1,852,720 $0.00 100.0 $0.00 ****SEABROOK 2,880,805,150 2,597,699,164 $13.88 96.0 $13.67 38SECOND COLLEGE GRANT 1,434,022 1,434,022 $0.00 100.0 $0.00 ****SHARON 54,540,233 52,412,312 $18.61 103.4 $19.30 84SHELBURNE 82,137,286 69,684,461 $14.50 100.0 $16.08 51SOMERSWORTH 844,222,836 805,706,910 $27.83 105.1 $29.04 209SOUTH HAMPTON 163,669,311 141,919,372 $14.70 115.0 $16.65 55SPRINGFIELD 198,581,295 182,821,826 $19.98 106.1 $21.54 117STARK 67,025,904 64,690,332 $14.70 106.0 $14.79 44STEWARTSTOWN 121,780,818 90,970,754 $16.15 122.6 $21.09 105STODDARD 282,912,770 279,768,431 $14.38 100.0 $14.48 42STRAFFORD 452,499,500 452,217,481 $22.80 100.0 $22.77 141STRATFORD 66,981,383 57,020,796 $23.54 100.0 $26.20 188STRATHAM 1,206,570,770 1,111,316,215 $18.95 108.3 $20.46 98SUCCESS 10,962,813 10,962,813 $0.00 100.0 $0.00 ****SUGAR HILL 149,249,051 149,381,280 $18.63 100.0 $18.59 74SULLIVAN 56,556,589 55,911,104 $26.83 100.0 $26.76 193SUNAPEE 1,145,967,220 1,220,238,156 $14.14 93.5 $13.25 36SURRY 83,429,447 84,298,372 $16.95 100.0 $16.73 56SUTTON 269,227,087 269,354,060 $21.76 100.0 $21.67 121SWANZEY 593,015,042 542,863,287 $25.29 108.2 $27.17 195TAMWORTH 359,244,842 306,221,983 $18.57 118.0 $21.61 119TEMPLE 153,506,579 152,471,683 $21.94 100.0 $22.04 128THOM & MES PURCHASE 5,450,764 6,043,499 $1.25 100.0 $1.13 1THORNTON 373,090,143 374,015,875 $17.31 100.0 $17.18 61TILTON 518,760,906 507,650,023 $18.40 100.0 $18.51 73TROY 128,596,192 123,535,836 $28.30 100.0 $29.19 210TUFTONBORO 1,025,698,430 1,020,336,008 $8.71 100.0 $8.72 13UNITY 132,973,470 131,225,002 $21.20 100.0 $21.41 113WAKEFIELD 912,370,766 913,032,245 $11.97 100.0 $11.91 24WALPOLE 446,256,721 442,828,556 $18.97 100.0 $19.00 78WARNER 282,229,195 279,945,753 $24.97 100.0 $24.99 176WARREN 78,981,468 69,004,847 $20.62 108.0 $23.20 147WASHINGTON 251,754,051 237,502,743 $15.92 105.2 $16.82 58WATERVILLE VALLEY 361,811,809 325,284,228 $11.20 112.0 $12.45 28WEARE 803,374,493 770,373,087 $20.60 103.0 $21.25 109WEBSTER 232,194,390 188,453,319 $17.64 118.3 $21.50 115WENTWORTH 89,267,765 94,416,199 $20.78 94.4 $19.55 87WENTWORTH LOCATION 9,325,788 9,343,595 $8.57 100.0 $8.54 12WESTMORELAND 174,532,412 179,990,265 $20.47 96.9 $19.81 90WHITEFIELD 210,006,120 161,511,904 $20.25 126.2 $25.93 185WILMOT 178,853,766 178,576,134 $21.28 100.0 $21.27 110WILTON 367,619,274 366,989,173 $25.45 100.0 $25.45 182WINCHESTER 284,569,110 292,382,353 $30.03 95.8 $28.95 207WINDHAM 2,041,719,770 2,068,807,422 $23.08 98.6 $22.57 133WINDSOR 22,890,184 26,639,941 $14.48 99.1 $12.36 27WOLFEBORO 2,052,849,700 2,054,099,902 $12.20 100.0 $12.17 26WOODSTOCK 236,120,928 255,054,726 $17.32 93.1 $15.90 48STATE TOTAL 158,500,914,585 154,348,551,055 $20.12 103.2 $20.46*RANKING BASED ON LOWEST TO HIGHEST FULL VALUE TAX RATE.
NH DRA 2012 Annual Report - Page 176

2011
ASSESSMENT
REVIEW
REPORT
NH DRA 2012 Annual Report - Page 177

ASSESSMENT REVIEW GUIDELINES As recommended by the New Hampshire
Assessing Standards Board (ASB) Per RSA (Revised Statutes Annotated) 21-J:11-a
A Level and Uniformity of Assessments
Ratio 90% - 100% with 90% confidence level
RSA 21-J:11-a,I,(a)
COD (Coefficient of Dispersion) of median ratio not greater than 20
(no confidence interval)
RSA 21-J:11-a,I,(a)
B Assessing Practices
RSA 91-A access, All records of the municipalities assessor’s office
should be available to the public pursuant to RSA 91-A
95% of sample: RSA 74:1
o Must reflect April 1 value
o Must reflect construction done by April 1 and not after
Have revised inventory program – RSA 75:8
85% of Current Use Sample – RSA 79-A:5
o Form A-10 timely filed
o Form CU-12 timely filed
o Valued per CUB 304 (current use board rules)
o Land Use Change Tax
Appraisal Contracts to Department of Revenue Administration
(DRA) – RSA 21-J:11
o Submitted prior to start
o Include personnel in contract
C Exemptions and Credits
Periodic Review By Town – RSA 72:33,VI
o Elderly Exemption; RSA 72:39-a & b
o Veterans’ Tax Credit; RSA 72:28
o Tax Credit for Service-Connected Total Disability; RSA: 72:35
o Exemption for the Blind; RSA 72:37 (optional)
o Exemption for the Disabled; RSA 72:37-b (optional)
o Exemption for Deaf or Severely Hearing Impaired Persons;
RSA 72:38-b (optional) (new)
NH DRA 2012 Annual Report - Page 178

RSA 72:23-c
o Religious – Board of Tax & Land Appeals (BTLA), A-9
o Educational – BTLA, A-9
o Charitable – BTLA, A-9
RSA 72:23,VI
o Charitable – BTLA, A-12
D Data Accuracy
80% of property record cards must be free of material errors;
RSA 21-J:11-a,I,(d)
Verify accuracy of data elements (report to ASB);
RSA 21-J:11-a,I,(d)
E Proportionality
Verify PRD (Price Related Differential) (report to ASB);
RSA 21-J:11-a,I,(e) Should be between .98 and 1.03 with a 90%
confidence level
Median ratio, with 90% confidence level for all strata within 5% of
overall median point estimate; RSA 21-J-a,I,(e)
o Improved residential
o Improved non-residential
o Unimproved property
F USPAP
Verify USPAP complaint report based on Standard t of the 2005 Edition
of USPAP
NH DRA 2012 Annual Report - Page 179

2011 ASSESSMENT REVIEW REPORT SUMMARY COMPARISON
CATEGORY ASB GUIDELINE Acworth Alexandria Allenstown Amherst Atkinson Barrington
Level and Uniformity of
Assessments Ratio
Asb III, A,1 MET MET MET MET MET MET
2 Sub CategoriesCOD
Asb III, A,2 MET MET MET MET MET MET
Assessing Practices
9 Sub Categories
April 1st Assessment
Date-No Value if Doesn't
Exist April 1st
Asb III,B,2 MET MET MET MET MET NOT MET
Revised Inventory
Program
Asb III,B,3 MET MET MET MET MET MET
Current Use A-10's
Asb III,B,4,a NOT MET NOT MET MET MET MET MET
Current Use A-12's
Asb III,B,4,b NOT MET NOT MET MET MET MET MET
Compliance with
CUB 304
Asb III,B,4,c NOT MET NOT MET MET MET MET MET
Land Use
Change Tax
Asb III,B,4,d MET NOT MET MET MET MET MET
Contracts Submitted
Asb III,B,5,a MET MET MET MET MET MET
Contract Employees
Asb III,B,5,b MET MET MET MET MET MET
Exemptions & Credits
Periodic Review of Tax
Credits
Asb III,C,1,a NOT MET NOT MET MET MET MET MET
Periodic Review of
Exemptions
Asb III,C,1,b MET NOT MET MET MET MET MET
3 Sub Categories
BTLA Form A-9's
Asb III,C,2 MET METMET MET MET NOT MET
BTLA Form A-12s
Asb III,C,3 MET METMET MET MET MET
Data Accuracy
80% Free of
Material Errors
Asb III,D,1 MET MET MET MET MET MET
2 Sub Categories
Accuracy of Data
Elements-Advisory Only
Asb III,D,2MET MET MET MET MET MET
Proportionality
PRD
Asb III, E,1 MET MET MET MET MET MET
2 Sub Categories
Strata within 5% of
Overall MediaPRD
Asb III,E,2 MET MET MET MET MET MET
USPAP Compliant Report
Copies of this report
shall be delivered to the
municipality and to the
DRA at no additional
cost. Asb III, F,1 MET MET MET MET MET MET
% of ASB Criteria Met 78.95% 68.42% 100.00% 100.00% 100.00% 89.47%
NH DRA 2012 Annual Report - Page 180

2011 ASSESSMENT REVIEW REPORT SUMMARY COMPARISON
CATEGORY ASB GUIDELINE
Level and Uniformity of
Assessments Ratio
Asb III, A,1
2 Sub CategoriesCOD
Asb III, A,2
Assessing Practices
9 Sub Categories
April 1st Assessment
Date-No Value if Doesn't
Exist April 1st
Asb III,B,2
Revised Inventory
Program
Asb III,B,3
Current Use A-10's
Asb III,B,4,a
Current Use A-12's
Asb III,B,4,b
Compliance with
CUB 304
Asb III,B,4,c
Land Use
Change Tax
Asb III,B,4,d
Contracts Submitted
Asb III,B,5,a
Contract Employees
Asb III,B,5,b
Exemptions & Credits
Periodic Review of Tax
Credits
Asb III,C,1,a
Periodic Review of
Exemptions
Asb III,C,1,b
3 Sub Categories
BTLA Form A-9's
Asb III,C,2
BTLA Form A-12s
Asb III,C,3
Data Accuracy
80% Free of
Material Errors
Asb III,D,1
2 Sub Categories
Accuracy of Data
Elements-Advisory Only
Asb III,D,2
Proportionality
PRD
Asb III, E,1
2 Sub Categories
Strata within 5% of
Overall MediaPRD
Asb III,E,2
USPAP Compliant Report
Copies of this report
shall be delivered to the
municipality and to the
DRA at no additional
cost. Asb III, F,1
% of ASB Criteria Met
Bath Belmont Bethlehem Bow Bridgewater Bristol
MET MET MET MET MET MET
MET NOT MET MET MET MET MET
NOT MET NOT MET NOT MET MET MET MET
MET MET MET MET MET MET
NOT MET MET NOT MET NOT MET NOT MET NOT MET
NOT MET MET NOT MET NOT MET NOT MET NOT MET
NOT MET MET NOT MET NOT MET NOT MET NOT MET
NOT MET MET MET MET NOT MET NOT MET
MET MET MET MET MET MET
MET MET MET MET MET MET
MET MET MET NOT MET NOT MET MET
MET NOT MET MET NOT MET NOT MET MET
MET MET NOT MET NOT MET MET MET
MET MET NOT MET MET MET MET
MET MET NOT MET MET MET MET
MET MET NOT MET MET MET MET
MET MET MET MET MET MET
MET MET MET MET MET MET
MET MET NOT MET MET MET MET
73.68% 84.21% 52.63% 68.42% 68.42% 78.95%
NH DRA 2012 Annual Report - Page 181

2011 ASSESSMENT REVIEW REPORT SUMMARY COMPARISON
CATEGORY ASB GUIDELINE
Level and Uniformity of
Assessments Ratio
Asb III, A,1
2 Sub CategoriesCOD
Asb III, A,2
Assessing Practices
9 Sub Categories
April 1st Assessment
Date-No Value if Doesn't
Exist April 1st
Asb III,B,2
Revised Inventory
Program
Asb III,B,3
Current Use A-10's
Asb III,B,4,a
Current Use A-12's
Asb III,B,4,b
Compliance with
CUB 304
Asb III,B,4,c
Land Use
Change Tax
Asb III,B,4,d
Contracts Submitted
Asb III,B,5,a
Contract Employees
Asb III,B,5,b
Exemptions & Credits
Periodic Review of Tax
Credits
Asb III,C,1,a
Periodic Review of
Exemptions
Asb III,C,1,b
3 Sub Categories
BTLA Form A-9's
Asb III,C,2
BTLA Form A-12s
Asb III,C,3
Data Accuracy
80% Free of
Material Errors
Asb III,D,1
2 Sub Categories
Accuracy of Data
Elements-Advisory Only
Asb III,D,2
Proportionality
PRD
Asb III, E,1
2 Sub Categories
Strata within 5% of
Overall MediaPRD
Asb III,E,2
USPAP Compliant Report
Copies of this report
shall be delivered to the
municipality and to the
DRA at no additional
cost. Asb III, F,1
% of ASB Criteria Met
Canaan Canterbury Charlestown Chester Danbury Danville
MET MET MET MET MET MET
MET MET MET MET MET MET
MET NOT MET MET MET MET MET
MET MET MET MET MET MET
NOT MET NOT MET MET MET MET NOT MET
NOT MET NOT MET MET MET MET NOT MET
NOT MET NOT MET MET MET MET NOT MET
NOT MET NOT MET MET NOT MET MET MET
MET MET MET MET MET MET
MET MET MET MET MET MET
NOT MET NOT MET MET MET NOT MET MET
NOT MET NOT MET MET MET NOT MET MET
MET NOT MET MET MET NOT MET MET
MET NOT MET MET MET NOT MET MET
MET MET MET MET MET MET
MET MET MET MET MET MET
MET MET MET MET MET MET
MET MET MET MET MET MET
MET MET MET MET MET NOT MET
68.42% 52.63% 100.00% 94.74% 78.95% 78.95%
NH DRA 2012 Annual Report - Page 182

2011 ASSESSMENT REVIEW REPORT SUMMARY COMPARISON
CATEGORY ASB GUIDELINE
Level and Uniformity of
Assessments Ratio
Asb III, A,1
2 Sub CategoriesCOD
Asb III, A,2
Assessing Practices
9 Sub Categories
April 1st Assessment
Date-No Value if Doesn't
Exist April 1st
Asb III,B,2
Revised Inventory
Program
Asb III,B,3
Current Use A-10's
Asb III,B,4,a
Current Use A-12's
Asb III,B,4,b
Compliance with
CUB 304
Asb III,B,4,c
Land Use
Change Tax
Asb III,B,4,d
Contracts Submitted
Asb III,B,5,a
Contract Employees
Asb III,B,5,b
Exemptions & Credits
Periodic Review of Tax
Credits
Asb III,C,1,a
Periodic Review of
Exemptions
Asb III,C,1,b
3 Sub Categories
BTLA Form A-9's
Asb III,C,2
BTLA Form A-12s
Asb III,C,3
Data Accuracy
80% Free of
Material Errors
Asb III,D,1
2 Sub Categories
Accuracy of Data
Elements-Advisory Only
Asb III,D,2
Proportionality
PRD
Asb III, E,1
2 Sub Categories
Strata within 5% of
Overall MediaPRD
Asb III,E,2
USPAP Compliant Report
Copies of this report
shall be delivered to the
municipality and to the
DRA at no additional
cost. Asb III, F,1
% of ASB Criteria Met
Dunbarton Eaton Exeter Franconia Freedom
MET MET MET MET MET
MET MET MET MET MET
MET MET NOT MET MET NOT MET
MET MET MET MET MET
MET NOT MET NOT MET NOT MET MET
MET NOT MET NOT MET NOT MET MET
MET NOT MET NOT MET NOT MET MET
MET NOT MET MET MET MET
MET NOT MET MET MET MET
MET MET MET MET MET
MET NOT MET MET MET NOT MET
MET MET MET MET MET
MET NOT MET MET MET NOT MET
MET MET MET MET NOT MET
MET MET MET MET NOT MET
MET MET MET MET MET
MET MET MET MET MET
MET MET MET MET MET
MET MET MET MET MET
100.00% 63.16% 78.95% 84.21% 73.68%
NH DRA 2012 Annual Report - Page 183

2011 ASSESSMENT REVIEW REPORT SUMMARY COMPARISON
CATEGORY ASB GUIDELINE
Level and Uniformity of
Assessments Ratio
Asb III, A,1
2 Sub CategoriesCOD
Asb III, A,2
Assessing Practices
9 Sub Categories
April 1st Assessment
Date-No Value if Doesn't
Exist April 1st
Asb III,B,2
Revised Inventory
Program
Asb III,B,3
Current Use A-10's
Asb III,B,4,a
Current Use A-12's
Asb III,B,4,b
Compliance with
CUB 304
Asb III,B,4,c
Land Use
Change Tax
Asb III,B,4,d
Contracts Submitted
Asb III,B,5,a
Contract Employees
Asb III,B,5,b
Exemptions & Credits
Periodic Review of Tax
Credits
Asb III,C,1,a
Periodic Review of
Exemptions
Asb III,C,1,b
3 Sub Categories
BTLA Form A-9's
Asb III,C,2
BTLA Form A-12s
Asb III,C,3
Data Accuracy
80% Free of
Material Errors
Asb III,D,1
2 Sub Categories
Accuracy of Data
Elements-Advisory Only
Asb III,D,2
Proportionality
PRD
Asb III, E,1
2 Sub Categories
Strata within 5% of
Overall MediaPRD
Asb III,E,2
USPAP Compliant Report
Copies of this report
shall be delivered to the
municipality and to the
DRA at no additional
cost. Asb III, F,1
% of ASB Criteria Met
Groton Haverhill Hebron Jefferson Landaff Langdon
MET MET MET MET MET MET
MET MET MET MET MET MET
MET NOT MET MET MET MET MET
MET MET MET MET MET MET
NOT MET NOT MET NOT MET NOT MET NOT MET NOT MET
NOT MET NOT MET NOT MET NOT MET NOT MET NOT MET
NOT MET NOT MET NOT MET NOT MET NOT MET NOT MET
MET NOT MET MET NOT MET NOT MET MET
MET NOT MET MET MET MET MET
MET MET MET MET MET MET
MET MET MET MET NOT MET NOT MET
MET MET MET MET NOT MET NOT MET
MET NOT MET MET NOT MET NOT MET MET
MET NOT MET MET MET MET NOT MET
MET MET MET MET MET MET
MET MET MET MET MET MET
MET MET MET MET MET MET
MET MET MET MET MET MET
MET MET MET MET NOT MET MET
84.21% 57.89% 84.21% 73.68% 57.89% 68.42%
NH DRA 2012 Annual Report - Page 184

2011 ASSESSMENT REVIEW REPORT SUMMARY COMPARISON
CATEGORY ASB GUIDELINE
Level and Uniformity of
Assessments Ratio
Asb III, A,1
2 Sub CategoriesCOD
Asb III, A,2
Assessing Practices
9 Sub Categories
April 1st Assessment
Date-No Value if Doesn't
Exist April 1st
Asb III,B,2
Revised Inventory
Program
Asb III,B,3
Current Use A-10's
Asb III,B,4,a
Current Use A-12's
Asb III,B,4,b
Compliance with
CUB 304
Asb III,B,4,c
Land Use
Change Tax
Asb III,B,4,d
Contracts Submitted
Asb III,B,5,a
Contract Employees
Asb III,B,5,b
Exemptions & Credits
Periodic Review of Tax
Credits
Asb III,C,1,a
Periodic Review of
Exemptions
Asb III,C,1,b
3 Sub Categories
BTLA Form A-9's
Asb III,C,2
BTLA Form A-12s
Asb III,C,3
Data Accuracy
80% Free of
Material Errors
Asb III,D,1
2 Sub Categories
Accuracy of Data
Elements-Advisory Only
Asb III,D,2
Proportionality
PRD
Asb III, E,1
2 Sub Categories
Strata within 5% of
Overall MediaPRD
Asb III,E,2
USPAP Compliant Report
Copies of this report
shall be delivered to the
municipality and to the
DRA at no additional
cost. Asb III, F,1
% of ASB Criteria Met
Lee Lincoln Lyme Manchester Marlborough
MET MET MET MET MET
MET MET MET MET MET
MET NOT MET MET NOT MET MET
MET MET MET MET MET
MET NOT MET MET MET MET
MET NOT MET MET MET MET
MET NOT MET MET MET MET
MET MET MET MET MET
MET MET MET MET MET
MET MET MET MET MET
MET MET MET MET MET
MET MET MET MET MET
MET MET MET NOT MET MET
MET MET MET NOT MET MET
MET MET MET MET MET
MET MET MET MET MET
MET MET MET MET MET
MET MET MET NOT MET MET
MET MET MET MET NOT MET
100.00% 78.95% 100.00% 78.95% 94.74%
NH DRA 2012 Annual Report - Page 185

2011 ASSESSMENT REVIEW REPORT SUMMARY COMPARISON
CATEGORY ASB GUIDELINE
Level and Uniformity of
Assessments Ratio
Asb III, A,1
2 Sub CategoriesCOD
Asb III, A,2
Assessing Practices
9 Sub Categories
April 1st Assessment
Date-No Value if Doesn't
Exist April 1st
Asb III,B,2
Revised Inventory
Program
Asb III,B,3
Current Use A-10's
Asb III,B,4,a
Current Use A-12's
Asb III,B,4,b
Compliance with
CUB 304
Asb III,B,4,c
Land Use
Change Tax
Asb III,B,4,d
Contracts Submitted
Asb III,B,5,a
Contract Employees
Asb III,B,5,b
Exemptions & Credits
Periodic Review of Tax
Credits
Asb III,C,1,a
Periodic Review of
Exemptions
Asb III,C,1,b
3 Sub Categories
BTLA Form A-9's
Asb III,C,2
BTLA Form A-12s
Asb III,C,3
Data Accuracy
80% Free of
Material Errors
Asb III,D,1
2 Sub Categories
Accuracy of Data
Elements-Advisory Only
Asb III,D,2
Proportionality
PRD
Asb III, E,1
2 Sub Categories
Strata within 5% of
Overall MediaPRD
Asb III,E,2
USPAP Compliant Report
Copies of this report
shall be delivered to the
municipality and to the
DRA at no additional
cost. Asb III, F,1
% of ASB Criteria Met
Merrimack Milford Nelson New Boston New Castle
MET MET MET MET MET
MET MET MET MET MET
MET MET MET MET NOT MET
MET MET MET MET MET
MET MET NOT MET MET MET
MET MET NOT MET MET MET
MET MET NOT MET MET MET
MET MET MET MET MET
MET MET MET MET MET
MET MET MET MET MET
MET MET MET MET MET
MET MET MET MET MET
MET MET MET MET MET
MET MET MET MET MET
MET MET MET MET MET
MET MET MET MET MET
MET MET MET MET MET
MET MET MET MET MET
MET MET MET MET MET
100.00% 100.00% 84.21% 100.00% 94.74%
NH DRA 2012 Annual Report - Page 186
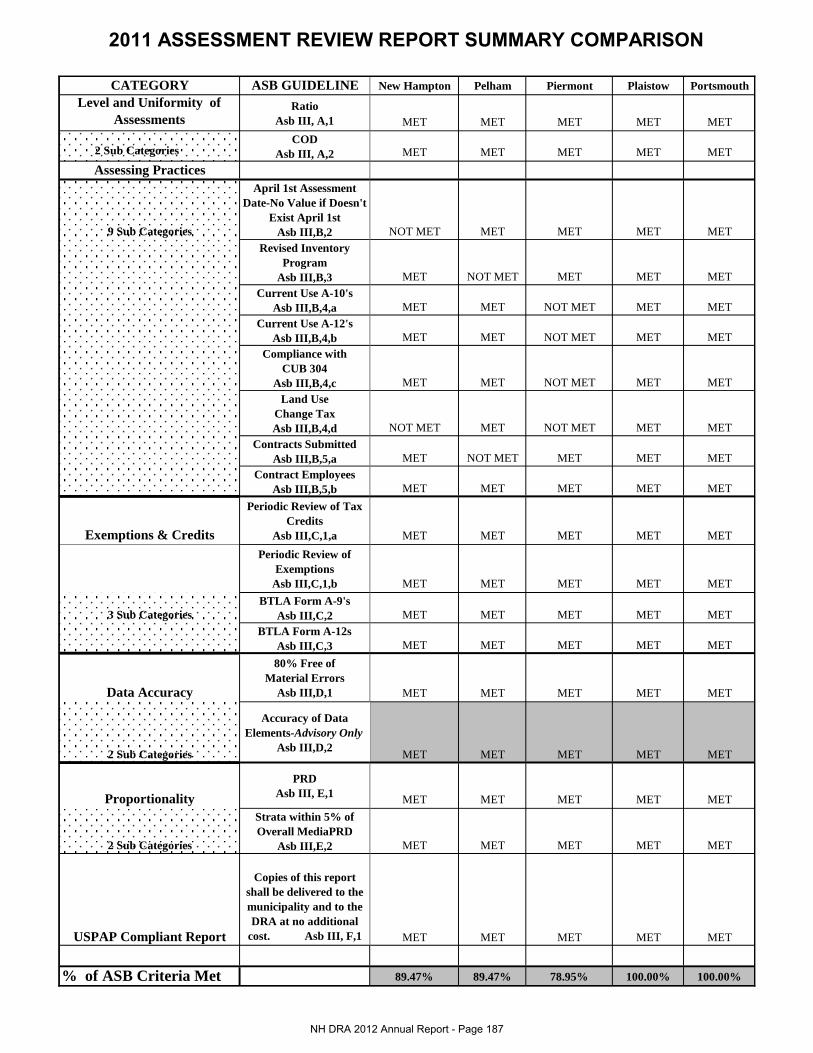
2011 ASSESSMENT REVIEW REPORT SUMMARY COMPARISON
CATEGORY ASB GUIDELINE
Level and Uniformity of
Assessments Ratio
Asb III, A,1
2 Sub CategoriesCOD
Asb III, A,2
Assessing Practices
9 Sub Categories
April 1st Assessment
Date-No Value if Doesn't
Exist April 1st
Asb III,B,2
Revised Inventory
Program
Asb III,B,3
Current Use A-10's
Asb III,B,4,a
Current Use A-12's
Asb III,B,4,b
Compliance with
CUB 304
Asb III,B,4,c
Land Use
Change Tax
Asb III,B,4,d
Contracts Submitted
Asb III,B,5,a
Contract Employees
Asb III,B,5,b
Exemptions & Credits
Periodic Review of Tax
Credits
Asb III,C,1,a
Periodic Review of
Exemptions
Asb III,C,1,b
3 Sub Categories
BTLA Form A-9's
Asb III,C,2
BTLA Form A-12s
Asb III,C,3
Data Accuracy
80% Free of
Material Errors
Asb III,D,1
2 Sub Categories
Accuracy of Data
Elements-Advisory Only
Asb III,D,2
Proportionality
PRD
Asb III, E,1
2 Sub Categories
Strata within 5% of
Overall MediaPRD
Asb III,E,2
USPAP Compliant Report
Copies of this report
shall be delivered to the
municipality and to the
DRA at no additional
cost. Asb III, F,1
% of ASB Criteria Met
New Hampton Pelham Piermont Plaistow Portsmouth
MET MET MET MET MET
MET MET MET MET MET
NOT MET MET MET MET MET
MET NOT MET MET MET MET
MET MET NOT MET MET MET
MET MET NOT MET MET MET
MET MET NOT MET MET MET
NOT MET MET NOT MET MET MET
MET NOT MET MET MET MET
MET MET MET MET MET
MET MET MET MET MET
MET MET MET MET MET
MET MET MET MET MET
MET MET MET MET MET
MET MET MET MET MET
MET MET MET MET MET
MET MET MET MET MET
MET MET MET MET MET
MET MET MET MET MET
89.47% 89.47% 78.95% 100.00% 100.00%
NH DRA 2012 Annual Report - Page 187

2011 ASSESSMENT REVIEW REPORT SUMMARY COMPARISON
CATEGORY ASB GUIDELINE
Level and Uniformity of
Assessments Ratio
Asb III, A,1
2 Sub CategoriesCOD
Asb III, A,2
Assessing Practices
9 Sub Categories
April 1st Assessment
Date-No Value if Doesn't
Exist April 1st
Asb III,B,2
Revised Inventory
Program
Asb III,B,3
Current Use A-10's
Asb III,B,4,a
Current Use A-12's
Asb III,B,4,b
Compliance with
CUB 304
Asb III,B,4,c
Land Use
Change Tax
Asb III,B,4,d
Contracts Submitted
Asb III,B,5,a
Contract Employees
Asb III,B,5,b
Exemptions & Credits
Periodic Review of Tax
Credits
Asb III,C,1,a
Periodic Review of
Exemptions
Asb III,C,1,b
3 Sub Categories
BTLA Form A-9's
Asb III,C,2
BTLA Form A-12s
Asb III,C,3
Data Accuracy
80% Free of
Material Errors
Asb III,D,1
2 Sub Categories
Accuracy of Data
Elements-Advisory Only
Asb III,D,2
Proportionality
PRD
Asb III, E,1
2 Sub Categories
Strata within 5% of
Overall MediaPRD
Asb III,E,2
USPAP Compliant Report
Copies of this report
shall be delivered to the
municipality and to the
DRA at no additional
cost. Asb III, F,1
% of ASB Criteria Met
Raymond Salem Sandown Shelburne Stratford Sunapee
MET MET NOT MET MET MET MET
MET MET MET MET MET MET
MET MET NOT MET MET MET MET
MET MET MET MET MET MET
NOT MET MET NOT MET MET NOT MET MET
NOT MET MET NOT MET MET NOT MET MET
NOT MET MET NOT MET MET NOT MET MET
NOT MET MET NOT MET MET MET MET
MET MET MET MET MET MET
MET MET MET MET MET MET
MET MET MET MET MET MET
MET MET NOT MET MET MET MET
NOT MET MET MET MET MET NOT MET
MET MET MET MET MET MET
MET MET MET MET MET MET
MET MET MET MET MET MET
MET MET MET MET MET MET
MET MET MET MET MET MET
MET MET MET MET MET MET
73.68% 100.00% 63.16% 100.00% 84.21% 94.74%
NH DRA 2012 Annual Report - Page 188

2011 ASSESSMENT REVIEW REPORT SUMMARY COMPARISON
CATEGORY ASB GUIDELINE
Level and Uniformity of
Assessments Ratio
Asb III, A,1
2 Sub CategoriesCOD
Asb III, A,2
Assessing Practices
9 Sub Categories
April 1st Assessment
Date-No Value if Doesn't
Exist April 1st
Asb III,B,2
Revised Inventory
Program
Asb III,B,3
Current Use A-10's
Asb III,B,4,a
Current Use A-12's
Asb III,B,4,b
Compliance with
CUB 304
Asb III,B,4,c
Land Use
Change Tax
Asb III,B,4,d
Contracts Submitted
Asb III,B,5,a
Contract Employees
Asb III,B,5,b
Exemptions & Credits
Periodic Review of Tax
Credits
Asb III,C,1,a
Periodic Review of
Exemptions
Asb III,C,1,b
3 Sub Categories
BTLA Form A-9's
Asb III,C,2
BTLA Form A-12s
Asb III,C,3
Data Accuracy
80% Free of
Material Errors
Asb III,D,1
2 Sub Categories
Accuracy of Data
Elements-Advisory Only
Asb III,D,2
Proportionality
PRD
Asb III, E,1
2 Sub Categories
Strata within 5% of
Overall MediaPRD
Asb III,E,2
USPAP Compliant Report
Copies of this report
shall be delivered to the
municipality and to the
DRA at no additional
cost. Asb III, F,1
% of ASB Criteria Met
Walpole Warren Weare Wentworth Windsor
MET MET MET MET MET
MET MET MET MET MET
MET MET MET MET MET
MET MET MET MET MET
MET NOT MET MET NOT MET NOT MET
MET NOT MET MET NOT MET NOT MET
MET NOT MET MET NOT MET NOT MET
MET NOT MET MET MET MET
MET MET MET MET MET
MET MET MET MET MET
MET NOT MET MET NOT MET NOT MET
MET NOT MET MET MET MET
NOT MET NOT MET NOT MET NOT MET MET
NOT MET NOT MET MET NOT MET MET
MET MET MET MET MET
MET MET MET MET MET
MET MET MET MET MET
MET MET MET MET MET
MET MET MET MET MET
89.47% 57.89% 94.74% 68.42% 78.95%
NH DRA 2012 Annual Report - Page 189

2011 ASSESSMENT REVIEW REPORT SUMMARY COMPARISON
CATEGORY ASB GUIDELINE
Level and Uniformity of
Assessments Ratio
Asb III, A,1
2 Sub CategoriesCOD
Asb III, A,2
Assessing Practices
9 Sub Categories
April 1st Assessment
Date-No Value if Doesn't
Exist April 1st
Asb III,B,2
Revised Inventory
Program
Asb III,B,3
Current Use A-10's
Asb III,B,4,a
Current Use A-12's
Asb III,B,4,b
Compliance with
CUB 304
Asb III,B,4,c
Land Use
Change Tax
Asb III,B,4,d
Contracts Submitted
Asb III,B,5,a
Contract Employees
Asb III,B,5,b
Exemptions & Credits
Periodic Review of Tax
Credits
Asb III,C,1,a
Periodic Review of
Exemptions
Asb III,C,1,b
3 Sub Categories
BTLA Form A-9's
Asb III,C,2
BTLA Form A-12s
Asb III,C,3
Data Accuracy
80% Free of
Material Errors
Asb III,D,1
2 Sub Categories
Accuracy of Data
Elements-Advisory Only
Asb III,D,2
Proportionality
PRD
Asb III, E,1
2 Sub Categories
Strata within 5% of
Overall MediaPRD
Asb III,E,2
USPAP Compliant Report
Copies of this report
shall be delivered to the
municipality and to the
DRA at no additional
cost. Asb III, F,1
% of ASB Criteria Met
MET NOT MET MET
54 1 87%
54 1 87%
42 13 68%
54 1 87%
27 28 44%
27 28 44%
27 28 44%
39 16 63%
52 3 84%
55 0 89%
41 14 66%
44 11 71%
38 17 61%
45 10 78%
53 2 85%
54 1 93%
55 0 89%
54 1 87%
51 4 82%
NH DRA 2012 Annual Report - Page 190