state of indiana justice reinvestment advisory...
TRANSCRIPT
State of Indiana
Justice Reinvestment Advisory Council
ANNUAL REPORT October 1, 2016-September 30, 2017

1
Executive Summary Legislation establishing the Justice Reinvestment Advisory Council (JRAC) went into effect on July 1, 2015. JRAC consists of leadership from both the executive and judicial branches of state and local government. The JRAC organizational model consists of nine statutory members, a chairperson, and two standing committees (data and legislation). Between October 1, 2016 and September 30, 2017, JRAC reviewed and made funding recommendations for Department of Correction community supervision grants, reviewed the Division of Mental Health and Addiction’s Recovery Works program, drafted legislative proposals, and worked with the Evidence Based Decision Making State Team on criminal justice data collection.
Accomplishments
• FY 17 unused grant funds o $1.2M distributed to EBDM counties for pretrial services o $500K distributed to 17 counties and 1 regional community corrections agency
One-time funding/short-term projects • training, equipment, data processing, drug testing supplies, notification
technology • FY 18 Community Corrections Grant Awards
o $25M distributed to 160 entities o 167 eligible entities requested $30.6M o 31 new staff hired, 14 new programs established, and existing capacity expanded
• Recovery Works Program o $13,249,737 expended for 14,595 individuals in FY17 o $4,748.169 expended for 2,646 new participants in FY18 (as of August 31) o Top 5 services: medication, group substance use disorder counseling, individual skills
training/development, transportation, housing o Top 5 counties: Marion, Vanderburgh, Allen, Madison, Monroe
• Legislative Work o Testimony before House Courts and Criminal Code Committee (January 2017) o Testimony before Senate Criminal Law Committee (February 2017) o Drafted and supported amendments to IC 12-23-19-1, IC12-23-19-2, and IC 35-38-3-3(d) o Testimony before Interim Study Committee on Corrections and Criminal Law (September
2017) • Data Collection Improvements
o Partnership with Management Performance Hub (MOU pending) o Jail population survey
2
Contents
Executive Summary ............................................. 1
Justice Reinvestment Advisory Council Members 3
About the Justice Reinvestment Advisory Council 4
Meeting Highlights .............................................. 6
Committee Summaries ........................................ 7
FY17 Community Corrections Grant Summary ..... 8
FY18 Community Corrections Grant Summary ..... 8
Recovery Works Program Summary .................. 10
Program/Treatment Plan Information ............... 11
DOC Population Reports .................................... 13
Jail Data Summary ............................................ 14
Impact of 1006 .................................................. 15
APPENDIX ......................................................... 19

3
Justice Reinvestment Advisory Council Members
Jane Seigel, Chair Executive Director
Indiana Office of Court Services
Mark Bowen President
Indiana Sheriffs Association
Robert Carter, Jr. Commissioner
Indiana Department of Correction
Larry Landis Executive Director
Indiana Public Defender Council
Adam McQueen President
Probation Officers Professional Association of Indiana
Kevin Moore Director
Division of Mental Health and Addiction
David Murtaugh Executive Director
Indiana Criminal Justice Institute
David Powell Executive Director
Indiana Prosecuting Attorneys Council
Bill Watson President
Indiana Association of Community Corrections Act Counties
4
About the Justice Reinvestment Advisory Council Legislation establishing the Justice Reinvestment Advisory Council went into effect on July 1, 2015. The nine-member Advisory Council consists of leadership from state and local government. IC 33-38-9.5 provides the following:
Membership (1) The executive director of the Indiana public defender council or the executive director's designee. (2) The executive director of the Indiana prosecuting attorneys council or the executive director's designee. (3) The director of the division of mental health and addiction or the director's designee. (4) The president of the Indiana Sheriffs' Association or the president's designee. (5) The commissioner of the Indiana department of correction or the commissioner's designee. (6) The executive director of the Indiana judicial center or the executive director's designee. (7) The executive director of the Indiana criminal justice institute or the executive director's designee. (8) The president of the Indiana Association of Community Corrections Act Counties or the president's designee. (9) The president of the Probation Officers Professional Association of Indiana or the president's designee.
Chair The executive director of the Indiana judicial center shall serve as chairperson of the advisory council. Purpose The purpose of the advisory council is to conduct a state level review and evaluation of: (1) local corrections programs, including community corrections, county jails, and probation services; and (2) the processes used by the department of correction and the division of mental health and addiction in awarding grants. The advisory council may make a recommendation to the department of correction, community corrections advisory boards, and the division of mental health and addiction concerning the award of grant.
Goal The goal of the justice reinvestment advisory council is to develop incarceration alternatives and recidivism reduction programs at the county and community level by promoting the development of: (1) probation services; (2) problem solving courts;
5
(3) mental health treatment; (4) substance abuse treatment; (5) programs providing for court supervision, probation, or pretrial diversion; (6) community corrections; (7) evidence based recidivism reduction programs for currently incarcerated persons; (8) other alternatives to incarceration. Meetings The advisory council shall meet as necessary to: (1) work with the department of correction and the division of mental health and addiction to establish the grant criteria and grant reporting requirements described in subsection (k); (2) review grant applications; (3) make recommendations and provide feedback to the department of correction and the division of mental health and addiction concerning grants to be awarded; (4) review grants awarded by the department of correction and the division of mental health and addiction; and (5) suggest areas and programs in which the award of future grants might be beneficial. Staff The Indiana judicial center shall staff the advisory council.
6
Meeting Highlights *click hyperlinks to view minutes
October 20, 2016 • September DOC inmate population report and trends • DOC report on applications for $2M in unused FY17 grant funds • DMHA update on Recovery Works • Discussion of data reporting and performance measures
November 18, 2016 • DOC report on FY17 unused grant funds and recommendations • Approval of grant funding recommendations for unused FY17 funds • DMHA update on Recovery Works • Legislative subcommittee report and abstract of judgment discussion
January 12, 2017 • January DOC inmate population report • DOC report on FY18 grant application process • DMHA update on Recovery Works • Legislative & Data update
April 7, 2017 • DOC report on FY18 community corrections grant recommendations • DMHA update on Recovery Works • Data subcommittee report • Legislative subcommittee report
June 9, 2017 • DOC update on grant award notifications and audit discussion • DMHA update on Recovery Works • Discussion on legislative summer study committees
August 4, 2017 • DOC report on audits • DMHA update on Recovery Works and Phase I evaluation • Legislative subcommittee report
September 22, 2017 • DOC population trends and report on FY19 grant process • DMHA Update on Recovery Works and Phase I evaluation • Legislative and data discussion • Review of Annual Report
7
Committee Summaries
Legislative Committee
The JRAC Legislative Committee drafted and supported amendments to IC 12-23-19-1, IC 12-23-19-2, IC 35-38-3-3(d), and IC 33—38-9.5(1)(k) during the 2017 session of the Indiana General Assembly. JRAC supported the following bills: HB 1010 on commitment to DOC for Level 6 felons; HB 1006 on Recovery Works misdemeanor pilot and Recovery Works services for juveniles waived to adult court; and HB 1349 on rehabilitation progress and recidivism reporting. In addition, JRAC supported HB 1218 on adding juvenile representatives to community corrections advisory boards. During the session, JRAC members testified in the House Courts and Criminal Code Committee and the Senate Corrections and Criminal Law Committee on issues related to implementation of sentencing reform.
JRAC members testified before the House Courts and Criminal Code Committee in January 2017 and the Senate Corrections and Criminal Law Committee in February 2017. Additionally, JRAC members testified before the Interim Study Committee on Corrections and Criminal Law in September 2017.
Data Committee
The JRAC Data Committee worked with Management Performance Hub to develop a plan to share data for JRAC and Evidence Based Decision Making (EBDM) projects.
The Data Committee partnered with the Indiana Sheriffs Association to conduct a jail population survey in July and August 2017. All 91 jails responded to the survey. The survey is in Appendix 4. Lisa Thompson, project manager for Trial Court Technology, presented the survey results to the Interim Study Committee on Corrections and Criminal Code on September 7 and September 19, 2017.
The Data Committee also worked with the Supreme Court’s Office of Judicial Administration and Trial Court Technology to achieve a 100% completion rate on abstracts of judgement for Level 6 felons. The abstract information is necessary for accurate data on felony sentences and for county billing for reimbursement from DOC.

8
FY17 Community Corrections Grant Summary DOC distributed $2M in unused FY17 grant funding in November of 2017. DOC solicited grant applications to fund pretrial services in EBDM counties and one-time/short-term projects in other counties. 57 eligible entities requested $5,685,456 in funding.
JRAC approved $1,121,500 in pretrial services funding for the following 8 EBDM counties: Allen, Bartholomew, Grant, Hamilton, Hendricks, Jefferson, Porter, and Tipton.
JRAC approved $531,300 in one-time/short-term funding for the following 16 counties and 1 regional community corrections agency: Clark, Elkhart, Hoosier Hills, Johnson, Lake, Lawrence, Marshall, Martin, Miami, Monroe, Montgomery, Morgan, Owen, Parke, Randolph, St. Joseph, and Vigo.
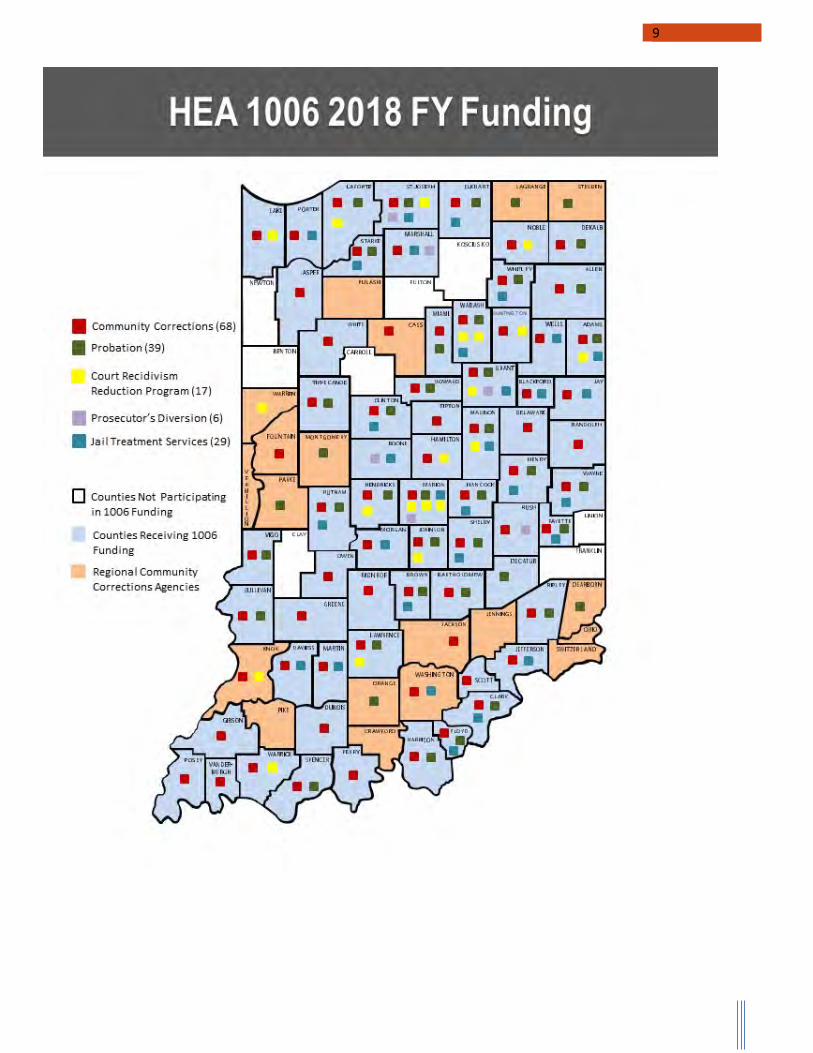
FY18 Community Corrections Grant Summary DOC distributed $25M in grant funding for FY18. DOC solicited grant applications to fund community corrections programs, probation departments, court recidivism reduction programs, and prosecutor diversion programs. 167 eligible entities applied for DOC funding, requesting a total of $30,611,218.99. JRAC approved $25M in funding for:
• 68 community corrections agencies ($15,591,718)• 39 probation departments ($4,728,400)• 17 court recidivism reduction programs ($2,014,600)• 6 prosecutor diversion programs ($634,900)• 29 jail treatment services ($2,030,382)
A summary of the funding requests and awards is in Appendix 1. FY18 funding expanded programming for electronic monitoring, treatment services, drug testing supplies, training, equipment, and full-time staff benefits. The funding for community corrections agencies resulted in 16 new staff and 5 new levels of supervision/programming (pretrial program, 2 work release programs, mental health court, home detention/electronic monitoring, and day reporting). The funding for jail treatment services resulted in 3 new staff, 3 new entities, and 3 new programs (substance abuse and mental health treatment program, two cognitive behavioral programs). The funding for probation resulted in 6 new staff, 1 new entity, and 2 new levels supervision/programs (day reporting and pretrial program). The funding for prosecutor’s diversion resulted in 3 new staff, 1 new entity, and 1 new program (felony diversion). The funding for court recidivism reduction programs resulted in 3 new staff, 3 new entities, and 3 new programs (veteran’s court, drug court, and drug and alcohol court). DOC Commissioner Carter approved the funding effective July 1, 2017. Information on FY16, FY17, and FY18 funding for community supervision grants is in Appendix 3.
9

10
Recovery Works Program Summary House Enrolled Act 1006 (2015) established the Forensic Treatment Services Grants through the Family and Social Service Administration’s Division of Mental Health and Addiction (DMHA). The grant program, known as Recovery Works, increases the availability of specialized mental health and addiction treatment and recovery services in the community for persons without insurance coverage who may otherwise face incarceration. DMHA officially launched the Recovery Works treatment program on November 1, 2015. Recovery Works is a voucher-based system that works with entities that are DMHA certified/licensed and demonstrate competency in the treatment of criminal justice populations. Recovery Works was funded at $20M for FY 2017 and $20M For FY 2018.
At the end of FY17, there were 14,595 unique participants enrolled in Recovery Works and $13,249,737 expended for services to participants. There were also 77 designated Recovery Works providers in the state. The top 5 services provided to participants were housing, skills development training, substance use disorder treatment (group), intensive outpatient treatment, and case management. The top 5 counties with participants enrolled in Recovery Works were Marion, Vanderburgh, Madison, Vigo, and Monroe. In the first two months of FY 18 (as of August 31, 2017), there were an additional 16 approved providers, an additional 2,646 participants enrolled in Recovery Works, and an additional $4,748,169 expended for direct service care to participants, for a total of 17,522 participants since inception.
DMHA contracted with the Indiana University Center for Criminal Justice Research (IUCCJR) to conduct an evaluation of the Recovery Works program. Phase I of the study covered Recovery Works from inception in November 2015 through May 2017 and examined administrative data from DARMHA (Data Assessment Registry Mental Health and Addiction) and the Indiana Department of Correction. During that time, 12,042 eligible participants were enrolled in Recovery Works.
The IUCCJR study shows the following: clients were predominantly white males with an average age of 34 and no insurance; alcohol, opioids, and marijuana were the most common substances used and more than half of clients had a prior substance abuse treatment episode. The study also shows that for clients who remained in Recovery Works for at least 6 months, there were statistically significant increases in rates of employment and insurance coverage and decreases in self-reported arrests. The study assessed recidivism for clients with a year at risk and for clients who has previously been to DOC. Of the 1321 clients at risk for at least one year, the incarceration rate was 7.7% (with 52% incarcerated on a technical violation). Of the 571 clients at risk for at least one year who has previously been released from DOC, the re-incarceration rate was 13.8% (with 57% re-incarcerated for a technical violation). The IUCCRI Phase I policy brief is in Appendix 5.
11
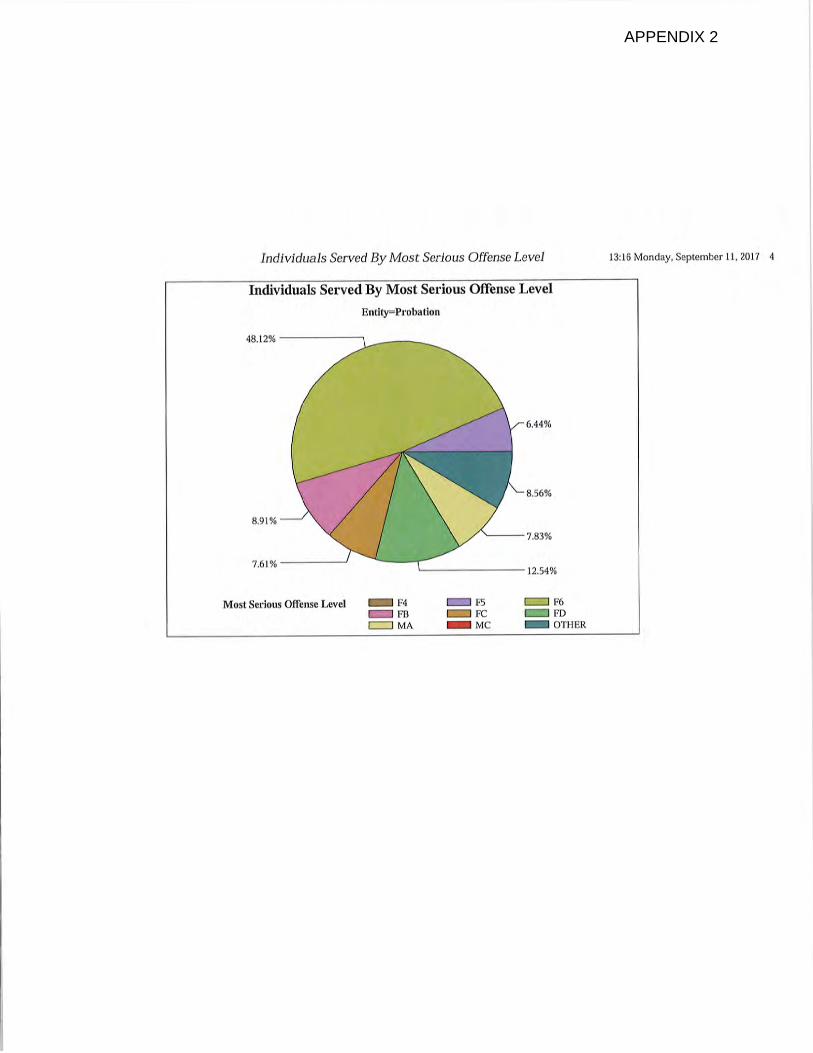
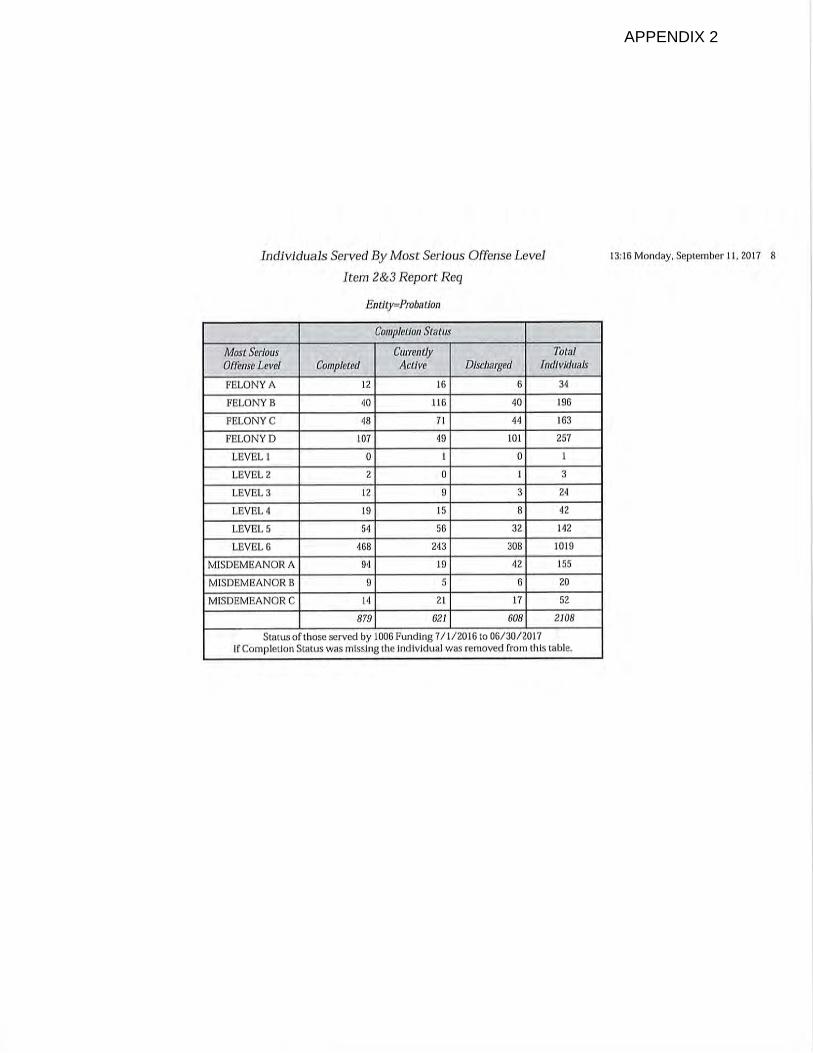
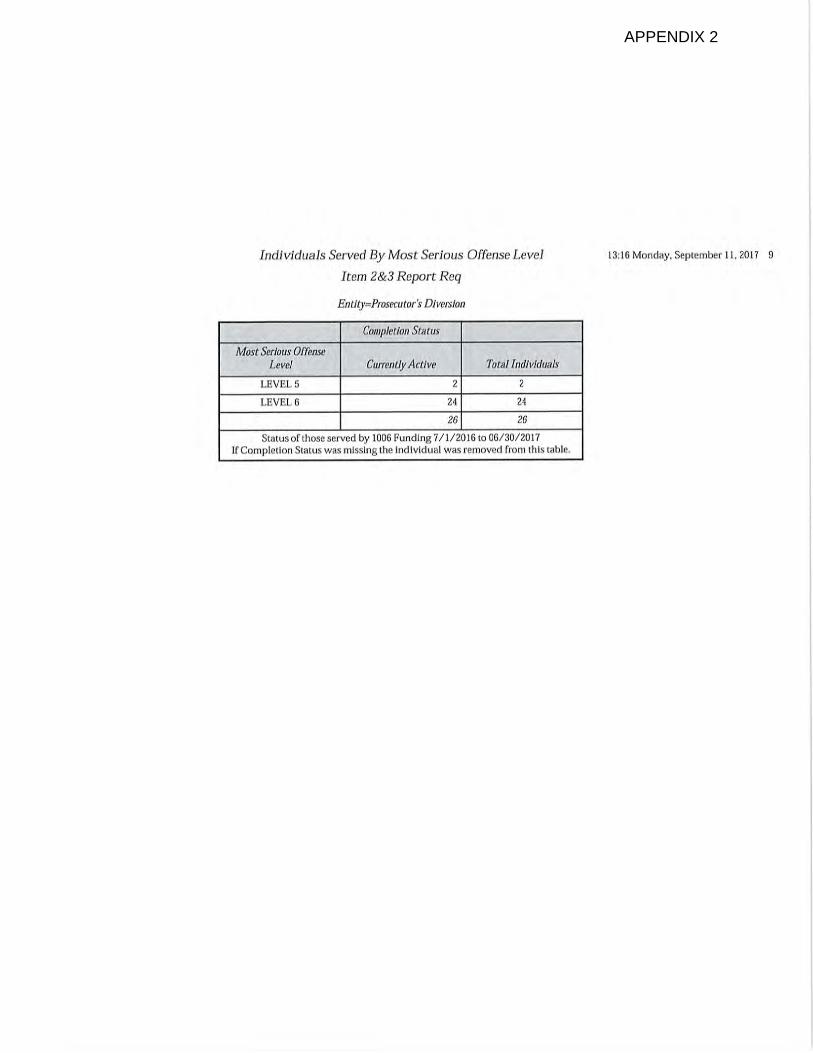
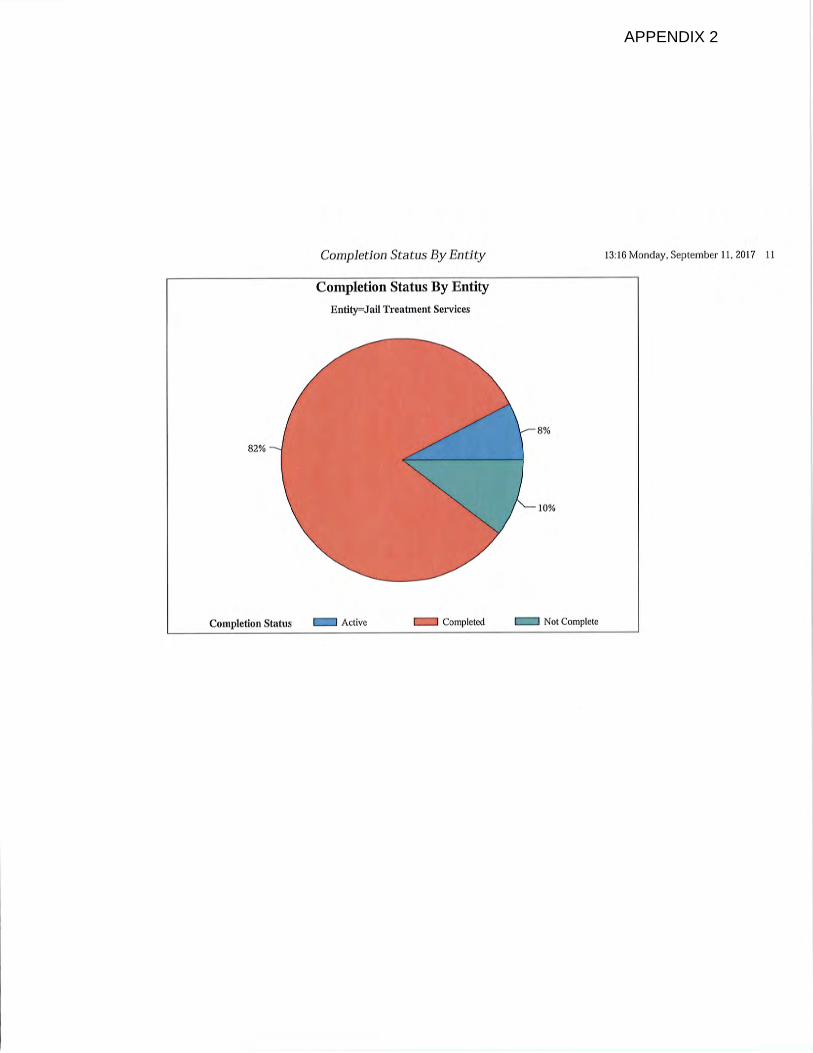
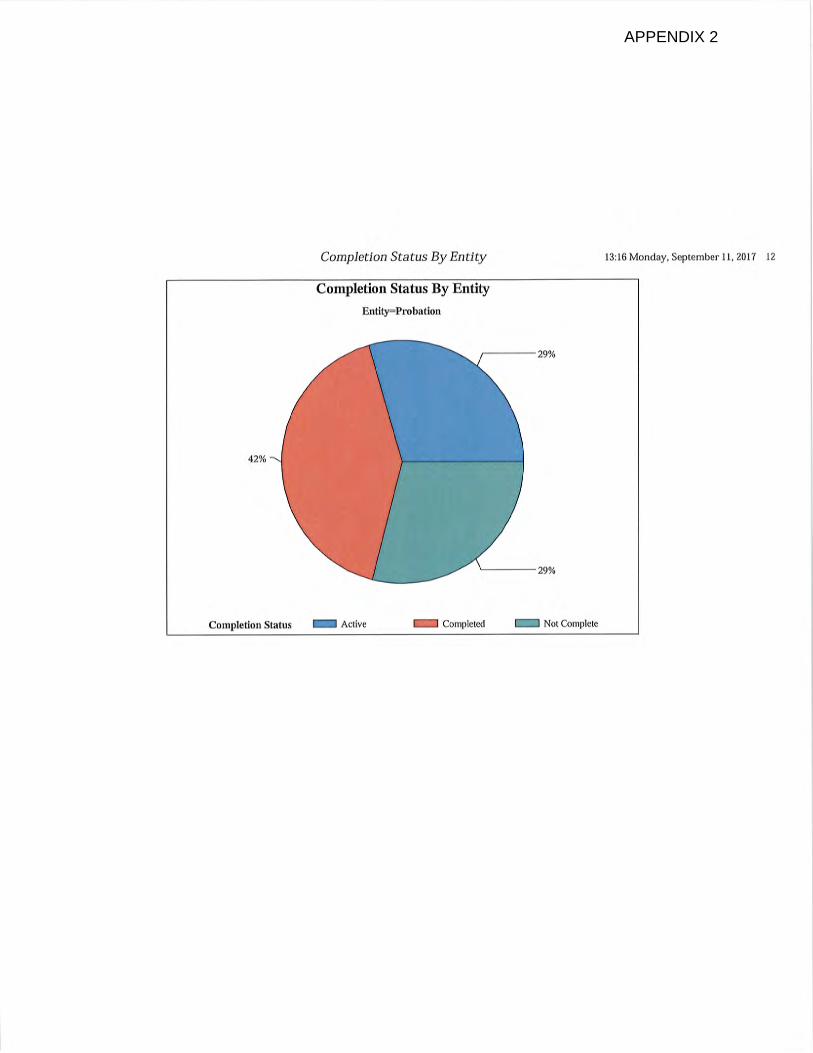
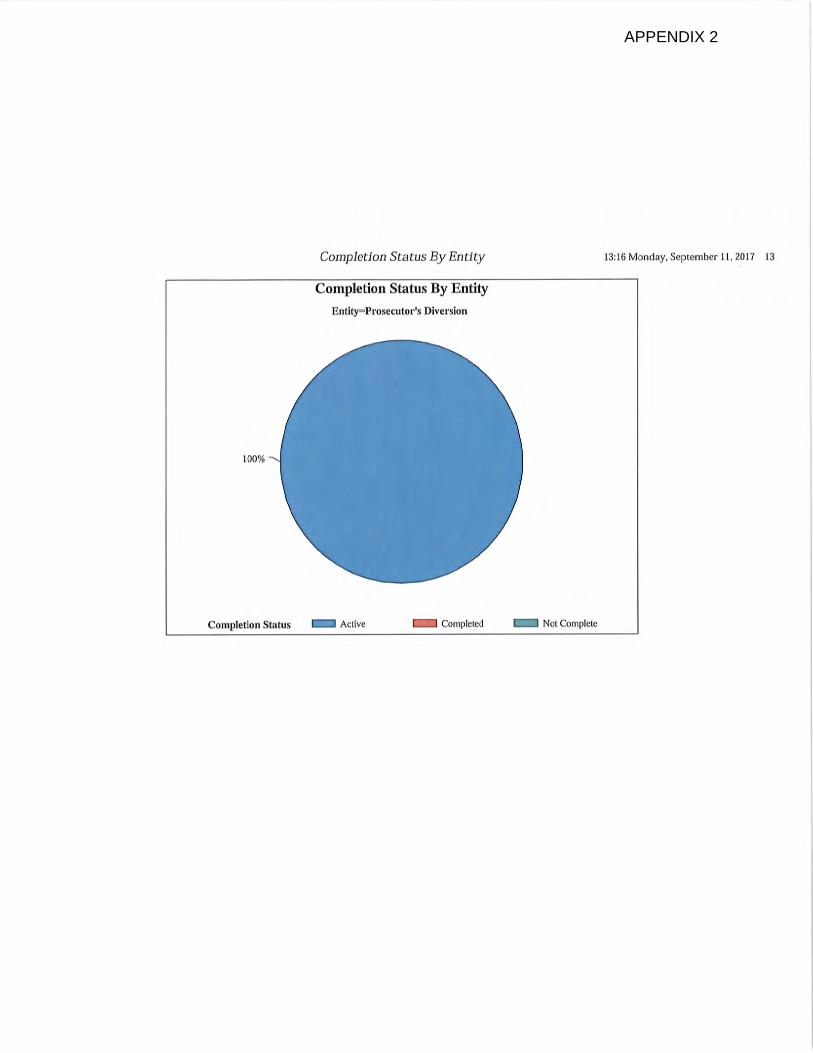
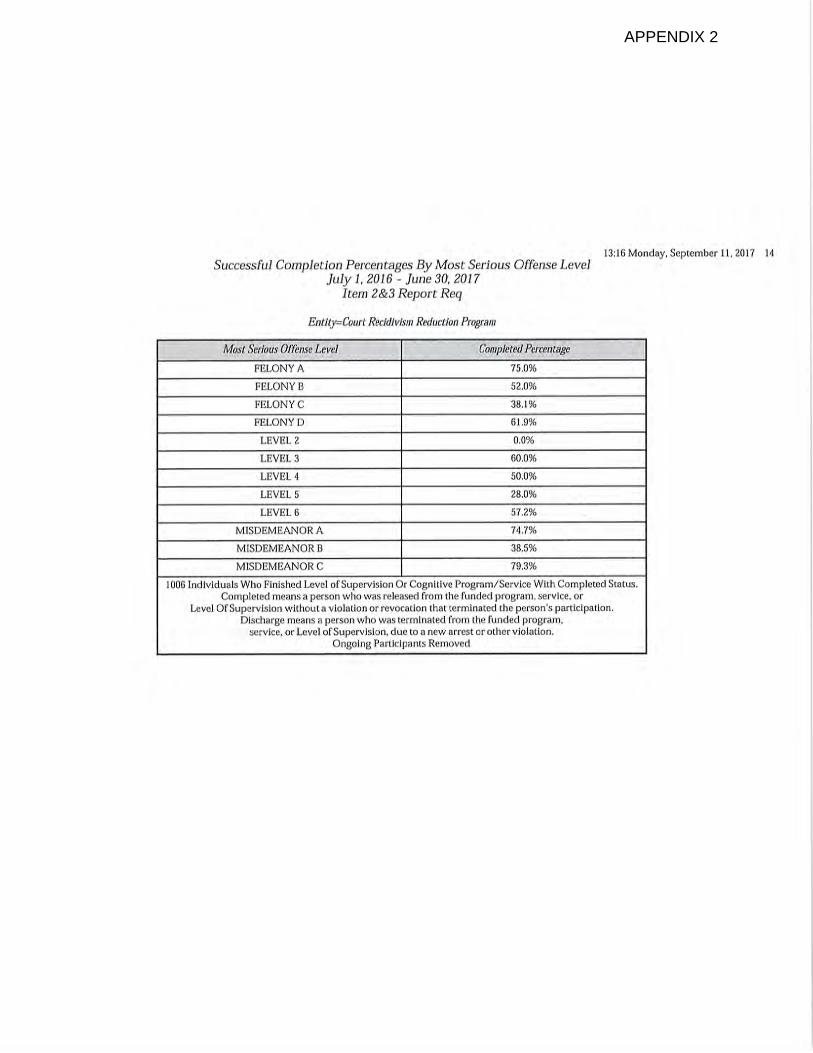
Program/Treatment Plan Information Effective July 1, 2017, IC 33-38-9.5-2(l) requires that the Justice Reinvestment Advisory Council annual report include the following information from the Department of Correction:
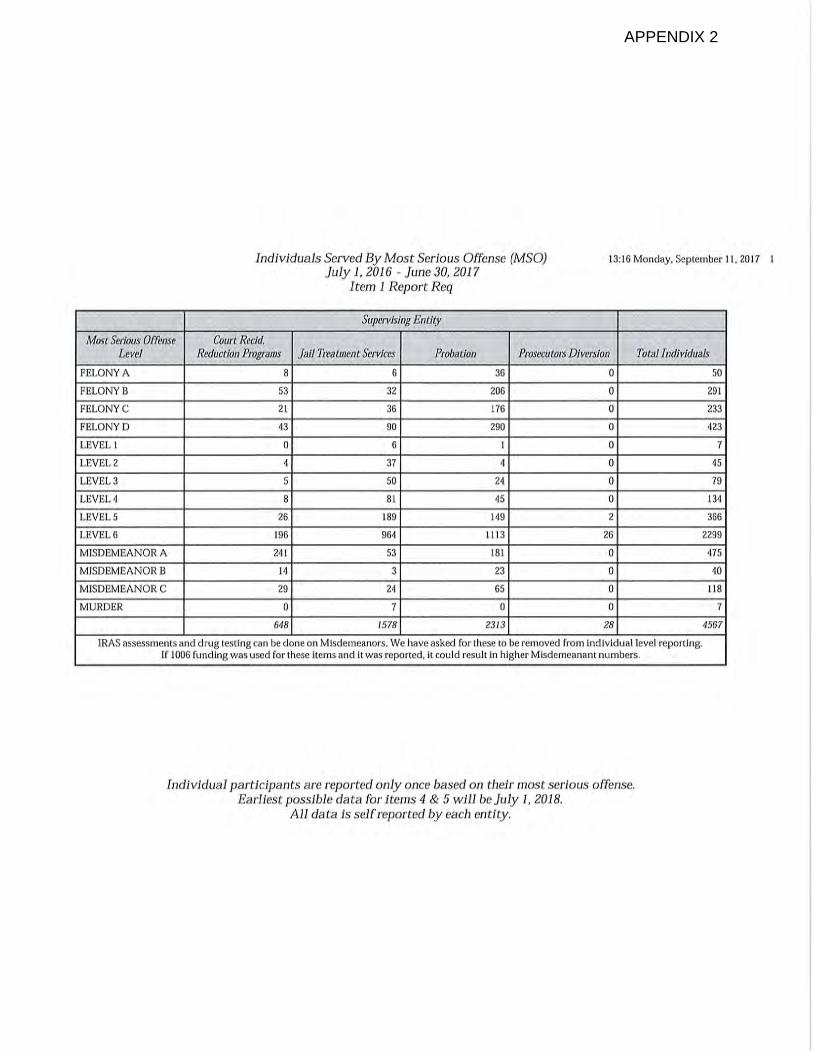
(1) The total number of participants, categorized by level of most serious offense, who were served by the entity through funds described in subsection (k).
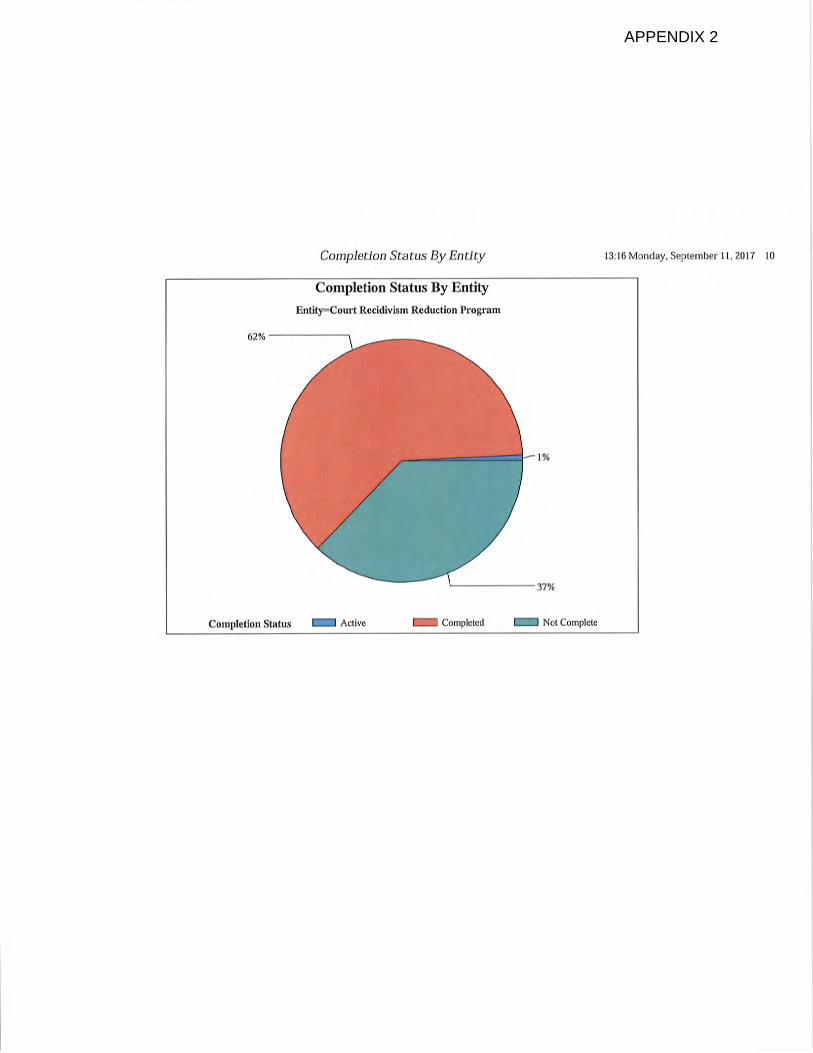
(2) The percentage of participants, categorized by level of most serious offense, who completed a treatment program, service, or level of supervision.
(3) The percentage of participants, categorized by level of most serious offense, who were discharged from a treatment program, service, or level of supervision.
(4) The percentage of participants, categorized by level of most serious offense, who: (A) completed a funded treatment program, service, or level of supervision; and (B) were subsequently committed to the department of correction;
within twenty-four (24) months after completing the funded treatment program, service, or level of supervision.
(5) The percentage of participants, categorized by level of most serious offense, who were:
(A) discharged from a funded treatment program, service, or level of supervision; and (B) subsequently committed to the department of correction;
within twenty-four (24) months after being discharged from the funded treatment program, service, or level of supervision.
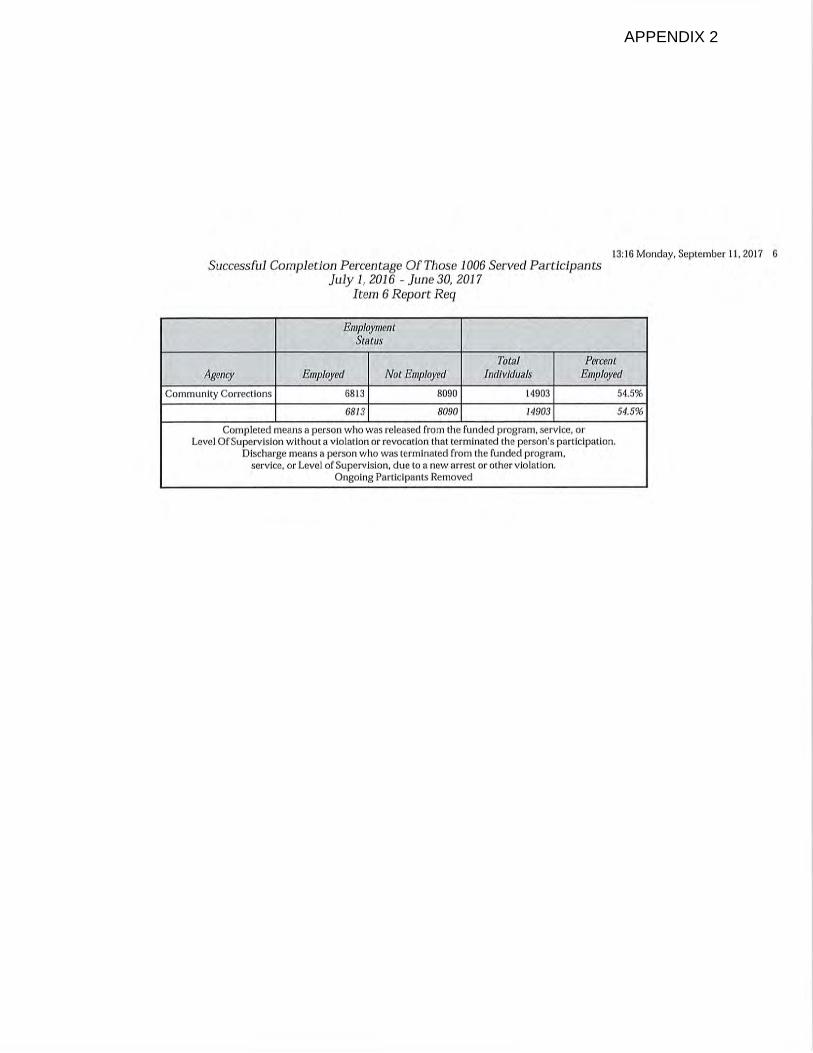
(6) The total number of participants who completed a funded treatment program, service, or level of supervision.
(7) The total number of participants who: (A) completed a funded treatment program, service, or level of supervision; and (B) were legally employed.
(8) Any other information relevant to the funding of the entity as described in subsection (k).
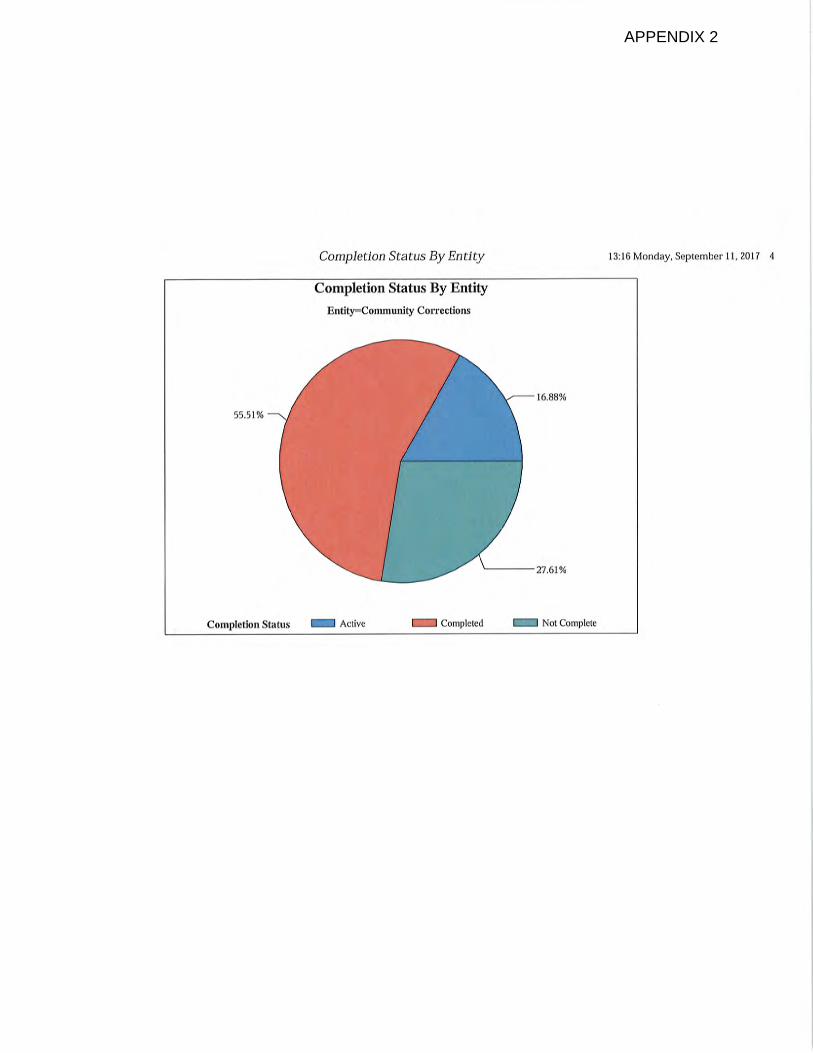
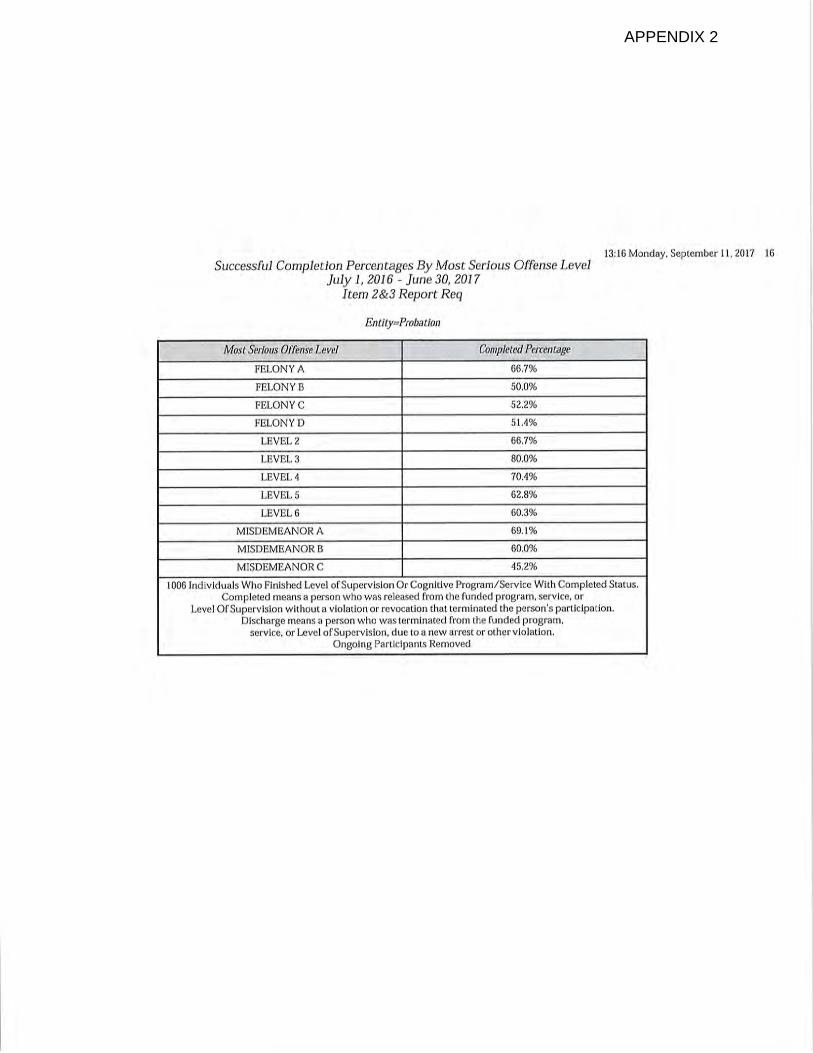
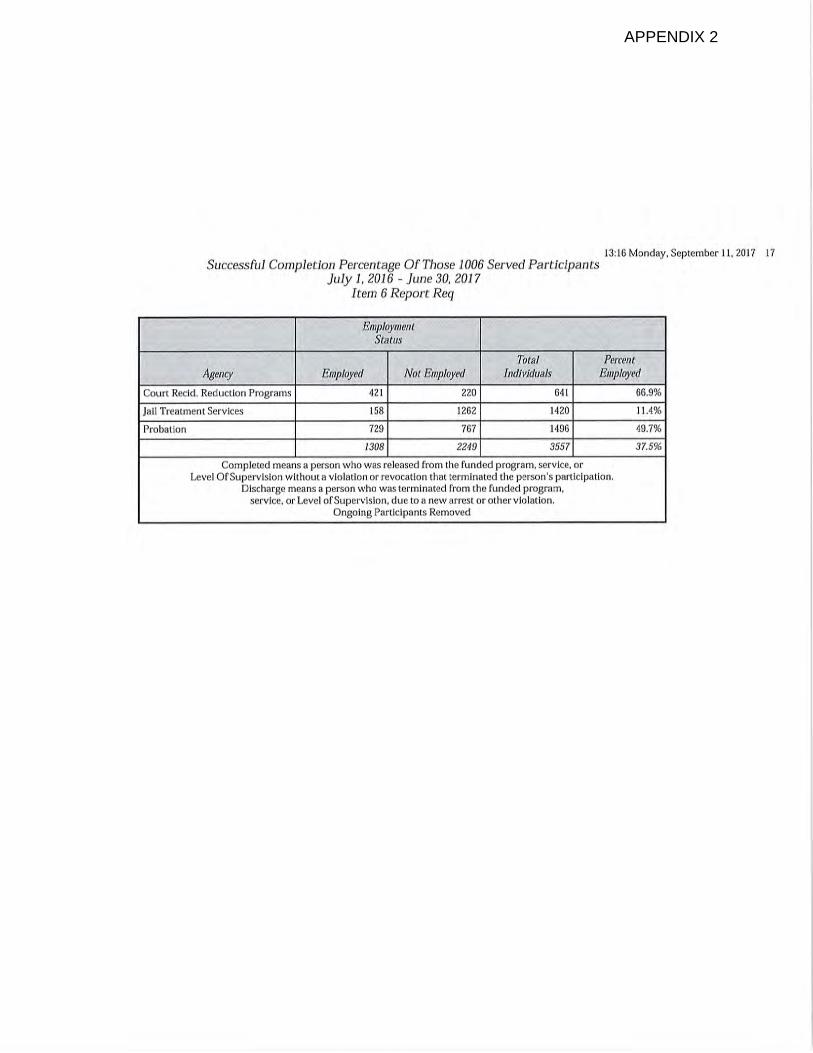
The information reported to DOC is from community corrections programs, probation departments, jail treatment, court recidivism reduction programs, and prosecutor diversion programs that received FY 17 grant funding. The reporting period covered July 1, 2016 to June 30, 2017. Funded programs reported on the number of individuals served, program completion rates, and employment rates. Data on participants by level of most serious offense is available in Appendix 2. Data on participant commitment to DOC within 2 years is not yet available. During this period, community supervision services were provided to 10,702 Level 6 offenders. The programs and services provided to these offenders included pretrial supervision, electronic monitoring, work release, substance abuse treatment, cognitive behavioral treatment programs (such as Thinking for a Change, Moral Reconation Therapy, and Relapse Prevention Therapy), drug treatment court, re-entry court, veteran’s court, behavioral health court, and problem-solving court).
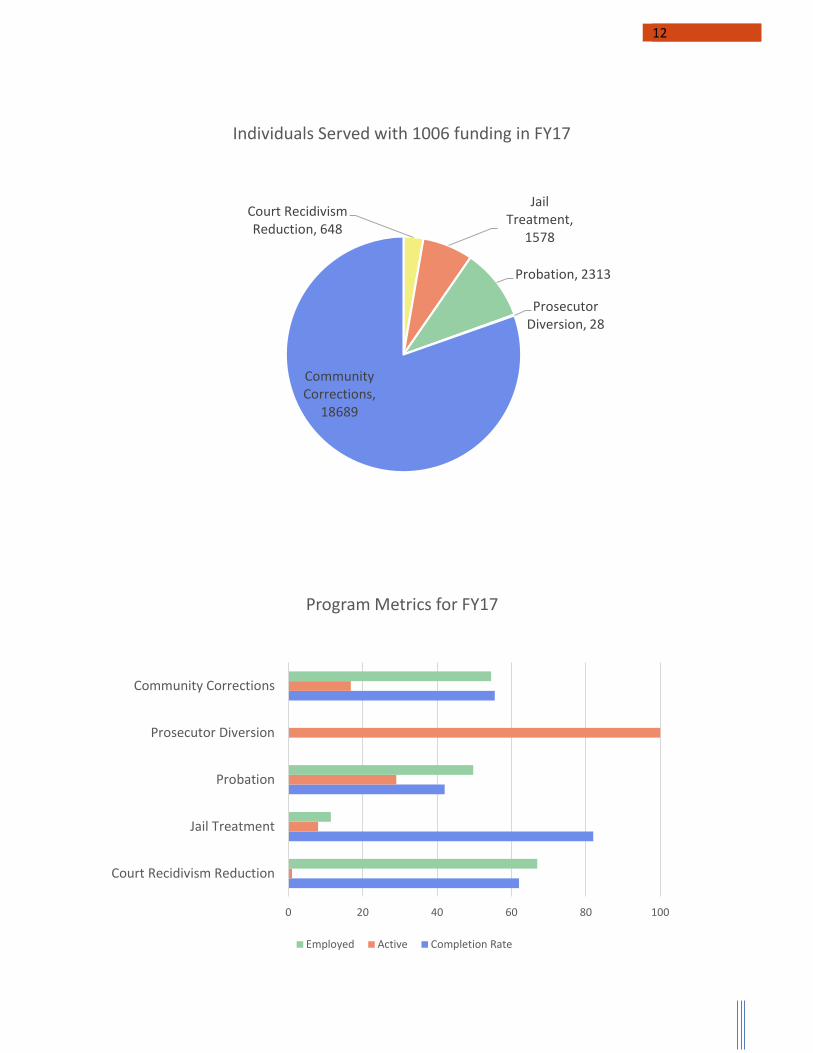
12
Court Recidivism Reduction, 648
Jail Treatment,
1578
Probation, 2313
Prosecutor Diversion, 28
Community Corrections,
18689
Individuals Served with 1006 funding in FY17
0 20 40 60 80 100
Court Recidivism Reduction
Jail Treatment
Probation
Prosecutor Diversion
Community Corrections
Program Metrics for FY17
Employed Active Completion Rate
13
DOC Population Reports IC 11-12-2-1(e) and (f) require the Department of Correction to submit a monthly report to the Justice Reinvestment Advisory Council regarding the following information:
(e) Before the tenth day of each month, the department shall compile the following information with respect to the previous month:
(1) The number of persons committed to the department. (2) The number of persons:
(A) confined in a department facility; (B) participating in a community corrections program; and (C) confined in a local jail under contract with or on behalf of the department.
(3) For each facility operated by the department: (A) the number of beds in each facility; (B) the number of inmates housed in the facility; (C) the highest felony classification of each inmate housed in the facility; and (D) a list of all felonies for which persons housed in the facility have been sentenced.
(f) The department shall: (1) quarterly submit a report to the budget committee; and (2) monthly submit a report to the justice reinvestment advisory council (as established in IC 33-38-9.5-2);
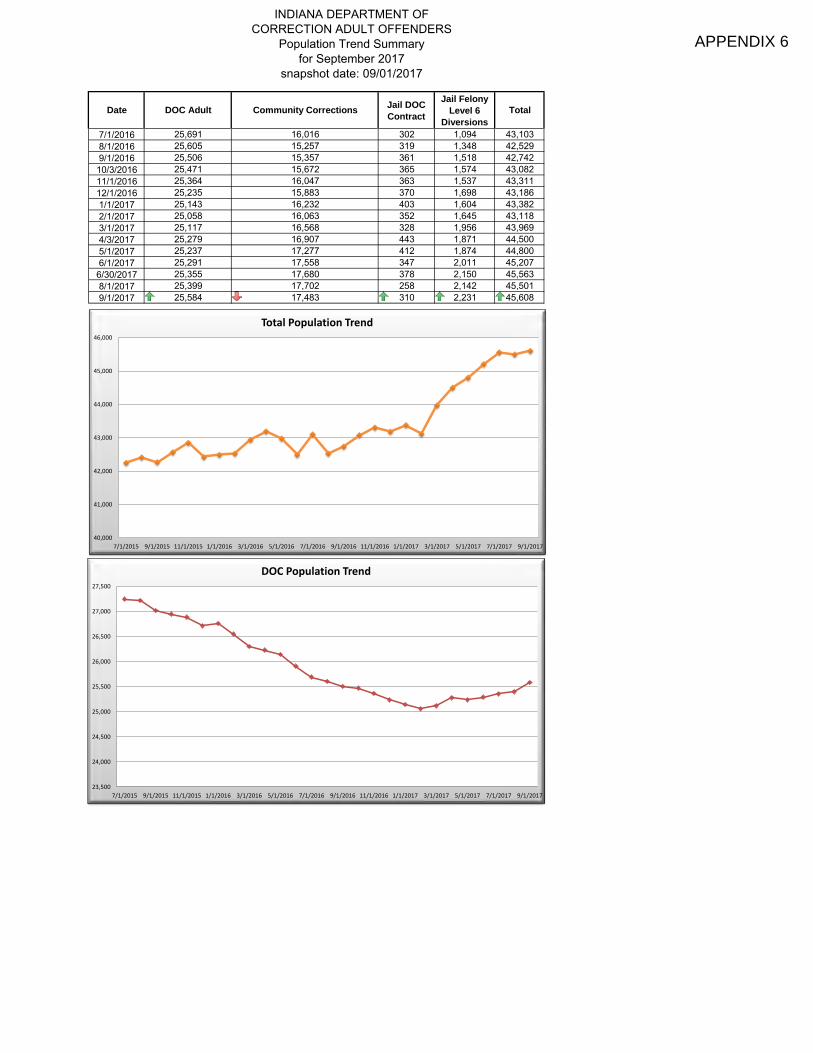
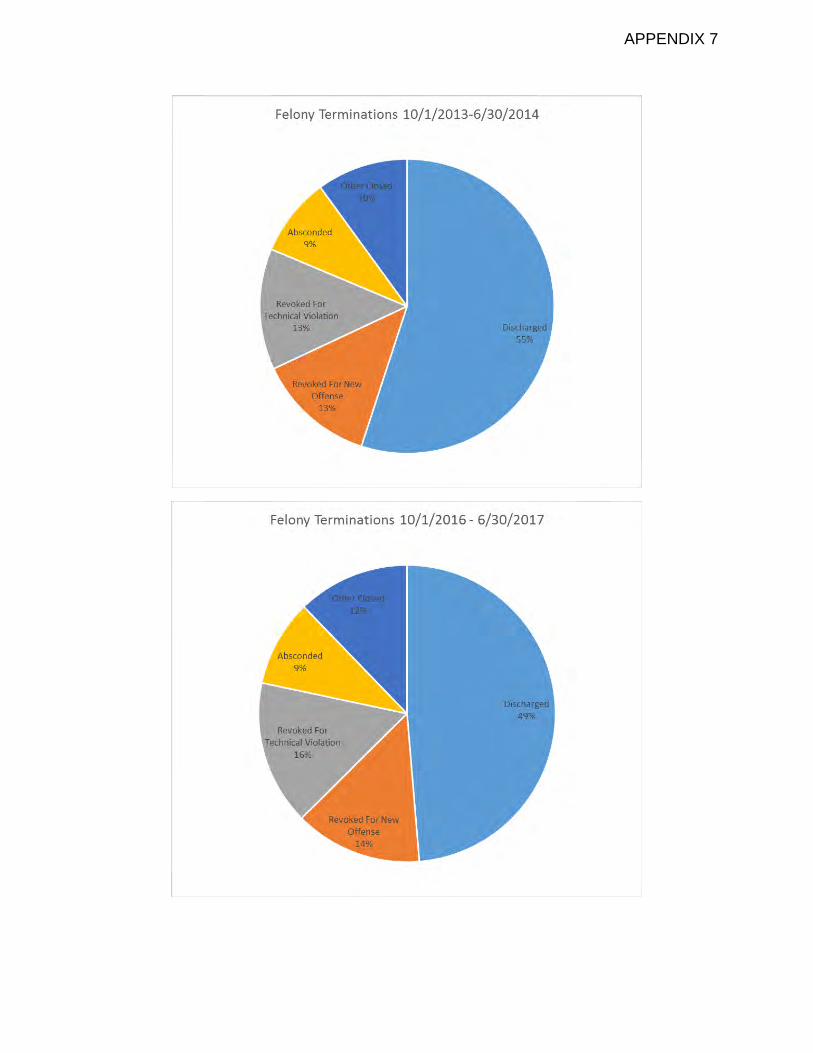
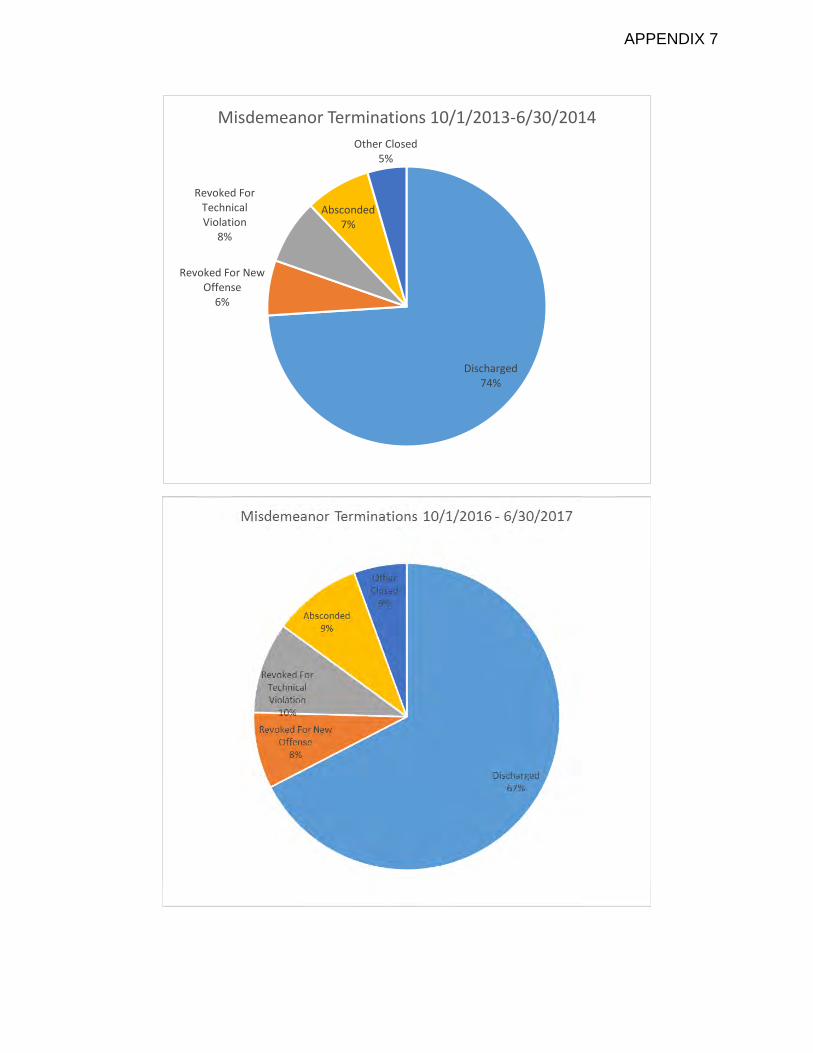
of the information compiled by the department under subsection (e). DOC submits monthly population reports to JRAC and posts the reports on the DOC website. The September 2017 report shows a slight decrease in the community corrections population, a slight increase in the jail population, and a slight increase in the DOC population. See Appendix 6. In addition, the Office of Judicial Administration’s Division of Trial Court Technology submits sentencing data to JRAC as requested. The sentencing data is pulled from original abstracts of judgment entered in Incite and includes information on probation. The original abstracts from October 1, 2016 to August 31, 2017 show an increase in the number of cases sentenced to probation. The abstract data includes information of probation revocations from October 1, 2016 to June 30, 2017. See Appendix 7.

14
Jail Data Summary On July 21, 2017, the Indiana Sheriffs’ Association (ISA) distributed a survey to all Sheriffs statewide asking for a summary of each county’s current jail population. Below is a summary of the self-reported data received from the 91 jails across the state (Ohio County no longer has their own jail). Although the “snap-shot” date was provided by each county, overall survey results range from July 18, 2017 to September 14, 2017.
• 25 different jail management systems reported • Annual cost of jail management systems totaling $1,622,241.08 • Although 44% of jail beds are filled with an F6 inmate, only 10% of all jail beds are filled due to
Sentenced F6s. • 44 jails are over capacity. Even if every Sentenced F6 were sent to DOC, there would still be 31 jails over
capacity. However, if ½ of the pretrial population were released to pretrial supervision, only 13 jails would be over capacity.
Jail Utilization Breakdown by Degree Only Total Jail Utilization
Level 6 Jail Inmates MR, Level 1-5 Jail Inmates Misdemeanor Jail Inmates

15
Impact of 1006
• Data from abstracts of judgment shows there has been a shift away from DOC sentences in favor of placement in local jails and probation. In March 2014, the most common sentence for a felony was a straight commitment to DOC, meaning the person was sentenced to a DOC commitment without community corrections or probation. These made up 22% of all original abstracts. Now, this type of sentence makes up only 10% of original abstracts, and is the fifth most common type of sentence. The most common type of sentence now is a jail sentence followed by probation. This category represented 15% of original abstracts in March 2014, but rose to 27% of abstracts by December 2016. Not only are F6 offenders being diverted to jails, the amount of time they are spending incarcerated is much lower than for FD offenders. In 2016, the average number of days imposed for a Class D Felony was 141, while the average number of days imposed for a Level 6 Felony was 84.
• Serious offenders are spending more time incarcerated in prison. The sentences being imposed have not changed significantly; however, the new credit time rules result in longer prison stays for higher level felonies. Overall, after adjusting for credit time, in 2016 the average DOC executed sentence for each felony level was as follows:
a. Class A Felonies: 4,178 days b. Level 1 and 2 Felonies combined: 5,420 days c. Class B Felonies: 984 days d. Level 3 and 4 Felonies combined: 1,783 days e. Class C Felonies: 578 days f. Level 5 Felonies: 782 days
• Sentences to DOC for property and substance crimes have fallen dramatically. In March 2014
(when tracking of this data began) offenders were sentenced to a total of 211,380 bed-days for property crimes. In December 2016, that number was 92,166, a 56% reduction. For substance crimes over the same period, the total number of DOC bed-days sentenced dropped from 397,178 to 171,335, a 55% drop.
• The amount of time felons spend in pre-trial incarceration has not changed significantly. In 2016, felons spent an average of 77 actual days incarcerated pre-trial. This is a slight decrease from 82 actual days of pre-trial incarceration in 2015. Pre-trial incarceration effects county budgets, particularly with F6 offenders. F6 offenders spent an average of 45 days incarcerated pre-trial in 2016. The average sentence on an F6 is 84 days, meaning that F6 offenders are spending more than half of their sentences in pre-trial detention. In 2016, 41% of F6 offenders who received executed sentences had already served the entire sentence, meaning the county was not eligible to recoup any of the cost of incarceration that offender (DOC only reimburses counties for incarcerating F6 offenders post-conviction). In 2016, offenders spent 1,327,870

16
days in pre-trial incarceration for F6 offenses. If these sentences had been served post-sentence, the counties would have been eligible for $43,160,075 in reimbursement from DOC (this is slightly less than $35 per day because a small percentage of these offenders are eligible to go to DOC).

17
18
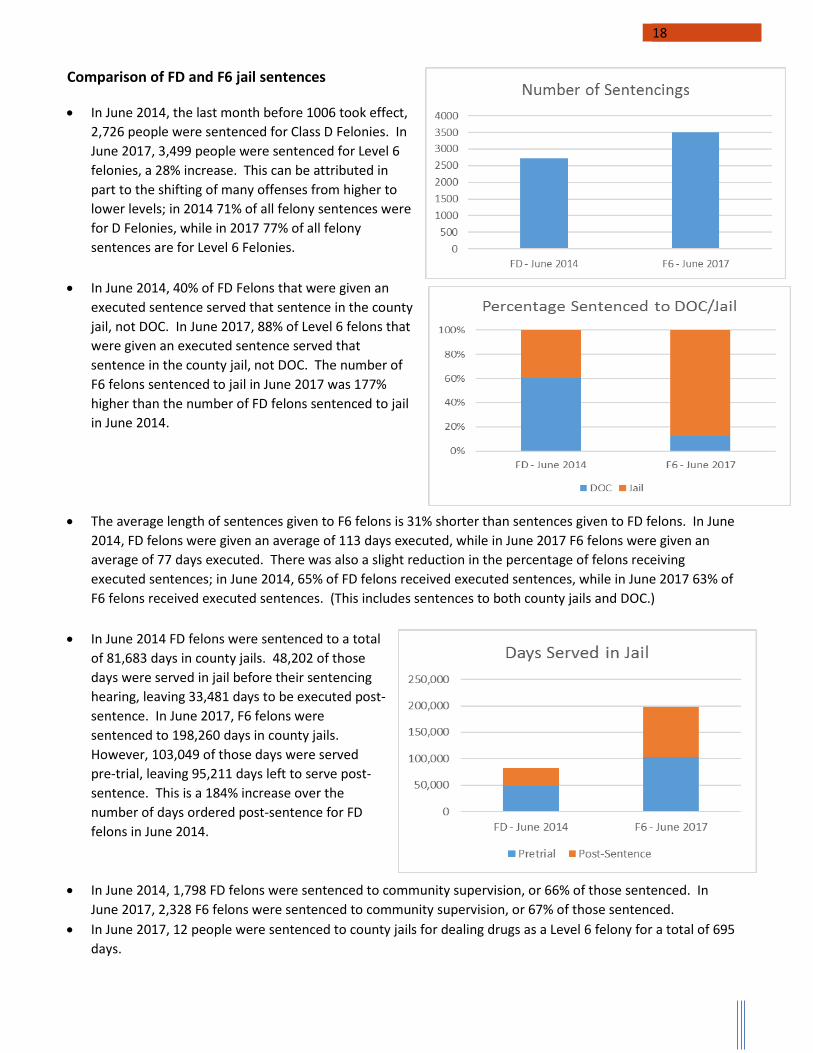
Comparison of FD and F6 jail sentences
• In June 2014, the last month before 1006 took effect, 2,726 people were sentenced for Class D Felonies. In June 2017, 3,499 people were sentenced for Level 6 felonies, a 28% increase. This can be attributed in part to the shifting of many offenses from higher to lower levels; in 2014 71% of all felony sentences were for D Felonies, while in 2017 77% of all felony sentences are for Level 6 Felonies.
• In June 2014, 40% of FD Felons that were given an
executed sentence served that sentence in the county jail, not DOC. In June 2017, 88% of Level 6 felons that were given an executed sentence served that sentence in the county jail, not DOC. The number of F6 felons sentenced to jail in June 2017 was 177% higher than the number of FD felons sentenced to jail in June 2014.
• The average length of sentences given to F6 felons is 31% shorter than sentences given to FD felons. In June 2014, FD felons were given an average of 113 days executed, while in June 2017 F6 felons were given an average of 77 days executed. There was also a slight reduction in the percentage of felons receiving executed sentences; in June 2014, 65% of FD felons received executed sentences, while in June 2017 63% of F6 felons received executed sentences. (This includes sentences to both county jails and DOC.)
• In June 2014 FD felons were sentenced to a total
of 81,683 days in county jails. 48,202 of those days were served in jail before their sentencing hearing, leaving 33,481 days to be executed post-sentence. In June 2017, F6 felons were sentenced to 198,260 days in county jails. However, 103,049 of those days were served pre-trial, leaving 95,211 days left to serve post-sentence. This is a 184% increase over the number of days ordered post-sentence for FD felons in June 2014.
• In June 2014, 1,798 FD felons were sentenced to community supervision, or 66% of those sentenced. In June 2017, 2,328 F6 felons were sentenced to community supervision, or 67% of those sentenced.
• In June 2017, 12 people were sentenced to county jails for dealing drugs as a Level 6 felony for a total of 695 days.
19
APPENDIX
#1—DOC FY18 Grant Awards Information
#2—FY17 Community Supervision Program Metrics (by most serious offense)
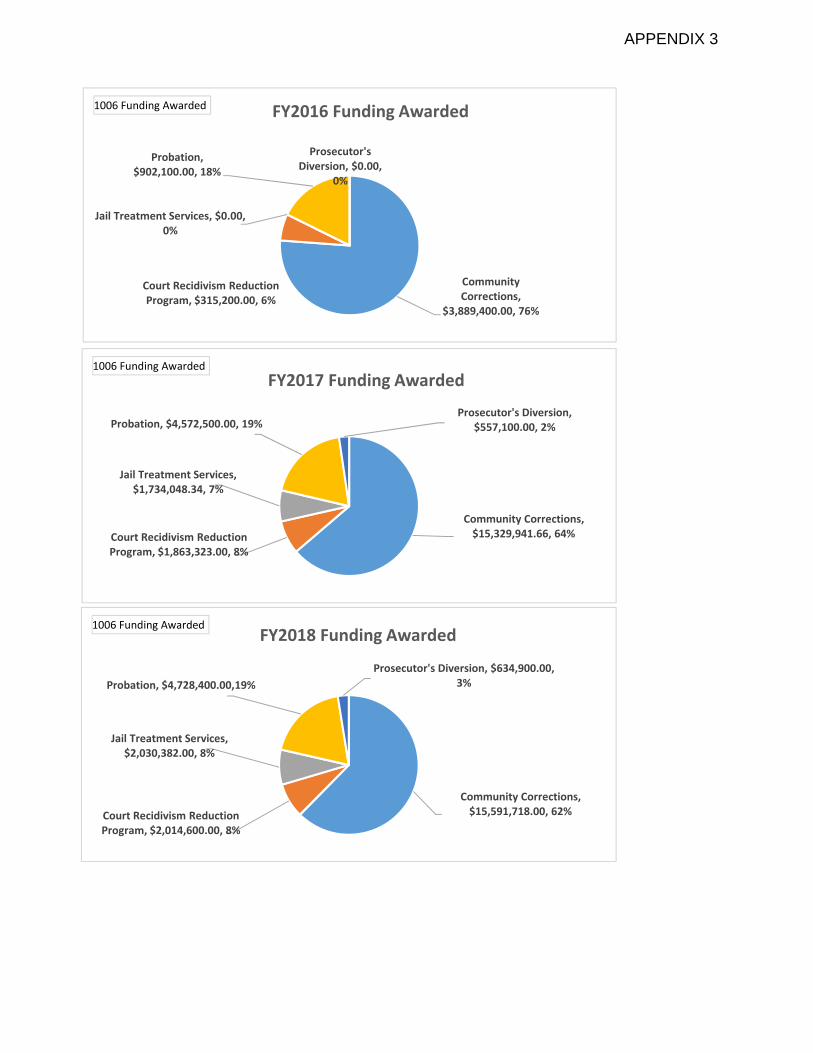
#3—FY16-18 Community Supervision Funding Charts
#4—Recovery Works Enrollment and Service
#5—Recovery Works Evaluation Phase I Policy Brief
#6—DOC Population Reports
#7—Abstract of Judgment Sentencing Data
#8—Jail Data Survey
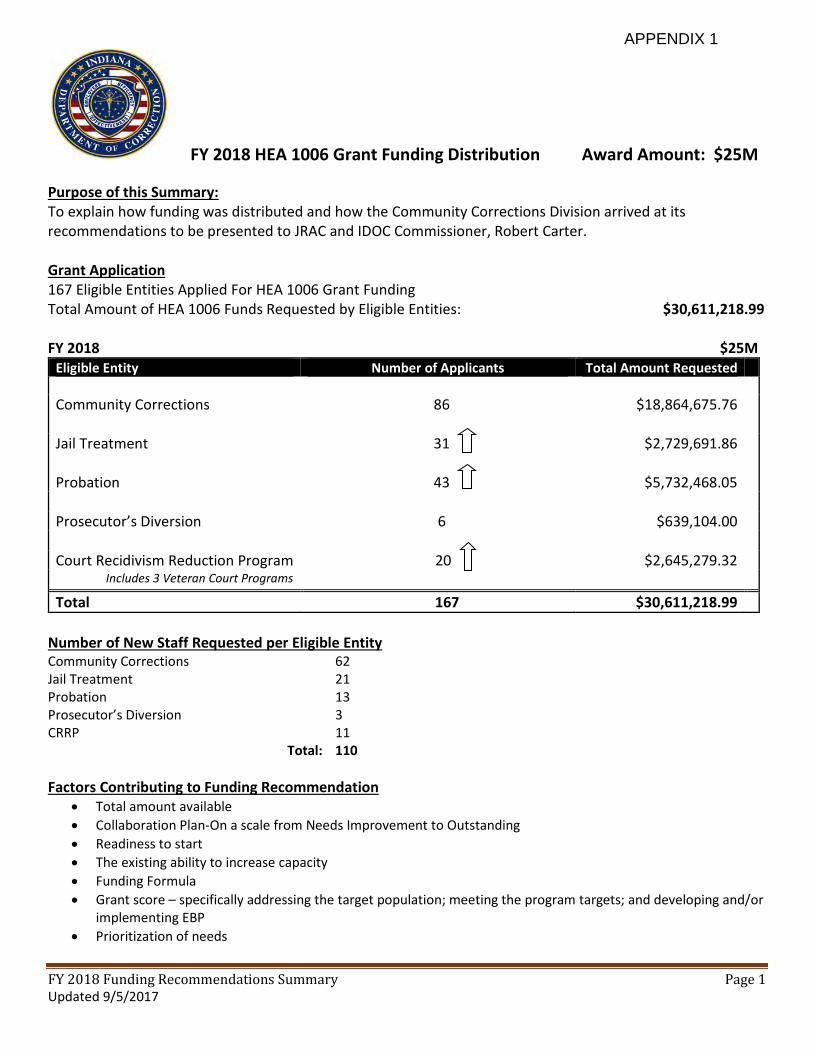
FY 2018 HEA 1006 Grant Funding Distribution Award Amount: $25M
FY 2018 Funding Recommendations Summary Page 1 Updated 9/5/2017
Purpose of this Summary: To explain how funding was distributed and how the Community Corrections Division arrived at its recommendations to be presented to JRAC and IDOC Commissioner, Robert Carter.
Grant Application 167 Eligible Entities Applied For HEA 1006 Grant Funding Total Amount of HEA 1006 Funds Requested by Eligible Entities: $30,611,218.99
FY 2018 $25M Eligible Entity Number of Applicants Total Amount Requested
Community Corrections 86 $18,864,675.76
Jail Treatment
Probation
31
43
$2,729,691.86
$5,732,468.05
Prosecutor’s Diversion 6 $639,104.00
Court Recidivism Reduction Program 20 $2,645,279.32 Includes 3 Veteran Court Programs
Total 167 $30,611,218.99
Number of New Staff Requested per Eligible Entity Community Corrections 62 Jail Treatment 21 Probation 13 Prosecutor’s Diversion 3 CRRP 11
Total: 110
Factors Contributing to Funding Recommendation • Total amount available• Collaboration Plan-On a scale from Needs Improvement to Outstanding• Readiness to start• The existing ability to increase capacity• Funding Formula• Grant score – specifically addressing the target population; meeting the program targets; and developing and/or
implementing EBP• Prioritization of needs
APPENDIX 1

FY 2018 HEA 1006 Grant Funding Distribution Award Amount: $25M
FY 2018 Funding Recommendations Summary Page 2 Updated 9/5/2017
Funding Formula The primary goal of the funding formula is to objectively disburse the additional grant funds to assist county agencies as they experience an increase in felony level 6 offenders. The main variable indicator is the Community Corrections Grant Application Score, which allows the State to incentivize positive evidence-based practices/programs. This method allows the counties to influence their funding amount through their performance, and is expected to foster continuous improvement.
Key Aspects of the Formula • Incentivizes positive performances• Accounts for population differentials between counties• Adjusts for changes in State funding levels and to county agency populations served
Prioritization of Funding • Continued grant funding for staffing positions awarded in FY 2016 and FY 2017• Grant application clearly addresses a plan of expansion for services/monitoring of target population• New Programs or new treatment services to benefit the county was proposed• Grant Score and Collaboration Score
Grant Award Recommendations by Eligible Entity *Refer to recommendation spreadsheet for details
Total Amount Awarded: $25,000,000.00 Total Number of New Positions Awarded: 31
Other items funded include, but are not limited to: • Benefits for Full Time Staff• Contracts with Monitoring Vendors, i.e. BI, Corrisoft, Norchem, etc.• Contracts with Treatment Providers• Drug Testing Supplies and other Operational Supplies• Travel/Training• Office Equipment
APPENDIX 1

FY 2018 HEA 1006 Grant Funding Distribution Award Amount: $25M
FY 2018 Funding Recommendations Summary Page 3 Updated 9/5/2017
Community Corrections New Staff: 16 New Entities: 0 New Levels of Supervision/Programs: 5 (Pre-Trial Program, Two Work Releases, Mental Health Court, Home Detention/EM, and Day Reporting)
FY 2018 Total Amount Recommended for Community Corrections: $15,591,718.00 FY 2017 Total Amount Awarded for Community Corrections $15,447,428.66
Jail Treatment Services New Staff: 3 New Entities: 3 New Levels Of Supervision/Programs: 3 (SA and MH Treatment Program, Two Cognitive Behavioral Programs)
FY 2018 Total Amount Recommended for Jail Treatment Services: $2,030,382.00 FY 2017 Total Amount Awarded for Jail Treatment: $1,701,783.00
Probation New Staff: 6 New Entities: 1 New Levels of Supervision/Programs: 2 (Day Reporting/Probation Supervision, Pre-Trial Program)
FY 2018 Total Amount Recommended for Probation: $4,728,400.00 FY 2017 Total Amount Awarded for Probation: $4,554,505.00
Prosecutor’s Diversion New Staff: 3 New Entities: 1 New Levels of Supervision/Programs: 1 (Felony Offender Diversion)
FY 2018 Total Amount Recommended for Prosecutor’s Diversion: $634,900.00 FY 2017 Total Amount Awarded for Prosecutor’s Diversion: $557,100.00
APPENDIX 1

FY 2018 HEA 1006 Grant Funding Distribution Award Amount: $25M
FY 2018 Funding Recommendations Summary Page 4 Updated 9/5/2017
Court Recidivism Reduction Programs (CRRP) New Staff: 3 New Entities: 3 New Levels of Supervision/Programs: 3 (Indianapolis Veteran’s Court, Drug Court, Drug and Alcohol Court)
FY 2018 Total Amount Recommended for Court Recidivism Reduction Programs: $2,014,600.00 FY 2017 Total Amount Awarded for Court Recidivism Reduction Programs: $1,834,723.00
APPENDIX 1

APPENDIX 2

APPENDIX 2

APPENDIX 2
APPENDIX 2

APPENDIX 2
APPENDIX 2
APPENDIX 2

APPENDIX 2

APPENDIX 2
APPENDIX 2

APPENDIX 2

APPENDIX 2

APPENDIX 2
APPENDIX 2
APPENDIX 2
APPENDIX 2
APPENDIX 2
APPENDIX 2
APPENDIX 2
APPENDIX 2

APPENDIX 2
APPENDIX 2
APPENDIX 2

FY 2016 Entities
1006 Funding
Awarded
Percent Of
Funding Awarded
Count Of Entities
Awarded Funding
Community Corrections $3,889,400.00 76% 39Court Recidivism Reduction Program $315,200.00 6% 3Jail Treatment Services $0.00 0% 0Probation $902,100.00 18% 15Prosecutor's Diversion $0.00 0% 0Grand Total $5,106,700.00 57
FY 2017 Entities
1006 Funding
Awarded
Percent Of
Funding Awarded
Count Of Entities
Awarded Funding
Community Corrections $15,329,941.66 64% 66Court Recidivism Reduction Program $1,863,323.00 8% 14Jail Treatment Services $1,734,048.34 7% 26Probation $4,572,500.00 19% 41Prosecutor's Diversion $557,100.00 2% 4Grand Total $24,056,913.00 151
FY 2018 Entities
1006 Funding
Awarded
Percent Of
Funding Awarded
Count Of Entities
Awarded Funding
Community Corrections $15,591,718.00 62% 68Court Recidivism Reduction Program $2,014,600.00 8% 17Jail Treatment Services $2,030,382.00 8% 29Probation $4,728,400.00 19% 39Prosecutor's Diversion $634,900.00 3% 6Grand Total $25,000,000.00 159
APPENDIX 3
Community Corrections,
$3,889,400.00, 76%
Court Recidivism Reduction Program, $315,200.00, 6%
Jail Treatment Services, $0.00, 0%
Probation, $902,100.00, 18%
Prosecutor's Diversion, $0.00,
0%
FY2016 Funding Awarded1006 Funding Awarded
Community Corrections, $15,329,941.66, 64%Court Recidivism Reduction
Program, $1,863,323.00, 8%
Jail Treatment Services, $1,734,048.34, 7%
Probation, $4,572,500.00, 19%Prosecutor's Diversion,
$557,100.00, 2%
FY2017 Funding Awarded1006 Funding Awarded
Community Corrections, $15,591,718.00, 62%Court Recidivism Reduction
Program, $2,014,600.00, 8%
Jail Treatment Services, $2,030,382.00, 8%
Probation, $4,728,400.00, 19%Prosecutor's Diversion, $634,900.00,
3%
FY2018 Funding Awarded1006 Funding Awarded
APPENDIX 3
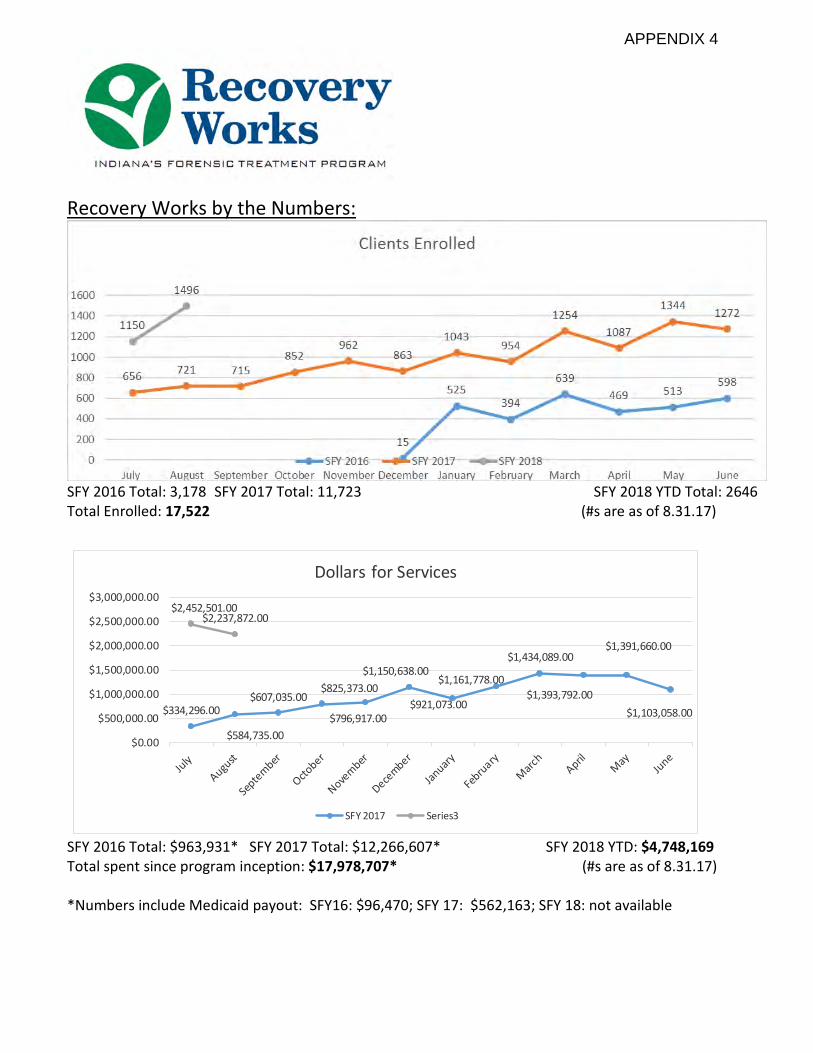
Recovery Works by the Numbers:
SFY 2016 Total: 3,178 SFY 2017 Total: 11,723 SFY 2018 YTD Total: 2646 Total Enrolled: 17,522 (#s are as of 8.31.17)
SFY 2016 Total: $963,931* SFY 2017 Total: $12,266,607* SFY 2018 YTD: $4,748,169 Total spent since program inception: $17,978,707* (#s are as of 8.31.17)
*Numbers include Medicaid payout: SFY16: $96,470; SFY 17: $562,163; SFY 18: not available
$334,296.00
$584,735.00
$607,035.00
$796,917.00
$825,373.00$1,150,638.00
$921,073.00
$1,161,778.00
$1,434,089.00
$1,393,792.00
$1,391,660.00
$1,103,058.00
$2,452,501.00$2,237,872.00
$0.00
$500,000.00
$1,000,000.00
$1,500,000.00
$2,000,000.00
$2,500,000.00
$3,000,000.00
Dollars for Services
SFY 2017 Series3
APPENDIX 4
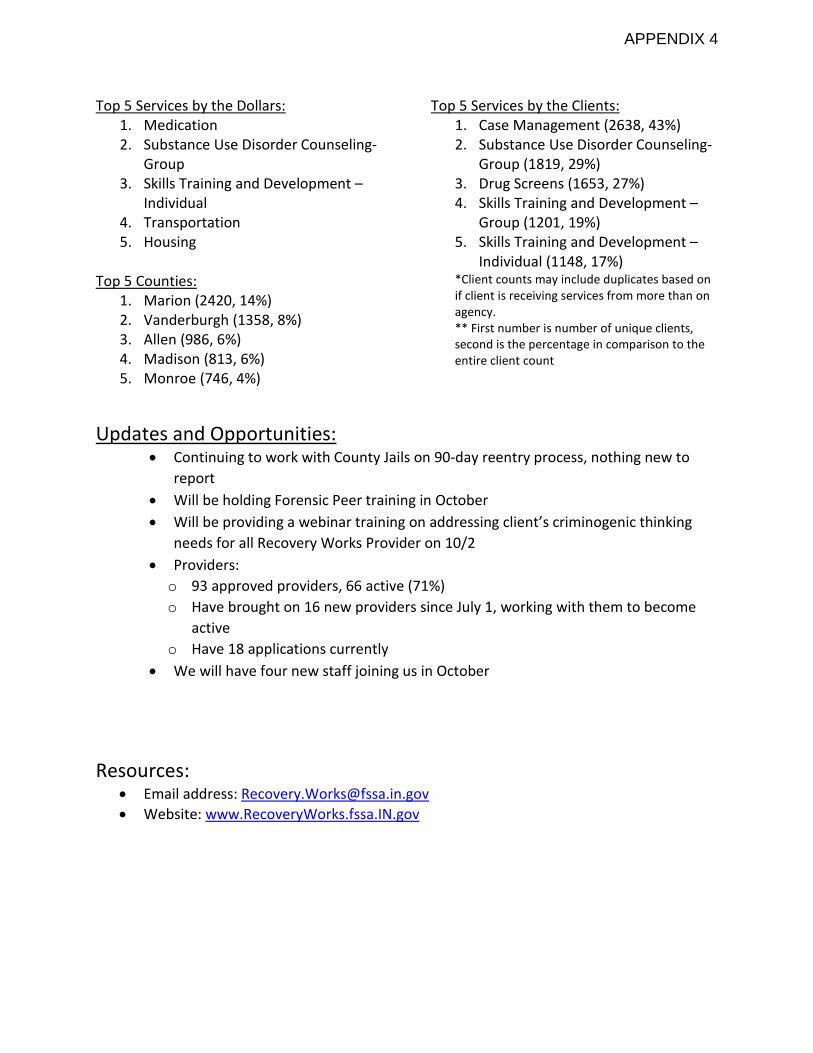
Top 5 Services by the Dollars: 1. Medication 2. Substance Use Disorder Counseling-
Group 3. Skills Training and Development –
Individual 4. Transportation 5. Housing
Top 5 Services by the Clients: 1. Case Management (2638, 43%) 2. Substance Use Disorder Counseling-
Group (1819, 29%) 3. Drug Screens (1653, 27%) 4. Skills Training and Development –
Group (1201, 19%) 5. Skills Training and Development –
Individual (1148, 17%) Top 5 Counties:
1. Marion (2420, 14%) 2. Vanderburgh (1358, 8%) 3. Allen (986, 6%) 4. Madison (813, 6%) 5. Monroe (746, 4%)
*Client counts may include duplicates based on if client is receiving services from more than on agency. ** First number is number of unique clients, second is the percentage in comparison to the entire client count
Updates and Opportunities: • Continuing to work with County Jails on 90-day reentry process, nothing new to
report • Will be holding Forensic Peer training in October • Will be providing a webinar training on addressing client’s criminogenic thinking
needs for all Recovery Works Provider on 10/2 • Providers: o 93 approved providers, 66 active (71%) o Have brought on 16 new providers since July 1, working with them to become
active o Have 18 applications currently
• We will have four new staff joining us in October
Resources:
• Email address: [email protected] • Website: www.RecoveryWorks.fssa.IN.gov
APPENDIX 4
1358*
72*74*
104*
69*
9*210*
34*62*
78*10*276*
19* 54*
128* 223*14*184*142*
22*180*
3*171* 55*
112*48*
108*26*
317*29*
746*
68*53* 31*124*736*
252*
88* 203*
21*
116*39*92*
171*2420*
81*12*
297*40*25*
70* 250*45*
45*157*813
*
16*
7*58*9*17*45*195*
49*
338*11*0*
212*
60*137*16*135*136
*
170*
74*25*2*
986*149*45*
201*
1 212* 52* 132*174*374*
87*57*615*460*256*422
*
HUNTINGTON
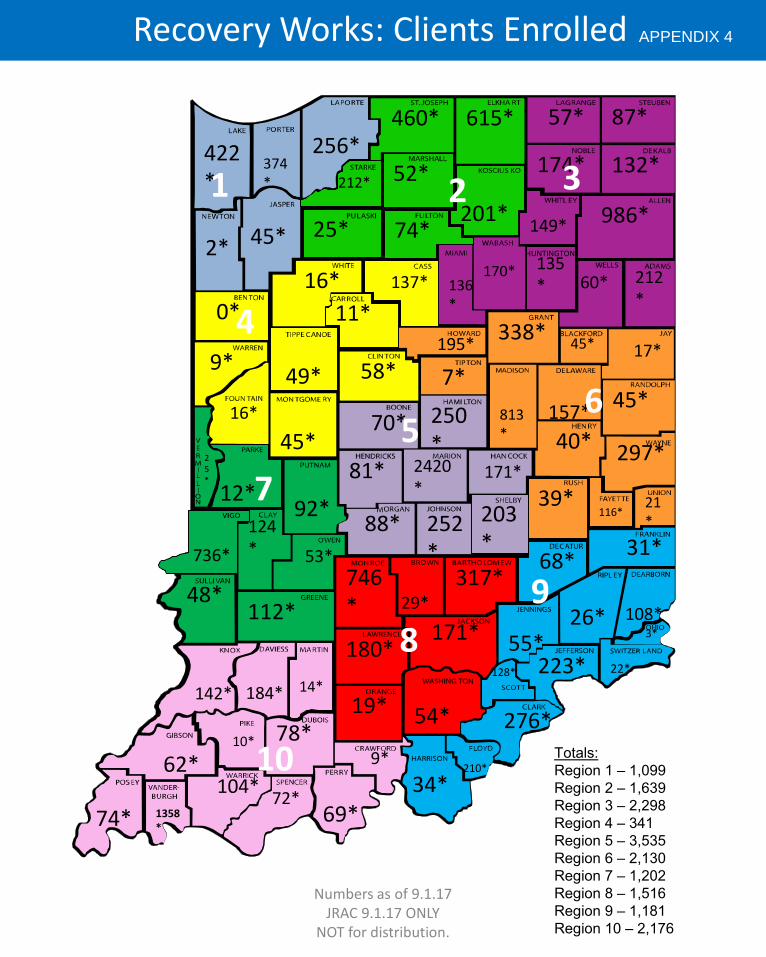
Recovery Works: Clients Enrolled
1 2 3
4
7
56
9
8
10 Totals: Region 1 – 1,099Region 2 – 1,639Region 3 – 2,298Region 4 – 341Region 5 – 3,535Region 6 – 2,130Region 7 – 1,202Region 8 – 1,516Region 9 – 1,181Region 10 – 2,176
Numbers as of 9.1.17 JRAC 9.1.17 ONLY
NOT for distribution.
APPENDIX 4
1
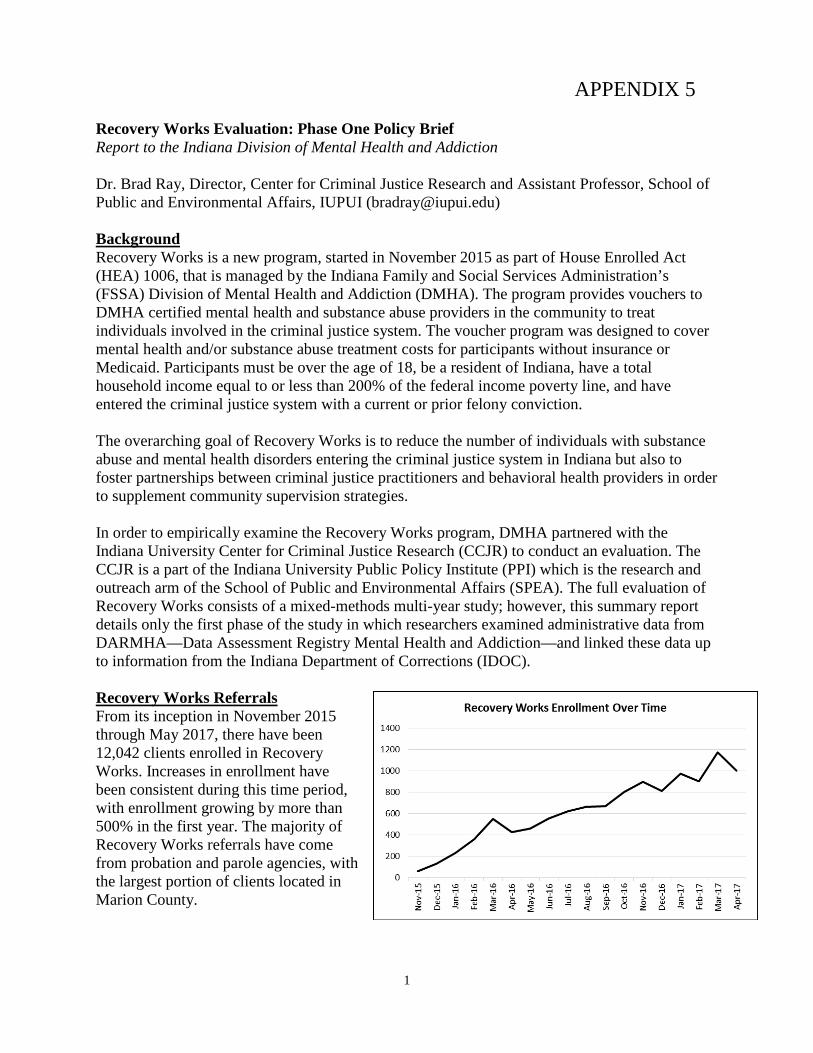
APPENDIX 5 Recovery Works Evaluation: Phase One Policy Brief Report to the Indiana Division of Mental Health and Addiction Dr. Brad Ray, Director, Center for Criminal Justice Research and Assistant Professor, School of Public and Environmental Affairs, IUPUI ([email protected]) Background Recovery Works is a new program, started in November 2015 as part of House Enrolled Act (HEA) 1006, that is managed by the Indiana Family and Social Services Administration’s (FSSA) Division of Mental Health and Addiction (DMHA). The program provides vouchers to DMHA certified mental health and substance abuse providers in the community to treat individuals involved in the criminal justice system. The voucher program was designed to cover mental health and/or substance abuse treatment costs for participants without insurance or Medicaid. Participants must be over the age of 18, be a resident of Indiana, have a total household income equal to or less than 200% of the federal income poverty line, and have entered the criminal justice system with a current or prior felony conviction. The overarching goal of Recovery Works is to reduce the number of individuals with substance abuse and mental health disorders entering the criminal justice system in Indiana but also to foster partnerships between criminal justice practitioners and behavioral health providers in order to supplement community supervision strategies. In order to empirically examine the Recovery Works program, DMHA partnered with the Indiana University Center for Criminal Justice Research (CCJR) to conduct an evaluation. The CCJR is a part of the Indiana University Public Policy Institute (PPI) which is the research and outreach arm of the School of Public and Environmental Affairs (SPEA). The full evaluation of Recovery Works consists of a mixed-methods multi-year study; however, this summary report details only the first phase of the study in which researchers examined administrative data from DARMHA—Data Assessment Registry Mental Health and Addiction—and linked these data up to information from the Indiana Department of Corrections (IDOC). Recovery Works Referrals From its inception in November 2015 through May 2017, there have been 12,042 clients enrolled in Recovery Works. Increases in enrollment have been consistent during this time period, with enrollment growing by more than 500% in the first year. The majority of Recovery Works referrals have come from probation and parole agencies, with the largest portion of clients located in Marion County.
2
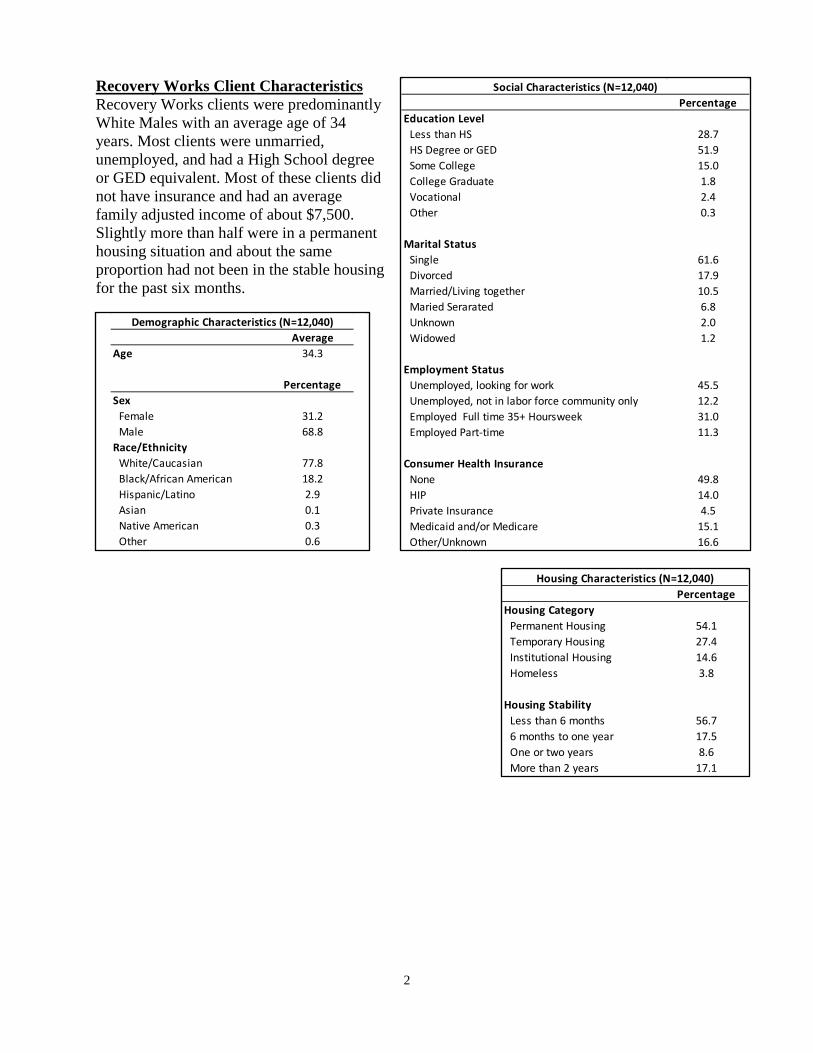
Recovery Works Client Characteristics Recovery Works clients were predominantly White Males with an average age of 34 years. Most clients were unmarried, unemployed, and had a High School degree or GED equivalent. Most of these clients did not have insurance and had an average family adjusted income of about $7,500. Slightly more than half were in a permanent housing situation and about the same proportion had not been in the stable housing for the past six months.
AverageAge 34.3
PercentageSex Female 31.2 Male 68.8Race/Ethnicity White/Caucasian 77.8 Black/African American 18.2 Hispanic/Latino 2.9 Asian 0.1 Native American 0.3 Other 0.6
Demographic Characteristics (N=12,040)
PercentageEducation Level Less than HS 28.7 HS Degree or GED 51.9 Some College 15.0 College Graduate 1.8 Vocational 2.4 Other 0.3
Marital Status Single 61.6 Divorced 17.9 Married/Living together 10.5 Maried Serarated 6.8 Unknown 2.0 Widowed 1.2
Employment Status Unemployed, looking for work 45.5 Unemployed, not in labor force community only 12.2 Employed Full time 35+ Hoursweek 31.0 Employed Part-time 11.3
Consumer Health Insurance None 49.8 HIP 14.0 Private Insurance 4.5 Medicaid and/or Medicare 15.1 Other/Unknown 16.6
Social Characteristics (N=12,040)
PercentageHousing Category Permanent Housing 54.1 Temporary Housing 27.4 Institutional Housing 14.6 Homeless 3.8
Housing Stability Less than 6 months 56.7 6 months to one year 17.5 One or two years 8.6 More than 2 years 17.1
Housing Characteristics (N=12,040)
3
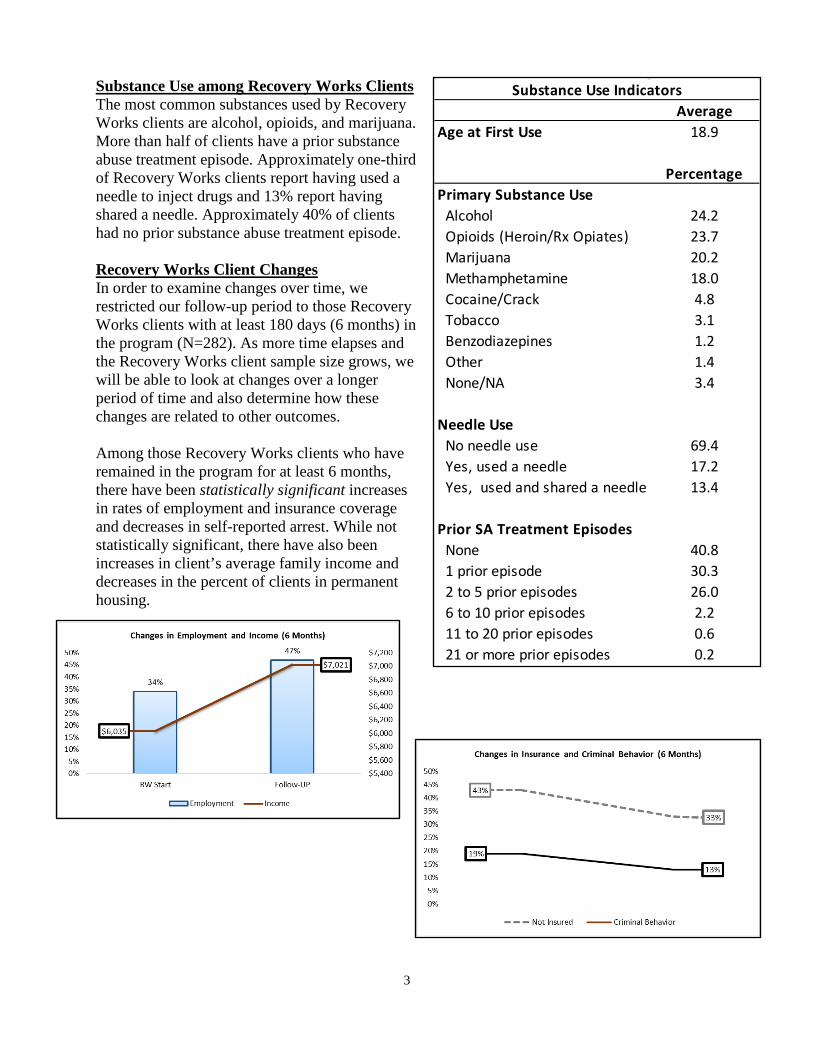
Substance Use among Recovery Works Clients The most common substances used by Recovery Works clients are alcohol, opioids, and marijuana. More than half of clients have a prior substance abuse treatment episode. Approximately one-third of Recovery Works clients report having used a needle to inject drugs and 13% report having shared a needle. Approximately 40% of clients had no prior substance abuse treatment episode. Recovery Works Client Changes In order to examine changes over time, we restricted our follow-up period to those Recovery Works clients with at least 180 days (6 months) in the program (N=282). As more time elapses and the Recovery Works client sample size grows, we will be able to look at changes over a longer period of time and also determine how these changes are related to other outcomes. Among those Recovery Works clients who have remained in the program for at least 6 months, there have been statistically significant increases in rates of employment and insurance coverage and decreases in self-reported arrest. While not statistically significant, there have also been increases in client’s average family income and decreases in the percent of clients in permanent housing.
AverageAge at First Use 18.9
PercentagePrimary Substance Use Alcohol 24.2 Opioids (Heroin/Rx Opiates) 23.7 Marijuana 20.2 Methamphetamine 18.0 Cocaine/Crack 4.8 Tobacco 3.1 Benzodiazepines 1.2 Other 1.4 None/NA 3.4
Needle Use No needle use 69.4 Yes, used a needle 17.2 Yes, used and shared a needle 13.4
Prior SA Treatment Episodes None 40.8 1 prior episode 30.3 2 to 5 prior episodes 26.0 6 to 10 prior episodes 2.2 11 to 20 prior episodes 0.6 21 or more prior episodes 0.2
Substance Use Indicators
4
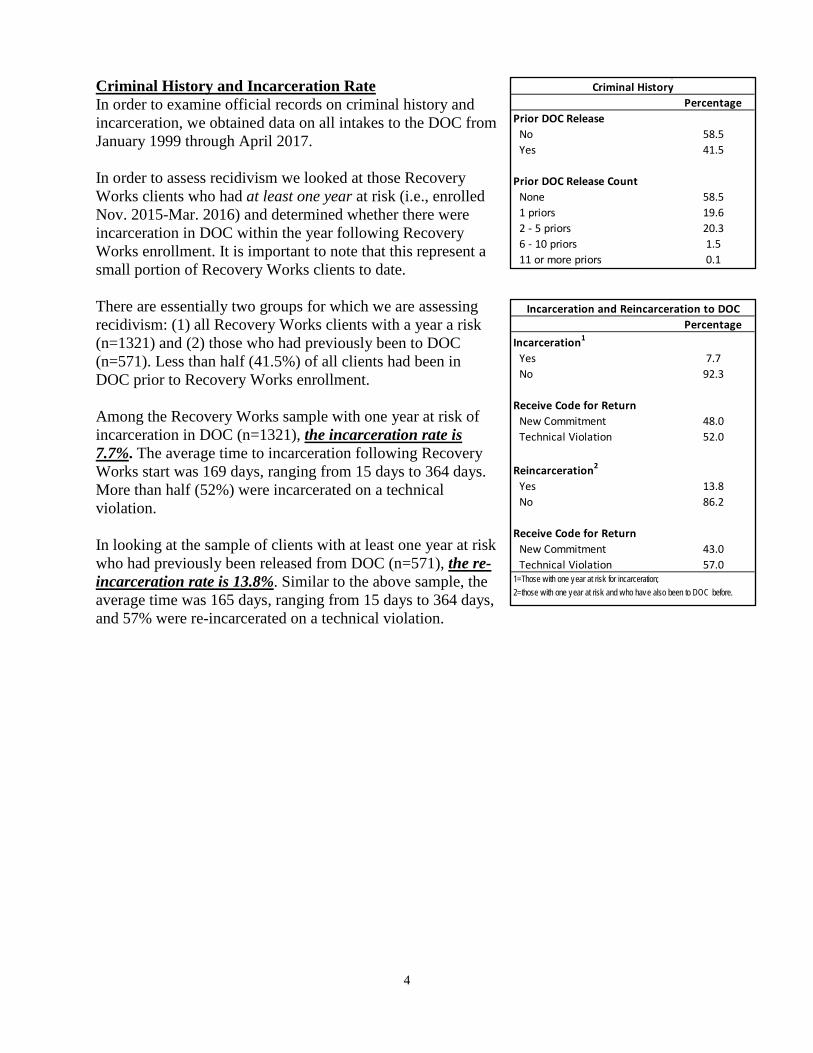
Criminal History and Incarceration Rate In order to examine official records on criminal history and incarceration, we obtained data on all intakes to the DOC from January 1999 through April 2017. In order to assess recidivism we looked at those Recovery Works clients who had at least one year at risk (i.e., enrolled Nov. 2015-Mar. 2016) and determined whether there were incarceration in DOC within the year following Recovery Works enrollment. It is important to note that this represent a small portion of Recovery Works clients to date. There are essentially two groups for which we are assessing recidivism: (1) all Recovery Works clients with a year a risk (n=1321) and (2) those who had previously been to DOC (n=571). Less than half (41.5%) of all clients had been in DOC prior to Recovery Works enrollment. Among the Recovery Works sample with one year at risk of incarceration in DOC (n=1321), the incarceration rate is 7.7%. The average time to incarceration following Recovery Works start was 169 days, ranging from 15 days to 364 days. More than half (52%) were incarcerated on a technical violation. In looking at the sample of clients with at least one year at risk who had previously been released from DOC (n=571), the re-incarceration rate is 13.8%. Similar to the above sample, the average time was 165 days, ranging from 15 days to 364 days, and 57% were re-incarcerated on a technical violation.
PercentagePrior DOC Release No 58.5 Yes 41.5
Prior DOC Release Count None 58.5 1 priors 19.6 2 - 5 priors 20.3 6 - 10 priors 1.5 11 or more priors 0.1
Criminal History
PercentageIncarceration1
Yes 7.7 No 92.3
Receive Code for Return New Commitment 48.0 Technical Violation 52.0
Reincarceration2
Yes 13.8 No 86.2
Receive Code for Return New Commitment 43.0 Technical Violation 57.01=Those with one year at risk for incarceration; 2=those with one year at risk and who have also been to DOC before.
Incarceration and Reincarceration to DOC
5
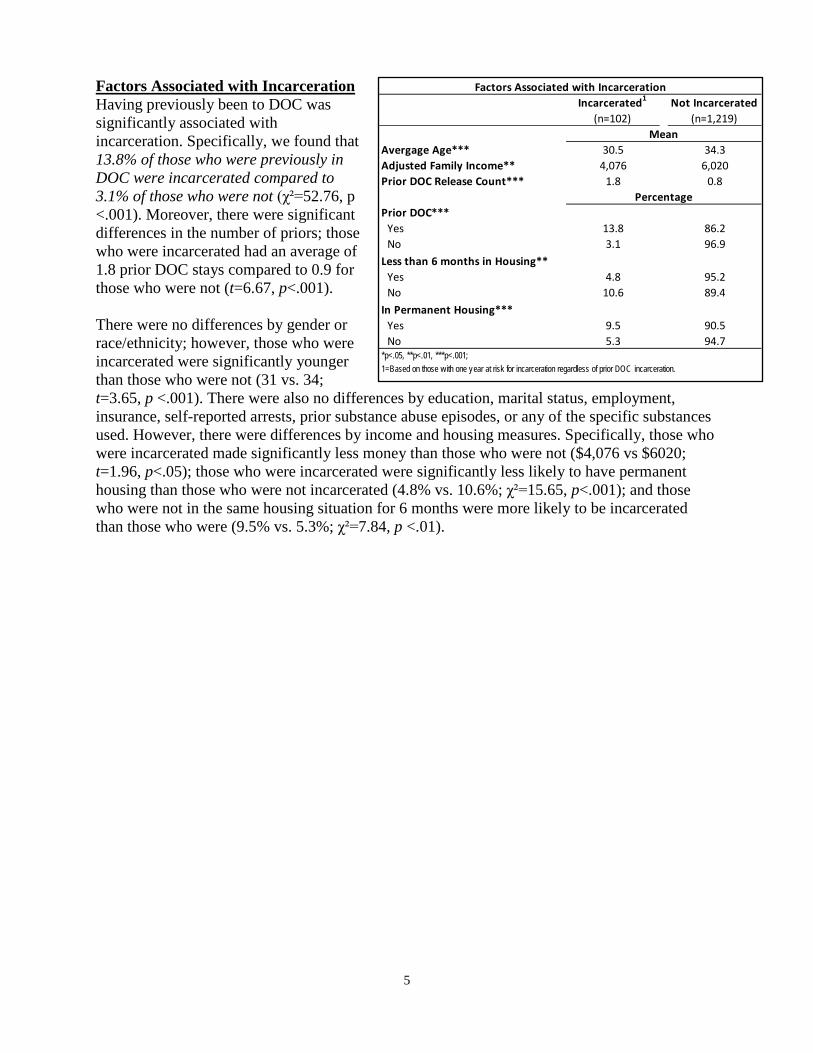
Factors Associated with Incarceration Having previously been to DOC was significantly associated with incarceration. Specifically, we found that 13.8% of those who were previously in DOC were incarcerated compared to 3.1% of those who were not (χ²=52.76, p <.001). Moreover, there were significant differences in the number of priors; those who were incarcerated had an average of 1.8 prior DOC stays compared to 0.9 for those who were not (t=6.67, p<.001). There were no differences by gender or race/ethnicity; however, those who were incarcerated were significantly younger than those who were not (31 vs. 34; t=3.65, p <.001). There were also no differences by education, marital status, employment, insurance, self-reported arrests, prior substance abuse episodes, or any of the specific substances used. However, there were differences by income and housing measures. Specifically, those who were incarcerated made significantly less money than those who were not ($4,076 vs $6020; t=1.96, p<.05); those who were incarcerated were significantly less likely to have permanent housing than those who were not incarcerated (4.8% vs. 10.6%; χ²=15.65, p<.001); and those who were not in the same housing situation for 6 months were more likely to be incarcerated than those who were (9.5% vs. 5.3%; χ²=7.84, p <.01).
Incarcerated1
(n=102)Not Incarcerated
(n=1,219)
Avergage Age*** 30.5 34.3Adjusted Family Income** 4,076 6,020Prior DOC Release Count*** 1.8 0.8
Prior DOC*** Yes 13.8 86.2 No 3.1 96.9Less than 6 months in Housing** Yes 4.8 95.2 No 10.6 89.4In Permanent Housing*** Yes 9.5 90.5 No 5.3 94.7
Mean
Percentage
Factors Associated with Incarceration
*p<.05, **p<.01, ***p<.001; 1=Based on those with one year at risk for incarceration regardless of prior DOC incarceration.

INDIANA DEPARTMENT OF CORRECTION
HEA 1006: Supplemental Report for September 2017
Month Old New Murder Total Old Felony% New Felony%
07/2017 363 529 5 897 40.7% 59.3%
08/2017 396 591 11 998 40.1% 59.9%
Date Old New Murder Total Old Felony% New Felony%
8/1/2017 14,402 8,476 2,497 25,375 63.0% 37.0%
9/1/2017 14,218 8,841 2,496 25,555 62.1% 38.6%
02/2017
03/2017
04/2017
05/2017
06/2017
07/2017
08/2017
Date
7/1/2015
8/1/2015
9/1/2015
10/1/2015
11/1/2015
20%
30%
40%
50%
60%
70%
06
/20
15
07
/20
15
08
/20
15
09
/20
15
10
/20
15
11
/20
15
12
/20
15
01
/20
16
02
/20
16
03
/20
16
04
/20
16
05
/20
16
06
/20
16
07
/20
16
08
/20
16
09
/20
16
10
/20
16
11
/20
16
12
/20
16
01
/20
17
02
/20
17
03
/20
17
04
/20
17
05
/20
17
06
/20
17
07
/20
17
08
/20
17
Adult Admission Trend: Old vs New Felony Levels(Chart does not include Murder)
Old Felony%
New Felony%
6.6%9.3%
12.3%15.4% 17.2% 19.0% 21.3% 23.5% 25.8%
27.0% 29.4%
33.2%35.9%
38.6%
5%10%15%20%25%30%35%40%45%
7/1
/20
15
8/1
/20
15
9/1
/20
15
10
/1/2
01
5
11
/1/2
01
5
12
/1/2
01
5
1/1
/20
16
2/1
/20
16
3/1
/20
16
4/1
/20
16
5/1
/20
16
6/1
/20
16
7/1
/20
16
8/1
/20
16
9/1
/20
16
10
/1/2
01
6
11
/1/2
01
6
12
/1/2
01
6
1/1
/20
17
2/1
/20
17
3/1
/20
17
4/1
/20
17
5/1
/20
17
6/1
/20
17
7/1
/20
17
8/1
/20
17
9/1
/20
17
Facility Population: New Felony Levels(Chart does not include Murder)
0
1,000
2,000
3,000
4,000
1 2 3 4 5 6
271608
1,475 1,863
3,635
989
Distribution of New Felony Levels by Most Serious Offenseas of 09/01/2017
August Admissions:
11 Missing Sentencing Data/ HO
Comparisons include grouping
Old A-D Offenses Vs. New 1-6 Offenses
Total Population:
29 Missing Data or HO Offenses
APPENDIX 6
INDIANA DEPARTMENT OF CORRECTION
HEA 1006: Supplemental Report for September 2017
12/1/2015
1/1/2016
2/1/2016
3/1/2016
4/1/2016
5/1/2016
6/1/2016
7/1/2016
8/1/2016
9/1/2016
10/3/2016
11/1/2016
12/1/2016
1/1/2017
2/1/2017
3/1/2017
4/1/2017
5/1/2017
6/1/2017
6/30/2017
8/1/2017
9/1/2017
Parole Violators - Technical
Court Supervision Violators - New Commits
Court Supervision Violators - Technical
Return from CTP - New Commits
Return from CTP - Technical
Other
Release Type
Parole
0
50
100
150
200
250
300
350
400
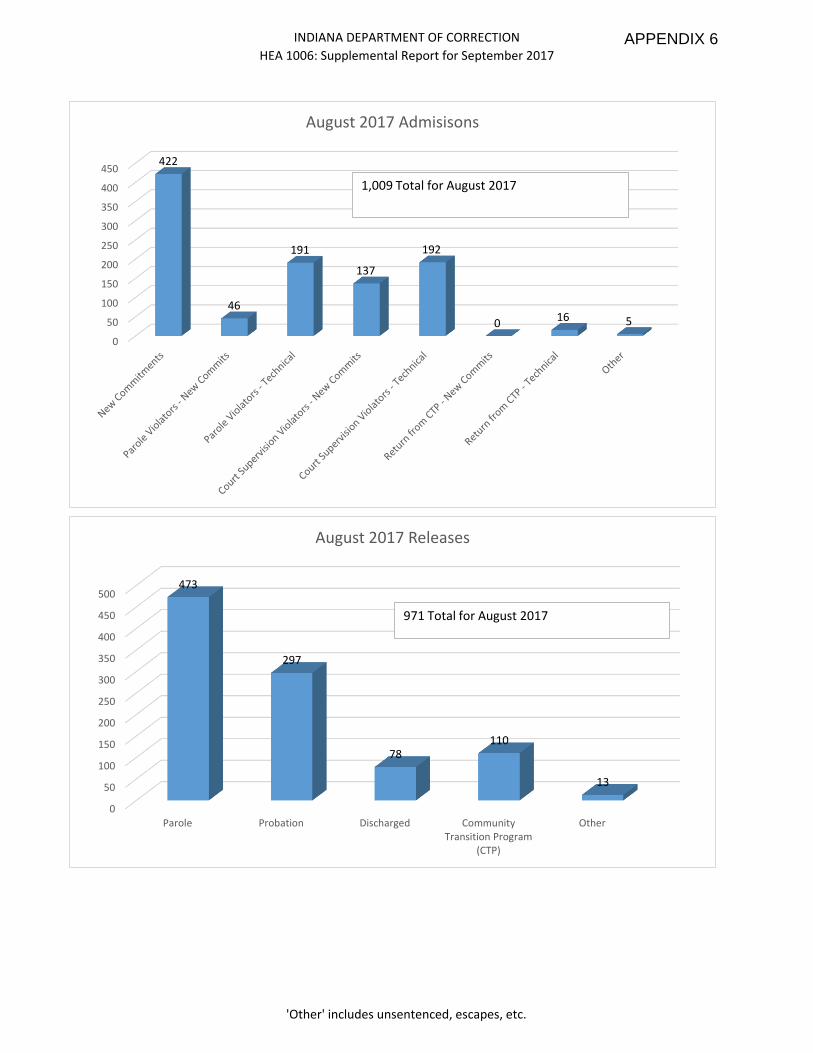
450422
46
191
137
192
0 16 5
August 2017 Admisisons
942 Total for April 20171,026 Total for May 20171,009 Total for August 2017
0
50
100
150
200
250
300
350
400
450
500
Parole Probation Discharged CommunityTransition Program
(CTP)
Other
473
297
78110
13
August 2017 Releases
1,032 Total for April 20171,038 Total for May 2017971 Total for August 2017
'Other' includes unsentenced, escapes, etc.
APPENDIX 6
INDIANA DEPARTMENT OF CORRECTION ADULT OFFENDERS
Population Trend Summaryfor September 2017
snapshot date: 09/01/2017
Date DOC Adult Community CorrectionsJail DOC
Contract
Jail Felony
Level 6
Diversions
Total
7/1/2016 25,691 16,016 302 1,094 43,1038/1/2016 25,605 15,257 319 1,348 42,5299/1/2016 25,506 15,357 361 1,518 42,74210/3/2016 25,471 15,672 365 1,574 43,08211/1/2016 25,364 16,047 363 1,537 43,31112/1/2016 25,235 15,883 370 1,698 43,1861/1/2017 25,143 16,232 403 1,604 43,3822/1/2017 25,058 16,063 352 1,645 43,1183/1/2017 25,117 16,568 328 1,956 43,9694/3/2017 25,279 16,907 443 1,871 44,5005/1/2017 25,237 17,277 412 1,874 44,8006/1/2017 25,291 17,558 347 2,011 45,2076/30/2017 25,355 17,680 378 2,150 45,5638/1/2017 25,399 17,702 258 2,142 45,5019/1/2017 25,584 17,483 310 2,231 45,608
10/3/201611/1/201612/1/20161/1/20172/1/20173/1/20174/3/20175/1/20176/1/20177/1/20178/1/20179/1/2017
23,500
24,000
24,500
25,000
25,500
26,000
26,500
27,000
27,500
7/1/2015 9/1/2015 11/1/2015 1/1/2016 3/1/2016 5/1/2016 7/1/2016 9/1/2016 11/1/2016 1/1/2017 3/1/2017 5/1/2017 7/1/2017 9/1/2017
DOC Population Trend
40,000
41,000
42,000
43,000
44,000
45,000
46,000
7/1/2015 9/1/2015 11/1/2015 1/1/2016 3/1/2016 5/1/2016 7/1/2016 9/1/2016 11/1/2016 1/1/2017 3/1/2017 5/1/2017 7/1/2017 9/1/2017
Total Population Trend
APPENDIX 6

INDIANA DEPARTMENT OF CORRECTION ADULT OFFENDERS
Population Trend Summaryfor September 2017
snapshot date: 09/01/2017
Date DOC Adult Community CorrectionsJail DOC
Contract
Jail Felony
Level 6
Diversions
Total
7/1/2016 25,691 16,016 302 1,094 43,1038/1/2016 25,605 15,257 319 1,348 42,5299/1/2016 25,506 15,357 361 1,518 42,74210/3/2016 25,471 15,672 365 1,574 43,08211/1/2016 25,364 16,047 363 1,537 43,31112/1/2016 25,235 15,883 370 1,698 43,1861/1/2017 25,143 16,232 403 1,604 43,3822/1/2017 25,058 16,063 352 1,645 43,1183/1/2017 25,117 16,568 328 1,956 43,9694/3/2017 25,279 16,907 443 1,871 44,5005/1/2017 25,237 17,277 412 1,874 44,8006/1/2017 25,291 17,558 347 2,011 45,2076/30/2017 25,355 17,680 378 2,150 45,5638/1/2017 25,399 17,702 258 2,142 45,5019/1/2017 25,584 17,483 310 2,231 45,608
0
500
1,000
1,500
2,000
2,500
7/1/2015 9/1/2015 11/1/2015 1/1/2016 3/1/2016 5/1/2016 7/1/2016 9/1/2016 11/1/2016 1/1/2017 3/1/2017 5/1/2017 7/1/2017 9/1/2017
Jail Population Trend
0
2,000
4,000
6,000
8,000
10,000
12,000
14,000
16,000
18,000
20,000
7/1/2015 9/1/2015 11/1/2015 1/1/2016 3/1/2016 5/1/2016 7/1/2016 9/1/2016 11/1/2016 1/1/2017 3/1/2017 5/1/2017 7/1/2017 9/1/2017
Community Correction Population Trend
APPENDIX 6
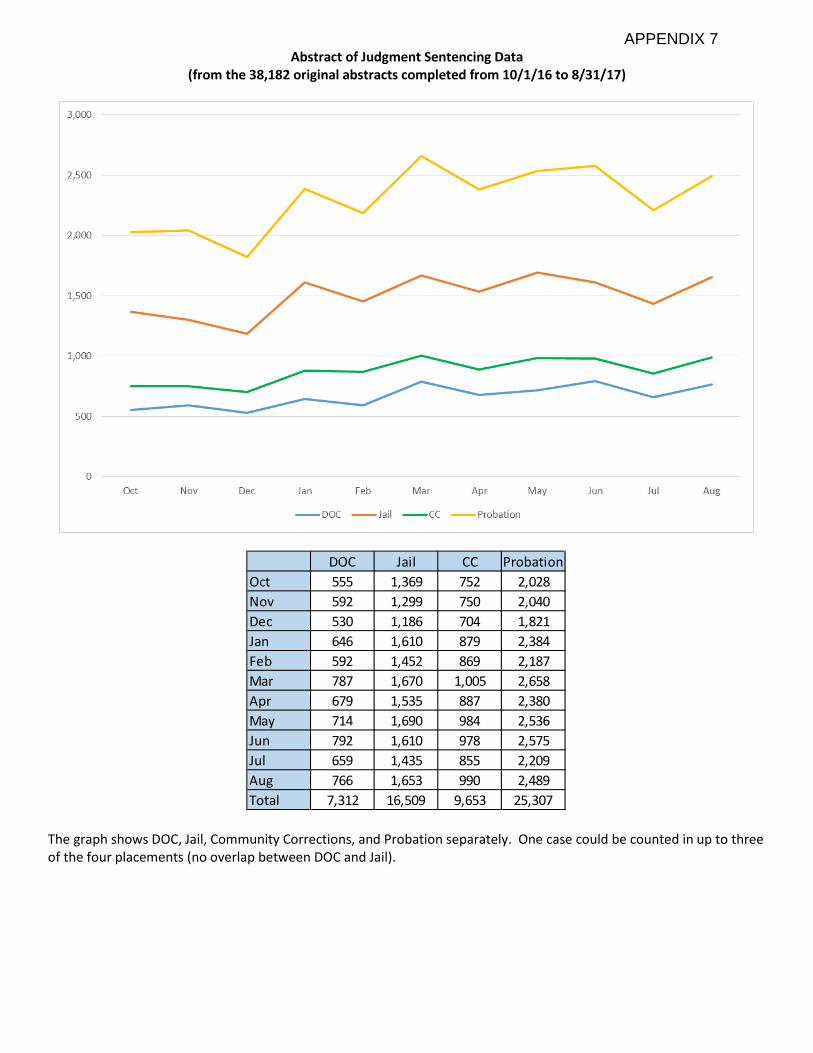
Abstract of Judgment Sentencing Data (from the 38,182 original abstracts completed from 10/1/16 to 8/31/17)
The graph shows DOC, Jail, Community Corrections, and Probation separately. One case could be counted in up to three of the four placements (no overlap between DOC and Jail).
DOC Jail CC ProbationOct 555 1,369 752 2,028Nov 592 1,299 750 2,040Dec 530 1,186 704 1,821Jan 646 1,610 879 2,384Feb 592 1,452 869 2,187Mar 787 1,670 1,005 2,658Apr 679 1,535 887 2,380May 714 1,690 984 2,536Jun 792 1,610 978 2,575Jul 659 1,435 855 2,209Aug 766 1,653 990 2,489Total 7,312 16,509 9,653 25,307
APPENDIX 7

The chart below represents all original abstracts from 10/1/2016 to 8/31/2017
Of the 19,368 abstracts that had a combination of placements, 60% had a jail sentence followed by some type of community supervision and 97% had a probation component to their sentence. Overall, 67% of original sentences included probation.
Data on L6/FD sentences: Of the original felony sentencing abstracts, 1,118 were FD cases and 27,528 were L6 cases. For the FD sentences, 454 received some or fully executed time in the jail (40.6%) [Note: 162 were fully executed in jail – 14.5% of all FD sentences]. For L6 sentences, 12,716 received some or fully executed time in the jail (46.2%) [Note: 3,894 were fully executed in the jail – 14.1% of all L6 sentences].
*Data provided by the Division of Trial Court Technology
APPENDIX 7
APPENDIX 7
Discharged74%
Revoked For New Offense
6%
Revoked For Technical Violation
8%
Absconded7%
Other Closed5%
Misdemeanor Terminations 10/1/2013-6/30/2014
APPENDIX 7
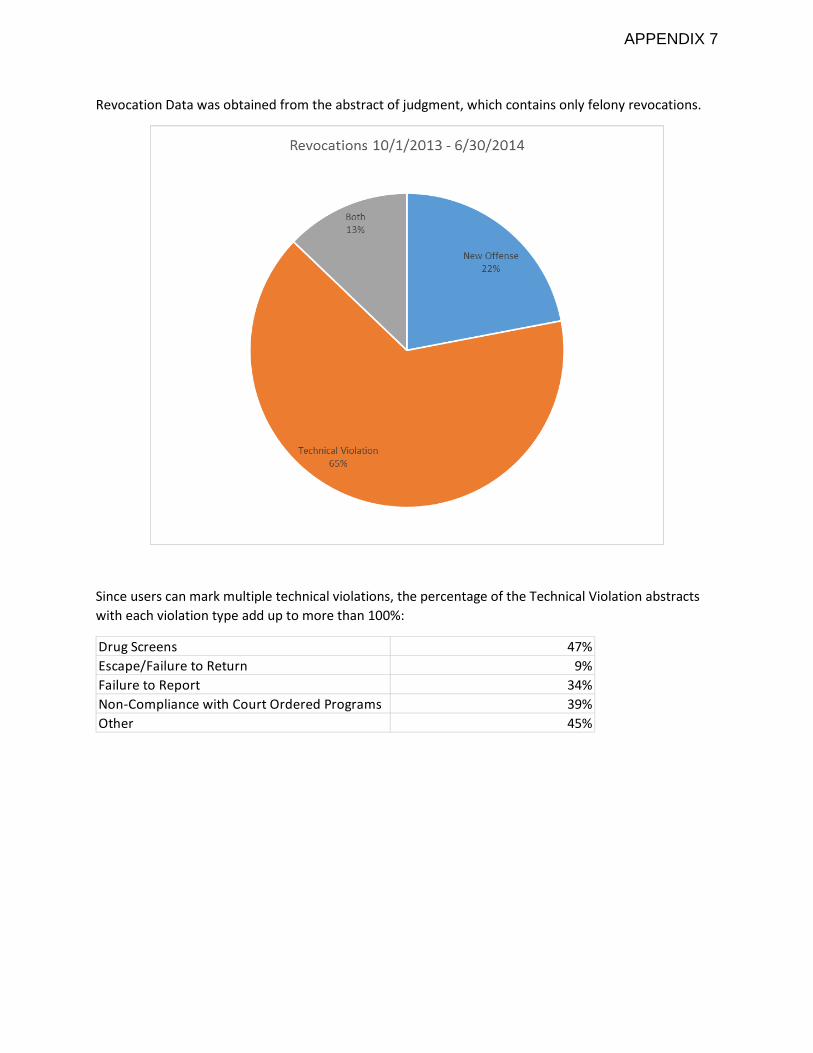
Revocation Data was obtained from the abstract of judgment, which contains only felony revocations.
Since users can mark multiple technical violations, the percentage of the Technical Violation abstracts with each violation type add up to more than 100%:
Drug Screens 47%Escape/Failure to Return 9%Failure to Report 34%Non-Compliance with Court Ordered Programs 39%Other 45%
APPENDIX 7
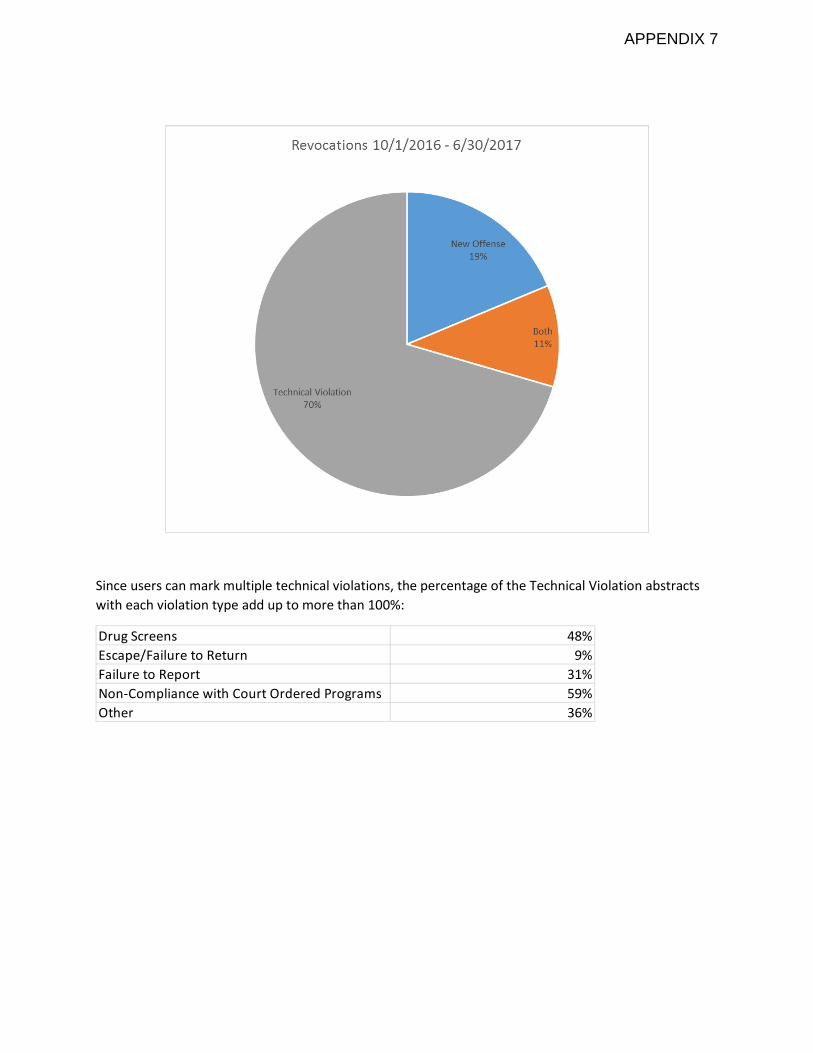
Since users can mark multiple technical violations, the percentage of the Technical Violation abstracts with each violation type add up to more than 100%:
Drug Screens 48%Escape/Failure to Return 9%Failure to Report 31%Non-Compliance with Court Ordered Programs 59%Other 36%
APPENDIX 7
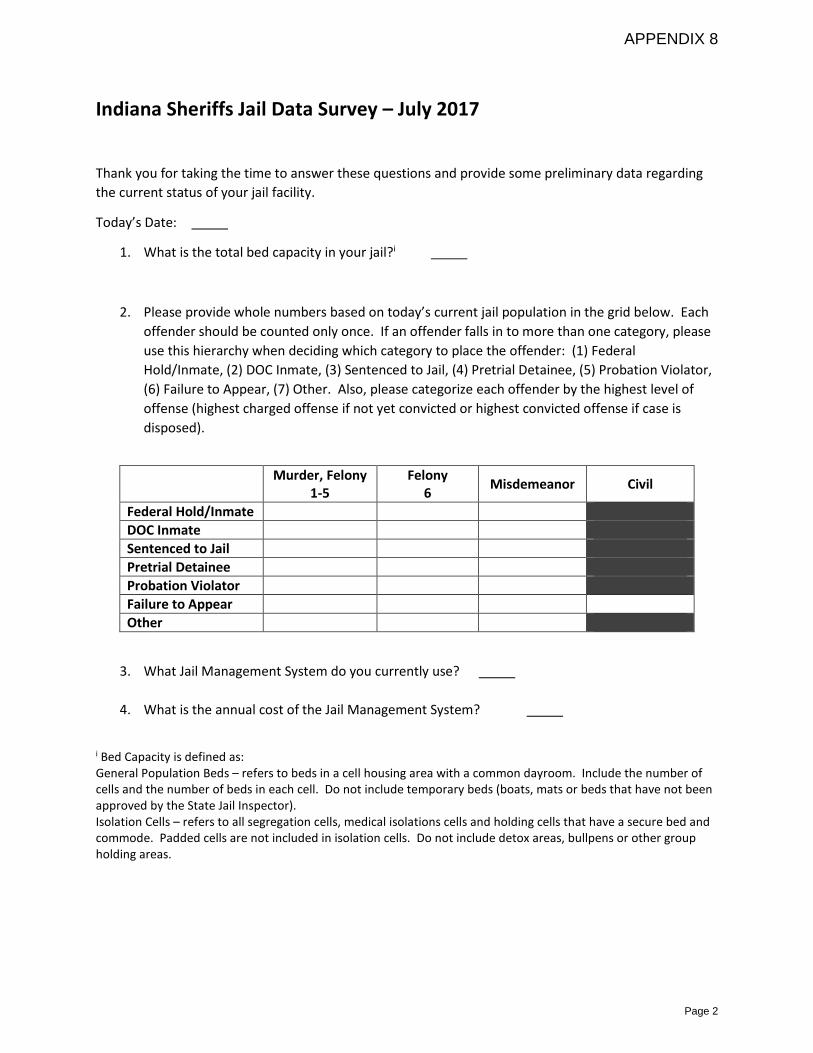
Indiana Sheriffs Jail Data Survey – July 2017
Thank you for taking the time to answer these questions and provide some preliminary data regarding the current status of your jail facility.
Today’s Date:
1. What is the total bed capacity in your jail?i
2. Please provide whole numbers based on today’s current jail population in the grid below. Each offender should be counted only once. If an offender falls in to more than one category, please use this hierarchy when deciding which category to place the offender: (1) Federal Hold/Inmate, (2) DOC Inmate, (3) Sentenced to Jail, (4) Pretrial Detainee, (5) Probation Violator, (6) Failure to Appear, (7) Other. Also, please categorize each offender by the highest level of offense (highest charged offense if not yet convicted or highest convicted offense if case is disposed).
3. What Jail Management System do you currently use?
4. What is the annual cost of the Jail Management System?
i Bed Capacity is defined as: General Population Beds – refers to beds in a cell housing area with a common dayroom. Include the number of cells and the number of beds in each cell. Do not include temporary beds (boats, mats or beds that have not been approved by the State Jail Inspector). Isolation Cells – refers to all segregation cells, medical isolations cells and holding cells that have a secure bed and commode. Padded cells are not included in isolation cells. Do not include detox areas, bullpens or other group holding areas.
Murder, Felony 1-5
Felony 6 Misdemeanor Civil
Federal Hold/Inmate DOC Inmate Sentenced to Jail Pretrial Detainee Probation Violator Failure to Appear Other
Page 2
APPENDIX 8