state of india’s livelihoods report 2010inclusivefinanceindia.org/uploads-inclusivefinance/... ·...
TRANSCRIPT


State of India’s Livelihoods Report 2010

ii State of IndIa’S LIveLIhoodS RepoRt 2010

State of India’s Livelihoods Report 2010
The 4P Report
Edited by
Sankar DattaVipin Sharma

Copyright © ACCESS Development Services, 2010
All rights reserved. No part of this book may be reproduced or utilized in any form or by any means, electronic or
mechanical, including photocopying, recording or by any information storage or retrieval system, without permission
in writing from the publisher.
Jointly published in 2010 by
Sage Publications India Pvt Ltd aCCeSS Development ServicesB1/I-1 Mohan Cooperative Industrial Area 28, Hauz Khas Village
Mathura Road, New Delhi 110 044, India New Delhi 110 016
www.sagepub.in www.accessdev.org
Sage Publications Inc2455 Teller Road
Thousand Oaks, California 91320, USA
Sage Publications Ltd1 Oliver’s Yard, 55 City Road
London EC1Y 1SP, United Kingdom
Sage Publications asia-Pacific Pte Ltd33 Pekin Street
#02-01 Far East Square
Singapore 048763
Published by Vivek Mehra for SAgE Publications India Pvt Ltd, typeset in 10/13 pt Minion by Star Compugraphics
Private Limited, Delhi and printed at Rajkamal Electric Press, Kundli, Haryana.
Library of Congress Cataloging-in-Publication Data available
ISBN: 978-81-321-0587-9 (PB)
The Sage Team: Rekha Natarajan, Aniruddha De, Sanjeev Kumar Sharma and Umesh Kashyap

Contents
List of Tables vii
List of Figures ix
List of Boxes xi
List of Abbreviations xiii
Preface xix
Acknowledgements xxi
1. Overview of Livelihoods Situation 1 Sankar Datta and Vipin Sharma
2. Livelihoods in Agriculture—Status, Policies and Prospects 15 Trilok Singh Papola
3. greening India through MgNREgA—Convergent Action for Benefits beyond Employment generation 33
Suryamani Roul
4. New generation Initiatives in Agri-based Livelihoods—Five Successful Private Sector Initiatives 51
Pradeep Kumar Mishra
5. Financing Agriculture—Emerging Scenario 63 Biswa Bandhu Mohanty
6. Agriculture Marketing—From Livelihoods to Enterprise 87 Reshma Anand
7. Climate Change and Agriculture—Challenges and Opportunities in India 105 Shailesh Nagar and Jayesh Bhatia
About the Editors and Contributors 125

vi State of IndIa’S LIveLIhoodS RepoRt 2010

List of Tables
1.1 Top nine commodities produced in India and its world ranking 21.2 Normal (average of 2003–04 to 2007–08) area, production and yield
of major crops in India 31.3 Top 10 exports from India 31.4 Share of population engaged in agriculture and agriculture’s contribution
to gDP in India and the United States (n.d.) 31.5 growth rate of output of different sub-sectors of agriculture: 1993/94 prices 31.6 Contributions of various sectors in the Indian gDP (percentage) 41.7 growth rate of Indian gDP and agriculture 41.8 Profitability of crops in Orissa over the years 41.9 Per capita net availability of food grains (grams per day) in India 61.10 Land holdings in India 71.11 Land use classifications in India (thousand hectares) 71.12 growth in Indian microfinance sector 8
2.1 Incidence of poverty among agricultural workers and rural population: 2004–05 16
2.2 Average monthly income and consumption expenditure (`) per farmer household (2002–03) 17
2.3 Loans by source and purpose (%) 172.4 Distribution of agricultural households by main activity and size
of operational holdings—2004–05 (%) 222.5 Changes in size distribution of operational holdings (%) 22
3.1 An overview of performance of MgNREgA 383.2 Areas of convergence and activities in four select districts of AP 473.3 Main benefits for small and marginal farmers from MgNREgA 50
5.1 Debt from institutional sources as per land holding classes 66
6.1 Agriculture sector: Key indicators at constant prices (2004–05) (%) 886.2 Status of implementation of APMC Act in India 936.3 Public and private investment in agriculture and allied sector at
2004–05 prices 946.4 Agri-produce sourcing operations of key companies (contract farming,
direct purchase and PPP models) 996.5 Indian food industry: Key statistics 101
7.1 Share of drylands in All-India cropped area, 1989–90 1067.2 Share of dryland main workers in total workforce,
All-India, 1991 1067.3 Climate change and agriculture in India: Findings from various studies 1087.4 Climate change hazards, impacts, micro-level strategies, and actions
for adaptation to climate change 117
viii State of IndIa’S LIveLIhoodS RepoRt 2010
7.5 Benefits of MgNREgS with respect to climate change adaptation and mitigation in India 118
7.6 Programme outputs and their potential for climate change 1197.7 Changes in land use and its impact 1197.8 Positive impacts of NRM interventions on agriculture-based livelihoods 1207.9 Key successes in WORLP related to climate change adaptation
in agriculture 121

List of Figures
1.1 grain orientation in irrigated and rainfed areas from 1960 onwards 6
7.1 Distribution of gHg emissions from India in 2007 1107.2 Sources of gHgs within agriculture sector 1117.3 Number of papers on climate change published in peer reviewed journals 115

x State of IndIa’S LIveLIhoodS RepoRt 2010

List of Boxes
3.1 Salient features of MgNREgA 353.2 Are benefits of MgNREgA reaching people? 393.3 Findings of the planning commission’s mid-term appraisal report on
rural development programmes 403.4 Empowerment of women workers through MgNREgS: A study in four states 40
4.1 The SRI concept 554.2 The PTD process 58
5.1 Reforms in short term cooperative credit structures (STCCS) New hope for agri-finance 66
5.2 Operation Barga: Share croppers empowerment in West Bengal through participatory land reforms strategy 71
5.3 Bhoomi in Karnataka: Bringing sea-change in land records management system 72
5.4 Soil health card: A pioneering initiative of the gujarat government 725.5 Samanwita: Commercial banks collaborate with community-based
organizations for community development 725.6 Branding products of Farmers/SHgs—marketing perspectives 765.7 Vegetable and fruit promotion council, Kerala (VFPCK): Price discovery
for SHgs through a farmers’ market model 765.8 Financial assistance for strengthening supply chain system: Fruit and vegetable
auction market (SFVAM), Bangalore 775.9 Supply chain integration in horticulture 795.10 ICICI Bank’s warehouse receipt-based financing 795.11 ITC’s E-Choupal: Linking business with societal purpose 805.12 Mobile vans for knowledge management (KM) of farmers 81
6.1 Interstate barriers to trade 916.2 Cultivating communities 966.3 Suminter Organics: A case study of contract farming 976.4 Prominent private equity in agribusinesses 1006.5 Cooperative paddy cultivation in Thrissur, Kerala 1016.6 Dharmapuri Precision Farmers Agro Services: A local farmer
enterprise model 102
7.1 Innovation in Micro-insurance 116

xii State of IndIa’S LIveLIhoodS RepoRt 2010

List of Abbreviations
ABC Agri Business CentreAC Agri ClinicsACI Agri Credit Intensive BranchesADWDRS Agriculture Debt Waiver and Debt Relief SchemeAEZ Agri Export ZonesAFCB Adat Farmers Cooperative BankAFP Agro Food ParkAIFOF All India Federation of Organic FarmingAIM Alternate Implementation ModelAME Agriculture Man Ecology FoundationANBC Adjusted Net Bank CreditAP Andhra PradeshAPC Agricultural Prices CommissionAPEDA Agricultural and Processed Food Products Export Development
AuthorityAPMC Agricultural Produce Market CommitteeAPMIP AP Micro Irrigation ProjectAPPS Ananthapur Paryavarana Parirakshana SamithisARF Automatic Refinance FacilityASCI Administrative Staff College of India, HyderabadATM Automated Teller MachineATMA Agricultural Technology Management AgencyBAIF Bharatiya Agro Industries FoundationBC Business CorrespondentBDS Business Development ServicesBF Business FacilitatorBIPCL Banana India Producer Company LtdBNRgSK Bharat Nirman Rajiv gandhi Sewa KendraBOOT Build Own Operate TransferBOP Bottom of the PyramidBOT Build Operate TransferBPL Below Poverty LineBRgF Backward Region grant FundCACP Commission on Agricultural Costs and PricesCAgP IV Carlyle Asia growth Partners IVCB Commercial BanksCBO Community Based OrganizationsCCI Cotton Corporation IndiaCCS Cooperative Credit StructureCDS Current Daily StatusCEgC Central Employment guarantee Council

xiv State of IndIa’S LIveLIhoodS RepoRt 2010
CH4 MethaneCIBIL Credit Information Bureau (India) LimitedCIIFAD Cornell International Institute for Food, Agriculture and DevelopmentCLDP Comprehensive Land Development ProjectCMP Common Minimum ProgrammeCMSA Community Managed Sustained AgricultureCO2 Carbon DioxideCPR Common Property ResourcesCRD Commissioner Rural DevelopmentCSA Community Supported AgricultureCSC Common Service CentresCSIR Council for Scientific and Industrial ResearchCSO Civil Society OrganizationCSP Customer Service PointD&B Dun and Bradstreet Information Services India Pvt. LtdDCCB District Central Cooperative BanksDDP Desert Development ProgrammeDfID Department for International DevelopmentDMI Directorate of Marketing and InspectionDPAP Drought Prone Area ProgrammeDPFAS Dharmapuri Precision Farmers Agro ServicesDPIP District Poverty Initiatives ProgrammeDRDA District Rural Development AgencyEAS Employment Assurance SchemeEXIM Bank Export Import Bank of IndiaFA Farmers AssociationsFAO Food and Agriculture OrganizationFC Farmers ClubsFCI Food Corporation of IndiaFDI Foreign Direct InvestmentFFS Farmer Field SchoolsFIEC Farm Information Exchange ClubsFIF Financial Inclusion FundFIP Financial Inclusion PlanFIPF Farm Innovation and Promotion FundFITF Financial Inclusion Technology FundFMCg Fast Moving Consumer goodsgAP good Agricultural PracticesgBP Pound SterlinggCA gross Cultivated AreagCF gross Capital FormationgDP gross Domestic ProductgHg green House gasgIS geographical Information SystemsgLC ground Level CreditgoI government of IndiagORUS gomukh Centre for Rural SustainabilitygSM global System for Mobile CommunicationsgTZ Deutsche gesellschaft für Technische Zusammenarbeit

List of Abbreviations xv
HDFC Housing Development Finance CorporationHDP High Density PolyethyleneHYV High Yielding VarietiesIAAP Intensive Agricultural Area ProgrammeIADP Intensive Agricultural Development ProgrammeIAY Indira Awas YojanaICAR Indian Council for Agriculture ResearchICQS Internal Control System for Quality ManagementICRISAT International Crops Research Institute for Semi-Arid TropicsICT Information and Communication TechnologyIDE International Development EnterpriseIFOAM International Federation of Organic Agriculture MovementsIgA Income generation ActivitiesIIFM Indian Institute of Forest ManagementIIM Indian Institute of ManagementIIPA Indian Institute of Public Administration, New DelhiIIT Indian Institute of TechnologyINRM Integrated Natural Resource ManagementIPCC Inter-governmental Panel on Climate ChangeIPM Integrated Pest ManagementIRDP Integrated Rural Development ProgrammeIT Information TechnologyITC Indian Tobacco CompanyITDA Integrated Tribal Development AgenciesIWDP Integrated Watershed Development ProgrammeIWMP Integrated Watershed Management ProgrammeJCI Jute Corporation of IndiaJLg Joint Liability groupsJRY Jawahar Rojgar YojanaKCC Kisan Credit CardKfW Kreditanstalt für WiederaufbauKHDP Kerala Horticulture Development ProjectKM Knowledge ManagementKVK Krishi Vigyan KendraLT Long TermMANREgA Mahatma gandhi National Rural Employment guarantee SchemeMART Marketing and Research TeamMCK Micro Credit KendraMCX Multi Commodity Exchange LimitedMEgS Maharashtra Employment guarantee SchemeMEPA Micro Enterprise Promotion AgencyMF MicrofinanceMFALDA Marginal Farmers and Agricultural Labour Development AgencyMFI Microfinance InstitutionMFIN Microfinance Institutions NetworkMFO Microfinance OrganizationsMgNREgA Mahatma gandhi National Rural Employment guarantee ActMgNREgP Mahatma gandhi National Rural Employment guarantee ProgrammeMgNREgS Mahatma gandhi National Rural Employment guarantee Scheme

xvi State of IndIa’S LIveLIhoodS RepoRt 2010
MI Tanks Micro Irrigation TanksMIP Micro Irrigation ProjectsMMAS Macro-Management of Agriculture SchemeMNC Multi National CompanyMoEF Ministry of Environment and ForestsMoRD Ministry of Rural DevelopmentMoU Memorandum of UnderstandingMP Madhya PradeshMPEDA Marine Products Export Development AgencyMPRLP Madhya Pradesh Rural Livelihoods ProjectMRP Maximum Retail PriceMSP Minimum Support PriceMSSRF M S Swaminathan Research FoundationMT Medium TermMTA Midterm AppraisalN2O Nitrous OxideNABARD National Bank for Agriculture and Rural DevelopmentNADP National Agricultural Development ProgrammeNAFED National Agricultural Cooperative Marketing FederationNAIS National Agricultural Insurance SchemeNAPCC National Action Plan on Climate ChangeNBFC Non-Banking Financial CompaniesNCAER National Council of Applied Economic ResearchNCDEX National Commodity and Derivative ExchangeNCEUS National Commission for Enterprises in the Unorganized SectorNCF National Commission on FarmersNDC National Development CouncilNDDB National Dairy Development BoardNFFWP National Food for Work ProgrammeNgO Non-governmental OrganizationNHM National Horticulture MissionNIC National Informatics CentreNOVOD National Oilseeds and Vegetable Oils DevelopmentNPA Non-Performing AssetNREgA National Rural Employment guarantee ActNREgP National Rural Employment guarantee ProgrammeNREgS National Rural Employment guarantee SchemeNREP National Rural Employment ProgrammeNRLM National Rural Livelihood MissionNRM Natural Resource ManagementNSDM National Skill Development MissionNSS National Sample SurveyNSSO National Sample Survey OrganizationNTFP Non-Timber Forest ProduceNWDPRA National Watershed Development Project for Rainfed AreasOBC Other Backward ClassesOMFED Orissa State Cooperative Milk Producers FederationORMAS Orissa Rural Development and Marketing SocietyOTS One Time Settlement

List of Abbreviations xvii
PDS Public Distribution SystemPIF Public Interest FoundationPIN Professional Institutional NetworkPLP Potential Linked Credit PlanPNB Punjab National BankPoS Point of SalePPCP Public Private Community PartnershipPPP Public Private PartnershipPPS Paryavarana Parirakshana SamithisPRA Participatory Rural AppraisalPRADAN Professional Assistance for Development ActionPRI Panchayat Raj InstitutionPTD Participatory Technology DevelopmentR&D Research and DevelopmentRAAKS Rapid Assessment of Agricultural Knowledge SystemsRBI Reserve Bank of IndiaRIDF Rural Infrastructure Development FundRKVY Rashtriya Krishi Vikas YojanaRLEgP Rural Labour Employment guarantee ProgrammeRMg Rithu Mithra groupsRP Resource PersonRRB Regional Rural BanksRSETI Rural Self Employment Training InstitutesRTC Rural Transformation CentresRUDSETI Rural Development and Self-Employment Training InstitutesSAA Service Area ApproachSAF Syndicate Agricultural FoundationSAS Situation Assessment SurveySAU State Agriculture UniversitySBI State Bank of IndiaSC Scheduled CasteSCARDB State Cooperative Agriculture and Rural Development BanksSEWA Self Employed Women’s AssociationSF Small FarmersSFDA Small Farmers Development AgencySFVAM Fruit and Vegetable Auction MarketSgRY Sampoorna grameen Rozgar YojanaSgSY Swarnajayanti gram Swarozgar YojanaSHg Self Help groupSHg-BLP Self Help group-Bank Linkage ProgrammeSHM State Horticulture MissionSHPI Self Help Promoting InstitutionSKDRDP Shri Kshetra Dharmasthala Rural Development ProjectSKS Swasraya Karashaka SamithisSLA Sustainable Livelihoods ApproachSME Small and Medium EntrepreneursSOIL State of India’s LivelihoodSRI System of Rice IntensificationST Scheduled Tribe
xviii State of IndIa’S LIveLIhoodS RepoRt 2010
STCCS Short Term Cooperative Credit StructuresT&V Training and VisitTDF Tribal Development FundTERI The Energy Research InstituteTN Tamil NaduTNAU Tamil Nadu Agricultural UniversityUID Unique Identification NumberUIDA Unique Identification Development Authority of IndiaUNDP United Nations Development ProgrammeUP Uttar PradeshUPA United Progressive AllianceUPS Uninterruptible Power SupplyUS United StatesUT Union TerritoryV&MC Vigilance and Monitoring CommitteeVAT Value Added TaxVC Vaidyanathan CommitteeVFPCK Vegetable and Fruit Promotion Council, KeralaVSAT Very Small Aperture TerminalVVV Vikash Volunteer VahiniWB West BengalWDF Watershed Development FundWgCB Working group on Capacity BuildingWgPE Working group on Planning and ExecutionWgTA Working group on Transparency and AccountabilityWORLP Western Orissa Rural Livelihood ProjectWR Warehousing ReceiptWTO World Trade OrganizationWWF World Wildlife Fund for Nature

Preface
Responding to the increasing attention on livelihoods of disadvantaged people by govern-ment and by non-government agencies, the Livelihood School, an institution engaged in building and disseminating knowledge required for supporting large number of livelihoods, and ACCESS Development Services, an agency engaged in a variety of technical assistance and support services to those engaged in livelihood promotion, made the first joint effort to take a close look at the status of livelihoods in India in 2008. Looking at the overwhelming response and paying attention to some of the feedback on this report, we decided to bring out an improved edition in 2009. But both these reports tried to present a general overview of the livelihood situation in India. The first volume presented a picture of the situation of livelihoods in the country, while the second volume looked at some of the major events that had happened in the year, such as the global financial crisis, change in the government, setting up of the skill missions, and examined the impact they had on the livelihoods of people, especially the poor.
But both these reports looked at the impact on livelihoods across the sectors. However, we recognized that the implications on livelihoods in different sectors were significantly dif-ferent and needed to be examined carefully. Therefore, this year we have focused the State of India’s Livelihoods: The 4P Report on agriculture, which supports the livelihoods of more than 50 per cent of the country’s population and contributes less than 17 per cent of the gDP and feeds 100 per cent of the country.
In this year’s report, in the ‘Overview’ chapter, Sankar Datta and Vipin Sharma present a comprehensive picture of livelihoods in agriculture. While on many fronts of production India today has acquired a significant position in the world’s production (for example, in commodities like milk, paddy, wheat and groundnut), in terms of productivity it is still lagging behind. growth in production has also stagnated, with decreasing proportion of the national income being shared by these farmers, who feed us. In the subsequent chapter on ‘Livelihoods in Agriculture—Status, Policies and Prospects’, T.S. Papola explores how the agricultural policies of the state over the years have affected the livelihoods of people engaged in agricul- ture and how some of the other employment generation policies have affected agriculture.
However, this period has also witnessed variety of new initiatives to support the livelihoods of the people, especially in rural areas. These initiatives have also had their implication on the labour engaged in agriculture, and thereby affecting its costs and its profitability. In Chapter 3, ‘greening India through MgNREgA—Convergent Action for Benefits beyond Employment generation’, Suryamani Roul has examined the effect of this large government programme in greater details. And in the subsequent chapter, Pradeep Kumar Mishra has presented the experience of ‘New generation Interventions in Agri-based Livelihoods’, some of the private sector initiatives. This period has also witnessed several new initiatives in making financial services available for new initiatives in agriculture. These have been elaborated in details by Bishwabandhu Mohanty in the subsequent chapter, ‘Financing Agriculture—Emerging Scenario’. The other set of new initiatives we have talked about in this report is a variety of new market linkage efforts. Reshma Anand in the chapter on ‘Agriculture Marketing—From Livelihoods to Enterprise’ has presented several of these interventions.

xx State of IndIa’S LIveLIhoodS RepoRt 2010
Another phenomenon which has affected agriculture and thereby livelihoods of people engaged in it we could not ignore was climate change. In Chapter 7, ‘Climate Change and Agriculture—Challenges and Opportunities in India’, Shailesh Nagar and Jayesh Bhatia have eloquently presented both the positive and negative dimensions of such changes.
By placing these different dimensions of Policy and Practice together and what it is doing to the People whose livelihoods are dependant on agriculture and what are some of the emerging Possibilities, we have tried to present a comprehensive picture of livelihoods in agriculture in this year’s State of India’s Livelihoods: The 4P Report.
Enjoy reading.
Sankar Datta

Acknowledgements
The report owes its gratitude to the enormous effort, cooperation and support of all the contributors, who took out precious time for writing various chapters, despite their personal and professional preoccupations. The report would not have been possible without the valuable contributions of Professor Trilok Singh Papola for analyzing agri-policies in India over the years, Mr Biswa Bandhu Mohanty for his elucidation of the emerging scenario in agriculture financing, Pradeep Mishra for presenting examples of successful private sector agri-initiatives, Reshma Anand for shedding light on agri-marketing, Sailesh Nagar and Jayesh Bhatia for crystallizing the relationship between climate change and agriculture in India, and Suryamani Roul for exploring the potential of MgNREgA’s convergence with agri-schemes. Archana Sharma of ARANYA deserves special mention and appreciation for her tremendous effort in coordinating with all the authors and content editing a rather diverse report. The report is also grateful to Dr Sankar Datta and Vipin Sharma for co-writing the ‘Overview’ chapter, as well as their overall vision and guidance. A special thank you is due to The Livelihood School for their unwavering support and direction. Finally, the report could never have beenbrought out on time had it not been for the background support of the ACCESS team.

xxii State of IndIa’S LIveLIhoodS RepoRt 2010

1.1. Introduction
Even today, livelihoods of 50 per cent of the people in our country depend on agricul-ture and related activities. But agriculture and related activities put together share only 17 per cent of the nation’s income. Produc-tion as well as productivity is stagnant. Most of the resource endowed land is producing to their maximum capacities. To improve productivity by harnessing potential of the poorer quality land, that too with smaller land holders, is a challenge. Especially with tech- nology development still revolving around management of intensive crop production.
To ameliorate the situation, we are left with no way other than (a) to facilitate large numbers of people moving away from agriculture to non-farm sector; (b) invest into improving other resources, especially land and water; and (c) focus on developing technologies for non-irrigated areas which can be adopted by the small farmers.
1.1.1. Scope of SOIL 2010Since 2008, the State of India’s Livelihood: People, Policies, Possibilities and Pro-moters (the SOIL: 4P Report) has gained popularity amongst livelihood interven-tionists, policy-makers and academics alike as a report that benchmarks current trends that impact the livelihoods of the poor. While the last two reports have traced broad trends, factors and conditions that have influenced the situation of livelihoods
in India, the 2010 SOIL Report has focused on livelihoods in agriculture.
Even today, despite significant growth in the manufacturing and the service sectors, agriculture remains the mainstay source of livelihoods in India. Though the percentage of people engaged in agriculture has come down below the historic mark of 50 per cent of the population of the country, in terms of number, even today, more than 566 million people’s livelihoods primarily depend on agriculture. Not only does agriculture engage the largest number of people, the sector also feeds the entire country. The food security of 100 per cent of the people in the nation depends on agriculture.
Recognizing that agriculture forms the basis of livelihoods of such a large number of people, the Government of India has also, in recent years, stepped up its efforts to strengthen Indian agriculture. In an un- precedented manner, it has brought in National Policy for Farmers, which focuses on the interest of the farmers and not farm production and a new Special Policy on Food Security, which focuses on the people who need the food. Breakthrough in bio- technology is opening up new horizons for agriculture. There have also been a lot of new investments coming in for agricul-ture and related industries. Many civil society organizations have also started con-centrating their action on agriculture.
Therefore, this year’s State of India’s Livelihood Report focuses on ‘who are these 566 million people’ (may be more than 600 by the time this report is being read), and ‘what do they do to seek out a livelihood’.
Overview of Livelihoods Situation
Sankar Datta anD Vipin Sharma*
Chapter 1
*Done with research support from Ms K Padmaja, a freelance development consultant.

2 Sankar Datta anD Vipin Sharma
1.1.2 Agriculture includes…Agriculture is a complex sector with no universally accepted definition. By some definition it includes: crop production, horticulture and allied activities like dairy, piggery, poultry, goat rearing, fisheries, logging, non-timber forest produce (NTFP) collection, agricultural inputs and agricul-tural processing sub-sectors.
A large proportion of the farming households, especially the poor, earn their livelihoods from a mix of subsistence ac-tivities. Most small and marginal farmers who own on an average less than an acre of land cannot produce enough to sustain a family of 5.5 (NSSO, 2003) at the present level of productivity (e.g., paddy 2,203 kg/ha or sorghum 2,337 kg/ha in 2009–08) (http://dacnet.nic.in). Therefore, most of them engage in multiple sets of activities to augment their income and manage their cash flows. These include wage labour; animal husbandry, especially of small ruminants; forestry; horticulture; planta-tion; logging; etc.
This year’s SOIL Report, while look-ing at agriculture from the perspective of people whose livelihoods depend on it, will also include animal husbandry, fisheries, horticulture, some of the important plan-tation crops and necessary support services, as its part.
1.2. Overview of situation of agriculture
1.2.1. At the top of the world, for several commodities
India leads the world in production of a few agriculture commodities. It is the largest producer in the world of milk, cashew nuts, coconut, tea, ginger, turmeric and black pepper (Table 1.1). It also has the world’s largest cattle population (281 million). It is the second largest producer of wheat, rice, sugar, groundnut and inland fish. It is the third largest producer of tobacco. India accounts for 10 per cent of the world fruit production, ranking first in production of banana and sapota.
Our country is no longer reeling under the pressure of shortage of foods. Produc-tion and areas under them is summarized in Table 1.2.
Having reached a comfortable level of food sufficiency, India has also started ex-porting some of its agricultural products (Table 1.3).
1.2.2. But not a great livelihood opportunity
While on one hand, India is shining with an 8 per cent growth of Gross Domestic Product (GDP), 50 per cent of the people who feed us only share 17 per cent of the GDP. Agriculture is growing at a rate far slower than the rest of the economy. Its growth is not proportionate to meet the requirements of our growing popula- tion. This may have serious implications for the people engaged in agriculture for their livelihoods: the shining India may take away the food from the hungry mouths of people who produce it.
It has been argued that with the devel-opment of an economy, the contribution of agriculture to the overall economy comes down. In developed economies like in the United States, the contribution of agri- culture to the economy is only 1.2 per cent of the GDP with only 0.6 per cent popula-tion being engaged in the sector (Table 1.4). As Indian economy is growing, contribu-tion of agriculture has also started to come down, but still a very large percentage of the population depends on it.
Table 1.1: Top nine commodities produced in India and its world ranking
CommodityWorld rank
Value of production (in ` ’000 crores)
1. Paddy (Rice) 2 13,7502. Buffalo milk 1 1,2603. Wheat 2 5454. Cow milk 2 5005. Fresh vegetables 2 3306. Sugarcane 3 2607. Potato 2 1808. Groundnut 1 1709. Pimento
(red chillies)1 170
Source: Global Economy Research Group (2010).
Overview of Livelihoods Situation 3
1.2.3. Nearly stagnant production and productivity
Exploring why it is so we find that the
production of cereals, which had reached
184 million tons in 2001, revolve around
200 million tons, and have marginally
increased to reach only 220 million tons by 2009. Similarly, all food grain produc- tion has marginally increased by 1.9 per cent per annum to 234 million tons in 2009 from 197 in 2001. (Source: compiled from the statistics released by Ministry of Agricul- ture as cited in www.indiaagristat.com).
Not only the total production but even productivity per unit of land has not im-proved in the several years after the Green Revolution. In spite of having some of the most fertile soil, average yield in India is about 30 per cent to 50 per cent of the aver- age yield in the world (Wikipedia, 2010).
There is a silver lining though. Table 1.5 shows that while overall rate of growth of agriculture has been coming down, livestock production, fisheries and horticulture have grown at higher rates than crop production
itself. As these often fetch higher return, this
Table 1.2: Normal (average of 2003–04 to 2007–08) area, production and yield of major crops in India
Area under production (Million hectares)
Total production (Million tonnes) Yield(Kg/ha)
Food grainsTotal coarse cereals 29.2 36.0 1,231Total pulses 23.1 14.1 610Total food grains 122.6 213.6 1,743
OilseedsAll nine oilseeds 26.4 26.3 995
Other cash cropsSugarcane 4.4 291.2 66,151Cotton 8.7 19.4 379Jute 0.9 11.0 2,093Potato 1.4 24.3 17,207Onion 0.6 7.8 12,520
Source: Ministry of Agriculture (2009).
Table 1.3: Top 10 exports from India
ProductsValue
(` ’000 crores)
1. Rice parboiled 36,5202. Bovine cuts boneless, frozen 33,7813. Basmati rice 30,9764. Onions, fresh/chilled 12,9035. Guargum treated and pulverized 10,3346. Other rice 7,5177. Other cane jaggery 7,2068. Mango pulp 5,6119. Groundnuts HPS kernels 5,359
10. Maize (corn), other than seed 4,895
Source: APEDA (n.d.).
Table 1.4: Share of population engaged in agriculture and agriculture’s contribution to GDP in India and the United States (n.d.)
Share of population engaged in agriculture
Share of agriculture in GDP
Ratio of share of GDP to percentage of people engaged
India 52% 17.2% 0.33US 0.6% 1.2% 2.00
Source: Wikipedia (2010a, 2010b).
Table 1.5: Growth rate of output of different sub-sectors of agriculture: 1993/94 prices
Period Crop sector (%) Livestock (%) Fisheries (%) Horticulture (%)
1980/81 to 1989/90 2.71 4.84 5.93 2.421990/91 to 1996/97 3.22 4.12 7.41 5.921997/98 to 2003/04 0.61 3.76 4.28 3.66
Source: Planning Commission (2007).

4 Sankar Datta anD Vipin Sharma
indicates larger number of people deriving
their livelihoods from some of these sources
rather than from staple crops.
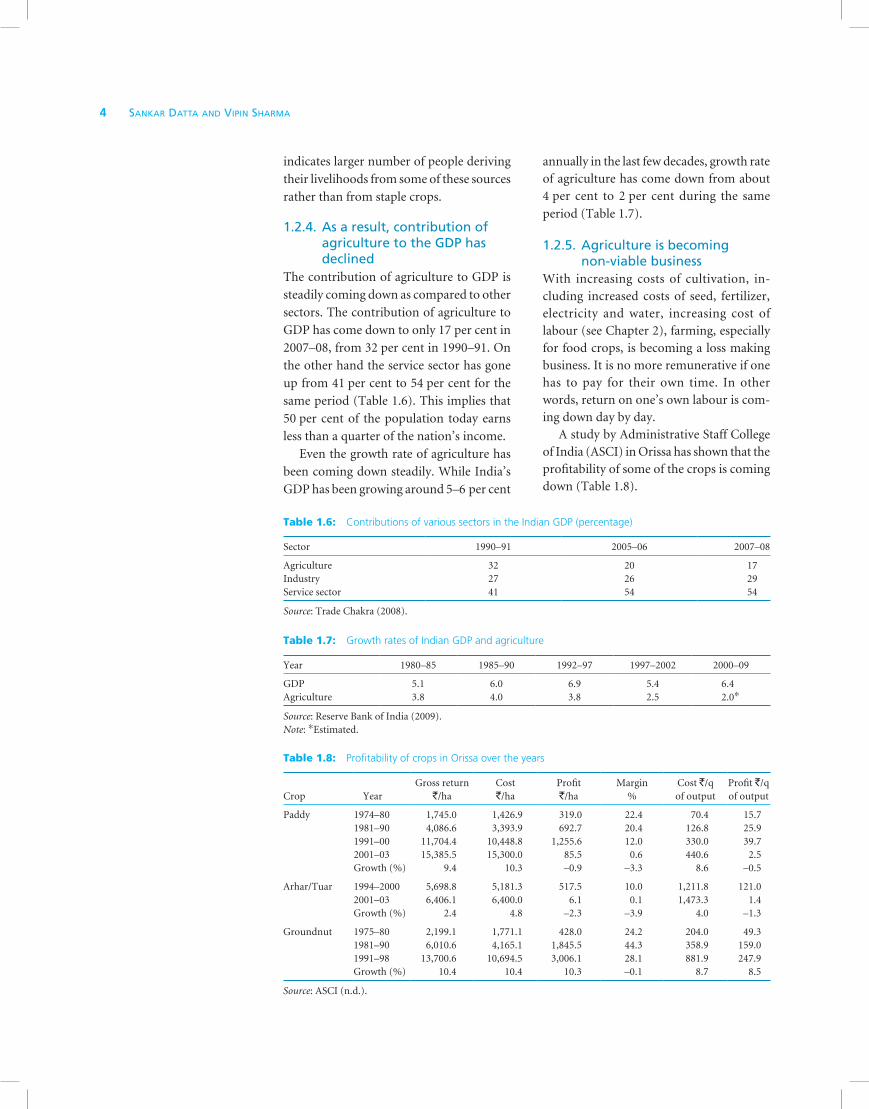
1.2.4. As a result, contribution of agriculture to the GDP has declined
The contribution of agriculture to GDP is
steadily coming down as compared to other
sectors. The contribution of agriculture to
GDP has come down to only 17 per cent in
2007–08, from 32 per cent in 1990–91. On
the other hand the service sector has gone
up from 41 per cent to 54 per cent for the
same period (Table 1.6). This implies that
50 per cent of the population today earns
less than a quarter of the nation’s income.
Even the growth rate of agriculture has
been coming down steadily. While India’s
GDP has been growing around 5–6 per cent
annually in the last few decades, growth rate of agriculture has come down from about 4 per cent to 2 per cent during the same
period (Table 1.7).
1.2.5. Agriculture is becoming non-viable business
With increasing costs of cultivation, in-cluding increased costs of seed, fertilizer, electricity and water, increasing cost of labour (see Chapter 2), farming, especially for food crops, is becoming a loss making business. It is no more remunerative if one has to pay for their own time. In other words, return on one’s own labour is com-ing down day by day.
A study by Administrative Staff College of India (ASCI) in Orissa has shown that the profitability of some of the crops is coming down (Table 1.8).
Table 1.6: Contributions of various sectors in the Indian GDP (percentage)
Sector 1990–91 2005–06 2007–08
Agriculture 32 20 17Industry 27 26 29Service sector 41 54 54
Source: Trade Chakra (2008).
Table 1.7: Growth rates of Indian GDP and agriculture
Year 1980–85 1985–90 1992–97 1997–2002 2000–09
GDP 5.1 6.0 6.9 5.4 6.4Agriculture 3.8 4.0 3.8 2.5 2.0*
Source: Reserve Bank of India (2009).Note: *Estimated.
Table 1.8: Profitability of crops in Orissa over the years
Crop YearGross return
`/haCost `/ha
Profit `/ha
Margin %
Cost `/q of output
Profit `/q of output
Paddy 1974–80 1,745.0 1,426.9 319.0 22.4 70.4 15.7 1981–90 4,086.6 3,393.9 692.7 20.4 126.8 25.9 1991–00 11,704.4 10,448.8 1,255.6 12.0 330.0 39.7 2001–03 15,385.5 15,300.0 85.5 0.6 440.6 2.5 Growth (%) 9.4 10.3 –0.9 –3.3 8.6 –0.5
Arhar/Tuar 1994–2000 5,698.8 5,181.3 517.5 10.0 1,211.8 121.02001–03 6,406.1 6,400.0 6.1 0.1 1,473.3 1.4
Growth (%) 2.4 4.8 –2.3 –3.9 4.0 –1.3
Groundnut 1975–80 2,199.1 1,771.1 428.0 24.2 204.0 49.3 1981–90 6,010.6 4,165.1 1,845.5 44.3 358.9 159.0 1991–98 13,700.6 10,694.5 3,006.1 28.1 881.9 247.9 Growth (%) 10.4 10.4 10.3 –0.1 8.7 8.5
Source: ASCI (n.d.).

Overview of Livelihoods Situation 5
The study showed that profitability of the crops grown is decreasing due to increase in the labour cost, cost of power and irrigation, and the farm gate prices the farmers receive is less in spite of the recent price rise of various commodities. Thus the ability of agriculture to sustain large num- ber of livelihoods is coming down.
1.2.6. Distress at farmer householdStagnating productivity of agriculture, increasing cost of production and near stagnant prices for majority of the crops, coupled with increasing cost of living for the farming households and changing as-pirations of the community with the advent of the information and telecommunica-tion technologies, has made the lives of the people whose livelihoods depend primar-ily on agriculture more difficult. With the spread of the Management Intensive Crop Production systems, the dependence of the farmers on the markets, both for their in-puts and outputs have gone up. So has the risks arising from dependence on nature affected by climate change, frequent natural disasters, uncertainties in yields and prices, weak rural infrastructure and imperfect markets.
On one hand this has made agriculture not only non-viable but also risky, on the other hand the finance industry has also made its inroads in the rural areas. Market dependence, coupled with availability of finance, without appropriate increase in the net revenue is a recipe for disaster. This has led to a serious distress at the farm-ing household level. The National Crime Records Bureau data show us that nearly 200,000 farmers have killed themselves between 1997 and 2008. Maharashtra’s numbers are the worst in the country. This state has seen 41,404 farmers’ suicides since 1997. Of these, 12,493 have occurred in 2006–08.
The government has taken several steps to address this issue. But most of them have revolved around loan waivers and cash compensations to affected families, both
of which are very short-term measures and quite often people have misutilized such schemes to get rid of some of the burdens from their families.
1.2.7. To import or produce at home: A tough choice
Agriculture feeds the world. In order to keep the price under control, government has started importing many commodities. Hence agricultural imports have started going up. It increased from ` 627 million in 2003–04 to ` 5,831 million in 2008–09 in case of sugar and from ` 22.9 billion to ` 58.7 billion for pulses in the same period. While the proportion of agricultural import to the total import of the country has come down from 5.29 per cent in 2000–01 to 2.74 per cent in 2008–09, in terms of real value and volume it has been growing (Ministry of Agriculture, n.d.).
While imports may contribute towards making food available to the consumers, it is exerting pressure on the farmers as the price they realize at farm gate gets affected. This affects millions of farm livelihoods.
1.2.8. Shift towards cash crops has started affecting food production
With reducing margins from food crops, many farmers are looking for alternatives. Wherever resources permit, they shift to non-food crops. This is further facilitated by technological developments in agriculture and rising demand for non-food crops. Traditional farming is changing into mod-ern commercial farming.
Grain orientation1 of agriculture during the last decade has decreased from 71 per cent to 67 per cent. Most of the change in grain orientation, however, is taking place under rainfed conditions to reduce the risk factor of crop failures due to drought or less rain, although comparative advantage, yield difference and crop rotation considerations
1 Grain orientation of agriculture is defined as a ratio of gross cropped area for food grain to total cropped area.

6 Sankar Datta anD Vipin Sharma
often favour diversification in irrigated areas (Figure 1.1).
Among the food grain crops, the area under superior cereals, that is, rice and wheat, is increasing; while that of coarse cereals (millets) is on the decline. While cereals and pulses have lost area, major gainers of this area shift are the non-food grain crops, especially oilseeds.
1.2.9. Reducing per capita availability of food
Due to the increase in population, stagnant production and decrease in the area under production of food crops (between 1990–91 and 2000–01, around 4 per cent of the gross cultivated area [GCA]—representing approximately about 6.7 million hectares—has shifted from food grain crops to non-food grain crops), farmers have started shift- ing to non-food crops with higher returns. As a result the net per capita availability of the food grains has started declining Table 1.9). This trend is fuelling concerns for food security!
1.2.10. Land fragmentationWith increasing population pressure, agriculture land is getting more and more fragmented. National Sample Survey Or-ganization (NSSO) data shows that in 1961 average land holding size was 2.63 hectares, which has come down to 1.06 hectares by 2003. While in 1960s when Green Revo-lution was taking place 61.7 per cent of farmers were small and marginal, this proportion had reached 86.1 per cent in 2003 (Table 1.10).
The task of enhancing productivity of agriculture in the country, which could not be achieved by the large landholders in the last 50 years since the Green Revolution, therefore now lies on the shoulders of mil-lions of small farmers. However, most of the agricultural research has concentrated on management intensive crop produc-tion technologies. These are more resource consuming and therefore more easily adoptable by large farmers, especially in irrigated areas.
Figure 1.1: Grain orientation in irrigated and rainfed areas from 1960 onwards
Source: Bhaduri (2007).
Table 1.9: Per capita net availability of food grains (grams per day) in India
Year Rice Wheat Other cereals Cereals Gram Pulses Food grains
2000 203.7 160.0 59.0 422.7 10.8 31.8 454.42008 (P) 175.4 145.1 54.1 374.6 10.6 41.8 436.0Difference –28.3 –14.9 –4.9 –48.1 –0.2 10.0 –18.4
Source: Ministry of Agriculture. Available online at http://www.indiaagristat.com/table/percapitaavailability/24fooditems/103/6367/data.aspx (accessed in 2010).

Overview of Livelihoods Situation 7
1.2.11. Poorer quality land left out, mostly rainfed
With increasing intensity of agriculture, all the high quality, especially irrigated, land has already been utilized. These areas often show very high productivity, at par with global levels of productivity. Table 1.11 reveals that most of the cultivable areas (85 per cent) have been already brought under cultivation. The balance land, still available for cultivation, is in resource poor areas. Often disadvantaged with respect to physical, social and economic infrastruc-ture, these areas have very little or no services available. Poor capital formation in agriculture has also limited possibility of investments in land over years, leaving land almost at a stage of becoming un- cultivable. What is disturbing (Table 1.11) is that there is a gradual increase in land classified as uncultivable. Though increasing urbanization is one of the reasons for such increase, under-investment in land is also contributing towards it.
Though productivity of land has not been going up, parts of cultivable land are getting converted into uncultivable land, with farm land getting infringed upon for
infrastructure development, housing and industry.
1.3. People: What’s happening to people whose livelihoods are based on agriculture
1.3.1. Situation of employmentAccording to Census of India (2001), there are nearly
l 127 million cultivators and their families,l 107.5 million agricultural labourers
andl 6 million other farm workers engaged in
livestock, forestry and plantations.
Of the total agricultural labourers,
l 38 per cent were female and 61.9 per cent were male,
l 21.7 per cent were female and 78.3 per cent were male workers amongst live-stock, forestry and plantation workers and
l About 99.2 per cent of agricultural work-ers were reported to be unorganized and unprotected.
Table 1.10: Land holdings in India
1960–61 1970–71 1980–81 1991–92 2003
NSSO Round 17th 26th 37th 48th 59th1. No of operational holdings (millions) 50.77 57.07 71.04 93.45 101.272. Average area operated (hectares) 2.63 2.2 1.6 1.34 1.063. Category of land holding (percentage of land held) a. Marginal 39.1 45.8 56.0 62.8 70.5 b. Small 22.6 22.4 19.3 17.8 15.6 c. Semi-medium 19.8 17.7 14.2 12.0 9.2 d. Medium 14.0 11.1 8.6 6.1 4.3 e. Large 4.5 3.1 1.9 1.3 0.8
Source: NSSO (2006).
Table 1.11: Land use classifications in India (thousand hectares)
YearCultivable
landCultivated
landUncultivable
landUncultivated
landPercentage of cultivated land to cultivable land
2000–01 183,506 156,142 121,674 149,038 85%2004–05 183,007 155,649 122,571 149,929 85%2007–08 182,442 155,671 123,232 150,003 85%
Source: Ministry of Agriculture, ‘State-wise Land Use Classification and Irrigated Area in India (1995–1996 to 2007–2008)—Part I’. Available online at http://www.indiastat.com/table/agriculture/2/landuse/448932/7201/data.aspx (accessed in 2010).

8 Sankar Datta anD Vipin Sharma
1.3.2. Feminization and aging of agriculture
With the reducing returns from farming activity discussed in Sections 1.2.2, 1.2.3 and 1.2.4, people have started looking out for alternate opportunities for aug-menting their income. This has led to male members from the villages, especially peri-urban villages, migrating (even if it is only daily migration) to neighbouring towns and cities and even to distant big cities where there is increased demand for labour, leaving the agricultural operations to be managed by women. Though this phenomenon has started increasing the in-volvement of women in agriculture, it has also started increasing workload on already over-burdened women.
Similarly, younger people moving out in search of jobs has also left the elderly to manage the farms which are no longer remunerative.
1.3.3. Growth of microfinance has shown rural people are bankable
One phenomenon that cannot be ignored in rural India today is the growth of the microfinance industry.
As of March 2009, the MFIs in India reported a client base of 22.6 million with an outstanding portfolio of more than ` 100 billion.
Though microfinance is not directed towards agriculture specifically, and ex-cept BASIX not many other Microfinance Institutions (MFIs) have any specific prod- uct designed to cater to the needs of the farming activities, it does have a significant implication. As money is easily disposable and during the cropping seasons, sig-nificant amount of funds are required for
agricultural operations, substantial parts of microfinance get invested in agriculture. Anecdotal evidence shows that growth of microfinance has not only reduced pressures on farmers for farm credit but has also broken some of the traditional credit linked marketing linkages.
1. Enhanced engagement of women: One of the effects of growth of the micro- finance industry has been on the em-powerment of women. As most micro-finance organization (MFO) models largely involve women in their activ-ities, women have got access to finance. They have also started engaging in their own group meetings or activities which are beyond their regular house- hold chore. This has enhanced their position within the family and also within the community. This, coupled with the feminization phenomenon dis-cussed earlier, has increased their role in agriculture. Studies have shown that women are now more actively engaged (or wilfully disengaged) from various farm operations like procurement of inputs and marketing of their products.
2. Consumer products being routed through microfinance (MF) channel: In the recent years, many industries have been trying to capture the ‘market at the bottom of the pyramid’. This includes many consumer goods companies. With the growth of the microfinance industry, many of them have started utilizing the new social infrastructure to penetrate deeper in the villages. Though this has had both positive and negative impacts, from the perspective of agriculture we see many improved technologies such
Table 1.12: Growth in Indian microfinance sector
Year ending 31 March 2004 2005 2006 2007 2008 2009
Outstanding Portfolio (in ` million) 4,000 12,600 24,800 42,100 76,750 117,300Growth Rate 215% 97% 66% 86% 53%
Borrowers (million) 1.0 2.3 4.9 7.9 14.2 22.6Growth Rate 130% 113% 61% 80% 59%
Source: Srinivasan (2009).

Overview of Livelihoods Situation 9
as solar powered equipments being propagated through this channel.
This has been further facilitated with the spread of the information and communication technology (ICT) and intrusion of television and multimedia. However, this has also led to a change in the aspirations of the people. More focus is on the utilization of fast mov-ing consumer goods (FMCG) products resulting in the increase of household expenditure, thus in the long term re-sulting in the decrease in the allocation of investments in agriculture.
3. Booming grassroots financial sector—agricultural credit: The target for the agriculture credit flow for the year 2009–10 is being set at ` 3,250 billion as against that of ` 2,870 billion just a year back, a 13 per cent increase. The flow of credit to the farm sector has increased to ` 2,644 billion during the last fiscal from ` 2,546 billion in 2007–08.
1.4. Policy Environment
1.4.1. Four distinct eras of agricultural policy
Though the first ever National Agriculture Policy was announced on 28 July 2000, India has made diverse policy interven- tions to strengthen its agriculture for quite some time. It has had policies related to marketing of agricultural commodities, introduction of new technologies, and management of the gene pool, wages and benefits to agricultural labour, agri-cultural credit, warehousing, and import and export of food grains among others.
In terms of the agricultural policy regime, we can divide the period since independ- ence into four distinct periods. As has been discussed extensively by Ramesh Chand (n.d.) in his article ‘India’s National Agri-cultural Policy: A Critique’, the period from 1950–51 to mid-1960s, also called pre-green revolution period, witnessed tremendous agrarian reforms, institutional changes
and development of major irrigation pro- jects. Intermediary landlordism was abol-ished. Land ceiling acts were passed by all the states to eliminate large sized holdings and cooperative credit institutions were strengthened to minimize exploitation of cultivators by private money lenders and traders. Expansion of area was the main source of growth in the pre-green revolu-tion period. However, the focus of these policies was enhancing production and they did not pay any special attention to livelihoods of people who depended on agriculture.
The country faced severe food shortage and crisis in early 1960s, which prompted the policy-makers to adopt spread of new seeds of high yielding varieties (HYV) of wheat and rice, which involved heavy use of fertilizers and irrigation. This marked the second phase of agriculture policy in the country. The strategy produced quick re- sults. Between 1965–66 and 1971–72, wheat and paddy witnessed an increase of 30 mil-lion tons, which was 168 per cent higher than the achievement of 15 years follow-ing 1950–51. This policy made a concerted effort of technology development coupled with institutional development. Two very important institutions, namely Food Cor-poration of India and Agricultural Prices Commission, were created in this period. The focus of this policy regime shifted from production to productivity, and no specific attention was given to livelihoods.
The next phase in Indian agriculture began in the early 1980s. While there was clear change in economic policy towards delicensing and deregulation in industry sector, agriculture policy lacked direction and was marked by confusion. Though on one hand India was moving towards a market-based economy, which was clear in the industrial policies, there was no such clear directive for agriculture. While some agro-processing industries were getting deregulated, the concerns for food security did not permit such a move on the input side, sending a mixed message.

10 Sankar Datta anD Vipin Sharma
A new phase in India’s economic policy, initiated in 1991, marked significant depar-ture from the past. Government initiated process of economic reforms, which in-volved deregulation, reduced govern-ment participation in economic activities and liberalization. Though much of the reforms were not initiated to directly affect agriculture sector, the sector was affected indirectly by devaluation of exchange rate, liberalization and opening of agri-culture land to industries. This was further encouraged by new international trade accord and World Trade Organization (WTO), requiring opening up of domestic market. But the government did not seem to have a clear stand in agriculture like it had for industry.
1.4.2. Present policy focusIn response to the mounting pressure to articulate its stand on agriculture, the Gov- ernment of India announced its first ever Agricultural Policy in July 2000. The pre- sent policy proposes to intervene in mul-tiple dimensions that affect agriculture, including technology; import–export; price management and warehousing, and allied and related sectors. Over the next two de-cades, it aims to attain:
l a growth rate in excess of 4 per cent per annum in the agriculture sector;
l growth that is based on efficient use of resources and conserves soil, water and biodiversity;
l growth with equity, that is, growth which is widespread across regions and farmers;
l growth that is demand driven and caters to domestic markets and maximizes benefits from exports of agricultural products in the face of the challenges arising from economic liberalization and globalization; and
l growth that is sustainable technologic- ally, environmentally and economically.
This policy provides a major thrust to development of rainfed and irrigated
horticulture, floriculture, roots and tubers, plantation crops, aromatic and medicinal plants, bee-keeping and sericulture for augmenting food supply, promoting exports and generating employment in the rural areas. It also places special attention on development of animal husbandry, poultry, dairy and aqua-culture for diversify-ing agriculture, increasing animal protein availability in the food basket and for gen-erating exportable surpluses.
1.4.3. Farmer-centric policyFor the first time a National Commission on Farmers (NCF) under the chairmanship of Professor M.S. Swaminathan was set up in 2006. Based on their recommendation, Government of India approved the National Policy for Farmers, 2007 (Ministry of Agri-culture, 2007).
The primary focus of this policy is on ‘farmer’, defined holistically and not merely on agriculture. In that sense, it is much more comprehensive than an Agriculture Policy. The objective is to improve the economic viability of farming through substantially improving net income of farmers. There is emphasis on increased productivity, pro- fitability and institutional support and on improvement of land, water and support services apart from provisions of appropri-ate price policy, risk mitigation measures and so on.
Inspite of these major policy changes, the Government of India continues to strug-gle with many issues of agricultural policy. Some of these have been discussed in the following sections.
1.4.4. New environment of good governance
The country today has an environment of Good Governance. An enabling envir-onment and supportive framework are created, schemes to secure and enhance in-come opportunities have been introduced, additional income sources are being intro-duced and people’s involvement is being encouraged. Some of initiatives have been discussed in this section. However, we need

Overview of Livelihoods Situation 11
to keep in mind that the policy environ- ment of the country is changing rapidly and these would also affect the policy envir-onment of agriculture.
1. Policy-makers today are becoming sensitive to the reality on the ground. Although several supportive govern-ment policies and programmes have been initiated in the country, there is a large scope for improvement in the im-plementation of these programmes.
2. Though earlier the focus of agricul-tural policy was on production and productivity, since the beginning of the Tenth Five Year plan attention has been given to employment generation as well. New programmes like Mahatma Gandhi National Rural Employment Generation Scheme (MGNREGS) have been started, which has had an impact on the prevailing agricultural wage rates and also the profitability of agricul- ture. Responding to the reality on the ground, this scheme has been modified in 2009 to draw attention to non-land based activities as well. With intro-duction of MGNREGS in rural areas, additional money is being pumped in, which has increased buying powers. But, it has also affected availability of labour for various agricultural op-erations. This has been discussed in detail in a subsequent chapter of this report.
3. There has also been enhanced focus on Convergence. In an unprecedented move, a Convergence Agreement has been signed between Ministry of Agricul-ture and Ministry of Rural Development in October 2007. New model guidelines have been developed for convergence of various programmes. A special task force has been set up to look at the long list of more than 400 centrally sponsored schemes and rationalize them.
4. Recognizing the need for involve-ment of the people in management of development programmes, and role of decentralized and democratic planning
processes, Panchayati Raj system has been strengthened. As there were several deficiencies in the earlier delivery sys-tem through the District Magistrate’s office, alternate delivery mechanisms are being developed.
5. In recent years, there has been Special Policy Attention on Food Security: a specially deployed group is working on a new Food Security Act. There has been high focus on Financial Inclusion and Inclusive Growth.
6. There has been a recognition at the policy-makers’ level that loan waiver has not yielded the desired results. But there is a serious debate on ‘What should be the Package for Supporting the Poor in Distress’.
7. Increased frequency of draoghts and floods—change in cropping pattern—and its effect on labour demand has increased concerns about Climate-Induced Vulnerability. High policy at-tention is being given on climate change. There are several impacts of climate change on the poor households which are quite visible. Most of the practices adopted by Indian farmers conserve the ecological balance; they do not find space in international negotiations. An umbrella Programme on Natural Resource Management (NABARD-GTZ) has been initiated to find better ways of managing them.
1.4.5. Some of the important policy debates
In spite of having made a comprehensive and farmer-focused policy on agriculture, the policy-makers are struggling with some of the dilemmas, which have both positive and negative consequences for livelihoods in agriculture. Some of these are:
1. Management of food-related inflation, while farmers are dissatisfied with the present pricing policies.
2. Import of food grains and edible oil to stabilize domestic prices.

12 Sankar Datta anD Vipin Sharma
3. Import of wheat, violating local pro-curement norms.
4. Introduction of Bt crops.5. Distress at farmer level causing increas-
ing number of suicides.6. Management of increasing risks in
agriculture.7. Diverting agricultural land for devel-
opment of infrastructure and industry, including agro-processing industries.
1.4.6. Regionalized agricultural policy
It needs to be recognized that agriculture is diverse and the support that it requires in different parts of the country also differs significantly from region to region. The policies which may be relevant in Punjab may have no relevance in neighbouring Rajasthan. Our Constitution too enables region-based agriculture policies by put- ting agriculture under State as well as Central subject. In this current environ- ment of good governance, it is time for us to come up with regional policies for dif- ferent regions of the country.
1.5. Promoters
India has also witnessed significant change in the nature of players who influence livelihoods in agriculture. The new pro-moters in this field are:
1. Many large multilateral programmes which encourage multi-sector collab-oration are operational in India. There are several programmes that are being implemented focusing on crops, tech-nology missions on oilseeds and pulses, horticulture, seeds, fertilizers, plant protection, machinery, rainfed farming, natural resource management, credit, cooperation, agriculture marketing, in-formation technology, policy and plan, trade and natural disaster management (Source: http://www.agriculture-industry-india.com/agro-programme-schemes/, accessed in 2010).
2. India has also created a different in-vestment environment, especially for
agriculture and related sectors. Foreign investments in many relevant sectors have been allowed and are coming in.
3. Several private investments are com- ing up, which can have positive influ- ence on the livelihoods of people who depend on agriculture.
4. Intra-value chain collaborations have started.
5. Many corporates are looking at the market at the bottom of the pyramid.
6. Markets are making efforts of coming closer to producers, cutting down the long supply chains.
7. Innovations in market linkage (ITC e-Chowpal III, Reliance) are taking place.
8. India has the fastest growing retail industry. It faced serious oppositions from multiple quarters initially, but there has been a rebirth of retail.
9. Blurring of boundaries between the public and private sector goods and services has taken place. Many private, often foreign, agencies are getting en-gaged in delivery of services, such as development of infrastructure, which were earlier limited to the public do-main. New forms of revenue models are being developed. Alternate Imple-mentation Model (AIM), where the gov- ernment governs and other agencies get engaged in delivery of different com-ponents of the package of services in Public-Private-Community Partnership (PPCP) is becoming popular.
10. Private investments in Infrastructure have started coming in. Roads and other infrastructure have improved, providing better access to market and information. Investments are also being done in establishing agri-processing industries.
11. There are also emerging markets for social services. Many enterprises in training and other support services are drawing private investments, though small.
12. Market-led interventions for livelihood support/promotion is popularized in

Overview of Livelihoods Situation 13
development sector. Donors focus on sustainability, also pushing market-led intervention.
1.6. Possibilities
There are several new possibilities arising in the field of agriculture. These are arising out of many changes in the market and the environment. Therefore, as promoters of livelihoods in agriculture, we need to take note of:
1. Big explosion in ICT, which is opening new possibilities for farmers.
2. Deep penetration of television: Aspir- ation levels have gone up with adver-tisements and with new TV serials. This has prompted high levels of cynicism among youth and some aversion towards agriculture as a basis of livelihood.
3. There is increased emphasis for capacity building. There are higher investments in capacity building. Failure of agricul-tural extension mechanism has also reshaped the form of farm training.
4. In the recent years there have been nu-merous experimentations on design-ing appropriate forms of institutions for farming, which included Producer Companies, Commodity Cooperatives, Contract Farming and Contact Farm-ing among others. See further discus-sion in Seminar on ‘Future Options of Agriculture—Corporate, Contract or Cooperative Farming?’ which was conducted in collaboration with Insti-tution of Agricultural Technologists (IAT) on 27 June 2009 in Bangalore (IAT, 2009).
5. There has been a boom in grassroots financial sector. More than 50 million women are organized in Self Help Groups (SHGs). However, exploration of this for use by other products and services is not very encouraging.
6. Unique identity of people being established.
7. Growing demand for environment friendly products by the Haves. Many
parts of India are forced to not adopt HYV cultivation technology. Can they be aggregated to a new market opportunity?
8. With MGNREGS enhancing pur- chase power demand for food items which are mostly agricultural, demand is likely to be growing in a positive cycle.
9. Basmati rice, select pulses, spices, tea, coffee, cotton and fruits are some po-tential sub-sectors of agriculture that are growing.
10. There have been new efforts in pro-ductivity enhancement. System of Rice Intensification (SRI), organic farming, Participatory Technology Develop-ment and drip irrigation are some of the new efforts in improving agricul- tural technology dissemination.
1.7. Structure of the Report
The 2010 SOIL Report, focused on liveli-hoods in agriculture, has six chapters other than the current one. These are:
1. Livelihoods in Agriculture: Status, Policies and Prospects.
2. Government of India’s Convergence Approach with a Focus on MGNREGA and Agriculture.
3. New Generation Initiatives in Agri-Based Livelihoods: Five Successful Private Sector Initiatives.
4. Financing Agriculture: Emerging Scenario.
5. Agriculture Marketing: From Liveli-hoods to Enterprise.
6. Climate Change and Agriculture: Chal-lenges and Opportunities in India.
ReferencesAPEDA (Agriculture and Processed Food Products
Export Development Authority). (n.d.). Available online at http://apeda.com/apedawebsite/HelpNews/APEDA_Products_Exports.htm. Accessed on 29 July 2010.
ASCI (Administrative Staff College of India). (n.d.). Research Report on Factor Productivity and

14 Sankar Datta anD Vipin Sharma
Marketed surplus of Major Crops in India. Available
online at http://planningcommission.nic.in/
reports/sereport/ser/ser_fpm.pdf. Accessed on
26 May 2009.
Bhaduri, Anik. (2007). Future of Foodgrain Production,
Grain Orientation in Irrigated and Rainfed Area
from 1960 Onwards. New Delhi: Ministry of
Agriculture, Government of India.
Chand, Ramesh. (n.d.). India’s National Agricultural
Policy: A Critique. Available online at http://
www.iegindia.org/dis_rc_85.pdf. Accessed on
14 July 2010.
Global Economy Research Group. (2010). The
Economic Report: Emerging India 2010. Penang:
Global Economy Research Group.
IAT. (2009). Discussion in Seminar on ‘Future
Options of Agriculture—Corporate, Contract or
Cooperative Farming?’. Bangalore, 27 June 2009,
Institution of Agricultural Technologists.
Ministry of Agriculture. (n.d.). ‘India’s Imports and
Exports of Agricultural Commodities vis-à-vis
Total National Imports/Exports’. Available
online at http://dacnet.nic.in/eands/pdf%20files/
tb13.1FU.pdf. Accessed on 26 July 2010.
——— (2007). National Policy for Farmers 2007.
Available online at http://agricoop.nic.in/NPF/
npff2007.pdf. Accessed in 2010.
——— (2009). Agricultural Statistics at a Glance.
New Delhi: Department of Agriculture and
Cooperation, Ministry of Agriculture, GoI.
NSSO. (2003). Press Note on Consumption Expenditure
of Farmer Households (January–December 2003).
New Delhi, National Sample Survey Organization.
New Delhi: GoI.
NSSO. (2006). Some Aspects of Operational Land
Holdings in India, 2002–03. Report No. 492. New
Delhi, National Sample Survey Organization.
New Delhi: GoI.
Planning Commission. (2007). Report of the Steering
Committee on Agriculture and Allied Sectors for
Formulation of the 11th Five Year Plan. New Delhi:
Planning Commission, GoI.
Reserve Bank of India (2009). Growth Rates and
Sectoral Composition of Real Gross Domestic
Product (GDP) in India—Part I (At 1999–2000
Prices) (2002–2003 to 2008–2009). RBI Annual
Report 2009. Mumbai: Reserve Bank of India.
Available online at http://www.indiastat.com/
table/economy/8/grossdomesticproductgdpnet
domesticproductndp/449275/411029/data.aspx
(accessed in 2010).
Srinivasan, N. (2009). Microfinance India State of
the Sector Report 2009. New Delhi: ACCESS
Development Services.
Trade Chakra (2008). ‘GDP of India’. Available online
at http://www.tradechakra.com/indian-economy/
gdp.html. Accessed on 26 July 2010.
Wikipedia. (2010a). ‘Economy of India’. Available
online at URL:http://en.wikipedia.org/wiki/
Economy_of_India. Accessed on 7 July 2010.
——— (2010b). ‘Economy of the United States’.
Available online at URL:http://en.wikipedia.org/
wiki/economy_of_the_united_states. Accessed
on 6 July 2010.

2.1. Introduction
Agriculture has always been and still con-tinues to be the main source of livelihood for the majority of Indian population. No doubt the percentage of people depend-ent on agriculture for employment and livelihood has declined over the years, but the decline in its share in Gross Domestic Product (GDP) has been much faster. Agriculture now contributes only about 17 per cent to GDP while employing about 55 per cent of the workforce. This imbalance, which has taken place partly due to slower growth of agriculture and mainly on ac-count of the failure of the non-agricultural sectors to generate enough jobs so as to shift the workforce away from agricul- ture, is a major source of concern for income growth and livelihoods of those engaged in agriculture in general. Within the agri-cultural workforce, there are groups which are specially disadvantaged in terms of ownership of productive assets and access to inputs, technology and markets that limit their capability to benefit from growth and thus face more acute problems of livelihood. Strategies and policies relating to agriculture have focused on both the aspects—growth and special benefits to disadvantaged groups—to varying extent at different periods of time and, of course,
to the varying and generally only moder- ate extent of success. Focus on ‘inclusive’ growth in recent years has led to reorien-tation of approach to a certain extent to bring about an acceleration in the growth of agriculture, on one hand, and to make it more diversified and region- and group-specific with a more decentralized approach to focus on livelihoods of the disadvantaged, on the other. Results of this reorientation are yet to be seen, as measures to operation-alize it have been on the ground only for a short period of time. At the same time, it is also important to recognize that the solution to the livelihood problems of all those presently engaged in agriculture is not possible within agriculture and meas-ures to enable them to shift to other more remunerative vocations are necessary.
The present chapter attempts to analyse these and related aspects of livelihoods in agriculture. It starts with highlighting the main features of the nature and extent of the problem, for the agricultural population as a whole and, in particular, for its relatively disadvantaged segments. That is followed by an attempt to critically examine the past strategies, policies and programmes in terms of their relative focus on different objectives of agricultural development and their effectiveness. Here both the general strategies and policies for agricultural growth and special programmes for selected groups of population are covered. Recent reorientation towards inclusive growth and
Livelihoods in Agriculture—Status,
Policies and ProspectsTrilok Singh PaPola*
Chapter 2
*Thanks are due to Ms Smriti Walia for her assistance in preparing this chapter.

16 Trilok Singh PaPola
measures for its operationalization in agri- culture sector are described in the next section. And, finally, an assessment of how far the ongoing and proposed measures can be effective and an outline of what more needs to be done to address the liveli-hood issues of agricultural population are attempted.
2.2. Nature and magnitude of livelihood deficit
2.2.1. Levels of income, expenditure and poverty
Even though the rate of growth of agricul-ture has always been understandably lower than the aggregate growth of the econ-omy, GDP from agriculture has more than quadrupled during 1950–51/2006–07. But increase in per worker GDP in agriculture has risen only by 75 per cent as compared to a fourfold increase in overall real per capita GDP during this period. Per worker GDP in agriculture was estimated to be around ` 2,000 per month during 2006–07 (Planning Commission, 2008b, p. 3), compared to about ` 9,000 for the economy as a whole (computed on the basis of figures in MoF, 2010). With a much slower decline in the share of workers than of GDP in agriculture, the gap between agricultural and non-agricultural income per worker has doubled from around 1:3 in 1951–52 to about 1:6 in 2006–07. NSSO survey on Situation Assessment of Farmers (2003) estimated that a farmer household, on an average, has a total monthly income of ` 2,115 from all sources (Bhalla, 2008, p. 68). These figures not only indicate the relatively poorer condition of those en- gaged in agriculture, but also reflect the poor state of their livelihoods in absolute terms.
Incidence of poverty is higher among rural population. It was 28.3 per cent in rural and 25.7 per cent in urban areas in 2004–05. Among rural households engaged in agriculture, poverty ratio was higher at 31 per cent (Table 2.1). Poverty, no doubt, is lower among cultivators (21.5 per cent)
than among agricultural labourers. Among the latter who constitute 36 per cent of agricultural workers, 46 per cent were poor. Their average daily wages were about ` 40 and they got work for only 209 days in a year, in 2004–05. Among farmers there was a large difference in the incidence of poverty, across different landholding size groups. Among all farmers possessing lands of various sizes, poverty ratio in 2004–05 was estimated to be 15.2 per cent (NCEUS, 2008a, 2008b). But for the landless, it was high at 22 per cent, slightly lower at 20 per cent among sub-marginal, 18.1 per cent among marginal, 14.8 per cent among small and 9.8 per cent among medium and large farmers.
Poverty estimates are based on private household consumption expenditure which may or may not be met by house-hold incomes. To the extent a household experiences deficit in its budget which may be met by incurring debt, it is vulnerable even if not poor. The Situation Assessment Survey (SAS) of farmers carried out during 2003 provides some interesting estimates in this regard about the farmer house-holds with different sizes of landholdings possessed. It was observed that farm house- holds on an average were in deficit, the aver-age monthly expenditure being ̀ 2,770 and average income from all sources (not only farming) ` 2,115 (Table 2.2). An average household in the landless, sub-marginal, marginal and small categories incurred
Table 2.1: Incidence of poverty among agricul-tural workers and rural population: 2004–05
Household category
Below poverty line (%)
Agricultural Labourers 46.4Cultivators (including landless) 21.5Farmers with land: all sizes
Landless (with land <0.01 ha) Sub-marginal (with land 0.01–0.4 ha) Marginal (with land 0.4–1.0 ha) Small (with land 1.0–2.0 ha) Medium and large (with land >2.0 ha)
15.222.020.218.114.8
9.8All agricultural workers 31.1All rural population 28.3
Source: NSSO Surveys on Consumer Expenditure, as estimated by Chadha (2008) and NCEUS (2009).

Livelihoods in Agriculture 17
expenditure in excess of its income, the deficit ranging from about 40 per cent in the case of landless to 20 per cent in the case of marginal and about 3 per cent in the case of small farmers (Bhalla, 2008, p. 68). Judged on the criterion of household income required to meet the poverty line expenditure (which was around ̀ 1,800 per month in 2002–03), it was only the groups of farmer households possessing more than one hectare of land which, on an average, were able to be above poverty line. In terms of expenditure, however, average for farmer households in each category exceeded the poverty line estimate.
2.2.2. IndebtednessThe deficit in income was obviously met by incurring debt. Farmers in all size groups of holding were indebted. Those in larger land-size groups, in fact, were indebted more often than the landless, marginal and small holders. According to SAS, 49 per cent of farmers were indebted in 2003; among those with no land or with up to one hectare of land, 45–46 per cent was indebted; among those with more than 2 hectares,
58 per cent had taken loans. A major dif-ference, however, lay in the source and the purpose of loans (Table 2.3). Medium and large farmers availed loan facility from institutional sources in 67 per cent of cases. But 58 per cent of loans by sub-marginal and 47 per cent by marginal landholders were taken from non-institutional sources. Banks contributed 24 and 32 per cent of loans for these two categories; they accounted for 43 per cent of loans of the farmers in the medium and large categories together. Moneylenders accounted for 32 and 31 per cent in case of sub-marginal and marginal farmers, but only 20 per cent of loans of medium and large farmers.
Purpose wise, overall, 31 per cent of all loans by farmers were for capital expend-iture and 35 per cent each for current pro- ductive expenditure and consumption expenditure. Consumption expenditure, however, accounted for 61 per cent of loans of sub-marginal and 43 per cent of loans of marginal farmers. Even in the case of the small farmers, 29 per cent of loans were taken for meeting current consumption requirements; such percentage among
Table 2.2: Average monthly income and consumption expenditure (`) per farmer household (2002–03)
Landholding category of household
Income from Totalincome Total consumption expenditureWages Cultivation Livestock Non-farm business
Landless 1,075 11 64 230 1,380 2,297Sub-marginal 973 296 94 270 1,633 2,390Marginal 720 784 112 193 1,809 2,672Small 635 1,578 102 178 2,493 3,148Semi-medium 637 2,685 57 210 3,598 3,685Medium 486 4,676 12 507 5,681 4,626Large 557 8,321 113 676 9,667 6,418All sizes 819 969 91 236 2,115 2,770
Source: NSS 59th Round, Situation Assessment Survey of Farmers, as computed by Bhalla (2008).
Table 2.3: Loans by source and purpose (%)
Farmercategory
Source Purpose
Institutional Non-institutional
CapitalCurrent
productive ConsumptionAll Banks All Money lenders
Sub-marginal 42.6 24.4 57.6 32.4 14.0 24.0 61.0Marginal 52.8 32.0 47.2 30.8 24.0 33.0 43.0Small 57.36 35.4 42.4 25.9 34.0 37.0 29.0Medium and large 66.8 42.6 33.2 20.0 41.0 40.0 20.0
Source: NSSO 59th Round on Situation Assessment Survey of Farmers, as Computed by NCEUS (2008b).

18 Trilok Singh PaPola
medium and large farmers was 20. Loans for capital expenditure formed a small percentage—14 and 24—in the case of sub-marginal and marginal farmers. Tak-ing indebtedness for meeting current con-sumption requirements as a criterion, more than one-third of the farming households suffered from vulnerability of livelihoods. But the incidence of vulnerability was, of course, much higher among the sub mar-ginal (61 per cent) and marginal (43 per cent) households.
It is obvious from the above descrip-tion that sustenance and improvement in agriculture livelihoods are issues of pri-mary importance for a large proportion of farmers. This was very clearly reflected by the response of farmers to the question whether they liked farming and would like to pursue it as their vocation asked in the Situation Assessment Survey in 2003. Forty per cent of the farmers are reported to have said that they did not like farming, mainly for the reason that it is not profitable (Bhalla, 2008, pp. 4–5).
2.2.3. Agricultural growth, livelihoods and emerging concerns
Several indicators of the economic health of farming and farmers have significantly improved over the years. Besides quad-rupling of agricultural GDP since 1950–51, as mentioned earlier, food grains produc-tion increased from 51 million tonnes in 1950–51 to 217 million tonnes in 2006–07, which mainly resulted from a tripling of food grains yield per unit of cropped area. Similarly, production of oilseeds, cotton and sugarcane has also increased more than fourfold (Planning Commission, 2008b, p. 3). Productivity per worker has increased, but rather slowly due to growth of population in farming households and inability of other sectors to productively employ surplus labour from agriculture. Yet, there has been a significant reduction in poverty among farmers as among other
groups of population. Poverty in rural areas declined from 46 per cent in 1983 to 28 per cent in 2004–05. Poverty among agricul-tural workers (both farmers and labourers together) declined from 45.5 to 31 per cent, among cultivators from 37 to 22 per cent and among agricultural labourers from 60 to 46 per cent (Chadha, 2008). Real wages of agricultural labourers have increased significantly. They rose by 2.50 per cent per annum during 1983–94 and 2.07 per cent per annum during 1994–2005 (Karan and Sakthivel, 2008).
Yet livelihood deficit as indicated by stat-istics on incomes, expenditure, indebted-ness and poverty described earlier continues to be large, particularly among the marg-inal holders, the landless and agricultural labourers. There is also a very clear regional dimension of the livelihood problem, based on agro-climatic characteristics of states and areas. In general, states with dominance of rainfed farming have much poorer, more vulnerable livelihoods among their farmers than those with major part of their farming receiving assured irrigation. There are, of course, special factors in hilly and tribal areas which restrict improvements in the incomes and livelihoods of their farmers. That the farm sector needs special atten-tion not only in terms of growth in out-put but also for ensuring sustenance and improvement in the livelihoods of those engaged in agriculture has always been recognized, but it seems to have been taken up as a special challenge by the government in recent years. Thus the first United Pro-gressive Alliance (UPA) government in-cluded ‘welfare and well-being of farmers, farm labourers and workers’ as a prominent item in its Common Minimum Programme (CMP) in 2004 and the Eleventh Five Year Plan (2007–12) not only finds a high (4 per cent) growth of agriculture ‘critical for achieving greater inclusiveness’ (Planning Commission, 2008a, p. 6) but also lays down measures in the areas of research, ex-tension, diversified allied activities, credit,

Livelihoods in Agriculture 19
and, specially, rainfed agriculture with a focus on improving livelihoods and welfare of farmers in different landholding size groups and in different agro-climatic and geographical conditions.
2.3. Agricultural policy and livelihoods: Earlier efforts and outcomes
2.3.1. Land reformsIt was not as if agriculture as a sector and farmers as a population group were not given due importance in planning and policy making in the earlier years. A faster growth of agriculture has been part of the growth perspective of all Five Years Plans. But relative priority given to it, the dom-inant objective and strategy, policies and programmes have varied from time to time. Broadly speaking, agricultural development policy in the post-Independence period could be divided into three distinctive phases (Venkateswarulu, 2008): (a) Independence to mid-1960s, (b) Green Revolution period (1966–91) and (c) post-reform (1991) period. The first phase was characterized by efforts to increase agricultural output through institutional reforms mainly consisting of land reforms and extension services through Community Development Pro- gramme. Land reforms measures consisted of (a) abolition of intermediaries, (b) tenancy reforms and (c) ceiling on landholdings. Primary objective of these reforms was to promote social and distributive justice propounded by the Congress Party and other progressive elements in the Inde-pendence movement and subsequently enshrined in the Constitution of India, but they were also seen as instruments of raising agricultural production through incentives provided by ensuring land to the tillers and improving viability of small and marginal farms and providing owner- ship to the landless.
Different land reform measures have had varying effectiveness in implementation
and outcomes. Abolition of intermediaries was reasonably successful; about 20 million tenants were freed from the clutches of zamindars and raitwars (Dandekar and Rath, 1971). Implementation of tenancy reforms, aiming at security of tenure to the tenants, was not very successful, except in some later cases such as Operation Barga in West Bengal and tenancy reforms in Karnataka and Kerala. Ceiling on land-holdings was least successful; the quantum of land declared surplus so far has been only 7.35 million hectares, far short of what was estimated and expected, of which 5.39 million hectares has been redistri-buted, rest being subject to litigation, and even the land allotted to the landless often is not actually in their possession (Planning Commission, 2008b, pp. 29–30). Thus, the land reform measures which could be seen as direct method of improving livelihoods of the poor farmers and agricultural labour-ers had only a limited success.
Plan priority and allocation to agricul-ture were on top in the First Five Year Plan after which they saw a relative decline and so did the growth of agriculture and production of food grains, so much so that the situation had to be described as ‘food crisis’ by the Ford Foundation Team invited to study the situation in 1959. The US aided Intensive Agricultural Development Programme (IADP) was introduced in 1960 providing for strengthening the supply of inputs and credit, training and extension. Shortfalls in agriculture, however, continued as production stagnated. A new policy package concentrating on application of technology inputs in the selected 20 to 25 per cent of cultivated area with assured water, and, therefore, with relatively better prospects of rapid increase in production, called Intensive Agricultural Area Pro-gramme (IAAP) was introduced in 1965 in 114 selected districts. As can be seen from its title itself, the obvious objective of the programme was to quickly increase agricultural production, particularly of

20 Trilok Singh PaPola
food grains, in order to reduce increasing dependence on imports and attain self-sufficiency in food production.
2.3.2. Green revolutionAs import of food grains increased to above 10 million tons in 1966, the need for increasing food production became more urgent and policy initiatives had to concentrate on this objective. Thus the use of biochemical and mechanical tech- nology, which signified what came to be known as Green Revolution, became im-perative even if it meant very little benefit to the small and marginal farmers, or for rain-fed areas and most crops other than wheat and rice, for which high yielding varieties (HYV) were not available. Growth of agri-cultural output accelerated particularly during the period of wider dissemination of technology, 1980–81 to 1990–91, to over 3.5 per cent per annum. Most important, India achieved self-sufficiency in food grains production. Obviously, such an out-standing performance of Indian agricul- ture did have a positive impact on the levels of living of farmers, but the benefits were highly uneven among farmers with different sizes of holdings—the larger gaining much more than the small and the marginal farm- ers and agricultural labourers gaining very little (Bhalla and Chadha, 1983). And across regions and areas—irrigated areas gain- ing most and rainfed very little. In other words, the Green Revolution technology had ‘region-specificity’, ‘crop-specificity’ and ‘class-specificity’ (Venkateswarulu, 2008) and did not contribute much to reducing the livelihood deficit of the vast number of marginal farmers, cultivators and labour- ers in rainfed areas, and of those cultivating crops other than those for which HYV seeds were available.
During the period following economic reforms, while the technological processes in Indian agriculture continued as in the Green Revolution, certain basic changes took place in trade and investment policy regime. While agriculture was initially left
‘unreformed’, import liberalization in respect of certain commodities and encourage- ment of export-orientation started from 1994. More important, however, was the decline in the ‘developmentist’ role of the state that accompanied adoption of neo-liberal policies, resulting in the decline of public investment in agriculture. It con-stituted 5 per cent of agriculture GDP during the first half and 3.5 per cent during the second half of 1980s, but only 2.4 per cent during the first half and 2 per cent during the second half of 1990s, and stagnated around that level till 2004–05 (Planning Commission, 2008b, p. 8). Partly on account of the tapering off of the impact of Green Revolution technology and partly due to the new policy regime, the period from 1997–98 to 2004–05 recorded a signifi-cant deceleration in the rate of agricultural growth (ibid., p. 4). Slowdown in the growth of output reduced per capita net per day availability of food grains from the peaks of 510 gms in 1991 and 503 in 1997 to 422 gms in 2005. Growth of employment in agriculture declined from an average annual rate of 1.38 during 1983 to 1993–94, to 0.84 during 1993–94 to 2004–05. Real daily wages of casual agricultural workers rose at the rate of around 2.5 per cent per annum during 1983–93/94, but only at a rate of around 2 per cent per annum during 1994–2005. Even in periods of relatively good performance of agriculture, liveli-hoods of a large proportion of farming population have remained precarious and vulnerable. It can, therefore, be easily surmised that the poor performance of agricultural sector during this period must have had significant adverse effect in their economic situation. The trend, however, has been reversed since 2004–05 with public investment and agricultural growth rate significantly increasing since 2005–06.
2.3.3. Minimum support prices Besides policies supporting deepening and widening of Green Revolution, through easier and, often, subsidized availability and
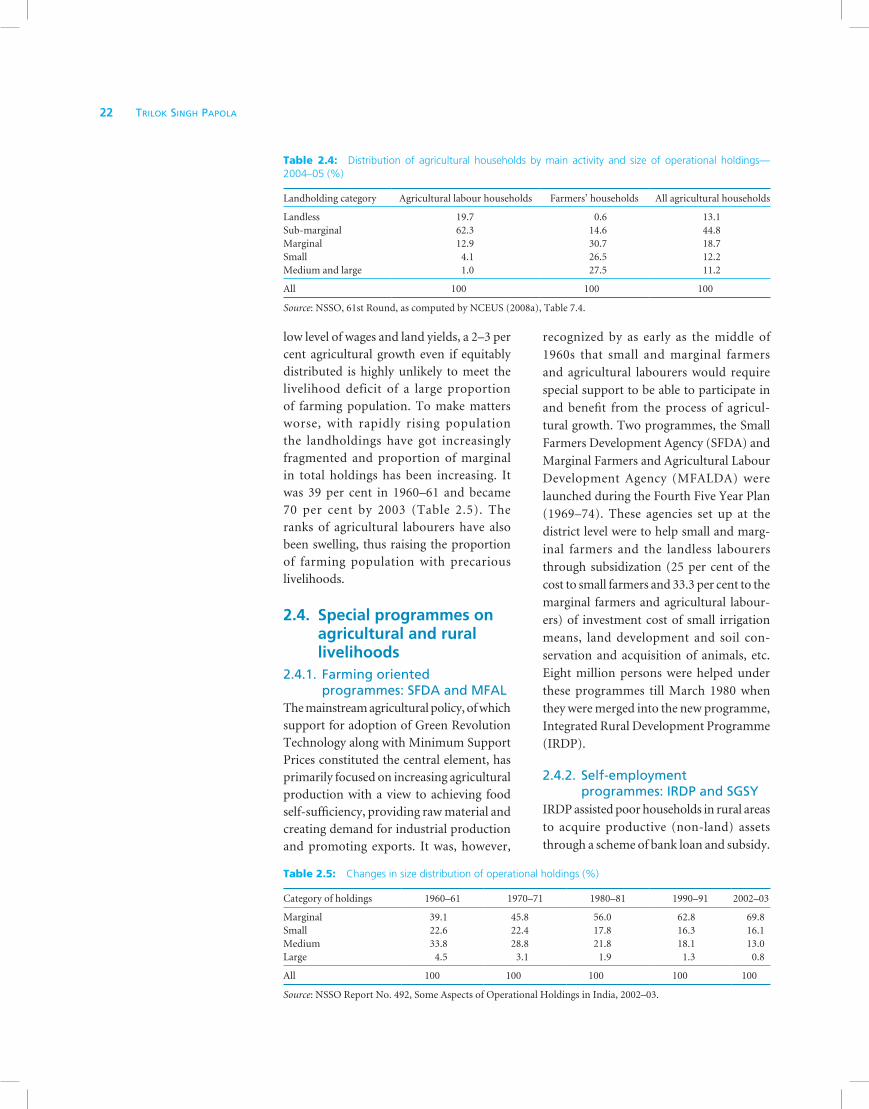
Livelihoods in Agriculture 21
access to inputs and credit, the other major plank of agricultural policy in India relates to the provision of Minimum Support Price (MSP) and public procurement of agricultural output, especially food grains. These measures aim at providing incen-tives to farmers and protecting them from market fluctuations and exploitation on one hand, and protecting consumers from price rise by distributing procured food grains at fixed prices through a public distribution system (PDS) on the other. MSP was thus an instrument of raising production, but to the extent farmers were assured of remunerative minimum prices of their produce, it also contributed to en- suring livelihoods for them. Introduced in 1965, with the appointment of the first Agricultural Prices Commission (APC), now known as Commission on Agricultural Costs and Prices (CACP), MSP policy has undergone intense debate and significant changes, particularly with the initiation of economic liberalization where the price policy has also to keep in view the global price trends and foreign trade in agricul- tural products. The discussion here is con-fined only to the implications and impact of MSP on livelihoods of farmers.
In general, MSP policy does not seem to have made any significant positive im- pact on the economic status of the farming groups for which livelihoods are a concern. In the first instance, only a small proportion of farmers seem to know about it: accord- ing to the National Sample Survey Or-ganization (NSSO) Situation Assessment Survey (2003), only 29 per cent of farmers were aware of MSP, and only 19 per cent knew about procurement agencies. Among marginal and small farmers only 26 per cent were aware of MSP, while 41 per cent of medium and large farmers knew about it. Among different states, farmers in those with higher agricultural yield and surplus production show greater awareness about MSP than those in agriculturally less-developed states. Thus, while 63 per cent of farmers in Punjab, 62 per cent in Haryana
and 48 per cent in Tamil Nadu were aware of MSP, only 11 per cent in Rajasthan, 12 per cent in Orissa and Jharkhand and 19 per cent in Bihar knew about it (NCEUS, 2008b, Table A-6). It is also found that the relative price parity resulting from MSPs fixed for different crops from time to time has resulted in a raw deal for the resource poor farmers and underdeveloped regions (Deshpande, 2008, p. 139).
From the above capsule account of the central planks of policy approach to agri-cultural development in India, it is clear that improvement in livelihoods of farm-ing population was taken for granted as an inevitable outcome, but was not explicitly considered to form a central objective, of agricultural growth. It is interesting to note that the same was true of the employment and poverty reduction which are, of course, directly related to livelihoods. Logically, the proposition that growth of agriculture would lead to improvements in the liveli-hoods of the people engaged in agriculture cannot be questioned. Whether it holds in reality, however, depends on the rate, nature and structure of growth on one hand, and endowment of the different strata of farm-ing people to be able to participate in growth on the other. To the extent livelihoods in the absolute sense are a matter of concern for majority of population, the rate at which growth takes place itself is vitally import-ant. From that viewpoint, if livelihoods of all agricultural labourers, marginal and small farmers, together constituting above 90 per cent, are precarious and vulnerable, a relatively slow growth (about 2.5 per cent per annum) that Indian agriculture has recorded during the last over five decades since 1951–52 in itself is the major reason for the continuing livelihood deficit of Indian farming population. But given the fact that about 36 per cent of agricultural workers are agricultural labourers primarily depending on wages, and among farmers an overwhelming majority consist of marginal and small holders (Table 2.4) and given the

22 Trilok Singh PaPola
low level of wages and land yields, a 2–3 per cent agricultural growth even if equitably distributed is highly unlikely to meet the livelihood deficit of a large proportion of farming population. To make matters worse, with rapidly rising population the landholdings have got increasingly fragmented and proportion of marginal in total holdings has been increasing. It was 39 per cent in 1960–61 and became 70 per cent by 2003 (Table 2.5). The ranks of agricultural labourers have also been swelling, thus raising the proportion of farming population with precarious livelihoods.
2.4. Special programmes on agricultural and rural livelihoods
2.4.1. Farming oriented programmes: SFDA and MFAL
The mainstream agricultural policy, of which support for adoption of Green Revolution Technology along with Minimum Support Prices constituted the central element, has primarily focused on increasing agricultural production with a view to achieving food self-sufficiency, providing raw material and creating demand for industrial production and promoting exports. It was, however,
recognized by as early as the middle of
1960s that small and marginal farmers
and agricultural labourers would require
special support to be able to participate in
and benefit from the process of agricul-
tural growth. Two programmes, the Small
Farmers Development Agency (SFDA) and
Marginal Farmers and Agricultural Labour
Development Agency (MFALDA) were
launched during the Fourth Five Year Plan
(1969–74). These agencies set up at the
district level were to help small and marg-
inal farmers and the landless labourers
through subsidization (25 per cent of the
cost to small farmers and 33.3 per cent to the
marginal farmers and agricultural labour-
ers) of investment cost of small irrigation
means, land development and soil con-
servation and acquisition of animals, etc.
Eight million persons were helped under
these programmes till March 1980 when
they were merged into the new programme,
Integrated Rural Development Programme
(IRDP).
2.4.2. Self-employment programmes: IRDP and SGSY
IRDP assisted poor households in rural areas
to acquire productive (non-land) assets
through a scheme of bank loan and subsidy.
Table 2.4: Distribution of agricultural households by main activity and size of operational holdings—2004–05 (%)
Landholding category Agricultural labour households Farmers’ households All agricultural households
Landless 19.7 0.6 13.1Sub-marginal 62.3 14.6 44.8Marginal 12.9 30.7 18.7Small 4.1 26.5 12.2Medium and large 1.0 27.5 11.2
All 100 100 100
Source: NSSO, 61st Round, as computed by NCEUS (2008a), Table 7.4.
Table 2.5: Changes in size distribution of operational holdings (%)
Category of holdings 1960–61 1970–71 1980–81 1990–91 2002–03
Marginal 39.1 45.8 56.0 62.8 69.8Small 22.6 22.4 17.8 16.3 16.1Medium 33.8 28.8 21.8 18.1 13.0Large 4.5 3.1 1.9 1.3 0.8
All 100 100 100 100 100
Source: NSSO Report No. 492, Some Aspects of Operational Holdings in India, 2002–03.

Livelihoods in Agriculture 23
During its life, that is, 1978–79/1998–99, over 54 million households were assisted under the programme, about ̀ 230 billion of credit was mobilized and another ̀ 110 billion was provided as subsidy (Planning Commis- sion, 2001). IRDP has been extensively evaluated. Its contribution to income sup-plementation of assisted households has been significant though not many (only about 15 per cent) have had an increase in income sufficient to cross the poverty line (Papola, 2008). Those closer to ‘poverty line’ have obviously crossed it more often than those far below it. According to a study in Andhra Pradesh, where the programmes seems to have done much better than aver-age for the country as a whole, 88 per cent of the ‘moderately poor’, but less than 50 per cent of the ‘very poor’, crossed poverty line after receiving IRDP assistance. But there was significant upward mobility among the poor: 75 per cent of the ‘very poor’ went up to the category of ‘moderately poor’; 17 per cent of the ‘very very poor’ also rose to the status of ‘moderately poor’ (Dev and Rao, 2002). IRDP could, on the whole, be regarded as a reasonably successful liveli-hood programme based on the subsidized promotion of self-employment among the poor households. But, even though it was titled as ‘Integrated’, it was, in fact, not at all integrated with the programmes for pro- motion of services and infrastructure essen-tial for sustaining production and carrying out remunerative sale of the produce of the assisted households. The scale of assistance per household was rather too small to start and sustain a business enterprise. The average investment—bank loan plus subsidy—per assisted household was around ` 9,000 during 1992–95 (Papola and Sharma, 2003).
IRDP was rep laced in 1999 by Swarnajayanti Gram Swarozgar Yojana (SGSY), integrating all self-employment programmes and focusing on microenter-prise development with emphasis on social mobilization through formation of Self Help Groups (SHGs). It also incorporated
supplementary measures such as planning of activity clusters, infrastructure build up, technology support and market linkages that were found lacking in IRDP. Till 2009–10, 3.67 million SHGs were formed, over 10 million SHG swarozgaris and about 4 million individual swarozgaris were assisted with about ̀ 101 billion subsidy and ` 208 billion bank credit. Average invest-ment (credit plus subsidy) per swarozgari worked out to ̀ 32,008 in 2009–10 (MoRD, 2010a).
Significant progress was achieved in the formation of SHGs but only about 23 per cent of them were able to take up eco- nomic activities. The Committee on Credit Related Issues under SGSY (Radhakrishna Committee) appointed by the Ministry of Rural Development found that the pro-gramme has fallen short in meeting its credit targets, and utilization of govern- ment funds has fallen short of their avail-ability. Part of the reason may lie in the limited capacity of the poor to take up self-employment activities. The Committee found very little was done towards strength-ening their capacity, though the programme had provision for training and capacity building. Similar observation was made by the Mid-Term Appraisal of the Tenth Five Year Plan. Cluster approach was also a non-starter and line departments of state governments mostly failed in providing non-credit inputs to the swarozgaris. The performance of the programme was par- ticularly unsatisfactory in states with higher incidence of poverty, due to the poor deli-very system (MoRD, 2007).
The most intractable problem in a self-employment programme like SGSY is that of identifying and supporting economic activities that can be viably run by the poor in underdeveloped rural areas. Collective action through SHGs was expected to be of help in establishing linkages and develop-ing common facilities. But as Radhakrishna Committee observed, the poor performance of SGSY is due to poor quality of SHGs. As in the case of IRDP, investment per swarozgari

24 Trilok Singh PaPola
continues to be low, even though it is much improved at ` 32,000 in 2009–10 (MoRD, 2010a). It still compares unfavourably, for example, with the figure of ` 100,000 adjudged to be the minimum investment required in self-employment enterprise of a household in Andhra Pradesh to generate an above poverty line income (Planning Commission, 2006). Finding productive activities with prospects of viability that can absorb larger amount of investment itself is a difficult task in backward rural areas. More important, however, is the need to integrate the economy of the poor with the mainstream economy so as to lend it sustained viability and upward mobility.
Even with the best of efforts, however, it would not be practical to project the self- employment enterprise supported under SGSY alone as the activity to sustain the livelihood of a rural household. With the best performance of the programme in Andhra Pradesh and Kerala, average monthly income per swarozgari from the assisted activity is found to be as low as ̀ 2,000 (MoRD, 2007). Households need to and actually derive income from multiple sources including from wage labour. Self-employment under SGSY alone cannot, therefore, be treated as the means of poverty alleviation. The Committee on Credit Related Issues of SGSY, therefore, recommended restructur-ing of the programme and combining it with skill-based wage employment.
2.4.3. National Rural Livelihood Mission: A new initiative
Accepting the recommendation of the above Committee, the Ministry of Rural Development has decided to redesign and restructure the SGSY into National Rural Livelihood Mission (NRLM). The Mis-sion envisages promotion of ‘diversified and gainful self-employment and wage employment opportunities’ with the ob-jective of reducing poverty among the rural Below Poverty Line (BPL) households. Already under operationalization after a cabinet decision in June 2010, the mission ‘will
have a multipronged approach to strengthen livelihoods of the rural poor by promoting SHGs, improving existing occupations, providing skill development and place-ment’ (MoRD, 2010b [press release, 25 July 2010]). Targets have been set for ‘outputs’, ‘outcomes’ concerning formation and sup-port to SHGs, SHG initiated enterprises, training of BPL youth, placement sup- port, etc. for the remaining period of the Eleventh Plan and for the XII Plan (2012–17). Mission activities are to be implemented on a decentralized basis through District Rural Development Agencies (DRDAs) to whom funds will be directly transferred to meet expenditure on subsidy to SHGs, infrastructure and marketing, corpus for federations of SHGs, interest subsidy, train-ing and capacity building and engagement of Non Government Organization (NGO) facilitators.
NRLM is seen as an important initiative towards an integrated approach to directly tackle the livelihood problem of the rural poor. It recognizes that the promotion of self-employment alone cannot be the solu-tion for all households and all persons. While the capacity of households to undertake self-employment–based enterprises has to be improved through training and infra- structure development, workers belonging to these households also need to be equipped with skills to take up wage and salary-based employment. For this purpose, the NRLM is proposed to be linked with the National Skill Development Mission (NSDM). Thus, while it envisages setting up of the Rural Self Employment Train- ing Institutes (RSETI) on the one hand, training in employable skills by utilizing existing training infrastructure and master craftsmen forms another important com-ponent of the skill development initiative under the Mission. It is also hoped that with steps to improve access to credit from organized banking system and enhance-ment of capital subsidy limit to individual swarozgaris to ` 15,000 (general) and ` 20,000 (SC/ST) and to ` 2.5 lakh for

Livelihoods in Agriculture 25
SHG for promoting employment-oriented income generating activities will not only motivate more BPL households to take up self-employment ventures but also lead to the upscaling of investment size per enterprise to a viable and sustainable level.
2.4.4. Wage employment programmes: Supplementation for current livelihood sustenance
By the middle of 1970s, when detailed information regarding consumption expenditure and employment started becoming available from the regular com-prehensive surveys conducted by NSSO, it became possible to gauge poverty and unemployment among rural households. It was observed that a large proportion of poor households engaged in farming on small and marginal holdings and on farm and non-farm labour do not have gainful employment for a considerable time in a year. Providing supplementary wage employment to the members of such households was, therefore, seen as a way of supplementing their livelihoods and reducing current poverty. Drawing upon the long experience of labour-intensive public works for relief in natural calamities like famines, the government devised a National Rural Employment Programme (NREP) in 1980, as a poverty alleviation programme with the twin objective of pro- viding wage income to the rural poor and creation of rural infrastructure. The pro- gramme was rechristened as Jawahar Rozgar Yojana (JRY) in 1989–90 when a separ-ate concurrent programme called Rural Labour Employment Guarantee Programme (RLEGP) was also initiated specifically targeted to the landless labour households, guaranteeing them 100 days of employment per year. Employment Assurance Scheme (EAS) introduced in 1983 aimed at similar guarantee in selected backward and poor areas. All wage-employment programmes were integrated into Sampoorna Grameen Rozgar Yojana (SGRY) in 2001. Some states
also have similar programmes, the most notable among them being the Maharashtra Employment Guarantee Scheme (MEGS) started in mid-1970s, guaranteeing manual work on demand on a statutory basis.
All these programmes had building of rural infrastructure as one of their object-ives, along with the provision of income to rural poor through wages in employment in public works. Sometimes the former was listed as ‘secondary’ and the latter as ‘primary’ objective. In practice also, these programmes did not contribute much to the creation of durable infrastructure or productive assets. But they were certainly effective in providing supplementary in-come to the rural poor and thus helping them in sustaining their livelihoods. For example, JRY and EAS together generated equivalent of 4.4 million person years of employment during (1998–99) making 1.5 per cent of total labour force per- son years in that year. As a percentage of labour force of the poor households only, it would make 4.5 per cent which is more than half of the rate of person days of unemployment estimated at 7 per cent in that year (Radhakrishna and Ray, 2005). On the whole, however, all these programmes, including SGRY which integrated all wage- employment programmes in 2001, were able to meet only a small part of the require-ment of supplementary employment, and were therefore able to make only a small contribution to the household incomes of rural households, in general. In the case of MEGS which provided employment on demand on the basis of a statutory guarantee, however, it is observed that programmes under it succeeded in mitigating hunger and also preventing rural wages from falling to very low levels (Acharya, 1990).
It is with the objective of making a sig-nificant impact on the livelihoods of the rural poor by providing them wage employment to the maximum possible extent of their requirements that the United Progres- sive Alliance (UPA) government, assuming

26 Trilok Singh PaPola
power in 2004, enacted a National Rural Employment Guarantee Act (NREGA), now rechristened as Mahatma Gandhi Rural Employment Guarantee Act (MGNREGA), in 2005, providing for legally guaranteed employment of 100 days to every house- hold on demand in rural areas. Imple-mented in phases, it now covers all rural districts of the country. It is the largest liveli-hood protection programme anywhere in the world. An amount of ` 380 billion of pub- lic funds were spent on this programme in 2009–10, of which about 68 per cent were paid as wages to workers participating in the programme. Over 2.8 billion person days of employment were provided to about 53 million households at an average of 54 person days per household (MoRD, 2010b).
Taking ` 100 as the average daily wage paid for work in the programmes under the Act (noting that average for the year 2006–07, 2007–08 and 2008–09 worked out to be ` 54.00, ` 75.00 and ` 84.00, respectively, [Tankha, 2009] and the aver-age of minimum wages fixed for unskilled workers in agriculture in different states for the year 2007 worked out to ` 114 [Labour Bureau, 2010]), a participating household earned an average of ` 5,400 from work in the projects under MGNREGA. It can mean a substantial contribution to the house-hold incomes, particularly of those with below poverty line income and, therefore, can bring about a significant improve- ment in the livelihoods of the rural poor. It is also observed that the average number of person days of employment provided to a household has been increasing. It was 42 in 2007–08, 48 in 2008–09 and 54 in 2009–10, and percentage of households having com-pleted 100 days of work also increased from 3.5 million in 2007–08, to 6.5 million in 2008–09 and 7.1 million in 2009–10. With continuation of this trend, contribution of MGNREGA to the livelihoods of the rural poor will gain increasing significance over the years.
2.4.5 Area development programmes
Self-employment and wage-employment programmes both aim at livelihood promo-tion but their suitability and effectiveness vary among areas as well as households with different resource endowments. There have, therefore, been attempts from time to time to develop programmes that are area specific and focused on specific farmer groups. Mention has already been made earlier of the programmes in the latter category targeting small and marginal farmers and agricultural labourers. In the former category, Drought Prone Area Pro- gramme (DPAP) has been the earliest area development programme launched in 1973–74. The basic objective of the pro-gramme was to minimize the adverse effects of drought on the production of crops and livestock, and productivity of land, water and human resources, ultim-ately leading to ‘drought proofing’ of the affected areas. Though focused on the man- agement and augmentation of physical resources, the programme aimed at overall development and improving the liveli-hoods of the poor and disadvantaged who inhabited these areas.
DPAP was found to have succeeded in creating durable public assets, but its overall impact in containing the adverse impact of drought was not found to be significant. Hanumantha Rao Committee appointed in 1993 to review the programme attributed its poor performance, inter alia, to its geographically and activity-wise highly dispersed and unintegrated nature. Fol- lowing recommendations of the Committee, DPAP was restructured focusing on water-shed approach. The three programmes, DPAP, Watershed Development Programme and Wasteland Development Programme were made to operate on the same guide-lines, thus leading to a more integrated ap-proach. The three programmes have now been consolidated into a single programme, namely, Integrated Watershed Management

Livelihoods in Agriculture 27
Programme (IWMP) following the emphasis laid in the Eleventh Plan on developing concerted and integrated action plans for agricultural development in rainfed areas (MoRD, 2010a).
2.5. Eleventh plan and livelihoods in agriculture: Some highlights of the new focus
Midterm Appraisal (MTA) of the Tenth Plan and the National Commission on Farmers (NCF) had raised serious concerns on the slowdown in agricultural growth, in gen-eral, and the distress experienced by small and marginal farmers and those in rainfed areas, in particular. The National Policy for Farmers (2007) and the Eleventh Plan, therefore, focused on both these aspects. As noted in the beginning of this chapter, Eleventh Five Year Plan for the first time brings livelihoods into focus in relation to the growth of agricultural sector. It notes with concern some recent trends that have adverse implications for food security and farmers’ incomes and poverty. Besides a slowdown in growth, the Plan mentions a number of other developments indicat-ing inequities and distress and threats to livelihoods (Planning Commission, 2008b, p. 4). As a first step towards restor-ing dynamism to agricultural sector, the plan asks for increase in public investment in agriculture from 3 per cent of agricul-tural GDP to 4 per cent. Along with several measures for raising productivity of re-source use, it is expected to ensure a 4 per cent GDP growth in agriculture. Such a growth is considered necessary, but not sufficient to bring about significant improvements in the livelihoods of agricultural population. For that, and ‘for growth to be at all inclusive, the agricultural strategy must focus on 85 per cent of farmers who are small and marginal, increasingly female, and who find it diffi- cult to access inputs, credit and extension or to market their output’ (ibid., p. 8). The Plan
also identifies specific factors causing low productivity by agro-climatic regions and calls for regionally differentiated strategy, particularly in respect of rainfed areas.
The National Agricultural Development Programme (NADP) or Rashtriya Krishi Vikas Yojana (RKVY), which was launched on the recommendation of the National Development Council (NDC) in 2007, is an important initiative towards decentraliza-tion of planning of agricultural develop-ment at the state and district levels keeping in view the agro-climatic conditions, natural resource endowments and local needs. It incentivizes the process of decentralized planning in the states by providing them central assistance to undertake a large num- ber of planning and development activ-ities in agriculture and allied sectors. This scheme combined with another central assistance scheme, the Macro-Management of Agriculture Scheme (MMAS), with spe-cial focus on development of degraded land and soils offers considerable flexibility to states to take care of regional conditions and priorities and, therefore, should provide sufficient scope to states to promote faster growth of agriculture in poorer areas, so as to make it more inclusive.
Within the national programmes for increasing production and productivity, provisions are made to specially look after the needs of small and marginal farmers and poor and remote and inaccessible areas. Subsidy rates in programmes like Agricul-tural Technology Management Agency (ATMA) or supply of agricultural equip-ment under MMAS are higher for small and marginal farmers. A separate Technology Mission for Integrated Development of Horticulture has been launched for North Eastern states, Sikkim, Jammu and Kashmir, Himachal Pradesh and Uttarakhand.
What is most significant in relation to aspects of equity, inclusiveness and liveli-hood security in the context of agricultural development in the Eleventh Plan is the inclusion of a special focus on the ‘social

28 Trilok Singh PaPola
context’ (ibid., p. 28), which brings on the agenda the issues of land reforms, protection of rights in land of tribal people, security of homestead rights and tenancy reforms, which have been generally neglected in plan programmes for many years in the past. It proposes modernization of management of land records by initiating a central scheme, National Land Records Management Programme, in order to ensure security of land rights which is of crucial importance particularly for the small and marginal holders. Noting that area declared surplus under land ceiling legislations has been very small and land distributed still smaller and often not in possession of the allottees, it is proposed to expedite settlement of the disputes and problems that have held up distribution of the remaining surplus land and to take up special measures to ensure that the distributed land is given to the allottees. It is also noted that the Government land illegally encroached by private individuals should be identified and distributed to the landless persons. Expeditious preparation and updating of land records and complete ban on all forms of transfers of tribal land are some of the measures suggested to prevent land alienation of tribal people. Legalization of tenancy in a ‘limited’ manner is proposed to provide security to the tenants for a contractual period. Howsoever limited in terms of their potential impact, these ideas nevertheless reflect a point of departure from production-centred strategies to the neglect of equity, inclusiveness and liveli-hood security followed most of the time in recent decades.
2.6. Way ahead: Making agricultural growth more inclusive and looking beyond agriculture
The Eleventh Five Year Plan, no doubt, lays emphasis on inclusive growth of agriculture, but falls short of outlining a comprehensive strategy and programme for its operationalization. Drawing upon the
ideas in the Plan document, the National Policy for Farmers (MoA, 2007) and a Special Programme for Marginal and Small Farm-ers prepared by the National Commission for Enterprises in the Unorganized Sector (NCEUS, 2008b) and other studies and reports, an attempt is made here to outline the major elements of a strategy for inclusive growth of agriculture and augmentation of livelihood base of farming population, specially of the small and marginal farmers and the landless.
First, a high rate of growth of agriculture is vital for any strategy for inclusive growth. A rate of growth which does not signifi-cantly exceed the rate of population growth in agriculture households is not likely to be able to bring in benefits to the poor among the farmers and the agricultural labourers. Therefore, achievement of the growth rate of 4 per cent, as targeted in the Eleventh Plan, on a sustained basis would be necessary and for that purpose invest-ment in agriculture needs to be increased, specially public investment, which would need to be significantly stepped up to about 5 per cent of the agricultural GDP.
Second, agricultural growth would need to be diversified both geographically and crop-wise, in order that poorer regions and states and crops and other activities on which the poorer farmers mostly depend for their livelihoods are significant contributors to it. To a certain extent, this is happening in so far as the rates of agricultural growth of several agriculturally or otherwise poorer states and growth of output in activities like horticulture and fishery have been significantly higher than the average in recent years. Policy stimulants that have con-tributed to these trends need to be further strengthened. Smaller states, particularly those with remote and relatively inacces-sible terrain, need to identify their niche activities and products and concentrate on their specialised growth (e.g., large cardamom in Sikkim; Papola, 2005).
Third, the most important element of a strategy for inclusive and livelihood-centred

Livelihoods in Agriculture 29
agricultural growth has to focus on the small and marginal farmers. The Eleventh Plan squarely recognizes this and also asks for some special measures. To a certain extent, the need for special attention to those groups of farmers can be taken care of by diversify-ing agricultural growth as suggested earlier. But much more, in the form of a specially targeted comprehensive programme, as proposed by the NCEUS, is required to ef-fectively tackle the problems of livelihoods of the small and marginal farmers. Such a programme would have to adopt an area-cum-farmers’ groups approach. Organizing them into farmers’ societies, cooperatives or any other collective form to pool resources for production, to access common services and most importantly, to collectively mar-ket their produce is likely to be highly beneficial as has been demonstrated in sev-eral instances such as under Rithu Mithra Groups (RMGs) and Community Managed Sustained Agriculture (CMSA) in Andhra Pradesh, ‘Kudumbashree’ in Kerala and Self Employed Women’s Association (SEWA) in Gujarat and the relatively better function- ing cooperative societies in different parts of the country. These experiments need to be replicated elsewhere and new forms like the ‘producers’ companies adopted wherever feasible. Formation of organizations of small and marginal farmers should also facilitate their better access to credit, which has been found to be highly limited. It would also be necessary, as recommended by NCEUS, to fix a 10 per cent quota, out of the presently assigned 18 per cent to agriculture, to ensure actual availability of credit to small and marginal farmers as per requirements.
Fourth, a strategy for promotion of liveli-hoods of farming population cannot be con-fined to measures to improve incomes of cultivators alone. Almost one-third of those engaged in agriculture consist of agricultural labourers, deriving all or major part of their income from wage labour. They do not get work for all days round the year and get very low wages when employed. Agricultural labourers were unemployed for 16 per cent
of their labour force person days as against 8 per cent of all rural workers in 2004–05. Average days of employment of agricultural labourers were estimated to be 209 and aver-age daily wages ` 40. Though minimum wages for agricultural labourers are fixed by state governments, most of them get much less than the rate fixed for them. In 2004–05, 68 per cent of agricultural wage workers received less than the statutorily fixed min-imum wages. During 2006–07, average of the officially fixed minimum daily wages for unskilled work in agriculture in different states worked out to be ̀ 114, while actually paid wages averaged to ` 50. A faster and diversified agricultural growth is expected to raise both employment and wages of agricultural labourers. MGNREGA is also assessed to have a positive impact on wages in rural areas (Dreze and Khera, 2009). But a stricter compliance of minimum wage pro- vision cannot also be ignored.
Fifth, it is important to recognize and facilitate increasing importance of the non-farm activities for raising incomes and livelihoods of the farmer households. According to the Situation Assessment Sur-vey, only half the income of farmer house- holds was derived from farming, including cultivation and animal husbandry, rest came from non-farm business and wages including that from non-farm labour. Income from farming constituted only a much smaller part of total household in- come of marginal farmers (Table 2.2). Devel- opment of non-farm activities is important on two counts; one, to augment incomes of the farmer households through non-farm business and wages; and two, to provide alternative employment and income oppor-tunities to those not adequately productively employed in farming. It must be recognized that the magnitude of the workers in the latter category is large and needs to be trans- ferred to non-farm activities. In fact, the failure to shift labour force from agricul- ture with its shrinking share in GDP is the main reason for the large and increasing livelihood deficit among agricultural house-holds. Rapid growth of non-farm activities,
30 Trilok Singh PaPola
especially in rural areas, must, therefore, form an important part of the strategy for improving livelihoods of agricultural population. Rural non-farm activities have shown good potential for growth in recent years and well-directed policy interven-tions in the spheres of land use, credit and marketing can make them grow much faster.
Lastly, a word about the relevance of MGNREGA for livelihoods in agriculture is in order. As already mentioned, employ-ment in the programmes under the Act is making a significant contribution to the incomes of rural households. Though the average days of work provided to a household fall much short of the ceiling of 100 days in a year, removing this limit will prove beneficial to landless labourer and marginal farmer households, whose requirements of employment are much larger than those of large, medium and even small farmers. But, it must, however, be recognized that the programme aims at protection of current livelihoods and reducing current poverty, and not at build-ing the capacity of households to sustain and improve their livelihoods. Given the magnitude of livelihood deficit among the rural households, it would need to con- tinue perhaps on an increasing scale for quite some time to come. But the possibility of utilizing it for building capacity of areas and households to generate productive employment on a sustained basis by build- ing public assets and improving the pro-ductivity of private assets, particularly, land of the poorer households, however, needs to be seriously and effectively explored. In order to attain this objective, it is necessary to have convergence of other programmes of rural development with those under MGNREGA, a subject that is dealt with in the next chapter.
ReferencesAcharya, Sarthi. (1990). Maharashtra Employment
Guarantee Scheme: A Study of Labour Market Intervention. New Delhi: ILO-ARTEP.
Bhalla, G.S. (2008). Condition of Indian Peasantry.
New Delhi: National Book Trust.
Bhalla, G.S. and G.K. Chadha. (1983). Green Revolution
and the Small Peasant. New Delhi: Concept
Publishing Company.
Chadha, G.K. (2008). ‘Employment and Poverty
in Rural India: Which Way to Go Now’, ILO
Asia-Pacific Working Paper Series. New Delhi:
ILO-SRO.
Dandekar, V.M. and Neelkantha Rath. (1971). ‘Poverty
in India’, Economic and Political Weekly, 6(1):
25–48, 9 January.
Deshpande, R.S. (2008). ‘Price Policy and Minimum
Support Price in Changing Agricultural Economy’,
in Sankar Kumar Bhaumik (ed.), Reforming Indian
Agriculture Towards Employment Generation
and Poverty Reduction (Essays in Honour of G.K.
Chadha). New Delhi: SAGE.
Dev, Mahendra and Padmanabha Rao. (2002). Pov-
erty Alleviation Programmes in Andhra Pradesh.
Hyderabad: Centre for Economic and Social
Studies.
Dreze, Jean and Reetika Khera. (2009). ‘The Battle
for Employment Guarantee’, Frontline, 6(1),
January 2009.
Karan, Anup K. and Selvaraj Sakthivel. (2008). ‘Trends
in Wages and Earnings in India: Increasing Wage,
Differentials in a Segmented Labour Market’,
ILO-Pacific Working Paper Series. New Delhi:
ILO-SRO.
Labour Bureau. (2010). Report of the Working of the
Minimum Wages Act, 1948 (For the Year 2007).
Shimla: Ministry of Labour, Government of India,
Labour Bureau.
Ministry of Agriculture (MoA). (2007). National Policy
for Farmers. New Delhi: Government of India.
Ministry of Finance (MoF). (2010). Economic Survey,
2009–10. New Delhi: Government of India,
Department of Economic Affairs.
Ministry of Rural Development (MoRD). (2007).
Report of the Committee on Credit Related Issues
under SGSY (Radhakrishna Committee). New
Delhi: Government of India.
——— (2010a). Annual Report, 2009–10. New Delhi:
Government of India.
——— (2010b). ‘Rural Employment Guarantee Act
(NREGA)—NAREGA (Outcomes) for the
Financial year 2009–2010’. Available online
at http://nrega.nic.in-National. Accessed on
31 July 2010.
National Commission for Enterprises in the Un-
organised Sector (NCEUS), (Chairman: Arjun K.
Sengupta). (2008a). Report on Conditions of Work
and Promotion of Livelihoods in the Unorganised
Sector. New Delhi: Academic Foundation.
——— (2008b). A Special Programme for Marginal and
Small Farmers. New Delhi: NCEUS.
——— (2009). The Challenge of Employment in India:
An Informal Economy Perspective. New Delhi:
NCEUS.

Livelihoods in Agriculture 31
Papola, T.S. (2005). Development and Livelihood in
Sikkim: Towards a Comparative Advantage Based
Strategy. New Delhi: UNDP, HDRC.
——— (2008). ‘Economic Growth, Poverty
Reduction and Role of Special Programmes’, in
N. Jayaram and R.S. Despande (eds), Footprints
of Development and Change (Essays in Memory
of Professor V.K.R.V. Rao Commemorat-
ing his birth centenary). New Delhi: Academic
Foundation.
Papola, T.S. and Alakh N. Sharma. (2003). ‘Globalisa-
tion and Social Exclusion in India: Evolving an
Inclusionary Policy Framework’, paper prepared
for the World Commission on Social Dimension
of Globalisation. Geneva: International Labour
Office.
Planning Commission. (2001). Report of the Working
Group on Poverty Alleviation Programmes for the
Tenth Five Year Plan (2002–2007). New Delhi:
Government of India.
——— (2006). Report of the Working Group on Poverty
Alleviation Programmes for the Eleventh Five Year
Plan. New Delhi: Government of India.
Planning Commission. (2008a). Eleventh Five Year
Plan 2007–2012. Volume I: Inclusive Growth. New
Delhi: Oxford University Press.
——— (2008b). Eleventh Five Year Plan 2007–2012
Volume III: Agriculture, Rural Development,
Industry, Services and Physical Infrastructure. New
Delhi: Oxfrod University Press.
Radhakrishna, R. and Shovan Ray (eds). (2005).
Handbook of Poverty in India. New Delhi: Oxford
University Press.
Tankha, Ajay. (2009). ‘NREGS and Livelihoods: A
Review of Issues and Outcomes’, in Sankar
Datta and Vipin Sharma (eds), State of India’s
Livelihoods. New Delhi: Access Development
Services.
Venkateswarulu, A. (2008). ‘Agricultural Development
in India Policies and Performance’, in Sankar
Kumar Bhaumik (ed.), Reforming Indian
Agriculture Towards Employment Generation
and Poverty Reduction (Essays in Honour of G.K.
Chadha). New Delhi: SAGE.

32 Trilok Singh PaPola

Chapter 3
Greening India through MGnreGa—Convergent
action for Benefits beyond employment
GenerationSuryamani roul
3.1. Introduction
In recent years, Government of India (GoI) has made substantial public investments for strengthening the rural economy and livelihoods base of the poor, especially marginalized groups like Scheduled Castes (SCs)/Scheduled Tribes (STs) and women. The Government has also accelerated the pace of poverty reduction strategies by allocating higher amount of resources, setting targets with quantifiable deliverables and putting systems in place for monitoring programmes for effective and efficient functioning. The importance and seriousness of these pol-icies and resource commitments towards poverty reduction and inclusive growth pro-cesses are best reflected in the enactment of a single legislation—the National Rural Employment Guarantee Act (NREGA) notified on 7 September 2005, renamed as Mahatma Gandhi National Rural Em-ployment Guarantee Act (MGNREGA)1 since October 2009. MGNREGA aims at
enhancing livelihoods security by providing at least 100 days of guaranteed wage employ-ment in a financial year to every household whose adult members volunteer to do unskilled manual work.
Implemented from February 2006, the Act covered 200 most poor and backward districts in its first phase. It was implemented in an additional 130 districts in Phase II during 2007–08. As per the initial target, NREGA was planned to be expanded countrywide in five years. To bring the whole nation under its safety net programme as early as possible and keeping in view the demand, the scheme was extended in Phase III, to the remaining 274 rural districts, from 1 April 2008. In these districts, preexisting wage employment programmes, the Na-tional Food for Work Programme (NFFWP) and the Sampoorna Grameen Rozgar Yojana (SGRY) were merged with NREGA.
MGNREGA, with its ‘rights based’ approach is a paradigm shift from most other earlier Government programmes and schemes. The Act has become a signi-ficant instrument for strengthening grass root level community participation and decentralized governance system by giving a pivotal role to Panchayat Raj Institu-tions (PRI) in planning, monitoring and
1 In this paper; NREGA, MGNREGA, NREGP and NREGS have been used interchangeably. The NREG Act was renamed as MGNREGA in 2009. The Act also makes it mandatory for states to formulate Schemes and Programmes, thus adding S and P for usage by many.

34 Suryamani roul
implementation, and towards regeneration
of natural resources. The Act includes a
unique feature that guarantees time-bound
employment and wage payment within
15 days, incentive–disincentive structure
to the State Governments for providing
employment, as 90 per cent of the cost
for employment provided is borne by the
Centre, whereas unemployment allowance
is borne by the state. It emphasises on
labour-intensive works prohibiting use
of contractors and machinery. The Act
also mandates 33 per cent participation
for women, which has a direct bearing on
women’s socio-economic empowerment.
The most significant feature of MGNREGA
lies in making the Government legally
accountable for providing employment to
those who ask.
Ministry of Rural Development (MoRD),
GoI implements this flagship programme.
The Act makes it mandatory for the states
to formulate State Schemes in conformity
to the legally non-negotiable parameters
laid down in Schedules I and II of the Act
and operational parameters delineated in
the MGNREGA Guidelines.
3.2. Objectives and salient features of the programme
MGNREGA is the first ever law internation-
ally that guarantees wage employment at
such an unprecedented scale. The primary
objective of the Act is augmenting wage
employment. Its auxiliary objective is to
encourage sustainable development by
strengthening natural resource manage-
ment through works that address causes of
chronic poverty like drought, deforestation
and soil erosion. The process outcomes
include strengthening grassroots processes
of democracy and infusing transparency
and accountability in governance. The
salient features of the programme are given
in Box 3.1.
The selected list of permissible works is:
l Water conservation and water harvestingl Drought proofing (including plantation
and afforestation)l Irrigation canals including micro and
minor irrigation worksl Flood control and protection workl Minor irrigation, horticulture and land
development on lands of SC/ST/Below Poverty Line (BPL)/Indira Awas Yojana (IAY) land reform beneficiaries
l Renovation of traditional water bodiesl Land developmentl Rural connectivity
3.3. New initiatives under MGNREGA
During the last one year, the following new initiatives have been introduced by the Government under the MGNREGA. The new initiatives intend to ensure trans-parency and accountability in the process so that programme’s benefits reach millions of rural poor across the country and con-tribute to poverty alleviation in turn (Press Information Bureau, 2010).
The initiatives are:
1. Dedicating NREGA to the Memory of the Father of the Nation: The Act has been renamed as Mahatma Gandhi National Rural Employment Guarantee Act.
2. Amending the Act to Enlarge the Scope of Work: Schedule I, paragraph 1, sub-para iv of National Rural Employment Guarantee Act 2005 was amended on 22 July 2009 to include:
Provision of irrigation facility, horticulture plantation and land development facilities to land owned by households belonging to the Schedule Castes and Schedule Tribes or below poverty line families or to beneficiaries of land reforms or to the beneficiaries under the Indira Awas Yojana of GoI or that of the small farmers or marginal farmers as defined in the Agriculture Debt Waiver and Debt Relief Scheme, 2008.

Greening India through MGNREGA 35
Gram Panchayats while approving
work plans have been asked under the
Act, to ensure that works on lands of
SC/ST and BPL receive first priority.
3. Entitlement of ` 100 as Real Wage under MGNREGA: The Government has revised the wage rate under Section 6(1) of NREG Act subject to a ceiling of ` 100. In respect of states with higher
Box 3.1: Salient features of MGNREGA
Objectives of MGNREGA
l Augmenting wage employment. l Strengthening natural resources man-
agement through works that address causes of chronic poverty like drought, deforestation and soil erosion and thus encouraging sustainable development.
l Strengthening grassroots processes of democracy by infusing transparency and accountability in governance.
l Strengthening decentralization by giving a pivotal role to the Panchayat Raj Insti-tutions in planning, monitoring and implementation.
Unique features of MGNREGA
l Time-bound employment guarantee and wage payment within 15 days.
l Incentive/disincentive to the State Gov-ernments as 90 per cent of the cost for employment provided is borne by the Centre, whereas the States have to pay unemployment allowance at their own cost.
l Emphasis on labour-intensive works; prohibiting use of contractors and machinery.
l The Act mandates 33 per cent par-ticipation for women.
Key processes of MGNREGA implementation
l Cost sharing: Central Government three-fourths, State Government one-fourth.
l Adult members of rural households submit their name, age and address with photo to the Gram Panchayat.
l The Gram Panchayat registers households after making enquiry and issues a job card.
l The job card contains the details of adult member enrolled and his/her photo.
l Registered person can submit an ap-plication for work in writing (for at least fourteen days of continuous work) either to Panchayat or to Programme Officer.
l The Panchayat/Programme Officer will accept the valid application and issue dated receipt of application; letter providing work will be sent to the ap- plicant and also displayed at the Panchayat office.
l Employment will be provided within a radius of 5 km; if above 5 km, extra wage will be paid.
l If employment under the scheme is not provided within 15 days of receipt of the application, daily unemployment allowance will be paid to the applicant.
Critical aspectsl Job cards are issued upon through
verification of reasonably reliable local data base. Job cards are made prior to em- ployment demand and work allocation.
l Selection of works are mandated to be made by Gram Sabha in villages and displayed after approval of shelf of projects, to ensure public choice, transparency and accountability and prevent material-intensive, contractor-based works and concocted work records.
l Execution of works: At least half the works should be run by Gram Panchayats. Muster roll must be maintained for the cardholders to be found at each work, to prevent contractor led works.
l Measurement of work to be made according to a schedule of rural rate followed by reading out muster rolls on work site during regular measurement time to prevent bogus records and payment of wages below prescribed levels.
l Payments of wage to be made through banks and post offices to close avenues for use of contractors, short payment and corruption.
Source: Author.

36 Suryamani roul
wages, amount exceeding ` 100 would be paid by the State Governments from their own resources. (e.g., Gov-ernment of Andhra Pradesh [AP] has increased the wage rate). Further, it has been made mandatory that wage to MGNREGA workers be paid through banks/post office accounts. Emphasis is laid on works on individual land of small and marginal farmers, particularly those belonging to SCs/STs and BPL.
4. Guide l ine s to S ta te s to Se t Up Ombudsman at District Levels: GoI has issued Guidelines to states for appoint-ment of Ombudsman at the district level. The Ombudsmen will be well-known persons from civil society who have experience in the field of public administration, law, academics, social work or management. The purpose is to help receive complaints from MGNREGA workers and others, con-sider such complaints and facilitate their disposal in accordance with law.
5. MGNREGA Partnership with Unique Identification Development Authority of India (UIDA): In order to eliminate duplicate job cards and ghost bene-ficiaries while facilitating easy bank account opening and tracking the mo-bility of beneficiaries and ensuring a better monitoring, use of Information and Communication Technology (ICT) devices especially biometrics and integration with Unique Identification Development Authority of India has been introduced.
6. National Helpline Set Up for Receipt of Complaints: The MoRD has set up a toll-free National Helpline (1800110707) to enable the submission of complaints and queries for the protection of workers entitlements and rights under the Act. This is being ICT-enabled and linked with the State and District Level Helplines to create a National Network of MGNREGA Helpline. Helplines have also been set up in states like Orissa, UP, Himachal Pradesh, West Bengal (WB) and Goa.
7. Social Audits: Recognizing Social Audits as an important tool to enable the rural communities to monitor and analyze the quality, durability and usefulness of MGNREGA works as well as mobilize awareness and enforcement on their rights, the MoRD has accorded utmost importance to the organization of Social Audits by the Gram Panchayats and issued instructions to the states to make necessary arrangements. The Act was amended to provide for procedures on conducting social audits. Till May–June 2010, social audits have been undertaken in 0.24 million Gram Panchayats of the country (Press Information Bureau, 2010).
8. Online Monitoring of Social Audits: The monitoring of Social Audits is now made through a web site which places all critical parameters such as job cards, muster rolls, wage payments, num-ber of days of employment provided and works under execution online for monitoring and easy public access for information.
9. National Level Monitors’ Visit: Thirty-seven National level Monitors were deputed in 37 districts in 15 different states for special monitoring of the social audit campaign initiated by the Ministry.
10. Monitoring of MGNREGA by Eminent Citizens: Sixty-one out of targeted 100 eminent citizens have been identified so far as per Scheme Guidelines for independent monitoring to report on the progress of the scheme.
11. Vigilance and Monitoring committees at State and District Level: Vigilance and Monitoring Committees (V&MCs) have been reconstituted in all states/Union Territories (UTs) at state as well as district level for effective monitoring of programme implementat ion MGNREGA.
12. Strengthening Monitoring Mechanism: A Professional Institutional Network (PIN) has been constituted, including Indian Institute of Technologies (IITs),
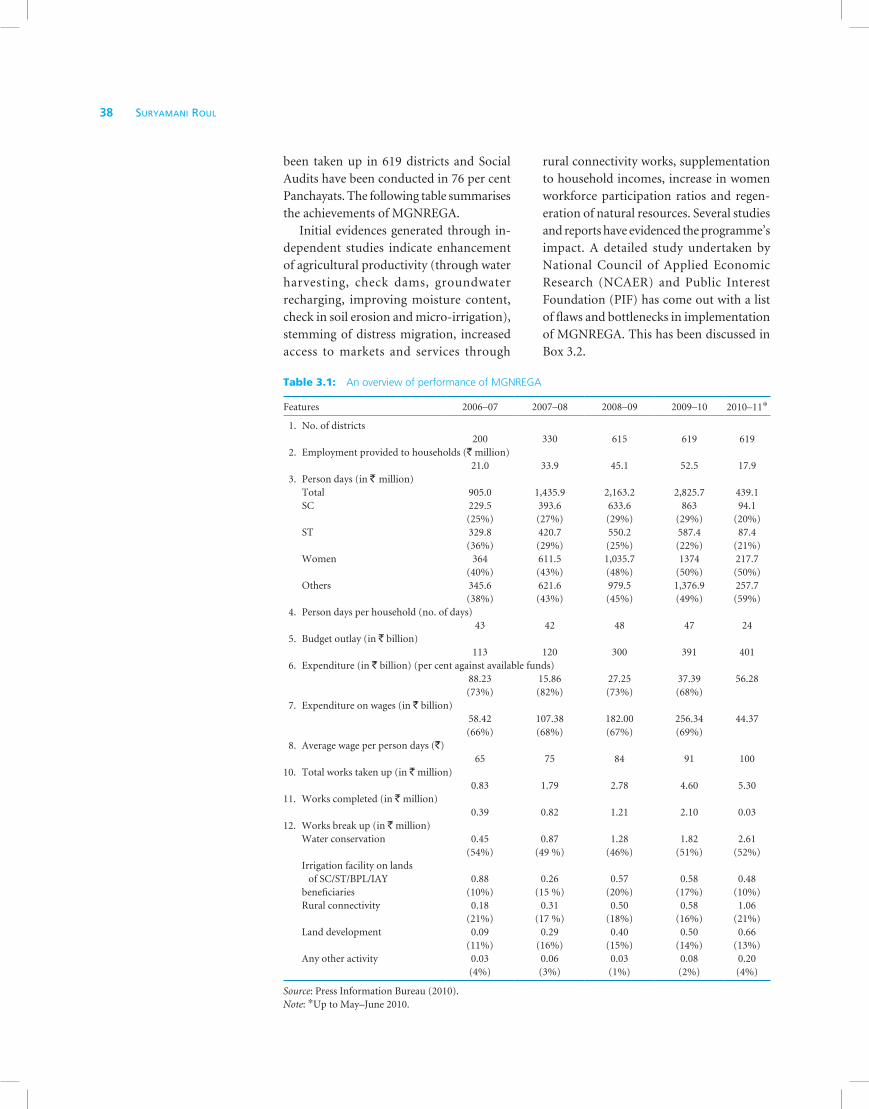
Greening India through MGNREGA 37
Indian Institute of Managements (IIMs), Administative Staff College of India (ASCI), Indian Institute of Public Administration (IIPA), Indian Institute of Forests Management (IIFM), agri- culture universities and other pro-fessional institutions, for supporting MGNREGA through impact assess-ments and concurrent monitoring and appraisal. Some of the findings include increase in agriculture minimum wages, wages earned per day, annual income, reduction in distress migration, effective targeting of marginalized groups (SC/ST/BPL) and use of MGNREGA as a supplementary income source during non-agricultural seasons. The productivity and multiplier effects of MGNREGA include improvement in ground water, improved agricultural pro- ductivity and cropping intensity, and livelihood diversification in rural areas.
13. Business Correspondent Model: To ensure timely payment of wages to the workers, a Banking Correspondence Model was adopted in Rajasthan with the help of Central Bank of India. MGNREGA has resulted in major financial inclusion wherein bank/post office accounts have been opened for the families getting employment. The Rural Ministry has advised all the states to ensure payment of wages through bank accounts. About 91.9 million bank accounts have been opened so far.
14. MGNREGA in Naxal Affected States: The GoI has issued instructions to all Naxal affected states (AP, Bihar, Chhattisgarh, Jharkhand, Madhya Pradesh [MP], Maharashtra, Orissa and UP) for implementation of MGNREGA to intensify awareness generation cam-paign among rural households, issuance of job cards, implementing sufficient number of works and timely payment of wages.
15. Construction of Bharat Nirman Rajiv Gandhi Sewa Kendra (BNRGSK): It is planned to construct Sewa Kendras under the scheme to create durable
assets in the villages. Gram Panchayat Bhawans would be constructed in each Gram Panchayat and Block. This will act as a centre for dissemination of knowledge and delivery of public services to rural households. Six per cent of the funds earmarked under the administrative head of the scheme is to be used to provide latest ICT facilities in Gram Panchayats within the permissible norms. This is made under the Schedule I, paragraph 1(g) of National Rural Employment Guarantee Act 2005 by expanding its scope to include the construction of BNRGSK at the Gram Panchayat and Block level.
16. Convergence of the MGNREGA: MoRD has developed and disseminated Guidelines for convergence of the MGNREGS with different schemes and specific programmes. For this purpose, 115 convergence pilot districts are iden-tified in 23 states, and independent organizations have been instituted under the monitoring of National In-stitute of Rural Development and with support from UNDP.
3.4. Status of MGNREGA: Implementation and coverage
GoI has allocated resources to the tune of ` 401 billion for the MGNREGA for the year 2010–11. Up to May–June 2010, the programme has provided employment to 52.5 million households across the country. Average real wage rate has increased to ` 100 per day as compared to ` 65 in 2006–07 and ` 91 in 2009–10. Of the 7.8 billion person days generated since 2006, women comprise of 50 per cent, SCs 21 per cent and STs 20 per cent. Households numbering 6.95 million (13.24 per cent) have completed 100 days of work. Over 91.9 million accounts have been opened (in banks/post offices). Rupees 216.25 billion (84 per cent of wages) have been disbursed as wages through the bank and post office accounts. Over 4.7 million works have

38 Suryamani roul
been taken up in 619 districts and Social Audits have been conducted in 76 per cent Panchayats. The following table summarises the achievements of MGNREGA.
Initial evidences generated through in-dependent studies indicate enhancement of agricultural productivity (through water harvesting, check dams, groundwater recharging, improving moisture content, check in soil erosion and micro-irrigation), stemming of distress migration, increased access to markets and services through
rural connectivity works, supplementation to household incomes, increase in women workforce participation ratios and regen-eration of natural resources. Several studies and reports have evidenced the programme’s impact. A detailed study undertaken by National Council of Applied Economic Research (NCAER) and Public Interest Foundation (PIF) has come out with a list of flaws and bottlenecks in implementation of MGNREGA. This has been discussed in Box 3.2.
Table 3.1: An overview of performance of MGNREGA
Features 2006–07 2007–08 2008–09 2009–10 2010–11*
1. No. of districts200 330 615 619 619
2. Employment provided to households (` million)21.0 33.9 45.1 52.5 17.9
3. Person days (in ` million) Total 905.0 1,435.9 2,163.2 2,825.7 439.1 SC 229.5
(25%)393.6(27%)
633.6(29%)
863(29%)
94.1(20%)
ST 329.8(36%)
420.7(29%)
550.2(25%)
587.4(22%)
87.4(21%)
Women 364(40%)
611.5(43%)
1,035.7(48%)
1374(50%)
217.7(50%)
Others 345.6(38%)
621.6(43%)
979.5(45%)
1,376.9(49%)
257.7(59%)
4. Person days per household (no. of days)43 42 48 47 24
5. Budget outlay (in ` billion)113 120 300 391 401
6. Expenditure (in ` billion) (per cent against available funds)88.23(73%)
15.86(82%)
27.25(73%)
37.39(68%)
56.28
7. Expenditure on wages (in ` billion)58.42(66%)
107.38(68%)
182.00 (67%)
256.34(69%)
44.37
8. Average wage per person days (`)65 75 84 91 100
10. Total works taken up (in ` million)0.83 1.79 2.78 4.60 5.30
11. Works completed (in ` million)0.39 0.82 1.21 2.10 0.03
12. Works break up (in ` million) Water conservation 0.45
(54%)0.87
(49 %)1.28
(46%)1.82
(51%)2.61
(52%) Irrigation facility on lands
of SC/ST/BPL/IAY beneficiaries
0.88(10%)
0.26(15 %)
0.57(20%)
0.58(17%)
0.48(10%)
Rural connectivity 0.18(21%)
0.31(17 %)
0.50(18%)
0.58(16%)
1.06(21%)
Land development 0.09(11%)
0.29(16%)
0.40(15%)
0.50(14%)
0.66(13%)
Any other activity 0.03(4%)
0.06(3%)
0.03(1%)
0.08(2%)
0.20(4%)
Source: Press Information Bureau (2010).Note: *Up to May–June 2010.

Greening India through MGNREGA 39
This programme, since its enactment, has been a safety net and lifeline for many labourers and small and marginal farmers who would otherwise have been adversely affected by jobs lost and reduced pay because of the economic crisis. The programme has had an important role to play in helping the poor to tide over the immediate impact of the global economic crisis. The fact that MGNREGA has a predominant focus on natural resource regeneration with public works that are related to drought-proofing and irrigation—like planting trees, building irrigation canals and watersheds and desilting ponds—thus boosting agriculture and food security has been the other benefit of MGNREGA. The findings of the Planning Commission’s mid-term appraisal report gives a critical view of MGNREGA. Box 3.3 discusses this in brief. A recent study focus-ing on empowerment of women workers through MGNREGA provides very positive impact and in explained in Box 3.4.
3.5. Governments’ commitment towards strengthening MGNREGA
On the occasion of the launch of the fifth year of MGNREGA on 2 February 2010, Dr Manmohan Singh, Prime Minister of
India, addressing a gathering of around 1,200 participants from all over the country termed MGNREGA as a path-breaking phenomenon with its pro-poor vision and promise of right to work, inclusive growth and social security. While lauding the success of the programmes, which has provided livelihood opportunities for over 170.4 million households till May–June 2010, he called for forging linkages of rural development programmes with MGNREGA to augment functional capabilities of the workers. Highlighting the role of PRIs in implementation of the Act and focusing on bringing better integration of MGNREGA with other grassroot level programmes, he underlined the need for convergence between the programmes having overlapping objectives and scope.
In envisioning MGNREGA as a trans-formative vehicle for empowering local communities to enhance their livelihood security, MoRD has taken several steps such as encouraging decentralized participatory management, improving delivery systems and public accountability, to ensure effective implementation.
In order to address major issues asso-ciated with implementation of MGNREGA, the MoRD, GoI during its 11th Central
Box 3.2: Are benefits of MGNREGA reaching people?
A study undertaken by NCAER and PIF in 2009 has found many flaws affecting the implementation of MGNREGA. Funds not reaching its intended beneficiaries, significant inflation in official numbers regarding creation of actual jobs and man-days as well as red-tapism blocking proper implementation being some of them. The study found that in a large number of districts in several states, the number of households that have been issued job cards is more than the total number of households in these districts. In many places there were delays in providing job cards and many households demanding employment did not get employment. The study revealed that there are inordinate delays in payment to workers, and implementation has suffered due to anomalies in the selection of works, poor
execution, inflated estimates, inadequacies in measurement, cost overruns and delays in release of funds by states. Quality of assets created under the scheme is doubtful is many places, thereby questioning long-term usefulness of these assets. Some states like Assam, Orissa, Gujarat, Maharashtra, Karnataka and Kerala have evidenced reduction in employment generation under MGNREGA as compared to SGRY. Rajasthan, AP and Tamil Nadu (TN) were the top three states in implementation of MGNREGA, while Punjab was the worst in this category, followed by Gujarat and WB. However, the share of ST households in employment has improved and outshined participation of women under MGNREGA.
Source: NCAER and PIF (2009).

40 Suryamani roul
Employment Guarantee Council (CEGC) meeting in May 2010, has set up six working groups to look into matters relating to plan-ning and execution of the schemes, capacity building of workers and functionaries, transparency and accountability, etc.
A seven-member Working Group on Planning and Execution (WGPE) is looking to address issues relating to preparation and
approvals of a shelf of projects as per the provisions of MGNREGA and formulation and approval of the labour budget under the Act. It also looks into the development of perspective plans and the annual plan, choice of works for sustainable and durable assets within permissible list, expansion of scope of works, convergence guidelines and processes and developing guidelines for
Box 3.3: Findings of the planning commission’s mid-term appraisal report on rural development programmes
As per the findings of the mid-term appraisal of various rural development programmes, despite making a significant overall impact, the performance of MGNREGA remains patchy. Majority of states were under-performers and only 14 per cent worker households could get 100 days of work. On the positive side, MGNREGA had performed better than any other anti-poverty initiatives undertaken in India. In the four years since its inception, MGNREGA has provided about 6 billion person days of work at a total expenditure of around ` 700 billion. The coverage of SCs/STs and women under the scheme is remarkable.
Another indicator used by the study was intensity of work provided. Intensity of work was defined as the number of days of work provided to those who got any work. The national average intensity of work was 48 days and as many as 15 states’ average was below this figure. These included Himachal Pradesh, Maharashtra, Haryana, Assam, Meghalaya, TN, Jammu and Kashmir, Uttarakhand, Orissa, Karnataka, Punjab, WB, Bihar, Gujarat
and Kerala. In states such as Kerala (22) and Punjab (31), low days of work were attributed to extension of the programme to the whole state, resulting in inclusion of districts with minimal demand for the scheme. But some of the high-demand states such as Orissa, Bihar, Karnataka, WB and Uttarakhand too were among the non-performing. This appears to be a case of the states not having given due attention to energise MGNREGA.
Another method of assessing relative performance of states was to compare the share of states in person days generated under the programme with their share in rural BPL households in India. As per the report findings, UP and Bihar emerge as the worst performers as their share in rural BPL households is about 10 per cent higher than their share in employment generated under the scheme. WB, Orissa, MP, Gujarat and Karnataka too were found to be lagging behind on this count, while Rajasthan and AP were found to have performed very well.
Source: Kumar (2010).
Box 3.4: Empowerment of women workers through MGNREGS: A study in four states
A field study undertaken to examine the empowerment effects of the National Rural Employment Guarantee Scheme on rural women in four states—Bihar, Jharkhand, Rajasthan and Himachal Pradesh has found that women workers have gained from the scheme. The gain has been because of the paid employment opportunity, and benefits have been realized through income-consumption effects, intra-household effects and the enhancement of choice and capability. Other benefits include realization of equal wages under the MGNREGA, thereby balancing
gender discriminatory wages prevalent in the rural labour market. The Act has inbuilt provisions like priority for women in the ratio of one-third of total workers; equal wages and crèches for the children of women workers and other provisions like work within a radius of 5 kilometres from home, absence of supervisor and contractor and flexi bility in terms of choosing period and months of employment. These have been very conducive for rural women.
Source: Pankaj and Tankha (2010).

Greening India through MGNREGA 41
innovations. The WGPE is also examining issues related to detailed estimates, timely opening of works, selection of imple-menting agencies for selected projects, role of line departments, material procurement, worksite management and facilities, inspection and monitoring of works and operational modalities of convergence projects.
A seven-member Working Group on Capacity Building (WGCB) looks into the empowerment of MGNREGA workers so that they are able to assert and realize their rights. It will also suggest measures for strengthening of community participation at all levels in administrative systems and strengthening of research and evaluation system.
A nine-member Working Group on Transparency and Accountability (WGTA) has taken up issues associated with enforcement of rights and entitlements of MGNREGA workers and suggest suitable measures. This group is examining the issues related to the application process for issue of job cards, its authenticity and updation systems, timely work allocation to beneficiaries, payment of unemployment allowance and all issues relating to internal and external monitoring and verification systems prescribed by the MoRD.
A seven-member Working Group on Specific Needs of Specific Category of Workers is focusing on issues of gender equity, needs of disabled persons, needs of old persons, special benefits to SC, ST and families in left wing extremist areas and drought affected areas.
The Working Group on Works to be taken up on Individual Land is examining the draft guidelines prepared periodically and the practices in ‘major’ states and shall make recommendations for improve-ment. This working group has been set up to suggest measures for optimising the potential of MGNREGA in enhancing agricultural productivity and reducing economic vulnerability of the programme beneficiaries.
Acting on the request of MoRD, the
Ministry of Statistics and Programme
Implementation, GoI has constituted a
10-member Committee in March 2010 to
develop a mechanism to evolve a framework
to create a separate index for updation of
MGNREGA wages and related issues in
keeping with the local situations prevailing.
The Committee has recommended that the
real wages provided under the MGNREGA
be linked to the Consumer Price Index
(The Economic Times, 2010).
Actions taken from to time indicate
that the Government is fully committed
to reform and innovations in execution of
MGNREGA. The programmes are backed
by a strong political will and necessary
budgetary resources. Considered as the
world’s largest ‘cash for work’ scheme,
MGNREGA is an ambitious social-protection
programme. The Act is a first of its kind
backed by national legislation to enhance
livelihood security by providing at least
100 days of guaranteed wage employment
in a year to every household whose adult
members volunteer to do unskilled manual
work.
The President of India, Smt. Pratibha
Patil, in her address to the joint session
of Parliament when the 15th Lok Sabha
met for the first time on 4 June 2009,
emphasized on enlarging the scope of
works permitted under MGNREGA so that
more opportunities for land productivity
improvement are created and convergence
with other programmes of government is
undertaken to maximize impact.
Expanding the scope of MGNREGA by
including new types of work and widening
the scope of asset creation has witnessed
large support from representatives of state-
level political parties too. In an endeavour
to increase scope of asset creation under
the scheme, the GoI has come out with a
convergence plan of MGNREGA to other
Government schemes related to agriculture,
water resources, land resources, forests and
rural roads.

42 Suryamani roul
3.6. MGNREGA and programme convergence
Convergence of other programmes with MGNREGA as against it being a stand alone programme is accepted by almost all stakeholders because convergent action between ongoing programmes with similar or complimentary works and MGNREGA is felt necessary for creation of durable assets and strengthening livelihoods resource base of rural poor. While extending the MGNREGA to all the districts in the country in 2008, the MoRD constituted a Task Force on convergence of other programmes/schemes with MGNREGA through an office memorandum dated 1 April 2008. This memorandum intended to examine the modalities of convergence with other programmes in order to ensure planned and coordinated investments in rural areas to create employment opportunities. This is a paradigm shift from the initial focus of the Act. Creation of durable assets is an important component for the welfare of the small and marginal farmers.
In order to optimize the multiplier effects of MGNREGA, the Task Force looked at the possibilities of convergence of programmes like National Horticulture Mission, Rashtriya Krishi Vikas Yojana, Bharat Nirman and Watershed Development. The MoRD has come out with detailed guidelines on pro-gramme convergence based on mutual understanding with other departments at the Central Government level (www.nrega.nic.in).
Convergence intends to add value to MGNREGA works by creating durable efforts and enabling planned and coord-inated public investments in rural areas. Convergence assumes optimum usage of MGNREGA funds for purposes and activities which are unmet by other pro-grammes without diluting MGNREGA objectives. It would involve identification and prioritization of needs and preparation of suitable shelf of projects involving im-plementation agencies. The purpose of programme convergences are:
l To meet the large critical unmet demandsl To add variety into annual action plansl To add more implementing agencies for
common purposel To raise income levels of needy familiesl To achieve sustainable economic/social
returnsl To transfer new technologies to field
fasterl To ensure better returns from other
schemes
It is considered that the district is the best level for planning convergence and should take a lead in identifying needs, resources, strengths and weaknesses of the imple-menting agencies.
MGNREGA, as entry point programme for convergence, has an advantage because:
l Covers a wide range of works (almost all works required for watershed develop-ment in rainfed area, for command area development in irrigated areas and fair weather road for rural area connectivity)
l Provides space as united funds for local area planning
l Provision of decentralized planning which enables comprehensive need assessment at grassroots and greater ownership of projects
l Provides legal safeguards through Actl Provides ample scope for natural re-
source management facilitating sustain-able development
l It helps in development of human capital and physical capital through institutional linkages thereby facilitating effective targeting
Convergence of the MGNREGA funds with funds from other sources can help in creation of durable assets. For instance, funds available with PRIs from other sources (such as the National Finance Commission, State Finance Commission, State Departments) and other Central or Centrally Sponsored Schemes (such as Swarnajayanti Gram Swarozgar Yojana [SGSY] and Backward Region Grant Fund [BRGF]) can be dovetailed with

Greening India through MGNREGA 43
MGNREGA funds for the construction of durable community assets under the works permissible. However, MGNREGA funds should not be used as substitute resources by different departments and agencies for their own activities.
Expected outputs of convergent action:
l Increase in Social Capital: Collective planning and implementation among different stakeholders will enhance social capital, thereby improving man-agement and work output.
l Increase in Physical Capital: The process will aid in creating durable assets and will also improve land productivity.
l Facilitation of Ecological Synergies: Natural resource regeneration through different activities such as afforestation, drought proofing, flood proofing and watershed will add to environmentally sustainable development.
l Mitigate Effect of Climate Change: Natural resource enhancement related MGNREGA works help in addressing issues such as CO2 emissions, industrial pollution and global warming.
l Enhance Economic Opportunities: Income opportunities, savings and investments may be generated through activities such as pisciculture.
l Strengthen Democratic Processes : Convergence awareness and planning at the grass root level will lead to greater ownership of projects.
l Facilitate Sustainable Development: Convergence efforts through creation of durable assets, rural connectivity, productivity enhancement and cap-acity development lead to sustainable development.
3.7. Early evidences of MGNREGA and programme convergence
The MoRD has developed and disse-minated guidelines for convergence of the MGNREGA with different schemes and specific programmes including piloting,
monitoring systems and processes of con-vergence is various states. With technical sup- port from United Nations Development Programme (UNDP), pilot exercises are being undertaken in 115 districts in 23 states by independent organizations (UNDP, 2009b).
Since the MGNREGA convergence mechanisms have been given a phillip only recently, an attempt has been made to capture some early evidences particularly from MP, WB, Kerala and AP. UNDP Solution Exchange—Work and Employ-ment Community through a discussion initiated by Seema Kakade, Prayas, Pune, has captured some of the state-specific con-vergence efforts with MGNREGA (Kakade, 2010).
3.7.1. Madhya Pradesh—Kapil Dhara sub-scheme changed the life of marginal farmers
MP is the first state to introduce conver-gence of the different rural development programmes. It has also developed guidelines to implement Watershed De-velopment activities under MGNREGS (www.watermissionmp.com).
Implementing MGNREGS through sub-schemes has yielded positive results in MP. The Government of MP has introduced 11 sub-schemes for creation of durable assets through MGNREGS, namely:
l Kapil Dhara irrigation structures (dug well, check dam, masonry dam, farm pond on private land)
l Nandan Phalodyan (horticulture on private land)
l Bhumi Shilp (farm bunding on private land)
l Shail Pern (soil conservation and plan-tation in degraded hills)
l Vanya (plantation in community waste land)
l Resham (sericulture in community as well as private land)
l Nirmal Neer (well and tank construction for community drinking water)
l Nirmal Vatika (construction of leaching pit and fruit tree plantation)

44 Suryamani roul
l Meenakshi (pisciculture)l Sahasradhara (micro-irrigation structure
with canals)l Srunkhalabadh Jal Sanrachana (con-
struction of series of stop dams in rivers)
MGNREGA through Kapil Dhara wells have improved the productivity, intensity and diversity of the crops wherever water is available. This scheme has added to livelihood security of the small and marginal farmers. This programme has been con-verged with SGSY and diesel pump sets are provided to Kapil Dhara beneficiaries for irrigation. In spite of certain reported irregularities, these irrigation structures have checked distress migration from villages. Through the Vanya sub-scheme under MGNREGS, plantation has been done in several villages with wire and stone fencing to protect it.
The Madhya Pradesh Rural Livelihoods Programme’s (MPRLP) convergence with MGNREGS, in the past four years, has an outreach of 26,867 households and has generated more than 0.6 million person days of work. MPRLP has also planned for 41,472 households and projects worth ` 2,249 have been sanctioned benefiting 4,485 households.
3.7.2. West Bengal—Successful collaboration models with PrI in Bankura district has had a snowball effect
Professional Assistance for Develop-ment Action (PRADAN), a national level livelihoods promotion organization, has trained 156 local PRI functionaries and District Officials in Integrated Natural Resource Management (INRM) planning. The trained youth are engaged in helping the villagers in planning and implementing INRM activities. PRADAN worked very closely with the PRI system of Gopalpur Panchayat and with support of women’s Self - Help Groups (SHGs), MGNREGA activities were undertaken to create decentralized water bodies (as appropriate key component of INRM for the area), and orchard or
timber plantation (to improve productivity of unused uplands). The initiative started in 2008 summer in Elora village using about ` 0.4 million for creating small water harvesting structures (5 per cent model/Hapa). About 30–40 models of in situ rainwater conservation were demonstrated in one patch of 20 ha of Arjuna plantation of the same Gram Panchayat. The impact was so significant that it impressed the local Panchayat leader, block officials and district administration. The neighbouring Panchayat leaders requested PRADAN to help them in preparing similar INRM plan for their villages. At the same time PRADAN helped the Gram Unnayan Samity and Gram Panchayat to set systems and processes so that they can quickly and effectively respond to the villagers’ demands generated through the planning process. The steps followed are:
l Facilitating SHGs/Gram Samsad to select people to work as village level Resource Persons (RPs)
l Giving exposure and training to RPsl Helping RPs in campaigning to build
awareness in the villagesl Helping SHGs to organize village-level
planning event involving all householdsl Giving field inputs to ensure poorest
biased livelihood centric planl Each SHG is given responsibility to im-
plement work in a defined patch to avoid confusions
l Payments through SHGs as they are the best pay masters
l Extremely regular payments in a weekly cycle
A comprehensive plan for 2,000 ha area for INRM treatment is made for taking it up on a priority basis to see the impact on the area. The plan includes a mango plantation of 27 ha in two patches within the area through convergence of MGNREGS, National Horticulture Mission (NHM), Zilla Parishad Schemes and Agriculture Department Schemes. Funds are being mobilized from different agencies like

Greening India through MGNREGA 45
National Bank for Agriculture and Rural Development (NABARD) and Panchayat (MGNREGS) for rest of the activities. Watershed development work for 557 ha within this 2,000 ha is under progress with support from NABARD. PRADAN is now working in five blocks of Bankura district. PRADAN has supported in mobilizing ` 55.79 million for MGNREGS alone for INRM work in these five blocks in the last three years. About 2,500 families have created productive assets. PRADAN is now making efforts to extend to Purulia and Pashchim Medinipur districts of WB. The Government of WB has agreed to provide 60 per cent of PRADAN’s support cost for enhancing awareness within the com-munity regarding MGNREGS, developing village-based resource persons for planning and implementing of INRM-based plan under MGNREGS, and installing process and systems in five blocks for implementing INRM-based activities under MGNREGS. PRADAN is following a watershed approach for planning and implementing the INRM activities.
3.7.3. Kerala—Involvement of PrIs and SHGs gives good results
In Kerala, MGNREGS is implemented through Kudumbashree, a Government sponsored women’s network for poverty reduction. The scheme’s implementation is totally controlled by local governments with each Gram Panchayat having its own model of convergence. While creation of durable assets was avoided the initial phases, it is subsequently getting included in a controlled manner. The Gram Panchayats in Kerala are successfully converging with the Departments of Agriculture, Forest and Irrigation.
In Wadakkanchery Block, 2,500 workers worked for a period of three weeks to desilt an 47-km long irrigation canal. This canal brought assured irrigation to 3,000 hectares of paddy. There has been tremendous impact of the programme in Kerala, which includes improvement in quality of work, level of transparency and reduction in corrupt practices reduced. Participation of
women labourers is substantially increased and has in turn positively impacted women’s empowerment. The impact on agriculture too has been significant. The success of MGNREGS through Kudumbashree has led to their replication in few other states.
3.7.4. Andhra Pradesh—Structured mechanism to involve the civil society helps in better planning and smoother implementation of MGnreGS
Government of AP has developed a detailed Operational Guidelines incorporating various management practices to ensure better execution of the scheme. This document outlines procedures right from planning, registration of job seekers, work allocation and execution, including procedure for systematic payments and timely disbursement of unemployment allowance, wherever applicable. A web-based software for tracking and updating information which helps in monitoring has been operationalized.
The activities under that could be taken up under MGNREGA are broadly under eight categories and 85 kinds of sub-activities have been listed under these eight categories. This exercise has clarified roles of different stakeholders and leads to execution of works without ambiguity.
The convergence efforts are primarily with the line departments such as Agri-culture, AP Micro Irrigation Project (APMIP) and Horticulture, and other schemes like Comprehensive Land Development Project (CLDP) and Watershed Programmes wherever they are under implementation. The State Government has made special provisions by issuing circulars for providing employment throughout the year in specific areas that are drought stricken and/or migration prone. Mahboobnagar is one such district; advance wage payment have been instructed for remote tribal areas to attract people to the scheme. Special provisions have also been made for differently abled persons. Continuous efforts are on to pro-vide facilities at work sites. Risk mitigation mechanism has been put in place by creating
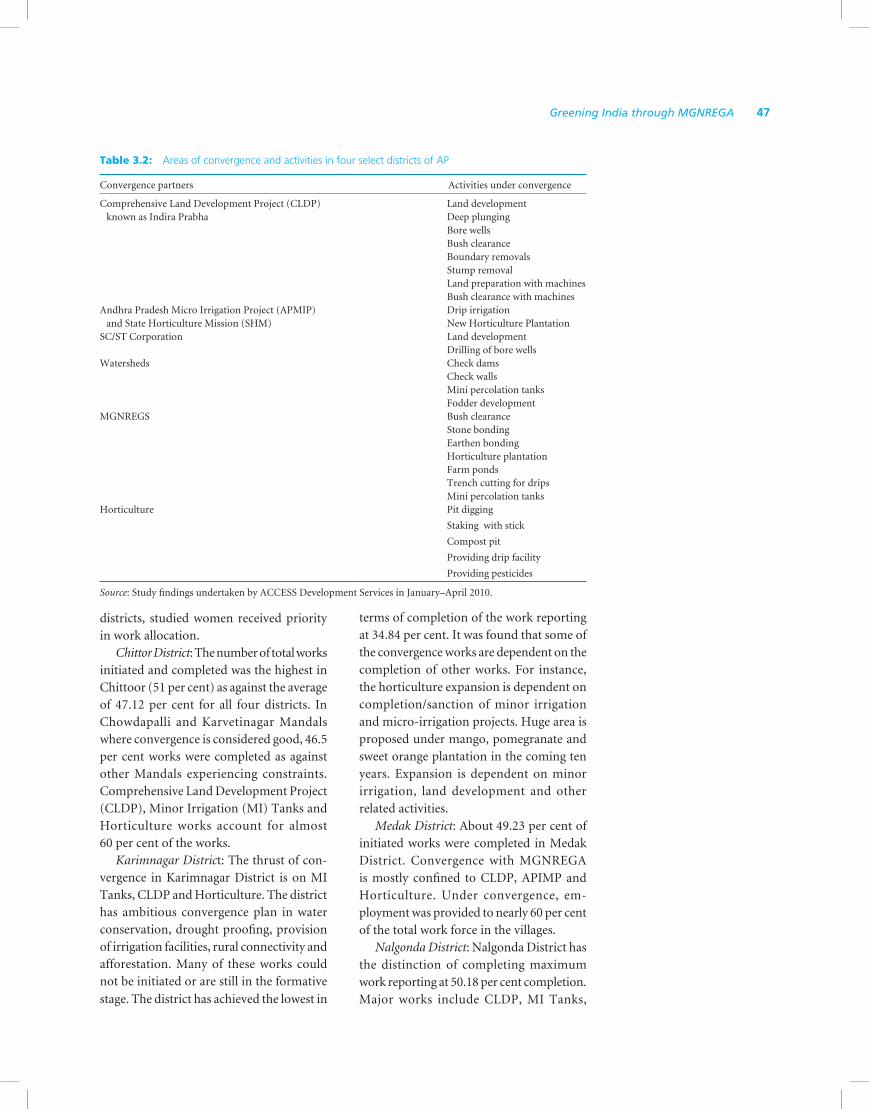
46 Suryamani roul
special provision for mishaps at work. Both Government and NGO stakeholders took special initiatives to conduct work motion studies that led to revision of cost norms as appropriate. Social audit process is being improved with the stakeholders’ involvement to help in scheme execution. Grievance redressal systems are in place at Mandal, District and State levels and progress is reviewed periodically. Few initiatives related to new technology, such as smart card, finger print and smart biometric recognition are being piloted and is expected to come out with solutions to make the programme even more effective and efficient.
The office of Commissioner for Rural De-velopment has entered into a Memorandum of Understanding (MoU) with a network of Non-Governmental Organizations (NGOs). As a result of the coordinated efforts of the NGOs, Community and the District Administration, 70 per cent of the poor were able to engage in MGNREGS works earning upto ̀ 10,000. Government of AP has taken the following steps to ensure smoother and effective implementation of NREGS:
l Evolving a structured engagement mechanism with the civil society and community-based organizations (CBOs).
l MoU between Commissioner for Rural Development (CRD) and a network of NGOs.
l Direction to districts towards appending need-based shelf of projects and allocating funds on that basis.
l Micro-planning exercises are promoted in each village, focusing particularly on Common Property Resources (CPRs).
l Based on micro-planning, estimates are developed along with the MGNREGS team and allocations are done by the district. For example, Ananthapur Paryavarana Parirakshana Samithis (APPS) has provided field facilitation support in Ananthapur District.
l Engagement of Field-level resource agencies for monitoring of MGNREGA.
For example, a CBO called Vedika, a district level apex body is involved in field-level monitoring and social audit processes in Ananthpur. This has ensured that at least 70 per cent of the small holders participating in MGNREGS work and are able to earn up to ̀ 10,000, which makes their farming viable.
l At the district level, the District Collectors have initiated a fortnightly Steering Com-mittee Meeting to review and resolve dif-ferent field level problems along with the NGOs and CBOs.
Early evidences of convergences are also captured through a study undertaken by ACCESS Development Services with support from UNDP. It covered the four districts of Karimnagar, Nalgonda, Chittoor and Medak. Findings of study give ample evidences that convergence at the village-level benefits the farmers significantly (ACCESS, 2010). The main objective of the study was to look into the convergence issues between MGNREGS and ongoing schemes of different departments/ministries to ensure effective implementation of the scheme. The study was to make recom-mendations for required corrections/improvements in the implementation pro-cess and assess whether guidelines issued on convergence are being followed in ex-ecution of works. Table 3.2 gives consolidated information on areas of con-vergence and activities under MGNREGS in these four districts.
In all the four districts, convergence with MGNREGS is confined to five schemes of the Government, namely CLDP, APMIP, Micro Irrigation Project (MIP), Watershed Development and Horticulture. The nature of works vary within and between the districts (sample is based on two Mandals which experienced significant positive impact of convergence and two Mandals which experienced constraints in optimal performance of con- vergence). There was variation in terms of inclusion of vulnerable communities, particularly the SC, ST and Other Backward Caste (OBC) communities. However, in all

Greening India through MGNREGA 47
districts, studied women received priority in work allocation.
Chittor District: The number of total works initiated and completed was the highest in Chittoor (51 per cent) as against the average of 47.12 per cent for all four districts. In Chowdapalli and Karvetinagar Mandals where convergence is considered good, 46.5 per cent works were completed as against other Mandals experiencing constraints. Comprehensive Land Development Project (CLDP), Minor Irrigation (MI) Tanks and Horticulture works account for almost 60 per cent of the works.
Karimnagar District: The thrust of con-vergence in Karimnagar District is on MI Tanks, CLDP and Horticulture. The district has ambitious convergence plan in water conservation, drought proofing, provision of irrigation facilities, rural connectivity and afforestation. Many of these works could not be initiated or are still in the formative
stage. The district has achieved the lowest in
terms of completion of the work reporting at 34.84 per cent. It was found that some of the convergence works are dependent on the completion of other works. For instance, the horticulture expansion is dependent on completion/sanction of minor irrigation and micro-irrigation projects. Huge area is proposed under mango, pomegranate and sweet orange plantation in the coming ten years. Expansion is dependent on minor irrigation, land development and other related activities.
Medak District: About 49.23 per cent of initiated works were completed in Medak District. Convergence with MGNREGA is mostly confined to CLDP, APIMP and Horticulture. Under convergence, em-ployment was provided to nearly 60 per cent of the total work force in the villages.
Nalgonda District: Nalgonda District has the distinction of completing maximum work reporting at 50.18 per cent completion. Major works include CLDP, MI Tanks,
Table 3.2: Areas of convergence and activities in four select districts of AP
Convergence partners Activities under convergence
Comprehensive Land Development Project (CLDP) known as Indira Prabha
Land developmentDeep plungingBore wellsBush clearanceBoundary removalsStump removalLand preparation with machinesBush clearance with machines
Andhra Pradesh Micro Irrigation Project (APMIP) and State Horticulture Mission (SHM)
Drip irrigationNew Horticulture Plantation
SC/ST Corporation Land developmentDrilling of bore wells
Watersheds Check damsCheck wallsMini percolation tanksFodder development
MGNREGS Bush clearanceStone bondingEarthen bondingHorticulture plantationFarm pondsTrench cutting for dripsMini percolation tanks
Horticulture Pit digging
Staking with stick
Compost pit
Providing drip facility
Providing pesticides
Source: Study findings undertaken by ACCESS Development Services in January–April 2010.

48 Suryamani roul
Horticulture and Watershed management. Maximum works are generated under CLDP and irrigation. Men and women had equal representation in execution of conver-gence works. Substantial individual assets have been created under convergence with horticultural activities. The convergence activities under forestry and agriculture are yet to take off in the district.
The study also brings out the fact that most of the farmers face water scarcity for cultivation. They are therefore not able to achieve 75 per cent plant survival that makes them eligible for subsidy from APMIP and SHM. This forces the farmers to approach moneylenders for loans to buy inputs to save their crop. The farmers perceive assets created under convergence as very useful and benefits from these assets have significantly reduced migration from villages to cities across all four districts. Land development, bush clearance, deep ploughing, stone bunding, earthen bunding, compost pits and feeder channels were commonly initiated with joint convergence of various departments. A major observation was that line departments are lacking in ownership in MGNREGA convergence work, as most of them do not consider these as their work.
AP Government has recently decided to bring those working under the MGNREGA under the jurisdiction of the Workers’ Welfare Board to help them avail benefits like insurance, medical and other facilities. About 0.8 million workers are registered with the Welfare Board till May 2010. The Government of Andhra Pradesh has also planned to set up a special Lok Adalat to redress grievances of MGNREGA workers. This is a reflection of AP Government’s commitment for welfare of workers employed in unorganized sectors.
3.8. Other departments showing interest for convergence under the MGNREGA
In spite of many reports on malpractices in MGNREGA in media and by social
activist groups, MGNREGA is proving to be fruitful for small and marginal farmers. AP is a case in point. Positive impacts have been reported from Rajasthan, Orissa, MP, Uttarakhand and many other states. Many other departments are evincing interest to dovetail their programmes with MGNREGA, based on the positive outcomes of convergence efforts.
Recently, a Working Group has been formed to formulate models of convergent action between MGNREGA and schemes of the Ministry of Tribal Affairs vide an order of MoRD dated 9 July 2010. The main objective of such a move is to examine the modalities of convergence towards furtherance of the common objectives of different programmes for generation of sustainable livelihoods and income for the tribal communities. Just like MGNREGA, there are several programmes run by the Ministry of Tribal Affairs, which have a direct bearing on generation of rural livelihoods. The Working Group’s suggestions will help in rolling out model pilot projects through which the productivity of the tribal people can be enhanced. Some of these programmes are special central assistance for tribal development, development of primitive tribal groups, and the scheme of market development of tribal products. At present, there is no coordination between the implementing agencies at the field level to converge these schemes for maximising benefits. The Working Group will deliberate on ways to converge these schemes with MGNREGA and will submit its report to MoRD within two months.
3.9. Greening India through MGNREGA convergent action
MGNREGA is bringing about a silent revolution in rural areas. The civil society actors have contributed significantly in the efforts to shape and make this programme a role model for public service delivery in rural areas. In some states, the administrative machinery is responding very positively
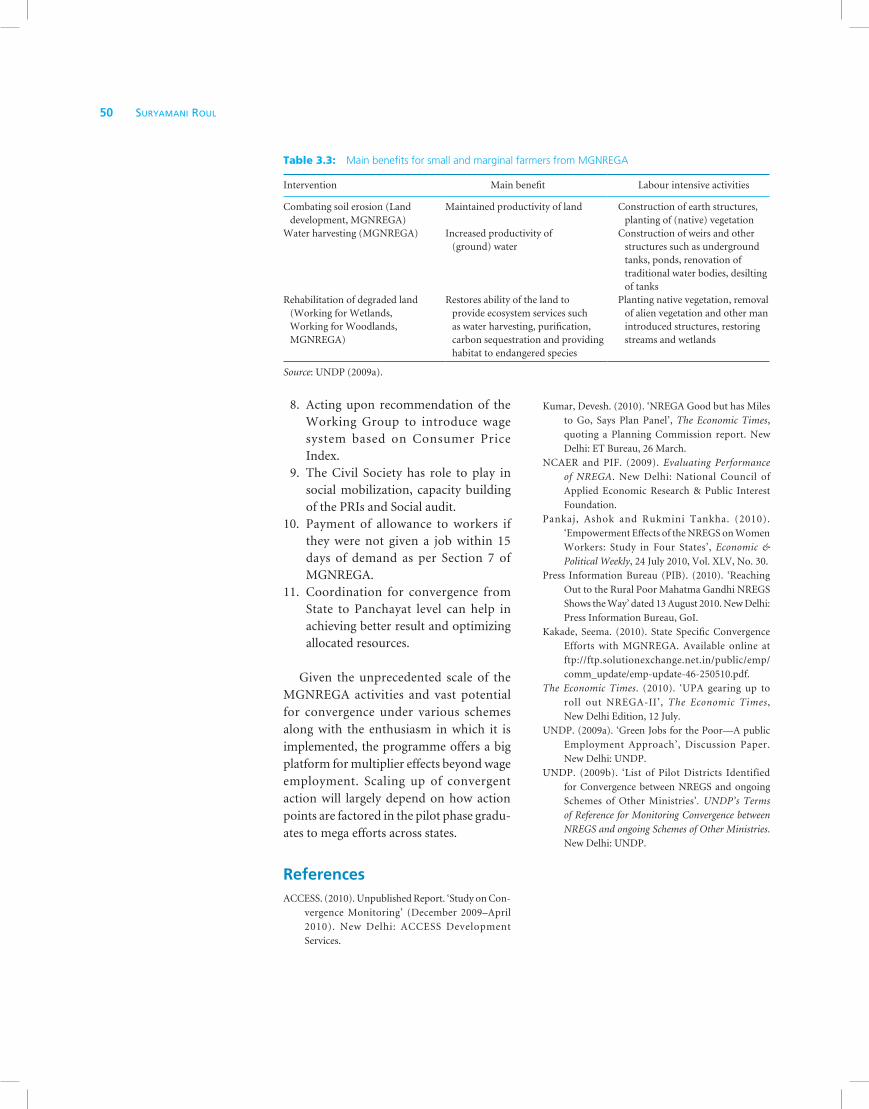
Greening India through MGNREGA 49
and proactively, whereas in some states
the programme is experiencing limited
support from the State Governments. Con-
vergent action agenda is moving faster in
some states like AP, Orissa, Uttarakhand,
Maharashtra, MP, Rajasthan and some parts
of Northeast.
The success of MGNREGA need not
be measured just in terms of employment
generation, even though it has created a
success record far better than other pro-
grammes. MGNREGA is a model for
innovation in many areas of public service
delivery. Starting from providing land-based
employment to the wage earner, MGNREGA
has had innovative initiatives like financial
inclusion, social security provisioning for
workers in the unorganized sector and
identification of the poor. In the rural areas
0.92 million zero balance bank/post office
accounts have been opened because of
MGNREGA. Many households have been
included in the financial network for the
first time. This is an achievement considering
that financial inclusion is not a stated ob-
jective of the programme. Similarly, as
against the stated objective of one-third
of women participation in total person
days generated, the actual numbers have
reached 50 per cent. An expected spillover
has also been the rise in wages in almost all
states since the initiation of the programme.
Evidently, the self-targeting inherent in
MGNREGA has had a better score in
targeting the poor than the officially listed
BPL households, thereby providing rural
poor an opportunity to stake claim to the
fruits of growth.
T h e t w o m a s s i v e G o v e r n m e n t
programmes—National Rural Livelihoods
Mission and National Food Security
Mission converged with MGNREGA can
revolutionalize Indian agriculture. It is
projected that in the next two decades, Indian
agriculture will meet the requirements of
food security, will rapidly diversify and will
function in a rural urban continuum. With
rapid development of markets and shifting
of working populations from villages to
linked small towns and also from crop
production to value-added activities, em-
ployment growth in agriculture is expected
to be high. The success of Indian agricul-
ture largely depends on a new institutional
structure that will provide technology,
organizational, pricing and infrastructure
support. Indian agriculture is already
increasingly demand driven. This is ex-
pected to further accelerate in the future.
MGNREGA has potential to contribute
towards greening India by benefiting
the small and marginal farmers directly
through convergent action. The main
benefits are illustrated in Table 3.3.
For convergent action, the following
action points are important:
1. Strengthening and endowing capacities
of the PRIs by providing them requisite
technical and social human resource so
that they are empowered to formulate
plans and implement accordingly.
2. Social mobilization by a cadre of mob-
ilizers at the village level holds the key to
shape MGNREGA into a truly demand-
driven programme.
3. Improving the productivity of agriculture
and convergence with other allied pro-
grammes make a big change in ensuring
sustainable livelihoods to the rural poor.
4. Asset creation for small and marginal
farmers on their land would greatly
help these farmers to benefit out of
MGNREGA.
5. Strengthening social audit process and
grievance redressal system through
independent bodies.
6. Use of information technology (IT)
can strengthen social audit processes
and reduce chances of leakages and
corruption. The IT system practiced in
AP is a good example for providing full
proof tracking system.
7. Use of IT system to make payment of
wages easy, transparent and timely.
Banking Correspondence model,
wherever banking/post office network
is absent, can be an option.

50 Suryamani roul
8. Acting upon recommendation of the Working Group to introduce wage system based on Consumer Price Index.
9. The Civil Society has role to play in social mobilization, capacity building of the PRIs and Social audit.
10. Payment of allowance to workers if they were not given a job within 15 days of demand as per Section 7 of MGNREGA.
11. Coordination for convergence from State to Panchayat level can help in achieving better result and optimizing allocated resources.
Given the unprecedented scale of the MGNREGA activities and vast potential for convergence under various schemes along with the enthusiasm in which it is implemented, the programme offers a big platform for multiplier effects beyond wage employment. Scaling up of convergent action will largely depend on how action points are factored in the pilot phase gradu-ates to mega efforts across states.
ReferencesACCESS. (2010). Unpublished Report. ‘Study on Con-
vergence Monitoring’ (December 2009–April 2010). New Delhi: ACCESS Development Services.
Kumar, Devesh. (2010). ‘NREGA Good but has Miles to Go, Says Plan Panel’, The Economic Times, quoting a Planning Commission report. New Delhi: ET Bureau, 26 March.
NCAER and PIF. (2009). Evaluating Performance of NREGA. New Delhi: National Council of Applied Economic Research & Public Interest Foundation.
Pankaj, Ashok and Rukmini Tankha. (2010). ‘Empowerment Effects of the NREGS on Women Workers: Study in Four States’, Economic & Political Weekly, 24 July 2010, Vol. XLV, No. 30.
Press Information Bureau (PIB). (2010). ‘Reaching Out to the Rural Poor Mahatma Gandhi NREGS Shows the Way’ dated 13 August 2010. New Delhi: Press Information Bureau, GoI.
Kakade, Seema. (2010). State Specific Convergence Efforts with MGNREGA. Available online at ftp://ftp.solutionexchange.net.in/public/emp/comm_update/emp-update-46-250510.pdf.
The Economic Times. (2010). ‘UPA gearing up to roll out NREGA-II’, The Economic Times, New Delhi Edition, 12 July.
UNDP. (2009a). ‘Green Jobs for the Poor—A public Employment Approach’, Discussion Paper. New Delhi: UNDP.
UNDP. (2009b). ‘List of Pilot Districts Identified for Convergence between NREGS and ongoing Schemes of Other Ministries’. UNDP’s Terms of Reference for Monitoring Convergence between NREGS and ongoing Schemes of Other Ministries. New Delhi: UNDP.
Table 3.3: Main benefits for small and marginal farmers from MGNREGA
Intervention Main benefit Labour intensive activities
Combating soil erosion (Land development, MGNREGA)
Maintained productivity of land Construction of earth structures, planting of (native) vegetation
Water harvesting (MGNREGA) Increased productivity of (ground) water
Construction of weirs and other structures such as underground tanks, ponds, renovation of traditional water bodies, desilting of tanks
Rehabilitation of degraded land (Working for Wetlands, Working for Woodlands, MGNREGA)
Restores ability of the land to provide ecosystem services such as water harvesting, purification, carbon sequestration and providing habitat to endangered species
Planting native vegetation, removal of alien vegetation and other man introduced structures, restoring streams and wetlands
Source: UNDP (2009a).
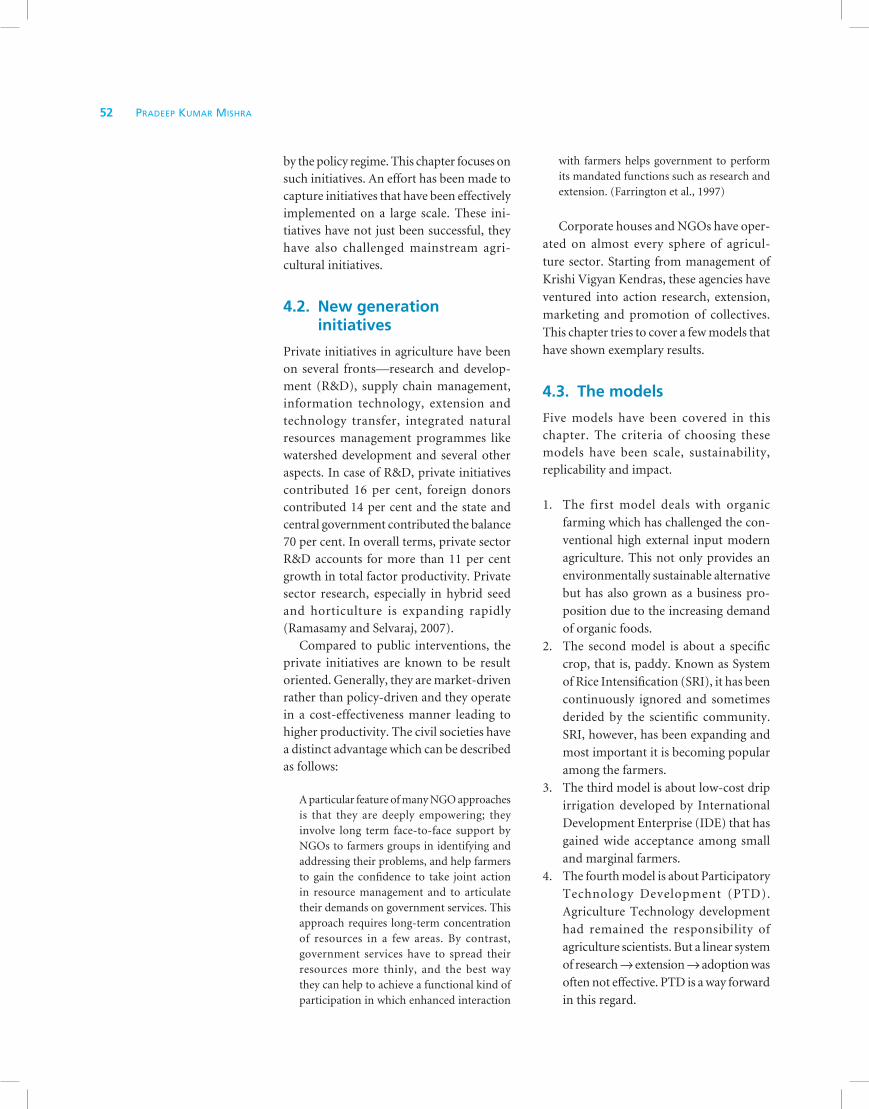
Chapter 4
New Generation Initiatives in Agri-based
Livelihoods—Five Successful Private Sector Initiatives
PradeeP Kumar mishra
4.1. Introduction
Indian agriculture, in the last century,
has passed through several phases and
the Government has played an important
role in it. In 1951, the sector contributed
around 50 per cent to the Gross Domestic
Product (GDP) and employed 70 per cent
of the population. This naturally made it a
focus sector for development. The trend is
reflected in the fact that plan expenditure
on agriculture, irrigation and flood control
was 37 per cent of total outlay in the First
Five Year Plan (Bhalla, 2007). The absolute
amount of expenditure on agriculture in-
creased consistently through the successive
plans although the proportion in total plan
outlay kept on decreasing. In the Tenth Plan,
it is 16.5 per cent.
Government initiatives in agriculture
sector have been primarily in developing
infrastructure like electricity, dams, canal
network, promoting scientific research and
extension through establishing a network of
agriculture universities, Indian Council for
Agriculture Research (ICAR) institutions
and Krishi Vigyan Kendras (KVKs). Broadly
speaking, the focus of government ini-
tiatives has been on research and extension is
directly aimed at production enhancement.
Parallel efforts by Civil Society Organiza-tions (CSOs) and corporate agencies on the other hand have been dealing with various aspects of the sector.
The parallel initiatives by private sector (including Non-Governmental Organ-izations [NGOs] and corporate agencies) have been significant. While some of them are localised in nature, others have made vast coverage. The rationale behind these initiatives is that mainstream interventions were not inclusive. Green Revolution was effective in making India self-sufficient in food grains but it created huge inequalities. Sections of farmers from dryland areas, hilly regions and a few socio-economic strata remained unaffected by majority of agriculture development initiatives. Either the technology was inappropriate or the policies did not fit into their social, cultural or geographical context. In some cases the markets did not support the initiative. Overall, there was huge scope for working on issues like equity and sustainability.
The National Agriculture Policy 2000 recognized the need for stepping up public and private investment in agriculture. Realizing that there exists a niche area, many private agencies entered the sector either on their own or after being enabled

52 PradeeP Kumar mishra
by the policy regime. This chapter focuses on such initiatives. An effort has been made to capture initiatives that have been effectively implemented on a large scale. These ini-tiatives have not just been successful, they have also challenged mainstream agri-cultural initiatives.
4.2. New generation initiatives
Private initiatives in agriculture have been on several fronts—research and develop-ment (R&D), supply chain management, information technology, extension and technology transfer, integrated natural resources management programmes like watershed development and several other aspects. In case of R&D, private initiatives contributed 16 per cent, foreign donors contributed 14 per cent and the state and central government contributed the balance 70 per cent. In overall terms, private sector R&D accounts for more than 11 per cent growth in total factor productivity. Private sector research, especially in hybrid seed and horticulture is expanding rapidly (Ramasamy and Selvaraj, 2007).
Compared to public interventions, the private initiatives are known to be result oriented. Generally, they are market-driven rather than policy-driven and they operate in a cost-effectiveness manner leading to higher productivity. The civil societies have a distinct advantage which can be described as follows:
A particular feature of many NGO approaches is that they are deeply empowering; they involve long term face-to-face support by NGOs to farmers groups in identifying and addressing their problems, and help farmers to gain the confidence to take joint action in resource management and to articulate their demands on government services. This approach requires long-term concentration of resources in a few areas. By contrast, government services have to spread their resources more thinly, and the best way they can help to achieve a functional kind of participation in which enhanced interaction
with farmers helps government to perform its mandated functions such as research and extension. (Farrington et al., 1997)
Corporate houses and NGOs have oper-
ated on almost every sphere of agricul-
ture sector. Starting from management of
Krishi Vigyan Kendras, these agencies have
ventured into action research, extension,
marketing and promotion of collectives.
This chapter tries to cover a few models that
have shown exemplary results.
4.3. The models
Five models have been covered in this chapter. The criteria of choosing these models have been scale, sustainability, replicability and impact.
1. The first model deals with organic
farming which has challenged the con-
ventional high external input modern
agriculture. This not only provides an
environmentally sustainable alternative
but has also grown as a business pro-
position due to the increasing demand
of organic foods.
2. The second model is about a specific
crop, that is, paddy. Known as System
of Rice Intensification (SRI), it has been
continuously ignored and sometimes
derided by the scientific community.
SRI, however, has been expanding and
most important it is becoming popular
among the farmers.
3. The third model is about low-cost drip
irrigation developed by International
Development Enterprise (IDE) that has
gained wide acceptance among small
and marginal farmers.
4. The fourth model is about Participatory
Technology Development (PTD).
Agriculture Technology development
had remained the responsibility of
agriculture scientists. But a linear system
of research → extension → adoption was
often not effective. PTD is a way forward
in this regard.

New Generation Initiatives in Agri-based Livelihoods 53
5. The fifth model is about the use of in-formation technology in integration of market channels by private corporations that has been able to promote inclusive growth.
4.3.1. Organic farming and certification
The need for organic farming in India arises out of the unsustainable nature of conventional farming. Monoculture, ex-cessive dependence on chemical fertilizers and pesticides, resulting in increased soil salinity and contamination of soil and water, are a few of the problems associated with current agriculture practices.
Although modest as compared to de-veloped countries, at an average of 96 kg per ha, intensity of use of fertilizer has been high in India. Much of this use is in irrigated areas. Eighty per cent of fertilizer is used in 33 per cent of gross cultivated area (Narayan, 2005, p. 31). Such practices impact both drinking as well as irrigation water. Long-term use of fertilizer also affects the soil health negatively. Excessive use of pesticide has increased toxic residues in food grain, fodder, vegetable, meat and milk (Dhaliwal and Singh, 1993). Daily pesticide intake of individuals has increased above acceptable level (Prakash, 2003). Organic farming is an alternative for reducing negative impact of modern agriculture.
While organic farming has potential to overcome the negative aspects of con-ventional high external input agriculture, there is another reason for its increasing importance. Rich nutrient content and lower toxic residue in organic foods has led to increase in demand of organic products worldwide.
Organic agriculture movement in India received inspiration and assistance from International Federation of Organic Agriculture Movements (IFOAM), which has 750 organizational members from 116 countries (IFOAM, n.d.). All India Federation of Organic Farming (AIFOF) is a member of IFOAM and consists of
a number of NGOs, farmers’ organiza-tions, promotional bodies and institutions (Narayan, 2005).
Extent of organic farming in India: According to IFOAM, India has 1.02 million ha land under organic farming. Among developing countries, only Argentina, China and Brazil have more land under organic farming. Globally, 35 million ha of agricultural land is under organic farming. The world has about 1.4 million organic producers. This is a sevenfold increase in the last ten years (Willer, 2010). India, with 340,000 organic crop growers, tops the list. This is primarily because the small size holdings of Indian farmers.
The global market for organic agricul-tural produce is 50 billion US dollars, of which the United States alone consumes about half of all organic produces (Sahota, 2010). India’s organic exports amount to 125 million US dollars. The government is planning to increase to one billion US dollars in next five years (Organic Monitor, 2010).
Challenges: The main challenges in organic farming are related to certification, which needs strong monitoring and adherence to standards in cultivation and input appli-cation. Awareness among farmers regarding certification is rather low. Another important issue related to organic farming is the organic market is a premium market and steep growth would mean overdependence on export that could be risky sometimes.
Morarka foundation initiatives in organic agriculture development:1 The MR Morarka-GDC Rural Research Foundation (henceforth mentioned as Morarka Foundation), established in 1991 by leading industrialist Kamal Morarka, is headquartered in Jaipur. The organization is a leading name in the field of organic farming in India. Morarka Foundation’s involvement with agriculture development started in 1995 when, supported by the
1 This section has been primarily drawn from websites of Morarka Foundation and Morarka Organic. (Morarka Foundation, n.d.; Morarka Organic, n.d.).

54 PradeeP Kumar mishra
Directorate of Agriculture of Government of Rajasthan under a World Bank aided project, the Foundation implemented an agriculture extension project in 60 villages of Nawalgarh block of Jhunjhunu district of Rajasthan. It covered 10,000 farm families cultivating 25,000 ha of land, (Morarka Foundation, n.d.). In the subsequent years, the organization implemented District Rural Development Agency (DRDA) supported watershed development projects and Department of Biotechnology supported pro- ject on biological management practices under which organic farming components were taken up.
While implementing these projects, the Foundation’s extension functionaries found high cost of cultivation to be a major problem for the farmers. As a solution to the problem, the Foundation started pro- moting vermiculture.2 By 2000, the Foun-dation had become the largest producer of vermicompost in the world. The Foun-dation currently has a capacity of produc-ing five million tonnes of vermicompost per year (Morarka Foundation, n.d.). The on-farm fertility management tech- nology, that is, vermiculture was awarded for excellence in technology innovation by the Ministry of Science and Technology, Government of India in the year 2001 and 2002. Subsequently the organization expanded operations to other states.
While working on its on-farm fertility management concept, the Foundation realized the increasing demand of organic food and certification procedures. The organic farming interventions made by the organization became a building block for this idea. It promoted record maintenance procedures for meeting organic certification requirements. Subsequently, it developed an Internal Control System for Quality Management and Certification (ICQS). In the first two years about 4,000 ha area was covered. Currently the programme covers about 250,000 farmers registered under
ICQS across 15 Indian states. Over 50,000 of these farmers are also certified by various international certification agencies.
The Foundation has also assisted entre-preneurs and private companies in venturing into organic farming. Collaborating with professionals, scientists, farmers, private sector companies, it has been able to build strong organic agribusiness value chain enterprises. The organization has facilitated linkages between organic producers and traders. In the year 2006–07 it promoted an independent for profit agency, Morarka Organic Foods Pvt. Ltd., for marketing the produces to facilitate direct linkage between the consumer and producers. The com- pany has ventured into international oper-ations (Morarka Organic, n.d.).
4.3.2. System of rice intensification The System of Rice Intensification (SRI), an innovation in the field of rice cultivation done outside the agriculture establishment, was developed by late Fr Henri de Laulaníe, a priest with knowledge on agriculture, in 1983, as he observed a strange increase in yield when transplanted early (Rabenandrasana, 1999). Early experimentations were done in Madagascar. After experimentations, a set of principles for SRI (Box 4.1 gives a summary of it) was perfected. But till 1999, it remained to be a local phenomenon limited to Madagascar. But, SRI today has been widely experimented in 22 countries across the world.
SRI means different things to different stakeholders. Originally, a set of principles applied to the farming; the rice research establishment has taken it as a technique (Shambhu Prasad, 2006). The criticism of the scientific community has been mainly because of the problems related to its standardization as a technique. However, the issue of standardization did not arise in the case of civil society as for them it is a set of principles. The concept spread despite a lukewarm response from the agricultural establishments. Interestingly, the apathy to SRI from establishment has been a worldwide phenomenon.
2 Vermiculture means artificial rearing of earth-worms. The excreta of earthworms is known as vermicompost which is rich in organic content.

New Generation Initiatives in Agri-based Livelihoods 55
SRI spread rapidly as farmers found it
practical and significantly higher yield was
observed. It had environmental benefits too,
as it does not encourage use of chemical
fertilizers. In 2002, 15 countries shared ex-
periences related to SRI in an international
seminar in China. The conference not
only pooled the experiences from several
countries but it also opened new avenues
for making it a large-scale practice.
Unlike the hybrid seeds, propagation
of SRI did not receive much support from
the scientific community. In fact, they
resisted its popularization. The credit for
propagation of SRI goes to civil society
organizations (Shambhu Prasad, 2006).
SRI in India: In India, the first trial of
SRI was undertaken by Dr Thiyagarajan
of Tamil Nadu Agricultural University
(TNAU) after he attended the 2000 seminar
in China. However, the TNAU experiment
was a modified version of SRI where only
three of the SRI principles (single seeding,
wider spacing and use of weeder) were
followed (Thiyagarajan, 2002). The initial
results were not very encouraging and the
yield level was less than the conventional
method of rice cultivation. Later, the farmers
from Andhra Pradesh and Tamil Nadu were
sponsored by Cornell International Institute
for Food, Agriculture and Development
(CIIFAD) for an exposure trip for SRI to
Sri Lanka. Acharya N.G. Ranga Agricultural
University, Hyderabad also took a keen
Box 4.1: The SRI concept
The basic concepts of SRI can be summarized as follows:
1. Use young seedlings to preserve mature plant’s growth potential (these days direct seeding is also being tried out).
2. Avoid trauma to the roots. Transplant quickly, shallow (1–2 cm), with no inversion of seedlings root tips as that delays the plants resumption of growth after transplanting.
3. Give plants optimally wider spacing.
4. Keep paddy soil sufficiently moist but not continuously flooded, mostly aerobic and not saturated.
5. Actively aerate the soil as much as possible, using a rotary hoe or cono weeder to control weeds.
6. Enhance soil organic matter as much as possible by applying compost, mulch, manure, etc. Chemical fertilizers can be used with SRI, but the best results have come with organic soil amendments.
Source: Paraphrased from Uphoff (n.d., p. 5).
interest in SRI. Alapati Satyanarayana,
Director of Extension, an initial sceptic,
became one of its proponents (Shambhu
Prasad, 2006).
Civil Society initiatives on SRI have been
much more extensive. Professional Assist-
ance for Development Action (PRADAN),
a rural development agency, experimented
SRI in Jharkhand and West Bengal;
Timbactu Cooperative in Andhra Pradesh;
People’s Science Institute in Uttarakhand
and Himachal Pradesh; Centre for Rural
Development Training in Karnataka; while
M.S. Swaminathan Research Foundation
(MSSRF) experimented in several states.
Many other agencies played a key role
in popularizing concept and practice of
SRI. The World Wildlife Fund for Nature
(WWF) negotiated for policy change for
its wider propagation. A joint project of
WWF and International Crops Research
Institute for Semi-Arid Tropics (ICRISAT)
has supported SRI experimentation in
several states.
Awareness and knowledge about SRI has
spread not through agricultural universities
and extension officials, but through internet
and farmers to farmer. Media too played
a key role by highlighting significant
impro-vements in yield because of SRI,
though at times its report did misinterpret
information (ibid.).
The reported increase in yield due to SRI
has been to the extent of 1.5 to 2.54 tonnes/ha

56 PradeeP Kumar mishra
in Tamil Nadu and Andhra Pradesh (Satyanarayana, 2004; Thiyagarajan et al., 2005). The highest yield has been to the extent of 17.2 tonnes/ha (Satyanarayana, 2004; Punna Rao and Satyanarayana, 2005). Decrease in consumption of water, increase of straw yield, increase in labour productivity resulting in net returns to the extent of 67 per cent has been reported (Sinha and Talati, 2005).
In recent years, however, the govern-ment has shown keen interest in promoting SRI. National Bank for Agriculture and Rural Development (NABARD) has taken a lead in providing support to such initiatives. Various state governments have also come forward and provided support.
Because SRI is a set of principles rather than a technique, it has been adopted with modifications by farmers. This is the primary reason behind its growing acceptance. This very nature of SRI has been a reason behind its non-standardization as a technique, resulting in serious criticism from the scientific community. Faulty measurements, methodological difficulties in experimentation, difficulty in large-scale propagation are the major criticisms regarding SRI by the scientific community (Shambhu Prasad, 2006). Sinclair (2004) considers the results of SRI as ‘unconfirmed field observations’, which cannot be accepted until the research is described in an unbiased manner in scientific journals reviewed by anonymous referees.
Irrespective of the criticisms, SRI has gained popularity among farmers and non-research stakeholders. Its eco-friendliness, significant yield improvements and saving on scarce inputs like water is the reason for its adoption.
4.3.3. Low-cost drip irrigation technology
The idea of low-cost drip irrigation was born by accident. Paul Pollock, the founder of International Development Enterprise (IDE), was having discussions with a banker in Nepal about introducing Rainbird type
sprinklers. These sprinklers are pressured by 10,000-litre tanks located in small streams 20 metres vertically above the field. During interaction with farmers, they found that the systems were effective, but at about 1,000 dollars, was affordable only with government subsidy. The 10,000-litre tank contributed to about 30 per cent of the cost. Thus developed the idea of designing a low-cost system. Based on this and with inputs from engineers, a 30-dollar system was designed using high density polyethylene (HDP) pipe, a used 55 gallon drum and a simple cloth filter (Polak, n.d.).
It took another five years to perfect and adapt the system and to finally develop a low-cost drip irrigation system. IDE India then tested the same in fields and observed that in comparison to conventional flooding method this produced additional crop yield of 30 per cent or more using half the amount of water. Keeping in mind the Indian and Nepalese conditions, drip systems ranging from 20 sq mts to 10 acres were developed. As a result, the resource-scarce farmers can start with smaller areas and add to it later. Cost was further decreased by replacing im-ported kits with a locally available bucket.
By that time, India already had a large market for drips, with about 50 drip system manufacturers. The drips cost about 750 dollars per acre. The IDE system brought down the cost to almost a third. However, existing manufacturers were not convinced of the system, hence IDE established two assembly plants of its own for this purpose. In the first two years, 10,000 units of drip sets were sold in India and Nepal (ibid.). Today the mirco-irrigation system is used by 250,000 farmers in India (IDE, 2009).
4.3.4. Participatory technology development
Starting with Grow More Food Campaign and followed by the Green Revolution, India has evolved from a food deficit country at the time of independence to being self-sufficient in food-grain production. However, Green Revolution brought with it a number of

New Generation Initiatives in Agri-based Livelihoods 57
problems. The chief being that it could not bring about equitable distribution of benefits and that the approach was largely envir-onmentally unsustainable. Dwarikanath (2007) observes that the hurried progress of Green Revolution processes lost sight of a healthy farming system and farmers were rarely guided adequately beyond crops and yields.
The Green Revolution extension system was largely top-down, where farmers’ par-ticipation was minimal. Given its utility and simplicity of the measures, Green Revo-lution was a great success. But a large group of farmers, particularly the resource-scarce ones and the farmers from rainfed area remained bereft of the benefits. The Green Revolution measures were limited to a few selected crops like wheat and rice.
An average resource-scarce farmer does not have much access to technology and capital; he/she cannot even take much risk; has a mixed farming approach which in-cludes pulses, coarse cereals, livestock, and elements overlooked by the mono-cropping system of modern agriculture. For a small/marginal farmer food security of the household held the key to his/her decisions. This was one of the reasons why many farmers could not adopt Green Revolution methods.
Participatory Technology Development (PTD) is a counter-approach. It is a paradigm and does not involve replacing a particular input with another or introducing particular technology (Box 4.2). It speaks about em- powering the farmers in the process of tech- nology development, recognizing that farmers experiment on their fields and they bring in valuable insights that go undocumented and lost. Thus, the farmers’ informal experimentation helps in developing locally appropriate technologies regardless of whether they are supported by the scientific community. Veldhuizen et al. (2005) say that it is the field workers of local NGOs rather than scientists who recognize and understand how farmers experiment. In operational terms, PTD is defined as:
A long-term interaction between outsiders and local people, with the aim of generating innovations based on indigenous knowledge and cultures to develop sustainable livelihood systems. It involves and links the power and capacities of agricultural research with the interests and knowledge of local com-munities. (Salas et al., 2003, p. 4)
In contrast to conventional training and visit approach, PTD has an element of em-powerment of farmers. It is a participatory action research method where there is dialogue between outsiders (scientists or experts) and farmers for working out a technology development process that is suitable to the area and acceptable to the farmers. Thus, PTD brings a paradigm shift in the knowledge system of agriculture. PTD has an inbuilt system of capacity building of farmers as they actively participate in the technology development process. The SRI system too is a kind of PTD.
Agriculture Man Ecology Foundation (AME) and experience of PTD:3 AME is a Bangalore-based support organization operating in South India since mid-1980s. Aiming at promoting eco-friendly and sustainable agriculture, AME works with PTD as its ‘entry strategy’. AME follows PTD using PRA, Farmer Field Schools (FFS) in Integrated Pest Management (IPM) and Rapid Assessment of Agricultural Knowledge Systems (RAAKS). AME’s interventions start with field-level guidance to farmers and NGO field staff, and the lessons learnt in the PTD processes are then fed upwards to formal agricultural research establish-ments (Naidu and Walsum, 2002). Box 4.2 discusses the process followed in PTD.
AME operates in drought-prone Deccan Plateau which, with annual rainfall ranging from 500 to 900 mm and 81 per cent of the area, is under rainfed crops. Because existing research institutions focused mainly on irrigated agriculture, AME worked to assist NGOs involved in promoting sustainable
3 This section has been largely drawn from Naidu and Walsum (2002).

58 PradeeP Kumar mishra
agriculture in the Deccan Plateau. AME is
not an implementing agency. It guides field-
level facilitation through other NGOs and
communicates the learnings to policy level
and research institutions. It also involves
banks, input suppliers, processing units
and storage experts in deliberations on
PTD processes.
Since 1996, the Netherlands Government
has been giving AME an exclusive support
to act as a catalyzing agency, with aim to
enhance linkages between the biomass
actors in Deccan Plateau region. In 1997,
a bilateral project was worked out that
endorsed the mandate given to AME.
AME started PTD activities in 1997 with
270 farmers. During the next five years,
it directly covered 2,500 farmers and ex-
tended its reach to another 10,300 through
extension farmers, who are not part of PTD
but come for an exposure to technologies
developed in PTD process. The outcomes
of PTD processes are as follows:
l Increased yields: paddy 20–40 per cent, cotton 10–20 per cent, groundnut 20–30 per cent
l Increased quality of producel Decreased risk and yield stability l Increase in farm biodiversity because
of inter/mixed cropping, trees, green manure
l Reduced pest and disease incidence l Reduced cost of fertilizers to the extent
of 40 per centl Higher net profits because lower
cultivation costs. Paddy 30–40 per cent, cotton 20–30 per cent, groundnut 10–20 per cent
l Better soil health and enhanced moisture retention capacity
l Higher crop productivity in subsequent years due to residual effect of manure (Naidu and Walsum, 2002)
AME works with all categories of farmers. But farmers with very low resource levels are generally not able to be directly involved in
Box 4.2: The PTD process
Initial assessment of problems in agriculture is done through participatory assessments methods such as Participatory Rural Appraisal (PRA) and Rapid Assessment of Agricultural Knowledge Systems (RAAKS). This includes understanding key actors, their perceptions, possible solutions to the problems and possible areas of collaboration.
This is followed by training of farmers as well as of NGO staff. The training is par-ticipative and experiential and includes PTD concepts, approach, problem identification, gender mainstreaming, monitoring and evaluation. Farmers are encouraged to share their knowledge about indigenous technologies. The focus of the PTD processes is primarily on testing and adapting eco-friendly technologies that had been developed elsewhere.
Sharing between the ‘primary’ stakeholders takes place in several ways: during the weekly field visits of NGO personnel, during training conducted by Agriculture Man Ecology Foun-dation (AME), at monthly review meetings
between AME and NGO and at a meeting with farmers and NGOs to evaluate PTD results. Researchers and government extension staff are also invited to join at important stages in a PTD process.
Scal ing up is done through three approaches:
l Farmer to farmer l Farmer to farmer groupl Farmer group to network/federation
Monitoring is done at four levels, indi-vidual farmer, SHG, NGO and AME. Farmers’ monitoring and evaluation focus on crop performance, labour requirements and cost-benefit analysis. A system for documentation is set up and maintained. This has been a difficult process as most people involved in PTD were field workers and their documentation skills are not very good.
Source: Naidu and Walsum (2002).

New Generation Initiatives in Agri-based Livelihoods 59
PTD experiments as at least 2–3 acres are required so that some land can be spared for experiments. However, the resource-scarce farmers get indirect exposure as ‘extension farmers’ learning from those who have been directly involved in the experiments.
The problems associated with PTD were primarily institutional. As PTD is process oriented and time consuming, NGOs found it difficult to implement. During the first two years of the initiatives, a number of technologies had been tested. They thought that it was time to spread the ‘proven’ technologies to other farmers, villages and NGOs in their networks rather than continuing in the experimental mode.
4.3.5. IT-enabling supply chain Information technology (IT) revolution-alized India’s economy in the 1990s. The use of IT in industry and services provided India an edge in the beginning of 21st century. However, IT-driven efficiency in agriculture was not thought of by many.
Traditionally, farmers sold their produces in Mandis. The network of Agricultural Produce Market Committee (APMCs) promoted by Government were the hub of transactions. The Mandi system was plagued with problems such as excessive exploitation by middlemen and lack of sufficient information to farmers. Only the traders had access to price-related infor-mation and farmers were exploited by their unfair practices.
For example, soyabean is exempted from India’s small-scale industries regulations to allow for processing in large, modern facilities. But 90 per cent soyabean crop was sold by farmers with small holdings to traders in Mandi. In Mandi system, even if the farmers have some tentative idea about the price trend (Annamalai and Rao, 2003) they often have to accept a price collusively decided by the traders.
Many interventions have been intro-duced, recognizing information asymmetry as an important bottleneck. Radio and
newspapers regularly publish current prices, but only internet could provide the real time information. But much of rural India does not have access to internet. Many NGOs and corporate agencies have their own initiatives in this regard. For example, the Morarka Foundation in Rajasthan introduced information flow on price of commodities through pagers. However, the first large-scale initiative, popularly known as ‘e-choupal’, was made by ITC Ltd. Today we have many other similar initiatives like Common Service Centres (CSC), which provide many more services and also have a much higher spread. E-choupal being the first large-scale initiative is an excellent example to discussion.
E-choupal initiative of ITC: E-Choupal began in 2003 as an ITC initiative. It targeted the small and marginal farmers, three-fourth of the farmer population, for providing timely and relevant information on several issues—weather, transparent price discovery and technical know-how about farming.
The e-choupal is connected through Very Small Aperture Terminal (VSAT), wireless or local telecommunication infrastructure. Solar battery chargers and uninterruptible power supply (UPS) are provided considering large spells of electricity failure in rural areas. The e-choupal is run by a ‘Sanchalak’ who has been trained to access the web portal and pass on information to farmers. There is also a ‘Samyojak’, that is, a commission agent covering 40 e-choupals, whose role is facilitating cargo procurement process (FAO, n.d.).
The system is designed to gather customer information too. This helps in understanding the location, consumer preference, financial position and credit worthiness (ibid.). The information kiosk is also used for reverse flows like agriculture inputs, Fast Moving Consumer Goods (FMCGs), etc. By linking physical infrastructure with virtual space, the e-choupal initiative has been able to bring a transformation in agricultural procurement in rural India. Today, there is a network of

60 PradeeP Kumar mishra
6,500 e-choupal centres covering 40,000 villages across 10 states of India. About four million farmers use this facility for trading commodities like wheat, rice, pulses, soya, maize, spices, coffee and aqua-products. The reverse flow carries FMCG, durables, automotives and banking services back to villages (ITC, n.d.).
In response to the huge potential, ITC has added Choupal Sagars as a component to the initiative. Choupal Sagars are made-to-design agribusiness hubs that offer the following combination of services to rural India:
l ITC agri-sourcing centres to provide farmers a transparent best price sales window
l Shopping centres offering a product range comparable to urban areas
l Facilitation centres delivering a host of farm-related services such as training, soil testing, product quality certification, medical and clinical services, cafeteria and fuel station
Twenty-Four Choupal Sagars are oper-ational in three states.
E-choupals have brought down trans-action costs to the extent of 1.5 to 2 per cent. Services like quality testing have helped farmers fetch premium prices for their superior produces. It has improved com-petitiveness in agricultural commodity mar-ket. However, challenges still remain, as the initiative, unlike other trading initiatives, required huge investments. Even today, quality testing, bulk storage, inadequate connectivity and power pose challenges (FAO, n.d.).
4.4. Conclusion
The five large models ranging from a farming system to the application of IT are completely different from each other. They target different aspects of agriculture and hence cannot be a comparatively an-alyzed. But all the five models have some commonality.
All the models are eco-friendly and
therefore environmentally sustainable.
While organic farming and SRI have been
designed to be so, PTD and low-cost drip
systems encourage low external inputs
and water saving. Information technology
has helped building an efficient supply
chain, indirectly contributing to saving of
resources.
Most of the models are cost effective.
Higher productivity makes SRI and organic
farming cost effective while the low-cost drip
is by design sustainable in financial terms.
The PTD is process oriented and hence has a
transaction cost but once institutionalized,
its long benefits would far exceed its cost.
The e-choupal model needs a high initial
cost and hence it is yet to pay back. However,
the fact that it has brought down the trans-
action costs makes it beneficial for the
society and private benefit is assured in the
longer run.
All the five models have been imple-
mented at a large scale. The simplicity of
the system, openness for farmers’ inclusion
and use of cost-effective mechanisms were
key to scaling up.
In terms of replicability too, the models
are positively placed. However, space for
adaptation is essential as they are based on
innovative ideas targeted at a perceived niche
area. Replication of SRI is a case in point.
Replication of SRI does not always give
encouraging results and this is the primary
reason for resistance in the establishment
for SRI.
The main implications of the above
discussion are as follows:
l India is a vast country with diverse
climatic situations and diverse livelihood
patterns, and, therefore, there exists
an immense scope for out of the box
solutions. Innovative initiatives, in the
area of technology, markets, systems or
processes can have positive impact on
livelihoods of agriculture-dependent
households.

New Generation Initiatives in Agri-based Livelihoods 61
l New generation initiatives need not (and actually do not) comply with established pattern of thinking. Concepts like SRI cannot be directly accommodated in scientific research processes. Irrespective of all criticisms, SRI has been successfully implemented. Policies, hence, should provide enough room for such inno-vations to come up and bloom.
l New initiatives are not static approaches. The e-choupal transformed into Choupal Sagar and SRI is being tried out for dif-ferent crops and in different forms. It is not the original idea or the nomenclature that is important (which generally is an issue in formal establishments), but how far it contributes to enhancing people’s livelihoods.
l As these are private initiatives, financial viability contributes a lot to the changes in the concepts.
These innovative models have developed because of out of the box thinking. Hence, some specificity is bound to exist. Policy-makers and the scientific community should work towards standardizing these models to local conditions. An interesting feature of these models is that they have developed without much support from public funding and public institutions. And at times, public institutions have used small drawbacks in the model to reject or criticize them. These models represent a different paradigm, and the establishment must provide an enabling environment for such initiatives.
References
Annamalai, K. and Sachin Rao. (2003). ‘What Works: ITC’s E-Choupal and Profitable Rural Transformation: Web-based Information and Procurement Tools for Indian Farmers’. Available online at http://www.value-chains.org/dyn/bds/docs/292/ITC%20e-choupal%20India.pdf. Accessed on 5 July 2010.
Bhalla, G.S. (2007). Indian Agriculture since Independence. New Delhi: National Book Trust.
Dhaliwal, G.S. and B. Singh (eds). (1993). Pesticides: Their Ecological Impact in Developing Countries. New Delhi: Commonwealth Publishers.
Dwarikanath, R. (2007). Some Insights into Agriculture Development Today, AMEF Policy Advocacy Series 2. Bangalore: AME Foundation.
FAO. (n.d.). ‘Bridging the Rural Divide: Case Study Community based Transformation Systems, India, ITC-E-Choupal’. Available online at http://www.fao.org/rdd/doc/ITC%20e-Choupal.pdf. Accessed on 5 July 2010.
Farrington, John, Rasheed Sulaiman V. and Suresh Pal. (1997). ‘Strengthening Research and Extension for Rainfed Farming: Role of Social Science and Institutional Factors’, Policy Brief 5. New Delhi: ICAR. Available online at www.ncap.res.in/upload_files/policy_brief/pb5.pdf. Accessed on 29 June 2010.
IDE. (2009). ‘Annual Report 2008’. Available online at http://www.ideorg.org/OurStory/2008_Annual_Report_web.pdf. Accessed on 5 July 2010.
IFOAM. (n.d.). ‘About the International Federation of Organic Agriculture Movements’. Available online on http://www.ifoam.org/about_ifoam/index.html. Accessed on 10 August 2010.
ITC. (n.d.). ‘E-choupal: E-empowering Indian Farmers’. Available online at http://www.itcportal.com/rural-development/echoupal.htm. Accessed on 5 July 2010.
Morarka Foundation. (n.d.). ‘Organic Agriculture Development and Promotion’. Available online at http://www.morarkango.com/organic_agriculture/index.php. Accessed on 29 June 2010.
Morarka Organic. (n.d.). ‘Our Story–Our Roots’. Available online at http://www.morarkaorganic.com/our_roots.html. Accessed on 3 August 2010.
Naidu, Y.D. and Edith van Walsum. (2002). ‘PTD for Sustainable Dryland Agriculture in South India: Balancing Our Way to Scale, Participatory Technology Development’. Working Paper 7, Netherlands, ETC Ecoculture.
Narayan, S. (2005). Organic Farming in India: Relevance, Problems and Constraints, Occasional Paper 13, Mumbai, NABARD.
Organic Monitor. (2010). ‘India: Government Sets Ambitious Organic Export Target’. Available online at http://www.organicmonitor.com/asia.htm. Accessed on 5 July 2010.
Polak, Paul. (n.d.). ‘The Design Process for the IDE Low Cost Drip Irrigation System’. Available online at http://www.its.caltech.edu/~e105/readings/cases/IDEdrip.pdf. Accessed on 29 June 2010.
Prakash, T.N. (2003). A Theoretical Framework to Promote Organic Produce Marketing in India, Indian Journal of Agriculture Marketing, Conference Number Special, pp. 1–16.
Punna Rao P. and A. Satyanarayana. (2005). ‘Producing More Rice With Less Water Farmers, Researchers and Extensionists’ Experiences and Impressions with System of Rice Intensification in Andhra Pradesh’, paper presented in 4th Annual

62 PradeeP Kumar mishra
IWMI TATA Partners Meet on ‘Bracing up for the Future’, Anand, Institute for Rural Management, 24–26 February.
Rabenandrasana, Justin. (1999). ‘Revolution in Rice Intensification in Madagascar’, ILEIA Newsletter, 15(3/4): 48–49. Available online at http://www.metafro.be/leisa/1999/48-49.pdf. Accessed on 29 June 2010.
Ramasamy, C. and K.N. Selvaraj. (2007). Prioritizing Agricultural Research and Extension, INRM Policy Brief No. 15. New Delhi: ADB.
Sahota, Amarjit. (2010). ‘The Global Market for Organic Food and Drink’. Available online at http://www.organic-world.net/fileadmin/documents_organicworld/yearbook/yearbook-2010/sahota-21010-market.pdf. Accessed on 5 July 2010.
Salas, Maruja, Xu Jianchu and Timmi Tillmann. (2003). Field Manual Participatory Technology Development (PTD): Linking Indigenous Knowledge and Biodiversity for Sustainable Livelihoods, 2nd printing (electronic version) 2004. Kunming: Yunnan Science and Technology Press. Available online at www.mtnforum.org/rs/ol/counter_docdown.cfm?fID=544.pdf. Accessed on 6 October 2010.
Satyanarayana, A. (2004). ‘The System of Rice Intensification: Evaluations in Andhra Pradesh’, paper presented at World Rice Research Conference, Tokyo-Tsukuba, 4–7 November, 2004 in Shambhu Prasad, 2006.
Shambhu Prasad, C. (2006). System of Rice Intensification in India: Innovation, History and Institutional Challenges. Hyderabad: ICRISAT.
Sinha, S.K. and Jayesh Talati. (2005). ‘Impact of System of Rice Intensification (SRI) on rice yields: Results of a new sample study in Purulia district, India’, paper presented in 4th Annual IWMI TATA Partners Meet on ‘Bracing up for the Future’, Institute for Rural Management, Anand, 24–26 February.
Sinclair. (2004). ‘Agronomic UFOs Waste Valuable Scientific Resources’, Rice Today, July–September 2004, p. 43. Available online at http://www.irri.org/publications/today/pdfs/3-3/grain3-3.pdf. Accessed on 29 June 2010.
Thiyagarajan, T.M. (2002). ‘Experiments with a Modified System of Rice Intensification in India’, in Uphoff et al. (eds), Assessments of the System of Rice Intensification (SRI): Proceedings of an International Conference held in Sanya, China, pp. 137–139, 1–4 April, 2002, in Shambhu Prasad, 2006.
Thiyagarajan, T.M., K. Senthilkumar, R. Priyadarshini, K. Ezhilrani, S. Jothimani, P.M.M. David, J. Sundarsingh, A. Muthusankaranarayanan, Huib Hengsdijk and Prem S. Bindraban. (2005). ‘System of Rice Intensification for Enhanced Water and Rice Productivity in Tamil Nadu, India’, paper presented in 4th Annual IWMI TATA Partners Meet on ‘Bracing up for the Future’, Institute for Rural Management Anand, 24–26 February, in Shambhu Prasad, 2006.
Uphoff, Norman. (n.d.). ‘The System of Rice Intensification as a System of Agricultural Innovation’. Available online at http://www.future-agricultures.org/farmerfirst/files/T1c_Uphoff.pdf. Accessed on 24 May 2010.
Veldhuizen, Laurens van, Ann Waters-Bayer and Chesha Wettasinha. (2005). ‘Participatory Technology Development: Where There is No Researcher’, in Julian Gonsalves, Thomas Becker, Ann Braun, Dindo Campilan, Hidelisa de Chavez, Elizabeth Fajber, Monica Kapiriri, Joy Rivaca-Caminade and Ronnie Vernooy (eds), Participatory Research and Development for Sustainable Agriculture and Natural Resource Management: A Sourcebook, Volume 1: Understanding Participatory Research and Development, CIP-UPWARD/IDRC.
Willer, Helga. (2010). ‘Organic Agriculture Worldwide: Key Results from the Global Survey on Organic Agriculture 2010’, presentation based on Helga Wiler and Lukas Kilcher (eds), The World of Organic Agriculture. Statistics and Emerging Trends, 2010, IFOAM, Bonn, and FiBL, Frick. Available online at http://www.organic-world.net/2010-presentations.html. Accessed on 5 July 2010.

Chapter 5
Financing Agriculture—Emerging Scenario
Biswa Bandhu Mohanty
5.1. Introduction
Agriculture, the backbone of rural livelihood security system, contributes 17 per cent of India’s Gross Domestic Product (GDP). But its relevance in India’s economic, social and political fabric is much more than its contribution to GDP. To quote the ‘All India Rural Credit Survey’ (1954), ‘India is essentially Rural India and Rural India is virtually the cultivators, the village handicraftsmen and the agricultural labour.’ Rural India is home to 74 per cent of the country’s 1.15 billion population. Agri-culture provides employment to nearly 52 per cent of the total workforce. Fifty-seven per cent of the total population is directly or indirectly dependent on agriculture and allied sector. Its growth is essential for self-reliance, ensuring food and nutritional security, realizing equitable distribution of income and wealth, poverty alleviation and improving quality of life. Agriculture is also an important source of raw material as also the source of consumption for many industrial products, particularly fertilizer, pesticides, agricultural implements and consumer goods. Growth in agriculture has a cascading impact on other sectors.
India with its wide range of agro-climatic conditions, soils and crops, is one of the 12 mega centres of biodiversity in the world. It has 2.3 per cent of the world’s land area and 4 per cent of the earth’s fresh water resources. But it feeds about 17 per cent of the world’s population. It has 11.6 per cent of world’s irrigated area, even though only 60 per cent of our irrigation potential has
been harnessed till date. The production of food grains during 2008–09 was estimated to be 229.85 million tonnes. India is one of the leading countries in production of milk, tea, pulses, rice, wheat, fruits, groundnut, coffee, sugarcane, coarse cereals and cotton. We have witnessed the successes of Green Revolution (wheat) and White Revolution (milk). But despite having the third largest skilled manpower and varied resource base, India’s productivity is not even one-third of the best achieved anywhere in the world.
The financing of agriculture as a critical input is reinforced by the unique role of the Indian agriculture in India’s economy and its role in poverty alleviation. Financing agriculture is not just financing an economic activity, but an intervention that has huge implications for the agriculture productivity, well-being of the farming community, food security and environmental sustainability.
Credit is one of the financial services required for agriculture and the ‘financial services’ are one of the several components of investments made in agriculture. Invest-ments would include farmer’s own labour, seeds saved by him, his other savings, ex-tension services and his borrowings. Farmers borrow from multiple sources, both formal and informal. Informal sources encompass social networks, moneylenders, chit funds, traders, microfinance organizations (MFOs) and other unregulated entities. Formal institutions include Commercial Banks (CBs), Regional Rural Banks (RRBs), Cooperative Banks and Non-Banking Financial Companies (NBFCs). Formal

64 Biswa Bandhu Mohanty
(1966) recommended that CBs should play a complementary role along with cooperatives for extending credit for agriculture.
The second phase is from nationalization of banks in 1969 to liberalization in 1991. The nationalization of CBs acted as a catalyst for extending agri-credit with widening of branch network in rural areas. The concept of Priority Sector was introduced specifying that certain portion of Adjusted Net Bank Credit (ANBC) be deployed in the sector for the target group (e.g., 18 per cent for Agriculture, 10 per cent for Weaker Section, 5 per cent for Women, etc.). Lead Bank Scheme, introduced in December 1969, made specific banks in each district the key agency for local development by entrusting them with responsibility for evolving a coordinated approach to credit deployment, in consultation with banks and other agencies. Three objectives, namely low rate of interest for agriculture, directed lending for the disadvantaged and evolving responsive institutional delivery system were pursued. The onset of Green Revolution by 1970s focused on credit for purchase of inputs, such as fertilizers, high yielding varieties of seeds, pump sets, irrigation, etc., in agriculture. RRBs were set up in 1976 to primarily meet the credit needs of Small Farmers (SF) and Marginal Farmers (MF). National Bank for Agriculture and Rural Development (NABARD) was establi-shed in 1982 to play central catalytic role in financing, promoting and supervising agriculture and rural credit institutions for ‘integrated rural development’. In 1989, Service Area Approach (SAA) was adopted wherein service area villages were identified and assigned to bank branches, based on their proximity and contiguity. Credit Plans were prepared, on annual basis, for the service area of each branch, which involved coordination between various developmental institutions and credit institutions.
Dur ing the th i rd phase (pos t -liberalization from 1991 till date), a series of reforms measures was undertaken in
institutions generally provide production Short Term (ST), Medium Term (MT), Long Term (LT) loans and bridge loans. They also reschedule LT loans and convert ST/MT loans in case of natural calamities or other distress situations.
5.2. Agriculture credit over years
Rural indebtedness has been an issue of concern for Indian agriculture. It is stated that ‘the Indian farmer is born in debts, lives in debts and dies in debts’. Many quote the Shakespearean dictum: ‘He that dies pays all debt.’ Development of responsive and appropriate rural credit system has been found to be very difficult and an issue of continuous concern for over a century. Efforts had been directed by policy-makers such as Planning Commission, Govern-ment of India (GoI) and Reserve Bank of India (RBI) to address these concerns for a long time.
An analysis of agriculture credit can be divided into three distinct phases: (a) Pre-nationalization of banks, that is, 1947–69, (b) Nationalization till liberalization, that is, 1969–91 and (c) Post-liberalization, that is, 1991 till date.
In the first phase which is from inde-pendence in 1947 to nationalization of banks in 1969, efforts were made for poverty alleviation and development of cooperatives with focus on development, through growth with equity. By 1951, the provision of credit through cooperatives remained meagre. Only 3.3 per cent of the cultivators had access to credit from cooperatives and 0.9 per cent from CBs. Bulk of the rural credit was extended by moneylenders using usurious practices at prohibitive rates. The foundation for building a broader credit infrastructure for rural credit was laid by the Report of All India Rural Credit Survey (1954) which pinpointed the pivotal role of cooperatives stating, ‘cooperation has failed but cooperatives must succeed.’ The All India Rural Credit Review Committee

Financing Agriculture 65
rural credit including agriculture as a part of overall structural reforms initiated in 1991. High-Level Committees were set up by GoI/RBI/NABARD to look into issues and concerns of rural credit and related aspects. The recommendations had far-reaching impact for revamping rural credit delivery system and processes. Based on their recommendations and in tune with the international standards and practices, certain policy measures were initiated for enhancing soundness, efficiency and productivity of credit delivery institutions. These included deregulation of interest rates, introduction of prudential norms (income recognition, asset classification and provisioning), increasing outreach, simplification of procedure, stimulating credit flow to rural areas/weaker sections.
Formal banking industry was expanded with a thrust on opening rural branch and now consists of 80 CBs (public and private sector), 82 RRBs (46 amalgamated and 36 stand alone), 31 State Cooperative Banks, 370 District Central Cooperative Banks (DCCBs), 19 State Cooperative Agriculture and Rural Development Banks (SCARDBs). There are nearly 35,000 rural and semi-urban branches of CBs, 15,500 branches of RRBs and over a hundred thousand rural outlets of cooperatives.
Institution of Rural Infrastructure De-velopment Fund (RIDF) in NABARD during 1995–96 is another significant develop- ment. Commercial Banks are depositing funds with NABARD towards shortfall in mandatory lending for agriculture. These are used for financing rural infrastructure projects implemented by the State Gover-nments. Introduction of Kisan Credit Card (KCC) in 1998 for facilitating flexible credit delivery to farmers is noteworthy development. 82.9 million cards were issued till 31 March 2009. Financial inclusion and inclusive growth have been focused on at all levels.
Thus, the concern with the inadequacy of agricultural credit has had more than a century of tortuous history. The agricultural
credit system as it has emerged, has been a product of both evolution and intervention and symbolizes the system’s response to the stimuli from continuing dissatisfaction with credit delivery. The concern for food security and the need for building up buffer stocks, which guided the Green revolution, created both enhanced and diversified type of credit requirements for agricultural production. In India, a ‘supply-leading approach’ to the institutional development has been followed. (Mohan, 2006)
5.3. Deepening of financial services: Access for the poor
5.3.1. Small farmers and marginal farmers
The access to institutional credit by SF/MF, landless and tenant farmers and oral lessees, who constitute 82 per cent of the farmers in the country, has been major policy focus. As per National Sample Survey Organization (NSSO) Survey Report, 2003, there are 147.9 million rural households in the country out of which 89.3 million households (nearly 60 per cent) are cultivator households. Of these cultivator households, 43.4 million households, constituting 48.6 per cent, are indebted to either formal or non-formal services or both and only 27 per cent (24.3 million households) are covered by formal services. It implies that nearly 51 per cent of cultivator households translating to 45.95 million or over 200 million persons are financially excluded. Eighty-eight per cent of the non-indebted households are under SF/MF category. The data in Table 5.1 show that formal system has a distinct bias towards households with larger land holdings. The data from the 59th round of National Sample Survey (NSS) furnished below are self-explanatory.
The number of small farmers has been increasing due to continuing fragmentation of land. Credit to these vulnerable sections both in terms of proportion of accounts and volume of loans has been declining over the years. Bankers perceive SF/MF as higher

66 Biswa Bandhu Mohanty
credit risk than large farmers on account of inability of former to provide collateral security. They also prefer to provide small short-term loan instead of long-term loan to SF/MF, thereby constraining their scope for production and productivity enhancement. As on 31 March 2010, out of 48.2 million agriculture loan accounts, 28.5 million belonged to SF/MF, constituting 59 per cent. But they were financed for only ̀ 1,182,771.1 million, constituting 32.2 per cent of the total loan volume (` 3,669,188.2 million). On the other hand, only 0.7 million tenants and oral lessees had availed loan of ` 437.7 million, translating to 1.19 per cent of the above total. Provisional data have been compiled by NABARD. Out of the total credit provided in 2009–10 for agriculture, 73 per cent was for crop loan and 27 per cent for term loan, with cooperatives having the highest crop loan at 89 per cent and CBs having the highest
share of 32 per cent under term loan, against respective total financing for agriculture during the year. Box 5.1 discusses the possibilities of cooperatives improving their performance in agri-finance, consequent to the ongoing reforms.
5.3.2. Credit delivery innovation: genesis of SHG-bank linkage programme (SHG-BLP)
Despite phenomenal expansion of organ-ized banking in India, a large number of the poor continued to remain excluded from their services. The policies, systems and procedures were not ideally to enable poor to be part of formal banking system. Misconceptions about banking with the poor prevailed during 1980s, leading to serious aberrations in credit delivery. This prompted a search for alternatives to im-prove access of the rural poor to banks. The idea was to provide an integrated microfinance service rather than providing just micro-credit. As a wide network of bank branches already existed, the strategy was not on creating alternative organizations, but on findings ways and means to improve the access of the poor to the existing banking network through design of new products and delivery mechanism.
Women Self Help Groups (SHGs) promoted by Non-Governmental Organ-izations (NGOs) had been operating in
Box: 5.1: Reforms in Short Term Cooperative Credit Structures (STCCS) New hope for agri-finance
Based on the recommendations of Task Force for STCCS, the GoI in 2006 had announced a revival package with ` 135,960 million estimated outlay. The package aimed to make cooperatives a well-managed and vibrant channel for financial services in rural India. To facilitate implementation of the package, 25 State Governments have so far executed Memorandum of Understandings (MoUs) with GoI. The package envisages legal and institutional reforms, improvement in quality of management and introduction of better systems and practices in the Cooperative Credit Structure (CCS). With a view to ensuring
democratic functioning of cooperative institutions, 16 states have amended the Cooperative Societies Act. This helps bring in autonomy in financial and administrative matters and regulatory control of RBI. Other initiatives included streamlining audit process, accounting system, supervisory strategy, deepening training and capacity building efforts. With improved institutional capacity of STCCS, it is expected that quality and intensity of financing to farmers would show visible changes.
Source: NABARD, available at www.nabard.org
Table 5.1: Debt from institutional sources as per land holding classes
Size of land holding (ha)
Debt from institutional sources (%)
<0.01 22.060.01–0.40 43.300.41–1.00 52.801.01–2.00 57.602.01–4.00 65.104.01–10.00 68.80>10.00 67.60All sizes 57.70
Source: NSSO (2005).

Financing Agriculture 67
India on small scale in the late 1970s/early 1980s. Based on the study findings of an Action Research Project, the SHG-BLP model evolved as core strategy that could be used by the banking system for increasing access of the poor to formal banking sys-tem. SHG-BLP was launched by NABARD in 1992, with the policy support of RBI. With the success of pilot phase, SHG-BLP had been mainstreamed in 1996. The pro-gramme has achieved spectacular growth during the last 18 years with 6.1 million SHGs with savings of ` 55,456.2 million and 4.2 million SHGs credit linked with banks with a loan outstanding of ̀ 22.6700 million as on 31 March 2009 (NABARD, 2009b). Although the programme has been activity-neutral, it brings to the fore the immense possibilities of financing agriculture with participation of matured SHGs.
Also, Micro-finance Institutions (MFIs), in different legal forms, have made rapid strides and expanded outreach in rural areas. They have adopted various models for delivery of microfinance services, such as SHGs, Joint Liability Groups (JLG), Indi-viduals and Cluster Association of SHGs. Their loan packages vary widely across the country. Some MFIs have adopted the Grameen model. Quite often, apart from financing SHG directly, the banks have financed MFIs for lending to SHGs and other small borrowers, under the SHG-BLP (n.b.: This is a model permitted under SHG-BLP—Total bank finance through this channel stood at ` 50,090.9 million to 1,915 MFIs as on 31 March 2009).
5.4. Agrarian distress: An area of concern
Notwithstanding the above efforts, policy focus and innovations in agricultural fi-nance, there has been fall in the share of agri-credit in proportion to total credit. Support services and public investments in agriculture have weakened. A considerable decline in rate of growth of area, pro-duction, productivity and area irrigated has also been noticed for major crops. Gross Capital Formation (GCF) as a proportion
to total capital formation has continuously declined.
Financial exclusion of farmers coupled with usurious interest rates and exploitative practices by moneylenders continue to persist. There have been widespread con-cerns and unrest over the resultant agrarian distress leading to farmers’ suicides in the country. While precise reasons for individual farmer’s distress is a matter of deeper study, broad issues have a bearing on farmers’ plight with reference to financing.
Issues such as slowdown in agriculture growth, low agri-productivity, natural re-sources degradation, unsustainable water management and irrigation, crowding of investments, constrained post-harvesting and value addition, high wastage, long and inefficient value chain, inadequate infrastructure, fragile social security/risk mitigation, uncertainty and fluctuations in price, market, weather and lack of appropriate extension and technology have a bearing on agriculture finance (Sahu, 2010).
Although these issues cannot be fully resolved by the financial institutions, they have a catalytic role in motivating, coordinating, following up and networking with the concerned agencies for minimizing the adverse effects of such constraints on the effectiveness of investments.
5.4.1. Inherent constraints of agriculture operations
l High dependence on natural factors leading to production risks due to vagaries. Sixty per cent of the cultivated land is dependent on rainfall, and rainfed farming is perceived to be highly risky.
l Constraints in infrastructure in terms of connectivity, communication, irriga-tion, storage, social infrastructure, etc., in rural areas.
l Dispersed population, difficult terrains leading to high cost of service delivery.
l Growing sub-division and fragmen-tation of land holdings, resulting in uneconomic farm holdings.
l Issue of ownership of land causing diffi-culties to tillers and women borrowers.

68 Biswa Bandhu Mohanty
5.4.2. Internal factors: bankers’ perceptions and practices
l Banks in general continue to harbour high-risk perception with respect to lending for agriculture, especially to small farmers, new and uncharted areas/activities in agriculture. Tendency of banks to safeguard their bottom line makes them perceive agriculture with uncertainties in market, price, weather and support services as risky, particularly term loans.
l Availability of tangible collateral, decline in the price of the collateral, difficulties in enforcement of collateral, etc., hinder bank financing.
l Bankers generally approach the proposals/schemes for financing agricultural ac- tivities from conventional lending tech-nology and practices. Apprehensions with regard to recovery performance, incidence of Non-Performing Assets (NPAs), in the backdrop of past experi-ence in certain regions/activities, in-hibit them from becoming flexible and proactive.
l Bankers have not developed required domain knowledge and capability on project appraisal and technical know-how commensurate with developments/changes in several emerging areas of agri-finance. They are not fully equipped to adopt differential approach for different sectors and regions. Experiences of RRBs and Cooperative Banks have mostly been sporadic lending, mostly covered by NABARD refinance under Automatic Refinance Facility (ARF).
5.4.3. Constraints in external support environment
l Market forces of demand and supply often compel farmers to cultivate com-mercial crops, which require higher investment. When bankers shy away from financing them, they take recourse to informal lending which involves high cost of debt-servicing. Any shortfall in yield and price brings misery to farmers borrowing at high rates. Inappropriate application of input mix, ignorance on
technical know-how and spurious use of fertilizer and pesticides add to the farmers’ plight. Serious water stress arises due to depletion of groundwater resources. The crisis has been exacerbated due to environment degradation and a plateau of existing agricultural technology.
l Rising population has exerted tremen-dous pressure on land. Agriculture labour force has increased faster than the agricultural land leading to lower land-to-labour ratios. Labour productivity has stagnated and income gain per capita has reduced.
l In the absence of safety nets, modern and comprehensive risk-mitigation measures/techniques, supplementary livelihood options in non-farm sector and due to the lack of comprehensive and cost-effective (life and non-life) insurance products including weather insurance, farmers are adversely affected. Current crop loan insurance, based on area yield approach, suffers from low coverage and high claim to premium ratio. A comprehensive and all inclusive coverage needs a realistic and reliable estimation of crop damages and an effective strategy of insurance coverage and claim settlement policy.
l The Minimum Support Price (MSP) given to farmers is inadequate. Lack of assured institutional mechanism for sale prompting prompts farmers to sell their produce to middlemen at a lower price.
l Government Extension Services are not able to address gaps in technology, adoption of new technology, inputs supply management and integrated nutrient management that could help alleviate problems of farmers.
5.5. Supportive measures of GoI
5.5.1. Multiple schemes and programmes
GoI has been providing impetus to finan-cing agriculture through various policy packages/schemes from time to time.
Financing Agriculture 69
During 1973–93, the GoI had introduced segment-focused/area-based schemes like Drought-Prone Areas Programme (DPAP), Desert Development Programme (DDP), Integrated Watershed Development Programme (IWDP) and Integrated Tribal Development Agencies (ITDA) programme. Recently, consecutive budgets have focused on agri-business development. Important supportive approaches include GoI-sponsored schemes with provision of subsidy along with bank credit, interest subvention schemes for crop loans, Agriculture Relief and Debt Waiver Scheme 2008, institution of various Missions, etc.
The credit-cum-subsidy schemes operated through banks include schemes for setting up of rural godowns, cold storages, agri-marketing infrastructure, organic farming, horticulture development, etc. Under GoI-sponsored Agri Clinics (AC) and Agri Business Centres (ABC) schemes, banks are providing agri-graduates financial assistance for setting up of AC and ABC. The National Horticulture Mission, National Mission of Sustainable Horticulture, National Food Security Mission, Rashtriya Krishi Vikas Yojana (RKVY), National Missions on Oilseeds/Pulses/Bamboo Development, etc., are some of the major schemes of GoI.
The GoI’s initiatives in research, extension and transfer of technology include the CSIR network and schemes such as World Bank assisted Training and Visit (T&V) System of agriculture extension, Krishi Vigyan Kendras (KVK) and Agricultural Technology Management Agencies (ATMA). Development of State Agriculture University System (SAU) encompassing collaboration of each SAU with the American Land Grant College System had given impetus to research-oriented development of several allied activities.
5.5.2. Doubling of agriculture creditThe GoI, as a part of its strategy to boost agri-production, had announced a package to double the flow of institutional credit to agriculture in three years starting from 2004–05. The programme envisaged
acceleration of expansion of KCC coverage, financing new investment projects in agri-culture and allied activities, rescheduling/restructuring of farmers’ loans in areas (affected by natural calamities), One Time Settlement (OTS) for farmers in distress and redemption of loans from informal sources of credit.
On account of increased thrust and intensive review during the period 2004–09, Ground Level Credit flow (GLC) increased with an average annual compounding rate of 23 per cent. In 2008–09, credit dis-bursement of ` 2,890,000 million could be effected against the target of ` 2,800,000 million, with CBs achieving 115 per cent, RRBs 89 per cent and cooperative banks 67 per cent of their respective targets. The Pubic and Private Sector Commercial Banks had advanced 42 per cent and 46.8 per cent of ANBC, respectively, during 2008–09. As per provisional data compiled by NABARD up to July 2010, against the ` 3,250,000 million target set for banks in 2009–10, they accomplished ` 3,669,188.2 million with CBs, RRBs and Cooperatives achieving 110, 115 and 128 per cent targets respectively. The share of CBs on agricultural lending has registered sharp increase (75 per cent in 2009–10 versus 35.9 per cent in 1983–84) with corresponding fall in the share of cooperatives (9 per cent in 2009–10 versus 56 per cent in 1983–84).
Increased credit flow for agriculture had actually resulted in higher credit intensity for agriculture as a proportion of agricul-ture GDP—from 7.2 per cent in 1993–94 to 33.3 per cent during 2008–09. The growth momentum has been sustained during the last five years. Flow of credit has trebled while it doubled in early 1990s. However, repayment capacity enhance-ment, productivity, income increase and price realization have not been evidenced due to increased credit flow.
5.5.3. Agriculture Debt Waiver and Debt Relief Scheme (ADWDRS), 2008
The National Commission on Farmers (2005) under the Chairmanship of Professor

70 Biswa Bandhu Mohanty
M.S. Swaminathan, as also the Expert Group on Agricultural Indebtedness (2006) headed by Professor R. Radhakrishna—both set up by the GoI had given certain recom-mendations for extending relief to SF/MF. Against this backdrop, GoI announced ADWDRS in 2008. ADWDRS granted full waiver of all direct agricultural loans extended by banks to SF/MF and partial waiver to other farmers for loans disbursed between 31 March 1997 and 31 March 2007, which were overdue as on 31 December 2007 and remained unpaid till 29 February 2008, subject to certain terms and conditions. These farmers were made eligible for fresh loans from the banking system, as per the scheme. Over ` 720,000 million have gone into the accounts of 40 million indebted farmers under the scheme.
Several experts and institutions have critically assessed the scheme in terms of concept and possible impact. The following are broad inferences:
l ‘Default’ has been the basis of reward, thereby disincentivizing good borrowers.
l The eligibility criteria pre-suppose ‘one size fits all’ farmers irrespective of the diversities of the country in terms of yield, terrains, etc.
l It tried to cure the symptom, rather than the disease.
l As an instrument of relief, ADWDRS is likely to have short-term effect, rather than long-term impact.
l The waiver has not invariably led to issue of fresh loans, as envisaged.
l Huge funds could have been gainfully used for reforms/revival of the sector, meeting emerging infrastructural needs and for long-term asset creation.
l Earlier commitment of GoI under MoUs with the State Governments in STCCS reform package under Vaidyanathan Committee (VC) that recourse to such waivers would not be taken, has not been adhered to.
The waiver was declared as one-time measure and was stated to be beginning of a process. There is, therefore, need for
independent assessment of the impact of the scheme to find out how much of the lofty objectives have been fulfilled, to draw lessons for the future policy and approach. For lasting and better impact, the Government, however, may consider shifting focus from supply-driven approach to demand-driven intervention.
5.5.4. Role of State GovernmentsAgriculture/Cooperation being State sub- jects, many State Governments have an-nounced several farmer-friendly welfare programmes aimed at improving agri-culture production and productivity, liveli-hood promotion through microfinance development and other innovations. Ex-amples of some of the state Governments’ important and innovative initiatives are given in Boxes 5.2, 5.3 and 5.4 The Gov-ernments of AP, Kerala, Karnataka, Orissa and Tamil Nadu have assumed Self Help Promoting Institution (SHPI) role under SHG-BLP and given the programme a great momentum. Some State Govern-ments have extended interest subsidy for loans given to farmers/SHGs by banks, especially cooperative banks. Provision of interest subsidy for farmers through cooperatives and denying the same to farmer borrowers of CBs/RRBs discriminate among farmers.
5.5.5. Role of NABARDNABARD, as an Apex Development Bank has been playing financial, developmental and supervisory role in agriculture and rural development. It has been administering, as a nodal agency, various schemes including ARDWR, Interest Subvention, RIDF and other sponsored programmes of GoI. It has been refinancing banks for a wide spectrum of activities in tune with the na- tional priorities. Various funds, namely Watershed Development Fund (WDF), Financial Inclusion Fund (FIF), Financial Inclusion Technology Fund (FITF) and Farm Innovation and Promotion Fund (FIPF), aim at adding value to credit interventions for agriculture. The Potential Linked Credit Plan (PLP) prepared annually by NABARD for every district reflects
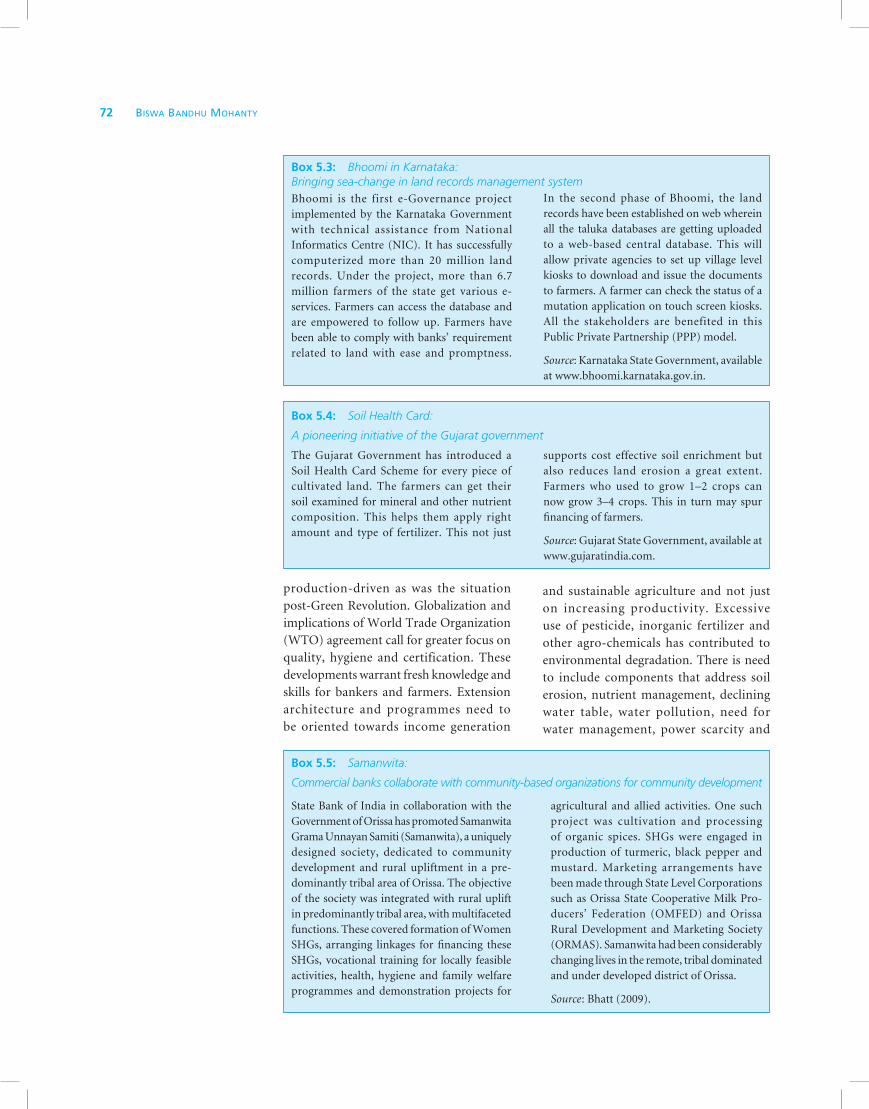
Financing Agriculture 71
the potential that could be harnessed for financing agri-culture and allied activities in that district. These are expected to be a reference for financing banks.
5.6. Changing face of agriculture
5.6.1. Facets of change: New horizons for finance
Changing agriculture scenario and per-spectives bring to fore the premise for trans-formation in agriculture financing. Some of the important potential is as follows:
l An ever-increasing younger population, rapid growth in the middle and upper income segment bring in shift in the food preferences and demand for retailed organized products. Processed and fast foods are in greater demand. New gen-eration of customers with changing lifestyles and growing income has the ability and willingness to pay for these products.
l The growth and modernization in Indian agriculture are taking place with adoption of hybrid seeds, advanced cultivation method and use of non-conventional energy.
l Commercial ventures of organic far-ming, horticulture, floriculture, cash crops, spices, tea, coffee, seafood, etc., are increasingly being supported. Export of flowers, grapes and mangoes is a success story. System of Rice Intensification (SRI) and innovations in marketing organic rice directly to consumers in
small niche markets, market linkage for vegetable farming, especially organic farming, open new horizons of agri-business.
l The value chain in production, pro-cessing, packaging, grading and stand-ardization of farm produce warrants new format of finance.
l The modern rice mills, popularization of branded atta and e-Choupal indicate that private sector sensing opportunities and filling up gaps in government action.
l Designing, appraisal, implementation, monitoring and evaluation are assuming more significance.
l Diversification and commercialization of agriculture warrant large farmers and agri-entrepreneurs to look for higher financial securities designed to suit their projects. The potentials of SF and MF, tenants and the landless can be harnessed for agriculture production by provid-ing innovative microfinance products encompassing credit, savings, insurance, leasing, etc.
l Integrated watershed development pro-grammes are gaining momentum in dryland areas and watershed commun-ities are looking for increased institu-tional credit and banks’ involvement in the whole process.
5.6.2. Required approach for bankers: responsive and responsible finance
Post-liberalization, agriculture is becoming more and more demand-driven rather than
Box 5.2: Operation Barga: Share croppers empowerment in West Bengal through participatory land reforms strategy
Operation Barga aimed to bestow inheritable rights to sharecroppers, whereby quasi-property rights were conferred to registered sharecroppers. Within three years, one million sharecroppers were included in the programme. This change of status from labourers to land owners, inclusion of their names in record of rights, fixation of fair rent and hereditary rights for cultivation assured farmers of stable livelihood and improved
their standard of living and quality of life. Notwithstanding the operational constraints and political controversies, it has given sharecroppers access to credit, technology and market. Consequent to this measure of people’s participation in the development affecting livelihood and collective action, there has been substantial increase in agriculture output, wages, decline in poverty, increase in food intake, etc.
Source: Thorat (2008).

72 Biswa Bandhu Mohanty
production-driven as was the situation post-Green Revolution. Globalization and implications of World Trade Organization (WTO) agreement call for greater focus on quality, hygiene and certification. These developments warrant fresh knowledge and skills for bankers and farmers. Extension architecture and programmes need to be oriented towards income generation
and sustainable agriculture and not just on increasing productivity. Excessive use of pesticide, inorganic fertilizer and other agro-chemicals has contributed to environmental degradation. There is need to include components that address soil erosion, nutrient management, declining water table, water pollution, need for water management, power scarcity and
Box 5.3: Bhoomi in Karnataka: Bringing sea-change in land records management system Bhoomi is the first e-Governance project implemented by the Karnataka Government with technical assistance from National Informatics Centre (NIC). It has successfully computerized more than 20 million land records. Under the project, more than 6.7 million farmers of the state get various e-services. Farmers can access the database and are empowered to follow up. Farmers have been able to comply with banks’ requirement related to land with ease and promptness.
In the second phase of Bhoomi, the land records have been established on web wherein all the taluka databases are getting uploaded to a web-based central database. This will allow private agencies to set up village level kiosks to download and issue the documents to farmers. A farmer can check the status of a mutation application on touch screen kiosks. All the stakeholders are benefited in this Public Private Partnership (PPP) model.
Source: Karnataka State Government, available at www.bhoomi.karnataka.gov.in.
Box 5.5: Samanwita:
Commercial banks collaborate with community-based organizations for community development
State Bank of India in collaboration with the Government of Orissa has promoted Samanwita Grama Unnayan Samiti (Samanwita), a uniquely designed society, dedicated to community development and rural upliftment in a pre-dominantly tribal area of Orissa. The objective of the society was integrated with rural uplift in predominantly tribal area, with multifaceted functions. These covered formation of Women SHGs, arranging linkages for financing these SHGs, vocational training for locally feasible activities, health, hygiene and family welfare programmes and demonstration projects for
agricultural and allied activities. One such project was cultivation and processing of organic spices. SHGs were engaged in production of turmeric, black pepper and mustard. Marketing arrangements have been made through State Level Corporations such as Orissa State Cooperative Milk Pro-ducers’ Federation (OMFED) and Orissa Rural Development and Marketing Society (ORMAS). Samanwita had been considerably changing lives in the remote, tribal dominated and under developed district of Orissa.
Source: Bhatt (2009).
Box 5.4: Soil Health Card:
A pioneering initiative of the Gujarat government
The Gujarat Government has introduced a Soil Health Card Scheme for every piece of cultivated land. The farmers can get their soil examined for mineral and other nutrient composition. This helps them apply right amount and type of fertilizer. This not just
supports cost effective soil enrichment but also reduces land erosion a great extent. Farmers who used to grow 1–2 crops can now grow 3–4 crops. This in turn may spur financing of farmers.
Source: Gujarat State Government, available at www.gujaratindia.com.

Financing Agriculture 73
renewable energy, marketing and price in financing farmers. To arrest adverse trends, sustainable, responsible financing and social reporting, community participation are warranted.
5.6.3. Value chain financeVarious value chain models of financing are emerging, for example, processing and exports after production under con- tract farming, cold chains for production-procurement-processing logistic, retailing fruits and vegetables and warehousing and warehouse receipt. With the tenant far-ming and contract farming system gaining momentum, financing for mechanization and production and distribution of agri-implements is getting intensified. Inte-gration of process at a wide scale under value chain means that banks are to secure repayment of loans at higher levels of the value chain. Area-based schemes for agriculture and diversified sub-sectors, and related infrastructure, require more term loans and, as such, project with a focus on activities like organic farming, integrated water management, use of alternative sources of energy, etc., are being encouraged.
5.6.4. Livelihood financeLivelihood is a comprehensive approach. Promoting sustainable livelihood for far-mers would encompass financial services, agricultural business development services and institutional development services. Financial services include savings, credit, comprehensive insurance (health, crops and livestock) and infrastructure development (road, power, market, health, education, skill development, coping with natural disaster/calamities, etc.). In India, most of the livelihood programmes have preferred SHGs as delivery routes.
Livelihood programmes covering far-mers need huge investments in capacity building, access to market, technology and arrangement for extension services and infrastructure. Livelihood finance for vulnerability reduction and addressing structural issues of poverty require financial deepening of products, processes, innovation,
contingency planning. To make these programmes effective, the process, design and institutional framework for the pro-gramme are very crucial. A huge quantity of organizational efforts, for networking, convergence and coordination is also essential. Financial institutions need to be integrated in the whole process, so that they could carve out space and scale for intervention.
5.7. Paradigm shift in financing agriculture
Based on the experience gathered in several interventions, a paradigm shift in approach to financing and developing farmers, par-ticularly small and marginal farmers is slowly taking place. Financing agriculture, involving scattered farmers from diverse areas and background has been costly, risky and cumbersome. There is constant change in technology, processes, organizational theories and socio-political climates. This has mandated continuous innovation in products, processes, organizational pattern and delivery mechanism in agriculture financing. There is a trend:
l From supply-driven products and ser-vices to demand-driven ones.
l From top-down supply-centric pro-ducts and services to a whole range of interventions—activity, production, ex-tension, technology and marketing in a market-driven approach.
l From conventional delivery practices to innovative and cost-effective services.
The emerging approaches are:
1. From Individual Lending to Group Approaches: With success of micro-finance movement, particularly SHG-Bank Linkage Programme in India, Group approach is now accepted as a better, cost-effective and sustainable way of economic and social empowerment. Learnings from SHG-based development banking which are relevant for financing

74 Biswa Bandhu Mohanty
small and marginal farmers have been given as under:
l SHG portfolio is safe and per-
forming.
l Mutual trust and peer pressure
work better than collateral lending.
l Partners and consultative approach
is necessary for better results.
l Space for flexibility and innovation
should be provided for expansion.
l Programme can be up-scaled in a
phased manner.
l Promotional efforts to be focused on
building human capital.
l Financial, organizational and oper-
ational sustainability is dependent on
scale, system, quality, effectiveness,
enabling environment and sup-
portive mechanism for graduation
process (Mohanty, 2009).
2. From Sporadic to Area-based Sector Specific Cluster Approach: Cluster
approach has been very relevant and
effective for promoting farmers’ income
levels and living standards in view of
economy of scale, development of com-
mon facilities and organized imple-
mentation in specific areas, activities/
sub-sector. Thus, cluster approach is
prioritized and preferred as compared
to sporadic approach as former results
in impact creation and visible change in
the farmers’ pursuits.
3. From Credit to Credit and Financial Services: In rural credit focus all
along has been on credit dispensation.
Development banking on the other hand
considers that credit would be effective
and result oriented if accompanied with
related promotional and developmental
inputs, and that savings, insurance,
remittance, business counselling and
other business services are essential
ingredients for banking with poor.
Thus, there have been attempts to bring
about transformation from credit to
comprehensive financial services.
4. From Direct Delivery Mechanism to Financial Intermediaries: Considering the magnitude and locational diver-sities among farmers, the delivery and intricacy of financial services and credit plus interventions required for them, direct and conventional ways of financing farmers have not been cost-effective and efficient. Thus, there has been emergence of various insti-tutional models, intermediaries like Business Facilitator (BF), Business Correspondent (BC) adopting various Information and Communication Technology (ICT) tools and products for catering to varying financial needs. Various safeguards, internal and ex-ternal checks and control are being evolved to minimize the risks involved in such mechanisms and approaches.
5.8. Innovative approach: New perspectives in financing
Many banks, development finance insti-tutions, promotional agencies and cor-porates have begun supporting farmers through new and innovative approaches and models. GoI, RBI, NABARD, State Governments and banks have played a catalytic role in terms of policy initiatives and promotional measures in this dir-ection. Some of these initiatives are outlined in this section:
1. Joint Liability Groups: JLGs have been recognized as a good business proposition for banks to finance small, marginal, tenant and oral lessee far-mers. A JLG is an informal group com-prising of 4–10 individuals coming together for the purpose of availing bank loan on individual basis through group mechanism against mutual guarantee. Joint undertaking given by the JLG and the affinity among the group members serve as a collateral substitute for the loans. Activity-based JLGs have come

Financing Agriculture 75
up in different parts of the country to pursue specific agriculture and allied activities. MFIs have been financing JLGs in a large measure. Simplified documentation, group dynamics, quality of clients, good repayment prospects, promotional support from NABARD for formation and linkage, extension from the State Government—all make JLG financing attractive for the banks. NABARD has issued revised operational guidelines during October 2009 and decided to extend promotional assistance to banks and JLG promoting institutions to upscale the JLG-Bank Linkage programme. JLGs of farmers are expected to be formed in increased scale.
2. Self-Help Groups: SHGs have trans-formed over the years SHGs’ borrowing profile have changed from consum- ption to production and from pro-duction to income generation activities (IGA). The SHG-BLP originally envisaged that members of matured SHGs could directly approach finan-cing institution for raising larger funds for IGA at appropriate stage. NABARD implemented a pilot project in nine districts in nine states in 2005–06 for promotion of micro-enterprises among the matured SHGs. The project envisaged engagement of a suitable identified NGO in each pilot district as the Micro Enterprise Promotion Agency (MEPA) and adoption of a 3M approach (Micro Planning, Micro Market and Micro Enterprise) developed by Marketing and Research Team (MART). The project’s end-term assessment by NABARD revealed that most beneficiaries chose to pursue the traditional activities, by building on their existing capacities and capabilities and these activities were mainly (77 per cent) farm and off farm activities.
Facilitation of the people’s institu-tions like NGOs and SHG Federations at the grassroots level added advantage for the following primarily: (a) evolving
diversities of supportive programmes; (b) providing risk mitigation instru-ments in the back drop of uncer-tainties of monsoons, inadequacies of infrastructure, other contingencies and (c) empowering them with knowledge and skill in relation to management of production, finance and marketing associated with the agribusiness.
Banks may require services of an intermediary, Community Based Or- ganization (CBO) to fulfil these emer-ging needs of matured SHGs taking up viable agribusiness. The banks are expected to provide incremental financial services to SHGs or finan-cing CBOs to enable them to assume the above role. Some of the CBOs like Myrada and Dhan Foundation have developed organizational structures and broader approach to facilitate such interventions for SHGs. In many parts of the country, SHGs have taken recourse to specific parts of the value chain, depending on their convenience and capacity. There is clear division/specialization of work SHG-wise for procurement, grading, marketing and processing in certain contiguous areas. An example illustrating possible ways of banks integrating with CBOs is given in Box 5.5 on page 72. Boxes 5.6 and 5.7 on page 76 illustrate examples of NGOs and other intermediaries providing innovative facilitations for marketing in agribusiness.
3. Business Correspondents and Business Facilitators: In June 2006, RBI had issued a new set of guidelines permitting the banks to use Business Facilitators (BFs) and Business Correspondents (BCs) to expand outreach for accelerating financial inclusion. BCs are permitted to carry out transaction on behalf of the banks as against BFs who facilitate bank to carry out transactions, but cannot transact on behalf of the bank. In November 2009, RBI has enlarged the category of persons who can act as BCs. Now, besides the Technology

76 Biswa Bandhu Mohanty
Vendors, authorized organizations—
NGOs, MFIs, individuals and a host
of other entities including authorized
functionaries of well-run SHGs-linked
to banks—can be BCs. These guidelines
have inspired banks to take recourse to
BCs as (a) it proves more cost-effective
than branches, (b) enables to reach
the unreached for financial inclusion,
(c) facilitates doorstep banking and
(d) helps in up-scaling business faster.
Notwithstanding risks involved in cash
handling, accounting, safety of funds,
viability and technology integration,
the channel provides tremendous op-
portunities for financing farmers in the
difficult and inaccessible areas. Many
banks have internalized BCs and BFs
significantly.
Keeping the poor at the centre of the
strategy, the SF, MF, Scheduled Castes
(SCs), Scheduled Tribes (STs), mi-
grants, tenants and oral lessees can be
increasingly provided with financial services through BC mechanism. The BC/BF model is extensively used for Government-supported MANREGA programme and social security pen-sions. FIF and Financial Inclusion Technology Fund (FITF) with overall corpus of ` 5,000 million each has been instituted in NABARD with con-tribution from GOI, RBI and NABARD in the ratio of 40:40:20 in a phased manner over five years. The liberaliza-tion of RBI guidelines, promotional grant, funds for experimentation of technology solutions/devices, capacity building measures, provision of supple-mentary funds for filling up viability gaps, training and capacity building efforts and, above all, the enthusiasm of banks to make strides in rural areas in delivery of financial services for the target population have made BC/BF mechanism a very promising delivery channel for the future.
Box 5.6: Branding products of Farmers/SHGs—marketing perspectives
Shri Kshetra Dharmasthala Rural Development Project (SKDRDP) in Karnataka has created suitable marketing infrastructure and a brand name Siri for marketing of agri-based products of SHGs/farmers facilitating quality standards and increased popularity and market demand. Landless farmers/oral lessees take recourse to SHG/JLG route for bank finance because of
dispensation of collateral/land records in the system. A study on tenant farmers in Karnataka where tenant farming has been prohibited revealed that they continue to take shelter under SHG route for their financial needs, in view of the innate flexibility in the system.
Source: www.skdrp.org
Box 5.7: Vegetable and Fruit Promotion Council, Kerala (VFPCK): Price discovery for SHGs through a farmers’ market model
VFPCK was registered as a Section 25 Company in 2001 under which Farmers Market, known as Swasraya Karashaka Samithis (SKS), have been formed to facilitate sale of vegetable produce of members of SHGs associated to it. VFPCK is a successor of Kerala Horticulture Development Project (KHDP), which was initiated by the State Government in 1993 in collaboration with the European Union, to enhance production of vegetable and fruits in the State. Each SKS is provided with infrastructure, namely building, office, weighing machine and space for display of vegetables.
SKS begins as an informal organization where farmers come together to bulk their
produce at a central location and collectively negotiate with traders. Later on, the SKS secures a legal entity as a society under the Society Registration Act, 1860. SKS is managed by a Committee comprising of representatives of SHGs associated with it. SKS facilitates col-lection of daily price range of vegetables pre-vailing in the nearby markets. Based on the information and the demand and quality of vegetables, benchmark price is determined and sales prices decided.
Organizational support in form of VFPCK and SKS helps SHGs in price discovery for sale of their produce at optimal price.
Source: www.vfpck.org

Financing Agriculture 77
4. W a d i A p p r o a c h f o r T r i b a l Communities: Wadi is not merely a programme of agri-horti-forestry but an approach for sustainable livelihood and better quality of life, for tribals and other backward communities. Over the last two and half decades, Wadi (small orchard) has been transformed into a multidisciplinary programme for rehabilitation. The key strategy is to provide sustainable livelihood from an acre of land for the participating poor family. Each Wadi owner could earn ` 20,000–25,000 annually from the small piece of land, once the trees start bearing fruits. There are other supplementary activities for income generation. During the gestation period, the people are engaged in promotion of agriculture in inter-space, introduction of short gestation cash crops, processing of food, herbal medicines, livestock and poultry. They are also organized into SHGs which are linked with banks to enable them to access credit. Local people’s organizations are linked with Government/Development Agencies, market outlets and Panchayat Raj Institutions (PRIs) to empower people to ensure sustainability beyond the
project period. Bharatiya Agro Industries Foundation (BAIF) has done pioneering work in this direction in Maharashtra and Gujarat under a Kreditanstalt für Wiederaufbau (KfW)-NABARD assisted programme. The Wadi approach is being replicated through a Tribal Development Fund (TDF) instituted in NABARD. The approach could usher a new way of life for 20–25 million families across 250 tribal communities who live in or close to forested areas and undertake minor forest produce collection as part of their livelihood.
5. Contract Farming: With the increasing demand for value-added and high-quality niche products and the need for integration of food value chain, efforts have been directed by some of the corporates to adopt contract far- ming mechanism. The contract far-ming system pre-supposes three basic agreements—Market, Resource and Management provisions. Under mar-ket provision, growers and buyers agree to terms and conditions for future sale and purchase of crop/agri-product. Under the resource provision, the buyer agrees to supply selected inputs and
Box 5.8: Financial assistance for strengthening supply chain system: Fruit and vegetable auction market (SFVAM), Bangalore
Recognizing the need for an efficient horti-culture market which would stimulate pro-ductivity, raise quality standards, reduce losses and ensure increasing supply of fresh horticultural produce at reasonable prices to consumers, the GoI had approached National Daily Development Board (NDDB) to evolve/implement procurement and marketing of horticulture produce system. NDDB had promoted SFVAM with an objective to provide optimal condition and new trading oppor-tunities for fruits and vegetables. SFVAM has organized farmers into Farmers Associations (FA) in different parts of the country for sourcing raw materials for the market. The fruits and vegetables are sold under a brand name SAFAL. SFVAM, auction system is based on a single, central auction in which all the registered buyers (Business Associates)
participate. The produce supplied by individual growers is subjected to grading/sorting and packing at the FA level. The country’s first state of the art International Floriculture Auction Centre set up here provides a common platform for growers and buyers to explore more busi-ness opportunities in the international and domestic markets. The FAs are linked with Financial Institutions for meeting the credit requirements with tripartite arrangements for recovery of loan at the selling point in the market. Since producers are expected to adopt Good Agricultural Practices (GAP), the demand for higher credit is anticipated. SAFAL is a good model of technology, credit and market linkage for perishables.
Source: Unpublished study conducted by Karnataka Regional Office, NABARD in 2006.

78 Biswa Bandhu Mohanty
technical advice. Under the manage-ment provision, the grower agrees to follow recommended production, methodology, inputs, cultivation and harvesting specifications.
Contract farming encourages market-led production of crops and generates steady income for individual farmers. Contract farming generates gainful employment in rural communities, particularly for SF, MF and the landless and promotes self-reliance in general by garnering locally available resources and expertise to meet new challenges. It also benefits the buyer in terms of assured flow of raw materials, long term commitment for supply at pre-determined price and earning goodwill for the firm. NDDB led SAFAL ex-periment at Bangalore in the public sector (see Box 5.8 on page 77) and con- tract farming at the aegis of private companies, namely Reliance, PepsiCo, Pantaloon, etc., are examples of contract farming.
Financial institutions play an im-portant role in providing finance for high-tech agriculture under contract farming format. They also provide production credit to farmers and act as payment channels for companies, providing crop insurance products to farmers. They also offer various banking products like warehousing receipt financing and commodity based financing for their clients/farmers.
6. Producer Companies: In the Mandi system, there is no premium for quality or long-term relationships. Agribusiness enterprises, with high capital investment are, therefore, increasingly looking for direct tie-up with farmers to ensure consistent, continuous and adequate supplies supply. As it is not practical to deal with individual farmers, the agri-business enterprises are looking for aggregates or intermediary institutions. Producer companies which combine positives of cooperative enterprise and efficiency of a company meet the
expectations of agribusiness enter-prises. Indian Organic Farmers Produce Company Ltd, Kerala, producing certified organic products, Vanila India Producer Company Ltd (Vanilco), also in Kerala with members growing and marketing Vanila, Banana India Producer Company Ltd (BIPCL), in Kerala, formed by banana growers facilitating value addition are some of the Producer Companies. Government of Madhya Pradesh under the District Poverty Initiatives Programme (DPIP) has promoted a large number of Pro-ducer Companies in various parts of the State. The State Government has been supporting these companies through policy measures and financial assistance. In Gujarat, the Junagarh Dairy has been constituted a Producer Company to ensure better price for the milk producers (Murray, 2008).
Most of the Producer Companies are still in a nascent stage and operating as providers of technical know-how or facilitating marketing. There has not been significant demand for bank finance by these companies. However, as the Producer Companies take roots, they will need capital from the banking system. As these Companies do not have anything substantial other than producer members’ equity to leverage borrowings, the banks may have to adopt unconventional approaches relying on their credibility, guarantees/undertaking by the promoter institutions/purchase order/agreements. The model is evolving, and financial institutions can tap the opportunity right from their incubation. The Producer Com- panies in various commodity segments may be evolved into different formats: (a) aggregator, input provider, (b) intermediating with corporate entities and (c) with own processing facility, brand and market channels. These will help in making farming more remunerative and opening up opportunities for bank finance.

Financing Agriculture 79
7. Agri Export Zones (AEZ): GoI in 2001 introduced a scheme for boosting export by providing comprehensive support mechanism for a particular potential produce in a contiguous area. The support mechanism encompasses de-velopment and sourcing of raw materials and packaging leading to exports. It is a cluster approach for a geographical region with a potential product and adopting an end-to-end approach integrating the entire process, from production till it reaches the market. The anticipated benefits are as under:
a. Strengthening backward linkages with a market-oriented approach
b. Ensuring product acceptability and its competitiveness abroad as well as in the domestic market
c. Bringing in value addition to basic agricultural produce
d. Bringing down cost of production through economy of scale
e. Ensuring better price for agricultural produce
f. Improving product quality and packaging
g. Promoting trade-related research and development
h. Increasing employment oppor-tunities
Agricultural and Processed Food Products Export Development Authority (APEDA) has been identified as nodal agency and National Horticulture Board, Ministry of Food Processing, Ministry of Agriculture, NABARD, Export-Import Bank of India (EXIM Bank), etc., are involved as convergence partners. Forty-eight AEZs with a pro-jected export of ` 103,000 million in five years are operating in various parts of the country. A web-based monitoring system is already in place. Besides fi-nancing farmers by way of production loans, the banks support stakeholders in contract farming in AEZs. Several successful ventures of contract farming in AEZ have been witnessed. The AEZ in Gherkins in Karnataka is a case in point.
8. Creating Value Chain with an Inte-grated Approach: Commercial Banks are increasingly involved in financing different models for infrastructural development in agriculture, which has a multiplier effect. By financing different products and targeting diverse players in the value chain, a complex but sustainable
Box: 5.9: Supply chain integration in horticulture
Through debt financing, ICICI Bank facilitated the Advani Group in creation of 18,000 MT of controlled atmosphere storage facilities for apples (Dev Bhoomi) in Himachal Pradesh. The bank facilitated investment by the private sector in the value chain and helped develop
linkages with the growers and markets. The supply chain integration for horticulture crops, such as apples ensured higher price realization for farmers and also resulted in giving better quality of horticulture produce to the ultimate consumers.
Source: Kochar (2009).
Box 5.10: ICICI Bank’s warehouse receipt-based financing
ICICI bank developed a product wherein a farmer could avail loan against produce stored in a warehouse. The bank also helped to develop cost-effective security system for warehouses where farmers could safely store their produce. The cost of monitoring was reduced by use of Global System for Mobile Communications (GSM) technology. Introducing intelligent
Black Boxes’ at around 50 warehouses across the country facilitate monitoring from re-mote locations and, thereby, reduces cost of monitoring. It also facilitates doing business with smaller warehouses where the SF and MF stock their produce.
Source: Kochar (2009).

80 Biswa Bandhu Mohanty
system is created. Banks provide medium and long-term loans under the integrated model. An example of bank facilitating supply chain integration is given in Box 5.9 on page 79. Yes Bank has been supporting an Integrated Agro Food Park (AFP) Scheme (Kapoor, 2009). A typical AFP has some focused food chains and has processing and some part of production facilities within the park. These parks require a large supply of raw material from nearby areas for which they need collection centres. These centres termed Rural Transformation Centres (RTC), besides collection, can also undertake first level of quality control. As transformation of rural economy is one of the main ob-jectives for sustainable development of Agro Food Park, they make a strong case for PPP for rural development. Financing mega infrastructure models impact a big chunk of rural population and provides tremendous scope for financial inclusion.
9. Financing of Rural Marts: Rural Marts help rural consumers in buy back of outputs, crop finance, supply of agri-inputs, transfer of information (weather, price, demand and supply) and door delivery of products. Major corporate houses such as the Tatas, Birlas, Bharati and Reliance and the world’s giant retailers such as Mart, Tesco and Carrefour are entering rural sector with huge investments in retail-supply chain. These organized retailers provide farmers with seeds, facilitating them to increase yields with the assured buy backs. Their entry has resulted in
greater investment in farm technology. Retailers such as Reliance Retail and Bharati, exporters such as Gautam Green Company and Mahendra Shubhlabh and consolidators such as DCM Shriram are positioning themselves as farm to fork supply chains (Atre, 2008). The entry of this chain will create innovative and need-based products and service opportunities for banks. The retail boom is expected to revolutionize the farm credit scenario. Rural India is changing in terms of market size and diversity and corporates, banks and professionals will get many more oppor-tunities. The success story of ITC’s e-choupal programme given in Box 5.11 is a vivid example of corporate sector’s intervention in agribusiness.
Bottom of the Pyramid (BOP) markets represent 80 percent of humanity. It is reasonable to expect that four billion people in search of an improved quality of life will create one of the most vibrant growth markets we have ever seen. Private sector involvement in development can be a win for both the BOP consumers and the private sector. All of us can learn. The flow of ideas, knowledge, and innovation will become a two-way street-from the developed countries to the developing as well as the reverse. Multi National Companies (MNCs) can help BOP markets to develop. They can also learn from BOP markets. (Prahalad, 2006)
10. Technology Applications: Considering that a good number of farmer customers are illiterate and find it difficult to utilize services of regular automated teller machines (ATMs), banks have
Box 5.11: ITC’s E-Choupal: Linking business with societal purpose
6,500 ITC e-choupal centres spread across 40,000 villages have benefited 4 million farmers, particularly SF/MF. The e-choupals provide farming know-how and services, timely and relevant weather information, transparent price discovery and access to wider markets. These enable farmers to bargain as virtual buyers’ cooperatives, and opt for best practices.
Small farmers can manage risks better, by linking to future markets. E-Choupal’s digital infrastructure has empowered the farmers in many ways including accessing to banking service.
Source: ITC, available at www.itcportal.com/www.echanpal.com.

Financing Agriculture 81
introduced biometric ATMs which facilitate operation for illiterate farmers (e.g., Punjab National Bank [PNB]). Under the branchless banking model, banks have introduced biometric smart card-based technology with the help of BC/BF. This facilitates reach to the last mile customers. The technology provides cost-effective and transparent services. Emphasis has been on financial inclusion in the unbanked centres with focus on women, landless, agriculture labourers, tenant farmers and oral lessees. Technology has enabled field functionaries to utilize their time on field visits with a view to meeting farmers for business counselling, guidance and also recovery of advances. Some of the banks (e.g., State Bank of India [SBI]) have introduced kiosk banking, mobile banking, bulk opening/bulk handling and small ticket asset accounts on technology platform based on debit card/master card operations through BC. Training and sensitization for such applications for bank’s own staff and the customers have been also embarked upon. An example of training strategy adopted by banks is furnished in Box 5.12.
Technology has been leveraged by opening accounts by Customer Service Point (CSP) of BCs engaged through Smart Cards which are biometric. These are operated through Point of Sale (PoS) mechanism and finger point recog- nizing machines which enable custom-ers to transact business through CSPs operating in nearby areas.
11. Special Products and Delivery Mechanism: Many of CBs have estab-lished specialized setups to cater to the specific needs of agriculture financing
and farmer customers’ welfare. These include agri-extension units, high-tech agri-finance branches and agribusiness marketing units with specialized, tech-nically qualified and dedicated staff. SBI has created Marketing and Recovery Team (MART) in each region with re-sponsibility for marketing and building relationships with farmers, dealers of agri-products, organizing promotional events, loan sanctioning, monitoring and recovery, appraisal of high-value proposals, advisory services and follow up. Structured loan products such as Kisan Bike, Agri-Venders’ Bike, Farmers Home Loan, Land Purchase Scheme by Indian Bank and Syndicate Kisan Saathi Scheme, and Syndicate Gram Yojana by Syndicate Bank are some examples. Kisan Sathi Yojna of Purvanchal Gramin Bank is an example of a Debt Swap product to relieve farmers from clutches of moneylenders. Many of the banks have improved upon KCC mechanism with additional provisions. E-KCC enables the user to operate from any branch for cash withdrawal or input purchase. It seeks to refine the true con-cept of KCC to the extent of bringing anytime, anywhere money for farmers and integrating features of electronic card and KCC Scheme.
12. Farmers Awareness/Facilitation Measures
a. Farmers Clubs (FC): The Farmers Clubs programme was launched by NABARD, soon after its inception in 1982, to propagate the concept of development through Credit under the then Vikash Volunteer Vahini (VVV). The programme has been redefined and enlarged over a period of time with an aim to organize
Box 5.12: Mobile vans for knowledge management (KM) of farmers
Punjab National Bank has been using mobile vans at Farmers’ Training Centre at Sachakhera (Haryana) for providing off-site training on improved package and practices of agriculture
crops, allied activities and soil testing and jatropha cultivation. The van doubles as an information Kiosk.
Source: Kamath (2009).

82 Biswa Bandhu Mohanty
farmers around a common agenda of access to credit, technology, market and extension services. NABARD has been providing promotional grant for formation, nurturing and maintenance of Clubs (for initial three years) through CBs, RRBs, Cooperative banks and grassroots organizations (NGOs, PRIs, KVKs, etc.). The FCs have been assuming role of Self Help Promoting Insti-tutions (SHPIs) and also BF for CBs. Federations of FCs have also been formed where FCs function as agents for dissemination of technology for the farmers with the help of KVKs. The recent policy focus has been on formation of federation of FCs/Producer Groups/Companies at district level with a view to promoting access to credit, productivity and income through collective efforts. As on 31 March 2009, there were 38,215 Clubs covering 87,724 villages in 581 districts (NABARD 2009a).
b. Special Organizational Outfits of Banks: Several banks have set up special organization arms. Syndicate Bank promoted Syndicate Agri-cultural Foundation (SAF) to disseminate scientific farming tech-niques. SAF, in turn, established Farm Information Exchange Clubs (FIECs) for farmers and Farm Schools for schoolchildren. Indian Bank established Agri Credit Intensive Branches (ACI) and Micro State Branches. They have also set up Micro Credit Kendra’s (MCKs), a special window for microfinance in rural and semi-urban areas. The Rural Development and Self Employment Training Institutes (RUDSETI) symbolizes synergy of banks and NGOs in pursuit of skill and entrepreneurship development of rural unemployed youth. The replication of RUDSETIs in all dis-tricts in a phased manner would go a long way in farmers’/agri-entre-preneurs’ capacity building.
c. Business Counselling Centres: Many banks have embarked upon financial/business counselling pro-grammes for knowledge manage-ment of farmers. Indian Bank has set up Financial Literacy and Credit Counselling Cells, conducts Agro-extension Service meets, intensive farm credit campaign and Green Plus campaign. Canara Bank has formed Canara Grameena Vikas Vahini as a vehicle for inclusive growth, set up Green Brigades, deployed vehicles for financial literacy campaign, pro-vides extension services on farm technology and imparts vocation training to farmers. SBI has estab-lished Farmers’ Corner (Kisan March) and undertakes Farmers’ Training Programmes.
13. Credit Information Bureau: The establishment of Credit Information Bureau (India) Limited (CIBIL), pro-moted by SBI, Housing Development Finance Corporation (HDFC), Dun and Bradstreet Information Services India Pvt. Ltd (D&B) and Trans Union Inter-national Inc. (Trans Union) is a major step for assessing credit worthiness/credit rating of borrower and risk-based pricing of loans. Comprehensive credit information can be provided by collecting, collating and disseminating credit information pertaining to both commercial and common borrowers to a closed user group of members. RBI has permitted three more Credit Bureau, namely Experian Credit Information Co. of India Pvt. Ltd, Highmark Credit Information Services Pvt. Ltd and Equifax Credit Information Services Pvt. Ltd. This will provide a broad range of credit data and information solutions and thereby contain NPAs and improve portfolio quality of banks. Some of the MFIs constituting Microfinance Institution Networks (MFINs) have invested in Alpha Finance Consul-tants (P) Ltd to set up Credit Bureau to address issue of multiple borrowing and over-indebtedness.

Financing Agriculture 83
14. Process Simplification: Consequent to competition, adoption of technology and emerging need for flexibility, speed, cost cutting and quality of financial ser- vices, there has been continued efforts for re-engineering delivery processes in the banks. The banks have made attempts at simplification of documen-tation, introduction of flexi timings, increased delegation of sanctioning powers to branch managers and redressal mechanism for customer’s grievances. Codes of Standard and Fair Practices have been introduced in banks with supervisory guidance of RBI/NABARD. Some of the important changes/trends in the banking sector are outlined below:
a. Scale of finance for various crops and farm and off-farm activities have been liberalized and each bank has been determining its own scale of finance.
b. Banks are taking recourse to collateral-free lending approach for dispensation of microfinance.
c. With BC/BF mechanism in place and technology solutions at their disposal, as also the MANREGA experience, some banks have started disbursement of loans by way of direct credit to farmer’s account.
d. Agri-rural activity is getting more business oriented and each household has its distinct identity, interest and priority. Considering differential needs and advantages of household analysis, a discriminatory approach for financial and other support ser-vices with household as unit is being realized. Some banks have started financing accordingly.
e. With enactment of Warehousing Development and Regulation Bill, Warehousing Receipt (WR) becomes a negotiable instrument and the banks can, therefore, finance against pledge of WR. This enables farmers to store their produce and take advan- tage of any favourable price move-ment in future. Some banks have
already started developing products around WRs. An example of one of the banks’ product in financing against WRs is given in Box 5.10 on page 79. They can establish linkage with the Commodity Future market through financing WR and, thereby, facilitate the farmers or an aggregate of farmers to take a pos-ition in future market to manage the price risk in the given commodities. They can avail professional help of Collateral Management Companies set up for management of warehouse and produce stored, while financing against WRs. Farmers will get loans at favourable terms and bankers would minimize credit risks under this arrangement.
5.9. Role expectations
Agriculture has unfolded immense scope for diversification, commercialization and creation of wealth for the economy. Though a critical input, Credit is not a sufficient criterion to bring about trans-formation of subsistence agriculture to sustainable agriculture livelihoods. It is also not sufficient if only a small segment of enterprising farmers capitalize emerging opportunities. Actual development of agriculture is when the bottom segment of farmers becomes capable of availing economic opportunities. The changing paradigm in agriculture demands pro-active, progressive and forward-looking roles from stakeholders, particularly GoI, fi-nancial institutions, development agencies and farmers to carry forward the agenda for inclusive growth and sustainable agri-culture. Based on the above analysis, the following approaches are suggested:
1. Government of India/State Governments
l Shifting emphasis from supply-centric approaches/programmes to demand-driven services for greater and sustainable impact.

84 Biswa Bandhu Mohanty
l Accelerating and deepening infra-
structure development in rural areas
to boost agriculture production and
productivity.
l Phasing out capital subsidies and
redirecting resources for promotion
of infrastructure.
l Transforming all extension services
of GoI and State Governments to
become market-led, participatory
and responsive.
l Enhancing production and pro-
ductivity through systematic and
comprehensive interventions.
l Evolving/implementing compre-
hensive and cost-effective agricul-
ture insurance schemes including
weather insurance and addressing
climate changes risks.
l Bringing under convergence all
departments related to livelihood
promotion.
l Create an enabling and congenial
environment for recycling of credit;
and not announce any further waiver
of loans.
l Encouraging private investment in
agriculture for capital formation.
l Strengthening financial institutions
and community-based organizations
to ensure their effective participation
in livelihood promotion and sus-
tainable agriculture development
measures.
l A farm-to-work programme so
that those employed in seasonal
agricultural work can move to other
supplementary work in between.
l Taking measures for KM of farmers,
particularly in key areas such as
modern farming techniques, tech-
nology, agri-markets and disaster
management. The Four Cs (Con-
nectivity, Contents, Capacity-building,
Care and management), as National
Farmers’ Commission put it, are cen-
tral to making all knowledge man-
agement missions successful.
2. Financial Institutions and Develop-ment Institutions
l Encouraging good repayment culture—incentivizing farmers for prompt repayment.
l Ensuring financial services to far-mers by banks/MFIs at affordable cost and in conformity with ‘social per-formance management’ principles.
l Providing greater long-term finance for capital formation in agriculture and allied activities.
l Developing internal capacity in pre-paration, appraisal, monitoring, eva-luation of livelihood programmes, project lending and area based inte-grated schemes.
l Training and exposures for officials to be up-scaled and deepened.
l Support innovative business models in agriculture for farmers’ employ-ment and income enhancement.
l Adopting a soft recovery approach towards farmers.
3. Farmers
l Farmers need to know about programmes/schemes, avenues, their rights, entitlements and obligations.
l Considering that most community based platforms/institutions are envisaged as participatory, farmers’ involvement in the whole process is essential.
l Modern agriculture practices are knowledge intensive and technology/skill based. Farmers need to fam-iliarize themselves with the same.
l Farmer borrowers need to inculcate credit discipline for financial insti-tutions to recycle funds.
l Progressive farmers may assume role of knowledge workers under the aegis of Farmers Clubs and pro-pagate best practices.
l Farmers should take recourse to business counselling in the event of stress.

Financing Agriculture 85
5.10. Conclusion
The Government of India has envisaged a 4 per cent growth in agriculture during the 11th and 12th plan periods. Agriculture, therefore, would be one of the major con- tributors towards achievement of the planned 9 per cent economic growth rate. Keeping in view ground realities in agri-culture, doubling of current growth rate is a daunting task. GoI has made enormous investment in irrigation, input subsidies, farm loan waiver and extension. Banks have stepped up agri-credit support sub-stantially. Policy initiatives have been taken, on recommendations of National Commission on Farmers, for boosting Indian agriculture and salvaging farmers’ plight in the area of credit, technology, ex-tension and marketing services. However, considering challenges from climate change, science and technology, farmers’ distress and targeted growth, much more policy reforms, efficiency and speed in implementation and above all, passion, mission and vision are necessary.
The development should include adoption of a vision-based approach in stimulating support to agriculture, creating conducive economic climate, rationalization of financial services for farming, tech-nological and extension services in tune with market dynamics and conservation of natural resources. The financial institutions have onerous responsibility in carrying forward the above mission. They need to play a catalytic role much beyond credit dispensation and recovery. They need to adopt a developmental perspective vis-à-vis agriculture and farmers’ welfare. The activity for which the farmer is financed should pay for itself, generate sustainable returns and be environmentally safe.
It is not the quantum of money that has flown in, but how much sustainable employment, income, livelihood and quality of life for farmers have been effected that is the benchmark for success for measuring success of financial services. The above paradigms coupled with the ongoing Unique
Identification Number (UID) Project of
GoI, Financial Inclusion Plans (FIP) of
banks and Farmers’ Commissions of some
State Governments should ultimately
provide identity, dignity and empower-
ment to the teeming millions of farmers.
We must continue to invest, nurture and
support an environment that can harness
the energies and aspirations of farmers.
ReferencesAtre, S.V. (2008). ‘Retail Boom: New Opportunities
in Agricultural Finance’, National Journal of
Agriculture and Rural Development, Jan–Feb
2008: 9–11.
Bhatt, O.P. (2009). ‘State Bank of India: The Pioneer in
Agriculture Lending’, CAB Calling, Special Issue,
Oct–Dec 2009, 33: 11–16.
Kamath, K.R. (2009). ‘Punjab National Bank’s
Initiatives in Agriculture Credit’, CAB Calling,
Oct–Dec 2009, 33: 22–26.
Kapoor, Rana. (2009). ‘Financing Agriculture and
Agribusiness: Yes Bank’s Approach’, CAB Calling,
Oct–Dec 2009, 33: 45–53.
Kochar, Chandra D. (2009). ‘Reaching out to Rural
India: The ICICI Bank Experience’, CAB Calling,
Oct–Dec 2009, 33: 17–21.
Mohan, Rakesh. (2006). ‘Agricultural Credit in
India—Status, Issues and Future Agenda’,
Economic and Political Weekly, Mar 2006, XLI:
1013–23.
Mohanty, B.B. (2009). ‘Transformation of Credit
Delivery for the Poor through SHGs-Bank Linkage
Programme’, paper presented at LBS Academy,
Mussorie, 2009.
Murray, E.V. (2008). ‘Producer Company Model-
Current Status and Future Outlook—Opportunities
for Bank Finance’, CAB Calling, June 2008, 32:
45–51.
NABARD. (2009a). Annual Report 2008–09. Mumbai:
NABARD.
———(2009b). Status of Microfinance in India 2008–09.
Mumbai: NABARD.
NSSO. (2005). Indebtedness of Farmers’ Households,
Survey Report No. 498 (59th Round). New
Delhi: NSSO.
Prahalad, C.K. (2006). The Fortune at the Bottom
of the Pyramid, pp. 61–62, Wharton School
Publishing.
Sahu, B.S. (2010). ‘Agrarian Crisis—Distress, Suicides
and Emerging Challenges’, presented at 92nd
Conference of the Indian Economists Association,
Bhubaneswar, 2010.
Thorat, YSP. (2008). ‘Indian Agriculture 2017’, CAB
Calling, June 2008: 68–71.
86 Biswa Bandhu Mohanty

6.1. Introduction
The key premise in this chapter is that sig-nificant transformation in agri-marketing in India, particularly efforts to include small marginal farmers, will come through only if overall agriculture is treated as an economic activity—not merely a source of livelihood for farmers across the country. This change in perspective is perhaps the most import-ant factor that will inspire necessary changes in government policy, direct investment towards infrastructure and create fertile ground for new, scalable enterprise models and successful public private partnerships (PPP). The chapter shares a variety of dis-tinct case studies—each starting with the premise of a market based agri-marketing model but taking a different route to reach that objective.
6.2. Current situation
We face a dichotomy in the state of agri-culture in India. The country has all the critical elements and resources for a robust agriculture-based economy:
l India has over 190 million hectares of cultivable land, second only to the United States and more than China and Europe. It has 20 per cent of the world’s irrigable land under food grains, is the second largest grower of vegetables and produces 17 per cent of the world’s cotton.
l The country has abundant water re-ources that can be tapped more effi-ciently to increase the proportion of irrigated land.
l Most states have the potential to double farm yields through better application of known cropping best practices and available technology.
l Consistent economic growth over the last 10 years has opened up large market opportunities in the domestic market for mass-market foods, value-added processed products and niche premium foods. While 2008–09 was a trying period for organized retail, there is a resurgence of activity in this space.
However, our inability to leverage this opportunity to our advantage is evident from the following facts:
l Agriculture’s contribution to Gross Domestic Product (GDP) continues to reduce relative to other sectors despite providing employment to more than half the country’s population (Table 6.1).
l Repeated Fragmentation: The country has more than 100 million small farm-ers with landholdings between 1 and 4 hectares. They account for 30 per cent of cultivable land in the country. The share of small farmers in the total number of landholdings increased from 70 per cent in 1971 to 80 per cent in 1998 and is expected to be at 83 per cent
Agriculture Marketing—From Livelihoods
to EnterpriseReshma anand
Chapter 6

88 Reshma anand
by the end of 2010. Between 1960 and 2000, the average farm size in India shrank from 2.7 hectares to less than 1.2 hectares. Low farm productivity fol-lowed as a consequence of repeated land fragmentation.
l Poor Infrastructure: Post harvest losses due to wastage and poor infrastructure account for an estimated 10 per cent of food grain production and 25 per cent of fruit and vegetable production. Inadequate rural road connectivity and other supporting infrastructure (e.g., cold storage network, etc.), results in considerable wastage every year.
l Limited Irrigation: Only about 35 per cent of agricultural land is irrigated. Irrigation networks are yet to reach a considerable proportion of the farmers, which increases their vulnerability by making them exclusively dependent on rainfalls.
l Livelihood versus Economic activity: For long, agriculture has been treated as a means of livelihood for a substantial proportion of rural population rather than an economic profession, which leads to the obvious efficiency conse-quences. This notion has been reflected in the mindset of policy-makers as well who have focused more on providing
support to the sector at the cost of stream-lining investments and ensuring a robust marketing network in agriculture.
The National Agriculture Policy 2000 assessed that the Indian agriculture sector faces problems of capital inadequacy, lack of infrastructure support and demands side constraints such as controls on movement, storage and sale of agricultural products. These have continued to affect the eco-nomic viability of the agricultural sector. The Tenth Plan document further notes:
The current market system is dominated by traders. Appropriate and effective linkages between the producers and sellers continue to be weak. The absence of rural road con-nectivity and other infrastructure, combined with improper management, lack of mar- ket intelligence and inadequate credit support has resulted in a system that is unfavourable to the farmers. The adverse impact of all these is more pronounced in the case of the small and marginal farmers who consti-tute about 78 per cent of the entire farming community. . . . Further, primary rural mar-kets are not equipped with basic facilities like platforms for sale and auction, electri- city, drinking water, link roads, traders’ premises, facilities for post-harvest man-agement etc.
6.3. Agri-marketing—Scope, key players and channels
6.3.1. ScopeAgriculture marketing comprises all the operations involved in the movement of produce from the farm till it reaches the ultimate consumer. Several functions are involved in this process, such as:
1. Buying and assembling2. Transporting and loading/unloading3. Grading4. Storing/warehousing5. Processing6. Financing7. Risk-bearing8. Retailing
Table 6.1: Agriculture sector: key indicators at constant prices (2004–05) (%)
Item 2007–08 2008–09
Growth in GDP in agriculture and allied sectors
4.7 1.6
Agriculture 5.0 1.1Forestry and logging 2.2 2.9Fishing 6.0 6.3
Share in GDP—agriculture and allied sectors
16.4 15.7
Agriculture 13.9 13.2Forestry and logging 1.7 1.7Fishing 0.8 0.8
Employment in the agriculture sector as share of total employment in 2004–05 as per CDS
52.1
Source: Central Statistical Organization (CSO) and Department of Agriculture and Cooperation Current Daily Status (CDS).

Agriculture Marketing 89
6.3.2. Key players in agri-marketing6.3.2.1. The Producer: Most farmers or producers sell their surplus either in the village or in the local market or mandi. Some farmers, especially the large ones, assemble the produce of small farmers, transport it to the nearby market for sale.
6.3.2.2. The Government: In the interest of public welfare, the Government in India intervenes heavily in the agri-marketing system in the following ways:
l Framing of rules and regulations for the protection of the interest of farmers and consumers. The government regulates the sale of agricultural produce, sets support prices for farmers and also intervenes in distribution of food stocks.
l Promotional activities such as storage and warehousing, transportation and communication facilities credit facility through various institutions, grading and standardization.
l Administration of prices at different levels of marketing guaranteeing minimum support prices to producers, providing commodities at fair prices to consum-ers and fixing the rates of commission charged by commission agents.
l Influencing supply and demand by import, export, internal procurement and distribution.
To deliver its agenda, the government relies on a network of organizations. These include:
l The Food Corporation of India (FCI): FCI procures a sizable portion of mar-ketable surplus of food grains and other agricultural commodities at incentive prices from the farmers on behalf of the Central and State Governments. It releases the stocks through the public distribution system (fair price shops and controlled item shops). It aims to minimize seasonal price fluctuations and inter-regional price variations in
agricultural commodities and build up a sizable buffer stock of food grains to ensure National Food Security.
l Specialized Marketing Organizations: For commercial crops, especially those with potential in the export markets, there are a host of specialized organiza-tions that focus on promoting markets for these products, providing quality standards, encouraging value addition and providing requisite support to farmers to improve productivity. Key organizations include:
o Cotton Corporation of India (CCI)o Jute Corporation of India (JCI)o Tea Boardo Coffee Boardo Spice Boardo National Oilseeds and Vegetable Oils
Development Board (NOVOD)o Agricultural Processed Products
and Export Development Agency (APEDA)
o Marine Products Export Develop-ment Agency (MPEDA)
l Cooperatives and Federations
o The National Agricultural Cooperative Marketing Federation (NAFED)
o All India Cotton Cooperative Feder-ation Limited
o National Dairy Development Board (NDDB)
l Departments and Boards
o The Directorate of Marketing and Inspection (DMI)
o State Level Agricultural Marketing Departments and Agricultural Mar-keting Boards
o State and Lower Level Cooperative Marketing Societies
6.3.2.3. The Trader/Retailer/Processor: The main trading functionaries in the marketing channel for agricultural com-modities include village traders, primary and secondary wholesalers, commission

90 Reshma anand
agents, processors and retailers including
vendors. Private trade, despite government
intervention, has continued to dominate
the trade in agricultural commodities. The
quantity of agricultural producers handled
by the government agencies has been about
10 per cent of the total value of marketed
surplus. Around 10 per cent of the mar-
keted surplus is handled by the producers
or consumers cooperatives. Thus, nearly
80 per cent of the marketed surplus of agri-
cultural products in India is handled by
private sector—largely unorganized.
6.4. Channels
Characteristics of channels of agricultural
marketing affect the prices paid by con-
sumers and shares of them received by the
producer. The shorter the channel, lesser
the market costs and cheaper the com-
modity to the consumer. When the channel
is long with more intermediaries, prices are
more and producer’s share is less. The key
channels for agri-marketing in India are:
l Government Channel: Producer—Gov-
ernment Department—End Consumer
The government channel is used
mainly for food grains like rice, wheat and
sugar. In some essential commodities,
when the prices are unduly high or low,
the government enters into market to
buy the commodities and sell them to
protect the interests of both—producer
and consumer.
l Cooperative Channel: Producer—
Cooperative—Consumer
The cooperative channel for farm
produce has few success stories in India.
In Maharashtra, this channel is used
partially in important fruit crops like
grapes, pomegranate, banana, oranges.
l Private Channel: Producer—Village
Merchant—Wholesaler—Commission
Agent—Retailer—Consumer.
In the private channel, there are many
intermediaries, which result in high costs
and market margins. Therefore, com-modities become costly for the final consumer and this reduces the producer’s share in consumer’s prices. This is the traditional and dominant channel as nearly 60–70 per cent agricultural pro-duce is sold through this channel.
6.5. Key challenges in agricultural marketing
6.5.1. Regulated markets under Agricultural Produce Market Committee (APMC) have discouraged enterprise and private sector participation
Agricultural markets in most parts of the country are established and regulated under the State APMC Acts. The APMCs, set up in major production and arrival centres across the country, perform the crucial function of organizing agriculture trade and pro- viding a meeting point for buyers and sellers. These 7,161 regulated markets, or mandis, are mostly primary wholesale mar-kets. Farmers can only sell their produce at mandis and not directly to buyers.
Though the APMCs were set up to protect farmers from exploitation of inter-mediaries and traders, as well as ensure better prices and timely payment for their produce, these markets have become in-efficient over a period of time. During the past 50 years, no significant improvement has taken place in the functioning of agri-cultural markets. The APMC Acts have created monopolies and entry barriers and prevented disintermediation. This mono- poly of government-regulated wholesale markets has prevented development of a competitive marketing system in the coun-try, providing little help to farmers in direct marketing, organizing retailing, a smooth raw material supply to agro-processing indus- tries and adoption of innovative marketing systems and technologies.
The multiplicity of charges imposed on these markets is a major disincentive for the corporate private sector players to participate. Private sector participation in

Agriculture Marketing 91
agri-marketing continues to be tentative on account of factors above and the difficulty to obtain the produce of uniform quality for which a premium price can be charged. While a Model Act has been proposed, it is yet to be implemented across states.
6.5.2. Low investment in infrastructure and productivity
Over the last 25 years, India has not invested enough in raising agricultural productiv-ity. Government, the largest investor in Indian agriculture, sells seeds, fertilizer, water and extension services to farmers and also buys their products. But government’s investments have focused on subsidizing not developing agriculture. Bottlenecks such as rural road connectivity and other sup- porting infrastructure (e.g., cold storage network, etc.) result in considerable wastage every year estimated at over ` 5,000 billion. Most mandis are typically located near important towns, centres of production, dis-trict headquarters or major trade centres. While it is true that every district has a mandi and that they are spread through-out the length and breadth of the country, small farmers have limited access to these mandis. Transactions take place between commission agents and wholesalers. Market intermediaries purchase the farm produce from farmers, often in advance, and bring it to mandis for sale to wholesalers. Small
farmers have limited access to mandis. Any wasted produce for a small farmer can be extremely damaging.
Poor linkages in the marketing chan-nels and poor marketing infrastructure lead to high and fluctuating consumer prices. And only a small proportion of the consumer rupee reaches the farmers. There is substantial wastage, deterioration in quality and frequent mismatch between demand and supply spatially and over time. Ninety per cent of effort (and investment) in Indian agriculture is production oriented; only 10 per cent is on marketing and post harvest phases (CII, 2009).
Both agricultural output and GDP could get a major fillip by reduction in wast-ages and inefficiencies in the marketing process. Insufficient investment in raising productivity has been the biggest obstacle to food security in India. Developing countries such as Indonesia and China recognized the importance of raising productivity and have long since transformed their agricul-ture sectors to the enduring benefit of their people.
6.5.3. Inter-state barriers to tradeThere are significant inter-state barriers to trade. These barriers prevent seamless movement and price distortions on account of tax structures and physical blockages (Box 6.1). These barriers have a significant impact on prices and avoidable wastages.
Box 6.1: Interstate barriers to trade
Taxation-related barriersl Variation in rates across states (rationalized
after VAT introduction, but not eliminated) leads to evasion through paper trades by unscrupulous players.
l High rates (most common rate of 5 per cent appears low, but impact already low margins in agribusiness) are also an incentive for evasion.
l Multi-point taxation (APMC cess is collected at multiple points) has a cascading impact on prices.
Physical barriersl Physical controls using the Essential Com-
modities Act (like stock limits at times of short-term shortages) lead to long-term supply distortions.
l Restrictions on movement of specific com-modities create situation of uncertainty.
l Multiple check posts cause serious wastage of perishable agri-produce.
l APMC regulations restrict movement of agri-produce to attractive markets over long distance, restricting ability of farmers to manage price risk.
Source: CII (2009).
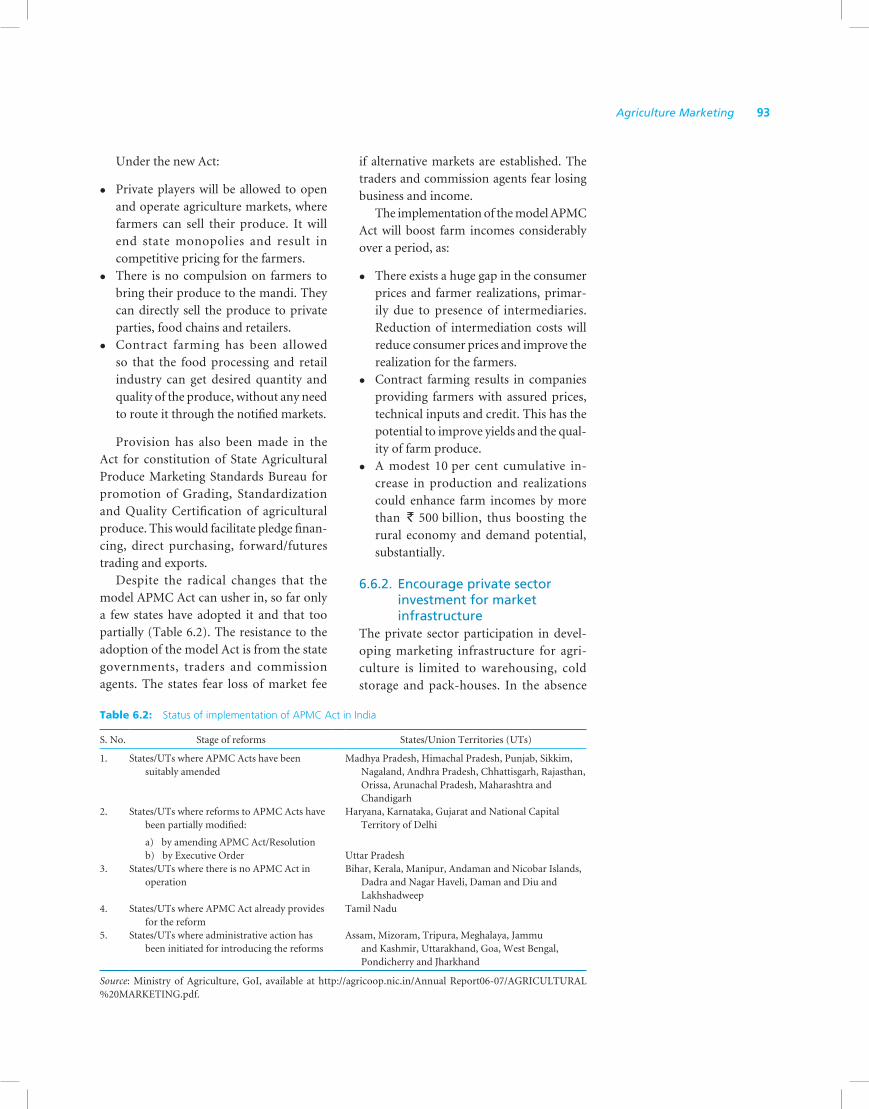
92 Reshma anand
6.5.4. Large number of intermediaries distorting prices without any benefits to farmers
Poor infrastructure and low penetration of marketing network have resulted in a large number of intermediaries in the agri-marketing system. This results in high price fluctuations. Prices realized by the farmers still remain low end and bulk of the margin between the farm-gate and final price is consumed by intermediaries. A study conducted by Images Retail (CII, 2009) indicates that the retail price of pro-duce sold by the farmer can go up to 3.5 times the farm-gate price. They also suggest that if the product is routed through a cooperative of the farmers and a distribution company, the end retail price can be 26 per cent lower, resulting in better prices for farmers and/or reduced prices for consumers.
6.5.5. Agriculture financing seen as separate from marketing
Agriculture sector financing has so far mainly concentrated on production financing, leav-ing behind equally important marketing finance. During the Green Revolution, co- operative institutions played a major role in providing production financing in many parts of India. Over the years, various gov- ernment policies have weakened these institutions and agriculture financing has not kept pace with the increased demand, thereby impacting agriculture sector growth in the country. Considerable efforts in recent years to improve agriculture financing through measures such as reduction in interest rates, mandating banks to increase the share of loans to the sector and Kisan Credit Cards among others, a large gap still remains between provisioning and the requirement, forcing farmers to fall back on the informal sector. There exists complementariness in agricultural mar- keting and financing; ignoring this attri-bute and dealing with them separately has impacted growth of agriculture and impacted price realization by farmers.
Challenges of capital inadequacy, lack
of infrastructure support, lopsided in-
vestments and demand side constraints
such as controls on movement, storage
and sale of agricultural products have
continued to affect the economic viability
of agricultural sector. In this context,
small marginal farmers would continue
to slip into poverty. Their way out of the
low land holding—low productivity—low
income cycle is if they grow and sell high-
value, labour-intensive crops such as off-
season fruits and vegetables and have
access to very cheap small-farm irrigation,
financing, good seeds and fertilizers and
markets where they sell their crops at a
profit. This requires a significant set of
macro and micro reforms which are de-
tailed in the next section.
6.6. Critical drivers to transform agri-marketing in India
6.6.1. Implementation of the amended model APMC Act
The Ministry of Agriculture, Government of
India (GoI) formulated a model APMC Act
in 2003, and advised states to implement the
Act. The amended Act aims at a complete
transformation of agricultural market-
ing in India to make it more market and
growth oriented. It permits farmers, local
authorities and others to establish new
markets, set up purchase centre, farmer/
consumer markets for direct sale in any
area and promote PPP in management
and development of agricultural mar-
kets as well as contract farming. The pro-
posed Act encourages:
1. development of competitive agricul-
ture marketing,
2. deregulation of the marketing system
and
3. promotion of private investment in
management and development of agri-
cultural markets in India.

Agriculture Marketing 93
Under the new Act:
l Private players will be allowed to open and operate agriculture markets, where farmers can sell their produce. It will end state monopolies and result in competitive pricing for the farmers.
l There is no compulsion on farmers to bring their produce to the mandi. They can directly sell the produce to private parties, food chains and retailers.
l Contract farming has been allowed so that the food processing and retail industry can get desired quantity and quality of the produce, without any need to route it through the notified markets.
Provision has also been made in the Act for constitution of State Agricultural Produce Marketing Standards Bureau for promotion of Grading, Standardization and Quality Certification of agricultural produce. This would facilitate pledge finan-cing, direct purchasing, forward/futures trading and exports.
Despite the radical changes that the model APMC Act can usher in, so far only a few states have adopted it and that too partially (Table 6.2). The resistance to the adoption of the model Act is from the state governments, traders and commission agents. The states fear loss of market fee
if alternative markets are established. The traders and commission agents fear losing business and income.
The implementation of the model APMC Act will boost farm incomes considerably over a period, as:
l There exists a huge gap in the consumer prices and farmer realizations, primar-ily due to presence of intermediaries. Reduction of intermediation costs will reduce consumer prices and improve the realization for the farmers.
l Contract farming results in companies providing farmers with assured prices, technical inputs and credit. This has the potential to improve yields and the qual-ity of farm produce.
l A modest 10 per cent cumulative in-crease in production and realizations could enhance farm incomes by more than ` 500 billion, thus boosting the rural economy and demand potential, substantially.
6.6.2. Encourage private sector investment for market infrastructure
The private sector participation in devel-oping marketing infrastructure for agri-culture is limited to warehousing, cold storage and pack-houses. In the absence
Table 6.2: Status of implementation of APMC Act in India
S. No. Stage of reforms States/Union Territories (UTs)
1. States/UTs where APMC Acts have been suitably amended
Madhya Pradesh, Himachal Pradesh, Punjab, Sikkim, Nagaland, Andhra Pradesh, Chhattisgarh, Rajasthan, Orissa, Arunachal Pradesh, Maharashtra and Chandigarh
2. States/UTs where reforms to APMC Acts have been partially modified:
a) by amending APMC Act/Resolutionb) by Executive Order
Haryana, Karnataka, Gujarat and National Capital Territory of Delhi
Uttar Pradesh3. States/UTs where there is no APMC Act in
operationBihar, Kerala, Manipur, Andaman and Nicobar Islands,
Dadra and Nagar Haveli, Daman and Diu and Lakhshadweep
4. States/UTs where APMC Act already provides for the reform
Tamil Nadu
5. States/UTs where administrative action has been initiated for introducing the reforms
Assam, Mizoram, Tripura, Meghalaya, Jammu and Kashmir, Uttarakhand, Goa, West Bengal, Pondicherry and Jharkhand
Source: Ministry of Agriculture, GoI, available at http://agricoop.nic.in/Annual Report06-07/AGRICULTURAL %20MARKETING.pdf.

94 Reshma anand
l provisions to allow private entrepre-neurs to cover price and yield risks for farmers.
6.6.3. Address risk mitigation in agricultural marketing
Farmers are most vulnerable to market-related risks, such as fluctuation in com-modity prices due to their poor holding capacity and cash requirement for the next crop. Crop insurance is complicated and does not cover all crops. It has a complex sys- tem of loss assessment. It would be necessary to revise current insurance schemes to cover all crops, input costs and cash requirements following a year of loss. Actuarial premiums should be charged with subsidies only for small and marginal farmers within the scheme.
The government has been trying to implement various market mechanisms to cover farmers’ market-related risks. These include future and spot trade of agricultural commodities through electronic exchanges and implementation of warehousing receipt system. The real benefits of these instru-ments need to reach the target beneficiaries. An integrated approach, in which efficient systems of e-spot trading, grading and qual- ity certification, scientific warehousing and collateral management, crop/weather insur- ance and futures benchmarked over the counter offered forward contracting, could exploit complementarities between agri-cultural marketing and financing, and will help address the current problems in these functions. The ultimate objective should be to develop marketing and financing systems wherein price discovery takes place in an
of adequate government support in terms of a conducive policy regime, minimum guarantee of returns (as is the case with other infrastructure such as power and road), fair competition (monopoly of APMC markets), the private sector is cautious about its role in the area of agricultural marketing and infrastructure development. Yet, its share of investments is higher vis-à-vis government spending (Table 6.3).
There is a need to ensure that policies attract serious and committed private sec-tor participants to the value chain. The key players include providers of agricultural inputs, micro-irrigation, financing and risk management services, fresh produce aggregators and marketers, food pos- sessors, poultry or dairy producers and processors and those that can help build extension services capabilities.
To encourage the private sector to make investments in marketing infrastructure on the required scale, a favourable regulatory environment needs to be created to attract large entities. This would include:
l liberalized credit norms to entrepreneurs for agricultural marketing activities;
l changes in the market regulatory frame-work to allow private entrepreneurs estab- lish market yards and other regulatory facilities;
l changes in the cooperative laws to allow farmers' cooperatives to work along cor-porate lines and compete with private trade;
l review of existing legal instruments to facilitate the entry of entrepreneurs in marketing activities and
Table 6.3: Public and private investment in agriculture and allied sector at 2004–05 prices
Year
Investment in agriculture and allied sectors (` crore)
Share in total investment (per cent)
Total Public Private Public Private
2004–05 78,848 16,183 62,665 20.5 79.52005–06 93,121 19,909 73,211 21.4 78.62006–07 94,400 22,978 71,422 24.3 75.72007–08 110,006 23,039 86,967 20.9 79.12008–09 138,597 24,452 114,145 17.6 82.4
Source: Department of Agriculture and Cooperation (2010); http://www.indianbusiness.nic.in/economy/ agriculture.htm.
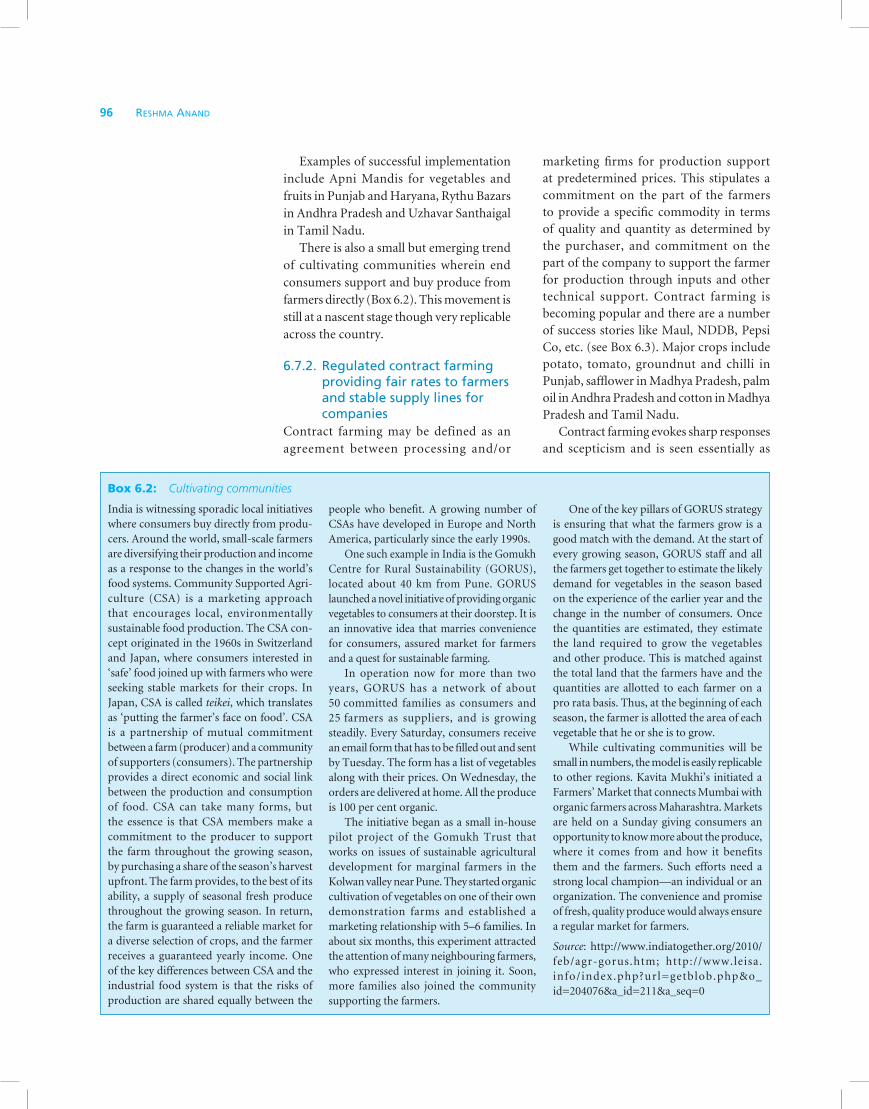
Agriculture Marketing 95
efficient manner, cost of marketing reduces, quality of produce improves, farmers are able to get their payment in time, farmers get both production and marketing credit in time, transaction costs are reduced and risks are minimized.
6.6.4. Revamp cooperative institution network
At present, there are over 60,000 primary cooperative marketing societies of which 3,500 are special commodity marketing societies. At the district level, there are 160 Central Marketing Societies. At the state level, there are 29 general purpose State Level Cooperative Marketing Feder-ation. In additions, there are eight State Level Trade Cooperative Development Corporations/Federations.
Punjab, Maharashtra, Uttar Pradesh and Gujarat accounted for 75 per cent of the total value of the agricultural produce marketed by cooperatives. The three major commodities that accounted for about 75 per cent of the total sales are food grains, sugarcane and cotton.
Efforts are being made by the govern-ment to recapitalize and revive the Indian Cooperative Sector. Professionalization of cooperatives along with modernization of their operational procedures would facilitate their development as self-reliant and economically viable rural financial or-ganizations, after ensuring better manage-rial skills with efficient risk management, safeguarding against market imperfections, transparency, accountability, quality ser-vices and achieving higher recovery ratio with minimal or no subsidy support from the Government.
While increasing the capital base of the cooperatives, there is also recognition of the need for appropriate credit planning and appropriate loan appraisal system for ensuring viability and feasibility in dis-bursing loans to the borrowing members. To increase the outreach of cooperative credit to millions of its poor members, steps are being taken to ensure that the cooperative
credit institutions are member driven, based on self-help and democratic principles. The members should have ample flexibility to devise their recovery procedures so as to reduce their overdue and to make their in-stitution economically viable.
Credit from cooperatives is generally used for producing low valued products. This demands diversification of loans in order to enable a large number of farmers and weaker sections of people to take loans for area-specific viable activities like dairying, poultry farming, aquaculture, pisciculture, goat and sheep rearing, seri-culture, etc. Further, the cooperatives have a high potential to diversify in different export promotion activities like processing of agricultural commodities like tea, cashew nuts, spices, jute, coir, sugar and its by-products. This calls for a better linkage between the cooperative credit institutions and cooperative marketing agencies to make the cooperatives as a banking institution competitive in this globalized era.
6.7. Emerging developments and impact of reforms in agri-marketing
With the right set of reforms in agri-marketing, the impact will be seen in the following areas:
6.7.1. Increase in direct marketing initiatives resulting in better rates for farmers and lower prices for consumers
Direct marketing enables farmers to dir-ectly sell their produce to the agri-processor, marketer (organized retail) and consumers. It also involves farmers cultivating speci-fic produce to meet demands of buyers. This increases price realization for farm-ers due to significantly lower marketing and intermediation cost. In South Korea, this marketing model has ensured 20–30 per cent lower end consumer prices, despite 10–20 per cent increase in farmers’ realizations.

96 Reshma anand
Examples of successful implementation include Apni Mandis for vegetables and fruits in Punjab and Haryana, Rythu Bazars in Andhra Pradesh and Uzhavar Santhaigal in Tamil Nadu.
There is also a small but emerging trend of cultivating communities wherein end consumers support and buy produce from farmers directly (Box 6.2). This movement is still at a nascent stage though very replicable across the country.
6.7.2. Regulated contract farming providing fair rates to farmers and stable supply lines for companies
Contract farming may be defined as an agreement between processing and/or
marketing firms for production support at predetermined prices. This stipulates a commitment on the part of the farmers to provide a specific commodity in terms of quality and quantity as determined by the purchaser, and commitment on the part of the company to support the farmer for production through inputs and other technical support. Contract farming is becoming popular and there are a number of success stories like Maul, NDDB, Pepsi Co, etc. (see Box 6.3). Major crops include potato, tomato, groundnut and chilli in Punjab, safflower in Madhya Pradesh, palm oil in Andhra Pradesh and cotton in Madhya Pradesh and Tamil Nadu.
Contract farming evokes sharp responses and scepticism and is seen essentially as
Box 6.2: Cultivating communities
India is witnessing sporadic local initiatives where consumers buy directly from produ-cers. Around the world, small-scale farmers are diversifying their production and income as a response to the changes in the world’s food systems. Community Supported Agri-culture (CSA) is a marketing approach that encourages local, environmentally sustainable food production. The CSA con-cept originated in the 1960s in Switzerland and Japan, where consumers interested in ‘safe’ food joined up with farmers who were seeking stable markets for their crops. In Japan, CSA is called teikei, which translates as ‘putting the farmer’s face on food’. CSA is a partnership of mutual commitment between a farm (producer) and a community of supporters (consumers). The partnership provides a direct economic and social link between the production and consumption of food. CSA can take many forms, but the essence is that CSA members make a commitment to the producer to support the farm throughout the growing season, by purchasing a share of the season’s harvest upfront. The farm provides, to the best of its ability, a supply of seasonal fresh produce throughout the growing season. In return, the farm is guaranteed a reliable market for a diverse selection of crops, and the farmer receives a guaranteed yearly income. One of the key differences between CSA and the industrial food system is that the risks of production are shared equally between the
people who benefit. A growing number of CSAs have developed in Europe and North America, particularly since the early 1990s.
One such example in India is the Gomukh Centre for Rural Sustainability (GORUS), located about 40 km from Pune. GORUS launched a novel initiative of providing organic vegetables to consumers at their doorstep. It is an innovative idea that marries convenience for consumers, assured market for farmers and a quest for sustainable farming.
In operation now for more than two years, GORUS has a network of about 50 committed families as consumers and 25 farmers as suppliers, and is growing steadily. Every Saturday, consumers receive an email form that has to be filled out and sent by Tuesday. The form has a list of vegetables along with their prices. On Wednesday, the orders are delivered at home. All the produce is 100 per cent organic.
The initiative began as a small in-house pilot project of the Gomukh Trust that works on issues of sustainable agricultural development for marginal farmers in the Kolwan valley near Pune. They started organic cultivation of vegetables on one of their own demonstration farms and established a marketing relationship with 5–6 families. In about six months, this experiment attracted the attention of many neighbouring farmers, who expressed interest in joining it. Soon, more families also joined the community supporting the farmers.
One of the key pillars of GORUS strategy is ensuring that what the farmers grow is a good match with the demand. At the start of every growing season, GORUS staff and all the farmers get together to estimate the likely demand for vegetables in the season based on the experience of the earlier year and the change in the number of consumers. Once the quantities are estimated, they estimate the land required to grow the vegetables and other produce. This is matched against the total land that the farmers have and the quantities are allotted to each farmer on a pro rata basis. Thus, at the beginning of each season, the farmer is allotted the area of each vegetable that he or she is to grow.
While cultivating communities will be small in numbers, the model is easily replicable to other regions. Kavita Mukhi’s initiated a Farmers’ Market that connects Mumbai with organic farmers across Maharashtra. Markets are held on a Sunday giving consumers an opportunity to know more about the produce, where it comes from and how it benefits them and the farmers. Such efforts need a strong local champion—an individual or an organization. The convenience and promise of fresh, quality produce would always ensure a regular market for farmers.
Source: http://www.indiatogether.org/2010/feb/agr-gorus.htm; http://www.leisa.info/index.php?url=getblob.php&o_id=204076&a_id=211&a_seq=0

Agriculture Marketing 97
an agreement between unequal parties, namely:
l Unorganized small-scale farmers, with little bargaining power and limited resources to raise productivity and com-pete commercially.
l Powerful agribusiness, offering pro-duction and supply contracts which—in exchange for inputs and technical advice—allows them to exploit cheap labour and transfer most risks to producers.
A Food and Agriculture Organization (FAO) guide released by the Agriculture and Consumer Protection Department, 2001, argues that well-managed contract farming has proven effective in linking the small farm sector to sources of extension advice, mechanization, seeds, fertilizer and credit, and to guaranteed and profitable markets for produce. ‘It is an approach that
can contribute to both increased income
for farmers and higher profitability for
sponsors and reduced risk and uncertainty
for both parties when efficiently organized
and managed.’
‘The advantages and disadvantages of
contract farming vary according to the
physical, social and market environments in
which sponsors and growers operate.’ The
FAO guide says:
The prime advantage for farmers is that the sponsor will normally undertake to purchase all produce grown, within specified quality and quantity parameters. Contracts can provide farmers with access to a wide range of managerial, technical and extension services that otherwise may be unobtainable. Farmers can also use the contract agreement as col-lateral to arrange credit with a commercial bank in order to fund inputs.
Small-scale farmers are frequently reluc-
tant to adopt new technologies because of
Suminter Organics adopted an integrated approach to procuring, monitoring and selling organic produce. The business model is built on the premise that by offering organic certifica-tion and training to Indian farmers, the sponsor can ensure a supply chain of quality organic goods, pay the farmers a premium over market prices, and thereby make agriculture a viable option for these farmers.
To make the process of procuring and marketing as efficient, transparent and fair as possible, each step has been integrated into their business model.
Suminter contracts with over 1,000 farmers, buying back all of their products and provid-ing the necessary farming inputs for organic cultivation. Suminter then provides the for- ward linkages that farmers require to bring their products to market. Through this process, farmers incur substantially lower costs and also receive a 10 per cent premium over market prices. In this way, Suminter India Organics bridges the gap between the company’s suppliers and the global market,
commercializing their products through a fair and transparent process. Suminter India Organics has built lasting relationships with its current customer base in the Netherlands and the United States.
To support their activities abroad, the company created a division in the Netherlands that meets the growing demand through the distribution of their produce. Through this branch, Suminter has captured the entire value chain, from the farm to the market. Their Netherlands division handles warehousing and marketing, which eliminates third-party exporters and traders. It is this type of integrated supply chain that differentiates Suminter from its competitors. They have even come up with an internal solution to the biggest problem facing organic farmers—the prevention of pest and bacteria attacks. Suminter has an exclusive joint venture with the Dutch company Eco2 BV, which has a well-respected technology for chemical-free fumigation.
Source: Consolidated from World Resources Institute Archives (2007), NextBillion.net (2007) and www.suminterindiaorganics.com.
Box 6.3: Suminter Organics: A case study of contract farming

98 Reshma anand
the possible risks and costs involved. In
contract farming, private agribusiness will
usually offer technology more effectively
than government agricultural extension
services, because it has a direct economic
interest in improving farmers’ production.
Skills the farmer learns through contract
farming may include record keeping, the
efficient use of farm resources, improved
methods of applying chemicals and fertil-
izers and knowledge of the importance
of quality and of the demands of export
markets. Farmers also gain experience in
carrying out field activities according to a
strict timetable, and they often apply tech-
niques introduced by management to other
cash and subsistence crops.
Nevertheless, both parties in contract
farming must accept a degree of risk. For
farmers, there is the uncertainty involved
in growing new, unfamiliar crops and
producing for markets that might not always
live up to their expectations—or to their
sponsors’ forecasts. On the sponsor’s side,
risks can arise when dealing with farmers
who, in turn, may have negotiated use of
the land with traditional owners. Before
entering into contracts, the sponsor needs
to ensure that access to land is secured, at
least for the term of the agreement. ‘The
contract farming system should be seen
as a partnership between agribusiness and
farmers,’ the FAO guide concludes:
To be successful it requires a long-term com- mitment from both parties. Exploitative ar-rangements by managers are likely to have only a limited duration and can jeopardize agribusiness investments. Similarly, farmers need to consider that honouring contractual arrangements is likely to be to their long-term benefit.1
6.7.3. Increasing application of Information and Communication Technology (ICT) creating more transparent markets for farmers
Information technologies can revolution- ize the way farmers update themselves on information related to agri-inputs, credit, markets, weather, extension advisory and other e-governance services. E-choupal, Warana, Grameeen Sanchar Society (Grasso), Reuters Market Light, AGMARKNET and Lifelines are a few successful examples. The Department for agriculture has developed four portals and 40 web sites covering both Headquarters and its Field Offices/Directorates to make information and ser-vices accessible to the farming community. These portals are DACNET (http://dacnet.nic.in), AGMARKNET (http://agmarknet.nic.in), DAC (http://agricoop.nic.in) and INTRADAC (http://intradac.nic.in).
AGMARKNET Portal (http://agmarknet.nic.in) provides information on (a) prices and arrivals of agricultural commodities at various mandis in eight Indian languages; (b) trend analysis of prices and arrivals at market/district/state level and (c) grading, packaging, standards, sanitary requirements and marketing charges. Over 300 commod-ities and 2,000 varieties from 1,500 markets are being covered. In all, 3,700 markets are proposed to be covered during the Eleventh Plan. More commodities/varieties would be covered on a need basis. Information on prices and arrivals is updated on a daily basis. Conversion of this portal into other regional languages is in progress. A Geographical In- formation Systems (GIS) based National Agricultural Market Atlas for providing information on areas of production, move-ment, storage market/consumption centres is also under development.
Mobile companies are also targeting rural areas with specific products and services. The Nokia Life Tools project is one such example along with the Airtel and Reuters Market Light project, both of which are
1 A Food and Agriculture Organization (FAO) guide released by the Agriculture and Consumer Protection Department, 2001. Available at http://www.fao.org/ag/magazine/0107sp.htm

Agriculture Marketing 99
marketing commodity-specific informa-tion packages to farmers.
Amongst the promoters of ICT initi-atives in agri-marketing are public sec- tor, not-for-profit sector and private sector companies who are targeting the major stakeholder, that is, the farmer, with their unique information delivery systems. However, the success of these models de-pends on how effectively and efficiently farmers are able to make use of these technologies.
6.7.4. Growing number of Public Private Partnerships (PPPs)
There are many examples of success- ful PPPs. It is a widely held belief now that with increasing policy changes aimed at private sector participation in agri-marketing, PPPs will be a dominant model in the coming years. Major PPP
models include joint ventures, build-operate-transfer (BOT) and build-own-operate-transfer (BOOT).
Key successful PPPs include Safal market in Karnataka for modernization of wholesale markets. ITC’s e-Chaupal, Haryali Kisan Bazaar, Mahindra Subh Labh, Cargil Farmgate Business and Tata Kisan Sansar are all initiatives of market-ing distribution in the PPP format. Besides, commodity exchanges and futures mar-kets have come up in the form of National Commodity and Derivative Exchange Ltd (NCDEX) and Multi-Commodity Exchange Limited (MCX). Table 6.4 shown the sourc-ing operations of some key companies.
6.7.5. Increasing private equity interest in agribusinesses
Indian agro-based companies are now attracting a host of private equity players,
Table 6.4: Agri-produce sourcing operations of key companies (contract farming, direct purchase and PPP models)
Company States Products
ITC Ltd Uttar Pradesh Wheat, cornMadhya Pradesh SoyaKarnataka CoffeeAndhra Pradesh Aqua-products
Mahindra Shubh Labh Tamil Nadu, Andhra Pradesh, Karnataka, Rajasthan
Paddy
Tata Kisan Sansar Madhya Pradesh WheatHaryana Basmati riceKarnataka Fruits (pomegranate, papaya, sapota and
guava)Maharashtra Fresh vegetablesUttar Pradesh, Punjab Paddy and vegetable seeds
EID Parry Tamil Nadu Sugar, banana, cashew, tapioca and groundnut
Pepsi Foods Punjab Potato, tomato, groundnut, chilli and paddyHindustan Lever Limited Madhya Pradesh Wheat, spices
Punjab, Haryana TomatoPunjab Basmati
Field Fresh Foods Punjab, Jammu and Kashmir, Himachal Pradesh, Haryana, Western Uttar Pradesh, Uttarakhand
Fresh fruits and vegetables
Nijjer Agro Foods Ltd Punjab Fruits and vegetablesMaxworth Fruits Andhra Pradesh, Karnataka and Tamil Nadu FruitsSatluj Agricultural Pvt Ltd Punjab Field fresh vegetablesReliance (Anil Ambani Group) Punjab Fruits and vegetablesJamnagar Farms Pvt Ltd
(Mukesh Ambani Group)Punjab and Gujarat Horticultural crops
Reitzel India Pvt Ltd Karnataka GherkinsAppachi Cotton Company Tamil Nadu CottonUgar Sugar Works Ltd Karnataka Barley
Source: Chakraborty (2009).

100 Reshma anand
who sense potential on account of strong demand and the sector’s insulation from the credit-induced economic crisis in the West. Within the agribusiness, private equity firms are exploring various areas including agri-biotech and seeds, food processing, organic farming, crop protection, integrated cold chain management, and logistics and distribution (see Box 6.4).
6.7.6. Organized retail and food processing industry creating demand for agri-produce
Agri-marketing reforms, when imple-mented, could have significant implica- tions on food processors and retailers. Organized food processing is under 10 per cent in India and organized retail penetration in Food and Grocery is a meagre <1 per cent (Table 6.5). These are opportunities that could emerge significantly over the next 10 years.
l Organized Retail: Organized retail could reduce the end-price for consumers (and increase its value add) by establishing the farm to fork supply chain. Currently, most retailers procure agri-produce (especially perishable produce) from
mandis. However, direct sourcing from
the farm-gate ensures minimal wast-
age and lower cost. This would enable
retailers to have uniform quality of
produce of desired variety.
While organized retail (especially
food retailing) in India is still in an
evolutionary phase, there is immense
room for improving productivity
(and reducing cost) by reducing the
intermediaries between the farm and the
fork. It was aptly noted that very little has
been done in India to establish a direct
procurement mechanism by leading
retailers. Even today, major retailers
continue to procure from mandis rather
than setting up their own supply chains
to procure directly from farmers, which
could help improve productivity through
better cold storage, warehousing, etc.
Lack of policy stability with regard to
Foreign Direct Investment (FDI) in
retailing has inhibited entry of foreign
retailers and their best practices. With
the government indicating a change
on the FDI policy in retail, there would
be significant ramifications on the
rationalization of food supply chain.
Box 6.4: Prominent private equity in agribusinesses
Some prominent recent investments include:
l 2008: $50 million investment by Blackstone in Hyderabad-based Nuziveedu seeds, which is one of the largest hybrid seeds companies in India.
l Morgan Stanley’s investment in castor oil maker Biotor Industries, through its Asia fund.
l $5 million was invested by ePlanet Ventures in Chennai-based Sree Ramcides, a 36-year-old family-run agro-solutions company.
l Nexus India (a subsidiary of Nexus Ven-ture Partners) invested ` 1 billion in Sohan Lal Commodity Management, an agri-commodity logistics and procurement com-pany based in Delhi.
l In 2008, Nexus India had invested between ` 1 and 2 billion in Suminter India Organics, an organic farming firm.
l More recently, the Carlyle Group a global private equity investment firm, based in Washington, will be investing ` 11 billion in Tirumala Milk Products headquar- tered in Guntur district of Andhra Pradesh through the Carlyle Asia Growth Partners IV (CAGP IV). The ` 60 billion company was started by four rural entrepreneurs nearly 10 years ago.
Source : http://indiamicrofinance.com/indian-agriculture-offers-spring-of-hope-for-private-equity-firms.html; http://indiamicrofinance.com/agricultural-commodity-logistics-firm-inr-10-crore-investment-nexus-india.html; http://india microfinance.com/carlyle-group-invest-rs-110-crore-tirumala-milk-products.html

Agriculture Marketing 101
l Food Processors: The level of food processing in India is lower than most developed and developing countries. The segment is highly fragmented and dominated by the unorganized sector. Improvement in agri-marketing infrastructure would benefit food processors through better pricing, stable supply of raw materials and customized produce. The key sectors that show promising growth prospects include Fruits and Vegetables, Meat and Poultry, Dairy and Packaged Foods. Key players include Nestlé (milk procurement), Marico (safflower and copra procurement) and ITC (input material procurement through Choupal Sagar).
6.7.7. Renewal of local enterprise through cooperatives and organizations of farmers
Cooperatives have had success in fields like dairy, agricultural credit, sale of fertilizer,
sugar production and handloom. But in the core farming activities, there has been no suc- cessful cooperative movement in the coun- try. This is despite sound business reasons existing for joint or cooperative farming. Small holdings necessarily mean low pro-duction and low economies of scale, unless there is heavy investment in technology. This problem can be offset when small landowners join plots and work together. Further, joint management of large plots means distribution of risk—a crucial factor in a business heavily dependent on uncertain monsoon (see Boxes 6.5 and 6.6). Cooperative farming has worked extremely well in highly developed market economies. Between 60 and 75 per cent of the market share in grain trade is held by agricultural cooper-atives in Denmark, France, Ireland, Austria and Sweden. Even in the United States, agricultural cooperatives enjoy a 38 per cent share of the market in trading grain alone.
Cooperative farming is conceived and promoted as a farmer controlled setup,
Table 6.5: Indian food industry: key statistics
Particulars 2002–03 2006–07 2010–11* 2014–15*
Food industry size (US$ billion) 175 200 250 300Food processing industry size (US$ billion) 70 85 110 150Share of food processing in total food industry (%) 40 43 44 50Size of organized food processing sector (US$ billion) 13 23 37 60Organized sector in food processing industry (%) 19 27 36 40Organized food processing in food industry 7.6 11.6 15.8 20
Source: KSA Technopak, Report for Global Food Marketplace 2008 in partnership with Ministry of Food Processing Industries and FICCI.Note: *Projected.
One of India’s success stories is a cooperative of 2,400 small farmers in Thrissur, Kerala, who are carrying out organic paddy cultivation with support from the Adat Farmers Cooperative Bank (AFCB). Members pool in their hold-ings, jointly cultivate the land using improved practices, and receive wages for their daily labour. When the produce is sold, at the end of the season, they receive a dividend in propor- tion to the area of land contributed by them, and a share of income from the produce propor-tionate to the labour they have contributed.
The bank set up nine farmers’ committees to undertake responsibility for various aspects
of the work, from cultivation, to pumping out water from the paddy fields and harvesting the crop. AFCB distributed ` 15 million to the farmers as interest-free loans of ` 6,000 each. While total cost of cultivation in 2006 was ` 21 million, expected gross returns were ` 51 million. The remaining ` 30 million was to be distributed among the farmers, proportionate to their landholdings.
Source: Consolidated from published reports in India Microfinance Business News 2009–10; and http://www.thehindubusinessline.com/2006/05/08/stories/2006050801830300.htm
Box 6.5: Cooperative paddy cultivation in Thrissur, Kerala

102 Reshma anand
Box: 6.6: Dharmapuri Precision Farmers Agro Services: A local farmer enterprise model
Enterprise models that deliver a ‘package’ of solutions for the farmer including inputs, water and market linkages will see quick and replicable adoption. Case in point: Dharmapuri Precision Farmers Agro Services.
Dharmapuri, about 120 km south of Bangalore, is a water-deficient district. It averages an annual rainfall of 90 cm—about 25 per cent below the national average. Hence, farmers here used to sow only one crop a year, often keeping vast tracts of their land barren.
This drew a team of three professors from Tamil Nadu Agricultural University (TNAU), led by Professor E. Vadivel, to the district in 2006. They spent two years with the farmers, and introduced them to precision farming—a more healthy and efficient way of cultivation. At the heart of precision farming is drip irrigation where, instead of flooding the field over-ground, a mixture of water and soluble bio-fertilizers is fed through a network of pipes below the ground. Three hundred farmers were identified for a pilot project in precision farming, over a period of three years. The state gave them a cash subsidy of 80–100 per cent to buy drip-irrigation kits for 1 hectare of their land holding. A majority of them saw their yields rise 50–200 per cent in the first year itself. But one issue troubled the farmers. The fertilizers and pesticides they sourced from local dealers were often spurious and inferior. Vadivel and team examined the inputs, and agreed with the reading of the farmers. Their solution: stop buying from them.
Vadivel advised the farmers to come together to float a company that would
sell these key inputs. Of the 300 farmers who were part of the pilot project, 166 bought the idea. They formed a public limited company, Dharmapuri Precision Farmers Agro Services (DPFAS). Each farmer subscribed ̀ 10,000 to the company’s equity, and became a shareholder. The company collected ` 1.66 million as equity capital. From that sum, DPFAS set up a retail outlet in Dharmapuri. The 400 sq. ft outlet procures agricultural goods and inputs—fertilizers, pesticides, seeds, equipment—directly from companies. This ensures quality. Farmers also got better prices. Unlike local dealers, who charged maximum retail price (MRP), the retail outlet sold goods at a nominal mark-up to cost price. Farmers buy goods at 3–25 per cent below MRP, improving their margins further.
These 166 farmers of Dharmapuri district are reaping it rich for two reasons. One, they embraced advanced farming practices. Two, in a move whose impact is still playing out, they came together to form a company. So, they embraced business structures and business practices typical of a registered company—equity capital, shareholders, management, board of directors, financial reporting and audit of accounts, among other things.
The arrangement is functioning well. They have eliminated middlemen in the input side and are working on doing the same on the output side. Crop yields have risen 50–200 per cent. Several farmers who were mired in debt have since become debt free. And for each of the last two years, they have earned a super normal 40 per cent return on their investment in the company. Dharmapuri is a revelatory tale of why, and
how, farmers should band into a company.In 2007–08, its first full year, DPFAS
recorded sales of ` 15 million—on capital employed of ̀ 1.6 million. Such an operation does not need much working capital, as farmers tend to pay in cash, while companies give goods on credit. Turnover of DPFAS rose to ` 35 million in 2008–09, of which, ` 15 million came from the sale and instal-lation of drip-irrigation kits (zero in the first year).
In each of those two years, the company declared a dividend of 40 per cent. So, each shareholder got ` 4,000 each year on an investment of ̀ 10,000. Yet, even after a high payout, DPFAS has cash to spare. It is putting this cash to good use to invest in similar companies promoted by farmers in other districts. DPFAS wants to buy 20 per cent of the equity of these companies. In Erode, it will invest ` 0.1 million in a company planned by 40 farmers, with an initial contribution of ` 10,000 each. Other districts in the pipe-line include Madurai, Trichy, Salem and Ramanathapuram.
Overall, DPFAS farmers have become brand ambassadors of precision farming and business structures in Tamil Nadu. The State Government has extended the precision farming project to all districts, with a 50 per cent subsidy on drip-irrigation kits. About 12,000 farmers have received training and implemented precision farming techniques so far.
Source: India Microfinance Business News 2009–10, available at http://indiamicrofinance.com/the-company-of-farmers-should-farmers-corporatize.html; http://business.outlookindia.com/article/aspx?261658
capable of providing key inputs and ser-
vices for the production and marketing
of the products at harvest time on behalf of
the poor and powerless farmers. Indirect
contracting through farmer cooperatives
may be an effective mechanism to counter
any potential exploitation that a contract
farming agreement may have.
6.8. ConclusionIn conclusion, agricultural marketing in India can change its record with the right mix of intelligent regulation, investment in infrastructure, streamlining of credit and credit institutions, encouragement of private sector involvement with adequate checks and balances and encouragement

Agriculture Marketing 103
of local enterprise. This moderate and
deliberate approach would address both
supply side and demand side actors and will
deliver results and value the farmer and the
consumer alike.
ReferencesChakraborty, Debashis. (2009). ‘Contract Farming in
India: Unique Solution to Multilayer Agricultural
Problems?’ Review of Market Integration, 1(1):
83–102.
Confederation of Indian Industries (CII). (2009). Background Paper, Agriculture Marketing Summit December 2009, New Delhi, CII.
Department of Agriculture and Cooperation. (2010). Annual Report 2009–2010. Ministry of Agriculture, GoI. Available at http://agricoop.nic.in/AnnualRepor2009–10/AR.pdf
NextBillion.net. (2007). ‘Rising Ventures: Suminter Makes “Satva” a Sustainable Business Pro-position’. Available at www.nextbillion.net/blog/2007/06/03rising-ventures-suminter-makes-satva-a-sustainable-business-prop
World Resources Institute Archives. (2007). ‘The WRI Weekly Roundup’, 5 June 2007. Available at http://archive.wri.org/page.cfm?id=4455&z=?

104 Reshma anand

7.1. Introduction
This chapter reviews available literature on potential effects of climate change on agriculture in India and discusses vulnerability of agriculture, especially dry-land agriculture to climate induced changes. The chapter then discusses the challenges and opportunities for adaptation in the agriculture sector due to climate change. A programmatic intervention has been used as an example to detail the opportunities available.
Agriculture contributes around 20 per cent to the Gross Domestic Product (GDP) in India. Even though the share of agriculture in the GDP has been declining over the last 50 years, the agriculture sector in India is still crucial for rural livelihoods as it not only helps feed the growing population of the country but also employs a large labour force. Agriculture sector employs an estimated 56.4 per cent of the total workforce and supports 600 million people directly or indirectly (GoI, 2007a). The contribution of agriculture to the livelihoods of a vast majority in India cannot be overstated. It is expected that the agriculture sector
would continue to be important in India’s economy in the years to come.
After independence, Indian agriculture adopted modern methods and area under irrigation increased at a fast pace. But, a significant proportion of agriculture land is still dependent on rainfall, and food production is considerably dependent on dryland agriculture. Although food grain production in India has increased from 50 million tons in 1951 to 212 million tons in 2002 with the mean cereal productiv-ity increasing from 500 kg/ha to almost 1,800 kg/ha, lack of alternative liveli-hoods and widespread poverty continue to threaten livelihood security of small and marginal farmers in the dryland agricul-ture region (MoEF, 2004). Rainfall quantity and its distribution vary considerably both temporally and spatially across the country. Extreme climatic events like droughts and floods also affect agriculture production frequently in India.
7.2. Dryland areas in India
Drylands constitute regions where agriculture is predominantly dependent on rainfall. It consists of areas with rainfall below critical minimum level. According to this definition, it is estimated that 177 districts constituting 42 per cent of districts in India covering
Climate Change and Agriculture—Challenges
and Opportunities in India
ShaileSh Nagar* aNd JayeSh Bhatia**
Chapter 7
*Consultant, NR Management Consultants India Pvt. Ltd.
**Director, NR Management Consultants India Pvt. Ltd.

106 ShaileSh Nagar aNd JayeSh Bhatia
56 per cent of the total geographical area fall in the category of drylands (Shah et al., 1998). Madhya Pradesh, Rajasthan and Maharashtra together account for nearly 50 per cent of the dry districts and 52 per cent of dry areas in India.
Dryland areas are significant in terms of agriculture as 53 per cent of India’s gross sown area is in dryland condition, the dryland crops account for 48 per cent of the area under food crops and 68 per cent of the area under non-food crops. An estimation of the area covered under different crops in drylands in India is given in the Table 7.1.
Table 7.1 illustrates the importance of dryland areas in the country’s food security. Dryland districts account for almost 80 per cent of the output of coarse cereals, nearly 50 per cent of maize, 65 per cent of gram and tur, 81 per cent of groundnut and 88 per cent of soyabean (ibid.).
Dryland areas are important vis-à-vis rural livelihoods in India. Around 50 per cent of the total rural workforce in India is located in the dry districts and about half of the rural main workers engaged in
agriculture are also from the dry districts. This has been shown in Table 7.2.
7.3. Dimensions of climate change in India
Rainfall and temperature are two key cli-matic factors that are predicted to be affected due to rise of Green House Gases (GHGs) in atmosphere. Consequent to that are the changes in availability of and access to water. This section, in brief, discusses the expected change vis-à-vis these two factors and the consequences of these changes on water availability.
7.3.1. TemperatureOne of the main impacts of climate change is expected to be on temperature. Climate studies project that in the scenario of doubling of carbon dioxide concentra-tion, India’s climate could become warmer by 2.33°C to 4.78°C (Longern, 1998 cited in Gupta, 2005). Studies suggest that with respect to 1980, there may be an increase in annual temperatures of 0.7°C to 1.0°C by 2040 (Lal et al., 1995 cited in Gupta, 2005). A detailed assessment by these studies suggests that maximum temperature will increase by 2°C to 4°C during the 2050s in the region south of 25°N (south of cities such as Udaipur, Khajuraho and Varanasi). In the northern region, temperature increase may exceed 4°C. Rise in temperature not only directly affects life, but is also one of the causal factors for extreme events which impact lives and livelihoods at a large scale. For example, in 1998, around 3,000 people died in India due to heat which was worst in 50 years and in the next year, a tropical
Table 7.1: Share of drylands in All-India cropped area, 1989–90
Crop/Crop groupDryland area under
each crop (%)
Jowar 92Bajra 95Maize 57Ragi 69Barley 39
Total cereals 45Gram 76Tur 88
Total pulses 77Total food grains 51Total food crops 48
Groundnut 79Sesamum 79Rapeseed 31Linseed 80Soyabean 78
Total oilseeds 66Cotton 63Tobacco 50
Total non-food crops 68Total cropped area 53
Source: Shah et al. (1998).
Table 7.2: Share of dryland main workers in total workforce, All-India, 1991
Share of dryland main workers Share
In agricultural labour 48%In cultivation 49%In total agricultural sector 49%In total workforce 47%
Source: Shah et al. (1998).

Climate Change and Agriculture 107
cyclone in Orissa left 10,000 dead. The fre-quency of such extreme events is expected to increase with changes in temperature.
7.3.2. RainfallAnother important aspect of climate change in India is predicted to be on monsoons. Predictions are based on studies that model numerous variables to assess changes in monsoon pattern. Although these studies differ on the scale of variation, it is certain that the mean monsoon intensity and vari-ability is expected to increase (Ashrit et al., 2001; Chung et al., 2006; Kumar et al., 2006; and Kumar et al., 2003 cited in Panda, 2009). These studies project that major parts of the country would experience an overall decline in the number of rainy days. At a disaggregated level, it is predicted that western and central parts would experience decline in more than 15 rainy days, whereas near the foothills of Himalayas and in Northeast India, the number of rainy days may increase by 5 to 10 days. These studies also project a 20 per cent rise in all-India summer monsoon rainfall and further rise in total rainfall over all the states, except Punjab, Rajasthan and Tamil Nadu, which show a slight decrease.
7.3.3. WaterConsequent to the probable change in monsoon pattern, as a result of climate change, water availability and access will be impacted. Temporal and spatial avail- ability and access to water is already highly skewed in India. Economic progress, in-creased area under agriculture and increas-ing population, have led to exponential increase in the demand for water. According to the Ministry of Water Resources the amount of water available per person in India is decreasing steadily—from 3,450 cm in 1951 to 1,250 cm in 1999 and is expected to further decline to 760 cm per person in 2050 (Shiva, 2002). Western parts of Rajasthan and the Kutch region in Gujarat already experiences chronic drought situ-ation. Sabarmati and Luni basins in these
regions will experience drastically decreased precipitation, which will further deterior-ate drought conditions (Gosain and Rao, 2003 cited in Gupta, 2005). Lower rainfall and increased temperature causing more evaporation would further reduce the avail-ability of freshwater in the watersheds, soil moisture would decline and hydrological zones would become more arid.
River systems across the country will be affected by the climate change and chang-ing rainfall pattern. Studies conducted by The Energy Research Institute (TERI) on climate change effects in India suggest that by the year 2050, the average annual runoff in the river Brahmaputra will dec-line by 14 per cent and that Himalayan river systems draining into the Gangetic basin is gradually dying out (Tangri, 2003 cited in Gupta, 2005). On the other hand, intense flooding is projected in Mahanadi, Brahmani, Godavari and Cauvery basins due to increased precipitation (Gosain and Rao, 2003 cited in Gupta, 2005).
7.4. Impacts of climate change on agriculture
The previous sections have discussed the importance of dryland agriculture in food security and livelihoods of the rural people in India; and the phenomenon of climate change and its impact in India. This section would attempt at understanding the impact of climate change on agriculture in India. The information given in the section per-tains to impact on overall agriculture. Dry-land agriculture can be considered as more vulnerable due to its complete dependence on weather.
Climatic factors affecting agriculture in- clude temperature, rainfall, carbon dioxide concentration, changes in soil moisture, etc. Changes in these factors would have effect on agriculture. As stated earlier, a large area in India is under dryland con-ditions and agriculture in these regions is entirely dependent on climatic factors. Consequently, the effect of climate change

108 ShaileSh Nagar aNd JayeSh Bhatia
would have most direct and immediate impact on agriculture in such areas (World Bank, 2009).
At the global level, it is expected that cold temperate regions of the north may have some short-term gains from the ris- ing temperature due to low initial values of temperature. Whereas the south, where most of the natural resources dependent developing countries are located, would be negatively affected as the temperatures there are already reaching limits of crop tolerance.
It is not only overall temperature that will impact agriculture but seasonal variations in temperature may also be responsible for some indirect impact on agriculture pro-duction. The initial values of climatic factors are important for assessment of impact of future climate change events. Warmer spring and summer temperatures in India are expected to harm agriculture produc-tion in India as the temperatures are already quite high. A rise in winter temperature is expected to affect farm income as low winter temperatures help control pests.
Table 7.3 summarizes findings of vari-ous studies on climate change impact on agriculture in India.
The Inter-governmental Panel on Cli-mate Change (IPCC) reports project that the productivity of different crops will be affected and rice and wheat yield could de- cline considerably due to climatic changes (IPCC, 2001a; IPCC, 2007). The economic loss from such loss of productivity is esti-mated to range between 9 per cent and 25 per cent (net revenue at the farm level) for a temperature rise of 2°C to 3.5°C (Kumar and Parikh, 1998a).
A more micro assessment suggests that the coastal regions of Gujarat, Maharashtra and Karnataka would be most negatively affected in terms of agriculture, whereas small losses may also occur in Punjab, Haryana and western Uttar Pradesh (Sanghi et al., 1998). Various simulations using dynamic crop models indicate a decrease in yield of crops as temperature increases in different parts of India, while there may be a small increase in the irrigated rice yields.
However, wheat yields in central India are
Table 7.3: Climate change and agriculture in India: Findings from various studies
Author Findings
IPCC (2007) • Mean sea level rise of 0.18 m to 0.59 m by 2090 relative to the 1980–99 level• Increased flooding of low-lying areas and loss of crop yields from inundation and salinization of
fresh water sources• Increase in precipitation events
Gosain et al. (2006) • Water shortages throughout Kutch, Saurashtra, Mahi, Pennar, Sabarmati and TapiMoEF (2004) • Irrigated rice yields may have a small gain
• Wheat yields in central India are likely to suffer drop in crop yield up to 2% in pessimistic* scenario, but there is also a possibility that yields may increase by 6% if the global change is optimistic.
• Some decrease in Sorghum yield in western India only if temperature increase is beyond the projected scenarios
Kumar and Parikh (1998a and 1998b) • Rice yields will fall by 15–25% and wheat yields by 30–35%• 2°C warming would decrease net income by about 8%• 3.5°C rise would reduce income by 20–26%
Sanghi et al. (1998) • A 2°C warming would reduce average net income by only about 3–6%• A 3.5°C warming would reduce income by 3–8%
Garg and Hassan (2007) • Major river basins in the country will face a water deficit by 2050Rosenzweig and Parry (1994) • Grain yields would fall 25–40% if temperature rose by 4°CGuiteras (2007) • Projected climate change over the period 2010–39 reduces major crop yields by 4.5–9%.
• The long-run (2070–99) impact reduces yields by 25% or more in the absence of long-run adaptation
Source: Authors.
*‘Pessimistic’ scenario refers to high increase in temperature and low increase in CO2, while ‘optimistic’ scenario refers to large increase in CO2 and a low change in temperature.

Climate Change and Agriculture 109
likely to suffer reduction in crop yield up to
2 per cent (MoEF, 2004). Mendelsohn and
Dinar (1999) review various studies and sug-
gest that there will be regional variation in
the effect of climate change on agriculture
in India. Warming would affect the western
coastal districts most heavily, whereas dis-
tricts in several eastern states along the coast
are expected to benefit. The desert and marg-
inally dry areas would not be very sensitive
to warming as the productivity in these areas
is already so low that additional warming
will not harm further.
Agriculture will not only be affected
directly by the climatic factors mentioned
above but also from the indirect effects of
climate change in terms of increased fre-
quency of droughts, floods and cyclones.
Also, the inundation and salinization of
large amount of coastal land due to sea-
level rise is going to affect agriculture pro-
duction in India. Another indirect effect on
agriculture would be through changes in
irrigation needs due to variability in rainfall
and temperature (causing evaporation).
7.5. Adaptation to ameliorate climate change impact
It is to be noted that the afore-mentioned
studies do not factor adaptation by farm-ers
while calculating the net impact of climate
change on agriculture in India. Broadly,
adaptation is understood ‘as a stress response
in light of access to resources and the abilities
of people to cope’ (Downing, 1991; Adger
and Kelly, 1999; and Adger, 2000 cited in
Smit and Wandel, 2006, p. 284).
Although Kumar and Parikh (1998a)
suggest that even with adaptation of crop-
ping patterns and inputs by farmers in
response to climate change, losses would
remain significant, Mendelsohn and Dinar
(1999) estimated that the adaptation by
individual farmers may be responsible for
reducing potential climate change damages
in agriculture by between one-fourth and
one-half in future. This reduction does not
take into account change in technology
and it is estimated that further reduc-
tion according to the report may be pos-
sible because of improved technology in
terms of improved irrigation, better seed
varieties, etc.
All the studies quoted before indicated
that there would be a significant reduction
in agricultural yields in India because of
climate change effects. Areas with higher
poverty and high dependence on agricul-
ture are more vulnerable in comparison to
others. It is expected that the major impact
will be on the dryland crops (Gupta, 2005).
Damage to livelihoods would be severe
unless rapid and complete adaptation
measures are adopted.
7.6. Impacts of agriculture on climate change
It is not only climate change that affects
agriculture, but agriculture also contributes
towards climate change through produc-
tion of GHGs. In India, agriculture pro-
cesses contribute to about 17 per cent of
the GHG emissions. These are primarily
due to methane emission from enteric fer-
mentation in ruminant animals and paddy
cultivation, and nitrous oxides from appli-
cation of manures and fertilizers to the
soils (MoEF, 2010). According to Food and
Agriculture Organization (FAO) reports,
the emission from agriculture sector is
expected to rise across the world in the
future due to following factors:
l More land being brought under agri-
culture from land uses like forests
l Increased energy demand because of
higher use of irrigation and fertilizer
l Changes in the pattern of land use
induced by growing demand for meat
l Increased GHG emission from enteric
fermentation as well as from manure be-
cause of increased production of meat

110 ShaileSh Nagar aNd JayeSh Bhatia
7.7. Impact of livestock rearing on climate change
Livestock rearing is an integral part of agri-culture sector in India. This is much more in dryland areas where cattle rearing provides economic stability to farmers faced with uncertainties in farm production. Cattle and small ruminants are the major source of methane emissions in India (MoEF, 2004). In India, methane produced from livestock is highest amongst all agricultural sources. Decomposition of organic animal waste is another source of methane production, the amount of which depends on how waste is managed. In India, only 5–10 per cent of cattle and 10–20 per cent of buffaloes are of improved breed. The rest are low-producing, indigenous breeds.
While the GHG emissions are expected to increase in future, there are several possibilities through which emission from agriculture sector could be reduced. Overall, a reduction in the volume or intensity of agricultural activity or an improvement in the cropping practices and efficient use of inputs (assuming a stable level of output of agricultural product) reduces agriculture’s GHG emissions.
There is an increasing need to analyze agricultural practices in terms of their miti- gation potential and encourage agricul-tural practices that lower carbon emission.
In India, agriculture sector is the third
largest emitter of GHGs after Energy and
Industrial Processes sectors. Figure 7.1 pro-
vides an understanding of the share of dif-
ferent sectors in overall emission of GHGs
in India. Carbon dioxide (CO2) emissions
from agriculture are considered to be in-
significant due to utilization of CO2 in
photosynthesis process. However, methane
(CH4) emissions are high on the account of
large number of livestock in India.
In absolute terms, total national CH4
emission in the year 2007 was 20.56 mil-
lion tons of CO2 equivalent. Of this, the
share of agriculture sector was 67 per
cent. Emission due to enteric fermentation
(10.1 million tons of CO2 equivalent) and
paddy cultivation (3.33 million tons of
CO2 equivalent) were the highest sources of
CH4 emission in the agriculture sector (see
Figure 7.2). In paddy cultivation, methane
is produced from anaerobic decomposition
of organic material in flooded rice fields,
which escapes into the atmosphere primarily
by diffusive transport through rice plants
during growing season.
Total Nitrous oxide (N2O) emission in
India in 2007 was 0.2 million tones of CO2
equivalent contributing 0.02 per cent of the
total GHG emissions. Significant emission
of N2O was from the agriculture sector,
which accounted for 61 per cent of total
N2O emission.
Figure 7.1: Distribution of GHG emissions from India in 2007
Source: MoEF (2010).

Climate Change and Agriculture 111
This can be done by providing farmers with advice and incentives on the best land management options as regards climate change.
7.8. Government policies affecting adaptation in agriculture
In this section, government’s policies related to adaptation in agriculture sector would be discussed. The focus on adaptation is intentional as the largest portion of GHG from agriculture stems not from agri- culture but the allied activity of livestock rearing (enteric fermentation). Given that a large population still depends on agri-culture for their livelihood, the impact of climate change on the productivity of agriculture is a critical issue. In this context while mitigation actions by the govern- ment are as yet optional,1 there is every reason for the government to start looking at suitable adaptation measures.
There are several policies and pro-grammes of the Government of India (GoI) that have a bearing on adaptation in the agriculture sector. The three key policies discussed in this chapter include the National Action Plan on Climate Change, the Integrated Watershed Development Programme and the Mahatma Gandhi National Rural Employment Guarantee Scheme.
7.8.1. National action plan on climate change
The GoI has drafted a National Action Plan for Climate Change (GoI, 2008) in which it has resolved to create eight mis-sions to work on climate change and its probable impact in different sectors. One of these missions is National Mission for Sustainable Agriculture. The focus of the national mission is on the four aspects of (a) Dryland Agriculture (b) Risk Management (c) Access to Information and (d) Use of Biotechnology.
1. Dryland Agriculture : The mission realizes the importance of drylands for food security as also for providing livelihoods to rural poor. The plan is to work in four strategic areas in order to improve productivity of the drylands and facilitate farmers’ adaptation to climate change. The areas include (a) crop im-provement, (b) improving methods to
Figure 7.2: Sources of GHGs within agriculture sector
Source: MoEF (2010).
1 India has taken a leadership role among developing countries in espousing the principle that it is the developed countries that were primarily responsible for the climate change and therefore should bear the responsibility of mitigating its effect. The developing economies should not be made to share the burden of mitigation. However, this stance is getting softened now in light of the fast economic growth of India and subsequent rise in the GHG emissions in India.

112 ShaileSh Nagar aNd JayeSh Bhatia
conserve soil and water, (c) stakeholder consultations, information sharing and capacity development of farming community and (d) financial support for adopting relevant technologies to overcome climate stress.
2. Risk Management: Understanding that climate change induced extreme weather events put farmers at risk, the mission gives priority to strengthen-ing agriculture and weather insurance mechanisms and supports insurance providers through development of weather derivative modelling, facili-tates weather insurance through use of web technology, facilitates resource mapping and land-use planning at the level of watersheds and vulner-able eco-regions. The mission aims at developing and implementing region-specific contingency plans based on vulnerability and risk scenarios.
3. Access to Information: The third focus of the National Mission for Sustainable Agriculture is on access to information. The mission realizes that no need-based and interactive modes are available to farmers for information. The mission plans to create regional databases on physical resources and processes asso-ciated with agriculture and provide information in the form of block-level data and state-level agro-climatic atlases. This information would also include medicinal plants, agro-forestry, livestock and agro-processing.
4. Use of Biotechnology: The fourth aspect of Mission’s focus is the use of Biotechnology. The focus is towards drought proofing, taking advantage of elevated CO2 concentrations, in- creased yields and increased resistance to disease and pests. The mission plans to achieve this by
l genetic engineering,l developing crops with more efficient
water and nitrogen use, for greater tolerance to drought, submergence or salinity and
l developing nutritional strategies for managing heat stress in dairy animals so as to prevent nutrient deficiencies leading to low productivity.
7.8.2. Watershed development programmes
Watershed development has become a key strategy in India for not only addressing resource degradation but also creating durable assets in the natural resource domain. The key objective of watershed development is to restore ecological bal-ance in the degraded and fragile dryland ecosystems by developing and conserving land, water and vegetative cover. In doing so, watershed development programmes reduce the vulnerability of the community residing within the watershed areas towards climate.
Integrated development of natural re-sources on watershed basis is carried out largely by Ministry of Agriculture, Minis-try of Rural Development, National Bank of Agriculture and Rural Development, externally funded projects (bilateral and multilateral) and international NGOs. Some agencies support development of multiple natural resources (e.g., Ministry of Rural Development), while other agencies also support development of livelihoods (farm production system as well as off-farm livelihoods) in addition to development of natural resources but as an integral part of the watershed programme. Up to the Tenth Five Year Plan, a total of 51 million hectares with an overall investment of ` 192 billion was covered under watershed development projects (GoI, 2007b).
Watershed development programmes have become the most important vehi-cle for promoting growth in dryland areas of India. During the Eleventh Five Year Plan, the existing three area development programmes—Integrated Wasteland Devel-opment Programme, Drought Prone Area Programme and Desert Development Programme—have been consolidated into a single programme called the Integrated

Climate Change and Agriculture 113
Watershed Management Programme (IWMP). This consolidation is for optimum use of resources, sustainable outcomes and integrated planning. The common guidelines, effective from 1 April 2008, for Watershed Development Programme have been formulated and an amount of ` 18 billion allocated for IWMP during 2008–09.
In dryland areas of India, a specific programme ‘National Watershed Devel-opment Program in Rainfed Areas’ (NWDPRA) is being funded by the GoI for watershed development. NWDPRA focuses on scientific land use through de-velopment of integrated farming system on the principles of watershed management in each community development block where arable area under assured means of irrigation is less than 30 per cent. Guide-lines for NWDPRA were prepared and used during the Tenth Plan period. Whereas IWMP is funded through Department of Land Resources under Ministry of Rural Development, NWDPRA is funded through Department of Agriculture and Cooperation of Ministry of Agriculture.
Planning Commission, in its working group report has proposed to develop all the waste land/dryland areas (88.5 mil-lion ha) in a period of 20 years (i.e., up to Thirteenth Five Year Plan) at a cost of ` 727 billion with peoples’ participation. The evaluation of dryland area developmental programmes like Drought Prone Areas Programme, Desert Development Pro-gramme, National Watershed Develop-ment Project for Rainfed Areas (NWDPRA), etc., by various agencies indicates promise in watershed programmes for improving dryland areas and facilitating adaptation by farmers.
7.8.3. Mahatma Gandhi National Rural Employment Guarantee Scheme
Mahatma Gandhi National Rural Em-ployment Guarantee Scheme (MGNREGS) is the flagship scheme of the GoI that provides
demand-based employment to rural people who earn their daily wage through manual labour. The National Rural Employment Guarantee Act entitles all rural households in India to 100 days of wage employment. The key feature of MGNREGS is not only 100 days employment entitlement but also the potential to create durable assets in rural areas that can mitigate the risks aris-ing from a changing climate in India. Thus, MGNREGS has the potential for not only creating assets in the common domain like check dams on rivulets and digging com-mon ponds, but now also on the private lands of the marginal households like creating farm ponds, land levelling, etc.
The potential of MGNREGS in mitigat-ing adverse effects of climate change on farmers stems from the fact that it is a social security measure ensured by the law. Even in case of adversity, the farmer can claim their right to livelihood from MGNREGS, thus reducing livelihood vulnerability of the farmer to natural travesties. The scheme also facilitates adaptation as it tries to create dur-able assets in the public and private domain, which results in conservation of natural resources like water and soil.
7.9. Challenges to adaptation in agriculture sector
There are several challenges to adaptation of the community in agriculture sector in the context of climate change. These challenges can be broadly divided into the three categories of Capacities, Technologies and Resources. This section discusses each of these broad challenges.
7.9.1. Challenges related to capacities
Meaningful adaptation by farmers would require specific capacities at local, regional and national levels. Challenges related to capacity development would include developing knowledge base and dissem-ination of relevant information, which would result in adoption of appropriate technologies and practice for adaptation.

114 ShaileSh Nagar aNd JayeSh Bhatia
Increasing awareness about climate change among farmers is another challenge.
Developing capacities would include developing knowledge base and dissem-ination of relevant information, which would result in adoption of technology and practice appropriate for adaptation. Increasing awareness about climate change among farmers is another challenge.
India has a wide network of public agri- culture research institutions. Indian Council of Agriculture Research alone has four deemed agriculture universities and 45 insti-tutions under it. The state governments have their own agriculture universities and institutions. Taking a lead, Indian Council for Agricultural Research (ICAR) had launched a network ‘Impacts, Adaptation and Vulnerability of Indian Agriculture to Climatic Change’ in 2004 which has ex-panded to 25 centres across the country now. Climate Change has also been identified as a priority area for National Agricultural Innovations Project Funding by ICAR. Despite these initiatives, there is still a lot to be done in terms of institutional capacity development.
ICAR identifies following areas in capa- city development that need to be focused on for climate change adaptation in agri-culture:2
l Establish an Agricultural Intelligence System for impact of weather and inputs on production of important commodities at national as well as international level
l Weather watch groupsl Increase pest surveillancel Explore feasibility of establishing feed,
fodder and seed banksl Increase farm insurance coverage using
weather derivativesl Enhance climate literacy
There is an urgent need for mapping vulnerability of various areas at the smallest
level possible with increased accuracy for preparing appropriate plans for adapta-tion. This will require huge financial inputs along with technically trained human re-sources. National Action Plan on Climate Change (NAPCC) has outlined a plan for creating such a knowledge base, but the implementation of NAPCC is still very unclear.
When institutional capacities are de-veloped and substantial knowledge base on adaptation strategies at different levels is available, proper transmission of such information will be required. Transmission of information related to climate change and appropriate responses to climate change is still poor in India. This, combined with inadequate infrastructure in many marginal areas and low levels of human capital, constitutes major constraints for adaptation.
7.9.2. Challenges related to science and technology
Adaptation in agriculture to varied climate would require technological innovations in the spheres of climate modelling for predicting accurate local level climate change effects, crop science, biotechnology, etc. This would require massive financial resources and skilled manpower. India currently lags behind in the world in terms of generation of suitable knowledge related to Climate Change (see Figure 7.3).
Government expenditure on Research and Development (R&D) in Climate Change is low just as in overall R&D sector. According to a Planning Commission report, the expenditure on overall R&D was about 0.74 per cent of Gross National Product in 2004–05, about three-quarters in the public sector and the rest in the private sector and higher education institutions. The total public and private expenditure on overall R&D in India, which amounts to a little less than $4 billion a year, pales into insignificance in the light of a global total which is of the order of a trillion dollars (GoI, 2006a).
2 Available online on http://www.icar.org.in/en/node/250. Accessed on 27 July 2010.

Climate Change and Agriculture 115
Various institutions are now working on issues related to climate change within their own sphere of activities. Institutions like Indian Remote Sensing Agency, Indian Agriculture Research Institute, Ministry of Water Resources, the India Meteorological Department and the Institute of Tropical Meteorology are in the process of technology development and dissemination, which are essential for adaptation to climate change. However, for developing an integrated adaptation mechanism, there is a need to enhance technical and institutional cap-acity to understand, analyze and address climate change. India has a large science and technology institutional base in many areas relevant to climate change research. These institutions have to develop a shared vision, integrated approach and network-ing for synergistic research in climate change relevant to policy-making.
7.9.3 Challenges related to resources
Challenges related to resources at the national or state level include financial resources that would be required to aug-ment capacities of various institutions, establish networks and infrastructure for dissemination of appropriate knowledge which have been briefly discussed earlier. Constraints at the local level pertain to
availability of irrigation and credit and generating awareness on climate change per se. Irrigation infrastructure and availability of credit to farmers, especially small and marginal farmers in dryland areas is anyway less which makes farmer in these areas more vulnerable to climate induced changes.
1. Increasing Area under Irrigation: One of the key adaptation measures to reduce climate-induced vulnerability is to provide resource inputs in agriculture. Thus, increasing area under irriga-tion becomes a priority in adaptation. However, there are challenges with regard to water use and availability that would need to be overcome. Seventy-five per cent of the total water available in India currently is used for irrigation. As much as 20 per cent is required to meet domestic and municipal needs—leaving just 5 per cent for industrial needs. With warming, there is expected to be increased demand for water from domestic and industrial consumption. This may limit the availability of water for irrigation. A large area under irrigation already receives water from ground-water sources. Further pressure on these resources may also lead to groundwater depletion, soil salinization and water
logging. Many states in India need to
Figure 7.3: Number of papers on climate change published in peer reviewed journals
Source: Data on country-wise number of papers on climate change was gathered from Web of Science on a search query for ‘Climate Change’.

116 ShaileSh Nagar aNd JayeSh Bhatia
adopt measures for restricting the use of
groundwater to prevent a water famine
in the future (IPCC, 2001b). The problem
is further compounded by the nature of
small and marginal landholdings, which
are characterized by highly unequal
ownership of and access to productive
assets such as land and water (World
Bank, 2009).
2. Micro-credit and Insurance: Another
key resource that should be available
at the local level for reducing farmer
vulnerability arising from climate
change is microfinance and agriculture
insurance. Crop insurance assumes a
vital role in the stable growth of the
agriculture sector in India as crop pro-
duction is still dependent on vagaries
of weather and large-scale damages due
to attack of pests and diseases are com-
mon. Innovations in microfinance gen-
erally and in micro-insurance products
specifically may aid farmers’ capacity to
adapt to climate change. This is espe-
cially true in production settings that
are exposed to greater variability and
more frequent extreme events (Lybbert
and Sumner, 2010).
The National Agricultural Insurance
Scheme (NAIS) is being implemented
from rabi 1999–2000 season with
the objective of providing insurance
coverage and financial support to the
farmers in the event of failure in any of
the notified crops as a result of natural
calamities, pests and disease, and to help
stabilize farm incomes, particularly in
disaster. Around 75 million farmers
have benefited from the scheme till
December 2005 with the total sum
assured of ` 705 billion (GoI, 2006b).
Though some innovative insurance
products are now available (Box 7.1),
given the scale of India’s agriculture,
their coverage and total farmers in-
sured is still negligible. Increasing the
area and the number of farmers under
such schemes and designing effective
insurance schemes is still a challenge
for GoI.
7.10. Opportunities available in adaptation
This section discusses various potentials
existing in India in terms of adaptation to
climate change in agriculture. Using the case
of Western Orissa Rural Livelihood Project
(WORLP), the chapter highlights various
strategies/actions that may be promoted
by the policy-makers and civil society at
large.
It is now established that the policies
that are designed to strengthen current
coping capacity also have the power to
strengthen long-term adaptive capacity.
This is best exemplified by measures such
as crop productivity enhancement, crop
insurance, seed banks, alternative (off-farm)
employment options and enhanced access
to inputs and markets. At the micro-level,
several strategies are adopted by farmers
Box 7.1: Innovation in micro-insurance
A recent pilot programme by the private sector in India with an NGO into banking involves risk being insured if rainfall is insufficient. The growing season for the crops in question, groundnuts and soybean has been divided into sections so that a critical shortage of pre-cipitation in one part of the growing season will trigger the index policy, even if ample rainfall
at other times in the growing season results in overall, aggregate precipitation appearing to be satisfactory for crop growth. Some 200 farmers are involved in this pilot programme. This pilot provided some key lessons related to such weather insurance that would be a challenge for the policy-makers and institutions designing such schemes in futures.
Source: Gine et al. (2007).

Climate Change and Agriculture 117
themselves or there is a scope for facilitating environment provided by policy (Table 7.4) which ensures better coping by the farmers. Many of these strategies already form part of the programmes on watershed development and wasteland development in India.
Interventions in these programmes increase the adaptive capacity of the com-munity to cope with climate induced stress,
especially in areas where the land and its holding capacity are more marginal. In wasteland and watershed development programmes like WORLP, a large num- ber of natural resources management (NRM) activities are implemented through a series of interventions to manage and check runoff from catchments and to reduce sediment load in water bodies.
Table 7.4: Climate change hazards, impacts, micro-level strategies and actions for adaptation to climate change
Climate change hazards Impact Strategy Adaptation actions
• Shift of season• Drought/aridity• Erratic rainfall• Floods• Sea-level rise• Storms• Extreme heat• Extreme cold• Vector borne diseases
• Damage to forest • Decreased food security• Decreased functionality of human
settlements• Landslides• Loss of crops• Water shortages• Soil erosion• Loss of livelihoods• Low survival/productivity of livestock• Low survival/productivity of poultry• Low productivity of fisheries• Loss of land• Water logging• Coastal inundation/erosion• Damage to human settlements• Urban heat islands• Increased disease incidences
• Dissemination of knowledge and education• Improved farm-level infrastructure design• Vector control• Appropriate crop selection• Alternative cultivation methods• Post-harvest management• Pest control• Rain water harvesting• Soil conservation• Sustainable water management• Natural resource management• Nutrient management• Livelihood diversification• Appropriate livestock selection• Appropriate poultry selection• Diet diversification • Improved house design• Appropriate appliances• Disaster risk management
• Afforestation/reforestation• Agro-forestry• Animal pest control• Appropriate irrigation methods• Aquaculture• Bunds/ridges/terraces• Check dams• Cold-resistant housing• Crop processing• Disaster mitigation• Disaster preparedness• Disaster rehabilitation• Drought-resilient crops• Early warning• Exterminating vectors• Flood-resistant housing• Food processing and storage• Forest management• Harvesting of wild foods• Heat-resistant housing• Horticulture• Hydroponics• Improved cropping system• Indigenous forecasting• Integrated agriculture–aquaculture• Livestock breeding• Ponds• Portable household appliances• Poultry breeding• Promotion of handicrafts• Rangeland management• Restoration of coastal ecosystems• Retaining walls• Saline tolerant crops• Sea dykes• Seed priming• Seed selection and storage• Soil fertilization• Storm-resistant housing• Tanks• Temporary land redistribution• Vermicomposting• Vocational training• Water allocation• Weed control• Wells
Source: Anonymous.

118 ShaileSh Nagar aNd JayeSh Bhatia
These strategies enhance water resources and improve land productivity. Such activ-ities also influence water, nutrient, carbon and production cycles in ecosystems, which are in turn influenced by the prevalent cli- matic conditions. A major part of the NRM activities are intended to increase recharge through the unsaturated root zone to the extent that less rainfall is available for pos-sible runoff. Reduced runoff is generally accompanied by reduced soil loss, and minimal sediment load is thus deposited in water bodies.
Two large-scale programmes imple-mented by GoI—MGNREGS and Integrated Watershed Development Programme— that have a direct bearing on the adaptive capacity of the farmers and which directly influence productivity of agriculture, espe-cially in the dryland regions.
The MGNREGS is a rights-based employ-ment entitlement which exclusively focuses on manual works that are mostly directed towards creating or strengthening natural asset base. The expenditure across the country in MGNREGS in 2008–09 was more than ` 270 billion with highest priority to water conservation works. Many of the interventions under MGNREGS provide co-benefits of adaptation and mitigation to climate change (Table 7.5).
In the context where a large amount of financial resources are channelled by the GoI
in watershed development and employment generation programmes, it can be argued that sustainable agricultural practices to increase resilience to climate change can be facilitated through these well-funded government agricultural and watershed programmes.
A case of such watershed development programme in India is the Western Orissa Rural Livelihood Programme. A recent study was conducted to assess WORLP outcomes in terms of climate change issues in the project area. The case given in the following section provides evidence to the potential of such projects/programmes in addressing vulnerability arising from variation in climate.
7.11. Case of Western Orissa Rural Livelihood Programme (WORLP)3
7.11.1. The programmeWestern Orissa Rural Livelihood Pro-gramme is being implemented in four of the poorest districts in the state, namely Bargarh, Bolangir, Kalahandi and Nuapada. It is implemented by the Orissa Watershed Development Mission (Government of Orissa) with support from the Department for International Development (DfID). The programme started in August 2000 with a total cost of ` 2.3 billion (GBP 32.75 million) and covers 870 villages
Table 7.5: Benefits of mGNreGS with respect to climate change adaptation and mitigation in India
MGNREGS’ co-benefit of adaptation to climate changeMGNREGS’ co-benefit of mitigation to
climate change
Coping with increasing water stress
• Water conservation/rainwater harvesting• Increased irrigation• Enhancing water-use efficiency• Land development leading to improvement in soil water-
holding capacity/reduction in soil erosion
Coping with extreme events
• Employment security—Income during non-agricultural seasons• Forestry and horticultural incomes• Drought proofing and flood protection
Carbon sequestration
• Land development; soil conservation• Tree planting activities• Afforestation and Horticulture
Source: Adapted from Sharma (2009).
3 The case is excerpts from Synthesis Report: Effects of Climate Change in WORLP (WORLP, 2006).

Climate Change and Agriculture 119
across 290 watersheds in 29 blocks of the
four districts. The four project districts com-
pare with sub-Saharan Africa in terms of
human development indicators.
The project aimed at establishing ef-
fective approaches to sustainable rural
livelihoods through watershed develop-
ment in the targeted districts which would
be adopted by Government agencies and
other stakeholders.
The project’s design was guided by the
Sustainable Livelihood Approach (SLA)
encompassing effective strategies for liveli-
hood improvement and leading to positive
livelihood outcomes. Vulnerability con-
text, which is an integral part of the SLA
and include shocks, adverse trends and
seasonality over which the community or
the project had no control, was recognized
by the project design. Although, at the design
stage, the project outputs were not planned
to aid adaptation to climate change in the
project areas, these ultimately contributed to
facilitating adaptation. Table 7.6 compares
the five outputs on their potential for aiding
climate change adaptation.
7.11.2. Impact of the programme1. Impact on Natural Resources: Under
the WORLP programme, a number of soil and water conservation measures have been implemented in the project districts. In addition to these interven-tions, some micro-irrigation measures such as the surface treadle pump, rope and washer pumps, pressure pumps and drip irrigation systems were also promoted. Table 7.7 suggests that gross cropped area and cropping intensity has improved in the project watersheds.
2. Impact on Agriculture: A number of agricultural strategies which have evolved in response to climate shock can be seen as adaptation. Examples of these are:
l Choice of crops that consume less water (mostly low yielding local varieties)
l Adjustment of crop management practices for upland/fragile land situations by deep furrow plough-ing to better capture moisture over prolonged dry spells
Table 7.6: Programme outputs and their potential for climate change
Outputs Comment
1. The poorest are organized and are able to plan and implement participatory livelihoods-focused development effectively.
1. Where social capital is raised, communities are more resilient and better equipped to handle climate shocks effectively.
2. The livelihood asset base for the poorest is enhanced and diversified in 290 micro-watersheds.
2. An enhanced and diversified asset base, especially for natural and financial assets, should permit increased adaptability and reduced vulnerability.
3. Government, PRI and NGOs work together to implement participatory, livelihood-focused development effectively.
3. Better convergence and pooling of ideas and resources will strengthen the capacity of stakeholders to deal with climate stress and encourage building on each other’s strengths.
4. Policy and practice constraints to livelihoods are reduced in the areas of Non-Timber Forest Produce, migration, land rights, disaster preparedness and gender issues.
4. Policy issues that all have a direct bearing on reducing climate stress.
5. Project approaches are replicable elsewhere in the Kalahandi, Bolangir, Bargarh and Koraput region in Orissa.
5. Approaches proven helpful in reducing climate stress can be identified and scaled up.
Source: WORLP (2009).
Table 7.7 Changes in land use and its impact
Project input Changes Adaptive action and impact
Soil and water conservation Aat land has become cultivable More wasteland becomes cultivable, benefiting the poor in upper reaches more resilience to dry spells and drought
Excavation of farm ponds, water bodies
Better water availability for livestock
Decline in grazing radius and pressure on fodder but better animal healthdecline in livestock loss
Source: WORLP (2009).

120 ShaileSh Nagar aNd JayeSh Bhatia
l Reduction of the area of crops
planned—remaining seeds due to
reduction in area cropped may be
used for feeding livestock or could
be exchanged for other goods
l Adjustment of cropping systems—
short duration varieties planted
l Re-use of drainage water for vege-
table crops and kitchen gardens
The project has attempted to facilitate
changes in cropping systems as well as crop-
ping patterns, and this has helped people to
adapt to climate stress, especially drought.
All interventions were accompanied by a
large-scale community sensitization de-
signed to promote appropriate agricultural
activities.
Table 7.8 indicates some of the impacts
on cropping systems that have resulted
from project interventions on the NRM
front.
3. Socio-Economic Impacts: The project has made substantial investments in capacity building of the target group, which translates into an increase in the social capital of the community. Greater social capital is likely to increase resilience and enhance people’s capacity to cope, as well as providing quicker, better informed and more appropriate responses to stress situations, including climate variability and change.
WORLP has organized around 65,000 women in approximately 5,000 SHGs with improved savings and linkage to the banks. The increased number and strength of SHGs has sig- nificantly improved stock of social capital within the project. This has an immediate impact on reducing people’s vulnerability, cushioning the effects of climate-related shocks, and ensuring ability to cope. Through exposure to
Table 7.8: Positive impacts of Nrm interventions on agriculture-based livelihoods
Intervention/Cause Impact
Water harvesting structures and seepage through bunds
• Crop yields (rice in particular) increased by 50–80% with the conversion of uplands (Aat lands) to lowlands (Bahal lands)
Increased moisture regimes • Soil moisture regime improved, leading to changes in crop variety—little more yield in aat land
• Yield low in short-duration varieties; improved soil moisture regime allows longer duration varieties in aat and mal
• Improved crop husbandryField bunding • Erosion has reduced in almost all visited watersheds barring untreated
areas• Improved soil moisture, yield of other crops (maize, groundnut, gurji)
increased by 20–30%Crop diversification • For aat and mal local varieties were perceived to be drought and pest
resistant and HYV seeds were not available anyway. Farmers accepted the trade-off between high drought and pest resistance and low yield. Some HYVs were introduced in Berna, leading to 25–30% yield increase
• Farmers are adapting to a favourable situation created by improving soil moisture. 11,945 farmers brought under crop diversification, enhancing their adaptive capacity
• Cotton picked up with yield increase from 3–4 q/ha to 10–12 q/ha • Rice being replaced with crops like gurji, groundnut and cotton to the
extent of 30–80%Increased groundwater recharge • Flourishing of home gardens
• Backyard farming • Use of micro-irrigation tools in lieu of the traditional Picot system for
water liftingPost harvest • Onion clusters have been developed in all lands except aat (620 acres in
Rabi in Bolangir) and low-cost storage (layered) has been introduced to reduce distress selling
Source: WORLP (2009).

Climate Change and Agriculture 121
participatory planning processes, the
groups manage common property
resources more efficiently, and are bet-
ter prepared for crises as compared to
areas where such groups are either non-
existent or weak.
The project not only helped com-
munities in improving livelihood asset
base but also facilitated diversifica-
tion of livelihoods. Diversification
of livelihoods explains the reported
reduction in poverty. The main benefits
were apparent in the off-farm or non-
farm categories. These ensured im-
proved capacity—particularly of the
very poorest—to cope better during
climate stress conditions such as dry
spells and drought.
Non-land based activities, such as
mushroom cultivation, apiary, sericul-
ture, collection and processing of Non-
Timber Forest Produce (NTFP), petty
business, agro-processing and market
value addition, skill upgradation of
village artisans, retailing Public Dis-
tribution System (PDS) commodities,
production of grafts and/or seedlings,
processing and marketing of home
made products and preparation of raw
drugs from medicinal plant parts, have
all successfully been undertaken by indi-
viduals or groups after necessary skill
improvement. The Revolving Fund that
has been provided by the project has been
able to reduce dependence on single-
activity livelihoods, thereby ensuring
significant livelihood diversification.
4. Coping Capacity and Strategies: The pro- ject area is characterized by dryland and smallholder agriculture. Drought is the main manifestation of climate stress that affects this group. Improved coping capacity of the marginal farmers was one of the key intended project outcomes. The Impact Assessment found that the project has had a very positive effect in this regard.
Enhanced agricultural production, greater diversification of livelihood activ-ities and better access to consumption credit were outlined as the key factors behind this improved capacity to cope with drought. Almost 44 per cent of marginal farmers attributed this to increase in agricultural production, 35 per cent to diversification of livelihoods and 28 per cent to consumption credit.
Table 7.9 summarizes the key successes in the WORLP related to climate change adaptation in agriculture.
7.12. Conclusions
The chapter has provided an understand- ing of agriculture and climate change in India and how these affect each other. While knowledge on climate-change effects on agriculture is increasing, there is still a dearth of micro-level studies that can provide bet-ter understanding. What is certain is that climate change will affect agriculture and agriculture-related livelihoods.
Various scenarios have been modelled, and these identify various regions within
Table 7.9: Key successes in worlP related to climate change adaptation in agriculture
Main features of WORLP Indicators of adaptation success
• Establishing community institutions and training on various agricultural and conservation aspects
• Capacity building
• Undertaking soil and water conservation activities, water harvesting and erosion control
• Ecosystem improvement, improved water availability for irrigation/domestic consumption, improved land productivity
• Undertaking plantation of trees and grasses • Increased availability of fodder/fuelwood and stable ecosystems
• Supporting micro-credit and facilitating off- and non-farm activities
• Improved and diversified livelihoods
Source: WORLP (2009).

122 ShaileSh Nagar aNd JayeSh Bhatia
India that will face diverse impact of climate change and extreme events caused due to climate change. Dryland areas due to its complete dependence on the nature will be most affected. This is because in dryland areas the capacity of people to control fac-tors of production is much more limited.
Several challenges are now faced by the State and Civil Society in India vis-à-vis climate change and its impact on the farm- ing community. The key challenges relate to capacities, scientific knowledge and technologies and resources at different levels. Technical institutes are gathering momentum in keeping abreast with tech-nologies to work on climate change issues, but there is still dearth of innovative tech-nologies especially at micro-level and their dissemination to deal with effects of cli- mate change. Financial resources in India for dealing with climate change do not seem to be a constraining factor; however, the farmers’ accessibility of these resources, especially related to credit, appears to be a challenge.
Watershed Development Programmes and MGNREGS provide opportunities for climate change adaptation in agricul- ture. These programmes are in harmony with the objectives of climate change adap-tation. The large monetary allocations for these programmes have a potential to mitigate adverse effects of climate change to significant extent, especially in India’s dryland areas.
ReferencesGarg, N.K. and Q. Hassan. (2007). ‘Alarming Scarcity of
Water in India’, Current Science, 93(7): 932–41.Gine, X.R. Townsend and J. Vickery. (2007). ‘Patterns
of Rainfall Insurance Participation in Rural India’, presentation in World Bank Conference: Access to Finance. Available online at http://siteresources.worldbank.org/INTFR/Resources/Gine_Townsend_Vickery.ppt. Accessed on 26 June 2010.
GoI. (2006a). Report of the Committee on Technological Innovation and Venture Capital, Planning Com-mission, New Delhi. Available online at http://www.planningcommission.nic.in/reports/genrep/rep_vcr.pdf. Accessed on 26 June 2010.
GoI. (2006b). ‘Economic Survey 2005–2006’. Available online at http://www.indiabudget.nic.in/es2005-06/chapt2006/chap813.pdf. Accessed on 27 July 2010.
——— (2007a). ‘Report of the Steering Committee on Agriculture and Allied Sectors for Formulation of the Eleventh Five Year Plan (2007–2012)’, Planning Commission, Government of India. Available online at http://planningcommission.nic.in/aboutus/committee/strgrp11/str11_agriall.pdf. Accessed on 27 July 2010.
——— (2007b). Report of the Working Group on Natural Resources Management Eleventh Five Year Plan (2007–2012), Planning Commission, Volume I: Synthesis, Government of India.
——— (2008). National Action Plan for Climate Change, Government of India. Available online at http://pmindia.nic.in/Pg01-52.pdf. Accessed on 26 July 2010.
Gosain, A.K., S. Rao and D. Basuray. (2006). ‘Climate Change Impact Assessment on Hydrology of Indian River Basins’, Current Science, 90(3): 346–53.
Guiteras, R. (2007). ‘Impact of Climate Change on Indian Agriculture’, Job Market Paper (Draft). Available online at http://websv03b.colgate.edu/portaldata/imagegallerywww/2050/ImageGallery/Guiteras%20Paper.pdf. Accessed on 26 July 2010.
Gupta, V. (2005). ‘Climate Change and Domestic Mitigation Efforts’, Economic & Political Weekly, 40(10): 981–87.
Intergovernmental Panel on Climate Change (IPCC). (2001a). Synthesis Report: Climate Change 2001. Summary for Policymakers, Wembley, United Kingdom, September 24–29.
——— (2001b). Chapter 11—Asia, Third Assessment Report: Climate Change 2001, Core Writing Team, Murari Lal, Hideo Harasawa and Daniel Murdiyarso (eds), IPCC, Geneva, Switzerland.
——— (2007). Synthesis Report Contribution of Work-ing Groups I, II and III to the Fourth Assessment Report of the Intergovernmental Panel on Climate Change, Core Writing Team, R.K Pachauri and A. Reisinger (eds), IPCC, Geneva, Switzerland.
Kumar, K.S.K. and J. Parikh. (1998a). ‘Climate Change Impacts on Indian Agriculture: The Ricardian Approach’, in A. Dinar, R. Mendelsohn et al. (eds), Measuring the Impact of Climate Change on Indian Agriculture, World Bank Technical Paper No. 402, Washington DC, The World Bank.
——— (1998b). ‘Climate Change Impacts on Indian Agriculture: Results from a Crop Modeling Ap-proach’, in A. Dinar, R. Mendelsohn et al. (eds), Measuring the Impact of Climate Change on Indian Agriculture, World Bank Technical Paper No. 402, Washington DC, The World Bank.
Lybbert, T. and D. Sumner. (2010). ‘Agricultural Technologies for Climate Change Mitigation and Adaptation in Developing Countries:

Climate Change and Agriculture 123
Policy Options for Innovation and Technology Diffusion, ICTSD–IPC Platform on Climate Change, Agriculture and Trade’, Issue Brief No. 6, International Centre for Trade and Sustainable Development, Geneva, Switzerland and International Food & Agricultural Trade Policy Council, Washington DC, USA.
Mendelsohn, R. and A. Dinar. (1999). ‘Climate Change, Agriculture and Developing Countries: Does Adaptation Matter?’, The World Bank Research Observer, 14(2).
MoEF. (2004). India’s Initial National Communication to the United Nations Framework Convention on Climate Change. Executive Summary, Ministry of Environment and Forests, Government of India, New Delhi.
——— (2010). India: Greenhouse Gas Emissions 2007, Ministry of Environment and Forests, Gov-ernment of India, New Delhi.
Panda, A. (2009). Assessing Vulnerability to Climate Change in India, Economic & Political Weekly, xliv(16): 105–07.
Rosenzweig, C. and M.L. Parry. (1994). ‘Potential Impact of Climate Change on World Food Supply’, Nature, 367: 133–38.
Sanghi, A., R. Mendelsohn and A. Dinar. (1998). ‘The Climate Sensitivity of Indian Agriculture’, in A. Dinar, R. Mendelsohn et al. (eds), Measuring the
Impact of Climate Change on Indian Agriculture,
World Bank Technical Paper No. 402, Washington
DC, The World Bank.
Shah, M., D. Banerji, P.S. Vijayashankar and
P. Ambasta. (1998). India’s Drylands—Tribal
Societies and Development through Environmental
Regeneration. New Delhi: Oxford University
Press.
Sharma, R. (2009). ‘National Rural Employment Guarantee
Act-Building Resilience: Development & Diffusion
of Technologies for Sustainable Development’,
presentation. Available online at http://www.
newdelhicctechconference.com/Session6-
23.10.09/DrRitaSharma[CompatibilityMode].
pdf. Accessed on 26 July 2010.
Shiva, V. (2002). ‘Water Wars (Excerpt from the book)’.
Available online at http://www.thirdworldtraveler.
com/Vandana_Shiva/Water_Wars_VShiva.html.
Accessed on 29 July 2010.
Smit, B. and J. Wandel. (2006). ‘Adaptation, Adaptive
Capacity and Vulnerability’, Global Environmental
Change, 16: 282–92.
World Bank. (2009). South Asia Climate Change
Strategy (Draft). World Bank.
Western Orissa Rural Livelihood Programme (WORLP).
(2009). Synthesis Report: Effects of Climate Change
in WORLP. Bhubaneshwar: WORLP.

124 ShaileSh Nagar aNd JayeSh Bhatia

About the Editors and Contributors
The Editors
Sankar Datta is the Dean, Livelihood School, Hyderabad and Director, Indian Grameen
Services, Hyderabad. Dr Datta has a bachelor’s degree in Agriculture and Animal Husbandry
from GB Pant Agriculture University, Pantnagar, a postgraduate diploma in Rural Management
from the Institute of Rural Management, Anand and a PhD in Economics from the Sardar
Patel University, Gujarat. He worked with MP Oilseeds Cooperative Federation, PRADAN
and IIM-Ahmedabad, before joining the faculty of Institute of Rural Management, Anand for
five years. Dr Datta has been involved in extending professional services for rural development
activities, specially focusing on livelihood promotion, working with micro-enterprises for
over two decades.
Vipin Sharma is the CEO, ACCESS Development Services. He is responsible for insti-
tutionalization and expansion of the organization as a pan-India resource organization to
support livelihoods and microfinance outreach. He has earlier worked in CARE-India as
Programme Director, Microfinance, heading CASHE (Credit and Savings for Household
Enterprises), CARE’s largest microfinance programme worldwide. Prior to that, he was
Executive Director, Rural Non-Farm Development Agency (RUDA), Government of
Rajasthan. He holds a BA (Hons) in History from St. Stephen’s College, Delhi University and
an MA in History from University of Rajasthan, Jaipur.
The Contributors
Reshma Anand, founder of Earthy Goods, is an Economics graduate from University of
Delhi and an MBA from Indian Institute of Management, Bangalore. She started her career
with Unilever India. Her next assignment was with Development Alternatives, a renowned
social enterprise, where she headed marketing, business development and fund raising.
In course of her travels to villages across India, Reshma found many resilient entrepreneurs
and artisans who make quality products, give fair prices to local farmers and create local
employment but face challenge accessing markets on fair terms. She set up Earthy Goods over
a year ago to create a network of agricultural producers and bring them to market.
Jayesh Bhatia has 16 years of experience working with national and international research
and consulting organization. With degrees from Indian Institute of Forest Management,
Bhopal and University of Oxford, he specializes in project and research management,
natural resource management, monitoring and evaluation, livelihoods and climate change
adaptation. He has been involved in design and delivery of donor-supported projects and
programmes. Jayesh was instrumental in establishment of NR Management Consultants
(NRMC) India Pvt Ltd in 2004. NRMC India has emerged as a leading consultancy and

126 State of IndIa’S LIveLIhoodS RepoRt 2010
research organization, working across five core areas of Project Management, Research
and Advocacy, Climate Change Adaptation, Training and Capacity Building, and Impact
Communication Group.
Pradeep Kumar Mishra is presently heading the Eastern India Regional Centre of The
Livelihood School. Previously associated with the Indian Institute of Forest Management,
Bhopal, ARAVALI, Jaipur and Soil Conservation Department, Orissa, he has about 13 years of
experience in academic and development sectors. He has published on various issues dealing
with project appraisal, planning, impact assessment, policy and institutions in the field of
natural resource management, livelihood promotion and microfinance. His recent academic
contribution has been on integrating organizational and policy elements to economic analysis
in the form of an integrated impact assessment model. Pradeep holds a doctorate in Rural
Economics from the Institute of Rural Management Anand (IRMA).
Biswa Bandhu Mohanty has worked with NABARD for 28 years in the areas of development
finance and rural development, particularly promotion of non-farm sector, microfinance,
human resources development, supervision of rural financial institutions, agriculture finan-
cing and institutional development. He was Chief General Manager for over eight years
and headed important departments. Prior to joining NABARD, Mr Mohanty worked for
nine years with Utkal University, Orissa Finance Service, Steel Authority (India) Limited and
the Reserve Bank of India. After his retirement from NABARD on 31 March 2010, he has
been engaged as a freelance consultant to reputed national and international agencies in his
areas of expertise.
Shailesh Nagar works with NR Management Consultants India Pvt Ltd, New Delhi. Shailesh
has worked for 13 years at the grassroot level in Uttarakhand and Rajasthan and provided
research and consultancy support to different government and donor-aided projects. An
alumnus of Indian Institute of Forest Management, Bhopal and University of Cambridge, UK
and a Shell–Chevening Scholar, his MPhil thesis at Cambridge was on Biofuel Policy in India.
He has published reports and papers on various aspects of Natural Resource Management
and Development including voluntary carbon trading in the forestry sector. His current
interests are climate change adaptation in forestry and agriculture sector, bioenergy and rural
livelihoods.
Trilok Singh Papola, former Director and currently Honorary Professor, Institute for Studies
in Industrial Development, New Delhi, is a development economist with over four decades
of experience in teaching, research and advisory assignments. He specializes in the areas of
labour and employment, development planning, industrial economics, rural and regional
development and enterprise development. He has taught at the Universities of Lucknow and
Bombay, Indian Institute of Management (Ahmedabad) and University of Cambridge, UK.
He was Director, Giri Institute of Development Studies, Lucknow for 10 years (1977–87),
Advisor, Planning Commission, Government of India for eight years (1987–95) and Head,
Mountain Enterprises and Infrastructure Division at International Centre for Integrated
Mountain Development, Kathmandu (1996–2002). Dr Papola has published 14 books and
over 100 research papers in reputed journals and edited books. He was a Member (part-
time) of the National Commission on Enterprises in Unorganised Sector (2005–09) and is
currently a member of the Council on Micro, Small and Medium Enterprises chaired by the
Prime Minister.

About the Editors and Contributors 127
Suryamani Roul, Vice President, Livelihoods, ACCESS Development Services, has expertise in enterprise and entrepreneurship promotion with intensive exposure to remote areas and tribal communities. He has earlier been Project Director, Sustainable Tribal Empowerment Project, CARE-India, Andhra Pradesh and Project Manager, CREDIT Project under CARE-India’s Small Economic Activities Development (SEAD) Programme supported by DFID’s JFS support with WFP and Rotary Foundation in undivided Bihar (Ranchi). He holds a Bachelors in Economics from Utkal University, a Masters in Analytical and Applied Economics from Utkal University and an MBA from Calcutta University.