state of health in the eu estonia - who/europe intranet
TRANSCRIPT

on Health Systems and Policies
European
a partnership hosted by WHO
State of Health in the EU
EstoniaCountry Health Profile 2017

Contents1 • HIGHLIGHTS 1
2 • HEALTH IN ESTONIA 2
3 • RISK FACTORS 4
4 • THE HEALTH SYSTEM 6
5 • PERFORMANCE OF THE HEALTH SYSTEM 9
5.1 Effectiveness 9
5.2 Accessibility 12
5.3 Resilience 13
6 • KEY FINDINGS 16
Disclaimer: The opinions expressed and arguments employed herein are solely those of the authors and do not necessarily reflect the official views of the OECD or of its member countries, or of the European Observatory on Health Systems and Policies or any of its Partners. The views expressed herein can in no way be taken to reflect the official opinion of the European Union. This document, as well as any data and map included herein, are without prejudice to the status of or sovereignty over
any territory, to the delimitation of international frontiers and boundaries and to the name of any territory, city or area.Additional disclaimers for WHO are visible at http://www.who.int/bulletin/disclaimer/en/
Demographic and socioeconomic context in Estonia, 2015
Demographic factors
Socioeconomic factors
1. Number of children born per woman aged 15–49.2. Purchasing power parity (PPP) is defined as the rate of currency conversion that equalises the purchasing power of different currencies by eliminating the differences in price levels between countries.3. Percentage of persons living with less than 50 % of median equivalised disposable income.
Source: Eurostat Database.
Estonia EU
Population size (thousands) 1 315 509 394
Share of population over age 65 (%) 18.8 18.9
Fertility rate¹ 1.6 1.6
GDP per capita (EUR PPP2) 21 666 28 900
Relative poverty rate3 (%) 12.5 10.8
Unemployment rate (%) 6.2 9.4
The Country Health Profile seriesThe State of Health in the EU profiles provide a concise and policy-relevant overview of health and health systems in the EU Member States, emphasising the particular characteristics and challenges in each country. They are designed to support the efforts of Member States in their evidence-based policy making.
The Country Health Profiles are the joint work of the OECD and the European Observatory on Health Systems and Policies, in cooperation with the European Commission. The team is grateful for the valuable comments and suggestions provided by Member States and the Health Systems and Policy Monitor network.
Data and information sourcesThe data and information in these Country Health Profiles are based mainly on national official statistics provided to Eurostat and the OECD, which were validated in June 2017 to ensure the highest standards of data comparability. The sources and methods underlying these data are available in the Eurostat Database and the OECD health database. Some additional data also come from the Institute for Health Metrics and Evaluation (IHME), the European Centre for Disease Prevention and Control (ECDC), the Health Behaviour in School-Aged Children (HBSC) surveys and the World Health Organization (WHO), as well as other national sources.
The calculated EU averages are weighted averages of the 28 Member States unless otherwise noted.
To download the Excel spreadsheet matching all the tables and graphs in this profile, just type the following StatLinks into your Internet browser: http://dx.doi.org/10.1787/888933593494
© OECD and World Health Organization (acting as the host organization for, and secretariat of, the European Observatory on Health Systems and Policies)

STATE OF HEALTH IN THE EU: COUNTRY HEALTH PROFILE 2017 – ESTONIA
Highlights . 1
1 Highlights
The health status of Estonian people has improved and is rapidly closing the gap with EU averages. Yet large socioeconomic disparities persist and gains in life expectancy are spent in less good health than in other countries. Deregulation in the 1990s did not achieve the hoped for efficient and accessible health services, so there has been a gradual return to centralised planning and regulation.
Esto
nia
Life expectancy at birth was 78.0 years in 2015, compared with 71.1 years in 2000 and is rapidly catching up with the EU average. These gains are mainly the result of a strong reduction in premature deaths from cardiovascular diseases, although these remain relatively high. Despite improvements, HIV infections and tuberculosis are still challenges for Estonia.
Health status
Health system
Health spending in Estonia, at EUR 1 407, is lower than in most other EU countries, and in 2015, was only about half the EU average per head. This was the equivalent of 6.5% of GDP, again well below the EU average (9.9%). There is a strong reliance on payroll contributions that makes the system vulnerable but still three quarters of health spending is publicly funded, which gives the population more protection than in neighbouring countries.
EffectivenessAmenable mortality in Estonia remains one of the highest in EU countries, which together with other indicators indicates substantial room to improve health services.
AccessAccess to health care shows little variation between income groups but could be improved considerably by addressing high unmet needs for medical care and by addressing waiting times for specialised care.
ResilienceFinancing is vulnerable to the impacts of ageing and economic downturn, while infrastructure and the health workforce remain a considerable challenge. Improvements are planned to broaden the revenue base and create long-term stability.
Health system performance
EE
EU
0% 6% 18%2010
260
300
220
180
140
100
2014 12%
2005 2007 2009 2011 2013 2015€0
€1 000
€2 000
€3 000
149
273
235
126
78.0 YEARS 2000
78
80
76
74
72
70
2015
82
80.6
78.0
71.1
77.3
Life expectancy at birth, years
In 2014, 24% of Estonian adults smoked tobacco daily, only slightly above the EU average but with men smoking much more heavily than women. Alcohol consumption per adult has also decreased but binge drinking among men is high. Adult obesity rates have grown by 40% overall since 2000 and are higher than the EU average whereas overweight and obesity among children pose a real public health concern.
Risk factors
Smoking 24%
23%
20%
Binge drinking
Obesity
% of adults in 2014 EE EU
EE EUPer capita spending (EUR PPP)
EE EU
High income All Low income
Amenable mortality per 100 000 population
% reporting unmet medical needs, 2015
EE EU
83.0
82.7
82.4
82.4
82.2
81.9
81.8
81.6
81.6
81.5
81.3
81.3
81.1
81.1
81.0
80.9
80.8
80.7
80.6
78.7
78.0
77.5
77.5
76.7
75.7
75.0
74.8
74.7
74.6
60
65
70
75
80
85
902015 2000Years
Spai
n
Italy
Fran
ce
Luxe
mbo
urg
Swed
en
Mal
ta
Cypr
us
Neth
erla
nds
Finl
and
Irela
nd
Aust
ria
Portu
gal
Gree
ce
Belg
ium
Unite
d Ki
ngdo
m
Slov
enia
Denm
ark
Germ
any
EU
Czec
h Re
publ
ic
Esto
nia
Croa
tia
Pola
nd
Slov
ak R
epub
lic
Hung
ary
Rom
ania
Latv
ia
Bulg
aria
Lith
uani
a
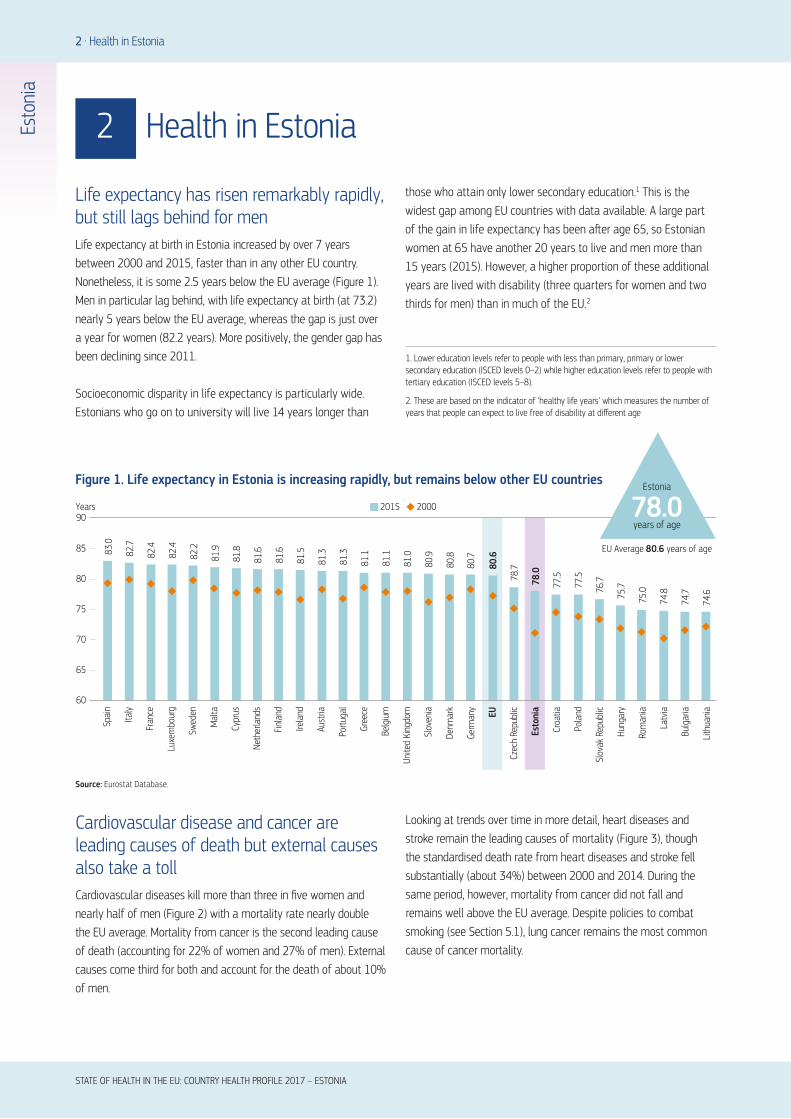
Life expectancy has risen remarkably rapidly, but still lags behind for menLife expectancy at birth in Estonia increased by over 7 years between 2000 and 2015, faster than in any other EU country. Nonetheless, it is some 2.5 years below the EU average (Figure 1). Men in particular lag behind, with life expectancy at birth (at 73.2) nearly 5 years below the EU average, whereas the gap is just over a year for women (82.2 years). More positively, the gender gap has been declining since 2011.
Socioeconomic disparity in life expectancy is particularly wide. Estonians who go on to university will live 14 years longer than
Cardiovascular disease and cancer are leading causes of death but external causes also take a tollCardiovascular diseases kill more than three in five women and nearly half of men (Figure 2) with a mortality rate nearly double the EU average. Mortality from cancer is the second leading cause of death (accounting for 22% of women and 27% of men). External causes come third for both and account for the death of about 10% of men.
those who attain only lower secondary education.1 This is the widest gap among EU countries with data available. A large part of the gain in life expectancy has been after age 65, so Estonian women at 65 have another 20 years to live and men more than 15 years (2015). However, a higher proportion of these additional years are lived with disability (three quarters for women and two thirds for men) than in much of the EU.2
Looking at trends over time in more detail, heart diseases and stroke remain the leading causes of mortality (Figure 3), though the standardised death rate from heart diseases and stroke fell substantially (about 34%) between 2000 and 2014. During the same period, however, mortality from cancer did not fall and remains well above the EU average. Despite policies to combat smoking (see Section 5.1), lung cancer remains the most common cause of cancer mortality.
2 Health in Estonia
2 . Health in Estonia
STATE OF HEALTH IN THE EU: COUNTRY HEALTH PROFILE 2017 – ESTONIA
Esto
nia
Figure 1. Life expectancy in Estonia is increasing rapidly, but remains below other EU countries
Source: Eurostat Database.
EU Average 80.6 years of age
Estonia
78.0years of age
1. Lower education levels refer to people with less than primary, primary or lower secondary education (ISCED levels 0–2) while higher education levels refer to people with tertiary education (ISCED levels 5–8).
2. These are based on the indicator of ‘healthy life years’ which measures the number of years that people can expect to live free of disability at different age

STATE OF HEALTH IN THE EU: COUNTRY HEALTH PROFILE 2017 – ESTONIA
Health in Estonia . 3
(Number of deaths: 8 011)Women
(Number of deaths: 7 478)Men
Cardiovascular diseasesCancer
Digestive systemExternal causes
Other causesRespiratory diseases
45%
27%
10%
5%
5% 9%
61% 22%
8%
2%
3% 3%
Note: The data are presented by broad ICD chapter. Dementia was added to the nervous system diseases’ chapter to include it with Alzheimer’s disease (the main form of dementia).
Source: Eurostat Database (data refer to 2014).
Figure 2. Most deaths in both women and men are caused by cardiovascular disease or cancer
Esto
nia
Figure 3. Heart disease and stroke remain the main causes of death; suicide and poisoning have fallen
2000 ranking 2014 ranking % of all deaths in 2014
22%
6%
6%
5%
3%
2%
2%
2%
2%
2%
1
2
3
4
5
6
7
8
9
10
11
15
1
2
3
4
5
6
7
8
9
10
12
13
Ischaemic heart diseases
Stroke
Other heart diseases
Lung cancer
Colorectal cancer
Stomach cancer
Prostate cancer
Liver diseases
Breast cancer
Pneumonia
2%
2%Accidental poisoning
Suicide
Source: Eurostat Database.
Back pain, alcohol and mental health contribute to high levels of healthy life lostCardiovascular disease, low back and neck pain, alcohol-related disorders and depression are leading causes of disability-adjusted life years (DALYs)3 (IHME, 2016). Based on self-reported data from the European Health Interview Survey (EHIS), almost a quarter of Estonians have hypertension, more than one in thirty report living with asthma, and more than one in twenty have diabetes.
HIV, tuberculosis and hepatitis C virus remain high despite improvementsAlthough the reported rate of new HIV cases in Estonia is declining steadily, it is still the highest in the EU. There were 20.6 notified cases per 100 000 in 2015, nearly four times the EU average.
Despite a substantial decrease in tuberculosis since 2010, the notification rate (2015) was 40% higher than the EU average. The prevalence of multidrug-resistant tuberculosis is particularly worrying at 21.2% of all cases in 2015 (ECDC, 2017). Lastly, hepatitis C virus is underreported but as many as 1% of first-time blood donors have the virus.
People do not feel they are in good health, especially lower income groupsOnly half of Estonians report being in good health, a much lower proportion than is typical in the EU (with average levels nearer to two thirds). This is much more pronounced in low income groups where just 34% of people assess their health as good – compared with 75% of the highest income quintile (2015). This is the largest gap of any EU country (Figure 4). The disparity is borne out by marked inequalities in the prevalence of chronic conditions by education level, with people with the lowest level almost 50%
3. DALY is an indicator used to estimate the total number of years lost due to specific diseases and risk factors. One DALY equals one year of healthy life lost (IHME).

4 . Health in Estonia
STATE OF HEALTH IN THE EU: COUNTRY HEALTH PROFILE 2017 – ESTONIA
Esto
nia
more likely to live with asthma or other chronic respiratory diseases, and 40% more likely to live with hypertension, than those with the highest level of education (2014).4
1. The shares for the total population and the low income population are roughly the same.
2. The shares for the total population and the high income population are roughly the same.
Source: Eurostat Database, based on EU-SILC (data refer to 2015).
Figure 4. Estonia has the EU’s largest inequalities in self-reported health status by income
Behavioural risk factors remain a major problem The relatively poor health status of Estonians is linked to a range of health determinants, including working and living conditions, and behavioural risk factors. Data suggest that 37% of the overall burden of disease (in terms of DALYs) can be attributed to behavioural risks, including alcohol consumption and smoking, as well as diet and low physical activity (IHME, 2016).
Smoking and drinking have declined but many men still smoke and drink heavilyAdult smoking rates have fallen sharply, dropping from 30% in 2000 to 24% in 2014, which is higher than the EU average (21%). The biggest improvement has been in women however, and one-third of men are still smoking daily (twice the rate for women).
3 Risk factors
20 30 40 50 60 70 80 90 100% of adults reporting to be in good health
Ireland
Cyprus
Sweden
Netherlands
Greece¹
Spain¹
Denmark
Romania²
Austria
United Kingdom
France
EU
Slovak Republic
Italy¹
Bulgaria
Slovenia
Germany
Czech Republic
Croatia
Poland
Hungary
Estonia
Portugal
Lithuania
Latvia
Finland
Luxembourg
Malta
Belgium
Total population High income Low income
4. Inequalities by education may partially be attributed to the higher proportion of older people with lower educational levels; however, this alone does not account for all socioeconomic disparities.

STATE OF HEALTH IN THE EU: COUNTRY HEALTH PROFILE 2017 – ESTONIA
Risk factors . 5
Esto
nia
Men are also overwhelmingly more likely to have alcohol issues, with 37% reporting heavy episodic drinking5 compared with 9% of women. This accounts for the poor showing of Estonian adults in EU binge drinking comparisons (Figure 5). Despite this, alcohol consumption per adult (measured by sales), is declining – although it is still above the EU average (11.7 litres per adult against 10 litres) (see Section 5.1). Encouragingly, there has been a sharp decline in risky health behaviours among adolescents. The percentage of 15-year-olds who report having been drunk at least twice in their life has fallen substantially since 2001, particularly among boys, although it is still high for the EU. Smoking among adolescents (boys and girls) has also dropped sharply and is now lower than in most EU countries.
Rapidly increasing obesity rates are a growing public health concernThe prevalence of adult obesity increased by nearly 40% between 2000 and 2015 and nearly one in five Estonian adults is now obese, nearly five percentage points above the EU average. Although overweight and obesity rates among adolescents remain
3 Risk factors
5. Binge drinking behaviour is defined as consuming six or more alcoholic drinks on a single occasion, at least once a month over the past year.
Figure 5. Compared to other EU countries, Estonia performs poorly on most behavioural risk factors
Note: The closer the dot is to the centre the better the country performs compared to other EU countries. No country is in the white ‘target area’ as there is room for progress in all countries in all areas.
Source: OECD calculations based on Eurostat Database (EHIS in or around 2014), OECD Health Statistics and HBSC survey in 2013–14. (Chart design: Laboratorio MeS).
slightly lower than the EU average, they more than doubled between 2001–02 and 2013–14 (rising from 7% to 16%). Some 26% of Estonian children start primary school already overweight or obese (unpublished childhood obesity survey – COSI), which is a worrying trend as being overweight in childhood is predictive of problems continuing into adulthood
The poor and poorly educated take more behavioural health risks Risky behaviours are more prevalent among populations with low levels of education or income. The difference in smoking rates among adults is particularly striking: twice as many of those with the lowest education levels smoke compared with the best educated (31% versus 14%). Binge drinking is also more common among the least educated, although the gap is smaller. Obesity is similar with rates nearly 30% higher for the less educated (22% versus 18%). A higher prevalence of risk factors among disadvantaged groups contributes to differences in health status between socioeconomic groups, though other inequalities also play a role (see Section 5.1).
Smoking, 15-year-olds
Binge drinking, adultsObesity, adults
Overweight/obesity, 15-year-olds
Drunkenness, 15-year-olds
Smoking, adultsPhysical activity, adults
Physical activity, 15-year-olds

6 . The health system
There has been a gradual return to strong centralised planning and regulation Experience with deregulation in the 1990s did not deliver the efficiency and accessibility expected so central planning powers and regulatory functions have been reasserted. The autonomous Estonian Health Insurance Fund (EHIF) remains the core purchaser (and even finances some disease prevention and health promotion programmes). The Ministry of Social Affairs is the steward of the health system and is supported by the National Institute for Health Development; the Health Board, which is responsible for public health (with the National Institute for Health Development) and ambulance services (until 2018 when they transfer to the EHIF) as well as licensing and oversight of providers; the State Agency of Medicines; and the Centre of Health and Welfare Information Systems.
Hospitals are mostly publicly owned while primary care provision and pharmacies are in private hands. In particular, the primary care system is comparatively well established (Kringos et al., 2013), with independent family physicians acting as gatekeepers to secondary care. The 2012 National Health Plan (NHP) integrates all strategies, health and development plans and links the various health system stakeholders and other sectors (see Section 5.3).
Health spending is low and financing is vulnerable to ageing and economic downturnsAt EUR 1 407 per capita (adjusted for differences in purchasing power) health spending in Estonia is well below the EU average (EUR 2 797). This is the equivalent of 6.5% of GDP, again well below the EU average (9.9%) in 2015 (Figure 6). However, the share of public spending (76%) is relatively high compared to neighbouring countries.
The health system is mainly funded through earmarked social payroll tax paid by the employed. Non-contributing individuals (children, pensioners and registered unemployed) account for a high share of the insured population (around half). This threatens financial sustainability, not least because the population is ageing. It makes the system particularly vulnerable to economic downturns, as happened with dramatic impact during the economic crisis in 2008. Perhaps unsurprisingly, the EHIF has been in deficit since 2013, with debts mounting to EUR 25 million in 2016, forcing it to draw on reserves.
Source: OECD Health Statistics, Eurostat Database, WHO Global Health Expenditure Database (data refer to 2015).
4 The health system
Figure 6. Spending on health is very low compared to other Member States
0
2
4
6
8
10
12
0
1 000
2 000
3 000
4 000
5 000
6 000Per capita (le� axis) Share of GDP (right axis)
EUR PPP % of GDP
Luxe
mbo
urg
Germ
any
Neth
erla
nds
Swed
en
Irela
nd
Aust
ria
Denm
ark
Belg
ium
Fran
ce
Unite
d Ki
ngdo
m
Finl
and EU Italy
Mal
ta
Spai
n
Slov
enia
Portu
gal
Czec
h Re
publ
ic
Gree
ce
Cypr
us
Slov
ak R
epub
lic
Hung
ary
Lith
uani
a
Esto
nia
Pola
nd
Croa
tia
Bulg
aria
Latv
ia
Rom
ania
STATE OF HEALTH IN THE EU: COUNTRY HEALTH PROFILE 2017 – ESTONIA
Esto
nia

STATE OF HEALTH IN THE EU: COUNTRY HEALTH PROFILE 2017 – ESTONIA
The health system . 7
Esto
nia
Pharmaceutical cost-sharing and dentistry make up the majority of out-of-pocket spending The Health Insurance Act (2002) defines detailed cost-sharing requirements for a number of primary and specialist care services. It expects patients to make direct co-payments, setting maximum fees for specific services. There are caps of EUR 5 for home visits or specialist consultations; EUR 2.50 per day for a hospital stay (up to a 10-day maximum); and EUR 3.19 per prescription. There are extensive, additional co-payments for pharmaceuticals with only 50% of the remaining price reimbursed as standard, although higher reimbursement rates of up to 100% apply for some disease (e.g. cancers, syphilis, diabetes) and patient groups. Copayments for medicines and dental care account for 74% of out-of-pocket spending (also see Section 5.2). Out-of-pocket spending also includes payments for services that are not in the benefits package or are made to non-contracted providers.
Contracts with providers are being used more strategically Health services purchasing builds on a contractual relationship with providers and financial incentives. In primary care, age-adjusted capitation, fee-for-service payments and basic allowances have been complemented by a quality bonus system
since 2006. This aims to expand the role of primary care and to foster better management of selected chronic conditions. It has been compulsory for family physicians since 2015.
In hospitals a diagnosis-related groups system was implemented in 2004, complementing fee-for-service payments. There has also been revision of specialist care contracting (2014). This resulted in fewer contracted private providers (compared to the previous cycle) delivering a similar volume of care (Habicht et al., 2016). Further roll out is currently on hold to allow evidence of the impact of reforms in primary care (health centres) and the networking of hospitals to be taken into consideration (see Box 1).
BOX 1. ESTONIA IS SEEKING TO CONCENTRATE CARE BY NETWORKING HOSPITALS
Since 2014 regional-level hospitals have been encouraged to network with general hospitals to share skills and medical resources and to support access to specialist care in smaller hospitals. On the other hand, it is expected that as a result of networking, high technology specialist care will concentrate more in regional centres of excellence. By mid-2017 there were initial networks coordinated by the North Estonian Medical Centre and the Tartu University involving five general hospitals, but this number will increase.
Note: In Portugal and Greece, data refer to all doctors licensed to practice, resulting in a large over-estimation of the number of practising doctors (e.g. of around 30% in Portugal). In Austria and Greece, the number of nurses is under-estimated as it only includes those working in hospital.
Source: Eurostat Database.
Figure 7. Estonian physician and nurse ratios are increasingly falling behind the EU averages
Doctors LowNurses High
Doctors LowNurses Low
Doctors HighNurses High
Doctors HighNurses Low
20
15
10
5
0
1 2 3 4 5 6 7
Prac
tisin
g nu
rses
per
1 0
00 p
opul
atio
n, 2
015
(or n
eare
st y
ear)
Practising doctors per 1 000 population, 2015 (or nearest year)
EU UK
EU average: 3.6
EU average: 8.4AT
BE
BGHR
CY
CZ
DK
Estonia
FI
FR
DE
EL
HU
IE
IT
LV
LT
LU
MT
NL
PL
PTRO
SK
SI
ES
SE
8 . The health system
EU structural funds are relied on for health infrastructure and new primary care centre investmentHistorically, care was hospital dominated so the development of family medicine-based primary care has been linked with a reduction in hospitals and hospital beds to rebalance the use of resources. Many small hospitals have merged or turned into ambulatory (or outpatient) clinics, nursing hospitals and social services providers. As a result, the number of acute hospital beds per 100 000 population has fallen dramatically and, in 2015, was slightly below the EU average (368 versus 418 beds). In parallel, the number of nursing care and rehabilitation beds has increased sharply.
Health institutions are responsible for capital investment and from 2004, when Estonia joined the EU, have become quite reliant on support from EU structural funds (see Section 5.3). Hospitals are functional and well equipped, although there is still a legacy of older structures unsuitable for modern care delivery. Current investments are targeted at establishing new primary care centres with wider scope to replace solo practices.
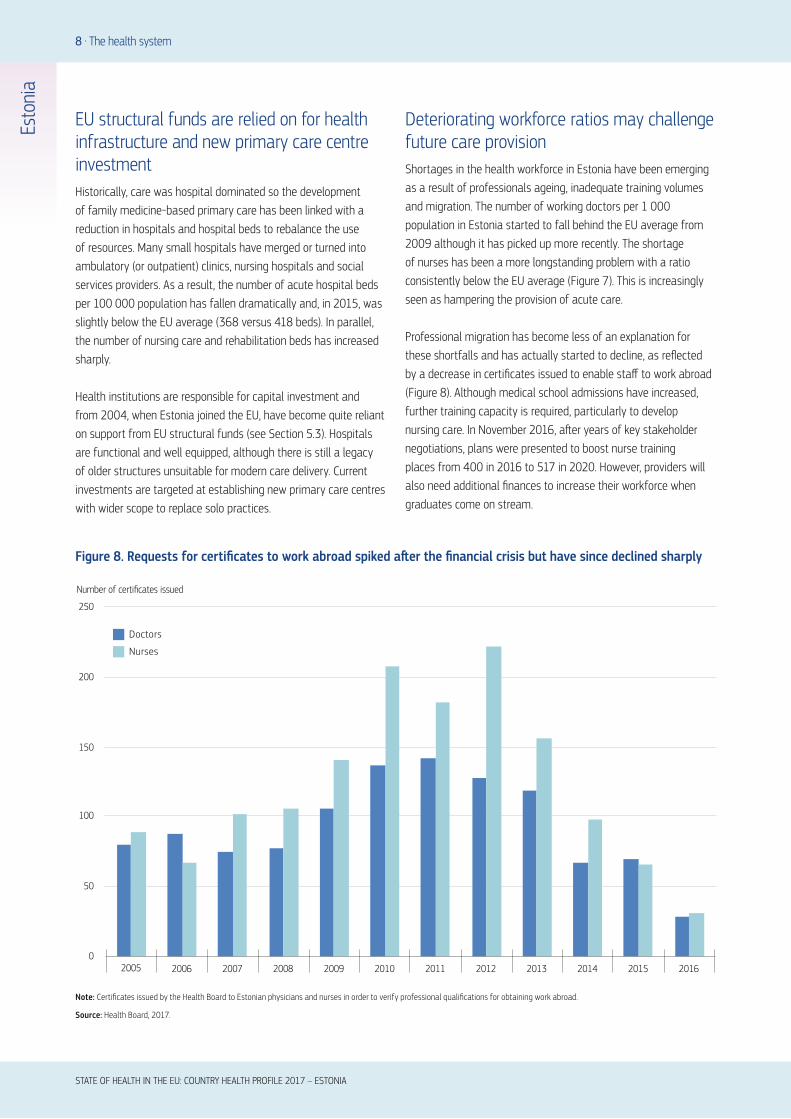
Deteriorating workforce ratios may challenge future care provision Shortages in the health workforce in Estonia have been emerging as a result of professionals ageing, inadequate training volumes and migration. The number of working doctors per 1 000 population in Estonia started to fall behind the EU average from 2009 although it has picked up more recently. The shortage of nurses has been a more longstanding problem with a ratio consistently below the EU average (Figure 7). This is increasingly seen as hampering the provision of acute care.
Professional migration has become less of an explanation for these shortfalls and has actually started to decline, as reflected by a decrease in certificates issued to enable staff to work abroad (Figure 8). Although medical school admissions have increased, further training capacity is required, particularly to develop nursing care. In November 2016, after years of key stakeholder negotiations, plans were presented to boost nurse training places from 400 in 2016 to 517 in 2020. However, providers will also need additional finances to increase their workforce when graduates come on stream.
Note: Certificates issued by the Health Board to Estonian physicians and nurses in order to verify professional qualifications for obtaining work abroad.
Source: Health Board, 2017.
Figure 8. Requests for certificates to work abroad spiked after the financial crisis but have since declined sharply
0
50
100
150
200
250
2005 2006 2007 2008 2009 2010 2011 2012 2013 2014 2015 2016
Doctors
Nurses
Number of certificates issued
STATE OF HEALTH IN THE EU: COUNTRY HEALTH PROFILE 2017 – ESTONIA
Esto
nia
Performance of the health system . 9
STATE OF HEALTH IN THE EU: COUNTRY HEALTH PROFILE 2017 – ESTONIA
Esto
nia
5 Performance of the health system
5.1 EFFECTIVENESS
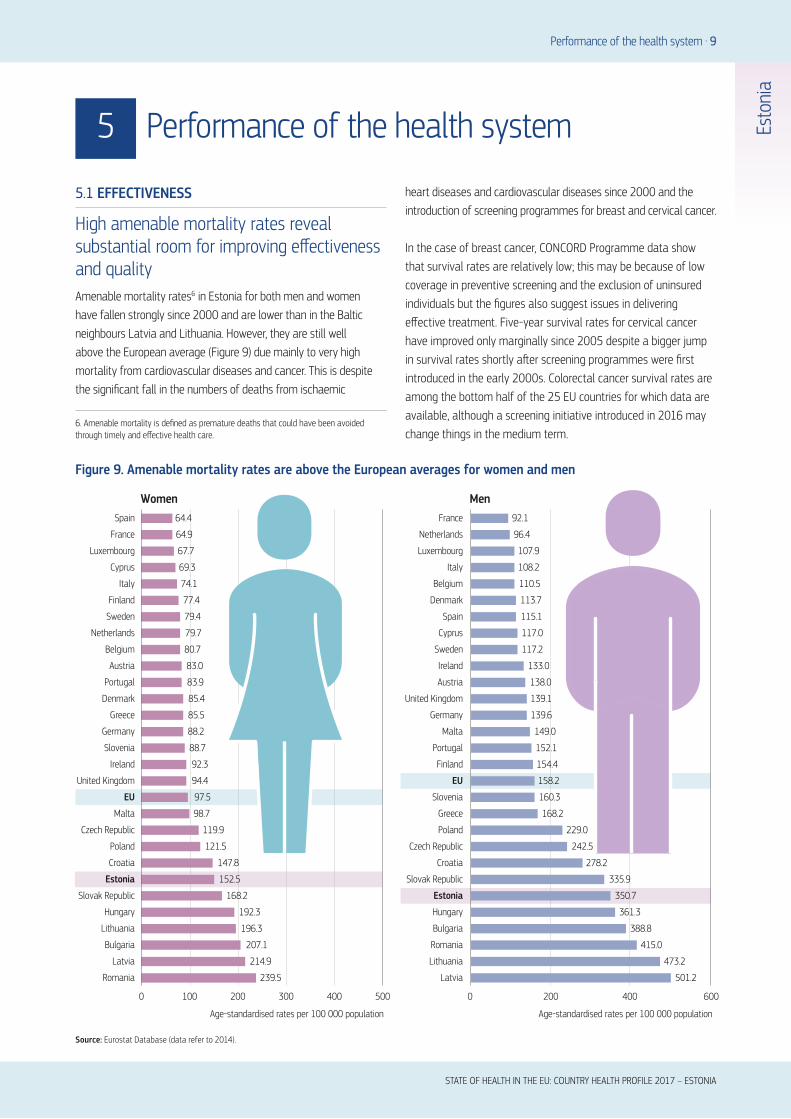
High amenable mortality rates reveal substantial room for improving effectiveness and qualityAmenable mortality rates6 in Estonia for both men and women have fallen strongly since 2000 and are lower than in the Baltic neighbours Latvia and Lithuania. However, they are still well above the European average (Figure 9) due mainly to very high mortality from cardiovascular diseases and cancer. This is despite the significant fall in the numbers of deaths from ischaemic
heart diseases and cardiovascular diseases since 2000 and the introduction of screening programmes for breast and cervical cancer.
In the case of breast cancer, CONCORD Programme data show that survival rates are relatively low; this may be because of low coverage in preventive screening and the exclusion of uninsured individuals but the figures also suggest issues in delivering effective treatment. Five-year survival rates for cervical cancer have improved only marginally since 2005 despite a bigger jump in survival rates shortly after screening programmes were first introduced in the early 2000s. Colorectal cancer survival rates are among the bottom half of the 25 EU countries for which data are available, although a screening initiative introduced in 2016 may change things in the medium term.
6. Amenable mortality is defined as premature deaths that could have been avoided through timely and effective health care.
Source: Eurostat Database (data refer to 2014).
239.5
214.9
207.1
196.3
192.3
168.2
152.5
147.8
121.5
119.9
98.7
97.5
94.4
92.3
88.7
88.2
85.5
85.4
83.9
83.0
80.7
79.7
79.4
77.4
74.1
69.3
67.7
64.9
0 100 200 300 400 500
64.4
Romania
Latvia
Bulgaria
Lithuania
Hungary
Slovak Republic
Estonia
Croatia
Poland
Czech Republic
Malta
EU
United Kingdom
Ireland
Slovenia
Germany
Greece
Denmark
Portugal
Austria
Belgium
Netherlands
Sweden
Finland
Italy
Cyprus
Luxembourg
France
Spain
MenWomen
Age-standardised rates per 100 000 population
0 200 400 600
Age-standardised rates per 100 000 population
501.2
473.2
415.0
388.8
361.3
350.7
335.9
278.2
242.5
229.0
168.2
160.3
158.2
154.4
152.1
149.0
139.6
139.1
138.0
133.0
117.2
117.0
115.1
113.7
110.5
108.2
107.9
96.4
92.1
Lithuania
Latvia
Romania
Bulgaria
Hungary
Estonia
Slovak Republic
Croatia
Czech Republic
Poland
Greece
Slovenia
EU
Finland
Portugal
Malta
Germany
United Kingdom
Austria
Ireland
Sweden
Cyprus
Spain
Denmark
Belgium
Italy
Luxembourg
Netherlands
France
Figure 9. Amenable mortality rates are above the European averages for women and men

10 . Performance of the health system
Policies addressing risky behaviours do not do enough to promote healthy lifestylesImportant preventable causes of mortality such as lung cancer and liver diseases, but also external causes, are well above the EU average and point both to unhealthy lifestyles and to health system challenges around health promotion. There have been government efforts to tackle risk behaviours through increased excise taxes on alcohol and cigarettes (2006–17) and through the introduction of a smoking ban in public spaces, public transport and workplaces (2007) as well as the introduction of picture warnings on tobacco products (2016) and a ban on smoking areas in buildings (2017). Smoking rates have also started to decline, most strikingly among the young, but initiatives fail to reach the least advantaged (see Section 3).
The consumption of alcohol also has been declining since 2007, but stays above the EU average. In 2014 the ‘sober and healthier’ programme started its activities to raise awareness about alcohol-related harm. Currently, Parliament is discussing limiting alcohol advertising and having sales restrictions. Furthermore, Parliament is also discussing a tax on sugar-sweetened beverages. This could help to tackle obesity, which is growing sharply, especially among the young (see Section 3) although for the latter a programme exists (since 2016) to improve the physical activity of school children. But as with the other risks above, it seems likely that more needs to be done to reach certain vulnerable groups such as men with lower levels of education.
There is scope to improve public health servicesPublic health has been moving from the centralised Soviet model to a more decentralised system focused on disease prevention and health promotion. However, there is still insufficient capacity to provide fully effective public health services. The NHP is seeking to address this through training, supervision and clearer definitions of responsibilities. Starting from 2018, municipalities will have to provide health and well-being profiles of the local population. These can then be used to plan measures that improve the health status of citizens.
Care quality indicators show a mixed picture and signal room to improve servicesThere is recent research suggesting that primary care is effective in helping to prevent hospital admissions (Atun et al., 2016). Avoidable hospital admissions are among the best in Europe for asthma and chronic obstructive pulmonary disease (see Figure 10), about average for congestive heart failure and diabetes, but among the worst for hypertension. Moreover, the 30-day fatality rates for acute myocardial infarction and stroke are among the worst in the EU. There are structures in place to support quality health care but outcomes suggest substantial room to further improve service quality and the coordination between levels of care.
STATE OF HEALTH IN THE EU: COUNTRY HEALTH PROFILE 2017 – ESTONIA
Esto
nia
Note: Rates are not adjusted by the prevalence of these conditions.
Source: OECD Health Statistics (data refer to 2015 or latest year).
Figure 10. Estonia has relatively low avoidable hospital admissions for chronic diseases
0
100
200
300
400
500
600
Age-sex standardised rate per 100 000 population
Portu
gal
Italy
Neth
erla
nds
Unite
d Ki
ngdo
m
Spai
n
Slov
enia
Swed
en
Esto
nia
Fran
ce
Denm
ark
Belg
ium
Finl
and
Luxe
mbo
urg EU
Irela
nd
Mal
ta
Czec
h Re
publ
ic
Slov
ak R
epub
lic
Aust
ria
Latv
ia
Germ
any
Pola
nd
Hung
ary
Lith
uani
a
COPD
Diabetes
Asthma

STATE OF HEALTH IN THE EU: COUNTRY HEALTH PROFILE 2017 – ESTONIA
Performance of the health system . 11
Esto
nia
Quality initiatives have been implemented but need time (and perhaps incentives) to take effectVarious quality initiatives have been introduced at the provider level, including the quality bonus system (see Section 4). In addition, the EHIF has published a selection of service quality indicators for every hospital since 2012 and quality criteria are included in strategic contracts. In 2016, the first Advisory Board for Development of Quality Indicators report was published and established a system of publically monitoring quality indicators. The EHIF is also leading an on-going process to improve development of clinical guidelines and in 2012 published a manual on the development of treatment guidelines. Since 2002, five clinical audits have been carried out in collaboration with experts each year by EHIF.
More needs to done to meet the challenge of rising (multiple) non-communicable diseases Even though Estonia has taken significant steps towards capturing and improving health care quality and is committed to care integration, the World Bank (2015) estimated that a large proportion of acute inpatient care could be shifted to more appropriate (and lower cost) settings. Examples from 2013 suggest that 67.5% of specialist visits for hypertension and 20% of specialist visits for diabetes could be deemed ‘avoidable’ and managed more appropriately in primary care. The report suggests that blocks to rolling out quality commitments and achieving better integration included insufficient financial incentives to ensure that providers adhered fully to clinical guidelines; the lack of multi-disciplinary teams; a culture of treatment over prevention; and weak overall patient management in primary care.
Estonia is using some of the tools the World Bank suggests. Current plans for health centres and hospital networks seek to create multi-disciplinary teams, to redefine the roles of family physicians vis-à-vis specialists and to improve training. There are also contracting mechanisms that may help to improve incentives and accountability for the provision of preventive services and outcomes. Nonetheless, there is still some way to go in achieving effectiveness and the challenges will not get any easier with the ageing of the population and the (associated) increase in (multiple) chronic diseases. Estonia may have to do still more and to consider strategies like the stratification of patients based on the complexity of their needs and establishing better patient pathways (World Bank, 2015).
5.2 ACCESSIBILITY
Decreasing health coverage is a reason for concernEntitlement is based on residence in Estonia and it is not possible to opt out of health insurance, at least in theory. The National Health Plan envisaged universal coverage by 2020 but the economic crisis halted improvements. In fact, the insurance rate has steadily decreased from 96% in 2009 to 94% in 2015. Who the 6% uninsured people are is not well understood. The Ministry is currently investigating this. It is suspected that they are mostly young men who are economically inactive or working abroad.
The uninsured are entitled to emergency care and some public health services (HIV/AIDS, tuberculosis, drug dependence) only. They are also eligible to take up voluntary coverage, as are residents with a pension from abroad and anyone who was enrolled for at least 12 months in the previous two years. However, the high monthly voluntary contribution of EUR 149 (2017), means that uptake is low.
Estonia has the highest level of unmet need in EuropeEstonians have reported increasing levels of unmet medical need since 2009, singling out especially dental and specialist care. In 2015, 12.7% of all Estonians reported unmet need for medical care (mainly because of waiting times, but also to a lesser extent because of cost or too long distance to travel), which was the highest in the EU. However, there is less variation across income quintiles than in other countries with high unmet need (Figure 11) because cost is not the main barrier to service use.
Only 0.7% of Estonians report costs as a barrier to access, and the same small proportion cite geographic reasons. In fact, waiting lists are the cause of unmet medical need (11.3%) and seem to impact on lower and poorer income groups. They were ‘run up’ in the aftermath of the financial crisis as a deliberate policy (also see Box 2) but also reflect on wider issues such as poor care coordination, misaligned incentives in primary care and poor linkages with social care.
The erosion of dental coverage and cash benefits were reversed in 2017The EHIF, the Ministry of Social Affairs and the Government define and agree on the benefits package and despite the financial crisis have been able to cover the provision of preventive and curative health services and medical devices. Although user charges were introduced or increased, they seem not to have led to barriers to access (see below). Pharmaceuticals, provided they are on the

12 . Performance of the health system
positive list, are reimbursed at a percentage of the cost less a flat rate prescription charge, although users do have to pay out-of-pocket expenses.
Cash benefits also compensate for the costs of adult dental care. Expenditure reduction measures reduced dental benefits and this is reflected in reports of unmet need. However, as of July 2017 these measures for dental care were reversed, and limited in-kind benefit for dental care was introduced for all population groups.
Increased cost-sharing seems not to translate into higher unmet needs for financial reasonsThe share of total health expenditure covered by out-of-pocket spending has been relatively stable in the last 10 years (around 22%, with a peak of 25% in 2006). In 2015 it was 23%, higher than the EU average (Figure 12) but consistent with the NHP, which stipulates that the share of out-of-pocket payments should remain below 25% of total health expenditure. Out-of-pocket payments as a share of household consumption, are slightly above the EU average – with Estonia at 2.7% compared to 2.3% in 2015. The largest share of out-of-pocket expense was for pharmaceuticals (42%), followed by dental care (31%).
Although co-payments were subject to various adjustments (mainly increases in 2012 and 2013), unmet need for medical care due to financial reasons reported in the lowest income quintile decreased by 6 percentage points between 2006 and 2015 and is now well below the EU average (2.1% vs 4.1%). Similarly, the proportion of all households reporting health-related catastrophic expenditure7 more than halved in the same time. Nevertheless, the financial burden of out-of-pocket payments is still skewed towards lower-income households.
STATE OF HEALTH IN THE EU: COUNTRY HEALTH PROFILE 2017 – ESTONIA
Esto
nia
Note: The data refer to unmet needs for a medical examination or treatment due to costs,
distance to travel or waiting times. Caution is required in comparing the data across countries
as there are some variations in the survey instrument used.
Source: Eurostat Database, based on EU-SILC (data refer to 2015).
Total population Low income
20
High income
100
Estonia
Greece
Romania
Latvia
Poland
Italy
Bulgaria
Finland
EU
Portugal
Lithuania
Ireland
United Kingdom
Hungary
Belgium
Slovak Republic
Croatia
Cyprus
Denmark
France
Sweden
Luxembourg
Czech Republic
Malta
Spain
Germany
Netherlands
Slovenia
Austria
% reporting unmet medical need, 2015
Figure 11. Estonians of all incomes face high levels of unmet need
7. Catastrophic expenditure is defined as household out-of-pocket spending exceeding 40% of total household spending net of subsistence needs (i.e. food, housing and utilities).
BOX 2. THE ESTONIAN HEALTH SYSTEM SHOWED RESILIENCE DURING THE 2008 FINANCIAL CRISIS
In 2009, the Estonian economy contracted by 14.1%. Unemployment rose from only 3.9% in 2007 to 19.8% in early 2010. Revenue from payroll contributions as well as tax revenues dropped dramatically (Van Ginneken et al., 2012). An austerity package was rolled out quickly. It involved some cuts in benefits and prices; increased cost-sharing; extended waiting times; increased VAT on medications; more rational use of medicines; a focus on primary and outpatient (and ambulatory) care; and a reduction in specialised care. Salaries were not explicitly cut but had to fall because of a drop in available
funding. European Structural Funds were used to offset some of the falls in public health funding and capital investment. The EHIF had learned from earlier crises and used the financial reserves it had accrued over the growth years to counter the effects of the current economic shock but also reduced temporary employment sick leave benefits (currently still in place). Yet some of the long-term effects may not be felt yet and to this day, Estonians report elevated levels of unmet need due to waiting times although these cannot be attributed solely to the financial crisis.

STATE OF HEALTH IN THE EU: COUNTRY HEALTH PROFILE 2017 – ESTONIA
Performance of the health system . 13
There is uncertainty about the health workforce long termA growing challenge is guaranteeing a sufficient level of human resources. Recent changes have enabled more substitution by increasing the role of nurses and midwives in health system organisation. Yet no clear plan exists on how to pursue this direction in the coming years. Furthermore, the workforce is ageing and the nurse to population ratio is declining (see Section 4). Shortages are mostly felt for family physicians and nurses. It has also become increasingly difficult to attract health professionals to rural areas because of budgetary constraints, and also because increasing workloads are particularly onerous for rural staff.
Medical training could move away from narrow disease-oriented specialisation to give more general skills or do more to promote continuous education as a way of re-skilling the workforce. There is also a need to develop a cohort of auxiliary professionals such as nutritionists and dieticians who can help combat the growing obesity challenge. If the Estonian system is to become resilient in terms of staffing it needs to tackle supply and skill sets and redesign incentives schemes to support its objectives, most urgently for family physicians.
Potential efficiency savings offer some, but not much, of a cushion against shock Although Estonia is more efficient on most metrics than its Baltic neighbours, there is clearly still room to improve. This is despite the fact that the Estonian system has long seen efficiency as a priority (probably because of its narrow revenue base and limited ability to bring in additional funds). Although it is a rather blunt indicator,
Esto
nia
Public/Compulsaryhealth insurance
Out-of-pocket
EUEstonia
Other
Voluntary health insurance
79%
15%
5%
1%
76%
23%
1%
Source: OECD Health Statistics, Eurostat Database (data refer to 2015).
Figure 12. Out-of-pocket payments make up nearly one quarter of total health expenditure
5.3 RESILIENCE
Long-term stability of financing is a considerable challenge, although improvements are plannedThe sustainability of Estonia’s health system financing has been a longstanding concern. Several reports (Võrk et al., 2005; Praxis, 2011; Thomson et al., 2010, 2011) have flagged the heavy dependence on earmarked payroll tax as source of revenue, which accounts for two thirds of total expenditure. This payroll tax, equal to 13% of wages, is raised from the (declining) working population and employers. It is vulnerable to economic shocks (see Box 2) and population ageing. The reports concluded that there is a need to broaden and diversify the public revenue base. Recently the government has agreed on a step-wise introduction of health insurance fund contributions on behalf of pensioners (rising to 13% of pensions in 2022).
Infrastructure is covered but without a long-term funding strategy Significant investment funding continues to rely on EU Structural Funds and these are central to modernising the health infrastructure. This explains why capital costs are not reimbursed from the state budget, although the law mandates this. This is a potential resilience issue in that the system is not as self-sufficient as it should be, nor is it working as it should.

Figure 13. Estonia could perform better in amenable mortality even with current spending
Source: OECD Health Statistics, Eurostat Database, WHO Global Health Expenditure Database (data refer to 2014).
ATBE
BGHR
CYCZ
DK
Estonia
FI
FR
DE
ELHU
IE
IT
LVLT
LU
MT
NL
PL
PT
RO
SK
SI
ES
SE
UK
0
1 000
2 000
3 000
4 000
5 000
6 000
0 50 100 150 200 250 300 350
Health expenditure per capita, EUR PPP
Amenable mortality per 100 000 population
14 . Performance of the health system
relating amenable mortality to health spending gives an initial insight into whether health care resources are generally used cost-effectively, but with the proviso that health behaviours as well as health system factors influence the level of amenable mortality. On this measure, Estonia performs better than its Baltic neighbours but the Croatian and Polish health systems achieve lower amenable mortality with similar spending levels (see Figure 13), so even under current budget pressures Estonia might do better.
Certainly, on various sources of inefficiency Estonia seems to be closing the gap with EU averages. The EHIF has been using the contracting system to set targets for greater use of outpatient care and day-care surgery with some real successes, like cataract surgery, 99% of which takes place in day care, making Estonia a top European performer. The average length of stay in hospital has decreased and now sits slightly below the European average (7.6 compared to 8 days) (2014), and hospital bed numbers have fallen (see Figure 14). There is still scope to make further efficiency gains if needed however, as some countries have markedly lower lengths of stay and acute bed numbers. Similarly, bed occupancy rates could improve as they are among the lowest in Europe at 67%. These indicators suggest that there is room to protect outputs by improving efficiency in the event of a further shock (although any bed cuts in rural areas ought not to compromise access to health services).
Efforts have been made to increase the use of genericsIn 2015, the volume of generics as a share of the total pharmaceutical market was 36%, which although well below top performers with the same indicator available (e.g. Slovak Republic (70%), Czech Republic (42%)) is a significant improvement on the past. Legislative changes in 2002 stimulated prescribing of generics and have improved value for money. Pharmaceuticals now account for 21.4% of total health expenditure, slightly above the EU average but well below the inflated burden of pharmaceutical spending (around 30%) that affects its Baltic neighbours (2014).
Estonia is pioneering e-health servicesEstonia has invested in e-health and is internationally recognised for its innovations. Most health care providers keep an electronic health record for patients and all health care providers are responsible for sending patient health and health care service provision information to the central health information system. This allows patients to access their health data and providers to access and exchange information with various, relevant databases. The system also allows e-consultations, digital referrals and e-prescriptions – virtually all prescriptions are electronic and pharmacists increasingly sell on-line. Several new applications are under development, including an electronic
STATE OF HEALTH IN THE EU: COUNTRY HEALTH PROFILE 2017 – ESTONIA
Esto
nia

BOX 3. THE NATIONAL HEALTH PLAN AS A TOOL FOR RESILIENCE
The general objective of the NHP is to increase the number of healthy years of life by reducing mortality and morbidity rates. It integrates values such as solidarity, equal opportunity and justice, access to high-quality health care services and empowering civil society. Performance indicators are in place to allow the monitoring of progress and measurable targets defined for four-year cycles leading to 2020. In addition, measurable targets have been set for specific health sectors such as HIV/AIDS, cancer and hospitals (the separate 2016 Hospital Master Plan).
STATE OF HEALTH IN THE EU: COUNTRY HEALTH PROFILE 2017 – ESTONIA
Performance of the health system . 15
immunisation passport, a central digital registration system for outpatient care and, since 2016, a facility to provide access to claims and costs. The use of the platform has increased rapidly with 4.5 million enquiries from the patient portal to the e-health system in the first 4 months of 2017 compared to 0.5 million in 2011. There is nonetheless scope for further improvement, particularly with regard to better use of the data for service integration, clinical decision-making and outcomes measurement.
The National Health Plan could be improved and become a more effective strategic planning tool The main health strategy in Estonia is the 2012 NHP and ought to provide a springboard for responding to changed circumstances (Box 3). However, an evaluation in 2017 found that the NHP has not been an effective tool for overall strategic planning. As inconsistencies exist between the different sectoral strategies stronger sub-strategies are needed to provide further guidance in line with overall NHP goals. In fact, three 2014 multisectoral green papers on drugs, alcohol and tobacco, have been more effective in producing actual policies.
Accountability mechanisms could be enhanced Accountability is important to the strength of the health system and although there are mechanisms in place they are not used consistently or managing to achieve all that they might on quality
and health outcomes. The first national health system performance assessment was published in 2010 (Lai, Veillard and Bevan, 2010) and although regular performance assessments were planned they have never materialised. They have not therefore contributed to NHP planning or to holding stakeholders accountable. There is also a need to enhance the evaluation of provider activity and to use monitoring tools across the health system to improve quality and health outcomes. Investments in the e-health system may play a critical role here by facilitating better exchange of information and increased accountability (Lai et al., 2015; World Bank, 2015).
Esto
nia
Note: There is a break in these two series in 2013.
Source: Eurostat Database.
Beds per 1 000 population
20042003200220012000 2005 2006 2007 2008 2009 2010 2011 2012 2013 2014 2015
ALOS (days)Hospital beds Average length of stay in hospital
4
5
6
7
8
9
10
4
5
6
7
8
9
10
Figure 14. Average length of stay and beds have fallen but could improve further

16 . Key findings
lEstonians have witnessed the strongest gains in life
expectancy of all EU countries, particularly after age
65 but these years gained are spent in worse health
than elsewhere in the EU. Deaths from cardiovascular
diseases have fallen sharply, but along with cancer and
external causes remain the leading causes of mortality.
The proportion of people reporting that they are in good
health is among the lowest in the EU, with the largest gap
between rich and poor of any country.
lUnhealthy lifestyles persist in Estonia despite recent
improvements and with large disparities between
socioeconomic groups. Men are particularly exposed to
risk factors. There are policies on smoking, drinking and
more recently obesity (nutrition and physical activity
green paper, sugar tax) but these may need more time
to take effect and could be better targeted at vulnerable
groups.
lAmenable mortality rates in Estonia for both men and
women have fallen sharply since 2000 but remain above
the European average, while 30-day fatality for acute
myocardial infarction and stroke, are among the worst in
Europe. Furthermore, a large proportion of acute inpatient
care could be ‘avoided’ by moving it to more appropriate
settings and by managing people with non-communicable
diseases better (i.e. through more integrated care). There
is clearly substantial room for improving health service
effectiveness and quality although this is well recognised
and recent Estonian reforms focus on establishing multi-
disciplinary health centres in primary care and creating
networks of hospitals.
lAccess to health care could be improved substantially.
Some 6% of the population have no insurance. It is
unclear who these people are but an investigation is
underway. Estonia also has the highest level of unmet
need for medical care, albeit with little variation across
income groups compared to other countries high with
unmet need. This is mostly caused by waiting times,
which may also reflect on poor coordination and
integration. More positively, the erosion of dental coverage
and cash benefits as part of fiscal consolidation were
rolled back early in 2017.
lHealth system resilience remains a considerable
challenge. Estonia is a low spender on health and draws
from a narrow revenue base (payroll contributions),
making it vulnerable to economic shocks and population
ageing. This should change with the gradual phasing in
of government contributions on behalf of pensioners.
Providers are also dependent on external (European)
funding for capital investments, rather than seeking self-
sufficiency. Furthermore, deteriorating health workforce
ratios and regional shortages jeopardise resilience and
require a long-term strategy that will train more family
physicians but also shift the focus from a narrow disease
orientation to more multidisciplinary skills, and revise
incentive schemes.
lEven though the Estonian health system is comparatively
efficient on a number of indicators, with relatively high
generic penetration and great use of day care surgery,
several indicators (average length of stay, occupancy
rates, bed numbers) suggest that there is significant room
to improve. To this end, the National Health Plan could be
revised to become less of a budgetary tool and more a
means for planning activities, defining measurable targets
and holding stakeholders accountable.
6 Key findings
STATE OF HEALTH IN THE EU: COUNTRY HEALTH PROFILE 2017 – ESTONIA
Esto
nia

Lai, T. et al. (2013), “Estonia: Health System Review”, Health Systems in Transition, Vol. 15(6), pp. 1-196
Atun, R. et al. (2016), “Shifting Chronic Disease Management from Hospitals to Primary Care in Estonian Health System: Analysis of National Panel Data”, Journal of Global Health, Vol. 6(2), 020701.
ECDC (2017). Tuberculosis surveillance and monitoring in Europe, 2017. European Centre for Disease Prevention and Control, Stockholm
Habicht, T., J. Habicht and E. van Ginneken (2015), “Strategic Purchasing Reform in Estonia: Reducing Inequalities in Access While Improving Care Concentration and Quality”, Health Policy, Vol. 119(8), pp. 1011–1016.
Health Board (2017), http://www.terviseamet.ee/tervishoid/tervishoiutoeoetaja-registreerimine/tervishoiutoeoetajate-migratsioon.html, http://www.terviseamet.ee/fileadmin/dok/Terv
IHME (2016), “Global Health Data Exchange”, Institute for Health Metrics and Evaluation, available at http://ghdx.healthdata.org/gbd-results-tool.
Kringos, D. et al. (2013), “The Strength of Primary Care in Europe: An International Comparative Study”, British Journal of General Practice, Vol. 63(616), pp. e742-e750, http://dx.doi.org/10.3399/bjgp13X674422.
Lai, T. et al. (2015), “Estonia Country Assessment. Better Non-communicable Disease Outcomes: Challenges and Opportunities for Health Systems”, World Health Organization, http://www.euro.who.int/__data/assets/pdf_file/0011/292781/Better-NCD-outcomes-challenges-opportunityes-HSS-Estonia-en.pdf?ua=1.
OECD/EU (2016), Health at a Glance: Europe 2016: State of Health in the EU Cycle, OECD Publishing, Paris, http://dx.doi.org/10.1787/9789264265592-en.
Lai, T., J. Veillard and G. Bevan (2010), “Estonia, Health System Performance Assessment: 2009 Snapshot”, WHO Regional Office for Europe and Estonian Ministry of Social Affairs, Copenhagen.
Praxis (2011), “Eesti sotsiaalkindlustussüsteemi jätkusuutliku rahastamise võimalused”, Poliitikauuringute Keskus Praxis, Tallinn, http://www.praxis.ee/fileadmin/tarmo/Projektid/Tervishoid/Eesti_tervishoiu_rahastamise_jatkusuutlikkus/Eesti_sotsiaalkindlustussuesteemi_jaetkusuutliku_rahastamise_voimalused_taeisversioon.pdf.
Thomson, S. et al. (2010), Responding to the Challenge of Financial Sustainability in Estonia’s Health System, WHO Regional Office for Europe, Copenhagen.
Thomson S et al. (2011), Responding to the Challenge of Financial Sustainability in Estonia’s Health System: One Year On. Copenhagen, WHO Regional Office for Europe.
van Ginneken, E. et al. (2012), “The Baltic States: Building on 20 Years of Health Reforms”, British Medical Journal, Vol. 345, e7348, http://dx.doi.org/10.1136/bmj.e7348.
Võrk, A. et al. (2005), “Eesti tervishoiu rahastamissüsteemi jätkusuutlikkuse analüüs”, Poliitikauuringute Keskus Praxis, Tallinn, http://www.praxis.ee/fileadmin/tarmo/Projektid/Tervishoid/Eesti_tervishoiu_rahastamise_jatkusuutlikkus/PRAXIS2005_THrahastamine_loppdokfinal0.pdf.
World Bank (2015), The State of Health Care Integration in Estonia. Summary Report, World Bank Group, https://www.haigekassa.ee/sites/default/files/Maailmapanga-uuring/summary_report_hk_2015.pdf.
Key sources
References
Austria AT Denmark DK Hungary HU Malta MT Slovenia SIBelgium BE Estonia EE Ireland IE Netherlands NL Spain ESBulgaria BG Finland FI Italy IT Poland PL Sweden SECroatia HR France FR Latvia LV Portugal PT United Kingdom UKCyprus CY Germany DE Lithuania LT Romania RO Czech Republic CZ Greece EL Luxembourg LU Slovak Republic SK
Country abbreviations

on Health Systems and Policies
European
a partnership hosted by WHO
State of Health in the EUCountry Health Profile 2017The Country Health Profiles are an important step in the European Commission’s two-year State of Health in the EU cycle and are the result of joint work between the Organisation for Economic Co-operation and Development (OECD) and the European Observatory on Health Systems and Policies. This series was co-ordinated by the Commission and produced with the financial assistance of the European Union.
The concise, policy relevant profiles are based on a transparent, consistent methodology, using both quantitative and qualitative data, yet flexibly adapted to the context of each EU Member State. The aim is to create a means for mutual learning and voluntary exchange that supports the efforts of Member States in their evidence-based policy making.
Each Country Health Profile provides a short synthesis of:l health status l the determinants of health, focussing on behavioural risk
factorsl the organisation of the health systeml the effectiveness, accessibility and resilience of the health
system
This is the first series of biennial country profiles, published in November 2017. The Commission is complementing the key findings of these country profiles with a Companion Report.
For more information see: ec.europa.eu/health/state
Please cite this publication as:
OECD/European Observatory on Health Systems and Policies (2017), Estonia: Country Health Profile 2017, State of Health in the EU, OECD Publishing, Paris/European Observatory on Health Systems and Policies, Brussels.http://dx.doi.org/10.1787/9789264283350-en
ISBN 9789264283350 (PDF)
Series: State of Health in the EUISSN 25227041 (online)