state of forests and reddpublications.jrc.ec.europa.eu/repository/bitstream/jrc... ·...
TRANSCRIPT

Funded by the European Union
State of Forests and REDD+ Activities
in Continental South-East Asia
A project implemented by FCG International, Forest Carbon, kartECO and VAFS

Page 1 of 99
This publication was produced with the financial support of the European Union. Its contents
are the sole responsibility of the consortium consisting of FCG International (Lead Partner)
and Forest Carbon and kartECO (Partners) and do not necessarily reflect the views of the
European Union.
EU Science Hub
https://ec.europa.eu/jrc
JRC110760
PDF ISBN 978-92-79-79976-1 doi:10.2760/58969
Luxembourg: Publications Office of the European Union, 2018
© European Union, 2018
Reuse is authorised provided that the source is acknowledged. The reuse policy of European
Commission documents is regulated by Decision 2011/833/EU (OJ L 330, 14.12.2011, p. 39).
For any use or reproduction of photos or other material that is not under the EU copyright,
permission must be sought directly from the copyright holders.
Pictures in order: Forest Carbon – Kyle Hemes – Minh Hoa District, Quang Binh Province, Vietnam, 2013.
Forest Carbon – Jeremy Ferrand – Lamam District, Sekong Province, Laos, 2016.
Forest Carbon – Chanthavone Phomphakdy, Paksong District, Champasak Province, Laos 2015.
Wildlife Conservation Society Cambodia, 2017.
Forest Carbon – Jeremy Ferrand – Nakai District, Khammouane Province, Laos, 2017.
Forest Carbon – Jeremy Ferrand – Tuyen Hoa District, Quang Binh Province, Vietnam, 2013.
How to cite this report: Ferrand, J., Härkönen, J., Moore, C., Tsiros, E., and Luu, T.C.
Publications Office of the European Union, Luxembourg, 2018, ISBN 978-92-79-79976-1,
doi:10.2760/58969, JRC110760

Page 2 of 99
Ferrand, J.2, Härkönen, J. 1, Moore, C. 2, Tsiros, E. 3, and Luu, T.C. 4
1 FCG International Ltd (FCG), Osmontie 34, Helsinki, 0061O – Finland. E-mail:
2 PT Forest Carbon Consultants Indonesia (Forest Carbon), Gedung Manggala Wanabakti
Block IV, Floor 6, Wing B Nr. 614 Jl. Gatot Subroto Senayan, Central Jakarta 10270,
Indonesia. E-mail: [email protected]
3 KARTERIS APOSTOLOS - KARTERIS MARINOS OE (kartECO - Environmental & Energy
Engineering Consultancy), Philippos Business Center, Ag. Anastasias & Laertou str, 57001,
Thessaloniki, PO Box 60824, Greece. E-mail: [email protected]
4 Vietnamese Academy of Forest Sciences (VAFS), Silviculture Research Institute, Dong
Ngac Commune, Tu Liem District, Hanoi, Vietnam. E-mail: [email protected]
Service contract to support the establishment of a prototype of a regional forest
observatory in continental South-East Asia, including the countries of Cambodia, Laos,
Myanmar/Burma, Thailand and Vietnam.
EuropeAid/137722/DH/SER/MULTI 31 March 2018
State of Forests and REDD+ Activities
in Continental South-East Asia

Page 3 of 99
Abstract
The Regional Forest Observatory in Continental South-East Asia (RFO-SEA) is a platform that
acts as an information repository (database and website) for exchanging knowledge and
information related to monitoring and reporting on forests in the context of REDD+, as well
as the EU Forest Law Enforcement, Governance and Trade (FLEGT) program. More
specifically, the RFO-SEA, which at this stage covers the countries of Cambodia, Laos,
Myanmar, Thailand and Vietnam, provides information and figures related to the status of
forest cover, forest condition and REDD+ implementation at national and regional levels, as
well as a summary of the identified drivers of forest cover change in each country.
Utilizing the platform, the RFO-SEA project has produced a Report of the State of Forests and
REDD+ in Continental South-East Asia. This report leverages the data and information
contained in the RFO-SEA to describe the forest status and progress of REDD+
implementation at national and regional levels. The report showcases the types of
information that can be gleaned from the observatory and gives practitioners involved in
forest monitoring and REDD+ an understanding of forest status and REDD+ activities in the
region. Target stakeholders of the RFO-SEA are national institutions involved in forest
monitoring, management and REDD+, as well as development agencies, NGOs and
research institutions involved in the REDD+ process.
Key words: forest observatory, REDD+, forest cover, FLEGT (Forest Law Enforcement,
Governance and Trade), database, continental South-East Asia
Acknowledgement
This publication was produced through financial support from the European Union and
technical support provided by the EC Joint Research Centre (JRC). We are especially
thankful for the expertise provided by Hans-Jürgen Stibig from JRC which greatly assisted
our work and his efforts to connect us with ReCaREDD (Strengthening National and Regional
Capacities for Reporting on the Mitigation Actions of the Forest Sector), a project
implemented by JRC in South-East Asia and other tropical regions. We are also grateful to
Vu Tan Phuong, Tran Lam Dong, Hoang Nguyen Huy, Pham Tiem Dung and Phung Dinh
Trung from the Vietnamese Academy of Forest Sciences (VAFS), together with Aapo
Kuusela, who contributed to the establishment and hosting of the database and website of
the Regional Forest Observatory in Continental South-East Asia (RFO-SEA), and Ioannis
Kapanidis who designed the layout of the document.

Page 4 of 99
Executive Summary
Background
The European Commission, through the Joint Research Centre (JRC), has conducted the
ReCaREDD project (Strengthening Regional Capacities for REDD+) in Cambodia, Laos and
Vietnam since 2013. It provides technical support and training in remote sensing
methodologies to national technicians involved in forest monitoring and REDD+. To
complement these activities, ReCaREDD has launched a pilot phase to develop a
prototype of the Regional Forest Observatory for South-East Asia (RFO-SEA). For this
prototyping phase, the geographical focus of the observatory is on continental South-East
Asia, covering the countries of Cambodia, Laos, Myanmar, Thailand and Vietnam.
The RFO-SEA, developed during 2016 – 2018, provides information and figures related to the
status of forest cover and REDD+ implementation at national and regional levels as well as
a summary of the identified drivers of forest cover change in each country included in the
database. The RFO-SEA contents are freely accessible through the website www.rfo-
sea.org.
Utilizing the platform, the RFO-SEA project has produced a Report of the State of Forests and
REDD+ in Continental South-East Asia. This report leverages the data and information
contained in the RFO-SEA to describe forest status and REDD+ at national and regional
levels in continental South-East Asia. The intent of this report is to demonstrate the utility of
the RFO-SEA by showcasing the types of information that can be gleaned from the
observatory and give all practitioners involved in forest monitoring and REDD+ an
understanding of forest status and REDD+ activities in the region. This first report is intended
to serve as precursor for potential regular reporting.
Forests of South-East Asia
Forests produce a number of ecosystem benefits, covering goods and services that benefit
people in different ways. These benefits include i) provisioning services (forest goods); ii)
regulating and supporting services related to water, soil, climate, agriculture and
biodiversity conservation; and iii) cultural services.
Provisioning services, often referred as forest goods, cover timber, fuelwood and non-timber
forest products such as food, fiber, and medicinal plants. In continental SE Asian countries
these valuable NTFPs include, for instance pine resin, rattan and medicinal plants. These
forest goods often create the foundation in South-East Asia for rural livelihoods, SMEs and
industry in related processing and marketing sectors.
Additionally, forests produce important regulating and supporting services having effects
on the qualities of land, watercourses, atmosphere and biological resources. As elsewhere,
in South East Asia these services refer to water, soil, climate, agriculture, biodiversity
conservation and cultural services. In the context of climate change, forests work as a
carbon sink - they do not only store carbon but continue to sequester it from the
atmosphere.
Forests play a significant role in South-East Asia by hosting a home to a rich array of flora
and fauna, providing essential resources to the local communities, while also providing

Page 5 of 99
timber for domestic use and local or international trade. As an example, in a country like
Laos, 80% of the population rely on forest resources. Also, the forests of South-East Asia are
often qualified as some of the most species-rich in the world.
According to FAO statistics (FAO-FRA 2015), the forest area of the five countries covered by
the RFO-SEA is 884,310 km2, covering 46% of the land area of these countries (Cambodia
54%, Laos 81%, Myanmar 44%, Thailand 32% and Vietnam 48%). However, there is a growing
pressure on forests and forest land due to the increasing demand for land and natural
resources directly linked to population growth, infrastructure development, and the
expansion of industrial agriculture. For instance, the road net development by providing
access to markets and remote resources, has also increased opportunities for investment
and trade, as well as facilitated the encroachment of loggers or agribusinesses. This issue
particularly affects the northwest and southern parts of Laos and northeast Cambodia.
The establishment of cash crop plantations has become a primary driver of forest
conversion in Southeast Asia. In the Mekong region, the production of rubber, cashew nuts,
coconut and sugar cane has been a major cause of forest conversion while in coastal areas
shrimp ponds and agriculture have resulted in the loss of mangroves. In southern Thailand
and southern Myanmar, oil-palm plantation establishment has also been an important
cause of forest conversion.
As per FAO-FRA 2015, between 2005 and 2015, only Cambodia and Myanmar suffered
ongoing forest loss, while Laos and Vietnam experienced forest gains. Thailand’s total forest
area remained relatively constant during this period. It should be noted, however, that the
FAO FRA report is based on self-reported data from each country. Additionally, even the
RFO-SEA countries with a stable or increasing forest cover are faced with the loss of natural
forests while forest plantation areas increase.
The global land cover maps and datasets produced by the Climate Change Initiative Land
Cover project (CCI-LC) of the European Space Agency indicate that the forest cover
consistently decreased in Cambodia over the period of 2000 – 2015. Forest loss occurred
between 2000 and 2010 also in Laos and Myanmar, before stabilizing for 2010 – 2015. In
Thailand, forest cover decreased between 2000 and 2005 but has steadily increased after
this year. In Vietnam, forest loss occurred during the first period from 2000 to 2005, but the
forest area has mostly been stable after this.
While the trends from national datasets should be considered the most authoritative, the
regional datasets still provide value with respect to viewing forest losses and gains across
the region through a consistent analytical lens.
Regional REDD+ developments
Vietnam and Cambodia are the most advanced in the region with respect to REDD+
implementation. Both countries benefited from receiving early stage REDD+ readiness
support from the UN-REDD programme in addition to the Forest Carbon Partnership Facility
(FCPF) from whom both countries have received additional readiness funding in addition to
the initial US$3.6 million readiness grant. Both of the countries have developed national
REDD+ strategies, identified implementation arrangements for REDD+, and developed and
officially submitted their country’s Forest Reference Emission Level (FREL) to the UN
Framework Convention on Climate Change (UNFCCC). They still need to better articulate

Page 6 of 99
the Safeguards Information Systems (SIS) and further develop their National Forest
Monitoring Systems (NFMS).
Laos and Myanmar are slightly further behind Vietnam and Cambodia when it comes to
REDD+ readiness. While the institutional arrangements for REDD+ are in place in both of the
countries, they are still undertaking the analytical steps to develop their national REDD+
strategies, develop their Forest Reference Emission Levels (FREL), finalize the safeguard
assessments as well as develop their NFMS. Currently Laos is developing its national REDD+
strategy with a draft available for public viewing likely to emerge in early 2018. Both of the
countries will submit FRELs to the UNFCCC for technical assessment in early 2018, while the
development of the NFMS will continue throughout 2018.
Thailand is the furthest behind of the five countries with respect to REDD+ readiness. While
its REDD+ institutions have been established these have met infrequently and primarily only
in the context of developing the country’s Readiness Plan Idea Note (R-PIN) and Readiness
Preparation Proposal (R-PP). Work to develop the country’s main REDD+ components is
expected to begin in 2018 once R-PP grant funding is released for technical assistance
support.
Regional EU FLEGT developments
The EU Forest Law Enforcement, Governance and Trade (EU FLEGT) Action Plan was
established in 2003 aiming to reduce illegal logging by strengthening sustainable legal forest
management, improving governance and promoting trade of legally produced timber. In
developing countries, this principally takes the form of a Voluntary Partnership Agreement
(VPA), a legally binding trade agreement, between the EU and the timber-producing
country outside the EU to ensure that timber and timber products exported to the EU come
from legal sources, while also engendering improvements in regulation and forest
governance within the timber-producing country.
Of the five RFO-SEA target countries, Myanmar and Cambodia are still at an early stage in
the FLEGT process, focusing on information and consensus building. Myanmar entered the
preparation stage for the VPA in 2015, thereafter improving the design of its Myanmar
Timber Legality Assurance System (MTLAS) through the commissioning of a gap analysis and
initiating in-country dialogues on the VPA process with a broad set of national stakeholders.
In Cambodia, the VPA process is even at an even earlier stage with the current focus being
on building internal capacity to engage with the VPA process.
Laos, Thailand and Vietnam have progressed to formal negotiations on the VPA with the
EU. Laos initiated these negotiations in April 2017, aiming at the completion of this stage still
during 2018. Thailand on the other hand started its negotiations in 2013 but due to political
instability, these were put on hold until recently; in June 2017, negotiations resumed.
Vietnam is the most advanced of the RFO-SEA target countries with its VPA initialled in May
2017. Following this, the EU and Vietnam commenced a final review of the VPA text and
annexes to start the procedures to ratify the VPA in 2018.
Information repository
RFO-SEA information repository user-interface is available at http://www.RFO-
SEA.org/geonetwork/. It has been built using GeoNetwork application with modifications to
comply with the RFO-SEA requirements. GeoNetwork user interface is straightforward and

Page 7 of 99
easy to use for end users. Users can upload new data to the information repository database
through the user interface without complex database scripts. The interface also has a
powerful search tool embedded, which allows users to easily find the data that they are
looking for in the database.

Page 8 of 99
Abbreviations and Acronyms
CARPE Central Africa Regional Program for the Environment (USAID)
CCBC Climate, Communities, and Biodiversity Certification
CCR Climate Change Response
CMS Content Management System
COP The United Nations Climate Change Conference / Conference of the Parties
DEVCO Directorate-General for International Cooperation and Development (of
European Commission)
DMP Data Management Plan
ECD European Commission Delegation
EIA Environmental Impact Assessment
ER-PD Emission Reduction Program Document
ER-PIN Emissions Reduction Project Idea Note (ERPIN)
ESMF Environment and Social Management Framework
EU European Union
FC Forest Carbon (PT Forest Carbon Consultants Indonesia)
FCG Finnish Consulting Group (FCG International)
FCPF Forest Carbon Partnership Facility
FFI Flora & Fauna International
FLEGT Forest Law Enforcement, Governance, and Trade
FMU Forest Management Unit
FORMIS Forest Management Information Systems Project
FREL Forest Reference Emission Level (FRL)
GIS Geographical Information System
GHG Green House Gas(es)
ICT Information and communications technology
JRC Joint Research Centre (the European Commission's science and knowledge
service)
JV Joint Venture
LED Low-Emission Development
LULUCF Land Use, Land Use Change, Forestry

Page 9 of 99
LUP Landuse Plan(ning)
M&E Monitoring and Evaluation
MONREC Ministry of Natural Resources and Environmental Conservation (of Myanmar)
MRV Measurement, Reporting and Verification
NFI National Forest Inventory
NFIS National Forest Inventory and Statistics
NGO Non-Government Organization
OFAC Observatoire des Forêts d’Afrique Centrale (Observatory of Central African
Forests)
PA Protected Areas (The Law on Protected Areas , Cambodia)
PHP An open-source server-side scripting language
ReCaREDD Strengthening National and Regional Capacities for Reporting on the
Mitigation Actions of the Forest Sector
REDD Reducing Emissions from Deforestation and Forest Degradation in
Development Countries
REDD+ Reducing Emissions from Deforestation and Forest Degradation, and foster
conservation, sustainable management of forests, and enhancement of
forest carbon stocks
RFO Regional Forest Observatory
REL Reference Emission Level
R-PP Readiness Preparation Proposal (to FCPF)
SEA South-East Asia
SESA Strategic Environmental and Social Assessment
SME Small and Medium Sized Enterprises
SRV Socialist Republic of Vietnam
TOR Terms of Reference
TmFO The Tropical managed Forest Observatory
UNFCCC UN Framework Convention on Climate Change
UN-REDD The United Nations Collaborative Programme on Reducing Emissions from
Deforestation and Forest Degradation in Developing Countries
USAID United States Agency for International Development
VAFS Vietnamese Academy of Forest Sciences
VPA (FLEGT) Voluntary Partnership Agreement

Page 10 of 99
Contents
Abstract 3
Acknowledgement 3
Executive Summary 4
Abbreviations and Acronyms 8
Contents 10
List of Figures, Tables and Boxes 12
1 Introduction 15
1.1 Background 15
1.2 Objectives of the Regional Forest Observatory 16
1.3 Report of the State of the Forest in continental South-East Asia 16
2 Regional Forest Observatory for South-East Asia (RFO-SEA) 17
3 Forests of South-East Asia 19
3.1 Values of forests in South-East Asia 19
3.2 State of the forests 21
3.3 Regional REDD+ developments 27
3.4 Regional EU FLEGT developments 29
4 NATIONAL STATUS: Cambodia 31
4.1 Institutional context 31
4.2 REDD+ and EU FLEGT National status 32
4.3 Forest management and conservation 34
4.4 Drivers of forest change 35
4.5 Forest status 37
5 NATIONAL STATUS: Laos 42
5.1 Institutional context 42
5.2 REDD+ and EU FLEGT National status 43

Page 11 of 99
5.3 Forest management and conservation 46
5.4 Drivers of forest change 48
5.5 Forest status 49
6 NATIONAL STATUS: Myanmar 58
6.1 Institutional context 58
6.2 REDD+ and EU FLEGT National status 58
6.3 Forest management and conservation 60
6.4 Drivers of forest change 62
6.5 Forest status 63
7 NATIONAL STATUS: Thailand 68
7.1 Institutional context 68
7.2 REDD+ and EU FLEGT National status 69
7.3 Forest management and conservation 70
7.4 Drivers of forest change 71
7.5 Forest status 72
8 NATIONAL STATUS: Vietnam 76
8.1 Institutional context 76
8.2 REDD+ and EU FLEGT National status 77
8.3 Forest management and conservation 81
8.4 Drivers of forest change 84
8.5 Forest status 85
9 Information Repository 92
9.1 Interface and use 92
9.2 Content by country and type 93
10 Conclusion 95
11 References 96

Page 12 of 99
List of tables, figures and boxes
List of tables
Table 1. Forest area in 2005, 2010 and 2015 22
Table 2. Forest cover area from 2000 to 2015 from CCI-LC maps 24
Table 3 Key Active Multi/Bilateral REDD+ & FLEGT initiatives: Cambodia 34
Table 4. Forest definition in Cambodia 37
Table 5. Forest types in Cambodia 37
Table 6. Forest status summary for Cambodia 39
Table 7. Estimation of above ground biomass (tC/ha) by forest types in
Cambodia 40
Table 8. Carbon pools considered to calculate Cambodia’s FRL 41
Table 9 Total Annual CO2 Emissions and Removals (t CO2 / year) FRL
reference period 41
Table 10 Key Active Multi/Bilateral REDD+ & FLEGT initiatives: Laos 45
Table 11. Forest categories in Laos according to 2007 Forestry Law 46
Table 12. Summary of forest category areas managed at national level in Laos 47
Table 13. Forest definition in Laos 49
Table 14. Land and forest classification system in Laos 49
Table 15. Forest status summary for Laos 53
Table 16. Historical area of stratified land cover in Laos 54
Table 17. Activity data per period in Laos 54
Table 18. Description of Activity Data for Laos 55
Table 19. Carbon pools considered in calculation of FREL/FRL in Laos 56
Table 20. Proposed FREL/FRL for Laos 56
Table 21. Carbon stocks per strata 57
Table 22 Key Active Multi/Bilateral REDD+ & FLEGT initiatives: Myanmar 59
Table 23. Forest categories area in Myanmar 60
Table 24. Forest definition in Myanmar 63
Table 25. Forest cover summary for Myanmar 66
Table 26. Carbon pools considered in Myanmar for the calculation of FREL/FRL 66

Page 13 of 99
Table 27 Key Active Multi/Bilateral REDD+ & FLEGT initiatives: Thailand 70
Table 28. Forest area under DNP, RFD and MoA jurisdiction 70
Table 29 Forest definition in Thailand 72
Table 30. Forest cover summary for Thailand 74
Table 31 Key Active Multi/Bilateral REDD+ & FLEGT initiatives: Vietnam 80
Table 32. Breakdown of forest categories by forest type 82
Table 33 Breakdown of forest management entities 83
Table 34. Forest definition in Vietnam 85
Table 35. Forest types in Vietnam 86
Table 36. Forest cover summary for Vietnam 87
Table 37. Historical forest cover area in Vietnam 89
Table 38. Carbon pools considered in Vietnam for FREL/FRL 90
Table 39. Carbon stock per forest type in Vietnam 91
Table 40. Main document of the information repository 93
List of figures
Figure 1. Land cover 2015 23
Figure 2. Deforestation and reforestation 2000-2015 from CCI Landcover maps 25
Figure 3. Three phases of REDD+ 28
Figure 4. Summary of the EU FLEGT VPA process 29
Figure 5. Protected areas in Cambodia 35
Figure 6. Drivers of forest change in Cambodia 36
Figure 7. Land cover 2014 in Cambodia 38
Figure 8. Forest cover change in Cambodia from 2005 to 2014 39
Figure 9. Forest cover change 2010-2014 in Cambodia 40
Figure 10. Map of forest categories in Laos 47
Figure 11. Direct drivers of forest cover change in Laos 48
Figure 12. Indirect drivers of forest cover change in Laos 48
Figure 13. Slash-and-burn cycle and land/forest classes 51

Page 14 of 99
Figure 14. Forest and Land cover map 2015 - Laos 52
Figure 15. Map of Activity Data in Laos for the period 2005-2010 and 2010-2015 55
Figure 16. Map of forest category in Myanmar 61
Figure 18. Drivers of forest change in Myanmar 62
Figure 18. Myanmar historical forest cover maps 64
Figure 19. Map of forest cover change in Myanmar between 2002 and 2014 65
Figure 20. Drivers of forest change in Thailand 72
Figure 21. Forest cover map of Thailand in 2016 75
Figure 22. Map of forest category in Vietnam 82
Figure 23. Drivers of forest change in Vietnam 84
Figure 24. Map of forest status in Vietnam in 2016 88
List of boxes
Box 1. Wood and wooden products export of Vietnam 20
Box 2. Forest Reference Level (FRL) and Forest Reference Emission Level
(FREL) 27

Page 15 of 99
1 Introduction
1.1 Background
Reducing emissions from deforestation and forest degradation (REDD+) is a mechanism
developed by Parties to the United Nations Framework Convention on Climate Change
(UNFCCC). Cambodia, Laos, Myanmar, Thailand and Vietnam are all in the process of
establishing national REDD+ programs to address the impacts that changes in land-use and
forest management are having on climate change, biodiversity conservation, and the
livelihoods of forest dependent communities. To better understand the contribution of
REDD+ interventions on reductions in GHG emissions – and for reporting on the latter – these
countries, as well as sub-national REDD+ programs are required to collect, process and
analyse various datasets (satellite imagery, forest inventories, drivers of deforestation,
mitigation activities, etc.) to establish their Forest Reference Emission Levels (FRELs) and
Monitoring, Reporting and Verification (MRV) systems. Doing this, however, is hindered by
the ability of governmental, non-governmental, multilateral and civil society organizations
to produce, access and share existing and emerging REDD+ relevant information and
datasets.
The European Commission, through the Joint Research Centre (JRC), has conducted the
ReCaREDD project (Strengthening Regional Capacities for REDD+) in Cambodia, Laos and
Vietnam since 2013. It provides technical support and training in Remote Sensing
methodologies to national technicians involved in forest monitoring and REDD+ in these
countries. To complement these activities, ReCaREDD has launched a pilot phase to
develop a prototype of a Regional Forest Observatory.
A consortium led by FCG International (FCG), in partnership with kartECO and Forest
Carbon, has developed the observatory in collaboration with the Vietnamese Academy of
Forest Science (VAFS).

Page 16 of 99
For this prototyping phase, the geographical focus of the observatory is on continental
South-East Asia, namely in Cambodia, Laos, Myanmar, Thailand and Vietnam.
1.2 Objectives of the Regional Forest Observatory
The Regional Forest Observatory for South-East Asia (RFO-SEA) is a regional platform that
acts as an information repository (database and website) for exchanging knowledge and
information related to monitoring and reporting on forests in the context of REDD+, including
aspects related to the EU Forest Law Enforcement, Governance and Trade (FLEGT)
program. The targeted stakeholders are the national institutions involved in forest monitoring
and management as well as REDD+, but also other stakeholders involved in the REDD+
process, including, for instance NGOs and research institutes.
1.3 Report of the State of Forests and REDD+ in continental South-East Asia
This report, leverages the data and information contained in the RFO-SEA to describe forest
status and REDD+ at national and regional levels in continental South-East Asia. The intent
of this report is to demonstrate the utility of the RFO-SEA by showcasing the types of
information that can be gleaned from the observatory and give all practitioners involved in
forest monitoring and REDD+ an understanding of forest status and REDD+ activities in the
region. This first report is intended to serve as a precursor for potential regular reporting on
the status of regional forest cover and REDD+ for the region. As a tangible output of the
RFO-SEA, the report will act as a communication tool to engage with stakeholders.
Following this Introduction, Section 2 provides greater detail on the history and objectives of
the RFO-SEA. Section 3 then provides a regional overview on: (i) the importance of forests
in S.E. Asia; (ii) forest cover status; and (iii) the status of REDD+ and FELGT implementation.
Sections 4 through 8 describe the status of forest management, REDD+ implementation and
forest cover in each of the five countries covered by the RFO-SEA before describing the
contents of the RFO-SEA’s Information Repository in Section 8 and offering some concluding
remarks in Section 9.
To quantify forest cover at the regional level, the report uses a global forest cover map to
give a consistent and comparable view of forest cover change within the region. At the
national level, the report uses the best available national forest cover map or the official
published figures by the respective governmental agencies in charge of forest
management and monitoring.

Page 17 of 99
2 Regional Forest Observatory for South-East Asia
(RFO-SEA)
Initiated in late 2016, the prototyping of a Regional Forest Observatory for South-East Asia is
now complete and the website freely accessible at: www.rfo-sea.org. The RFO-SEA was
officially launched in March 2018 and promoted to potential users and stakeholders. This
next phase of the RFO-SEA will focus on seeking a partner to host and sustain the RFO-SEA.
The RFO-SEA’s vision is to promote knowledge sharing and transparency through a
collaborative effort. As such, the RFO-SEA is populated via shared data and information
from government agencies, multilateral and bilateral institutions, INGOs/NGOs and the
academic sector. By providing relevant information on forest status and REDD+, the RFO-
SEA aims to:
i. Support practitioners to understand local, national, and regional land-use change
dynamics;
ii. Support coordination between projects and facilitate dialogue between partners;
and,
iii. Foster regional cooperation and an integrated approach on forest and land-use
issues.
The Observatory, RFO-SEA
The Regional Forest Observatory for South-East Asia, called RFO - SEA, is intended to be a
platform to share knowledge on the regional status of forests and REDD+. The RFO - SEA will
act as a repository for maps, statistics, GIS layers, reports, and scientific papers stored in a
database and accessible through a user-friendly website.
A similar regional observatory has been
developed in Central Africa through the
OFAC (Forest Observatory of Central
Africa (www.observatoire-comifac.net).

Page 18 of 99
The implementation of the RFO-SEA prototype started with a screening of key stakeholders
in the region to assess their interest in the RFO-SEA content and approach, which informed
the final design of the RFO-SEA. The database and website were developed with the
support of VAFS and in regular communication with JRC. The data and information were
sourced from contributing stakeholders or other freely available sources.
The RFO-SEA is composed of three main components:
1. A general website which provides information on the status of forests and REDD+ in each
country;
2. A geoportal; and
3. An information repository.
The RFO-SEA provides information and figures related to the status of forest cover and
REDD+ implementation at national and regional levels as well as a summary of the identified
drivers of forest cover change in each country. This overview is linked to source documents
available in the RFO-SEA’s information repository.
The geoportal provides geographical information that will help users to comprehend forest
cover and forest cover change dynamics at regional, national, or local levels. It also
provides information on land-use and management, for example the location of protected
areas. Finally, it provides global information on landscapes such as soil type or average
rainfall or fire occurrence.
Practitioners who work on mapping forest cover change can use the RFO-SEA geoportal as
a comparison tool. As such, they can verify if forest cover change trends given by their own
maps match with other provided datasets in the portal or assess which forest cover type
was affected by deforestation.
The information repository is a knowledge pool with relevant documents related to: the
implementation status of REDD+ in each country; forest monitoring, especially forest cover
change; relevant forestry and REDD+ projects from the region; methodologies; and,
technical guidance. For the most part, this data is stored in standard pdf format so that end
users can access it easily. The majority of REDD+ relevant literature was sourced from the
UNFCCC, FCPF, UN-REDD or national REDD+ websites. The information repository provides
access to country’s latest officially submitted reports such as FREL reports, R-PPs or REDD+
National Strategies. Relevant studies or academic publications regarding forest monitoring
are available in the repository. The repository also provides the material produced and
collected in the context of the ReCaREDD project.

Page 19 of 99
3 Forests of South-East Asia
3.1 Values of forests in South-East Asia
Ecosystem services are the benefits people obtain from ecosystems. Forests produce a
number of ecosystem benefits, covering goods and services that benefit people in different
ways. These benefits include i) provisioning services (forest goods); ii) regulating and

Page 20 of 99
supporting services related to water, soil, climate, agriculture and biodiversity conservation;
and iii) cultural services. Contents of these services are given below.
Provisioning services – forest goods
Key provisioning services – also known as forest goods – provided by forests in SE Asia
include:
- Timber
- Fuelwood
- Non-timber forest products such as food, fiber, and medicinal plants (in continental SE
Asian countries valuable NTFPs include e.g. pine resin, rattan and medicinal plants).
In SE Asia, forest goods often lay the foundation for rural livelihoods, SMEs and industry in
related processing and marketing sectors. An example of forest industry and related export
regarding Vietnam is given in Box 1 below.
Box 1. Wood and wooden products export of Vietnam
According to a 2015 International Tropical Timber Organization (ITTO) report, Myanmar
produced about 6 million m3 of logs in 2014 with a total export value of primary timber
products being about 1.78 billion US dollars. In addition to Vietnam and Myanmar, forestry
and forest industry largely contribute to livelihoods and economies of other continental
South-East Asian countries, too.
Vietnam was the world’s fourth-largest wood and wooden product exporter in 2015, after
China, Germany and Italy. In 2015 export turnover reached $6.9 billion, up 10.7 per cent
compared to 2014. During recent years the growth has remained level at 8 to 10 per cent.
Even though a part of the required raw material is imported, this production is mainly based on
timber grown and harvested in Vietnam.
According to the Ho Chi Minh City Handicraft and Wood Industry Association (HAWA), the
export of wood and wooden products saw better performance than other key export sectors.
The US, China, Japan and the EU remained the largest markets.
Wooden furniture accounted for the majority of exports. Labor-intensive products previously
dominated the market but enterprises have now become involved in product design,
accelerated the application of advanced technology in processing, and improved
management skills and services.
Figures from the Vietnam Timber and Forest Product Association show that in 2000 there were
only 741 wood and wooden product enterprises in the country but the number increased to
3,934 by 2015. Given its potential the wood and wooden products processing industry is one of
Vietnam’s most valuable export industries.
(Vietnam Economic Times, 2.2.2016)
Box 1. Wood and wooden products export of Vietnam

Page 21 of 99
Regulating & supporting services
Forests produce many regulating and supporting services that have effects on the quality
of land, watercourses, atmosphere and biological resources. In South East Asia, as
elsewhere, these services refer to water, soil, climate, agriculture, biodiversity conservation
and cultural services.
Regarding water, forests have an important role regulating water quality and quantity,
recharging groundwater and reducing flooding (frequency and damage), mitigating sea
level rise and storm surges. Moreover, forests stabilize soil, control erosion and reduce the
potential for landslides.
In the context of climate change, forests work as a carbon sink - they store carbon and
continue to sequester carbon from the atmosphere. Forests also regulate rainfall and
temperatures and provide shade and shelter. For agriculture, forests provide pollination
services and pest control.
With regards to biodiversity conservation, forests provide habitat for biodiversity. Biodiversity
supports other ecosystem services (resilience of forests and their services, pollination, forest
products, and cultural services). Biodiversity values are affected by species richness,
presence of threatened or endemic species and connectivity with other forests.
Concerning cultural services, forests support (eco-)tourism, attract tourists (e.g. wildlife
spotting, bird-watching, hiking). They also have cultural and spiritual value (sacred and
historical sites) and recreational values, providing access to nature, pleasant landscapes
and peaceful areas.
3.2 State of the forests
There is a growing pressure on forests and forest land due to increasing demands for land
and natural resources directly linked to population growth, infrastructure development, and
the expansion of industrial agriculture. For instance, while road development provides
access to markets and remote areas while also increasing opportunities for investment and
trade, it has also facilitated encroachment by loggers and the expansion of agribusinesses
into forests. This issue has particularly affected the northwest and southern parts of Laos and
northeast Cambodia.
The establishment of cash crop plantations has become a primary driver of forest
conversion in Southeast Asia. Deforestation and loss of canopy cover has been particularly
intense in Myanmar. Smaller scale forest loss in Laos, Viet Nam, and Cambodia has also
been recorded. In the Mekong region the production of rubber, cashew nuts, coconut and
sugar cane has been a major cause of forest conversion, while in coastal areas shrimp
ponds and agriculture have resulted in the loss of mangroves. In southern Thailand and
southern Myanmar, oil-palm establishment has also been an important cause of forest
conversion. Greater details on the specific drivers impacting each target country of the
RFO-SEA are provided in the respective country profiles.

Page 22 of 99
According to the 2015 FAO Global Forest Resources Assessment (FRA) report, in 2015, total
forest area in the target countries covered by RFO-SEA was 884,310 km2 or 46% of the whole
extent of the five countries.
Table 1. Forest area in 2005, 2010 and 2015. (FAO, 2015)
Forest cover 2005 2010 2015
Country Area (km2) % Area (km2) % Area (km2) %
Cambodia 107,310 61 100,940 57 94,570 54
Laos 168,700 73 178,160 77 187,610 81
Myanmar 333,210 51 317,730 48 290,410 44
Thailand 161,000 32 162,490 32 163,990 32
Vietnam 130,770 42 141,280 46 147,730 48
Total 900,990 47 900,600 47 884,310 46
Biogeosciences 11/2014 reports a change in tropical forest cover of entire Southeast Asia
from 268.0 million hectares in 1990 to 236.3 million hectares in 2010 1. Regarding the five
countries currently covered by RFO-SEA, as per the dataset given in Table 1 above,
between 2005 and 2015 only Cambodia and Myanmar suffered ongoing forest loss, while
Laos and Vietnam experienced forest gains. Thailand’s total forest area remained relatively
constant during this period. It should be noted, however, that the FAO FRA report is based
on self-reported data from each country, which often is not reliable due to poor quality. For
example, the datasets leveraged in Myanmar to report to the FRA were considered of too
low a quality to be used for the country’s FREL. Additionally, if data is not available, FAO
uses previous data to make projections to arrive at a figure for the subsequent period. This
is known to be the case for Laos where the forest area trends between 2002 and 2010 were
used to arrive at a value for 2015. As such, the FAO FRA numbers, while informative, must be
considered with caution.
A different dataset to understand regional forest cover trends in the five RFO-SEA countries,
are the global land cover maps produced by the Climate Change Initiative Land Cover
project (CCI-LC) 2 of the European Space Agency. Figure 1 provides an example of these
land cover maps. The CCI-LC maps can be considered as a more robust dataset to make
comparisons between countries over time due to the consistency in the underlying imagery
used and the land cover interpretation methods employed. Nevertheless, its low resolution
of 300 meters may impact its ability to identify small-scale deforestation event and thus
under-estimate slightly the deforestation. As such, they cannot be considered as
authoritative as nationally produced datasets.
1 H.-J. Stibig et al.: Change in tropical forest cover of Southeast Asia from 1990 to 2010
(https://www.biogeosciences.net/11/247/2014/)
2 http://maps.elie.ucl.ac.be/CCI/viewer/index.php

Page 23 of 99
Figure 1. Land cover 2015. (ESA, 2016)

Page 24 of 99
As per the CCI-LC dataset as shown in Table 2, total forest cover consistently decreased
over the 2000 – 2015 period in Cambodia. Forest loss occurred between 2000 and 2010 in
Laos and Myanmar, before stabilizing for the 2010 – 2015 period. In Thailand, forest cover
decreased between 2000 and 2005 before but steadily increased after this year. In Vietnam,
forest loss occurred during the first period, but the forest area was mostly stable after this.
Table 2. Forest cover area from CCI-LC maps. (ESA, 2016)
The CCI-LC dataset is consistent with forest cover trends identified in national datasets for
Cambodia and Thailand. The CCI-LC dataset appears to overestimate the stabilization of
forest cover in Laos and Myanmar compared to national datasets, while also not capturing
the greater forest gains achieved in Vietnam during this period. While the trends from
national datasets should be considered the most authoritative, the regional datasets still
provide value with respect to viewing forest losses and gains across the region through a
consistent analytical lens. Sections 4 through 8 provide a greater discussion of the forest
cover trends in each of the five RFO-SEA target countries.
Figure 2 illustrates where deforestation and reforestation occurred between 2000 and 2015
according to the CCI-LC dataset. In Vietnam, deforestation was most evident in the Central
Highlands and Central Coast areas. Here, degraded forests were replaced by forest
plantations, mostly rubber in the Central Highlands and acacia in the Central Coast. This
reforestation trend in the Central Highlands is visible on the map; the other notable area of
reforestation in Vietnam is in the South Central Coast. In Cambodia, the majority of
deforestation occurred in the Central Plains area due to the establishment of commercial
plantations in economic land concessions. The Cardamoms mountain range was also
impacted by deforestation on its edge. The visible reforestation occurred in only a few spits
and corresponds to the establishment of plantations. In Myanmar, forest located in the
south, in the Tenasserim range, was heavily impacted by deforestation due to agriculture
expansion, oil palm plantations and the development of infrastructure.
Forest Cover
Area (km2) 2000 2005 2010 2015
Cambodia 91,839 87,038 85,161 83,714
Laos 131,495 129,808 128,862 129,151
Myanmar 344,390 343,716 343,154 344,042
Thailand 129,193 128,194 128,816 130,202
Vietnam 119,083 115,971 115,976 115,320
Total 816,000 804,726 801,969 802,430

Page 25 of 99
Figure 2. Deforestation and reforestation 2000-2015 from CCI Land cover maps. (ESA, 2016)

Page 26 of 99
In Thailand, deforestation occurred in the northern provinces as well as in the proximity to
the Myanmar border. It is known that in Thailand reforestation programs supported by the
government have mostly counter-balanced the loss. Reforestation comes most likely from
plantations in the south and reforestation of degraded land in the mountainous area in the
north. In Laos, the implementation of rubber plantations, starting in the mid-2000 lead to
deforestation in the north-west and south-east provinces fueled largely by Chinese and
Vietnamese investors. The growth of these plantations, as well as the regeneration of former
shifting cultivation areas are the likely cause of the observed reforestation in the north. The
development of numerous hydropower projects, encouraged by national policies
supporting the development of Laos as an exporter of power, caused deforestation. Small-
scale shifting agriculture, which is still practiced throughout Laos but particularly in the
northern parts, also causes encroachment into forest areas.
It should also be noted, that in all countries forest quality is being lost, even in countries
where forest cover appears to be stable or increasing. This is due to the concurrent loss of
natural forests while forest plantation areas increase.
3.3 Regional REDD+ developments
The Warsaw Framework for REDD+, a series of seven decisions adopted at the COP 19 held
in Warsaw, Poland, in November 2013, is the most important guidance under the UNFCCC
for developing countries on REDD+ implementation. Between the Warsaw Framework for
REDD+ and previous decisions on REDD+ adopted by the COP, it is possible to summarize
the main features that a country must have in place to receive results based payments for
REDD+. These are:
National REDD+ Strategy or Action Plan: A national REDD+ strategy or action plan
addressing the drivers of deforestation and forest degradation, land tenure issues, forest
governance issues, gender considerations and REDD+ safeguards including the full and
effective participation of relevant stakeholders, inter alia indigenous peoples and local
communities.
Safeguards: A system for providing information on how the REDD+ safeguards under the
Cancun Agreement are being promoted and supported when implementing REDD+
activities. Taking into account national circumstances and respective capabilities, and
recognizing national sovereignty and legislation, relevant international obligations and
agreements, and respecting gender considerations, the safeguards information systems
should provide transparent and consistent information that is accessible by all relevant
stakeholders and updated on a regular basis. The systems should build upon existing
systems, be implemented at the national level and also be transparent and flexible to
allow for improvements over time.

Page 27 of 99
Forest Reference Levels: A national forest reference emission level (FREL) and/or forest
reference level (FRL) or as an interim level a sub-national FREL/FRL. These reference levels
form the basis to assess a country’s REDD+ performance. FREL/FRLs should be developed
in a manner consistent with IPCC guidance, take national circumstances into account,
be built iteratively if necessary, and use data and information that is transparent,
complete, consistent and accurate. FREL/FRLs are to be submitted to the REDD+
secretariat to be technically assessed as a pre-requisite to being eligible for results based
payments.
Box 2. Forest Reference Level (FRL) and Forest Reference Emission Level (FREL)
National Forest Monitoring System: A robust and transparent national forest monitoring
system to monitor, measure and report on changes in forest carbon. National forest
monitoring systems should be flexible, allow for improvement and build upon existing
systems, as appropriate. They should reflect the phased approach of REDD+
implementation and enable the assessment of different types of forest in the country
according to national definitions, including natural forest. They may also provide
relevant information to the safeguards information systems (SIS). As with the
development of FREL/FRLs, the data and information provided by national forest
monitoring systems should be transparent, consistent over time, and suitable for
measuring, reporting and verifying, taking into account national capabilities and
capacities.
REDD+ readiness is typically described as one of the three phases of REDD+ as countries
move along a process towards increasingly being prepared to achieve emission reductions
from REDD+ activities and receive results based payments. These three phases are outlined
below in Figure 3 including an assessment of where each of the five countries covered by
the RFO-SEA falls along the various phases.
Although the term FREL/FRL is used extensively throughout UNFCCC COP REDD+ decisions, no
formal distinction between the two has been provided. An FREL is generally understood to
include only emissions from deforestation and forest degradation, while a FRL includes all of the
potentially eligible REDD+ activities, including both emissions by sources and removals by sinks
(i.e. enhancement of forest carbon stocks).

Page 28 of 99
Figure 3. Three phases of REDD+
Vietnam and Cambodia are the most advanced in the region with respect to REDD+
implementation. Both countries benefited from receiving early stage REDD+ readiness
support from the UN-REDD programme in addition to the FCPF from whom both countries
have received additional readiness funding in addition to the initial US$3.6 million readiness
grant. Both countries have developed national REDD+ strategies, identified implementation
arrangements for REDD+, and developed and officially submitted their country’s FRL to the
UNFCCC. These are notable achievements and place both countries well on their way
towards establishing the necessary components under the Warsaw Framework to receive
results based REDD+ payments. Both countries need to better articulate their SIS and further
develop their NFMS, activities that both countries are currently undertaking.
Laos and Myanmar are slightly further behind Vietnam and Cambodia when it comes to
REDD+ readiness. While the institutional arrangements for REDD+ are in place in both
countries, they are still undertaking the analytical steps to develop their national REDD+
strategies, develop their FRL, finalize their safeguard assessments, as well as develop their
NFMS. Laos is further ahead in the development of its national REDD+ strategy with a draft
available for public viewing likely to emerge in early 2018, while this will likely emerge in late
2018 for Myanmar. Both will submit FRLs to the UNFCCC for technical assessment in early
2018, while the development of the NFMS will continue throughout 2018. As such, important
progress has been made to date in both countries and further gains will be made following
the disbursement of the additional readiness grant from the FCPF in Laos and the ongoing
support of the UN-REDD program in Myanmar.
Thailand is the furthest behind of the five countries with respect to REDD+ readiness. While
its REDD+ institutions have been established these have met infrequently and primarily only
in the context of developing the country’s R-PIN and R-PP. Thailand’s R-PP readiness grant
was only signed in 2016 and disbursement of these funds to kick-start the REDD+ readiness
process has been slow to date. Work to develop the country’s main REDD+ components is
expected to begin in 2018 once R-PP grant funding is released for technical assistance
support.
PH
ASE I
READINESS
Capacity Building
Elaborate REDD+ Strategy
Identify REDD+ Institutions P
HASE I
I IMPLEMENTATION
Implement REDD+ Strategy
Develop PAMs
Initial Results Based Payments (Funds, voluntary markets, other)
PH
ASE I
II
RESULTS BASED PAYMENTS
Full MRV
Results Based Finance

Page 29 of 99
3.4 Regional EU FLEGT developments
The EU Forest Law Enforcement, Governance and Trade (EU FLEGT) Action Plan was
established in 2003 aiming to reduce illegal logging by strengthening sustainable legal forest
management, improving governance and promoting trade in legally produced timber. In
developing countries, this principally takes the form of a Voluntary Partnership Agreement
(VPA) – a legally binding trade agreement – between the EU and timber-producing country
outside the EU. The purpose of the VPA is to ensure that timber and timber products
exported to the EU come from legal sources, while also engendering improvements in
regulation and forest governance within the timber-producing country.
The central part of a VPA is the legality assurance system (LAS) which is designed to identify,
monitor and license legally produced timber, to ensure that only legal timber is exported to
the EU. A timber LAS usually includes five elements:
a definition of what constitutes legal timber;
a procedure for verifying control of the supply chain;
tools for verification and the capacity to use them;
licensing by a national authority; and
an independent audit.
The negotiation of a VPA follows the process outlined in Figure 4 below.
Figure 4. Summary of the EU FLEGT VPA process
Phase 1: Information and
consensus building
Timber-producing country signals
interest in developing a VPA
Government assesses whether VPA process
is appropriate
Timber-producing country and EU agree to launch ofrmal VPA
negotiations
Phase 2: Formal negotiations
Timber-producing country conducts
inclusive, multistakholder
process to get in-country consensus
EU and negotiating country discuss details of content of VPA to
reach agreeemnt
EU and negotiating country initial VPA -country becomes a
'partner country'
Phase 3: Ratification and implementation
EU and partner country get VPA
ratified by respective legislative arms
Partner country begins to develop and implement its
LAS, builds capacity and/or develops new
procedures
Partner country uses an independent
auditor to ensure LAS is operating correctly
Phase 4: LicensingShipments to the EU
are issued with FLEGT licenses

Page 30 of 99
Of the five RFO-SEA target countries, Myanmar and Cambodia still fall within Phase 1.
Myanmar entered the preparation stage for a VPA in 2015 and has been focusing its efforts
on improving the design of its Myanmar Timber Legality Assurance System (MTLAS) through
the commissioning of a gap analysis and initiating in-country dialogues on the VPA process
with a broad set of national stakeholders. Formal negotiations have not yet begun with the
EU, however. In Cambodia, engagement is at an even earlier stage with the current focus
being on building internal capacity to engage with the VPA process.
Laos, Thailand and Vietnam all fall within Phase 2, albeit at different stages within this phase.
Laos initiated formal VPA negotiations in April 2017 and a has goal for negotiations to be
complete by 2018. Thailand on the other hand started its negotiations in 2013 but due to
political instability these were put on hold until recently; in June 2017 negotiations resumed.
Vietnam is the most advanced of all RFO-SEA target countries with its VPA initialed in May
2017 following over six years of negotiations. The next step will be for Vietnam and the EU to
ratify the VPA.

Page 31 of 99
4 NATIONAL STATUS: Cambodia
4.1 Institutional context
Previously, forests in Cambodia were managed by the Forest Administration (FA) and
Fisheries Administration (FiA), part of the Ministry of Agriculture, Forestry and Fisheries (MAFF).
However, under sub-decree No. 69 on the Transfer of the Protected Forest, Forest
Conservation and Production Forest Areas, and Economic Land Concessions between
MAFF, and MoE (Ministry of Environment), dated 28 April 2016, the protected forests are now
under the management of the MoE.
The Permanent Forest Estate (PFE) is under the jurisdictional management of MAFF, including
the management over flooded and mangrove forests, while the MoE is responsible for
managing Protected Areas, including the core area of the Tonle Sap.
The main relevant law governing the forestry sector is the 2002 Forestry Law. It provides for
the management, use, harvesting, conservation and development of all forests (planted or
natural) within the Kingdom of Cambodia.

Page 32 of 99
The policy objectives of the forestry sector under the PFE are synthesized into an overarching
strategic framework set out in the National Forest Programme 2010-2029 published in 2010
which acknowledge the objective to attain 60% of forest cover by 2015.
Recent ministerial changes in 2016 and 2017 have transferred all protected areas plus
additional areas designated as Biodiversity Conservation Corridors from MAFF to MoE, while
Economic Land Concessions previously under MoE have been transferred to MAFF. More
than four million ha have been transferred between the two ministries. Registration and
demarcation in the field have yet to be done.
4.2 REDD+ and EU FLEGT National status
4.2.1 REDD+
Cambodia was an early proponent of project-based REDD+ approaches with two REDD
pilot projects officially approved as early as 2008 (Oddar Meanchey Community Forests)
and 2009 (Seima Protection Forest). At the national level, Cambodia developed a national
road map for REDD+ Readiness in 2009 and 2010 as a basis to prepare its UN-REDD National
Programme Document and R-PP for the FCPF. Cambodia was approved to become a UN-
REDD National Programme in March 2011 and the programme ran until June 2015 (including
a 6-month extension). In parallel, Cambodia submitted its R-PP to the FCPF in 2011 which
was approved for readiness funding subject to the submission of a revised R-PP which was
submitted in March 2013. Implementation of R-PP activities began in March 2014.
Cambodia’s mid-term report to the FCPF in 2016 requested an additional US$5 million in
Readiness funds to be used between 2017 and 2020. An additional US$5.2 million was made
available from the FCPF in September 2017. To date, Cambodia has not submitted an ER-
PIN requesting participation under the FCPF’s Carbon Fund.
Institutionally, REDD+ is governed by the National Council on Sustainable Development
(NCSD), which was established to address development issues at the highest policy levels
and to mainstream sustainable development principles into the national policy framework
that will have a positive impact on the governance and management of forest resources.
The NCSD chairs the National REDD+ Taskforce, the inter-ministerial body with the
responsibility to further REDD+ Readiness and implementation in Cambodia. To provide
technical inputs to the REDD+ process, four Technical Working Groups have been
established on REDD+ demonstration, safeguards, benefit sharing and MRV. Additionally,
Cambodia has a REDD+ Consultation Group as well as a Gender Group. Day-to-day
management of the REDD+ process for the majority of the REDD+ readiness phase fell to
the REDD+ Taskforce Secretariat within the FA under MAFF. However, the recent ministerial
reshuffling means the REDD+ Taskforce Secretariat will be transferred to the GDANCP under
MoE. This is expected to happen shortly.
Cambodia finalized its National REDD+ Strategy (NRS) in 2015 and presented this to the
international community at the COP 21 in Paris in December 2015. Following this, the NRS
began a process of validation with national stakeholders; the NRS has been endorsed by
both the MoE and MAFF and currently sits with the National Council of Ministers for final
endorsement; this is likely to happen in early 2018. The NRS identifies all key drivers of

Page 33 of 99
deforestation and forest degradation, includes priority measures to address forest loss and
outlines the institutional arrangements to implement these measures. This is now being
operationalized into a NRS Action Plan.
While potential environmental and social impacts of the NRS were considered in the
development of the NRS, at present, the Environment and Social Management Framework
(ESMF) to address and monitor potential safeguard triggers has not yet been developed;
this will happen following the finalization of national Environment and Natural Resources
Code (ENRC). A policy and legal review has been completed identifying Cambodia’s
existing safeguard mechanisms in the context of developing the SIS for which a design
approach exists, although the actual system has not yet been developed.
The Cambodia Forest Reference Level (FRL) has been completed, endorsed by the Royal
Government of Cambodia (RGC), and was submitted to the UNFCCC for technical review
in December 2016. The initial technical assessment by UNFCCC was completed in March
2017 and the FRL will be reviewed and updated based on the technical comments and
feedback from UNFCCC. No performance against this FRL, however, has yet been assessed.
An initial NFMS has been developed with the intent to improve this over time. Currently, the
NFMS focuses primarily on data necessary for MRV. Land cover change assessments for 2016
are currently being finalized as well as work to improve biomass models. Trainings to conduct
a national forest inventory have been completed, including training on forest inventory
data management, and data processing and reporting for MRV Technical Team.
Sub-national REDD+ demonstration activities primarily take the form of VCS REDD+ projects
in Cambodia. In addition to the Oddar Meanchey and Seima projects, additional REDD+
demonstration projects include the Southern Cardamom REDD+ Project, Kulen Promtep
Wildlife Sanctuary project, and a Joint Crediting Mechanism REDD+ Project in Prey Lang.
The Oddar Meanchey project made some early stage sales to Microsoft in mid-2013, while
the Seima Protection Forest project more recently secured a pre-sale of emission reductions
to the Disney Corporation in 2016 generating US$2.6 million for the project.
4.2.2 EU FLEGT
Of the five RFO-SEA countries, Cambodia is the least advanced with regards to engaging
with the EU FLEGT process and negotiating a VPA. Initial contact between the EU and
Cambodia regarding the VPA process occurred in 2010 and was followed by an agreement
to conduct a joint study on understanding the timber flows and control in Cambodia which
was published in 2014. Since this time little progress has been made to enter into the formal
VPA process with only limited capacity building efforts to better understand the process
occurring to date. No known projects or programs to support Cambodia’s accession into
the EU FLEGT are known.

Page 34 of 99
Table 3. Key Active Multi/Bilateral REDD+ & FLEGT initiatives: Cambodia
Name Focus
Forest Carbon Partnership Facility Supporting national level REDD+ Readiness
Project for Facilitating the
Implementation of REDD+ Strategy
and Policy (CAM-REDD)
Technical cooperation project for facilitating the
implementation of REDD+ Strategy and Policy
4.3 Forest management and conservation
The Permanent Forest Estate (PFE) is under the jurisdiction of the Forest Administration (FA).
The Forest Law sets the Ministry of Agriculture, Forestry and Fisheries with the tasks of
classifying, registering and setting boundaries for all forests in the Permanent Forest Estates.
They are managed in accordance with the National Forest Management Plan.
The PFE is sub-divided into Permanent Forest Reserve (PFR) and Private Forest. The PFR is
composed of Production Forest, Protection Forest, and Conversion Forestland. According
to the Forest Law, Private Forests shall be maintained by their owners.
Production Forests are managed to ensure sustainable production. This category contains
Forest Concessions and Community Forests. The Protection Forests are protected for the
value of their ecosystem and natural resources. Conversion Forestland is forest yet to be
allocated in one of the other categories.
Two systems of concession exist in Cambodia involving forests. Economic land concessions
(ELCs) and forest concessions are long-term leases allowing different kinds of activities.
Forest concessions are granted through public bidding and should not exceed 30 years.
Community forests cannot be sold or granted as economic land concessions (ELCs).
However, several ELCs have been located within the boundaries of protected areas.
In February 2016, the Prime Minister announced a jurisdictional reform for natural resources
management, which focused on redefining the roles of MAFF and MoE with MoE having a
primary mandate for protection and conservation of natural resources, and MAFF focusing
on the developmental aspects. Accordingly, the issuance of sub-decree No. 69 in May
2016, transferred all protected areas (13 areas of Protection and Conservation Forest) from
MAFF to MoE, 5 areas of Production Forest from MAFF to MoE to be reallocated as Protected
Forest, and all 73 Economic Land Concessions from MoE to MAFF.
In January 2017, 1.4 million ha of land have been designated as Biodiversity Conservation
Corridors and transferred from MAFF to MoE. This increases the land under the authority of
MoE to around 7 million hectares. The sub-decree for how these new lands will be managed
has yet to be developed.
With the changes, Cambodia has approximately 40% of the national territory under
protection. There are however, significant challenges in terms of management and many
PAs are under heavy pressure. Already before the changes made in 2017 the status is that

Page 35 of 99
out of 51 protected areas, none of them have a management plan and only one has been
zoned according to the Law on Protected Areas 2008 (PA Law).
Under the 2006 Fisheries Law, inundated forests and mangrove areas outside of PAs are
managed and regulated by the Fisheries Administration, set out in the Strategic Planning
Framework for Fisheries 2010-2019.
Figure 5. Protected areas in Cambodia. (Source: Open Development Cambodia3, 2017)
4.4 Drivers of forest change
Before the 1970s, Cambodia’s forest area remained relatively constant. Since the 1970s,
forest area began to decline due to the effects of the Vietnam War, as Cambodia suffered
from an unstable political situation and logging.
Starting in the 1990s, as a result of rapid economic growth and weak environmental
regulations, 60% of the country was leased to the private timber industry, which led to
widespread deforestation and forest degradation. Land speculation driven by high prices
also contributed to accelerated forest clearing in recent years. In particular, economic land
concessions for the production of rubber, sugarcane, cassava and more recently biofuel
3 https://opendevelopmentcambodia.net/

Page 36 of 99
crops have led to substantial deforestation and displacement of forest-dependent
populations.
The 2001 Land Law formalized the legal framework for granting concessions for economic
purposes. An economic land concession, or ELC, is a long-term lease that allows the
beneficiary to clear land in order to develop industrial agriculture.
From 1996 to 2013 MAFF granted 121 ELCs (Economic Land Concession) covering 1,230,364
hectares of forest in 17 provinces, in which 39 local companies covered 609,377 ha, and 82
international companies covered 620,987 ha. MAFF reported that 135,322 ha of these
concessions were plantations for rubber, palm oil, cashew nut, cassava of used to raise
cattle.
Forest degradation is also caused by unsustainable fuel wood collection and charcoal
production. The latter is more damaging as it requires green wood and, in some regions, is
more profitable than agriculture. Due to a lack of alternative energy sources, wood is the
primary energy source for most rural and some urban households. Uncontrolled logging has
also resulted in forest degradation.
Lack of government capacity in remote areas to adequately manage forests is a major
underlying condition leading to deforestation and forest degradation.
Figure 6. Drivers of forest change in Cambodia. (Source: adapted from Delux C. 2015)

Page 37 of 99
4.5 Forest status
4.5.1 Forest types
Historically, various forest maps produced in Cambodia have made use of different forest
type descriptions. Implementation of the REDD+ program and the establishment of the FRL
however requires a consistent classification system. The one adopted for this purpose is
described in the FRL and is compatible with IPCC land-use classes (see Table 5).
Table 4. Forest definition in Cambodia. (Royal Government of Cambodia, 2016c)
Forest Definition
Forest is the unit of natural ecosystem or plantation in wetlands, low lands and dry lands
which are covered by natural stands or plantation trees with a height of at least 5
meters on an area of at least 0.5 ha and with a canopy of more than 10 %
For REDD+, rubber, oil palm and perennial crops are excluded from this definition
The main forest classes are distinguished with the support of leaf phenology which can be
identified with remote sensing imagery. Thus, evergreen forest, semi-evergreen forest and
deciduous forest are identified with this ecological criteria. Flooded forest, mangrove and
pine forest all have very different ecologies and species composition from the three former
types and can be identified easily.
Table 5. Forest types in Cambodia. (RGC, 2016c)
IPCC Land Use
Categories
Land Use/Cover
Categories Description/Comment
Forest
Evergreen forest Forest with trees maintaining their leaves during
the whole year
Semi-evergreen
forest
Forest with variable percentages of evergreen
and deciduous trees
Deciduous forest Dry mixed deciduous forest and dry
Dipterocarp forests
Pine trees Forest dominated by coniferous trees
Pine plantation
Tree plantation This class includes the following type: teak,
eucalyptus, acacia, jatropha and others
Mangrove forest
Rear mangrove Salt tolerant species but only infrequent floods
Flooded forest
Bamboo
Crop land
Rubber plantation
Oil palm
Paddy field

Page 38 of 99
IPCC Land Use
Categories
Land Use/Cover
Categories Description/Comment
Crop land
Arable and tillage land, and agro-forestry
systems where vegetation falls below the
thresholds used for the forest land category
Grassland
Grassland
Grasslands are characterized as lands
dominated by grasses rather than large shrubs
or trees. It is crucial that the rainfall is
concentrated in six or eight months of the year,
followed by a long period of drought when fires
can occur.
Wood shrub Areas dominated by evergreen and deciduous
woodland with a height less than 5 meters
Wetlands Water
Settlements Built-up area
Village
Other Rock
Sand
Evergreen forest is mainly found in the Cardamom mountains in the west of the country,
while semi-evergreen forests are distributed in Ratanakiri province which borders Laos and
Vietnam. Deciduous forests are found predominantly in Mondulkiri province in the south-
east. Flooded forests are located around the Tonle Sap.
Figure 7. Land cover 2014 in Cambodia. (RGC, 2016c)

Page 39 of 99
4.5.2 Current and historical forest cover
The figures and map shown below in Table 6 and Figure 8 are sourced from a published
booklet produced by the Forestry Administration in 2016 with the support of the UN-REDD
program.
Table 6. Forest status summary for Cambodia. (RGC, 2016c)
Forest Area
Total Forest Cover (2014) 8,518,173 ha Forest covers 46.9 % of
Cambodia
Forest Cover Change Trend
DECREASE
Forest area
2010: 10,451,912 ha
2010-2014:
- 483,435 ha/year
2010-2014:
- 4.6 %/year
While the current forest cover is still relatively high, Cambodia lost a considerable amount
of forest over the last two decades, and the pace of land use and forest conversion has
accelerated.
Figure 8. Forest cover change in Cambodia from 2005 to 2014. (RGC, 2016c)
During the period from 2005 to 2010, forest loss occurred mostly in the western part of the
country in hilly zones and along the mountain ranges where evergreen and semi-evergreen
forests are located. Changes to both evergreen and deciduous lowland forests have also
been recorded in the flatlands. Furthermore, forest change hotspots are frequently located
in areas bordering Laos, Thailand, and Vietnam. The last period from 2010 to 2014 saw an
increase in forest loss, as displayed in Figure 8; forest cover which represented 57.55% of
Cambodia’s total area in 2010, was only 46.9% four years later. Forest loss as illustrated in
Figure 9 occurred mainly in Oddar Meanchey, Kratie, Konpong Speu provinces and along
the road that goes from Stung Treng to Ratanakiri provinces.

Page 40 of 99
Figure 9. Forest cover change 2010-2014 in Cambodia. (RGC, 2016c)
4.5.3 Carbon stocks
Cambodia has never conducted a National Forest Inventory (NFI), although one has
recently been designed. When implemented, the NFI is expected to improve the national
emission factors which currently are based on existing references. The post-deforestation
carbon stock per unit of area is currently assumed zero because there is no reliable data on
the land-use and regrowth potential, for the non-forest land cover classes which are
replacing forests.
Cambodia selected carbon stock values based on existing references for the above
ground biomass (AGB) pool during the establishment of its FRL, as shown in Table 7 below.
Table 7. Estimation of above ground biomass (tC/ha) by forest types in Cambodia.
(Source: (RGC, 2016a)
Forest Type AGB (tC/ha)
Evergreen 76.6
Semi-Evergreen 114.21
Deciduous 39.95
Forest regrowth 35.25
Flooded forest 32.9
Plantation 47.0

Page 41 of 99
Forest Type AGB (tC/ha)
Pine Plantation 47
Mangrove 70.5
Rear Mangrove 77.55
4.5.4 FREL/FRL Summary
The scale of the FRL is nation-wide. The FRL considers only deforestation and afforestation
and accounts only for CO2 emissions. The considered carbon pools are summarized in the
table below.
Table 8. Carbon pools considered to calculate Cambodia’s FRL. (RGC, 2016a)
Carbon Pool Included
AGB YES
BGB YES
Soil organic carbon NO
Dead wood NO
Litter NO
Cambodia takes an approach based on the historical average of net emissions from
deforestation and afforestation for eight years from 2006 to 2014 to construct its FRL.
Average annual emissions during the historical reference period were assessed to be
79,245,643 tCO2/year; this is what is projected over the FRL period of 2014 – 2018.
Table 9. Total Annual CO2 Emissions and Removals (t CO2 / year) FRL reference period.
(RGC, 2016a)
Period Removals
(tCO2/year)
Emissions
(tCO2/year)
Net Emissions and
Removals (tCO2/year)
2006-2010 -6,626,046 34,148,629 27,522,583
2010-2014 -20,298,825 151,267,528 130,968,703
Average 2006-2014 -13,462,436 92,708,079 79,245,643

Page 42 of 99
5 NATIONAL STATUS: Laos
5.1 Institutional context
Forests in Laos are under the jurisdiction of the Department of Forestry (DoF) under the
Ministry of Agriculture and Forestry (MAF). The 8th National Socio-Economic Development
Plan (2016-2020), the National Forest Strategy to the Year 2020 and the (Intended) Nationally
Determined Contributions (NDC) include the commitment to increase forest cover to 70%
by 2020 through sustainable forest management as well as reforestation and afforestation
measures. The main law related to forestry in Laos is the 2007 Forestry Law. It defines all
natural forestland, including communal village forestland, as the ultimate property of the
national community, which is being represented by the State. In 2012, the Prime Minister’s
Order 13/PM suspended the consideration and approval for new investment projects
related to mining prospecting and exploration, rubber and eucalyptus plantation
concession, due to the expansion of concessions to the significant detriment of forests. In
2016, the Prime Minister’s Order 15/PM, aimed to combat illegal logging by prohibiting the
export of round and sawn timber as well as semi-finished products. Only finished wood
products can now be exported.

Page 43 of 99
5.2 REDD+ and EU FLEGT National status
5.2.1 REDD+
Laos became actively involved with REDD+ in 2008 with the submission of its R-PIN to the
FCPF. It’s R-PP was approved in 2010 and a US$ 3.6 million Readiness Preparation grant
approved in 2014. The delay to move from approved R-PP to the approval of the grant was
primarily due to a ministerial reshuffling that resulted in a lack of clarity over forest
management responsibility, specifically with regards to REDD+. Laos contracted a Technical
Assistance team in 2016 to support with the implementation of the Readiness Preparation
grant. In its mid-term report in 2016, Laos requested the FCPF for an additional US$4.575
million in Readiness funds to be used between September 2017 and August 2020 which has
been accepted although the grant agreement not yet been officially signed.
Laos is also engaging with the FCPF under the Carbon Fund. Its ER-PIN was selected for
provisional inclusion into the pipelines of both Tranche A and Tranche B of the Carbon Fund
at the thirteenth Carbon Fund meeting in October 2015. A revised ER-PIN was submitted in
February 2016 and a Letter of Intent signed in July 2016. Laos anticipates submitting its ER-
PD in January 2018.
In addition to its engagement with the FCPF, Laos is a recipient of $30 million from the Forest
Investment Program to pilot REDD+ interventions. Laos has also benefited from the ongoing
support of several REDD+-specific donor programs, including the Climate Protection
through Avoided Deforestation (CliPAD) program, funded by KfW and GIZ, and the
Sustainable Forest Management and REDD+ Program (F-REDD), funded by JICA. Targeted,
in-kind support is also provided by FAO, primarily for the development of the country’s ER-
PD submission.
Institutionally, REDD+ in Laos is overseen by the REDD+ Taskforce, an inter-ministerial body
chaired by the Vice Minister of MAF and representing 8 different ministries as well as the
National University of Laos. Technical inputs and guidance to the REDD+ Taskforce is
provided by six Technical Working Groups, representing the following key topical areas:
legal framework, land tenure, MRV/REL, safeguards, benefit sharing, and law enforcement.
While the REDD+ Taskforce meets irregularly, the TWGs, with coordinating support from the
R-PP Technical Assistance team and other donor agencies, meet regularly to discuss and
progress technical matters. Secretarial and day-to-day management of REDD+ in Laos is
delegated to the REDD+ Division under the Department of Forestry. Additionally, seven
Provincial REDD+ Taskforces (PRTF) and Provincial REDD+ Offices (PRO) have been
established.
The development of the National REDD+ Strategy is currently underway. An assessment and
analysis of land use changes at the national level has been undertaken, drivers and
strategic REDD+ interventions prioritized, and assessments conducted on the forest law and
policy as well as natural resource rights and land tenure. This has led to the development of
a draft strategy that is currently undergoing stakeholder consultations and verification. In
tandem with the development of the National REDD+ Strategy, a Strategic Environmental
and Social Assessment (SESA) report analysing the social and environmental impacts of the
strategy has been drafted and the associated ESMF currently under development.
Page 44 of 99
At the subnational level, draft Provincial REDD+ Action Plans have been developed for the
six provinces comprising the ER-Program and will form the basis for elaborating the ER-PD’s
strategic interventions.
With respect to developing the country’s FRL/FREL, several of the most important building
blocks are in place. The Second National Forest Inventory was completed in 2017 which will
inform the development of Tier 2 emission factors. Furthermore, national, wall-to-wall
mapping for the years 2005, 2010 and 2015 has been completed, providing the necessary
data inputs to generate activity data for the FRL/FREL. A preliminary FREL was developed
for the ER-PIN and will be updated with the newly available activity data and emission
factors in the ER-PD. Construction of the national FRL/FREL is completed and was submitted
to UNFCCC in January 2018.
Development of the NFMS has made limited progress to date. Design of the MRV system
has been completed and it currently houses historical data necessary to generate activity
data. However, broader elements of the NFMS, including the SIS and links to local level forest
monitoring are still in the design stage.
To date, Laos has not received any REDD+ results based payments at the project, sub-
national or national level. One VCS validated project exists in Laos, although this has not yet
achieved any credit sales.
5.2.2 EU-FLEGT
The Department of Forest Inspection under the Ministry of Agriculture and Forestry is the
national focal point for developing the VPA, partnering closely with the Ministry of Industry
and Commerce and the Ministry of Natural Resources and Environment, as well as other
government agencies, civil society organisations, academia, the timber processing industry,
and other stakeholders. In February 2012, the Government of Laos announced its interest in
negotiating a VP and in October 2013 the Ministry of Agriculture and Forestry opened a
Forest Law Enforcement, Governance and Trade (FLEGT) Standing Office with support from
Germany's Agency for International Cooperation (GIZ). However, authorization for formal
negotiations was not granted by the Prime Minister until June 2015 after which Laos quickly
set up its negotiating structure – establishing a National Steering Committee and appointing
a Chief Negotiator. In October 2015, Laos communicated to the EU its readiness to
negotiate and the first negotiation round took place in April 2017. The FLEGT Technical
Working Group, at its meeting on 15 December 2016, finalized key parts of the draft timber
legality definition, and the National Steering Committee has approved the scope of the
Voluntary Partnership Agreement (VPA) to include all export markets and the domestic
market, the main timber sources: 1) Production forest, 2) conversion forest, 3) plantation, 4)
village use forest, and a wide product scope.

Page 45 of 99
Table 10. Key Active Multi/Bilateral REDD+ & FLEGT initiatives: Laos
Name Focus
Forest Carbon Partnership Facility Supporting national level REDD+ Readiness
Climate Protection through Avoided
Deforestation (CliPAD)
GIZ and KfW co-funded project to provide policy
advice and capacity development supporting
the establishment of the national and provincial
REDD+ framework and REDD+ planning
processes. At the local level, mitigation activities
are piloted and pro-poor REDD+ mechanisms
and sustainable financing models are
developed.
Sustainable Forest Management and
REDD+ Program (F-REDD)
JICA funded project aiming to strengthen
capacity for clarification of REDD+ strategy and
improve forest resource information with the
purpose to promote sustainable forest
management (SFM)
ProFLEGT Joint initiative of the Lao Government and
German development cooperation, this GIZ
project supports the VPA negotiation process
between the EU and Laos.
FAO-EU FLEGT Programme
FAO-EU FLEGT Programme supported projects
include practical activities which will inform the
development of robust yet realistic legality
standards and their verification. Identified
priorities to be addressed in Laos include
increasing understanding of the VPA and TLAS
concepts and the opportunities the VPA process
provides. It aims to support activities bridging the
considerable gap between the legal and
regulatory framework and legal compliance or
law enforcement practices on the ground, and
document current informal practices, limitations
of verification processes and the challenges and
barriers facing smallholders, communities and
SME in legality compliance.

Page 46 of 99
5.3 Forest management and conservation
Forest plays a crucial role in Laos. According to the Forestry Strategy to 2020 (published in
2005), forests contributed 3.2 % of GDP in 2001. Around 80% of the population relies on the
forest for timber, fuel, food, fibre, medicines and other products. In rural areas, NTFPs often
provide more than half a family’s total income.
The national Forestry Law identifies three categories of state forests based on their functions.
About 14.5 million ha (more than 50% of the country’s land area) is delineated as state
forest. All of these forest areas may include land cover that is not forest.
Table 11. Forest categories in Laos according to 2007 Forestry Law. (GoL, 2007)
Category Functions
Conservation forests
and national
protected areas
(NPAs)
Conservation of nature; preservation of plant and animal species as well
as forest ecosystems and other sites of natural, historical, cultural,
tourism, environmental, educational and scientific research importance.
These are subdivided into total protection zones (all land uses
prohibited), controlled use zones (permanent agriculture, non-
commercial logging and collection of forest products allowed), corridor
zones (collection of forest products allowed) and buffer zones (non-
commercial logging and collection of forest products allowed).
Protection forests
Protection of the environment; protection from natural disasters;
prevention of soil erosion; protection of water resources, riverbanks,
roadsides and soil quality; the protection of strategic areas for national
defence. These are subdivided into total protection zones (all land uses
prohibited) and controlled use zones (permanent agriculture, non-
commercial logging and collection of forest products allowed).
Production forests
Natural and planted forests that serve the purpose of production of
timber and other forest products to satisfy business demands and the
requirements of national socioeconomic development and people’s
livelihoods. These are subdivided into forest management areas
(devoted to timber extraction) and village-use zones (permanent
agriculture, non-commercial logging and collection of forest products
allowed).
Village forests are poorly recognized and not included in the three forest types as described
in the current version of Lao forest law. Village forests are considered as forest lands within
Provinces and Districts, and are not classified as Production, Protection or Conservation
where timber can be harvested and sold. Village use forests are the forest areas located
within village areas and allocated for village management, preservation and utilization
according to the land and forest allocation plan.

Page 47 of 99
Table 12. Summary of forest category areas managed at national level in Laos. (Source:
FIPD 2016 and GoL 2010)
Forest Category Number Area (ha)
Estimated Forested
Area (ha)
(GoL 2010)
Estimated
Forested
Area (%)
Conservation Forest 24 3,878,560 2,370,000 61
Protection Forest 49 7,482,109 2,570,000 34
Production Forest 51 3,094,510 1,300,000 42
Total 14,455,179 6,240,000 43
Figure 10. Map of forest categories in Laos. (FIPD, 2016)

Page 48 of 99
5.4 Drivers of forest change
The R-PP to FCPF submitted in 2010 identifies nine drivers of forest cover change:
Figure 11. Direct drivers of forest cover change in Laos. (GoL, 2010)
A study conducted in 2011 in Northern Laos also identified indirect drivers of forest change:
Figure 12. Indirect drivers of forest cover change in Laos. (Wildlife Conservation Society and
GIZ, 2015)
The main drivers of deforestation have been identified as conversion to agricultural land
and plantation crops (including timber trees and rubber), by commercial companies and
smallholders, and for mining and infrastructure development. There has also been and will
continue to be expansion in hydro-power generating capacity. A recent study conducted
in 2017 with the support of satellite imagery in the context of FCPF identified that main large
scale (for change > 20ha) drivers are shifting agriculture, agriculture expansion and tree
plantations. Shifting agriculture was identified as the predominant driver in the northern part
of the country while tree plantations are the main driver in the South. Agricultural expansion
occurs throughout the country.
Drivers of DEFORESTATION
Drivers of FOREST DEGRADATION
Unsustainable
Wood
Extraction
Urban
Expansion
Shifting
Cultivation Forest Fire
Agricultural
Expansion Mining
Industrial
Tree
plantations
Infrastructure
Development
Hydropower
Development
Indirect drivers of forest change
Poverty
Population
Growth
International
Demand for
Commodities
Village
Relocation
Border
Crossings
Limited Law
Enforcement
Effectiveness
Deficient Land
Use Planning
Implementation
Boundary
Demarcation

Page 49 of 99
Smallholder agricultural expansion is similar to shifting cultivation in terms of agents of
deforestation and the dynamics of forest loss, except that the crops planted are typically
cash crops such as maize and cassava or perennial crops such as rubber. These are,
generally planted on more accessible land which uses the land permanently so that it does
not revert to forest, unlike with shifting cultivation where the abandonment of the land after
rice cultivation allows some areas to regenerate to forest.
The drivers of degradation are primarily illegal logging, unsustainable wood extraction and
shifting cultivation. The latter is considered as degradation so long as it is done on a rotation
basis and there is a fallow period that allows secondary forest to regenerate. In this way,
overall forest stock is reduced, but not the forest area. Illegal logging activities are driven by
their high profitability and are facilitated by weak law enforcement and control.
5.5 Forest status
5.5.1 Forest types
The Forest Inventory and Planning Division (FIPD) under DoF, produces the national Forest
Type Map.
Table 13. Forest definition in Laos. (GoL, 2018)
Forest Definition
Forest Current Forest means the natural forest and forest plantation which having a tree
cover with a crown density of at least 20 %, the area more than 0.5 ha, and DBH more
than 10 cm.
The land/forest classification system of the country applies two levels of classification. Level
1 consists of seven classes including “Current Forest” and “Potential Forest” among others.
Level 2 further classifies the Level 1 current forest class into six natural and plantation classes.
The relation between the national land/forest classification system and the land-use
category definition of the IPCC is illustrated in Table 14 below.
Table 14. Land and forest classification system in Laos. (Gol, 2018)
IPCC Land Use Categories Land Use/Cover Categories
Level 1 Level 2
Forest Current Forest
Evergreen Forest
Mixed Deciduous Forest
Dry Dipterocarp Forest
Coniferous Forest
Mixed Coniferous and Broadleaved
Forest

Page 50 of 99
IPCC Land Use Categories Land Use/Cover Categories
Level 1 Level 2
Forest Plantation
Potential Forest Bamboo
Regenerating Vegetation
Grassland Other Vegetated
Areas
Savannah
Scrub
Grassland
Cropland Cropland
Upland Crop
Rice Paddy
Other Agriculture
Agriculture Plantation
Settlements Settlements Urban Areas
Other Other Lands Barren Land and Rock
Other Land
Wetland Above-ground
Water source
River
Wetland
Current forest refers to areas that meet the forest definition (Table 13. Forest definition in
Laos) while potential forest includes regenerating vegetation that does not yet match the
definition of forest.
Upland Crop and Regenerating Vegetation are predominately considered to be stages of
the shifting cultivation cycle, and these lands are considered to re-grow and recover
through natural vegetative succession as illustrated in Figure 13. Slash-and-burn cycle and
land/forest classes For the purpose of REDD+, in line with the IPCC definition (2003) which
describes that forest land can be “vegetation that currently fall below, but are expected
to exceed, the threshold of forest land category.” Regenerating Vegetation is classified as
“Forest Land”. Upland Crop is classified as “Cropland” as they are used, even temporarily,
for cropping at the time of mapping.

Page 51 of 99
Figure 13. Slash-and-burn cycle and land/forest classes. (GoL, 2018)
The predominant forest type in Laos is mixed deciduous and can be found throughout the
country. In this forest type, half of the species would be deciduous, with bamboo also being
present.
Evergreen forest is a richer and denser type of forest found in higher elevated areas such
the Annamite mountains along the Laos-Vietnam border or in the north-west in Bokeo
province. Various species of rosewood trees like Pterocarpus Pelatus are usually the target
of illegal loggers.
Dry Dipterocarp forest are commonly found in flat land with shallow soil and is composed
of rather small trees that are fire resistant (Dipterocarpus Obtusifolius). This forest type is found
in the south of the country in Savannakhet, Salavan, Champassak and Sekong provinces.
Coniferous forest and mixed coniferous and broadleaved forest can be found in very
specific places in the country such as Xiengkhouang plateau, the Nakai plateau and
Sekong province near the Vietnamese border.
The total area of Upland Crops (UC), Regenerating Vegetation (RV) and Mixed Deciduous Forest
(MDF) account for nearly 70% of the land of Laos. Due to the prevalence of shifting cultivation in
Laos and particularly in the northern region, large areas of land are shifting between these three
different land/forest classes. Accurate interpretation of the transition events from UC (i.e. non-
forest land) to RV (i.e. forest land temporarily un-stocked and does not meet the definition as
forest) and then to MD, through satellite imagery presents a technical challenge. The
classification of these land/forest classes can have significant impact on uncertainty.
Among the stages of shifting cultivation, UC is the stage of the land immediately after being
slashed-and-burnt for cropping and is relatively easy to classify due to the lack of, or reduced,
vegetation cover. RV and MD are continuous phases of regeneration in many cases, and old RV
and young MD have very similar colour tone and texture on satellite imagery, thus, distinguishing
the two in a single satellite image is technically challenging.
Upland Crop (UC) Regenerating Vegetation (RV) Mixed Deciduous Forest (MD)
DBH > 10cm
Crown Cover > 20%

Page 52 of 99
Figure 14. Forest and Land cover map 2015 – Laos. (GoL, 2018)
Regenerating vegetation is mainly found in the northern part of the country where shifting
cultivation practices are dominant.
Plantation forests which have considerably expanded during the last decade, only
represent 1% of the current forest. Rubber plantations have been developed in the north
(Luang Namtha and Oudomxay provinces) and in the south (Champassak and Attopeu
provinces) respectively by Chinese and Vietnamese investors. Acacia or Eucalyptus
plantations were developed for the need of the paper industry mainly in the central
provinces like Bolikhamxai and Khammouane provinces.
5.5.2 Current and historical forest cover
The Table 1. Forest area in 2005, 2010 and 2015. (FAO, 2015) that displays figures from the
FAO Forest Resources Assessment could be misleading for Laos as first FAO uses its own forest
definition (10% canopy cover) and secondly the figure for 2015 is an extrapolation of the
trend observed between 2002 and 2010. In reality forests in Laos are decreasing in extent
and in quality mainly because of the expansion of agricultural land pushed by the

Page 53 of 99
emergence of cash crops, such as maize, and the development of infrastructure and
logging.
Table 15. Forest status summary for Laos. (FIPD, 2016).
Forest Area
Forest land (Current forest and potential forest): 19,531,889
ha
Current Forest (2015) 13,369,408 ha
Potential Forest (2015) 6,162,481 ha
Forest land: 84.7 %
Current forest: 58 %
Potential Forest: 26.7 %
Forest Cover Change Trend
DECREASE
Current Forest area
2005: 13,875,422 ha
2005-2015:
- 50,601 ha/year
2005-2015:
- 0.4 %/year
The figures displayed in Table 15. Forest status summary for Laos come from the national
forest type maps. A detailed look reveals that while areas considered as forest covers 84.7%
of the country, current forest represents only 58%, with this class of forest seeing a regular
decrease of its area of -0.4% per year. These deforestation figures do not illustrate the impact
of logging on the degradation of forest resources which is known to be occurring at high
rates in Laos.
For the purpose of the REDD+ MRV, the national land and forest classification explained in
Table 14. Land and forest classification system in Laos is condensed into five strata. Such
simplified stratification will help reduce uncertainty of emissions and removals while
balancing the accuracy of sampling and the cost/efforts required. The forest stratification
used for the construction of the FREL/FRL includes the following five types of forest land and
non-forest land and the historical figure is shown in Table 16. Historical area of stratified land
cover in Laos:
- Evergreen Forest has distinctly high carbon stocks (200.0tC) and is separated as an
independent stratum – Stratum 1.
- Mix Deciduous Forest, Conifer Forest and Mixed Coniferous and Broadleaved Forest will
form one stratum on the basis of similarity in carbon stocks per hectare (87.7tC, 92.6tC,
114.7tc). – Stratum 2.
- Dry Dipterocarp Forest will form one stratum due to the difference in carbon stock from
other forest classes (43.2tC), and also due to the fact that they are mostly distributed in
the low-lands and prone to conversion to other land use – Stratum 3.
- Forest Plantation, Bamboo and Regenerating Vegetation will form one stratum on the
basis of similarity in average carbon stock (37.2tC, 24.4tC, 17.4tC) – Stratum 4.
- The remaining 12 non-forest classes form one stratum – Stratum 5.

Page 54 of 99
Looking at historical figures, the strata 1, 2 and 3 which are current and natural forest types
as opposed to plantation, are decreasing significantly, with strata 2 losing more than 50,000
ha every year.
Table 16. Historical area of stratified land cover in Laos. (GoL, 2018)
IPCC Land
Use Class Strata
2005 2010 2015
Area (ha) % Area (ha) % Area (ha) %
Forest
Land
Strata 1 2,618,169 11.40% 2,613,226 11.30% 2,605,557 11.30%
Strata 2 9,961,368 43.20% 9,721,635 42.20% 9,437,688 40.90%
Strata 3 1,272,006 5.50% 1,215,712 5.30% 1,188,198 5.20%
Strata 4 6,183,370 26.80% 6,042,075 26.20% 6,300,445 27.30%
Sub-total 20,034,913 86.90% 19,592,648 85.00% 19,531,888 84.70%
Other Strata 5 3,019,344 13.10% 3,461,610 15.00% 3,522,370 15.30%
Total 23,054,258 100% 23,054,258 100% 23,054,258 100%
As described in Table 18. Description of Activity Data for Laos and shown in the Figure 15.
Map of Activity Data (Deforestation, Forest Degradation, Reforestation and Forest
Regeneration) in Laos for the period 2005-2010 and 2010-2015 below in yellow, deforestation
is the conversion of any forest land strata into non-forest strata, stratum 5. During the first
period 2005-2010, deforestation occurred with the expansion of corn especially in the north-
east (Xamneua province) and the west (Vientiane and Sayabouly province) which
converted large areas of regeneration vegetation to cropland. The development of large
infrastructure like the Nam Theun II hydropower dam in Khammouane province flooded
forested areas. Rubber plantation were developed on degraded forest land in the south of
the country. During the period 2010-2015, the expansion of cash crop reached a plateau
that resulted in less regenerating areas converted into cropland. However, the pace of
deforestation of current forest types remained constant.
Table 17. Activity data per period in Laos. (GoL, 2018)
Activity Area (ha)
2005-2010 2010-2015
Deforestation 719,348 320,381
Reforestation 277,082 259,621
Forest Degradation 242,890 297,004
Forest restoration 85,896 107,381

Page 55 of 99
Figure 15. Map of Activity Data (Deforestation, Forest Degradation, Reforestation and Forest
Regeneration) in Laos for the period 2005-2010 and 2010-2015. (GoL, 2018)
5.5.3 FREL/REL Summary
The reference period of the FREL/FRL is 10 years, from 2005 to 2015. The scale of the FREL/FRL
is national wide and only CO2 is considered. The tables below summarize the activities
considered as well as the carbon pools included.
Table 18. Description of Activity Data for Laos. (GoL, 2018)
Activities Description
Emissions from
deforestation
A deforestation event is a change of a forest land stratum to a
non-forest land stratum.
The total emissions from deforestation account for
approximately 34% of all forest-related emissions in the reference
period (2005-2015).
Emissions from forest
degradation
A degradation event is a change within forest land strata from a
higher biomass stratum to lower biomass stratum, and also
through measurement of tree stumps as a proxy indicator of
logging activities
The total emissions from forest degradation account for
approximately 66% of all forest-related emissions in the reference
period (2005-2015). Estimated emissions from selective logging
represent 41% of total emissions from forest degradation.

Page 56 of 99
Activities Description
Removals from forest
enhancement
(Restoration)
A restoration event is a change within forest land stratum from a
lower biomass stratum to a higher biomass stratum (in IPCC
terms, “forest land remaining forest land”).
This is often a result of regrowth of the RV (Stratum 4) to other
natural forest classes.
Removals from forest
enhancement
(Reforestation)
A reforestation event is a change of non-forest stratum (Stratum
5) to forest land strata (Strata 1-4).
This is often a result of a non-forest land (Stratum 5) being
converted into the Plantation class, or regenerating into the RV
(both Stratum 4).
Table 19. Carbon pools considered in calculation of FREL/FRL in Laos. (GoL, 2018)
Carbon Pool Included
AGB YES
BGB YES
Soil organic carbon NO
Dead wood NO
Liter NO
The Table 20 below displays the average annual historical emissions and removal for the
reference period, 2005-2015. The average historical emissions aggregates the emissions from
deforestation, forest degradation and also an estimation of emissions from selective
logging. Net average annual historical emissions which are projected forward for the FREL
are 26,575,895 tCO2e.
Table 20. Proposed FREL/FRL for Laos. (GoL, 2018)
Emissions/Removals tCO2e/year
Average historical emissions + 34,106,431
Average historical removals - 7,530,536
Net Average historical emissions + 26,575,895
5.5.4 Carbon stocks
The Lao National Forest Inventory and Planning Division conducted its second ever National
Forest Inventory during the dry seasons of 2016 and 2017 with the purpose of updating
biomass and carbon stock values for five forest classes: evergreen forest (EF), mixed
deciduous forest (MDF), mixed coniferous broadleaf (MCB), coniferous forest (CF) and dry
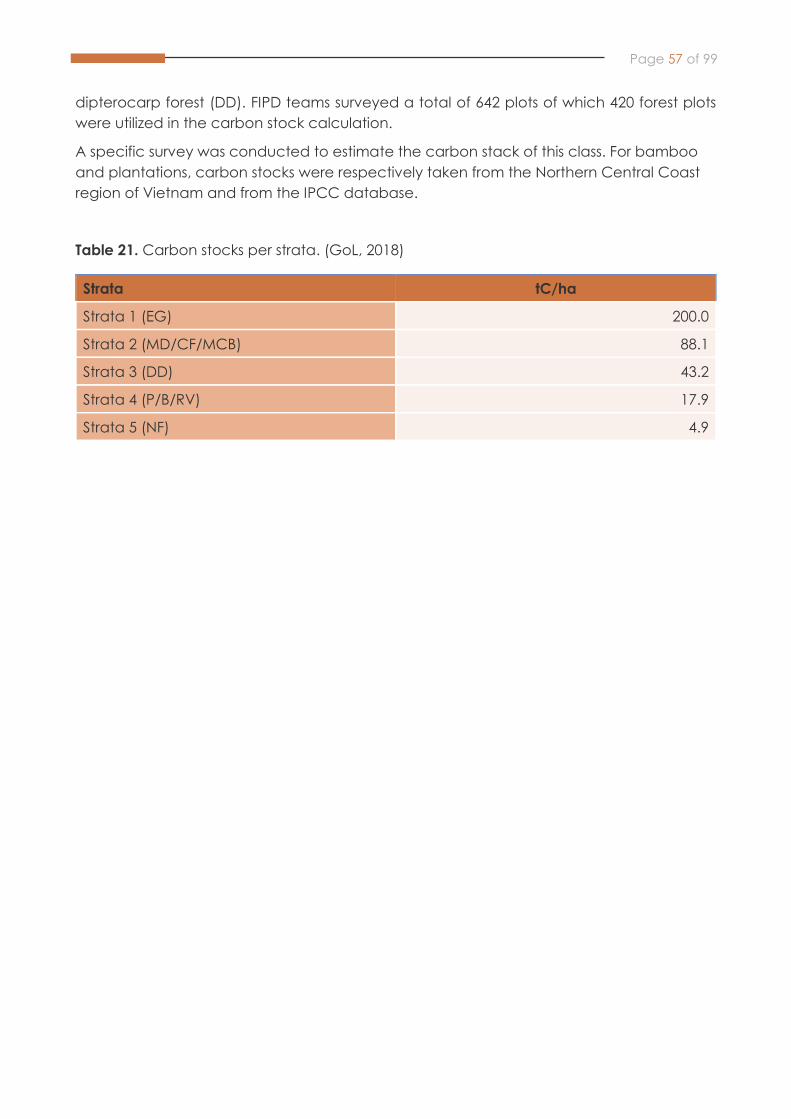
Page 57 of 99
dipterocarp forest (DD). FIPD teams surveyed a total of 642 plots of which 420 forest plots
were utilized in the carbon stock calculation.
A specific survey was conducted to estimate the carbon stack of this class. For bamboo
and plantations, carbon stocks were respectively taken from the Northern Central Coast
region of Vietnam and from the IPCC database.
Table 21. Carbon stocks per strata. (GoL, 2018)
Strata tC/ha
Strata 1 (EG) 200.0
Strata 2 (MD/CF/MCB) 88.1
Strata 3 (DD) 43.2
Strata 4 (P/B/RV) 17.9
Strata 5 (NF) 4.9

Page 58 of 99
6 NATIONAL STATUS: Myanmar
6.1 Institutional context
The Ministry of Natural Resources and Environmental Conservation (MONREC) is responsible
for managing all forestlands in the country including the Permanent Forest Estate (PFE) and
Public Forests. MONREC develops the forest policy and legal frameworks and coordinates
Climate Change related policy analysis and development.
Myanmar has two key forestry laws and policies in place: the 1992 Forest Law, and the 1995
Forest Policy. The 1992 Forest Law supports conservation initiatives, sustainable forestry
practices, socio-economic benefits, and encourages private sector and community
participation in forest management. The Forest Policy focuses on sustainable production,
satisfying basic needs, institutional strengthening, improvements in efficiency, forest and
biodiversity protection, and participatory forestry.
6.2 REDD+ and EU FLEGT National status
6.2.1 REDD+
Between July 2012 – August 2013 Myanmar undertook a process to develop a REDD+
Readiness Roadmap in partnership with the Regional Community Forestry Training Centre
(RECOFTC) and with the support of the Government of Norway and UN-REDD targeted
funds. This roadmap became the basis to guide early stage REDD+ Readiness and formed
the basis of an application to become a full UN-REDD National Programme. Additional
targeted support of US$1,115,000 from UN-REDD was used between 2014 – 2015 to support
implementation of the Readiness Roadmap. Myanmar prepared its Expression of Interest to
become a UN-REDD National Programme in 2015; this was approved at the 15th meeting of
the UN-REDD Policy Board in November 2015. The UN-REDD National Programme was
launched in early 2017 and will run until 2020.
Institutionally, under the overall guidance of the Ministry of Natural Resources and
Environmental Conservation (MONREC), the Myanmar REDD+ Taskforce manages and
coordinates the readiness process. The REDD+ Taskforce is composed of members from

Page 59 of 99
MONREC, the Ministry of Agriculture, Livestock and Irrigation (MoALI), Ministry of Home Affairs
(MoHA) and the Myanmar Environment Rehabilitation-conservation Network (MERN). The
REDD+ Taskforce is supported operationally by a REDD+ Taskforce Office within the Forest
Department. The REDD+ Taskforce draws on the technical inputs from three Technical
Working Groups (TWGs) that together form the REDD+ Stakeholder Network. The three TWGs
are on: drivers and strategies; stakeholder engagement and safeguards; and national forest
monitoring systems and forest reference emission levels/forest reference levels.
Through support from the UN-REDD program, Myanmar has made reasonable progress on
the development of its REDD+ National Strategy. A draft strategy has been elaborated
outlining key interventions to address the various drivers of deforestation and forest
degradation. The strategy is now undergoing stakeholder consultations and is likely to be
available for wider public viewing by late 2018.
The assessment of safeguard impacts of the REDD+ National Strategy is expected to occur
once this is finalized and the elements of the strategy identified. This will also lead to the
identification of the key safeguard components to be integrated into the SIS.
Myanmar expects to develop its preliminary FREL for submission to the UNFCCC by early
2018. Due to the lack of national wall-to-wall forest and land cover maps, this will be
elaborated based on a sampling approach that integrates both global forest cover
datasets with available national datasets and extrapolating trends. In the absence of a NFI,
Myanmar will make use of conservative assumptions for emission factors. An NFI will be
conducted over the next several years.
Limited progress has been made in Myanmar to date on the development of the NFMS.
While national institutions and historical data is available on which to build the NFMS, a lack
of financial resources and limited technical skills has impeded progress. Development of the
NFMS is a priority of the UN-REDD programme.
6.2.2 EU FLEGT
Myanmar entered the preparation phase for a VPA with the EU in 2015. This has been
undertaken under the guidance of a FLEGT-VPA Interim Task Force (ITF) representing
relevant government, civil society and private sector stakeholders. In early 2016, the
Myanmar Forest Certification Committee (MFCC), supported by the Food and Agriculture
Organization of the United Nations (FAO), commissioned a multi-stakeholder, participatory
gap analysis of the current Myanmar Timber Legality Assurance System (MTLAS) to
document the existing MTLAS and describe some of the gaps observed between the MTLAS
and existing international frameworks and best practice for standards and assurance
systems. This report was published in 2017. An executive committee is expected to be
established in early 2018 to engage in formal VPA negotiations.
Table 22. Key Active Multi/Bilateral REDD+ & FLEGT initiatives: Myanmar
Name Focus
UN-REDD Supporting national level REDD+ Readiness

Page 60 of 99
6.3 Forest management and conservation
Administratively, Myanmar defines its PFE to be comprised of three components:
- Reserved Forests. These are forests gazetted for timber production by the state;
- Protected Public Forests. These are forests that are gazette for production of timber and
other products for use locally; and
- Protected Areas (PA).
The PFE accounted for 28.9% of the total area of the country in 2015. Most of the forest
outside the PFE, lies on land designated as “Vacant, Fallow and Virgin” (VFV). Only 60.4%
of the PFE has forest cover. The Forest Policy states that Myanmar’s protected area must
cover at least 10% of the total land area of the country. Data reported to the FAO in 2015
indicates that 4.46 million ha of forest (~6.8% of its land area) are located within protected
areas.
Table 23. Forest categories area in Myanmar. (GoM, 2018b)
Category Cover type Area (hectares) % of country area
Inside PFE
Forest 11,799,238 17.4
Other land use 7,526,245 11.1
Water bodies 209,364 0.3
Total Area 19,534,847 28.9

Page 61 of 99
Figure 16. Map of forest category in Myanmar (GoM, 2018b)
Although tenure over forested land generally lies with the government, other tenure
arrangements also exist, as outlined below:
- Community forests (CF). The most recent version of the Community Forestry Instructions
(2016) specify that CF can be established in Reserved Forest, Protected Public Forest,
Buffer Zones of Protected areas and Land under the management of government
agencies, or owned by private individuals and non-governmental organizations (NGOs).
The Forest Department may issue a permit for Community Forest Enterprise with the aims
of adding value to the current land and freely trade forest products through
commercialization. The Forestry Master Plan (2001) set a target of 920,000 ha under CF’s
by 2030. Currently there are 116,700 ha. To meet the target will require nearly 67,000
ha/year to be established from now until 2030, compared to a current average of 2,810
ha/year.
- Village-owned fuelwood plantations. The Forest Department has established 183,000 ha
of such plantations in the period 1981-2016 on Permanent Forest Estate land. These are
also known as “Village supply plantations”.

Page 62 of 99
- Privately-owned plantations. The National Reforestation and Rehabilitation Programme
has set a target of expansion of privately-owned forest plantations by 8,100 ha, annually.
Up to March 2017, private plantations amounted to 56,100 ha of teak and 35,700 ha of
non-teak species.
6.4 Drivers of forest change
Presented below are the main direct and underlying drivers of deforestation impacting
Myanmar’s forests, as identified in Myanmar’s 2013 REDD+ Readiness Roadmap.
Drivers of DEFORESTATION
Agricultural
Expansion
Forest and
Agriculture
Concessions
Mining
Infrastructure
Development
Aquaculture
Industry
Drivers of FOREST DEGRADATION
Unsustainable
Logging
Fuel Wood
Collection
Pioneering
Shifting
Cultivation
Underlying cause of forest change
Increasing
Demand for Food
and Wood
Products
Population
Growth
Livelihood
Based on
Forest
Poor Forest
Governance
Inconsistencies
with Policies
Figure 17. Drivers of forest change in Myanmar. (GoM, 2013)
A growing population and the increasing demand for food, wood products and other
commodities from domestic and international markets put pressure on remaining forest
resources and are driving rapid land-use change in favour of agriculture and extractive
industries.
Remaining intact forests are being exploited for maximum short-term gain at the cost of
long-term sustainability. For example, large portions of mangrove forest were converted by
aquaculture industries between 1990 and 2010. Additionally, farmers seem to be adapting
to political and economic reforms by shifting from agriculture to commercially more viable
and beneficial cash crops like rubber.
Most large-scale plantations in Myanmar grow rubber, sugar cane or palm oil. While total
plantation area is still relatively limited, expansion is concentrated in a few states/regions
with high local impacts on forest ecosystems and biodiversity. A good example are oil palm
plantations in southern Tanintharyi. This region is the only part of the country that has the
climate and conditions for their large-scale development and management; their
establishment has impacted around 400,000 ha of pristine forest. Bokpyin and Tanintharyi
townships jointly lost more than 75,000 ha of intact forest to oil palm plantation establishment
between 2002 and 2014. By 2017, rubber plantations expansion reached around 650,000

Page 63 of 99
ha. It followed investments from Thailand and Malaysia especially in the states bordering
Thailand (Mon, Kayin and Tanintharyi) and in the north-east in Kachin and Shan states.
The increasing production of corn which follows the growth of the livestock sector is a cause
of deforestation like in Shan State. Shifting cultivation while decreasing since 2000 may still
occur in uplands and impact forested areas.
Mining activity, while being a driver of forest cover change since 2000, in Kachin, Sagaing
and Mandalay states, is not expected to expand and cause further deforestation in the
coming years. However, infrastructures development, particularly the hydropower sector
will have an increasing impact on forested areas.
Illegal logging is taking place in many states and/or regions, although the hotspot appears
to be Kachin state, as timber (and charcoal) are being exported to China illegally.
6.5 Forest status
6.5.1 Forest types
Table 24. Forest definition in Myanmar. (GoM, 2018a)
Forest Definition
Myanmar uses an adaptation of the FAO definition of forests: “Land spanning more
than 0.5 hectares with trees higher than 5 meters and a canopy cover of more than 10
percent or trees able to reach these thresholds in situ”. Mangroves are included, but
perennial agricultural plantations such as oil palm and rubber are not.
The forests are distributed over three climatically distinct regions (i.e. tropical, subtropical
and temperate) with eight major forest types and several subtypes defined by the
occurrence of certain dominant species or species groups (e.g. dipterocarps) or specific
edaphic conditions:
Tropical types:
- Evergreen Hardwood Forests (including mangroves)
- Mixed Evergreen and Deciduous Hardwood Forests
- Dry Deciduous Hardwood Forests
Subtropical types:
- Hardwood Rainforests
- Mountain Forests (including Pine Forests)
Temperate types:
- High Mountain Hardwood Forests
- High Mountain Conifer Forests
- High Mountain Subalpine Scrub Forests
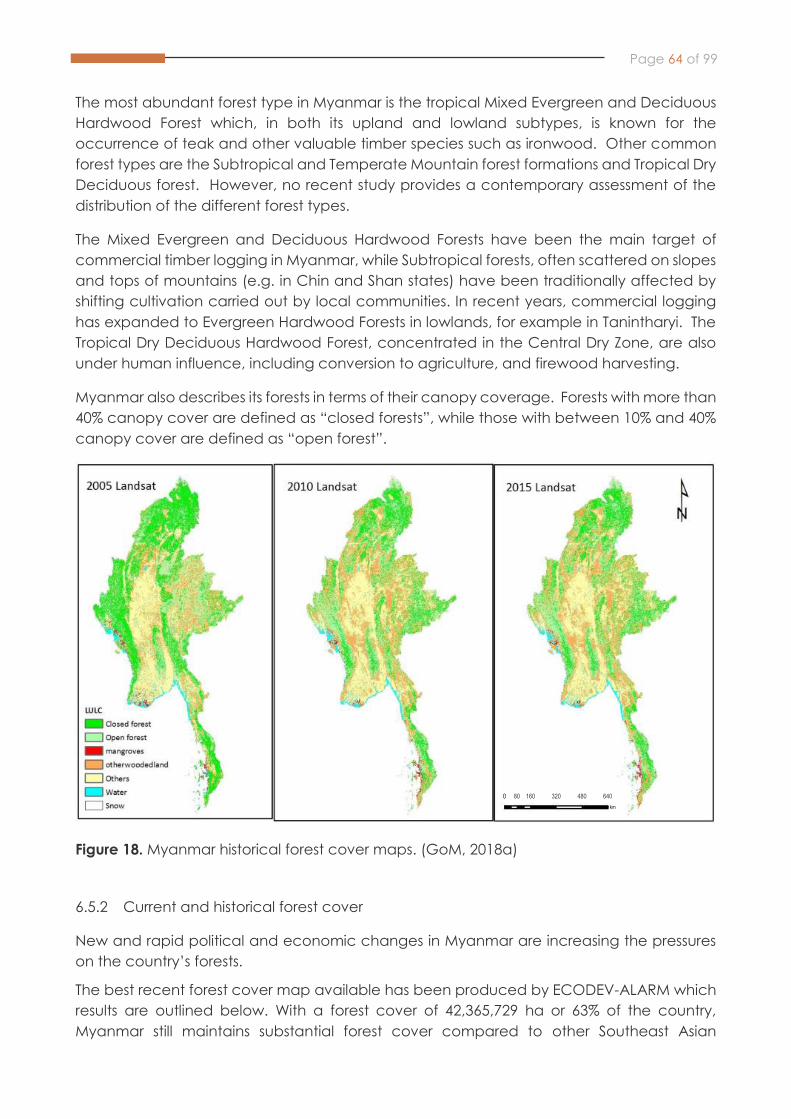
Page 64 of 99
The most abundant forest type in Myanmar is the tropical Mixed Evergreen and Deciduous
Hardwood Forest which, in both its upland and lowland subtypes, is known for the
occurrence of teak and other valuable timber species such as ironwood. Other common
forest types are the Subtropical and Temperate Mountain forest formations and Tropical Dry
Deciduous forest. However, no recent study provides a contemporary assessment of the
distribution of the different forest types.
The Mixed Evergreen and Deciduous Hardwood Forests have been the main target of
commercial timber logging in Myanmar, while Subtropical forests, often scattered on slopes
and tops of mountains (e.g. in Chin and Shan states) have been traditionally affected by
shifting cultivation carried out by local communities. In recent years, commercial logging
has expanded to Evergreen Hardwood Forests in lowlands, for example in Tanintharyi. The
Tropical Dry Deciduous Hardwood Forest, concentrated in the Central Dry Zone, are also
under human influence, including conversion to agriculture, and firewood harvesting.
Myanmar also describes its forests in terms of their canopy coverage. Forests with more than
40% canopy cover are defined as “closed forests”, while those with between 10% and 40%
canopy cover are defined as “open forest”.
Figure 18. Myanmar historical forest cover maps. (GoM, 2018a)
6.5.2 Current and historical forest cover
New and rapid political and economic changes in Myanmar are increasing the pressures
on the country’s forests.
The best recent forest cover map available has been produced by ECODEV-ALARM which
results are outlined below. With a forest cover of 42,365,729 ha or 63% of the country,
Myanmar still maintains substantial forest cover compared to other Southeast Asian
0 80 160 320 480 640
km

Page 65 of 99
countries, However, only 38% of these forests can be considered intact (meaning forest that
has a canopy cover greater than 80%)
Figure 19. Map of forest cover change in Myanmar between 2002 and 2014. (ALARM,
2016)
Between 2002 and 2014, intact forests declined at a rate of 0.94% annually, totalling more
than 2 million ha of forest loss. Losses can be extremely high locally, such as townships that
are hotspots for intact forest loss in Shan, Sagaing, Kachin, and Tanintharyi.

Page 66 of 99
Table 25. Forest cover summary for Myanmar. (ALARM, 2016)
Forest Area
Total Forest Cover (2014) 42,365,729 ha
Source: ECODEV-ALARM, 2016 63 %
Forest Cover Change Trend
DECREASE
Forest area
2002: 43,962,183 ha
2002-2014:
- 133,038 ha/year
2002-2014:
- 0.3 %/year
6.5.3 FREL/REL Summary
The scope of Myanmar’s FREL is national level. Initially, Myanmar prioritized two of the five
REDD+ activities as the focus of the country’s first FREL/FRL submission; deforestation and
enhancement of forest carbon stock through afforestation/reforestation. However, the
current FREL/FRL considers only deforestation.
Three carbon pools of Above Ground Biomass (AGB), Below Ground Biomass (BGB) and
Litter are included in this FREL, using allometric equations derived from district forest
management. One National Emission Factor was used as an uncertainty test is needed for
forest type stratification and national data sources are currently insufficient for this purpose.
Table 26. Carbon pools considered in Myanmar for the calculation of FREL/FRL. (GoM,
2018a)
Carbon Pool Included
AGB YES
BGB YES
Soil organic carbon NO
Dead wood NO
Litter YES
The current FREL/FRL considers only CO2. The reference period is 2005 to 2015.
The amount of deforestation (forest loss) during the reference period has been estimated
using a sample-based approach. This approach was preferred to the use of the wall-to-wall
maps shown in Figure 18. Myanmar historical forest cover maps. The basis for the sample-
based approach were the tree cover 2000 and tree cover loss 2000-2015 maps developed
by the University of Maryland.4 A stratified random sampling generated 1,884 locations
4 http://earthenginepartners.appspot.com/science-2013-global-forest

Page 67 of 99
where the forest change was surveyed by visual interpretation with the software Collect
Earth5 that leverages Google Earth, Landsat and Bing imagery. The results of this survey were
area estimates for forest and non-forest cover for each year and thus area estimates for
deforestation. The final bias-corrected estimated forest loss is 387,527 ha per year over the
period 2005-2015.
It should be noted that the accuracy of the estimated loss is rather low with producer’s and
user’s accuracy being respectively 0.44 and 0.21. The estimated forest loss differs
significantly from the figures shown by the FAO-FRA (see Table 1. Forest area in 2005, 2010
and 2015. (FAO, 2015) or the ECODEV-ALARM map (Table 25. Forest cover summary for
Myanmar.) which are respectively 428,000 ha/year and 133,038 ha/year. Still, the sample-
based area estimates for forest loss was assessed as the most reliable figure.
In conclusion, Myanmar proposes an initial FREL by using the historical average of emissions
during the reference period from 2005 to 2015 which was obtained by multiplying the bias-
corrected area of annual deforestation with the national Emission Factor (EF) of
125.43tCO2e per ha. which is based on inventory results in 40 districts.
Annual CO2 emission from deforestation during the historical reference period 2005-2015
have been estimated as 48,607,511 tCO2 per year.
5 http://www.openforis.org/tools/collect-earth.html

Page 68 of 99
7 NATIONAL STATUS: Thailand
7.1 Institutional context
The Royal Forest Department (RFD) of Thailand was founded in 1896 to consolidate the
exploitation of forests. As a result, all forests were taken into public ownership from the feudal
chiefs to be managed by the Government. With the creation of the Ministry of Natural
Resources and Environment in 2002, the RFD was divided into three Departments:
- The RFD responsible for forests outside Protected Areas,
- The Department of Natural Parks, Wildlife and Plant Conservation (DNP) responsible for
the Protected Areas,
- The Department of Marine and Coastal Resources (DMCR) which manages coastal flora
and fauna, including mangrove forests outside Protected Areas through conservation
and rehabilitation.
All the departments are under the supervision of the Ministry of Natural Resources and
Environment (MONRE).
Thailand has promulgated many forest laws which have been effective to control and
define the processes for forest protection and forest resource management with the aim of
sustainable utilization of forest resources. At present, there are six forest laws being
employed to regulate the forestry activities as follows:
- Forest Act B.E. 2484 (1941) and subsequent amendment B.E. 2532 (1989),
- National Park Act B.E. 2504 (1961),
- National Reserved Forest Act B.E. 2507 (1964) and subsequent amendments B.E. 2522
(1979) and B.E. 2528 (1985),
- Wildlife Preservation and Protection Act B.E. 2535 (1992),
- Forest Plantation Act B.E. 2535 (1992),
- Chainsaw Act B.E. 2545 (2002).

Page 69 of 99
The 12th National Economic and Social Development Plan (NESDP 2017-2021) set a target
for the forest cover to 40% of the country area.
7.2 REDD+ and EU FLEGT National status
7.2.1 REDD+
Thailand was selected as a FCPF REDD Country Participant in 2009 following the submission
of its R-PIN in early 2008. A delay of five years ensued before Thailand submitted its R-PP in
March 2013 which was accepted provisionally subject to revisions which were received in
November 2013. The Readiness Preparation Grant was signed in June 2016, unlocking $3.6
million to support the development of REDD Readiness in Thailand.
At the institutional level, REDD+ is overseen in Thailand by the inter-ministerial REDD+
Taskforce established in 2010 and headed by the Department of National Parks, Wildlife and
Plant Conservation (DNP). In addition to serving as the REDD+ policy making agency to
develop national REDD+ strategy options for REDD+ readiness in Thailand, the REDD+
Taskforce is tasked with establishing a number of Technical Working Groups (TWGs) and
overseeing the REDD+ Office and REDD+ Information Center. The REDD+ Office is the
implementing agency charged with facilitating, implementing and promoting all REDD+
activities. The DNP’s Director of the Forest and Plant Conservation Research Office will lead
the REDD+ Office and draw the membership from DNP, Royal Forest Department (RFD),
Department of Marine Coastal Resources (DMCR) and Forestry Industry Organization (FIO).
The REDD+ Information Center, on the other hand, is a multi-ministerial center charged with
heading all REDD+ carbon registry activities in Thailand. Despite the existence of these
REDD+ institutions, these are only active on a limited basis.
Due to the fact that approval of the FCPF readiness grant only occurred recently, Thailand
has made only limited progress on achieving REDD+ readiness. It is expected that the
development of the national REDD+ strategy will commence in early 2018 once R-PP funds
begin to be spent, after which the assessment of potential safeguards the strategy triggers
can be assessed and key indicators to be monitored and reported in the SIS identified.
Whilst Thailand does not yet have a FRL/FREL or a NFMS, the expectation is that these should
not be too difficult to establish due to the high technical capacities and extensive data
already available in Thailand, including an advanced forest monitoring system and existing
national forest inventory data. The main challenges to pull the NFMS together will be to
establish consistent definitions and parameters for forest types for both the activity data and
emission factors, as well as coordinating the different agencies currently involved with forest
monitoring.
7.2.2 EU FLEGT
Thailand officially entered into the VPA process in September 2013. Also, in 2013, Thailand
established a multi-stakeholder as-hoc working group (AHWG) to develop the VPA legality
definition and is now also tasked with developing all VPA annexes. The same year also saw
Thailand found its Thai-EU FLEGT Secretariat Office (TEFSO) within the Royal Forestry
Department. The military coup in 2014 put the prospect of negotiations on hold until 2015
when the European Commission and Thai government agreed that technical negotiations
could resume. 2016 saw TEFSO and the AHWG continue to develop the VPA annexes and

Page 70 of 99
in December of the same year the Thai Cabinet approved moving towards full negotiations.
In mid-2017 the first face-to-face negotiations between Thailand and the EU took place.
Table 27. Key Active Multi/Bilateral REDD+ & FLEGT initiatives: Thailand
Name Focus
FCPF Supporting national level REDD+ Readiness
FAO EU FLEGT FAO-EU FLEGT Programme’s support to Thailand
has largely focused on strengthening TEFSO and
Civil Society Organisations (CSOs) to facilitate,
and substantively engage in, the VPA process.
FAO FLEGT’s support also covers technical inputs
for the development of Thailand’s TLAS and other
technical VPA annexes.
7.3 Forest management and conservation
In 2013, there were 1,221 National Forest Reserves that cover 23 million ha. The RFD manages
11.8 million ha of forest lands, which consist of National Forest Reserves (10.12 million ha) and
Permanent Forest Estates outside NFRs (1.68 million ha). The DNP manages national parks,
wildlife sanctuaries, watersheds, and other protected areas, some of which overlap the
boundaries of National Forest Reserves. The table below outlines the forest lands managed
by the DNP and the RFD.
Table 28. Forest areas under jurisdiction of DNP, RFD and MoA. (NEPCON, 2017)
Conservation
Type Jurisdiction Number Area (ha)
% of the
country
Degraded land
within National
Forest Reserve
Ministry of
Agriculture 5,220,000 10.18
National Forest
Reserve RFD 10,120,000 19.74
National Forest
Reserve (Area that overlaps
with National parks
and Wildlife
Sanctuary)
DNP 7,690,000 15.00
National Forest
Reserve 1.221 23,000,000 44.85
Permanent
Forest Estate RFD 1,680,000 3.28
National Park DNP 127 6,220,000 12.13
Wildlife
Sanctuary DNP 58 3,660,000 7.13
No Hunting Area DNP 60 523,304 1.02

Page 71 of 99
Conservation
Type Jurisdiction Number Area (ha)
% of the
country
Forest Park DNP 113 123,671 0.24
Botanical
Garden DNP 16 4,137 0.01
Arboretum DNP 55 4,265 0.01
NFR are divided into 3 zones:
- Conservation Forest Zone (Zone C): covers existing protected forest areas declared in
the royal decrees and cabinet resolutions (wildlife sanctuaries, national parks,
watershed classification 1, mangrove conservation areas). Some of this area remains
occupied by permanent agriculture, shifting cultivation, and associated human
settlements.
- Economic Forest Zone (Zone E): was set aside for buffer zones, commercial tree
plantations, mining, and other economic development activities. Some of these lands
are in degraded forest areas.
- Agricultural Zone (Zone A): is a portion of the national forest reserve deemed suitable for
agriculture. These areas are being allocated to farmers by the Agricultural Land Reform
Office (ALRO).
Although there are communities residing in Protected Areas (national parks and wildlife
sanctuaries) and national Reserved Forests, community forestry can be legally conducted
in Reserved Forests only by virtue of Section 19 of National Reserved Forest Act 1964 and it
must be jointly done by communities and forestry officers. For the Protected Areas, the
intention of the law is to protect river sources and manage national forest and natural
resources and biodiversity. Therefore, community forestry is not allowed in the Protected
Areas.
In the 1970s, looking for ways to address the country's rampant deforestation, the Thai
government officially recognized community forestry as a tool for sustainable forest
management. By 1989, an estimated 8,000 sites existed, and today there are more than
10,000. The Ministry's Royal Forest Department, responsible for all forests not in protected
areas, has long supported community forestry and has a sub-department that supports
communities in legalizing sites. In contrast, the Ministry's National Park, Wildlife, and Plant
Conservation Department, responsible for protected-area forests, has largely worked to
prevent community forestry in protected areas, operating under the exclusionary National
Park law. As of 2010, the Royal Forest Department had formally recognized and registered
around 7,000 community forests, all outside of protected areas, and it is actively seeking to
register more.
7.4 Drivers of forest change
The revised R-PP submission to the FCPF in 2013 identifies the following drivers of forest cover
change:

Page 72 of 99
Figure 20. Drivers of forest change in Thailand. (RTG, 2013)
Policies adopted since the first NESDP to the sixth (from 1961 to 1991) promoted in priority
the economic development of the country. Therefore allocation of forest concessions, or
concessions for mining sector and infrastructure development impacted forest resources. In
addition, the promotion of intensive commercial monoculture crops resulted in the
expansion of agricultural land.
Forest degradation has mainly been caused by illegal logging, harvesting of non-timber
forest products for commercial purposes and uncontrolled forest fires. Figures from the RFD
in 2012 showed that fires resulted in 5,475 ha of forest loss mainly in the north and north-east
parts of the country.
Illegal logging and the timber trade are extremely profitable due to strong timber demand
in East and Southeast Asia, high prices and the existence of high value species, such as
Dalbergia cochinchinensis (price about US$ 5,000 per m3). The Department of National Parks
reported an increase in the value of confiscated D. cochinchinensis between 2009 -2012,
from US$ 1 million in 2009 to more than US$ 4 million in 2012.
7.5 Forest status
7.5.1 Forest types
Table 29. Forest definition used in Thailand. (NEPCON, 2017 and FAO 2010 Forest Resources
Assessment Thailand)
Forest Definition
Land spanning more than 0.5 hectares with trees higher than 5 meters and a canopy
cover of more than 10 percent, or trees able to reach these thresholds in situ. The
definition excludes eucalyptus plantations, or trees planted primarily for non-timber use
such as agroforestry systems, fruit orchards, rubber and palm plantations.
Drivers of DEFORESTATION
Drivers of FOREST DEGRADATION
Underlying cause of forest change
Agricultural
Expansion
Unclear Land
Allocation
Population
Growth
Livelihood
based on
Forest
Mining and
Hydropower
Forest
Concession
Infrastructure
Development
Commercial
Harvesting of
NTFP
Illegal
Logging Forest Fire

Page 73 of 99
Forests in Thailand are rich in biodiversity; they possess approximately 7% of the world flora
and fauna. There are more than 2,000 species of flora and fauna that are endemic only to
Thailand.
There are two main types of forests in Thailand: evergreen forest and deciduous forest.
The evergreen forest is subdivided into tropical evergreen forest, pine forest, and mangrove
and beach forest:
- Tropical evergreen forest is found all over the moist part of the country. This type of forest
is also subdivided into the tropical rain forest, the semi-evergreen forest and the hill
evergreen forest:
o Tropical rain forest is characterized by a very rich flora and very dense
undergrowth. This type of forest is commonly found in the Southern and the
Eastern regions where rainfall is above 2,000 millimetres. The predominant
species (the top store species) are, for example, Dipterocarpus spp, Hopea
spp, Lagerstroemia spp, and Shorea spp,
o Semi-evergreen forest is scattered all over the country where the rainfall is
between 1,000-2,000 millimetres. The predominant species are Dipterocarpus
spp, Hopea spp, Diospyros spp, Afzelia spp, Terminalia spp, and Artocarpus
spp.
o Hill evergreen forest is found on the highlands (above 1,000 meters elevation).
The presence of mosses and lichens on trees and rocks is the indicator of this
forest type. The predominant species are oaks (Quercus spp) and chestnuts
(Castanopsis spp and Lithocarpus spp).
- Pine forest has two species of tropical pines, Pinus merkusii found in the northern and the
western part of the Central region, where the soil is poor, and P. kesiya found only the
highlands of the Northern and Northeastern regions.
- Mangrove forests occur along the coastal areas of the Eastern, Central and Southern
regions. The predominant species are Rhizophora spp, Xylocarpus spp, Avecennia spp,
Bruguiera spp, and Nypa spp.
- Beach forests occur along the sandy coastal plains especially in the eastern coast of the
Southern region. The main species in this type of forest are Diospyros spp, Croton spp,
Lagerstroemia spp and Casuarina spp.
Deciduous forest is characterized by the presence of deciduous tree species and is
commonly found throughout the country. It is subdivided into the mixed deciduous forest
and the dry dipterocarp forest.
- Mixed deciduous forest is commercially among the most valuable forest of Thailand with
Tectona grandis, Xylia kerrii, Pterocarpus marcrocarpus, Afzelia xylocarpus and
Dalbergia spp (rose wood) as the dominant species.

Page 74 of 99
- Dry dipterocarp forest is commonly found in the dry area (rainfall below 1,000 millimetres)
with sandy soils. The predominant species are mainly Dipterocarpaceae such as
Diptercarpus tuberculatus and D. obtusifolius.
DNP reported in 2007 that the most common forest types were tropical evergreen forest
(66%, including hill evergreen forest and dry evergreen forest), mixed deciduous forest (8%),
dry dipterocarp forest (7%) and pine forest (6%).
In addition to the evergreen and mixed deciduous forest types, in 2007, the country had
about 2.5 million hectares of plantations (about half of which are rubber plantations, which
are considered to be agricultural crops). Rubber planting has been actively promoted by
the Government since the 1960s and the total area reached 1,906 million ha in 2005 and
2.377 million ha in 2007, of which 75% is found in the Southern region, 10% in the Eastern
region and 14% in the Northeast region.
7.5.2 Current and historical forest cover
The forest cover reported by the DNP in 2013 was 16,339,126 ha. This figure with those
displayed in the table below confirm that forest cover is increasing in Thailand. However,
the Figure 2. Deforestation and reforestation 2000-2015 from CCI Land cover maps, which
illustrates the regional deforestation from global historical land cover maps, showed that
deforestation in Thailand occurred essentially between 1995 and 2005 near the border with
Myanmar and principally in two locations, the south of Mae Hong Song province and in
Kanchaburi province.
Forest increase comes from government policies that support reforestation of degraded
forest areas through tree planting campaigns. The first NESDP in 1965 initiated this effort and
by 2012, 650,000 ha were planted (LEAF, 2015). Also, recent efforts to enact the legislation
enabled the RFD to retrieve forest land from illegal encroachment. Between 2010 and 2012,
17,530 ha were retrieved principally from the northern regions (7,188 ha).
Table 30. Forest cover summary for Thailand.
Forest Area
Total Forest Cover (2015): 16,347,969 ha
Source: Department of Natural Parks, Wildlife and Plant
Conservation-2016
31.6 %
Forest Cover Change Trend
INCREASE
Forest area
2005: 16,100,000 ha
2015: 16,399,000 ha
Source: FRA - FAO, 2015.
2005-2015:
+ 29,900 ha/year
2005-2015:
+ 0.19 %/year

Page 75 of 99
Figure 21. Forest cover map of Thailand in 2015-2016. (Source: DNP, 2016)
7.5.3 FREL/REL Summary
As outlined in Chapter 7.2.1, Thailand has not yet developed its FREL/FRL.

Page 76 of 99
8 NATIONAL STATUS: Vietnam
8.1 Institutional context
The forest in Vietnam (SRV, Socialist Republic of Vietnam) is managed by the Vietnamese
Forestry Administration (VNFOREST), which is under the Ministry of Agriculture and Rural
Development (MARD). Management is governed by the 1992 Law on Forest Protection and
Development, last amended in 2004.
Between 1998 and 2010, in order to halt deforestation and increase forest cover to 43% by
2010, the government implemented publicly funded forestry projects under the Five Million
Hectares Reforestation Program (Program 661). The results from the program have been
mixed6. Although it has gone a long way in meeting its targets for protection forest, it has
fallen below its expectations for regeneration, particularly for plantations. Consequently,
6 Vietnam R-PP Readiness Preparation Proposal, 2011

Page 77 of 99
Program 147 “support for development of forest plantations” (2007-2015) which focuses on
production forests was introduced.
The Land Law (2003) clarifies the framework for forestry land tenure and enables the
allocation of forest land to communities as well as to individual households. In 2005, the
Forest Protection and Development Law recognizes distinct categories of forest ownership,
with varying responsibilities and rights for forest management.
8.2 REDD+ and EU FLEGT National status
8.2.1 REDD+
Vietnam was the earliest REDD+ mover in the region, submitting an ER-PIN to the FCPF
already in March of 2008, only a few months after the FCPF formally launched at the 2007
Bali COP. A Readiness grant was approved for Vietnam by the FCPF in March 2011 subject
to the submission of a revised R-PP. Vietnam resubmitted its revised R-PP in November 2011
and the Readiness Grant Agreement was signed in 2012. Vietnam’s 2015 mid-term progress
report requested an additional US$5 million of Readiness funds from the FCPF which were
granted in October 2016.
During this time, Vietnam also became a UN-REDD National Programme. The UN-REDD’s
Policy Board approved Vietnam in March 2009 and the programme ran until June 2012.
Phase II of UN-REDD programme began in July 2013 and is expected to run until the end of
2018.
In order to receive results-based payments for performance, Vietnam submitted an ER-PIN
to the FCPF Carbon Fund in May 2014. This was selected for inclusion into both Tranche A
and B of the Carbon Fund in June 2016 and a Letter of Intent (LOI) signed in January 2015.
Vietnam’s first ER-PD was submitted in November 2016 and a revised version resubmitted in
November 2017. The ER Programme focuses on six provinces: Thanh Hoa, Nghe An, Ha Tinh,
Quang Binh, Quang Tri, Thua Thien Hue.
In addition to multi-lateral support, Vietnam has benefited from a number of REDD+ specific
initiatives, that have helped Vietnam become one of the most advanced REDD+ countries
globally. These include:
Sustainable Natural Resource Management Project (SNRM Project), funded by JICA
Provincial Government Support for the Preparation and Implementation of REDD+ Pilot
Activities in Quang Binh, funded by GIZ
Delivering Environmental and Social Benefits from REDD+ in South East Asia (MB-REDD)
funded by SNV
REDD+ Planning Implementation in Dien Bien (SUSFORM-NOW), funded by JICA
REDD+ Pilot Implementation in Dien Bien (SUSFORM-NOW), funded by JICA
Vietnam Forests and Deltas Programme, funded by USAID
Forest Management Information Systems Project (FORMIS), funded by the Ministry of
Foreign Affairs of Finland
Until November 2017, the National REDD+ Steering Committee (NRSC) was the ultimate
body with responsibility for managing the REDD+ readiness process and overall
implementation. This responsibility has now been passed to National Target Programme for

Page 78 of 99
Sustainable Forest Management headed by the Deputy Prime Minister and deputized to
the Minister of Agriculture and Rural Development (MARD). As with the National REDD+
Steering Committee, this is a multi-sectoral body. Day-to-day management for the REDD+
process is delegated to the Vietnam REDD+ Office (VRO) which sits within VNFOREST in
MARD. Six Technical Working Groups (TWGs) have also been established on: i) REDD+
governance; ii) MRV; iii) REDD+ financing and benefit distribution; iv) local implementation;
v) private sector engagement; and vi) safeguards.
Vietnam began development of the first National REDD+ Action Programme (NRAP) as early
as 2011, with official endorsement of this NRAP coming from the Prime Minister in 2012. This
NRAP was to govern the period between 2011 – 2020 and be implemented in two phases:
1) 2011 - 2015 with a focus on awareness raising, capacity building and pilot activities in at
least 8 provinces; and 2) 2016 - 2020, where Vietnam will extend its capacity building efforts,
accomplish technical and institutional requirements for implementing REDD+ and
implement demonstration activities at the national scale. A review of progress in the NRAP
implementation was carried out at the end of the first phase of the NRAP (2011 – 2015) and
determined that a revision of the NRAP was necessary to better guide REDD+
implementation, particularly with regards to developing mitigation strategies that went
beyond the forest sector and engaged additional sectors. Revision of the NRAP occurred
in 2016 and the revised NRAP was given Prime Minister approval in April 2017. Following this,
Vietnam is now in the process of developing a National REDD+ Investment Plan (NRIP) for
the period 2017-2020.
With the support of the UN-REDD Phase II program, as well as the FPCF and other donor
REDD+ projects, Provincial REDD+ Action Plans (PRAPs) have also been developed in the six
provinces forming the ER Program. Whilst developed primarily to support the development
of the ER-PD and came before the revision of the NRAP, these PRAPs now need to be
updated to better align with the revised NRAP.
To date, work on safeguards in Vietnam has included the conduct of a legal study on
Vietnam’s existing safeguards-relevant policies, laws and regulations (PLRs) and the extent
to which they are consistent with the scope and content of the Cancun safeguards. An
assessment of the extent to which these PLRs are being implemented in practice was
conducted in 2016. In addition, a considerable amount of work was carried out to provide
a national “clarification” or “interpretation” of the Cancun safeguards in accordance with
Vietnam’s national context including through extensive consultations with the STWG-SG.
Finally, a framework design document was produced for Vietnam’s Safeguard Information
System (SIS) in late 2016. Development of the SIS currently remains in its early stages.
It should be noted that under the auspices of the first FCPF grant assessments of the
environmental and social impacts of the ER Programme were conducted, resulting in a SESA
(Strategic Environmental and Social Assessment) and ESMF (Environment and Social
Management Framework). Under the additional FCPF readiness funding, a SESA of the
revised NRAP is now also being conducted.
Vietnam was one of the first countries globally to submit a FREL/FRL to the UNFCCC for
technical assessment in January 2016. Based on feedback from the technical assessment
the FREL/FRL was revised throughout 2016 and final, revised version submitted in December
2016. In addition to the national FREL/FRL, a reference emission level (REL) and reference

Page 79 of 99
level (RL) for the ER Programme area was also developed and incorporated into the ER-PD
submission. For both of these submissions, the methodological approach is outlined and the
historical data is made available and adjustments for national circumstances explained
transparently, consistent with UNFCCC guidance. Vietnam is currently attempting to assess
performance against its FREL up to the year 2016.
With respect to the development of its NFMS, Vietnam is able to make use of its existing
Forest Resources Monitoring System, which has undergone a digitization process under the
Forest Management Information Systems Project (FORMIS), as the basis for its activity
reporting. For the MRV component of the NFMS, Vietnam has a number of existing
government programs and initiatives that can contribute to the generation of the necessary
activity data and emission factors, including the National Forest Inventory Monitoring and
Assessment Program (NFIMAP), National Forest Inventory and Statistics (NFIS) or Annual
Forest and Forestland Monitoring Report Program (AFLMRP). Seeking clarification on which
system to use for MRV purposes and establishing the institutional linkages to aggregate the
relevant information are currently under development.
To date, Vietnam has not benefited from any form of results-based payments for REDD+
performance.
8.2.2 EU FLEGT
Vietnam began negotiating its VPA with the EU in November 2010. For Vietnam, negotiations
were led by the Vietnam Administration of Forestry (VNFOREST) under the Ministry of
Agriculture and Rural Development. Following this, in 2001, Vietnam established an inter-
ministerial FLEGT-VPA Steering Committee to support these negotiations.
Additionally, also in 2011, Vietnam established two Working Groups: one to prepare the
timber legality definition and another to prepare the legality assurance system. These
Working Groups included representatives from government, industry association and one
international NGO. Vietnamese civil society was not, however, party to the negotiations
and was only able to provide inputs through public consultations. In response, local NGOs
established a VNGO FLEGT Network in 2012 to promote and coordinate civil society inputs
in the process.
In November 2016, six years after beginning negotiations, Vietnam and the EU agreed, in
principle, on the content of the VPA before initialling the VPA in May 2017. Both Vietnam
and the EU will now have to complete the procedure for signing and ratifying the VPA in
line with their internal procedures.
1. Legal framework. The programme provides advisory support for the drafting of legal
documents, including for conservation-oriented financing mechanisms (payment for
environmental services, PFES), protected area management, and sustainable forest
management. It also contributes the lessons learned from the projects in the
provinces (incl. Phong Nha-Khe Bang project in Quang Binh Province) to the REDD+
process at the national level.
2. Development of institutional capacity. The programme assists the partner ministry in
implementing the National Capacity Development Plan for Protected Area
Management. The Department of Nature Conservation is supported to introduce

Page 80 of 99
information management systems to improve forest ranger patrolling strategies in
protected areas (“SMART” Tool). Experiences drawn from the certification of two
forestry companies are being used to contribute to the development and
implementation of a national sustainable forest management plan, and to
strengthen the capacities of service providers to enable them to assist additional
forestry companies with certification.
3. Timber legality (VPA FLEGT and TLAS). The programme is advising the partner within
the context of FLEGT negotiations, including the design of timber legality assurance
systems. The project will also provide support to strengthen the capacities of the
verification authorities.
Table 31. Key Active Multi/Bilateral REDD+ & FLEGT initiatives: Vietnam
Name Focus
FCPF Supporting national level REDD+ Readiness
UN-REDD Phase II Supporting national level REDD+ Readiness
Sustainable Natural Resource
Management Project (SNRM Project),
funded by JICA
Supporting policies for storing biodiversity
information in NBDS which is indispensable for
implementation of biodiversity conservation
policy
Aiming for Forest Monitoring System using
tablet-PC developed by JICA to be adapted
as officialized system in the country
cooperating with provinces and other
Development Partners.
Building capacity that enables full
implementation of REDD+ activities at the
national level as well as the provincial level in
the northwest.
Supporting the implementation of
Collaborative Management in Lam Dong
province, in a manner consistent with
UNESCOʼs MAB Programme.
Conservation and sustainable use of
forest biodiversity and ecosystem
services, GIZ
Legal framework. Advisory support for the
drafting of legal documents, including for
conservation-oriented financing mechanisms,
protected area management, and sustainable
forest management. Contributes lessons learned
from projects in provinces (incl. Phong Nha-Khe
Bang project in Quang Binh Province) to the
REDD+ process at the national level.

Page 81 of 99
Name Focus
Development of institutional capacity. Assists
partner ministry in implementing the National
Capacity Development Plan for Protected Area
Management. The Department of Nature
Conservation is supported to introduce
information management systems to improve
forest ranger patrolling strategies in protected
areas. Contributes to the development and
implementation of a national sustainable forest
management plan, and to strengthen the
capacities of service providers to enable them to
assist forestry companies with certification.
Timber legality (VPA FLEGT and TLAS). Advising
partner within the context of FLEGT negotiations,
including the design of timber legality assurance
systems. Provides support to strengthen the
capacities of the verification authorities.
FAO EU FLEGT FAO-EU FLEGT Programme has coordinated
closely with GIZ and other stakeholders to
support key interventions necessary to develop
the systems, laws and regulations needed for
successful VPA implementation. FAO FLEGT is
also collaborating closely with UN-REDD in
Vietnam, which has provided support to
developing central elements of Vietnam’s
Timber Legality Assurance System (TLAS).
8.3 Forest management and conservation
The overall objective of forest management in Viet Nam, as defined in the Viet Nam Forestry
Development strategy 2006-2020, is to sustainably manage 16.24 million ha zoned for forest
land and increase forest cover to 47% by 2020.
As of 2016, Viet Nam had 14.4 million ha of forested land, covering 41% of the total country,
including 10.2 million ha of natural forests and 4.2 million ha of plantation forests.
Forest types in Vietnam are classified into three categories: Special-use Forest, Protection
Forest and Production Forest.
- Protection forests are used to: protect water resources, catchments and land; prevent
erosion and desertification; mitigate natural disasters; and regulate climate. Protection
forests include: watershed; wind-, sand- and wave-break; sea encroachment and
environmental protection forest subcategories.

Page 82 of 99
- Special-use forests (SUFs) are used mainly to preserve nature (as a national park, nature
reserve or a species habitat conservation area), representative ecosystems, plant and
animal gene pools; for research purposes; to protect historical, cultural relics and
landscapes; and to provide resort and tourism services. They also often have a dual
purpose of acting as a watershed protection forest.
- Production forests are used mainly for production of timber and NTFPs. Production forests
include natural, plantation and seed forests.
Table 32. Breakdown of forest categories by forest type. (SRV, 2017)
Forest Management
Areas (ha) Forest Category
Outside
Forest
Categories
Total Area
Forest
Type (ha)
Type of forest/Forest
Category
Special -
use
Forest
protection
Forest
production
Natural forest 2,055,270 3,871,422 3,915,643 399,806 10,242,141
Plantation forest 82,062 666,430 2,756,413 630,636 4,135,541
Total Area Forest
Category (ha) 2,137,332 4,537,852 6,672,056 1,030,442 14,377,682
Figure 22. Map of forest category in Vietnam. (VNFOREST 2017)

Page 83 of 99
In Vietnam, all forest lands are officially claimed as state property. The government
allocates land use rights to different economic entities, such as:
- State-owned forest management board (FMB) authorized to manage special-use
forests and protection forests,
- State-owned forestry enterprises (SFE) mandated to manage protection and
production forests,
- Individual households,
- Communities,
- Commune People’s Committee (CPC)
- Army units,
- Other economic entities that are authorized to manage protection and production
forests.
In 2014, SFEs manage 1.9 million ha of forests (accounting for 14% of total forests), of which
75% is natural forests and the remainder are plantations.
FMBs control nearly 4.2 million ha of forests (34% of total forests), primarily special-use forests
and protection forests for biodiversity conservation and environmental protection purposes.
The proportion of natural forest under FMB management is 85%.
Around 3.4 million ha of forests (approximately 24%) have been allocated to individual
households, of which 55% are natural forests.
CPCs currently manage around 2.3 million ha (16% of the total forests), of which 1.9 million
ha are natural forests. The government gives CPCs rights to temporarily manage some
forestlands, which they have not yet allocated to other entities.
Registered communities and other group of local communities manage around 1.13 million
ha (8% of forests).
Table 33. Breakdown of forest management entities (MARD 2014).
Management Entity % of forest land
Forest Management Board 34
State-owned Forestry Enterprise 14
Individual Household 24
Communities 4
Commune People’s Committee 16
Army 2
Other Economic Entity 2
Other 4

Page 84 of 99
8.4 Drivers of forest change
Currently, the main direct drivers of deforestation and degradation are generally agreed to
be: (i) conversion to agriculture (particularly to industrial perennial crops); (ii) unsustainable
logging (notably illegal logging); (iii) infrastructure development; and (iv) forest fires.
Figure 23. Drivers of forest change in Vietnam. (SRV, 2011a)
Agricultural expansion is predominantly for cassava and perennial cash crops. Most of the
recent expansion in the perennial industrial crops such as coffee or cashew has
concentrated particularly in two places, the Central Highlands and the Southeast regions.
In the Central Highlands, between 1990 and 2000, the area for coffee plantations increased
from 50,000 to 500,000 hectares.
In 2009, Vietnam started to promote the development of rubber on poor and degraded
areas. However, in the Central Highlands, the conversion of forest land to rubber plantations
led to large scale deforestation as the criteria defining poor forest were poorly followed by
provincial administration authorities. The country has already surpassed its national target
on rubber production and its policy is now the stabilization of the area under production, as
well as to stop conversion of natural forests
Tree plantations which often occurred on degraded natural forest areas, have played a
crucial role in Vietnam’s forest transition. Nationally, there are over 1.1 million ha of acacia
plantations for wood production, managed on 5 to 10 years rotation cycles. In Thanh Hoa
province, the area of tree plantations increased from 87,100 ha in 2001 to 180,300 ha in
2014.
To support the country’s development, transport infrastructure and hydropower dams were
built. The building of roads in remote rural areas has often, inadvertently created the means
by which otherwise inaccessible timber has become transportable and marketable. The
Drivers of DEFORESTATION
Drivers of FOREST DEGRADATION
Underlying cause of forest change
Conversion to
Agricultural
Land
National
Economic
Growth
Weak Forest
Governance and
Land Management
Increased Demand
for Forest and
Agriculture Product
Infrastructure
Development
Unsustainable
Logging Forest Fire

Page 85 of 99
road network in Vietnam have more than doubled in length between 1990 and 2010. Dams
impacted forested area; On the Dong Nai river, several dams destroyed more than 15,000
ha of forest.
The underlying drivers of deforestation are the overall country’s demographic and
economic growth which led to an increased demand for products from forest and
agriculture.
Unsustainable exploitation and encroachment has been identified as the main drivers of
forest degradation. Timber harvesting (legal and illegal) occurred in both plantations and
natural forests and has led to a reduction of biodiversity values and forest stocks.
Encroachment can be caused by shifting cultivation practices which are still implemented
by farmers in Central Highlands but also in the provinces bordering Laos in the North-West
and North Central Coast.
More than 6 million hectares of forests in Vietnam are associated with having a high fire risk.
According to VNFOREST, from 2002 to 2010, there were 704 forest fires leading to 5,081.9 ha
of forest cover lost.
The underlying causes of forest degradation and especially illegal logging are multiple. First
illegal logging is driven by the increased demand for timber and its high profitability. Then it
is facilitated by the lack of forest monitoring and enforcement at local level as well as issues
in forest delineation and allocation of adequate use-rights to local communities.
8.5 Forest status
8.5.1 Forest types
The Table 34 below shows the forest definition provided by the Circular 34 (2004) and used
in Vietnam for the calculation of the FREL/FRL.
Table 34. Forest definition in Vietnam. (SRV, 2016)
Forest Definition
A forest is an area of at least 0.5 ha,
with a canopy cover of 10% and with trees that reach more than 5 meters height
New forest plantations of timber trees and newly regenerated forests of forest
plantations are identified as forests if they reach the average height of over 1.5 meters
for slow-growing species, and over 3.0 meters for fast-growing species and a density of
at least 1,000 trees per hectare.
The classification system identifies seventeen land cover classes of which twelve are forest
types. The distinction between rich, medium and poor forest is based on average timber
stock, respectively more than 200 m3/ha, between 100 and 200 m3/ha, and less than 100
m3/ha.

Page 86 of 99
Table 35. Forest types in Vietnam. (SRV, 2016)
Forest type and other land cover
Evergreen broadleaf forest - rich
Evergreen broadleaf forest - medium
Evergreen broadleaf forest - poor
Evergreen broadleaf regrowth forest
Deciduous forest
Bamboo forest
Mixed wood and bamboo forest
Coniferous forest
Mixed broadleaf and coniferous forest
Mangrove forest
Forest on rocky mountain
Plantation forest
Rocky mountain without forest
Barren land planned for forestry
Water
Residential area
Other land
The evergreen broadleaf forest is the dominant forest type in Vietnam. According to Table
37 and the NFIS (National Forest Inventory and Statistics) figures, when considering all
evergreen broadleaf forest sub-types (rich, medium, poor and regrowth), it represents
nearly 50% of all forest cover. This type has a diverse ecology with a multi-storey forest
structure dominated by Dipterocarpacea species. It is mainly located along the border with
Laos in the Annamite range, and in the northern provinces.
Deciduous forest representing 4% of the forest cover is mainly located in the south of the
country in Dak Lak and Gia Lai provinces.
Bamboo forest and mixed woody and bamboo are found in areas where shifting cultivation
is practiced in the North-west of the country like Nghe An province. It represents
respectively, 2.5% and 0.5% of the forest cover.
Forest on rocky mountain which represents 6% of the forest cover is principally forest on
limestone which can be found in the north and north central regions like in Phong Nha-Ke
Bang special-use forest.
Coniferous forest can be found in the south like in Lam Dong province with main specie
being Pinus merkusii and in the north, close to Chinese border with Fokienia hodginsii as main
specie. Coniferous forest represents only 1% of forest cover.
Plantation forest represents 27% of total forest cover with rubber, acacia and pine as main
species.

Page 87 of 99
8.5.2 Current and historical forest cover
To monitor forest cover change, the Forest Inventory and Planning Institute (FIPI) produced
the NFI maps (National Forest Inventory) for the years 1990, 1995, 2000, 2005, 2010. To support
the REDD+ national strategy and the development of the FREL these maps have been
revised by JICA and UN-REDD.
For the period going from 2010 to 2016, the most recent dataset regarding forest is the
National Forest Inventory and Statistics (NFIS), which is a national survey monitored by MARD
and implemented by the following institutions: FIPI, VAFS Vietnamese Academy of Forestry
Science (VAFS) and the Vietnamese National Forestry University (VNFU). NFIS has a very
different approach than the NFI which is fed by maps produced with remote sensing
techniques. NFIS is implemented at the provincial level and collates information from forest
rangers for each forest units in regards with forest status, function, cover, ownership,
management etc. This data is then aggregated at the provincial and national level to
provide overall statistics on forest status in the country.
Table 36 below displays official figures published by VNFOREST in 2017, taken from NFIS
statistics, on the forest cover as of end of 2016. Natural forest covers 10,242,141 ha while
plantation forest covers 4,135,541 ha which includes 745,749 ha of young plantations that
do not reach the minimum canopy cover of the forest definition. Therefore, the total forest
cover is 13,631,934 ha which represents 41.19% of the country. Another official document
from VNFOREST states that national forest cover as of end of 2010 was 13,030,939 ha, or
39.5% of the country. According to these two reports, the forest cover increase rate is
0.8%/year over the 2010-2016 period. For the previous period 2000-2010, according to NFI
figures, the forest cover increase reached 1.44%/year.
Table 36. Forest cover summary for Vietnam. (SRV 2016 and SRV 2017)
Forest Area
Total Forest Cover (2016): 13,631,934 ha 41.19%
Total Forest:
14,377,682 ha
Source: NFIS 2016
Natural Forest
10,242,141 ha
Plantation Forest (include young plantations
that do not reach forest cover definition)
4,135,541 ha
Forest Cover Change Trend
INCREASE
2010: 13,030,939 ha
2016: 13,631,934 ha
Source: NFIS
Forest area
2000: 11,939,000 ha
2010: 13,661,000 ha
Source: NFI
2010-2016
+ 100,166 ha/year
2000-2010:
+ 172,200 ha/year
2010-2016:
+ 0.8/year
2000-2010:
+ 1.44%/year

Page 88 of 99
Figure 24. Map of forest status in Vietnam in 2016. (Souce: Computed from VNFOREST,
2017)
Table 37 below displays the figures from the NFI maps that were used for the FREL/FLR
calculation. The NFIS figure comes from a geographical layer provided by VNFOREST in 2017
and were reclassified into the NFI classes by the RFO-SEA.
The overall national forest cover increases are due mostly to the development of
commercial plantations (Acacia, Eucalyptus, Pine, Rubber). Nevertheless, dense natural
forests are shrinking and suffer from degradation. For instance, deforestation occurred at
high rate in Central Highland and South Central Coast regions. For instance, according to
NFI figures provide in Table 37 below, in 1995 Rich Evergreen Broadleaved Forest was 856,000
ha and decreased to 681,000 ha in 2010. In the meantime, forest plantation increased from
994,000 ha to 3,122,000 ha.

Page 89 of 99
Table 37. Historical forest cover area in Vietnam. (SRV, 2016 and SRV, 2017)
National Forest Inventory (NFI) - Four Cycle Maps
National Forest
Inventory and
Statistics (NFIS)
Forest and Other Land Cover
Area (1,000 ha) 1995 2000 2005 2010 2016
Evergreen Broadleaved Rich
forest 856 804 693 681 703
Evergreen Broadleaved
medium forest 2004 1889 1783 1674 1831
Evergreen Broadleaved poor
forest 1918 1785 1621 1581 1510
Evergreen broadleaf regrowth
forest 2399 2699 3283 3654 3119
Deciduous forest 751 722 665 646 576
Bamboo forest 526 547 490 441 363
Mixed woody and bamboo
forest 734 751 751 748 1165
Coniferous forest 172 177 164 162 123
Mixed woody and coniferous
forest 64 56 54 53 65
Mangrove forest 199 178 134 142 61
Rocky mountain forest 740 749 759 757 903
Woody plantation 994 1582 2343 3122 3939
Non-forest rock 232 224 207 205 75
Bushes and grass land 7748 7039 6042 4688 2318
Water body 824 846 851 870 66
Residential area 1498 1569 1669 1798
Agriculture land, other land 11356 11399 11507 11796 16200
Total 33015 33016 33016 33018 33018
Summary Summary
Forest 11357 11939 12740 13661 14359
Natural Forest 10363 10357 10397 10539 10420
Forest Plantations 994 1582 2343 3122 3939
Bare Land 7980 7263 6249 4893 2392
Agriculture and other land 13678 13814 14027 14464 16266
Total 33015 33016 33016 33018 33018
Comparing NFI and NFIS which are produced with two different approaches, should be
taken with caution. However, it can still illustrate the overall trend. According to NFIS,

Page 90 of 99
between 2010 and 2016, the sum of natural forest decreased from 10,539,000 ha to
10,420,000 ha while forest plantations increased from 3,122,000 ha to 3,939,000 ha.
8.5.3 FREL/REL Summary
The scale of Vietnam’s FREL/FRL is national. It considers CO2 and the following activities:
- Deforestation: Activity of conversion of forests to non-forest land.
- Degradation: Activity resulting in a downward shift in terms of carbon stock between
forest types, including Evergreen broadleaf forest volume-based sub-types of “rich,
medium, and poor” (based on the average standing volume per ha) and other forest
types (deciduous, bamboos etc.)
- Reforestation: Activity of land use change from non-forest land to forest land.
- Restoration: Activity resulting in upward shift of carbon stock between forest types,
including Evergreen broadleaf forest volume-based sub-types of “rich, medium, and
poor” (based on the average standing volume per ha) and other forest types
(deciduous, bamboos etc.)
Table 38. Carbon pools considered in Vietnam for FREL/FRL. (SRV, 2016)
Carbon Pool Included
AGB YES
BGB YES
Soil organic carbon NO
Dead wood NO
Liter NO
The historical emissions/removals for the three periods, 1995-2000, 2000-2005, 2005-2010
shows that there is no clear trend on the historical emissions/removals. Therefore, the
average of historical emissions/removals during the reference period will be used as for
Vietnam’s FREL/FRL.
The proposed FREL for Viet Nam (Average of gross emissions) is 59.96 million tCO2e/year
and the proposed FRL (Average of removals) is -39.6 million tCO2e/year.
8.5.4 Carbon stocks
Activities were implemented as a series of work undertaken through the UN-REDD
Programme for Vietnam with technical assistance from FAO, towards the improvement of
country-specific emission factors for Viet Nam.
These activities were conducted by five national institutes and organization, namely, Forest
Inventory and Planning Institute (FIPI), North-west Sub-FIPI, Center for Forest Inventory and
Consultancy (CFIC), Viet Nam Forestry University (VFU), Tay Nguyen University (TNU), and the
Research Center for Forest Ecology and Environment (RCFEE, under VAFS) as coordinator.

Page 91 of 99
The Table 39 below presents the national average carbon stocks for each forest type for
the period 2005-2010. For the calculation of the FREL/FRL, the emission factors were derived
from carbon stocks specific to the agro-ecological region and the NFI cycle.
Table 39. Carbon stock per forest type in Vietnam. (SRV, 2016)
National average carbon stocks AGB + BGB (tC/ha) per forest type - Cycle IV 2005-2010
Code Forest Type Carbon Stock (tC/ha) Uncertainty (at CI
95%)
1 Evergreen broadleaf rich 140 3
8 Coniferous 95 11
2 Evergreen broadleaf medium 75 1
9 Mixed broadleaf-coniferous 67 45
10 Mangrove 58 -
7 Mixed wood and bamboo 42 7
3 Evergreen broadleaf poor 32 3
5 Deciduous Forest 31 8
4 Evergreen broadleaf regrowth 26 6
11 Limestone forest 19 83
12 Plantation 16 13
6 Bamboo 15 11

Page 92 of 99
Information Repository
8.6 Interface and use
RFO-SEA information repository user-interface is available at: http://www.RFO-
SEA.org/geonetwork/
The information repository user-interface is built using GeoNetwork which is straightforward
and easy to use for end users. Users can upload new data to the information repository
database through the user interface without any complex database scripts. The user
interface also has a powerful search tool embedded which allows users to easily find the
data that they are looking for in the database.
The main functionalities of the information repository user-interface are:
- Powerful search tools with indexing
- Filtering by geographical location, document type, document date, etc.
- Catalogue services with CSW (Catalog Service for the Web) available. Allows
integration and linking to other geoportals, websites and information repositories
- Metadata editor for creating standard metadata for the datasets in the RFO-SEA
system
- Metadata viewer for accessing the metadata records
- Integration to the website and the geoportal
- Administrative tools for configuring and modifying the information repository

Page 93 of 99
8.7 Content by country and type
Table 40. Main document of the information repository.
Cambodia Laos Myanmar Thailand Vietnam Regional
REDD+
REDD+
UNFCCC
FRL submission
2016
FREL/FRL
submission 2018
FREL/FRL
submission
2018
FREL/FRL
submission
2016
REDD+ FCPF R-PP 2013 R-Package 2018 R-PP 2013 ER-PD 2018
REDD+ Projects
Presentation
SEIMA project –
WCS 2017
National
REDD+
Strategy
Draft of National
REDD+ Strategy
2016
Draft 2018
Forest Status Drivers of forest
change
Drivers of Forest
change in
Cambodia – LEAF
2015
REDD+ Context –
Cifor 2013
Forest
Inventory
2006
Methodo-
logy
National Forest
Inventory
CliPAD mapping
priority jurisdiction
- 2013
Tree
Allometric
equation
Forest
mapping
Land cover and
classification
system – Brun
2013
Myanmar
Forest cover
change 2002-
2014

Page 94 of 99
Cambodia Laos Myanmar Thailand Vietnam Regional
Technical
Guidance
ESA CCI Product
User Guide
Delta rNBR
Background
IMPACT new
features
Sentinel-2
download
guidance
Academic
papers
REDD+ and forest
restoration –
Erasmus University
2016
PFES in
Lamdong
2017
Institutional
text Forest law Forest Law 2002 Forest Law 2007
Forest Law
2003
Forest Act
1941
Law on
forest
protection
and
developm
ent 2004

9 Conclusion
Forests play a crucial social, environmental and economic role in South East Asia, including
the five target countries of the RFO-SEA. They harbour one of the richest pools of biodiversity
in the world, including a number of endemic and critically endangered species, while also
being an important driver of economic activity. For the more rural communities in the
region, forests are an integral part of their livelihoods through the provision of food, fibre and
fuel.
Forests in the five target countries of the RFO-SEA, however, are under high pressure, largely
due to rapid economic development, population growth and limited capacities to fully
manage the large forest estates in each country. Across the region, the expansion of
agricultural lands, establishment of commercial plantations such as rubber and acacia, the
proliferation of infrastructure projects such as road networks, mines and hydropower dams,
all occur at the expense of forests. Unsustainable logging, both legal and illegal further
damages forest ecosystems.
Overall, the region is seeing a decrease in forest cover and quality. While in countries like
Vietnam and Thailand forest cover is stable or increasing, this is due, largely, to monoculture
plantations, while natural forest continues to be degraded. Laos has seen a stabilization of
its forest cover but degradation caused by illegal logging continues to be an issue.
Deforestation occurs in Myanmar at a stable rate while Cambodia’s rate of deforestation is
accelerating.
All five countries are engaging with the REDD+ process albeit each is at a slightly different
stage of REDD+ Readiness. Vietnam and Cambodia are the most advanced in the region
with respect to REDD+ implementation. Both countries have developed national REDD+
strategies, identified implementation arrangements for REDD+, and developed and
officially submitted their country’s FREL to the UNFCCC. Lao PDR and Myanmar are slightly
further behind Vietnam and Cambodia when it comes to REDD+ readiness. While the
institutional arrangements for REDD+ are in place in both countries, they are still undertaking
the analytical steps to develop their national REDD+ strategies, develop their FREL, finalize
their safeguard assessments, as well as develop their NFMS. Lao PDR is further ahead in the
development of its national REDD+ strategy with a draft available for public viewing likely
to emerge in early 2018, while this will likely emerge in late 2018 for Myanmar. Both will submit
FRELs to the UNFCCC for technical assessment in early 2018, while the development of their
NFMSs will continue throughout 2018. Thailand on the other hand is at a much earlier stage
and is only expected to begin its REDD+ Readiness process in earnest in 2018.
As for EU FLEGT, progress towards establishing VPAs with the EU are similarly at various
stages of development. Vietnam leads the way here again and is the furthest ahead with
VPA negotiations complete and currently moving towards ratification and
implementation. Laos and Thailand have only just begun the VPA negotiating process,
while in Myanmar and Cambodia this is yet to begin. Myanmar is actively seeking to put in
place the relevant institutions and is engaging in a stakeholder consultation process to
prepare discussions in anticipation of the FLEGT process. Cambodia, however, is in its
infancy with regards to engaging with the FLEGT process.

10 References
ESA European Space Agency. 2016. Climate Change Initiative Land Cover project (CCI-
LC). https://www.esa-landcover-cci.org/
FAO Food and Agriculture Organization of the United Nations. 2015. Global Forest
Resources Assessment 2015
Langner A, Miettinen J, Kukkonen M, Vancutsem C, Simonetti D, Vieilledent G,
Verhegghen A, Gallego J, Stibig H-J. 2018. Towards Operational Monitoring of Forest
Canopy Disturbance in Evergreen Rain Forests: A Test Case in Continental Southeast Asia.
Remote Sensing. 10, 4, 544, doi:10.3390/rs10040544
Stibig, H.-J., Achard, F., Carboni, S., Raši, R., & Miettinen, J. 2014. Change in tropical forest
cover of Southeast Asia from 1990 to 2010. Biogeosciences, 11, 247–258.
CAMBODIA
RGC Royal Government of Cambodia. 2017. Forest Investment Program. Forest
Administration, Ministry of Agriculture, Forestry and Fisheries.
RGC Royal Government of Cambodia. 2016a. Initial Forest Reference Level for Cambodia
under the UNFCCC Framework.
RGC Royal Government of Cambodia. 2016b. National REDD+ Strategy.
RGC Royal Government of Cambodia. 2016c. Cambodia Forest cover 2014. Forestry
Administration.
RGC Royal Government of Cambodia. 2011. Forest Carbon Partnership Facility (FCPF)
Readiness Preparation Proposal (R-PP) Cambodia. United Nations REDD Programme (UN-
REDD) in Cambodia.
RGC Royal Government of Cambodia. 2010. National Forest Programme 2010-2030.
Delux C. 2015. USAID Lowering Emissions in Asia’s Forests (USAID LEAF) Drivers of
Deforestation in the Greater Mekong Subregion Cambodia Country Report.
LAOS
GoL Government of Laos. 2018. Lao PDR’s Forest Reference Emission Level and Forest
Reference Level for REDD+ Results Payment under the UNFCCC. Department of Forestry,
Ministry of Agriculture and Forestry, Lao PDR.
GoL Government of Laos. 2018. Forest Carbon Partnership Facility (FCPF). Readiness
Package Self-Assessment Report: Readiness for Reducing Emissions from Deforestation and
Degradation (REDD+).
GoL Government of Laos. 2010. Forest Carbon Partnership Facility (FCPF) Readiness
Preparation Proposal (R-PP) Lao PDR. Vientiane: Department of Forestry, Ministry of
Agriculture and Forestry, Government of Lao PDR.
Koch S. 2017. The struggle over Lao PDR’s forests: New opportunities for improved forest
governance?

Lestrelin G, Trockenbrodt M, Phanvilay K, Thongmanivong S, Vongvisouk T, Pham TT and
Castella J-C. 2013. The context of REDD+ in the Lao People’s Democratic Republic: Drivers,
agents and institutions. Occasional Paper 92. Bogor, Indonesia: CIFOR.
Wildlife Conservation Society and GIZ. 2015. Report on the Assessment of Drivers of
Deforestation and Forest Degradation in Houaphan Province, Lao PDR.
MYANMAR
GoM Government of Myanmar. 2018a. Forest Reference Emission Level (FREL) of
Myanmar. Ministry of Natural Resources and Environmental Conservation (MONREC).
GoM Government of Myanmar. 2018b. National REDD+ Strategy Myanmar.
GoM Government of Myanmar. 2015. Forest (Emissions) Reference Level action plan for
Myanmar. United Nations REDD Programme (UN-REDD) in Myanmar.
GoM Government of Myanmar. 2013. Myanmar REDD+ Readiness Roadmap. United
Nations REDD Programme (UN-REDD) in Myanmar.
Advancing life and regenerating motherland (ALARM). 2016. MYANMAR FOREST COVER
CHANGE 2002-2014.
THAILAND
RTG Royal Thai Government. 2013. Forest Carbon Partnership Facility (FCPF) Readiness
Preparation Proposal (R-PP) Thailand.
Emmanoch W. 2015. USAID Lowering Emissions in Asia’s Forests (USAID LEAF) Drivers of
Deforestation in the Greater Mekong Subregion Thailand Country Report.
NEPCON. 2017. Timber Legality Risk Assessment – Thailand.
RTG Royal Thai Government. 2010. Forest Management in Thailand. Royal Forest
Department.
RTG Royal Thai Government. 2009. Forestry in Thailand. Royal Forest Department.
VIETNAM
SRV Socialist Republic of Vietnam. 2017. Implementation of National Forest Inventory and
Statistics 2013-2017. Ministry of Agriculture and Rural Development.
SRV Socialist Republic of Vietnam. 2016. Vietnam’s Modified Submission on Reference Levels
for REDD+ Results Based Payments under UNFCCC. Ministry of Agriculture and Rural
Development.
Tuan D A. 2015. USAID Lowering Emissions in Asia’s Forests (USAID LEAF) Drivers of
Deforestation in the Greater Mekong Subregion Vietnam Country Report.
SRV Socialist Republic of Vietnam. 2011a. Forest Carbon Partnership Facility (FCPF)
Readiness Preparation Proposal (R-PP) Vietnam.
SRV Socialist Republic of Vietnam. 2011. Final report on Forest Ecological Stratification in
Vietnam. United Nations REDD Programme (UN-REDD) in Vietnam.

Funded by the European Union
This publication was produced with the financial support of the European Union. Its contents
are the sole responsibility of the consortium consisting of FCG International (Lead Partner)
and Forest Carbon and kartECO (Partners) and do not necessarily reflect the views of the
European Union.
doi:10.2760/58969
ISBN: 978-92-79-79976-1
KJ-04-18-151-EN
-N