state of data insights - interana
TRANSCRIPT

STATE OF DATA INSIGHTS
2017

170 analytics end-users reveal
important challenges around existing analytics
solutions and data-informed decision making.
CONTENTS
Market research & survey scope ............................................... 5
How important is it to be data-informed? ............................ 6
Who consumes analytics? .......................................................... 8
Who makes data-informed decisions? ................................... 11
What is data culture like? ........................................................... 12
How are data insights obtained? ............................................. 13
How does someone answer a data-related question at your company? ........................................................ 15
How long does it takes to get insights? .................................. 16
How often do analytics users encounter a question they can't answer? .................................................. 17
How is analytics set up at your company? ............................. 18
Top analytics pain points and requirements . ....................... 19
Summary ....................................................................................... 23
5TRENDS IN ANALYTICS AND DATA-INFORMED DECISION MAKING
Market Research & Survey Scope
The aim of this market survey is to assess the current data culture at various businesses. Our area of research focuses on understanding the state of data accessibility at companies and assessing the importance of data-informed decision making. We define being data-informed as making decisions guided by data gathered through a combination of hypothesis testing and product intuition.
We also report on key trends in the use of event analytics solutions and current pain points faced by analytics end-users. For these purposes, event analytics refers to analytics that tracks events, or actions that reveal how entities in your system—whether they are users, devices, or other objects—interact with your product.
This survey includes 170 respondents from startups to Fortune 500 companies, ranging from C-level executives, VPs, and directors to individual contributors
the survey covers the following topics:
• The importance of being data-informed• Identifying which teams that make data-
informed decisions• Assessing how teams gain insights into their
data• The types of event-based analytics solutions
people are using to get data insights and the time it takes to discover these insights
• The key limitations and pain points of existing analytics solutions
• The top two things analytics end-users desire from their analytics solutions, and the value they want to derive from them
• Key factors people looking into new analytics solutions should consider in order to foster a more data-informed culture

6 STATE OF DATA INSIGHTS 2017
How important is it to be data-informed?
Companies are well aware of the value data insights bring to business decision making. Every massively successful tech company from Google to Uber has found their competitive advantage in data. From the tracking of fundamental metrics like revenue and burn rate to KPIs and success metrics that vary between teams, organizations today need data to guide decision-making. That’s table stakes. The thing that separates great companies from the rest, however, lies in how much of the thinking they do themselves and how much of it is left to the data.
12%
46%
42%Important
Very important
Mission critical
Data-informedYou let the data guide your decision-making process
You let data act as a check on your intuition
Data-driven
This is the fundamental difference between being data-driven and being data-informed:

20%
12% 15%
8%
4%
9%
6%16%
6%
2%
1%
1%
8 9STATE OF DATA INSIGHTS 2017 TRENDS IN ANALYTICS AND DATA-INFORMED DECISION MAKING
answered that their company currently has an analytics solution in place today.
Who consumes analytics?
For a company to be data-informed, they must first have analytics in place to track, collect, and analyze relevant event data.
How prevalent is analytics?Having analytics in place isn’t the only requirement for being data-informed; teams across the company should incorporate analytics and data-informed thinking into their decision-making processes. According to our survey respondents, this does seem to be the case. Analytics users, or consumers of analytics reports, are not overwhelmingly part of any one team.
91%
0 20 40 60 80 100
Our company has an analytics solution in place today
Our company is currently exploring analytics but we don’t plan to have a solution in place
in the next 12 months
Our company is currently exploring analytics and we plan to have a solution in the next 12 months
Our company is not exploring analytics
91%
5%
3%
1%
The heaviest analytics consumers are in product management (20%), engineering & product development (20%), and marketing (16%), but can be found in almost every standard department, from growth to IT to operations.
Customer Success
Data/Analytics
Engineering
Finance
General Management
Growth
IT
Marketing
Operations
Product Management
Sales
Softwrare/Product Development

Furthermore, among our survey respondents, most analytics users/consumers are in a management or strategic decision-making role in some capacity (76%)—but they do not dominate any one type of role or title. Manager (22%), Specialist (18%), and Director (16%) were the most common titles among our survey respondents.
Analytics users/consumers come from various teams and bear various titles, with no one team or title being an overwhelming majority. This suggests that analytics itself is becoming more democratized, at least in terms of access.
?How does this relate to a company’s ability to be data-informed?
10 11STATE OF DATA INSIGHTS 2017 TRENDS IN ANALYTICS AND DATA-INFORMED DECISION MAKING
Who makes data-informed decisions?
Being a data-informed company doesn’t simply mean you have a data team or a product team that uses analytics. It means teams across the whole company are equipped with access and knowledge to data insights—not just analytics—in order to make data-informed decisions.
When we asked our survey respondents which teams regularly made data-informed decisions, the most common responses were Marketing (65%) and Data/Analytics (63%). This is fairly well-aligned with the teams that are also the heaviest consumers of analytics, as we saw in the previous section. Note, also, that a non-insignificant number of our survey respondents chose the other teams as well.
Every team more or less regularly makes data-informed decisions.
0 0.1 0.2 0.3 0.4 0.5 0.6 0.7 80
65%
63%
47%
47%
45%
44%
40%
28%
27%
26%
5%
Marketing
Data Analytics
Software/Product Development
Operations
Engineering
Sales
General Management
Growth
Online Business (e-commerce)
Information Technology
Other
Which teams make data-informed decisions?

Despite the widespread use of analytics and data-informed decision making, only 25% say that everyone understands the importance of being data-informed AND is equipped with the right tools and knowledge to make data-informed decisions. In fact, the majority of respondents (62%) say only a select few have the right tools and knowledge to be data-informed.
62%
25%
9%
4%
12 13STATE OF DATA INSIGHTS 2017 TRENDS IN ANALYTICS AND DATA-INFORMED DECISION MAKING
What is the data culture like?
How do you describe the data culture at your company?
Everyone talks about the importance of data, but no one is data-informed.
Everyone understands the importance of data and is equipped with the right tools and knowledge to make data-informed decisions.
Everyone understands the importance of data, but only a select few are equipped with the right tools or knowledge to make data-informed decisions.
Not everyone understands the importance of data.
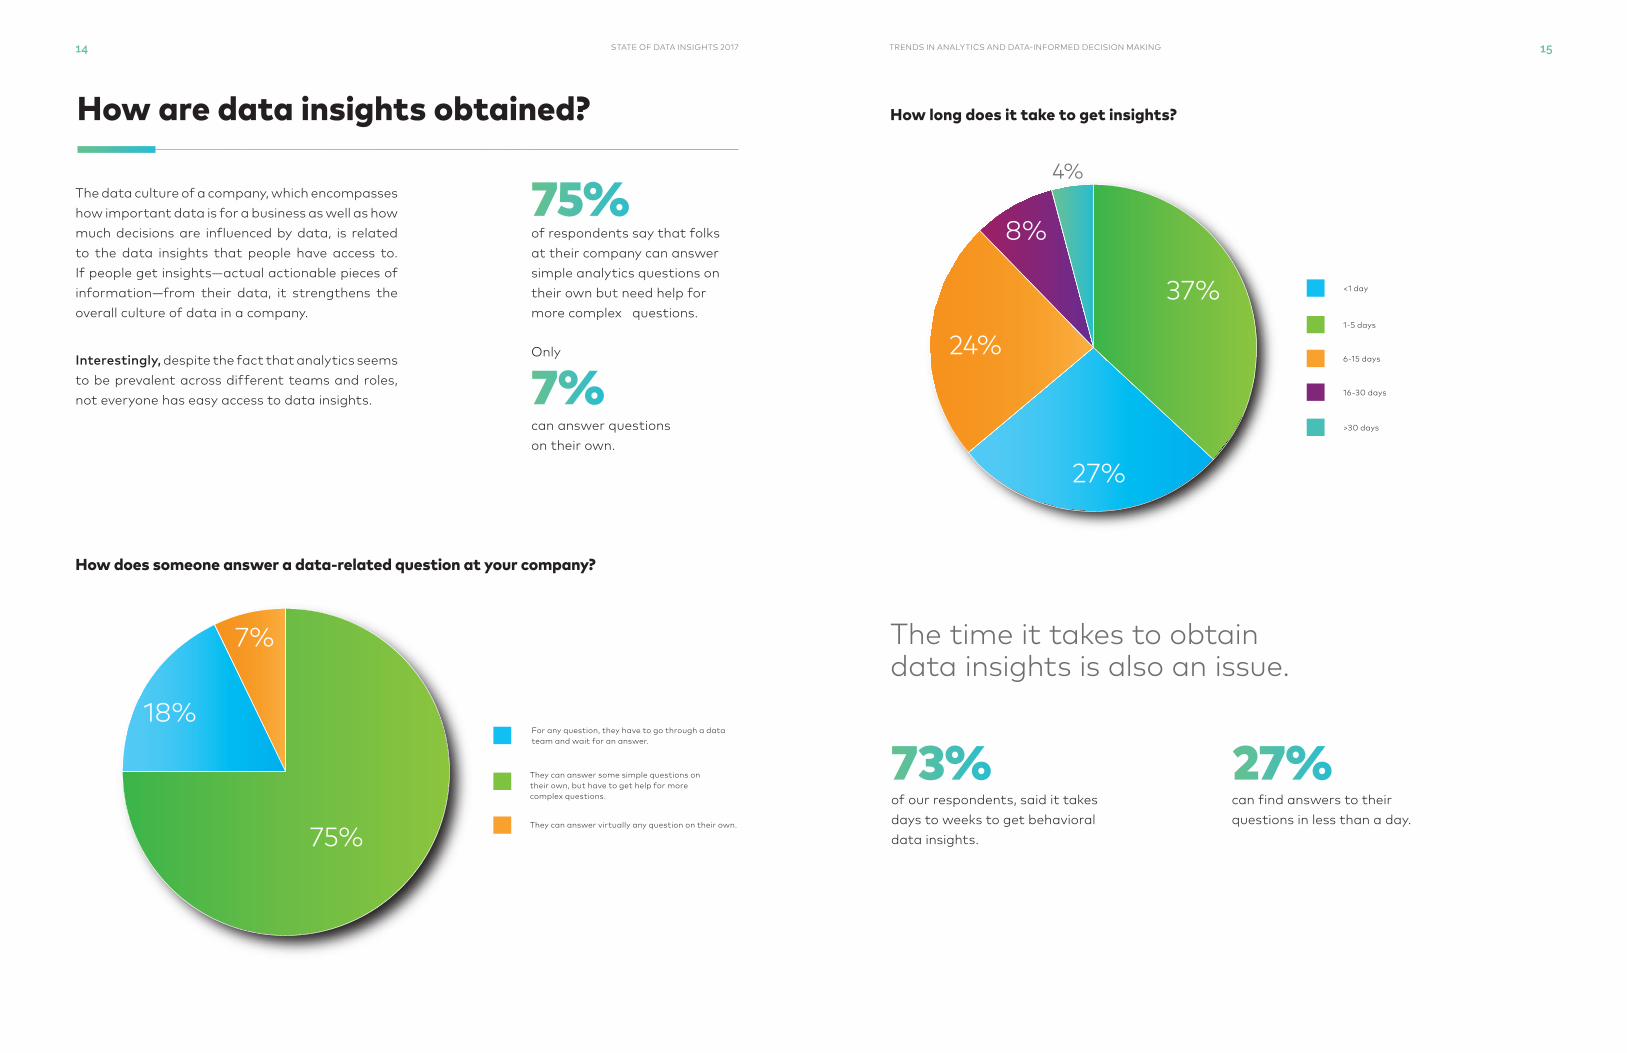
For any question, they have to go through a data team and wait for an answer.
They can answer some simple questions on their own, but have to get help for more complex questions.
They can answer virtually any question on their own.
How are data insights obtained?
14 15STATE OF DATA INSIGHTS 2017 TRENDS IN ANALYTICS AND DATA-INFORMED DECISION MAKING
The data culture of a company, which encompasses how important data is for a business as well as how much decisions are influenced by data, is related to the data insights that people have access to. If people get insights—actual actionable pieces of information—from their data, it strengthens the overall culture of data in a company.
Interestingly, despite the fact that analytics seems to be prevalent across different teams and roles, not everyone has easy access to data insights.
can answer questions on their own.
7%
75%
The time it takes to obtain data insights is also an issue.
73% 27%
of respondents say that folks at their company can answer simple analytics questions on their own but need help for more complex questions.
How does someone answer a data-related question at your company?
of our respondents, said it takes days to weeks to get behavioral data insights.
can find answers to their questions in less than a day.
75%
18%
7%
Only
<1 day
1-5 days
6-15 days
16-30 days
>30 days
24%
8%
4%
37%
27%
How long does it take to get insights?

16 STATE OF DATA INSIGHTS 2017
How often do analytics users encounter a question they can't solve?
Daily
Weekly
Montly
Quarterly
Almost Never
36%
33%
10%
10%
11%
About the same proportion of respondents (69%) say that on a weekly to monthly basis, they encounter a behavioral question that they cannot answer with their current analytics solution. Only 4% uncover insights in less than a day.
Despite the prevalence of analytics across teams and acknowledging the importance of being data-informed, the widespread data culture is one of limited access to data insights. Data insights are limited by knowledge of analytics, performance, and complexity of questions.

18 STATE OF DATA INSIGHTS 2017
The ability to ask questions of your data and gain behavioral data insights is directly related to a company’s analytics setup and is a core part of the data culture.
Self-service analytics solutions that allow both technical and non-technical individuals gain data insights are typically marketed as being critical for a company to be data-informed. When we asked our survey respondents to describe their current analytics setup, only 35% said they used a full stack, self-service analytics solution with a visual interface.
42%
35%
13%
5%
4% 1%
We use a full stack, self-service analytics solution with an interactive visual interface.
We query our own database using a third party SQL editor or visualization tool.
I don’t know.
It depends on the team.
Some combination third-party and internal analytics tools
We have our own internal analytics architecture and have built our own tools.
How is analytics set up at your company?

20 21STATE OF DATA INSIGHTS 2017 TRENDS IN ANALYTICS AND DATA-INFORMED DECISION MAKING
It’s possible that the reason data insights are challenging to obtain for the majority of respondents is that their analytics solutions simply do not have the speed, flexibility, or ease of use to answer the data questions people have.
In fact, the top pain points that analytics users have with their existing solution are:
PerformanceFlexibility
say their analytics is not flexible enough to meet their needs.
say they have to deal with slow query speeds
0 0.1 0.2 0.3 0.4 0.5
42.9%
32.4%
30.0%
27.1%
27.1%
25.3%
14.1%
Not flexible enough to meet my needs
Slow query speeds
Complicated interface/too hard to use
Too expensive
Requires too much coding
Instrumentation
Cannot scale with event volume
Top analytics pain points & requirements
43% 32%Main analytics requirement
Companies want their analytics platforms to be flexible to their needs and powerful enough to answer questions fast. End-users want to couple this with a platform that can provide them with deep user behavior insights with an accessible interface.
31%
20%16%
14%
8%
8%
3%
Query speed and performance
Ability to scale as my data volume grows
Ability to provide deep insights into user behavior
Cost of subscription
Ease of analytics setup and deployment
Intuituve and accessbile interface for all end-users
Other
For those currently looking into analytics vendors, we asked for their top requirement:
• 31% say the ability to provide deep insights into user behavior
• 21% say an intuitive and accessible interface for all end-users
• 16% say cost

22 STATE OF DATA INSIGHTS 2017
SummaryThe aim of this report was to understand current trends in accessing data insights and making data-informed decisions by analyzing the data culture and analytics setup at various companies.
Most companies know it is important to be data-informed and have an analytics solution in place. 88% said it was very important or mission critical for their company or team to be data-informed. They are also equipped with analytics to be data-informed; 91% answered that their company currently has an analytics solution in place today.
With their current analytics in place, finding data insights is painful. While many teams across a company make data-informed decisions, quickly exploring and answering data-related questions is a still a challenge for many. The majority (62%) say only some are equipped with the right tools and knowledge to make data-informed decisions. Only 7% say they can answer any question on their own and a mere 4% say they can find answers to these questions in less than a day.
Current analytics pain points are related to flexibility and performance. 43% say their analytics is not flexible enough to meet their needs as their top analytics pain point; 32% say it is slow query speeds.
People want their analytics to provide behavioral insights and also be accessible. Those who are currently looking into analytics solutions want their product to give them deep insight into how users or entities interact with their product (31%) while also being accessible and intuitive to all end-users (20%).
Key Trends
Choosing the right analytics solution is a critical part of building a data-informed organization. When evaluating analytics vendors, keep the following things in mind:
Things to consider when building a data-informed organization
How flexible should your analytics be?Do you want to explore your data deeply and uncover trends in behavior? How complex are the questions you want to ask of your data? Are you going to be doing a lot of ad hoc analysis?
How powerful should your analytics be?How fast do you plan on growing? Can your analytics scale with your event volume while still keeping query times down?
Who will be using analytics?In a data-informed organization, everyone makes use of data insights. Does your solution need to cater to both technical and non-technical end-users?
How fast can you get insights?Can you iterate on your questions, get to your answers instantly, and then communicate those insights to your team? Or do you have to wait days or weeks to formulate your query and hear back from the data team?
