state of city finances - sacities.net
TRANSCRIPT

State of City Finances
Towards sustainable municipal finances
authors: Louis Boshoff, Anton Cartwright, Yasmin Coovadia, Lita Fani, Nick Graham, Roland Hunter, Ian Palmer, Johan Viljoen, Kim Walsh, Wellies Welgemoed,
Project Managers: Michael Kihato and Thoko Vukea(SACN)content Design and editing: Kristina Davidson (Write to the Point)Design and Layout: InkDesign
Reference Group: Ken Breetzke (eThekwini Municipality), Karen Harrison (NDHS Accreditation Panel ), Carsten Hollaender Laugesen (LTE Energy Pty Ltd), Shanaaz Majiet (CoGTA), Nkhensani Makondo (CoGTA), Linda Manyuchi (SALGA), Sebata Mofokeng ( Mangaung Municipality), Ernest Mohlahlo (Mangaung Municipality), Derek Morgan (eThekwini Municipality), Nasreen Mosam (PWC), Wayne Muller (City of Cape Town), Monty Narsoo (Independent Consultant), Cecilia Njenga (UNEP), Jonathan Patrick (SALGA), Tlou Ramaru (Department of Environmental Affairs), Debra Roberts (eThekwini Municipality), David Savage (Independent Consultant), Annette van Schalkwyk (Ekurhuleni Municipality), George van Schalkwyk (City of Cape Town), Kevin Wall (CSIR).
Photo creditsMedia club south africa (www.mediaclubsouthafrica.com): Andrew Luke: pp. 2 and 69; Chris Kirchhoff: pp 27, 31, 44, 51, 58, 60, 63, 64, 83, 90, 91, 94, 114, 141, 147, 163, 165, 171, 176 and 182; Graeme Williams: pp. 3, 34, 48, 72, 73, 78, 89, 104, 113, 120, 123, 132, 136, 139, 143, 150, 152, 155, 158, 162, 164, 173, 185 and 186; Hannelie Coetzee: pp. 77, 79 and 80; Jeffrey Barbee: pp. 47, 49, 57, 180 and 189; Mary Alexander: pp. 76, 86 and 169; Paul Sauer: p. 102; Roger Bosch: pp. 11 and 151; Sasol: pp. 24, 172 and 192
cape Town Tourism (www.capetown.travel): pp. 6, 7, 8, 12, 13, 16, 21, 23, 25, 28, 42, 81, 116 and 148
All other photos in the publication are attributable to the SACN.
About this publicAtionThe South African Cities Network (SACN) has for some time been involved in investigating, assessing and tracking how its members are doing financially. This publication is a continuation of this body of work. It performs an analysis of the annual financial statements of the SACN members cities. Importantly, however, it goes further, probing a number of key thematic areas that have important implications for city finances. Under the broad umbrella of sustainable municipal finances, these themes touch on matters as varied as city tariffs and their affordability to households, housing accreditation, how well city assets are maintained and even the potential effect of the green agenda on city finances. The report makes the links and connections that city finances have to these important developmental issues. We look forward to continuing to tell this unfolding story going into the future.
April 2013
AcknowledgemenTs

1
Table of contents .............................................................................................................................................1
List of figures.....................................................................................................................................................4
List of tables.......................................................................................................................................................6
Acronyms ............................................................................................................................................................8
Author profiles............................................................................................................................................... 10
Foreword .......................................................................................................................................................... 12
Introduction: sustainable finance in SACN cities .......................................................................... 14
References ....................................................................................................................................................... 23
cHaPTeR 1: Laying the foundations ......................................................................... 25
State of SACN member cities’ finances ............................................................................................ 26Total revenue ....................................................................................................................................................... 26Operating revenue ............................................................................................................................................ 28Capital revenue .................................................................................................................................................. 31Total expenditure ............................................................................................................................................... 34Remuneration costs ........... .................................................................................................................... ........ 36Bulk purchase costs .......................................................................................................................................... 37Capital expenditure .......................................................................................................................................... 38Debtors ................................................................................................................................................................... 38Cash position ....................................................................................................................................................... 40
Conclusion ....................................................................................................................................................... 41
cHaPTeR 2: On the affordability of metropolitan taxes and service charges to households ............................................................................................................. 43
Standard packages of services .............................................................................................................. 45
Benchmark household incomes ............................................................................................................ 45
Increasing municipal service charges ................................................................................................ 48Comparative costs of service packages ................................................................................................. 49Composition of service charges ................................................................................................................. 51Discussion ............................................................................................................................................................. 57
Affordability of municipal service charges ...................................................................................... 59Cost of service packages compared to benchmark household incomes............... 60
Conclusions ................................................................................................................. 64
Annexure 2A: Data Sources ....................................................................... 66
cHaPTeR 3: assignment of the housing function ....... 71
Accreditation and assignment .................................................. 73
The effect of accreditation/assignment on cities ........... 78City of Cape Town .............................................................................. 78eThekwini ............................................................................................. 79City of Johannesburg .................................................................... 80City of Tshwane ................................................................................. 81
TABle oF conTenTs
2
Ekurhuleni.................................................................................................... 81
The challenges of accreditation and assignment ............. 82
The impact of assignment on financial sustainability ... 86
Conclusion .......................................................................................... 89
Acknowledgements ........................................................................ 90
References ........................................................................................... 91
cHaPTeR 4: city assets .................................................... 93
What are municipal assets? ................................................................... 93
Assessing the value of city asset portfolios ......................................... 94Composition of asset value by major service .................................................. 97
State of city assets ............................................................................................................. 98City asset health ............................................................................................................................................. 98
Repairs and maintenance .............................................................................................................................. 98
Asset investment needs ..........................................................................................................................100Complexities facing cities .................................................................................................. 103Climate change adaptation .........................................................................................................................105Next generation city assets ........................................................................................................................107The trend towards compact city design ...............................................................................................107The costs of densification proposals for Ekurhuleni undertaken in 2011 .............................107
New trends, developments and best practices in infrastructure asset management practice ............................................................................................................................................................109
City asset management initiatives ................................................................................. 111Buffalo City ..........................................................................................................................................................111Cape Town ............................................................................................................................................................111Ekurhuleni ........................................................................................................................................................... 112eThekwini ............................................................................................................................................................ 114Johannesburg ................................................................................................................................................... 114Mangaung ........................................................................................................................................................... 115Nelson Mandela Bay ...................................................................................................................................... 115
Conclusion ..................................................................................................................................................... 116
References ..................................................................................................................................................... 118
cHaPTeR 5: The case for a green economy in cities ............................................. 121
Understanding the green economy ..................................................................................................122
Legislative framework for green economy finance ...................................................................128
Paying for a green economy .................................................................................................................130Three categories of green economy options .....................................................................................131Public-private financing partnerships ...................................................................................................132Bond finance ......................................................................................................................................................136Carbon finance .................................................................................................................................................136Development finance ....................................................................................................................................137
3
Guidelines for green economy finance ...........................................................................................137Within mandate and addressing a significant market failure ....................................................137New opportunities for growth and risk reduction ...........................................................................138Employment and equity ...............................................................................................................................139Fiscal efficiency ................................................................................................................................................140
Measuring a green economy ................................................................................................................141
Conclusion .....................................................................................................................................................143
Reference list ................................................................................................................................................144
cHaPTeR 6: Financial implications of demand-side management for electricity and water .................................................................................................................. 149
Problem statement ....................................................................................................................................150Resource conservation imperatives .......................................................................................................151Merits of resource conservation for municipalities ........................................................................151Disincentives for managing demand.....................................................................................................152Problem statement summary ....................................................................................................................153
Institutional context ..................................................................................................................................153
Financial context ........................................................................................................................................156
Resource conservation interventions at local sphere ..............................................................157
Analysis framework ..................................................................................................................................162
Prioritising resource conservation options....................................................................................164Assessing the impact of DSM measures .............................................................................................165
National support for local-level resource conservation measures ....................................167Possible mechanisms to transfer funds or subsidies to local authorities for DSM interventions ......................................................................................................................................................169Financial and institutional mechanisms to support municipal DSM ......................................170
Conclusion .....................................................................................................................................................171
cHaPTeR 7: Financial modelling as a strategic planning tool ............................. 173
The importance of integrated investment planning ..................................................................175
Financial modelling examples from South African cities .......................................................177City of Johannesburg: strategic planning for growth and development .............................177eThekwini metro: balancing capital budget allocations ...............................................................179City of Cape Town: scenario planning around varying growth scenarios ............................181Alignment of departmental strategies ..................................................................................................182Motivation for funding strategies ............................................................................................................183Modelling the implications of demand management strategies for water and electricity ....................................................................................................................................................184Financial implications relating to asset replacement ....................................................................187Comparing the cities ......................................................................................................................................188
Implications for long-term sustainability of cities ......................................................................191
Conclusion .....................................................................................................................................................192
4
lIsT oF FIgURes
Figure 0.1 Structure of the publication 15
Figure 1.1 Total city revenues (constant 2012 R billion and annual percentage increase) 26
Figure 1.2 Total nine-city revenues by source (constant 2012 R billion and percentage change) 27
Figure 1.3 Total city service charge revenue (constant 2012 R billion and percentage change) 29
Figure 1.4 ESG and other operating grants by city (constant 2012 R billion and percentage change) 30
Figure 1.5 Capital grants by city (constant 2012 R billion and percentage change) 31
Figure 1.6 Municipal borrowings relative to annual operating revenue [%] 32
Figure 1.7 Surplus by city (constant 2012 R billion and percentage change) 33
Figure 1.8 Total city expenditure by category (constant 2012 R billion and percentage change) 34
Figure 1.9 Comparison of share of city expenditure by category (constant 2012 R billion) 35
Figure 1.10 Aggregate city expenditure and capex by category summary (constant 2012 R billion) 36
Figure 1.11 Remuneration by city (constant 2012 R billion and percentage change) 36
Figure 1.12 Bulk purchases by city (constant 2012 R billion and percentage change) 37
Figure 1.13 Capital expenditure of cities (constant 2012 R billion and percentage change) 38
Figure 1.14 Aggregate city debtors: gross, net, and bad debt provisions as percentage of billed income 39
Figure 1.15 Various cities gross debtors’ balances outstanding relative to billed revenue (%) 39
Figure 1.16 Months of cash spend (constant 2012 R billion) 40
Figure 2.1 Household income profiles by city (thousands per income band) 46
Figure 2.2 Income distributions by city (2011–2013) 47
Figure 2.3 Cost of service packages in 2011 50
Figure 2.4 Composition of service charges by city, 2011 52
Figure 2.5 Overall percentage increases in real cost of service packages between 2009 and 2012 (%) 58
Figure 2.6 City GVA 2006–2012 (constant 2012 R billion) and annual % increase 59
Figure 2.7 Cost of service package types as percentage of benchmark household income categories, 2009 and 2012. 61
5
lIs
T o
F F
IgU
Re
sS
TAT
E O
F C
ITY
FIN
AN
CE
S
2013
Figure 2.8 Cost of service package types as fraction of benchmark household incomes (%) 62
Figure 2.9 Change in cost of service packages as share of benchmark household incomes (%) 63
Figure 4.1 Spatial distribution of municipal assets by value (current 2012 prices) 95
Figure 4.2 CRC and DRC values for SACN cities (current 2012 prices rounded to the nearest R billion) 96
Figure 4.3 Composition of asset value by major group (current 2012 prices rounded to the nearest R billion) 97
Figure 4.4 Infrastructure unit rates (rand per residential customer unit) provided for low-income housing in Ekurhuleni 108
Figure 5.1 Economic value (GVA) created per ton of CO2 emitted for South African metros (2011 prices) 125
Figure 5.2 Real capital expenditure in South Africa’s metros by sector, 2003–2013 134
Figure 5.3 Financing and investment options for renewable energy infrastructure 135
Figure 7.1 Typical structure of an investment planning model, incorporated into the MSFM 174
Figure 7.2 City of Johannesburg GDS assessment: typical capital expenditure results from the base scenario analysis 177
Figure 7.3 City of Johannesburg GDS assessment: results for base scenario disaggregated by type of expenditure 178
Figure 7.4 eThekwini metro: typical results for the application of a model to rationalise budget cuts in capital expenditure 180
Figure 7.5 City of Cape Town: demographic growth scenario 181
Figure 7.6 Indicative results of the impact of conservation and demand management interventions on bulk electricity requirement (CoJ example) 185
Figure 7.7 Indicative results of the impact of conservation and demand management interventions on the operating account (CoJ example) 185
Figure 7.8 Indicative results of the impact of demand management interventions and price interventions on the financial position of a city’s electricity account (eThekwini example) 186
Figure 7.9 Indicative illustration of the impact on capital expenditure projections with major changes to asset valuation (eThekwini example) 187
Figure 7.10 Comparative results of asset replacement values per consumer unit 189
Figure 7.11 Comparative results of capital requirements over 10 years per consumer unit 190
6
lIsT oF TABles
table 2.1 Standard service packages 45
table 2.2 Average household incomes per city (R per month) 45
table 2.3 Monthly income distribution and benchmark household incomes 48
table 2.4 Monthly cost of service packages A to D in 2011, ranked by city (2012 R) 49
table 2.5 Variation from average cost of service packages A to D in 2011, ranked by city (%) 50
table 2.6 Composition of city charges by service package type, 2011 51
table 2.7 Cost of TYPE A service packages by city 2009–2012 (constant 2012 R) 53
table 2.8 Cost of TYPE B service packages by city 2009–2012 (constant 2012 R) 54
table 2.9 Cost of TYPE C service packages by city 2009–2012 (constant 2012 R) 55
table 2.10 Cost of TYPE D service packages by city 2009–2012 (constant 2012 R) 56
table 2.11 Overall percentage increases in cost of service packages between 2009 and 2012 (%) 57
table 2.12 Cost of service packages as % of benchmark household incomes (%) 60
table 3.1 The three levels of accreditation 74
table 3.2 Summary of accreditation of housing functions 75

7
lIs
T o
F T
AB
le
sS
TAT
E O
F C
ITY
FIN
AN
CE
S
2013
table 4.1 2011 Value of PPE assets (nominal, rounded to nearest R million) 94
table 4.2 Actual spending vs. benchmarked repairs and maintenance needs (rounded to the nearest R million) 99
table 4.3 Asset replacement value, capital subsidies and economic growth rates of SACN cities (R million) 100
table 4.4 Summarised infrastructure investment needs 2013–2017 (R million) 101
table 4.5 Summarised infrastructure investment needs 2013–2017 (R million) 102
table 4.6 Annual wear and tear of cities’ immovable PPE (2012 R million) 106
table 4.7 Summarised audit outcomes for SACN cities 109
table 4.8 Audit results for the immovable PPE of Ekurhuleni 2009–2011 113
table 5.1 Green economy indicators for South African metros 124
table 5.2 Estimated employment potential of urban green economy categories in South Africa 127
table 6.1 Resource conservation interventions and their impacts 158

8
BePP Built Environment Performance Plan
cDM clean development mechanism
cO carbon dioxide
cRc current replacement cost
DBsa Development Bank of Southern Africa
DFi Development Finance Institutions
DHs Department of Human Settlements
DRc depreciated replacement cost
DsM demand-side management
du/ha dwelling units per hectare
escO Energy Service Company
esG Equitable Share Grant
ess Electrical Support Services
FBs free basic services
AcRonyms

9
Ac
Ro
ny
ms
STA
TE
OF
CIT
Y F
INA
NC
ES
20
13
FFc Financial and Fiscal Commission
GDP gross domestic product
GDs growth and development strategy
GHG greenhouse has
GRaP Generally Recognised Accounting Practices
HsDG Human Settlement Development Grant
iaMP infrastructure asset management plans
iDc Industrial Development Corporation
iDP Integrated Development Plan
iRPTn Integrated Rapid Public Transport Network
kl kilolitres
kWh kilowatt hours
Lec Light Emitting Diode
LGFF local government fiscal framework
MHDP Municipal Housing Development Plans
MiG Municipal Infrastructure Grant
MRMa Municipal Finance Management Act
MsDF Metropolitan Spatial Development Framework
MsFM Municipal Services Finance Model
MW megawatt
nDP National Development Plan
nPc National Planning Commission
nUsP National Upgrading Support Programme
Pic Public Investment Corporation
PPe property, price and equipment
sacn South African Cities Network
saLGa South African Local Government Association
sWH solar water heaters
Ues urban ecological security
UisP Upgrading of Informal Settlements Programme
UneP United Nations Environmental Programme
UsDG Urban Settlement Development Grant
WeF World Economic Forum
10
AUTHoR PRoFIles
chApter 1: Financial analysis and benchmarkingA director and shareholder at Akhile Management and Consulting, Wellies Welgemoed specialises in the analysis of municipalities and then developing and implementing turnaround strategies for municipalities in distress. He also assists municipalities with corporate governance through the development and implementation of policies and by-laws.
Johan Viljoen is a consultant at Akhile Management and Consulting. He specialises in assisting municipalities with implementing accounting standards, as well as analysing and interpreting financial results.
chApter 2: Tariffs and affordabilityRoland Hunter is a specialist consultant in public finance and management, working especially on city finances. His recent interests include the financing of urban infrastructure services in African cities and improving the financial capacity of African city governments. He has written extensively for earlier SACN publications on city finance.
Lita Fani is a consultant in public finance and management with direct professional experience in municipal finance, administration and accounting, including core participation in key projects for the City of Johannesburg (the 2010 FIFA World Cup project and the Clean Audit programme, which resulted in the city receiving its first unqualified audit), as well as developing and implementing asset management processes and procedures for municipal entities at the city.
chApter 3: Assignment of the housing functionA professional planner with 20 years’ experience in urban development in South Africa, Yasmin coovadia has a special interest in public and municipal finance, urban policy, the development of informal settlements and enhancing planning practice.
chApter 4: City assetsLouis Boshoff is the managing director of i@Consulting and a visiting lecturer at the University of Cape Town on its Master’s Programme in Urban Infrastructure Design and Management. He is passionate about infrastructure asset management, and received the Notable Award at the First World Congress on Infrastructure Asset Management in Kuala Lumpur, 2011. He also has a special interest in optimising and future-proofing cities.

11
AU
TH
oR
PR
oF
Ile
sS
TAT
E O
F C
ITY
FIN
AN
CE
S
2013
chApter 5: The case for a green economy in citiesanton cartwright is a Mistra Urban Futures economist at the African Centre for Cities, University of Cape Town, with a research focus on the interactions between ecological degradation and human wellbeing in cities. He is director of Econologic Consulting, a founder of the Promoting Access to Carbon Equity (PACE) centre (which enables small-scale renewable energy and energy efficiency projects to benefit from carbon market investments) and an associate of the Stockholm Environment Institute and the Cambridge Programme for Sustainability Leadership.
chApter 6: Demand-supply management Founder of the PDG (Palmer Development Group), ian Palmer had led over 100 consulting projects in the realm of public sector service delivery, including the fields of municipal services planning, municipal finance, inter-governmental relations, water and sanitation, housing, roads and public transport.
nick Graham is a Director of PDG. His interest lies in urban systems modelling and analysis, including the interface between municipal finance, spatial planning and municipal services.
Kim Walsh is a Director of PDG. Her primary area of interest is financial modelling and analysis, which she applies across a range of fields, including municipal finance, water services, national grant allocation, public transport and renewable energy financing.
chApter 7: Financial modellingFounder of the PDG (Palmer Development Group), ian Palmer had led over 100 consulting projects in the realm of public sector service delivery, including the fields of municipal services planning, municipal finance, inter-governmental relations, water and sanitation, housing, roads and public transport.
nick Graham is a Director of PDG. His interest lies in urban systems modelling and analysis, including the interface between municipal finance, spatial planning and municipal services.

12
FoRewoRd
City municipal finances are critical to the operations of local government. An entire chapter in our Constitution is dedicated to how the three spheres of local government should handle their finances, touching on key areas such as fair and transparent procurement, effective budgeting and sharing of national revenues. Financial issues are such an integral part of municipal functions that failure to fulfill them can lead to a city being “taken over” by provincial government, breaching the enshrined municipal autonomy so important to our system of governance.
Beyond this, however, a city’s financial stories are also a narration of its prosperity and achievements, ill fortune and failures. Through these stories, we understand cities, gauge their economic, social and environmental health, and determine if the country is on a sustainable path to development. This latest edition of the State of City Finances is therefore themed sustainable city finances. Its content is structured around the three interrelated aspects of sustainable development (economic, social and environmental), within which financial issues are squarely placed.
Any examination of city finances over the last number of years cannot ignore the prominent headline-grabbing issues. One is the need for clean audits. The Auditor- General’s report for the financial year ending 2011 showed that a number of SACN members still have a long way to go to achieving good audit outcomes, as they still retain qualified or disclaimed opinions. Cities must use their money better and report with greater effectiveness and transparency. A number of metros need more accurate and complete billing, while rising debt owed by both private households and government departments continues to hold back city operations. Tax payers are

13
Fo
Re
wo
Rd
STA
TE
OF
CIT
Y F
INA
NC
ES
20
13
growing increasingly weary, as displayed by the stiff resistance from local businesses to a proposed municipal business tax reported in our previous edition. Stability in political leadership has also been re-emphasised as critical for city success.
Yet while these headline-grabbing issues are vital pieces of the municipal financial puzzle, they are not the only ones. This publication draws attention to a number of other unfolding storylines that are equally important to city financial sustainability. One is the story of tariffs and affordability, an important influence that is outside city control but will severely test municipal financial stability. Cities are also now taking centre stage in housing delivery, as the housing accreditation process unfolds. Likewise, the developing practice around the green economy highlights a new and exciting frontier in city development thinking, presenting numerous opportunities but also challenges to city finances.
As we have reported over the last few years, the story of city municipal finances has been about resilience. Resilience amid challenging economic conditions, both nationally and globally, and rising demands for services, as populations grow and in-migration from rural areas and smaller towns continues at pace. Going forward, city financial sustainability means moving beyond being resilient, to a more proactive position. Cities urgently need to work on getting the basics right, but equally important they need to explore and encourage greater innovation to deal with the new challenges and opportunities. The South African Cities Network will continue to report on these developments and, in so doing, will hopefully create a useful body of knowledge that assists our members evolve into the future.
Sithole Mbanga
CEO South African Cities Network
14
InTRodUcTIon
sustainable finance in sAcn cities
The overall theme of the State of City Finances 2012 is sustainable finance for South African cities. The
idea of ‘sustainable development’ has its origins in environmental policy and law, popularised by the Brudtland Report (WCED 1987). Simply put, sustainable development is development that meets the needs of the present without compromising the ability of future generations to meet their needs and has three dimensions: social, economic and environmental. The reference to future generations highlights the appeal to intergenerational equity.
This definition has been the subject of much criticism,1 but remains one of the most important
anchoring principles for development. Locally, a number of writers have borrowed the concept of
sustainability in order to define sustainable municipal finance. The Financial and Fiscal Commission notes the complexity of the concept, given that there is ‘no [existing] generalised measure of sustainability existing’ (FFC 2012), and settles on a definition anchored in ‘operating expenditure and own revenue growth rates’. Another writer emphasises the theme of resilience and the ability to absorb financial shocks in the future, as it is the
financial ability to deliver services, develop and maintain infrastructure required by its residents without unplanned increases in rates and taxes or a reduction in the level of services and the ability to absolve financial shocks caused by natural, economic and other adversities without external financial assistance.[emphasis added] (Claassen 2011)
Another definition highlights the intergenerational aspect: ‘a government’s ability to manage its own finances so it can meet its spending commitments both now and in the future’ [emphasis added] (De Lange 2010).
This publication does not attempt a definition but rather borrows the three dimensions of sustainability – economic, social and environmental – to structure the narrative. Each chapter addresses at least one of these dimensions, while the intergenerational aspect of the definition is emphasised through the lens of long-term planning.
1 For some useful critiques of the concept, see for example Sagoff M (1988) The Economy of the Earth: Philosophy, Law and the Environment. Cambridge: Cambridge University Press.
This publication does not
attempt a definition but rather borrows the three
dimensions of sustainability – economic, social and
environmental …
15
InT
Ro
dU
cT
Ion
STA
TE
OF
CIT
Y F
INA
NC
ES
20
13
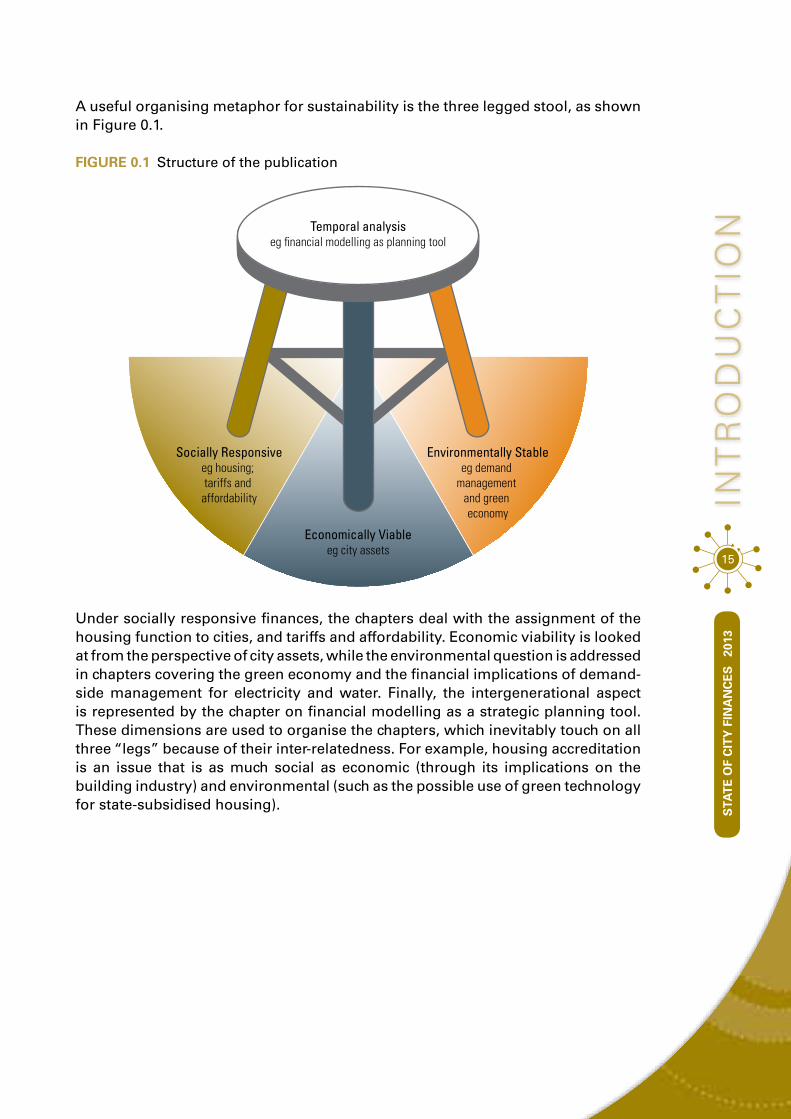
A useful organising metaphor for sustainability is the three legged stool, as shown in Figure 0.1.
FiGURe 0.1 Structure of the publication
Temporal analysiseg �nancial modelling as planning tool
Socially Responsiveeg housing; tariffs and affordability
Economically Viableeg city assets
Environmentally Stableeg demand
management and green economy
Under socially responsive finances, the chapters deal with the assignment of the housing function to cities, and tariffs and affordability. Economic viability is looked at from the perspective of city assets, while the environmental question is addressed in chapters covering the green economy and the financial implications of demand-side management for electricity and water. Finally, the intergenerational aspect is represented by the chapter on financial modelling as a strategic planning tool. These dimensions are used to organise the chapters, which inevitably touch on all three “legs” because of their inter-relatedness. For example, housing accreditation is an issue that is as much social as economic (through its implications on the building industry) and environmental (such as the possible use of green technology for state-subsidised housing).

16a development mandate for south african local government South Africa is emerging from a very particular history and legacy, and sustainable finances need to be seen within this context, where the state has an explicit developmental mandate. The Constitution of South Africa provides for the developmental duties of local government, which means giving priority to the basic needs of the community and promoting their social and economic development.2
This appeal – to look after the very basic needs of communities must be kept in mind when confronting the delicate prioritising balancing act that cities invariably have to perform.
Many of the chapters make references to this tension. For example, the chapter on city assets (Chapter 4) points out that, under the exacting accounting standards of the new Generally Recognised Accounting Practice (GRAP), cities have to meet stringent compliance requirements, while still delivering on ambitious social and economic development programmes. Chapter 5 sounds a cautionary note against blindly adopting green economy precepts from the developed world without carefully thinking through the consequences, which could exacerbate the urban inequalities already existing in our cities. Likewise, as Chapter 6 highlights, cities have to balance consuming fewer resources, such as water and electricity, with extending these services to under-serviced areas as quickly as possible. In Chapter 7, on financial modelling as a strategic planning tool, some practical examples are provided of how cities deal with these tensions.
2 Section 153.
STA
TE
OF
CIT
Y F
INA
NC
ES
20
13
17
InT
Ro
dU
cT
Ion
structure of the publication This publication has seven chapters.
chApter 1: Financial analysis of SACN Cities Chapter 1 is a financial analysis of the nine SACN cities, based on the annual financial statements for the financial year 2010/11. As part of SACN’s established annual reporting mechanism, the analysis uses the broad categories of city revenues, expenditure, debtors and cash position. Some of the key issues highlighted in this chapter are:
city operating revenues are increasing in virtually all sacn cities, although the levels of these increases vary across the cities. More importantly, much of this increased revenue is attributable to higher electricity charges, which are the result of the rising cost of bulk purchases from Eskom. The sustained and precipitous increase in electricity charges are the subject of a dedicated chapter (Chapter 2), which looks at the affordability of electricity and other services in the light of these increases, and the underlying implications on city financial sustainability. Chapters 6 and 7 also touch on the effects of these rising costs on the demand for services.
From the expenditure side, employee-related costs have risen significantly, although remaining generally constant as a proportion of total costs. The authors offer some explanations for this, for example the filling of vacant posts and implementing new grading systems in cities. Nevertheless, the perception that higher-than-inflation increases are partly responsible cannot be ignored. A worrying trend relates to the very modest increase in repairs and maintenance expenditure, an observation that is confirmed by the chapter on city assets (Chapter 4).
STA
TE
OF
CIT
Y F
INA
NC
ES
20
13

18
Cities have shown consistent improvement in the handling of their debtors, but this does not detract from the fact that many cities are experiencing deteriorating payment levels. The chapter on tariffs and affordability (Chapter 2) raises a red flag on the possible worsening of this situation, as services become more expensive. Finally, an aggregate increase in cash positions across the cities hides a worrying story of some cities clearly facing cashflow problems.
chApter 2: Tariffs and affordability This chapter dwells on city tariffs and the related question of household affordability. It starts with the premise that, to be financially sustainable, a city needs to deliver the quantity and quality of services required by its residents and businesses at an affordable price. However, affordability is not a straightforward concept. It varies, depending on how much income a person earns. The chapter uses the latest 2011 census data to segment the incomes of different residential users, focusing on low to mid-income earners. Among its findings is that increases in tariffs have generally outstripped increases in household incomes, with the increases being proportionally greater for lower income earners. This will have major implications on the financial sustainability of cities given that the trend of higher tariff costs is set to continue for the foreseeable future. The result is likely to be greater indebtedness among households and further worsening payment levels to cities, which reflects observations made in Chapter 1. An argument is made for greater efficiency in revenue collection, less wastage and restraint on costs such as salaries and wages, in order to cushion as far as possible the effects of these inevitable tariff increases.
chApter 3: Assignment of the housing functionIn dealing with the housing mandate and the associated concern around resources, this chapter addresses questions of intergovernmental relations – an issue that recurs in Chapter 5, in the case of local government avoiding budgeting for a green economy because the environment is considered a provincial, not a local, government responsibility. Chapter 6 also raises the critical need for greater interaction and support by national government, given that many national environmental, economic and social imperatives related to resource conservation are being financed and implemented at city level.
What emerges from Chapter 3 is the complexity of the allocation of the housing mandate. At the heart of the unfolding process of accreditation and assignment of housing to local government is the evolving understanding of the mandate, and accompanying recalibration of intergovernmental fiscal relations. The chapter lays out in simple terms the housing mandates of different spheres of government and the associated grants and allocations. With the danger of oversimplifying, primary responsibility for housing lies with national and provincial government, but local government and cities have always played a major role in implementing state-driven housing projects. This role, and the fact that all houses developed become part of a municipality’s rates base, has financial implications. Yet cities have never had control over the financial resources necessary to fulfil this mandate.
19
InT
Ro
dU
cT
Ion
STA
TE
OF
CIT
Y F
INA
NC
ES
20
13
The chapter provides some examples of how various SACN cities are adopting (and innovating with) the various financial instruments that target housing. A common sentiment from the examples is that accreditation and assignment allows for greater predictability and control over finances. This, the chapter points out, is appreciated universally by city financial officers because it empowers them to do proper financial planning. However, as the chapter emphasises, the accreditation process does not resolve many of the problems that have confronted the state-driven housing programme, including the question of financial sustainability.
chApter 4: City assetsFinancial sustainability is approached from the angle of city assets in Chapter 4, which deals with the problem of existing maintenance backlogs of city assets and how to finance them into the future. This issue perhaps best reflects the tensions and inherent balancing act a city has to make when taking financial decisions. On the one side is a need to roll out new infrastructure to poor and excluded communities, a legacy of our history. On the other side is a core of city assets that represents the current tax base and needs to be maintained and expanded. The chapter makes a judgment on how well SACN cities have performed this balancing act over the years, noting that:
Much of capital budgets over the past 12 years have been directed to service extensions, but the estimates indicate that renewal and growth needs have assumed about equal importance. Without asset renewal, current revenue streams will not be assured and depletion of service potential will follow; without growth, cities (and indeed the country) will stagnate.
Quantifying asset maintenance and renewal needs puts a financial cost to this reality, a problem hinted at in earlier chapters. According to Chapter 1, between 2010 and 2011 repairs and maintenance as a percentage of total expenditure fell, while total expenditure in real terms only increased very modestly between 2009 and 2011. As Chapter 4 points out, this legacy of under expenditure means that allocations will need to increase by 23% over a five-year period from 2012, taking into consideration growth, service extensions and city maintenance needs. This is many times what is being currently spent. The legacy of insufficient re-investment in existing assets and spend on maintenance activities is an enormous financial burden that poses a serious challenge for the future.

20
The chapter also raises an important dimension to future infrastructure extension, suggesting that SACN cities need to take proactive measures to ensure a secure supply of electricity and water, especially given the lessons of rolling blackouts from the past and looming water problems. A similar proactive attitude should be adopted in dealing with greenhouse gas emissions reduction, and future asset maintenance should include retrofitting of infrastructure compatible with this goal. The chapter ends on a positive note, providing some examples of positive developments in city asset management in the SACN cities.
chApter 5: Green economyChapter 5 sounds a word of caution against blindly investing in green technologies. This is because a naïve attempt to embrace a green economy could exacerbate pre-existing urban fault lines, such as inequality, structural poverty or poor fiscal planning, and render a municipality bankrupt. The chapter offers a practical approach for introducing a green economy in South African cities, based on three dimensions. First, the city must consider options that deliver an environmental benefit but also save money immediately. Second, the options chosen should require no additional expenditure but rather rely on reallocating the existing budget. Finally, cities should invest in products that require additional upfront expenditure, so long as a subsequent financial benefit, risk reduction or economic growth benefit are realised.
chApter 6: Demand-side management This chapter considers the effect of demand-side management on municipal revenues, which is an aspect of municipal financial sustainability touched on in other chapters. Chapter 1 mentions the importance of service charges, which constitute well over 50% of city revenues, while Chapter 4 argues that lower consumption of municipal services (specifically electricity through use of technology such as
solar) will have a negative effect on municipal revenues in the case of middle to high-income earners. Lower consumption from middle
class households means less revenue from a steady and reliable source.
Chapter 6 examines the hypothesis that demand-side management measures may mean revenue losses, as
electricity and water generate significant city revenues. Further, interventions to reduce resource consumption also require capital investment and could potentially incur additional operating costs. What emerges is that the issue is much more complex than these relatively linear relationships. Many interlinking pressures are associated with the provision of municipal services, and their net financial effects are not obvious. For example, increasing the cost of the services themselves, as shown in Chapter 2, may result in greater revenues. However, in the long
term, increased costs may also be a demand-side

STA
TE
OF
CIT
Y F
INA
NC
ES
20
13
21
InT
Ro
dU
cT
Ion
intervention for lower consumption, which in turn means lower revenues. The chapter concludes that the nature of demand is not sufficiently well understood to be able to determine accurately pricing relationships in the long run. Some inroads into this understanding are being made, as Chapter 7 illustrates, but many questions still remain and will only become clearer with time. Another complexity raised is that the provision of services in municipalities is so intertwined financially and institutionally (for example through cross-subsidisation) that clear lines of cause and effect from demand-side management are difficult to determine accurately.
Nevertheless, the chapter responds by pointing out that resource conservation is at the heart of demand-side management and asking what are the best financial measures for this at a local government level? In answering, the chapter makes an important distinction between resource conservation measures targeted at creating greater efficiencies in the system and demand-side management. An example of the former is that a city can upgrade its distribution networks and therefore reduce losses. A city can also improve its billing systems and increase billing coverage as high priority financial interventions, and reduce its own municipal wastage and inefficiencies such as inefficient street-lighting. These and several other possible solutions are offered to shift the question to one of what holistic approaches, including demand-side management, can be used as a financially sustainable response to resource conservation.
STA
TE
OF
CIT
Y F
INA
NC
ES
20
13

22chApter 7: Financial modellingThe final chapter encapsulates the complexity of city financial sustainability that has emerged in the previous chapters. It explores the experiences of using a modelling tool, the Municipal Services Financial Model, to plan for investment in a municipality. Planning is an important component of any city’s financial sustainability, and this chapter re-asserts that finances should be at the heart of planning. A number of examples illustrate the use of the tool, including Johannesburg’s Growth and Development Strategy planning process, eThekwini’s balancing of capital budget allocations, and the City of Cape Town’s scenario planning around varying growth scenarios.
The utility of the model emerges from the fact that much of current planning does not contain a strong financial component. For example, instruments such as Integrated Development Plans are one of a multitude of planning systems employed by cities that often do not resolve important financial questions arising from the planning process. The logic of functional departments and sectoral mandates often overpower the whole. Additionally, the scattered nature of city planning across departments and sectors means there is no holistic financial view.
In taking a holistic view, based on the definition of sustainable development as applied to municipal finance, it is hoped that this publication goes some way in highlighting the complexity of city finance. Sustainable municipal finance is vital for the future prosperity of South Africa, given the move toward a more decentralised government and the importance of cities for the growth of the country’s economy.

STA
TE
OF
CIT
Y F
INA
NC
ES
20
13
ReFeRencesClaassen, L. 2011. Introduction of the new municipal financial sustainability index
(MFSI). IMFO, Iss. Spring, p.20.
De Lange, D. 2010. Should municipalities be reporting on long-term financial sustainability? IMFO, Iss. Spring, p.22.
FFC (Financial and Fiscal Commission). 2012. 2012/2013 Technical Report. Johannesburg: Financial and Fiscal Commission, http://tinyurl.com/d9ek5cu.
WCED (World Commission on Environment and Development). 1987. Our Common Future. Oxford: Oxford University Press.
23
Re
Fe
Re
nc
es
STA
TE
OF
CIT
Y F
INA
NC
ES
20
13

24

25
… cities influence the lives of millions
of citizens and businesses and contribute significantly to the economic and social
transformation of the country.
STA
TE
OF
CIT
Y F
INA
NC
ES
20
13
laying the foundations
Cities are the major drivers of the South African economy, and so their performance is a good indicator of the state of the economy and the environment in which business must operate. Through the services they deliver, cities influence the lives of millions of citizens and businesses and contribute significantly to the economic and social transformation of the country. Therefore, healthy municipal finances are vital to the future of South Africa.
The performance of municipalities is a measure of their contribution to a sustainable environment and their own sustainability. Municipalities have to account for the resources and provision of services at appropriate levels while still fulfilling their social responsibility. Furthermore, municipalities develop long-term plans and assign resources to invest in the environment to meet future demand.
The South African Cities Network (SACN) has been reporting on the state and health of finances of its network members for many years through its State of City Finances publications. This chapter lays the foundation for much of the discussion and analysis in this publication. It establishes the state of the SACN member cities’ finances by updating the financial indicators from the State of City Finances 2011 using the latest financial data and in constant 2012 rands instead of constant 2008 rands. The areas covered are: revenue, expenditure, debtors and cash position.
cHAPTeR 1
26
stAte oF sAcn member cities’ FinAnces
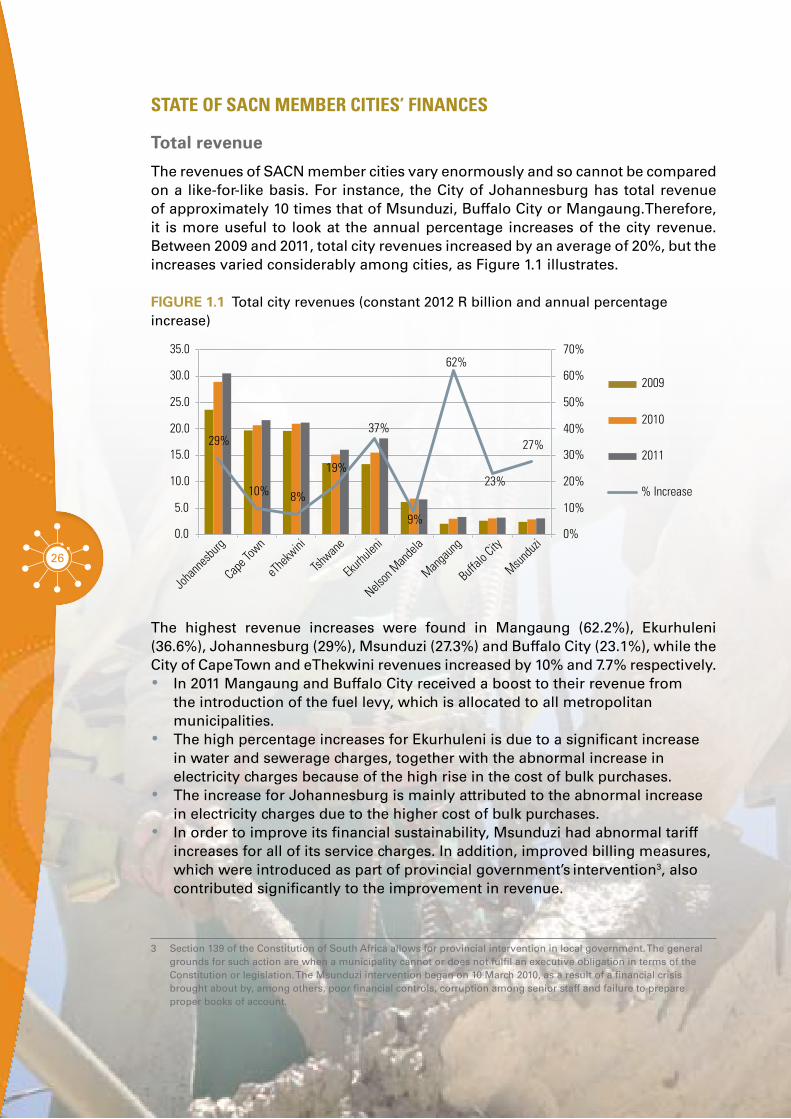
Total revenue
The revenues of SACN member cities vary enormously and so cannot be compared on a like-for-like basis. For instance, the City of Johannesburg has total revenue of approximately 10 times that of Msunduzi, Buffalo City or Mangaung.Therefore, it is more useful to look at the annual percentage increases of the city revenue. Between 2009 and 2011, total city revenues increased by an average of 20%, but the increases varied considerably among cities, as Figure 1.1 illustrates.
FiGURe 1.1 Total city revenues (constant 2012 R billion and annual percentage increase)
0.0
Joha
nnesb
urg
Cape T
own
eThe
kwini
Tshwan
e
Ekurhu
leni
Nelson
Man
dela
Manga
ung
Buffalo
City
Msundu
zi
5.0
10.0
15.0
20.0
25.0
30.0
35.0
37%27%
0%
% Increase
2011
2010
2009
10%
20%
30%
40%
50%
60%
70%62%
9%
23%10% 8%
19%
29%
The highest revenue increases were found in Mangaung (62.2%), Ekurhuleni (36.6%), Johannesburg (29%), Msunduzi (27.3%) and Buffalo City (23.1%), while the City of Cape Town and eThekwini revenues increased by 10% and 7.7% respectively.•• In 2011 Mangaung and Buffalo City received a boost to their revenue from
the introduction of the fuel levy, which is allocated to all metropolitan municipalities.
•• The high percentage increases for Ekurhuleni is due to a significant increase in water and sewerage charges, together with the abnormal increase in electricity charges because of the high rise in the cost of bulk purchases.
•• The increase for Johannesburg is mainly attributed to the abnormal increase in electricity charges due to the higher cost of bulk purchases.
•• In order to improve its financial sustainability, Msunduzi had abnormal tariff increases for all of its service charges. In addition, improved billing measures, which were introduced as part of provincial government’s intervention3, also contributed significantly to the improvement in revenue.
3 Section 139 of the Constitution of South Africa allows for provincial intervention in local government. The general grounds for such action are when a municipality cannot or does not fulfil an executive obligation in terms of the Constitution or legislation. The Msunduzi intervention began on 10 March 2010, as a result of a financial crisis brought about by, among others, poor financial controls, corruption among senior staff and failure to prepare proper books of account.
27
cH
AP
Te
R 1
STA
TE
OF
CIT
Y F
INA
NC
ES
20
13
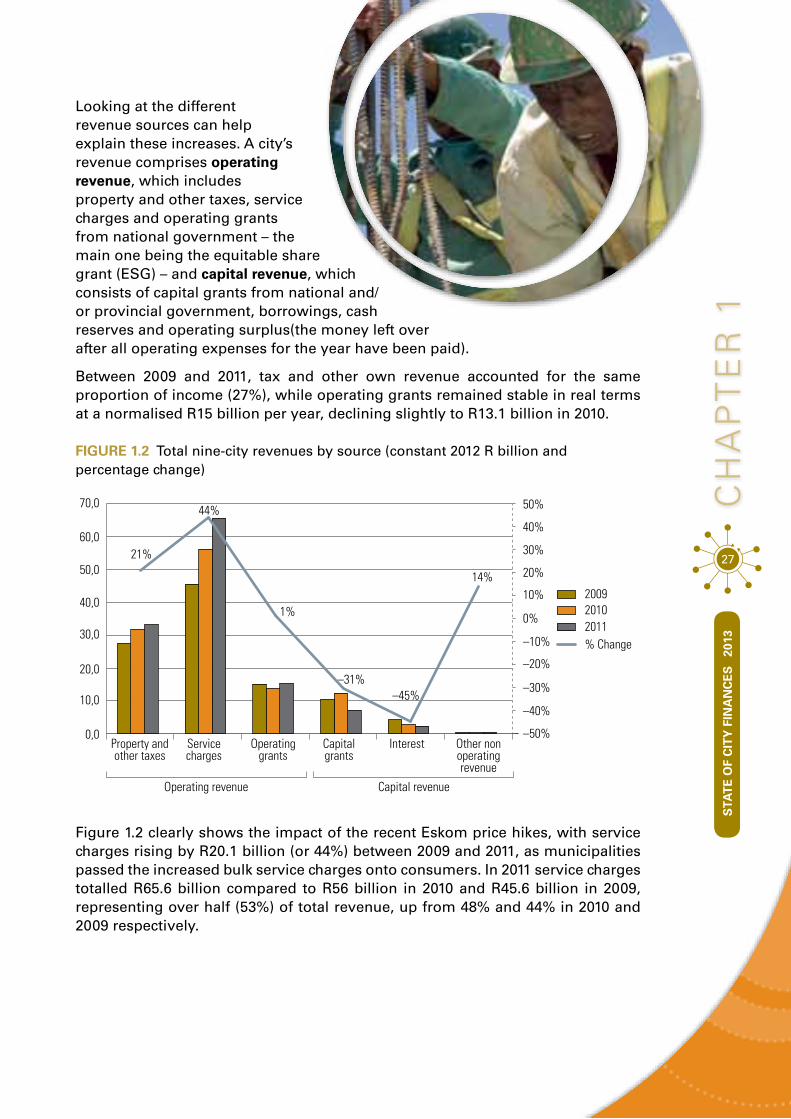
Looking at the different revenue sources can help explain these increases. A city’s revenue comprises operating revenue, which includes property and other taxes, service charges and operating grants from national government – the main one being the equitable share grant (ESG) – and capital revenue, which consists of capital grants from national and/or provincial government, borrowings, cash reserves and operating surplus(the money left over after all operating expenses for the year have been paid).
Between 2009 and 2011, tax and other own revenue accounted for the same proportion of income (27%), while operating grants remained stable in real terms at a normalised R15 billion per year, declining slightly to R13.1 billion in 2010.
FiGURe 1.2 Total nine-city revenues by source (constant 2012 R billion and percentage change)
0,0Property andother taxes
Operating revenue Capital revenue
Servicecharges
Operatinggrants
Capitalgrants
Interest Other nonoperatingrevenue
10,0
20,0
30,0
40,0
21%
44%
1%
–31%–45%
14%50,0
60,0
70,0
0%
10%
–10%
30%
200920102011% Change
–30%
20%
–20%
40%
–40%
50%
–50%
Figure 1.2 clearly shows the impact of the recent Eskom price hikes, with service charges rising by R20.1 billion (or 44%) between 2009 and 2011, as municipalities passed the increased bulk service charges onto consumers. In 2011 service charges totalled R65.6 billion compared to R56 billion in 2010 and R45.6 billion in 2009, representing over half (53%) of total revenue, up from 48% and 44% in 2010 and 2009 respectively.

28
This increase in service charges offset the decrease in capital grant revenue, which dropped from R12.4 billion in 2010 to R7 billion in 2011. With the completion of the stadiums and associated infrastructure for the 2010 Soccer World Cup, the proportion of revenue from capital grants reduced from 11% in 2010 to 6% in 2011. The decreased grants and lower interest rates led to overall interest revenue declining from R2.7 billion in 2010 to R2.3 billion in 2011. In 2011, interest on investments declined by 19.1% to R1.1 billion, while interest on consumer debtors declined by 9.2% to R1.2 billion, despite gross debtors increasing by 16%. This was because some municipalities did not levy interest on outstanding debt.
Operating revenue
A city’s operating revenue derives mainly from property and other taxes (such as the fuel levy), service charges and operating grants. •• Compared to service charges, property and other taxes did not increase
significantly over the three years. This is partly a result of municipalities ‘subsidising’ the abnormal increase in electricity through lower increases on property tax and other services in an attempt to keep the total cost of services low.
•• In 2010 the higher increases in property rates revenue compared to 2009 were the result of all municipalities being compelled to introduce new valuation rolls by 1 July 2009 compiled in accordance with the Municipal Property Rates Act. The new principle of valuating properties according to market value led to a significant increase in property rates revenue for all municipalities.
•• In 2011 Mangaung and Buffalo City received metro status and a subsequent boost to their revenue from the introduction of the fuel levy, which is allocated to all metropolitan municipalities.
STA
TE
OF
CIT
Y F
INA
NC
ES
20
13
29
cH
AP
Te
R 1
Service charges
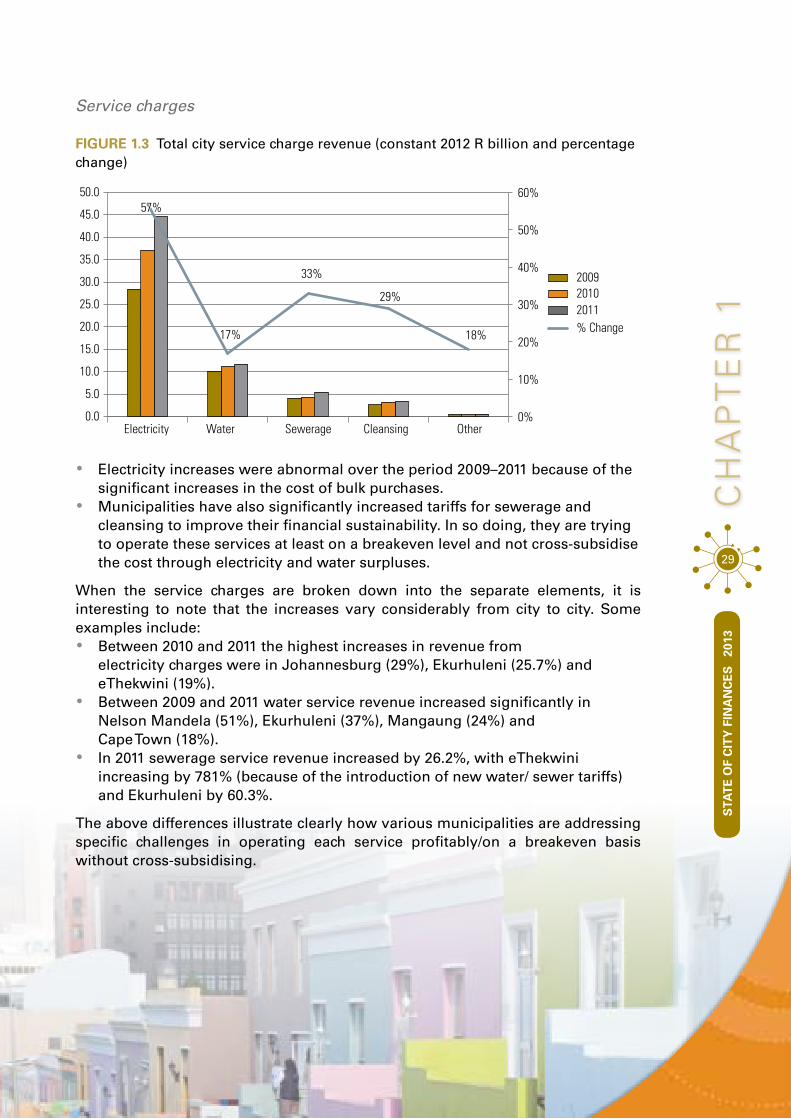
FiGURe 1.3 Total city service charge revenue (constant 2012 R billion and percentage change)
0.0
5.0
10.0
15.0
20.0
25.0
30.0
35.0
40.0
45.0
50.0
0%Electricity
17%
33%
29%
18%
Water Sewerage Cleansing Other
10%
20%
30%
40%
50%
60%
200920102011% Change
57%57%
•• Electricity increases were abnormal over the period 2009–2011 because of the significant increases in the cost of bulk purchases.
•• Municipalities have also significantly increased tariffs for sewerage and cleansing to improve their financial sustainability. In so doing, they are trying to operate these services at least on a breakeven level and not cross-subsidise the cost through electricity and water surpluses.
When the service charges are broken down into the separate elements, it is interesting to note that the increases vary considerably from city to city. Some examples include:•• Between 2010 and 2011 the highest increases in revenue from
electricity charges were in Johannesburg (29%), Ekurhuleni (25.7%) and eThekwini (19%).
•• Between 2009 and 2011 water service revenue increased significantly in Nelson Mandela (51%), Ekurhuleni (37%), Mangaung (24%) and Cape Town (18%).
•• In 2011 sewerage service revenue increased by 26.2%, with eThekwini increasing by 781% (because of the introduction of new water/ sewer tariffs) and Ekurhuleni by 60.3%.
The above differences illustrate clearly how various municipalities are addressing specific challenges in operating each service profitably/on a breakeven basis without cross-subsidising.
STA
TE
OF
CIT
Y F
INA
NC
ES
20
13

30
Operating grants
National government gives operating grants to municipalities to cover operating expenditure. The main grant is the ESG, which subsidises the cost of providing free basic services (FBS). Overall, operating grants remained stable in real terms during 2009–2011, but the increases varied per city.
FiGURe 1.4 ESG and other operating grants by city (constant 2012 R billion and percentage change)
0.0
0.5
1.0
1.5
2.0
2.5
3.0
3.5
4.0
4.5
5.022%
19%
32%
20%
53%
39%
15%
Joha
nnesb
urg
Cape T
own
eThe
kwini
Tshwan
e
Ekurhu
leni
Nelson
Man
dela
Manga
ung
Buffalo
City
Msundu
zi
200920102011% Change
–80%
–60%
–40%
–20%
0%
20%
40%
60%
–33%–33%
–59%–59%
For 2011 the total operating grants allocated to Johannesburg and Ekurhuleni represented approximately 50% of the total allocation. This is as a result of the two municipalities having the largest populations and therefore the greatest need for FBS. The total equitable share and operating grants for Buffalo City and Mangaung were around R0.6 billion respectively, with Msunduzi receiving the least at just over R0.3 billion.
A comparison of the operating grants for the metros between 2009 and 2011 revealed the following:•• From 2010 to 2011, the total operating grant allocation for Johannesburg,
Tshwane, Ekurhuleni, Nelson Mandela, Mangaung, Buffalo City and Msunduzi increased by an average of 12% in real terms.
•• The total operating grant share for Cape Town decreased by 33% between 2009 and 2010, reflecting the increased grants in 2009 for hosting the 2010 Soccer World Cup, and then increased by 23% in 2011.
•• The total operating grant share for eThekwini decreased by 1% from 2010 to 2011, after a decrease of 59% between 2009 and 2010. This was also because of increased grants in 2009 for hosting the 2010 Soccer World Cup.

STA
TE
OF
CIT
Y F
INA
NC
ES
20
13
31
cH
AP
Te
R 1
Capital revenue
Capital revenue is the money available to pay for capital projects, such as the building of new infrastructure or the purchase of land. The main sources are capital grants, borrowing, cash reserves and operating surplus.
Figure 1.5 illustrates vividly the effect of the end of the 2010 Soccer World Cup and the completion of stadiums and infrastructure that had been funded by capital grants in some of the cities.
FiGURe 1.5 Capital grants by city (constant 2012 R billion and percentage change)
0.0
0.5
1.0
1.5
2.0
2.5
3.0
3.5
4.0
Joha
nnesb
urg
Cape T
own
eThe
kwini
Tshwan
e
Ekurhu
leni
Nelson
Man
dela
Manga
ung
Buffalo
City
Msundu
zi–60%
–40%
–20%
0%
20%
40%
60%
200920102011% Change
10%
–51%–51% –47%
10%
–47%
–31%
–1%
–44%–44%
–21%
51%
–10%
•• Between 2010 and 2011, total capital and conditional grants declined by an average of 42.6% in Johannesburg, Cape Town, eThekwini, Tshwane, Nelson Mandela and Mangaung. This was all due to the completion of the infrastructure for the 2010 Soccer World Cup.
•• For the period 2009 to 2011 total capital and conditional grants allocations for Ekurhuleni, Buffalo City and Msunduzi remained stable in real terms. These municipalities were not host cities for the 2010 Soccer World Cup and therefore did not benefit from additional infrastructure upgrades.
32
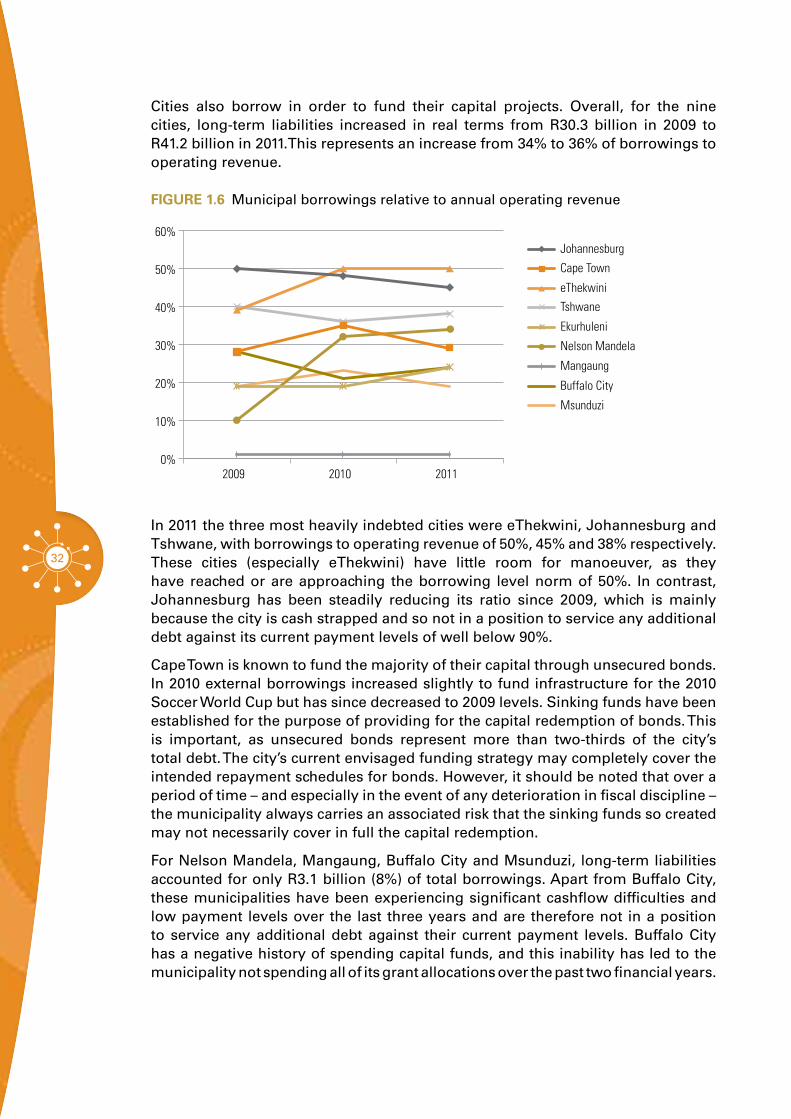
Cities also borrow in order to fund their capital projects. Overall, for the nine cities, long-term liabilities increased in real terms from R30.3 billion in 2009 to R41.2 billion in 2011.This represents an increase from 34% to 36% of borrowings to operating revenue.
FiGURe 1.6 Municipal borrowings relative to annual operating revenue
Msunduzi
Buffalo City
Mangaung
Ekurhuleni
Tshwane
eThekwini
Nelson Mandela
Johannesburg
Cape Town
0%
10%
20%
30%
40%
50%
60%
2009 2010 2011
In 2011 the three most heavily indebted cities were eThekwini, Johannesburg and Tshwane, with borrowings to operating revenue of 50%, 45% and 38% respectively. These cities (especially eThekwini) have little room for manoeuver, as they have reached or are approaching the borrowing level norm of 50%. In contrast, Johannesburg has been steadily reducing its ratio since 2009, which is mainly because the city is cash strapped and so not in a position to service any additional debt against its current payment levels of well below 90%.
Cape Town is known to fund the majority of their capital through unsecured bonds. In 2010 external borrowings increased slightly to fund infrastructure for the 2010 Soccer World Cup but has since decreased to 2009 levels. Sinking funds have been established for the purpose of providing for the capital redemption of bonds. This is important, as unsecured bonds represent more than two-thirds of the city’s total debt. The city’s current envisaged funding strategy may completely cover the intended repayment schedules for bonds. However, it should be noted that over a period of time – and especially in the event of any deterioration in fiscal discipline – the municipality always carries an associated risk that the sinking funds so created may not necessarily cover in full the capital redemption.
For Nelson Mandela, Mangaung, Buffalo City and Msunduzi, long-term liabilities accounted for only R3.1 billion (8%) of total borrowings. Apart from Buffalo City, these municipalities have been experiencing significant cashflow difficulties and low payment levels over the last three years and are therefore not in a position to service any additional debt against their current payment levels. Buffalo City has a negative history of spending capital funds, and this inability has led to the municipality not spending all of its grant allocations over the past two financial years.

STA
TE
OF
CIT
Y F
INA
NC
ES
20
13
33
cH
AP
Te
R 1
Operating surplusThe operating surplus is an important part of capital revenue that enables cities to plan their longer-term development.
FiGURe 1.7 Surplus by city (constant 2012 R billion and percentage change)
0.0
2.0
4.0
6.0
8.0
10.0
12.0
0%
1%
2%
3%
4%
5%
6%
7%
8%
9%
10%
2009 2010 2011
Operating Surplus (De�cit)Surplus (De�cit)Operating Surplus (De�cit) %Surplus (De�cit) %
8%
9%
5%
4%
9%
5%6%
8%8%
4%
6%
8%
The aggregate operating surplus increased by 9% in 2011, after increasing by 6% since 2009. However, the operating surplus as a percentage of revenue remained at 6% for both 2009 and 2010, declining to 5% in 2011.
STA
TE
OF
CIT
Y F
INA
NC
ES
20
13
34
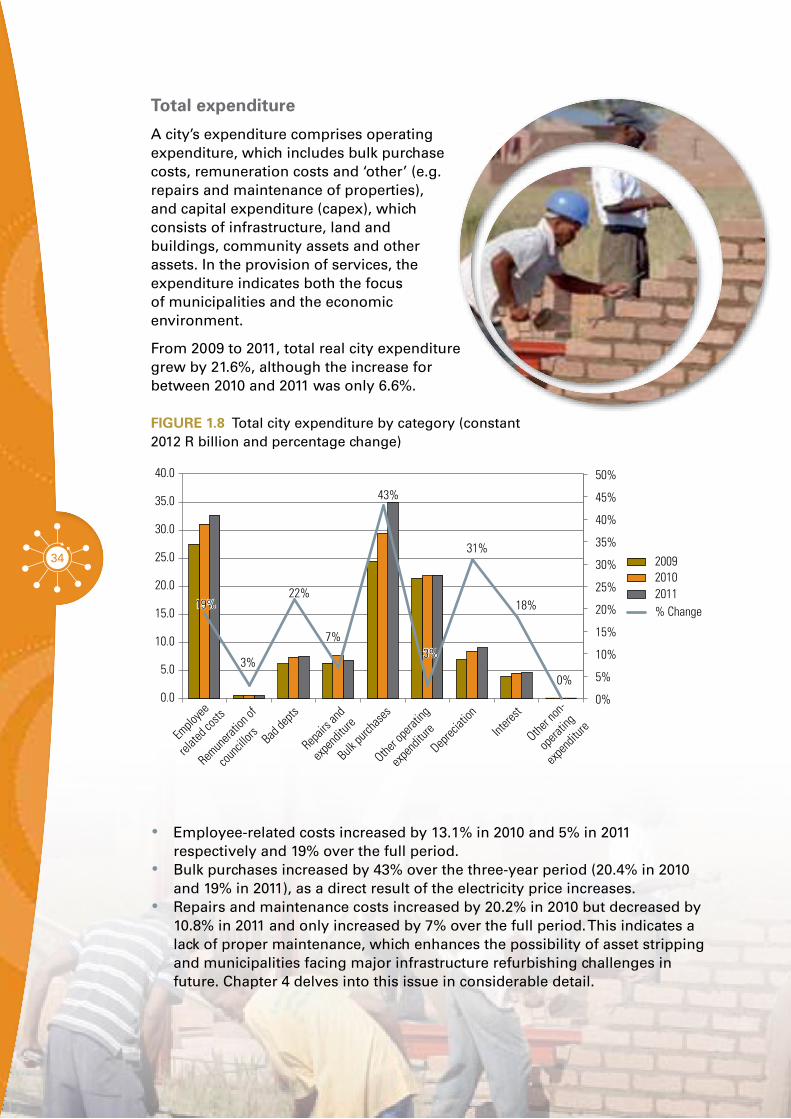
Total expenditure
A city’s expenditure comprises operating expenditure, which includes bulk purchase costs, remuneration costs and ‘other’ (e.g. repairs and maintenance of properties), and capital expenditure (capex), which consists of infrastructure, land and buildings, community assets and other assets. In the provision of services, the expenditure indicates both the focus of municipalities and the economic environment.
From 2009 to 2011, total real city expenditure grew by 21.6%, although the increase for between 2010 and 2011 was only 6.6%.
FiGURe 1.8 Total city expenditure by category (constant 2012 R billion and percentage change)
0.0
5.0
10.0
15.0
20.0
25.0
30.0
35.0
40.0
200920102011% Change
0%
5%
10%
15%
20%
25%
30%
35%
40%
45%
50%
19%
3%
22%
7%
43%
Emplo
yee
relate
d cost
s
Remun
eratio
n of
counci
llors Bad
depts
Repair
s and
expen
diture
Deprec
iation
Intere
st
Other n
on-
opera
ting
expen
diture
Other o
perat
ing
expen
diture
Bulk pu
rchase
s
31%
18%
0%
19%
3%3%
•• Employee-related costs increased by 13.1% in 2010 and 5% in 2011 respectively and 19% over the full period.
•• Bulk purchases increased by 43% over the three-year period (20.4% in 2010 and 19% in 2011), as a direct result of the electricity price increases.
•• Repairs and maintenance costs increased by 20.2% in 2010 but decreased by 10.8% in 2011 and only increased by 7% over the full period. This indicates a lack of proper maintenance, which enhances the possibility of asset stripping and municipalities facing major infrastructure refurbishing challenges in future. Chapter 4 delves into this issue in considerable detail.
STA
TE
OF
CIT
Y F
INA
NC
ES
20
13
35
cH
AP
Te
R 1
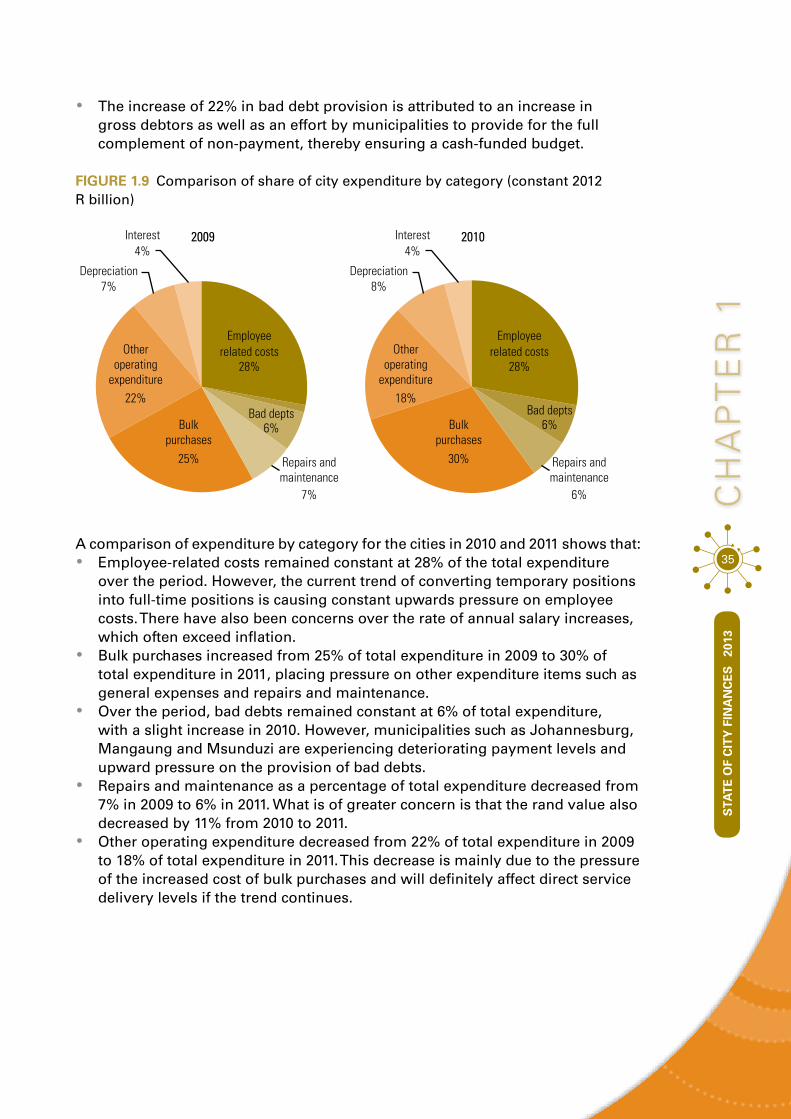
•• The increase of 22% in bad debt provision is attributed to an increase in gross debtors as well as an effort by municipalities to provide for the full complement of non-payment, thereby ensuring a cash-funded budget.
FiGURe 1.9 Comparison of share of city expenditure by category (constant 2012 R billion)
4%2009Interest
Depreciation
Otheroperating
expenditure
Bulkpurchases
Repairs andmaintenance
Employeerelated costs
Bad depts
7%
22%
25%
7%
6%
28%
4%2010Interest
Depreciation
Otheroperating
expenditure
Bulkpurchases
Repairs andmaintenance
Employeerelated costs
Bad depts
8%
18%
30%
6%
6%
28%
A comparison of expenditure by category for the cities in 2010 and 2011 shows that:•• Employee-related costs remained constant at 28% of the total expenditure
over the period. However, the current trend of converting temporary positions into full-time positions is causing constant upwards pressure on employee costs. There have also been concerns over the rate of annual salary increases, which often exceed inflation.
•• Bulk purchases increased from 25% of total expenditure in 2009 to 30% of total expenditure in 2011, placing pressure on other expenditure items such as general expenses and repairs and maintenance.
•• Over the period, bad debts remained constant at 6% of total expenditure, with a slight increase in 2010. However, municipalities such as Johannesburg, Mangaung and Msunduzi are experiencing deteriorating payment levels and upward pressure on the provision of bad debts.
•• Repairs and maintenance as a percentage of total expenditure decreased from 7% in 2009 to 6% in 2011. What is of greater concern is that the rand value also decreased by 11% from 2010 to 2011.
•• Other operating expenditure decreased from 22% of total expenditure in 2009 to 18% of total expenditure in 2011. This decrease is mainly due to the pressure of the increased cost of bulk purchases and will definitely affect direct service delivery levels if the trend continues.

36
FiGURe 1.10 Aggregate city expenditure and capex by category summary (constant 2012 R billion)
Capital expenditure
Other expenditure
Bulk purchases
Remuneration
2009 2010 20110
20
40
60
80
100
120
140
160
Total city expenditure and capital expenditure increased by 8% in 2010 but during 2011 decreased by 1% in real terms. This reduction was mainly because of the decline in capital expenditure following the end of the 2010 Soccer World Cup.
Remuneration costs
The increase in remuneration costs varies across the cities. It should be noted that an increase in remuneration is due not only to the annual increment but also to the filling of vacant positions and expansion of municipal organisational structure.
FiGURe 1.11 Remuneration by city (constant 2012 R billion and percentage change)
0.0
1.0
2.0
3.0
4.0
5.0
6.0
7.0
–5%
0%
5%
10%
15%
20%
25%
30%
35%
Joha
nnesb
urg
Cape T
own
eThe
kwini
Tshwan
e
Ekurhu
leni
Nelson
Man
dela
Manga
ung
Buffalo
City
Msundu
zi
2009
27%
21%
20%
28%
19%
33%
18% 17%
–1%
20102011% Change
27%
21%
20%19%

STA
TE
OF
CIT
Y F
INA
NC
ES
20
13
37
cH
AP
Te
R 1
In 2010 and 2011 the average expenditure on remuneration increased by 15% and 7% above CPI respectively. However, the yearly increases varied per city. In 2010, the increases were 31% for Nelson Mandela and below 20% for all of the other cities (Cape Town 19%, Johannesburg 16%, Ekurhuleni 14%, eThekwini 13%, Buffalo City 12%, Tshwane 11% and Mangaung 11%) apart from Msunduzi, which only increased by 3% above CPI. In 2011, the increases were 14% in Tshwane and 10% in Johannesburg and Nelson Mandela. When adjusted for CPI, remuneration for the remaining metros increased between 5% and 6%, with the exception of Cape Town (increased by 2%) and Msunduzi (declined by 4%).
The increase in employee-related costs since 2009 in Tshwane may indicate that the city has reversed its policy of not filling vacant positions. An analysis on the vacancy rates of Tshwane from 2007 to 2008 found a decline of 4 601 jobs.
In Cape Town, the substantial increase in employee costs (above the average wage agreements) is mainly due to the city implementing the TASK Job Grading System, creating additional positions in the organisational structure and converting temporary posts into permanent posts. As a result, between 2008 and 2011 staff numbers for the City of Cape Town increased by 18%, from 21 530 to 25 390.
Bulk purchase costs
Bulk purchases, which include electricity and water costs, increased in most cities following Eskom’s price hikes.
FiGURe 1.12 Bulk purchases by city (constant 2012 R billion and percentage change)
0.0
1.0
2.0
3.0
4.0
5.0
6.0
7.0
8.0
9.0
200920102011
50%47%
51%
37%
43%
45%
% Change
Joha
nnesb
urg
Cape T
own
eThe
kwini
Tshwan
e
Ekurhu
leni
Nelson
Man
dela
Manga
ung
Buffalo
City
Msundu
zi0%
10%
20%
30%
40%
50%
60%
50% 37%
51%
43%43%
53%
16%16%
53%
45%47%50%50%
With the exception of Buffalo City, all cities saw bulk purchase expenditure increase significantly between 2009 and 2011. Buffalo City’s lower percentage is explained by the correction of an accounting error in 2011. Bulk purchases form a major part of total operating expenditure and have a significant influence on the availability of funding for spending on other expenses such as service delivery and repairs and maintenance. The abnormal increases are already reflected in decreased expenditure on repairs and maintenance, which will have serious negative effects on future maintenance of infrastructure assets.
STA
TE
OF
CIT
Y F
INA
NC
ES
20
13

38
Capital expenditure
Municipalities normally finance capital projects from own revenue, external loans and leases, or government grants. Ideally municipalities should fund most of their capital expenditure from own resources.
FiGURe 1.13 Capital expenditure of cities (constant 2012 R billion and percentage change)
0.0
1.0
2.0
3.0
4.0
5.0
6.0
7.0
8.0
Joha
nnesb
urg
Cape T
own
eThe
kwini
Tshwan
e
Ekurhu
leni
Nelson
Man
dela
Manga
ung
Buffalo
City
Msundu
zi
2009–31%
–30%
–10%
–66%
–48%
20102011% Change
–70%
–60%
–50%
–40%
–30%
–20%
–10%
0%
–2%
–44%–48%
–43%–44%
–48%–43%
–2%
As Figure 1.13 shows clearly, cities made significant investments in capital expenditure in preparation for the 2010 Soccer World Cup. However, capital expenditure is now returning to levels similar to pre-2010, reducing by 33% in real terms between 2010 and 2011. This was mainly because of the reduction in capital allocations by the World Cup hosting cities of Cape Town (48%), Johannesburg (44%), eThekwini (43%), Mangaung (48%), Tshwane (31%) and Ekurhuleni (30%).
Debtors
Debtor and credit control ratios indicate whether a municipality is able to collect its debts within the prescribed payment period, so performance is measured against one month’s billings. Municipalities measure and report on gross debtors and net debtors. Gross debtors are the total amount owed to the municipality for services and taxes, whereas net debtors take into account invoices that the city does not expect to be paid. In other words, the amount owed to the municipality after taking bad and doubtful debts into account.
High gross debtors imply that the municipality is invoicing for services and taxes but not collecting efficiently or effectively the money owed; it may indicate ineffective credit control procedures as well as the payment culture of the consumers. High net debtors may indicate the effectiveness of credit control procedures and can provide an assessment of the provision for bad debts.
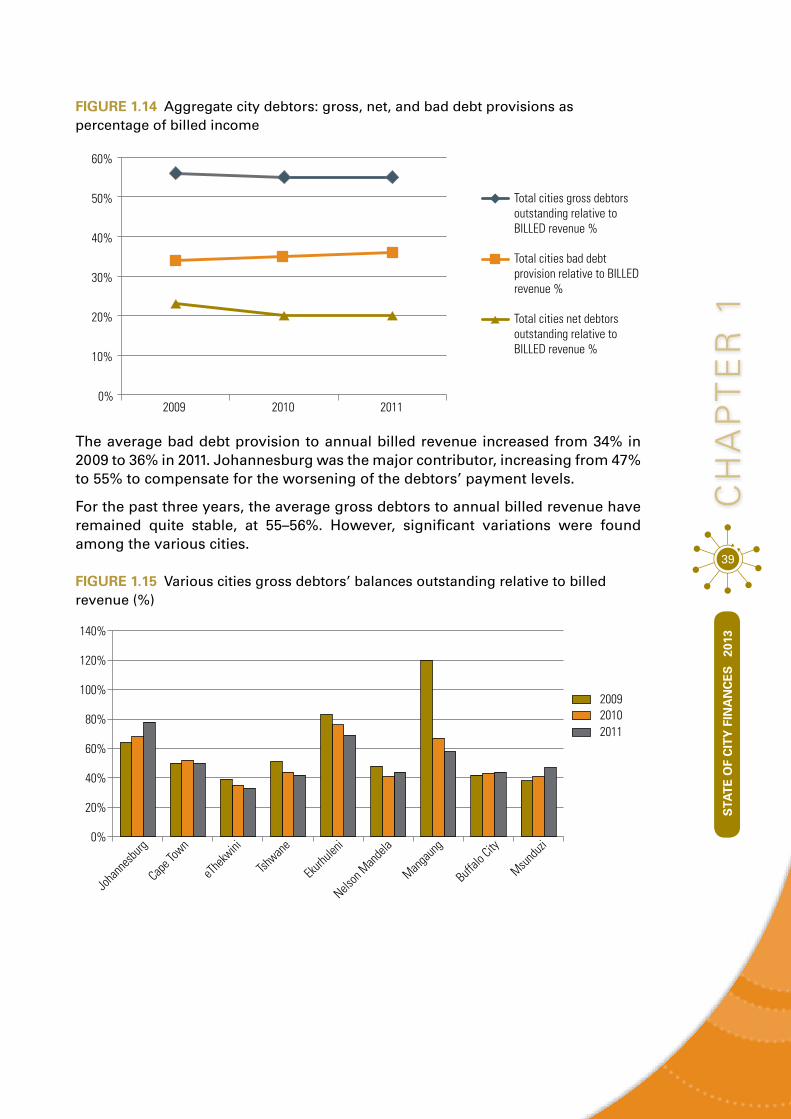
STA
TE
OF
CIT
Y F
INA
NC
ES
20
13
39
cH
AP
Te
R 1
FiGURe 1.14 Aggregate city debtors: gross, net, and bad debt provisions as percentage of billed income
Total cities gross debtorsoutstanding relative toBILLED revenue %
0%2009 2010 2011
10%
20%
30%
40%
50%
60%
Total cities net debtorsoutstanding relative toBILLED revenue %
Total cities bad debtprovision relative to BILLEDrevenue %
The average bad debt provision to annual billed revenue increased from 34% in 2009 to 36% in 2011. Johannesburg was the major contributor, increasing from 47% to 55% to compensate for the worsening of the debtors’ payment levels.
For the past three years, the average gross debtors to annual billed revenue have remained quite stable, at 55–56%. However, significant variations were found among the various cities.
FiGURe 1.15 Various cities gross debtors’ balances outstanding relative to billed revenue (%)
0%
20%
40%
60%
80%
100%
120%
140%
Joha
nnesb
urg
Cape T
own
eThe
kwini
Tshwan
e
Ekurhu
leni
Nelson
Man
dela
Manga
ung
Buffalo
City
Msundu
zi
200920102011

40
Johannesburg’s collections deteriorated, with gross debtors increasing from 64% in 2009 to 78% in 2011, whereas Ekurhuleni improved, with gross debtors decreasing from 83% in 2009 to 69% in 2011. Tshwane and eThekwini improved, with gross debtors decreasing from 51% to 42% and from 39% to 33% respectively.
It should also be taken into account that outstanding debtors do not necessarily decrease because of improved collection efforts but may be due to municipalities writing off debt on a continuous basis.
Cash position
For the nine cities, the cash and cash equivalents position in real terms was R7.7 billion in 2009, R10.4 billion in 2010 and R9.4 billion in 2011, while short-term investments were R5.3 billion in 2009, R1.4 billion in 2010 and R5.5 billion in 2011.
Cities need to have sufficient cash to meet their financial commitments. A measure of this is the months of cash spend, which is calculated by dividing the monthly cash expenditure requirement into the total cash and cash equivalents available. The result is the number of months of expenditure the city can cover.
FiGURe 1.16 Months of cash spend (constant 2012 R billion)
Msunduzi
Buffalo City
Mangaung
Ekurhuleni
Tshwane
eThekwini
Nelson Mandela
Johannesburg
Cape Town
0.0
0.5
1.0
1.5
2.0
2.5
3.0
3.5
4.0
The cities currently have on average 1.42 months of cash, which is an improvement since 2009 (1.32 months) and 2010 (1.11 months). However, Johannesburg currently only has 0.35 months of cash, which could indicate an increase in risk. Without cash reserves to fall back on, the city will depend on its ability to collect from debtors in order to pay its monthly cash expenditure. In contrast, the City of Cape Town had 3.19 months of cash on hand.

STA
TE
OF
CIT
Y F
INA
NC
ES
20
13
conclUsIon The cities support a significant portion of the country’s economy and, therefore, their performance and sustainability is important. Various changing factors have had an impact on the environment in which the cities operate and provide services.
Increases in bulk purchase costs, mainly as a result of Eskom’s significant tariff hikes and employee-related costs, due to salary increases in excess of inflation, are not really within the control of the cities, as these costs are mostly driven by outside factors. These cost increases are in contrast to cities needing to maintain high levels of service delivery, while keeping tariff increases within the national inflation target band. The financial results show that the larger metros appear to cope better with the financial and service challenges than the smaller metros and local municipalities. However, the cities are often forced to pass the increased costs to their consumers, which may have a significant impact on the affordability of municipal charges. This is already clearly illustrated in the poor cashflow positions of Johannesburg, Tshwane, Nelson Mandela Bay, Mangaung and Emfuleni.
In the majority of cases, operating surpluses are generated annually. From a revenue perspective, service charges and government grants have increased most in proportion to other revenue sources.
From an expenditure perspective, both an increase in employee-related costs and bulk purchases relative to total operating expenditure could have a negative influence on repair and maintenance spending and allow limited flexibility in discretionary operating expenditure. And there lies the dilemma: the imperative is to ensure that tariffs are structured in such a way to account for the true cost of rendering the service in order to prevent compromising on repairs and maintenance spending. However, as noted, this has had, and will probably have, a negative effect on affordability of municipal charges going forward.
The net debtors’ balances outstanding have increased marginally. However, the percentage increase of bad debt provision is greater than the percentage increase of revenue from property rates and service charges. This indicates a decline in the ability to collect revenue.
Cash and investments have been negatively affected. The relatively high net debtors’ days indicate that municipalities are likely to encounter cashflow issues in future. Therefore, an emphasis on improving debtors’ payment performance is needed. Furthermore, the cash coverage suggests that the municipality is vulnerable in terms of its ability to meet its commitments (pay expenses) if debtors performance worsens.
Over the reporting period, capital spending in some of the cities increased substantially, largely attributable to capital grants paid to 2010 Soccer World Cup hosting cities. However, doubt remains whether these cities will realise a positive return over time on these capital investments. The increase in employee-related costs will also influence the cities’ ability to react to credit challenges, including implementing sizeable capital expenditure programmes. This will result in increased financial leverage and potential expenditure pressure for service delivery and social housing.
41
co
nc
lU
sIo
n
STA
TE
OF
CIT
Y F
INA
NC
ES
20
13

42
Affordability is not a straight -
forward concept, especially when dealing with
city services.
43
STA
TE
OF
CIT
Y F
INA
NC
ES
20
13
on the affordability of metropolitan taxes and service charges to households
One of the key dimensions of city sustainability is that the city government should be able to deliver the quantity and quality of services required by its residents and businesses at a price they can afford to pay. In recent years metropolitan municipalities have found themselves having to pass on to consumers the rapid increases in electricity and water bulk charges and have also been increasing property taxes. The question that arises is whether metropolitan municipalities are ‘pricing themselves out of the market’ by imposing increasingly unaffordable municipal service charges on their residents and businesses.
Unaffordable taxes and service charges could have a number of adverse implications for city financial sustainability, and accordingly for overall city sustainability. At the most fundamental level, unaffordable service charges imply that the services offered by the city government are incorrect in type, quantity or quality and/or their operational and administrative efficiency is too low, relative to what city consumers and taxpayers can afford to pay. While metropolitan governments can do little about the increases in bulk service charges imposed by Eskom and the various water boards, if service charges are becoming increasingly unaffordable, they will need to re-examine many aspects of their service delivery work, including their service offerings.
This chapter uses data for SACN member cities to examine the increases in municipal service charges in recent years. Information on the actual service charges and property taxes imposed by SACN members is combined with a variety of other data in order to specify more closely the nature and extent of the increases, assess their affordability to households, compare across cities, and examine the implications for future city finances.
Affordability is not a straightforward concept, especially when dealing with city services. For example, customers may quite reasonably be expected to react to some price increases by curtailing their consumption, thereby preserving affordability. However, this is not really an option where household incomes and per capita consumption levels are already low.
cHAPTeR 2

44
Furthermore, affordability means different things to business as opposed to residential consumers. Businesses consumers are very diverse, cut across every economic sector and use very different packages of municipal services. The impact of increasing service charges depends on many factors, including the significance of municipal charges in the overall business cost structure and the competitiveness of the industry. Municipal taxes and charges are part of business costs, and, for some businesses, increases can to some extent be passed on to their customers through increased prices, thereby entering the general inflationary spiral and being borne ultimately by households. If this is not possible, businesses can be expected to take action to minimise the impact of the increases (for example by moving to smaller premises or using more efficient technologies) or possibly even closing down. Any assessment of the affordability of municipal taxes and charges to businesses is therefore necessarily a large-scale exercise.
This chapter accordingly focuses upon the affordability of municipal services to households. In order to compare like with like, the charges imposed for four standard ‘baskets of services’ (TYPES A to D) are traced for each metropolitan municipality and in each financial year. These standard baskets are specified in terms of a property value, a monthly electricity consumption in kilowatt hours (kWh) and a monthly water consumption in kilolitres (kl). A ‘total municipal account’ can be calculated by looking up charges for sanitation, refuse removal, and other services in annual metropolitan tariff tables, adding VAT as required.4
Property taxes are an essential component of the municipal account, as they represent services such as roads and parks that are not covered in the consumption of water and electricity and, in some cases, are also the basis for charging for refuse removal and other services. However, property taxes depend on assessed values, and all SACN members introduced new valuation rolls in this period, resulting in generally higher property values and lower property tax rates. For this reason much of the analysis has been limited to the period after the introduction of new valuation rolls (i.e. 2008/09 to 2011/12), and the ‘assessed values’ referred to are values in the relevant city valuation roll as at 2008/09.
4 This data was collected from tariff tables available on individual city websites for 2006 to 2012. Data for Nelson Mandela Bay was only available for 2011.

45
cH
AP
Te
R 2
STA
TE
OF
CIT
Y F
INA
NC
ES
20
13
stAndArd pAckAges oF servicesThe characteristics of the standard baskets of services used, summarised in Table 2.1, were the following:a. T YPE A: the household lives in a property with an assessed value of R100,000
and consumes 400 kWh per month of electricity and 20 kl per month of water.b. T YPE B: the household lives in a property with an assessed value of R250,000
and consumes 500 kWh per month of electricity and 25 kl per month of water.c. T YPE C: the household lives in a property with an assessed value of R500,000
and consumes 800 kWh per month of electricity and 30 kl per month of water.d. T YPE D: the household lives in a property with an assessed value of
R1,000,000 and consumes 1 500 kWh per month of electricity and 40 kl per month of water;
TaBLe 2.1 Standard service packages
standard service packages
Property value in 2008/09 (R)
electricity consumption (kWh/month)
Water consumption (kl/month)
TYPe a 100,000 400 20
TYPe B 250,000 500 25
TYPe c 500,000 800 30
TYPe D 1,000,000 1 500 40
benchmArk household incomesIn order to assess changes in household affordability, the costs of the standard service packages need to be compared with appropriate household income figures. The approach taken is to create benchmark household income categories, informed by existing city income distributions, where the ‘benchmark household’ is presumed to consume the corresponding service package.
Average household incomes and the distribution of household incomes of course vary across the different cities. Table 2.2 provides an estimate of average household incomes per city, calculated from the 2011 census figures.
TaBLe 2.2 Average household incomes per city (R per month)
Johannesburg 19,037
cape Town 17,113
eThekwini 11,946
Tshwane 19,173
ekurhuleni 13,311
nelson Mandela Bay 11,203
Mangaung 11,057
Buffalo city 10,300
Msunduzi 11,494
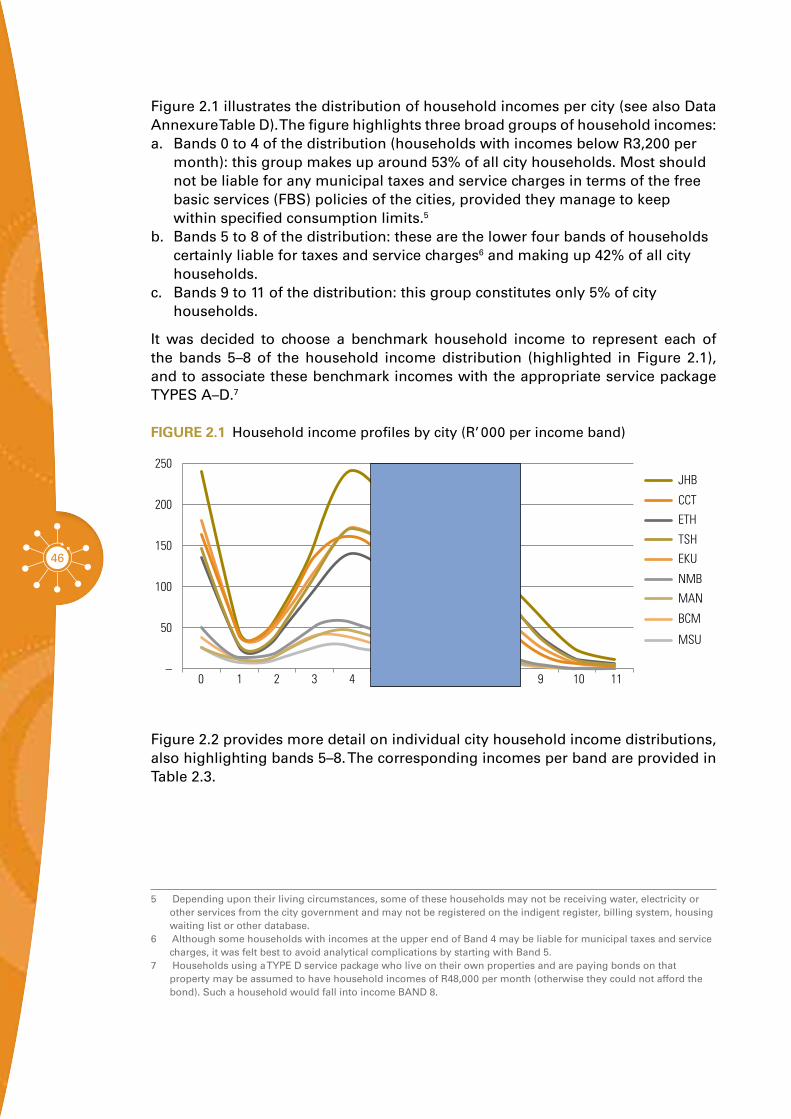
46
Figure 2.1 illustrates the distribution of household incomes per city (see also Data Annexure Table D). The figure highlights three broad groups of household incomes:a. Bands 0 to 4 of the distribution (households with incomes below R3,200 per
month): this group makes up around 53% of all city households. Most should not be liable for any municipal taxes and service charges in terms of the free basic services (FBS) policies of the cities, provided they manage to keep within specified consumption limits.5
b. Bands 5 to 8 of the distribution: these are the lower four bands of households certainly liable for taxes and service charges6 and making up 42% of all city households.
c. Bands 9 to 11 of the distribution: this group constitutes only 5% of city households.
It was decided to choose a benchmark household income to represent each of the bands 5–8 of the household income distribution (highlighted in Figure 2.1), and to associate these benchmark incomes with the appropriate service package TYPES A–D.7
FiGURe 2.1 Household income profiles by city (R’ 000 per income band)
MSU
0 1 2 3 4 5 6 7 8 9 10 11
BCM
MAN
NMB
EKU
TSH
ETH
CCT
JHB
–
50
100
150
200
250
Figure 2.2 provides more detail on individual city household income distributions, also highlighting bands 5–8. The corresponding incomes per band are provided in Table 2.3.
5 Depending upon their living circumstances, some of these households may not be receiving water, electricity or other services from the city government and may not be registered on the indigent register, billing system, housing waiting list or other database.
6 Although some households with incomes at the upper end of Band 4 may be liable for municipal taxes and service charges, it was felt best to avoid analytical complications by starting with Band 5.
7 Households using a TYPE D service package who live on their own properties and are paying bonds on that property may be assumed to have household incomes of R48,000 per month (otherwise they could not afford the bond). Such a household would fall into income BAND 8.
STA
TE
OF
CIT
Y F
INA
NC
ES
20
13
47
cH
AP
Te
R 2
FiGURe 2.2 Income distributions by city 2011–2013 (R’ 000)
JOHANNESBURG CAPE TOWN ETHEKWINI
00 1 2 3 4 5 6 7 8 9 10 11
50
100
150
200
250
0
50
100
150
200
250
0 1 2 3 4 5 6 7 8 9 10 11 0
50
100
150
200
250
0 1 2 3 4 5 6 7 8 9 10 11
TSHWANE EKURHULENI NELSON MANDELA BAY
0
50
100
150
200
250
0 1 2 3 4 5 6 7 8 9 10 110
50
100
150
200
250
0 1 2 3 4 5 6 7 8 9 10 110
10
20
30
40
50
60
0 1 2 3 4 5 6 7 8 9 10 11
MANGAUNG BUFFALO CITY MSUNDUZI
0
10
20
30
40
50
60
0 1 2 3 4 5 6 7 8 9 10 11 0
10
20
30
40
50
60
0 1 2 3 4 5 6 7 8 9 10 11 0
10
20
30
40
50
60
0 1 2 3 4 5 6 7 8 9 10 11
STA
TE
OF
CIT
Y F
INA
NC
ES
20
13

48
The benchmark household incomes presumed to correspond with each service package are shown in Table 2.3.
TaBLe 2.3 Monthly income distribution and benchmark household incomes
BanD RanGe (R/month) BencHMaRK (R/month)
0 0
1 1–400
2 401–800
3 801–1,600
4 1,601–3,200
5 3,201–6,400 6,000
6 6,401–12,800 12,000
7 12,801–25,600 24,000
8 25,601–51,200 48,000
9 51,201–102,400
10 102,401–204,800
11 204,801+
Source of first two columns: Census 2011 & Gaffney’s (see Annexure A)
increAsing municipAl service chArgesThe property taxes and service charges imposed by metropolitan councils have undoubtedly been increasing rapidly. Data from Chapter 1 clearly shows that city revenues from service charges have rapidly increased, largely because of increasing tariffs. However, the rate of increase has varied across cities and according to the type of service package. The following sub-sections set out the total municipal bill including VAT that was charged for each of the standard packages of services.

49
cH
AP
Te
R 2
STA
TE
OF
CIT
Y F
INA
NC
ES
20
13
Comparative costs of service packages
Table 2.4 provides a snapshot comparison of the costs of the different service packages charged by the nine city governments, ranking the cities by cost of service packages A to D in 2011. It is supported by Table 2.5, which shows the percentage variation from the average price for each service package, and by Figure 2.3, which portrays the same information graphically.
TaBLe 2.4 Monthly cost of service packages A to D in 2011, ranked by city (2012 R)
TYPe a TYPe B TYPe c TYPe D
ccT 551 eTH 880 eTH 1,528 nMB 2,990
eTH 580 eKU 975 nMB 1,757 JHB 3,068
JHB 598 JHB 1,006 Man 1,774 eTH 3,110
eKU 742 ccT 1,079 ccT 1,795 Man 3,286
Man 754 Man 1,101 eKU 1,910 aVeRaGe 3,305
aVeRaGe 804 nMB 1,149 aVeRaGe 1,910 ccT 3,332
nMB 834 aVeRaGe 1,151 JHB 1,941 MsU 3,381
TsH 1,035 TsH 1,360 TsH 2,033 eKU 3,498
MsU 1,041 BcM 1,385 BcM 2,164 TsH 3,524
BcM 1,105 MsU 1,428 MsU 2,292 BcM 3,553
The following conclusions are evident:a. The cost of the service packages varies considerably, especially at the lower
end. Thus a T YPE A package varies by 68% around the average (mean), while the variation at the other end ( T YPE D) is only 18%. TYPES B and C vary by 48% and 40% respectively. These variations reflect the different approaches to the pricing of services (especially at lower levels of consumption) and to the property tax policy.
b. The average cost of a T YPE A service package is R804 per month. Buffalo City Municipality is the most expensive (37% above average), while Cape Town is the cheapest (31% below average).
c. The average cost of a T YPE B service package is R1,151 per month. Msunduzi is the most expensive (24% above average), and eThekwini is the cheapest (24% below average).
d. The average cost of a T YPE C service package is R1,910 per month. Msunduzi is the most expensive (20% above average), and eThekwini is the cheapest (20% below average).
e. The average cost of a T YPE D service package is R3,305 per month. Buffalo City Municipality is the most expensive (8% above average), and Nelson Mandela Bay is the cheapest (10% below average).
50
TaBLe 2.5 Variation from average cost of service packages A to D in 2011, ranked by city (%)
TYPe a TYPe B TYPe c TYPe D
ccT –31% eTH –24% eTH –20% nMB –10%
eTH –28% eKU –15% nMB –8% JHB –7%
JHB –26% JHB –13% Man –7% eTH –6%
eKU –8% ccT –6% ccT –6% Man –1%
Man –6% Man –4% eKU 0% aVeRaGe 0%
aVeRaGe 0% nMB 0% aVeRaGe 0% ccT 1%
nMB 4% aVeRaGe 0% JHB 2% MsU 2%
TsH 29% TsH 18% TsH 6% eKU 6%
MsU 29% BcM 20% BcM 13% TsH 7%
BcM 37% MsU 24% MsU 20% BcM 8%
FiGURe 2.3 Cost of service packages in 2011 (2012 R values)
0
250
500
750
1000
1250
1500
1750
2000
2250
2500
2750
3000
3250
3500
3750
BCM TSH EKU MSU CCT MAN ETH JHB NMB
TYPE A TYPE B TYPE C TYPE D

STA
TE
OF
CIT
Y F
INA
NC
ES
20
13
51
cH
AP
Te
R 2
Composition of service charges
Table 2.6 summarises the composition of city service charges by service package type for all SACN members collectively. Electricity charges account for between 43% and 50% of all city taxes and service charges. Property taxes amount to around 3% for T YPE A service packages, rising to 17% for T YPE D, while water charges show the opposite pattern, falling from 22% for T YPE A to 14% for T YPE D service packages. Sanitation and refuse charges, as a fraction of the total municipal charge, also tend to decline from T YPE A to T YPE D.
Nevertheless, these averages also conceal considerable variety (see Figure 3.4 and the Data Annexure Table D). For example, electricity dominates the eThekwini T YPE A municipal account, comprising over 56% of the total, but water accounts for only 22%. In contrast, the costs of Mangaung’s T YPE A service delivery package is quite different: electricity makes up only 32% of the total, and water charges almost match this share at 30%.
TaBLe 2.6 Composition of city charges by service package type, 2011
TYPe a TYPe B TYPe c TYPe D
Property tax 3% 9% 14% 17%
electricity 46% 43% 48% 50%
Water 22% 21% 16% 14%
sanitation 10% 10% 8% 6%
Refuse 6% 6% 4% 3%
Other 1% 1% 0% 0%
VaT 12% 11% 11% 10%
Total 100% 100% 100% 100%
STA
TE
OF
CIT
Y F
INA
NC
ES
20
13
52
FiGURe 2.4 Composition of service charges by city, 2011
TYPE A
0
200
400
600
800
1000
1200
1400
JHB CCT ETH TSH EKU NMBMAN BCM MSU
Vat
Other
Refuse
Sanitation
Water
Electricity
Property Tax
TYPE B
0
200
400
600
800
1000
1200
1400Vat
Other
Refuse
Sanitation
Water
Electricity
Property Tax
JHB CCT ETH TSH EKU NMBMANBCM MSU
TYPE C
0
400
800
1200
1600
2000
2400
Vat
Other
Refuse
Sanitation
Water
Electricity
Property Tax
JHB CCT ETH TSH EKU NMBMAN BCM MSU
TYPE D
0400800
1200160020002400280032003600
Vat
Other
Refuse
Sanitation
Water
Electricity
Property Tax
JHB CCT ETH TSH EKU NMB MAN BCM MSU
53
cH
AP
Te
R 2
STA
TE
OF
CIT
Y F
INA
NC
ES
20
13
Cost of T YPE A service package 2009–2012
Table 2.7 shows the cost of T YPE A service packages by city for the period 2009–2012, expressed in constant 2012 values.
TaBLe 2.7 Cost of T YPE A service packages by city 2009–2012 (constant 2012 R)
2009 2010 2011 2012 change %
ccT 456 484 551 590 29%
eTH 611 593 580 605 –1%
JHB 670 602 598 631 –6%
eKU 589 544 742 695 18%
Man 696 659 754 866 24%
nMB 834
TsH 864 946 1,035 1,118 29%
MsU 822 961 1,041 885 8%
BcM 791 882 1,105 1,174 48%
TYPE A
0
200
–200
400
600
800
1000
1200
CCT ETH JHB EKU MAN NMB TSH MSU BCM
0%
10%
20%
30%
40%
50%
60%2009 2010 2011 2012 % change
JHB
Over this period, Buffalo City increased the cost of its T YPE A service package by the most (48%), while Tshwane, Cape Town, Mangaung and Ekurhuleni increased by between 29% and 18%. In contrast, Johannesburg reduced the cost of its T YPE A service package by 6% in real terms, followed by eThekwini with a 1% reduction, whereas Msunduzi increased its T YPE A charges by only 8%.

54
Cost of T YPE B service package 2009–2012
Table 2.8 shows the cost of T YPE B service packages by city for 2009–2012, expressed in constant 2012 values.
TaBLe 2.8 Cost of T YPE B service packages by city 2009–2012 (constant 2012 R)
2009 2010 2011 2012 % change
eTH 934 906 880 908 –3%
eKU 818 757 975 980 20%
JHB 1,299 1,011 1,006 1,060 –18%
ccT 958 1,011 1,079 1,111 16%
Man 996 965 1,101 1,218 22%
nMB 1,149
TsH 1,140 1,251 1,360 1,463 28%
BcM 1,023 1,138 1,385 1,496 46%
MsU 1,110 1,323 1,428 1,545 39%
TYPE B
0
200
–200
400
–400
600
–600
–800
800
1000
1200
1400
1600
1800
2000
0%
10%
–10%
–20%
20%
30%
40%
50%2009 2010 2011 2012 % change
ETH EKU CCT MAN NMB TSH BCM MSUJHB
Buffalo City again showed the most dramatic increase in the cost of its T YPE B service package (46%), closely followed by Msunduzi (39%), while Tshwane, Mangaung, Cape Town, and Ekurhuleni increased by between 28% and 16%. Johannesburg and eThekwini again had a different approach, reducing the real costs of their T YPE B service package by 18% and 3% in real terms.

STA
TE
OF
CIT
Y F
INA
NC
ES
20
13
55
cH
AP
Te
R 2
Cost of T YPE C service package 2009–2012
Table 2.9 shows the cost of T YPE C service packages by city for 2009–2012, expressed in constant 2012 values.
TaBLe 2.9 Cost of T YPE C service packages by city 2009–2012 (constant 2012 R)
2009 2010 2011 2012 % change
eTH 1,232 1,479 1,528 1,565 27%
nMB 1,757
Man 1,490 1,773 1,774 1,905 28%
ccT 1,557 1,667 1,795 1,882 21%
eKU 1,349 1,372 1,910 1,676 24%
JHB 1,488 1,752 1,941 2,016 35%
TsH 1,680 1,847 2,033 2,176 30%
BcM 1,588 1,771 2,164 2,273 43%
MsU 1,954 2,095 2,292 2,472 26%
TYPE C
JHBCCTETH TSHEKUNMB MAN BCM MSU0
250
500
750
1000
1250
1500
1750
2000
2250
2500
0
5%
10%
15%
20%
25%
30%
35%
40%
45%
50%2009 2010 2011 2012 % change
Again Buffalo City increased its T YPE C charges by the most (43%), and all other cities charged between 21% (Cape Town) and 35% (Johannesburg) more in 2012 than in 2009. Unlike their approach to T YPE A and T YPE B service packages, Johannesburg and eThekwini join the other city governments in substantially increasing their charges for T YPE C service packages.
STA
TE
OF
CIT
Y F
INA
NC
ES
20
13

56
Cost of T YPE D service package 2009–2012
Table 2.10 shows the cost of T YPE D service packages by city for 2009–2012, expressed in constant 2012 values.
TaBLe 2.10 Cost of T YPE D service packages by city 2009–2012 (constant 2012 R)
2009 2010 2011 2012 % change
nMB 2,990
JHB 2,340 2,775 3,068 3,224 38%
eTH 2,527 3,028 3,110 3,182 26%
Man 2,545 3,412 3,286 3,453 36%
ccT 2,650 3,006 3,332 3,577 35%
MsU 2,757 3,098 3,381 3,625 31%
eKU 2,539 2,560 3,498 3,832 51%
TsH 2,839 3,129 3,524 3,755 32%
BcM 2,563 2,878 3,553 3,723 45%
TYPE D
0250500750
100012501500175020002250250027503000325035003750400042504500475050005250
0%3%5%8%10%13%15%18%20%23%25%28%30%33%35%38%40%43%45%48%50%53%
JHB CCTETH TSHEKUNMB MAN BCMMSU
2009 2010 2011 2012 % change
Between 2009 and 2012, Ekurhuleni imposed the most substantial cost increase (51%) for service package T YPE D, followed by Buffalo City with the second highest increase (45%). At the other end of the scale, eThekwini increased its T YPE D charges by 26%. The other city governments increased their charges by between 30% and 40%.
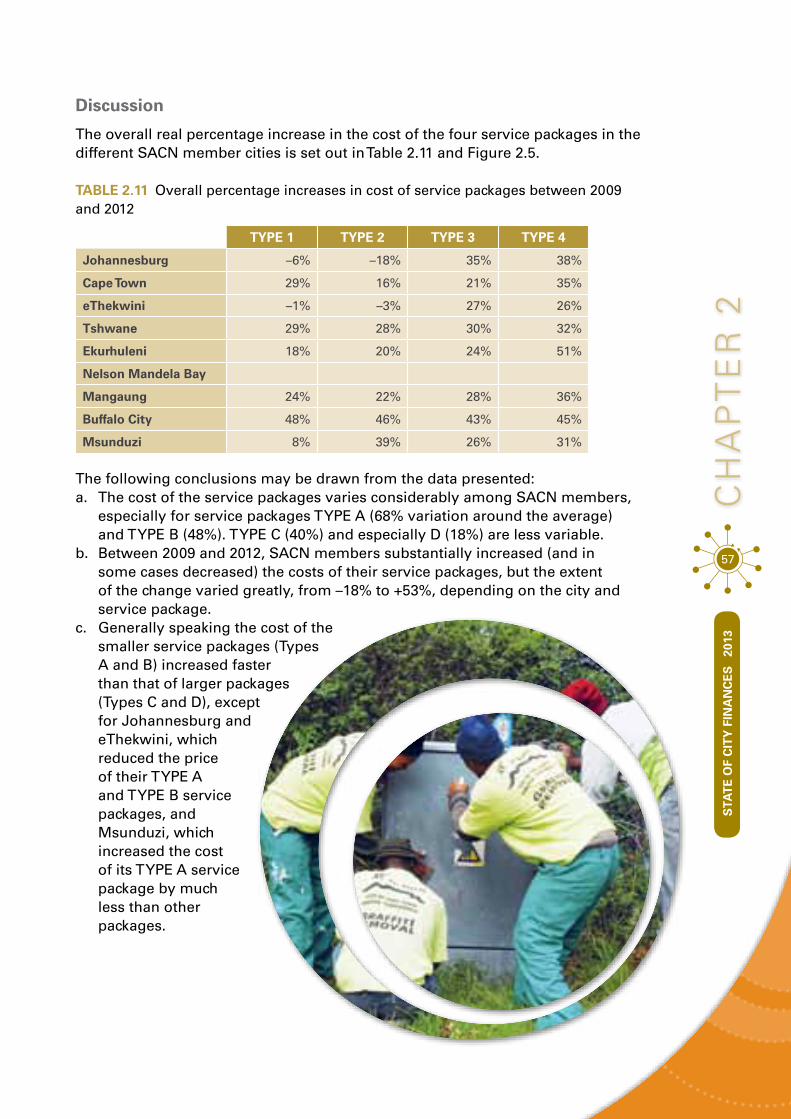
57
cH
AP
Te
R 2
STA
TE
OF
CIT
Y F
INA
NC
ES
20
13
Discussion
The overall real percentage increase in the cost of the four service packages in the different SACN member cities is set out in Table 2.11 and Figure 2.5.
TaBLe 2.11 Overall percentage increases in cost of service packages between 2009 and 2012
TYPe 1 TYPe 2 TYPe 3 TYPe 4
Johannesburg –6% –18% 35% 38%
cape Town 29% 16% 21% 35%
eThekwini –1% –3% 27% 26%
Tshwane 29% 28% 30% 32%
ekurhuleni 18% 20% 24% 51%
nelson Mandela Bay
Mangaung 24% 22% 28% 36%
Buffalo city 48% 46% 43% 45%
Msunduzi 8% 39% 26% 31%
The following conclusions may be drawn from the data presented:a. The cost of the service packages varies considerably among SACN members,
especially for service packages T YPE A (68% variation around the average) and T YPE B (48%). T YPE C (40%) and especially D (18%) are less variable.
b. Between 2009 and 2012, SACN members substantially increased (and in some cases decreased) the costs of their service packages, but the extent of the change varied greatly, from –18% to +53%, depending on the city and service package.
c. Generally speaking the cost of the smaller service packages (Types A and B) increased faster than that of larger packages (Types C and D), except for Johannesburg and eThekwini, which reduced the price of their T YPE A and T YPE B service packages, and Msunduzi, which increased the cost of its T YPE A service package by much less than other packages.

58
FiGURe 2.5 Overall percentage increases in real cost of service packages between 2009 and 2012 (%)
–20–15–10
–505
10152025303540455055
TYPE A TYPE B TYPE C TYPE D
BCMTSH EKU MSUCCT MANETHJHB NMBJHB
a. Buffalo City is the most expensive city for T YPES A and D, and second most expensive for T YPE C and D. It has also seen the most rapid increases in charges for T YPES A to C and the second most rapid increase for T YPE D.
b. Cape Town has the lowest-cost T YPE A service package, and Nelson Mandela Bay is cheapest for T YPE D; eThekwini is the second cheapest city for T YPE A and the cheapest city for T YPES B and C.
The variety in the charges for the different service packages and their trends over the last few years presumably reflect a number of different factors. City governments face different cost structures, and they have made their own specific organisational and financial arrangements – including various cross- subsidy arrangements – to cover these costs. They have also developed and amended their own approaches to providing and financing FBS and other anti-poverty measures. In addition, they faced different financial circumstances in the period under review, with some cities recovering from acute financial stress and others managing to maintain greater stability. Property taxes and service charges imposed by SACN members can therefore be expected to have followed different historical trajectories.

STA
TE
OF
CIT
Y F
INA
NC
ES
20
13
59
cH
AP
Te
R 2
AFFordAbility oF municipAl service chArgesThe affordability of municipal service charges depends in part upon the charges themselves (set out earlier) and in part upon household incomes. Household incomes are affected by trends in circumstances, economic growth and development, employment, government social grant policy and other factors.
A city’s economic growth differs from the national trend, depending on the city’s economy and local circumstances. Over the last several years, South African city economies have grown, albeit with a substantial setback in 2008 and 2009, followed by the recovery in 2010 that faltered somewhat in 2011. As Figure 2.6 shows, Nelson Mandela Bay was clearly the SACN member city most seriously affected by the economic downturn.
FiGURe 2.6 City GVA 2006–2012 (constant 2012 R billion) and annual % increase
0
50
100
150
200
250
300
350
400
BCMTSH EKU MSUCCT MANETHJHB NMB
2006 2007 2008 2009 2010 2011
BCM
MAN
EKU
TSH
ETH
NMB
JHB
CCT
–6%
–4%
–2%
0%
2%
4%
6%
8%
MSU
20112010200920082007
STA
TE
OF
CIT
Y F
INA
NC
ES
20
13

60
Cost of service packages compared to benchmark household incomes
To assess changes in the affordability of city services, the cost of service packages T YPES A to D charged by each SACN member are compared with the benchmark household incomes for each type. Table 2.12 sets out the cost of the service packages per city as a percentage of the benchmark household incomes for 2009 and 2012.
TaBLe 2.12 Cost of service packages as % of benchmark household incomes
Year 2009 2012
service package TYPe a
TYPe B
TYPe c
TYPe D
TYPe a
TYPe B
TYPe c
TYPe D
Benchmark household
income (R per
month)
2012 values
6,000 12,000 24,000 48,000 6,000 12,000 24,000 48,000
2009 values
5,198 10,397 20,794 41,587 6,000 12,000 24,000 48,000
Johannesburg 11.2% 10.8% 6.2% 4.9% 10.5% 8.8% 8.4% 6.7%
Cape Town 7.6% 8.0% 6.5% 5.5% 9.8% 9.3% 7.8% 7.5%
eThekwini 10.2% 7.8% 5.1% 5.3% 10.1% 7.6% 6.5% 6.6%
Tshwane 14.4% 9.5% 7.0% 5.9% 18.6% 12.2% 9.1% 7.8%
Ekurhuleni 9.8% 6.8% 5.6% 5.3% 11.6% 8.2% 7.0% 8.0%
Nelson Mandela Bay (NB 2011 only)
13.2% 9.1% 6.9% 5.9%
Mangaung 11.6% 8.3% 6.2% 5.3% 14.4% 10.2% 7.9% 7.2%
Buffalo City 13.2% 8.5% 6.6% 5.3% 19.6% 12.5% 9.5% 7.8%
Msunduzi 13.7% 9.2% 8.1% 5.7% 14.7% 12.9% 10.3% 7.6%
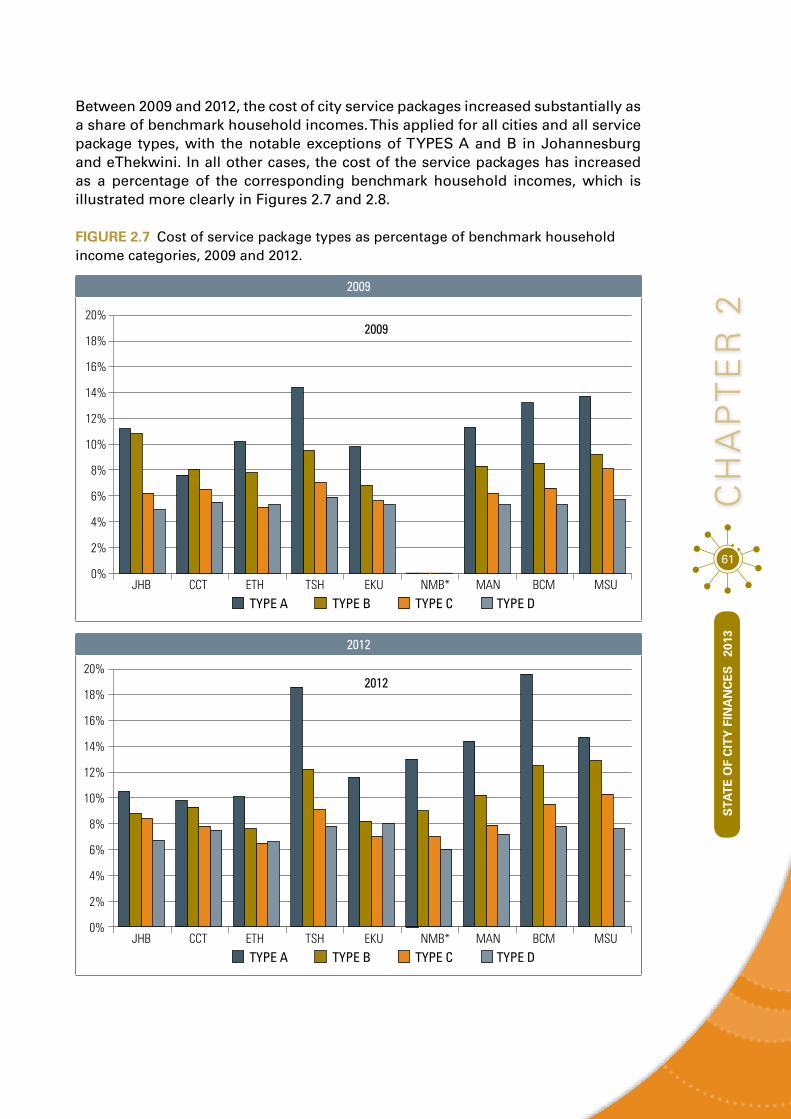
61
cH
AP
Te
R 2
STA
TE
OF
CIT
Y F
INA
NC
ES
20
13
Between 2009 and 2012, the cost of city service packages increased substantially as a share of benchmark household incomes. This applied for all cities and all service package types, with the notable exceptions of T YPES A and B in Johannesburg and eThekwini. In all other cases, the cost of the service packages has increased as a percentage of the corresponding benchmark household incomes, which is illustrated more clearly in Figures 2.7 and 2.8.
FiGURe 2.7 Cost of service package types as percentage of benchmark household income categories, 2009 and 2012.
2009
0%JHB CCT ETH TSH EKU
2009
NMB* MAN BCM MSU
2%
4%
6%
8%
10%
12%
14%
16%
18%
20%
TYPE DTYPE CTYPE BTYPE A
2012
0%JHB CCT ETH TSH EKU
2012
NMB* MAN BCM MSU
2%
4%
6%
8%
10%
12%
14%
16%
18%
20%
TYPE DTYPE CTYPE BTYPE A

62
FiGURe 2.8 Cost of service package types as fraction of benchmark household incomes (%)
JOHANNESBURG CAPE TOWN ETHEKWINI
0%2%4%6%8%
10%12%14%16%18%20%
2009 2012
TYPE A TYPE B TYPE C TYPE D0%
TYPE A TYPE B TYPE C TYPE D
2%4%6%8%
10%12%14%16%18%20%
2009 2012
0%TYPE A TYPE B TYPE C TYPE D
2%4%6%8%
10%12%14%16%18%20%
2009 2012
TSHWANE EKURHULENI NELSON MANDELA BAY
0%TYPE A TYPE B TYPE C TYPE D
2%4%6%8%
10%12%14%16%18%20%
2009 2012
0% TYPE A TYPE B TYPE C TYPE D
2%4%6%8%
10%12%14%16%18%20%
2009 2012
0%TYPE A TYPE B TYPE C TYPE D
2%4%6%8%
10%12%14%16%18%20%
2009 2012
MANGAUNG BUFFALO CITY MSUNDUZI
0%TYPE A TYPE B TYPE C TYPE D
2%4%6%8%
10%12%14%16%18%20%
2009 2012
0%TYPE A TYPE B TYPE C TYPE D
2%4%6%8%
10%12%14%16%18%20%
2009 2012
0%TYPE A TYPE B TYPE C TYPE D
2%4%6%8%
10%12%14%16%18%20%
2009 2012
Notable features of the results include:a. As a fraction of their benchmark household incomes, T YPES A and B service
packages cost more than T YPES C and D, and between 2009 and 2012 increased by the most. In other words, those households that use the highest fractions of their incomes on city services were also forced to devote the most substantial extra portions of their incomes to paying for municipal services. This pattern, which is clearly evident in Figure 2.9, applied to all city governments except Johannesburg and eThekwini, which reduced the share of benchmark household incomes required to pay for T YPE A and T YPE B service packages, and Msunduzi, which increased its charges for T YPE A much less (as a fraction of the benchmark household incomes) than for other types.

STA
TE
OF
CIT
Y F
INA
NC
ES
20
13
63
cH
AP
Te
R 2
b. The cost of T YPE A service packages increased the most (as a fraction of benchmark household incomes ) in Buffalo City (over 6%) and Tshwane (over 4%), where the cost is now almost 20% of benchmark household incomes. It seems clear that municipal service charges have become substantially unaffordable for these households.
c. The cost of T YPE B service packages increased the most (as a fraction of benchmark household incomes) in Buffalo City (4%), Msunduzi (almost 4%) and Tshwane (almost 3%), where the cost is now around 12% of benchmark household incomes. In other cities a T YPE B service package generally costs less than 10% of benchmark household incomes. Yet household affordability issues are also likely to be emerging in this category.
d. The cost of T YPE C service packages also increased the most (as a fraction of benchmark household incomes) in Buffalo City (just under 2.9%), followed by Johannesburg, Tshwane, and Msunduzi (around 2.2%). eThekwini had the lowest increases as a share of benchmark household incomes (1.4%).
e. In the case of T YPE D service packages, Ekurhuleni increased its charges (as a fraction of benchmark household incomes) by the most (2.7%), followed by Buffalo City at 2.2%. eThekwini had the lowest increase (1.4%).
FiGURe 2.9 Change in cost of service packages as share of benchmark household incomes (%)
–3%
–2%
–1%
0%
1%
2%
3%
4%
5%
6%
7%
BCMTSH EKU MSUCCT MANETHJHB NMB
TYPE A TYPE B TYPE C TYPE D
STA
TE
OF
CIT
Y F
INA
NC
ES
20
13
64
Between 2009 and 2012, the number of households in SACN member cities grew by approximately 4%. This gives a rough indication of the increased demand for services by households and does not take into consideration demand by businesses over the period. City government expenditure increases could reasonably be expected to be of a similar order. However, SACN members increased their expenditure by much more than this, and spending on personnel and other categories of operating expenditure also increased substantially in real terms (not just bulk supply costs) as seen in Chapter 1.
To pay for this rapid increase in operating expenditures, city governments have especially relied on increased tariffs, although they have been able to draw upon increased operating grants. Rates and taxes have accordingly increased substantially, especially for larger service packages: •• A household in Tshwane that is using 500 kWh of electricity and 25kl of water
per month, and paying rates on a property of R250,000 is paying 28% more to the municipality in 2012 than in 2009.
•• A household in Johannesburg that is using 800 kWh of electricity and 30kl of water per month, and paying rates on a property valued at R500,000 is paying 35% more to the municipality in 2012 than in 2009.
•• A household in Ekurhuleni that is using 1 500 kWh of electricity and 40kl of water per month, and paying rates on a R1 million property, is paying 51% more to the municipality in 2012 than in 2009.
conclUsIons
65
co
nc
lU
sIo
ns
STA
TE
OF
CIT
Y F
INA
NC
ES
20
13
These increases are onerous, given that average household incomes grew by only around 15% between 2009 and 2012. In 2009 poorer households in formal housing were spending 10–14% of their household incomes on their municipal account; today they are spending 11–19%, for the same package of services. Higher-income households, which in 2009 were spending 6–7% of household incomes on municipal services, are now spending 8–9% for the same service package.
This increasing unaffordability of city services, especially at the lower end of the consumption profile threatens city financial sustainability in a number of ways. Indeed many of these trends are already visible from Chapter 1. a. Household collection rates can be expected to remain under pressure, and
indeed to decline further, unless city governments make extra efforts to collect uncollected revenues and save on areas of waste and inefficiency.
b. Willingness to pay is likely to weaken, as tax morality is hard to sustain when essential services are unaffordable.
c. Gross debtors can be expected to increase even more rapidly, and pressure on city cash flows is likely to increase.
d. Funding other city services by marking-up water and electricity costs may become harder.
e. City governments that are financially weaker, as a result of charging unaffordable taxes and tariffs, will be a weaker platform on which to graft substantial new spending responsibilities, especially public transport and housing.
Therefore, city governments must seek ways of containing the increases in their service charges. In the short term, cities will be under pressure to absorb (i.e. not fully pass on) increases in electricity supply costs, but this could prove dangerous. Without improved city operational effectiveness, anything less than passing on the full bulk supply cost increases will also increase financial pressure on the municipality.
City governments cannot do much about the bulk service charges that they face currently and in the future. However, they can (and should) endeavour to contain their other costs, notably personnel costs, and to increase the service delivery output from personnel and other resources used. Cost increases that are higher than warranted by increases in bulk supply costs should certainly be discouraged, in the interest of city consumers and city government sustainability.
In due course, if a city government is charging more than what its residents can afford to pay, a more fundamental review of its service delivery models and performance is likely to be required.
66
dAtA sourcesa. Taxes and service charges: Tariff tables of the various financial years accessed
through individual city websites (the characteristics of the standard packages of services are summarised in Table 2.1). Tariffs and charges were collected on the following standard assumptions and basis:i. These are residential tariffs to formal settlements.ii. They are the charges for taxes and for services consumed and therefore
do not take household type into consideration, such as pensioners, child-headed and indigent households, except where this is built into the service charges themselves. They also do not take account of any additional rebates based on income levels of pensioners.
iii. Water consumption: for direct metered connections to the Council’s water reticulation system, with no flow restriction or water consumption management meter.
iv. Waste: for a 240 litre bin removed once a week.v. Electricity: for residential customers with single-phase 230 V or multi-phase
400/230 V connections with a capacity of up to 80 A per phase. T YPES A and B are assumed to have pre-payment meters, while T YPES C and D are assumed to have conventional credit arrangements.
b. Data on GDP and current income per city: Quantec (supplied by i@a consulting).
c. Data on income distribution per city: calculated from Census 2011 data (supplied by i@a consulting).
A. TOTAL COST OF PACKAGES OF SERVICES BY CITY, 2009 and 2012 (2012 R values)
JOHannesBURG caPe TOWn eTHeKWini
a B c D a B c D a B c D
2009 670 1,299 1,488 2,340 456 958 1,557 2,650 611 934 1,232 2,527
2012 631 1,060 2,016 3,224 590 1,111 1,882 3,577 605 908 1,565 3,182
% increase
–6% –18% 35% 38% 29% 16% 21% 35% –1% –3% 27% 26%
TsHWane eKURHULeni neLsOn ManDeLa BaY
a B c D a B c D a B c D
2009 864 1,140 1,680 2,839 589 818 1,349 2,539 (2011 only)
2012 1,118 1,463 2,176 3,755 695 980 1,676 3,832 834 1,149 1,757 2,990
% increase
29% 28% 30% 32% 18% 20% 24% 51% (n/a)
ManGaUnG BUFFaLO ciTY MsUnDUZi
a B c D a B c D a B c D
2009 696 996 1,490 2,545 791 1,023 1,588 2,563 822 1,110 1,954 2,757
2012 866 1,218 1,905 3,453 1,174 1,496 2,273 3,723 885 1,545 2,472 3,625
% increase
24% 22% 28% 36% 48% 46% 43% 45% 8% 39% 26% 31%
Source: City websites (2012), adjusted for inflation by the authors.
AnnexURe 2A

67
An
ne
xU
Re
2A
STA
TE
OF
CIT
Y F
INA
NC
ES
20
13
B. DETAILED COMPOSITION OF SERVICE CHARGES BY CITY & SERVICE PACKAGE TYPE, 2011 (2012 R VALUES)
TYPe a JHB ccT eTH TsH eKU nMB Man BcM MsU
Property tax – – – 33 49 47 36 21 –
electricity 297 264 375 406 298 365 333 474 349
Water 114 107 75 244 126 132 176 180 348
sanitation 86 87 33 86 72 94 87 47 102
Refuse – – – 48 79 62 – 175 66
Other – – – 48 – – – 25 –
VaT 70 64 68 116 80 91 83 126 121
Total 567 523 550 981 704 791 715 1,048 987
TYPe B JHB ccT eTH TsH eKU nMB Man BcM MsU
Property tax 44 23 98 131 58 129 125 74 205
electricity 371 537 469 514 416 457 428 592 437
Water 181 175 109 301 177 207 231 248 403
sanitation 168 125 48 105 85 118 147 47 102
Refuse 78 40 21 48 83 62 – 175 66
Other – – – 48 – – – 25 –
VaT 112 123 90 142 106 118 113 152 141
Total 954 1,023 834 1,290 925 1,090 1,044 1,314 1,354
TYPe c JHB ccT eTH TsH eKU nMB Man BcM MsU
Property tax 153 140 287 295 201 266 274 163 423
electricity 960 881 750 850 1,003 730 739 948 910
Water 249 244 155 365 228 295 286 316 458
sanitation 168 170 68 122 99 141 211 193 102
Refuse 104 76 46 48 83 62 – 175 66
Other – – – 48 – – – 25 –
VaT 207 192 143 201 198 172 173 232 215
Total 1,840 1,702 1,448 1,928 1,811 1,666 1,682 2,052 2,173
TYPe D JHB ccT eTH TsH eKU nMB Man BcM MsU
Property tax 372 374 665 622 489 541 572 340 859
electricity 1,531 1,707 1,406 1,659 1,922 1,370 1,495 1,777 1,272
Water 390 412 358 502 353 393 400 487 619
sanitation 168 248 157 128 123 188 337 193 102
Refuse 137 76 81 48 83 62 – 175 66
Other – – – 48 – – – 25 –
VaT 312 342 280 334 347 282 312 372 288
Total 2,909 3,160 2,948 3,341 3,317 2,835 3,116 3,369 3,206

68
C. PERCENTAGE COMPOSITION OF SERVICE CHARGES BY CITY & SERVICE PACKAGE TYPE, 2011
TYPe a JHB ccT eTH TsH eKU nMB Man BcM MsU
Property tax 0% 0% 0% 3% 7% 6% 5% 2% 0%
electricity 52% 51% 68% 41% 42% 46% 47% 45% 35%
Water 20% 20% 14% 25% 18% 17% 25% 17% 35%
sanitation 15% 17% 6% 9% 10% 12% 12% 4% 10%
Refuse 0% 0% 0% 5% 11% 8% 0% 17% 7%
Other 0% 0% 0% 5% 0% 0% 0% 2% 0%
VaT 12% 12% 12% 12% 11% 12% 12% 12% 12%
Total 100% 100% 100% 100% 100% 100% 100% 100% 100%
TYPe B JHB ccT eTH TsH eKU nMB Man BcM MsU
Property tax 5% 2% 12% 10% 6% 12% 12% 6% 15%
electricity 39% 53% 56% 40% 45% 42% 41% 45% 32%
Water 19% 17% 13% 23% 19% 19% 22% 19% 30%
sanitation 18% 12% 6% 8% 9% 11% 14% 4% 8%
Refuse 8% 4% 2% 4% 9% 6% 0% 13% 5%
Other 0% 0% 0% 4% 0% 0% 0% 2% 0%
VaT 12% 12% 11% 11% 12% 11% 11% 12% 10%
Total 100% 100% 100% 100% 100% 100% 100% 100% 100%
TYPe c JHB ccT eTH TsH eKU nMB Man BcM MsU
Property tax 8% 8% 20% 15% 11% 16% 16% 8% 19%
electricity 52% 52% 52% 44% 55% 44% 44% 46% 42%
Water 14% 14% 11% 19% 13% 18% 17% 15% 21%
sanitation 9% 10% 5% 6% 5% 8% 13% 9% 5%
Refuse 6% 4% 3% 2% 5% 4% 0% 9% 3%
Other 0% 0% 0% 2% 0% 0% 0% 1% 0%
VaT 11% 11% 10% 10% 11% 10% 10% 11% 10%
Total 100% 100% 100% 100% 100% 100% 100% 100% 100%
TYPe D JHB ccT eTH TsH eKU nMB Man BcM MsU
Property tax 13% 12% 23% 19% 15% 19% 18% 10% 27%
electricity 53% 54% 48% 50% 58% 48% 48% 53% 40%
Water 13% 13% 12% 15% 11% 14% 13% 14% 19%
sanitation 6% 8% 5% 4% 4% 7% 11% 6% 3%
Refuse 5% 2% 3% 1% 2% 2% 0% 5% 2%
Other 0% 0% 0% 1% 0% 0% 0% 1% 0%
VaT 11% 11% 10% 10% 10% 10% 10% 11% 9%
Total 100% 100% 100% 100% 100% 100% 100% 100% 100%
STA
TE
OF
CIT
Y F
INA
NC
ES
20
13
69
An
ne
xU
Re
2A
D. CITY GROSS VALUE ADDED (Constant 2012 R billion)
2006 2007 2008 2009 2010 2011
Johannesburg 225,187 246,558 251,655 245,795 262,393 281,272
cape Town 169,493 178,971 177,798 175,780 183,602 192,281
eThekwini 142,561 147,391 144,605 142,802 147,698 153,289
Tshwane 161,354 170,773 169,904 168,909 176,883 185,893
ekurhuleni 154,721 164,734 164,645 159,741 168,100 178,345
nelson Mandela Bay 43,744 44,497 43,086 42,385 43,514 44,547
Mangaung 32,613 34,129 33,904 33,663 34,845 35,641
Buffalo city 29,273 30,171 29,592 29,308 30,142 30,873
Msunduzi 22,642 22,932 22,273 22,152 22,592 23,006
sacn 981,587 1,040,156 1,037,462 1,020,534 1,069,768 1,125,148
Rest of sa 771,353 810,066 807,720 803,544 834,525 879,595
south africa 1,752,940 1,850,223 1,845,181 1,824,078 1,904,294 2,004,742
Source: Quantec (2012)
E. HOUSEHOLD INCOME DISTRIBUTION BY CITY, 2011(Number of households per annual income band)
JHB ccT eTH TsH eKU nMB Man BcM MsU
no income 240 335 146 517 163 756 135 639 180 712 51 302 26 408 38 023 26 358R1–R4,800 43 829 29 374 40 651 26 036 38 519 14 218 10 759 11 650 7 607R4,801–R9,600 62 814 42 418 58 936 37 911 53 729 19 777 15 785 15 660 11 186R9,601–R19,600 153 236 113 276 136 839 96 854 118 089 51 553 39 773 41 421 26 453R19,601–R38,200 240 770 170 824 161 380 140 975 171 568 55 845 46 813 38 047 27 076R38,201–R76,400 203 171 154 427 128 231 120 989 152 386 41 948 32 665 24 916 20 615R76,401–R153,800 151 045 139 348 102 163 107 237 109 570 34 604 23 928 19 986 16 810R153,801–R307,600 130 349 126 625 82 562 103 399 88 759 29 322 18 641 17 765 14 368R307,601–R614.400 110 125 92 860 54 290 84 577 64 448 18 127 11 654 11 058 9 323R614,001–R1,228,800 65 054 38 018 19 218 40 806 27 165 5 301 3 674 3 448 2 881R1,228,801–R2,457,600 23 054 9 749 5 517 11 132 6 797 1 350 982 918 747R2,457,601 or more 10 890 5 065 3 107 5 890 3 657 935 826 668 560Unspecified 183 73 62 90 65 8 13 8 9Total 1 434
8551 068
574956 712 911 535 1 015
464324 290
231 921
223 568
163 993
Source: Calculated from Census 2011 data (supplied by i@a consulting).
STA
TE
OF
CIT
Y F
INA
NC
ES
20
13
70

The NDP notes that progress has been
extremely slow in assigning the housing function,
despite the Constitution and relevant legislation
71
STA
TE
OF
CIT
Y F
INA
NC
ES
20
13
Assignment of the housing function
The National Development Plan (NDP) acknowledges that cities need more comprehensive control over the core built-environment functions to integrate housing8 and public transport in ways that can contribute positively to restructuring their built environment (NPC 2012: 434). The NDP notes that progress has been extremely slow in assigning the housing function, despite the Constitution and relevant legislation allowing the necessary shifts in power to be made. The slow pace is compounded by existing challenges in the sector, a lack of focus on the development of an effective system of national and provincial support and oversight (including changes in the institutional arrangements), and municipal administrative and financial capacity issues.
Various processes are underway to address policy and fiscal issues. In January 2010, the Cabinet Lekgotla (which is a regular executive planning session) adopted 12 Outcomes. Of relevance are Outcomes 8 and 9 that collectively focus on prioritising the upgrading of informal settlements,9 increasing rental housing, making strategic use of state-owned land for housing, addressing the challenges of the GAP housing market,10 and building effective institutional capacity to expand service delivery. Both these Outcomes refer to the accreditation and assignment of metros by 2014. In other processes, in late 2010 the national Department of Human Settlements (DHS) started a policy review, while in November 2011 the Financial and Fiscal Commission (FFC) began looking at the efficacy of housing finance.
The housing policy refocus and the adoption of Outcome 8 (The Presidency 2010) acknowledge the benefits to date and also the remaining challenges. Since 1994, when a new housing policy was launched, the DHS estimates that 3.2 million subsidised units have been completed/are in progress for poor families. The housing capital subsidy programme enabled home ownership, transferring title deeds to the beneficiaries. At the same time, access to basic services expanded – 97.7% of households have access to water, 82% have access to sanitation and 75.8% to electricity.
8 Housing refers to the function performed by government using public funding. The national department responsible for this function recently changed its name to Human Settlements, with provincial and local government departments doing likewise. However the NDP uses ‘human settlements’ in its broader meaning, to refer to settlement types covering the full spectrum of land uses and functions, including housing.
9 Also by Cabinet Resolution, 2011 that provides further focus within 45 municipalities.10 Refers to people who earn too much to qualify for a government housing subsidy (>R3,500 pm) and too little to
qualify for a bank loan. The top threshold for this market varies depending on different views and interpretations.
cHAPTeR 3
72
The challenges are extensively outlined in the NDP (NPC 2012: 268–273) and in the Housing Finance Options Analysis produced by the FFC (FFC 2012b: 3–4). Some of the challenges identified in the FFC document include: •• Increasing housing backlogs because of housing delivery falling short of
targets and the failure to transfer title deeds.•• Fiscal sustainability of the supply-side, state-driven approach of housing
provision.•• Dysfunctions in rental market and a lack of understanding of the demand side
of housing.•• Distortions in the housing market caused by the current subsidy system.
The NDP elaborates further (NPC 2012: 270):
The housing issue is complex and needs to be addressed through a cumulative process of reform. There is tension between the need to address housing backlogs quickly and affordably, and the need to provide housing to create well-functioning, high-quality human settlements that will offer greater opportunities for income generation and human development. There is a need to find the correct balance between protecting property rights of vulnerable individuals, protecting state investment, allowing integration of state-provided housing into the property market to stimulate the secondary housing market and ensuring locational flexibility for housing beneficiaries. To achieve this, there is a need to debate the appropriate role for government and other actors in realising the constitutional right to housing and developmental goals. ... Large amounts of money have been spent on the housing sector but major problems remain.

73
cH
AP
Te
R 3
STA
TE
OF
CIT
Y F
INA
NC
ES
20
13
Cities manage a range of housing programmes, which vary according to the city, as a result of housing being a concurrent function of all levels of government. Housing is a concurrent function of national and provincial government in terms of Schedule 4, Part A of the Constitution (1996), with the Housing Act no. 107 of 1997 detailing the functions of provincial and local government in relation to housing provision. In effect, while municipalities have a clear mandate to ensure the access of communities to adequate housing and services, the specific function of executing national and provincial housing programmes lies with provincial government.
This chapter focuses on the assignment of the housing function, whether it will constrain or improve efficiency in housing delivery and general city performance, and the impact it may have on the sustainability of municipal finance.
AccreditAtion And AssignmentThe rationale for assignment can be found in Section 156(4) of the Constitution (Act 108 of 1996), which stipulates that schedule 4A and 5A matters (which include housing) must be assigned to a municipality, by agreement, provided the municipality has the capacity. The Housing Act of 1997 provides for the process through which a municipality can become accredited to administer national housing programmes. In the last two to three years accreditation has gained momentum, with the establishment of the Accreditation Panel to manage and oversee the process. The national DHS defines accreditation (DHS 2006):
Accreditation of a municipality involves the delegation and, subsequently, assignment of certain clearly defined functions in respect of the administration of national housing programmes. This does not detract from any housing powers and functions a municipality may already have, as set out in Part 4, Section 9 of the Housing Act, and also does not include the power to design housing programmes to be funded from the national subsidy funds. Accreditation seeks to achieve 2 inter-related objectives: co-ordinated development (horizontal integration) and accelerated delivery (vertical integration). Accreditation is a process of progressive delegation towards ultimate assignment.
In November 2011, the national accreditation framework was revised and aligned to the constitutional and legislative framework for assignment. The roles and responsibilities of the three spheres of government change according to the level of accreditation achieved by a municipality.

74
TaBLe 3.1 The three levels of accreditation
Level One accredited municipalities
Level One accreditation is in addition to, not instead of, the municipality’s existing responsibilities in terms of the Housing Act. Therefore, the definition of local housing priorities and the management of all public stock remains a municipal function.
•• Can identify, plan for and allocate housing subsidy funds to local housing programmes and projects.
•• Have the authority and responsibility to respond to national housing policy directly.
•• Determine their housing plans (approved as part of the municipality’s Integrated Development Plan or IDP and taking into account comments by the provincial departments of human settlements), and identify specific programmes for the year.
•• Develop specific individual housing project plans for submission to the provincial DHS and implement approved plans.
Level Two accredited municipalities
The provincial DHS is obliged to allocate housing subsidy funding as prioritised and programmed by the municipality and continues to be responsible for the financial management of budgets.
•• Delegated to evaluate and approve all national and provincial DHS housing programmes.
•• Manage and administer all programmes, including cashflow projection and quality assurance.
•• Required to have the capacity to commission, produce and implement project feasibility assessments undertaken by professionals.
•• Required to have the capacity to administer the programmes including manage cashflow.
Level Three accredited municipalities (assignment)
•• Are assigned all Level One and Level Two functions.•• Have the additional assignment of responsibility
for financial administration, including subsidy payments and financial reporting and reconciliation.
•• Requires focused internal financial management and administrative capacity and financial systems that are compliant with national specifications.
Source: DHS, 2006. Accreditation Framework for Municipalities to Administer National Housing Programmes, Managing the incremental delegation of housing functions to local government. Available at http://www.dhs.gov.za/Content/Upcoming%20Events/Framework%20for%20Accreditation.pdf
In brief, accreditation is the power to administer national housing programmes, while assignment is the transfer of the function. Accreditation in itself does not transfer legal and financial accountability for functions from one sphere of government to another. Legally, accountability for functions can only be transferred from one sphere of government to another through assignment.
Accreditation is intended to produce coordinated development and accelerated delivery by assigning clearly defined functions in respect of the administration of national housing programmes, as illustrated in Table 3.2.

STA
TE
OF
CIT
Y F
INA
NC
ES
20
13
75
cH
AP
Te
R 3
TaBLe 3.2 Summary of accreditation of housing functions
Functions current Level 1 Level 2 Level 3
Policy and planning
Housing strategy (IDP) Municipality Municipality Municipality Municipality
Housing plan and budget (IDP) Municipality Municipality Municipality Municipality
Housing policies: procurement, allocation etc.
Municipality Municipality Municipality Municipality
Level 1: subsidy budget planning and allocation process and priority programme management/admin
Housing subsidy budget Provincial DHS
Municipality Municipality Municipality
Subsidy/fund allocations Provincial DHS
Municipality Municipality Municipality
Project identification Provincial DHS
Municipality Municipality Municipality
Priority programme management/admin
Provincial DHS
Municipality Municipality Municipality
Level 2: Full programme management/admin
Full project/programme approval
Provincial DHS
Provincial DHS
Municipality Municipality
Full contract administration Provincial DHS
Provincial DHS
Municipality Municipality
Full programme management Provincial DHS
Provincial DHS
Municipality Municipality
Subsidy registration Provincial DHS
Provincial DHS
Municipality Municipality
Subsidy registration (approval of special applications)
Provincial DHS
Provincial DHS
Provincial DHS
Provincial DHS
Full technical (construction) quality assurance
Provincial DHS
Provincial DHS
Municipality Municipality
Level 3: Financial administration
Subsidy disbursements Provincial DHS
Provincial DHS
Provincial DHS
Municipality
Financial reporting and reconciliation
Provincial DHS
Provincial DHS
Provincial DHS
Municipality
subsidy & property administration
Eligibility check Developer Developer Developer Developer
Subsidy applications Developer Developer Developer Developer
Allocation of subsidy/house Municipality Municipality Municipality Municipality
Transfer Deeds Office Deeds Office Deeds Office Deeds Office
Project management Developer Developer Developer Developer
Source: DHS, 2006. Accreditation Framework for Municipalities to Administer National Housing Programmes, Managing the incremental delegation of housing functions to local government. Available at http://www.dhs.gov.za/Content/Upcoming%20Events/Framework%20for%20Accreditation.pdf
STA
TE
OF
CIT
Y F
INA
NC
ES
20
13
76
Collectively and individually, accreditation and assignment will have a direct impact on the
governance/institutional arrangements and on the spending capacity and performance
of municipalities. At the time of writing, most metros had received Level 2
accreditation, and the Accreditation Panel was working towards the assignment of six metros: City of Cape Town, Nelson Mandela Bay Metro, eThekwini Metro, City of Johannesburg, Tshwane Metro and Ekurhuleni Metro, to take effect on 1 July 2013.
Accreditation and assignment processes do not cover the
assessment and redesign of housing finance instruments or programmes,
or how much money the national fiscus allocates to the function. Municipalities
that are assigned the housing function will still need to operate within the confines of
the Housing Act (1997) and national housing programmes and financing instruments, but they will then
have the discretion, responsibility and accountability to prioritise their own housing programmes to suit their local circumstances and needs.
Some sceptics believe that accreditation simply moves the current challenges within the sector from national and provincial government to municipalities without addressing the policy issues. However, the process of accreditation and assignment cannot address or resolve the current policy, fiscal and financial issues in the housing sector. As mentioned above, these issues will be addressed by other, parallel housing sector processes. Accreditation will result in higher levels of certainty in respect of financial allocations to municipalities – a great leap from the practice to date, where even the annual allocations were not gazetted or made known on time by provinces, thus hampering the municipalities’ ability to plan their capital investments effectively. Most officials in most cities are in favour of the move. They believe that accreditation provides clarity on responsibility and accountability, while offering the opportunity to be innovative and creative, to respond directly to local needs and to allow better coordinated development and more efficient delivery.

77
cH
AP
Te
R 3
STA
TE
OF
CIT
Y F
INA
NC
ES
20
13
BOx 3.1 Housing Finance Instruments available to municipalities
The Human settlements Development Grant (HsDG): the housing capital grant that can be used in approximately 40 different ways, depending on the chosen housing product or output. The Housing Code governs the use of the HSDG, giving details of the conditions of the use of the grant over and above the grant framework which is published as part of the annual Division of Revenue. The HSDG allocations are made from the national DHS to the provincial DHS from where they are transferred to cities and other municipalities. Accreditation and assignment have an impact on the certainty and flow of the HSDG allocations – accreditation requires the certainty of funding allocations to be made to cities to be gazetted and thus adhered to, while assignment means that the allocations will be made directly from the national department to cities.
The Urban settlements Development Grant (UsDG): introduced in 2011 to complement the HSDG-funded projects and other metro land and infrastructure development priorities. The USDG provides a direct transfer of funds to municipalities with fewer conditions than the HSDG, allowing for greater discretion by municipalities in the use of the grant, but holds them responsible for producing certain performances and outcomes for the built environment. The USDG allocations are direct from the national DHS to cities, while the HSDG allocations are made from the national DHS to provincial DHS before they are transferred to cities and other municipalities.
national Upgrading support Programme (nUsP): a national programme that supports municipal capacity to enable effective informal settlement upgrading. Although conceptualised prior to 2011, the NUSP only gained significant momentum from early 2012. It is designed to support the municipal implementation of the Upgrading of Informal Settlements Programme (UISP), one of the approximately 40 ways of using the HSDG, with the objective of eventually upgrading all well-located informal settlements in particular municipalities. Central to the NUSP approach is the issue of community empowerment, which includes community participation in planning and, most importantly, the issue of livelihoods through the provision of services that support human, social and economic development and networks. During 2012–2014, the cost of the NUSP is covered by a special allocation of funds rather than coming out of the UISP, thus ensuring that the maximum subsidy goes to implementation.

78
the eFFect oF AccreditAtion/Assignment on citiesSome individual city perspectives are provided to answer the question of whether housing accreditation and assignment will further constrain or improve city performance. These perspectives allow for comparison across cities and highlight innovative responses to the daunting challenge of supporting economic growth to enable job creation, and providing basic and other services while minimising the negative impacts on municipal financial sustainability. The city perspectives are based on personal interviews with city officials from the finance and human settlements departments11 and other key people involved during the accreditation and assignment process. Everyone was given an opportunity to ensure that their contributions were correctly understood and used in the chapter. All interviews are acknowledged at the end of this chapter.
City of Cape Town
The City of Cape Town is using the USDG and Level 2 Accreditation to gain greater efficiencies in its human settlements development. To date the City of Cape Town is the only metro that has benefited from certainty of funding for the medium term, with the Western Cape being the only province whose department has gazetted the HSDG allocation to the city (in 2011 and 2012) as required by Division of Revenue Act. However, for the City of Cape Town, the period of certainty of transfers should be five rather than three years, to enable a better response to planning for urbanisation and growth, which typically spans 10–20 years or more.
Currently, efficiencies have resulted in drastically quicker turnaround times for project approvals: six weeks at municipal level compared to seven to nine months at provincial level.
The private sector has also changed its approach, from responding to tenders to initiating development partnerships that have a substantial inclusionary housing component. This frees up municipal capacity to regulate effectively instead of being the developer of land and housing markets. The city is also able to play a more strategic role in targeting poverty alleviation and balancing investment that promotes economic growth; the city is currently initiating the formulation of their Built Environment Performance Plan (BEPP) 2030.
11 Interviews were conducted in eThekwini Metro, Msunduzi Municipality, Buffalo City Metro, City of Cape Town, City of Johannesburg, Tshwane Metro and Ekurhuleni Metro during August and September 2012.
STA
TE
OF
CIT
Y F
INA
NC
ES
20
13
79
cH
AP
Te
R 3
eThekwini
The eThekwini metro started imple menting projects before receiving funding allocations from the provincial government. Although this approach has meant carrying the cost of bridging finance, the city was able to have quicker, more affordable and responsive development, reach more households in dire poverty and hardship, and also provide interim services to all informal settlements. Following audit queries regarding contravention of the Municipal Finance Management Act (MFMA), the city stopped spending their own funds before receiving funding allocations from the province. The pace of delivery will most definitely benefit from having certainty of allocations initially from the provincial department and, after assignment of the housing function, direct allocations from the national department.
eThekwini’s Prioritisation Models enable the city to guide development, using exist-ing infrastructure capacity before developing new infrastructure, and encouraging housing development within Integrated Rapid Public Transport Network (IRPTN) buffers, while acknowledging that densities need to be considerably higher for making the IRPTN viable (PDG 2012). Having always had a programmatic approach to managing its informal settlements, the city is ahead of the NUSP timelines. The Interim Services Programme has been funded from city funds rather than the UISP and is now funded from the USDG due to the inflexible conditions imposed by the UISP.
STA
TE
OF
CIT
Y F
INA
NC
ES
20
13
80
City of Johannesburg
The City of Johannesburg sees the anticipated allocations of the USDG and HSDG as an important component of its 10-year Capital Investment Programme currently being formulated. However, similar to the City of Cape Town’s request, Johannesburg would like the funding to be extended from the current three years to at least five years (preferably 10 years), in order to enable better planning of financial resources.
The city’s review of the Metropolitan Spatial Development Framework (MSDF) acknowledges the need for further targeted development in marginal housing projects developed since 1994 and for ensuring (rather than just guiding) that all new housing projects are located in their ‘strategic land development areas’ along the major public transport routes. Although some may argue that court judgements have driven the city to find innovative and creative rental accommodation options for very low-income earners, the city has used its Expanded Social Package to come up with a creative institutional response rather than being restricted to existing housing solutions. Similarly, since 2006 the city has creatively and innovatively managed its informal settlements as a coordinated and integrated institutional response supporting livelihoods, which should be commended, although in recent years this has not received the attention required to be sustained.

81
cH
AP
Te
R 3
STA
TE
OF
CIT
Y F
INA
NC
ES
20
13
City of Tshwane
The City of Tshwane is working on regional and local spatial development frameworks to ensure that transport and housing projects are better integrated throughout the hierarchy of spatial plans. Projects such as the Rosslyn Motor Hub and the inner city are cited as examples of the commitment to developing housing projects that are located close to work spaces and integrated in the urban fabric by transport networks.
Ekurhuleni
For some time, Ekurhuleni metro has adopted a programmatic approach to managing its informal settlements. Like eThekwini, the city is ahead of NUSP timelines generally. Furthermore, Ekurhuleni has already identified informal settlements that are aligned to the MSDF and should be upgraded in-situ, as compared to those settlements that should be relocated or not receive substantial investment because of their inappropriate spatial location.
All municipalities interviewed agreed that funding certainty provides for better strategy development and planning. The cities would prefer longer periods of five or 10 years, but the certainty over the medium term is a good start.
Cities are focusing more on their internal processes to better integrate housing with other key functions such as public transport and the provision of community services and facilities. Most of the cities have some internal coordinating mechanisms, which could perform better if institutionalised and given greater attention by strategic management. Planning legislation and practice is also a focus area, in particular looking at how planners achieve integration of key functions, what approaches are used, and the extent to which these are supported and guided by legislation. At the moment, planning legislation is being reformed, with Parliament considering the Spatial Planning and Land Use Management Bill.
Accreditation and assignment brings a high degree of responsibility and ownership, a sense of being in the driving seat (relative to the provinces and nationally), as well as confidence that municipalities will be able to better coordinate development, accelerate delivery and directly respond to the complexity of local needs. Nevertheless, challenges remain for cities. The USDG makes explicit the link between the role that land and infrastructure play in contributing to job creation, basic services, as well as community services, making optimal use of existing infrastructure and guiding the development of new infrastructure and land release that can lead to spatial transformation. Metros have found value in formulating their BEPPs because they address the functional integration of residential development to transport.

82
the chAllenges oF AccreditAtion And Assignment
Cities have to grapple with the assignment of the land transport and housing functions, which need to be implemented in a manner that enhances service delivery, supports the growth of city economies and acts as a catalyst for the spatial transformation of the city. Supporting this is proposed land-use management and spatial planning legislation, which clarifies these functions as primarily the responsibility of local rather than provincial government. Many municipal departments, not just the relevant sector departments, will be affected. Therefore, the implication is that the performance and capacity of the city as a whole has to be considered. In particular, accreditation will place additional strain on weaker municipalities, notwithstanding the lack of capacity of some provincial DHS. The primary challenges are municipal capacity to perform and integrate these functions, within a context of rapidly increasing urbanisation.
… the implication is that the performance
and capacity of the city as a whole has to
be considered.
STA
TE
OF
CIT
Y F
INA
NC
ES
20
13
83
cH
AP
Te
R 3
The enthusiasm of municipalities for accreditation is driven more by the need for funding certainty and full administration and management of national housing programmes than how accreditation can contribute to more integrated planning and land-use management. Given the circumstances and slow pace of assignment and housing sector reform, such a view is perhaps warranted, but the focus is likely to change to integrated planning and land-use management in the short term.
As cities start to deal with the integration of the housing and public transport functions, an ongoing challenge is the level of functional integration between the sectors and the choice of which sector(s) leads development. Neither the Housing Code nor the HSDG framework has clear objectives or indicators to ensure that approved housing projects are integrated to other municipal programmes and projects within the priority developments identified by the MSDFs and IDPs. The NDP proposes that the development of effective and affordable public transport be used as the guiding factor to integrate urban spaces and people (NPC 2012: 183). The assumption is that cities have good IRPTNs that will connect space and development, which is not currently the case in all cities (even where bus rapid transport networks have been implemented). The implication is that, unless new housing development is integrated more effectively to public transport, municipal housing development plans (MHDPs) are unlikely to contribute substantially to more efficient cities and spatial transformation. In particular, public transport networks will need to service adequately existing housing developments located on the periphery in order to reduce the cost of mobility for people living in these areas to access jobs and services. Yet, to date, MHDPs have paid very little attention to how urban land and housing markets operate to include or exclude the poor and vulnerable, what needs to be done to manage and regulate these markets, and what impact government intervention in this market will have on the sustainability of municipal finance.
An area of concern for all cities is the persistent under-spending of capital budgets, which is believed to be linked to problems with planning and project management as well as administrative and technical capacity (FFC 2012a). Cities need to be able to manage their annual capital expenditure with minimal roll-overs. In 2006/07, conditional grant expenditure levels were at 91.9%, rising to 97.8% in 2007/08 and 97.6% in 2009/10; these figures have factored in roll-overs, meaning that not all the spending took place in the relevant financial year (National Treasury 2011).
STA
TE
OF
CIT
Y F
INA
NC
ES
20
13

84
Furthermore the finalisation of spatial planning and land-use management legislation would also provide greater guidance to planners. Over the last 18 years, municipal planning has tackled integrating local needs and priorities to sectoral programmes and priorities driven from the national and provincial spheres (matching grant funding to local needs especially to eradicate services backlogs), while simultaneously trying to integrate various sectors at the local government level (housing, transport, water and sanitation, electricity, etc.) and democratise the planning process. The formulation of MHDPs and their incorporation into the IDPs have always been a municipal function, but now the focus will be more on how housing is integrated to other key built environment functions, such as public transport, and the impact on the city’s urban form.
Cities have raised the concern of the adequacy and appropriateness of the capacity development grant. The City of Cape Town, eThekwini and Ekurhuleni point out that the short-term nature of the capacity development grant limits the nature of staff appointments. The grant only provides for contract appointments of approximately three years, making it difficult to attract high-level planning and project management skills, which are required for longer periods, given the nature of the activities. Furthermore, if the assignment of the function affects more than just the sector department at municipal level, national and provincial government may need to reassess the design of the grant.
Inter-governmental relations and institutional arrangements are another challenge when functions are assigned to cities. While the approval of the MHDPs has always been a local government function, provincial human settlements departments approve funding allocations to municipalities based on the Housing Code and the HSDG framework. However, neither the Housing Code nor the HSDG framework has clear objectives or indicators to ensure that approved housing projects are integrated to other municipal programmes and projects within the priority developments identified by the MSDFs and IDPs. Tensions between provincial and local priorities can influence provincial allocations to cities, sometimes with the unintended consequence of negatively affecting some local priorities.
85
cH
AP
Te
R 3
STA
TE
OF
CIT
Y F
INA
NC
ES
20
13
The assignment of functions implies not only changes at city level but also at national and provincial level. A decentralised authority requires not only effective systems of support and oversight from national and provincial government, but also effective, direct engagement between the national transferring authority and the receiving authority (the city) for planning and decision making. National departments have been used to dealing with cities via their provincial departments but now have to deal with cities directly. What will be required is a change in the mindset of the officials and politicians and of institutional mechanisms such as MinMEC.12
The shift will be from focusing on the MHDPs to looking broadly at the full range of cities’ statutory plans to assess the level of integration of housing with other key sectors. The point is best summed up by the following extract from the NDP: (NPC 2012: 436)
National government needs to shift towards developing a more enabling framework that focuses on developing the systems to strengthen local government. This could include operational guidelines for routine tasks and staffing frameworks for different municipal functions, so that municipalities can tailor their capacity-building strategy and staffing budget to their core functions. Such guidelines could also provide an accountability mechanism, making it easier to identify where resources are being misallocated or processes mismanaged. This should be accompanied by strengthened national and provincial support and oversight for local government. Only by engaging intensively with local government can national and provincial departments develop an in-depth understanding of the challenges. National and provincial departments have a constitutional right to intervene, and they should be prepared to utilise this when necessary. However, they are less likely to need to do so and more likely to intervene effectively if they are already engaged in working with the municipality to improve performance. Municipalities also need to strengthen their commitment to improving efficiency and effectiveness, avoiding wasting funds on non-priority expenditure and collecting all the revenues that are due.
Even though the NDP recognises the need for an enabling framework, no national urbanisation and/or urban development policy exists. Cities have started to formulate longer-term visions that include public transport and housing functions as well as the traditional basic service delivery functions. The City of Cape Town, Ekurhuleni, and eThekwini have mechanisms and processes for sectoral coordination and integrated planning. These are internal mechanisms that bring the officials from the relevant departments and functions together to plan and coordinate development. However, while it would not have a direct impact on the assignment of housing or public transport functions, a national policy is needed to provide planning guidance and direction to cities that are facing the challenges of rapid urbanisation. As increasing numbers of people (especially poorer people) flock to urban areas, cities will have to manage increasing uncertainty and complexity in the future. Strategic national and provincial interventions, such as the urgent policy reform within the housing and transport sectors, could assist cities to enhance their performance (Palmer 2011, Palmer and Tshangana 2011, PDG 2012).
12 Human Settlements Minister and MECs
86
the impAct oF Assignment on FinAnciAl sustAinAbilityAccreditation and assignment can have a direct, positive impact on cities by providing certainty and flow of funding. With unambiguous control of both the public transport and housing functions, cities are able to better plan and integrate these functions, thereby accelerating delivery. Nevertheless, the assignment of the housing function to cities may also become a strain on the sustainability of municipal finance because of the risks associated with the transfer of assets and increased operational costs. Furthermore, if key housing policy and finance issues (see Box 3.1) are not urgently addressed and resolved, assignment may become meaningless and useless to metros.
The assignment process has raised the issue of the increased operational costs because of the need for greater coordination and integration of the various municipal departments required to support human settlements and transport. The current guidance from national to provinces is to allow accredited municipalities to use 3%–5% of the HSDG for operational costs. However, it is critical that municipal capital and operational needs related to human settlements delivery are catered for in the short and long term. For example, metros cannot be expected to assume the operational costs of this function after 3–5 years. The assigning authority is bound by legislation (Section 10 of the Municipal Systems Act) to ensure that the receiving authority has sufficient capacity and support to perform the function. Therefore, the implications on the equitable share will need to be addressed because if the local government equitable share is increased (especially the institutional component), the provincial one will accordingly decrease. Whether this should be addressed by the assignment process or the review of the local government fiscal framework (LGFF) is debateable.

STA
TE
OF
CIT
Y F
INA
NC
ES
20
13
87
cH
AP
Te
R 3
When assets are transferred from the provincial to local sphere, the staffing capacity must be sufficient to maintain and operate these assets (generally existing or projects-in-progress built-environment infrastructure). The challenge is that maintaining and operating such infrastructure requires long-term professional staff, whereas the capacity development grant linked to assignment is only for three years. Thus, the onus is on the municipality to realise revenue streams from the infrastructure investment in a very short turnaround period, despite most of these investments directly benefiting indigent households or households that struggle to pay for rates and services. For example Ekurhuleni has raised the issue of having to take over (in terms of Sections 32, 33 and 36 of the Supply Chain Management Regulations) from the provincial department existing projects and assets that are likely to raise audit queries.
Tensions around the risks associated with asset transfer and increased operational costs have necessitated extra care in proceeding with the housing assignment process. For the first time, the formal assignment route is being followed, as prescribed by legislation. A financial and fiscal review is currently underway. Thus, assignment is providing added impetus for reforming the policy, fiscal and financial issues within the housing sector, and resolving the range of issues raised by the LGFF process.
STA
TE
OF
CIT
Y F
INA
NC
ES
20
13
88
BOx 3.2 How sustainable is the current housing programme
The accreditation and assignment process does not, and was never intended to address issues such as the fiscal gap or other financial issues that go to the heart of the financial sustainability of the housing programme as a whole. These issues all affect the financial sustainability of municipalities.
The structural fiscal gap13 is the difference between the capital subsidy and the actual cost of development. For example, the actual cost of an RDP house (land, services and top structure) is on average R140,000 in metros, while the maximum capital subsidy is approximately R60,000 (FFC 2011c). Therefore, the metro absorbs the difference of R80,000. Not included in this figure is further public investment in public spaces and community facilities required within the development. For instance, in-situ upgrading costs can cost up to R6,000 more than RDP development, excluding the operating cost for the management of the informal settlement prior to and during upgrading. Assignment simply deals with the transfer of the function, not with the funding gap, which is a matter for the housing policy reform and LGFF review processes
The current equitable share allocations are inadequate to cover both the provision of FBS and operating costs, given the nature of developing low-density housing in peripheral locations. Linked to the problem of FBS is indigent management, which involves more than correctly classifying households on the billing system. Assignment passes the full responsibility of providing basic services to the local sphere, suggesting that municipalities will need to adopt a more comprehensive approach. For example, ensuring that their cities have a range of shelter and accommodation options for households to choose, from the provision of interim services in well-managed settlements (where informality is not shunned), to space in informal settlements that will be upgraded in-situ, to rooms or flats to rent, and flats or houses to buy. Assignment gives cities full control over making developmental trade-offs necessary to get the most desired outcome for the built environment.
Maintaining informal settlements remains one of the biggest concerns facing cities. Outcome 8 shifts the focus of housing policy to informal settlements and to those large municipalities that accommodate most of the informal settlements in the country. Yet obtaining funding for upgrading and managing information settlements brings its own challenges. For instance, the Integrated Residential Development Grant regulations state that land and services components can only be funded if no other funding source exists. This means that the funding of these components stops when another funding source – the USDG – is introduced, and yet the USDG is supposed to provide additional funding to cities.
Whether or not the cities are assigned the housing function, they still need to improve their performance. Municipalities could and should grow their property values (and rates) over time for all residential properties, not just the high-value properties. Municipalities can improve their revenue performance in other ways, by increasing revenue-collection rates, managing credit control and debt management more intensively than they are currently doing, and looking for new sources of revenue (such as a local business tax). At the same time, municipalities will need to control costs and increase operational efficiencies. For example, the City of Johannesburg is aware of the need to manage employee productivity and to control the number of staff in order to keep expenditure on salaries at acceptable levels. Indeed, by putting greater pressures on the cities to improve the performance of their housing revenue, the assignment of the housing function to cities could have a positive impact on overall municipal financial sustainability.
13 Calculations for the structural fiscal gap are based on figures in the FFC Housing Finance Options Analysis (FFC 2011b)
STA
TE
OF
CIT
Y F
INA
NC
ES
20
13
conclUsIonFrom the cities’ perspective, accreditation and assignment provide certainty of funding over the medium term. Although the cities would like longer-term certainty, the accreditation process has contributed to enhancing their strategy development and planning. In particular, cities have had to focus more on their internal processes in order to better integrate housing to other key functions such as public transport and provision of community services and facilities. In some cases, drastically quicker turnaround times for project approvals have improved the pace and scale of delivery. For example in Cape Town, approval takes six weeks at municipal level compared to seven to nine months at provincial level. With less time spent on inter-governmental processes, implementation and delivery can go faster. The improved coordinated development and accelerated delivery are evident at this stage, which bodes well for the future.
However, another consequence of improved coordination and integration of municipal departments that support human settlements is increased operational costs, including staffing costs as a result of needing sufficient capacity to maintain and support assets that are transferred from province to the local sphere.
The extent to which assignment will adequately address the management of risks associated with the transfer of existing projects and assets (including liabilities) remains to be seen. Given the legal approach and the comprehensiveness of the assignment process (e.g. the FFC’s involvement in making recommendations to the housing minister and MECs), sufficient checks and balances are likely to be in place in the intergovernmental fiscal relations systems and processes. Cities can also be proactive, like in the case of the City of Cape Town that sought the involvement of the Auditor-General during the process of assignment of the housing function, to check on systems and procedures, rather than waiting for the annual audit.
The assignment of the built environment functions may be a step in the right direction but is not the panacea for all challenges related to integrated development or accelerating implementation and delivery at the city level. The longer the review and revision of the housing sector policy and fiscal instruments take, the greater the pressure on equitable share and cities’ own sources of capital to bridge the structural fiscal gap and the resulting increase in operational and maintenance costs. What remains to be seen is whether having more power over financial planning will result in cities becoming financially sustainable in the face of broader economic challenges.
89
co
nc
lU
sIo
nS
TAT
E O
F C
ITY
FIN
AN
CE
S
2013
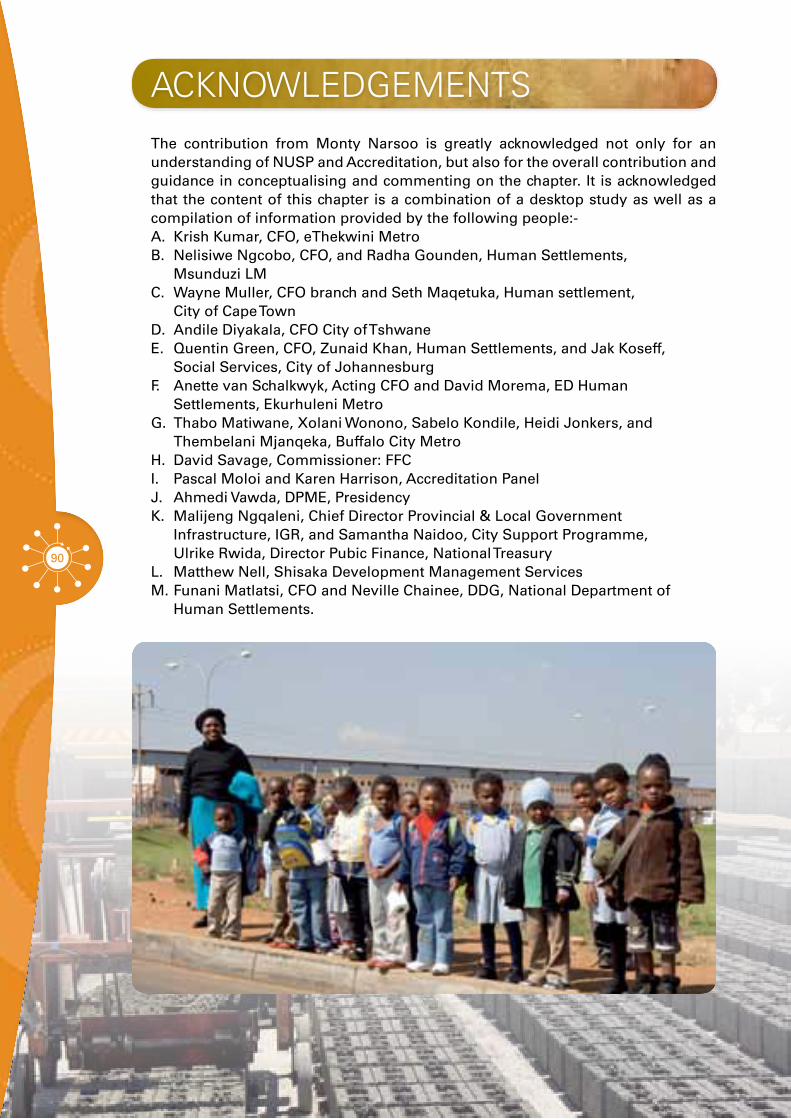
90
The contribution from Monty Narsoo is greatly acknowledged not only for an understanding of NUSP and Accreditation, but also for the overall contribution and guidance in conceptualising and commenting on the chapter. It is acknowledged that the content of this chapter is a combination of a desktop study as well as a compilation of information provided by the following people:-A. Krish Kumar, CFO, eThekwini MetroB. Nelisiwe Ngcobo, CFO, and Radha Gounden, Human Settlements,
Msunduzi LMC. Wayne Muller, CFO branch and Seth Maqetuka, Human settlement,
City of Cape Town D. Andile Diyakala, CFO City of TshwaneE. Quentin Green, CFO, Zunaid Khan, Human Settlements, and Jak Koseff,
Social Services, City of JohannesburgF. Anette van Schalkwyk, Acting CFO and David Morema, ED Human
Settlements, Ekurhuleni Metro G. Thabo Matiwane, xolani Wonono, Sabelo Kondile, Heidi Jonkers, and
Thembelani Mjanqeka, Buffalo City Metro H. David Savage, Commissioner: FFCI. Pascal Moloi and Karen Harrison, Accreditation PanelJ. Ahmedi Vawda, DPME, PresidencyK. Malijeng Ngqaleni, Chief Director Provincial & Local Government
Infrastructure, IGR, and Samantha Naidoo, City Support Programme, Ulrike Rwida, Director Pubic Finance, National Treasury
L. Matthew Nell, Shisaka Development Management ServicesM. Funani Matlatsi, CFO and Neville Chainee, DDG, National Department of
Human Settlements.
AcknowledgemenTs

STA
TE
OF
CIT
Y F
INA
NC
ES
20
13
ReFeRencesDHS (Department of Human Settlements).
2006. Accreditation Framework for Municipalities to Administer National Housing Programmes, Managing the incremental delegation of housing functions to local government. Pretoria: DHS.
FFC (Financial and Fiscal Commission). 2012a. Options Analysis associated with the LGFF Public Hearings. Chapter 4. Pretoria: FFC.
FFC. 2012b. Housing Finance Options Analysis. Pretoria: FFC.
FFC. 2012c. Summary of Housing Finance Public Hearings November 2012. Pretoria: FFC.
KZN DHS (Department of Human Settlements). 2011. Informal Settlement Eradication Strategy (draft). Prepared by Project Preparation Trust for KZN DHS.
National Treasury. 2011. Local Government Budgets and Expenditure Review 2006/07–2012/13. Pretoria: National Treasury.
NPC (National Planning Commission). 2012. National Development Plan: Our Future – make it work. Pretoria: NPC.
Palmer I. 2011. Assessment of financial trends for metro public transport functions – input to 5 cities local business tax submission to National Treasury. Cape Town: PDG.
Palmer I and Hickey Tshangana A. 2011. Assessment of financial trends for metro housing and public transport functions – input to 5 cities local business tax submission to National Treasury. Cape Town: PDG.
PDG (Palmer Development Group). 2012. Financial analysis of spatial investment based on eThekwini MSFM (draft).
The Presidency. 2010. Outcome 8 Delivery Agreement on Human Settlements. Pretoria: The Presidency.
91
Re
Fe
Re
nc
es

92

Each year metropolitan governments
in South Africa create more than R10 billion in
new assets.
93
STA
TE
OF
CIT
Y F
INA
NC
ES
20
13
city assets
Cities construct or otherwise acquire, operate and maintain a range of assets to support service delivery or for investment purposes. The management of these assets is an increasingly important area for municipal governments, which have to balance funding constraints, customer affordability and desire for improved services, and the risks associated with infrastructure assets. Each year metropolitan governments in South Africa create more than R10 billion in new assets. As municipal asset portfolios grow, the sheer quantity and complexity of assets mean that asset failure can often have severe impacts. These impacts can include loss of life, disruption of economic activity and can affect the municipality’s finances and performance. Effective asset management not only is needed to deal with the increasing assets and lifecycle costs attached to those assets but also enables good planning and socio-economic development.
WhAt Are municipAl Assets?Municipal assets include tangible and intangible assets as well as movable and immovable assets. Infrastructure and community assets are the means through which services are delivered, for example a water pump station and its components linked to the broader, potable water reticulation network, or buildings occupied by the municipality, including libraries, clinics and parks. They constitute 80% of total municipal asset value and are therefore the focus of this chapter.
This chapter reports on the composition and value of city assets, estimates asset maintenance and renewal needs, and compares actual expenditure to asset care needs. Challenges are highlighted with regard to asset accounting, investment, custodianship and retention of asset value and potential. Municipal asset portfolios are assessed to determine whether they are increasing in value and contributing to increased city revenues or not, and whether they are keeping pace with the needs of a growing population and economy. Special emphasis is placed on quantifying asset maintenance and renewal needs. Accepted benchmark and actual current provisions, as well as actual expenditure needs, are measured against assessed asset care needs to determine any funding gaps.
cHAPTeR 4
deFinitionAccording to the National
Treasury’s GRAP Implementation Guide for Municipalities
(September 2008), an asset is defined as ‘a resource controlled
by an entity as a result of past events and from which future benefits or service potential is expected to flow to the entity’.
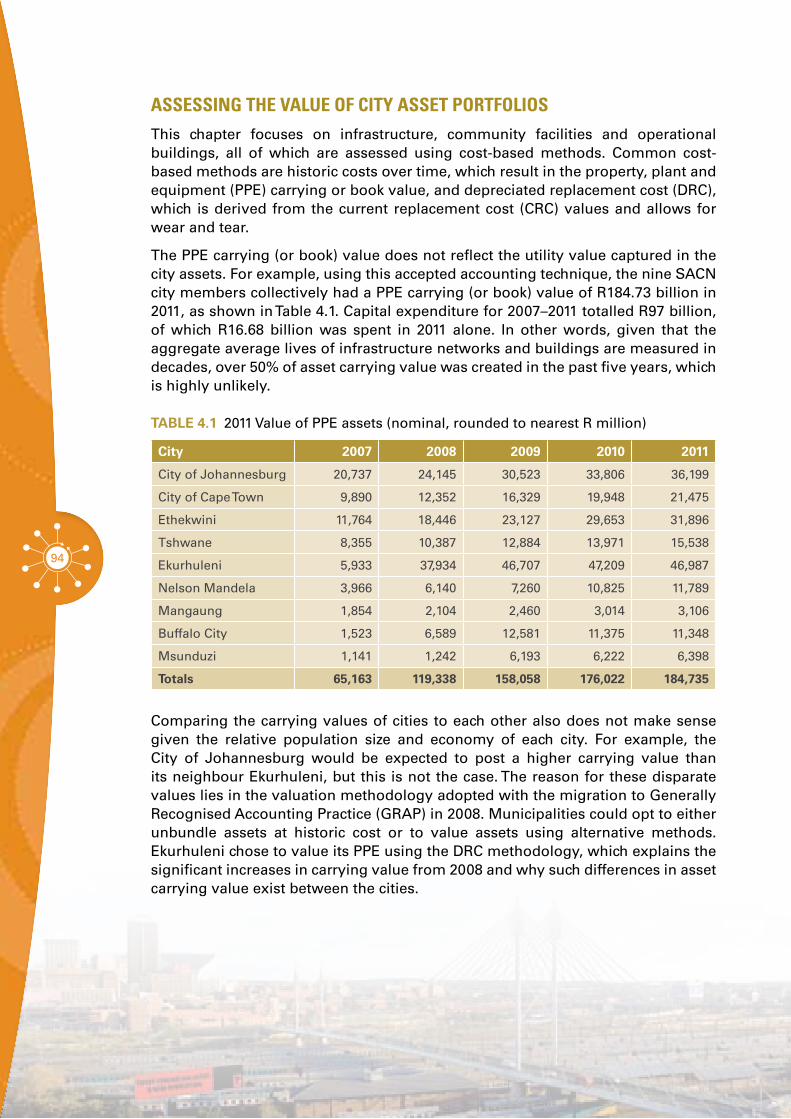
94
Assessing the vAlue oF city Asset portFoliosThis chapter focuses on infrastructure, community facilities and operational buildings, all of which are assessed using cost-based methods. Common cost-based methods are historic costs over time, which result in the property, plant and equipment (PPE) carrying or book value, and depreciated replacement cost (DRC), which is derived from the current replacement cost (CRC) values and allows for wear and tear.
The PPE carrying (or book) value does not reflect the utility value captured in the city assets. For example, using this accepted accounting technique, the nine SACN city members collectively had a PPE carrying (or book) value of R184.73 billion in 2011, as shown in Table 4.1. Capital expenditure for 2007–2011 totalled R97 billion, of which R16.68 billion was spent in 2011 alone. In other words, given that the aggregate average lives of infrastructure networks and buildings are measured in decades, over 50% of asset carrying value was created in the past five years, which is highly unlikely.
TaBLe 4.1 2011 Value of PPE assets (nominal, rounded to nearest R million)
city 2007 2008 2009 2010 2011
City of Johannesburg 20,737 24,145 30,523 33,806 36,199
City of Cape Town 9,890 12,352 16,329 19,948 21,475
Ethekwini 11,764 18,446 23,127 29,653 31,896
Tshwane 8,355 10,387 12,884 13,971 15,538
Ekurhuleni 5,933 37,934 46,707 47,209 46,987
Nelson Mandela 3,966 6,140 7,260 10,825 11,789
Mangaung 1,854 2,104 2,460 3,014 3,106
Buffalo City 1,523 6,589 12,581 11,375 11,348
Msunduzi 1,141 1,242 6,193 6,222 6,398
Totals 65,163 119,338 158,058 176,022 184,735
Comparing the carrying values of cities to each other also does not make sense given the relative population size and economy of each city. For example, the City of Johannesburg would be expected to post a higher carrying value than its neighbour Ekurhuleni, but this is not the case. The reason for these disparate values lies in the valuation methodology adopted with the migration to Generally Recognised Accounting Practice (GRAP) in 2008. Municipalities could opt to either unbundle assets at historic cost or to value assets using alternative methods. Ekurhuleni chose to value its PPE using the DRC methodology, which explains the significant increases in carrying value from 2008 and why such differences in asset carrying value exist between the cities.

STA
TE
OF
CIT
Y F
INA
NC
ES
20
13
95
cH
AP
Te
R 4
STA
TE
OF
CIT
Y F
INA
NC
ES
RE
PO
RT
20
13
DRC is the replacement cost of an existing asset after deducting an allowance for wear or consumption to reflect the remaining economic life of the existing asset (Boshoff et al. 2009). It is a similar value to the concept of asset carrying value but more likely to reflect the current value of an asset. DRC values are derived from CRC values – the cost of replacing the service potential of an existing asset, by reference to some measure of capacity, with an appropriate modern equivalent asset (Boshoff et al. 2009). For example, the cost of a UPVC pipe will be used, rather than the cost of the asbestos-cement pipe that is being replaced, which is out-dated and no longer the best option.
FiGURe 4.1 Spatial distribution of municipal assets by value (current 2012 prices)
To allow a true reflection of the value vested in PPE, DRC values are used in this chapter to compare cities sensibly, to measure asset deterioration and to estimate maintenance provisions. Asset maintenance needs are measured against CRC values, and estimates of asset needs are likewise based on CRC values.
CRC Per Municipality(R/Million)
< 1000 1000–2000 2000–3000 3000–5000 5000–10000 10000–20000 20000–125000

96
The CRC for all municipal infrastructure, community facilities and operational buildings in South Africa is estimated at R1.156 trillion, with a DRC of R565.85 billion (Boshoff and Childs, 2012). The CRC for the SACN cities amount to R598.39 billion, or over 50% of total municipal immovable production assets, and DRC is estimated at some R306.52 billion.
estimAted vAlue oF sAcn cities iFrAstructure And buildings:
r 589.69 billionin replacement value
52%remaining service or economic potential
r 306.52 billionin carrying value
Figure 4.2 illustrates both the spatial distribution of these assets and the high concentration of assets in the major cities.
FiGURe 4.2 CRC and DRC values for SACN cities (current 2012 prices rounded to the nearest R billion)
0
Msunduzi
R billion
Nelson Mandela Bay
City of Johannesburg
Mangaung
Ethekwini
Ekurhuleni
DRC
CRCCity of Tshwane
City of Cape Town
Buffalo City
20 40 60 80 100 120 140 160
22
105
140
73
37
95
49
89
46
38
20
22
11
15
8
54
72
11
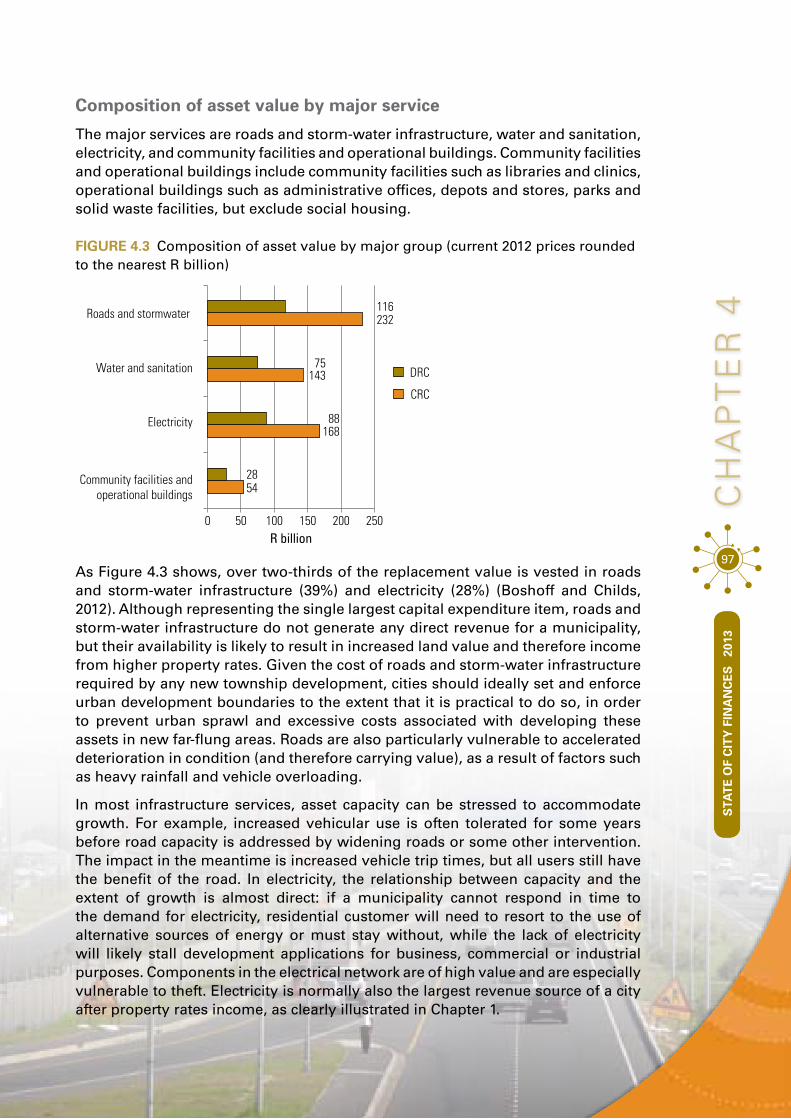
STA
TE
OF
CIT
Y F
INA
NC
ES
20
13
97
cH
AP
Te
R 4
Composition of asset value by major service
The major services are roads and storm-water infrastructure, water and sanitation, electricity, and community facilities and operational buildings. Community facilities and operational buildings include community facilities such as libraries and clinics, operational buildings such as administrative offices, depots and stores, parks and solid waste facilities, but exclude social housing.
FiGURe 4.3 Composition of asset value by major group (current 2012 prices rounded to the nearest R billion)
0 50 100 150 200 250
Water and sanitation
Electricity
Community facilities andoperational buildings
Roads and stormwater 232116
75
88
28
143
168
54
R billion
CRC
DRC
As Figure 4.3 shows, over two-thirds of the replacement value is vested in roads and storm-water infrastructure (39%) and electricity (28%) (Boshoff and Childs, 2012). Although representing the single largest capital expenditure item, roads and storm-water infrastructure do not generate any direct revenue for a municipality, but their availability is likely to result in increased land value and therefore income from higher property rates. Given the cost of roads and storm-water infrastructure required by any new township development, cities should ideally set and enforce urban development boundaries to the extent that it is practical to do so, in order to prevent urban sprawl and excessive costs associated with developing these assets in new far-flung areas. Roads are also particularly vulnerable to accelerated deterioration in condition (and therefore carrying value), as a result of factors such as heavy rainfall and vehicle overloading.
In most infrastructure services, asset capacity can be stressed to accommodate growth. For example, increased vehicular use is often tolerated for some years before road capacity is addressed by widening roads or some other intervention. The impact in the meantime is increased vehicle trip times, but all users still have the benefit of the road. In electricity, the relationship between capacity and the extent of growth is almost direct: if a municipality cannot respond in time to the demand for electricity, residential customer will need to resort to the use of alternative sources of energy or must stay without, while the lack of electricity will likely stall development applications for business, commercial or industrial purposes. Components in the electrical network are of high value and are especially vulnerable to theft. Electricity is normally also the largest revenue source of a city after property rates income, as clearly illustrated in Chapter 1.
STA
TE
OF
CIT
Y F
INA
NC
ES
20
13

98
stAte oF city Assets
City asset health
The remaining life of city assets is estimated at 52%, compared to 50% for secondary cities and district municipalities, and 45% for the re-mainder of South African municipalities (Boshoff and Childs, 2012). This indicates that, as a whole, city assets are in midlife, which means that cities should embark on asset renewal programming within the context of overall optimised asset lifecycle planning. Renewal includes the replacement or rehabilitation of an asset and should be planned taking into account capacity requirements (e.g. time renewals to coincide with upgrading, or to replace with an asset of lesser capacity where initially over-designed).
Repairs and maintenance
Repairs and maintenance are operating activities necessary for keeping an asset as near as practicable to its original condition but exclude rehabilitation or renewal. A common misperception is that municipalities should spend some percentage of the operating budget (typically 8%–12%) on repairs and maintenance. While at least ensuring resources are allocated to this critical activity, this target is not a correct measure. Asset-maintenance needs are mainly a function of the nature and extent of assets (with attention to factors such as service standard targets and local operating conditions) and so should be assessed against CRC, not the operating budget. The international norm for providing maintenance is about 2% of CRC per annum, although this varies from sector to sector: from as low as 1.1% for community facilities and operational buildings to as high as

99
cH
AP
Te
R 4
STA
TE
OF
CIT
Y F
INA
NC
ES
20
13
2.6% per annum for electricity. Of course, CRC-based budget provisions and actual spending may be tempered by operating funding constraints. Nevertheless, if maintenance is underfunded on an ongoing basis, estimates on asset useful life should be adjusted downward.
The benchmark repairs and maintenance needs are based on estimated CRC values, which include the total optimised cost of repairs and maintenance, comprising labour and material costs. As Table 4.2 shows, SACN cities should spend about R10.66 billion per annum on repairs and maintenance of immovable production assets. Yet in 2011, actual reported spending was R6.38 billion, indicating a funding gap of about R4.28 billion. However, this figure should be treated with some caution, as actual spending could be higher if the salary costs of staff involved in repairs and maintenance activities are added to the reported spending. Spending on infrastructure assets is probably lower, since the actual spending also includes the maintenance of moveable assets such as vehicles and machinery. Many municipalities also fund asset capital activities such as road resurfacing and pipe relining from the repairs and maintenance budget.
TaBLe 4.2 Actual spending vs. benchmarked repairs and maintenance needs (rounded to the nearest R million)
city cRc Benchmark repairs and
maintenance needs 2012
actual repairs and
maintenance 2011
adequacy of current
spending levels
measured against
benchmark needs
City of Johannesburg 139,831 2,497 497 –2,000
City of Cape Town 104,936 1,883 1,710 –173
Ethekwini 88,825 1,587 1,230 –356
Tshwane 72,873 1,286 1,057 –229
Ekurhuleni 95,170 1,682 1,168 –515
Nelson Mandela Bay 22,192 395 416 21
Mangaung 38,144 680 77 –603
Buffalo City 21,869 384 175 –210
Msunduzi 14,552 261 50 –212
Totals 598,394 10,657 6,380 –4,277
Note: All items are in 2012 values except for actual repairs and maintenance

100
Asset investment needs An economic growth rate of at least 7% is required to address poverty and unemployment in South Africa, but economic growth rates for cities ranged from 1.49% in Nelson Mandela Bay to 4.30% in Johannesburg (see Table 4.3).13 Existing economic activity and growth has been achieved at least partly on the back of existing municipal infrastructure, which in cities has a replacement value of R598.4 billion. Thus it is reasonable to assume that for the economy to grow, cities need to invest in new infrastructure while caring for existing assets.
TaBLe 4.3 Asset replacement value, capital subsidies and economic growth rates of SACN cities (R million)
capital subsidies received from national Treasury cRc economic growth rate
city 2011 2012 2013 2014
Buffalo city 628 608 722 741 21,870 2.18%
cape Town 2,727 2,373 2,553 2,764 104,936 3.68%
ekurhuleni 1,261 1,336 1,632 1,822 95,170 3.73%
eThekwini 1,437 1,901 2,401 2,884 88,825 3.16%
Johannesburg 2,846 2,693 3,137 3,411 139,831 4.30%
Mangaung 452 531 637 711 38,144 2.79%
Msunduzi 200 203 219 184 14,552 2.56%
nelson Mandela Bay 1,398 971 1,282 1,601 22,192 1.49%
Tshwane 1,182 1,889 2,156 2,583 72,873 3.46%
Totals 12,131 12,505 14,739 16,701 598,394
The estimated asset investment and care needs shown in Table 4.4 are based on an update of similar work by Boshoff and Gildenhuys (2012) on estimated urban infrastructure financing needs prepared for the World Bank.
The following assumptions were made for the modelling:•• Urban economic growth rates will steadily improve over a 10-year period,
reaching 5% by 2016 and 7% by 2021.•• Infrastructure and capital stock investment will increase at a commensurate
rate (‘growth’ in Table 4.4).•• Renewals are based on an assumed average weighted 30-year lifespan for
immovable assets, applied to the existing asset portfolio and adjusted for an increase in assets in future years.
•• The renewals backlog is equivalent to 1% of the replacement value of assets to be addressed over a five-year period commencing in 2013.
•• ‘Service extensions’, which refer to the need to provide service access to infrastructure and community facilities to the poor, are deemed to be equivalent to the quantum of capital grants transferred to cities (see Table 4.4).
13 According to the National Development Plan 2030 (The Presidency, 2012), to attain 6% unemployment by 2030, GDP growth will have to, at the very least, grow by 5.4% on average between 2011 and 2030. The figure of 7% is thus fairly ambitious and the National Development Plan quite rightly notes that very few countries have managed to sustain this kind of growth for a prolonged period of time.

STA
TE
OF
CIT
Y F
INA
NC
ES
20
13
101
cH
AP
Te
R 4
TaBLe 4.4 Summarised infrastructure investment needs 2013–2017 (R million)
city nature of investment need 2013 2014 2015 2016 2017
Buffalo city
Growth 723 875 1,041 1,225 1,390
Service extensions 722 741 761 781 801
Renewals 773 797 826 861 902
Total 2,218 2,413 2,628 2,867 3,092
cape Town
Growth 4,416 4,891 5,411 5,983 6,784
Service extensions 2,553 2,764 2,674 2,705 2,736
Renewals 3,708 3,855 4,018 4,198 4,398
Total 10,677 11,510 12,103 12,886 13,918
ekurhuleni
Growth 4,036 4,458 4,921 5,429 6,157
Service extensions 1,632 1,822 2,073 2,362 2,691
Renewals 3,363 3,497 3,646 3,810 3,991
Total 9,030 9,777 10,639 11,601 12,838
ethekwini
Growth 4,036 4,458 4,921 5,429 6,157
Service extensions 2,401 2,884 3,728 4,703 5,933
Renewals 3,138 3,254 3,385 3,534 3,701
Total 9,575 10,596 12,034 13,666 15,791
Johannesburg
Growth 3,460 3,934 4,456 5,034 5,708
Service extensions 3,137 3,411 3,581 3,839 4,116
Renewals 4,941 5,154 5,384 5,632 5,900
Total 11,537 12,499 13,422 14,505 15,724
Mangaung
Growth 6,404 6,902 7,442 8,029 9,105
Service extensions 637 711 844 985 1,149
Renewals 1,348 1,395 1,449 1,511 1,583
Total 8,389 9,008 9,735 10,525 11,837
Msunduzi
Growth 1,402 1,628 1,877 2,153 2,441
Service extensions 219 184 193 189 186
Renewals 514 531 552 575 602
Total 2,136 2,344 2,621 2,917 3,229
nelson Mandela Bay
Growth 642 821 1,017 1,234 1,399
Service extensions 1,282 1,601 1,533 1,642 1,758
Renewals 784 806 833 867 908
Total 2,708 3,228 3,383 3,742 4,065
Tshwane
Growth 515 607 707 819 929
Service extensions 2,156 2,583 3,489 4,469 5,726
Renewals 2,575 2,674 2,785 2,909 3,047
Total 5,246 5,863 6,981 8,197 9,701
consolidated investment
needs across sacn cities
Growth 25,634 28,574 31,793 35,335 40,069
intervention (service extension)
14,739 16,701 18,875 21,674 25,095
Rehabilitation 21,143 21,962 22,877 23,897 25,032
Total 61,516 67,237 73,545 80,905 90,196
STA
TE
OF
CIT
Y F
INA
NC
ES
20
13

102
As Table 4.4 shows, cities should invest R61,516 million (R61.5 billion) in the first year (2013) and more in subsequent years. This will require a significant increase in future capital budgets, as in 2011 capital spending was only R16.68 billion, about one-third of the investment needed.
These estimates exclude any provision for low-income housing, the cost of acquiring land or movable assets. Much of capital budgets over the past 12 years have been directed towards service extensions, but estimates indicate that renewal and growth needs have assumed about equal importance. Without asset renewal, current revenue streams will not be assured, and depletion of service potential will follow; without growth, cities (and indeed the country) will stagnate.
TaBLe 4.5 Summarised infrastructure investment needs 2013–2017 (R million)
cities
Periodincrease in annual
maintenance provisions by 2017
2012 2013 2014 2015 2016 2017amount (current
2012 prices)%
Buffalo city 420 436 453 473 496 522 102 24%
cape Town 2,007 2,093 2,188 2,288 2,400 2,527 521 26%
ekurhuleni 1,805 1,886 1,973 2,069 2,176 2,298 493 27%
ethekwini 1,697 1,771 1,853 1,952 2,065 2,194 498 29%
Johannesburg 2,665 2,793 2,927 3,070 3,225 3,400 735 28%
Mangaung 723 751 783 821 864 912 189 26%
Msunduzi 276 286 297 310 325 342 67 24%
nelson Mandela 433 451 472 490 515 543 110 25%
Tshwane 1,398 1,459 1,529 1,615 1,711 1,822 424 30%
Total 13,436 13,938 14,489 15,103 15,793 16,580 3,139 23%
Based on the extent and composition of existing assets and the investment needs, Table 4.4 shows that maintenance needs for SACN cities will increase by some R3,139 million (R3.1 billion or 23% over a five year period.

103
cH
AP
Te
R 4
STA
TE
OF
CIT
Y F
INA
NC
ES
20
13
Complexities facing citiesIn a world that is fast approaching the limits of non-renewable energy sources and food supply, compounded by polluted seas, rivers, land and atmosphere, cities increasingly need to take responsibility for securing their own futures, while positioning themselves as attractive spaces for investment and pooling of skills. They compete globally for access to scarce resources, such as fixed capital investment, skills, natural resources and other commodities. In South Africa, cities face capacity constraints and a limited supply of commodities such as potable water and electricity, which threaten their urban ecological security (UES).14 Cities also need to ensure their sustainability through greening of infrastructure and preparing for climate adaptation, as well as investing in next generation assets that will allow the cities to compete on the international stage.
Urban ecological securityIncreasing concerns over UES are resulting in strategies aimed at reconfiguring cities and their infrastructures in ways that help to secure their ecological and material reproduction. Yet cities have differing capacities and capabilities for developing strategic responses to the opportunities and constraints of key UES concerns. These newly emerging strategies may selectively privilege particular urban areas and particular social interests over others (Hodson and Marvin, 2009).
In South Africa, cities need to think about UES challenges, especially given their reliance on larger systems (for water, sanitation and electricity) over which they have little control and yet which affect their operations and sustainable futures. In the 1990s, when the national electricity grid was consolidated, several cities opted to purchase all bulk electricity from Eskom and to rely on their own generation
14 Urban ecological security describes the processes in and through which already powerful places (like New York, London and Tokyo) are using their wealth to create enclaves of security within which they can ward-off the worst effects of climatic threats and energy insecurities. http://anthropocenedotcom.wordpress.com/2011/10/08/league-tables-and-liberal-environmentalism/
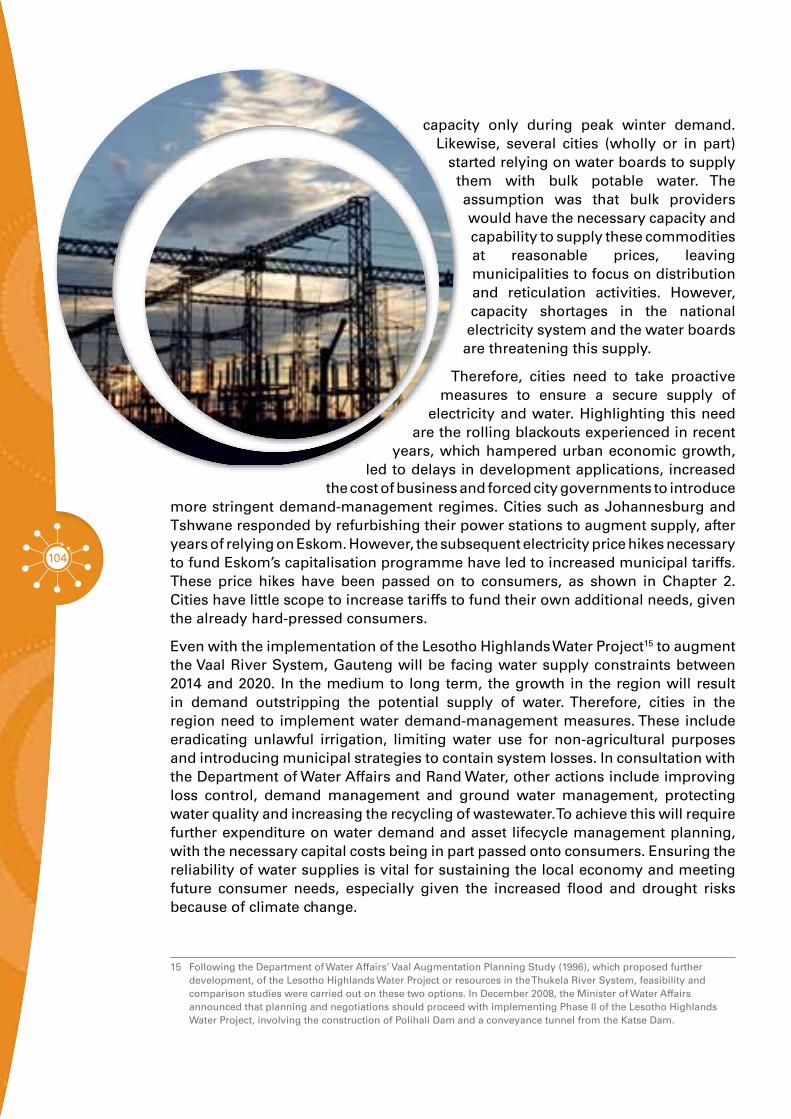
104
capacity only during peak winter demand. Likewise, several cities (wholly or in part)
started relying on water boards to supply them with bulk potable water. The assumption was that bulk providers would have the necessary capacity and capability to supply these commodities at reasonable prices, leaving municipalities to focus on distribution and reticulation activities. However, capacity shortages in the national electricity system and the water boards are threatening this supply.
Therefore, cities need to take proactive measures to ensure a secure supply of
electricity and water. Highlighting this need are the rolling blackouts experienced in recent
years, which hampered urban economic growth, led to delays in development applications, increased
the cost of business and forced city governments to introduce more stringent demand-management regimes. Cities such as Johannesburg and Tshwane responded by refurbishing their power stations to augment supply, after years of relying on Eskom. However, the subsequent electricity price hikes necessary to fund Eskom’s capitalisation programme have led to increased municipal tariffs. These price hikes have been passed on to consumers, as shown in Chapter 2. Cities have little scope to increase tariffs to fund their own additional needs, given the already hard-pressed consumers.
Even with the implementation of the Lesotho Highlands Water Project15 to augment the Vaal River System, Gauteng will be facing water supply constraints between 2014 and 2020. In the medium to long term, the growth in the region will result in demand outstripping the potential supply of water. Therefore, cities in the region need to implement water demand-management measures. These include eradicating unlawful irrigation, limiting water use for non-agricultural purposes and introducing municipal strategies to contain system losses. In consultation with the Department of Water Affairs and Rand Water, other actions include improving loss control, demand management and ground water management, protecting water quality and increasing the recycling of wastewater. To achieve this will require further expenditure on water demand and asset lifecycle management planning, with the necessary capital costs being in part passed onto consumers. Ensuring the reliability of water supplies is vital for sustaining the local economy and meeting future consumer needs, especially given the increased flood and drought risks because of climate change.
15 Following the Department of Water Affairs’ Vaal Augmentation Planning Study (1996), which proposed further development, of the Lesotho Highlands Water Project or resources in the Thukela River System, feasibility and comparison studies were carried out on these two options. In December 2008, the Minister of Water Affairs announced that planning and negotiations should proceed with implementing Phase II of the Lesotho Highlands Water Project, involving the construction of Polihali Dam and a conveyance tunnel from the Katse Dam.

STA
TE
OF
CIT
Y F
INA
NC
ES
20
13
105
cH
AP
Te
R 4
Climate change adaptation
Cities can ensure their sustainability by introducing climate change adaptation measures. These include reducing greenhouse gas (GHG) emissions and tackling the design, acquisition, operation and maintenance of infrastructure.
According to the National Development Plan, quoting the National Climate Change Response White Paper, the heavy reliance on coal-fired power generation makes the energy sector responsible for up to 48% of GHG emissions. The transport and industrial sectors are both put at 9%, while 14% is attributed to industrial process emissions, 9% to fugitive emission, and residential emissions that contribute only 1%.16 Consequently these sectors are likely to be the focus of GHG reduction initiatives in the public domain. Based on these figures, the focus at city level will be on green public transport (such as electrification of mass transport and provision of pedestrian and cycle facilities), industry which is often concentrated in urban and particularly city areas, as well as to a lesser extent on the energy efficiency of buildings and operations in general. While cities cannot alter the existing built environment on a large scale, new townships and developments can be designed in a more effective and green-friendly manner.
Cities have various options for designing, acquiring, operating and maintaining infrastructure, which could be connected to the grid or decoupled from larger systems, but these have implications for city capital programmes, environmental sustainability and revenue potential. For example, the widespread use of photovoltaic (solar) technology can substantially reduce actual electricity use but will affect municipal revenue, depending on whether it is used in high or low-income households. This dilemma of reduced consumption versus municipal revenues is reported on in greater detail in Chapter 2. If this technology is used in high-income households, the impact on municipal revenue would be negative. However, the impact on the municipal capital budget would be minimal, as high-income households (or their agents) are responsible for development contributions, site-based or internal infrastructure and connection fees; such capital investment is effectively funded off-budget. In contrast, introducing
16 These figures do vary somewhat depending on the source. The National Development Plan (The Presidency, 2012: 208) quoting the National Climate Response White Paper refers to a figure of 48% when attributing the energy sector proportion of emissions. The transport and industrial sectors are both put at 9%, and 14% for industrial use, while operation of non-residential and residential building sectors account for around 23% of total emissions.
STA
TE
OF
CIT
Y F
INA
NC
ES
20
13

106
green technologies in low-income households may reduce the municipal fiscal drain, as municipalities would not have to subsidise bulk purchase and reticulation costs. Nevertheless, regardless of whether such technology is employed, for now and in the medium term, Eskom will need to retain a spinning reserve – continue supplying electricity – as these alternative energies cannot provide a continuous supply (or sufficient energy). Municipalities will also continue to operate and maintain the distribution and reticulation infrastructure. Therefore, while the need for a radical shift in policy is increasingly being acknowledged, the timing and pace at which it will take place, and, more importantly, be implemented, is uncertain.
Although the ability and efficiency of many emerging green technologies are not clear at this stage, it is reasonable to expect that attention on these technologies will grow, with greening of infrastructure becoming an accepted industry practice, along the lines of the greening of buildings, which has been substantially driven by the private sector. Significant opportunities exist for retrofitting municipal infrastructure and facilities, funded on the back of a structured renewals programme wherever feasible and practical. Renewal entails the replacement or rehabilitation of an asset that constitutes capital budget activities, which materially extend the useful life of assets. Table 4.6 indicates an estimated annual depreciation charge of R16.84 billion for SACN cities, based on the current replacement cost figures provided in this chapter.
TaBLe 4.6 Annual wear and tear of cities’ immovable PPE (2012 R million)
sacn cities annual depreciation
Buffalo city 623.25
city of cape Town 2,929.27
city of Johannesburg 3,914.86
city of Tshwane 2,064.00
ekurhuleni 2,680.19
ethekwini 2,506.52
Mangaung 1,084.68
nelson Mandela Bay 623.29
Msunduzi 410.06
Total 16,836.12
In addition to retrofitting infrastructure to adapt to climate change, municipalities increasingly need to invest in next generation city assets in order to become more competitive.

107
cH
AP
Te
R 4
STA
TE
OF
CIT
Y F
INA
NC
ES
20
13
Next generation city assets
Today cities compete internationally for fixed capital investment, recurring short-term income from tourism and sought-after skills. Therefore, cities can no longer afford to limit investment to traditional municipal assets, such as civil and electrical infrastructure, and local facilities such as libraries and clinics. In order to compete, cities increasingly need to invest in improved mobility, telecommunications and hosting – what is known as the Smart City concept. In South Africa, eThekwini and Cape Town have invested in international convention centres comparable to any other in the world, while Ekurhuleni has invested close to R1 billion in an information and communications technology fibre optic cable network. All 2010 World Cup host cities invested heavily in stadiums and related facilities and infrastructure. More recently, the concept of an aerotropolis was introduced to South Africa, whereby a city’s airport is used to optimise city design and accelerate economic growth: Ekurhuleni has concluded pre-feasibility studies and eThekwini is following suit.
The trend towards compact city design
Current planning in cities favours compact city design, as the common belief is that compact cities operate more efficiently, with increased densities that result in high-ridership public transportation systems, and do not need as much infrastructure. Furthermore, a compact city design limits man’s footprint on the environment, by reducing travel distances and therefore travel costs and carbon emissions. The combination of these factors should contribute towards cost-effective, efficient and sustainable cities. However, compact city design comes at a cost, as the experience of Ekurhuleni shows (Boshoff et al. 2011):
A key concern in cities, especially since 2000, is the provision of infrastructure to the poor. The cost of such infrastructure is quite substantial and stretches the fiscal ability of cities, but it is relatively small when compared to the costs of public transport and high-density, low-income housing that are required for a compact city design.
The costs of densification proposals for Ekurhuleni undertaken in 2011
Three probable growth scenarios are greenfield, brownfield development and inner city development, which all have different costs. Greenfield unit rates are normally used when estimating infrastructure investment (typically creating new infrastructure or upgrading infrastructure), whereas brownfield unit rates are normally applied for the purpose of asset management planning, which focuses on the renewal of assets over time.

108
FiGURe 4.4 Infrastructure unit rates (rand per residential customer unit) provided for low-income housing in Ekurhuleni
0
20 000
40 000
60 000
80 000
100 000
120 000
140 000
160 000
180 000
35 du/Ha
Rand
s
69 du/Ha 90 du/Ha 100 du/Ha 110 du/Ha 140 du/Ha 160 du/Ha 200 du/Ha
CBD
Brown
Green
Source: Boshoff et al. (2011)
Table 4.4 shows that unit cost rates in all categories decline at higher densities. Densifying the inner city would cost about double that of greenfield development, whether at 35 dwelling units per hectare (du/ha) or 200 du/ha. A 2011 analysis of water network unit cost rates in Johannesburg also found that suburban unit costs are about twice as high as in a greenfield environment, and about three times as high in the CBD.
The National Housing Code (DoHS 2009) gives a unit cost rate of R4,203 per m2 for converting inner city buildings to high-rise housing able to accommodate high volumes and a unit cost rate of R1,400/m2 for constructing a low-income, single residential unit.17 Therefore, in order to address existing low-income housing backlogs and to cater for the growth of this segment, Ekurhuleni would need to build 248 339 housing units. If these units were single residential housing units (each consisting of a 40 m2 house on a 120 m2 stand), the cost would be about R71 billion. In contrast, if these units were high-rise housing within a densified inner city, the estimated cost would be a staggering R852 billion.
Ekurhuleni expects its total number of residential customers to increase from 790 062 in 2011 to 891 753 in 2036, which is far from the almost three million residential customers needed to achieve the proposed density target of 100 du/ha required for viable public transport.18 Moreover, based on an average unit operating cost of R40 million per kilometre per annum, the annual operating cost of an Integrated Rapid Public Transportation Network (IRPTN) would be R13 billion, or more than half of Ekurhuleni’s total annual budget. Ekurhuleni illustrates that increasing housing density within cities is a good objective but can only be realised over the long term – and is simply unaffordable in the short to medium term.
17 The actual figure of R1,400 is not quoted directly but derived from the total cost of R55,706 divided by 40 m2.18 The figure on the ideal density for a viable public transport system is by no means settled. For example, the City
of Cape Town provides a remarkably lower figure of 25du/ha as the more appropriate benchmark (City of Cape Town 2009). Tonkin (2008) does a literature review that points at anything between 40 du/ha and 100du/ha as being medium density settlement, with anything less than that being low density, and thus less appropriate.
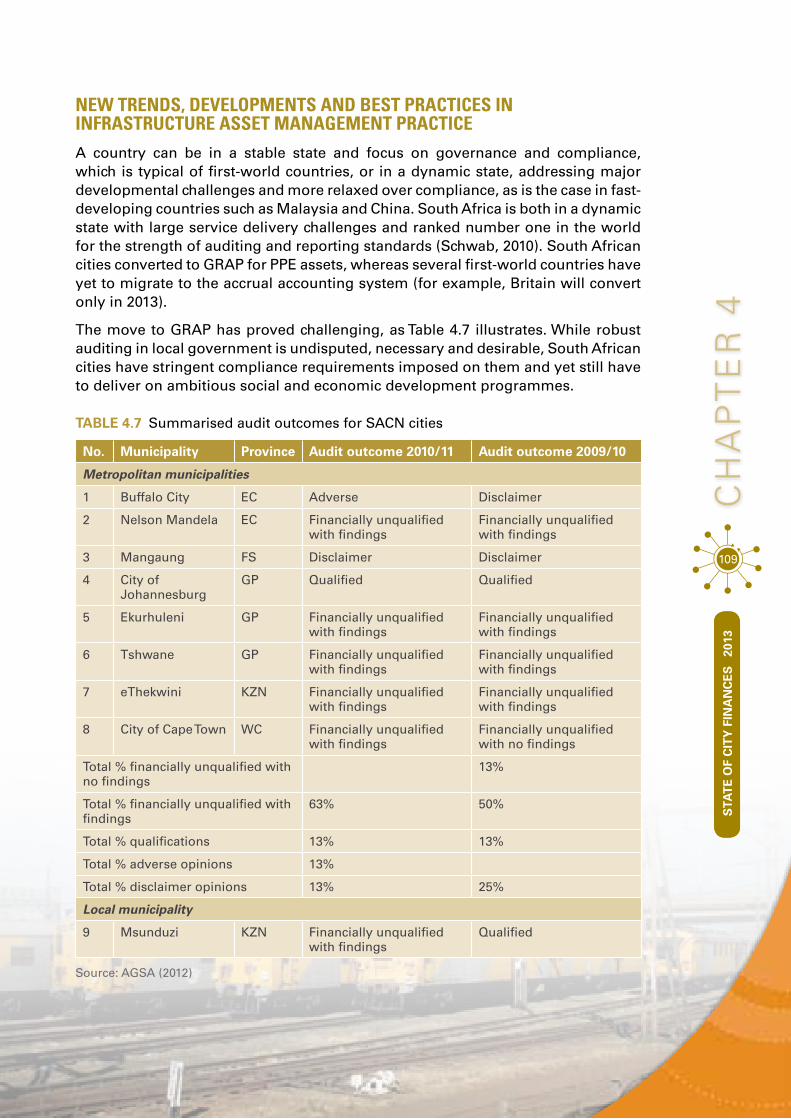
STA
TE
OF
CIT
Y F
INA
NC
ES
20
13
109
cH
AP
Te
R 4
neW trends, developments And best prActices in inFrAstructure Asset mAnAgement prActiceA country can be in a stable state and focus on governance and compliance, which is typical of first-world countries, or in a dynamic state, addressing major developmental challenges and more relaxed over compliance, as is the case in fast-developing countries such as Malaysia and China. South Africa is both in a dynamic state with large service delivery challenges and ranked number one in the world for the strength of auditing and reporting standards (Schwab, 2010). South African cities converted to GRAP for PPE assets, whereas several first-world countries have yet to migrate to the accrual accounting system (for example, Britain will convert only in 2013).
The move to GRAP has proved challenging, as Table 4.7 illustrates. While robust auditing in local government is undisputed, necessary and desirable, South African cities have stringent compliance requirements imposed on them and yet still have to deliver on ambitious social and economic development programmes.
TaBLe 4.7 Summarised audit outcomes for SACN cities
no. Municipality Province audit outcome 2010/11 audit outcome 2009/10
Metropolitan municipalities
1 Buffalo City EC Adverse Disclaimer
2 Nelson Mandela EC Financially unqualified with findings
Financially unqualified with findings
3 Mangaung FS Disclaimer Disclaimer
4 City of Johannesburg
GP Qualified Qualified
5 Ekurhuleni GP Financially unqualified with findings
Financially unqualified with findings
6 Tshwane GP Financially unqualified with findings
Financially unqualified with findings
7 eThekwini KZN Financially unqualified with findings
Financially unqualified with findings
8 City of Cape Town WC Financially unqualified with findings
Financially unqualified with no findings
Total % financially unqualified with no findings
13%
Total % financially unqualified with findings
63% 50%
Total % qualifications 13% 13%
Total % adverse opinions 13%
Total % disclaimer opinions 13% 25%
Local municipality
9 Msunduzi KZN Financially unqualified with findings
Qualified
Source: AGSA (2012)
STA
TE
OF
CIT
Y F
INA
NC
ES
20
13

110
Further complicating the compliance issue is that auditors interpret the accounting standards differently over time and between cities. The standards are also evolving and becoming more sophisticated. For example, GRAP 17, the Standard on PPE, has been amended and new standards introduced: •• The Standard of GRAP 103, Heritage Assets, indicates the requirements for
recognising, measuring, impairing, de-recognising, transferring and disclosing heritage assets to be used during the preparation of the annual financial statements. (GRAP 17 included the treatment of heritage assets and required disclosure, but measurement requirements were optional.) GRAP 103 is effective for financial years commencing on or after 1 April 2012, which means that municipalities must use GRAP 103 from 1 July 2012 and comply on 30 June 2013.
•• GRAP 21 and GRAP 26, dealing with the impairment of respectively non-cash generating assets and cash generating assets will be effective for financial years commencing on or after 1 April 2012. Therefore municipalities must use the requirements of these standards from 1 July 2012 and comply on 30 June 2013. The impairment standards explain how the recoverable amount must be calculated, provide the impairment indicators and indicate the disclosure requirements to be used when preparing the annual financial statements.
Asset management is fast evolving into a profession in its own right, with a unique body of knowledge. In 2014 the ISO 55000 asset management standard will be published and will incorporate elements of both the International Infrastructure Management Manual19 and the PAS 55 on the Optimised Management of Physical Assets.20 It is likely that in future, financing institutions will increasingly insist on compliance with this standard to ensure the safeguarding of their investments, and that auditors will consider this standard during their audits, particularly with respect to performance auditing.
19 The World Bank has endorsed as best practice the International Infrastructure Management Manual, to which South Africa is a signatory. The manual advocates sound principles, describes best practices and provides asset management techniques. It is the main source of guidance on the unbundling, valuation and lifecycle management of infrastructure and other immovable assets.
20 In 2008, the Publicly Available Specification (PAS 55) on the Optimised Management of Physical Assets was published in the United Kingdom. PAS 55 requires organisational commitment and a system-wide approach to asset management, and provides specifications on matters relating to asset management policy, strategy, objectives and plans; enablers and controls; the implementation of asset management plans; performance assessment and improvement, and management review. Many public and private utility organisations have found that compliance with this specification improved access to capital markets or ensured more favourable loan arrangements.

111
cH
AP
Te
R 4
STA
TE
OF
CIT
Y F
INA
NC
ES
20
13
ciTY asseT ManaGeMenT iniTiaTiVes
The SACN member cities recognise the importance of asset management, but the level of progress differs among the cities.
Buffalo City
In 2010 Buffalo City implemented an integrated infrastructure asset management system that includes a GRAP compliant asset register and captures all assets (BCM 2012). In 2012, the city prepared a valuation guide and draft asset management policy for all its assets and has also valued storm-water and bridges assets based on recent technical assessment data, and converted these datasets in GRAP 17 format. An asset management procedures manual is in the process of being assembled and will define the broader scope of asset management, addressing not only asset accounting procedures but also broader asset management planning.
Cape Town
In 2007 the City of Cape Town contracted an external service provider to establish an Asset Care Centre for the Electrical Support Services (ESS) department responsible for civil projects, maintenance, corrosion protection, electrical projects and transformer refurbishment.21 The project started by assessing the maturity of the department’s asset management practice. This assessment informed the development of an asset management improvement programme, the implementation of which is driven through the Asset Care Centre. The ESS Department was recently awarded the SABS President’s Award, which is presented to accredited clients that show significant improvement in business growth, business improvement, customer satisfaction and improved productivity. The ESS Department also won the SA Productivity National Award.
21 Press release by Pragmaworld. http://www.pragmaworld.net/media/pragma-team-assists-in-bringing-award-to-the-cape.php [Date accessed: 20 September 2012].

112
In 2008 the City of Cape Town launched an infrastructure asset management project with a particular focus on electricity services, water and sanitation, and solid waste (City of Cape Town Metropolitan Municipality 2012). The departments involved captured asset data and in 2011 completed first stage infrastructure asset management plans (IAMPs), which are used to inform the city’s IAMP. It has been proposed that the project be extended to include all utility service departments that have significant asset costs and would benefit from a formalised asset management approach. The city has recognised that asset management is a long-term process and has formulated proposals for a draft asset management strategy and implementation plan with supporting policies that should lead to the development of IAMPs for all relevant departments.
In addition, the City of Cape Town established a mayoral committee strategic working group to formulate principles for finalising the Asset Management Strategy, infrastructure maintenance and development planning within the city’s Medium Term Revenue and Expenditure Framework, linked to the development priorities of the City Development Strategy and the Economic Development Strategy.
Ekurhuleni
In 2009 Ekurhuleni embarked on a multi-year, integrated infrastructure asset management programme. The aims of the programme included successful conversion to GRAP 17 and subsequent clean audit results on immovable PPE, improved management of infrastructure and service delivery, which includes informed decisions about infrastructure and community service levels and standards, asset lifecycle planning, prioritisation and budgeting, and improvements in asset management practice.

STA
TE
OF
CIT
Y F
INA
NC
ES
20
13
113
cH
AP
Te
R 4
In 2009 the city unbundled and valued its major engineering networks (retrospectively adjusted to 30 June 2008) and acquired asset management software that includes a GRAP 17 compliant electronic asset register and various infrastructure and community asset portfolio-specific modules. The asset register is not only fully GRAP compliant but also contains details on fair valuation, asset attributes, failure mode status and related asset management data, all of which are spatially linked. In 2010 community facilities and operational buildings were unbundled, valued and brought onto the books. An infrastructure and community services backlog study was prepared based on the asset register that includes the quantification of backlogs up to 2025 on capital needs for addressing existing service access and asset renewal backlogs, the demands of population and economic growth, as well as ongoing asset renewal, and asset maintenance needs. Sectoral asset management plans were prepared for all infrastructure and community services as well as operational buildings, as was a comprehensive municipal infrastructure plan that contained an infrastructure investment analysis.
Along with the updated and further refined backlog study of 2011, these plans proved valuable beyond the immediate asset management needs. They informed subsequent updates of the Integrated Development Plan with respect to service levels, service access and backlog statistics, and annual presentations to National Treasury on backlogs, capital needs and asset care issues. They also informed the built-environment component of the city’s Growth and Development Strategy (approved in 2012) and provided most of the base data for the first Built Environment Performance Plan (prepared in 2011 and its 2012 update), the municipal Spatial Development Framework (inclusive of its capital investment framework) and the municipal Housing Development Plan approved in 2011. The backlog study, asset management plans and comprehensive municipal infrastructure plan are all in the process of being updated. Plans are also in place to upskill municipal staff, and to improve in-house asset management capacity and asset management practices. Audit results with respect to immovable PPE since 2008 are as follows:
TaBLe 4.8 Audit results for the immovable PPE of Ekurhuleni 2009–2011
Financial period audit result
30 June 2009 Unqualified with findings
30 June 2010 Unqualified with findings
30 June 2011 Unqualified with no findings
STA
TE
OF
CIT
Y F
INA
NC
ES
20
13

114
eThekwini
eThekwini established a GIS-based system that analyses the condition of the full range of asset classes, assesses the risk implications of asset failure, views and analyses the geographical locations of asset renewal and rehabilitation needs, determines the risks and cost implications of failing to carry out maintenance on key infrastructure assets, as well as the risks and cost implications of maintaining assets whose useful life has expired (eThekwini Metropolitan Municipality 2012). Asset portfolios have been assessed and the replacement values of assets determined. The city is also in the process of preparing an integrated IAMP for electricity, water and sanitation, roads, transport, parks and leisure, storm-water, solid waste, and property and buildings.
The adoption of good asset management practice is actively promoted across departments, with the emphasis on proactive maintenance, managing demand to limit the unnecessary construction of new assets and investigating alternative supply options such as re-using water from treatment works, researching sea water desalination and generating electricity from methane gas at municipal landfill sites.
Furthermore, where appropriate, an innovative approach has been taken by establishing community-based maintenance teams (as part of the Expanded Public Works Programme) to undertake infrastructure maintenance in a manner that supports poverty eradication and socio-economic upliftment of poorer communities.
Johannesburg
Some of the city’s municipal entities have compiled asset management registers, and the city has embarked on a process to compile and finalise asset management plans for all city infrastructure (City of Johannesburg Metropolitan Municipality 2011).
Since 2008, Johannesburg Water has been pursuing a programme to improve infrastructure asset management, in line with recognised good practice. It started by identifying a range of improvement actions and compiling an asset management plan. The plan highlighted the need for significant improvement in the accuracy of data underlying key strategic decisions relating to the management of the infrastructure and, in particular, for effective processes, systems and data to be established that would inform the considerable investments associated with capital renewal programmes. A prioritised

115
cH
AP
Te
R 4
STA
TE
OF
CIT
Y F
INA
NC
ES
20
13
programme of establishing robust and effectively structured asset data has been pursued, focusing initially on high value/high risk assets, and selectively progressing to high volume/lower value assets where it makes business sense. In parallel, asset models and business processes have been developed, underpinned by a programme to expand, integrate and align the engineering and financial support systems. It is envisaged that the asset management plan will now be updated, based on the new data, and will inform future budgets, and technical and organisational strategies.
Mangaung
In 2011 Mangaung embarked on the process of preparing a GRAP-compliant asset register. While recognising the need to prepare and implement an asset management plan to support the maintenance, upgrading and replacement of ageing infrastructure, the city acknowledges that little progress has been made in this regard (Mangaung Metropolitan Municipality 2012).
Nelson Mandela Bay
The city has GRAP-compliant asset management systems in place that support asset accounting, infrastructure development and maintenance programmes for its electricity, water, sanitation, refuse removal, roads, storm-water, and property and buildings asset portfolios (Nelson Mandela Bay Metropolitan Municipality 2012). The municipality boasts four consecutive unqualified audit opinions since 2007/08. Reported asset values are based on the historic-cost model, though the detailed asset register features asset replacement values for planning and budgeting purposes. Asset care needs are established through annual condition assessment, appropriate to the portfolio assessed, that are then incorporated into maintenance plans. These plans in turn inform the operating budget with respect to maintenance and the capital budget for asset renewals.

116
The eight metros and Msunduzi collectively have control over infrastructure and buildings with a replacement value of close to R600 million. These assets are indispensable for the livelihood of almost 20 million urban citizens and for some 57% of South Africa’s national output. However, perpetual benefits from these assets are by no means assured, as assets portfolios on average have reached midlife. Structured renewal programmes should be crafted within the context of optimised asset lifecycle strategies, and cities should recapitalise asset portfolios to an estimated amount of R16.84 billion per annum. This amount is a moving target, as every year cities invest about R13.44 billion in capital activity, of which the lion’s share is earmarked for new asset creation.
The two challenges are:1. The vastly insufficient re-investment in existing assets, a situation exacerbated
by an increasing asset renewals load, as additional assets are also subject to wear and tear. Regardless of the actual level of investment in renewals, opportunities exist for green retrofitting to achieve the objectives of cleaner, more sustainable cities and to support the emerging green economy.
2. Maintenance activities, which may be underfunded by about R4.28 billion per annum, when measured against benchmark data. This leads to accelerated deterioration in the condition of assets. The maintenance backlog is also likely to become larger, as more assets are created.
Over the next five years, cities need to invest about R373.39 billion to enable meaningful economic growth, provide services access to households and renew infrastructure. This represents an average annual investment of R74.68 billion, which is about five times the current level of investment. In 2012 the capital transfer envelope from national government was R12.5 billion, and cities will struggle to
conclUsIon

117
co
nc
lU
sIo
nS
TAT
E O
F C
ITY
FIN
AN
CE
S
2013
raise the necessary finance, even with full balance sheet leveraging. Furthermore, if this level of funding could somehow be obtained, cities would need to budget for an additional R3.14 billion in maintenance expenditure over the next five years.
Infrastructure investment needs are also shifting. In recent years the focus has been on service access, but investment needs are now fairly balanced between investment in economic growth, asset renewal and service access. More importantly, the impacts of compact city design have not yet been fully discounted in financial planning. Based on studies such as the densification proposals in Ekurhuleni, it appears that implementing high-density, low-income housing and bus rapid transport system initiatives will overshadow the cost of infrastructure provision. The future costs of building and infrastructure construction, upgrades and renewals are likely to become more expensive given the developed environment in which that capital activity will take place, or alternatively greenfields land, such as dolomitic land, is developed at a cost premium. This factor is currently not generally or properly accounted for in infrastructure investment planning models.
Given the sheer scale and importance of assets to both cities and the country, assets must be properly managed and accounted for. In recent years, infrastructure asset management best practices and asset accounting standards have developed and are increasingly informing and supporting each other. However, the application of these standards is not simple, and the interpretation of these standards differs between audit teams at various cities and from year to year.
Asset management within the SACN member cities is at various levels of progress. Some cities have assembled GRAP-compliant asset registers, implemented electronic asset management systems and prepared IAMPs per sector and for the organisation as a whole. Other cities are still contemplating such action.
Cities have much to share about best city asset management practice, and the approaches, innovation and challenges associated with launching and improving asset management programmes. Some years after embarking on an organisation-wide integrated infrastructure asset management programme, Ekurhuleni is able to share benefits with other business processes, supporting and enriching plans across sectors and services. Taking the lead in asset care centres, Cape Town has recognised (like Ekurhuleni) that proper asset management both supports and enhances strategic objectives and programmes. Ethekwini has introduced an innovative community-based maintenance initiative, and is considering alternative supply arrangements that support the objectives of a green economy and resilient cities discussed in Chapter 3.

118
AGSA (Auditor General South African). 2012. Consolidated General Report on Audit Outcomes of Local Government (Part 2). September 2012.
BCM (Buffalo City Metropolitan Municipality). 2012. Built Environment Performance Plan, p. 52.
Boshoff, LP and Childs, RC. 2012. Asset Wealth, Health and Care Needs: a 2012 View on Municipal Infrastructure and Community Facilities. 2012.
Boshoff, LP and Gildenhuys, BC. 2012. An Estimate of Infrastructure Funding Needs for South African Municipalities up to 2030: Revised Funding Quantum based on Probable Sustainable Development Goals and Current Best Thinking on Human Settlement Design.
Boshoff, LP, Childs, RC and Roberts, L. 2009. Guidelines for Infrastructure Asset Management in Local Government 2006–2009. Pretoria: Department of Provincial and Local Government.
Boshoff L, Fourie W and Childs R. 2011. Report on the Impacts of the MSDF Proposals: A focus on densification targets in relation to housing products, the need to create viable commuter mass for public transportation and the capital cost of infrastructure and amenities’ provision. Ekurhuleni Metropolitan Municipality. 15 November 2011.
City of Cape Town. 2009. Cape Town Densification Strategy: Technical Report. Cape Town: City of Cape Town. http://tinyurl.com/a2aqkpa.
ReFeRences
119
Re
Fe
Re
nc
es
STA
TE
OF
CIT
Y F
INA
NC
ES
20
13
City of Cape Town Metropolitan Municipality. 2012. Built Environment Performance Plan (BEPP) 2012/13, pp. 27–28.
City of Johannesburg Metropolitan Municipality. 2011. Built Environment Performance Plan: Building Sustainable Human Places in the City of Johannesburg 2011–2015, p. 28.
DoHS (Department of Human Settlements). 2009. The National Housing Code. Part 3 Subsidy Quantum (Volume 5), p. 5.
eThekwini Metropolitan Municipality. 2012. Built Environment Performance Plan 2012/13: Submission for the Urban Settlements Development Grant. Final. 01 June 2012, pp. 39, 47–48.
Hodson, M and Marvin, S. 2009. ‘Urban Ecological Security: A New Paradigm?’ International Journal of Urban and Regional Research, 33(1), pp. 193–215.
Mangaung Metropolitan Municipality. 2012. Urban Settlement Development Grant: Built Environment Performance Plan 2012/2013. Fourth Revision: 30 May 2012, pp. 16 and 76.
Nelson Mandela Bay Metropolitan Municipality. 2012. Urban Settlements Development Grant. 2012/13 Submission.
Schwab, K, 2010. The Global Competitiveness Report 2010-2011. Geneva, Switzerland: World Economic Forum. ISBN-13: 978-92-95044-87-6, p. 303.
The Presidency. 2012. National Development Plan 2030: Our Future Make it Work. Pretoria: The Presidency, pp. 118 and 124.
Tonkin, A. 2008. Sustainable Medium-Density Housing: A Resource Book. Cape Town: Development Action Group.

120120

A prerequisite for a green economy
is ‘smart public policy and innovative financing
mechanisms’
121
STA
TE
OF
CIT
Y F
INA
NC
ES
20
13
The case for a green economy in cities
Since 2008 the green economy has captured the focus of international agencies, politicians and multi-national companies. The concept has been touted as a means of achieving ‘sustainable development’, rather than a substitute for it (OECD 2011, UNEP 2011, World Bank 2012), but much of the enthusiasm for the green economy has been borne out of frustration with the inability of sustainable development to gain traction in economic and legal systems (Sagoff 2012).
Significant green economy attention is on cities, which are responsible for over 80% of global resource consumption and pollution (Satterthwaite et al. 2009) and an increasing proportion of the global economy. The social and ecological risks associated with current economic activity coalesce and amplify in cities. At the same time cities contain a concentration of ideas, financial capital and human resources, and developing country cities in particular, with their focus on infrastructure and services, offer great potential for mobilising the green economy. Prominent cities around the world have begun competing for profile, markets and investment associated with the green economy. South African cities need to understand the concept – its origins, strengths and weaknesses – and to identify how it can contribute to local priorities. This is relatively easy. More difficult is to respond to this understanding with a process that transitions local economies towards a credible notion of the green economy.
At a local level, much of the challenge relates to finance: a green economy may present the potential for higher levels of growth, more employment and less carbon dioxide (CO2), but a naïve attempt to embrace such an economy could exacerbate pre-existing urban inequality, structural poverty and poor fiscal planning, and render a municipality bankrupt. A prerequisite for a green economy is ‘smart public policy and innovative financing mechanisms’ (UNEP, 2011). However, in many developing countries, bullish green economy advocates may underestimate the upfront costs, foregone economic growth and technology risks associated with a transition to a green economy, not to mention the fiscal constraints under which cities operate (Resnick et al. 2012). Low gross domestic product (GDP) per capita, low urban population densities and perceived risk already make it difficult to construct the type of financing model that would allow African cities to build conventional service delivery infrastructure (Benerjee and Morella 2011). For cities, financing the green economy infrastructure represents a profound challenge, one that necessitates both conceptual and financial innovations.
cHAPTeR 5
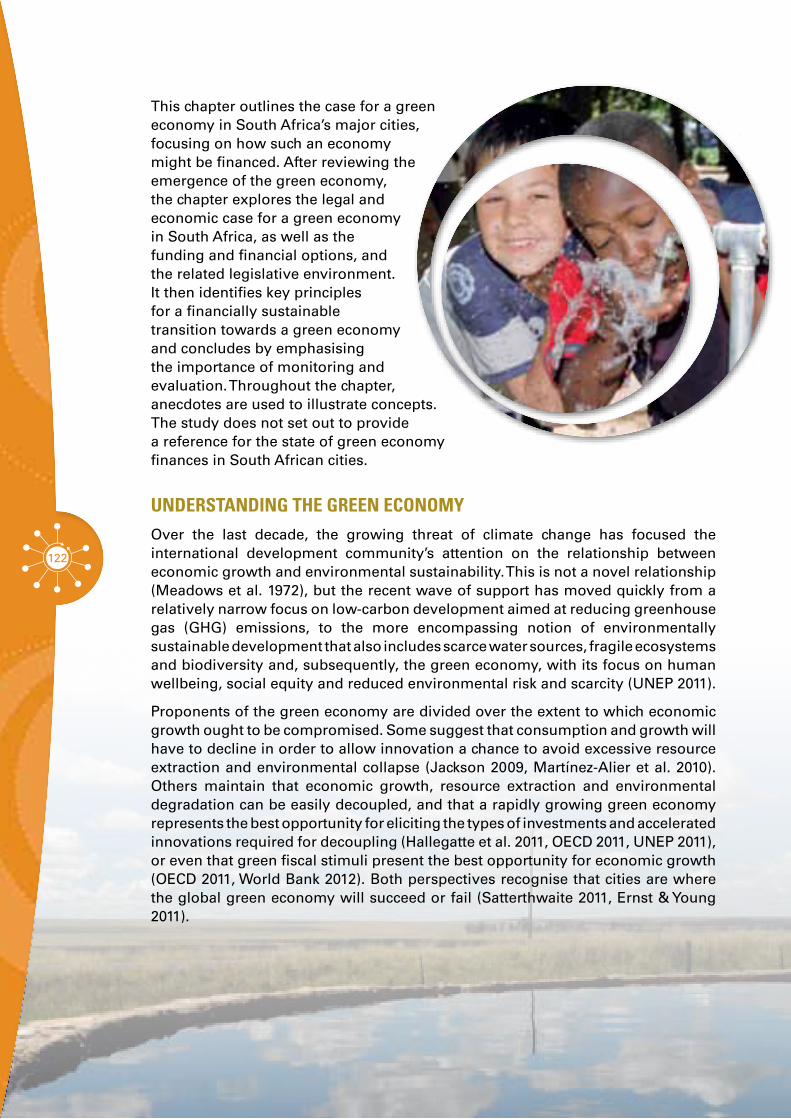
122
This chapter outlines the case for a green economy in South Africa’s major cities, focusing on how such an economy might be financed. After reviewing the emergence of the green economy, the chapter explores the legal and economic case for a green economy in South Africa, as well as the funding and financial options, and the related legislative environment. It then identifies key principles for a financially sustainable transition towards a green economy and concludes by emphasising the importance of monitoring and evaluation. Throughout the chapter, anecdotes are used to illustrate concepts. The study does not set out to provide a reference for the state of green economy finances in South African cities.
understAnding the green economyOver the last decade, the growing threat of climate change has focused the international development community’s attention on the relationship between economic growth and environmental sustainability. This is not a novel relationship (Meadows et al. 1972), but the recent wave of support has moved quickly from a relatively narrow focus on low-carbon development aimed at reducing greenhouse gas (GHG) emissions, to the more encompassing notion of environmentally sustainable development that also includes scarce water sources, fragile ecosystems and biodiversity and, subsequently, the green economy, with its focus on human wellbeing, social equity and reduced environmental risk and scarcity (UNEP 2011).
Proponents of the green economy are divided over the extent to which economic growth ought to be compromised. Some suggest that consumption and growth will have to decline in order to allow innovation a chance to avoid excessive resource extraction and environmental collapse (Jackson 2009, Martínez-Alier et al. 2010). Others maintain that economic growth, resource extraction and environmental degradation can be easily decoupled, and that a rapidly growing green economy represents the best opportunity for eliciting the types of investments and accelerated innovations required for decoupling (Hallegatte et al. 2011, OECD 2011, UNEP 2011), or even that green fiscal stimuli present the best opportunity for economic growth (OECD 2011, World Bank 2012). Both perspectives recognise that cities are where the global green economy will succeed or fail (Satterthwaite 2011, Ernst & Young 2011).
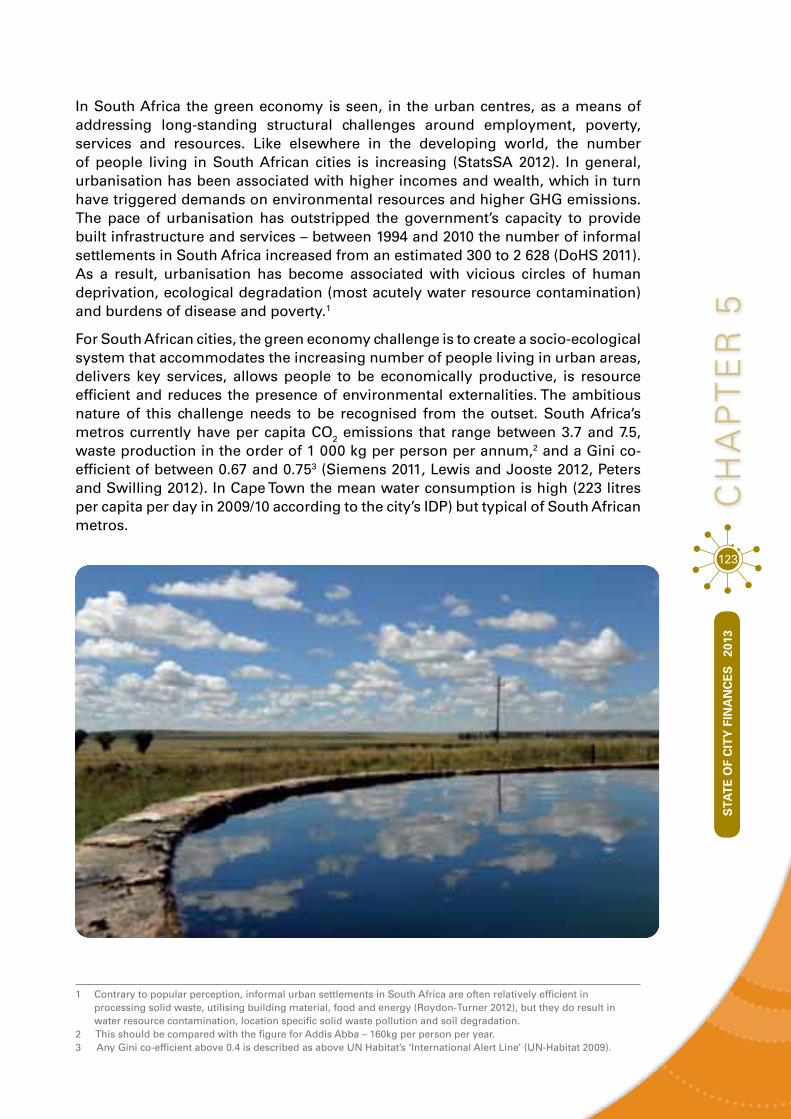
123
cH
AP
Te
R 5
STA
TE
OF
CIT
Y F
INA
NC
ES
20
13
In South Africa the green economy is seen, in the urban centres, as a means of addressing long-standing structural challenges around employment, poverty, services and resources. Like elsewhere in the developing world, the number of people living in South African cities is increasing (StatsSA 2012). In general, urbanisation has been associated with higher incomes and wealth, which in turn have triggered demands on environmental resources and higher GHG emissions. The pace of urbanisation has outstripped the government’s capacity to provide built infrastructure and services – between 1994 and 2010 the number of informal settlements in South Africa increased from an estimated 300 to 2 628 (DoHS 2011). As a result, urbanisation has become associated with vicious circles of human deprivation, ecological degradation (most acutely water resource contamination) and burdens of disease and poverty.1
For South African cities, the green economy challenge is to create a socio-ecological system that accommodates the increasing number of people living in urban areas, delivers key services, allows people to be economically productive, is resource efficient and reduces the presence of environmental externalities. The ambitious nature of this challenge needs to be recognised from the outset. South Africa’s metros currently have per capita CO2 emissions that range between 3.7 and 7.5, waste production in the order of 1 000 kg per person per annum,2 and a Gini co-efficient of between 0.67 and 0.753 (Siemens 2011, Lewis and Jooste 2012, Peters and Swilling 2012). In Cape Town the mean water consumption is high (223 litres per capita per day in 2009/10 according to the city’s IDP) but typical of South African metros.
1 Contrary to popular perception, informal urban settlements in South Africa are often relatively efficient in processing solid waste, utilising building material, food and energy (Roydon-Turner 2012), but they do result in water resource contamination, location specific solid waste pollution and soil degradation.
2 This should be compared with the figure for Addis Abba – 160kg per person per year. 3 Any Gini co-efficient above 0.4 is described as above UN Habitat’s ‘International Alert Line’ (UN-Habitat 2009).
124
TaBLe 5.1 Green economy indicators for South African metros
Pop
ula
tio
n1
eco
no
mic
gro
ss
valu
e ad
d (
GV
a)
R m
illio
n (
2011
)
en
ergy
bal
ance
(G
igaj
ou
le/a
nn
um
)1
en
ergy
bal
ance
per
ca
pit
a1
ele
ctri
city
use
per
an
nu
m (
kilo
wat
t h
ou
rs k
Wh
)1
en
ergy
-rel
ated
to
ns
of
cO
2 p
er c
apit
a1
Gin
ico
-effi
cien
t²
Buffalo City
724 308 R41,839 21 430 786 29.587946 1 293 287 259 3.7 0.75
Cape Town 3 497 097 R276,044 127 645 128 36.500311 13 504 156 356 5.9 0.67*
Ekurhuleni 2 724 227 R225,071 109 679 907 40.260928 15 513 210 926 7.7 0.74
eThekwini 3 468 087 R217,872 123 705 214 35.6695821 10 933 396 114 5.2 0.72
Johannes-burg
3 888 182 R689,667 142 612 254 36.6783895 14 593 279 736 5.8 0.75
Mangaung R34,511 0.74
Msunduzi 616 733 R46,618 3 484 701 5.6502587 1 792 294 124 5.7 0.73
Nelson Mandela
1 050 934 R60,642 32 191 176 30.6310158 3 095 153 203 4.7 0.72
Tshwane 2 345 909 R245,173 104 513 830 44.5515278 11 814 438 718 7.5 0.72
1 Source: Sustainable Energy Africa. 2011,State of Energy in South African Cities 2011, http://www.cityenergy.org.za/files/resources/energy%20data/State_of_energy_2011.pdf
² Source: UN-Habitat. 2011. State of the World’s Cities 2010/2011: Bridging the Urban Divide (data from 2005) http://www.unhabitat.org.jo/en/inp/Upload/2233036_pages%20from%20Report-Englishrd-2.pdf.
* In a recent economic growth strategy Cape Town claimed that its 2013 Gini co-efficient had improved to 0.58 (Atwell, 2013).

STA
TE
OF
CIT
Y F
INA
NC
ES
20
13
125
cH
AP
Te
R 5
Figure 5.1 shows the relatively low levels of economic value created in South African cities per unit of CO2 emitted, which is a function of energy profligacy, spatial form and the use of coal as an electricity feedstock.
FiGURe 5.1 Economic value (GVA) created per ton of CO2 emitted for South African metros (2011 prices)
0,00
0,05
0,10
0,15
0,20
0,25
R m
illio
n
Joha
nnesb
urg
Cape T
own
eThe
kwini
Tshwan
e
Ekurhu
leni
Nelson
Man
dela
Manga
ung*
Buffalo
City
Msundu
zi
Source: Sustainable Energy Africa. 2011. State of Energy in South African Cities 2011, http://www.cityenergy.org.za/files/resources/energy%20data/State_of_energy_2011.pdf and author’s own calculations. (* no data available for Mangaung)
Environmental pollution in South African cities currently tracks economic growth and affluence, a correlation that reveals just how embedded resource intensity and environmental damage is in the economy. Therefore, South African cities, in pursuing a green economy, will require major structural economic reform. Certainly, South Africa cannot hope to attain a credible green economy based on a few additional businesses, while leaving the core of its economy unchanged.
BOx 5.1 Johannesburg – pikitup’s trash to treasure
In October 2012, Pikitup commenced a trash-to-treasure project. By February 2013, the project had assisted residents to accumulate 1 107 tons of recyclables and created more than 100 new permanent jobs in Soweto and Diepsloot through buy-back centres managed by independent cooperatives. The Mayoral project encourages residents to recycle household refuse, and promotes job creation, as recyclable waste is exchanged for money. The project commenced in the Waterval area, and was rolled out to Zondi-depot serviced areas, Diepsloot and Orange Farm.
Pikitup.2013. Positive Impact of Trash to Treasure Project, http://www.pikitup.co.za/jit_default_1324.html.
STA
TE
OF
CIT
Y F
INA
NC
ES
20
13

126
A greater recognition of the value of the environment in budget allocations is central to developing a green economy. This does not imply increasing resources for conservation and environmental departments, but rather reflecting what is known about the environment in all budgets and economic decisions. To date this has proven difficult:•• A 2009 study estimated the value of Cape Town’s natural resources at
R43–R81 billion, and the goods and services provided by these assets to be worth between R2 billion and R6 billion per annum (De Wit et al. 2009).
•• In 2003 a similar study in Durban valued environmental goods and services at R3.1 billion.
•• An evaluation of the Kusile and Medupi coal-fired power stations put the externality cost (chiefly land, health, water and climate change) at R30 billion per annum.4
•• The risk of sea-level rise and storm surge to Cape Town’s coastline has been estimated at between R4.9 and R20.2 billion between 2008 and 2033 (Cartwright 2008).
The challenge – and indeed opportunity – is not only to reflect environmental value in local economic decisions and budgets but to do so in a manner that addresses key issues of unemployment, social exclusion and the fiscal crisis, which define South African cities.
Studies confirm that the green economy tends to be more labour intensive than an industrial economy (see Table 5.2 for a summary), but the types of jobs created must match the skill sets and geography of those people seeking employment. Projects – such as Johannesburg’s Pikitup waste collection and recycling (see Box 5.1), Cape Town’s Kader Asmal river rehabilitation programme and eThekwini’s greening initiative – have shown that green economy projects have the potential to provide considerable low-skilled employment near to where people live (and linked to a sense of place). In addition these jobs are relatively unthreatened by the vagaries of global market shifts, in comparison (for example) to employment in the clothing and textile industry. In brief, the green economy has the potential to provide precisely the type of jobs that unemployed people in South Africa require and can access.
4 These costs have been disaggregated and documented in a series of papers in the South African Energy Journal (2012) Volume 23 (4).
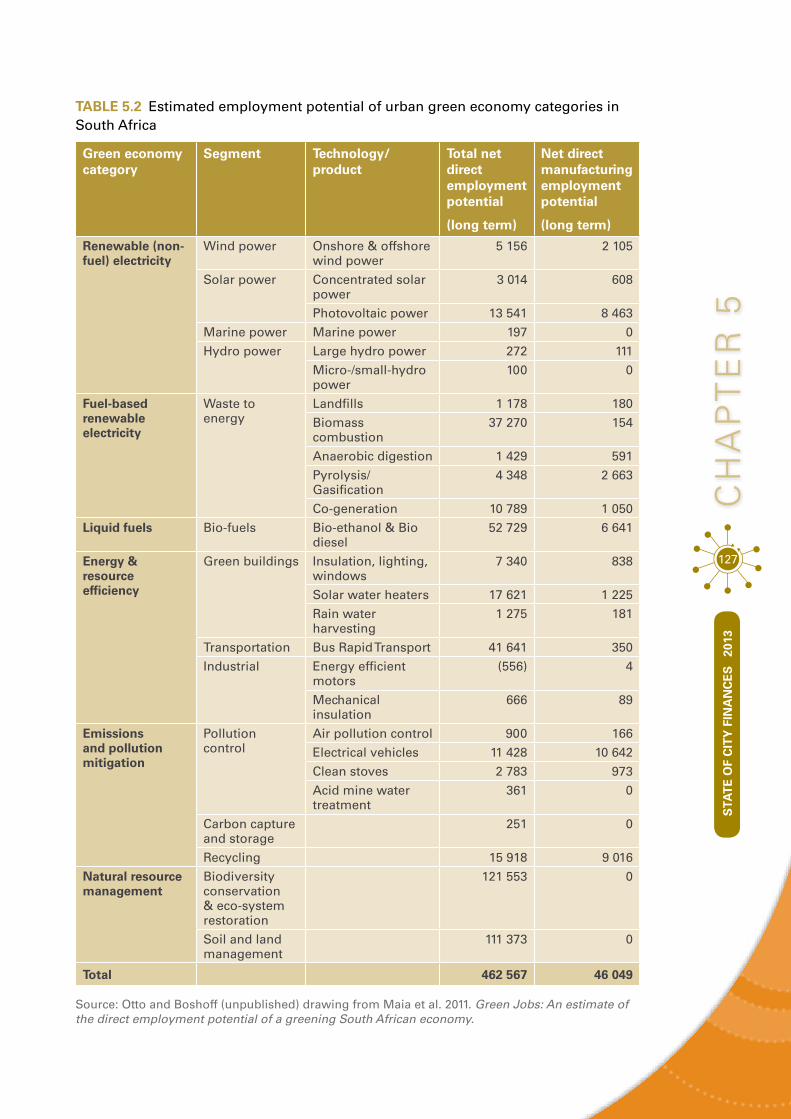
127
cH
AP
Te
R 5
STA
TE
OF
CIT
Y F
INA
NC
ES
20
13
TaBLe 5.2 Estimated employment potential of urban green economy categories in South Africa
Green economy category
segment Technology/product
Total net direct employment potential
(long term)
net direct manufacturing employment potential
(long term)
Renewable (non-fuel) electricity
Wind power Onshore & offshore wind power
5 156 2 105
Solar power Concentrated solar power
3 014 608
Photovoltaic power 13 541 8 463
Marine power Marine power 197 0
Hydro power Large hydro power 272 111
Micro-/small-hydro power
100 0
Fuel-based renewable electricity
Waste to energy
Landfills 1 178 180
Biomass combustion
37 270 154
Anaerobic digestion 1 429 591
Pyrolysis/Gasification
4 348 2 663
Co-generation 10 789 1 050
Liquid fuels Bio-fuels Bio-ethanol & Bio diesel
52 729 6 641
energy & resource efficiency
Green buildings Insulation, lighting, windows
7 340 838
Solar water heaters 17 621 1 225
Rain water harvesting
1 275 181
Transportation Bus Rapid Transport 41 641 350
Industrial Energy efficient motors
(556) 4
Mechanical insulation
666 89
emissions and pollution mitigation
Pollution control
Air pollution control 900 166
Electrical vehicles 11 428 10 642
Clean stoves 2 783 973
Acid mine water treatment
361 0
Carbon capture and storage
251 0
Recycling 15 918 9 016
natural resource management
Biodiversity conservation & eco-system restoration
121 553 0
Soil and land management
111 373 0
Total 462 567 46 049
Source: Otto and Boshoff (unpublished) drawing from Maia et al. 2011. Green Jobs: An estimate of the direct employment potential of a greening South African economy.

128
legislAtive FrAmeWork For green economy FinAnceIn South Africa, local government’s constitutional mandates to ensure the socio-economic wellbeing of local communities and a safe and accessible environment, creates the broad case for a city-based green economy effort. This mandate was codified in the Municipal Systems Act (South Africa 2003) and picked up in the National Strategy for Sustainable Development and Action Plan 2011–2014 (South Africa 2011a), New Growth Path (South Africa, 2011b) and National Development Plan 2030 (NPC 2012).
In general, South Africa’s environmental policies5 and economic growth strategies are sophisticated and well crafted, but local governments struggle with implementation. Part of the problem is that economic governance represents a relatively new local government mandate. Before the Municipal Systems Act in 2000, municipalities were chiefly preoccupied with providing services such as water, electricity and refuse removal to the city’s rate-paying suburbs. The expansion of responsibilities in 2000 was ambitious, even for South Africa’s relatively well-resourced metropolitan municipalities. A mature civil service acting within a well-defined economic strategy (which are not features of South African municipalities) would have found it difficult to strike the correct balance between continuing to provide high-quality services to relatively affluent rate-paying suburbs and extending new services to expanding informal and low-cost suburbs typically located on the city’s periphery. In South Africa’s relatively new metropolitan municipalities, the majority of city officials have a poor understanding of concepts such as public and private goods, environmental externalities, fiscal strategy, urbanisms and
5 Including, for example, the National Water Act (1998) and the National Environmental Management Act (2003).

STA
TE
OF
CIT
Y F
INA
NC
ES
20
13
129
cH
AP
Te
R 5
the crowding-in of private sector investment, all of which might be considered critical to ensuring an urban green economy. The result is an inability to change and the lock-in of existing economic modalities, an intransigence that is defended in a number of ways.
Three common reasons why cities avoid budgeting for a green economy are:i. The environment is a
provincial, not a local, government responsibility.
ii. The environment should not be prioritised at the expense of economic development.
iii. The Municipal Finance Management Act (MFMA) does not permit the type of innovation required to enable a green economy.
The concept of a green economy effectively deals with the first two reasons. By emphasising the environment as prerequisite for sustained economic activity and the costs and risks (especially for poorer communities) that result from environmental degradation, the green economy ensures that local governments have to consider the environment in their responsibility for human wellbeing.
The MFMA is potentially more challenging. The legislation was designed to ensure financial accountability, and under the Act ‘unlawful expenditure’ can result in a criminal charge. The Act also encourages public procurement to look for the ‘lowest cost’ options, which makes the transfer of state assets into private hands difficult, and restricts public-private partnerships to three years unless a case for significant ‘financial or economic benefit’ can be made in support of a longer period. While these are reasonable requirements of a piece of public finance legislation, the threat of criminality in conjunction with the perception that the legislation is onerous, and the lack of local capacity and precedent for economic governance at the local level, combine to stifle innovation and to blunt the instrument of fiscal strategy (De Visser 2012). This in turn, has profound implications for the financing of a green economy. In politically contested local governments, the risk of a potential breach of the MFMA is at best a conservative influence on economic governance and, at worst, a convenient excuse for inaction.
STA
TE
OF
CIT
Y F
INA
NC
ES
20
13

130
pAying For A green economyMany green economy options require some form of trade-off or upfront cost. For South African municipalities in particular, the drive for energy efficiency and household-scale renewable energy poses the challenge of foregone revenue from electricity sales. For the larger metros the revenue from electricity sales amounts to R7–R9billion per annum, with at least 10% profit margin for municipalities once bulk electricity and local grid servicing costs have been accounted for. Under the national public finance legislation, municipalities in South Africa are not permitted to run deficit budgets in the same way as national government. For this reason, measures that impose revenue loss, or require upfront investments, are inherently unattractive to local governments.
The Green Growth Action Alliance (WEF 2012) has estimated that a global green economy would require US$700 million more than business as usual. Although less than many other estimates (UNEP put this figure at US$34 billion in 2011) and significantly less than the cost of damage incurred in the absence of such a transition (World Bank 2010, 2013), this money nonetheless has to be found or motivated for in a fiscally constrained environment. It is easy to talk about the links between “green” and “growth” and the employment and investment benefits of a green economy, but at a local scale the embracing of a green economy in the South African context requires a financing plan that:•• Supports a transition from the current economic state to one that is less
carbon intensive and more resource efficient.•• Uses this transition to generate economic growth that is not only more
environmentally sustainable but also addresses the underlying social challenges of poverty and inequality.
•• Remains within the fiscal and financing guidelines required by good governance and, ideally, alleviates existing financing and service delivery constraints.
However, it is also true that not all green economy options carry the same financial obligation. What can be useful is to distinguish three categories of options based on their financing implications.

131
cH
AP
Te
R 5
STA
TE
OF
CIT
Y F
INA
NC
ES
20
13
Three categories of green economy options
Some options deliver an environmental benefit while also saving money immediately. Typically these options involve a simple change in behaviour that results in a cost saving and an environmental benefit. Examples include avoiding:•• Heating water in government buildings that do not require hot water.•• Burning street lights during the day.•• Transporting solid waste in vehicles that are only half full.•• Offering perverse subsidies for water-intensive activities or coal-fired
electricity consumption.
These options do not require financing, although clearly not all of them involve additional expenditure, and some can save costs.
A second category of options requires no additional expenditure but relies on relocating the existing budget in order to achieve a green economy outcome. The key is a public expenditure review that focuses on impact and efficiency instead of simply expenditure (as is the norm in South Africa). Many of these options involve choosing an innovation or technology capable of providing the same level of service – or in some instances a superior service – at a lower cost than the existing technology, with lower maintenance requirements and significantly reduced environmental impact. Examples include: •• Substituting employee parking fees with public transport vouchers.•• Instigating a waste collection and sorting service instead of a further roll-out
of the wheelie-bin and heavy-duty vehicle collection service.•• Using composting toilets and community bio-digesters instead of extending
water-intensive reticulated sewerage systems to remote communities.•• Paying for solar energy technology and localised smart-grids (with possible
gas complements) instead of trying to stretch the electricity grid to small numbers of people located on the urban periphery.
These examples are green economy substitutes to existing services and products that simultaneously reduce the environmental impact. Incidentally many of these options also mean higher levels of employment. In this category of options, the main challenge is managing the technology choice and transition.
The third category involves products and options that depend on additional upfront expenditure in order to realise a subsequent financial benefit, risk reduction or economic growth benefit. Examples include: •• Solar water heaters, which require an upfront investment of R6,000–R18,000
but save the owners the cost of electricity used for water heating, reduce CO2 emissions and the need for new power plants, and increase energy security.
•• Efficient public transport that requires expensive investments in infrastructure and vehicles, but can save commuters time and money, reduce vehicle emissions and congestion, and improve South Africa’s balance of payments by cutting the need for the liquid fuel imports that constitute South Africa’s largest import by value.
•• The preservation of wetlands and riparian zones, which not only reduces the cost of purifying urban water supplies but can also reduce the impact of urban flooding, which is projected to become more severe under climate change.
These options depend most on financing or budgeting solutions.

132
BOx 5.2 eThekwini waste to energy – electricity generation from landfill methane
eThekwini’s landfill gas-to-energy project required significant upfront investment but has the potential to save the municipality over the long term. Methane gas from two landfill sites – Bisasar Road and Mariannhill – is combusted and used to generate energy, exporting 10 megawatts (MW) to the local grid and supplying 10 000 homes. Electricity is sold to the eThekwini municipality under a power purchasing agreement. Although generation from landfill costs 66% more than conventional generation, carbon financing through the World Bank administered Prototype Carbon Fund (a private partnership of several countries’ governments and companies) makes up the difference. Some of the benefits to eThekwini include: monthly savings of R750,000; an energy supply not reliant on the national grid; carbon reduction of approximately 280 000 tons per year; improved air quality; and job creation. By July 2012, eThekwini had generated R65 million worth of electricity from its two landfill gas-to-energy projects. It is expected that the feasibility of these projects will improve as electricity prices rise. In December 2012, KPMG identified the project as one of the world’s most exciting infrastructure projects.
Sources: ESI-Africa. 2012. KwaZulu-Natal waste to energy project wins accolade, 22 December, http://www.esi-africa.com/node/15829.
Sustainable Energy Africa. 2011. State of Energy in South African Cities 2011, City Energy Support Unit of Sustainable Energy Africa, Cape Town, http://www.cityenergy.org.za/files/resources/energy%20data/State_of_energy_2011.pdf.
Urban Earth. 2012. Slow uptake of landfill gas to energy projects in South Africa, 16 July, http://urbanearth.co.za/articles/slow-uptake-landfill-gas-energy-projects-south-africa.
Public-private financing partnerships
The private sector, with its considerable resources and land ownership, has a critical role to play in the transition towards a green economy in South Africa’s cities. Commercial incentives for companies to engage the green economy are emerging. Globally, private sector investment in the renewable energy sector was US$200 billion in 2010 (UNEP 2011). However, not all green economy options are as well-structured for the private sector as the renewable energy market. Left to their own devices, businesses and the market are likely to prove insufficient to the green economy challenge presented by both bio-physical threats and social needs. Much of the environmental collapse and structural poverty that threaten South Africa’s cities emanate from market failures.6 The reasons for these market failures
6 Market failure is the inability of the market to factor in the full cost or benefit of a particular transaction or action, and the associated misallocation of resources around that transaction.
STA
TE
OF
CIT
Y F
INA
NC
ES
20
13
133
cH
AP
Te
R 5
include uncertainty and imperfect information of costs and benefits, externalities and collective action disincentives as exemplified in the ‘tragedy of the commons’ (Hardin 1968). Due to market failure, the conventional model of project finance has proved unreliable, and public sector leadership in green economy finance is necessary. In a mature financial environment, state-supported Development Finance Institutions (DFIs) might look to address these market failures and enable access for the private sector. This has not happened to any significant degree in South Africa. A notable feature of South Africa’s finance sector is the lack of distinction in lending rates between DFIs and commercial finance institutions.
In the absence of well-directed concessionary finance from DFIs, the burden for correcting the market failures and enabling green economy finance falls to the fiscus, which need not be detrimental. In African cities an average of 35% of GDP is made up of government procurement (IISD 2012), and this spend is capable of having a significant impact on the nature of urban economies. However, effective fiscal strategy, and the associated crowding-in of private sector finance, would require a substantial public expenditure review. Such reviews are not (yet) the norm for South African municipalities, where 83% of the metropolitan municipalities’ total expenditure is on operating costs – salaries, building rental and services and projects and programmes – and very difficult to alter (FFC 2012). So, while national government expenditure on ‘environmental protection’ increased by an average of 11% per annum between 2008 and 2011, it did not constitute the radical transition required to introduce a green economy at the local level. For this to happen, cities would have to prepare a collection of green economy projects, formulate budgets for them, include them in Integrated Development Plans (IDPs) and have them ready to implement on 1 July, start of the local government financial year. City budget allocation processes tend to be the preserve of a few senior city officials in South Africa, but equally too few proponents of a green economy in South Africa (both within and outside of city governments) are sufficiently familiar with the IDP and medium-term budgeting processes to prepare and package suitable projects so as to ensure effective use of operating expenditure.
STA
TE
OF
CIT
Y F
INA
NC
ES
20
13

134
Capital budgets represent a smaller, but important, component of fiscal strategy. The layout and design of urban capital expenditure mediate the relationship between people and the natural environment and also affect operating budget requirements. In general, South African metros have under-invested in infrastructure: collectively, private and public investment in infrastructure has fallen from 30% of GDP in the 1980s to less than 16% of GDP in 2011. At the same time, the relative contribution of private and public infrastructure has widened, with private sector investment out-stripping public expenditure on capital goods. South African metros require an additional investment of R30 billion per year over the next seven years to address backlogs (FFC 2012). The under-expenditure has its most acute impact on the poor and in the environment, and contributes to the vicious circle between poverty and degradation.7 A green economy will not only require additional expenditure on capital but also new approaches to municipal capital, to ensure a greater complementarity between the built environment and natural environment. The emerging evidence shows that not only does the natural environment generate valuable ecosystem goods and services such as flood buffers, erosion prevention, water purification and temperature mediation to cities (De Wit et al. 2012) but also, where it complements the natural environment, built infrastructure requires less maintenance, lasts longer and delivers a higher level of service (Grieve 2013). Therefore, as South Africa prepares to invest R4 trillion in infrastructure over the next 15 years (NPC 2012), for this investment (not to mention a green economy) to be viable, the expenditure must complement the existing ecological infrastructure and enhance (not undermine) the services provided by the natural environment. It is equally essential to a green economy that the allocation of capital budgets for the creation of infrastructural assets reduces the current intensity of energy consumption by increasing urban density, improving the energy efficiency of buildings and enabling public transport.
FiGURe 5.2 Real capital expenditure in South Africa’s metros by sector, 2003–2013
0%2005/06 2006/07 2007/08 2008/09 2009/10 2010/11 2011/12 2012/13
5%
10%
15%
20%
25%
30%
35%
40%
45%
50%
ElectricityHousingRoads and Storm-waterWater and Sanitation
Source: Fiscal and Financial Commission (2012)
7 A 2009 World Bank study identified the need in South Africa for R500 billion per year over the ensuing 10 years to address the backlog: R180 billion for new infrastructure, R80 billion to meet existing backlogs and (tellingly) R240 billion for rehabilitation of existing infrastructure.
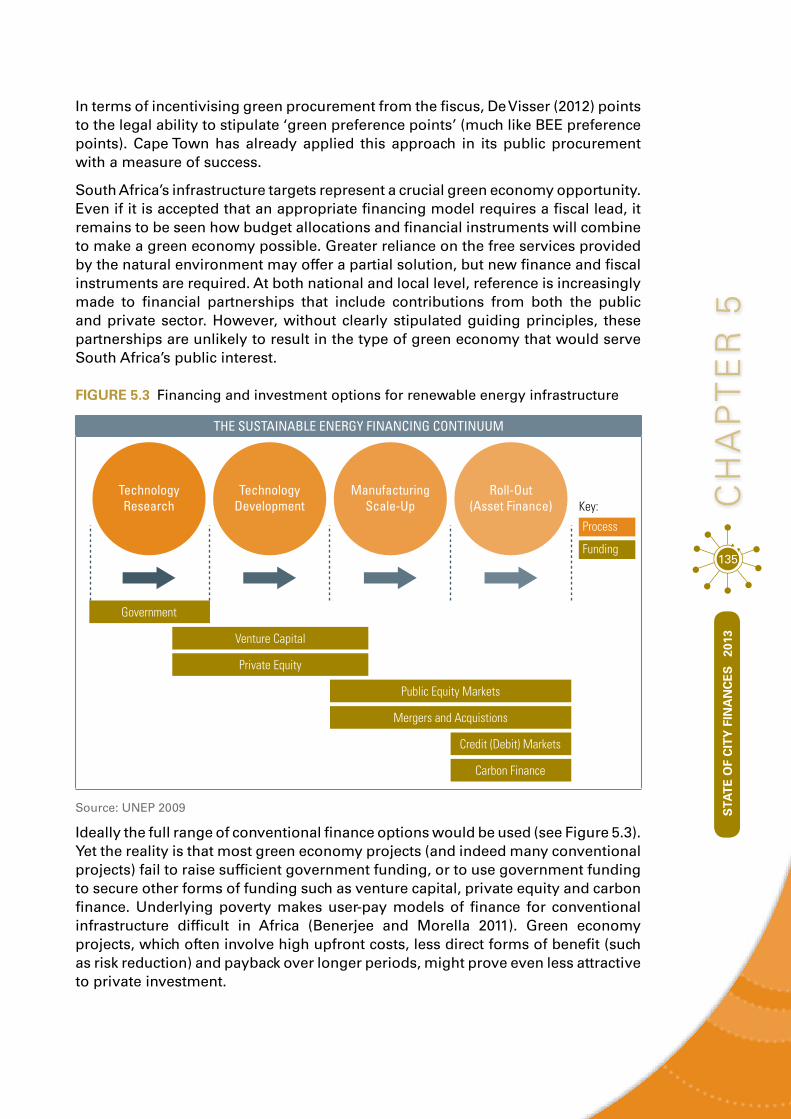
135
cH
AP
Te
R 5
STA
TE
OF
CIT
Y F
INA
NC
ES
20
13
In terms of incentivising green procurement from the fiscus, De Visser (2012) points to the legal ability to stipulate ‘green preference points’ (much like BEE preference points). Cape Town has already applied this approach in its public procurement with a measure of success.
South Africa’s infrastructure targets represent a crucial green economy opportunity. Even if it is accepted that an appropriate financing model requires a fiscal lead, it remains to be seen how budget allocations and financial instruments will combine to make a green economy possible. Greater reliance on the free services provided by the natural environment may offer a partial solution, but new finance and fiscal instruments are required. At both national and local level, reference is increasingly made to financial partnerships that include contributions from both the public and private sector. However, without clearly stipulated guiding principles, these partnerships are unlikely to result in the type of green economy that would serve South Africa’s public interest.
FiGURe 5.3 Financing and investment options for renewable energy infrastructure
THE SUSTAINABLE ENERGY FINANCING CONTINUUM
Key:
Government
Credit (Debit) Markets
Carbon Finance
Funding
Process
Venture Capital
Private Equity
Public Equity Markets
Mergers and Acquistions
TechnologyResearch
TechnologyDevelopment
ManufacturingScale-Up
Roll-Out(Asset Finance)
Source: UNEP 2009
Ideally the full range of conventional finance options would be used (see Figure 5.3). Yet the reality is that most green economy projects (and indeed many conventional projects) fail to raise sufficient government funding, or to use government funding to secure other forms of funding such as venture capital, private equity and carbon finance. Underlying poverty makes user-pay models of finance for conventional infrastructure difficult in Africa (Benerjee and Morella 2011). Green economy projects, which often involve high upfront costs, less direct forms of benefit (such as risk reduction) and payback over longer periods, might prove even less attractive to private investment.

136
Options that are in use, and which could be enhanced, include:
Bond finance
Internationally the “green bond” market is worth US$86–US$174 billion per year. South Africa’s re-insurance companies and pension funds are an under-utilised source of bond finance, particularly the state pensions held by the Public Investment Corporation (PIC). Re-insurers and pension fund holders have a vested interest in reducing the types of systemic risk related to environmental collapse and social instability that a green economy aims to tackle.
It seems reasonable that major fund managers should be investing in well-planned green economy initiatives, which demonstrate their ability to remove long-term risk, at rates that reflect the incremental benefits to their balance sheets and business models that ensue from these investments. In other words, at concessionary rates that impute their company’s benefit from the associated risk reduction.
Carbon finance
Worth US$86–US$174 billion annually, the global carbon market’s intention is to marshal investment in greenhouse gas abatement and sequestration to the point of lowest marginal emissions abatement. This is an elegant concept, which has suffered under UN bureaucracy and the inherent difficulty of measuring when a ton of CO2 has actually been avoided or sequestrated relative to what would have happened in the absence of the carbon-trading project.
South African municipalities have engaged the carbon market with varying degrees of success. The eThekwini landfill methane-flaring projects (see Box 5.2) did generate revenue, based on a forward payment, but struggled to have their emissions savings and the process leading to these savings adequately verified. The Kuyasa housing energy retrofit project (the first project to be certified by the Gold Standard carbon registry in the world) has struggled to generate sufficient carbon revenue to make a case for continued roll-out of the solar water heaters, insulated ceilings and energy efficient light bulbs that reduce emissions. Smaller municipalities in South Africa have had some success in securing carbon finance in the voluntary market off the back of government expenditure in bioethanol gel for households (in Umdoni) and community recycling projects in Cape Town.8
8 Both of these projects secured carbon finance through the South African based Credible Carbon voluntary market registry.

STA
TE
OF
CIT
Y F
INA
NC
ES
20
13
137
cH
AP
Te
R 5
Transaction costs aside, from the more successful carbon-trading projects in South Africa, a key lesson is the importance of establishing clarity over the ownership of the credits. Ambiguity over who – between local municipalities, project developers, household owners (or tenants) or financiers – has legal rights to the carbon credits and any realised revenue undermined the 2Tribes Housing carbon project in Ekurhuleni (ERC 2011), and similar issues were experienced at the Kuyasa carbon-trading project in Cape Town.
Development finance
Given the presence of externalities and the green economy’s developmental potential, DFIs in South Africa, such as Development Bank of Southern Africa and the Industrial Development Corporation (IDC), should be actively supporting this economy. The PIC represents a potentially significant entrant to the development finance industry. Although the PIC receives no discretionary capital from government, it is wholly owned by government and acts as custodian of over R1.1 trillion worth of assets and all government employee pension funds. As such, the PIC has both the means and a vested interest in creating the type of cities that its clients will be able to retire in and ensuring the sustainability and liveability of these cities. Whether PIC will issue concessionary finance or bonds to ensure compliance with required sustainability principles remains to be seen, but by virtue of its scale, the PIC’s decision will influence the investment of other private finance companies, and this influence could be used to support a green economy.
guidelines For green economy FinAnceAny form of government intervention in the finance market, whether subsidy, financing concession or preferential procurement, is risky and prone to unforeseen consequences. The history of economic development suggests that governments have a crucial role to play in progressive economies, but their intervention risks harming rather than improving the economies. In order to promote accountability and alignment, municipalities require a set of guiding principles, linked to their core mandate, with which to evaluate fiscal and legislative options. To ensure that South Africa’s urban green economy accords with sensible economics and prudent public finance strategies, criteria that ought to be considered include:
Within mandate and addressing a significant market failure
Cities must define their specific role and influence if the urban green economy requires contributions from the private and public sector, different spheres of government and different types of finance. A distinction should be made between green economy efforts best suited to, and likely to be driven by, the private sector and those that, for reasons of market failure or because they involve public goods, require a state-driven initiative. Burger et al. (2012) delineate different forms of public and private goods for Cape Town’s green economy. They propose that the city’s role is that of an enabler for activities that lend themselves to private sector investment, such as constructing utility-scale renewable energy or installing solar water heaters in affluent households. The city sets (and ensures compliance with) the broad parameters in which the private sector delivers green economy goods and services.
STA
TE
OF
CIT
Y F
INA
NC
ES
20
13
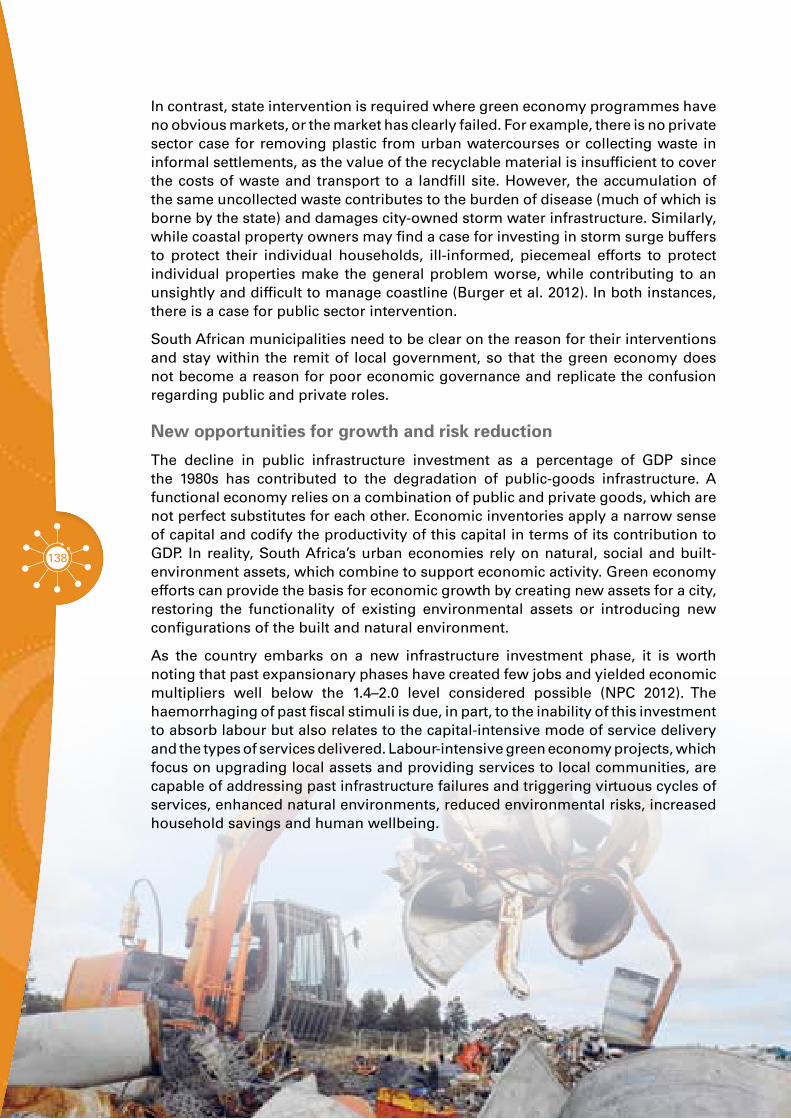
138
In contrast, state intervention is required where green economy programmes have no obvious markets, or the market has clearly failed. For example, there is no private sector case for removing plastic from urban watercourses or collecting waste in informal settlements, as the value of the recyclable material is insufficient to cover the costs of waste and transport to a landfill site. However, the accumulation of the same uncollected waste contributes to the burden of disease (much of which is borne by the state) and damages city-owned storm water infrastructure. Similarly, while coastal property owners may find a case for investing in storm surge buffers to protect their individual households, ill-informed, piecemeal efforts to protect individual properties make the general problem worse, while contributing to an unsightly and difficult to manage coastline (Burger et al. 2012). In both instances, there is a case for public sector intervention.
South African municipalities need to be clear on the reason for their interventions and stay within the remit of local government, so that the green economy does not become a reason for poor economic governance and replicate the confusion regarding public and private roles.
New opportunities for growth and risk reduction
The decline in public infrastructure investment as a percentage of GDP since the 1980s has contributed to the degradation of public-goods infrastructure. A functional economy relies on a combination of public and private goods, which are not perfect substitutes for each other. Economic inventories apply a narrow sense of capital and codify the productivity of this capital in terms of its contribution to GDP. In reality, South Africa’s urban economies rely on natural, social and built-environment assets, which combine to support economic activity. Green economy efforts can provide the basis for economic growth by creating new assets for a city, restoring the functionality of existing environmental assets or introducing new configurations of the built and natural environment.
As the country embarks on a new infrastructure investment phase, it is worth noting that past expansionary phases have created few jobs and yielded economic multipliers well below the 1.4–2.0 level considered possible (NPC 2012). The haemorrhaging of past fiscal stimuli is due, in part, to the inability of this investment to absorb labour but also relates to the capital-intensive mode of service delivery and the types of services delivered. Labour-intensive green economy projects, which focus on upgrading local assets and providing services to local communities, are capable of addressing past infrastructure failures and triggering virtuous cycles of services, enhanced natural environments, reduced environmental risks, increased household savings and human wellbeing.

139
cH
AP
Te
R 5
STA
TE
OF
CIT
Y F
INA
NC
ES
20
13
Employment and equity
South Africa has an employment crisis, which manifests in the cities as a growing number of people considered ‘unemployable’ by the private sector (Abedian 2012).9 While the long-term solution lies in education sector reform, it is an indictment of the current economy that when the economy does grow, it is unable to create the amount and types of employment that lift unemployed people out of poverty. The green economy has the potential to improve the mismatch10 and resulting market failure through a process of deliberate labour-intensive interventions aimed at enhancing natural and built-environment assets and improving the flow of services to local communities. Key to these services is that they are generated in or near communities, are insulated from price competition from emerging markets and return valuable economic goods and services to the city.
While the international literature points out that care for the environment is ultimately good for poverty alleviation (Cooke et al. 2010). South Africa requires a more direct link between the green economy and poverty alleviation. This link can be created by employing low-skilled residents to restore ecological assets and through projects that improve basic services at lower cost or reduced risk (through disaster risk reduction, social impacts or clear policy guidelines).
9 At the launch of the Western Cape’s Economic Development Partnership (26 April 2012) CEO of Pan African Holdings Dr Iraj Abedian stated: ‘We do not have an unemployment problem. We have an unemployability problem. Our system generates unemployability … So many people out there are unemployable, and someone has to account for that.’
10 Mismatch was the term used by the Fiscal and Financial Commission in their parliamentary briefing on unemployment (June 2012).
140
Fiscal efficiency
In the current fiscal environment, projects or programmes that can save the cities money are attractive. The green economy offers the potential to save costs through resource efficiency. Some of these savings are generated by drawing down goods and services on offer from the natural environment, including water purification and flood-buffering services provided by wetlands and riparian habitats, the storm-surge buffering services provided by coastal dunes, environmental amenities and renewable energy, and rain-fed water resources. The degradation of these “free” resources and services results in the need for more expensive alternatives, burdens the centrally coordinated provision of services and amplifies the impact of natural disasters. Other savings arise from devolving service delivery responsibilities away from centrally coordinated energy, water, sanitation and waste utilities that are locked into rising commodity prices, towards household and community-operated service models.
Opportunities also exist to attract private sector (including household) contributions as a complement to budget allocations.11 For example, cities’ efforts that address both social and ecological risk in a systemic manner remove the type of risk that insurance companies and pension funds struggle to manage, and improve the profitability of those companies. Where successful, city efforts that reduce systemic risk could – and should – solicit investment in exchange for the commercial benefit that they provide to the private sector. Similarly the sale of carbon credits off the back of the recycling activities of the Hout Bay Recycling Cooperative, established by the City of Cape Town, has seen private sector support for a community-based green economy project.
BOx 5.3 City of Cape Town retrofitting buildings
Cape Town has tapped the efficiency principle by applying donor funds to reduce electricity expenditure in government-owned buildings. The City of Cape Town’s own operations (street and traffic lights, buildings, pumping, fleet etc.) are responsible for 1.4% of Cape Town’s energy consumption and 2.2% of its electricity consumption. The city committed to reducing its energy consumption by 10%. Four large administration buildings (in Plumstead, Ottery, Fezeka and Durbanville) were retrofitted with energy efficient technology through a performance contract with an energy services company, funded by the Danish International Development Agency. The retrofits included installing efficient lighting and lighting controls, power factor correction units, solar water heaters and air conditioning thermostat controllers. The project will save 338 megawatt hours (MWh) per year across the four buildings (or 17% of the energy consumed in these buildings). The city also planned to have retrofitted all of its traffic lights with Light Emitting Diode (LED) technologies by September 2012, which would save 11 818 MWh per year. These energy efficiency projects are expected to save the City 22 747 MWh (or 22.7 million kWh) of electricity in total per year and reduce its carbon footprint by 22 747 tons of CO2.
City of Cape Town (2012), City focuses on improved energy efficiency within its operations, 6 August, http://www.capetown.gov.za/en/MediaReleases/Pages/Cityfocusesonimprovedenergyefficiencywithinitsoperations.aspx.
11 There is the suggestion that private sector investment in the green economy is currently struggling to find suitable allocations, but that firm commitments and demonstration from governments will yield investment (Zenghelis 2012).
STA
TE
OF
CIT
Y F
INA
NC
ES
20
13
141
cH
AP
Te
R 5
meAsuring A green economyA green economy requires innovation – and even some experimentation – and so the process must be subjected to monitoring and evaluation. In this context the distinction between mishaps, mistakes and violations is important. Mishaps and mistakes (provided they can be identified as such and remedied) are to be expected in the transition to a green economy, given the nature of the innovation required and the complex and inter-connected urban systems. To guide the innovation process, Stephane Hallegatte (2008) proposes five attributes of climate change adaptation projects that are equally applicable to green economy projects: (i) select ‘no-regret’ strategies that yield benefits even in the absence of climate change; (ii) favour reversible and flexible options; (iii) buy ‘safety margins’ in new investments; (iv) promote soft adaptation strategies, including the adoption of longer-term perspectives; (v) reduce decision-making time horizons so as to introduce iterative processes.
The utility of these attributes hinges on successful monitoring: it is no good applying projects that are ‘reversible and flexible’ without knowing which attributes are required.
Deciding how a green economy, and the success of finance for a green economy, should be measured is a matter for each municipality and its specific context. However, what is clear is that conventional metrics of GDP, internal rate of return and return on investment are likely to be limited in their ability to capture all that is valuable in an urban green economy. The pursuit of a green economy is about much more than growing the GDP and improving financial profitability, even though these may be legitimate parts of a green economy. Equally important are the many benefits, such as reduced risk, increased social inclusion and greater sustainability, which are inherently difficult to measure.
STA
TE
OF
CIT
Y F
INA
NC
ES
20
13

142
A 2011 study by the Economist Intelligence Unit, on behalf of Siemens, developed and applied a Green Cities Index to 15 cities in 11 African countries. The study compared data for energy and CO2, green open space, waste per capita, transport, water sanitation, air quality and environmental governance. Cape Town, Durban and Johannesburg were ranked above average (with Accra, Casablanca and Tunis) and Pretoria was ranked average (with Cairo, Lagos, Addis Ababa and Alexandria).
The measures were developed for application on other continents and, in their effort to ensure consistency across continents, did not captured the essence of South Africa’s urban green economy challenges. Locally appropriate measures would necessarily be easily and cheaply measured at the local scale and relate to the key considerations for South African cities, namely jobs, water, energy, inequality and ecological degradation (for which CO2 is a good proxy) and budget sustainability. A sense of the efficiency of progress can be gained by creating composites of these parameters. For example:•• Public cost (budgeted) per green economy person year of employment, using
as a point of reference: South Africa’s Tourism Support Programme’s reported ability to create employment at a cost of R121,000 per job; the IDC’s ability to create jobs at a cost of R440,00 per person year.
•• City GDP (or GVA) per ton of CO2 emitted (see Figure 5.1). This measure speaks to the need to decouple economic growth from environmental extraction and climate impact.
•• Water reticulated by the city as a ratio of total employment in the city.•• City energy expenditure as a ratio of city GDP.

STA
TE
OF
CIT
Y F
INA
NC
ES
20
13
conclUsIonSouth African cities are looking to the green economy to create employment and stimulate growth. Viable financing and funding options are central to the success of the green economy in South African cities. A number of South Africa’s leading municipalities find themselves in a precarious fiscal state created by the need to extend capital and skill-intensive services to an expanding geographic footprint, while revenue streams begin to taper. Green economy efforts that involve upfront investments in new capital or foregone revenue from brown economic growth or electricity sales have the potential to compound this state. Equally, failing to adopt a green economy will increase the cost of utility services and disaster management, and undermine economic growth, given that in some instances green economy programmes can relieve fiscal and financial constraints.
The need for a green economy in South African cities, and the imperative of linking this economy to service delivery and employment creation, requires significant investment in new technologies, new infrastructure and new means of delivering municipal services. Ideally this investment would emerge in the form of a suite of private sector finance, equity, development finance and public sector allocations, mobilised behind a shared vision. However, this level of coordinated effort seems unlikely given discordant priorities, limited capacity for fiscal strategy at the local level and the extent of market failure in both the development finance and the environmental sectors. In view of this situation, cities’ administrations must demonstrate the type of economic leadership that will enable subsequent flows of green economy finance. Fiscal strategy and fiscus allocations are the primary tools available to this leadership, and these tools need to be applied within an economic framework that prioritises addressing market failure, employment, growth and cost-effectiveness. A fiscal strategy, which is successful in supporting a low-carbon, resource-efficient and socially inclusive urban economy, will inevitably attract alternative sources of finance.
143
co
nc
lU
sIo
n

144
Abedian, I. 2012. Address at the launch of the Western Cape’s Economic Development Partnership (26 April 2012). Abedian was speaking as the CEO of Pan African Holdings.
Atwell, S. 2013. Economic Growth Strategy for the City of Cape Town. DRAFT, January. Mayor’s Office, City of Cape Town.
Benerjee, S and Morella, E. 2011. Africa’s Water and Sanitation Infrastructure: access, affordability and options. Washington, D.C., World Bank.
Burger, J, Ackron, J and Savage, D. 2012.Options for Resourcing Environmental Management in the City of Cape Town. Internal Discussion Paper commissioned by the City of Cape Town Climate Change Think Tank.
Cartwright, A. 2008. Sea-Level Rise Adaptation and risk mitigation measures for the City of Cape Town. Report prepared for the City of Cape Town ERM, Stockholm Environment Institute, Cape Town. <http://www.capetown.gov.za/en/EnvironmentalResourceManagement/publications/Documents/Phase%204%20-%20SLRRA%20Adaptation+Risk%20Mitigation%20Measures.pdf.>
Cartwright, A, Blignaut, J, De Wit, M, Goldberg, K, Mander, M, O’Donoghue, S and Roberts, D. 2013. ‘Economics of climate change adaptation at the local scale under conditions of uncertainty and resource constraints: the case of Durban, South Africa’.Environment and Urbanization,Vol 25(1): 1–18.
Cooke, J, Cylke, O, Larson, D, Nash, J and Stedman-Edwards, P. 2010. Vulnerable Places, Vulnerable People. Trade Liberalisation, Rural Poverty and the Environment.Co-publication of the World Bank, WWF and Edward Elgar.
De Visser, J. 2012. ‘Cities and climate change: ex abundanti cautela – from an excess of caution’. In Cartwright, A, Parnell, S, Oelofse, G and Ward, S. (eds). Climate Change at the City Scale. London: Routledge.
De Wit, M, Van Zyl, H, Crookes, D, Blignaut, J, Jayiya, T, Goiset, V andMahumani, B. 2009. Investing in Natural assets. A Business Case for the Environment in the City of Cape Town, Report for the City of Cape Town’s ERM Department, viewed January 2013, <http://www.capetown.gov.za/en/EnvironmentalResourceManagement/publications/Documents/EnvResEconomics-Final_Report_2009-08-18.pdf.>
ReFeRence lIsT
145
Re
Fe
Re
nc
e l
IsT
STA
TE
OF
CIT
Y F
INA
NC
ES
20
13
DoHS (Department of Human Settlements). 2011. National Upgrading Support Programme, http://www.upgradingsupport.org.
ERC (Energy Research Centre). 2011. Verification Report for the 2Tribes Energy Saving Housing Project. Report for the Credible Carbon registry. Available at www.crediblecarbon.com.
Ernst & Young. 2011. Turn Risks and Opportunities into Results. Exploring the Top 10 Risks and Opportunities for the Government and Public Sector. Report produced by Ernst Young and Oxford Analytica, viewed February 2013, http://www.ey.com/Publication/vwLUAssets/The_top_10_risks_and_opportunities_for_global_organizations/$FILE/Business%20Challenge%20main%20report-%20SCORED.pdf.
FFC (Fiscal and Financial Commission). 2012. Report to Parliament on Local Government. Pretoria: FFC.
Grieve, N. 2013. ‘Public good’, Engineering News, Volume 33(3) pp.16–17.
Hallegatte, S. 2008. ‘Strategies to adapt to an uncertain climate change’, Global Environmental Change, 684, p. 8.
Hallegatte, S, Heal, G, Fay, M and Treguer, D. 2011. ‘From growth to green growth: a framework’, Policy Research Working Paper 5872. Washington, D.C.: World Bank Sustainable Development Network, http://www-wds.worldbank.org/external/default/WDSContentServer/WDSP/IB/2011/12/07/000158349_20111207171314/Rendered/PDF/WPS5872.pdf.
Hardin G. 1968. The tragedy of the commons. Science 162, pp.1243–1248.
IISD (International Institute for Sustainable Development). 2012. Climate Change and Security in Africa, pp.38. <http://www.iisd.org/publications/pub.aspx?pno=1093.>
Jackson, T. 2009. Prosperity without Growth? Economics for a Finite Planet. London and New York: Earthscan/Routledge.
Lewis, Y and Jooste, M. 2012. ‘Opportunities and challenges in establishing a low-carbon zone in the Western Cape Province’. In Cartwright, A, Parnell, S, Oelofse, G and Ward, S. (eds.). Climate Change at the City Scale: Impacts, Mitigation and Adaptation in Cape Town. New York and Oxford: Routledge.
Maia, J, Giordano, T, Kelder, N, Bardien, G, Bodibe, M, Du Plooy, P, Jafta, x, Jarvis, D, Kruger-Cloete, E, Kuhn, G, Lepelle, R, Makaulule. L, Mosoma, K, Neoh, S, Netshitomboni, N, Ngozo, T and Swanepoel, J. 2011. Green Jobs: An Estimate of the Direct Employment Potential of a Greening South African Economy. Pretoria: Industrial Development Corporation, Development Bank of Southern Africa, Trade and Industrial Policy Strategies, p.8.
Martínez-Alier, J, Pascual, U, Vivien, F-D and Zaccai, E. 2010. ‘Sustainable de-growth: mapping the context, criticisms and future prospects of an emergent paradigm’,Ecological Economics, 69, pp.1741–1747, http://www.web.ca/~bthomson/degrowth/degrowth_history.pdf.
146
Meadows, D, Meadows, D, Randers, J and Behrens, W. 1972. The Limits to Growth. New York: Universe Books.
NPC (National Planning Commission). 2012. National Development Plan: Our Future – make it work, http://www.info.gov.za/view/DownloadFileAction?id=172306.
OECD (Organization for Economic Cooperation and Development). 2011. Towards Green Growth a Summary for Policy Makers. Paris, France: OECD, http://www.oecd.org/greengrowth/48012345.pdf.
Otto, E and Boshoff, L. 2012. Towards Green Resilient Cities. Unpublished technical report, i@Consulting.
Pikitup. 2013. Positive Impact of Trash to Treasure Project, 18 February, http://www.pikitup.co.za/jit_default_1324.html.
Republic of South Africa .2003. Municipal Systems Act (32), Pretoria.
Resnick, D, Trap, F and Thurlow, J. 2012. ‘The political economy of green growth: cases from Southern Africa’, Public Administration and Development, 32, pp. 215–228.
Roydon-Turner, S. 2011. From eradication to intervention, Unpublished Master’s Thesis, University of Cape Town.
Sagoff, M. 2012. ‘The rise and fall of ecological economics’, Breakthrough Journal, http://thebreakthrough.org/index.php/journal/past-issues/issue-2/the-rise-and-fall-of-ecological-economics/.
Satterthwaite, D. 2011. ‘How urban societies can adapt to resource shortage and climate change’, Philosophical Transactions of the Royal Society 369, pp.1762–1783.
Satterthwaite, S, Huq, S, Reid, H, Pelling, M and Lankoa, PR. 2009. ‘Adapting to climate change in urban areas: The possibilities and constraints in low and middle-income nations’, Human Settlements Discussion Paper Series, http://www.iied.org/HS/topics/accc.html.
Siemens. 2011. The Green Cities Index: a summary of the Green City Index research series, http://www.siemens.com/entry/cc/en/greencityindex.htm.
South Africa. 2003. Municipal Finance Management Act (56). Pretoria: Government Printer.
South Africa, Department of Environmental Affairs. 2011a. National Strategy for Sustainable Development and Action Plan 2011–2014. Pretoria: Department of Environmental Affairs.
South Africa, Economic Development Department. 2011b. New Growth Path 2020. Pretoria: Economic Development Department.
StatsSA (Statistics South Africa). 2012. Census 2011. Pretoria: StatsSA.

STA
TE
OF
CIT
Y F
INA
NC
ES
20
13
147
Re
Fe
Re
nc
e l
IsT
Sustainable Energy Africa. 2011. State of Energy in South African Cities 2011. Cape Town: Sustainable Energy Africa, City Energy Support Unit, http://www.cityenergy.org.za/files/resources/energy%20data/State_of_energy_2011.pdf.
Peters, C and Swilling, M. 2012. Sustainable, Resource Efficient Cities – Making It Happen! Paris, France: UNEP, http://www.sustainabilityinstitute.net/newsdocs/document-downloads/doc_download/568-sustainable-resource-efficient-cities-making-it-happen.
UNEP (United Nations Environmental Programme). 2009. Global Trends in Sustainable Energy Investment 2009. Analysis of trends and issues in the financing of renewable energy and energy efficiency. Nairobi: United Nations Environmental Programme.
UNEP. 2011. Towards a Green Economy: Pathways to Sustainable Development and Poverty Eradication – A Synthesis for Policymakers. Nairobi, Kenya: UNEP, http://www.unep.org/greeneconomy/Portals/88/documents/ger/GER_synthesis_en.pdf.
UN-Habitat. 2009. State of the World Cities 2008/9. Nairobi, Kenya: UN Habitat/Earthscan.
UN-Habitat. 2011. State of the World’s Cities 2010/2011: Bridging the Urban Divide. Nairobi, Kenya: UN-Habitat/Earthscan, http://www.unhabitat.org.jo/en/inp/Upload/2233036_pages%20from%20Report-Englishrd-2.pdf.
WEF (World Economic Forum). 2013. Green Investment Report (2013). Geneva: WEF, http://www3.weforum.org/docs/WEF_GreenInvestment_Report_2013.pdf.
World Bank. 2010. Cities and Climate Change: An Urgent Agenda. World Bank, http://siteresources.worldbank.org/INTUWM/Resources/340232-1205330656272/CitiesandClimateChange.pdf.
World Bank. 2012. Inclusive Green Growth: The Pathway to Sustainable Development. Washington D.C.: World Bank.
World Bank. 2013. Turn Down the Heat. Why a 4C World Must Be Avoided. Washington D.C.: World Bank, http://climatechange.worldbank.org/.
Zenghelis, D. 2012. ‘A strategy for restoring confidence in economic growth through green investment and innovation’, Policy Brief. London: London School of Economics, Grantham Research Institute on Climate Change and the Environment.
STA
TE
OF
CIT
Y F
INA
NC
ES
20
13

148
demand management may result in revenue loss.
149
STA
TE
OF
CIT
Y F
INA
NC
ES
20
13
Financial implications of demand-side management for electricity and water
The green agenda has resulted in a greater awareness around the resource consumption by cities and the need to better manage the demand, particularly for water and electricity. However, as these two services generate significant revenue for cities, demand management may result in revenue loss. In addition, interventions to reduce resource consumption will require capital investment and potentially incur additional operating costs. This must be balanced against the city’s reduced impact on the environment and the potential reduction in capital expenditure on bulk and connector infrastructure because of lower water and electricity demand.
This chapter seeks to improve the understanding of the impact of electricity and water1 demand management initiatives on municipalities and, specifically, to assess the financial implications. It is intended to provide background information and analytical tools that can inform future work, which will guide municipalities in implementing demand management initiatives.
This chapter is based on Demand Side Management for Electricity and Water and Financial Implications for Local Authorities, a report prepared by PDG (Palmer Development Group) for the Employment Promotion Programme (EPIII), and funded by South Africa Local Government Association (SALGA) and Business Unity South Africa (BUSA). It is published here under permission from the funders.
1 The chapter deals with electricity and water supply specifically. Solid waste systems are excluded because, although they also have an element of demand management in the way they are managed, the impact on municipal finances is relatively low.
cHAPTeR 6

150
BOx 6.1 A note on terminology
Resource conservation strategies can include a range of different types of interventions and can be implemented at different points in the resource delivery chain. If implemented at the end of the consumption chain – beyond the consumer supply point, which is typically a meter – these strategies are referred to as demand-side management (DsM) and are aimed at reducing end-user demand for specific resources such as water, energy or others.
If implemented at earlier points in the delivery chain, resource conservation measures can be implemented in ways that do not affect the final consumer. For example, improving infrastructure efficiencies (such as upgrades of inefficient electricity distribution networks) or reducing in-system losses (such as leak reduction in water mains through pressure control). Such measures are typically included under the terms “energy efficiency” and “water conservation”.
There is not always a clear separation in the way these terms are used and so, for simplicity, in this chapter DSM is applied to cover the whole range of interventions mentioned.
problem stAtementThe financial impact of resource conservation measures on a municipality will differ depending on where and how they are implemented. Interventions before the consumer’s meter (or point of use) will tend to have positive financial impacts, since they increase efficiencies and lower the costs to the municipality of delivering the service. Conservation measures beyond the consumer’s meter, i.e. true DSM, may have negative financial impacts on the municipality through reduced sales of the resource (or service in the case of waste) and hence a loss of revenue. DSM measures may also have positive financial impacts, for example if DSM is implemented by increasing tariffs to reduce consumption and through deferring the costs of new capital infrastructure.
Therefore, the net impact of a municipality’s resource conservation strategy will depend on the relative mix of measures used and on the specific local circumstances. An area of uncertainty is the use of tariffs to reduce consumption: the net financial impact will be positive if the increased tariffs outweigh the reduction in consumption, and negative if the reduction in consumption outweighs the increased tariffs. In the latter case, pursuing DSM measures would not be in the financial interests of the municipality or municipal departments.

151
cH
AP
Te
R 6
STA
TE
OF
CIT
Y F
INA
NC
ES
20
13
This is of particular concern for electricity services, and to a lesser degree water services, since many local authorities currently make a significant financial surplus from the provision of these services.
Resource conservation imperatives
At municipal level, there are currently a number of strong pressures for increased resource conservation. These include:•• National electricity supply constraints due to inadequate investment in
national power generation infrastructure.•• Energy efficiency requirements in support of greenhouse gas reduction
to meet South Africa’s national and international climate change mitigation targets.
•• Promotion of energy efficiency to assist households and firms to adapt to increasing costs of electricity.
•• Water supply constraints in a number of catchments and increasing costs of new sources of primary water supply in a water-scarce country.
•• National sustainable development objectives to reduce impacts on natural resources.
In all these areas, local authorities have important roles to play.
Merits of resource conservation for municipalities
Given the above imperatives, resource conservation programmes can have important benefits for municipalities, including: •• Reducing municipal expenses on bulk purchases without corresponding
increases in costs.•• Extending the life of useful assets and hence reduced or deferred capital costs.
This includes the reduced need for new bulk infrastructure.•• Avoiding system overloads and power blackouts, and hence supporting the
economic viability of South Africa’s urban areas.

152
•• Reducing household bills and costs of water and electricity to commercial and industrial consumers through DSM measures, which introduce important economic efficiencies into urban systems and improve the affordability of municipal services. These will feed back to municipalities through less bad debt and improved business environments.
•• In some cases, meeting absolute resource scarcity constraints, such as power supply or bulk water limitations.
Disincentives for managing demand
The biggest disincentive has already been mentioned: the negative financial impact on the municipality, or other water or electricity utility, from implementing a strategy that reduces the consumption of paying customers. Without any adjustment of the tariff to such customers, income to the municipality will reduce, which may threaten the economic viability of the entity providing the service and the municipality as a whole. Well recognised in the international literature, both developed and developing countries across the world have faced this disincentive and applied many interventions to deal with it.
Another disincentive is that municipalities and their service providers do not encounter directly the national consequences of resource over-utilisation. Of course, in the long term, they will face these consequences through, for example, the effect of climate change and increased input costs to their economies. But this is seldom on the mind of councils and municipal managers who are dealing with the day-to-day realities associated with service delivery in under-serviced areas with vulnerable economies.

STA
TE
OF
CIT
Y F
INA
NC
ES
20
13
153
cH
AP
Te
R 6
Demand management interventions can also be costly in terms of both capital required and increased operating costs. The capital costs tend to be on the municipal side of customer meters and relate to infrastructure improvements to reduce losses, pressure reduction in water networks, technology to manage household water geysers, metering systems and so on. On the operating account, ongoing costs may be incurred through consumer awareness campaigns and inspections related to regulatory interventions.
A final disincentive is that consumers may resist DSM interventions because of the cost to them, change in lifestyle, and the effort required to implement household, office and factory interventions.
Problem statement summary
The core of the problem statement is that, under certain circumstances, local authorities may have disincentives, many of them financial, to pursuing resource conservation strategies, even though they may have policy or strategic reasons for supporting such strategies. Further, given the fact that the financial impacts of resource conservation programmes can move in different directions, municipalities may have difficulty analysing the net financial impact of such programmes before implementation. For example, although the current rapid increases in the cost of bulk electricity allow municipalities to increase tariffs and possibly raise more revenue, price elasticity effects may reduce consumption and lead to a drop in revenue in the short or longer term.
In the context of increased pressures on municipalities to reduce resource use (or per capita resource use), it is important that municipalities have guidelines to assist them in developing and implementing resource conservation programmes.
institutionAl contextThe institutional arrangements in South Africa have specific relevance for resource conservation measures. Most important is the fact that municipalities undertake almost all water supply retail services and 60% of electricity retail (distribution or reticulation). In the case of water, private companies serve a small proportion of consumers, while a few municipalities have set up entities to run their water service, with Johannesburg being the largest example. In the case of electricity, Eskom supplies the remaining 40% of municipal consumers, predominantly in smaller municipalities, rural areas and townships in larger cities that have relatively low household income levels. Municipalities therefore have a dominant role to play with respect to resource conservation related to systems serving residential consumers, commercial consumers and medium to small industrial consumers.
STA
TE
OF
CIT
Y F
INA
NC
ES
20
13

154
Most large industrial consumers, including mines and power stations, get their supplies direct – from Eskom in the case of electricity and from the water resource in the case of water. Resource conservation measures associated with these supply systems fall under national jurisdiction and are not dealt with in depth in this chapter, except insofar as they affect municipal actions.
Eskom plays a dual role in the sector, supplying almost all the bulk electricity and providing the distribution service to 40% of municipal consumers, as mentioned above. Further, national government has delegated resource conservation responsibilities to the parastatal, specifically the management of a DSM programme. This has particular significance for the municipal sector as a whole and is covered later in this chapter.
Water boards have been given a role to play in water conservation and demand management by the Minister of Water Affairs under whose jurisdiction they fall. However, with very few exceptions, water boards do not provide retail services and so do not have influence over consumers or the management of distribution systems (where much of the water loss occurs). From a resource conservation perspective, in the future perhaps the most important option for water boards is to look at recycling treated wastewater effluent.
At a national government level, resource conservation measures for water and electricity are the responsibility of the Department of Water Affairs, the Department of Energy and the Department of Cooperative Governance, which has national oversight of local government affairs. Organisations representing the interests of business and/or particular industries also play a very important role. This applies in the local government sphere, where municipalities are typically unable to engage with the process technicalities associated with particular industries and, therefore, have limited ability to promote resource conservation measures for industries in their area. For example, large power consumers will typically be responding to the National Energy Efficiency Accord commitments and other national energy efficiency initiatives or incentives (such as the impending tax incentives for energy efficiency). These policies and programmes are targeted directly at the end industrial consumer and typically do not include a role for the intervening municipal electricity distributor in the cases where Eskom is not the direct supplier. However, the municipality will feel the impacts through decreased municipal sales and revenue and so needs to be aware of such programmes.
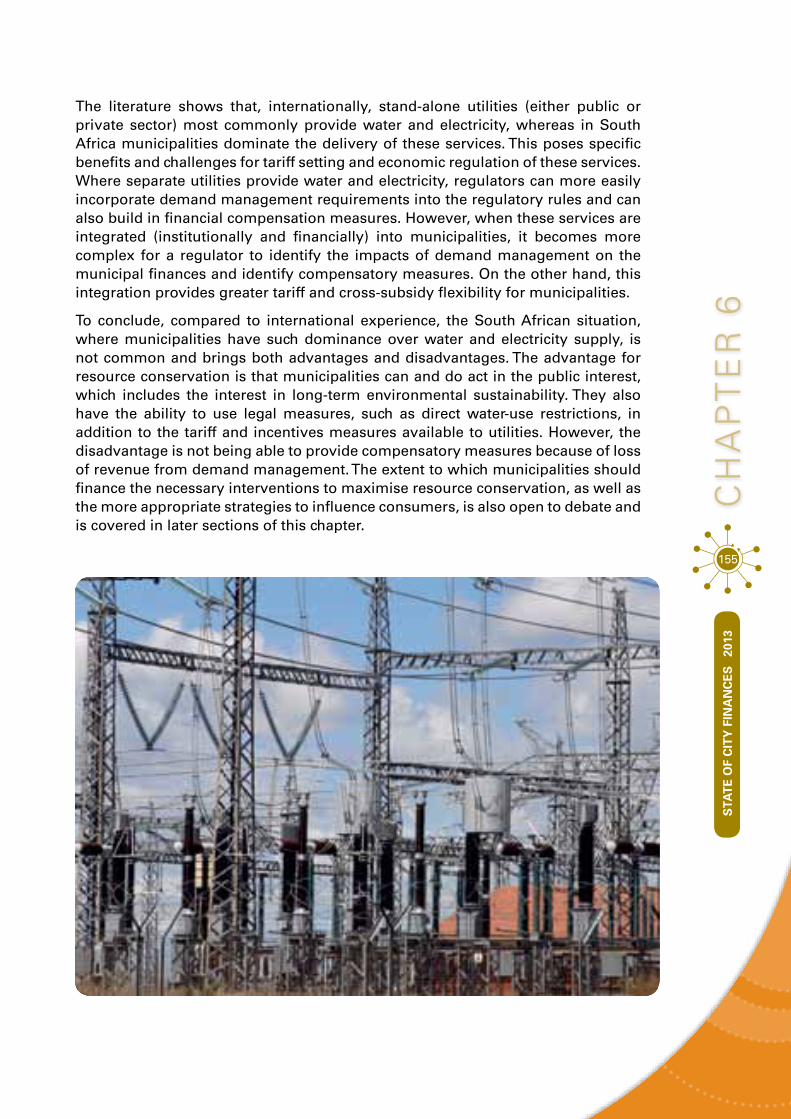
155
cH
AP
Te
R 6
STA
TE
OF
CIT
Y F
INA
NC
ES
20
13
The literature shows that, internationally, stand-alone utilities (either public or private sector) most commonly provide water and electricity, whereas in South Africa municipalities dominate the delivery of these services. This poses specific benefits and challenges for tariff setting and economic regulation of these services. Where separate utilities provide water and electricity, regulators can more easily incorporate demand management requirements into the regulatory rules and can also build in financial compensation measures. However, when these services are integrated (institutionally and financially) into municipalities, it becomes more complex for a regulator to identify the impacts of demand management on the municipal finances and identify compensatory measures. On the other hand, this integration provides greater tariff and cross-subsidy flexibility for municipalities.
To conclude, compared to international experience, the South African situation, where municipalities have such dominance over water and electricity supply, is not common and brings both advantages and disadvantages. The advantage for resource conservation is that municipalities can and do act in the public interest, which includes the interest in long-term environmental sustainability. They also have the ability to use legal measures, such as direct water-use restrictions, in addition to the tariff and incentives measures available to utilities. However, the disadvantage is not being able to provide compensatory measures because of loss of revenue from demand management. The extent to which municipalities should finance the necessary interventions to maximise resource conservation, as well as the more appropriate strategies to influence consumers, is also open to debate and is covered in later sections of this chapter.

156
FinAnciAl contextWater supply and electricity services in South Africa are financed primarily through payments made by consumers. However, subsidies in the form of transfers from the national fiscus are applied: •• The equitable share of national revenue is transferred to municipalities and is
intended, inter alia, to cover all or part of the costs of providing water supply and sanitation services to poor households.
•• Capital subsidies for providing water infrastructure and electricity distribution infrastructure are channelled directly to municipalities or to Eskom on behalf of municipalities.
•• The state subsidises bulk electricity and water in the sense that it co-finances power stations and large water resource development projects.
Considering the dominance of tariff-based revenue in financing water and electricity, the way tariffs are regulated is important. Most water service providers and electricity distributors are not regulated in a traditional fashion, where their tariffs are determined based on a reasonable return on the asset base. In the case of electricity and water, the tariff-setting process is loosely regulated, and municipal utilities are typically not ring-fenced. These services are therefore often used to generate surpluses for general municipal services, which makes DSM measures easier in some ways: municipalities do not face the contradiction between tariffs fixed by regulation and declines in sales, and there is typically some flexibility in tariff setting to address this issue. The National Energy Regulator of South Africa

STA
TE
OF
CIT
Y F
INA
NC
ES
20
13
157
cH
AP
Te
R 6
guidelines and the Electricity Pricing Policy appear to allow at least some consideration of DSM measures in tariff determination, and Eskom is required specifically to set aside some of its revenue for DSM. Therefore, tariff design and setting becomes a critical element of municipal DSM, both to offset the financial impacts of lower sales and as a DSM measure through setting appropriate price incentives.
Linked to the above, the majority of measures used in developed countries are not really appropriate for South African municipalities. In developed countries the strong economic regulation of utilities allows for the decoupling2 of revenue from sales. In South Africa, the loose economic regulation of municipalities makes DSM measures more difficult, since consistent and transparent methods for compensatory methods for DSM programmes are not as easily applied.
In considering the approach to financing DSM in the future, some important policy considerations are:•• Should the costs be borne primarily by the consumers of these services at
local government level? •• What is the role of Eskom’s DSM programme fund? •• Should the state introduce a new financial intervention to support DSM for
both water and electricity?
resource conservAtion interventions At locAl sphereTable 6.1 provides a list of conservation options applicable to the local sphere, together with an indication of their impact. This table is not intended to be comprehensive but rather a selection of the most widely applied interventions. The table provides an indication of the main resource conservation approaches used and available for use by local authorities in South Africa, as well as an overview of the extent to which different approaches used in resource conservation programmes have a (positive or negative) impact on the financial viability of municipalities.
2 The term decoupling refers to breaking the link between the volume of electricity or water sold and the amount of money payable to the seller. This is achieved through linking revenue to another indicator, such as number of households served.
STA
TE
OF
CIT
Y F
INA
NC
ES
20
13

158
TaB
Le 6
.1 R
eso
urc
e co
nse
rvat
ion
inte
rven
tio
ns
and
th
eir
imp
acts
Des
crip
tio
n o
f in
terv
enti
on
imp
act
on
res
ou
rce
req
uir
emen
tsim
pac
t o
n q
uan
tity
o
f w
ater
an
d
elec
tric
ity
sup
plie
d
to c
on
sum
ers
imp
act
on
mu
nic
ipal
co
sts
imp
act
on
mu
nic
ipal
re
ven
ue
(an
d h
ence
co
nsu
mer
bill
s)
imp
act
on
co
nsu
mer
co
sts
rela
ted
to
im
ple
men
tin
g t
he
con
serv
atio
n m
easu
re
Tech
nic
al in
terv
enti
on
s as
soci
ated
wit
h m
un
icip
al s
yste
ms
Tech
nic
al in
terv
enti
on
s as
soci
ated
wit
h m
un
icip
al s
yste
ms
Wat
er s
yste
m
loss
det
ecti
on
an
d
infr
astr
uct
ure
Su
bst
anti
al r
edu
ctio
n in
re
sou
rce
req
uir
emen
t d
ue
to r
edu
ctio
n in
tec
hn
ical
lo
sses
.
No
ne
Low
op
erat
ing
co
st in
crea
ses
in r
elat
ion
to
det
ecti
on
. M
od
erat
e o
per
atin
g c
ost
s as
soci
ated
wit
h in
fras
tru
ctu
re
rep
air.
Hig
h o
per
atin
g c
ost
re
du
ctio
ns
du
e to
red
uct
ion
in
bu
lk p
urc
has
es o
r re
du
ced
co
st o
f m
un
icip
al b
ulk
in
fras
tru
ctu
re.
No
ne
No
ne
Infr
astr
uct
ure
May
be
hig
h s
avin
gs
if
infr
astr
uct
ure
is in
po
or
con
dit
ion
.
No
ne
Hig
h-l
evel
cap
ital
co
sts
bu
t sh
ou
ld b
e p
art
of
go
od
ass
et
man
agem
ent.
No
ne
No
ne
Wat
er p
ress
ure
S
om
e re
du
ctio
n d
ue
to
red
uce
d n
etw
ork
loss
es
and
loss
es in
co
nsu
mer
sy
stem
s.
Low
er p
ress
ure
s re
du
ce le
akag
e o
n
con
sum
er s
yste
ms
– sm
all d
ecre
ase.
Co
sts
of
pre
ssu
re
man
agem
ent
are
sig
nifi
can
t.
Bu
t co
st s
avin
gs
du
e to
red
uce
d p
urc
has
e o
r p
rod
uct
ion
of
bu
lk w
ater
.
May
be
a sm
all
red
uct
ion
of
mu
nic
ipal
re
ven
ue
as c
on
sum
ers
save
wat
er.
No
ne
Wat
er
Su
bst
anti
al p
ote
nti
al, a
s re
cycl
ed w
ater
is u
sed
in
th
e p
lace
of
po
tab
le
wat
er. B
igg
est
app
licat
ion
to
ind
ust
rial
wat
er a
nd
w
ater
fo
r p
arks
, fiel
ds,
g
olf
co
urs
es e
tc.
No
imp
act
on
qu
anti
ty
use
d b
ut
low
er q
ual
ity
of
wat
er s
up
plie
d.
Su
bst
anti
al c
ost
s to
bu
ild
recy
clin
g in
fras
tru
ctu
re a
nd
sy
stem
s.
May
red
uce
rev
enu
e, a
s lo
wer
qu
alit
y w
ater
so
ld
at lo
wer
co
st.
No
t si
gn
ifica
nt
bu
t m
ay
req
uir
e so
me
tech
no
log
y ch
ang
e.
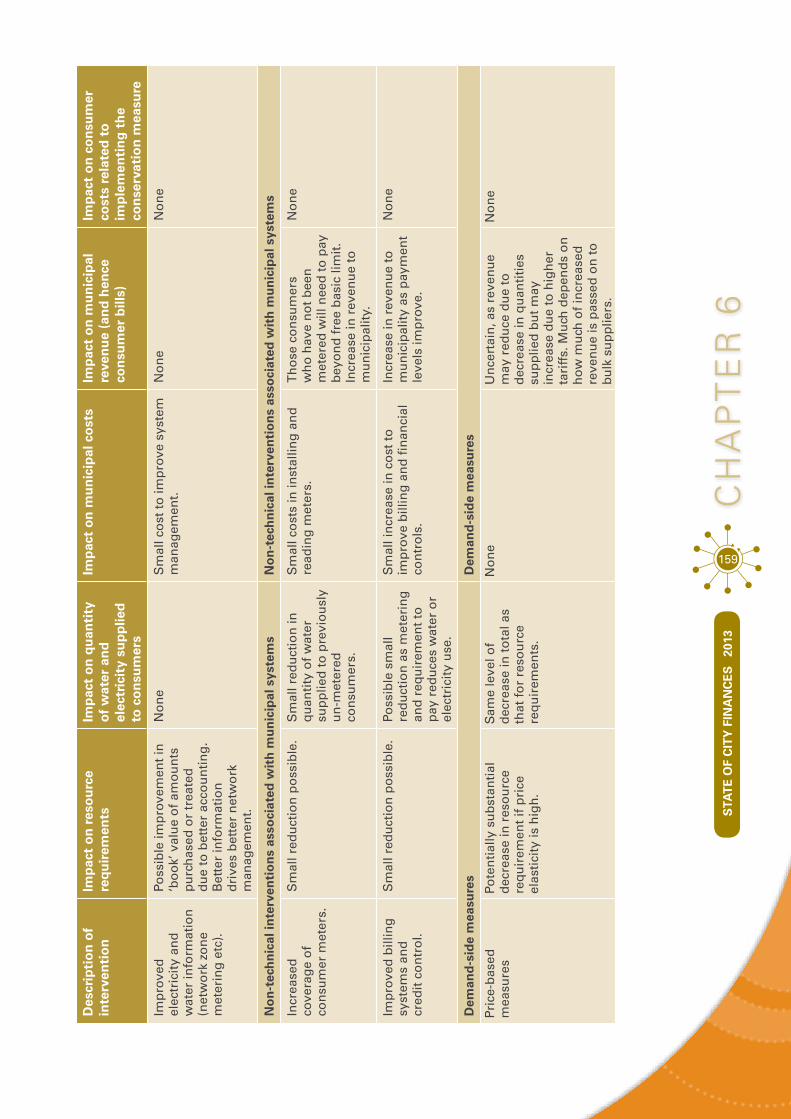
159
cH
AP
Te
R 6
STA
TE
OF
CIT
Y F
INA
NC
ES
20
13
Des
crip
tio
n o
f in
terv
enti
on
imp
act
on
res
ou
rce
req
uir
emen
tsim
pac
t o
n q
uan
tity
o
f w
ater
an
d
elec
tric
ity
sup
plie
d
to c
on
sum
ers
imp
act
on
mu
nic
ipal
co
sts
imp
act
on
mu
nic
ipal
re
ven
ue
(an
d h
ence
co
nsu
mer
bill
s)
imp
act
on
co
nsu
mer
co
sts
rela
ted
to
im
ple
men
tin
g t
he
con
serv
atio
n m
easu
re
Imp
rove
d
elec
tric
ity
and
w
ater
info
rmat
ion
(n
etw
ork
zo
ne
met
erin
g e
tc).
Poss
ible
imp
rove
men
t in
‘b
oo
k’ v
alu
e o
f am
ou
nts
p
urc
has
ed o
r tr
eate
d
du
e to
bet
ter
acco
un
tin
g.
Bet
ter
info
rmat
ion
d
rive
s b
ette
r n
etw
ork
m
anag
emen
t.
No
ne
Sm
all c
ost
to
imp
rove
sys
tem
m
anag
emen
t.N
on
eN
on
e
no
n-t
ech
nic
al in
terv
enti
on
s as
soci
ated
wit
h m
un
icip
al s
yste
ms
no
n-t
ech
nic
al in
terv
enti
on
s as
soci
ated
wit
h m
un
icip
al s
yste
ms
Incr
ease
d
cove
rag
e o
f co
nsu
mer
met
ers.
Sm
all r
edu
ctio
n p
oss
ible
.S
mal
l red
uct
ion
in
qu
anti
ty o
f w
ater
su
pp
lied
to
pre
vio
usl
y u
n-m
eter
ed
con
sum
ers.
Sm
all c
ost
s in
inst
allin
g a
nd
re
adin
g m
eter
s.T
ho
se c
on
sum
ers
wh
o h
ave
no
t b
een
m
eter
ed w
ill n
eed
to
pay
b
eyo
nd
fre
e b
asic
lim
it.
Incr
ease
in r
even
ue
to
mu
nic
ipal
ity.
No
ne
Imp
rove
d b
illin
g
syst
ems
and
cr
edit
co
ntr
ol.
Sm
all r
edu
ctio
n p
oss
ible
.Po
ssib
le s
mal
l re
du
ctio
n a
s m
eter
ing
an
d r
equ
irem
ent
to
pay
red
uce
s w
ater
or
elec
tric
ity
use
.
Sm
all i
ncr
ease
in c
ost
to
im
pro
ve b
illin
g a
nd
fin
anci
al
con
tro
ls.
Incr
ease
in r
even
ue
to
mu
nic
ipal
ity
as p
aym
ent
leve
ls im
pro
ve.
No
ne
Dem
and
-sid
e m
easu
res
Dem
and
-sid
e m
easu
res
Pric
e-b
ased
m
easu
res
Pote
nti
ally
su
bst
anti
al
dec
reas
e in
res
ou
rce
req
uir
emen
t if
pri
ce
elas
tici
ty is
hig
h.
Sam
e le
vel o
f d
ecre
ase
in t
ota
l as
that
fo
r re
sou
rce
req
uir
emen
ts.
No
ne
Un
cert
ain
, as
reve
nu
e m
ay r
edu
ce d
ue
to
dec
reas
e in
qu
anti
ties
su
pp
lied
bu
t m
ay
incr
ease
du
e to
hig
her
ta
riff
s. M
uch
dep
end
s o
n
ho
w m
uch
of
incr
ease
d
reve
nu
e is
pas
sed
on
to
b
ulk
su
pp
liers
.
No
ne

160
Des
crip
tio
n o
f in
terv
enti
on
imp
act
on
res
ou
rce
req
uir
emen
tsim
pac
t o
n q
uan
tity
o
f w
ater
an
d
elec
tric
ity
sup
plie
d
to c
on
sum
ers
imp
act
on
mu
nic
ipal
co
sts
imp
act
on
mu
nic
ipal
re
ven
ue
(an
d h
ence
co
nsu
mer
bill
s)
imp
act
on
co
nsu
mer
co
sts
rela
ted
to
im
ple
men
tin
g t
he
con
serv
atio
n m
easu
re
Bu
ildin
g s
tan
dar
ds
and
ass
oci
ated
re
gu
lati
on
Go
od
po
ten
tial
to
red
uce
el
ectr
icit
y d
eman
d in
th
e lo
ng
ter
m.
Go
od
po
ten
tial
in
th
e lo
ng
ter
m
wit
h c
on
sum
ers
exp
erie
nci
ng
no
or
littl
e lo
ss w
ith
res
pec
t to
livi
ng
an
d w
ork
ing
sp
aces
.
Neg
ligib
leLo
wer
leve
ls o
f re
ven
ue
as d
eman
d d
rop
s.M
any
bu
ildin
g
imp
rove
men
ts w
ill b
e m
ore
co
stly
in t
erm
s o
f ca
pit
al, b
ut
con
serv
atio
n
mea
sure
s w
ill a
lmo
st
alw
ays
save
co
sts
in t
he
lon
g t
erm
. S
ola
r w
ater
h
eate
rsS
ub
stan
tial
po
ten
tial
in
the
case
of
elec
tric
ity.
S
ub
stan
tial
po
ten
tial
. M
un
icip
alit
y m
ay c
ho
ose
to
as
sist
co
nsu
mer
s w
ith
fin
ance
. If
th
ey c
ho
ose
no
t to
th
ere
is
no
co
st t
o m
un
icip
alit
y.
Low
er le
vels
of
reve
nu
e.S
ub
stan
tial
cap
ital
co
st t
o c
on
sum
ers
for
inst
alla
tio
n b
ut
lon
g-t
erm
sa
vin
gs.
R
emo
te g
eyse
r co
ntr
ol s
yste
ms
Mai
nly
ap
plie
d t
o r
edu
ce
pea
k fa
cto
rs. N
o im
pac
t o
n w
eekl
y to
tal r
eso
urc
e u
tilis
atio
n.
Dai
ly u
se o
f w
ater
an
d
elec
tric
ity
rem
ain
s th
e sa
me.
Sig
nifi
can
t co
st t
o
mu
nic
ipal
itie
s to
pro
vid
e te
chn
olo
gy
and
op
erat
e th
e sy
stem
.
No
imp
act.
N
on
e
Ad
voca
cy
mea
sure
sS
ign
ifica
nt
po
ten
tial
to
red
uce
res
ou
rce
req
uir
emen
ts.
Sig
nifi
can
t p
ote
nti
al.
Sm
all c
ost
fo
r ad
vert
isin
g,
pu
blis
hin
g a
nd
dis
trib
uti
ng
in
form
atio
n.
Low
er r
even
ue.
No
ne
if t
he
resu
lt is
on
ly
beh
avio
ur
chan
ges
. Pe
rhap
s so
me
cost
s if
co
nsu
mer
s in
tro
du
ce
new
tec
hn
olo
gy.
Ho
use
ho
ld
wat
er r
euse
an
d r
ainw
ater
h
arve
stin
g
Sm
all p
ote
nti
al r
edu
ctio
n.
Sm
all p
ote
nti
al.
No
ne.
Sm
all r
edu
ctio
n in
re
ven
ue.
Req
uir
es s
ub
stan
tial
in
vest
men
t in
rec
yclin
g
syst
ems
and
/or
rain
wat
er
tan
ks.
Wat
er-w
ise
gard
enin
gS
ign
ifica
nt
po
ten
tial
if
ther
e ar
e la
rge
pro
per
ties
w
ith
hig
h in
com
e re
sid
ents
.
Sig
nifi
can
t p
ote
nti
al
ob
vio
usl
y as
soci
ated
w
ith
pro
per
ties
wit
h
larg
e ga
rden
s.
No
ne
So
me
red
uct
ion
in
reve
nu
e.S
om
e co
sts
if g
ard
en
is r
e-d
evel
op
ed o
r im
pro
ved
irri
gati
on
sy
stem
s in
stal
led
.

STA
TE
OF
CIT
Y F
INA
NC
ES
20
13
161
cH
AP
Te
R 6
Des
crip
tio
n o
f in
terv
enti
on
imp
act
on
res
ou
rce
req
uir
emen
tsim
pac
t o
n q
uan
tity
o
f w
ater
an
d
elec
tric
ity
sup
plie
d
to c
on
sum
ers
imp
act
on
mu
nic
ipal
co
sts
imp
act
on
mu
nic
ipal
re
ven
ue
(an
d h
ence
co
nsu
mer
bill
s)
imp
act
on
co
nsu
mer
co
sts
rela
ted
to
im
ple
men
tin
g t
he
con
serv
atio
n m
easu
re
Ho
use
ho
ld w
ater
lo
ss m
anag
emen
tS
om
e p
ote
nti
al,
par
ticu
larl
y w
her
e th
ere
is
no
met
erin
g.
So
wet
o e
xam
ple
in
dic
ates
th
at lo
sses
ca
n b
e h
igh
an
d t
hat
th
ere
is g
oo
d p
ote
nti
al
to r
edu
ce t
hes
e.
Sig
nifi
can
t co
st t
o m
anag
e an
d p
ay f
or
new
fitt
ing
s et
c.
Typ
ical
ly n
on
e, a
s h
ou
seh
old
s ar
e n
ot
pay
ing
fo
r w
ater
.
May
be
som
e co
st
to h
ou
seh
old
bu
t in
th
e S
ow
eto
cas
e th
e m
un
icip
alit
y co
vere
d t
his
co
st.
Low
vo
lum
e h
ou
seh
old
fitt
ing
s.S
ign
ifica
nt
red
uct
ion
p
arti
cula
rly
wit
h r
esp
ect
to t
oile
t fl
ush
ing
. Bu
t d
eclin
ing
as
alre
ady
fitt
ed
in a
larg
e p
rop
ort
ion
o
f h
ou
seh
old
s an
d
com
mer
cial
pro
per
ties
.
As
for
reso
urc
e re
qu
irem
ent.
No
ne
So
me
red
uct
ion
in
reve
nu
e.N
o c
ost
un
less
exi
stin
g
syst
ems
retr
ofi
tted
.
Man
ufa
ctu
rin
g
pro
cess
ef
fici
enci
es
Go
od
po
ten
tial
bu
t d
epen
den
t o
n s
cale
of
use
by
this
sec
tor
in t
he
mu
nic
ipal
ity.
Go
od
po
ten
tial
.N
on
eQ
uit
e su
bst
anti
al
po
ten
tial
to
red
uce
re
ven
ue
bu
t ov
er lo
ng
te
rm, a
s in
du
stri
es
take
tim
e to
intr
od
uce
n
ew t
ech
no
log
y o
r te
chn
iqu
es.
Typ
ical
ly r
equ
ires
su
bst
anti
al in
vest
men
t b
y in
du
stri
es b
ut
this
is
typ
ical
ly d
on
e w
hen
ex
isti
ng
mac
hin
ery
and
sy
stem
s re
ach
th
e en
d o
f th
eir
lives
.
STA
TE
OF
CIT
Y F
INA
NC
ES
20
13

162
AnAlysis FrAmeWorkIn taking decisions around prioritising resource conservation measures, having good information on the cost-benefit relationship of the intervention is important, including:a. Potential benefit to the environment in terms of reduced bulk water and
electricity requirements. b. Capital and operating cost of providing and operating the required
infrastructure and systems. c. Capital and operating cost savings over the long term through the reduced
need to provide new bulk and connector infrastructure.d. Reduction in revenue due to lower demand.e. Increase in revenue if the intervention involves a change in pricing.
Given the complexity of the relationship between costs and benefits, applying a model is useful in decision making. This chapter features the results of the Municipal Services Finance Model (MSFM), which allows for the impact on a quantity of resources to be analysed in relation to the costs incurred and revenue gained or lost. Further details on the MSFM are provided in Chapter 7.
Currently the key constraint to undertaking a sound analysis, whether done with the MSFM or not, is that the data on costs (item b in the above list) is very poor. Nevertheless, the model provides a useful analytical approach and, as data on costs gets better, the usefulness of the model will increase.
Perhaps the most important conclusion from the modelling is that economic growth in South African cities will result in an increase in water and electricity requirements that is well above resource conservation targets, unless major resource conservation measures are implemented.
In the case of both water and electricity systems, the primary intervention should be to reduce technical losses3 and implement other arrangements to reduce non-revenue4 water and electricity quantities. These interventions conserve resources, reduce costs
3 Technical losses refer to losses in the distribution systems (leaks, in the case of water) that do not benefit any consumers. Non-technical losses refer to water or electricity that is not paid for by consumers, either legally (free basic services) or illegally (theft).
4 Non-revenue includes technical and non-technical losses.

163
cH
AP
Te
R 6
STA
TE
OF
CIT
Y F
INA
NC
ES
20
13
and have a positive impact on the municipality’s revenue. This category contains two levels of intervention:•• Those based on improved management and operational systems (metering,
billing, credit control, loss detection and infrastructure maintenance).•• Those that require capital investment to rehabilitate infrastructure which has
reached or passed the end of its useful life.
Both these interventions are part of sound asset management practice. However, the infrastructure rehabilitation option cannot be achieved in the short term, as the investments required are high and capital available to municipalities is constrained. With regard to the impact of these interventions on resource requirements, the modelling clearly shows that much depends on the build-up of non-revenue water or electricity, and the extent to which this is the result of technical or non-technical losses.
The analysis is not conclusive with regard to price-based interventions, as too little is known about elasticity in the South African environment. However, price increase, which is rapid in the electricity sector and substantial in the water sector, will certainly reduce demand. Presently the indication is that the increase in revenue will compensate for the reduced demand, but uncertainties remain for the long term.
With regard to implementing true demand-side measures, the modelling is aimed primarily at showing what the impact of achieving national targets will be, not at assessing individual interventions in any detail.

164
prioritising resource conservAtion optionsSome conclusions, which can be drawn from research and modelling on interventions and that will have the biggest impact, are given below: a. The primary emphasis needs to be on supply-side interventions, which are
aimed at reducing non-revenue water and electricity including technical losses. This is more important in the water sector, as non-revenue water figures are high in most municipal systems.
b. Pricing will have a major impact particularly with rising block tariffs. The introduction of such tariffs for electricity is likely to shift demand.
c. Large, long-term benefits are gained through regulations aimed at greening buildings, both residential and commercial. Water and energy saving fittings and equipment are included here.
d. Engagement with industry representatives to promote water and energy efficiency in specific industries.
e. Supporting the introduction of solar water heaters.
In prioritising resource conservation measures, municipalities face certain constraints. A primary constraint is the disincentive associated with reduced revenue, which is the main theme of this chapter, but others include: a. Insufficient management capacity. b. Insufficient access to finance, especially capital finance. c. Difficulties incorporating resource conservation measures into municipal
planning, as demand management impacts are harder to estimate and typically less certain than supply interventions.
d. The need for interventions to reduce demand from high-income households and non-residential consumers while promoting service access to low-income households.
STA
TE
OF
CIT
Y F
INA
NC
ES
20
13
165
cH
AP
Te
R 6
However, conservation interventions for low-income households should not be ignored, particularly where wasteful practices occur. Such interventions will not have any significant revenue loss implications for municipalities, since these households are typically either subsidised or have high bad debt levels. The cost of supply to these consumers is therefore typically greater than the revenue or tariff, which is different from the situation in developed countries. The implication is that demand management in low-income households makes financial sense for municipalities. If structured correctly these interventions can also reduce household bills and improve the quality of life (for example, through insulating houses). There are good arguments for directing some demand management attention at poor households even though they use relatively low amounts of electricity or water.
Assessing the impact of DSM measures
How can municipalities best estimate the financial impacts of resource conservation programmes, and what are the ‘rules of thumb’ in this regard? What are the most financially preferred approaches to resource conservation by local authorities (including consideration of equity and impacts on poor households)?
This chapter suggests that financial modelling techniques are able to show the impact of resource conservation on the financial position of a municipality and/or an individual water or electricity service. However, specific information is required, as summarised below. •• Financial information can be obtained from municipal budgets with
expenditure and revenue trends projected forward using models. •• For technical interventions, reduced demand and resources savings on
the municipal side of meters will depend on the strategy applied in the municipality; estimates of what can be saved are based on literature or local experience.
•• To a limited extent, elasticity figures aimed at assessing the impact of demand relating to financial interventions (pricing) can be obtained from the literature. More important will be getting information for specific consumer groups in the municipality. An ideal time to do this is when prices are increasing rapidly (as they are now). What is required is to track (at least over the medium term) metered consumption figures for specific groups of consumers, together with changes in billed amounts. However, this will yield a measure of short-run elasticity – long-run elasticity, driven primarily by changes in technology, is harder to estimate locally.
STA
TE
OF
CIT
Y F
INA
NC
ES
20
13

166
Some rules of thumb for priority interventions are:•• Prioritise supply-side (pre-customer meter) interventions. This requires
improving metering to understand where losses occur, repairing pipelines and cabling and rehabilitating aging infrastructure. Pressure control of water systems also needs to be considered (see Table 6.1 for a fuller range of interventions).
•• Improve billing and credit control arrangements. •• Reduce wasteful consumption in the case of low-income customers,
where loss of revenue is not substantial in relation to gains from reduced consumption of water or electricity.
•• Reduce own municipal wastage and inefficiencies such as inefficient street-lighting.
•• Adjust rising block tariffs carefully, which may help balance DSM incentives and revenue-raising requirements.
•• Focus on geographical areas where the costs of bulk supply extension are high – the costs of DSM investments need to be set against savings on investment in bulk infrastructure expansion or the delays in making such investment.
167
cH
AP
Te
R 6
STA
TE
OF
CIT
Y F
INA
NC
ES
20
13
nAtionAl support For locAl-level resource conservAtion meAsuresThis analysis has raised some important national policy issues. The reality is that, to date, resource conservation measures associated with electricity and water have been driven primarily by municipalities, individual industries and Eskom. Admittedly national government departments have developed policies on resource conservation and have started improving legislation. However, the question remains whether more should be done, particularly with respect to financial interventions. Some of the reasons why the national fiscus should support DSM interventions include:•• Barrier removal: in a number of instances the financial benefits of DSM
interventions exceed their costs, but municipalities are unable to implement the required interventions because of specific barriers. For example, a municipality may be unable to raise the finance required for a water loss reduction programme despite evidence that such a programme will produce a net financial benefit over the medium term. National government can assist in overcoming such barriers by providing targeted infrastructure subsidies windows, or more subtle mechanisms such as loan or bond guarantees or dedicated ‘green loans’, which acknowledge the net financial benefit to the municipality. More basic interventions, such as providing technical assistance and advice may also assist to overcome barriers to ‘win-win’ DSM interventions.
•• national economic imperatives: the electricity supply crisis in particular is a national economic imperative that is beyond the control of the municipal sphere of government. Insofar as local government is expected to incur expenditure to assist in the short-term crisis management of demand, there are sound reasons for financial support for such interventions to be provided from the national fiscus. Demand reduction by municipalities ‘frees up’ peak capacity in the power system, which helps to enable the functioning and expansion of industrial investments dependent on secure electricity availability.
•• national environmental imperatives: many national environmental imperatives are difficult for most municipalities to include in a local-level cost-benefit analysis of DSM interventions and, hence, would be under-invested in by municipalities. These include the national response to climate change mitigation as well as the protection of the environmental reserve in national surface water resources. These national imperatives provide a rationale for national-level support for DSM interventions.

168
•• Welfare support to low-income households: a number of DSM interventions can both reduce demand for resources and act as a social welfare measure by lowering household bills and improving household quality of life. The national fiscus plays an important redistributive role, which cannot be replicated by some municipalities without sufficient income from wealthy households or business and industrial consumers to cross-subsidise DSM interventions. In these municipalities, such as predominantly rural municipalities, an argument is that national support should be provided as an effective welfare measure. This could include fundamental measures, such as the comprehensive introduction of insulation, solar water heaters (SWHs) and water-efficient appliances (such as taps and shower heads) in state-subsidised housing. Extension of national DSM programmes to focus on low-income SWH roll-out, insulation and ceiling retro-fitting and so forth is also likely to have a net social welfare gain.
•• Greater cost effectiveness at scale: National organisations such as the South African Local Government Association (SALGA) can reduce the costs of DSM interventions by reducing the transaction costs of: establishing channels for climate change finance; establishing credible Energy Service Companies (ESCOs) and providing enabling legislative frameworks for ESCOs (and their water equivalents); and providing support to address local management capacity limitations. Greater cost effectiveness could also be brought about by the coordinated purchasing of energy and water efficient products (such as cheaper SWHs, heat pumps, LED street-lights or similar).
STA
TE
OF
CIT
Y F
INA
NC
ES
20
13
169
cH
AP
Te
R 6
The above analysis does not suggest that national government should necessarily compensate local government for the revenue losses associated with reduced demand for their key services of water and electricity. Such reductions in revenue are a natural consequence of a more efficient use of these resources, and a natural transition to more resource-efficient local economies is needed. This may require a rebalancing of municipal revenues, from an over-reliance on profits from trading services to the gradual compensatory increase of other local revenue sources such as property rates or other local taxes.
Possible mechanisms to transfer funds or subsidies to local authorities for DSM interventions
In the electricity sector the international literature provides examples of institutional interventions such as ESCOs, which are responsible for driving energy efficiency initiatives and energy funds. Both of these options require more attention in South Africa, although the establishment of a new national institution along the ESCO model is unlikely to be justified here. A more focused extension of the ESCO model being established by Eskom to support their industrial DSM programme may be useful to support further areas of demand management – such as DSM interventions at the smaller commercial level and in both single-unit and multiple-unit residential settings. Consideration should also be given to using the ESCO model for water demand management and national support to establish a water demand management industry.
One of the most important financial interventions in energy efficiency is the Eskom DSM programme fund, which is established with the support of government and will be funded from bulk electricity sales (and hence all electricity consumers). Further work is needed to understand how accessible this source of funding is to municipalities and how much influence municipalities will have, given that they are constitutionally responsible for electricity distribution. Another matter that requires attention by national government is the shortage of funding for rehabilitating electricity distribution infrastructure. Not only is the level of technical losses increasing as infrastructure ages, but also there is the other obvious objective of improving reliability of the service.
In the case of water supply, a clear case exists for introducing a water conservation and demand management funding mechanism. The level of non-revenue water in the country is a very serious issue, and addressing this will result in large gains to the environment and to municipal viability. Yet most municipalities do not have the funding to address this issue properly.
STA
TE
OF
CIT
Y F
INA
NC
ES
20
13
170
Financial and institutional mechanisms to support municipal DSM
Financial or institutional mechanisms can be used to make resource conservation and DSM programmes more financially viable (such as off-balance sheet SWH programmes, out-sourcing water loss reduction projects and so forth). These mechanisms include: •• The facilitation of individual interventions, of the type listed in Table 6.1, by
national organisations (SALGA specifically) supporting local government. •• Off balance sheet finance options, such as:
•– ESCO model where a private sector party provides the capital finance and hence overcomes the capital-raising, management and expertise barriers.
•– Greater application of this model to the supply side for both water and energy loss reduction where technically possible.
•– Improved use of Eskom’s DSM fund and a greater influence over this fund by municipalities.
•• Loan guarantees from national government or Development Finance Institutions (DFIs) for loans for DSM interventions.
•• ‘Green finance’ windows such as dedicated financing lines at DFIs or via commercial banks for municipal infrastructure DSM interventions.
•• Climate change finance is available for certain DSM interventions (energy efficiency in particular), but has not yet provided meaningful support to DSM measures. The use of carbon finance via the clean development mechanism (CDM)5 to support the implementation of SWH programmes in low-income households has had limited success. However, the CDM has not yet significantly advanced the delivery of high-pressure SWH systems in middle and upper income households, where the reduction of electricity consumption is likely to be much more significant.
•• Although carbon finance has not yet had a significant impact, a number of promising ‘Programmatic CDM’ projects may provide greater access to carbon finance in the SWH and other distributed energy efficiency interventions, such as heat pumps. Municipalities should be made aware of the realistic benefits and challenges of carbon finance. For example, if appropriately managed, the sharing of transaction costs across municipalities or the support of national government in developing nationwide carbon finance projects. The use of such finance in support of energy DSM measures may well play a greater role in the medium term.
It should be recognised that the degree to which municipalities can regulate or intervene in household or business investment decisions is limited, and that some financial mechanisms for DSM are better targeted directly at the end consumer than via a municipality. Municipalities can possibly help to facilitate such products, through the use of their billing and information systems and their access to end consumers.
5 A mechanism defined in the Kyoto Protocol enables emissions reduction projects to generate Certified Emission Reduction units, which may be traded in emissions trading schemes (known as ‘carbon trading’).
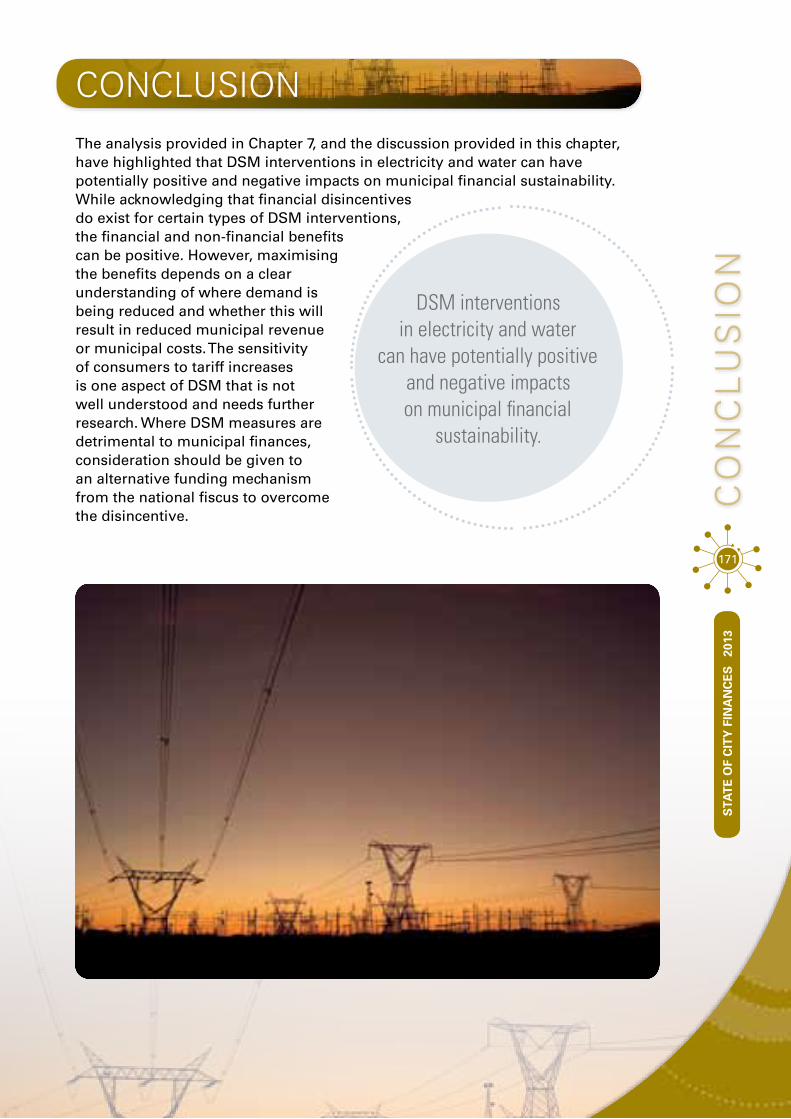
STA
TE
OF
CIT
Y F
INA
NC
ES
20
13
conclUsIonThe analysis provided in Chapter 7, and the discussion provided in this chapter, have highlighted that DSM interventions in electricity and water can have potentially positive and negative impacts on municipal financial sustainability. While acknowledging that financial disincentives do exist for certain types of DSM interventions, the financial and non-financial benefits can be positive. However, maximising the benefits depends on a clear understanding of where demand is being reduced and whether this will result in reduced municipal revenue or municipal costs. The sensitivity of consumers to tariff increases is one aspect of DSM that is not well understood and needs further research. Where DSM measures are detrimental to municipal finances, consideration should be given to an alternative funding mechanism from the national fiscus to overcome the disincentive.
171
co
nc
lU
sIo
n
DSM interventions in electricity and water
can have potentially positive and negative impacts on municipal financial
sustainability.
STA
TE
OF
CIT
Y F
INA
NC
ES
20
13

172

… financial models are often used
to project scenarios. One such model
is the Municipal Services Financial Model
(MSFM) …
173
STA
TE
OF
CIT
Y F
INA
NC
ES
20
13
Financial modelling as a strategic planning tool
The municipal finance environment is complex, and the factors that influence future planning are frequently uncertain. In this context, financial models are often used to project scenarios. One such model is the Municipal Services Financial Model (MSFM), which is probably the most widely used financial model in South Africa. This model is in the public domain and was developed for the Development Bank of Southern Africa (DBSA), the Department of Cooperative Governance and National Treasury. It has been applied at national level by the DBSA and National Treasury and has been run for six of the eight metropolitan municipalities, as well as many smaller municipalities.
While no one financial model can provide for all the planning needs of a city (and innovation needs to be encouraged), some key features are important for a model to be applied as an integrated planning tool. These are highlighted in Figure 7.1, which reflects the MSFM structure.
cHAPTeR 7
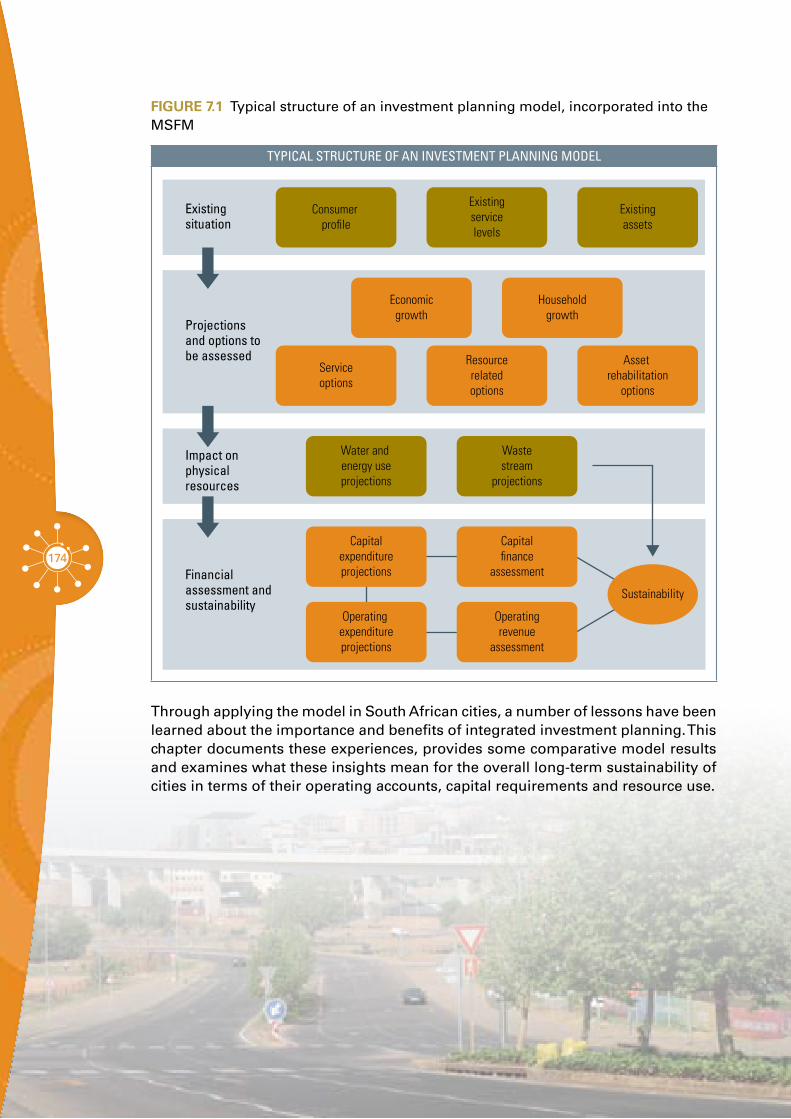
174
FiGURe 7.1 Typical structure of an investment planning model, incorporated into the MSFM
TYPICAL STRUCTURE OF AN INvESTMENT PLANNING MODEL
Existingsituation
Impact on physicalresources
Consumer pro�le
Existingservicelevels
Existingassets
Serviceoptions
Economicgrowth
Householdgrowth
Resourcerelatedoptions
Water and energy useprojections
Wastestream
projections
Capitalexpenditureprojections
Capital�nance
assessment
Sustainability
Operating expenditureprojections
Operatingrevenue
assessment
Asset rehabilitation
options
Projections and options tobe assessed
Financialassessment andsustainability
Through applying the model in South African cities, a number of lessons have been learned about the importance and benefits of integrated investment planning. This chapter documents these experiences, provides some comparative model results and examines what these insights mean for the overall long-term sustainability of cities in terms of their operating accounts, capital requirements and resource use.

175
cH
AP
Te
R 7
STA
TE
OF
CIT
Y F
INA
NC
ES
20
13
the importAnce oF integrAted investment plAnningIntegrated investment planning refers to a ‘zero-based’ process of planning (see Box 7.1) that aims to match available resources with the need to fulfil the municipality’s service provision mandate both now and in the future. It is ‘integrated’ because it considers all the functions of the municipality and how one may affect another. For example, a growth in low-income households leads to increased demand for housing, which in turn leads to a need for internal, connector and bulk infrastructure for all the services required by the individual housing unit. Similarly, economic growth projections will affect the demand for services, not only to cater for commercial and industrial consumers but also to supply an increasing proportion of higher income households that have potentially higher use of resources and higher levels of waste production.
BOx 7.1 Different forms of budget planning
Zero-based budgeting is a bottom-up process of planning, whereby a department or municipality defines the services it is expected to provide, quantifies the assets it owns, and then calculates the resources needed to fulfil their mandate. Alternative methods of planning are “incremental adjustment”, where the previous year’s budget is assumed to be fair and is simply increased by a percentage, or “application-based”, where individual departments submit plans and budgets which are assessed in some way to determine whether they are reasonable or not. While more common in municipalities than zero-based budgeting, the latter two methods are far more common in municipalities but are less rigorous and tend to be more subjective.
Cities undertake a myriad of planning processes, which may (or may not) feed into annual or longer-term budgeting processes. Integrated investment planning provides a basis for linking these planning processes in one high-level framework, ensuring that a consistent set of growth and development parameters are used. Ideally, these parameters should be based on historic trends and align with the strategic objectives of the city. An integrated planning approach is well suited to longer-term planning (such as growth and development strategies) because a 10-year timeframe is typically used, but the outputs can also inform the preparation of shorter-term plans, such as Integrated Development Plans (IDPs). Integrated planning adds the financial analysis that is all too often missing in such plans. Further, without an analysis that links technical parameters to the budget process, the process consists of simplistic increases on previous budgets without addressing the principles and key factors that influence a service provision programme, the related impact on physical resources and the associated investment requirement. For example, this simplistic planning approach may ignore historic under-investment in certain services or the city’s change in strategic direction. One argument is that, in the context of constrained budgets, a strategic budget modelling process can assist with prioritising problem areas or challenges that are not addressed in IDPs. Such a prioritisation, which can be fed into the IDP deliberations, and then back into the capital and operating budget, can be of tremendous value in securing a strategic direction for municipalities.

176Another advantage of integrated investment planning is that it links operating account implications to capital investments. For example, strategic decisions to invest in economic infrastructure can have positive implications for rates and tariff revenue, while delays in capital investment in rehabilitating existing assets lead to increased maintenance expenditure.
Integrated investment planning is also important because it links service delivery programmes to funding sources. This is an important part of integrated development planning, and acts as a reality check on ambitious service delivery plans. Cities are able to quantify the funding needed to achieve national backlog eradication targets, which can be used to motivate for specific grant funding from National Treasury.
Lastly, integrated planning provides a basis for a high-level assessment of the draw on physical resources, notably water and energy, and the nature of waste streams produced.
The wider application of this type of approach is evidence that South African metropolitan municipalities are becoming more strategic in their financial planning and are including longer-term projections, asset management plans and financial modelling to ensure their long-term sustainability.
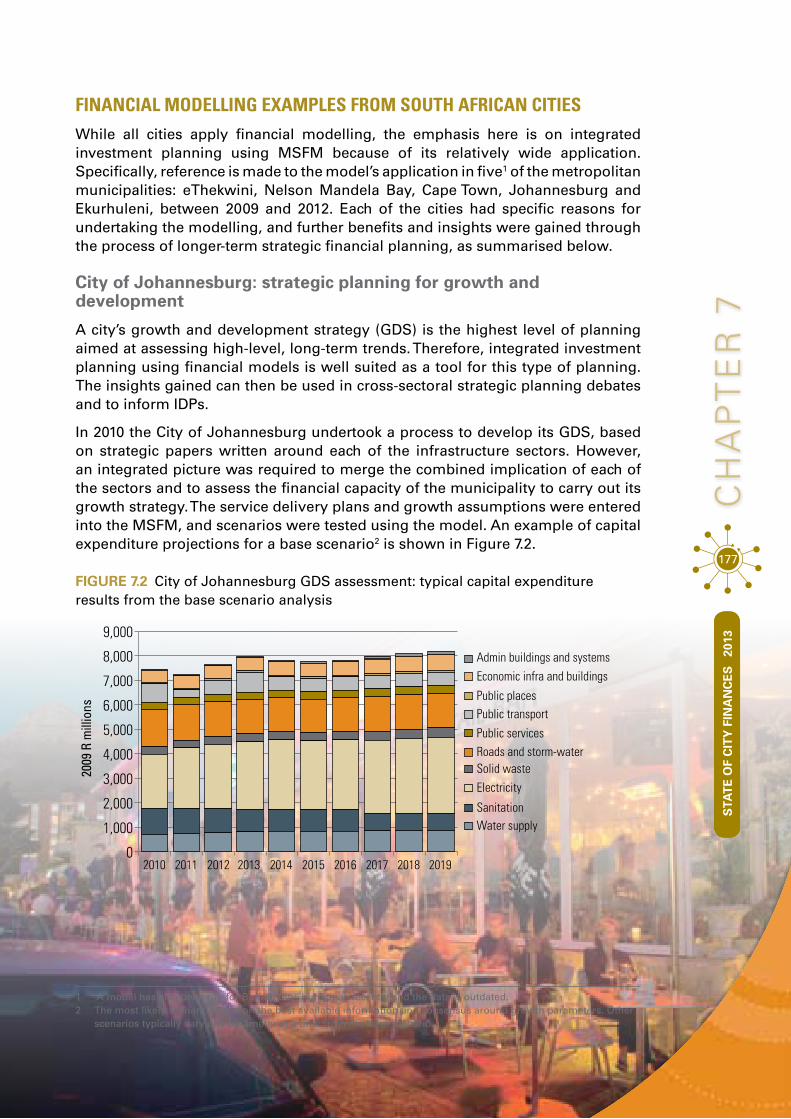
STA
TE
OF
CIT
Y F
INA
NC
ES
20
13
177
cH
AP
Te
R 7
FinAnciAl modelling exAmples From south AFricAn citiesWhile all cities apply financial modelling, the emphasis here is on integrated investment planning using MSFM because of its relatively wide application. Specifically, reference is made to the model’s application in five1 of the metropolitan municipalities: eThekwini, Nelson Mandela Bay, Cape Town, Johannesburg and Ekurhuleni, between 2009 and 2012. Each of the cities had specific reasons for undertaking the modelling, and further benefits and insights were gained through the process of longer-term strategic financial planning, as summarised below.
City of Johannesburg: strategic planning for growth and development
A city’s growth and development strategy (GDS) is the highest level of planning aimed at assessing high-level, long-term trends. Therefore, integrated investment planning using financial models is well suited as a tool for this type of planning. The insights gained can then be used in cross-sectoral strategic planning debates and to inform IDPs.
In 2010 the City of Johannesburg undertook a process to develop its GDS, based on strategic papers written around each of the infrastructure sectors. However, an integrated picture was required to merge the combined implication of each of the sectors and to assess the financial capacity of the municipality to carry out its growth strategy. The service delivery plans and growth assumptions were entered into the MSFM, and scenarios were tested using the model. An example of capital expenditure projections for a base scenario2 is shown in Figure 7.2.
FiGURe 7.2 City of Johannesburg GDS assessment: typical capital expenditure results from the base scenario analysis
Admin buildings and systemsEconomic infra and buildings
Public placesPublic transport
Public servicesRoads and storm-waterSolid wasteElectricity
SanitationWater supply
2010
2009
R m
illio
ns
2011 2012 2013 2014 2015 2016 2017 2018 20190
1,000
2,000
3,000
4,000
5,000
6,000
7,000
8,000
9,000
1 A model has also been run for Buffalo City, but not as recently and the data is outdated.2 The most likely scenario based on the best available information and consensus around growth parameters. Other
scenarios typically vary one parameter at a time from the base scenario.
STA
TE
OF
CIT
Y F
INA
NC
ES
20
13
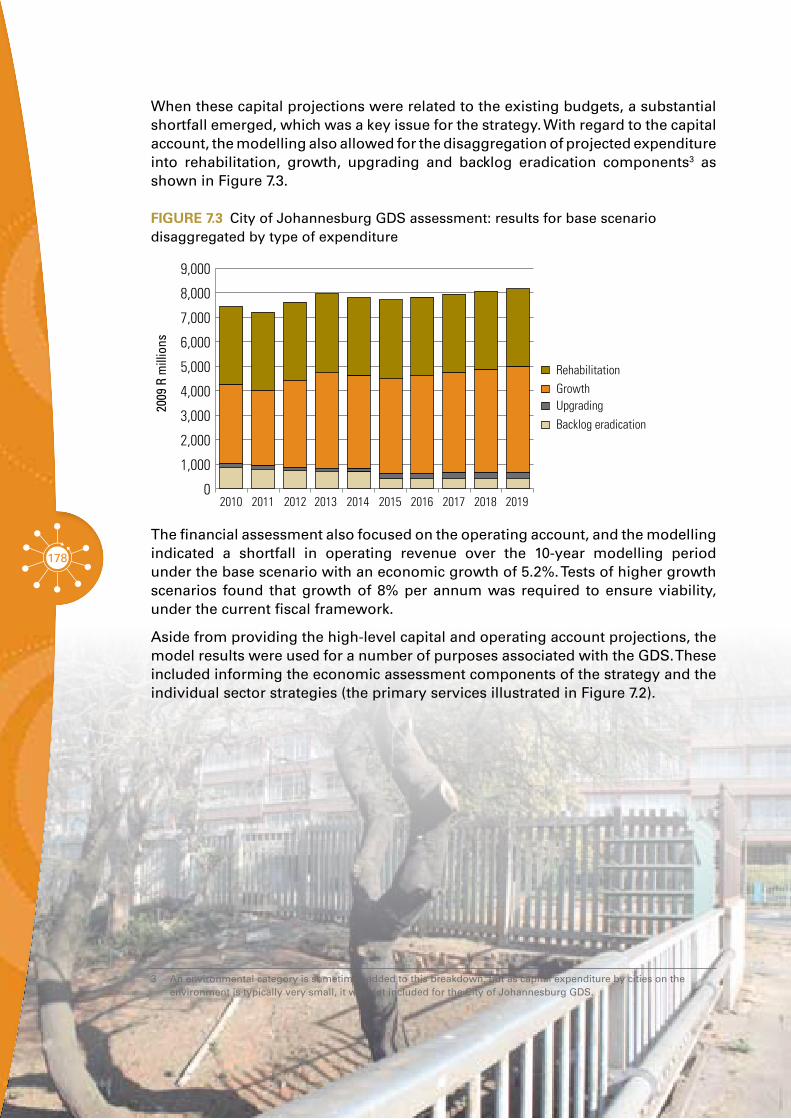
178
When these capital projections were related to the existing budgets, a substantial shortfall emerged, which was a key issue for the strategy. With regard to the capital account, the modelling also allowed for the disaggregation of projected expenditure into rehabilitation, growth, upgrading and backlog eradication components3 as shown in Figure 7.3.
FiGURe 7.3 City of Johannesburg GDS assessment: results for base scenario disaggregated by type of expenditure
RehabilitationGrowthUpgradingBacklog eradication
2009
R m
illio
ns
2010 2011 2012 2013 2014 2015 2016 2017 2018 20190
1,000
2,000
3,000
4,000
5,000
6,000
7,000
8,000
9,000
The financial assessment also focused on the operating account, and the modelling indicated a shortfall in operating revenue over the 10-year modelling period under the base scenario with an economic growth of 5.2%. Tests of higher growth scenarios found that growth of 8% per annum was required to ensure viability, under the current fiscal framework.
Aside from providing the high-level capital and operating account projections, the model results were used for a number of purposes associated with the GDS. These included informing the economic assessment components of the strategy and the individual sector strategies (the primary services illustrated in Figure 7.2).
3 An environmental category is sometimes added to this breakdown, but as capital expenditure by cities on the environment is typically very small, it was not included for the City of Johannesburg GDS.

179
cH
AP
Te
R 7
STA
TE
OF
CIT
Y F
INA
NC
ES
20
13
eThekwini metro: balancing capital budget allocations
Capital budget allocations are often made at a project level through some sort of prioritisation process (political or otherwise). Typically this leads to a situation where each line department puts in a request for capital funding for a set of projects, resulting in two difficulties: the capital requirement is far greater than the resources available, and a contentious decision has to be made about how to allocate finance to each line department or sector. A further concern is whether the capital spending approved is achieving the strategic objectives of the city. The eThekwini metro faced this situation in 2010 and 2011, when it was having severe capital funding constraints. In dealing with capital finance allocations, the city wished to maintain a strategic balance between (1) the social objective of eradicating service backlogs and providing infrastructure to the poor; (2) the economic growth objective of providing infrastructure to support economic growth and increased municipal revenue, and (3) the objective of providing for rehabilitation and/or replacement of existing assets that had reached the end of their useful lives.
The city decided to use financial modelling techniques, based on the MSFM, to assess the capital budget allocation. This was done by first running the MSFM on an unconstrained base scenario,4 projecting the ideal capital allocation to meet all the city’s backlog, growth and rehabilitation needs. The line departments were then asked to specify how the capital projects in their individual budgets were split among social,5 economic,6 rehabilitation,7 environmental8 and administration9 components. While the overall capital required was significantly more than the capital funding available, it was useful to analyse the difference in allocation between these categories.
BOx 7.2 Classification of capital projects
The categorisation of capital projects into the five categories (social, economic, rehabilitation, environmental and administration) is not a straightforward task. In eThekwini, definitions and examples of each of the categories were circulated, and line departments were requested to estimate what percentage of each individual project was serving what purpose. In this way, single projects could be said to be serving social, economic, and environmental purposes at the same time, but without ‘double counting’ the value of the work.
4 See previous footnote5 Defined as eradication of backlogs, upgrading levels of service, infrastructure for new low-income households,
social housing and public services.6 Defined as new infrastructure to serve high-income and non-residential consumers, improvement to public spaces
and buildings for economic activity.7 Defined as renewal or replacement of existing assets – excludes routine maintenance.8 Typically includes water and energy conservation projects, recycling projects etc.9 Typically includes admin buildings, IT systems and, in some cases, vehicles.
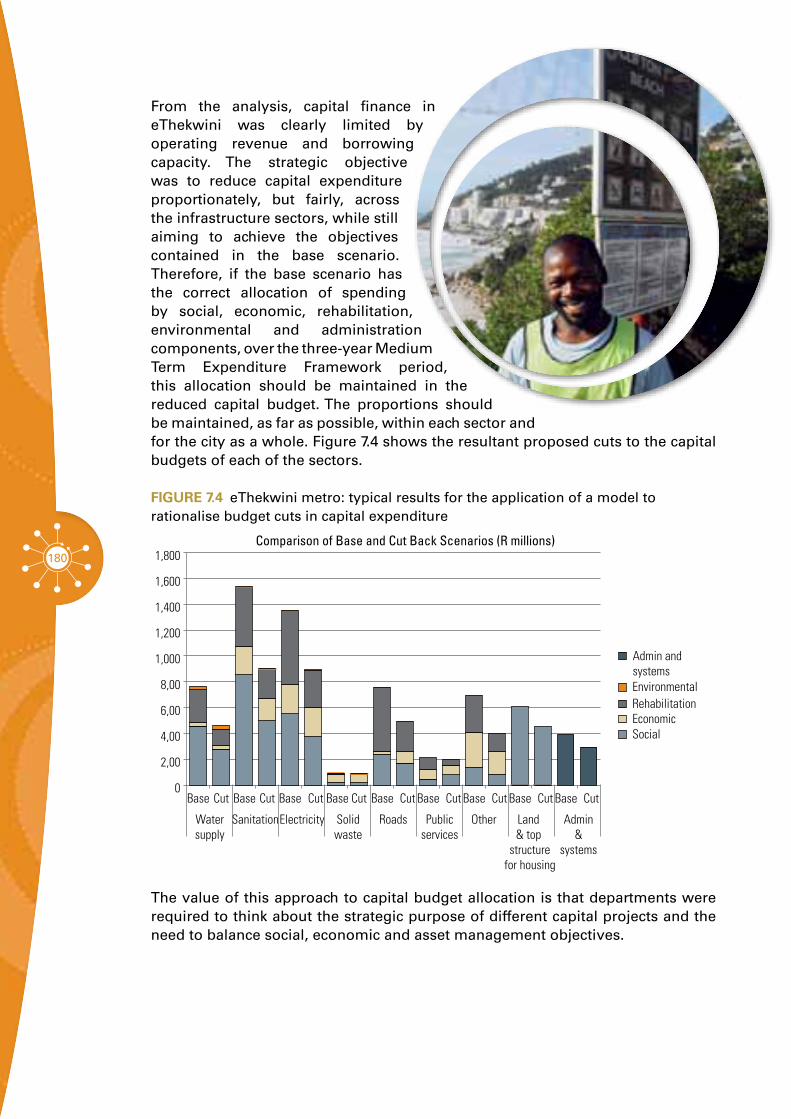
180
From the analysis, capital finance in eThekwini was clearly limited by operating revenue and borrowing capacity. The strategic objective was to reduce capital expenditure proportionately, but fairly, across the infrastructure sectors, while still aiming to achieve the objectives contained in the base scenario. Therefore, if the base scenario has the correct allocation of spending by social, economic, rehabilitation, environmental and administration components, over the three-year Medium Term Expenditure Framework period, this allocation should be maintained in the reduced capital budget. The proportions should be maintained, as far as possible, within each sector and for the city as a whole. Figure 7.4 shows the resultant proposed cuts to the capital budgets of each of the sectors.
FiGURe 7.4 eThekwini metro: typical results for the application of a model to rationalise budget cuts in capital expenditure
0
2,00
4,00
6,00
8,00
1,000
1,200
1,400
1,600
1,800
Admin and systemsEnvironmentalRehabilitationEconomicSocial
Base
Watersupply
SanitationElectricity Solidwaste
Roads Publicservices
Other Land & top
structurefor housing
Admin&
systems
Cut Base Cut Base Cut Base Cut Base Cut Base Cut Base Cut Base Cut Base Cut
Comparison of Base and Cut Back Scenarios (R millions)
The value of this approach to capital budget allocation is that departments were required to think about the strategic purpose of different capital projects and the need to balance social, economic and asset management objectives.
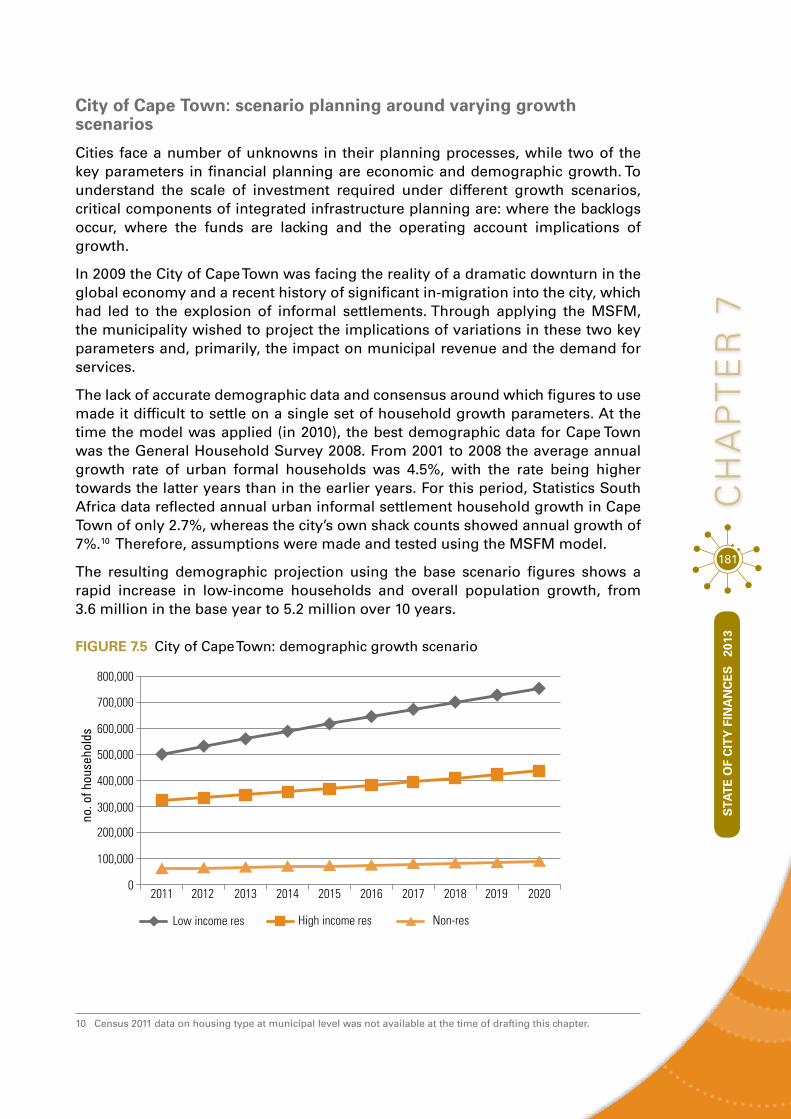
181
cH
AP
Te
R 7
STA
TE
OF
CIT
Y F
INA
NC
ES
20
13
City of Cape Town: scenario planning around varying growth scenarios
Cities face a number of unknowns in their planning processes, while two of the key parameters in financial planning are economic and demographic growth. To understand the scale of investment required under different growth scenarios, critical components of integrated infrastructure planning are: where the backlogs occur, where the funds are lacking and the operating account implications of growth.
In 2009 the City of Cape Town was facing the reality of a dramatic downturn in the global economy and a recent history of significant in-migration into the city, which had led to the explosion of informal settlements. Through applying the MSFM, the municipality wished to project the implications of variations in these two key parameters and, primarily, the impact on municipal revenue and the demand for services.
The lack of accurate demographic data and consensus around which figures to use made it difficult to settle on a single set of household growth parameters. At the time the model was applied (in 2010), the best demographic data for Cape Town was the General Household Survey 2008. From 2001 to 2008 the average annual growth rate of urban formal households was 4.5%, with the rate being higher towards the latter years than in the earlier years. For this period, Statistics South Africa data reflected annual urban informal settlement household growth in Cape Town of only 2.7%, whereas the city’s own shack counts showed annual growth of 7%.10 Therefore, assumptions were made and tested using the MSFM model.
The resulting demographic projection using the base scenario figures shows a rapid increase in low-income households and overall population growth, from 3.6 million in the base year to 5.2 million over 10 years.
FiGURe 7.5 City of Cape Town: demographic growth scenario
0
100,000
200,000
300,000
400,000
500,000
600,000
700,000
800,000
2011 2012 2013 2014 2015 2016 2017 2018 2019 2020
Non-resLow income res High income res
no. o
f hou
seho
lds
10 Census 2011 data on housing type at municipal level was not available at the time of drafting this chapter.

182
The projections for national economic growth available at the time from the Bureau of Economic Research varied between 2.7% and 4.1% over the period and were used for the base model run. However, this is a conservative estimate, as analysis has shown that, historically, metros have outperformed the national economic growth by 0.7% on average.
The combination of the high population growth rate and the pessimistic economic growth projections resulted in a high and increasing operating account deficit for the City of Cape Town. In particular, the rates account showed heavy deficits because of the large number of non-paying residents receiving municipal services.11 A more positive scenario of lower demographic growth and higher economic growth showed that the operating account deficit could be reduced to zero over nine years.
Alignment of departmental strategies
Financial planning is traditionally undertaken by city budget departments, with input from line departments. However, the resource constraints within the South African municipal environment mean that the interface between the finance department (those that hold the purse strings) and the line departments (those that spend the money) is often a site of conflict. A financial planning methodology that matches service delivery mandates with available funding has the ability to bridge this contested divide.
11 See Chapter 1 for a discussion on debtor levels
183
cH
AP
Te
R 7
STA
TE
OF
CIT
Y F
INA
NC
ES
20
13
In the City of Cape Town, the financial model was owned and driven by the budget office but required input from the technical departments in order to develop funding requirements using a zero-based approach. This gave the finance department an appreciation that the annual budget applications by the line departments were legitimate and, in many cases, less than what they actually needed.
The situation was reversed in eThekwini, where the engineering department drove the process in consultation with the city treasury. In this case the engineering department became engaged in the trade-offs that the treasury faced in allocating budget and the available funding constraints.
BOx 7.3 The need for greater inter-departmental integration
The case of conurbia housing development, eThekwini municipality
An example from eThekwini illustrates how capital budgeting cannot be undertaken in the ‘silos’ of line departments. The Cornubia housing development is a multi-billion rand, mixed-use development to the north of Durban to be implemented over the next 20 years. However, proposed capital budget cuts would have threatened the funding necessary to provide bulk water and sanitation infrastructure to the site. Therefore, funding for bulk infrastructure had to be ring-fenced to align with the development plans. The lesson learned is that budget allocations need to be integrated across departments on a scale bigger than that of individual projects and programmes. This is particularly relevant in the case of human settlements planning and further illustrates the need for spatial budgeting to play a stronger role. The geographic space in which projects are going to be implemented can be the integrating element in a budget process. If all line departments, aside from their sector-specific or network budget requirements, are required to provide the necessary infrastructure to specific geographic areas, this will mitigate against a situation where certain infrastructure elements are omitted, leading to a hold-up in the development of these areas.
Motivation for funding strategies
In the past, the National Treasury has used the MSFM to assess the (former) Municipal Infrastructure Grant (MIG) funding applications by the metros. The MSFM provided a tool that could be applied consistently across all metros, with a constant set of parameters, to compare funding requirements with service provision needs. The zero-based method of determining a municipality’s funding requirements is more transparent than simply submitting project lists for infrastructure (that may or may not be meeting actual needs) and provides a basis for negotiation between national and local government.
184
The metros have understood the benefit of this. The City of Cape Town and Nelson Mandela Bay metros were motivated to develop their own financial models, populated with their own data and assumptions, as a basis for negotiating with National Treasury around its assessment of metro finances. The City of Cape Town analysis showed a significant funding gap on the capital account that could be partially, but not totally, covered through increased borrowing and development charges. Similarly, Nelson Mandela Bay wished to provide motivation for an increased allocation of MIG and Equitable Share funding. On the operating account, scenarios were run to show what was possible in terms of increased collections, but also what impact an increase in the Equitable Share allocation would have.
Modelling has also been used for the metro business tax application, for many of the same reasons mentioned above. Scenarios were used to increase all possible internal funding sources over time, to illustrate that a structural capital funding gap still exists and that an additional funding source is required.
Modelling the implications of demand management strategies for water and electricity
National shortages of surface water and electricity supply capacity have drawn attention to the need to reduce the municipal demand for water and electricity. Although not new in South Africa, demand-management interventions have never before received as much attention. However, as these two services are primary revenue generators for municipalities, the municipalities have an obvious disincentive to promote demand reduction without some mechanism for financial compensation.
Financial modelling has been applied to test the implications of such resource conservation measures, using the cities of Johannesburg and eThekwini as case studies. The assessment included the impact on the water and electricity trading accounts. The theory behind demand-side management (DSM) is discussed in Chapter 6 and more detailed results of the analysis can be found in the original report12. Using electricity as an illustration, the approach was to test several scenarios: a. A base scenario with no demand management or conservation interventions,
resulting in current growth trends being projected into the future.b. A scenario where only technical losses are reduced, implying no change to
revenue but reduced payments for bulk electricity. c. A scenario addressing only non-revenue consumption, which relates to
electricity used, but not paid for by consumers, and not provided for under the free basic electricity policy.
d. A scenario based on true demand-side interventions (on the customer side of the meter), which are aimed at reducing the amount of electricity used by customers and, as this is metered and billed, affect revenue.
12 PDG. 2012. Demand Side Management for Electricity and Water and Financial Implications for Local Authorities. A report prepared by for the Employment Promotion Programme (EPIII).
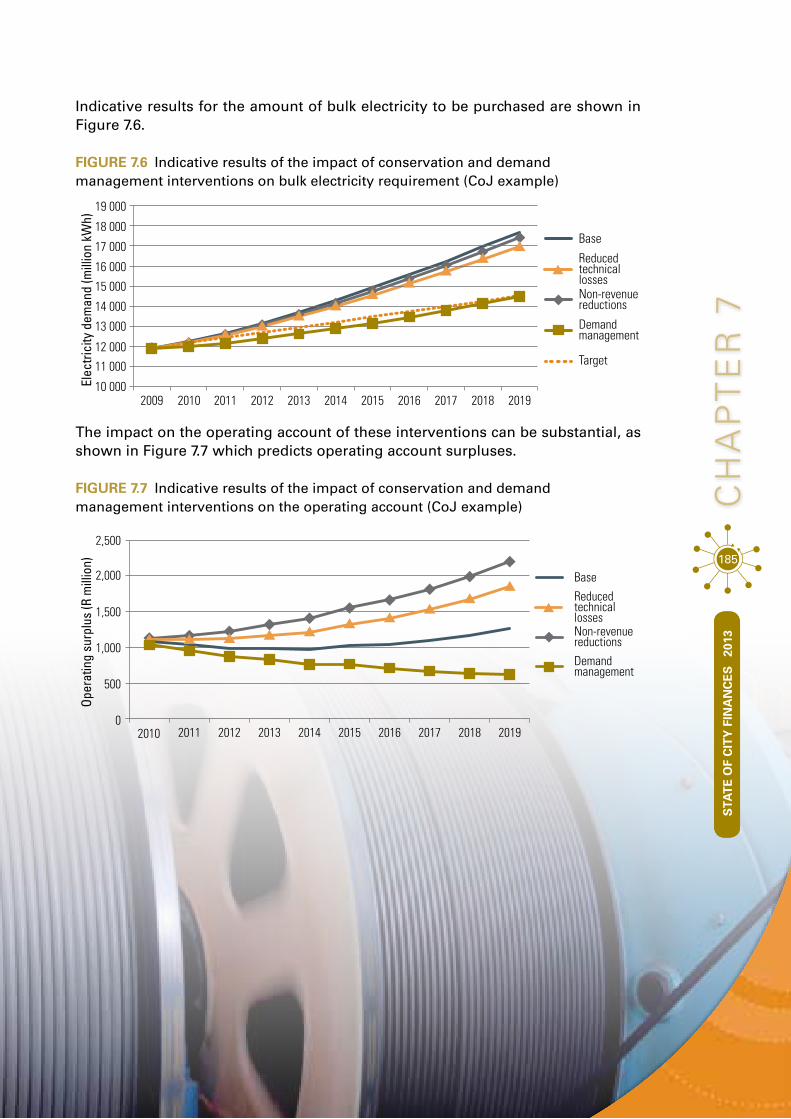
STA
TE
OF
CIT
Y F
INA
NC
ES
20
13
185
cH
AP
Te
R 7
Indicative results for the amount of bulk electricity to be purchased are shown in Figure 7.6.
FiGURe 7.6 Indicative results of the impact of conservation and demand management interventions on bulk electricity requirement (CoJ example)
10 000
11 000
12 000
13 000
14 000
15 000
16 000
17 000
18 000
19 000
20102009 2011
Elec
trici
ty d
eman
d (m
illio
n kW
h)
2012 2013 2014 2015 2016 2017 2018 2019
Non-revenuereductions
Demandmanagement
Base
Reducedtechnicallosses
Target
The impact on the operating account of these interventions can be substantial, as shown in Figure 7.7 which predicts operating account surpluses.
FiGURe 7.7 Indicative results of the impact of conservation and demand management interventions on the operating account (CoJ example)
0
500
1,000
1,500
2,000
2,500
Non-revenuereductions
Demandmanagement
Base
Reducedtechnicallosses
2010 2011 2012 2013 2014 2015 2016 2017 2018 2019
Oper
atin
g su
rplu
s (R
mill
ion)
STA
TE
OF
CIT
Y F
INA
NC
ES
20
13
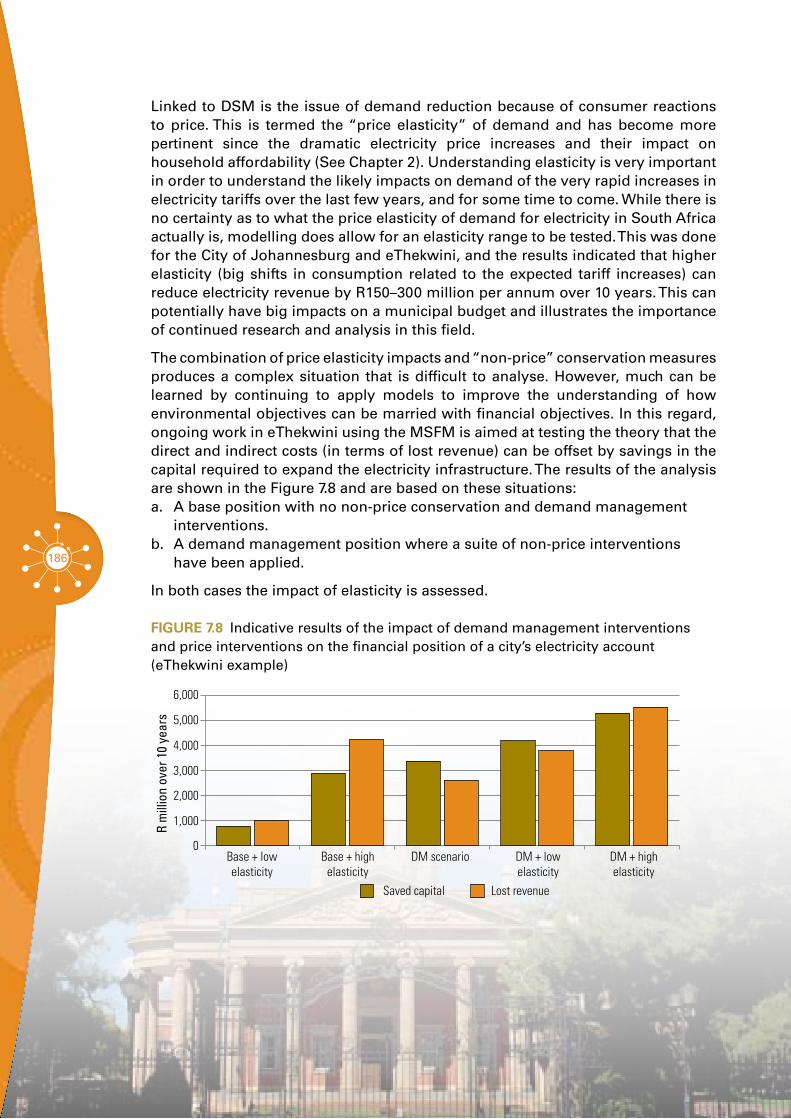
186
Linked to DSM is the issue of demand reduction because of consumer reactions to price. This is termed the “price elasticity” of demand and has become more pertinent since the dramatic electricity price increases and their impact on household affordability (See Chapter 2). Understanding elasticity is very important in order to understand the likely impacts on demand of the very rapid increases in electricity tariffs over the last few years, and for some time to come. While there is no certainty as to what the price elasticity of demand for electricity in South Africa actually is, modelling does allow for an elasticity range to be tested. This was done for the City of Johannesburg and eThekwini, and the results indicated that higher elasticity (big shifts in consumption related to the expected tariff increases) can reduce electricity revenue by R150–300 million per annum over 10 years. This can potentially have big impacts on a municipal budget and illustrates the importance of continued research and analysis in this field.
The combination of price elasticity impacts and “non-price” conservation measures produces a complex situation that is difficult to analyse. However, much can be learned by continuing to apply models to improve the understanding of how environmental objectives can be married with financial objectives. In this regard, ongoing work in eThekwini using the MSFM is aimed at testing the theory that the direct and indirect costs (in terms of lost revenue) can be offset by savings in the capital required to expand the electricity infrastructure. The results of the analysis are shown in the Figure 7.8 and are based on these situations:a. A base position with no non-price conservation and demand management
interventions. b. A demand management position where a suite of non-price interventions
have been applied.
In both cases the impact of elasticity is assessed.
FiGURe 7.8 Indicative results of the impact of demand management interventions and price interventions on the financial position of a city’s electricity account (eThekwini example)
0
1,000
2,000
3,000
4,000
5,000
6,000
Base + lowelasticity
R m
illio
n ov
er 1
0 ye
ars
Base + highelasticity
DM scenario
Saved capital Lost revenue
DM + lowelasticity
DM + highelasticity
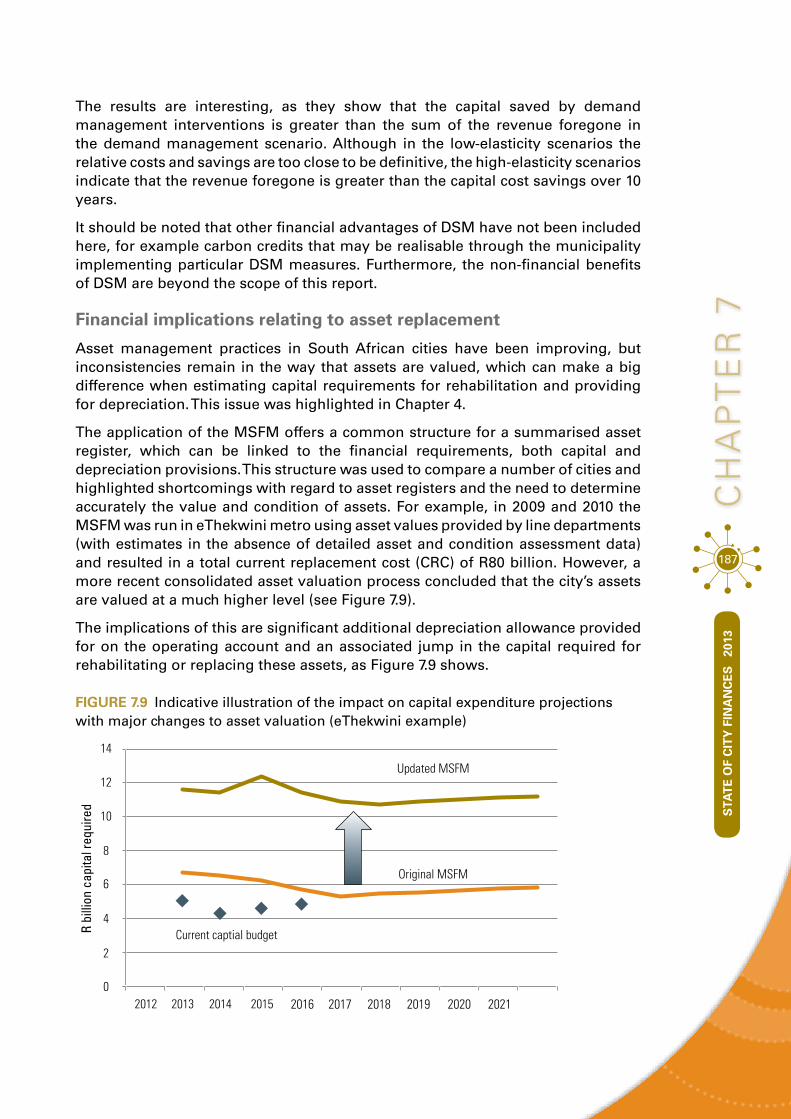
187
cH
AP
Te
R 7
STA
TE
OF
CIT
Y F
INA
NC
ES
20
13
The results are interesting, as they show that the capital saved by demand management interventions is greater than the sum of the revenue foregone in the demand management scenario. Although in the low-elasticity scenarios the relative costs and savings are too close to be definitive, the high-elasticity scenarios indicate that the revenue foregone is greater than the capital cost savings over 10 years.
It should be noted that other financial advantages of DSM have not been included here, for example carbon credits that may be realisable through the municipality implementing particular DSM measures. Furthermore, the non-financial benefits of DSM are beyond the scope of this report.
Financial implications relating to asset replacement
Asset management practices in South African cities have been improving, but inconsistencies remain in the way that assets are valued, which can make a big difference when estimating capital requirements for rehabilitation and providing for depreciation. This issue was highlighted in Chapter 4.
The application of the MSFM offers a common structure for a summarised asset register, which can be linked to the financial requirements, both capital and depreciation provisions. This structure was used to compare a number of cities and highlighted shortcomings with regard to asset registers and the need to determine accurately the value and condition of assets. For example, in 2009 and 2010 the MSFM was run in eThekwini metro using asset values provided by line departments (with estimates in the absence of detailed asset and condition assessment data) and resulted in a total current replacement cost (CRC) of R80 billion. However, a more recent consolidated asset valuation process concluded that the city’s assets are valued at a much higher level (see Figure 7.9).
The implications of this are significant additional depreciation allowance provided for on the operating account and an associated jump in the capital required for rehabilitating or replacing these assets, as Figure 7.9 shows.
FiGURe 7.9 Indicative illustration of the impact on capital expenditure projections with major changes to asset valuation (eThekwini example)
Updated MSFM
Original MSFM
Current captial budget
20120
2
4
6
8
10
12
R bi
llion
cap
ital r
equi
red
14
2013 2014 2015 2016 2017 2018 2019 2020 2021

188
The illustrated shift in capital provision for asset replacement is directly related to the value of assets and to the expected useful life of the assets, both of which are provided for in the modelling. The quite dramatic variability shown within a city that has generally good asset management illustrates the difficulties in getting good valuations, particularly in an environment where unit costs are increasing rapidly, as they have
been.
The direct link between the value of assets and provisions for depreciation
also has a big impact on the operating account with the application of GRAP
accounting methodology, as discussed in Chapter 4.
Asset management plans are an essential component of the suite of plans required by a municipality but need to be linked to a financial analysis that deals with the broader strategic issues facing the city. This in turn implies a link to operating and capital account projections, which financial modelling of this type can provide.
Comparing the cities
Having a consistent set of MSFM models for several cities in the country provides an opportunity to assess comparative figures, which was done on two occasions: for a workshop for four metros that were applying the model in 2011, and for cities that participated in the recent application for new funding sources (2011 data used).
The results from the latter initiative are used here because they are more recent and the model was applied in a reasonably consistent way. That said, substantial variability in the data available from cities will always remain, and so results are not fully comparable. Nevertheless, even if the comparison is not fully accurate, it remains useful for cities to compare their situations. In order to allow for such comparisons, the results are normalised based on the number of consumer units13 in each city.
13 The number of units to which the city provides a service, typically associated with a plot with water and electricity meters, or an informal dwelling. This is chosen as a unit of comparison because it is a measure of the service obligations of a municipality, while controlling for potential differences in household size or numbers of dwellings per plot.
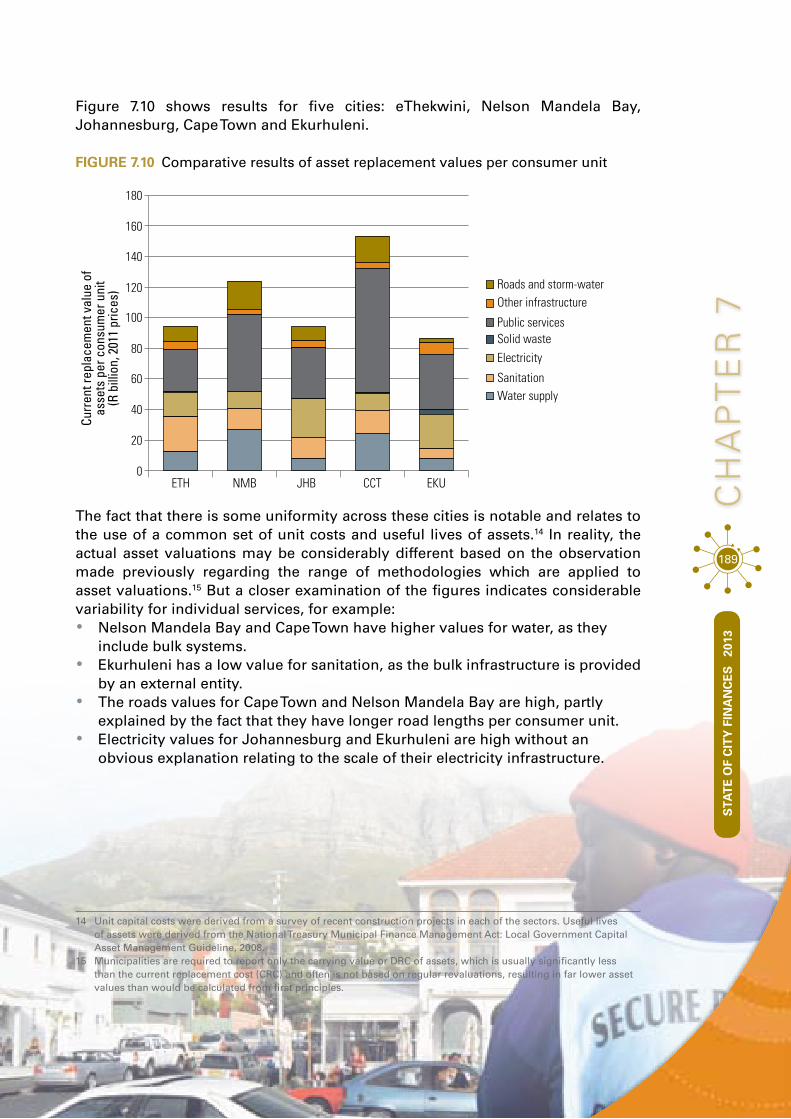
STA
TE
OF
CIT
Y F
INA
NC
ES
20
13
189
cH
AP
Te
R 7
Figure 7.10 shows results for five cities: eThekwini, Nelson Mandela Bay, Johannesburg, Cape Town and Ekurhuleni.
FiGURe 7.10 Comparative results of asset replacement values per consumer unit
0
20
40
60
80
100
120
140
160
180
Roads and storm-waterOther infrastructure
Public servicesSolid wasteElectricity
SanitationWater supply
Curr
ent r
epla
cem
ent v
alue
of
asse
ts p
er c
onsu
mer
uni
t(R
bill
ion,
201
1 pr
ices
)
ETH NMB JHB CCT EKU
The fact that there is some uniformity across these cities is notable and relates to the use of a common set of unit costs and useful lives of assets.14 In reality, the actual asset valuations may be considerably different based on the observation made previously regarding the range of methodologies which are applied to asset valuations.15 But a closer examination of the figures indicates considerable variability for individual services, for example:•• Nelson Mandela Bay and Cape Town have higher values for water, as they
include bulk systems. •• Ekurhuleni has a low value for sanitation, as the bulk infrastructure is provided
by an external entity. •• The roads values for Cape Town and Nelson Mandela Bay are high, partly
explained by the fact that they have longer road lengths per consumer unit. •• Electricity values for Johannesburg and Ekurhuleni are high without an
obvious explanation relating to the scale of their electricity infrastructure.
14 Unit capital costs were derived from a survey of recent construction projects in each of the sectors. Useful lives of assets were derived from the National Treasury Municipal Finance Management Act: Local Government Capital Asset Management Guideline, 2008.
15 Municipalities are required to report only the carrying value or DRC of assets, which is usually significantly less than the current replacement cost (CRC) and often is not based on regular revaluations, resulting in far lower asset values than would be calculated from first principles.
STA
TE
OF
CIT
Y F
INA
NC
ES
20
13

190
Figure 7.11 shows a comparison of the modelled capital requirement over the next 10 years, again normalised based on number of consumer units in each city:
FiGURe 7.11 Comparative results of capital requirements over 10 years per consumer unit
0
20
40
60
80
100
120
Public servicesLand and top structure for housing
RoadsSolid wasteElectricity
SanitationWater supplyCa
pita
l exp
endi
ture
ove
r 10
year
s,pe
r con
sum
er u
nit (
R bi
llion
s, 2
011
pric
es)
Public transportPublic placesEconomic infra and buildingsAdmin buildings and systems
ETH NMB JHB CCT EKU
•• Cape Town’s relatively high figure relates to higher expenditure projections for roads and water, which can partly be explained by the inclusion of bulk water costs16 and a relatively long road length per consumer unit (much of the roads expenditure is related to rehabilitation).
•• Ekurhuleni’s lower figure is partly explained by the lower water and sanitation responsibilities, as explained above in the asset value discussion, and lower provision for public transport infrastructure.
In making comparisons of this nature, the overall conclusion is that making the projections involves considerable complexity and hence, without a much more detailed explanation, the results can only serve to provide a rough picture.
These comparisons have emphasised capital-related items. However, having the MSFM models set up allows for a much wider data comparison to be undertaken for which there is not the space in this chapter.
16 The City of Johannesburg, Ekurhuleni and eThekwini purchase their bulk water from water boards, so do not incur the capital expenditure required for bulk water supply.

191
cH
AP
Te
R 7
STA
TE
OF
CIT
Y F
INA
NC
ES
20
13
implicAtions For long-term sustAinAbility oF citiesModelling provides information for individual cities and for policy makers at national level. Despite the variability between cities (as demonstrated here), the cities face similar difficulties, some of which need to be resolved internally, and some of which need to be resolved through national interventions. Chapter 6 explored the concept of financial sustainability and provides alternative institutional and financial mechanisms for national government support.
Sustainability is paramount among the highest level objectives on the urban agenda. The term sustainability can be considered from a financial, social and an environmental perspective. The modelling techniques allow for all these aspects to be considered, at least at a high level.
Considering the financial sustainability objective, the overall conclusion is that cities do not have enough finance available to meet national service delivery targets, to provide for economic growth at a level of about 5% per annum and to ensure sustainability through minimising environmental impact and properly managing assets. On the operating account this can be solved to an extent by increasing rates and tariffs, but substantial constraints remain. Large numbers of poorer people are entering cities and the extent to which they can be provided with free services is limited, taking into consideration both the Local Government Equitable Share finance and internal cross-subsidies. On the capital account, measures need to be taken to close the gap in capital finance, as is so evident from the modelling results. The modelling allows for this gap to be estimated and for options for closing the gap to be investigated. These include:•• Application of specific grants.•• Ability to generate surpluses sufficient (a) to finance capital works directly
from reserves and (b) to service long-term debt. •• Financing from development charges, currently an under source of capital
finance. •• Providing for finance from the private sector through public-private
partnerships.
With regard to environmental sustainability, models can project resource use (water and electricity specifically – see Chapter 6) and estimate waste streams (solid waste and wastewater). The analysis, with some results included above, shows the importance of resource conservation and demand management interventions. Without such interventions, the rapid rise in resource requirements and waste streams will severely affect the environment and water availability in a water-scarce country.

192
Large South African municipalities are clearly well advanced, by international standards, in applying financial modelling as an infrastructure investment planning tool. To a large degree, this is thanks to the support provided for model development and application by the Water Research Commission, the DBSA and government departments. This chapter has illustrated how individual cities have used modelling techniques for high-level strategic planning, long-range budgeting, service sector alignment and resource use projections. Modelling techniques have also served to inform national policy and national budget provisions.
The analysis has shown the successes of cities in South Africa in financing their operating activities for the wide range of services they provide. But it has also highlighted the problems experienced with raising capital, which relates to the overall financial viability of cities over the long term, as they have rapidly growing obligations to service poor households, provide a platform for the key economic sectors in the country and manage complex, large-scale assets. The more recent application of models has also shown the complexity cities face with regard to the environmental agenda. It is becoming increasingly important for cities to engage with the ‘green economy’ and change the nature of their investments.
conclUsIon
… individual cities have used modelling
techniques for high-level strategic planning, long-range
budgeting, service sector alignment and resource
use projections.

Tel: + 27 11 407 6471 • Fax: + 27 11 403 5230
P.O. Box 32160 • Braamfontein 2017
www.sacities.net
ISBN 978-0-620-56524-0
9 7 8 0 6 2 0 5 6 5 2 4 0