state of california alfred e. alquist seismic …ssc.ca.gov/about/meetings/agenda/20150813.pdf ·...
TRANSCRIPT

State Of California
ALFRED E. ALQUIST SEISMIC SAFETY COMMISSION
Governor Edmund G. Brown Jr.
Revised AGENDA
August 13, 2015 State Capitol, Room 437 Sacramento CA 95814
Time Item AGENDA Action 10:00 I. Call to Order
Roll Call Roll Call
10:05 II. Chairman’s Remarks • Welcome to Senator Cannella
Commissioner Timothy Strack
Discussion & Possible Action
10:10 III. Approval of June 11, 2015 Meeting Minutes Discussion & Possible Action
10:15 IV. Multi-Hazard Sensor Network at Lake Tahoe and Central Nevada Mr. Graham Kent, Nevada Earthquake Safety Council
Discussion & Possible Action
10:45 V. Progress Report on South Napa Earthquake Project Dr. Laurie Johnson, Pacific Earthquake Engineering Research Center
Discussion & Possible Action
11:15 VI. Progress Report on Recovery Modeling Within the Global Earthquake Model Mr. Chris Burton, Global Earthquake Model
Discussion & Possible Action
11:45 VII. Proposal: “The Value of a California Earthquake Early Warning System” Update on SB494 Mr. Mark Johnson, California Office of Emergency Services
Discussion & Possible Action
12:30 VIII. Earthquake Education/Outreach Project for Small Businesses (Phase II) Mr. Joel Ayala, Small Business Development Centers
Discussion & Possible Action
12:40 IX. Legislative Update Ms. Salina Valencia, Legislative Director, Seismic Safety Commission
Discussion & Possible Action
12:50 X. Executive Director’s Report • Budget • Filling Vacant Staff Services Manager I (Specialist) Position • October Meeting • Co-Sponsorship of “User Needs Workshop for the National Seismic
Hazard mapping Project” • Shake Table Demonstration at State Fair
Mr. Richard McCarthy, Executive Director, Seismic Safety Commission
Discussion & Possible Action
1:05 XI. Public Comment (Please complete a “Request to Speak” Form)
Discussion & Possible Action
1:10 XII. Miscellaneous & Good of the Meeting Discussion & Possible Action
1:15 XII. Adjourn Discussion & Possible Action
Next Meeting: October 8, 2015

1755 Creekside Oaks Drive, Suite 100 ▪ Sacram ento, CA 95833 ▪ 916-263-5506 ▪ fax 916-263-0594 ▪ email [email protected] ▪ www.seismic.ca.gov
* * * MEETING NOTICES
SIGN-UP & TIME LIMITS: If you wish to speak on an item, please fill out a “Request to Speak” form and give it to a staff person before the public hearing. The forms are available near the door to the meeting room. Time limits are indicated on the speaker sign-up forms and in case of questions or disputes the Chairman will determine the time limits for each speaker at the beginning of the public hearing. SUGGESTIONS FOR SUBMISSION OF WRITTEN MATERIALS. It is requested that written materials be submitted to the Commission staff prior to the meeting. If this is not possible it is requested that at least 30 copies be submitted to the Commission. This material will be distributed to the Commission members. Applicants are responsible for presenting their projects at the public hearing. NO FAXES will be accepted at the meeting site. You may be able to make prior arrangements with staff or a Commissioner to send a fax but you will be responsible for paying the hotel or meeting site for its receipt. CLOSED SESSION: The Commission may meet to consider possible and pending litigation in a session closed to the public pursuant to attorney-client privilege and statutory exception to the Open Meeting Act (Government Code §11126e). ACCESS TO HEARING: Meeting facilities are accessible to persons with disabilities. If you require special assistance, please contact any staff member prior to the meeting. An interpreter for the deaf will also be made available upon request to the staff at least five days prior to the meeting.

1755 Creekside Oaks Drive, Suite 100 ▪ Sacram ento, CA 95833 ▪ 916-263-5506 ▪ fax 916-263-0594 ▪ email [email protected] ▪ www.seismic.ca.gov
State Of California
ALFRED E. ALQUIST SEISMIC SAFETY COMMISSION
Governor Edmund G. Brown Jr.
Alfred E. Alquist Seismic Safety Commission State Capitol, Room 437 Sacramento, California
Minutes of Regular Meeting June 11, 2015
Members Present Members Absent Timothy Strack, Chairman Tracy Johnson, Vice Chair Greg Beroza Ken Cooley Michael Gardner Chet Widom Mark Ghilarducci (arrived at 10:08 a.m.) Randall Goodwin Staff Present Peggy Hellweg Helen Knudson Richard McCarthy, Executive Director Jim McGowan Robert Anderson, Engineering Geologist Kit Miyamoto (arrived at 11:51 a.m.) Fred Turner, Structural Engineer Ian Parkinson Salina Valencia, Legislative Director David Rabbitt Fuad Sweiss (arrived at 10:18 a.m.) Mark Wheetley (arrived at 10:09 a.m.) I. CALL TO ORDER AND ROLL CALL Commission Chairman Timothy Strack called the meeting to order at 10:06 a.m. and welcomed all participants. Legislative Director Salina Valencia called the roll and confirmed the presence of a quorum. II. CHAIRMAN’S REMARKS Chairman Strack welcomed everyone to the meeting. He announced that Commissioner Salud Carbajal had resigned and was running for Congress. III. APPROVAL OF APRIL 9, 2015 MEETING MINUTES Commissioner Peggy Hellweg reported that she had pointed out several minor typographical corrections to the staff.

2
ACTION: Commissioner Hellweg made a motion, seconded by Commissioner Michael Gardner, that:
The Commission approve the minutes of the April 9, 2015 meeting as amended. * Motion carried, 9 – 0 (Commissioners Mark Ghilarducci, Kit Miyamoto,
Fuad Sweiss, and Mark Wheetley absent during voting). IV. THE NEPAL EARTHQUAKE: LESSONS FOR CALIFORNIA Dr. Frank Webb, Deputy Manager, Earth Science Research & Formation Office, Jet Propulsion Laboratory (JPL), reported that JPL provided humanitarian and technical aid in response to the magnitude 7.8 earthquake that struck Nepal on April 25, 2015. He said the earthquake caused more than 8,700 fatalities and over 282,000 damaged homes. He noted that JPL worked with the National Aeronautics and Space Administration (NASA) to coordinate response and recovery efforts. Dr. Webb indicated that the Nepal earthquake was the first real-world test of the newly developed FINDER technology, a portable radar system that response workers can carry in backpacks and use to find people buried in rubble. He said FINDER proved its value in saving lives. He noted that JPL also worked with media representatives to develop appropriate public messaging after the earthquake. Dr. Webb stated that JPL worked with science agencies around the world to compile satellite data to identify broad-scale ground motion and produce damage and deformation maps that were helpful in prioritizing response efforts. He showed radar images of the affected area before and after the earthquake, and he pointed out particular locations where the earthquake effects were most devastating. He said the United States Geological Survey (USGS) used this data to update shake maps of the region, refine models, predict potential liquefaction and ground failure, and improve future hazards assessment. Dr. Webb added that the affected region is having problems now with landslides and widespread flooding as the result of heavy rains. Dr. Webb summarized key lessons for California from the Nepal earthquake. He stressed the importance of establishing relationships with response agencies and developing protocols prior to an event, and he noted that damage assessment based on radar images was valuable in planning humanitarian relief. Dr. Webb also recommended using FINDER technology as a tool in future search and rescue missions. Commissioner Greg Beroza asked if satellite data was available after the first day or if data acquisition required repeat passes by a number of satellites over the affected area. Dr. Webb replied that data from a number of satellite systems was aggregated. Commissioner Beroza asked if JPL practices its response efforts beforehand by participating in drills such as the statewide Golden Guardian exercise. Dr. Web responded that JPL participates in regular drills and practice sessions and will continue to do so.

3
Commissioner Hellweg asked how long it took to obtain good images of the affected area. Dr. Webb said an Italian satellite produced excellent “before” images that were compared with “after” images to identify damaged buildings and affected areas, and more “after” images were available within a day or two. He added that radar images take a bit longer. Commissioner Gardner asked if FINDER technology works in situations when search dogs and other technology are not available. Dr. Webb stated that FINDER radar can penetrate through 10 feet of rubble, so it works faster and better than using dogs. He added that FINDER was jointly developed by JPL, NSA, and the Department of Homeland Security. Chairman Strack noted that representatives from the search and rescue teams have been invited to make a presentation at the Commission’s August meeting about their rescue efforts, and more comprehensive information should be available by then. Executive Director Richard McCarthy reported that he met with JPL representatives in May at the CalOES headquarters to review JPL’s Phase 1 report showing the possible capabilities of its technology for California. Chairman Strack thanked Dr. Webb and JPL for their efforts. V. SIMULATION-BASED TOOLS FOR UNDERSTANDING AND ENHANCING
THE PROCESS OF POST-EARTHQUAKE RECOVERY Mr. McCarthy noted that the Commission is sponsoring a project with the Global Earthquake Model (GEM) to develop simulation tools that will identify policies and practices that tend to facilitate post-earthquake recovery. He introduced Dr. Henry Burton, Assistant Professor, University of California at Los Angeles, and GEM researcher, and invited him to discuss the project. Dr. Burton explained that the purpose of this Commission-sponsored project is to validate the efficacy of certain policies and actions in terms of their effect on post-earthquake recovery. He said GEM will create a simulation model integrated with the OpenQuake software platform that will allow policy-maker users to explore different “what-if” scenarios to determine which policies are most conducive to rapid recovery after a disaster. He noted that GEM is conducting case studies to validate its findings, and the purpose of the simulation tools is to quantify the trajectory of post-earthquake recovery and provide a measure of a particular community’s resilience. Dr. Burton stated that GEM’s research takes specific social and economic characteristics into account in analyzing the cumulative impacts of policies and programs on a given community. Dr. Burton observed that post-earthquake recovery is a complicated process, and research on the efficacy of policies is still in its infancy. He said GEM’s research focuses on housing and community actions, and he stressed the importance of gathering empirical data to support the simulation model. He then described the key components of the GEM simulation model: 1) The model uses functionality-based data to estimate building damage and quantify building performance; 2) The model allows for dynamic interaction by stakeholders to analyze effects of
4
their decisions; and 3) The model has the capability of forecasting the time parameters for repairing damage and restoring lifelines, also taking into account socioeconomic factors such as the availability of labor and financing. Dr. Burton said GEM researchers will continue to work on incorporating the simulation model in the OpenQuake software platform., collecting empirical data from past earthquakes, tailoring the model for specific use in California, and identifying a range of scenario events. Commissioner Randall Goodwin commented that this project is pertinent and supportive of the Commission’s work in revising the guidebook for local governments. He asked if GEM’s underlying assumptions in damage estimates were based on applicable construction codes. Dr. Burton replied that GEM researchers rely on HAZUS data and building inventories based on the type and era of construction. Commissioner Helen Knudson asked if GEM was focusing just on large earthquakes; Dr. Burton responded that the main case study is a magnitude 7.8 event. Commissioner Knudson asked if the research would include smaller events and actions individual homeowners and stakeholders can take. Dr. Burton acknowledged that both individual efforts and government policies were important, and he said the simulation model can be used as a tool to better understand how different policies affect recovery. Commissioner Mark Ghilarducci observed that this research has many potential applications, including assisting with initial damage assessments local governments need in order to apply for federal disaster assistance. He noted that there were protracted disputes after the Napa earthquake about the meaning of terms such as “major” and “destroyed,” because those definitions affected eligibility for Stafford Act funding. Commissioner Ghilarducci advocated further clarification of the criteria for the use of red and yellow tags in post-disaster building inspections. He said the level of inspection should also be defined, because some types of earthquake damage are not readily visible. Commissioner Greg Beroza asked if the GEM researchers planned to use the simulation model to identify factors that tend to optimize recovery efforts and recommend specific actions. Dr. Burton responded that the goal of the study is not optimization, but it allows users to change parameters to find out which actions have the greatest effect on recovery, and it provides a multitude of scenarios. Commissioner Beroza expressed his opinion that GEM was ideally positioned to offer advice to the recovery community on these issues. Dr. Burton said GEM can certainly be involved in that process. Commissioner Hellweg noted that each community has different decision-making considerations and processes, and she asked how users will be able to integrate their data and change the parameters in their scenarios. Dr. Burton recognized that there were elements of uncertainty in the GEM model, including the level of shaking and the level of damage. He stated that GEM intends to provide training workshops for users and will work with individual communities to explore their options.

5
Chairman Strack thanked Dr. Burton for his presentation. VI. UNIFORM CALIFORNIA EARTHQUAKE RUPTURE FORECAST Commissioner Beroza discussed the third update from the Uniform California Earthquake Rupture Forecast (UCERF), the 2014 UCERF3. He explained that UCERF develops official forecasts for the State of California, and this update provides more and better data and improved modeling technology. He said the 2008 UCERF2 had certain weaknesses that have been corrected in the current version. Commissioner Beroza stated that UCERF3 combines various sets of data from fault models, deformation models, and earthquake rate models; incorporates background probabilities using GPS measurements of the earth’s crust; and uses a logic tree to identify alternate fault models. Commissioner Beroza advised that UCERF3 results in new deformation models for the San Diego area, smoothed seismicity for the Redding area in northern California; a more realistic regional event rate for the Sacramento area for earthquakes over magnitude 5; revised scaling relationships for San Francisco, and it incorporates a time-dependent factor in probability models to take triggering and aftershocks into account. Commissioner Beroza noted that earthquake clusters or sequences have been reported after earthquakes in Landers, Turkey, New Zealand, Sumatra, and Nepal. VII. HOSPITAL BUILDING SAFETY BOARD ANNUAL REPORT Mr. Chris Tokas, Deputy Division Chief, Office of Statewide Health Planning and Development (OSHPD), presented the annual report of the Hospital Building Safety Board (HBSB) to the Commission. He began by describing the HBSB’s purpose, history, and areas of responsibility, and he reviewed the activities of the HBSB’s committees. Mr. Tokas reported that the Instrumentation Committee added three more hospitals to the list of facilities instrumented since 1989, bringing the total to 63. He said OSHPD supplies instruments to about three new hospitals per year, and the building code requires owners of certain hospitals to pay for and install instrumentation. Mr. Tokas discussed the status of OSHPD’s hospital retrofitting program, and presented charts showing the state’s inventory of hospital buildings, their seismic rankings, and the status of their compliance with SB 1953, a bill passed in 1994 that required demolition or strengthening of hospital buildings in California. He noted that the state’s inventory of SPC-1 buildings, the most hazardous group, has decreased to 314, and he showed a map of their locations. Mr. Tokas reported that HBSB’s Structural and Nonstructural Regulations Committee are proposing adding a new category, SPC-4D, to the 2016 version of the California Building Code. He explained that the SPC-4D categories will be used to help SPC-2 buildings upgrade to an SPC-4 level of safety. Mr. Tokas briefly reviewed some of the training programs and education efforts of the HBSB’s Education and Outreach Committee. He advised that the HBSB added a new Technology Committee in 2015.

6
Chairman Strack thanked Mr. Tokas for his report. IV. THE NEPAL EARTHQUAKE: LESSONS FOR CALIFORNIA (Continued) Chairman Strack welcomed Commissioner Miyamoto to the meeting and invited him to discuss his trip to Nepal. Commissioner Miyamoto said he arrived in Nepal two days after the April 25 earthquake, which resulted in 8,658 fatalities, over 500,000 houses destroyed, and displacing over 2 million people. He noted that the motion of the earthquake was unique, described as a strong, slow, swinging motion. He showed slides of some damaged buildings and observed that there was also considerable nonstructural damage. Commissioner Miyamoto showed pictures of high-rise condominium buildings constructed recently in Katmandu. He noted that these buildings met the life-safety building code, and only one person died as the result of a building failure. He added that there were problems with nonductile concrete buildings, brick buildings, and rock buildings constructed without mortar, and similar issues have been identified in California and elsewhere. Commissioner Miyamoto remarked that the people of Nepal will rebuild, but they need technical advice and knowledge regarding construction of schools and high-rise buildings, enhanced repair of walls, shear walls, dampers, and new technology. He noted that society expects more than life safety, but people do not understand that meeting the building code does not mean buildings are earthquake-proof. He showed pictures of metal shacks being used as temporary shelters, and he expressed concern that the upcoming monsoon season will create new problems. Commissioner Gardner asked whether the temporary shelters are on government property or private land. Commissioner Miyamoto answered that the shelters in Katmandu are mainly on government-owned property, but shelters in outlying villages tend to be on private land. Commissioner Beroza commented that Commissioner Miyamoto’s presentation was frightening, but that people already knew the “lessons” the earthquake revealed. He questioned whether this event will change public awareness. Commissioner Miyamoto said making people understand the building code provides a minimum level of life safety and having a disaster insurance program in place would be most helpful. He noted that developers would be able to market stronger buildings as more earthquake-resistant, and buildings might have more of an incentive to go beyond the code minimums. VIII. GUIDE TO IDENTIFY AND MANAGE SEISMIC RISKS OF BUILDINGS FOR
LOCAL GOVERNMENTS Commissioner Goodwin referred to the latest draft of the Commission’s guidebook for local governments regarding managing high-risk buildings. He said the manual is designed to assist elected officials and local government executives with suggestions for developing appropriate policies. Commissioner Goodwin noted the current version is the 14th revision, and it incorporates comments submitted by Commissioner Miyamoto and others.

7
Commissioner Goodwin highlighted the changes in the present draft. He noted the title was changed to eliminate the reference to “collapse-prone,” and the new title is “Guide to Identify and Manage Seismic Risks of Buildings for Local Governments.” He requested Commission approval to move ahead with graphic and editorial work so the document can be released. Commissioner Wheetley said he liked the graphics and the inclusion of success stories, and he asked about the possibility of including a North Coast jurisdiction as an example. Commissioner Goodwin and Mr. Turner expressed interest in that idea, and they welcomed a follow-up discussion with Commissioner Wheetley after the meeting. ACTION: Commissioner Hellweg made a motion, seconded by Commissioner Knudson,
that: The Commission authorize the committee and staff to finish the document and have it published. * Motion carried, 10 – 0 (Commissioners Parkinson, Rabbitt, and Strack
absent during voting; Mark Johnson voting for Commissioner Ghilarducci). IX. LEGISLATIVE UPDATE Legislative Director Salina Valencia advised that the Commission staff was monitoring three bills, SB 494 (Hills), creating a fund for the earthquake early warning system; AB 81 (Wood), extending a hospital seismic safety deadline; and SB 702 (Monning), providing funds for a voluntary new financing tool for the California Earthquake Authority. She clarified that the Commission does not adopt positions on pending legislation, but provides technical support and advice as requested. Ms. Valencia noted that the Legislature has until midnight on June 15 to pass the state budget bill, and the governor needs to sign the bill by July 1. Ms. Valencia observed that in response to California’s fourth year of drought, and Governor Brown issued an executive order on April 1 mandating substantial reductions in water usage. She said there are a number of other water-saving campaigns, and the state is allocating funds for emergency drought response legislation and expediting grants for water conservation projects. X. EXECUTIVE DIRECTOR’S REPORT Budget Mr. McCarthy drew attention to the latest budget projections. He noted that Contracted Fiscal Services is projecting a small year-end deficit at this point, but the actual figure will probably be less. He reported that the Commission received invoices for its work for the San Francisco Public Utilities Commission, the Diablo Canyon independent review panel, and on the Napa earthquake, and there is a small amount in unbilled research overhead costs being kept as a

8
reserve. Mr. McCarthy said he planned to wait 10 days and recalculate the figures, and he asked the Commission to authorize the staff to send an invoice to the Controller for the deficit amount. ACTION: Commissioner Knudson made a motion, seconded by Commissioner Wheetley,
that: The Commission authorize the staff to forward the invoice as proposed. * Motion carried, 11 – 0 (Commissioners Parkinson, Rabbitt, and Strack
absent during voting). Mr. McCarthy said he would send revised projections to all commissioners. Mr. McCarthy advised that the Commission asked Agency representatives to review the 2015-16 budget projections, and this topic will be discussed in more detail at the August meeting. He added that the staff will need to begin work soon in order to develop a budget change proposal (BCP) for 2016. He recommended that the Commission authorized the staff to develop a BCP if necessary, working with the Commission Chairman and Vice Chair. ACTION: Commissioner Wheetley made a motion, seconded by Commissioner Hellweg,
that: The Commission authorize the staff to develop a BCP as proposed. * Motion carried, 11 – 0 (Commissioners Parkinson, Rabbitt, and Strack
absent during voting). Commissioner Hellweg clarified that the Commission would not be seeking any funds from the state general fund, but only from the Commission’s existing funding source, the Insurance Fund. Mr. McCarthy confirmed that understanding. Filling Vacant SSM I Position Mr. McCarthy reported that the Commission was developing a job description and justification for filling the vacant SSM I position. He added that he hoped to interview candidates in July and have someone on board by August 1. Renew Commission Webpage Contract Mr. McCarthy said the Commission renewed its Webpage maintenance contract with the University of California at San Diego (UCSD). He noted that Mr. Michael Kleeman, UCSD, will be making a presentation at the October meeting, and there might be a way of transferring unused funds from that project to the Website contract.

9
California State Fair: Earthquake Exhibit Mr. McCarthy said the Commission is assisting with a preparedness exhibit at the California State Fair at Cal Expo that will feature a portable shake table and demonstrations for kids. XI. PUBLIC COMMENT Ms. Annie Kell, new outreach coordinator for the Nevada Seismological Lab, introduced herself and said she looks forward to working with the Commission. Mr. McCarthy welcomed Ms. Kell and noted that the Commission is looking for joint projects with Nevada. XII. MISCELLANEOUS AND GOOD OF THE MEETING Mr. McCarthy reminded commissioners to submit their expense claim forms to Ms. Sue Celli by June 15 so those expenses can be figured in the year-end budget totals. Mr. McCarthy noted that the August 13 meeting might be held telephonically, and he said the staff will let commissioners know as those plans develop. Commissioner Ghilarducci reported that the earthquake early warning working group is now working on a cost-benefit analysis. He said Mark Johnson met the previous day with telecom industry representatives who expressed concern about converting and integrating existing systems versus a ground-up approach. Commissioner Ghilarducci noted that he would be attending meetings the following week with the new Japanese consul general, Secretary Anna Caballero, and representatives from Japanese business associations. Commissioner Hellweg expressed interest in attending those meetings to discuss the early warning system. Commissioners congratulated Commissioner Gardner on his re-election on June 2. Commissioner Wheetley noted that immediately after the Commission meeting in Arcata on October 8, the Cascadia Project is holding three days of workshops that might be of interest to commissioners.

10
XIII. ADJOURN There being no further business, the meeting was adjourned at 1:01 p.m. ______________________________ Sue Celli Office Manager Approved by: ______________________________ Richard McCarthy Executive Director

State of California Seismic Safety Commission
Memo To: Richard J. McCarthy, Executive Director Commissioners
From: Robert Anderson, P.G., C.E.G.
Seismic Safety Commission 1755 Creekside Oaks Drive, Suite 100 Sacramento, CA 95833 (916) 263-5506
Date: August 13, 2015
Subject: Early Success of a MultiHazard Sensor Network at Lake Tahoe and Central Nevada Project Description: The Nevada Seismological Laboratory (NSL) at the University of Nevada, Reno (UNR) has embarked on a bold technical initiative, installing a high-speed (up to 100-150 Mb/sec) mountaintop-based Internet Protocol (IP) microwave network, or “Wilderness Internet”, enabling a myriad of sensor systems for Multi-Hazard Early Warning detection and response. In the Lake Tahoe Basin, this system is known as AlertTahoe, while a similar network is being installed in Central Nevada with support from the Bureau of Land Management. Unlike other early-warning systems, AlertTahoe does not rely on open-access public Internet services such as those provided by cellular service providers. Instead, it utilizes NSL’s private wireless communication network to collect data 24/7 in real-time from multiple sensors throughout the system. Utilizing this restricted-access private communication platform enhances system reliability, capability, capacity, and versatility for NSL staff and its community of certified users. Cameras on the network can be optimally placed for wildfire detection and are significantly less vulnerable to firestorms due infrastructure hardening and the ability to avoid extreme demands by the public on cellular and other networks during a crisis. The NSL system can provide a backup for emergency responders to use when public access communications become overwhelmed or fail during an event. The public can view these cameras year round through the AlertTahoe website (alerttahoe.seismo.unr.edu) and NSL's YouTube Channel (nvseismolab), allowing them to have “eyes on the basin” through real-time, on-demand time-lapse viewing Control of pan-tilt-zoom (PTZ) functionality is restricted to certified fire personnel. Seismic instruments from this network will soon be exported to the ShakeAlert system at UC Berkeley.

Page 2
Early Fire Detection: On June 20th, 2015, a report was issued for a potential file near Markleeville, CA. Within minutes of this report, the Snow Valley Peak, NV HD fire camera was pivoted toward the south, revealing a significant fire underway. Footage from a new camera at McClellan Peak (45 miles), near Carson City Nevada, revealed the fire ignition at least 1 hour earlier than reported, highlighting the need for crowd sourcing and machine vision to augment early detection through incident centers. This major fire was watched through its entire history with cameras situated at Snow Valley and McClellan Peaks, NV. On the afternoon of June 27th, a dry lightning storm struck the Tahoe basin with great potential for fire ignition. Once the storm broke, AlertTahoe cameras with on-demand time-lapse capabilities quickly discovered several fires; early detection helped keep these blazes to less than 1 acre in size. Fires have also been spotted in central NV (and Oregon from central NV, 104 miles away!) using this same technology. This process was repeated once again near Stateline, NV on July 19th, 2015. Unlike earthquake early warning systems, where the argument of ultimate savings is difficult at best (at least under present capabilities), fire early warning pays for itself quickly through early actionable intelligence (e.g., no early reconnaissance flights), and with the ultimate size of fires reduced in most cases due to early discovery and/or better situational awareness early on during the ignition stage. The AlertTahoe test-bed highlights the advantages of co-locating seismic and fire warning systems, and with El Nino brewing, extreme weather (i.e., ARkstorms) monitoring should also be included in this platform for total cost savings and better use of available spectrum. Recommendation: This is an informational item. Commissioners are encouraged to ask questions.

State of California Seismic Safety Commission
Memo To: Richard J. McCarthy, Executive Director Commissioners
From: Robert Anderson, P.G., C.E.G.
Seismic Safety Commission 1755 Creekside Oaks Drive, Suite 100 Sacramento, CA 95833 (916) 263-5506
Date: August 13, 2015
Subject: The Mw6 South Napa Earthquake of August 24, 2014, Project Update Project Description: Dr. Laurie Johnson from The Pacific Earthquake Engineering Research Center (PEER) will work cooperatively with a wide variety of organizations, companies and governmental entities to synthesize and analyze observations and studies resulting from the South Napa earthquake. The goal is to identify practical lessons and recommended actions to be considered by the California Seismic Safety Commission, as well as other governmental and private sector entities, to better prepare for and mitigate earthquake hazards and risks in California. Topic areas to be studied include seismological and geotechnical implications including early warning systems, earthquake effects on the built environment, lifeline systems and interdependencies, fire following earthquakes, disaster response and early recovery procedures, and socio-economic impacts. The intent of this work is not to develop a compendium of all information known about the South Napa earthquake but to convey specific findings and priority issues which should be addressed in advance of the next damaging earthquake in California. Contracting is in place. Work began in mid-July and various interviews including a short meeting with some of the CSSC Staff has been held already. The project is scheduled to conclude and a final report submitted to the CSSC by the end of January 2016. Recommendation: This is an informational item. Commissioners are encouraged to ask questions.


1
Preliminary Report Outline July 23, 2015
Working Title: “A Wake-up Call for Renewed Action: Findings and Recommendations from the M 6.0 South Napa Earthquake of August 24, 2014”
Desired report length ~ 20 pages
I. Preface (signed by the CSSC) II. Acknowledgments
III. Executive Summary (Emphasize the prioritized list of recommended actions) IV. Introduction
a. Brief basic statistics about the earthquake (magnitude, time of day, area impacted, casualties, damage, costs)
b. While not a large earthquake, the M6.0 South Napa Earthquake is one of the first damaging earthquakes to strike in the state’s major metropolitan areas in over two decades. This period of relative seismic quiescence has created a false sense of security, especially for the many new residents/industries that have no prior earthquake experience.
c. What’s changed in the last twenty years. Population/economic changes in California and metropolitan regions. Other changes/new knowledge around earthquakes/disaster management. Also acknowledge that State still recovering from 2008 recession and currently enduring worst drought on record
d. Other major earthquakes that have struck around the world with new insights and lessons
e. California nearly guaranteed to have a major damaging earthquake by 2050 – 3rd UCERF release
f. South Napa earthquake is our ‘wake-up call’ for renewed action and this report provides priorities for policymaking and action
V. Effects of the Earthquake VI. Insights from other Recent Earthquakes
a. Canterbury, New Zealand 2010-2011 earthquake sequence b. Great East Japan earthquake and tsunami 2011 c. Maule, Chile earthquake and tsunami 2010 d. Recent California earthquakes: San Simeon (2003) and Baja (2010) Also Haiti,
China, and Indonesia among others VII. Other Important changes/context (engineering and science, new technologies (real-time
earthquake monitoring and loss estimation, remote sensing, social

2
media/communications), market environment, political/government context (Insurance and lack of recovery resources, national/state disaster response/recovery frameworks)
VIII. Findings a. Introduction/context for the analysis
i. Success stories where current policies worked well and as intended ii. “Best practices” and practical, locally driven lessons that might be
considered for adoption by other jurisdictions/organizations iii. Issues related to existing policies and resilience practices that were not as
successful and may need refinement iv. New issues emerging from the earthquake and changing ‘context’,
recognizing State’s fiscal constraints b. Geosciences (earthquake early warning, faulting and afterslip, other ground
failures) c. Structures (Inspection process, new building and retrofit building performance
and issues, non-structural issues) d. Infrastructure (system performance and issues) e. People and Businesses (consumer protection issues, resident/business recovery
funding and issues, social/health issues, economic issues) f. Government and Other Institutions (disaster response coordination,
records/information management, access control and debris management, and recovery management)
IX. Recommendations

The M6 South Napa Earthquake of August 24, 2014: Policy Implications and Recommended Actions A Project for the California Seismic Safety Commission
Prepared by the Pacific Earthquake Engineering Research Center
Laurie A. Johnson PhD AICP1 Steve Mahin PhD2
Project Brief: The Pacific Earthquake Engineering Research Center (PEER) will work cooperatively with a wide variety of organizations, companies and governmental entities to synthesize and analyze observations and studies resulting from the South Napa earthquake. The goal is to identify practical lessons and recommended actions to be considered by the California Seismic Safety Commission, as well as other governmental and private sector entities, to better prepare for and mitigate earthquake hazards and risks in California. Topic areas to be studied include seismological and geotechnical implications including early warning systems, earthquake effects on the built environment, lifeline systems and interdependencies, fire following earthquakes, disaster response and early recovery procedures, and socio-economic impacts. We will also work to identify:
• Success stories where current policies worked well and as intended; • Best practices implemented before and following the South Napa earthquake that might be
considered for adoption by other jurisdictions and organizations; • Issues related to existing policies and mitigation practices that were not as successful as desired
and where further refinement may be needed; • Issues that were previously unanticipated and where new policies might be developed; and • Research and other studies that might be needed to develop, assess, and validate new policies
and practices. The intent of this work is not to develop a compendium of all information known about the South Napa earthquake but to convey specific findings and priority issues which should be addressed in advance of the next damaging earthquake in California. Work Plan: Work was formally initiated in July 2015, although preliminary work had already begun to gather resources and develop a working list of relevant policy implication topics. Work will progress quickly now that contracting is complete. On July 22nd, we met with a small group from the CSSC to review a preliminary report outline and working list of policy implication topics and resources, and to determine priority next steps in the work plan. During late July and early August, an initial round of interviews will be conducted with local, state, and federal agency contacts, emphasizing the collection of after-action report and developing a ‘boots on the ground’ real-world perspective on key issues, policy actions, and needs emerging from the earthquake and the recovery efforts. After assembling data and considering the policy implications, we will work to determine the needed public policy actions and a recommended prioritization and execution of the proposed actions. We will communicate and meet with a small, representative group of stakeholders (which may be assembled by the CSSC) to inform this 1 Laurie A. Johnson is an urban planner specializing in disaster recovery and catastrophe risk management. From 2011-2014, she co-chaired California’s Ad Hoc Tsunami Policy Working Group and co-authored the working group’s report California’s Tsunami Risk: A Call for Action, released in April 2014. She has also served as recovery planning and policy expert on the series of disaster scenarios developed by the USGS SAFRR (Science Application for Risk Reduction) program. She is Chair of the national Advisory Council on Earthquake Hazards Reduction (ACEHR) and a member of the Board of Directors of SPUR—the Bay Area’s public policy and good governance civic association. 2 Steve Mahin is the Byron and Elvira Nishkian Professor of Structural Engineering at U.C. Berkeley and the Interim Director of the Pacific Earthquake Engineering Research Center.

task. A report draft will be prepared and sent to the CSSC for review and comments by late September 2015 (3 months from contract execution). A final report will be issued within a month of receiving comments from CSSC. The project team will participate in a meeting convened by CSSC to discuss findings and recommended actions.

State of California Seismic Safety Commission
Memo
To: Seismic Safety Commissioners
From: Richard McCarthy Seismic Safety Commission 1755 Creekside Oaks Drive, Suite 100 Sacramento, CA 95833 (916) 263-5506 x 225
Date: August 3, 2015
Subject: Progress Report on Recovery Modeling Within the Global Earthquake Model
Project Update While losses are the outcome most commonly associated with earthquake events, it is increasingly becoming clear that some communities will have differing capacities to prepare for, to adjust to, and to recover from adverse impacts when they occur. Great emphasis is being placed on fostering disaster resilient communities. Since communities that can increase their resilience are in a better position to withstand adversity and to recover more quickly when damaging events occur. It is within this context that the Global Earthquake Model (GEM), with funding from the California Seismic Safety Commission, is developing a scientific framework and Open-source computational tools that may be used to generate community scale recovery projections. This will be accomplished by accounting for the probabilistic description of building damage, repair times, societal characteristics of communities, and the effectiveness of specific resilience-building actions during the preparedness, mitigation, and response phases of a disaster. At the core of this probabilistic framework is the performance-based assessment of building limit states (inspection, unoccupiable, demolition and collapse), but also pre-existing social and economic conditions within communities that are directly linked to differential recovery processes. This presentation will demonstrate the methods for incorporating socio-economic parameters into the recovery-modeling framework and tools under development in a meaningful and robust way. Work towards the proposal of a set of metrics for predicting recovery outcomes is being accomplished via real-world application using the 2014 South Napa earthquake as a case study. Here, a spatiotemporal assessment of the recovery of communities using in situ observations at six-month intervals is being used as an external validation metric to identify variables that might be sufficient for use in a predictive recovery-modeling framework. This work is concerned with the exploration of metrics covering social, economic, institutional, infrastructural, and community-based dimensions that may facilitate differential recovery outcomes.

2
Recommendation Staff recommends that the Commissioners listen to Mr. Chris Burton’s presentation and be prepared to ask questions.

1
Global Earthquake Model (GEM)/California Seismic Safety Commission: Recovery Modeling Project
Dr. Henry V. Burton Assistant Professor Department of Civil & Environmental Engineering University of California, Los Angeles 5732E Boelter Hall University of California Los Angeles, CA 90095 Dr. Christopher G. Burton Senior Scientist Coordinator Social Vulnerability and Integrated Risk Global Earthquake Model c/o Eucentre, Via Ferrata, 1 Pavia, 27100 Italy
Project Overview
A major earthquake occurring in one of the many large urban centers of California could lead to thousands of casualties, hundreds of thousands of displaced households and billions of dollars in losses. The lives of the impacted residents is likely to be enormously disrupted. The pace of recovery will depend among other things on the extent of building and lifeline damage, the extent of business disruption, the availability of utilities and how quickly communities can repair and replace their housing. Recent disasters like hurricane Katrina and super storm Sandy have demonstrated the need to facilitate speedy recovery of permanent housing in the affected communities. The immediate impact and pace of housing recovery is directly related to the likelihood of permanent outmigration of residents from the region. The overall goal of this project is to develop a scientific framework and computational tools to quantify the effectiveness of specific resilience-building actions (preparedness, mitigation, and response) that would increase the speed of recovery following an earthquake.
Goals and Scope
This project is concerned with the development and implementation of the scientific framework used in the GEM/CSSC recovery modeling project. The framework will build on an existing methodology developed by Dr. Henry V. Burton as part of his PhD work at Stanford (Burton 2014; Burton et al., 2015). This work includes the development of an open-source tool that takes in a probabilistic description of building damage, their repair times as well as other temporal parameters related to recovery, and generates a community scale recovery curve. At the core of the probabilistic framework is the performance-based assessment of building performance limit states (inspection, unoccupiable, demolition and collapse) that are explicitly linked to recovery. Building on the existing framework, this project will

2
develop a recovery model that accounts for the effect of the socio-economic standing and interactions of individual households with the broader environment. The following is an outline of the main objectives of the work:
1. Develop and document the post-earthquake recovery modeling methodology, the main components of which are:
• Develop fragility functions for southern California residential building typologies that link earthquake shaking intensity to the probability of exceedance of each of the recovery-based building limit states.
• Develop time-dependent functions that capture the trajectory of recovery at the household
level accounting for the uncertainty in the immediate post-earthquake limit state of the building.
• Incorporate the effect of “externalities” and socio-economic vulnerability into the
recovery function
• Aggregate building level recovery functions to produce regional/community level recovery curves
2. Develop an open source prototype tool (similar to the MATLAB tool developed by Burton, H.V.)
that takes as input, the probabilistic distribution of damage over a region and the necessary temporal parameters and generates a community-scale recovery curve as output.
3. Coordinate with OpenQuake developers to conduct a case study to assess the immediate post-earthquake impact and recovery of housing following the southern California Shake Out scenario earthquake.
It is noted that while the focus of the current project is applying the framework to the Southern California Shake Out scenario, the overall methodology is intended to be sufficiently general for use anywhere in the world. However, application of the framework to other regions will require the following:
• Developing fragility functions for the relevant building typology using the recovery-based performance limit states since the OpenQuake platform uses generic building damage states (none, slight, moderate etc.) that relate to the value of a building.
• Customizing the baseline temporal parameters (time to inspect building, lead time, repair time etc.) for the region of interest.
• Adapting the statistical relationships between various socio-economic factors and the trajectory of recovery
• The overall framework is specific to housing recovery and will ned to be adapted for application to other sectors (business, healthcare, education etc.)

3
Technical Approach
The four main components of the recovery modeling methodology are (1) recovery-based limit state fragility function development, (2) developing building-level time dependent recovery functions, (3) accounting for the effect of externalities and socio-economic vulnerability and (4) developing community/regional level recovery functions. These are discussed in detail in the following subsections.
Fragility Function Development
A rigorous evaluation of seismic resilience requires probabilistic methods for assessing limit states that influence post-earthquake functionality that can be incorporated in modeling the recovery of the building stock. The methodology incorporates a set of building performance limit states that specifically inform community seismic resilience (Figure 1). These limit states have been adapted from the building performance categories defined by SPUR. They include (i) damage triggering inspection, (ii) occupiable damage with loss of functionality, (iii) unoccupiable damage, (iv) irreparable damage and (v) collapse. These limit states are different from those that are currently used in OpenQuake and other risk modeling platforms. The fragility curves for these limit states are to be developed using a combination expert opinion (heuristic fragility curves), structural modeling and mapping of generic limit states (no damage, slight damage, moderate damage etc.) to recovery-based limit states. The following key tasks are needed to establish the new limit state fragility curves.
1. Conduct a detailed review of the residential building inventory used in the ShakeOut scenario (Jones et al., 2008) and document the taxonomy and their distribution.
2. Document the generic limit state fragility parameters for the building types from step 1
3. With input from the appropriate experts, map the generic limit state fragility parameters onto the recovery-based limit states. Steps 1 through 3 will be carried out to develop a “preliminary” set of fragility curves for the study
4. Construct two structural models (OpenSees) for selected building types and use these models to develop analytical fragilities for the generic and recovery-based limit states. The results of this study will be used to inform/modify the fragility curves developed in step 3.

4
Figure 1 Event tree showing limit states used to assess building-level recovery
Developing Building-Level Recovery Functions
Modeling the trajectory of recovery at the building level starts with defining five distinct recovery paths, each of which is explicitly linked to the recovery-based limit states discussed in the previous section. The recovery paths are described using discrete functional states and the time spent in each state. The functional states are used to represent the changing condition of the building with respect to its ability to facilitate its intended operation. It serves as the link between the previously described limit states and the measure of functionality. The functional states used to model the recovery of residential housing capacity include (1) the building is unsafe to occupy (NOcc), (2) the building is safe to occupy but unable to facilitate normal operations (OccLoss) and (3) the building is fully functional (OccFull). The building level recovery path is conceptually shown in Figure 2. It is a step function used to describe the time spent in each of the discrete functional states. The recovery path (and recovery function discussed later) is assessed over a pre-defined period of time referred to as the control time, TLC. TNOcc, TOccLoss and TOccFull are used to denote the time spent in the NOcc, OccLoss and OccFull functional states respectively. The time spent is each functional state is determined by the immediate post-earthquake limit state as well as the time associated with completing the necessary recovery activities. These times include (a) the time to inspect the building TINSP, (b) the time to perform any necessary engineering evaluations TASMT, (c) the time to mobilize for construction repairs/replacement TMOB and (d) the time to repair/replace the building TREP/TREPL. For this study, functionality is measured by the number of occupants in safe permanent housing. Each functional state is mapped to a quantifiable measure of functionality. This link between the functional states and the functionality measure is used to convert the recovery paths to the recovery functions. The key steps in computing the recovery functions include:
1. Establishing the recovery path for each limit state. This requires us to compute the time parameters (TINSP, TASMT, TMOB, TREP and TREPL) associated with each limit state. The inspection, assessment and mobilization times are to be determined from empirical data (Lomo Prieta, Northridge and Christchurch. The replacement times can be obtained from HAZUS. A FEMA P-58 assessment will be performed using the engineering demand parameters from the structural
no collapse
collapse LS5
inspection not triggered LS0
inspection triggered
irreparable damage LS4
repairable damage
building unsafe LS3
safe to occupy functionality
maintained LS1
loss of functionality LS2
clear and rebuild
continued function
demolish and rebuild
vacate until repaired
occupy during repairs
continued function

5
analyses (Step 4 of the “Fragility Function Development” section). The results of this assessment will be used to inform the repair times.
2. Adjusting lead time parameters (TINSP, TASMT, TMOB) to account for external and socio-economic effects. This is a key step in overall process. More details will be provided in the next section.
3. Mapping recovery paths to recovery functions. This is based on the relationship between the functional states and the measure of functionality. The functionality associated with the “not occupiable” and “fully functional” states is straightforward to compute. The functionality associated with the “occupiable with loss of function” state is less obvious. This needs to take into account the possibility of residents evacuating homes because of the loss of essential services. Ideally, the establishment of this relationship will incorporate empirical data from previous earthquakes.
Figure 2 Conceptual illustration of recovery path for individual buildings
Accounting for the effect of externalities and Socio-Economic Vulnerability on Recovery
Externalities are conditions outside of a building’s footprint that can impact post-earthquake recovery of functionality. Examples of these external effects include utility and lifeline disruption and loss of access due to ambient damage. Referring to Figure 1, externalities can be conceptualized as affecting the specified limit states and recovery times. In the case where the building is undamaged, i.e., LS0 or LS1, loss of functionality may occur as a result of external effects, such as utility disruption or damage to neighboring buildings, which renders an undamaged building inaccessible. In such cases, the recovery paths for these limit states can be modified by including the time to mitigate these external disruptions. Similarly, should the externality lead to disruptions that extend beyond the recovery time
FunctionalState
Time (days)
Not Occupiable (NOcc)
Occupiable Loss of Function (OccLoss)
TNOcc
Occupiable Fully Functional (OccFull)
TOccLoss TOccFull
TLC
6
required for other limit states (e.g., the repairs required for LS2), then these recovery times can be adjusted accordingly.
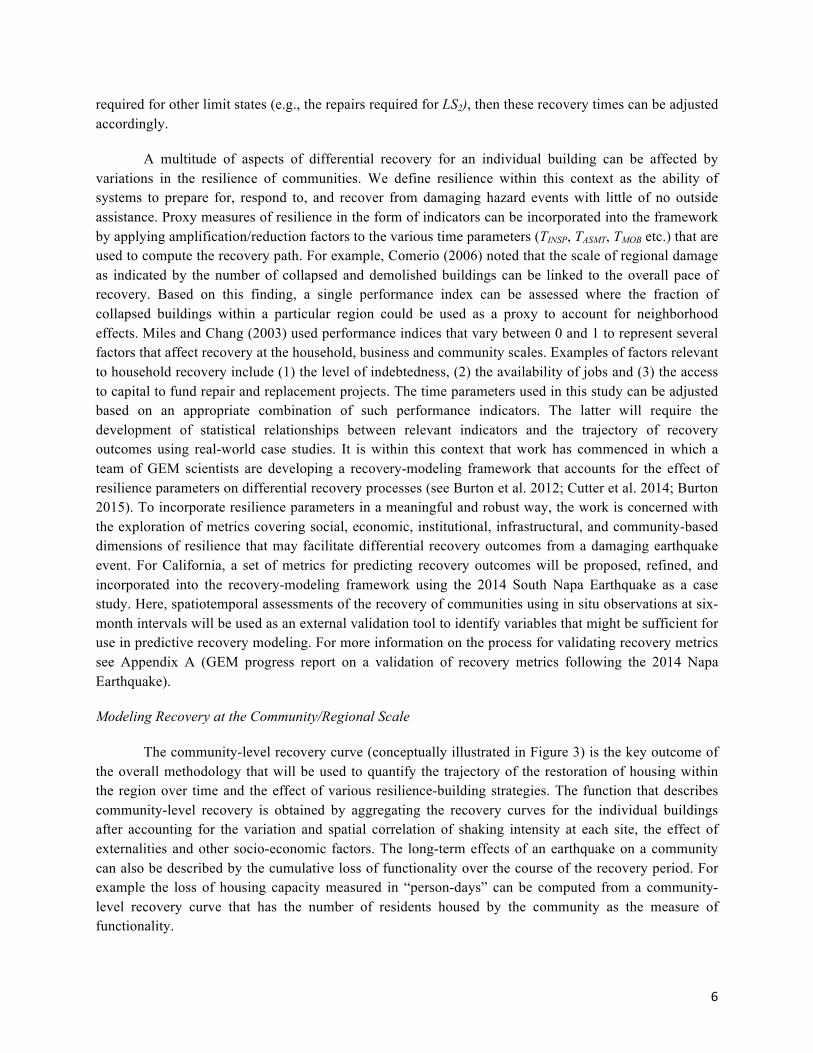
A multitude of aspects of differential recovery for an individual building can be affected by variations in the resilience of communities. We define resilience within this context as the ability of systems to prepare for, respond to, and recover from damaging hazard events with little of no outside assistance. Proxy measures of resilience in the form of indicators can be incorporated into the framework by applying amplification/reduction factors to the various time parameters (TINSP, TASMT, TMOB etc.) that are used to compute the recovery path. For example, Comerio (2006) noted that the scale of regional damage as indicated by the number of collapsed and demolished buildings can be linked to the overall pace of recovery. Based on this finding, a single performance index can be assessed where the fraction of collapsed buildings within a particular region could be used as a proxy to account for neighborhood effects. Miles and Chang (2003) used performance indices that vary between 0 and 1 to represent several factors that affect recovery at the household, business and community scales. Examples of factors relevant to household recovery include (1) the level of indebtedness, (2) the availability of jobs and (3) the access to capital to fund repair and replacement projects. The time parameters used in this study can be adjusted based on an appropriate combination of such performance indicators. The latter will require the development of statistical relationships between relevant indicators and the trajectory of recovery outcomes using real-world case studies. It is within this context that work has commenced in which a team of GEM scientists are developing a recovery-modeling framework that accounts for the effect of resilience parameters on differential recovery processes (see Burton et al. 2012; Cutter et al. 2014; Burton 2015). To incorporate resilience parameters in a meaningful and robust way, the work is concerned with the exploration of metrics covering social, economic, institutional, infrastructural, and community-based dimensions of resilience that may facilitate differential recovery outcomes from a damaging earthquake event. For California, a set of metrics for predicting recovery outcomes will be proposed, refined, and incorporated into the recovery-modeling framework using the 2014 South Napa Earthquake as a case study. Here, spatiotemporal assessments of the recovery of communities using in situ observations at six-month intervals will be used as an external validation tool to identify variables that might be sufficient for use in predictive recovery modeling. For more information on the process for validating recovery metrics see Appendix A (GEM progress report on a validation of recovery metrics following the 2014 Napa Earthquake).
Modeling Recovery at the Community/Regional Scale
The community-level recovery curve (conceptually illustrated in Figure 3) is the key outcome of the overall methodology that will be used to quantify the trajectory of the restoration of housing within the region over time and the effect of various resilience-building strategies. The function that describes community-level recovery is obtained by aggregating the recovery curves for the individual buildings after accounting for the variation and spatial correlation of shaking intensity at each site, the effect of externalities and other socio-economic factors. The long-term effects of an earthquake on a community can also be described by the cumulative loss of functionality over the course of the recovery period. For example the loss of housing capacity measured in “person-days” can be computed from a community-level recovery curve that has the number of residents housed by the community as the measure of functionality.

7
Figure 3 Community-scale recovery curve
Prototype Tool Development and Case Study
The following key algorithms, parameters and datasets are to be implemented into the prototype tool to enable recovery modeling and conducting the Southern California case study:
• Southern California building typologies and the fragility parameters for the associated recovery-based limit states.
• Lead time parameters and the algorithm for computing the external and socio-economic modifiers
• Recovery paths associated with recovery-based limit states
• Overall Framework Algorithm
o Generate probability distribution of recovery-based limit states for individual buildings given ground motion intensity and fragility parameters
o Generate building specific recovery paths based on the extent of damage
o Adjust recovery paths to account for external and socio-economic effects
o Generate “expected” recovery functions at the building level
o Aggregate building-recovery functions to obtain regional recovery function for shelter-in-place housing capacity
Housing Capacity
Time
Cumulative lossof occupancy
Recovery function
Immediate post-earthquakeloss of occupancy
Housing Capacity
Time
Cumulative lossof occupancy
Recovery function
Immediate post-earthquakeloss of occupancy

8
Additional Project Recommendations
We recommend that a four-person advisory panel be incorporated into the development of the scientific framework and the larger project as a whole. Two of the panel members will review the overall methodology. Their involvement will be limited to attending one or two meetings and the review of very brief material outlining the overall approach. The other two would provide insights regarding the development of the fragility parameters for wood frame timber structures which represent overwhelming majoring of residential occupancy in southern California. Their involvement would be limited to attending a single meeting and brief email/phone correspondence to field questions.
References
Burton, C.G., (2015). “A validation of metrics for community resilience to natural hazards and disasters using the recovery from Hurricane Katrina as a case study.” Annals of the Association of American Geographers, 105(1), 67-86.
Burton, H. (2014). “A rocking spine for enhanced seismic performance of concrete frames with infills.” Ph.D. dissertation, Dept. of Civil and Environmental Engineering, Stanford Univ., Stanford, CA.
Burton, H. V., Deierlein, G., Lallemant, D., Lin, T., “A framework for incorporating building performance limit states in the assessment of seismic resilience.” ASCE J. Struct. Eng. (in review)
Comerio, M. (2006). “Estimating downtime in loss modeling.” Earthquake Spectra, 22(2), 349-365.
Cutter, S.L., Schumann, R.L., and Emrich, C.T., (2014). “Exposure, social vulnerability and recovery disparities in New Jersey after Hurricane Sandy.” Journal of Extreme Events, 1(1), 1-23.
Miles, S. B., and Chang, S. E. (2003). “Urban disaster recovery: A framework and simulation model.” Multidisciplinary Center for Earthquake Engineering Research, MCEER-03-0005, Buffalo, NY.

1
Global Earthquake Model (GEM)/California Seismic Safety Commission: Recovery Modeling Project
Dr. Henry V. Burton Assistant Professor Department of Civil & Environmental Engineering University of California, Los Angeles 5732E Boelter Hall University of California Los Angeles, CA 90095 Dr. Christopher G. Burton Senior Scientist Coordinator Social Vulnerability and Integrated Risk Global Earthquake Model c/o Eucentre, Via Ferrata, 1 Pavia, 27100 Italy
Project Overview
A major earthquake occurring in one of the many large urban centers of California could lead to thousands of casualties, hundreds of thousands of displaced households and billions of dollars in losses. The lives of the impacted residents is likely to be enormously disrupted. The pace of recovery will depend among other things on the extent of building and lifeline damage, the extent of business disruption, the availability of utilities and how quickly communities can repair and replace their housing. Recent disasters like hurricane Katrina and super storm Sandy have demonstrated the need to facilitate speedy recovery of permanent housing in the affected communities. The immediate impact and pace of housing recovery is directly related to the likelihood of permanent outmigration of residents from the region. The overall goal of this project is to develop a scientific framework and computational tools to quantify the effectiveness of specific resilience-building actions (preparedness, mitigation, and response) that would increase the speed of recovery following an earthquake.
Goals and Scope
This project is concerned with the development and implementation of the scientific framework used in the GEM/CSSC recovery modeling project. The framework will build on an existing methodology developed by Dr. Henry V. Burton as part of his PhD work at Stanford (Burton 2014; Burton et al., 2015). This work includes the development of an open-source tool that takes in a probabilistic description of building damage, their repair times as well as other temporal parameters related to recovery, and generates a community scale recovery curve. At the core of the probabilistic framework is the performance-based assessment of building performance limit states (inspection, unoccupiable, demolition and collapse) that are explicitly linked to recovery. Building on the existing framework, this project will

2
develop a recovery model that accounts for the effect of the socio-economic standing and interactions of individual households with the broader environment. The following is an outline of the main objectives of the work:
1. Develop and document the post-earthquake recovery modeling methodology, the main components of which are:
• Develop fragility functions for southern California residential building typologies that link earthquake shaking intensity to the probability of exceedance of each of the recovery-based building limit states.
• Develop time-dependent functions that capture the trajectory of recovery at the household
level accounting for the uncertainty in the immediate post-earthquake limit state of the building.
• Incorporate the effect of “externalities” and socio-economic vulnerability into the
recovery function
• Aggregate building level recovery functions to produce regional/community level recovery curves
2. Develop an open source prototype tool (similar to the MATLAB tool developed by Burton, H.V.)
that takes as input, the probabilistic distribution of damage over a region and the necessary temporal parameters and generates a community-scale recovery curve as output.
3. Coordinate with OpenQuake developers to conduct a case study to assess the immediate post-earthquake impact and recovery of housing following the southern California Shake Out scenario earthquake.
It is noted that while the focus of the current project is applying the framework to the Southern California Shake Out scenario, the overall methodology is intended to be sufficiently general for use anywhere in the world. However, application of the framework to other regions will require the following:
• Developing fragility functions for the relevant building typology using the recovery-based performance limit states since the OpenQuake platform uses generic building damage states (none, slight, moderate etc.) that relate to the value of a building.
• Customizing the baseline temporal parameters (time to inspect building, lead time, repair time etc.) for the region of interest.
• Adapting the statistical relationships between various socio-economic factors and the trajectory of recovery
• The overall framework is specific to housing recovery and will ned to be adapted for application to other sectors (business, healthcare, education etc.)

3
Technical Approach
The four main components of the recovery modeling methodology are (1) recovery-based limit state fragility function development, (2) developing building-level time dependent recovery functions, (3) accounting for the effect of externalities and socio-economic vulnerability and (4) developing community/regional level recovery functions. These are discussed in detail in the following subsections.
Fragility Function Development
A rigorous evaluation of seismic resilience requires probabilistic methods for assessing limit states that influence post-earthquake functionality that can be incorporated in modeling the recovery of the building stock. The methodology incorporates a set of building performance limit states that specifically inform community seismic resilience (Figure 1). These limit states have been adapted from the building performance categories defined by SPUR. They include (i) damage triggering inspection, (ii) occupiable damage with loss of functionality, (iii) unoccupiable damage, (iv) irreparable damage and (v) collapse. These limit states are different from those that are currently used in OpenQuake and other risk modeling platforms. The fragility curves for these limit states are to be developed using a combination expert opinion (heuristic fragility curves), structural modeling and mapping of generic limit states (no damage, slight damage, moderate damage etc.) to recovery-based limit states. The following key tasks are needed to establish the new limit state fragility curves.
1. Conduct a detailed review of the residential building inventory used in the ShakeOut scenario (Jones et al., 2008) and document the taxonomy and their distribution.
2. Document the generic limit state fragility parameters for the building types from step 1
3. With input from the appropriate experts, map the generic limit state fragility parameters onto the recovery-based limit states. Steps 1 through 3 will be carried out to develop a “preliminary” set of fragility curves for the study
4. Construct two structural models (OpenSees) for selected building types and use these models to develop analytical fragilities for the generic and recovery-based limit states. The results of this study will be used to inform/modify the fragility curves developed in step 3.

4
Figure 1 Event tree showing limit states used to assess building-level recovery
Developing Building-Level Recovery Functions
Modeling the trajectory of recovery at the building level starts with defining five distinct recovery paths, each of which is explicitly linked to the recovery-based limit states discussed in the previous section. The recovery paths are described using discrete functional states and the time spent in each state. The functional states are used to represent the changing condition of the building with respect to its ability to facilitate its intended operation. It serves as the link between the previously described limit states and the measure of functionality. The functional states used to model the recovery of residential housing capacity include (1) the building is unsafe to occupy (NOcc), (2) the building is safe to occupy but unable to facilitate normal operations (OccLoss) and (3) the building is fully functional (OccFull). The building level recovery path is conceptually shown in Figure 2. It is a step function used to describe the time spent in each of the discrete functional states. The recovery path (and recovery function discussed later) is assessed over a pre-defined period of time referred to as the control time, TLC. TNOcc, TOccLoss and TOccFull are used to denote the time spent in the NOcc, OccLoss and OccFull functional states respectively. The time spent is each functional state is determined by the immediate post-earthquake limit state as well as the time associated with completing the necessary recovery activities. These times include (a) the time to inspect the building TINSP, (b) the time to perform any necessary engineering evaluations TASMT, (c) the time to mobilize for construction repairs/replacement TMOB and (d) the time to repair/replace the building TREP/TREPL. For this study, functionality is measured by the number of occupants in safe permanent housing. Each functional state is mapped to a quantifiable measure of functionality. This link between the functional states and the functionality measure is used to convert the recovery paths to the recovery functions. The key steps in computing the recovery functions include:
1. Establishing the recovery path for each limit state. This requires us to compute the time parameters (TINSP, TASMT, TMOB, TREP and TREPL) associated with each limit state. The inspection, assessment and mobilization times are to be determined from empirical data (Lomo Prieta, Northridge and Christchurch. The replacement times can be obtained from HAZUS. A FEMA P-58 assessment will be performed using the engineering demand parameters from the structural
no collapse
collapse LS5
inspection not triggered LS0
inspection triggered
irreparable damage LS4
repairable damage
building unsafe LS3
safe to occupy functionality
maintained LS1
loss of functionality LS2
clear and rebuild
continued function
demolish and rebuild
vacate until repaired
occupy during repairs
continued function

5
analyses (Step 4 of the “Fragility Function Development” section). The results of this assessment will be used to inform the repair times.
2. Adjusting lead time parameters (TINSP, TASMT, TMOB) to account for external and socio-economic effects. This is a key step in overall process. More details will be provided in the next section.
3. Mapping recovery paths to recovery functions. This is based on the relationship between the functional states and the measure of functionality. The functionality associated with the “not occupiable” and “fully functional” states is straightforward to compute. The functionality associated with the “occupiable with loss of function” state is less obvious. This needs to take into account the possibility of residents evacuating homes because of the loss of essential services. Ideally, the establishment of this relationship will incorporate empirical data from previous earthquakes.
Figure 2 Conceptual illustration of recovery path for individual buildings
Accounting for the effect of externalities and Socio-Economic Vulnerability on Recovery
Externalities are conditions outside of a building’s footprint that can impact post-earthquake recovery of functionality. Examples of these external effects include utility and lifeline disruption and loss of access due to ambient damage. Referring to Figure 1, externalities can be conceptualized as affecting the specified limit states and recovery times. In the case where the building is undamaged, i.e., LS0 or LS1, loss of functionality may occur as a result of external effects, such as utility disruption or damage to neighboring buildings, which renders an undamaged building inaccessible. In such cases, the recovery paths for these limit states can be modified by including the time to mitigate these external disruptions. Similarly, should the externality lead to disruptions that extend beyond the recovery time
FunctionalState
Time (days)
Not Occupiable (NOcc)
Occupiable Loss of Function (OccLoss)
TNOcc
Occupiable Fully Functional (OccFull)
TOccLoss TOccFull
TLC

6
required for other limit states (e.g., the repairs required for LS2), then these recovery times can be adjusted accordingly.
A multitude of aspects of differential recovery for an individual building can be affected by variations in the resilience of communities. We define resilience within this context as the ability of systems to prepare for, respond to, and recover from damaging hazard events with little of no outside assistance. Proxy measures of resilience in the form of indicators can be incorporated into the framework by applying amplification/reduction factors to the various time parameters (TINSP, TASMT, TMOB etc.) that are used to compute the recovery path. For example, Comerio (2006) noted that the scale of regional damage as indicated by the number of collapsed and demolished buildings can be linked to the overall pace of recovery. Based on this finding, a single performance index can be assessed where the fraction of collapsed buildings within a particular region could be used as a proxy to account for neighborhood effects. Miles and Chang (2003) used performance indices that vary between 0 and 1 to represent several factors that affect recovery at the household, business and community scales. Examples of factors relevant to household recovery include (1) the level of indebtedness, (2) the availability of jobs and (3) the access to capital to fund repair and replacement projects. The time parameters used in this study can be adjusted based on an appropriate combination of such performance indicators. The latter will require the development of statistical relationships between relevant indicators and the trajectory of recovery outcomes using real-world case studies. It is within this context that work has commenced in which a team of GEM scientists are developing a recovery-modeling framework that accounts for the effect of resilience parameters on differential recovery processes (see Burton et al. 2012; Cutter et al. 2014; Burton 2015). To incorporate resilience parameters in a meaningful and robust way, the work is concerned with the exploration of metrics covering social, economic, institutional, infrastructural, and community-based dimensions of resilience that may facilitate differential recovery outcomes from a damaging earthquake event. For California, a set of metrics for predicting recovery outcomes will be proposed, refined, and incorporated into the recovery-modeling framework using the 2014 South Napa Earthquake as a case study. Here, spatiotemporal assessments of the recovery of communities using in situ observations at six-month intervals will be used as an external validation tool to identify variables that might be sufficient for use in predictive recovery modeling. For more information on the process for validating recovery metrics see Appendix A (GEM progress report on a validation of recovery metrics following the 2014 Napa Earthquake).
Modeling Recovery at the Community/Regional Scale
The community-level recovery curve (conceptually illustrated in Figure 3) is the key outcome of the overall methodology that will be used to quantify the trajectory of the restoration of housing within the region over time and the effect of various resilience-building strategies. The function that describes community-level recovery is obtained by aggregating the recovery curves for the individual buildings after accounting for the variation and spatial correlation of shaking intensity at each site, the effect of externalities and other socio-economic factors. The long-term effects of an earthquake on a community can also be described by the cumulative loss of functionality over the course of the recovery period. For example the loss of housing capacity measured in “person-days” can be computed from a community-level recovery curve that has the number of residents housed by the community as the measure of functionality.

7
Figure 3 Community-scale recovery curve
Prototype Tool Development and Case Study
The following key algorithms, parameters and datasets are to be implemented into the prototype tool to enable recovery modeling and conducting the Southern California case study:
• Southern California building typologies and the fragility parameters for the associated recovery-based limit states.
• Lead time parameters and the algorithm for computing the external and socio-economic modifiers
• Recovery paths associated with recovery-based limit states
• Overall Framework Algorithm
o Generate probability distribution of recovery-based limit states for individual buildings given ground motion intensity and fragility parameters
o Generate building specific recovery paths based on the extent of damage
o Adjust recovery paths to account for external and socio-economic effects
o Generate “expected” recovery functions at the building level
o Aggregate building-recovery functions to obtain regional recovery function for shelter-in-place housing capacity
Housing Capacity
Time
Cumulative lossof occupancy
Recovery function
Immediate post-earthquakeloss of occupancy
Housing Capacity
Time
Cumulative lossof occupancy
Recovery function
Immediate post-earthquakeloss of occupancy

8
Additional Project Recommendations
We recommend that a four-person advisory panel be incorporated into the development of the scientific framework and the larger project as a whole. Two of the panel members will review the overall methodology. Their involvement will be limited to attending one or two meetings and the review of very brief material outlining the overall approach. The other two would provide insights regarding the development of the fragility parameters for wood frame timber structures which represent overwhelming majoring of residential occupancy in southern California. Their involvement would be limited to attending a single meeting and brief email/phone correspondence to field questions.
References
Burton, C.G., (2015). “A validation of metrics for community resilience to natural hazards and disasters using the recovery from Hurricane Katrina as a case study.” Annals of the Association of American Geographers, 105(1), 67-86.
Burton, H. (2014). “A rocking spine for enhanced seismic performance of concrete frames with infills.” Ph.D. dissertation, Dept. of Civil and Environmental Engineering, Stanford Univ., Stanford, CA.
Burton, H. V., Deierlein, G., Lallemant, D., Lin, T., “A framework for incorporating building performance limit states in the assessment of seismic resilience.” ASCE J. Struct. Eng. (in review)
Comerio, M. (2006). “Estimating downtime in loss modeling.” Earthquake Spectra, 22(2), 349-365.
Cutter, S.L., Schumann, R.L., and Emrich, C.T., (2014). “Exposure, social vulnerability and recovery disparities in New Jersey after Hurricane Sandy.” Journal of Extreme Events, 1(1), 1-23.
Miles, S. B., and Chang, S. E. (2003). “Urban disaster recovery: A framework and simulation model.” Multidisciplinary Center for Earthquake Engineering Research, MCEER-03-0005, Buffalo, NY.

Appendix A: GEM Progress Report on the Validation of Recovery Metrics Following the 2014 Napa Earthquake
While losses are the outcome most commonly associated with earthquake events, it is
increasingly becoming clear that some communities will have differential capacities to prepare for, to adjust to, and to recover from adverse earthquake impacts. Great emphasis is being placed on fostering disaster resilient communities as a result since communities that can increase their resilience are in a better position to withstand adversity and to recover more quickly when damaging events occur. It is within this context that the development of a scientific framework and computational tools to quantify the effectiveness of specific resilience-building actions that may increase the speed of recovery following an earthquake is taking place. The latter includes the development of an Open-source tool that accounts for the probabilistic description of building damage, repair times, as well as other temporal parameters related to recovery processes in order to generate community scale recovery projections. At the core of this probabilistic framework is the performance-based assessment of building performance limit states (e.g. unoccupiable, demolition, and collapse) that are explicitly linked to recovery. In addition, the work entails the incorporation of characteristics within communities, such as those that affect the resilience of communities, which are explicitly linked to differential recovery outcomes.
To incorporate parameters that affect recovery outcomes from an earthquake in a robust and meaningful way, work is being conducted that is concerned with the exploration of metrics covering social, economic, institutional, infrastructural, and community-based dimensions of resilience and their association with differential recovery outcomes. Here, a set of metrics for predicting recovery outcomes is being proposed, refined, and incorporated into the recovery-modeling framework being developed by Dr. Henry V. Burton (UCLA) via real-world application using the 2014 South Napa Earthquake as a case study (see GEM_CSSC_Project_Description). The selection of metrics is based upon a spatiotemporal assessment of the recovery of communities in Napa using in situ observations at six-month intervals that are being used as an external validation metric to identify variables that might be sufficient for use in predictive recovery modeling. The purpose of this work is to enhance our understanding of the multidimensional nature of recovery processes and to provide a validated set of variables (often referred to as indicators) that will be incorporated into the recovery-modeling framework by applying amplification/reduction factors to various time parameters. To accomplish this task, the following broad questions are being addressed:
a) What set of indicators provide the best comparative assessment of the recovery
potential of communities following a damaging earthquake event?
b) To what extent do these indicators predict a known and measureable outcome,
such as recovery from a damaging earthquake event?
Field method for long-term recovery assessment
The GEM team has commenced work on a spatiotemporal assessment of the recovery process following the 2014 South Napa Earthquake that will be used as an external validation metric to identify variables that may be sufficient for use in earthquake recovery prediction. Here, we are defining recovery as the process of reconstructing communities in order to return life, livelihoods, and the built environment to their pre-impact states. The recovery of a community includes a number of factors, yet the validation metric for this work focuses explicitly on the material manifestation of recovery in Napa (i.e. the reconstruction of the built environment), although the work is sensitive to the multifaceted nature of recovery. The

rational for considering the reconstruction of the built environment is that reconstruction is essential for returning life and livelihoods to pre-impact levels of functioning.
The validation portion of this project began with the development of a database of damages from the Napa earthquake event. Following the earthquake, the city of Napa geocoded damage observations, and the locations of the damaged buildings were made available via a web-‐based Geographic Information System. Using this information, we developed a GIS-‐based dataset that includes geocoded addresses of the damaged buildings within the city’s dataset, color-‐tagging information (red, yellow), and comments that include damage descriptions taken from the field surveys of the city officials. In total, evaluations of 1472 buildings were included in the database, 149 of the observations being red-‐tagged buildings and the remaining 1323 buildings representing yellow-‐ tagged buildings (Figure 1).
Figure 1. Database points of yellow and red-tagged buildings: Napa City and Napa County
From February 22nd to March 1st 2015, a field survey was conducted by a GEM research team using the damage database to collect in situ observations of the recovery occurring in the City of Napa on a building-‐by-‐building basis. Here, the recovery status of all red-‐tagged buildings and a random sample of yellow-‐tagged damaged structures was stringently evaluated and photographed. In addition, ancillary data was collected that includes information on the damaged building’s type, construction material, roof material, floor material, and occupancy status. Detailed notes were also taken that refer to the damage and recovery process that is taking place. Due to resource constrains it was not feasible to survey all the damaged buildings; thus, 400 out of the 1472 structures were selected for inspection (Figure 2). Structures with superficial damage or damages that occurred at the address but not affecting the primary structure such as carport damages, storage facility damages, and those that inaccessible for visual inspection were excluded from inspection the process.

Figure 2. Selection of points for recovery observations
A comparison of the sampled points from one time period to the next will permit a spatiotemporal representation of the recovery process for Napa City and will facilitate the development of a dependent variable that represents the time taken to recover for individual buildings and for communities. The GEM team of researchers will revisit the recovery points every six months for two-years following the event. The evidence of recovery is being input into a database using the GEM Inventory Data Capture Tools (IDCT)1 that enables users to collect and modify building exposure information. The evidence of recovery at each point is being evaluated to bin the progression of recovery into four basic categories that are codified as: 0, 1, 2 or 3 based on an exterior visual inspection. In this context, a score of 0 represents ‘No Recovery/Reconstruction’. A score of 1 is associated with the ‘Rebuilding of Structural Elements’, whereas a score of 2 represents the ‘Rebuilding of Non-structural Elements’ that may occur after the reconstruction of the building’s structural elements has taken place. A score of 3 represents a ‘Full Recovery’. More specifically, the ‘No Recovery’ category is concerned with a lack of any visible signs of recovery/reconstruction at a point. The ‘Rebuilding Structural Elements’ category accounts for on-going reconstruction to structural elements that include foundation and superstructure repairs. The ‘Rebuilding Non-structural Elements’ category is assigned when repairs to non-structural elements are in progress such as repairs to chimneys, veneer, exterior cladding and glazing, ceilings, stairs, windows, and doors. A ‘Full Recovery’ is only assigned when a building is fully repaired and occupied. The occupation of structures is subjectively determined using visual cues such as the absence of construction material on the property, the presence of personal vehicles in driveways, and the presence of personal belongings. Structures that were reconstructed, but vacant, are being binned in the ‘Rebuilding Non-structural Elements’ category. Figure 3 provides an example of each recovery category.
1 GEM Inventory Data Capture Tool (IDCT) http://www.globalquakemodel.org/what/physical-integrated-risk/inventory-capture-tools/

Figure 3. Example of recovery categorization: A) ‘No Recovery, b) ‘Rebuilding structural elements’, C) ‘Rebuilding non-structural elements’, D) ‘Full recovery’
It is important to acknowledge that recovery from different states of damage will not occur in an identical manner. For instance, the potential is great that a structure with only minor damage will not go through the full spectrum of recovery categorizations from impact to repair. It is therefore possible to obtain a recovery value further along the continuum where appropriate. In addition, it is important to note that the method captures only exterior recovery indicators, as interior access to the structures is not feasible. We acknowledge that structures that were identified as fully recovered or not recovered may have suffered extensive interior damage or have initiated interior reconstruction. In such cases, however, it is possible to understand the trajectory of the recovery of the building using ancillary cues such as information provided on the red or yellow tag that is posted on the building during the reconstruction process. In addition, data containing the date that a residence or business began to re-receive mail following the event may be used. This can be accomplished by using data obtained by the United States postal service.
Linking Recovery to Disaster Resilience Indicators
To identify variables associated with the recovery process in Napa, a multivariate regression modelling procedure will be utilized. A regression analysis will be used for the comparative portion of this work since regression provides a simplistic view of the relationship between variables. The regression models will incorporate recovery scores and/or recovery times (both deterministic and probabilistically generated) as response variables and proxy variables of disaster resilience/recovery ( ...X ) as predictor variables (see
section below). This procedure will allow for the prediction of Y (a recovery outcome at 6 months, one-year, 1.5-years, and two-years following the event) that is based on selected proxy variables of resilience ...X . Although the development of regression models
iX1 iX 2 i
i
iX1 iX 2 i

has been explored, regression-modelling particulars will be covered in later reports since regression model development will not take place until more data points are gathered via recovery observations.
Collection of Disaster Recovery Indicators
Since it is difficult to measure the ability of communities to recover from an earthquake event in relative terms, variables are being collected as proxy indicators to represent recovery potential within social, economic, infrastructural, institutional, and community subcomponents. As an initial step, a wish list of approximately 130 variables was compiled and is based upon two equally important criteria. First, variables are justified based on the recovery and/or disaster resilience literature and the variable's relevance to one or more of the five categories selected. A literature review of over 200 articles peer reviewed articles was conducted within this context. The second criterion is that variables must be scalable or available at multiple levels of geography. Out of the 130 variables on the wish list, fifty-eight have been collected, thus far, based on the two overarching criteria (Table 1).
The variable collection process is continuing to date, and the variable selection is consistent with the approach utilizing sub-components of resilience outlined in Burton (2015)2 and Cutter et al. (2010)3. Here, the first subcomponent (see Table 1), social resilience captures social capacities within communities, in addition to community health and well-being, and equity. Economic resilience is the second subcomponent and was designed to measure a community’s economic and livelihood stability, resource diversity, resource equity, and the exposure of a community’s economic assets. The third component, institutional resilience, covers hazard mitigation, planning, disaster preparedness, and urban development. Infrastructure resilience is the fourth component and is an evaluation of community response and recovery capacity. The final component is a community subcomponent (also known as community capital) that was designed to capture relationships that exist between individuals and their larger neighbourhood and community.
Table 1. Current list of proxy indicators of recovery potential (note: work in progress)
SOCIAL RESILIENCE Percent of households speaking English only and not limited English Percent of households with no presence of populations under 18 years Percent of households with no presence of population 60 years and over Percent of housing units with no persons with a disability Percent of the civilian non institutionalized population with any type of health insurance coverage Percent of the occupied housing units that have telephone service Percent of occupied housing units with a vehicle available Percent of the population 25 years and over that have at least a regular high school diploma Percent of the total population that is not a minority (or percent of the total population that is White alone, not Hispanic or Latino) Percent of the total population that is not elderly (under 65) Percent of the total population that is under 5 years Percent of the total population that is Hispanic or Latino Percent of the total population that is Black or African American alone Percent of the total population that is Asian alone Ratio non-white to white alone population Percent of occupied housing units that are owned occupied with a householder who is White alone, not 2 Burton C.G. (2015). A Validation of Metrics for Community Resilience to Natural Hazards and Disasters using the Recovery from Hurricane Katrina as a Case Study. Annals of the Association of American Geographers, 150(1): 67–86. 3 Cutter, S.L., Burton, C.G. and Emrich, C. (2010). Disaster Resilience Indicators for Benchmarking Baseline Conditions. Journal of Homeland Security and Emergency Management, 7(1): 1-22.

Hispanic or Latino Percent of occupied housing units that are renter occupied with a householder who is Hispanic or Latino Ratio no regular high school diploma to college degree for the population 25 years and over Number of child care services per 1000 population Average household size of occupied housing units Percent of the households with 5 persons and over Median age of the total population Percent of the households with a female householder, no husband present Percent of the total population that is American Indian and Alaska Native alone ECONOMIC RESILIENCE Percent of households with earnings in the past 12 months Median household income in the past 12 months Percent of owner occupied housing units without a mortgage Percent of population 16 years and over in labor force that is employed Percent of the population for whom poverty status is determined that has income in the past 12 months at or above poverty level Per capita income in the past 12 months (in 2013 inflation-adjusted dollars) Percent of the renter-occupied housing units with gross rent more than $1500 Percent of the civilian employed population 16 years and over that are not employed in food, accommodation and retail trade Percent of females 20 to 64 years in households that are in labor force Percent of occupied housing units that is owner occupied Percent of the civilian employed population 16 years and over that are employed in healthcare practitioners and technical occupations Percent of households with social security income in the past 12 months Percent of households with supplemental security income in the past 12 months Percent of households with public assistance income in the past 12 months Median value of owner occupied housing units Percent of the workers 16 years and over that work in place of residence INFRASTRUCTURE RESILIENCE Housing density Percent of housing units that are built after 1980 Percent of housing units that are not mobile homes Number of internet, television, radio and telecommunications broadcasters Number of schools (primary and secondary) Number of hotels & motels Number of banks Percent of housing units that are vacant Number of police, fire, emergency relief services and temporary shelters Percent of the housing units that are single family detached homes Percent of housing units with 2 or more units in structure Percent of housing units that are built before 1950 COMMUNITY CAPITAL Number of civic and social advocacy organizations per 1000 population Number of churches and religious organizations per 1000 population Number of arts, entertainment and recreation centers, libraries, museums, parks and historic sites per 1000 population Percent of the population 1 year and over living in a Metropolitan Statistical Area that lived in a different Metropolitan Statistical Area 1 year ago INSTITUTIONAL RESILIENCE Percent of the civilian employed population 16 years and over employed in emergency services (firefighting, law enforcement, protection)
Additional Data Requirements
Up until this point, this work conducted has been concerned exclusively with the development of spatiotemporal recovery metrics and the identification of a set of indicators

for predicting recovery outcomes. To predict recovery outcomes as effectively as possible, it will be beneficial to collect indicators that are not available from the United States Census, but may be available via other means. Here, the CSCC may be a beneficial partner in helping us to attain data via connections both publically and privately. Of utmost importance is the need to measure insurance coverage within the study area. High priority data that we wish to obtain is those that may facilitate the calculation of the percentage of households or housing units covered by earthquake insurance at the U.S. census block or block group level for the study area. Additional data of significance is data that relates to businesses within Napa County. Ideal attributes of businesses in Napa County include the size of businesses as determined by number of employees, annual revenues, exports, and business type as determined by NAICS codes. Such data is available via private enterprises such as InfoUSA (https://www.infousa.com/), but this data is at a high cost to be utilized exclusively as part of an exploratory analysis. Our hope is that such data may be freely available via other means. Finally, it may be beneficial to extend the analysis to selected areas of Napa County outside of Napa City. This would require input from the CSSC pertaining to the selection of respective study areas as well as data that delineates initial damages to structures following the Napa Earthquake so that a consistent methodology can be repeated for the respective study areas.

Recovery Modelling within the Global Earthquake Model (GEM) A project funded by the California Seismic Safety Commission (CSSC)
Christopher G. Burton; Henry V. Burton
While losses are the outcome most commonly associated with earthquake events, it is increasingly becoming clear that some communities will have differing capacities to prepare for, to adjust to, and to recover from adverse impacts when they occur. Great emphasis is being placed on fostering disaster resilient communities as a result since communities that can increase their resilience are in a better position to withstand adversity and to recover more quickly when damaging events occur. It is within this context that the Global Earthquake Model (GEM), with funding from the California Seismic Safety Commission, is developing a scientific framework and Open-source computational tools that may be used to generate community scale recovery projections. This will be accomplished by accounting for the probabilistic description of building damage, repair times, societal characteristics of communities, and the effectiveness of specific resilience-building actions during the preparedness, mitigation, and response phases of a disaster. At the core of this probabilistic framework is the performance-based assessment of building limit states (inspection, unoccupiable, demolition and collapse), but also pre-existing social and economic conditions within communities that are directly linked to differential recovery processes. This presentation will demonstrate the methods for incorporating socio-economic parameters into the recovery-modeling framework and tools under development in a meaningful and robust way. Work towards the proposal of a set of metrics for predicting recovery outcomes is being accomplished via real-world application using the 2014 South Napa Earthquake as a case study. Here, a spatiotemporal assessment of the recovery of communities using in situ observations at six-month intervals is being used as an external validation metric to identify variables that might be sufficient for use in a predictive recovery-modeling framework. This work is concerned with the exploration of metrics covering social, economic, institutional, infrastructural, and community-based dimensions that may facilitate differential recovery outcomes.

2014
Dat
a do
cum
eN
umer
o do
cCod
ice
p
D
escr
izio
ne c
onto
Forn
itore
Des
criz
ione
Mov
. Con
tabi
leD
escr
izio
ne d
ocum
ento
Dat
a pa
gam
entIm
port
o_to
tale
Exch
ange
rate
Exca
nge
rate
dat
eAm
ount
in U
SD22
/12/
2014
1764
/14
CSSC
Sp
ese
per a
llogg
io d
ipen
dent
i e c
olla
EUCE
NTR
E CE
NT
OSP
ITAL
ITA'
DES
POTA
KI31
/12/
2014
4,29
0.00
€
1.
2141
USD
31 D
ecem
ber 2
014
5,20
8.49
USD
29
/12/
2014
7654
CSSC
Co
mpe
nsi c
olla
bora
tori
STIP
ENDI
DIP
/ CO
LLAB
GEM
DIC
EMBR
E 20
14- S
CI.G
BURT
ON
- 10
% C
SSC
1ST
REPO
RT29
/12/
2014
482.
00€
1.
2141
USD
31 D
ecem
ber 2
014
585.
20U
SD
29
/12/
2014
7654
CSSC
O
neri
soci
ali c
olla
bora
tori
STIP
ENDI
DIP
/ CO
LLAB
GEM
DIC
EMBR
E 20
14- S
CI.G
BURT
ON
- 10
% C
SSC
1ST
REPO
RT29
/12/
2014
92.2
9€
1.
2141
USD
31 D
ecem
ber 2
014
112.
05U
SD
2015
Dat
a do
cum
eN
umer
o do
cCod
ice
p
D
escr
izio
ne c
onto
Forn
itore
Des
criz
ione
Mov
. Con
tabi
leD
escr
izio
ne d
ocum
ento
Dat
a pa
gam
entIm
port
o_to
tale
Exch
ange
rate
Exca
nge
rate
dat
eAm
ount
in U
SD28
/01/
2015
7771
CSSC
Co
mpe
nsi c
olla
bora
tori
STIP
ENDI
DIP
/ CO
LLAB
GEM
GEN
NAI
O 2
015-
SCI
.GEB
URT
ON
- 10
% C
SSC
1ST
REPO
RT28
/01/
2015
482.
00€
1.
1305
USD
31 Ja
nuar
y 20
1554
4.90
USD
28/0
1/20
1577
71CS
SC
One
ri so
cial
i col
labo
rato
riST
IPEN
DI D
IP/ C
OLL
AB G
EM G
ENN
AIO
201
5- S
CI.G
EBU
RTO
N -
10%
CSS
C 1S
T RE
PORT
28/0
1/20
1598
.71
€
1.13
05U
SD
31
Janu
ary
2015
111.
59U
SD
26
/02/
2015
7838
CSSC
Sp
ese
per a
llogg
io a
lber
ghi (
T)FI
ELD
TRIP
TO
NAP
A-AC
COM
MO
DATI
ON
DES
POTA
KACC
OM
MO
DATI
ON
DES
POTA
KI V
26/0
2/20
1549
7.72
€
1.12
40U
SD
28
Feb
ruar
y 20
1555
9.44
USD
26/0
2/20
1578
38CS
SC
Spes
e pe
r allo
ggio
alb
ergh
i (T)
FIEL
D TR
IP T
O N
APA-
ACCO
MM
ODA
TIO
N D
ESPO
TAKA
CCO
MM
ODA
TIO
N B
URT
ON
CHR
26/0
2/20
1549
7.72
€
1.12
40U
SD
28
Feb
ruar
y 20
1555
9.44
USD
27/0
2/20
1578
44CS
SC
Com
pens
i col
labo
rato
riST
IPEN
DI D
IP/ C
OLL
AB G
EM F
EBBR
AIO
201
5- S
CI.G
BURT
ON
- 10
% C
SSC
1ST
REPO
RT27
/02/
2015
482.
00€
1.
1240
USD
28 F
ebru
ary
2015
541.
77U
SD
27
/02/
2015
7844
CSSC
O
neri
soci
ali c
olla
bora
tori
STIP
ENDI
DIP
/ CO
LLAB
GEM
FEB
BRAI
O 2
015-
SCI
.GBU
RTO
N -
10%
CSS
C 1S
T RE
PORT
27/0
2/20
1598
.71
€
1.12
40U
SD
28
Feb
ruar
y 20
1511
0.95
USD
28/0
3/20
1580
26CS
SC
Com
pens
i col
labo
rato
riST
IPEN
DI D
IP/ C
OLL
AB G
EM M
ARZO
201
5- C
SSC.
DESP
OTA
KI, M
ARZO
201
528
/03/
2015
1,75
0.00
€
1.
0759
USD
31 M
arch
201
51,
882.
83U
SD
28/0
3/20
1580
26CS
SC
Rim
bors
i spe
se c
olla
bora
tori
STIP
ENDI
DIP
/ CO
LLAB
GEM
MAR
ZO 2
015-
CSS
C.DE
SPO
TAKI
, MAR
ZO 2
015
28/0
3/20
1513
.50
€
1.07
59U
SD
31
Mar
ch 2
015
14.5
2U
SD
28/0
3/20
1580
26CS
SC
One
ri so
cial
i col
labo
rato
riST
IPEN
DI D
IP/ C
OLL
AB G
EM M
ARZO
201
5- C
SSC.
DESP
OTA
KI, M
ARZO
201
528
/03/
2015
358.
40€
1.
0759
USD
31 M
arch
201
538
5.60
USD
23/0
3/20
1580
53CS
SC
Com
miss
ioni
ban
carie
(T)
RIM
BORS
O S
PESE
DES
POTA
KI P
ER F
IELD
WO
RK IN
NAP
A23
/03/
2015
2.50
€
1.
0759
USD
31 M
arch
201
52.
69U
SD
23/0
3/20
1580
53CS
SC
Rim
bors
i spe
se (T
)RI
MBO
RSO
SPE
SE D
ESPO
TAKI
PER
FIE
LDW
ORK
IN N
APA
23/0
3/20
1510
1.42
€
1.07
59U
SD
31
Mar
ch 2
015
109.
12U
SD
31
/03/
2015
2862
49CS
SC
Spes
e po
stal
i e sp
ediz
ioni
(T)
DHL
EXPR
ESS
ITAL
Y S.
R.L.
SPED
IZIO
NE
CON
TRAT
TO C
SSC
30/0
4/20
1527
.77
€
1.12
15U
SD
30
Apr
il 20
1531
.14
USD
28
/03/
2015
8025
CSSC
Co
mpe
nsi c
olla
bora
tori
STIP
ENDI
DIP
/ CO
LLAB
GEM
MAR
ZO 2
015-
SCI
.GEN
BURT
ON
- 10
% C
SSC
1ST
REPO
RT28
/03/
2015
500.
00€
1.
0759
USD
31 M
arch
201
553
7.95
USD
28/0
3/20
1580
25CS
SC
One
ri so
cial
i col
labo
rato
riST
IPEN
DI D
IP/ C
OLL
AB G
EM M
ARZO
201
5- S
CI.G
ENBU
RTO
N -
10%
CSS
C 1S
T RE
PORT
28/0
3/20
1510
2.40
€
1.07
59U
SD
31
Mar
ch 2
015
110.
17U
SD
28
/04/
2015
8037
CSSC
Co
mpe
nsi c
olla
bora
tori
STIP
ENDI
DIP
/ CO
LLAB
GEM
APR
ILE
2015
- CSS
C.DE
SPO
TAKI
28/0
4/20
151,
750.
00€
1.12
15U
SD
30
Apr
il 20
151,
962.
63U
SD
28/0
4/20
1580
37CS
SC
One
ri so
cial
i col
labo
rato
riST
IPEN
DI D
IP/ C
OLL
AB G
EM A
PRIL
E 20
15- C
SSC.
DESP
OTA
KI28
/04/
2015
358.
40€
1.
1215
USD
30 A
pril
2015
401.
95U
SD
07
/04/
2015
8094
CSSC
Sp
ese
viag
gi e
tras
fert
e (T
)AL
OHA
TOU
R VI
AGG
I DI F
EBBR
AIO
201
5FI
ELD
TRIP
TO
NAP
A, D
R. B
URT
ON
07/0
4/20
152,
091.
20€
1.12
15U
SD
30
Apr
il 20
152,
345.
28U
SD
28/0
4/20
1580
35CS
SC
Com
pens
i col
labo
rato
riST
IPEN
DI D
IP/ C
OLL
AB G
EM A
PRIL
E 20
15- S
CI.G
ENBU
RTO
N -
10%
CSS
C 1S
T RE
PORT
28/0
4/20
1550
0.00
€
1.12
15U
SD
30
Apr
il 20
1556
0.75
USD
28/0
4/20
1580
35CS
SC
One
ri so
cial
i col
labo
rato
riST
IPEN
DI D
IP/ C
OLL
AB G
EM A
PRIL
E 20
15- S
CI.G
ENBU
RTO
N -
10%
CSS
C 1S
T RE
PORT
28/0
4/20
1510
2.40
€
1.12
15U
SD
30
Apr
il 20
1511
4.84
USD
28/0
5/20
1581
90CS
SC
Com
pens
i col
labo
rato
riST
IPEN
DI D
IP/ C
OLL
AB G
EM M
AGG
IO 2
015-
CSS
C.DE
SPO
TAKI
28/0
5/20
151,
750.
00€
1.09
70U
SD
31
May
201
51,
919.
75U
SD
28/0
5/20
1581
90CS
SC
One
ri so
cial
i col
labo
rato
riST
IPEN
DI D
IP/ C
OLL
AB G
EM M
AGG
IO 2
015-
CSS
C.DE
SPO
TAKI
28/0
5/20
1535
8.40
€
1.09
70U
SD
31
May
201
539
3.16
USD
28/0
5/20
1581
89CS
SC
Com
pens
i col
labo
rato
riST
IPEN
DI D
IP/ C
OLL
AB G
EM M
AGG
IO 2
015-
SCI
.GE
BURT
ON
- 10
% C
SSC
1ST
REPO
RT28
/05/
2015
500.
00€
1.
0970
USD
31 M
ay 2
015
548.
50U
SD
28
/05/
2015
8189
CSSC
O
neri
soci
ali c
olla
bora
tori
STIP
ENDI
DIP
/ CO
LLAB
GEM
MAG
GIO
201
5- S
CI.G
EBU
RTO
N -
10%
CSS
C 1S
T RE
PORT
28/0
5/20
1510
2.40
€
1.09
70U
SD
31
May
201
511
2.33
USD
23/0
6/20
1582
9/15
CSSC
Sp
ese
per a
llogg
io d
ipen
dent
i e c
olla
EUCE
NTR
E CE
NT
OSP
ITAL
ITA'
DES
POTA
KI G
ENN
AIO
- G
IUG
NO
201
529
/06/
2015
6,43
5.00
€
1.
1189
USD
30 Ju
ne 2
015
7,20
0.12
USD
28
/06/
2015
8360
CSSC
Ri
mbo
rsi s
pese
col
labo
rato
riST
IPEN
DI D
IP/ C
OLL
AB G
EM G
IUG
NO
201
5- S
CI.G
ENBU
RTO
N -
CSSC
PRO
JECT
FIE
LDW
O
28
/06/
2015
231.
53€
1.
1189
USD
30 Ju
ne 2
015
259.
06U
SD
28
/06/
2015
8360
CSSC
Co
mpe
nsi c
olla
bora
tori
STIP
ENDI
DIP
/ CO
LLAB
GEM
GIU
GN
O 2
015-
SCI
.GEN
BURT
ON
- 10
% C
SSC
1ST
REPO
RT28
/06/
2015
500.
00€
1.
1189
USD
30 Ju
ne 2
015
559.
45U
SD
28
/06/
2015
8360
CSSC
O
neri
soci
ali c
olla
bora
tori
STIP
ENDI
DIP
/ CO
LLAB
GEM
GIU
GN
O 2
015-
SCI
.GEN
BURT
ON
- 10
% C
SSC
1ST
REPO
RT28
/06/
2015
102.
40€
1.
1189
USD
30 Ju
ne 2
015
114.
58U
SD
28
/06/
2015
8361
CSSC
Co
mpe
nsi c
olla
bora
tori
STIP
ENDI
DIP
/ CO
LLAB
GEM
GIU
GN
O 2
015-
CSS
C.DE
SPO
TAKI
28/0
6/20
151,
750.
00€
1.11
89U
SD
30
June
201
51,
958.
08U
SD
28/0
6/20
1583
61CS
SC
One
ri so
cial
i col
labo
rato
riST
IPEN
DI D
IP/ C
OLL
AB G
EM G
IUG
NO
201
5- C
SSC.
DESP
OTA
KI28
/06/
2015
358.
40€
1.
1189
USD
30 Ju
ne 2
015
401.
01U
SD
14
/07/
2015
8463
CSSC
Sp
ese
viag
gi e
tras
fert
e (T
)AS
SICU
RAZI
ON
E DE
SPO
TAKI
PER
NAP
A FI
ELD
WO
RK14
/07/
2015
47.4
3€
1.
1025
USD
28 Ju
ly 2
015
52.2
9U
SD
28/0
7/20
1584
69CS
SC
Spes
e vi
aggi
e tr
asfe
rte
(T)
SHU
TTLE
DES
POTA
KI D
A N
APA
A SF
O14
/07/
2015
89.7
1€
1.
1025
USD
28 Ju
ly 2
015
98.9
1U
SD
28/0
7/20
1584
68CS
SC
Com
pens
i col
labo
rato
riST
IPEN
DI D
IP/ C
OLL
AB G
EM L
UG
LIO
201
5- S
CI.G
ENBU
RTO
N -
10%
CSS
C 1S
T RE
PORT
28/0
7/20
1550
0.00
€
1.10
25U
SD
28
July
201
555
1.25
USD
28/0
7/20
1584
68CS
SC
One
ri so
cial
i col
labo
rato
riST
IPEN
DI D
IP/ C
OLL
AB G
EM L
UG
LIO
201
5- S
CI.G
ENBU
RTO
N -
10%
CSS
C 1S
T RE
PORT
28/0
7/20
1510
2.40
€
1.10
25U
SD
28
July
201
511
2.90
USD
28/0
7/20
1584
69CS
SC
Com
pens
i col
labo
rato
riST
IPEN
DI D
IP/ C
OLL
AB G
EM L
UG
LIO
201
5- C
SSC
DESP
OTA
KI28
/07/
2015
1,75
0.00
€
1.
1025
USD
28 Ju
ly 2
015
1,92
9.38
USD
28
/07/
2015
8469
CSSC
O
neri
soci
ali c
olla
bora
tori
STIP
ENDI
DIP
/ CO
LLAB
GEM
LU
GLI
O 2
015-
CSS
CDE
SPO
TAKI
28/0
7/20
1535
8.40
€
1.10
25U
SD
28
July
201
539
5.14
USD
TRAV
ELS
(tra
nspo
rts,
hot
els,
reim
burs
emen
ts, e
tc3,
570.
23€
3,99
8.05
USD
CA
R CO
LLEG
E 10
,725
.00
€
12,4
08.6
1U
SD
HO
NO
RARI
A +
DEBI
T N
OTE
S15
,289
.71
€
16,9
58.6
9U
SD
O
THER
S (b
ank
char
ges,
ship
men
t, et
c)30
.27
€
33.8
3U
SD
29,6
15.2
1€
33
,399
.18
USD


State of California Seismic Safety Commission
Memo To: Richard J. McCarthy, Executive Director Commissioners
From: Robert Anderson, P.G., C.E.G.
Seismic Safety Commission 1755 Creekside Oaks Drive, Suite 100 Sacramento, CA 95833 (916) 263-5506
Date: August 13, 2015
Subject: Update on SB 494 and Consideration for Funding Proposal “The Value of a California Earthquake Early Warning System” Background: Senate Bill 494 (Hill) would establish the California Earthquake Safety Fund. This fund would be used to fund seismic safety and earthquake related programs as well as the development of an earthquake early warning system. Prior Legislation (SB 135 (Padilla)) led to the establishment of an Earthquake Early Warning Working Group (Working Group) led by the Governor’s Office of Emergency Services. The Working Group has identified the need for a study to identify the value of an earthquake early warning system to businesses, utilities and various elements in state and local government and solicit input from them on what an effective warning system should be from the user’s perspective. This study would be supported by the Commission’s Research Fund and be completed within sixty days of signing the contract. Recommendation: Staff recommends that the Commission approve the above request for funding the proposal. Attachments: Proposal “The Value of a California Earthquake Early Warning System” OES Agenda Report: SB 494 and Contract Proposal: “The Value of an Earthquake Early Warning System”


1 Revised July 23, 2015
The Value of a California Earthquake Early Warning System: Analysis of Benefits to Businesses and Other Key Sectors
SCOPE OF WORK
PURPOSE The California Governor’s Office of Emergency Services, in partnership with the California Seismic Safety Commission, is seeking consultant services to prepare a business case for a California Earthquake Early Warning System. The objective is to establish the system’s value to the business community and key sectors in order to promote public and employee safety, enhance business resiliency, and protect infrastructure critical to local communities and the economy. This project is an initial step toward what will likely be a more comprehensive analysis over time, and as the system is developed. BACKGROUND In 2013, as a result of legislation an earthquake early warning working group was formed to develop a comprehensive statewide earthquake early warning system through a public private partnership. Preliminary estimated costs for earthquake early warning build out and ongoing operation are in the tens of millions; however the value and cost savings that can result from such a system are yet to be calculated. Given the importance of this initiative and sizeable investment, it is imperative that the state conduct an objective analysis to assess, validate, and ultimately demonstrate the value of an earthquake early warning system. DELIVERABLES The selected consultant will collaborate with the Project Manager appointed by the Governor’s Office of Emergency Services and the California Seismic Safety Commission to complete the project. As part of the contract, the consultant will conduct a survey and interview business, utility and other representatives to assess how an earthquake early warning system will benefit key sectors. Potential benefits could include, but are not limited to, protection of health/safety and assets, injury and loss prevention, speed of service restoration. The consultant will be required to interview both technical and management experts within each sector. The proposed system is currently being developed by the State of California under the framework of the California Integrated Seismic Network and its partner agencies. The results of the consultant’s research, interviews and analysis will be summarized in a written report prepared for the Governor’s Office of Emergency Services and the California Seismic Safety Commission. The deliverables for this project are further defined and outlined in the task list below.

2 Revised July 23, 2015
TASKS The consultant must confer with the Project Manager on all aspects of the following tasks, including design of questions, approval of points of contact, and approval of the sample selection of interviewees. The consultant will perform all work required to gather information needed to develop a preliminary cost-benefit analysis, including:
1. Define what the state would like to see in an early warning system and why it is important to reduce earthquake losses and injuries.
2. Summarize what the state has done to date through the Cal OES Earthquake Early Warning Working Group.
3. Develop a summary of what other countries have an early warning system and for how long.
4. Develop a questionnaire for use to survey and interview 10 selected organizations. Sample questions should include, but are not limited to:
a. Do you see any value in installing and utilizing early warning in order to mitigate potential threats to public and employee safety, or business losses due to earthquake damage?
b. What needs to change to make the Earthquake Early Warning viable for business and industry use?
c. Do you have any specific applications in mind in which an Earthquake Early Warning System would be beneficial?
d. Do you see any risks or negative considerations of an earthquake early warning system?
5. Interview a minimum of ten (10) selected organizations after they have reviewed the
material defined above. Organizations shall include, but are not limited to:
a. Financial Sector b. Electric Utility Sector c. Gas Utility Sector d. Water Utility Sector e. Telecommunications Sector f. Public Safety Sector (Fire, Law Enforcement, EMS) g. Hospital / Medical Service Sector h. Education Sector i. Mass Transit Sector j. Insurance Sector
6. Summarize the results from the questionnaire/interviews and present them in a written
report.

3 Revised July 23, 2015
7. As appropriate, identify additional analysis that may be needed based on the findings and results of this project.
TIMEFRAME The contactor must achieve all tasks within sixty (60) calendar days from contract execution.
ACCEPTANCE CRITERIA It shall be the State’s sole determination as to whether a deliverable has been successfully completed and acceptable to the State. There must be a signed acceptance document for each deliverable before invoices can be processed for payment. Acceptance criteria shall consist of the following:
1. Reports on written deliverables are completed as specified and approved. 2. All deliverables must be in a format that can be used by the State. 3. If a deliverable is not accepted, the State shall provide the rationale in writing within five
(5) business days of receipt of the deliverable or upon completion of acceptance testing period.
OTHER REPORTING REQUIREMENTS The contractor will develop and provide ad hoc reports as deemed appropriate and necessary by the State. STATE RESPONSIBILITIES Provide access to business and technical documents as necessary for the contractor to complete the tasks identified in the department’s purchase document. TRAVEL All travel costs are included in the award amount. AWARD AMOUNT This contract will not exceed $49,999.00

4 Revised July 23, 2015
Exhibit A Periodic Progress Report
Project Name: Consultant: Project Manager: Date of Report:
TASK Due in 30 Days Due in 60 Days Task 1: Define what the state would like to see in an early warning system and why it is important to reduce earthquake losses and injuries.
� Initiated � In Progress � Complete % Complete_____
� Initiated � In Progress � Complete % Complete_____
Task 2: Summarize what the state has done to date through the Cal OES Earthquake Early Warning Working Group.
� Initiated � In Progress � Complete % Complete_____
� Initiated � In Progress � Complete % Complete_____
Task 3: Develop a summary of what other countries have an early warning system and for how long.
� Initiated � In Progress � Complete % Complete_____
� Initiated � In Progress � Complete % Complete_____
Task 4: Develop a questionnaire for use to survey and interview 10 selected organizations.
� Initiated � In Progress � Complete % Complete_____
� Initiated � In Progress � Complete % Complete_____
Task 5: Interview selected organizations after they have reviewed the material defined above.
� Initiated � In Progress � Complete % Complete_____
� Initiated � In Progress � Complete % Complete_____
Task 6: Summarize the results from the questionnaire/interviews and present them in a written report.
� Initiated � In Progress � Complete % Complete_____
� Initiated � In Progress � Complete % Complete_____
Task 7: As appropriate, identify additional analysis that may be needed based on the findings and results of this project.
� Initiated � In Progress � Complete % Complete_____
� Initiated � In Progress � Complete % Complete_____
Signed:__________________________________________________Date:_________________

1
CALIFORNIA SEISMIC SAFETY COMMISSION
AGENDA REPORT AGENDA OF: August 13, 2015 FROM: Governor’s Office of Emergency Services SUBJECT: SB494 Update and Contract Proposal: “The Value of a California Earthquake Early Warning System.” ________________________________________________________________________ I. RECOMMENDED ACTION
That the Commission:
A. Receive a briefing on the status of Senate Bill 494. B. Authorize work to select a contractor to conduct an initial benefits analysis of a
California Earthquake Early Warning System. C. Authorize funding to conduct the study and prepare a report.
. II. BACKGROUND
The California State Legislature is currently considering SB494. As drafted, this bill would create the California Earthquake Safety Fund and would require moneys in the fund, upon appropriation by the Legislature, be used for seismic safety and earthquake-related programs, including the earthquake early warning system described above. The bill would authorize the fund to accept federal funds, funds from revenue bonds, local funds, and funds from private sources for purposes of carrying out its provisions, and would make conforming changes. In support of the development of an earthquake early warning system, Cal OES is seeking Commission authorization and funding to hire a consultant to prepare a report citing the benefits of the system. The objective is to establish the system’s value to the business community and key sectors in order to promote public and employee safety, enhance business resiliency, and protect infrastructure critical to local communities and the economy. The consultant should have experience in economic analysis and investment justification.
In 2013, as a result of SB135, an earthquake early warning working group was formed to develop a comprehensive statewide earthquake early warning system through a public private partnership. Preliminary estimated costs for earthquake early warning system build out and ongoing operation have been prepared by the partner agencies of the California Integrated Seismic Network; however the value and cost savings that can result from such a system are yet to be calculated. Given the importance of this initiative and sizeable investment, it is imperative that an objective analysis be conducted to assess, validate, and ultimately demonstrate the value of an earthquake early warning system. As part of the study, the selected consultant will conduct a survey and interview business, utility and other representatives to assess how an earthquake early warning system will

2
benefit key sectors. Potential benefits could include, but are not limited to, protection of health/safety and assets, injury and loss prevention, speed of service restoration. The consultant will be required to interview both technical and management experts within each sector. The results of the consultant’s research, interviews and analysis will be summarized in a written report prepared for the Governor’s Office of Emergency Services and the California Seismic Safety Commission.
III. ANALYSIS
A. Current Situation Preliminary benefits of an earthquake early warning system have been identified by the CISN partner agencies, including USGS, UC Berkeley, Caltech, CGS and Cal OES. During recent meetings between Cal OES and electric, gas, wireless and other industry representatives, the need was identified for a detailed report that establishes the system’s value to the business community and other key sectors.
B. Why the Report is Needed
This report will support the development of an earthquake early warning system by providing specific examples of benefits obtained from sector representative on how they can or will use the system to promote public and employee safety, enhance business resiliency, and protect infrastructure critical to local communities and the economy.
IV. CONCLUSION
Cal OES will continue to work with the partner agencies to develop the California Earthquake Early Warning System. If approved, SB494 will provide a governance structure for administering the system. In addition, a report that outlines the system benefits to the business community and other key sector will be helpful to gain their support for program administration. This project is an initial step toward what will likely be a more comprehensive analysis over time, and as the system is developed.
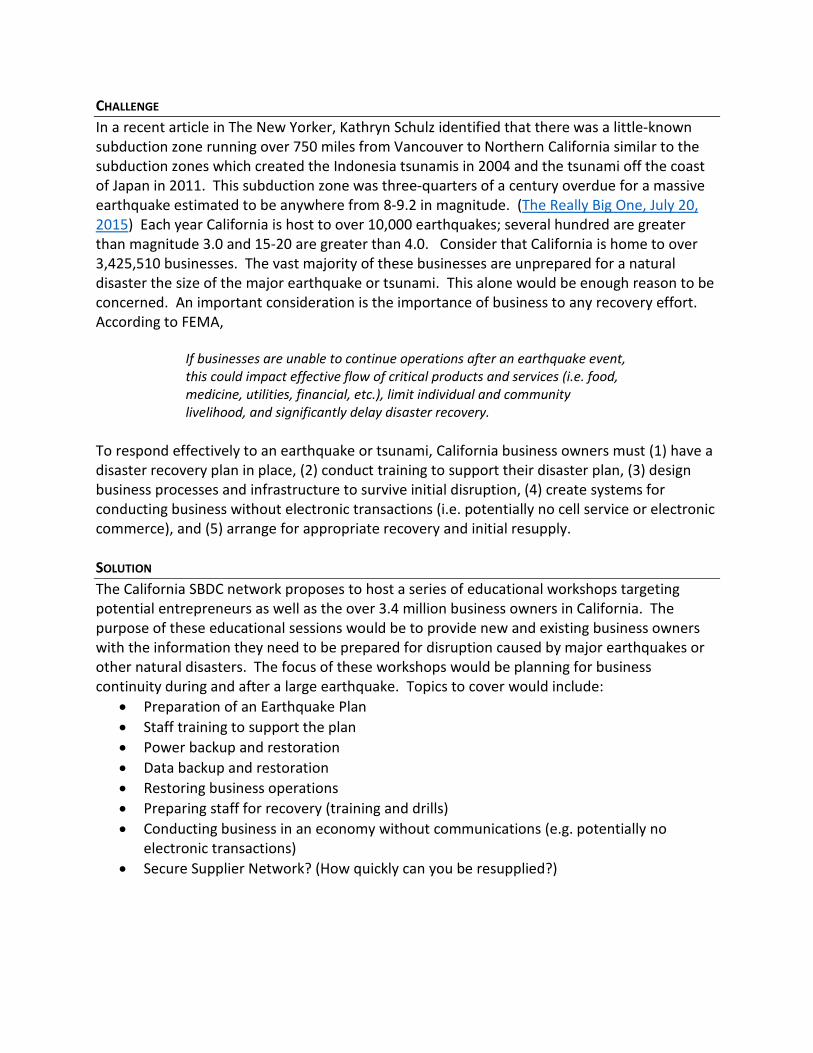
CHALLENGE In a recent article in The New Yorker, Kathryn Schulz identified that there was a little-known subduction zone running over 750 miles from Vancouver to Northern California similar to the subduction zones which created the Indonesia tsunamis in 2004 and the tsunami off the coast of Japan in 2011. This subduction zone was three-quarters of a century overdue for a massive earthquake estimated to be anywhere from 8-9.2 in magnitude. (The Really Big One, July 20, 2015) Each year California is host to over 10,000 earthquakes; several hundred are greater than magnitude 3.0 and 15-20 are greater than 4.0. Consider that California is home to over 3,425,510 businesses. The vast majority of these businesses are unprepared for a natural disaster the size of the major earthquake or tsunami. This alone would be enough reason to be concerned. An important consideration is the importance of business to any recovery effort. According to FEMA,
If businesses are unable to continue operations after an earthquake event, this could impact effective flow of critical products and services (i.e. food, medicine, utilities, financial, etc.), limit individual and community livelihood, and significantly delay disaster recovery.
To respond effectively to an earthquake or tsunami, California business owners must (1) have a disaster recovery plan in place, (2) conduct training to support their disaster plan, (3) design business processes and infrastructure to survive initial disruption, (4) create systems for conducting business without electronic transactions (i.e. potentially no cell service or electronic commerce), and (5) arrange for appropriate recovery and initial resupply. SOLUTION The California SBDC network proposes to host a series of educational workshops targeting potential entrepreneurs as well as the over 3.4 million business owners in California. The purpose of these educational sessions would be to provide new and existing business owners with the information they need to be prepared for disruption caused by major earthquakes or other natural disasters. The focus of these workshops would be planning for business continuity during and after a large earthquake. Topics to cover would include:
• Preparation of an Earthquake Plan • Staff training to support the plan • Power backup and restoration • Data backup and restoration • Restoring business operations • Preparing staff for recovery (training and drills) • Conducting business in an economy without communications (e.g. potentially no
electronic transactions) • Secure Supplier Network? (How quickly can you be resupplied?)

ABOUT THE CALIFORNIA SBDC NETWORK California’s Small Business Development Center (SBDC) Network is one of the state’s primary resource partners for small business development. Our consortium of 42 service centers and administrative lead centers play a leading role in driving the state economy by providing small businesses and entrepreneurs with confidential, no-cost advising and expert training and establishing a wide mesh network of technical assistance. Our network is equipped to help business owners access capital, development business and financial models, create and implement marketing strategies, connect to global markets, and grow their business online, among many other services. We are proud to count ourselves as part of a family of resource providers in the State of California that enable business owners to make the next big leap with their firms. The California SBDC network works closely with the 65,000 businesses and entrepreneurs across California annually, providing low cost training and over 78,373 hours of one-on-one assistance through one of our 42 California SBDC service centers and 106 outreach locations around California. Through these efforts, the California SBDC annually assists entrepreneurs to:
• Create 920 new businesses • Create 5,435 new jobs • Increase sales by $343,664,562 • Raise over $535,540,000 in new capital

CALIFORNIA’SSMALL BUSINESSDEVELOPMENT CENTERS
www.californiasbdc.org

PartnersPartners
130+LocationsLLooocccaaatititionononss
400+ Advisors400AAddvivisosorsrs
65,000+
Clients
Specializing in the Core Areas
of BusinessOur SBDC advisors, many of
whom are current and former business owners, possess an
incredible array of knowledge and expertise in: Business
Planning • Financing • Marketing • Human Resources • Operations
Management • Government Procurement • Export Assistance •
Technology Commercialization • Online Businesses
LeveragingResourcesCA SBDC is comprised of a consortium of member institutions and public and private partners, including: Governor’s Office of Business and Economic
Development • California State Board of Equalization • California
Seismic Commission • UC Regents • California State Universities (CSU) •
California Community Colleges • Major private universities • California’s cities •
Economic development agencies • Chambers of commerce • Banks • Private partners
Essential for Small Businesses
In 2014, the CA SBDC advised and trained more than 60,000 clients through its core
small business and specialty programs .
Servicing Every Area of California
Through six lead centers and 42 service centers and more than 90 outreach
centers, the CA SBDC has a wide reach to the California small business
community.
EMPOWERING BUSINESS COMMUNITIES
California SBDC’s Continuing Focus on Other Key InterestsBusiness Continuity
Disaster Preparedness
Emergency Readiness
Infrastructure Development
Broadband Access
High Speed Rail Procurement
Certification and Contract Qualification
Export and Trade Delegation Assistance
Layoff Aversion, ETP and Workforce Development
Youth and Encore Entrepreneurship
Technology Commercialization and Innovation
Advanced Manufacturing
Minority Business Development
Veterans
A Partner with Extensive Networks

DRIVINGLOCAL ECONOMIC DEVELOPMENT
California SBDC 2014 Economic Impact
HOURS OF 1:1 ADVISING WITH BUSINESS OWNERS
78,373INCREASE IN SALES FOR
SBDC CLIENTS
$343,664,562
IN CAPITAL INFUSION(LOANS AND EQUITY)
$535,540,334
NEW BUSINESSES CREATED
920 NEW JOBS CREATED
5,435
JOBS RETAINED
3,190
CLIENT SUCCESS
Working with the SBDC, I realized that I
Z Living System, San Luis Obispo, CA
SBDC, Gorilla Stationers was able to
Gorilla Stationers, Huntington Beach, CA
It’s A Deal Rentals, Redondo Beach, CA

NORTHERN CALIFORNIA NETWORKNORCALSBDC.ORG(707) 826-3919
Aptos – Central Coast SBDC (831) 479-6136
Berkley-Tech Futures Group (415) 494-7232
Eureka – North Coast SBDC (707) 445-9720
Fairfield – Solano SBDC (707) 864-3382
Fort Bragg – Mendocino SBDC (707) 964-7571
San Jose - Hispanic Satellite SBDC (408) 248-4800
Napa – Napa - Sonoma SBDC (707) 253-3210
Oakland – Alameda County SBDC (510) 208-0410
Pleasant Hill – Contra Costa SBDC (925) 602-6840
San Francisco – San Francisco SBDC (415) 937-7232
San Jose – Silicon Valley SBDC (408) 248-4800
San Mateo – San Mateo SBDC(650) 574-6402
San Rafael – Marin SBDC (415) 755-1100
Santa Rosa- Napa-Sonoma SBDC (707) 595-0060
Ukiah- Mendocino SBDC (707) 467-5931
NORTHEASTERN CALIFORNIA NETWORK NECSBDC.ORG(530) 898-5443
Chico – NEC SBDC at Butte College(530) 895-9017
Mt Shasta- NEC SBDC at JEDI NEW! (530) 926-6670
Redding – NEC SBDC Shasta Cascade NEW! (530) 222-8323
Sacramento –NEC SBDC Capital Region NEW! (916) 319-4268
Stockton – SBDC at San Joaquin Delta College(209) 954-5089
Truckee- SBDC at Sierra Business Council NEW! (530) 582-5022
UC MERCED NETWORKSBDC.UCMERCED.EDU(559) 241-7406
Bakersfield – CSU Bakersfield SBDC(661) 654-2856
Fresno – Fresno State SBDC Fresno/Madera(559) 347-3903
Modesto/Merced – The Alliance SBDC(209) 567-4910
Salinas – CSU Monterey Bay SBDC (831) 422-6239
San Luis Obispo – Cal Poly SBDC for Innovation(805) 756-5171
Visalia – Fresno State SBDC Tulare/Kings(559) 625-3051
ORANGE COUNTY/INLAND EMPIRE NETWORKLEADSBDC.ORG(657) 278-2719
Aliso Viejo – LaunchPad SBDC(949) 330-6565
Palm Springs – Coachella Valley SBDC(760) 340-1575
Pasadena – SBDC at Pasadena City College(626) 585-3106
Santa Clarita-SBDC at College of the Canyons (661)-362-5900
Westchester -Westchester Outreach Center NEW (800)-794-1402
SAN DIEGO AND IMPERIAL NETWORK//WWW.SDIVSBDC.ORG/(619) 216-6721
El Centro – Imperial Valley SBDC(760) 312-9800
Carlsbad – North San Diego SBDC(760) 795-8740
National City – South San Diego SBDC(619) 482-6391
NORTHERN CA NETWORK
NORTHEASTERN CA NETWORK
UC MERCED NETWORK
LOS ANGELES NETWORK
ORANGE COUNTY/INLAND EMPIRE NETWORK
SAN DIEGO AND IMPERIAL NETWORK
JOEL AYALA, STATEWIDE LIAISON,
CALIFORNIA SBDC
[email protected](714) 720-3604
LEAD CENTERS
SERVICE CENTERS
OUTREACH LOCATIONS
California Small Business Development Center Network Service Areas
Riverside – Inland Empire SBDC(951) 781-2345
Riverside – TriTech SBDC(951) 571-6480
Santa Ana – Orange County SBDC(714) 564-5200
LOS ANGELES NETWORKSMALLBIZLA.ORG(562) 938-5020
Beverly Hills- Beverly Hills Chamber Outreach Center NEW!(800) 794-1402
Camarillo – SBDC at EDC-Ventura County(805) 384-1800
Hawthorne – SBDC at EI Camino College(310) 973-3177
La Verne – SBDC at University of La Verne(909) 448-1567
Long Beach – SBDC at Long Beach City College(562) 938-5100
Los Angeles – SBDC at Pacific Coast Regional(213) 674-2696
Los Angeles – Bixel Exchange Emerging Technology Center at Los Angeles Area Chamber of Commerce(213) 580-7587