state narrative for georgia
TRANSCRIPT
1
Maternal and Child Health Services Title V Block Grant
State Narrative for
Georgia
Children 1-22
Application for 2015 Annual Report for 2013

2
National Performance Measures
Performance Measure 07: Percent of 19 to 35 month olds who have received full
schedule of age appropriate immunizations against Measles, Mumps, Rubella, Polio, Diphtheria, Tetanus, Pertussis, Haemophilus Influenza, and Hepatitis B.
Tracking Performance Measures [Secs 485 (2)(2)(B)(iii) and 486 (a)(2)(A)(iii)]
Annual Objective and Performance Data 2009 2010 2011 2012 2013
Annual Performance Objective 85 77 75.1 76.6 79.7
Annual Indicator 69.3 73.9 83.9 77.9 79.3
Numerator 138467 145466 164312 150748 162793
Denominator 199808 196842 195843 193515 205304
Data Source NIS NIS NIS NIS NIS
Check this box if you cannot report the numerator because 1.There are fewer than 5 events over the last year, and 2.The average number of events over the last 3 years is fewer than 5 and therefore a 3-year moving average cannot be applied.
Is the Data Provisional or Final? Final Final Provisional
2014 2015 2016 2017 2018
Annual Performance Objective 81.3 81.7 81.7 81.9
Notes-2013
Numerator data were calculated using the annual indicators and the denominator.
Annual indicators were updated based on the annual indicators retrieved from http://www.cdc.gov/vaccines/imz-managers/coverage/nis/child/data/tables-2012.html on May 15, 2014. Series 4:3:1:3:3:1 for Georgia. This file can be downloaded from the top of the website in the second box labeled "Coverage with Individual Vaccines and Vaccination Series by State (includes birth dose of HepB and 2+doses Hep A)" (download name: tab03_antigen_state) We have chosen to use this series even though it includes Varicella in order to maintain consistency across years and calculate trends.
Denominator data for 2007-2012 were updated based on reviewing OASIS figures.
Linear projections were used to derive population estimates and the annual indicator for 2013. The numerator for 2013 was derived by multiplying the annual indicator with the denominator.
Notes - 2012
Data retrieved from http://www.cdc.gov/vaccines/stats-surv/nis/data/tables_2011.htm on May 28th, 2013. 2011 data were updated with final numbers based on NIS. Linear projections were used to derive population estimates and the annual indicator for 2012.
Notes - 2011
2009 - tables retrieved from http://www.cdc.gov/vaccines/stats-surv/nis/data/tables_2009.htm on May 18th, 2012. 2010 - tables retrieved from http://www.cdc.gov/vaccines/stats-surv/nis/data/tables_2010.htm on

3
May 18th, 2012. The 2007 estimate was updated to 79.6 using the table: http://www.cdc.gov/vaccines/stats- surv/nis/data/tables_2007.htm retrieved on May 18th, 2012.
2011 indicator estimate is based on a linear projection of data for 2007 - 2010.
The denominator was derived from population estimates provided by OASIS. Linear projections for the population estimates were made for 2011.
The number of 19-35 months old is estimated by taking the number of children age 1 year, dividing by 12 and multiplying by 5 plus all children age 2 years.
2007 and 2008 data have recalculated as follows:
2007: numerator 165,284; denominator 207,643; and annual indicator 79.6
2008: numerator 149,988; denominator 208,606; and annual indicator 71.9
Notes - 2010
Data reflect the 4:3:1:3:3:1 immunization series. Data retrieved from http://www.cdc.gov/vaccines/stats-surv/nis/data/tables_2009.htm on July 2, 2011. Numerator and denominator are estimates based on the percentage reported by the National Immunization Survey. Data are unavailable for 2010. The 2010 estimate is developed using a linear projection with data from 2000 through 2009. The number of children 19 to 35 months is estimated by taking the number of children age 1 year dividing by 12 and multiplying by 5 plus all children age 2 years. Population estimates are provided by the Georgia Online Analytical Statistical Information System.
This indicator is trending in an undesired direction. Annual performance objective is based on a 2% annual increase from the 2010 estimated point estimate.
a. Last Year's Accomplishments GDPH sent out a press release during National Infant Immunization (April 20-27, 2013) promoting the importance of childhood immunization. GA childcare facilities are assessed annually by local public health staff to ensure that facilities are in compliance with GA laws pertaining to immunization of children attending daycare. Sept 2013- Statewide Immunization Conference had over 300 attendees. Topics included CDC’s childhood immunization schedule and Dr. Paul Offit spoke on how to communicate with parents who are hesitant to have their children vaccinated.
Table 4a, National Performance Measures Summary Sheet
Activities Pyramid Level of Service
DHC ES PBS IB
1. Utilize WIC enrollment information sent monthly by WIC to assess immunization status by WIC enrollment.
X
2. Improve compliance with recommended hepatitis b birth dose administration to decrease incidence of hepatitis b infection.
X

4
3. Use the best available data to identify coverage disparities among children and promote vaccination through key partnerships.
X
4.
5.
6.
7. 8. 9. 10.
b. Current Activities
Activity 1: Utilize WIC enrollment information sent monthly by WIC to assess immunization status by WIC enrollment.
Due to staff turnover and vacant positions immunization status of WIC clients has not been assessed.
Activity 2: Improve compliance with recommended hepatitis b birth dose administration to decrease incidence of hepatitis b infection. The PHBPP mailed printed copies of the Immunization Action Coalition’s e-book, Hepatitis B: What Hospitals Need to Do to Protect Newborns, to all Georgia birthing facilities. The mailing also included lab interpretation guides, triage flow charts and other educational tools. An article regarding the importance of the hepatitis B birth dose, Hepatitis B Birth Dose Saves Lives, was published in the GA AAP’s Winter 2014 newsletter, The Georgia Pediatrician.
Activity 3: Use the best available data to identify coverage disparities among children and promote vaccination through key partnerships. The Immunization program through collaboration with the GA Chapter of AAP promotes Healthcare Provider Immunization education (www.gaepic.org/Immunization.html). The AAP Immunization Coordinator attends quarterly PH Immunization Coordinators meeting.
c. Plan for the Coming Year
Activity 1: Promotion of childhood immunization through stakeholders and key partnerships. Output Measure(s): Number of presentations, seminars, and in-service trainings on immunization related topics for public and private health care professionals.
Monitoring: Education reports submitted by Immunization Program Consultants & District Immunization Coordinators.
Activity 2: Identify and track infants exposed to HBV at birth to ensure completion of the HepB vaccine series and post-vaccination serologic testing
Output Measure(s): Number of HBV-exposed infants enrolled in the PHBPP

5
Monitoring: SendSS quarterly reports
Performance Measure 09: Percent of third grade children who have received
protective sealants on at least one permanent molar tooth.
Tracking Performance Measures [Secs 485 (2)(2)(B)(iii) and 486 (a)(2)(A)(iii)]
Annual Objective and Performance Data
2009 2010 2011 2012 2013
Annual Performance Objective
24 39.8 37.6 37.8 37.4
Annual Indicator 39.0 37.4 37.4 37.4 37.4
Numerator 51681 48574 48113 48341 49036
Denominator 132515 129876 128645 129253 131113
Data Source Basic Screening Survey
Basic Screening Survey
Basic Screening Survey
Basic Screening Survey
Basic Screening Survey
Check this box if you cannot report the numerator because 1.There are fewer than 5 events over the last year, and 2.The average number of events over the last 3 years is fewer than 5 and therefore a 3-year moving average cannot be applied.
Is the Data Provisional or Final?
Final Final
2014 2015 2016 2017 2018
Annual Performance Objective
37.4 37.4 38.3 38.3
Notes – 2013
All denominator data are Fall enrollments (October enrollments) for K-12 Public Schools obtained from http://app.doe.k12.ga.us/ows-bin/owa/fte_pack_enrollgrade.entry_form. Denominators and numerators from 2011 and 2012 were updated. The percent of third grade children who have received a protective sealant on at least one permanent molar tooth is determined from the Basic Screening Survey. The Basic Screening Survey is a sample survey that includes an oral examination performed by a trained professional. The most recent Basic Screening Survey is for the 2010/2011 school year. The same indicator was used in the years thereafter.
Notes - 2012
The denominator for 2012 was estimated by linear projection using Fall enrollments for K-12 Public Schools from 2000 to 2010 -obtained from http://gaosa.org/report.aspx (Enrollment by demographics tab), and estimate of 2011 enrollements. Denominators for previous years were updated so that all denominators reflect Fall enrollments for 3rd graders for the respective years.
Notes - 2011 Data Collected in Year: 2011. Children 0 to 17.
6
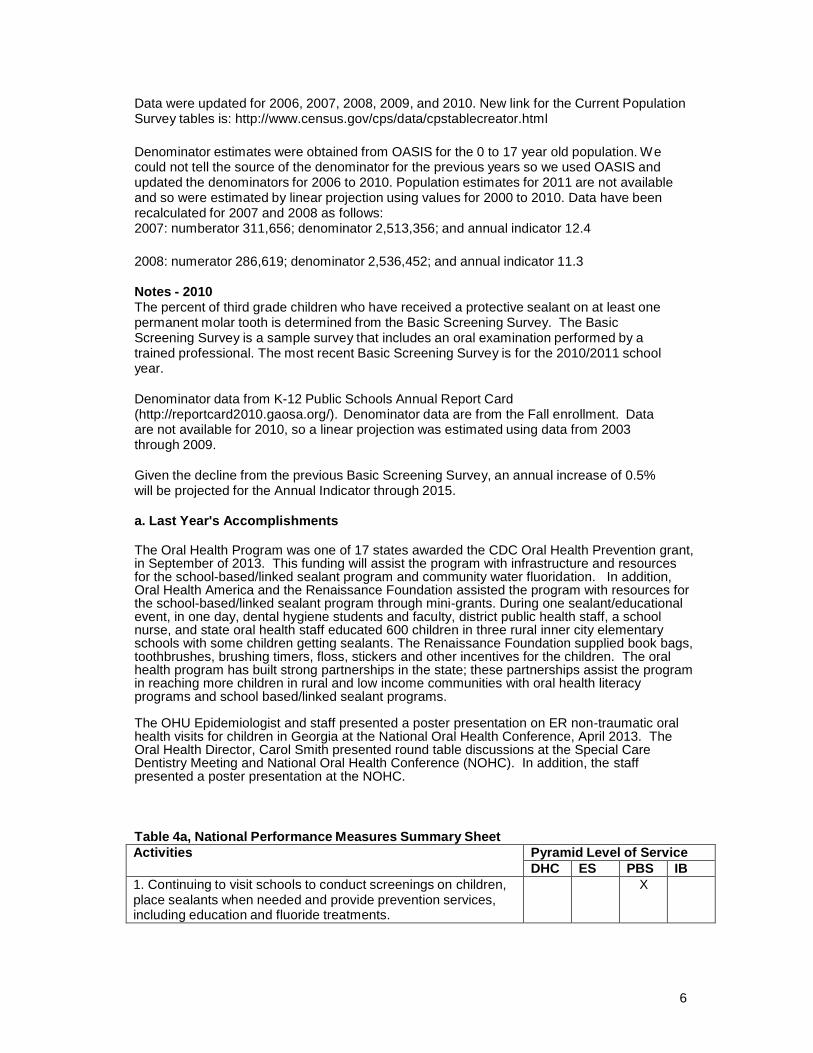
Data were updated for 2006, 2007, 2008, 2009, and 2010. New link for the Current Population Survey tables is: http://www.census.gov/cps/data/cpstablecreator.html
Denominator estimates were obtained from OASIS for the 0 to 17 year old population. We could not tell the source of the denominator for the previous years so we used OASIS and updated the denominators for 2006 to 2010. Population estimates for 2011 are not available and so were estimated by linear projection using values for 2000 to 2010. Data have been recalculated for 2007 and 2008 as follows: 2007: numberator 311,656; denominator 2,513,356; and annual indicator 12.4
2008: numerator 286,619; denominator 2,536,452; and annual indicator 11.3
Notes - 2010 The percent of third grade children who have received a protective sealant on at least one permanent molar tooth is determined from the Basic Screening Survey. The Basic Screening Survey is a sample survey that includes an oral examination performed by a trained professional. The most recent Basic Screening Survey is for the 2010/2011 school year.
Denominator data from K-12 Public Schools Annual Report Card (http://reportcard2010.gaosa.org/). Denominator data are from the Fall enrollment. Data are not available for 2010, so a linear projection was estimated using data from 2003 through 2009.
Given the decline from the previous Basic Screening Survey, an annual increase of 0.5% will be projected for the Annual Indicator through 2015.
a. Last Year's Accomplishments
The Oral Health Program was one of 17 states awarded the CDC Oral Health Prevention grant, in September of 2013. This funding will assist the program with infrastructure and resources for the school-based/linked sealant program and community water fluoridation. In addition, Oral Health America and the Renaissance Foundation assisted the program with resources for the school-based/linked sealant program through mini-grants. During one sealant/educational event, in one day, dental hygiene students and faculty, district public health staff, a school nurse, and state oral health staff educated 600 children in three rural inner city elementary schools with some children getting sealants. The Renaissance Foundation supplied book bags, toothbrushes, brushing timers, floss, stickers and other incentives for the children. The oral health program has built strong partnerships in the state; these partnerships assist the program in reaching more children in rural and low income communities with oral health literacy programs and school based/linked sealant programs. The OHU Epidemiologist and staff presented a poster presentation on ER non-traumatic oral health visits for children in Georgia at the National Oral Health Conference, April 2013. The Oral Health Director, Carol Smith presented round table discussions at the Special Care Dentistry Meeting and National Oral Health Conference (NOHC). In addition, the staff presented a poster presentation at the NOHC.
Table 4a, National Performance Measures Summary Sheet
Activities Pyramid Level of Service
DHC ES PBS IB
1. Continuing to visit schools to conduct screenings on children, place sealants when needed and provide prevention services, including education and fluoride treatments.
X

7
2. Sharing best practices through quarterly Oral Health Coordinators' meetings with dental public health providers throughout the state.
X
3. Continuing to provide ongoing consultative support and technical assistance (TA) to the districts, including monitoring and evaluation.
X
4. Continuing to provide TA and monitoring to school-based sealant programs (offered in schools with high student participation in the free and reduced school lunch program).
X
b. Current Activities
Activity 1: Increase the capacity to provide dental sealants through school-based programs. In FY 2013, the oral health school based prevention program placed 7,149 dental sealants on 2105 children. Working with a CDC Economist and data from the CDC SEALS database the relationship of caries/ untreated caries for children screened during the random selection process (Third Grade Survey) and the targeted population our school programs serve was evaluated; the results demonstrate the target population our program focuses on is a good representation for high risk factors for oral disease. In addition, later in 2014, information will be available evaluating the cost of public health’s preventive services/cost of averted caries or cost of restorations prevented. This information will be important in supporting the economic value of our State’s public health program’s oral health preventive services.
Activity 2: Increase oral health surveillance capacity: PRAMS, BRFSS, YRBS, utilize data from Head Start Oral Health Survey A Head Start Oral Health BSS is scheduled for fall of 2014. An Advisory Committee of Head Start staff, the Georgia Dental Association, the Oral Health Epidemiologist and Oral Health staff assisted in planning the survey. The Association of Dental and Territorial Dental Directors Epidemiologist also helped the Advisory Committee in planning the survey. Survey questions have been added to the screening forms and Early Head Start will be screened allowing the state to better identify the timing of early caries development for this population.
Activity 3: Promote increased capacity to provide oral health services in Georgia through partnership with the Oral Health Coalition. Training materials for school nurses on dental preventive measures were developed and trainings continue for school nurses on screening for oral diseases, referring and educating children on good oral health and home care. Two oral health, tobacco
5. Continuing to train school and public health nurses on oral disease prevention methods such as sealants and fluoride varnish. Providing oral screenings and emergency dental care.
X
6. Through the Oral Health Coalition, assessing strategies to improve oral health and develop and implement an oral health plan for Georgia.
X
7. Providing training to the medical and dental professional communities on infant oral health and application of fluoride varnish.
X
8. 9. 10.

8
prevention/oral health systemic connection presentations for middle and high schools were developed for school nurses and public health dental hygienists use for educating students in schools. These presentations will be vetted through the chronic disease programs to ensure messaging is consistent with their programs. The Oral Health Program (OHP) staff continues to expand on reaching external and internal partners by presenting at state meetings: Women, Infants and Children (WIC), Perinatal, Family Planning, Head Start Annual Session, the Oral Health Coalition, Regional Oral Health Coalitions, and Aging Communities, working with these partners for improving the oral health of their clients.
Activity 4: Provide education and training for dental and non-dental health care providers on initiation of infant oral health screening and fluoride varnish application by age one year. Implementation of fluoride varnish application during routine well baby and toddler visits has been slow although training of medical providers was offered. Georgia Chapter of the Academy of Pediatrics on tracking how many practices have implemented this preventive treatment for high-risk kids. The OHU will continue to request data from the Academy as they survey their members.
Activity 5: Maintain Community Water Fluoridation program Georgia serves over 96% of the population on community water fluoridation. The Fluoridation Specialist educates water plant operators on the value of water fluoridation supporting their work in ensuring the fluoridation levels are at optimal levels and they understand the value of fluoridation. The continued partnership of the DPH OHU staff with Georgia Rural Water Association, water plant operators, and the Fluoridation Advisory Committee ensures the continued quality of fluoridated water in Georgia. Due to the partnerships and continued education of water plant operators the CDC Quality Awards for water plants for excellent monitoring and reporting of fluoridation has increased every year for five years.
c. Plan for the Coming Year
Activity 1: Increase the capacity to provide dental sealants through school-based programs.
Output Measure(s): Number of sealant events occurring in school-based or community settings per year.
Monitoring: Quarterly review of data collected in the oral health database and CDC sealant- tracking system (SEALS).
Activity 2: Increase oral health surveillance capacity: PRAMS, BRFSS, YRBS, utilize data from Head Start Oral Health Survey
Output Measure(s): Number of questions asked about oral health on PRAMS; number of questions asked about oral health on YRBS; number of questions asked about oral health on BRFSS; data from 3rd Grade Oral Health and Nutrition/Obesity Survey and Head Start Oral Health Surveys conducted annually; full data review every 2-3 years to determine gaps in oral health services.
Monitoring: Quarterly review of surveillance instruments and survey progress.
9
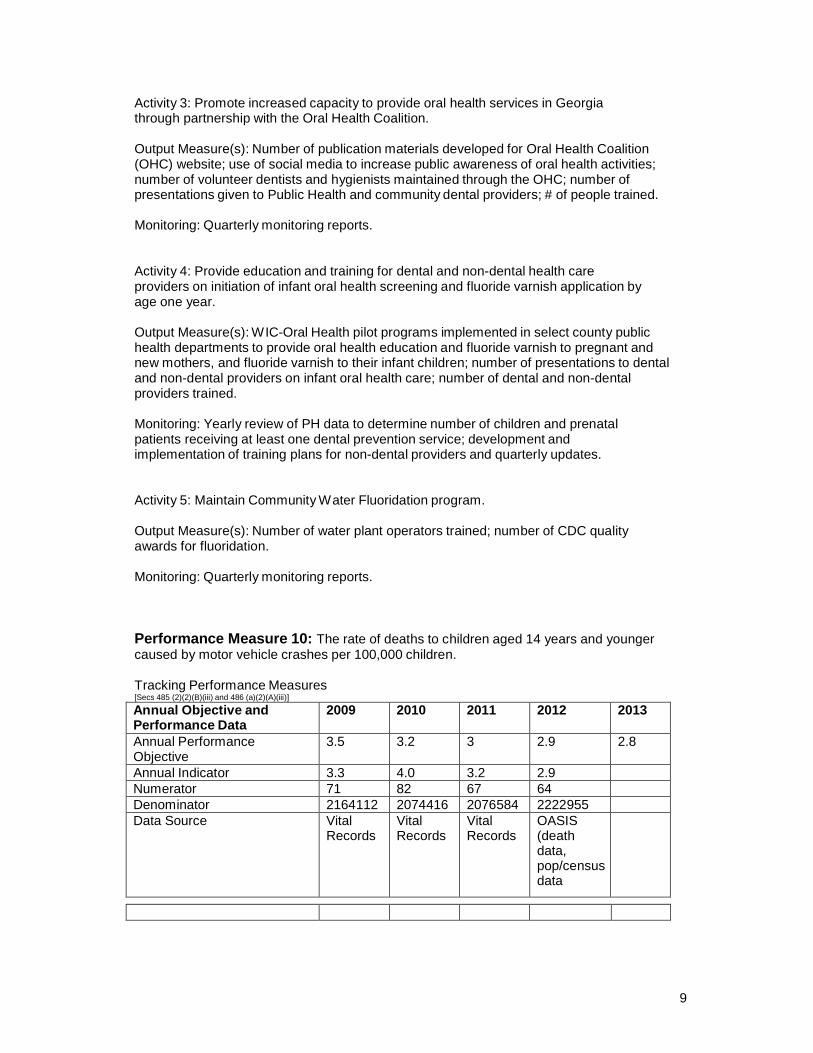
Activity 3: Promote increased capacity to provide oral health services in Georgia through partnership with the Oral Health Coalition.
Output Measure(s): Number of publication materials developed for Oral Health Coalition (OHC) website; use of social media to increase public awareness of oral health activities; number of volunteer dentists and hygienists maintained through the OHC; number of presentations given to Public Health and community dental providers; # of people trained.
Monitoring: Quarterly monitoring reports.
Activity 4: Provide education and training for dental and non-dental health care providers on initiation of infant oral health screening and fluoride varnish application by age one year.
Output Measure(s): WIC-Oral Health pilot programs implemented in select county public health departments to provide oral health education and fluoride varnish to pregnant and new mothers, and fluoride varnish to their infant children; number of presentations to dental and non-dental providers on infant oral health care; number of dental and non-dental providers trained.
Monitoring: Yearly review of PH data to determine number of children and prenatal patients receiving at least one dental prevention service; development and implementation of training plans for non-dental providers and quarterly updates.
Activity 5: Maintain Community Water Fluoridation program.
Output Measure(s): Number of water plant operators trained; number of CDC quality awards for fluoridation.
Monitoring: Quarterly monitoring reports.
Performance Measure 10: The rate of deaths to children aged 14 years and younger caused by motor vehicle crashes per 100,000 children.
Tracking Performance Measures [Secs 485 (2)(2)(B)(iii) and 486 (a)(2)(A)(iii)]
Annual Objective and Performance Data
2009 2010 2011 2012 2013
Annual Performance Objective
3.5 3.2 3 2.9 2.8
Annual Indicator 3.3 4.0 3.2 2.9
Numerator 71 82 67 64
Denominator 2164112 2074416 2076584 2222955
Data Source Vital Records
Vital Records
Vital Records
OASIS (death data, pop/census data

10
Check this box if you cannot report the numerator because 1.There are fewer than 5 events over the last year, and 2.The average number of events over the last 3 years is fewer than 5 and therefore a 3-year moving average cannot be applied.
Is the Data Provisional or Final?
Provisional Provisional
2014 2015 2016 2017 2018
Annual Performance Objective
2.7 2.7 2.5 2.5
Notes - 2012
Data source: OASIS (death data, population/census data) Numerator: number of deaths to children aged 14 years and younger caused by motor vehicle crashes Denominator: number of children aged 14 years and younger
Notes- Death record data are unavailable for 2011 and 2012, and population data are unavailable for 2012. The provisional estimates for the number of deaths are developed using a linear projection with data from 2000 through 2010, and for the population using a linear projection with data from 2000 through 2011.
Notes - 2011
Death record data is unavailable for 2009, 2010, and 2011 and population data is unavailable for 2011. The provisional estimates for the number of deaths were developed using a linear projection with data from 2000 to 2008 and for the population using a linear projection with data from 2000 through 2010.
Notes - 2010
Death record data are unavailable for 2009 and 2010. The number of deaths are developed using a linear projection with data from 2000 through 2008. Population data provided by the Georgia Online Analytic Statistical Information System. Population data for 2009 and 2010 are estimated using a linear projection with data from 2000 through 2008.
Annual performance objective estimates are developed by applying an annual decline of 3% to the 2010 point estimate based on the annual decline between 2000 and 2010.
a. Last Year's Accomplishments The COSP expanded the CPS Mini-Grant Program to include 154 counties, compared to the 142 participating in FFY 2012. Based on a Centers for Disease Control and Prevention (CDC) best practice, COSP provides local coalitions with child safety seats for distribution to income eligible families in conjunction with education in their use. The COSP distributed 7,737 child safety seats statewide through the CPS Mini-Grant program, special needs appointments, and car bed distribution to hospitals (this included 40 seats for children with special needs and 26 car beds to families, local coalitions, and hospitals). COSP staff collaborated and assisted with CPST Certification courses across the state. In addition, Injury Prevention (IP) staff provided technical assistance or consultation for grantees during 101 onsite visits, innumerable e-mails, video conferencing, and telephone contacts. IP staff provided technical assistance and/or training to 16 hospital groups, including three hospitals

11
new to our program through the Keeping Kids Safe Hospital Training initiative. Staff continued to work with Law Enforcement to educate on the CPS law. The COSP continued to support certification of Georgia State Patrol (GSP) troopers and other law enforcement officers by co-teaching Child Passenger Safety Technician (CPST) certification classes. The COSP continued to grow support for and collaboration with Georgia Head Start Association (GHSA), and the Department of Early Care and Learning (DECAL) by building CPS capacity in school settings; and providing training on safe transportation of children in vehicles. The COSP conducted 13 trainings, 2 conference, 6 meetings, 18 on-sites and 1 Roadeo for approximately 661 participants. In order to ensure staff are aware of all the county needs, the COSP released a survey in July to determine how many counties currently have wait lists of families in need of car seats. Sixty counties responded with a collective need for 500 seats across the state. The COSP is seeking out ways to meet the needs of the counties, but was able to ship additional seats for those counties who responded. The COSP received 33 Teddy Bear Sticker (TBS) fax back forms from health departments and emergency response agencies in 12 counties. The efforts of these agencies helped the COSP document 33 children saved from serious injury or death as a result of our statewide Mini-Grant program. Specific activities for the TBS program included trainings for the following agencies: IP staff attended the following meetings for EMS: Regional EMS-C meeting in Augusta State-wide EMS Advisory Council in Macon Region 1 Northwest GA EMS EMS-C in Augusta State EMS-C Federal Visit Athens Clarke County Law Enforcement Fulton County Law Enforcement Barrow County Sheriff and other law enforcement program staff During these meetings the COSP staff presented material on occupant safety work across the state, Teddy Bear Sticker Evaluation program and procedures, overviews of the COSP, and the training “The Power is in Your Pen”. Through the increased collaborative work with EMS this year, the COSP was able to get the TBS form created in pdf fillable format so responders can submit online. Other trainings included IP staff presenting along with Henry County School Transportation and National Bus Sales at the Fire Safety Symposium “Are You Prepared to Evacuate Special Needs Children from a School Bus” followed by a live extrication demonstration of a school bus on July 15. 68 participants attended (33 CPSTs). During the FFY 2013 grant period, the COSP continued to utilize process evaluation outcomes to determine the number of people reached and the amount of public information and educational materials distributed. The staff initiated a separate outcome evaluation component to look at the specific Mini Grant project and the way the child passenger safety messaging and instruction is being provided to caregivers. The COSP has strived to initiate this formal evaluation component to determine the overall effectiveness of the process and return on investment. The final result of the evaluation has forced the COSP to meet with Safe Kids Georgia and Emory School of Medicine to identify another mechanism or guidance on achieving higher results with the evaluation plan and # of respondents. During 2013, the COSP staff utilized funding from the Maternal and Child Health Section to purchase a web based address to house the new web portal. The portal went live on November 1, 2013 and is receiving monthly reports at this time. The portal is located at

12
www.gacarseats.com .The portal eliminates the need for project staff to manually input reports and allows staff to focus more time on program needs, objectives, and efficient documentation. The COSP program manager attended training to create COSP site pages for the new DPH website launch for September. All COSP pages were redesigned. The new website listing for the child occupant safety project is: http://dph.georgia.gov/injury-prevention-program http://dph.georgia.gov/child-occupant-safety-project-overview The COSP was involved with eleven press events/releases. Over 67 stories have run and 2,199,550 people were reached through media. Staff partnered with DECAL and GOHS to host a statewide media event demonstrating heatstroke warnings for parents, caregivers, and childcare providers and for all to be aware of the dangers leaving children in cars during hot months. Despite a cool/windy day, temperatures inside the vehicles that day still rose above 100 degrees inside. This event hit television prime time on Fox 5 and Channel 2 news, as well as being a published media event on Ga PH Health Weekly newsletter with an estimated outreach of 6,000 per GA DPH Communications staff. There were four television stations in attendance including the Weather Channel. The host event brought 30 people onsite to support the initiative which included multiple state agencies including GOHS, DECAL, GA DPH, Injury Prevention, GSP, DFCS, and Ga Building Authority. Several stories can be seen at the following resources listed below. It is very difficult to give an overall outreach number for these types of events. http://www.myfoxatlanta.com/story/22220107/officials-remind http://www.mysouthwestga.com/news/story.aspx?id=896498#.Ubd53OeHySq http://www.wtvm.com/story/22238635/the-dangers-of-leaving-kids-in-hot-cars COSP staff was asked by Safe Kids Georgia and Walker County Safe Kids to develop a presentation for ISIS Parenting Group on child passenger safety and best practice. Walker county Safety Kids presented this best practice education via a live webinar with this program. The release of this webinar reached at least 6 million people as per ISIS reporting.
Table 4a, National Performance Measures Summary Sheet
Activities Pyramid Level of Service
DHC ES PBS IB
1. Providing child passenger safety training, technical assistance and monitoring.
X
2. Distributing car safety seats. X 3. Providing education child passenger safety. X 4. 5. 6. 7. 8. 9. 10.
b. Current Activities
Activity 1: Distribute conventional seats and seats for children with specialized health care conditions/requirements
During the CPS monthly classes, a total of 4,420 caregivers were trained and counties distributed 2,483 child safety seats in the classes. This number reflects existing inventory

13
in months prior. In total, 8,966 pieces of PI&E materials were distributed. This includes 1,275 total child safety seats (including the19 Special Needs and 2 car beds) and possibly 191,227 total individuals were reached. IP staff worked with counties on the 2014 CPS Mini-Grant guidelines and application process. One hundred twenty-eight (128) 2014 CPS Mini-Grant Applications were received. Upon receipt, applications are reviewed and logged by IP staff. IP staff also e-mails the applying organization with a notification of receipt and requests any missing supporting documentation, when needed. COSP staff worked with sixteen families to arrange for appointments, seat distributions, and Medicaid coverage processing.
Activity 2: Document number of children saved from serious injury or death due to program- funded child safety seats
One TBS form was received from Clayton County Board of Health for a 2 year old child involved in a crash. The county received a replacement combination car seat, 4 bike helmets, and 10 window clings.
Activity 3: Offer child passenger safety training and presentations to internal and external stakeholders.
The COSP will be hiring a bilingual Spanish Program Consultant position to determine what type of minority CPS education and outreach is being offered in Georgia. Staff will be a resource providing up-to-date information as needed for CPS activities/events focusing on work with Bilingual technicians and minority communities in the key areas identified via data evaluation. The position will also work with the healthcare providers involved with minority groups in order to increase outreach and education on child occupant safety.
Some of the trainings and presentations offered by IP staff include:
Conducted LE training "You have the Power in Your Pen" to multiple LE agencies @ the SCTEN meeting where 79 were in attendance.
Lead Instructor on a 4 day CPST class October 29th – November 1st. 10 persons were certified as CPST's
Conducted a CPST recertification class for 17 current CPST’s on October 28th.
Exhibited at the GA AAP conference and offered education on correct CR use for conference attendees October 10th – 12th.
Met with Walker County Fire and EMS staff as well as local county EMS first responders in order to identify ways to work together and provide information on the TBS program county wide.
Conducted a CPS and SN training at the annual Do You Care for Kids (DUCK) conference on November 1, 2013. The purpose of the DUCK Conferences is to promote the education of Neonatal, Peri-Natal, Maternal, and Pediatric care givers. This conference included 112 nurses, physicians, respiratory therapists, and students.
14
Provided CPS education classes to two TAPS(Teenage Parents) classes at Appalache and Winder Barrow High Schools on November 21, 2013.
Staff exhibited at the GA AAP Nurse Manager conference on Friday, November 1, 2013. There were 250 people in participation.
Presented a lunch/learn to DPH employees to cover an overview of the COSP/GOHS initiatives in occupant safety – collaboration with Older Drivers, CODES, and COSP.
Activity 4: Host “Transporting Children with Special Healthcare needs” training once per year.
The training is scheduled for May 22, 2014.
Activity 5: Review child fatality review team report and deaths across multiple sources of data
The report was reviewed in January 2014. Recommendations were made for CFR team and to GOHS for purposes of minority outreach data collection.
c. Plan for the Coming Year
Activity 1: Distribute child safety seats to children including specialized child safety restraint systems for children with special healthcare needs.
Output Measure(s): # seats distributed and # counties served.
Monitoring: Quarterly monitoring of seats distributed and participating organizations involved.
Activity 2: Document # lives saved from injury and/or death due to program funded child safety seats by applying teddy bear stickers to the seats.
Output Measure(s): # of presentations/updates provided regarding the TBS program, # seats reported involved in crashes, # lives saved reported.
Monitoring: Quarterly report on number of TBS Fax Back forms received; develop and implement strategic plan for encouraging participation in TBS program.
Activity 3: Offer Child passenger safety training to internal and external stakeholders.
Output Measure(s): Audience trained, # of presentations and # people trained, certified.
Monitoring: Quarterly monitoring reports
Activity 4: Special Needs training scheduled for Oct. 9, 2014 in Hall County.
Output Measure(s): Will produce evaluation results including pre/post testing and participant attendance, # attendees.
Monitoring: Planning updates

15
Activity 5: Review of report in combination with other data sets on child deaths resulting from much and make policy recommendations to reduce deaths.
Output Measure(s): Annual child fatality report, annual report for occupant safety initiatives and state highway safety report.
Monitoring: Quarterly monitoring reports
Performance Measure 13: Percent of children without health insurance.
Tracking Performance Measures [Secs 485 (2)(2)(B)(iii) and 486 (a)(2)(A)(iii)]
Annual Objective and Performance Data
2009 2010 2011 2012 2013
Annual Performance Objective
11.7 10.8 11.2 11.2 11.2
Annual Indicator 10.2 11.9 10.0 11.2 11.7
Numerator 253822 296887 248531 319408 300290
Denominator 2488452 2494846 2493574 2495375 2567388
Data Source Current Population Survey
Current Population Survey
Current Population
Current Population Survey/OASIS
Current Population Survey/OASIS
Check this box if you cannot report the numerator because 1.There are fewer than 5 events over the last year, and 2.The average number of events over the last 3 years is fewer than 5 and therefore a 3-year moving average cannot be applied.
Is the Data Provisional or Final?
Final Final Provisional
2014 2015 2016 2017 2018
Annual Performance Objective
11.2 11.1 11.1 11.1
Notes - 2012
Data Collected in Year: 2012. Children 0 to 17. Current Population Survey tables: http://www.census.gov/cps/data/cpstablecreator.html Denominator estimates were obtained from OASIS for the 0 to 17 year old population. 2011 denominator was updated to final number. Population estimates for 2012 are not available and so were estimated by linear projection using values for 2000 to 2011.
Notes - 2011
Data Collected in Year: 2011. Children 0 to 17.
16
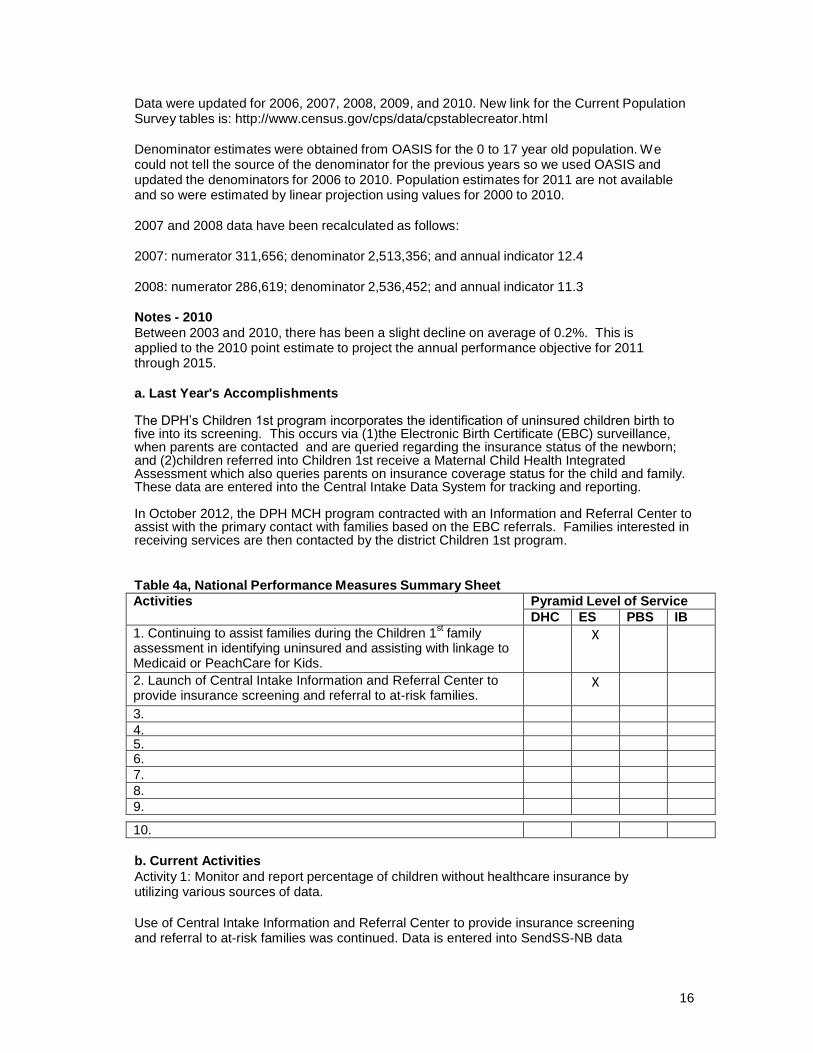
Data were updated for 2006, 2007, 2008, 2009, and 2010. New link for the Current Population Survey tables is: http://www.census.gov/cps/data/cpstablecreator.html
Denominator estimates were obtained from OASIS for the 0 to 17 year old population. We could not tell the source of the denominator for the previous years so we used OASIS and updated the denominators for 2006 to 2010. Population estimates for 2011 are not available and so were estimated by linear projection using values for 2000 to 2010.
2007 and 2008 data have been recalculated as follows:
2007: numerator 311,656; denominator 2,513,356; and annual indicator 12.4
2008: numerator 286,619; denominator 2,536,452; and annual indicator 11.3
Notes - 2010
Between 2003 and 2010, there has been a slight decline on average of 0.2%. This is applied to the 2010 point estimate to project the annual performance objective for 2011 through 2015.
a. Last Year's Accomplishments
The DPH’s Children 1st program incorporates the identification of uninsured children birth to five into its screening. This occurs via (1)the Electronic Birth Certificate (EBC) surveillance, when parents are contacted and are queried regarding the insurance status of the newborn; and (2)children referred into Children 1st receive a Maternal Child Health Integrated Assessment which also queries parents on insurance coverage status for the child and family. These data are entered into the Central Intake Data System for tracking and reporting. In October 2012, the DPH MCH program contracted with an Information and Referral Center to assist with the primary contact with families based on the EBC referrals. Families interested in receiving services are then contacted by the district Children 1st program.
Table 4a, National Performance Measures Summary Sheet
Activities Pyramid Level of Service
DHC ES PBS IB
1. Continuing to assist families during the Children 1st family
assessment in identifying uninsured and assisting with linkage to Medicaid or PeachCare for Kids.
X
2. Launch of Central Intake Information and Referral Center to provide insurance screening and referral to at-risk families.
X
3.
4.
5. 6. 7. 8. 9.
10.
b. Current Activities
Activity 1: Monitor and report percentage of children without healthcare insurance by utilizing various sources of data.
Use of Central Intake Information and Referral Center to provide insurance screening and referral to at-risk families was continued. Data is entered into SendSS-NB data

17
system for tracking.
Activity 2: Screen all children participating in MCH programs for eligibility for public insurance options and make appropriate referrals.
All children receiving the MCH Integrated Health Assessment are screened for insurance coverage and linked/referred to Medicaid or PeachCare for Kids (CHIP), as appropriate. Data is entered into SendSS-NB data system for tracking.
c. Plan for the Coming Year
Activity 1: Monitor and report percentage of children without healthcare insurance by utilizing various sources of data.
Output Measure(s): Child health insurance status
report. Monitoring: Quarterly progress reports.
Activity 2: Screen all children participating in MCH programs for eligibility for public insurance options and make appropriate referrals.
Output Measure(s): Number of children screened; number of children insured; number of children referred. Monitoring: Quarterly data reports.
Performance Measure 14: Percentage of children, ages 2 to 5 years, receiving WIC services with a Body Mass Index (BMI) at or above the 85th percentile.
Tracking Performance Measures [Secs 485 (2)(2)(B)(iii) and 486 (a)(2)(A)(iii)]
Annual Objective and Performance Data
2009 2010 2011 2012 2013
Annual Performance Objective 28 30.4 28.8 28.3 27.8
Annual Indicator 30.6 29.3 33.2 31.3 30.2
Numerator 23650 39959 36278 44650 39084
Denominator 77286 136379 109303 142560 129626
Data Source PedNSS PedNSS WIC report WIC Performance Measure Report
WIC Performance Measure Report
Check this box if you cannot report the numerator because 1.There are fewer than 5 events over the last year, and 2.The average number of events over the last 3 years is fewer than 5 and therefore a 3- year moving average cannot be applied.
Is the Data Provisional or Provisional Provisional Provisional
Final? 2014 2015 2016 2017 2018

18
Annual Performance Objective 27.4 26.9 26.7 26.2
Notes-2013
Source: WIC Performance Measure Report: June 2013-Child Weight Rpt 1 Cnty/Clinic Yearly SFY
Notes - 2012
Source: WIC Performance Measure Report: June 2012-Child Weight Rpt 1 Cnty/Clinic Yearly SFY
Notes - 2010
Data from Georgia PedNSS report as provided by Georgia WIC.
The average annual percent change between 2008 and 2009 is an decrease of 3.4%. The annual performance objective is decreased by half of this increase through 2015.
a. Last Year's Accomplishments
The WIC program continued to make changes to its organizational structure to increase the quality, efficiency and effectiveness of services provided. Currently, WIC is more than 90% staffed with the expectation to be fully staffed by 1 July 2014.
In addition, the 2014 WIC State Plan was approved by the United States Department of Agriculture (USDA) Food & Nutrition Services (FNS), and all previous findings from the USDA FNS Management Evaluations (ME) were closed. This accomplishment is noteworthy because for the first time in several years, the Georgia WIC program is completely compliant with federal and state operating standards, policies and procedures.
New WIC leadership has implemented standard operating procedures and internal review processes to consistently perform and regularly monitor progress. These improvements, along with the successful closure of the ME, convinced USDA FNS to lift the moratorium on authorizing new WIC vendors in the State. Lifting the moratorium allows more vendors to apply to provide much needed services to WIC participants.
Clinics are using the WHO and CDC Growth charts for Infants and Children that allow the program to capture obesity data at the local level. Local clinics are now able to capture and report monthly child weight data for the WIC population. These reports have been added to the Georgia WIC Information System (GWIS), and state, district and local staff are able to retrieve the reports to track performance goals.
Table 4a, National Performance Measures Summary Sheet
Activities Pyramid Level of Service
DHC ES PBS IB
1. Providing individual counseling to WIC participants on a variety of nutrition topics addressing healthy weight (i.e., Strong- 4-Life, healthy eating, stress-free feeding and physical activity).
X
2. Providing nutrition education to WIC participants through eating and physical activity programs (i.e., Individual counseling sessions, group nutrition education classes, healthy cooking demonstrations).
X
3. Providing training to WIC staff on nutrition education best practices that result in improved behaviors, including children who are overweight or obese.
X
19
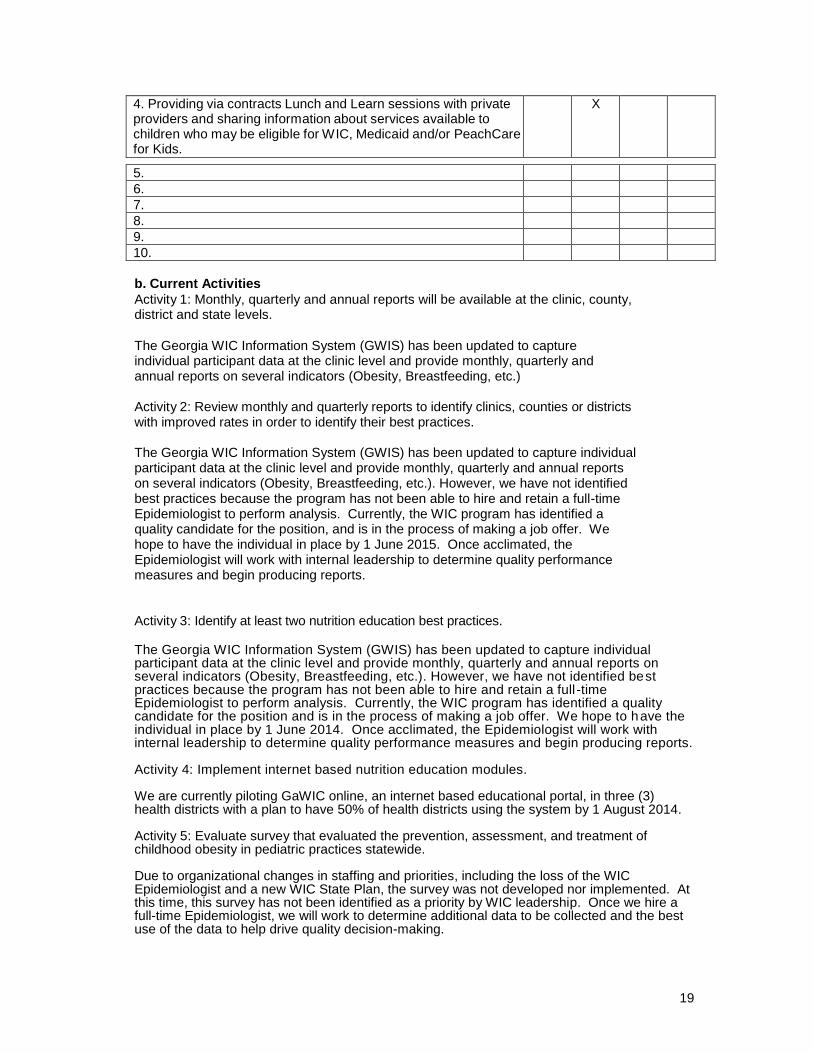
4. Providing via contracts Lunch and Learn sessions with private providers and sharing information about services available to children who may be eligible for WIC, Medicaid and/or PeachCare for Kids.
X
5. 6. 7. 8. 9. 10.
b. Current Activities
Activity 1: Monthly, quarterly and annual reports will be available at the clinic, county, district and state levels.
The Georgia WIC Information System (GWIS) has been updated to capture individual participant data at the clinic level and provide monthly, quarterly and annual reports on several indicators (Obesity, Breastfeeding, etc.)
Activity 2: Review monthly and quarterly reports to identify clinics, counties or districts with improved rates in order to identify their best practices. The Georgia WIC Information System (GWIS) has been updated to capture individual participant data at the clinic level and provide monthly, quarterly and annual reports on several indicators (Obesity, Breastfeeding, etc.). However, we have not identified best practices because the program has not been able to hire and retain a full-time Epidemiologist to perform analysis. Currently, the WIC program has identified a quality candidate for the position, and is in the process of making a job offer. We hope to have the individual in place by 1 June 2015. Once acclimated, the Epidemiologist will work with internal leadership to determine quality performance measures and begin producing reports.
Activity 3: Identify at least two nutrition education best practices.
The Georgia WIC Information System (GWIS) has been updated to capture individual participant data at the clinic level and provide monthly, quarterly and annual reports on several indicators (Obesity, Breastfeeding, etc.). However, we have not identified best practices because the program has not been able to hire and retain a full -time Epidemiologist to perform analysis. Currently, the WIC program has identified a quality candidate for the position and is in the process of making a job offer. We hope to have the individual in place by 1 June 2014. Once acclimated, the Epidemiologist will work with internal leadership to determine quality performance measures and begin producing reports. Activity 4: Implement internet based nutrition education modules. We are currently piloting GaWIC online, an internet based educational portal, in three (3) health districts with a plan to have 50% of health districts using the system by 1 August 2014. Activity 5: Evaluate survey that evaluated the prevention, assessment, and treatment of childhood obesity in pediatric practices statewide. Due to organizational changes in staffing and priorities, including the loss of the WIC Epidemiologist and a new WIC State Plan, the survey was not developed nor implemented. At this time, this survey has not been identified as a priority by WIC leadership. Once we hire a full-time Epidemiologist, we will work to determine additional data to be collected and the best use of the data to help drive quality decision-making.
20
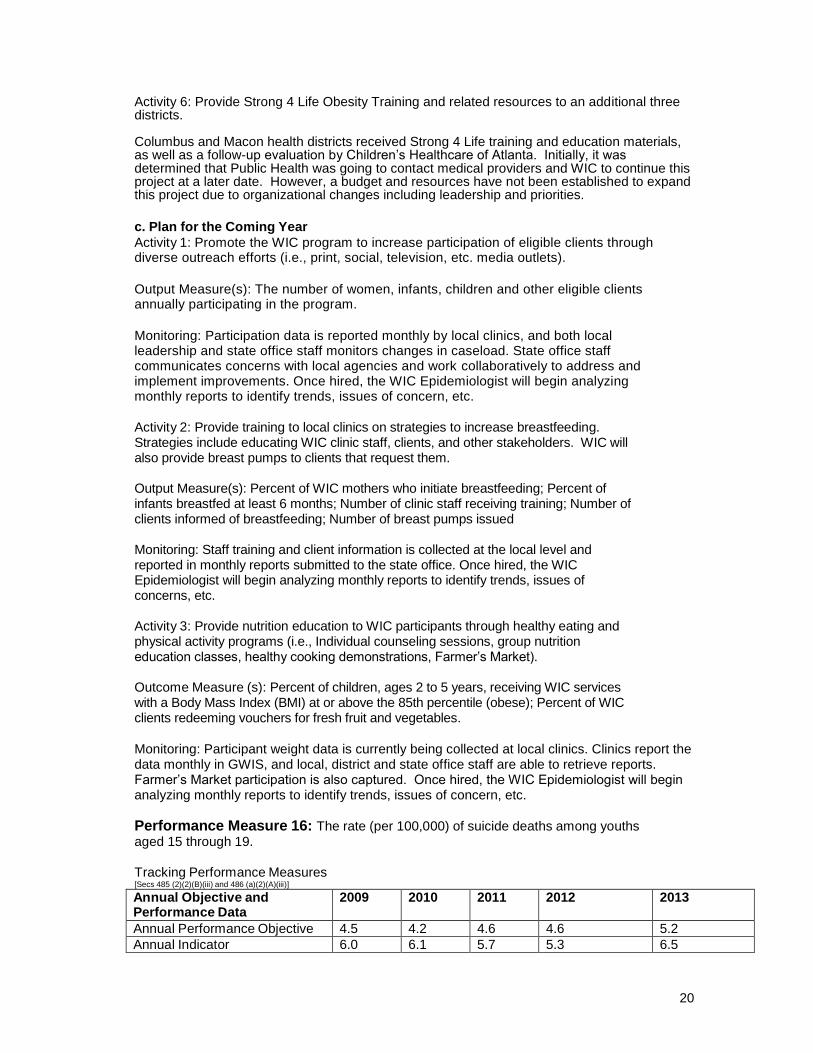
Activity 6: Provide Strong 4 Life Obesity Training and related resources to an additional three districts. Columbus and Macon health districts received Strong 4 Life training and education materials, as well as a follow-up evaluation by Children’s Healthcare of Atlanta. Initially, it was determined that Public Health was going to contact medical providers and WIC to continue this project at a later date. However, a budget and resources have not been established to expand this project due to organizational changes including leadership and priorities.
c. Plan for the Coming Year
Activity 1: Promote the WIC program to increase participation of eligible clients through diverse outreach efforts (i.e., print, social, television, etc. media outlets).
Output Measure(s): The number of women, infants, children and other eligible clients annually participating in the program.
Monitoring: Participation data is reported monthly by local clinics, and both local leadership and state office staff monitors changes in caseload. State office staff communicates concerns with local agencies and work collaboratively to address and implement improvements. Once hired, the WIC Epidemiologist will begin analyzing monthly reports to identify trends, issues of concern, etc.
Activity 2: Provide training to local clinics on strategies to increase breastfeeding. Strategies include educating WIC clinic staff, clients, and other stakeholders. WIC will also provide breast pumps to clients that request them. Output Measure(s): Percent of WIC mothers who initiate breastfeeding; Percent of infants breastfed at least 6 months; Number of clinic staff receiving training; Number of clients informed of breastfeeding; Number of breast pumps issued Monitoring: Staff training and client information is collected at the local level and reported in monthly reports submitted to the state office. Once hired, the WIC Epidemiologist will begin analyzing monthly reports to identify trends, issues of concerns, etc. Activity 3: Provide nutrition education to WIC participants through healthy eating and physical activity programs (i.e., Individual counseling sessions, group nutrition education classes, healthy cooking demonstrations, Farmer’s Market). Outcome Measure (s): Percent of children, ages 2 to 5 years, receiving WIC services with a Body Mass Index (BMI) at or above the 85th percentile (obese); Percent of WIC clients redeeming vouchers for fresh fruit and vegetables.
Monitoring: Participant weight data is currently being collected at local clinics. Clinics report the data monthly in GWIS, and local, district and state office staff are able to retrieve reports. Farmer’s Market participation is also captured. Once hired, the WIC Epidemiologist will begin analyzing monthly reports to identify trends, issues of concern, etc.
Performance Measure 16: The rate (per 100,000) of suicide deaths among youths aged 15 through 19.
Tracking Performance Measures [Secs 485 (2)(2)(B)(iii) and 486 (a)(2)(A)(iii)]
Annual Objective and Performance Data
2009 2010 2011 2012 2013
Annual Performance Objective 4.5 4.2 4.6 4.6 5.2
Annual Indicator 6.0 6.1 5.7 5.3 6.5

21
Numerator 43 43 40 37 48
Denominator 712243 707249 700944 699648 737729
Data Source Vital Records
Vital Records
Vital Records
OASIS (death data, pop/census data)
OASIS (death data, pop/ census data)
Check this box if you cannot report the numerator because 1.There are fewer than 5 events over the last year, and 2.The average number of events over the last 3 years is fewer than 5 and therefore a 3-
year moving average cannot be applied.
Is the Data Provisional or Final? Final Provisional Provisional
2014 2015 2016 2017 2018
Annual Performance Objective 5.2 4.9 4.8 4.8
Notes – 2013
Numerator: number of suicide deaths to children aged 15-19 years
Denominator: number of children aged 15-19 years
Population data are unavailable for 2013. The polulation was estimated using a linear projection with data from 2000 through 2012. The number of suicide deaths for 2012 and 2013 was obtained from the provisional death files for those years.
Notes - 2012 Data source: OASIS (death data, population/census data) Numerator: number of suicide deaths to children aged 15-19 years Denominator: number of children aged 15-19 years Notes-Death record data and population data are unavailable for 2012. The provisional estimates for the number of deaths are developed using a linear projection with data from 2000 through 2011, and for the population using a linear projection with data from 2000 through 2011.
Notes - 2011
Death record data are unavailable for 2009, 2010, and 2011 and population are unavailable for 2011. The provisional estimates for the number of deaths were developed using a linear projection with data from 2000 through 2008, and for the population, using a linear projection with data from 2000 through 2010.
Notes - 2010
Data are unavailable for 2009 and 2010. The provisional estimates are developed using a linear projection with data from 2000 through 2008. Population data provided by the Georgia Online Analytic Statistical Information System. Population data for 2009 and 2010 are estimated using a linear projection with data from 2000 through 2008.
Given the increase in 2008, the last year for which there are final data, the annual performance indictor will use a 0.5% reduction to determine estimates from 2011 through 2015.
a. Last Year's Accomplishments At the time this report was due, a detailed list of last year’s accomplishments was not available

22
to the IPP staff. The annual report is filed within the Georgia Suicide Prevention Information Network with assistance and collaborative work with several Suicide Prevention coalition and networks. The IPP staff continues to obtain annual report accomplishments and will submit as the information becomes available.
Table 4a, National Performance Measures Summary Sheet
Activities Pyramid Level of Service
DHC ES PBS IB
1. Providing training, technical assistance and monitoring of district activities and progress related to suicide prevention plans and objectives.
X
2. Continuing collaborations with the Department of Behavioral Health and Developmental Disabilities, Office of Injury Prevention and other agency staff to develop a statewide suicide prevention plan that includes staff development.
X
3. Continuing development of MCH referral, intake and assessment processes to identify adolescents "at risk" and to assure timely receipt of appropriate mental health resources.
X
4. Continuing to develop outcome and contract requirements, performance expectations/indicators and policies and procedures for contracts and Grant-in-Aid annexes related to adolescent mental health resources.
X
5. Continuing to fund and implement youth development programs and activities that provide adult-supervised activities, caring adult mentors and peer educators for targeted youth.
X
6. Providing training and technical assistance to the Georgia Association of School Nurses and other school health professionals related to suicide prevention.
X
7. Providing information to CMS staff on identification and referral of at-risk clients.
X
8. 9. 10.
b. Current Activities
The Georgia Suicide Prevention Information Network recently underwent major website changes. From the gspin.org site: GSPIN is your community web site for suicide prevention, intervention and aftercare information. This website has been created and maintained with a grant from Georgia's Department of Behavioral Health and Developmental Disabilities, Suicide Prevention Program to address the specific problems of lack of centralized information, communication, sharing of resources, and need for support for regional/local coalition building, creating a linked network of resources and activities.
The goal is to create and maintain a network for information flow, creating awareness and education by connecting survivor families and the suicide prevention community to prevention, intervention, and aftercare services, resources, training and activities that are happening around the state.
The IPP staff also work with the Georgia Suicide Prevention Action Network to ensure local communities have resources needed to find instructors and other partners to provide suicide prevention training to EMS and law enforcement partners. Many activities are ongoing including Suicide Day at the Capitol via coalition activities and trainings statewide. Statewide suicide fact

23
sheet was created for distribution (Website access is: www.span-ga.org).
c. Plan for the Coming Year
Activity 1: Work with the GVDRS to produce an age range (age 8 -- 19) specific fact sheet and map with overlay of high schools for distribution to the school systems every two years.
Output Measure(s): Number of suicide attempts by age group; number of suicide completions by age group; production of fact sheets; distribution of reports to school systems; number of health districts receiving fact sheets.
Monitoring: Quarterly progress reports; draft fact sheets.
Activity 2: Follow up on school-based Post-vention training and survey of protocols in high schools regarding suicide ideation, attempts, and school response.
Output Measure(s): Survey designed; survey distributed; report of survey
results; Monitoring: Survey validation report; plan for survey implementation.
Activity 3: Review report on child deaths resulting from suicide completions through Child Fatality Review, in combination with other data sets, and develop policy recommendations and activities aimed at reducing such deaths.
Output Measure(s): Annual Child Fatality Review Team Report across multiple sources of data on child deaths that includes suicide deaths and policy recommendations.
Monitoring: Quarterly reports.
Activity 4: Track DBHDD policy to utilize the Columbia Suicide Severity Risk Scale for all providers.
Output Measure(s): Policy developed; percent of providers utilizing
tool. Monitoring: Quarterly reports.
State Performance Measures
State Performance Measure 4: Deaths to children ages 15 to 17 years caused by
motor vehicle crashes per 100,000 children
Tracking Performance Measures [Secs 485 (2)(2)(B)(iii) and 486 (a)(2)(A)(iii)]
Annual Objective and Performance Data
2009 2010 2011 2012 2013
Annual Performance Objective
14.5 14.3 8
Annual Indicator 15.5 10.7 9.6 8.0

24
Numerator 65 45 40 35
Denominator 419421 420430 416990 439208
Data Source Vital Records
Vital Records
Vital Records
OASIS
Is the Data Provisional or Final?
Provisional Provisional
2014 2015 2016 2017 2018
Annual Performance Objective
8 7.4 7.2 6.9
Notes - 2012
Data are from OASIS. The population denominator for 2012 was estimated by linear projection using data for 2002-2011. The numerators for 2011 and 2012 were estimated using 2001 to 2010 data. The numerators for 2009 and 2010 were updated with final data. The Annual indicator – number of deaths to children ages 15 to 17 years by motor vehicle crashes was calculated using the numerator and denominator and expressed per 100,000 children.
Notes - 2011
Data are from OASIS. The Population denominator for 2011 was estimated by linear projection using data for 2000 to 2010
The numerator for 2009 to 2011 was estimated by linear projection using data from 2000 to 2008
.
The Annual indicator -number of deaths to children ages 15 to 17 years by motor vehicle crashes was calculated using the numerator and denominator and expressed per 100,000 children.
2008 was recalculated as
follows: Annual indicator:
12.1 Numerator: 289 Denominator: 148,501
Notes - 2010
Data for 2008 are final. Data for 2009 and 2010 are not availabe. Data are projected using a linear estimate derrived from data from 2000 through 2008. The average change in this indcator between 2000 and 2010 is positive. Therefore, a 1 percent decline is applied to estimate the annual performance objective.
a. Last Year's Accomplishments
By the end of the fiscal year there were Community Mobilization groups functioning in 26 counties.
There were a total of 74 activities conducted during the year, including teen traffic safety events, seat belt surveys, and child safety seat classes. Crash data from the hospital inpatient discharge database on crash injuries to teens for

25
Franklin County, the Gainesville Health District Counties and the state were provided to the NE GA RRI and their enforcement networks. This totaled 6 motor vehicle related data variable charts for September. In January 16 data variable maps were provided to NE GA RRI. These provided age, motor vehicle crash injury and death rate and county. In June 208 data variable maps documenting highway safety risk factors in the relevant counties were provided to NE GA RRI and the enforcement networks. Crash data from the hospital inpatient database for Camden County was provided with two variables presented to the Camden community mobilization group. Data from Vital Statistics and from the Hospital Inpatient Discharge Data base were analyzed by age and injury status for motor vehicle crash related incidents for Wayne County and provided to the local injury prevention group. This resulted in four charts. Five years of data for Toombs, Montgomery, Tattnall, Wheeler and Montgomery were analyzed and provided to the local Safe Kids group for motor vehicle related injuries and deaths for four age groups resulting in forty injury variable charts. A total of 44 variable charts were provided in December. In January, two data variable maps were provided to Vidalia Safe Kids. The maps compared crash rates to counties by rate. In February, two data maps were provided to the Regional Trauma Advisory Group. The maps showed motor vehicle crashes by county and region. The Office of Health Information and Planning began work in May on developing risk factor maps for SE GA RRI. In June, 384 data variable maps documenting highway safety risk factors in the relevant counties were developed for the SE GA RRI and were distributed to the enforcement networks as well as appropriate CMGs.
Table 4b, State Performance Measures Summary Sheet
Activities Pyramid Level of Service
DHC ES PBS IB
1. Establishing/maintaining Community Mobilization Groups. X
2. Hosting traffic safety events. X 3. Providing car seat classes and other injury prevention education.
X
4. Providing survey and crash data sets. X 5. 6. 7. 8. 9. 10.
b. Current Activities
There is currently no activity occurring for this performance measure as no renewal grant for highway safety at this time.
c. Plan for the Coming Year
No activities planned for the coming year due to lack of funding at this time.
State Performance Measure 5: Among children five years of age and younger who
received services through the MCH Program, the percent who received a developmental

26
screen
Tracking Performance Measures [Secs 485 (2)(2)(B)(iii) and 486 (a)(2)(A)(iii)]
Annual Objective and Performance Data
2009 2010 2011 2012 2013
Annual Performance Objective
35 35 35
Annual Indicator 38.6 30.1 86
Numerator 7490 7490 16246
Denominator 19382 19382 18823
Data Source Children 1st
quarterly report Children 1
st
quarterly report Children 1
st
quarterly report Is the Data Provisional or Final?
Final Provisional Provisional
2014 2015 2016 2017 2018
Annual Performance Objective
35 35 35 35
Notes - 2012
This is a new measure. Collection of this item began in the second quarter of Fiscal year 2012. The 2012 numerator data were compiled using the Children 1st Annual Report Column G for fiscal quarters 2 and 3. The 2012 denominator data were compiled using the Children 1st Annual Report Column C for fiscal quarters 2 and 3.
Notes - 2011 This is a new measure. The 2011 data was compiled using the Children 1st Quarterly Report Item I1 for fiscal quarters 2 and 3. Collection of this item began in the second quarter of Fiscal year 2012. It is anticipated that the annual performance objective should be estimated at approximately 35 percent but this will likely change as more data become available.
Notes - 2010 This is a new measure. The MCH Program is currently working to develop measurement processes to adequately capture the data. It is difficult to project the annual performance objective without baseline data. However, through discussions with staff, it is anticipated that this performance objective should be estimated at approximately 35 percent. This will likely change as more data become available.
a. Last Year's Accomplishments
Effective September 2013, the ability to enter ASQ:3 developmental and ASQ:SE social-emotional screening data was added to the MCH Children 1st statewide, web-based data system being utilized by all 18 public health districts. As of the end of the second quarter of state fiscal year 2014, the state DPH had the ability to track and monitor the numbers of ASQ screenings conducted by DPH, the number of referrals being received by DPH with pre viously completed developmental screens, and the outcome of the referrals (e.g. whether they were referred to Early Intervention Part C or Part B special-needs preschool services). This enhancement to the data system has greatly improved the ability of DPH/MCH to monitor the percentage of children entering MCH programs who receive developmental screenings. We are also now monitoring those children enrolled in Children 1st over time as follow-up ASQs are also entered into the system.
Table 4b, State Performance Measures Summary Sheet

27
Activities Pyramid Level of Service
DHC ES PBS IB
1. Implementing a reporting and measurement strategy that can be applied throughout all MCH programs.
X
2. 3. 4. 5. 6. 7. 8. 9. 10.
b. Current Activities
Activity 1: Implement a reporting and measurement strategy that can be applied throughout all MCH programs.
Enhancement to SendSS-NB web-based data system adding ASQ and ASQ:SE data to system was completed.
c. Plan for the Coming Year
Activity 1: Work with district child health programs to assure all data for ASQs and ASQ:SEs are being included in one centralized data system.
Output Measure(s): Inclusion of the ASQ scores from all child health programs in SendSS Newborn
Monitoring: Quarterly reports, SendSS-NB data Activity 2: Develop Quality Assurance/Quality Improvement for developmental screening data for all child health programs Output Measure(s): Inclusion of developmental screening protocols and data monitoring procedures in all child health programs
Monitoring: Child Health program operating procedures/manuals; Quarterly Reports
Health Status Capacity Indicators
Health Systems Capacity Indicator 05B: Infant deaths per 1,000 live births
INDICATOR #05 Comparison of health system capacity indicators for Medicaid, non-Medicaid, and all MCH populations in the
YEAR DATA SOURCE POPULATION
MEDICAID NON- MEDICAID
ALL
State

28
Infant deaths per 1,000 live births
Notes - 2013
Data source: data warehouse (final birth data) Numerator (Medicaid/Non-Medicaid): number resident births that have been linked to an infant death, where payor status is known Denominator (Medicaid/Non-Medicaid): number of resident births, where payor status is known Numerator (All): number resident births that have been linked to an infant death Denominator (All): number of resident births
Notes-Payor information was missing overall 11.6% and for deaths 13.8% in 2010. All records were included for the 'All' calculation, regardless of payor information.
Narrative:
Health Systems Capacity Indicator 05C: Percent of infants born to pregnant
women receiving prenatal care beginning in the first trimester
INDICATOR #05 Comparison of health system capacity indicators for Medicaid, non-Medicaid, and all MCH populations in the State
YEAR DATA SOURCE POPULATION
MEDICAID NON- MEDICAID
ALL
Percent of infants born to pregnant women receiving prenatal care beginning in the first trimester
Notes - 2013 Data source: EBC (Provional) Numerator (Medicaid/non-Medicaid): number of resident births with 1st trimester PNC, where payor status is known Denominator (Medicaid/non-Medicaid): number of resident births, where payor status is known Numerator (All): number of resident births with 1st trimester PNC, where month PNC began is known Denominator (All): number of resident births
Notes-Month PNC began was missing 23.6%, and payor information was missing overall 6.0% and for known PNC 1st trimester 1.4% in 2012. Records with missing data were excluded. Estimates are not likely stable. However, all records were included for the 'All' calculation, regardless of payor information, but where month PNC care began is known.
Narrative:
Health Status Indicators Health Status Indicators 03A: The death rate per 100,000 due to unintentional injuries among children aged 14 years and younger.

29
Health Status Indicators Forms for HSI 03A - Multi-Year Data
Annual Objective and Performance Data
2009 2010 2011 2012 2013
Annual Indicator 8.5 8.5 7.3 7.4 7.0
Numerator 175 177 152 154 149
Denominator 2064991 2074416 2076584 2078585 2141120
Check this box if you cannot report the numerator because 1.There are fewer than 5 events over the last year, and 2.The average number of events over the last 3 years is fewer than 5 and therefore a 3-year moving average cannot be applied.
Is the Data Provisional or Final? Final Final Final Provisional Provisional Notes – 2013 Data Source: OASIS (death data, population/census data) Numerator: number of resident deaths due to unintentional injuries among children aged 14 and younger (Motor Vehicle Crashes, Falls, Accidental Shooting, Drowning, Fire and Smoke Exposure, Poisoning, Suffocation, and all other intentional injuries. Denominator: number of resident children aged 14 and younger Death data are unavailable for 2009 and 2013. The provisional estimates are developed using a linear projection with data from 2000 through 2008. Population data for 2013 are estimated using a linear projection with data from 2000 through 2012. All the numerator and indicator data for all years were updated because the unintentional injuries on the OASIS query has now been expanded to include injuries due to suffocation and all other unintentional injuries. The ICD-10 codes for suffocation are W75-W84. The ICD-10 codes for all other unintentional injuries are V01,V05-V08, V09.1, V09.3-V11, V15-V18, V19.3, V19.7-V19.9, V80.0-V80.2, V80.6-V80.9, V81.2-V81.9, V82.2-V82.9, V87.9, V88.9, V89.1, V89.3-V99, W20-W31, W35-W64, W85-99, X10-X39, X50-X59, Y85-Y86.
Narrative: The IPP works with Children’s Healthcare of Atlanta and Safe Kids of Georgia to ensure all education programs statewide are consistent and aligned with national and state messaging recommendations. Staff work closely with all local public health departments, law enforcement, and EMS professionals to incorporate consistent prevention messages across community levels to ensure ultimate outreach. Additionally a recent group was assigned through IPP and the Georgia Department of Early Care and Learning to develop a committee to work on injuries occurring in the child care setting. This group is set to begin formal meetings to review the initial data collection in Spring 2014.
Health Status Indicators 03B: The death rate per 100,000 for unintentional injuries among children aged 14 years and younger due to motor vehicle crashes.
Health Status Indicators Forms for HSI 03B - Multi-Year Data
Annual Objective and Performance Data
2009 2010 2011 2012 2013
Annual Indicator 2.9 4.0 2.9 3.0 2.8

30
Numerator 59 82 61 62 60
Denominator 2064991 2074416 2076584 2078585 2141120
Check this box if you cannot report the numerator because 1.There are fewer than 5 events over the last year, and 2.The average number of events over the last 3 years is fewer than 5 and therefore a 3-year moving average cannot be applied.
Is the Data Provisional or Final? Final Provisional Provisional Notes – 2013 Data Source: OASIS (death data, population/census data) Numerator: number of resident deaths due to motor vehicle crashes among children aged 14 and younger Denominator: number of resident children aged 14 and younger Death data are unavailable for 2009 and 2013. The provisional estimates are developed using a linear projection with data from 2000 through 2008. Population data for 2013 are estimated using a linear projection with data from 2000 through 2012.
Notes - 2012 Data Source: OASIS (death data, population/census data) Numerator: number of resident deaths due to motor vehicle crashes among children aged 14 and younger Denominator: number of resident children aged 14 and younger
Notes-Death data are unavailable for 2009 and 2011. The provisional estimates are developed using a linear projection with data from 2000 through 2008. Population data for 2011 are estimated using a linear projection with data from 2000 through 2010.
Notes - 2011
Data source: OASIS (death data, population/census data)
Numerator: number of resident deaths due to motor vehicle crashes among children aged 14 and younger
Denominator: number of resident children aged 14 and younger
Death data are unavailable for 2009 and 2011. The provisional estimates were developed using a linear projection with data from 2000 through 2008. Population data for 2011 were estimated using a linear projection with data from 2000 through 2010.
Notes - 2010
Georgia Final Death File, 2000-2008, accessed through OASIS. ICD-10 codes V02-V04, V09.0, V09.2, V12-V14, V19.0-V19.2, V19.4-V19.6, V20-V79, V80.3-V80.5, V81.0-V81.1, V82.0-V82.1, V83-V86, V87.0-V87.8, V88.0-V88.8, V89.0, and V89.2 .
Consists of all accidents in which any motorized vehicle (car, truck, motorcycle, etc. ) was involved, including ones involving motor vehicles injuring pedestrians or bicyclists.
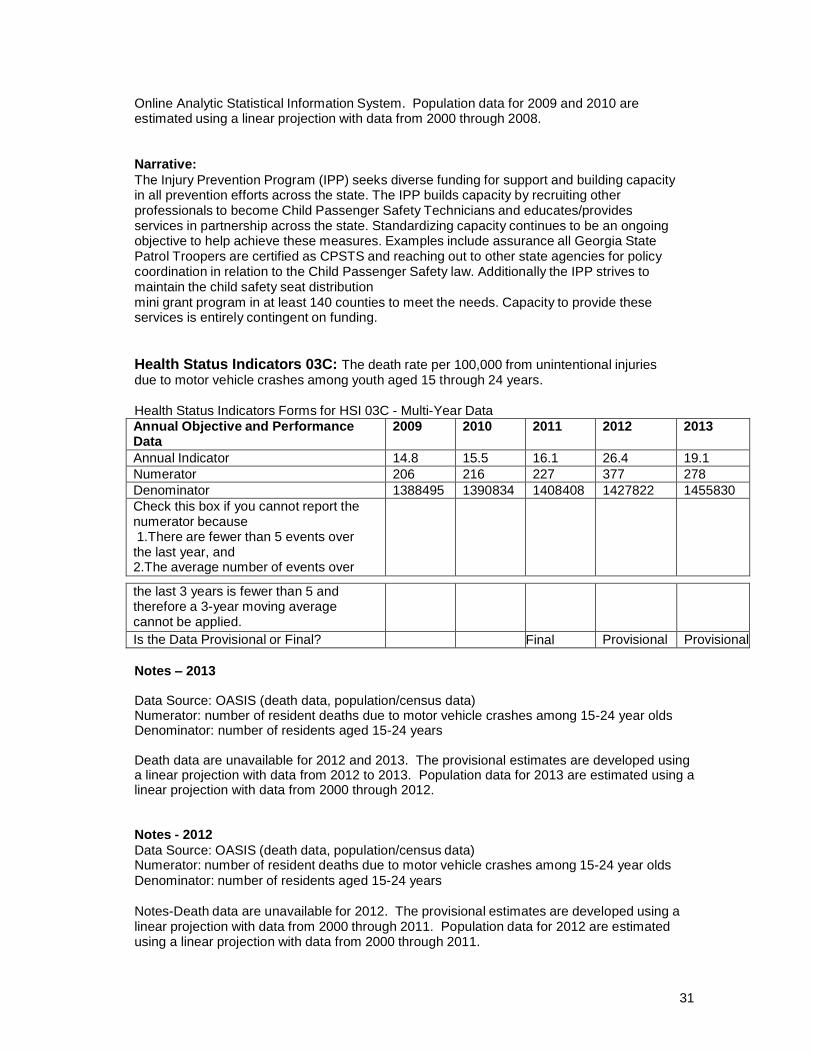
Data are unavailable for 2009 and 2010. The provisional estimates are developed using a linear projection with data from 2000 through 2008. Population data provided by the Georgia
31
Online Analytic Statistical Information System. Population data for 2009 and 2010 are estimated using a linear projection with data from 2000 through 2008.
Narrative:
The Injury Prevention Program (IPP) seeks diverse funding for support and building capacity in all prevention efforts across the state. The IPP builds capacity by recruiting other professionals to become Child Passenger Safety Technicians and educates/provides services in partnership across the state. Standardizing capacity continues to be an ongoing objective to help achieve these measures. Examples include assurance all Georgia State Patrol Troopers are certified as CPSTS and reaching out to other state agencies for policy coordination in relation to the Child Passenger Safety law. Additionally the IPP strives to maintain the child safety seat distribution mini grant program in at least 140 counties to meet the needs. Capacity to provide these services is entirely contingent on funding.
Health Status Indicators 03C: The death rate per 100,000 from unintentional injuries due to motor vehicle crashes among youth aged 15 through 24 years.
Health Status Indicators Forms for HSI 03C - Multi-Year Data
Annual Objective and Performance Data
2009 2010 2011 2012 2013
Annual Indicator 14.8 15.5 16.1 26.4 19.1
Numerator 206 216 227 377 278
Denominator 1388495 1390834 1408408 1427822 1455830
Check this box if you cannot report the numerator because 1.There are fewer than 5 events over the last year, and 2.The average number of events over
the last 3 years is fewer than 5 and therefore a 3-year moving average cannot be applied.
Is the Data Provisional or Final? Final Provisional Provisional
Notes – 2013 Data Source: OASIS (death data, population/census data) Numerator: number of resident deaths due to motor vehicle crashes among 15-24 year olds Denominator: number of residents aged 15-24 years Death data are unavailable for 2012 and 2013. The provisional estimates are developed using a linear projection with data from 2012 to 2013. Population data for 2013 are estimated using a linear projection with data from 2000 through 2012. Notes - 2012
Data Source: OASIS (death data, population/census data) Numerator: number of resident deaths due to motor vehicle crashes among 15-24 year olds Denominator: number of residents aged 15-24 years
Notes-Death data are unavailable for 2012. The provisional estimates are developed using a linear projection with data from 2000 through 2011. Population data for 2012 are estimated using a linear projection with data from 2000 through 2011.

32
Notes - 2011
Data source: OASIS (death data, population/census data)
Numerator: number of resident deaths due to motor vehicle crashes among 15-24 year olds
Denominator: numer of residents aged 15-24 years
Notes: death data are unavailable for 2009 and 2011. The provisional estimates were developed using a linear projection with data from 2000 through 2008. Population data for 2011 are estimated using a linear projection with data from 2000 through 2010.
Notes - 2010
Georgia Final Death File, 2000-2008, accessed through OASIS. ICD-10 codes V02-V04, V09.0, V09.2, V12-V14, V19.0-V19.2, V19.4-V19.6, V20-V79, V80.3-V80.5, V81.0-V81.1, V82.0-V82.1, V83-V86, V87.0-V87.8, V88.0-V88.8, V89.0, and V89.2.
Consists of all accidents in which any motorized vehicle (car, truck, motorcycle, etc. ) was involved, including ones involving motor vehicles injuring pedestrians or bicyclists.
Data are unavailable for 2009 and 2010. The provisional estimates are developed using a linear projection with data from 2000 through 2008. Population data provided by the Georgia Online Analytic Statistical Information System. Population data for 2009 and 2010 are estimated using a linear projection with data from 2000 through 2008.
Narrative: Previously the IPP collected seat belt usage survey data for teens and also utilized pre and post surveys to portray trends so the desired outcome is an increase from baseline for each school. However, as of October 1, 2013, funding for this program was eliminated from the IPP budget. Health Status Indicators 04A: The rate per 100,000 of all nonfatal injuries among children aged 14 years and younger.
Health Status Indicators Forms for HSI 04A - Multi-Year Data
Annual Objective and Performance Data
2009 2010 2011 2012 2013
Annual Indicator 7649.7 8496.7 8936.3 8895.5 8292.4
Numerator 165548 176021 185570 184901 180753
Denominator 2164112 2071630 2076584 2078585 2179734
Check this box if you cannot report
the numerator because 1.There are fewer than 5 events over the last year, and 2.The average number of events over the last 3 years is fewer than 5 and therefore a 3-year moving average cannot be applied.
Is the Data Provisional or Final? Final Final Provisional
Notes – 2013 Data Source: OASIS (deduplicated inpatient and deduplicated ER hospital discharge data, population/census data)

33
Numerator: number of deduplicated inpatient and deduplicated ER hospital discharges due to non-fatal injuries among resident children aged 14 and younger (Motor Vehicle Crashes, Falls, Accidental Shooting, Drowning, Fire and Smoke Exposure, Poisoning, suffocation, and all other unintentional injuries) Denominator: number of resident children aged 14 and younger Data are unavailable for 2011 and 2012. The provisional estimates are developed using a linear projection with data from 2002 through 2010; ER data are not available prior to 2002. Population data for 2011 are updated. Pop2012 are estimated using a linear projection with data from 2000 through 2010. For nonfatal injuries, deduplicated discharges and ER visits are used because these do not include deaths. The report for all the years have been updated. The categories now included in unintentional and non-fatal injuries are Motor Vehicle Crashes, Falls, Accidental Shooting, Drowning, Fire and Smoke Exposure, Poisoning, Suffocation, and All Other Unintentional injuries. The E-codes for suffocation are E911-E913. The E-codes for all other unintentional injuries are E800-E809, E826-E849, E900-E909, E914-E921, E923-E924.0, E924.2-E929.
Narrative: IPP staff work with the office of Vital Statistics to accomplish all data collection efforts related to injuries affecting young children. The new website within the OASIS program offers each county to pull their own baseline data summary where they can identify areas to work on and pursue. The child safety seat mini grant programs has the ability to reach all local public health departments to remind them of this effective data use tool and help them identify their top five areas of concern and focus.
Health Status Indicators 04B: The rate per 100,000 of nonfatal injuries due to motor vehicle crashes among children aged 14 years and younger.
Health Status Indicators Forms for HSI 04B - Multi-Year Data
Annual Objective and Performance Data
2009 2010 2011 2012 2013
Annual Indicator 440.1 469.4 451.5 428.8 388
Numerator 9525 9724 9376 8912 8449
Denominator 2164112 2071630 2076584 2078585 2179734
Check this box if you cannot report
the numerator because 1.There are fewer than 5 events over the last year, and 2.The average number of events over the last 3 years is fewer than 5 and therefore a 3-year moving average cannot be applied.
Is the Data Provisional or Final? Provisional Provisional Provisional
Notes-2013 Data Source: OASIS (deduplicated inpatient and deduplicated ER hospital discharge data, population/census data) Numerator: number of deduplicated inpatient and deduplicated ER hospital discharges due to motor vehicle crashes among resident children aged 14 and younger Denominator: number of resident children aged 14 and younger Data are unavailable for 2011 and 2012. The provisional estimates are developed using a linear projection with data from 2002 through 2010; ER data are not available prior to 2002. Population data for 2011 and 2012 are estimated using a linear projection with data from 2000 through 2010. For nonfatal injuries, deduplicated discharges and ER visits are used because

34
these do not include deaths. The report for all the years have been updated. Notes - 2012 Data Source: OASIS (deduplicated inpatient and deduplicated ER hospital discharge data, population/census data) Numerator: number of deduplicated inpatient and deduplicated ER hospital discharges due to motor vehicle crashes among resident children aged 14 and younger Denominator: number of resident children aged 14 and younger
Notes- Data are unavailable for 2011 and 2012. The provisional estimates are developed using a linear projection with data from 2002 through 2010; ER data are not available prior to 2002. Population data for 2011 and 2012 are estimated using a linear projection with data from 2000 through 2010. For nonfatal injuries, deduplicated discharges and ER visits are used because these do not include deaths.
Notes - 2011
"Data Source: OASIS (deduplicated inpatient and deduplicated ER hospital discharge data, population/census data) Numerator: number of deduplicated inpatient and deduplicated ER hospital discharges due to motor vehicle crashes among resident children aged 14 and younger Denominator: number of resident children aged 14 and younger"
Notes: Data are unavailable for 2011. The provisional estimates are developed using a linear projection with data from 2002 through 2010; ER data are not available prior to 2002. Population data for 2011 are estimated using a linear projection with data from 2000 through 2010. For nonfatal injuries, deduplicated discharges and ER visits are used because these do not include deaths. The report for all the years have been updated.
2007 and 2008 data have been recalculated as follows:
2007: numerator: 11,581; denominator: 2,109,362; annual indicator: 549
2008: numerator: 10,550; denominator: 2,127,815; annual indicator: 495.8
Notes - 2010
Inpatient and ER discharges with E-codes E810-E825, 2002-2007. Data accessed through OASIS.
Consists of all accidents in which any motorized vehicle (car, truck, motorcycle, etc. ) was involved, including ones involving motor vehicles injuring pedestrians or bicyclists.
Data are unavailable for 2009 and 2010. The provisional estimates are developed using a linear projection with data from 2002 through 2008. Population data provided by the Georgia Online Analytic Statistical Information System. Population data for 2009 and 2010 are estimated using a linear projection with data from 2000 through 2008.
Narrative: The IPP requires multiple funding sources to accomplish this objective and serve all populations at risk. In additional to the county mini grant programs, additional populations include children with special healthcare needs, childcare agencies/consultants, and school systems. Distribution of child safety seats requires leveraging multiple funding opportunities and agency partnerships/commitments. The IPP is working with the Maternal Child Health Section

35
to work with the Medicaid office for reimbursement of child safety seats as well as outreach to families in need of assistance. Health Status Indicators 04C: The rate per 100,000 of nonfatal injuries due to motor vehicle crashes among youth aged 15 through 24 years.
Health Status Indicators Forms for HSI 04C - Multi-Year Data
Annual Objective and Performance Data
2009 2010 2011 2012 2013
Annual Indicator 2102.5 1959.7 1989.9 1912.6 1827.6
Numerator 29422 27241 28026 27309 26591
Denominator 1399368 1390079 1408408 1427822 1454967
Check this box if you cannot report
the numerator because 1.There are fewer than 5 events over the last year, and 2.The average number of events over the last 3 years is fewer than 5 and therefore a 3-year moving average cannot be applied.
Is the Data Provisional or Final? Provisional Provisional Provisional
Notes – 2013 Data Source: OASIS (deduplicated inpatient and deduplicated ER hospital discharge data, population/census data) Numerator: number of deduplicated inpatient and deduplicated ER hospital discharges due to motor vehicle crashes among residents aged 15-24 years Denominator: number of residents aged 15-24 years Data are unavailable for 2011 and 2012. The provisional estimates are developed using a linear projection with data from 2002 through 2010; ER data are not available prior to 2002. Population data for 2011 and 2012 are estimated using a linear projection with data from 2000 through 2010. For nonfatal injuries, deduplicated discharges and ER visits are used because these do not include deaths. The report for all the years have been updated.
Narrative: The IPP continues to support staff who work with the Governor’s Office of Highway Safety and state EMS office to track data on all injuries related to MVC via hospital discharge information. In October 1, 2013, funding for the rural roads occupant safety program was eliminated, however the IPP continues to work with partners
Health Status Indicators 06A: Infants and children aged 0 through 24 years
enumerated by sub-populations of age group and race. (Demographics)
HSI #06A - Demographics (TOTAL POPULATION)
CATEGORY TOTAL POPULATION BY RACE
Total All Races
White Black or African American
American Indian or Native Alaskan
Asian Native Hawaiian or Other Pacific Islander
More than one race reported
Other and Unknown
Infants 0 to 1 132554 74321 45356 1031 4530 362 6954 0
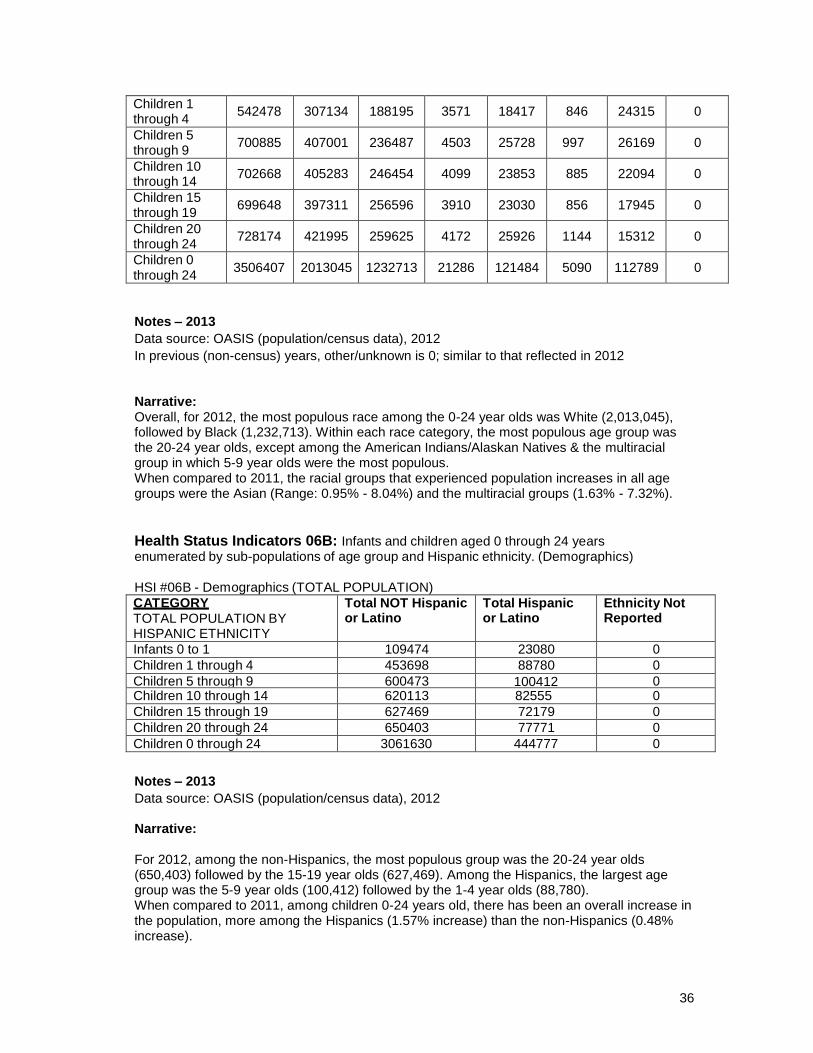
36
Children 1 through 4
542478
307134
188195
3571
18417
846
24315
0
Children 5 through 9
700885
407001
236487
4503
25728
997
26169
0
Children 10 through 14
702668
405283
246454
4099
23853
885
22094
0
Children 15 through 19
699648
397311
256596
3910
23030
856
17945
0
Children 20 through 24
728174
421995
259625
4172
25926
1144
15312
0
Children 0 through 24
3506407
2013045
1232713
21286
121484
5090
112789
0
Notes – 2013
Data source: OASIS (population/census data), 2012
In previous (non-census) years, other/unknown is 0; similar to that reflected in 2012
Narrative: Overall, for 2012, the most populous race among the 0-24 year olds was White (2,013,045), followed by Black (1,232,713). Within each race category, the most populous age group was the 20-24 year olds, except among the American Indians/Alaskan Natives & the multiracial group in which 5-9 year olds were the most populous. When compared to 2011, the racial groups that experienced population increases in all age groups were the Asian (Range: 0.95% - 8.04%) and the multiracial groups (1.63% - 7.32%).
Health Status Indicators 06B: Infants and children aged 0 through 24 years enumerated by sub-populations of age group and Hispanic ethnicity. (Demographics)
HSI #06B - Demographics (TOTAL POPULATION)
CATEGORY TOTAL POPULATION BY HISPANIC ETHNICITY
Total NOT Hispanic or Latino
Total Hispanic or Latino
Ethnicity Not Reported
Infants 0 to 1 109474 23080 0
Children 1 through 4 453698 88780 0
Children 5 through 9 600473 100412 0 Children 10 through 14 620113 82555 0
Children 15 through 19 627469 72179 0
Children 20 through 24 650403 77771 0
Children 0 through 24 3061630 444777 0
Notes – 2013
Data source: OASIS (population/census data), 2012
Narrative: For 2012, among the non-Hispanics, the most populous group was the 20-24 year olds (650,403) followed by the 15-19 year olds (627,469). Among the Hispanics, the largest age group was the 5-9 year olds (100,412) followed by the 1-4 year olds (88,780). When compared to 2011, among children 0-24 years old, there has been an overall increase in the population, more among the Hispanics (1.57% increase) than the non-Hispanics (0.48% increase).
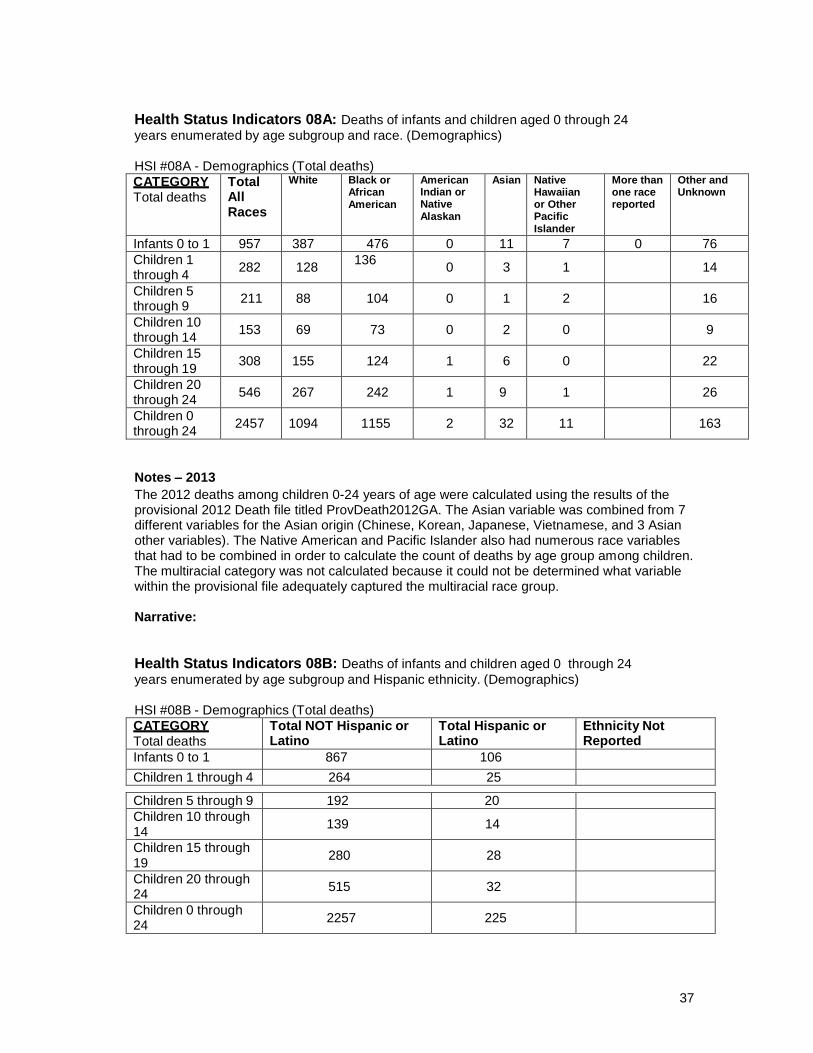
37
Health Status Indicators 08A: Deaths of infants and children aged 0 through 24
years enumerated by age subgroup and race. (Demographics)
HSI #08A - Demographics (Total deaths)
CATEGORY Total deaths
Total All Races
White Black or African American
American Indian or Native Alaskan
Asian Native Hawaiian or Other Pacific Islander
More than one race reported
Other and Unknown
Infants 0 to 1 957 387 476 0 11 7 0 76
Children 1 through 4
282
128 136
0
3
1
14
Children 5 through 9
211
88
104
0
1
2
16
Children 10 through 14
153
69
73
0
2
0
9
Children 15 through 19
308
155
124
1
6
0
22
Children 20 through 24
546
267
242
1
9
1
26
Children 0 through 24
2457
1094
1155
2
32
11
163
Notes – 2013
The 2012 deaths among children 0-24 years of age were calculated using the results of the provisional 2012 Death file titled ProvDeath2012GA. The Asian variable was combined from 7 different variables for the Asian origin (Chinese, Korean, Japanese, Vietnamese, and 3 Asian other variables). The Native American and Pacific Islander also had numerous race variables that had to be combined in order to calculate the count of deaths by age group among children. The multiracial category was not calculated because it could not be determined what variable within the provisional file adequately captured the multiracial race group.
Narrative:
Health Status Indicators 08B: Deaths of infants and children aged 0 through 24
years enumerated by age subgroup and Hispanic ethnicity. (Demographics)
HSI #08B - Demographics (Total deaths)
CATEGORY Total deaths
Total NOT Hispanic or Latino
Total Hispanic or Latino
Ethnicity Not Reported
Infants 0 to 1 867 106
Children 1 through 4 264 25
Children 5 through 9 192 20
Children 10 through 14
139
14
Children 15 through 19
280
28
Children 20 through 24
515
32
Children 0 through 24
2257
225

38
Notes – 2013
The count from the provisional file for the Hispanic deaths in 2012 was calculated using the provisional death file from 2012 titled ProvDeath2012GA. There were five different variables that were combined to determine the count of Hispanic deaths among children aged 0-24. The unknown variable was not calculated due to the coding of some of variables. The author could not decipher which code was used for unknown. The counts for the columns were coded as “H” for Hispanic and “N” for non-Hispanic.
Narrative:
Health Status Indicators 10: Geographic living area for all children aged 0 through 19
years.
HSI #10 - Demographics (Geographic Living Area)
Geographic Living Area Total
Living in metropolitan areas 862433
Living in urban areas 2318246
Living in rural areas 459987
Living in frontier areas 0
Total - all children 0 through 19 2778233
Notes – 2013
Georgia population data was provided by the Office of Health Information for Planning. Georgia population data accessed through OASIS. http://oasis.state.ga.us/oasis/qryPopulation.aspx
Narrative: The majority of children 0-19 years of age (83%) live in urban areas, and 31% live in metropolitan areas. The population of children 0-19 years increased 0.03% from 2011 to 2012. However, the population of children living in rural areas decreased by 1.5%, while the population of children living in non-rural areas increased by 0.3%. This slight change in population is not expected to have an immediate impact on the services provided to children.