state income limits for 2014 - california department of...
TRANSCRIPT


2014 State Income Limits Briefing Materials
California Code of Regulations, Title 25, § 6932
Page 1
Overview California Department of Housing and Community Development (HCD), pursuant to Health & Safety Code (H&SC) Section 50093(c), filed with the Office of Administrative Law 2014 State Income Limits. HCD updated its income limits based on Department of Housing and Urban Development (HUD) updates to its Section 8 Housing Choice Voucher Program that HUD released on December 18, 2013. HUD annually updates Section 8 income limits to reflect changes in household income category levels and median income levels applicable to extremely-low, very-low, and low- income households. California law specifies that its State Income Limits must be updated based on HUD updates to its Section 8 income limit levels. The Department also revises its State Income Limit levels to reflect the following: (1) adjustments, per State law, to some HUD county median income figures, (2) adjustments to some household income category and area median income levels to reflect HCD’s February 2013 Hold Harmless (HH) Policy. This policy was implemented to replace HUD’s HH Policy, discontinued in 2009, in maintaining income category and area median income levels at their highest achieved levels and (3) calculation of California’s moderate-income household levels based on changes to county area median income levels. Following are brief summaries of different methodologies used by HUD and HCD in updating income limits for different household income categories.
HUD Methodology Beginning with the FY 2013 Income Limits, HUD uses 40th percentile rents instead of Fair Market Rents (FMRs) that include 50th percentile areas, to calculate high housing cost areas. The purpose of this change is to prevent fluctuations in “Low-Income Housing Tax Credit Difficult Development Area” determinations that result solely from high housing cost income limit fluctuations as areas go in and out of the 50th percentile FMR program.
Extremely Low-Income This income category comprises households with a maximum income of 30 percent (30%) of HUD’s median family income (MFI). HUD calculates extremely-low income limits based on very-low income limits. Extremely low-income limits reflect 60 percent of very-low income limits. However, HUD sets a floor based on minimum Supplemental Security Income (SSI).
Very Low-Income The maximum very-low income limit typically reflects 50 percent (50%) of MFI. HUD's MFI figure generally equals two times HUD's 4-person very low-income limit, except when HUD applies adjustments. HUD may adjust income limits for an area or county to account for conditions that warrant special considerations, referred to as exceptions. HUD may apply exceptions to areas with unusually high or low family income, uneven housing-cost-to-income relationships or historical exceptions. The following reflect HUD’s explanations of adjustment increases and decreases contained in HUD’s FY 2014 Income Limits Briefing Material:

2014 State Income Limits Briefing Materials
California Code of Regulations, Title 25, § 6932
Page 2
Adjustment Increases: HUD applies an increase, if the four-person very low-income limit would otherwise be less than the amount at which 35 percent (35%) of it equals 85 percent (85%) of the annualized two-bedroom Section 8 FMR (or 40
th percentile rent in 50
th percentile
FMR areas). The purpose is to increase the income limit for areas where rental housing costs are unusually high in relation to the median income. Another reason for an increase is when the income limit is less than the relevant State non-metropolitan MFI. The four-person income limit is also increased, if it is less than 95 percent of last year’s very low income limit. HUD applies an increase to the four person income limit if it is less than the relevant State non-metropolitan median family income level. In addition, HUD restricts adjustments so income limits do not vary more than five percent (5%) of the previous year's very low-income figure. Very low-income limits are used as the base to calculate extremely-low and low-income limits. Adjustment Decreases: HUD applies a decrease to the greater of 80 percent of the U.S. median family level (MFI), or the amount at which 30 percent of a four-person family’s income equals 100 percent of the two-bedroom FMR (or 40
th percentile rent in 50
th percentile FMR areas).
The purpose is to decrease the income limit for areas of high median family income. The four-person income limit is reduced to the greater of 105 percent of last year’s limit or twice the change in the national MFI estimate if that amount would be larger than five percent (5%). HUD restricts adjustment increases and decreases to not vary more than five percent (5%) of the previous year's very low-income figure. Adjusted very low-income limits are used as the base to calculate extremely-low and low-income limits.
Low-Income In general, maximum income for low-income households reflects 80 percent (80%) of the MFI level. Most low-income limits represent the higher level of: (1) 80 percent of MFI or (2) 80 percent of State non-metropolitan median family income. However, due to adjustments that HUD sometimes makes, strictly calculating low-income limits as 80 percent of MFI could produce unintended anomalies inconsistent with statutory intent. HUD’s briefing materials specify that, with some exceptions, the low-income limit reflects 160 percent of the very low-income limit. HUD may apply exceptions to areas with unusually high or low housing-costs-to-income relationships. An example of the result from HUD applying an exception to an area could be an increase to the low-income limit without an increase to the very low-income limit. In sum, an “80%” limit cannot be assumed to equal 80 percent of the AMI or 4-person median income limit nor 160 percent of the very low-income limit due to adjustments HUD may make. Median Family Income Calculations of HUD's Section 8 Income Limits begin with the production of Median Family Income (MFI) estimates. The FY 2014 MFI estimates use 5-year American Community Survey (ACS) data (2007-2011), augmented by the 2011, 1-year ACS

2014 State Income Limits Briefing Materials
California Code of Regulations, Title 25, § 6932
Page 3
estimate of MFI information and then updated with Consumer Price Index (CPI) data through the end of 2012. Upon HUD determining Median Family Income, very low-income limits are then established and utilized to calculate extremely low- and low-income limits. Income Limit Calculations for Household Sizes Other Than 4-Persons Income limits for all income categories are adjusted for household size so that larger households have higher income limits than smaller households. For all income categories, income limits for household sizes other than 4-persons are calculated using the 4-person income limit as the base. HUD's adjustments use the following percentages, with results rounded to the nearest $50 increment: Number of persons in Household: 1 2 3 4 5 6 7 8
Adjustments: 70% 80% 90% Base 108% 116% 124% 132%
Income Limit Calculations for Household Sizes Greater Than 8-Persons For households of more than eight persons, refer to the formula at the end of the table for 2013 Income Limits. Due to the adjustments HUD can make to income limits in a given county, table data should be the only method used to determine program eligibility. Arithmetic calculations are applicable only when a household has more than eight members.
Reference: FY 2014 HUD Income Limits Transmittal Notice PDR-2014-02 issued December 18, 2013 and HUD Income Limits Briefing Material dated December 1, 2013 http://www.huduser.org/portal/datasets/il/il14/index.html
HCD Methodology State law (Health & Safety Code sections) prescribes the methodology the Department uses to update its Official State Income Limits. The Department utilizes HUD’s Section 8 Housing Choice Voucher Program Income Limits. HCD’s methodology Involves: (1) increasing some counties’ area median levels established by HUD, (2) increasing some 4-person very-low income limits established by HUD, (3) applying adjustments, pursuant to HCD’s new State Income Limit Hold Harmless (HH) Policy implemented in 2013, to restore and maintain household income category and county area median income levels at the highest level achieved prior to any HUD decreases from discontinuing its HH Policy after 2009, and (4) determining income limit levels applicable to California’s moderate-income households defined by State law as household income not exceeding 120 percent of county AMI. Area Median Income HCD adjusts some county area median income (AMI) levels set by HUD in comparing and applying the higher of: (1) HUD's median family income figure applicable to counties with a metropolitan statistical area or (2) HUD's statewide median family income figure for non-metropolitan counties ($57,900 reflecting highest 2012 level pursuant to the Department’s new HH Policy).

2014 State Income Limits Briefing Materials
California Code of Regulations, Title 25, § 6932
Page 4
4-person Median Income Calculation For a few counties, the Department increased HUD’s 4-person very-low figure to equal the respective higher county AMI figure pursuant to HCD’s HH Policy. Usually, HUD’s 4-person median income figure reflects the county's AMI figure. However, because HUD sometimes makes adjustments, based on unusually high median family income, to decrease the 4-person very-low income limit, the Department makes adjustments so its calculation of the 4-person very-low income limit for each county is not less than HUD’s median family income figure and, pursuant to HCD’s HH Policy, not less than the highest level achieved in a prior year.
Moderate-Income Levels The Department is responsible for establishing California moderate-income limit levels. After calculating the 4-person area median income (AMI) level as previously described, the Department sets the maximum moderate income limit to equal 120 percent of county AMI.
Applicability of California’s Official State Income Limits Applicability of these State Income Limits is subject to particular programs as program definitions of such factors as income, family, and household size, etc., vary. Some programs, such as Multifamily Tax Subsidy Projects (MTSPs), use different income limits. For MTSPs, separate income limits apply per provisions of the Housing and Economic Recovery Act (HERA) of 2008 (Public Law 110-289). Income limits for MTSPs are used to determine qualification levels as well as set maximum rental rates for projects funded with tax credits authorized under Section 42 of the Internal Revenue Code (Code). Also, MTSP income limits apply to projects financed with tax exempt housing bonds issued to provide qualified residential rental development under Section 142 of the Code. These income limits are available at this weblink http://www.huduser.org/datasets/mtsp.html.

State Income Limits for 2014 1 of 7
County Income Category 1 2 3 4 5 6 7 8
Alameda County Extremely Low 19,650 22,450 25,250 28,050 30,300 32,550 34,800 37,050 4-Person Very Low Income 32,750 37,400 42,100 46,750 50,500 54,250 58,000 61,750
Area Median Income: Low Income 47,350 54,100 60,850 67,600 73,050 78,450 83,850 89,250 $93,500 Median Income 65,450 74,800 84,150 93,500 101,000 108,450 115,950 123,400
Moderate Income 78,550 89,750 101,000 112,200 121,200 130,150 139,150 148,100
Alpine County Extremely Low 17,150 19,600 22,050 24,500 26,500 28,450 30,400 32,350 4-Person Very Low Income 28,600 32,650 36,750 40,800 44,100 47,350 50,600 53,900
Area Median Income: Low Income 44,750 51,150 57,550 63,900 69,050 74,150 79,250 84,350 $85,000 Median Income 59,500 68,000 76,500 85,000 91,800 98,600 105,400 112,200
Moderate Income 71,400 81,600 91,800 102,000 110,150 118,300 126,500 134,650
Amador County Extremely Low 15,200 17,400 19,550 21,700 23,450 25,200 26,950 28,650 4-Person Very Low Income 25,350 28,950 32,550 36,150 39,050 41,950 44,850 47,750
Area Median Income: Low Income 40,500 46,300 52,100 57,850 62,500 67,150 71,750 76,400 $72,300 Median Income 50,600 57,850 65,050 72,300 78,100 83,850 89,650 95,450
Moderate Income 60,700 69,400 78,100 86,750 93,700 100,650 107,550 114,500
Butte County Extremely Low 12,350 14,100 15,850 17,600 19,050 20,450 21,850 23,250 4-Person Very Low Income 20,550 23,500 26,450 29,350 31,700 34,050 36,400 38,750
Area Median Income: Low Income 32,900 37,600 42,300 46,950 50,750 54,500 58,250 62,000 $58,700 Median Income 41,100 46,950 52,850 58,700 63,400 68,100 72,800 77,500
Moderate Income 49,300 56,350 63,400 70,450 76,100 81,700 87,350 93,000
Calaveras County Extremely Low 14,700 16,800 18,900 21,000 22,700 24,400 26,050 27,750 4-Person Very Low Income 24,500 28,000 31,500 35,000 37,800 40,600 43,400 46,200
Area Median Income: Low Income 39,200 44,800 50,400 56,000 60,500 65,000 69,450 73,950 $70,000 Median Income 49,000 56,000 63,000 70,000 75,600 81,200 86,800 92,400
Moderate Income 58,800 67,200 75,600 84,000 90,700 97,450 104,150 110,900
Colusa County Extremely Low 12,150 13,900 15,650 17,350 18,750 20,150 21,550 22,950 4-Person Very Low Income 20,300 23,200 26,100 28,950 31,300 33,600 35,900 38,250
Area Median Income: Low Income 32,450 37,050 41,700 46,300 50,050 53,750 57,450 61,150 $57,900 Median Income 40,550 46,300 52,100 57,900 62,550 67,150 71,800 76,450
Moderate Income 48,650 55,600 62,550 69,500 75,050 80,600 86,200 91,750
Contra Costa County Extremely Low 19,650 22,450 25,250 28,050 30,300 32,550 34,800 37,050 4-Person Very Low Income 32,750 37,400 42,100 46,750 50,500 54,250 58,000 61,750
Area Median Income: Low Income 47,350 54,100 60,850 67,600 73,050 78,450 83,850 89,250 $93,500 Median Income 65,450 74,800 84,150 93,500 101,000 108,450 115,950 123,400
Moderate Income 78,550 89,750 101,000 112,200 121,200 130,150 139,150 148,100
Del Norte County Extremely Low 12,150 13,900 15,650 17,350 18,750 20,150 21,550 22,950 4-Person Very Low Income 20,300 23,200 26,100 28,950 31,300 33,600 35,900 38,250
Area Median Income: Low Income 32,450 37,050 41,700 46,300 50,050 53,750 57,450 61,150 $57,900 Median Income 40,550 46,300 52,100 57,900 62,550 67,150 71,800 76,450
Moderate Income 48,650 55,600 62,550 69,500 75,050 80,600 86,200 91,750
El Dorado County Extremely Low 16,000 18,300 20,600 22,850 24,700 26,550 28,350 30,200 4-Person Very Low Income 26,650 30,450 34,250 38,050 41,100 44,150 47,200 50,250
Area Median Income: Low Income 42,650 48,750 54,850 60,900 65,800 70,650 75,550 80,400 $76,100 Median Income 53,250 60,900 68,500 76,100 82,200 88,300 94,350 100,450
Moderate Income 63,900 73,050 82,150 91,300 98,600 105,900 113,200 120,500
Fresno County Extremely Low 12,150 13,900 15,650 17,350 18,750 20,150 21,550 22,950 4-Person Very Low Income 20,300 23,200 26,100 28,950 31,300 33,600 35,900 38,250
Area Median Income: Low Income 32,450 37,050 41,700 46,300 50,050 53,750 57,450 61,150 $57,900 Median Income 40,550 46,300 52,100 57,900 62,550 67,150 71,800 76,450
Moderate Income 48,650 55,600 62,550 69,500 75,050 80,600 86,200 91,750
Number of Persons in Household
See instructions on last page to use these income limits to determine applicant eligibility and calculate affordable housing cost and rent

State Income Limits for 2014 2 of 7
County Income Category 1 2 3 4 5 6 7 8
Number of Persons in Household
Glenn County Extremely Low 12,150 13,900 15,650 17,350 18,750 20,150 21,550 22,950
4-Person Very Low Income 20,300 23,200 26,100 28,950 31,300 33,600 35,900 38,250 Area Median Income: Low Income 32,450 37,050 41,700 46,300 50,050 53,750 57,450 61,150
$57,900 Median Income 40,550 46,300 52,100 57,900 62,550 67,150 71,800 76,450 Moderate Income 48,650 55,600 62,550 69,500 75,050 80,600 86,200 91,750
Humboldt County Extremely Low 12,150 13,900 15,650 17,350 18,750 20,150 21,550 22,950
4-Person Very Low Income 20,300 23,200 26,100 28,950 31,300 33,600 35,900 38,250 Area Median Income: Low Income 32,450 37,050 41,700 46,300 50,050 53,750 57,450 61,150
$57,900 Median Income 40,550 46,300 52,100 57,900 62,550 67,150 71,800 76,450 Moderate Income 48,650 55,600 62,550 69,500 75,050 80,600 86,200 91,750
Imperial County Extremely Low 12,150 13,900 15,650 17,350 18,750 20,150 21,550 22,950
4-Person Very Low Income 20,300 23,200 26,100 28,950 31,300 33,600 35,900 38,250 Area Median Income: Low Income 32,450 37,050 41,700 46,300 50,050 53,750 57,450 61,150
$57,900 Median Income 40,550 46,300 52,100 57,900 62,550 67,150 71,800 76,450 Moderate Income 48,650 55,600 62,550 69,500 75,050 80,600 86,200 91,750
Inyo County Extremely Low 14,500 16,600 18,650 20,700 22,400 24,050 25,700 27,350
4-Person Very Low Income 24,150 27,600 31,050 34,500 37,300 40,050 42,800 45,550 Area Median Income: Low Income 38,650 44,200 49,700 55,200 59,650 64,050 68,450 72,900
$70,900 Median Income 49,650 56,700 63,800 70,900 76,550 82,250 87,900 93,600 Moderate Income 59,550 68,100 76,600 85,100 91,900 98,700 105,500 112,350
Kern County Extremely Low 12,150 13,900 15,650 17,350 18,750 20,150 21,550 22,950
4-Person Very Low Income 20,300 23,200 26,100 28,950 31,300 33,600 35,900 38,250 Area Median Income: Low Income 32,450 37,050 41,700 46,300 50,050 53,750 57,450 61,150
$57,900 Median Income 40,550 46,300 52,100 57,900 62,550 67,150 71,800 76,450 Moderate Income 48,650 55,600 62,550 69,500 75,050 80,600 86,200 91,750
Kings County Extremely Low 12,150 13,900 15,650 17,350 18,750 20,150 21,550 22,950
4-Person Very Low Income 20,300 23,200 26,100 28,950 31,300 33,600 35,900 38,250 Area Median Income: Low Income 32,450 37,050 41,700 46,300 50,050 53,750 57,450 61,150
$57,900 Median Income 40,550 46,300 52,100 57,900 62,550 67,150 71,800 76,450 Moderate Income 48,650 55,600 62,550 69,500 75,050 80,600 86,200 91,750
Lake County Extremely Low 12,150 13,900 15,650 17,350 18,750 20,150 21,550 22,950
4-Person Very Low Income 20,300 23,200 26,100 28,950 31,300 33,600 35,900 38,250 Area Median Income: Low Income 32,450 37,050 41,700 46,300 50,050 53,750 57,450 61,150
$57,900 Median Income 40,550 46,300 52,100 57,900 62,550 67,150 71,800 76,450 Moderate Income 48,650 55,600 62,550 69,500 75,050 80,600 86,200 91,750
Lassen County Extremely Low 14,250 16,300 18,350 20,350 22,000 23,650 25,250 26,900
4-Person Very Low Income 23,800 27,200 30,600 33,950 36,700 39,400 42,100 44,850 Area Median Income: Low Income 38,050 43,450 48,900 54,300 58,650 63,000 67,350 71,700
$68,000 Median Income 47,600 54,400 61,200 68,000 73,450 78,900 84,300 89,750 Moderate Income 57,100 65,300 73,450 81,600 88,150 94,650 101,200 107,700
Los Angeles County Extremely Low 17,950 20,500 23,050 25,600 27,650 29,700 31,750 33,800
4-Person Very Low Income 29,900 34,200 38,450 42,700 46,150 49,550 52,950 56,400 Area Median Income: Low Income * 47,850 54,650 61,500 68,300 73,800 79,250 84,700 90,200
$64,800 Median Income 45,350 51,850 58,300 64,800 70,000 75,150 80,350 85,550 Moderate Income 54,450 62,200 70,000 77,750 83,950 90,200 96,400 102,650
* Lower income exceeding median income is an anomaly just for this county due to HUD historical high cost adjustments to median. Household lower income figures are derived based on very-low income figures not adjusted by HUD to account for any exceptions.
See instructions on last page to use these income limits to determine applicant eligibility and calculate affordable housing cost and rent

State Income Limits for 2014 3 of 7
County Income Category 1 2 3 4 5 6 7 8
Number of Persons in Household
Madera County Extremely Low 12,150 13,900 15,650 17,350 18,750 20,150 21,550 22,950
4-Person Very Low Income 20,300 23,200 26,100 28,950 31,300 33,600 35,900 38,250 Area Median Income: Low Income 32,450 37,050 41,700 46,300 50,050 53,750 57,450 61,150
$57,900 Median Income 40,550 46,300 52,100 57,900 62,550 67,150 71,800 76,450 Moderate Income 48,650 55,600 62,550 69,500 75,050 80,600 86,200 91,750
Marin County Extremely Low 23,750 27,150 30,550 33,950 36,650 39,400 42,100 44,800
4-Person Very Low Income 39,600 45,250 50,900 56,550 61,050 65,600 70,100 74,650 Area Median Income: Low Income 63,350 72,400 81,450 90,500 97,700 104,950 112,200 119,450
$103,000 Median Income 72,100 82,400 92,700 103,000 111,250 119,500 127,700 135,950 Moderate Income 86,500 98,900 111,250 123,600 133,500 143,400 153,250 163,150
Mariposa County Extremely Low 12,900 14,750 16,600 18,400 19,900 21,350 22,850 24,300
4-Person Very Low Income 21,500 24,550 27,600 30,650 33,150 35,600 38,050 40,500 Area Median Income: Low Income 34,350 39,250 44,150 49,050 53,000 56,900 60,850 64,750
$61,300 Median Income 42,900 49,050 55,150 61,300 66,200 71,100 76,000 80,900 Moderate Income 51,500 58,850 66,200 73,550 79,450 85,300 91,200 97,100
Mendocino County Extremely Low 12,150 13,900 15,650 17,350 18,750 20,150 21,550 22,950
4-Person Very Low Income 20,300 23,200 26,100 28,950 31,300 33,600 35,900 38,250 Area Median Income: Low Income 32,450 37,050 41,700 46,300 50,050 53,750 57,450 61,150
$57,900 Median Income 40,550 46,300 52,100 57,900 62,550 67,150 71,800 76,450 Moderate Income 48,650 55,600 62,550 69,500 75,050 80,600 86,200 91,750
Merced County Extremely Low 12,150 13,900 15,650 17,350 18,750 20,150 21,550 22,950
4-Person Very Low Income 20,300 23,200 26,100 28,950 31,300 33,600 35,900 38,250 Area Median Income: Low Income 32,450 37,050 41,700 46,300 50,050 53,750 57,450 61,150
$57,900 Median Income 40,550 46,300 52,100 57,900 62,550 67,150 71,800 76,450 Moderate Income 48,650 55,600 62,550 69,500 75,050 80,600 86,200 91,750
Modoc County Extremely Low 12,150 13,900 15,650 17,350 18,750 20,150 21,550 22,950
4-Person Very Low Income 20,300 23,200 26,100 28,950 31,300 33,600 35,900 38,250 Area Median Income: Low Income 32,450 37,050 41,700 46,300 50,050 53,750 57,450 61,150
$57,900 Median Income 40,550 46,300 52,100 57,900 62,550 67,150 71,800 76,450 Moderate Income 48,650 55,600 62,550 69,500 75,050 80,600 86,200 91,750
Mono County Extremely Low 17,050 19,500 21,950 24,350 26,300 28,250 30,200 32,150
4-Person Very Low Income 28,450 32,500 36,550 40,600 43,850 47,100 50,350 53,600 Area Median Income: Low Income 44,750 51,150 57,550 63,900 69,050 74,150 79,250 84,350
$81,200 Median Income 56,850 64,950 73,100 81,200 87,700 94,200 100,700 107,200 Moderate Income 68,200 77,950 87,700 97,450 105,250 113,050 120,850 128,650
Monterey County Extremely Low 15,100 17,250 19,400 21,550 23,300 25,000 26,750 28,450
4-Person Very Low Income 25,200 28,800 32,400 35,950 38,850 41,750 44,600 47,500 Area Median Income: Low Income 40,250 46,000 51,750 57,500 62,100 66,700 71,300 75,900
$68,700 Median Income 48,100 54,950 61,850 68,700 74,200 79,700 85,200 90,700 Moderate Income 57,700 65,950 74,200 82,450 89,050 95,650 102,250 108,850
Napa County Extremely Low 18,100 20,700 23,300 25,850 27,950 30,000 32,100 34,150
4-Person Very Low Income 30,150 34,450 38,750 43,050 46,500 49,950 53,400 56,850 Area Median Income: Low Income 46,150 52,750 59,350 65,900 71,200 76,450 81,750 87,000
$86,100 Median Income 60,250 68,900 77,500 86,100 93,000 99,900 106,750 113,650 Moderate Income 72,300 82,650 92,950 103,300 111,550 119,850 128,100 136,350
Nevada County Extremely Low 15,300 17,450 19,650 21,800 23,550 25,300 27,050 28,800
4-Person Very Low Income 25,450 29,050 32,700 36,300 39,250 42,150 45,050 47,950 Area Median Income: Low Income 40,700 46,500 52,300 58,100 62,750 67,400 72,050 76,700
$73,500 Median Income 51,450 58,800 66,150 73,500 79,400 85,250 91,150 97,000 Moderate Income 61,750 70,550 79,400 88,200 95,250 102,300 109,350 116,400
See instructions on last page to use these income limits to determine applicant eligibility and calculate affordable housing cost and rent

State Income Limits for 2014 4 of 7
County Income Category 1 2 3 4 5 6 7 8
Number of Persons in Household
Orange County Extremely Low 20,250 23,150 26,050 28,900 31,250 33,550 35,850 38,150
4-Person Very Low Income 33,750 38,550 43,350 48,150 52,050 55,900 59,750 63,600 Area Median Income: Low Income 53,950 61,650 69,350 77,050 83,250 89,400 95,550 101,750
$87,200 Median Income 61,050 69,750 78,500 87,200 94,200 101,150 108,150 115,100 Moderate Income 73,250 83,700 94,200 104,650 113,000 121,400 129,750 138,150
Placer County Extremely Low 16,000 18,300 20,600 22,850 24,700 26,550 28,350 30,200
4-Person Very Low Income 26,650 30,450 34,250 38,050 41,100 44,150 47,200 50,250 Area Median Income: Low Income 42,650 48,750 54,850 60,900 65,800 70,650 75,550 80,400
$76,100 Median Income 53,250 60,900 68,500 76,100 82,200 88,300 94,350 100,450 Moderate Income 63,900 73,050 82,150 91,300 98,600 105,900 113,200 120,500
Plumas County Extremely Low 13,050 14,900 16,750 18,600 20,100 21,600 23,100 24,600
4-Person Very Low Income 21,700 24,800 27,900 31,000 33,500 36,000 38,450 40,950 Area Median Income: Low Income 34,750 39,700 44,650 49,600 53,600 57,550 61,550 65,500
$62,000 Median Income 43,400 49,600 55,800 62,000 66,950 71,900 76,900 81,850 Moderate Income 52,100 59,500 66,950 74,400 80,350 86,300 92,250 98,200
Riverside County Extremely Low 14,100 16,100 18,100 20,100 21,750 23,350 24,950 26,550
4-Person Very Low Income 23,450 26,800 30,150 33,500 36,200 38,900 41,550 44,250 Area Median Income: Low Income 37,550 42,900 48,250 53,600 57,900 62,200 66,500 70,800
$65,000 Median Income 45,500 52,000 58,500 65,000 70,200 75,400 80,600 85,800 Moderate Income 54,600 62,400 70,200 78,000 84,250 90,500 96,700 102,950
Sacramento County Extremely Low 16,000 18,300 20,600 22,850 24,700 26,550 28,350 30,200
4-Person Very Low Income 26,650 30,450 34,250 38,050 41,100 44,150 47,200 50,250 Area Median Income: Low Income 42,650 48,750 54,850 60,900 65,800 70,650 75,550 80,400
$76,100 Median Income 53,250 60,900 68,500 76,100 82,200 88,300 94,350 100,450 Moderate Income 63,900 73,050 82,150 91,300 98,600 105,900 113,200 120,500
San Benito County Extremely Low 17,050 19,500 21,950 24,350 26,300 28,250 30,200 32,150
4-Person Very Low Income 28,400 32,450 36,500 40,550 43,800 47,050 50,300 53,550 Area Median Income: Low Income 45,100 51,550 58,000 64,400 69,600 74,750 79,900 85,050
$81,100 Median Income 56,750 64,900 73,000 81,100 87,600 94,100 100,550 107,050 Moderate Income 68,100 77,850 87,550 97,300 105,100 112,850 120,650 128,450
San Bernardino County Extremely Low 14,100 16,100 18,100 20,100 21,750 23,350 24,950 26,550
4-Person Very Low Income 23,450 26,800 30,150 33,500 36,200 38,900 41,550 44,250 Area Median Income: Low Income 37,550 42,900 48,250 53,600 57,900 62,200 66,500 70,800
$65,000 Median Income 45,500 52,000 58,500 65,000 70,200 75,400 80,600 85,800 Moderate Income 54,600 62,400 70,200 78,000 84,250 90,500 96,700 102,950
San Diego County Extremely Low 17,350 19,850 22,300 24,800 26,800 28,750 30,750 32,750
4-Person Very Low Income 28,900 33,050 37,150 41,300 44,600 47,900 51,200 54,500 Area Median Income: Low Income 46,250 52,900 59,500 66,100 71,400 76,700 81,950 87,250
$75,900 Median Income 53,150 60,700 68,300 75,900 81,950 88,050 94,100 100,200 Moderate Income 63,750 72,900 82,000 91,100 98,400 105,700 112,950 120,250
San Francisco County Extremely Low 23,750 27,150 30,550 33,950 36,650 39,400 42,100 44,800
4-Person Very Low Income 39,600 45,250 50,900 56,550 61,050 65,600 70,100 74,650 Area Median Income: Low Income 63,350 72,400 81,450 90,500 97,700 104,950 112,200 119,450
$103,000 Median Income 72,100 82,400 92,700 103,000 111,250 119,500 127,700 135,950 Moderate Income 86,500 98,900 111,250 123,600 133,500 143,400 153,250 163,150
San Joaquin County Extremely Low 13,950 15,950 17,950 19,900 21,500 23,100 24,700 26,300
4-Person Very Low Income 23,250 26,550 29,850 33,150 35,850 38,500 41,150 43,800 Area Median Income: Low Income 37,150 42,450 47,750 53,050 57,300 61,550 65,800 70,050
$66,300 Median Income 46,400 53,050 59,650 66,300 71,600 76,900 82,200 87,500 Moderate Income 55,700 63,650 71,600 79,550 85,900 92,300 98,650 105,000
See instructions on last page to use these income limits to determine applicant eligibility and calculate affordable housing cost and rent
State Income Limits for 2014 5 of 7
County Income Category 1 2 3 4 5 6 7 8
Number of Persons in Household
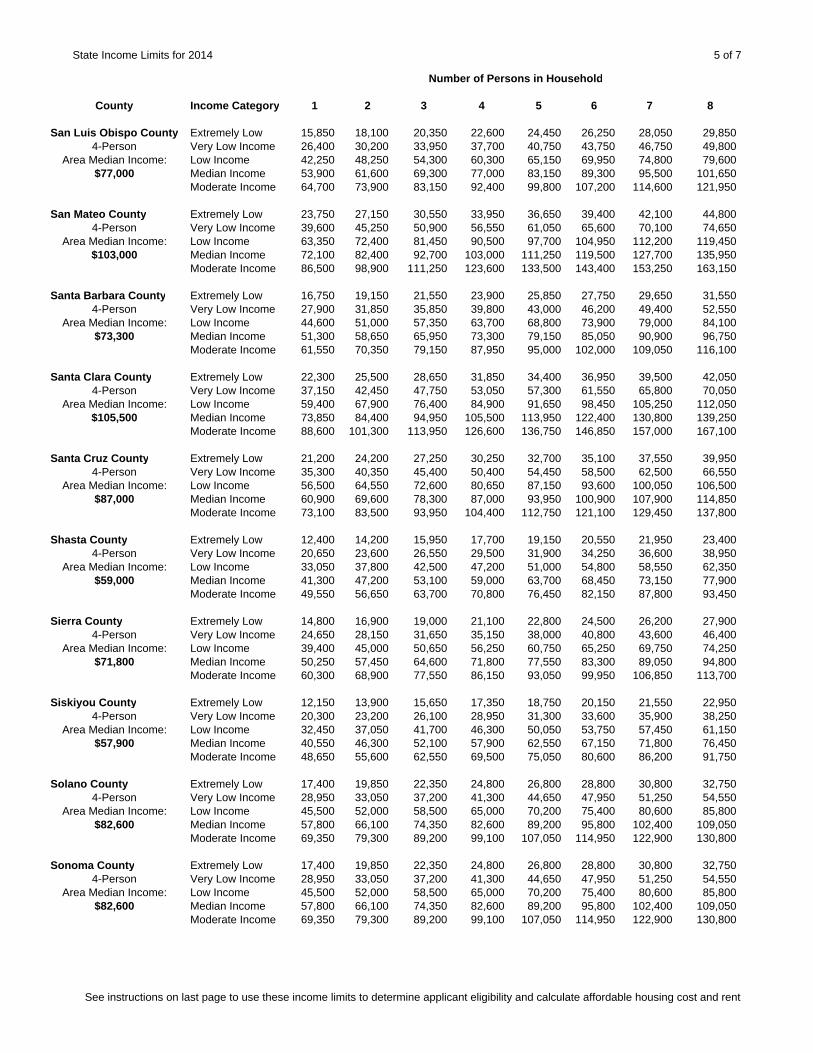
San Luis Obispo County Extremely Low 15,850 18,100 20,350 22,600 24,450 26,250 28,050 29,850
4-Person Very Low Income 26,400 30,200 33,950 37,700 40,750 43,750 46,750 49,800 Area Median Income: Low Income 42,250 48,250 54,300 60,300 65,150 69,950 74,800 79,600
$77,000 Median Income 53,900 61,600 69,300 77,000 83,150 89,300 95,500 101,650 Moderate Income 64,700 73,900 83,150 92,400 99,800 107,200 114,600 121,950
San Mateo County Extremely Low 23,750 27,150 30,550 33,950 36,650 39,400 42,100 44,800
4-Person Very Low Income 39,600 45,250 50,900 56,550 61,050 65,600 70,100 74,650 Area Median Income: Low Income 63,350 72,400 81,450 90,500 97,700 104,950 112,200 119,450
$103,000 Median Income 72,100 82,400 92,700 103,000 111,250 119,500 127,700 135,950 Moderate Income 86,500 98,900 111,250 123,600 133,500 143,400 153,250 163,150
Santa Barbara County Extremely Low 16,750 19,150 21,550 23,900 25,850 27,750 29,650 31,550
4-Person Very Low Income 27,900 31,850 35,850 39,800 43,000 46,200 49,400 52,550 Area Median Income: Low Income 44,600 51,000 57,350 63,700 68,800 73,900 79,000 84,100
$73,300 Median Income 51,300 58,650 65,950 73,300 79,150 85,050 90,900 96,750 Moderate Income 61,550 70,350 79,150 87,950 95,000 102,000 109,050 116,100
Santa Clara County Extremely Low 22,300 25,500 28,650 31,850 34,400 36,950 39,500 42,050
4-Person Very Low Income 37,150 42,450 47,750 53,050 57,300 61,550 65,800 70,050 Area Median Income: Low Income 59,400 67,900 76,400 84,900 91,650 98,450 105,250 112,050
$105,500 Median Income 73,850 84,400 94,950 105,500 113,950 122,400 130,800 139,250 Moderate Income 88,600 101,300 113,950 126,600 136,750 146,850 157,000 167,100
Santa Cruz County Extremely Low 21,200 24,200 27,250 30,250 32,700 35,100 37,550 39,950
4-Person Very Low Income 35,300 40,350 45,400 50,400 54,450 58,500 62,500 66,550 Area Median Income: Low Income 56,500 64,550 72,600 80,650 87,150 93,600 100,050 106,500
$87,000 Median Income 60,900 69,600 78,300 87,000 93,950 100,900 107,900 114,850 Moderate Income 73,100 83,500 93,950 104,400 112,750 121,100 129,450 137,800
Shasta County Extremely Low 12,400 14,200 15,950 17,700 19,150 20,550 21,950 23,400
4-Person Very Low Income 20,650 23,600 26,550 29,500 31,900 34,250 36,600 38,950 Area Median Income: Low Income 33,050 37,800 42,500 47,200 51,000 54,800 58,550 62,350
$59,000 Median Income 41,300 47,200 53,100 59,000 63,700 68,450 73,150 77,900 Moderate Income 49,550 56,650 63,700 70,800 76,450 82,150 87,800 93,450
Sierra County Extremely Low 14,800 16,900 19,000 21,100 22,800 24,500 26,200 27,900
4-Person Very Low Income 24,650 28,150 31,650 35,150 38,000 40,800 43,600 46,400 Area Median Income: Low Income 39,400 45,000 50,650 56,250 60,750 65,250 69,750 74,250
$71,800 Median Income 50,250 57,450 64,600 71,800 77,550 83,300 89,050 94,800 Moderate Income 60,300 68,900 77,550 86,150 93,050 99,950 106,850 113,700
Siskiyou County Extremely Low 12,150 13,900 15,650 17,350 18,750 20,150 21,550 22,950
4-Person Very Low Income 20,300 23,200 26,100 28,950 31,300 33,600 35,900 38,250 Area Median Income: Low Income 32,450 37,050 41,700 46,300 50,050 53,750 57,450 61,150
$57,900 Median Income 40,550 46,300 52,100 57,900 62,550 67,150 71,800 76,450 Moderate Income 48,650 55,600 62,550 69,500 75,050 80,600 86,200 91,750
Solano County Extremely Low 17,400 19,850 22,350 24,800 26,800 28,800 30,800 32,750
4-Person Very Low Income 28,950 33,050 37,200 41,300 44,650 47,950 51,250 54,550 Area Median Income: Low Income 45,500 52,000 58,500 65,000 70,200 75,400 80,600 85,800
$82,600 Median Income 57,800 66,100 74,350 82,600 89,200 95,800 102,400 109,050 Moderate Income 69,350 79,300 89,200 99,100 107,050 114,950 122,900 130,800
Sonoma County Extremely Low 17,400 19,850 22,350 24,800 26,800 28,800 30,800 32,750
4-Person Very Low Income 28,950 33,050 37,200 41,300 44,650 47,950 51,250 54,550 Area Median Income: Low Income 45,500 52,000 58,500 65,000 70,200 75,400 80,600 85,800
$82,600 Median Income 57,800 66,100 74,350 82,600 89,200 95,800 102,400 109,050 Moderate Income 69,350 79,300 89,200 99,100 107,050 114,950 122,900 130,800
See instructions on last page to use these income limits to determine applicant eligibility and calculate affordable housing cost and rent

State Income Limits for 2014 6 of 7
County Income Category 1 2 3 4 5 6 7 8
Number of Persons in Household
Stanislaus County Extremely Low 13,050 14,900 16,750 18,600 20,100 21,600 23,100 24,600
4-Person Very Low Income 21,700 24,800 27,900 31,000 33,500 36,000 38,450 40,950 Area Median Income: Low Income 34,750 39,700 44,650 49,600 53,600 57,550 61,550 65,500
$62,000 Median Income 43,400 49,600 55,800 62,000 66,950 71,900 76,900 81,850 Moderate Income 52,100 59,500 66,950 74,400 80,350 86,300 92,250 98,200
Sutter County Extremely Low 12,500 14,250 16,050 17,800 19,250 20,650 22,100 23,500
4-Person Very Low Income 20,800 23,800 26,750 29,700 32,100 34,500 36,850 39,250 Area Median Income: Low Income 33,250 38,000 42,750 47,500 51,300 55,100 58,900 62,700
$59,400 Median Income 41,600 47,500 53,450 59,400 64,150 68,900 73,650 78,400 Moderate Income 49,900 57,050 64,150 71,300 77,000 82,700 88,400 94,100
Tehama County Extremely Low 12,150 13,900 15,650 17,350 18,750 20,150 21,550 22,950
4-Person Very Low Income 20,300 23,200 26,100 28,950 31,300 33,600 35,900 38,250 Area Median Income: Low Income 32,450 37,050 41,700 46,300 50,050 53,750 57,450 61,150
$57,900 Median Income 40,550 46,300 52,100 57,900 62,550 67,150 71,800 76,450 Moderate Income 48,650 55,600 62,550 69,500 75,050 80,600 86,200 91,750
Trinity County Extremely Low 12,150 13,900 15,650 17,350 18,750 20,150 21,550 22,950
4-Person Very Low Income 20,300 23,200 26,100 28,950 31,300 33,600 35,900 38,250 Area Median Income: Low Income 32,450 37,050 41,700 46,300 50,050 53,750 57,450 61,150
$57,900 Median Income 40,550 46,300 52,100 57,900 62,550 67,150 71,800 76,450 Moderate Income 48,650 55,600 62,550 69,500 75,050 80,600 86,200 91,750
Tulare County Extremely Low 12,150 13,900 15,650 17,350 18,750 20,150 21,550 22,950
4-Person Very Low Income 20,300 23,200 26,100 28,950 31,300 33,600 35,900 38,250 Area Median Income: Low Income 32,450 37,050 41,700 46,300 50,050 53,750 57,450 61,150
$57,900 Median Income 40,550 46,300 52,100 57,900 62,550 67,150 71,800 76,450 Moderate Income 48,650 55,600 62,550 69,500 75,050 80,600 86,200 91,750
Tuolumne County Extremely Low 13,950 15,950 17,950 19,900 21,500 23,100 24,700 26,300
4-Person Very Low Income 23,250 26,600 29,900 33,200 35,900 38,550 41,200 43,850 Area Median Income: Low Income 37,200 42,500 47,800 53,100 57,350 61,600 65,850 70,100
$66,700 Median Income 46,700 53,350 60,050 66,700 72,050 77,350 82,700 88,050 Moderate Income 56,050 64,050 72,050 80,050 86,450 92,850 99,250 105,650
Ventura County Extremely Low 18,800 21,450 24,150 26,800 28,950 31,100 33,250 35,400
4-Person Very Low Income 31,300 35,750 40,200 44,650 48,250 51,800 55,400 58,950 Area Median Income: Low Income 49,850 57,000 64,100 71,200 76,900 82,600 88,300 94,000
$89,300 Median Income 62,500 71,450 80,350 89,300 96,450 103,600 110,750 117,900 Moderate Income 75,000 85,700 96,450 107,150 115,700 124,300 132,850 141,450
Yolo County Extremely Low 16,150 18,450 20,750 23,050 24,900 26,750 28,600 30,450
4-Person Very Low Income 26,950 30,800 34,650 38,450 41,550 44,650 47,700 50,800 Area Median Income: Low Income 43,050 49,200 55,350 61,500 66,450 71,350 76,300 81,200
$76,900 Median Income 53,850 61,500 69,200 76,900 83,050 89,200 95,350 101,500 Moderate Income 64,600 73,850 83,050 92,300 99,700 107,050 114,450 121,850
See instructions on last page to use these income limits to determine applicant eligibility and calculate affordable housing cost and rent

State Income Limits for 2014 7 of 7
County Income Category 1 2 3 4 5 6 7 8
Number of Persons in Household
Yuba County Extremely Low 12,500 14,250 16,050 17,800 19,250 20,650 22,100 23,500
4-Person Very Low Income 20,800 23,800 26,750 29,700 32,100 34,500 36,850 39,250 Area Median Income: Low Income 33,250 38,000 42,750 47,500 51,300 55,100 58,900 62,700
$59,400 Median Income 41,600 47,500 53,450 59,400 64,150 68,900 73,650 78,400 Moderate Income 49,900 57,050 64,150 71,300 77,000 82,700 88,400 94,100
Instructions:Eligibility Determination: Use household size income category figures in this chart. Determine eligibililty based on actual number of persons inhousehold and total of gross income for all persons.
Determination of Income Limit for Households Larger than Eight Persons:Per person (PP) adjustment above 8: (1) multiply the 4-person income limit by eight percent (8%), (2) multiply result by number of persons inexcess of eight, (3) add the amount to the 8-person income limit, and (4) round to the nearest $50.
Yuba CountyE X A M P L E 4 persons 8% PP Adj + 8 persons =9 persons 8 person + 8% Adj x 2 =10 personsExtremely Low 17,800 1424 23,500 24,900 23,500 2848 26,350Very Low Income 29,700 2376 39,200 41,600 39,200 4752 43,950Lower Income 47,500 3800 62,700 66,500 62,700 7600 70,300Moderate Income 71,300 5704 94,100 99,800 94,100 11408 105,500
Calculation of Housing Cost and Rent: Refer to Heath & Safety Code Sections 50052.5 and 50053. Use benchmark household size and multiply against applicable percentages defined in H&SC using Area Median Income identified in this chart.
Determination of Household Size: For projects with no federal assistance, household size is set at number of bedrooms in unit plus one.For projects with federal assistance, household size may be set by multiplying 1.5 against the number of bedrooms in unit.
HUD release: 12/18/2013
Authority cited: Health and Safety Code (H&SC) Section 50093.Reference: H&SC Sections 50079.5, 50093, 50105, and 50106.
See instructions on last page to use these income limits to determine applicant eligibility and calculate affordable housing cost and rent