state economic forecast
TRANSCRIPT
TD Economics
@TD_Economicshttp://economics.td.com
State Economic Forecast
New England• New England’s economic recovery process continues to make headway. The easing of restrictions has been a boon for con-
sumer-related industries, including the bruised leisure & hospitality sector. While most states in the region continue to lag the U.S. in terms of the jobs recovery, employment growth has generally kept pace with the nation this year, leading to lower unemployment rates. Labor markets of some of the smaller states show significant tightness, given limited improvement in labor force participation. The latest Delta-driven infection wave poses a near-term hurdle for growth. Fortunately, the region has some of the highest vaccination rates in the country, which will help limit the health toll and economic damage. Led by Massachusetts, the regional economy is forecast to expand at a clip similar to the nation’s during the 2021-22 period.
Beata Caranci, SVP & Chief Economist | 416-982-8067
James Marple, Managing Director | 416-982-2557
September 23, 2021
Middle Atlantic• The Mid-Atlantic economy is turning the corner this year, but, given a more pronounced hit from the pandemic at its on-
set, it has more catching up to do. High and rising vaccination rates in the region will help nurture the recovery. The latest Delta-driven infection wave, however, poses a near-term hurdle, particularly for the Empire State, given that it has delayed return-to-office plans in NYC. As a result, the state is expected to grow at a slightly slower pace than its neighbors this year, at 4.8%. This setback, however, should prove temporary, with the state expected to grow at an above-average rate of 4.9% next year as it makes up for lost ground. Growth in neighboring New Jersey and Pennsylvania, meanwhile, is expected to decelerate more in line with the U.S. average in 2022, to a little over 4%.
Admir Kolaj, Economist | 416-944-6318
Shernette Mcleod, PhD, Economist | 416-415-0413
Upper South Atlantic• The economic outlook for the Upper South Atlantic region remains positive despite some near-term headwinds as govern-
ments shift tactics in order to curtail the pandemic. Virginia and Maryland have recovered over half the jobs lost since the start of the pandemic-induced downturn, while DC has further to go. Business investment is picking up in North Carolina and Delaware is seeing a bustle of activity in its important logistics sector. Overall, North Carolina is expected to grow by a robust 6.7% this year, with Delaware not far behind at 5.3%.
Lower South Atlantic• The economies of the Lower South Atlantic are expected to
remain among the top performers in the country. The highly important tourism sector has rebounded from the pandemic-induced lows observed in 2020 in both South Carolina and Florida. While the fourth wave of the pandemic has weighed on activity recently, ongoing progress is expected. All said, South Carolina is set to grow at an above average rate of 6.3% in 2021, with Florida not far behind at 5.3%.
For more on the national outlook please see our Quarterly Economic Forecast.
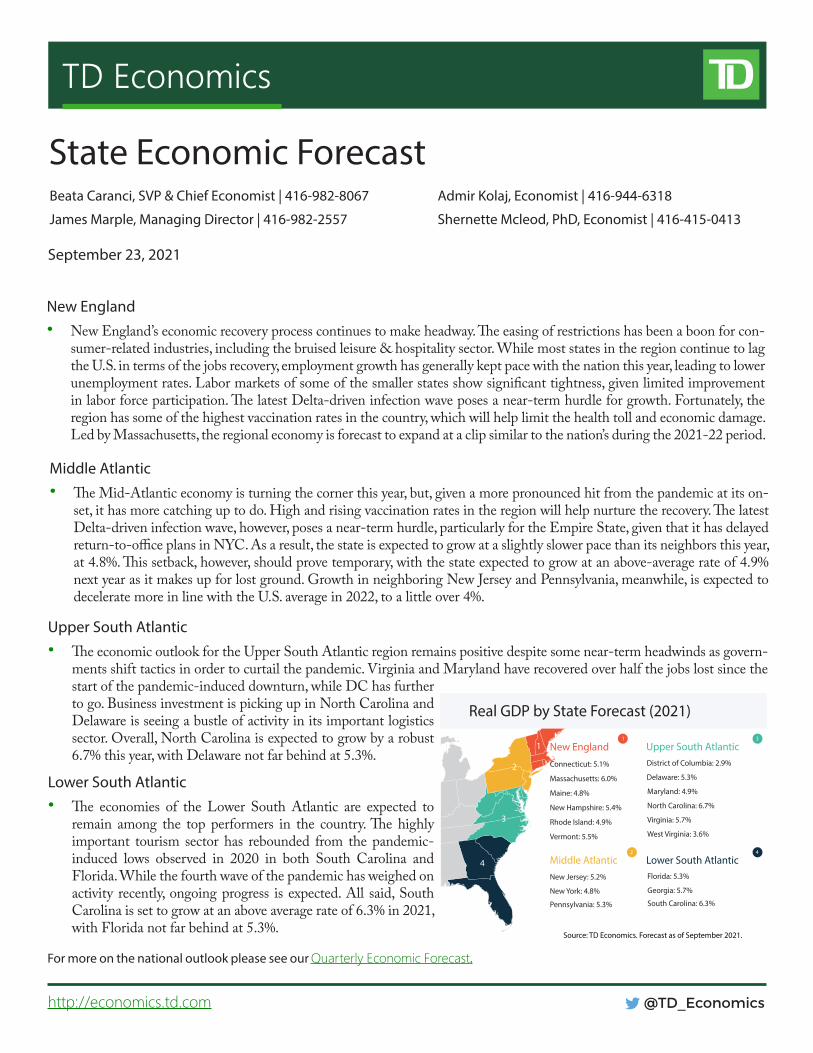
Real GDP by State Forecast (2021)
Source: TD Economics. Forecast as of September 2021.
Middle AtlanticNew Jersey: 5.2%
New York: 4.8%
Pennsylvania: 5.3%
2
3
District of Columbia: 2.9%
Delaware: 5.3%
Maryland: 4.9%
North Carolina: 6.7%
Virginia: 5.7%
West Virginia: 3.6%
Upper South Atlantic3
2
Lower South AtlanticFlorida: 5.3%
Georgia: 5.7%
South Carolina: 6.3%
4
4
Connecticut: 5.1%
Massachusetts: 6.0%
Maine: 4.8%
New Hampshire: 5.4%
Rhode Island: 4.9%
Vermont: 5.5%
New England1
1
2
@TD_Economicshttp://economics.td.com
New England (CT, MA, ME, NH, RI, VT)Connecticut: Green Shoots
Connecticut home prices experienced very sluggish growth in the decade following the Great Recession, un-derperforming both neighboring states and the nation. Ironically, perhaps, it took another crisis, the COVID-19 pandemic, to kick home price growth out of its funk. Helped along by the rise of remote work and the inflow of buyers from out of state (predominantly NYC), momen-tum kicked into higher gear and prices finally surpassed their pre-Great Recession peak this spring (Chart 1). As the health crisis and interest from out-of-state buyers wanes, home price growth, which has averaged over 20% (annualized) in recent months, is likely to slow to a more sustainable pace of around 7% next year – a theme in line with the national narrative.The recovery process for most other areas of the economy impacted by the pandemic has continued at a steady clip over the last few months. This is corroborated by labor market metrics, which show continued job gains, an in-crease in the labor force and an improvement in the un-employment rate. The easing of business restrictions has been a particular boon for the leisure and hospitality sec-tor, which has been the biggest source of job gains so far this year. OpenTable data tracking restaurant visits show that Connecticut has been outperforming the nation on this front since the spring. The rise in COVID-19 cases fueled by the Delta variant poses a near-term downside risk to the industry and overall recovery. That said, a high vaccination rate should help mitigate the health and eco-nomic impacts. Roughly 75% of the state population has already received the at least one vaccine dose.
The professional and business services sector, which pays above-average wages, has also been an important jobs contributor in recent months. Connecticut has recently attracted scores of new firms to the state, suggesting that progress should continue. ITT Inc. (manufacturing and tech) and Tomo (fintech) recently announced the reloca-tion of their headquarters from New York to Connecti-cut. Financial firms such as Elliott Management, Apollo Global Management and iCapital Network are expand-ing in Greenwich, long known as the hedge fund capital of the world. Green shoots also continue to emerge in the biotech space, evidenced by expansions at MannKind and Arvinas. Meanwhile, a $235 million investment from Frito-Lay marks an added positive development in the manufacturing space. All told, while the latest wave of infections poses a near-term hurdle, things are looking up. We expect the state economy to growth by 5.1% this year and 3.4% next. Massachusetts: Better Days
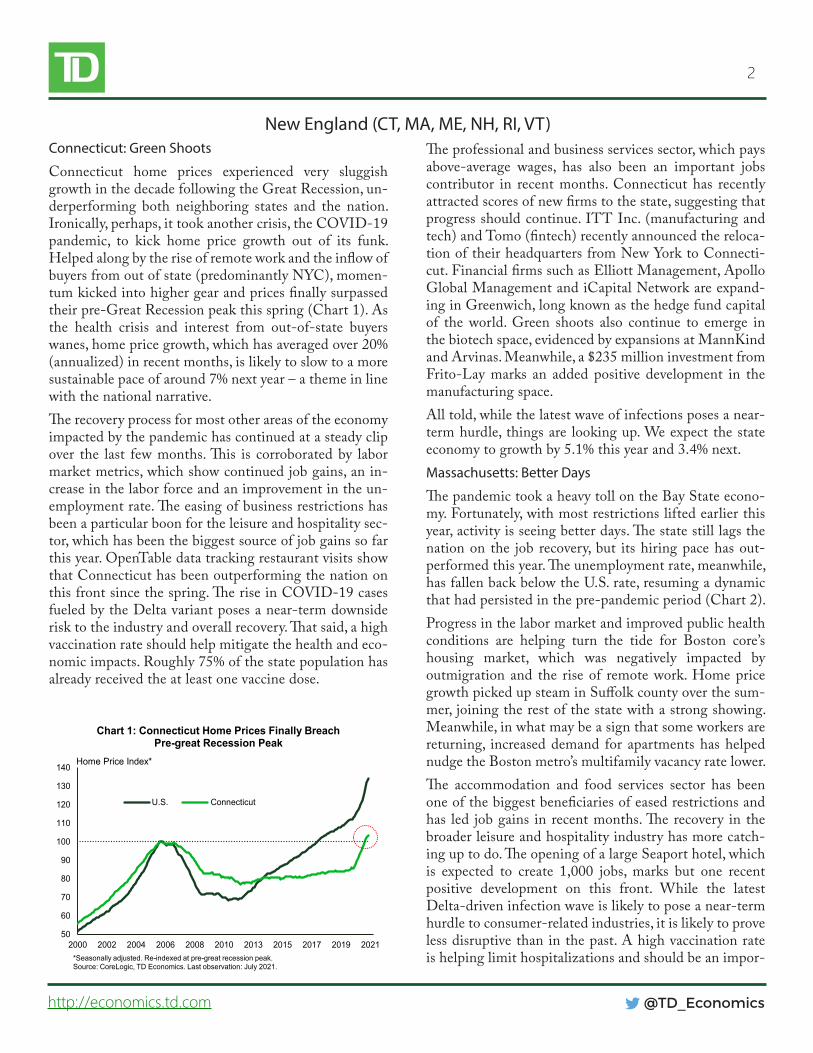
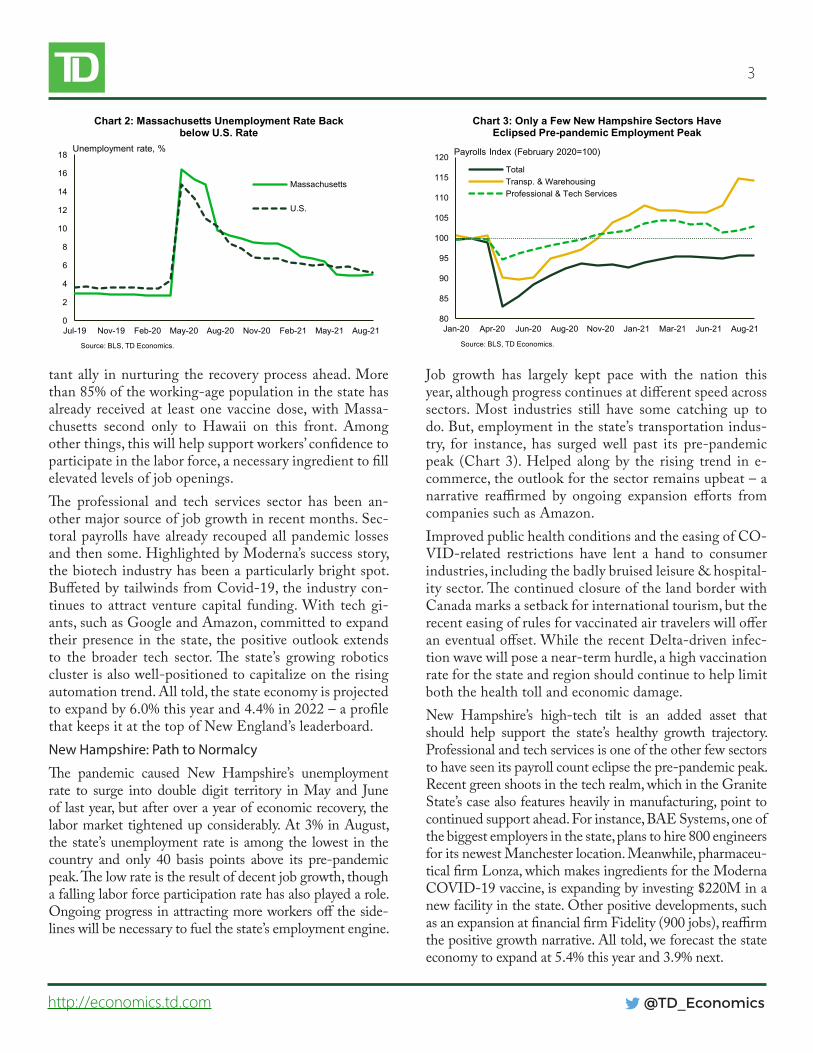
The pandemic took a heavy toll on the Bay State econo-my. Fortunately, with most restrictions lifted earlier this year, activity is seeing better days. The state still lags the nation on the job recovery, but its hiring pace has out-performed this year. The unemployment rate, meanwhile, has fallen back below the U.S. rate, resuming a dynamic that had persisted in the pre-pandemic period (Chart 2). Progress in the labor market and improved public health conditions are helping turn the tide for Boston core’s housing market, which was negatively impacted by outmigration and the rise of remote work. Home price growth picked up steam in Suffolk county over the sum-mer, joining the rest of the state with a strong showing. Meanwhile, in what may be a sign that some workers are returning, increased demand for apartments has helped nudge the Boston metro’s multifamily vacancy rate lower. The accommodation and food services sector has been one of the biggest beneficiaries of eased restrictions and has led job gains in recent months. The recovery in the broader leisure and hospitality industry has more catch-ing up to do. The opening of a large Seaport hotel, which is expected to create 1,000 jobs, marks but one recent positive development on this front. While the latest Delta-driven infection wave is likely to pose a near-term hurdle to consumer-related industries, it is likely to prove less disruptive than in the past. A high vaccination rate is helping limit hospitalizations and should be an impor-
50
60
70
80
90
100
110
120
130
140
2000 2002 2004 2006 2008 2010 2013 2015 2017 2019 2021
Chart 1: Connecticut Home Prices Finally Breach Pre-great Recession Peak
U.S. Connecticut
*Seasonally adjusted. Re-indexed at pre-great recession peak. Source: CoreLogic, TD Economics. Last observation: July 2021.
Home Price Index*
3
@TD_Economicshttp://economics.td.com
tant ally in nurturing the recovery process ahead. More than 85% of the working-age population in the state has already received at least one vaccine dose, with Massa-chusetts second only to Hawaii on this front. Among other things, this will help support workers’ confidence to participate in the labor force, a necessary ingredient to fill elevated levels of job openings. The professional and tech services sector has been an-other major source of job growth in recent months. Sec-toral payrolls have already recouped all pandemic losses and then some. Highlighted by Moderna’s success story, the biotech industry has been a particularly bright spot. Buffeted by tailwinds from Covid-19, the industry con-tinues to attract venture capital funding. With tech gi-ants, such as Google and Amazon, committed to expand their presence in the state, the positive outlook extends to the broader tech sector. The state’s growing robotics cluster is also well-positioned to capitalize on the rising automation trend. All told, the state economy is projected to expand by 6.0% this year and 4.4% in 2022 – a profile that keeps it at the top of New England’s leaderboard.New Hampshire: Path to Normalcy
The pandemic caused New Hampshire’s unemployment rate to surge into double digit territory in May and June of last year, but after over a year of economic recovery, the labor market tightened up considerably. At 3% in August, the state’s unemployment rate is among the lowest in the country and only 40 basis points above its pre-pandemic peak. The low rate is the result of decent job growth, though a falling labor force participation rate has also played a role. Ongoing progress in attracting more workers off the side-lines will be necessary to fuel the state’s employment engine.
Job growth has largely kept pace with the nation this year, although progress continues at different speed across sectors. Most industries still have some catching up to do. But, employment in the state’s transportation indus-try, for instance, has surged well past its pre-pandemic peak (Chart 3). Helped along by the rising trend in e-commerce, the outlook for the sector remains upbeat – a narrative reaffirmed by ongoing expansion efforts from companies such as Amazon. Improved public health conditions and the easing of CO-VID-related restrictions have lent a hand to consumer industries, including the badly bruised leisure & hospital-ity sector. The continued closure of the land border with Canada marks a setback for international tourism, but the recent easing of rules for vaccinated air travelers will offer an eventual offset. While the recent Delta-driven infec-tion wave will pose a near-term hurdle, a high vaccination rate for the state and region should continue to help limit both the health toll and economic damage. New Hampshire’s high-tech tilt is an added asset that should help support the state’s healthy growth trajectory. Professional and tech services is one of the other few sectors to have seen its payroll count eclipse the pre-pandemic peak. Recent green shoots in the tech realm, which in the Granite State’s case also features heavily in manufacturing, point to continued support ahead. For instance, BAE Systems, one of the biggest employers in the state, plans to hire 800 engineers for its newest Manchester location. Meanwhile, pharmaceu-tical firm Lonza, which makes ingredients for the Moderna COVID-19 vaccine, is expanding by investing $220M in a new facility in the state. Other positive developments, such as an expansion at financial firm Fidelity (900 jobs), reaffirm the positive growth narrative. All told, we forecast the state economy to expand at 5.4% this year and 3.9% next.
0
2
4
6
8
10
12
14
16
18
Jul-19 Nov-19 Feb-20 May-20 Aug-20 Nov-20 Feb-21 May-21 Aug-21
Chart 2: Massachusetts Unemployment Rate Back below U.S. Rate
Massachusetts
U.S.
Source: BLS, TD Economics.
Unemployment rate, %
80
85
90
95
100
105
110
115
120
Jan-20 Apr-20 Jun-20 Aug-20 Nov-20 Jan-21 Mar-21 Jun-21 Aug-21
Chart 3: Only a Few New Hampshire Sectors Have Eclipsed Pre-pandemic Employment Peak
TotalTransp. & WarehousingProfessional & Tech Services
Source: BLS, TD Economics.
Payrolls Index (February 2020=100)
4
@TD_Economicshttp://economics.td.com
Middle Atlantic (NJ, NY, PA)New Jersey: Making Progress
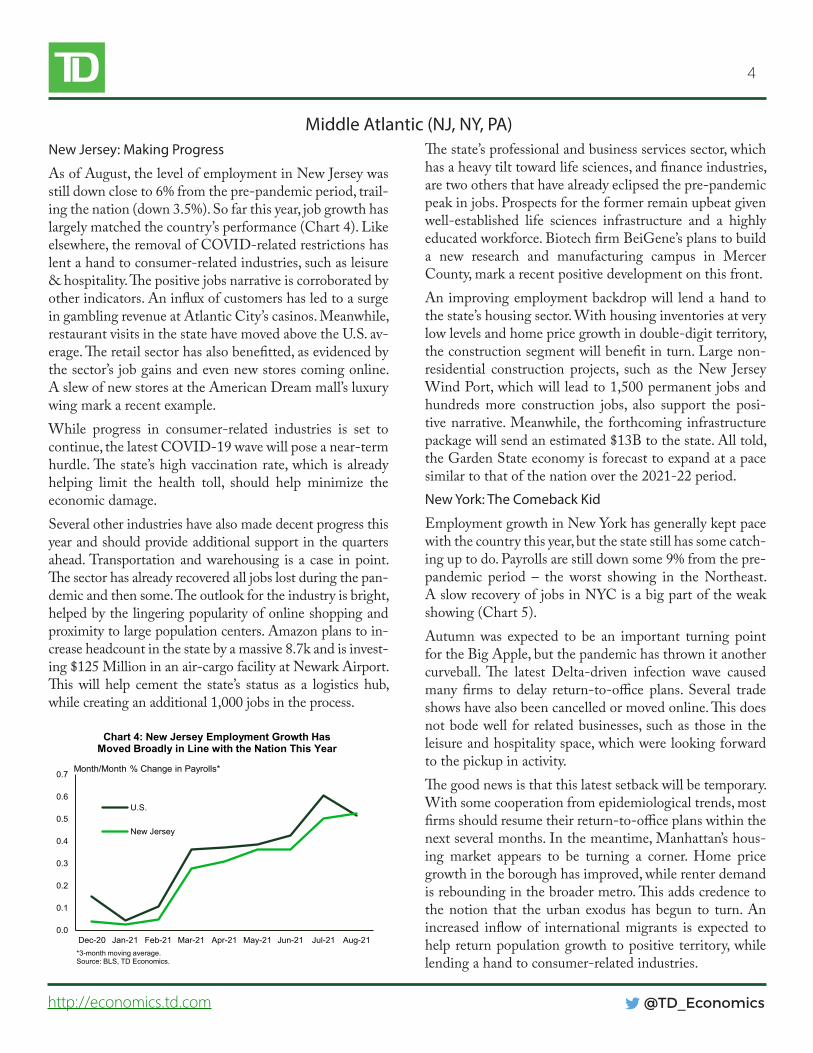
As of August, the level of employment in New Jersey was still down close to 6% from the pre-pandemic period, trail-ing the nation (down 3.5%). So far this year, job growth has largely matched the country’s performance (Chart 4). Like elsewhere, the removal of COVID-related restrictions has lent a hand to consumer-related industries, such as leisure & hospitality. The positive jobs narrative is corroborated by other indicators. An influx of customers has led to a surge in gambling revenue at Atlantic City’s casinos. Meanwhile, restaurant visits in the state have moved above the U.S. av-erage. The retail sector has also benefitted, as evidenced by the sector’s job gains and even new stores coming online. A slew of new stores at the American Dream mall’s luxury wing mark a recent example.While progress in consumer-related industries is set to continue, the latest COVID-19 wave will pose a near-term hurdle. The state’s high vaccination rate, which is already helping limit the health toll, should help minimize the economic damage. Several other industries have also made decent progress this year and should provide additional support in the quarters ahead. Transportation and warehousing is a case in point. The sector has already recovered all jobs lost during the pan-demic and then some. The outlook for the industry is bright, helped by the lingering popularity of online shopping and proximity to large population centers. Amazon plans to in-crease headcount in the state by a massive 8.7k and is invest-ing $125 Million in an air-cargo facility at Newark Airport. This will help cement the state’s status as a logistics hub, while creating an additional 1,000 jobs in the process.
The state’s professional and business services sector, which has a heavy tilt toward life sciences, and finance industries, are two others that have already eclipsed the pre-pandemic peak in jobs. Prospects for the former remain upbeat given well-established life sciences infrastructure and a highly educated workforce. Biotech firm BeiGene’s plans to build a new research and manufacturing campus in Mercer County, mark a recent positive development on this front.An improving employment backdrop will lend a hand to the state’s housing sector. With housing inventories at very low levels and home price growth in double-digit territory, the construction segment will benefit in turn. Large non-residential construction projects, such as the New Jersey Wind Port, which will lead to 1,500 permanent jobs and hundreds more construction jobs, also support the posi-tive narrative. Meanwhile, the forthcoming infrastructure package will send an estimated $13B to the state. All told, the Garden State economy is forecast to expand at a pace similar to that of the nation over the 2021-22 period.New York: The Comeback Kid
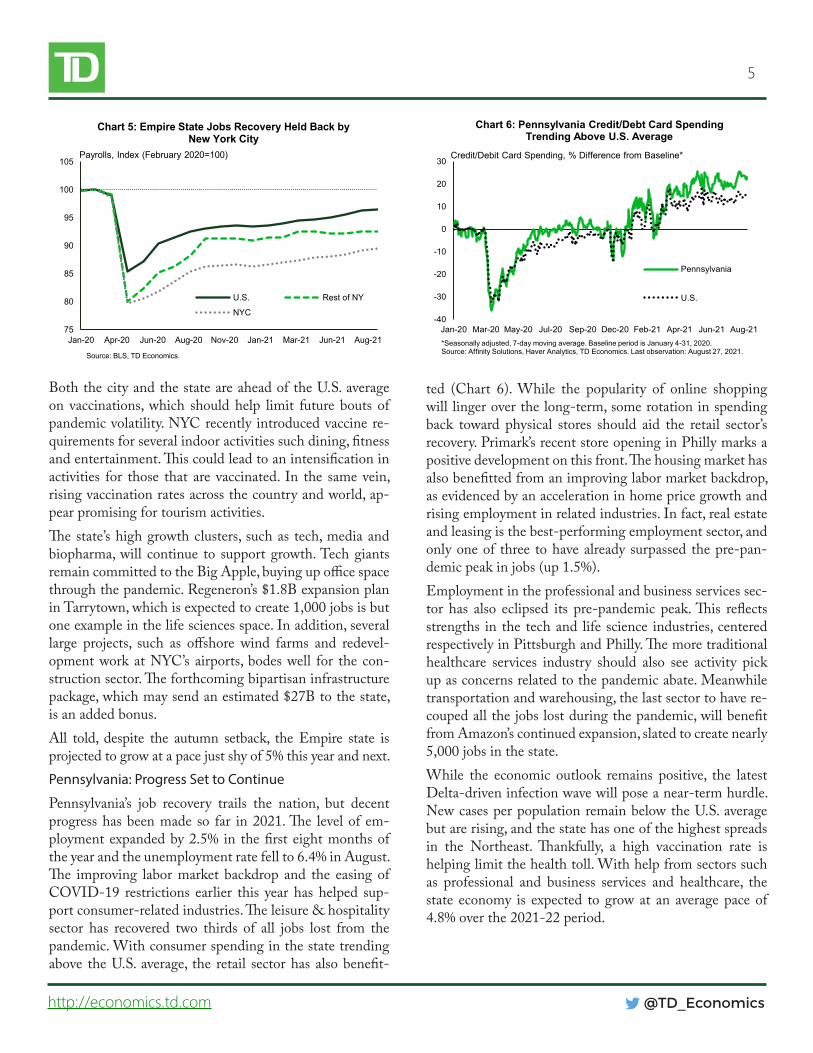
Employment growth in New York has generally kept pace with the country this year, but the state still has some catch-ing up to do. Payrolls are still down some 9% from the pre-pandemic period – the worst showing in the Northeast. A slow recovery of jobs in NYC is a big part of the weak showing (Chart 5).Autumn was expected to be an important turning point for the Big Apple, but the pandemic has thrown it another curveball. The latest Delta-driven infection wave caused many firms to delay return-to-office plans. Several trade shows have also been cancelled or moved online. This does not bode well for related businesses, such as those in the leisure and hospitality space, which were looking forward to the pickup in activity.The good news is that this latest setback will be temporary. With some cooperation from epidemiological trends, most firms should resume their return-to-office plans within the next several months. In the meantime, Manhattan’s hous-ing market appears to be turning a corner. Home price growth in the borough has improved, while renter demand is rebounding in the broader metro. This adds credence to the notion that the urban exodus has begun to turn. An increased inflow of international migrants is expected to help return population growth to positive territory, while lending a hand to consumer-related industries.
0.0
0.1
0.2
0.3
0.4
0.5
0.6
0.7
Dec-20 Jan-21 Feb-21 Mar-21 Apr-21 May-21 Jun-21 Jul-21 Aug-21
Chart 4: New Jersey Employment Growth Has Moved Broadly in Line with the Nation This Year
U.S.
New Jersey
*3-month moving average. Source: BLS, TD Economics.
Month/Month % Change in Payrolls*
5
@TD_Economicshttp://economics.td.com
Both the city and the state are ahead of the U.S. average on vaccinations, which should help limit future bouts of pandemic volatility. NYC recently introduced vaccine re-quirements for several indoor activities such dining, fitness and entertainment. This could lead to an intensification in activities for those that are vaccinated. In the same vein, rising vaccination rates across the country and world, ap-pear promising for tourism activities. The state’s high growth clusters, such as tech, media and biopharma, will continue to support growth. Tech giants remain committed to the Big Apple, buying up office space through the pandemic. Regeneron’s $1.8B expansion plan in Tarrytown, which is expected to create 1,000 jobs is but one example in the life sciences space. In addition, several large projects, such as offshore wind farms and redevel-opment work at NYC’s airports, bodes well for the con-struction sector. The forthcoming bipartisan infrastructure package, which may send an estimated $27B to the state, is an added bonus. All told, despite the autumn setback, the Empire state is projected to grow at a pace just shy of 5% this year and next. Pennsylvania: Progress Set to Continue
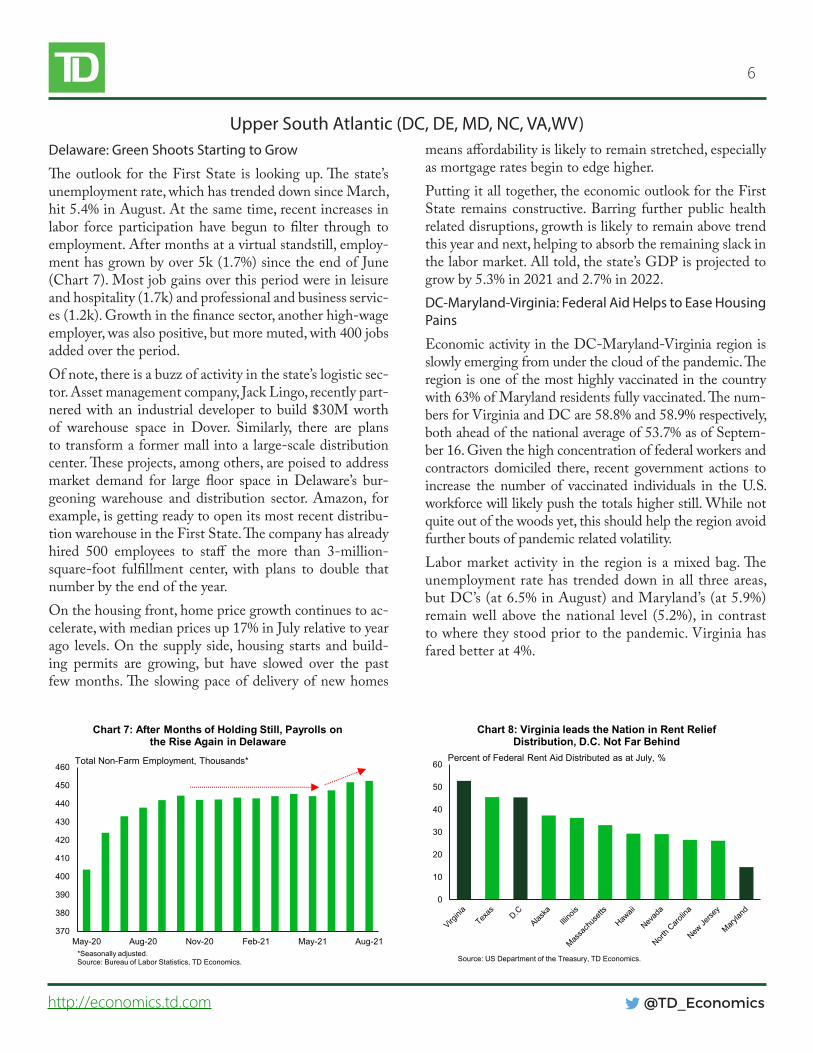
Pennsylvania’s job recovery trails the nation, but decent progress has been made so far in 2021. The level of em-ployment expanded by 2.5% in the first eight months of the year and the unemployment rate fell to 6.4% in August. The improving labor market backdrop and the easing of COVID-19 restrictions earlier this year has helped sup-port consumer-related industries. The leisure & hospitality sector has recovered two thirds of all jobs lost from the pandemic. With consumer spending in the state trending above the U.S. average, the retail sector has also benefit-
ted (Chart 6). While the popularity of online shopping will linger over the long-term, some rotation in spending back toward physical stores should aid the retail sector’s recovery. Primark’s recent store opening in Philly marks a positive development on this front. The housing market has also benefitted from an improving labor market backdrop, as evidenced by an acceleration in home price growth and rising employment in related industries. In fact, real estate and leasing is the best-performing employment sector, and only one of three to have already surpassed the pre-pan-demic peak in jobs (up 1.5%).Employment in the professional and business services sec-tor has also eclipsed its pre-pandemic peak. This reflects strengths in the tech and life science industries, centered respectively in Pittsburgh and Philly. The more traditional healthcare services industry should also see activity pick up as concerns related to the pandemic abate. Meanwhile transportation and warehousing, the last sector to have re-couped all the jobs lost during the pandemic, will benefit from Amazon’s continued expansion, slated to create nearly 5,000 jobs in the state.While the economic outlook remains positive, the latest Delta-driven infection wave will pose a near-term hurdle. New cases per population remain below the U.S. average but are rising, and the state has one of the highest spreads in the Northeast. Thankfully, a high vaccination rate is helping limit the health toll. With help from sectors such as professional and business services and healthcare, the state economy is expected to grow at an average pace of 4.8% over the 2021-22 period.
75
80
85
90
95
100
105
Jan-20 Apr-20 Jun-20 Aug-20 Nov-20 Jan-21 Mar-21 Jun-21 Aug-21
Chart 5: Empire State Jobs Recovery Held Back by New York City
U.S. Rest of NY
NYC
Source: BLS, TD Economics.
Payrolls, Index (February 2020=100)
-40
-30
-20
-10
0
10
20
30
Jan-20 Mar-20 May-20 Jul-20 Sep-20 Dec-20 Feb-21 Apr-21 Jun-21 Aug-21
Chart 6: Pennsylvania Credit/Debt Card Spending Trending Above U.S. Average
Pennsylvania
U.S.
*Seasonally adjusted, 7-day moving average. Baseline period is January 4-31, 2020. Source: Affinity Solutions, Haver Analytics, TD Economics. Last observation: August 27, 2021.
Credit/Debit Card Spending, % Difference from Baseline*
6
@TD_Economicshttp://economics.td.com
Upper South Atlantic (DC, DE, MD, NC, VA,WV)Delaware: Green Shoots Starting to Grow
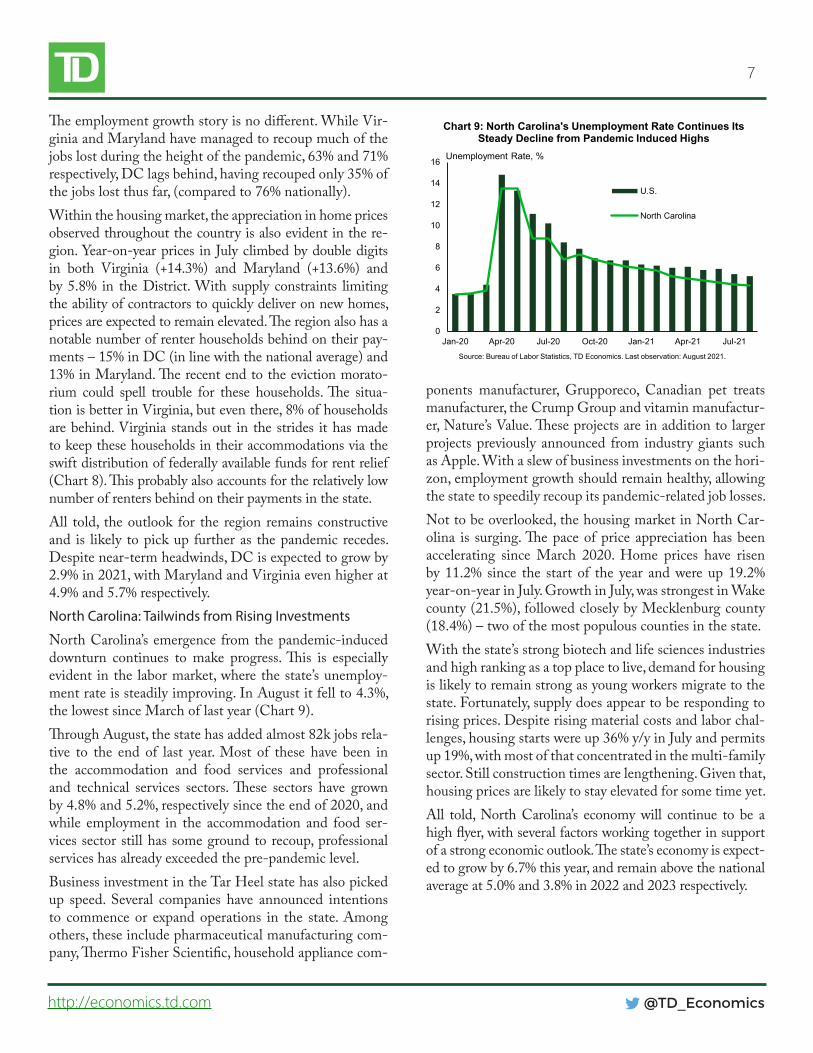
The outlook for the First State is looking up. The state’s unemployment rate, which has trended down since March, hit 5.4% in August. At the same time, recent increases in labor force participation have begun to filter through to employment. After months at a virtual standstill, employ-ment has grown by over 5k (1.7%) since the end of June (Chart 7). Most job gains over this period were in leisure and hospitality (1.7k) and professional and business servic-es (1.2k). Growth in the finance sector, another high-wage employer, was also positive, but more muted, with 400 jobs added over the period.Of note, there is a buzz of activity in the state’s logistic sec-tor. Asset management company, Jack Lingo, recently part-nered with an industrial developer to build $30M worth of warehouse space in Dover. Similarly, there are plans to transform a former mall into a large-scale distribution center. These projects, among others, are poised to address market demand for large floor space in Delaware’s bur-geoning warehouse and distribution sector. Amazon, for example, is getting ready to open its most recent distribu-tion warehouse in the First State. The company has already hired 500 employees to staff the more than 3-million-square-foot fulfillment center, with plans to double that number by the end of the year.On the housing front, home price growth continues to ac-celerate, with median prices up 17% in July relative to year ago levels. On the supply side, housing starts and build-ing permits are growing, but have slowed over the past few months. The slowing pace of delivery of new homes
means affordability is likely to remain stretched, especially as mortgage rates begin to edge higher.Putting it all together, the economic outlook for the First State remains constructive. Barring further public health related disruptions, growth is likely to remain above trend this year and next, helping to absorb the remaining slack in the labor market. All told, the state’s GDP is projected to grow by 5.3% in 2021 and 2.7% in 2022.DC-Maryland-Virginia: Federal Aid Helps to Ease Housing Pains
Economic activity in the DC-Maryland-Virginia region is slowly emerging from under the cloud of the pandemic. The region is one of the most highly vaccinated in the country with 63% of Maryland residents fully vaccinated. The num-bers for Virginia and DC are 58.8% and 58.9% respectively, both ahead of the national average of 53.7% as of Septem-ber 16. Given the high concentration of federal workers and contractors domiciled there, recent government actions to increase the number of vaccinated individuals in the U.S. workforce will likely push the totals higher still. While not quite out of the woods yet, this should help the region avoid further bouts of pandemic related volatility. Labor market activity in the region is a mixed bag. The unemployment rate has trended down in all three areas, but DC’s (at 6.5% in August) and Maryland’s (at 5.9%) remain well above the national level (5.2%), in contrast to where they stood prior to the pandemic. Virginia has fared better at 4%.
370
380
390
400
410
420
430
440
450
460
May-20 Aug-20 Nov-20 Feb-21 May-21 Aug-21
Chart 7: After Months of Holding Still, Payrolls on the Rise Again in Delaware
*Seasonally adjusted. Source: Bureau of Labor Statistics, TD Economics.
Total Non-Farm Employment, Thousands*
0
10
20
30
40
50
60
Chart 8: Virginia leads the Nation in Rent Relief Distribution, D.C. Not Far Behind
Source: US Department of the Treasury, TD Economics.
Percent of Federal Rent Aid Distributed as at July, %
7
@TD_Economicshttp://economics.td.com
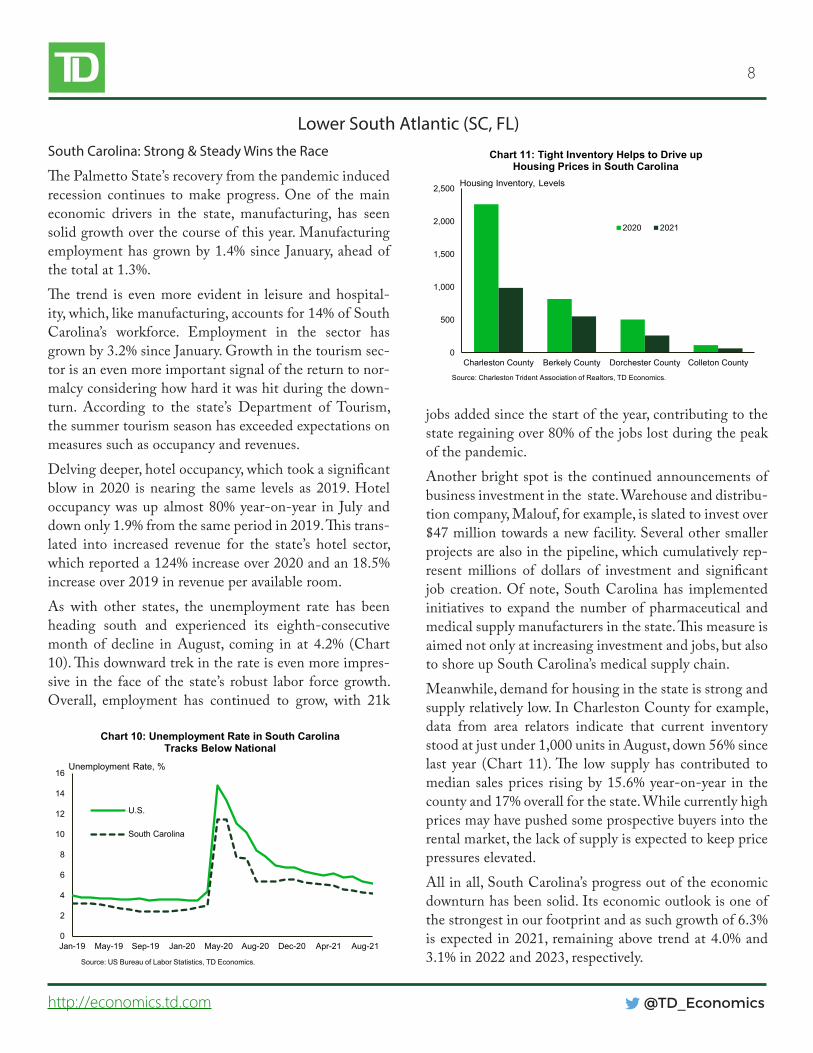
The employment growth story is no different. While Vir-ginia and Maryland have managed to recoup much of the jobs lost during the height of the pandemic, 63% and 71% respectively, DC lags behind, having recouped only 35% of the jobs lost thus far, (compared to 76% nationally). Within the housing market, the appreciation in home prices observed throughout the country is also evident in the re-gion. Year-on-year prices in July climbed by double digits in both Virginia (+14.3%) and Maryland (+13.6%) and by 5.8% in the District. With supply constraints limiting the ability of contractors to quickly deliver on new homes, prices are expected to remain elevated. The region also has a notable number of renter households behind on their pay-ments – 15% in DC (in line with the national average) and 13% in Maryland. The recent end to the eviction morato-rium could spell trouble for these households. The situa-tion is better in Virginia, but even there, 8% of households are behind. Virginia stands out in the strides it has made to keep these households in their accommodations via the swift distribution of federally available funds for rent relief (Chart 8). This probably also accounts for the relatively low number of renters behind on their payments in the state.All told, the outlook for the region remains constructive and is likely to pick up further as the pandemic recedes. Despite near-term headwinds, DC is expected to grow by 2.9% in 2021, with Maryland and Virginia even higher at 4.9% and 5.7% respectively.North Carolina: Tailwinds from Rising Investments
North Carolina’s emergence from the pandemic-induced downturn continues to make progress. This is especially evident in the labor market, where the state’s unemploy-ment rate is steadily improving. In August it fell to 4.3%, the lowest since March of last year (Chart 9). Through August, the state has added almost 82k jobs rela-tive to the end of last year. Most of these have been in the accommodation and food services and professional and technical services sectors. These sectors have grown by 4.8% and 5.2%, respectively since the end of 2020, and while employment in the accommodation and food ser-vices sector still has some ground to recoup, professional services has already exceeded the pre-pandemic level.Business investment in the Tar Heel state has also picked up speed. Several companies have announced intentions to commence or expand operations in the state. Among others, these include pharmaceutical manufacturing com-pany, Thermo Fisher Scientific, household appliance com-
ponents manufacturer, Grupporeco, Canadian pet treats manufacturer, the Crump Group and vitamin manufactur-er, Nature’s Value. These projects are in addition to larger projects previously announced from industry giants such as Apple. With a slew of business investments on the hori-zon, employment growth should remain healthy, allowing the state to speedily recoup its pandemic-related job losses.Not to be overlooked, the housing market in North Car-olina is surging. The pace of price appreciation has been accelerating since March 2020. Home prices have risen by 11.2% since the start of the year and were up 19.2% year-on-year in July. Growth in July, was strongest in Wake county (21.5%), followed closely by Mecklenburg county (18.4%) – two of the most populous counties in the state.With the state’s strong biotech and life sciences industries and high ranking as a top place to live, demand for housing is likely to remain strong as young workers migrate to the state. Fortunately, supply does appear to be responding to rising prices. Despite rising material costs and labor chal-lenges, housing starts were up 36% y/y in July and permits up 19%, with most of that concentrated in the multi-family sector. Still construction times are lengthening. Given that, housing prices are likely to stay elevated for some time yet.All told, North Carolina’s economy will continue to be a high flyer, with several factors working together in support of a strong economic outlook. The state’s economy is expect-ed to grow by 6.7% this year, and remain above the national average at 5.0% and 3.8% in 2022 and 2023 respectively.
0
2
4
6
8
10
12
14
16
Jan-20 Apr-20 Jul-20 Oct-20 Jan-21 Apr-21 Jul-21
U.S.
North Carolina
Source: Bureau of Labor Statistics, TD Economics. Last observation: August 2021.
Unemployment Rate, %
Chart 9: North Carolina's Unemployment Rate Continues Its Steady Decline from Pandemic Induced Highs
8
@TD_Economicshttp://economics.td.com
Lower South Atlantic (SC, FL)South Carolina: Strong & Steady Wins the Race
The Palmetto State’s recovery from the pandemic induced recession continues to make progress. One of the main economic drivers in the state, manufacturing, has seen solid growth over the course of this year. Manufacturing employment has grown by 1.4% since January, ahead of the total at 1.3%. The trend is even more evident in leisure and hospital-ity, which, like manufacturing, accounts for 14% of South Carolina’s workforce. Employment in the sector has grown by 3.2% since January. Growth in the tourism sec-tor is an even more important signal of the return to nor-malcy considering how hard it was hit during the down-turn. According to the state’s Department of Tourism, the summer tourism season has exceeded expectations on measures such as occupancy and revenues.Delving deeper, hotel occupancy, which took a significant blow in 2020 is nearing the same levels as 2019. Hotel occupancy was up almost 80% year-on-year in July and down only 1.9% from the same period in 2019. This trans-lated into increased revenue for the state’s hotel sector, which reported a 124% increase over 2020 and an 18.5% increase over 2019 in revenue per available room.As with other states, the unemployment rate has been heading south and experienced its eighth-consecutive month of decline in August, coming in at 4.2% (Chart 10). This downward trek in the rate is even more impres-sive in the face of the state’s robust labor force growth. Overall, employment has continued to grow, with 21k
jobs added since the start of the year, contributing to the state regaining over 80% of the jobs lost during the peak of the pandemic.Another bright spot is the continued announcements of business investment in the state. Warehouse and distribu-tion company, Malouf, for example, is slated to invest over $47 million towards a new facility. Several other smaller projects are also in the pipeline, which cumulatively rep-resent millions of dollars of investment and significant job creation. Of note, South Carolina has implemented initiatives to expand the number of pharmaceutical and medical supply manufacturers in the state. This measure is aimed not only at increasing investment and jobs, but also to shore up South Carolina’s medical supply chain.Meanwhile, demand for housing in the state is strong and supply relatively low. In Charleston County for example, data from area relators indicate that current inventory stood at just under 1,000 units in August, down 56% since last year (Chart 11). The low supply has contributed to median sales prices rising by 15.6% year-on-year in the county and 17% overall for the state. While currently high prices may have pushed some prospective buyers into the rental market, the lack of supply is expected to keep price pressures elevated.All in all, South Carolina’s progress out of the economic downturn has been solid. Its economic outlook is one of the strongest in our footprint and as such growth of 6.3% is expected in 2021, remaining above trend at 4.0% and 3.1% in 2022 and 2023, respectively.
0
2
4
6
8
10
12
14
16
Jan-19 May-19 Sep-19 Jan-20 May-20 Aug-20 Dec-20 Apr-21 Aug-21
Chart 10: Unemployment Rate in South Carolina Tracks Below National
U.S.
South Carolina
Source: US Bureau of Labor Statistics, TD Economics.
Unemployment Rate, %
0
500
1,000
1,500
2,000
2,500
Charleston County Berkely County Dorchester County Colleton County
Chart 11: Tight Inventory Helps to Drive up Housing Prices in South Carolina
2020 2021
Source: Charleston Trident Association of Realtors, TD Economics.
Housing Inventory, Levels
9
@TD_Economicshttp://economics.td.com
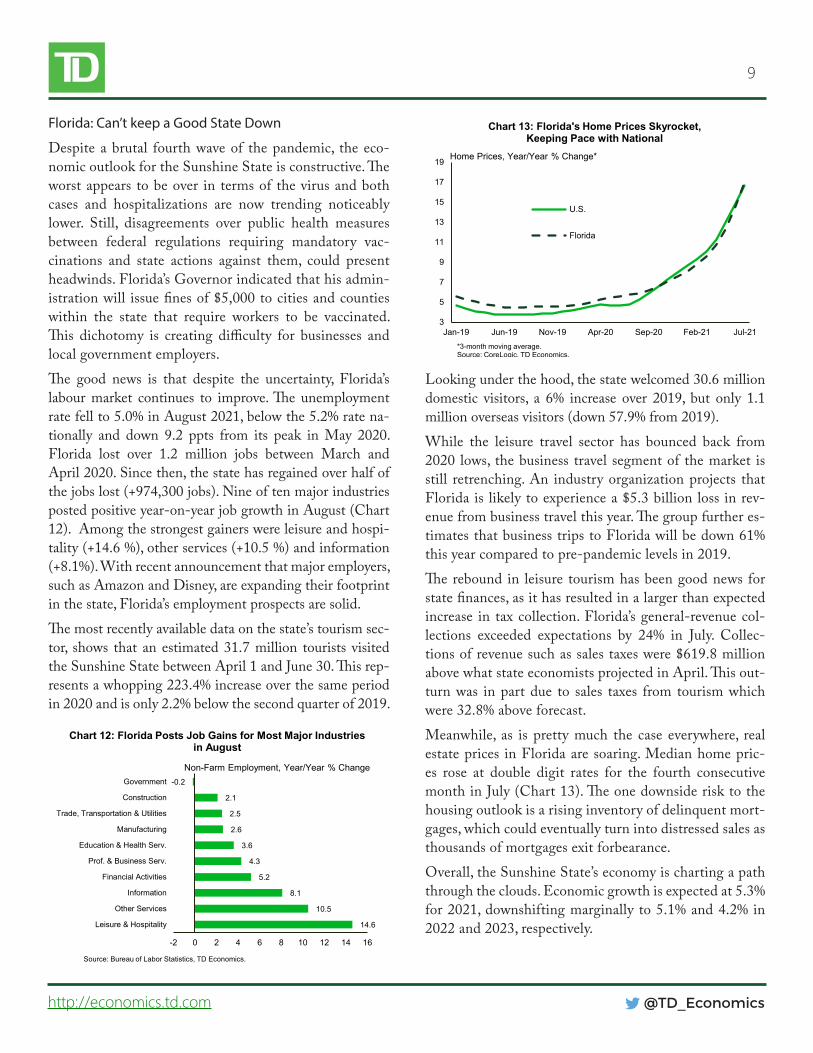
Looking under the hood, the state welcomed 30.6 million domestic visitors, a 6% increase over 2019, but only 1.1 million overseas visitors (down 57.9% from 2019). While the leisure travel sector has bounced back from 2020 lows, the business travel segment of the market is still retrenching. An industry organization projects that Florida is likely to experience a $5.3 billion loss in rev-enue from business travel this year. The group further es-timates that business trips to Florida will be down 61% this year compared to pre-pandemic levels in 2019.The rebound in leisure tourism has been good news for state finances, as it has resulted in a larger than expected increase in tax collection. Florida’s general-revenue col-lections exceeded expectations by 24% in July. Collec-tions of revenue such as sales taxes were $619.8 million above what state economists projected in April. This out-turn was in part due to sales taxes from tourism which were 32.8% above forecast.Meanwhile, as is pretty much the case everywhere, real estate prices in Florida are soaring. Median home pric-es rose at double digit rates for the fourth consecutive month in July (Chart 13). The one downside risk to the housing outlook is a rising inventory of delinquent mort-gages, which could eventually turn into distressed sales as thousands of mortgages exit forbearance.Overall, the Sunshine State’s economy is charting a path through the clouds. Economic growth is expected at 5.3% for 2021, downshifting marginally to 5.1% and 4.2% in 2022 and 2023, respectively.
Florida: Can’t keep a Good State Down
Despite a brutal fourth wave of the pandemic, the eco-nomic outlook for the Sunshine State is constructive. The worst appears to be over in terms of the virus and both cases and hospitalizations are now trending noticeably lower. Still, disagreements over public health measures between federal regulations requiring mandatory vac-cinations and state actions against them, could present headwinds. Florida’s Governor indicated that his admin-istration will issue fines of $5,000 to cities and counties within the state that require workers to be vaccinated. This dichotomy is creating difficulty for businesses and local government employers.The good news is that despite the uncertainty, Florida’s labour market continues to improve. The unemployment rate fell to 5.0% in August 2021, below the 5.2% rate na-tionally and down 9.2 ppts from its peak in May 2020. Florida lost over 1.2 million jobs between March and April 2020. Since then, the state has regained over half of the jobs lost (+974,300 jobs). Nine of ten major industries posted positive year-on-year job growth in August (Chart 12). Among the strongest gainers were leisure and hospi-tality (+14.6 %), other services (+10.5 %) and information (+8.1%). With recent announcement that major employers, such as Amazon and Disney, are expanding their footprint in the state, Florida’s employment prospects are solid.The most recently available data on the state’s tourism sec-tor, shows that an estimated 31.7 million tourists visited the Sunshine State between April 1 and June 30. This rep-resents a whopping 223.4% increase over the same period in 2020 and is only 2.2% below the second quarter of 2019.
14.6
10.5
8.1
5.2
4.3
3.6
2.6
2.5
2.1
-0.2
-2 0 2 4 6 8 10 12 14 16
Leisure & Hospitality
Other Services
Information
Financial Activities
Prof. & Business Serv.
Education & Health Serv.
Manufacturing
Trade, Transportation & Utilities
Construction
Government
Source: Bureau of Labor Statistics, TD Economics.
Non-Farm Employment, Year/Year % Change
Chart 12: Florida Posts Job Gains for Most Major Industries in August
3
5
7
9
11
13
15
17
19
Jan-19 Jun-19 Nov-19 Apr-20 Sep-20 Feb-21 Jul-21
Chart 13: Florida's Home Prices Skyrocket, Keeping Pace with National
U.S.
Florida
*3-month moving average.Source: CoreLogic, TD Economics.
Home Prices, Year/Year % Change*
10
@TD_Economicshttp://economics.td.com
DisclaimerThis report is provided by TD Economics. It is for informational and educational purposes only as of the date of writing, and may not be appropriate for other purposes. The views and opinions expressed may change at any time based on market or other conditions and may not come to pass. This material is not intended to be relied upon as investment advice or recommendations, does not constitute a solicitation to buy or sell securities and should not be considered specific legal, investment or tax advice. The report does not provide material information about the business and affairs of TD Bank Group and the members of TD Economics are not spokespersons for TD Bank Group with respect to its business and affairs. The information contained in this report has been drawn from sources believed to be reliable, but is not guaranteed to be accurate or complete. This report contains economic analysis and views, including about future economic and financial markets performance. These are based on certain assumptions and other factors, and are subject to inherent risks and uncertainties. The actual outcome may be materially different. The Toronto-Dominion Bank and its affiliates and related entities that comprise the TD Bank Group are not liable for any errors or omissions in the information, analysis or views contained in this report, or for any loss or damage suffered.
2021F 2022F 2023F 2021F 2022F 2023F 2021F 2022F 2023F 2021F 2022F 2023F 2021F 2022F 2023F
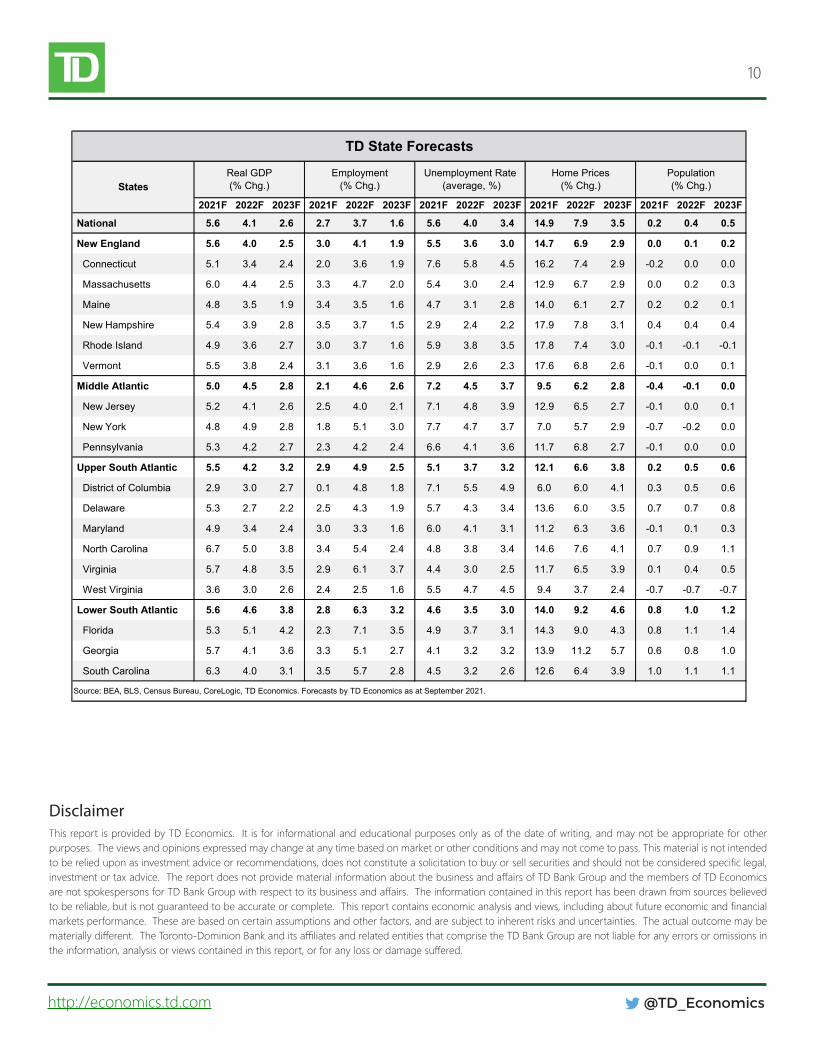
National 5.6 4.1 2.6 2.7 3.7 1.6 5.6 4.0 3.4 14.9 7.9 3.5 0.2 0.4 0.5
New England 5.6 4.0 2.5 3.0 4.1 1.9 5.5 3.6 3.0 14.7 6.9 2.9 0.0 0.1 0.2
Connecticut 5.1 3.4 2.4 2.0 3.6 1.9 7.6 5.8 4.5 16.2 7.4 2.9 -0.2 0.0 0.0
Massachusetts 6.0 4.4 2.5 3.3 4.7 2.0 5.4 3.0 2.4 12.9 6.7 2.9 0.0 0.2 0.3
Maine 4.8 3.5 1.9 3.4 3.5 1.6 4.7 3.1 2.8 14.0 6.1 2.7 0.2 0.2 0.1
New Hampshire 5.4 3.9 2.8 3.5 3.7 1.5 2.9 2.4 2.2 17.9 7.8 3.1 0.4 0.4 0.4
Rhode Island 4.9 3.6 2.7 3.0 3.7 1.6 5.9 3.8 3.5 17.8 7.4 3.0 -0.1 -0.1 -0.1
Vermont 5.5 3.8 2.4 3.1 3.6 1.6 2.9 2.6 2.3 17.6 6.8 2.6 -0.1 0.0 0.1
Middle Atlantic 5.0 4.5 2.8 2.1 4.6 2.6 7.2 4.5 3.7 9.5 6.2 2.8 -0.4 -0.1 0.0
New Jersey 5.2 4.1 2.6 2.5 4.0 2.1 7.1 4.8 3.9 12.9 6.5 2.7 -0.1 0.0 0.1
New York 4.8 4.9 2.8 1.8 5.1 3.0 7.7 4.7 3.7 7.0 5.7 2.9 -0.7 -0.2 0.0
Pennsylvania 5.3 4.2 2.7 2.3 4.2 2.4 6.6 4.1 3.6 11.7 6.8 2.7 -0.1 0.0 0.0
Upper South Atlantic 5.5 4.2 3.2 2.9 4.9 2.5 5.1 3.7 3.2 12.1 6.6 3.8 0.2 0.5 0.6
District of Columbia 2.9 3.0 2.7 0.1 4.8 1.8 7.1 5.5 4.9 6.0 6.0 4.1 0.3 0.5 0.6
Delaware 5.3 2.7 2.2 2.5 4.3 1.9 5.7 4.3 3.4 13.6 6.0 3.5 0.7 0.7 0.8
Maryland 4.9 3.4 2.4 3.0 3.3 1.6 6.0 4.1 3.1 11.2 6.3 3.6 -0.1 0.1 0.3
North Carolina 6.7 5.0 3.8 3.4 5.4 2.4 4.8 3.8 3.4 14.6 7.6 4.1 0.7 0.9 1.1
Virginia 5.7 4.8 3.5 2.9 6.1 3.7 4.4 3.0 2.5 11.7 6.5 3.9 0.1 0.4 0.5
West Virginia 3.6 3.0 2.6 2.4 2.5 1.6 5.5 4.7 4.5 9.4 3.7 2.4 -0.7 -0.7 -0.7
Lower South Atlantic 5.6 4.6 3.8 2.8 6.3 3.2 4.6 3.5 3.0 14.0 9.2 4.6 0.8 1.0 1.2
Florida 5.3 5.1 4.2 2.3 7.1 3.5 4.9 3.7 3.1 14.3 9.0 4.3 0.8 1.1 1.4
Georgia 5.7 4.1 3.6 3.3 5.1 2.7 4.1 3.2 3.2 13.9 11.2 5.7 0.6 0.8 1.0
South Carolina 6.3 4.0 3.1 3.5 5.7 2.8 4.5 3.2 2.6 12.6 6.4 3.9 1.0 1.1 1.1
TD State Forecasts
Source: BEA, BLS, Census Bureau, CoreLogic, TD Economics. Forecasts by TD Economics as at September 2021.
Real GDP(% Chg.)
Employment(% Chg.)
Unemployment Rate (average, %)
Home Prices(% Chg.)
Population(% Chg.)States