state board of accounts 302 west washington street room ... · 302 west washington street room e418...
TRANSCRIPT

STATE BOARD OF ACCOUNTS 302 West Washington Street
Room E418 INDIANAPOLIS, INDIANA 46204-2769
AUDIT REPORT
OF
BALL STATE UNIVERSITY
MUNCIE, INDIANA
July 1, 2007 to June 30, 2008


-1-
TABLE OF CONTENTS
Description Page Schedule of Officials .......................................................................................................................... 2 Report on Internal Control Over Financial Reporting and on Compliance and Other Matters Based on an Audit of Financial Statements Performed in Accordance With Government Auditing Standards ............................................... 3-4 Independent Auditor's Report on Compliance With Requirements Applicable to Each Major Program and Internal Control Over Compliance in Accordance With OMB Circular A-133 ................................................................ 5-6 Schedule of Expenditures of Federal Awards .................................................................................... 7-11 Notes to Schedule of Expenditures of Federal Awards ..................................................................... 12-13 Schedule of Findings and Questioned Costs ..................................................................................... 14 Auditee Prepared Schedule: Summary Schedule of Prior Audit Findings ................................................................................. 15 Exit Conference .................................................................................................................................. 16

-2-
SCHEDULE OF OFFICIALS Office Official Term President Dr. Jo Ann M. Gora 08-08-04 to 06-30-09 Vice President, Business Affairs and Treasurer Thomas J. Kinghorn 10-01-80 to 06-30-09 Associate Vice President, Finance and Assistant Treasurer Dr. Randall B. Howard 09-01-06 to 06-30-09 Associate Vice President, Business Services and Controller William A. McCune 07-15-91 to 06-30-09 President of the Board of Trustees Thomas L. DeWeese 01-01-96 to 06-30-09


SA
TO: THE Complian WrequiremeSupplemeThe Univeaccompanregulationthe Univebased on Win the UnAuditing SAudits of A-133 reqnoncomplmaterial eevidence cedures aable basisance with Inabove tha Internal C Tinternal cofederal prover comgram in oance, and
STATE AN EQUAL OP
INDEPENDAPPLICAB
CO
OFFICIALS
ce
We have auditents describeent that are aersity's majornying Scheduns, contracts ersity's manag
our audit.
We conductednited States oStandards, isStates, Localquire that wliance with theffect on a mabout the U
as we consides for our opin those require
n our opinion,at are applicab
Control Over C
he managemontrol over corograms. In pliance with
order to determd to test and r
OF INDPPORTUNITY
DENT AUDITOBLE TO EACHOMPLIANCE
OF BALL STA
ted the compld in the U.S.
applicable to er federal progule of Findingand grants a
gement. Our
d our audit of of America; thsued by the l Governmente plan and e types of co
major federalUniversity's coered necessanion. Our auements.
, the Universble to each of
Compliance
ment of the ompliance witplanning andrequirementsmine our audreport on inter
DIANA
Y EMPLOYER
OR'S REPORH MAJOR PRIN ACCORD
ATE UNIVER
liance of Ball Office of Man
each of its mrams are ide
gs and Questipplicable to eresponsibility
compliance ihe standardsComptroller ts, and Non-Pperform the
ompliance req program ocompliance wi
ary in the circuudit does not
ity complied f its major fed
University is h requiremen
d performing os that could hditing procedurnal control ov
-5-
R
RT ON COMPROGRAM ANANCE WITH
RSITY, DELAW
State Universnagement anajor federal pntified in the ioned Costs. each of its may is to expres
n accordances applicable tGeneral of thProfit Organiz
audit to obquirements reccurred. An ith those requmstances. Wprovide a leg
in all materiaderal program
responsible nts of laws, reour audit, wehave a direct ures for the pver complianc
PLIANCE WITD INTERNALOMB CIRCU
WARE COUN
sity (Universitnd Budget (OMprograms for Summary of Compliance
ajor federal pss an opinion
e with auditingto financial ahe United Stazations. Thosbtain reasonaeferred to abo
audit includequirements anWe believe thgal determina
al respects wims for the year
for establishegulations, coe considered
and materiaurpose of expce in accorda
STAT302 WE
INDIANA
Te
We
TH REQUIREML CONTROL ULAR A-133
NTY, INDIANA
ty) with the tyMB) Circular Athe year endAuditor's Res
e with the reqprograms is th
on the Unive
g standards gudits containates; and OMse standards able assurancove that couldes examiningnd performinhat our audit pation of the U
ith the requirer ended June
hing and mantracts and gthe Universitl effect on a pressing our
ance with OM
E BOARD OF AEST WASHINGT
ROOM E41APOLIS, INDIA
elephone: (317) 2Fax: (317) 232
eb Site: www.in
MENTS OVER
A
ypes of complA-133 Compled June 30, sults section uirements of he responsibiersity's compl
generally acced in Govern
MB Circular Aand OMB Cice about wh
d have a direcg, on a test bg such otherprovides a re
University's co
ements referr 30, 2008.
aintaining effegrants applicaty's internal cmajor federaopinion on coB Circular A-1
ACCOUNTS TON STREET 18
ANA 46204-2769
232-2513 -4711 .gov/sboa
liance liance 2008. of the laws,
ility of liance
cepted nment A-133, rcular
hether ct and basis, r pro-ason-ompli-
red to
ective able to control al pro-ompli-133.
9


BALL STATE UNIVERSITYSCHEDULE OF EXPENDITURES OF FEDERAL AWARDS
For the Year Ended June 30, 2008For the Year Ended June 30, 2008
Federal Grantor Agency/Pass-Through Entity/
Cluster Title/ Federal Identification Total AmountsProgram Title/ CFDA Number When No Federal Awards Passed-Through Questioned
Project Title Number CFDA Number Expended To Subrecipients Costs
Student Financial Aid Cluster
U.S. DEPARTMENT OF EDUCATION
Federal Supplemental Education Opportunity Grant 84.007 1,075,683$ -$ -$ Federal Work-Study Program 84.033 779,142 - - Federal Pell Grant Program 84.063 10,805,787 - - Academic Competitiveness Grants 84.375 855,401 - - National Science and Mathematics to Retain Talent (SMART) Grant 84.376 134,506 - -
Total U.S. Department of Education 13,650,519 - -
Total Student Financial Aid Cluster 13,650,519 - -
Research and Development Cluster
U.S. DEPARTMENT OF AGRICULTURE
Modeling Bat Distribution 10.XXX 14,872 - -
U.S. DEPARTMENT OF DEFENSE
Issue of Department of Defense Excess Equipment 12.000 42,623 - - Basic Scientific Research 12.431 2,893 - -
Pass-Through United States Army: Basic , Applied, and Advanced Research in Science and Engineering 12.630 379,402 37,933 -
Total U.S. Department of Defense 424,918 37,933 -
U.S. DEPARTMENT OF THE INTERIOR
Pass-Through Indiana Department of Natural Resources:Abandoned Mine Lane Reclamation 15.252 430 - - Sport Fish Restoration 15.605 165,738 - - Historic Preservation Fund Grants-In-Aid 15.904 39 - -
Pass-Through Purdue University:Assistance to State Water Resources Research Institutes 15.805 10,776 - -
Total U.S. Department of the Interior 176,983 - -
U.S. DEPARTMENT OF JUSTICE
Grants to Reduce Violent Crimes Against Women on Campus 16.525 54,453 - -
U.S. DEPARTMENT OF STATE
Education Exchange - University Lecturers (Professors) and Research Scholars 19.401 13,178 - -
U.S. DEPARTMENT OF TRANSPORTATION
Pass-Through Indiana Department of Transportation: Highway Planning and Construction 20.205 82,530 - - Construction-Differential Subsidies 20.800 7,667 - -
Total U.S. Department of Transportation 90,197 - -
NATIONAL AERONAUTICS AND SPACE ADMINISTRATION
Aerospace Education Services Program 43.AAA 291,420 - - Pass-Through Indiana University:
Aerospace Education Services Program 43.AAA 35,200 - - Pass-Through Marquette University: Pass-Through Marquette University:
Aerospace Education Services Program 43.AAA 36,337 - - Pass-Through Purdue University:
Aerospace Education Services Program 43.AAA 25,417 - - Pass-Through Texas Tech University:
Aerospace Education Services Program 43.AAA (2,397) - -
Total National Aeronautics and Space Administration 385,977 - -
The accompanying notes are an integral part of the Schedule of Expenditures of Federal Awards.

BALL STATE UNIVERSITYSCHEDULE OF EXPENDITURES OF FEDERAL AWARDS
For the Year Ended June 30, 2008For the Year Ended June 30, 2008
Federal Grantor Agency/Pass-Through Entity/
Cluster Title/ Federal Identification Total AmountsProgram Title/ CFDA Number When No Federal Awards Passed-Through Questioned
Project Title Number CFDA Number Expended To Subrecipients Costs
U.S. NATIONAL FOUNDATION OF ARTS AND THE HUMANITIES
Promotion of the Humanities-Fellowships and Stipends 45.160 4,991 - -
(Continued)
Pass-Through Indiana Humanities Council: Promotion of the Humanities - Federal/State Partnership 45.129 3,000 - -
Pass-Through Indiana State Library: Grants to States 45.310 (12,498) - -
Total National Foundation of Arts and the Humanities (4,507) - -
NATIONAL SCIENCE FOUNDATION
Engineering Grants 47.041 (2,160) - - Mathematical and Physical Sciences 47.049 30,357 - - Geosciences 47 050 33 042 Geosciences 47.050 33,042 - -
Social, Behavioral, and Economic Sciences 47.075 37,959 - - Education and Human Resources 47.076 5,574 - - International Science and Engineering (OISE) 47.079 11 - -
Pass-Through Purdue University: Mathematical and Physical Sciences 47.049 62,362 - - Education and Human Resources 47.076 68,362 - - Pass-Through Indiana University: Biological Sciences 47.074 88,261 - -
Total National Science Foundation 323,768 - -
U.S. ENVIRONMENTAL PROTECTION AGENCYU.S. ENVIRONMENTAL PROTECTION AGENCY
P3 Award: National Student Design Competition for Sustainability 66.516 8 - - Pass-Through New Jersey Meadowlands Commission:
New Jersey Meadowlands Commission Wetlands 66.XXX 1,791 - - Pass-Through Delaware County, Indiana:
NonPoint Source Implementation Grants 66.460 20,625 3,524 -
Total U.S. Environmental Protection Agency 22,424 3,524 -
U.S. DEPARTMENT OF ENERGY
State Energy Program 81.041 23,657 - - Office of Science Financial Assistance Program 81.049 213,686 - - Renewable Energy Research and Development 81.087 105,182 - -
Total U.S. Department of Energy 342,525 - -
U.S. DEPARTMENT OF EDUCATION
Overseas-Group Projects Abroad 84.021A 68,608 - - Fund for the Improvement of Postsecondary Education 84.116M 54,389 8,155 - Fund for the Improvement of Postsecondary Education 84.116Z 160,184 - - Fund for the Improvement of Education 84.215X 329,492 - - Foreign Language Assistance 84.293 83,474 - -
Pass-Through Ivy Tech Community College: Vocational Education-Basic Grants to States 84.048 725 - - Pass-Through Indiana Department of Education: Special Education-Grants to States 84.027A 1,020,953 141,599 - Special Education-Technical Assistance on State Data Collection 84.373X 277,232 234,113 - Pass-Through Madison Consolidated School District:
Fund for the Improvement of Education 84.215X 122,327 - - Pass-Through Indiana Commission on Higher Education: Improving Teacher Quality State Grants 84.367 5,664 - - Improving Teacher Quality State Grants 84.367A 155,233 - - Pass-Through Indiana University:
State Improvement Grant 84.323A 109,169 - - State Improvement Grant 84.323A 109,169 Pass-Through Delaware County Family Services: Twenty First Century Community Learning Center 84.287C 5,269 - -
Total U.S. Department of Education 2,392,719 383,867 -
The accompanying notes are an integral part of the Schedule of Expenditures of Federal Awards.

BALL STATE UNIVERSITYSCHEDULE OF EXPENDITURES OF FEDERAL AWARDS
For the Year Ended June 30, 2008For the Year Ended June 30, 2008
Federal Grantor Agency/Pass-Through Entity/
Cluster Title/ Federal Identification Total AmountsProgram Title/ CFDA Number When No Federal Awards Passed-Through Questioned
Project Title Number CFDA Number Expended To Subrecipients Costs
U.S. DEPARTMENT OF HEALTH AND HUMAN SERVICES
Academic Research Enhancement Award 93.900 25,872 - -
(Continued)
Cancer Treatment Research 93.395 (965) - - Heart and Vascular Diseases Research 93.837 38,121 - - Extramural Research Programs in the Neurosciences
and Neurological Disorders 93.853 91,898 - - Biomedical Research and Research Training 93.859 39,583 - - Aging Research 93.866 265,012 - - Pass-Through Purdue University:
Injury Prevention and Control Research and State and Community Based Programs 93.136 1,950 - -
Pass-Through Indiana State Department of Health:Center for Disease Control and Prevention Investigations
and Technical Assistance 93.283 771,174 56,899 - Pass Through Boston University:Pass-Through Boston University:
Research Related to Deafness and Communication Disorders 93.173 87,689 - - Pass-Through Indiana Family and Social Services:
Academic Research Enhancement Award 93.575 19,976 12,440 - Pass-Through Indiana Department of Child Services: Chafee Foster Care Independence Program 93.674 276,202 - -
Pass-Through Indiana Family and Social Services:Chafee Foster Care Independence Program/Promoting Safe and
Stable Families/Child Welfare Services-State Grants 93.674, 93.556, 93.645 141,013 - - Pass-Through Indiana University: Diabetes, Endocrinology and Metabolism Research 93.847 14,739 - - Pass-Through University of California Santa Cruz:
Aging Research 83.866 8,220 - - Aging Research 83.866 8,220
Total U.S. Department of Health and Human Services 1,780,484 69,339 -
Total Research and Development Cluster 6,017,991 494,663 -
Highway Safety Cluster
U.S. DEPARTMENT OF TRANSPORTATION
Pass-Through Indiana Criminal Justice Institute:Alcohol Traffic Safety and Drunk Driving Prevention Incentive Grants 20.601 2,848 - -
Total Highway Safety Cluster 2,848 - -
Special Education (IDEA) Cluster
U.S. DEPARTMENT OF EDUCATION
Pass-Through Indiana Department of Education:Special Education - Grants to States 84.027A 1,266,281 - -
Total Special Education Cluster 1,266,281 - -
CCDF Cluster
U.S. DEPARTMENT OF EDUCATION
Pass-Through Indiana Department of Education:Child Care Mandatory and Matching Funds of the Child Care
and Development Fund 93.596 42,106 - -
Total Special Education Cluster 42,106 - -
Homeland Security Cluster
U.S. DEPARTMENT OF EDUCATION
Pass-Through Indiana Department of Homeland Security:State Domestic Preparedness Equipment Support Program 97.004 9,341 - -
Total Special Education Cluster 9,341 - -
The accompanying notes are an integral part of the Schedule of Expenditures of Federal Awards.
BALL STATE UNIVERSITYSCHEDULE OF EXPENDITURES OF FEDERAL AWARDS
For the Year Ended June 30, 2008For the Year Ended June 30, 2008
Federal Grantor Agency/Pass-Through Entity/
Cluster Title/ Federal Identification Total AmountsProgram Title/ CFDA Number When No Federal Awards Passed-Through Questioned
Project Title Number CFDA Number Expended To Subrecipients Costs
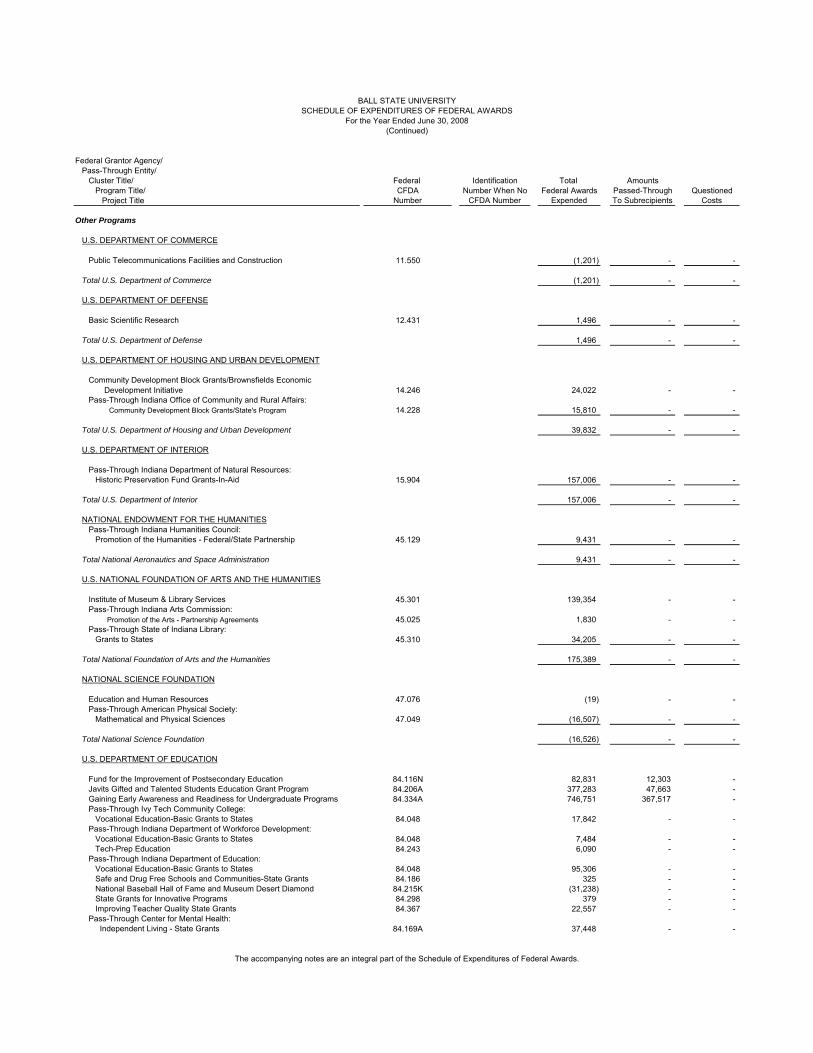
Other Programs
U.S. DEPARTMENT OF COMMERCE
(Continued)
Public Telecommunications Facilities and Construction 11.550 (1,201) - -
Total U.S. Department of Commerce (1,201) - -
U.S. DEPARTMENT OF DEFENSE
Basic Scientific Research 12.431 1,496 - -
Total U.S. Department of Defense 1,496 - -
U.S. DEPARTMENT OF HOUSING AND URBAN DEVELOPMENT
Community Development Block Grants/Brownsfields Economic Development Initiative 14.246 24,022 - -
Pass-Through Indiana Office of Community and Rural Affairs: Community Development Block Grants/State's Program 14.228 15,810 - -
Total U.S. Department of Housing and Urban Development 39,832 - -
U.S. DEPARTMENT OF INTERIOR
Pass-Through Indiana Department of Natural Resources:Historic Preservation Fund Grants-In-Aid 15.904 157,006 - -
Total U.S. Department of Interior 157,006 - -
NATIONAL ENDOWMENT FOR THE HUMANITIESPass-Through Indiana Humanities Council:
Promotion of the Humanities - Federal/State Partnership 45.129 9,431 - -
Total National Aeronautics and Space Administration 9,431 - -
U.S. NATIONAL FOUNDATION OF ARTS AND THE HUMANITIES
Institute of Museum & Library Services 45.301 139,354 - - Pass-Through Indiana Arts Commission:
Promotion of the Arts - Partnership Agreements 45.025 1,830 - - Pass-Through State of Indiana Library:
Grants to States 45.310 34,205 - -
Total National Foundation of Arts and the Humanities 175,389 - -
NATIONAL SCIENCE FOUNDATION
Education and Human Resources 47.076 (19) - - Pass-Through American Physical Society:
Mathematical and Physical Sciences 47.049 (16,507) - -
Total National Science Foundation (16 526)Total National Science Foundation (16,526) - -
U.S. DEPARTMENT OF EDUCATION
Fund for the Improvement of Postsecondary Education 84.116N 82,831 12,303 - Javits Gifted and Talented Students Education Grant Program 84.206A 377,283 47,663 - Gaining Early Awareness and Readiness for Undergraduate Programs 84.334A 746,751 367,517 - Pass-Through Ivy Tech Community College:
Vocational Education-Basic Grants to States 84.048 17,842 - - Pass-Through Indiana Department of Workforce Development:
Vocational Education-Basic Grants to States 84.048 7,484 - - Tech-Prep Education 84.243 6,090 - -
Pass-Through Indiana Department of Education:Pass Through Indiana Department of Education:Vocational Education-Basic Grants to States 84.048 95,306 - - Safe and Drug Free Schools and Communities-State Grants 84.186 325 - - National Baseball Hall of Fame and Museum Desert Diamond 84.215K (31,238) - -
State Grants for Innovative Programs 84.298 379 - - Improving Teacher Quality State Grants 84.367 22,557 - -
Pass-Through Center for Mental Health: Independent Living - State Grants 84.169A 37,448 - -
The accompanying notes are an integral part of the Schedule of Expenditures of Federal Awards.

BALL STATE UNIVERSITYSCHEDULE OF EXPENDITURES OF FEDERAL AWARDS
For the Year Ended June 30, 2008For the Year Ended June 30, 2008
Federal Grantor Agency/Pass-Through Entity/
Cluster Title/ Federal Identification Total AmountsProgram Title/ CFDA Number When No Federal Awards Passed-Through Questioned
Project Title Number CFDA Number Expended To Subrecipients Costs
U.S. DEPARTMENT OF EDUCATION (continued)
Pass-Through Greenfield Central School Corporation:
(Continued)
Mathematics and Science Partnerships 84.366 16,509 - - Pass-Through Muncie Community School Corporation: Mathematics and Science Partnerships 84.366B 23,649 - - Pass-Through National Writing Project Corporation: National Writing Project 84.928A 81,889 - -
Total U.S. Department of Education 1,485,105 427,483 -
U.S. DEPARTMENT OF HEALTH AND HUMAN SERVICES
Advanced Education Nursing Traineeships 93.358 71,037 - - Pass-Through Head Start Action, Inc.:
Head Start 93 600 1 322Head Start 93.600 1,322 - -
Total U.S. Department of Health and Human Services 72,359 - -
CORPORATION FOR NATIONAL AND COMMUNITY SERVICE
Pass-Through Midwest Campus Compact M3C Fellows:AmeriCorps 94.006 (589) - -
Pass-Through Indiana Campus Compact/Indiana University:AmeriCorps 94.006 11,292 - -
Total Corporation For National and Community Service 10,703 - -
DEPARTMENT OF HOMELAND SECURITY
Disaster Grants - Public Assistance (Presidential Declared Disasters) 97.036 21,609 - - Competitive Training Grants 97.068 255,429 - - Pass-Through Indiana Department of Homeland Security: Disaster Grants - Public Assistance (Presidential Declared Disasters) 97.036 31,012 - -
Total Department of Homeland Security 308,050 - -
Total Other Programs 2,241,644 427,483 -
Total Federal Awards 23,230,730$ 922,146$ -$
The accompanying notes are an integral part of the Schedule of Expenditures of Federal Awards.

-12-
BALL STATE UNIVERSITY NOTES TO SCHEDULE OF EXPENDITURES OF FEDERAL AWARDS
Note 1. Basis of Presentation
The accompanying Schedule of Expenditures of Federal Awards (schedule) includes the federal grant activity of Ball State University (University) and is presented in accordance with the re-quirements of OMB Circular A-133, Audits of States, Local Governments, and Non-Profit Organi-zations. The purpose of the Schedule is to present a summary of those activities of the University for the year ended June 30, 2008, which have been financed by the U.S. Government (federal awards). For purposes of the Schedule, federal awards include all federal assistance and procurement relationships entered into directly between the University and the federal government, and sub-awards from agencies of the State of Indiana and others made under federally sponsored agreements. Because the Schedule presents only a selective portion of the activities of the University, it is not intended to and does not present the financial position, change in net assets or current revenues, expenditures, and other changes of the University. Therefore, some amounts presented in this schedule may differ from amounts presented in, or used in the preparation of, the basic financial statements. For reporting purposes, federal awards have been classified into three types: 1) Student Financial Aid 2) Research and Development 3) Other Federal Programs
Note 2. Subrecipients Of the federal expenditures presented in the schedule, the University provided federal awards to subrecipients as follows for the year ended June 30, 2008:
Program Title
Federal CFDA
Number
Amount Provided to
Subrecipents Basic, Applied and Advanced Research in
Science and Engineering
12.630
$ 37,933Non Point Source Implementation Grants 66.460 3,524Fund for the Improvement of Postsecondary Education 84.116M 8,155Special Education-Grants to States 84.027A 141,599Special Education-Technical Assistance on State Data Collection 84.373X 234,113Center for Disease Control and Prevention Investigations
and Technical Assistance 93.283 56,899Academic Research Enhancement Award 93.575 12,440Fund for the Improvement of Postsecondary Education 84.116N 12,303Javits Gifted and Talented Students Education Grant Program 84.206A 47,663Gaining Early Awareness and Readiness for
Undergraduate Programs
84.334A
367,517 Totals $ 922,146
-13-
BALL STATE UNIVERSITY NOTES TO SCHEDULE OF EXPENDITURES OF FEDERAL AWARDS
(Continued)
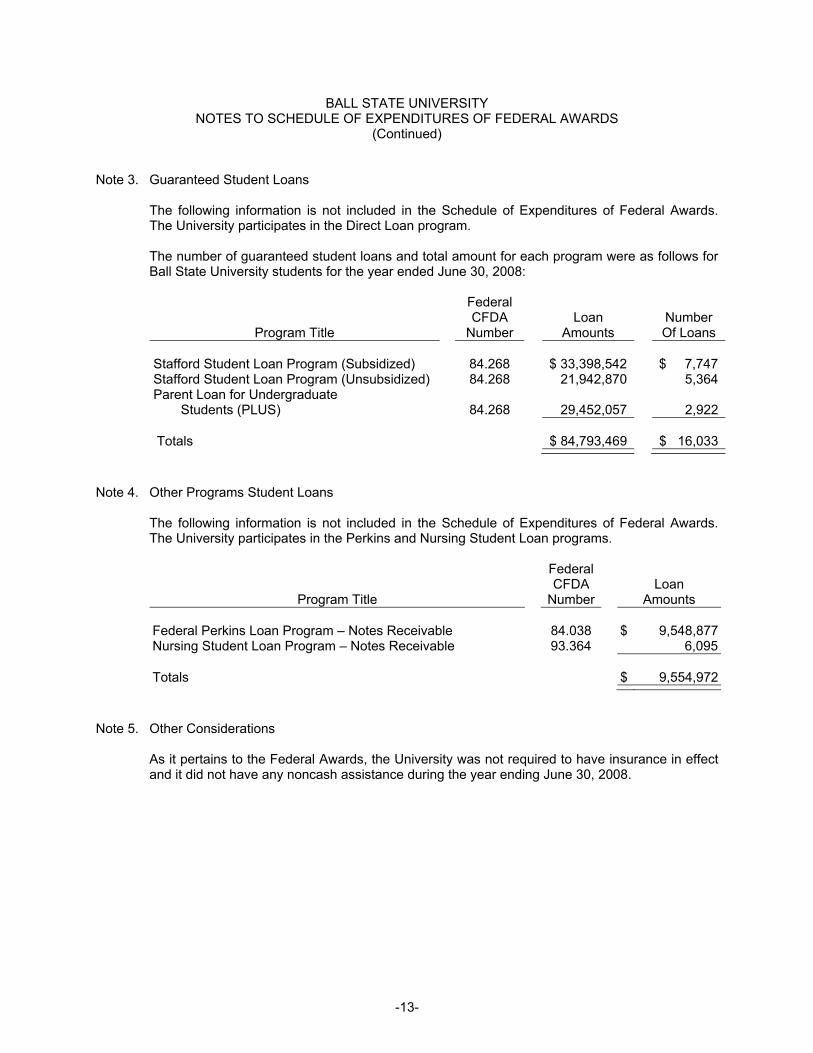
Note 3. Guaranteed Student Loans The following information is not included in the Schedule of Expenditures of Federal Awards. The University participates in the Direct Loan program. The number of guaranteed student loans and total amount for each program were as follows for Ball State University students for the year ended June 30, 2008:
Program Title
Federal CFDA
Number
Loan
Amounts
Number Of Loans
Stafford Student Loan Program (Subsidized) 84.268 $ 33,398,542 $ 7,747Stafford Student Loan Program (Unsubsidized) 84.268 21,942,870 5,364Parent Loan for Undergraduate
Students (PLUS)
84.268
29,452,057
2,922 Totals $ 84,793,469 $ 16,033
Note 4. Other Programs Student Loans The following information is not included in the Schedule of Expenditures of Federal Awards. The University participates in the Perkins and Nursing Student Loan programs.
Program Title
Federal CFDA
Number
Loan
Amounts Federal Perkins Loan Program – Notes Receivable 84.038 $ 9,548,877Nursing Student Loan Program – Notes Receivable 93.364 6,095 Totals $ 9,554,972
Note 5. Other Considerations As it pertains to the Federal Awards, the University was not required to have insurance in effect and it did not have any noncash assistance during the year ending June 30, 2008.

-14-
BALL STATE UNIVERSITY SCHEDULE OF FINDINGS AND QUESTIONED COSTS
Section I – Summary of Auditor's Results
Financial Statements:
Type of auditor's report issued: Unqualified
Internal control over financial reporting: Material weaknesses identified? No Significant deficiencies identified that are not considered to be material weaknesses? None reported
Noncompliance material to financial statements noted? No
Federal Awards:
Internal control over major programs: Material weaknesses identified? No Significant deficiencies identified that are not considered to be material weaknesses? None reported
Type of auditor's report issued on compliance for major programs: Unqualified Any audit findings disclosed that are required to be reported in accordance with section 510(a) of Circular A-133? No
Identification of Major Programs:
CFDA Number
Name of Federal Program or Cluster
SFA Cluster Student Financial Aid Cluster
84.027 Special Education Cluster
Dollar threshold used to distinguish between Type A and Type B programs: $696,922 Auditee qualified as low-risk auditee? No

-15-
BALL STATE UNIVERSITY SUMMARY SCHEDULE OF PRIOR AUDIT FINDINGS
No matters are reportable.

-16-
BALL STATE UNIVERSITY EXIT CONFERENCE
The contents of this report were discussed on February 16, 2009, with Thomas J. Kinghorn, Vice President Business Affairs and Treasurer; William A. McCune, Controller and Associate Vice President of Business Services; Dr. Randall B. Howard, Associate Vice President, Finance and Assistant Treasurer; Robert Zellers, Director of Scholarships and Financial Aid; Kathy Lucas, Director of Contracts and Grants; and Thomas Roberts, Director of Auditing. Our audit disclosed no material items that warrant comment at this time.


To
The President and Board of Trustees
Ball State University
This financial report presents
the financial position of
Ball State University at June 30, 2008,
and the results of activities for
the year then ended.
Thomas J. Kinghorn Vice President for Business Affairs
and Treasurer
December 19, 2008

ii
This financial report has been prepared
by the Office of Controller and Business Services
Ball State University, Muncie, Indiana 47306
Ball State University provides equal opportunity to all students and applicants for admission in its education programs, activities, and facilities without regard to race, religion, color, sex (except where sex
is a bona fide qualification), sexual orientation, physical or mental disability, national origin, ancestry, or age.
Ball State University provides equal opportunity to all employees and applicants for employment in its recruitment, hiring, retention, promotion, tenure, transfer, layoff, return from layoff,
training, and other employment decisions and in its compensation and benefits programs without regard to race, religion, color, sex (except where sex is a bona fide occupational qualification), sexual orientation, physical or mental disability,
national origin, ancestry, age, or citizenship (for U.S. citizens and protected lawfully-admitted aliens).
The University also takes affirmative action to employ and advance minorities, women, qualified disabled persons, and qualified disabled veterans and veterans of the Vietnam era. Information concerning the
University’s affirmative action programs can be obtained from the Office of University Compliance, Ball State University, Muncie, IN 47306.
Each line administrator is responsible for ensuring that educational and employment decisions are made and implemented in accordance with the University’s equal
opportunity and affirmative action policy. All persons involved in the decision-making process, including members of faculty and other employee committees, shall act in a nondiscriminatory manner. The Office of University Compliance is responsible for developing, coordinating, and implementing policies and procedures for institutional compliance with all
applicable federal and state equal opportunity laws and regulations and for preparing and monitoring compliance with required affirmative action programs.
Complaints regarding unlawful discrimination should be filed within 45 calendar days following the alleged act or incident giving rise to the complaint in the Office of University Compliance in accordance
with the “Ball State University Equal Opportunity and Affirmative Action Complaint Investigation Procedure and Appeal Process.” A copy of this document may be obtained by contacting
the Office of University Compliance.
The President will review the University’s equal opportunity and affirmative action policy and programs at least once each year, measure progress against the objectives stated in the affirmative action programs,
and report findings and conclusions to the Board of Trustees.

iii
Ball State University
2007-2008
Frank A. Bracken, Indianapolis, IN
Thomas L. DeWeese, Muncie, IN
Marianne Glick, Indianapolis, IN
Frank Hancock, Indianapolis, IN
Richard Hall, Carmel, IN
Hollis E. Hughes Jr., South Bend, IN
Gregory S. Fehribach, Indianapolis, IN (completed term December 31, 2007)
Matthew Momper, Fort Wayne, IN (appointed January 4, 2008)
Barbara Phillips, Carmel, IN
Danielle M. Frazier, New Palestine, IN (completed term July 6, 2007)
Kellie Conrad, Indianapolis, IN (appointed July 9, 2007)
Officers
Thomas L. DeWeese............................................................................................... President Frank A. Bracken ............................................................................................ Vice President Hollis E. Hughes Jr. ................................................................................................ Secretary Gregory S. Fehribach ..................(completed term December 31, 2007) Assistant Secretary Richard Hall .................................................. (elected January 25, 2008) Assistant Secretary Thomas J. Kinghorn .................................................................................................Treasurer
University President
Jo Ann M. Gora

iv
This page intentionally left blank


2
This page intentionally left blank

3
BBaallll SSttaattee UUnniivveerrssiittyy MMaannaaggeemmeenntt’’ss DDiissccuussssiioonn aanndd AAnnaallyyssiiss
JJuunnee 3300,, 22000088
IInnttrroodduuccttiioonn
Ball State University, located in Muncie, Indiana, was founded in 1918 as the Indiana State Normal School, Eastern Division. The Ball brothers, a prominent Muncie industrial family, had acquired the land and buildings of a private normal school and donated the property to the State of Indiana. The State, in turn, transferred control of the school to the Board of Trustees of the Indiana State Normal School. In 1929, the Indiana General Assembly separated the Muncie campus from Indiana State Normal School, naming the Muncie campus Ball State Teachers College. In 1965, the General Assembly renamed the institution Ball State University, in recognition of its significant growth in enrollment and physical facilities, the variety and quality of its educational programs and services, and in anticipation of the much broader role it would be expected to assume in the future. The University is governed by a nine-member Board of Trustees, which includes a full-time student and two members nominated or selected by the Ball State University Alumni Association. All members of the Board are appointed by the Governor of Indiana to four-year terms, except for the student member, who is appointed to a two-year term.
The University consists of seven colleges, offering eight associate-level programs, 178 undergraduate degree programs, 97 masters-level programs, 16 doctoral-level programs and four specialists programs, all fully accredited by the North Central Association of Colleges and Schools, as well as various schools, departments and programs being accredited by numerous other professional agencies, licensing boards, and state agencies. Enrollment in these programs for Fall 2007, totaled 17,919 full-time equivalent students from a total headcount of 20,325. On-campus enrollment totaled 15,877 full-time equivalent students from a total headcount of 16,828, approximately 6,700 of whom were housed in University residence halls and apartments. The University also operates the state’s only K-12 laboratory school, as well as the Indiana Academy for Science, Mathematics and Humanities, the state’s only residential high school for gifted and talented students. As of the beginning of the 2007-2008 academic year, the University’s staff and faculty (not including student employees and graduate assistants) totaled approximately 2,819 full-time and 452 part-time personnel. The campus facilities include 118 buildings, 96 of which are considered major, on 1,043 acres.
What follows is the Ball State University Financial Report for the year ended June 30, 2008, an objective record of the University’s stewardship of its human, physical and financial resources. Ball State University’s management has prepared and is responsible for the completeness and fairness of the financial statements and the related footnote disclosures included in this report, along with this discussion and analysis. The discussion and analysis is designed to provide an objective analysis of the University’s financial activities based on currently known facts, decisions, and conditions.
UUssiinngg tthhiiss RReeppoorrtt
This financial report includes three basic financial statements: the Statement of Net Assets, the Statement of Revenues, Expenses and Changes in Net Assets and the Statement of Cash Flows, prepared in accordance with Statement No. 35 of the Governmental Accounting Standards Board, Basic Financial Statements – and Management’s Discussion and Analysis – for Public Colleges and Universities, an Amendment of GASB Statement No. 34, as well as subsequent applicable statements from the GASB. These financial statements focus on the financial condition of the University, the results of operations, and cash flows of the University as a whole. Important features of these statements, which are mandated by the Governmental Accounting Standards Board, include:
• Revenues that are charges for services and goods, including tuition and fees, and non-capital grants, excluding those grants for financial aid, are recorded as operating revenues. This means that state appropriations, which are used primarily for operations, and federal and state financial aid, are required to be shown as non-operating revenue.

Management’s Discussion and Analysis
4
• Scholarship allowances are required to be recorded in three different places: as a reduction to tuition and fees, as a reduction to room and board and as an operating expense. The user must total the three amounts in order to ascertain the total scholarship aid received by students from the University. Not included in these amounts are scholarship aid received directly by students, as well as loan and work-study aid.
• Capital assets include construction in progress and infrastructure, as well as completed capital projects and capital acquisitions.
This financial report also includes, in addition to the basic financial statements referred to above, management’s discussion and analysis, the report of independent auditors, notes to the financial statements, required supplemental information regarding the funding progress of Other Post Employment Benefits (OPEB), as mandated by GASB Statement No. 45, and supplemental information not otherwise required. Included also, in accordance with GASB Statement No. 39, separately presented, are the financial statements and significant notes to the financial statements for the Ball State University Foundation. The Ball State University Foundation is a separate, not-for-profit corporation which solicits, collects and invests donations for the sole benefit of Ball State University. The Foundation’s financial statements are presented in accordance with the reporting principles of the Financial Accounting Standards Board and therefore are not comparable to those of the University.
In May, 2006, the American Institute of Certified Public Accountants issued its Statement on Auditing Standards (SAS) No. 112, “Communicating Internal Control Related Matters Identified in an Audit.” This statement, which applies to all organizations who publish audited financial statements, including governmental and not-for-profit organizations, incorporates many of the more stringent definitions for reporting significant deficiencies and material weaknesses that are currently applicable to the audits of publicly held corporations. In an effort to fully comply with provisions of the new internal control standards Ball State University has undertaken a detailed review of policies and procedures, documentation, processes, and training, with an emphasis on strengthening internal control. In addition, business continuity plans have been updated and tested and the internal audit process expanded.
SSttrraatteeggiicc PPllaann
This year, Ball State University will recognize the 90th anniversary of its founding. At no time in its history has the University future looked brighter. The increasingly global, technology-driven marketplace is demanding new skills of college graduates. The University has taken a proactive approach in recognizing these changing dynamics and responding with bold steps to ensure its competitiveness as a top-quality choice in public higher education. Ball State’s response is multi-faceted but can be summarized with a drive toward the distinctiveness of its students and a commitment to immersive learning. The health of the University, which is defined by quality students and quality faculty, relies on being known for distinctiveness in the programs it offers.
Ball State’s strategic plan is designed to enhance the University’s entrepreneurial approach to learning, scholarship, and civic engagement. Its goal is to redefine education and to provide a nationally recognized, distinctive, academically innovative higher education choice in Indiana. The plan has four key strategies which will continue to build on Ball State’s past and present strengths and successes.
First, the plan calls for Ball State to offer relevant immersive learning opportunities to each undergraduate student. Immersive learning experiences are transformational; students work as a team under a faculty mentor to develop real-world solutions to real-world problems. These interdisciplinary, business and community-based, student-driven learning experiences not only benefit the student, but also help the greater society by addressing the issues facing our world today. Immersive learning seeks to serve, engage with, and learn from leaders in businesses, communities, the state, nation, and world. During the 2007-2008 academic year, over 2,700 undergraduate students participated in 125 different immersive learning opportunities that enhance learning as well as assist local communities and businesses throughout Indiana.

Management’s Discussion and Analysis
5
Immersive learning is embraced by bright, creative students. It offers a significant intellectual challenge and, thus, is an essential point of institutional differentiation. Distinctiveness is critical to the health of the University. It is the key to healthy enrollment, quality students, and external support because it allows the University to clearly articulate its vision and stand apart from the competition.
Second, implementing the plan requires that the University attract better prepared students. Immersive learning represents a significant intellectual challenge, and the University is committed to seeking students who can step up to this challenge. It is intended that students admitted with higher academic achievement will ensure increased retention rates among students and develop graduates who will serve as ambassadors for the quality and uniqueness of a Ball State education. It is further anticipated that these ambassadors will increase the University’s local and national reputation and encourage other high quality prospects to seek admission.
As testament to this commitment toward attracting higher quality students, over 57 percent of the incoming freshman class has completed an academic honors curriculum in high school. It is the University’s goal that by 2012, over 80 percent of freshmen will have achieved academic honors distinction. This increase in enrollment of higher quality, academically talented students has led to concurrent increases in freshman to sophomore retention and graduation rates. A university’s ability to retain students after the freshman year is a key indicator of future success and completion. Ball State University’s six year graduation rate has risen over 15 percentage points in the past eight years. This increase is remarkable and ranks among the best in the country.
Third, the strategic plan focuses on increasing the number of nationally recognized faculty and academic programs. The University believes that the quality of a Ball State education is outstanding. Increases in national rankings and recognition should reinforce this fact to external audiences and promote the University’s brand among prospective students. Most recently, Ball State University was recognized by U.S. News and World Report for ranking 14th in its list of “Up and Coming National Universities.”
Fourth, the plan seeks to create a University community that is nationally recognized for a vibrant and supportive atmosphere. Competition for high quality students has never been more challenging. Students expect and often demand an environment that supports their creativity both in and outside the classroom. A part of reaching this strategic goal is the further development and expansion of the campus community, construction of new facilities and the renovation of existing campus facilities to best support learning, scholarship, institutional effectiveness, and quality of life.
The implementation of strategic plans requires fiscally sound planning geared to a sustainable long-term approach to financial management. Because this approach has been integral to Ball State University financial management for decades, the University is in a strong position to be successful in achieving its current goals and objectives. As explained in later sections of this report, sound long-term financial planning has enabled several major initiatives in the strategic plan such as increasing student selectivity, attracting key faculty and administrative personnel, upgrading administrative software and technology and the utilization of net capital assets for planned new construction and renewal projects.
FFiinnaanncciiaall HHiigghhlliigghhttss
The University’s financial position, as a whole, improved during the fiscal year ended June 30, 2008, as compared to the previous year. Net assets increased by $36.3 million, due primarily to an increase in restricted net assets for construction of $43.5 million, partially offset by a reduction in capital assets net of related debt of $24.3 million, and unrestricted net assets increased by $16.2 million. The increase in unrestricted net assets included $6.3 million in prepaid retiree benefits recognized for the first time as a result of GASB Statement No. 45 taking effect for the first time in fiscal year 2008.
The current ratio for the University, which is calculated by dividing current assets by current liabilities, increased from 1.77 to 1 at June 30, 2007 to 2.64 to 1 at June 30, 2008. Although a significant portion of this increase can be attributed to a new bond issuance, this ratio is still an indicator of the University’s strong short-term financial flexibility. One of the most basic determinants of clear financial health is the availability of expendable net assets to cover debt should it become necessary to settle those debt obligations. This viability ratio measures the University’s ability to fund these long-term

Management’s Discussion and Analysis
6
obligations. At June 30, 2008, the University’s viability ratio was 1.95 to 1. As the ratio grows above 1 to 1, so does the University’s ability to respond to adverse conditions as well as its ability to attract capital from external sources and fund new objectives.
Appropriations, Gifts and Grants
The University’s financial situation for 2007-08, which was the first year of the current biennium, was positively impacted by higher appropriations from the State of Indiana. Overall, appropriations increased by 2.4 percent over the prior fiscal year. State appropriations for operations increased by 2.8 percent and will increase even more in the second year of the biennium. While the increase is a significant improvement over the decreases in appropriations experienced in 2006-07, there is still a concern that operating appropriation increases have not kept pace with annual inflation. With regard to the preservation of capital assets, the biennial funding included 50 percent of the formula appropriation for renewal and replacement of academic and administrative buildings and infrastructure. In addition, the State, having withheld payment of one monthly appropriation in fiscal 2005, repaid $4.1 million of that amount during fiscal 2007 and another $3.3 million in fiscal 2008. The remaining $3.3 million is appropriated for repayment by the end of fiscal 2009. This will mean that by 2009 the total amount of temporary internal borrowing for this purpose will be repaid.
The University received 338 grant awards for research and other sponsored programs, totaling $20.4 million. This amount included significant grants from the U.S. Department of Justice, Indiana Department of Education, Woodrow Wilson National Fellowship Foundation, Corporation for Public Broadcasting, Indiana Tobacco Prevention and Cessation, U.S. Department of Education, and Vico Software. Grant awards may include cash received in advance, letters of credit, and cost reimbursable projects. The overall success ratio, measured by the number of awards received compared to the number of proposals submitted, was 74 percent in fiscal 2008, an increase from 64 percent in the prior fiscal year.
During fiscal 2008, supporters of Ball State University contributed private gifts to the Ball State University Foundation totaling $23.2 million, an increase over the prior fiscal year. In addition to funds received during the fiscal year, the University also obtained several major multi-year commitments in support of its new capital campaign and strategic plan. These gifts will be reflected in future fiscal year giving reports.
Other Postemployment Benefits
As of the most recent actuarial study, dated June 30, 2007, Ball State University’s liability for retiree health care was estimated to be $146.9 million if the actuarial effect of future Medicare Retiree Drug Subsidies is included, as it is under rules established by the Financial Accounting Standards Board (FASB) for non-governmental entities. The trust fund established to assist in financing this liability had a market value of $148.9 million at June 30, 2007, slightly higher than the actuarial liability. Due to weaknesses in the investment markets since then, the fund has a market value at June 30, 2008, of $142.8 million. Since Ball State University’s financial statements are prepared according to Governmental Accounting Standards Board (GASB) rules, which do not permit the inclusion of the actuarial effect of the Medicare Retiree Drug Subsidies, the actuarial liability must be reported as $171.9 million. It is expected that the funding level will vary with general economic conditions over time. For example, this liability had been actuarially fully funded in the late 1990’s. The University has a systematic plan in place to fund the benefit in accordance with the recently released GASB Statement No. 45.
Ball State University is not unique in providing health care as a benefit for its retirees. A 2004 TIAA-CREF survey revealed that 75 percent of colleges and universities offer retiree health care as a benefit. More recently, a Kaiser Family Foundation survey in 2007, indicated that 98 percent of state and local governments surveyed offered retiree health care benefits to early retirees, and 81 percent offered these benefits to Medicare-eligible retirees. One of Ball State University’s financial strengths is that it has been engaged since the late 1980’s in the systematic funding of this liability to its current status. The University’s aggressive employee, retiree, and family wellness initiative will also contribute to the management of costs for this program.

Management’s Discussion and Analysis
7
$-
$20
$40
$60
$80
$100
$120
$140
$160
$180
$200
Am
ount
(in
mili
ons)
2007 2008
Total Student Financial Assistance
UniversityScholarships
StudentEmployment
Loans
Scholarships andGrants
Scholarships and Financial Aid
Traditionally, colleges and universities provide access to higher education by offering institutional financial assistance to selected students to help cover their tuition and fees. This assistance can be based on financial need or merit. Using The College Board’s definition of tuition discounting for undergraduate students, Ball State’s fiscal year 2008 discount rate was 17.5 percent, an increase over last year’s discount rate of 16.2 percent. This compares favorably to the benchmark average for four-year public institutions of 14.6 percent as calculated by The College Board in their 2006 study, “Tuition Discounting: Not Just a Private College Practice.”
In addition to the types of financial aid included in the College Board study, several other types of aid such as federal and state financial assistance, federally guaranteed student loans, federal and state college work study, institutional aid providing room and board expenses, graduate assistants’ and doctoral assistants’ tuition remissions, other external scholarships, and University student wages are available to improve educational access for Ball State students. The University’s total student financial assistance provided in the fiscal year, as the graph indicates, was over $193.0 million compared to $185.3 million in the prior year.
In 2008, all forms of financial assistance, including student employment and loans, increased by 4.2 percent. Grant aid, which excludes student employment and loans, increased by 8.7 percent. This increase included $3.4 million in additional scholarships, grants, and awards and $2.8 million in institutional remitted fees.
PPuubblliicc RReeccooggnniittiioonn
Commitment to immersive learning and leadership in emerging media has earned Ball State University a top spot in U.S. News & World Report. In the publication's 2008 rankings issue, Ball State is cited as the nation's 14th best "Schools to Watch." This newly launched list of up-and-comers honored colleges and universities that are making the most promising and innovative changes in academics, faculty, students, campus or facilities. Also cited by the magazine were Ball State’s innovative and award-winning first year programs that enable first year students to succeed at the college level. These programs have helped the University achieve a 78 percent retention rate, rivaling select public universities and private universities. For the fourth consecutive year, Ball State University was also recognized in 2008, as one of the best universities in the Midwest by the Princeton Review, based on the University’s excellent academic programs and the opinions of students who report about their campus experiences.
In addition to these overall institutional accolades, several departments earned national rankings in their respective fields. Landscape Architecture ranked as the nation's fourth best undergraduate program and fifth best graduate program in the 2008 edition of Design Intelligence's America's Best Architecture and Design Schools. Entrepreneurship was ranked 11th in 2008 by Entrepreneur magazine and the Princeton Review and 10th in the nation by U.S. News & World Report. Ball State was recognized by In Tune magazine in its "Best Music Schools" 2009 listing, placing our School of Music among other elite institutions such as Juilliard, Oberlin, and the Boston Conservatory. The Journalism Department was ranked among the top 45 programs in the country in 2007 by Editor & Publisher, the nation's oldest publication covering the newspaper industry. The Finance Department ranked 11th nationally for quality teaching in an independent study published in the spring 2006 issue of Advances in Financial Education. The University Sales Education Foundation ranked Ball State's program, based in our H.H. Gregg Center for Professional Selling, among the top 26 university sales programs in the United States.

Management’s Discussion and Analysis
8
Scheumann Football Stadium
CCaappiittaall PPrroojjeeccttss
The Fall of 2007 was an exciting time on the Ball State campus as the university opened four newly constructed or renovated facilities. Park Hall, the first new residence hall to be built on campus since 1969, opened its doors to over 500
new residents in August, 2007. Park Hall was designed with student input and includes amenities such as semi-private baths for double rooms, a limited number of single rooms, two two-story social lounges, a work-out room, and technology center.
Students and staff were also offered a new dining experience through the expanded and renovated Woodworth Commons dining facility. Woodworth Commons features an expanded dining area, open food preparation courts, a two-story atrium, and beautiful stone, tile and woodwork throughout.
The University also welcomed back distinguished alumnus David Letterman on September 7, 2007, for the dedication of the new David Letterman Communication and Media Building, a state-of-the-art facility which will house Indiana Public Radio and WCRD radio stations, the Department of Telecommunications, the Department of Communication Studies, the
Center for Information and Communication Sciences, and the Office of the Dean of the College of Communications, Information and Media. This facility combines all departments within the college and therefore supports collaboration and engagement of faculty and students on an interdisciplinary basis within the college.
The Cardinal football team opened their 2007 season in the newly renovated Scheumann Football Stadium. The renovations included a new field turf playing field, expanded disabled accessibility, entertainment suites, club seating, a family-style seating area and improved game operations and support facilities.
TThhee SSttaatteemmeenntt ooff NNeett AAsssseettss
The Statement of Net Assets and the Statement of Revenues, Expenses and Changes in Net Assets report in summary fashion the financial position of the University as a whole and on its activities, focusing on the University’s net assets. These statements include all assets, liabilities, revenues and expenses, using the accrual basis of accounting. The only exceptions are gifts and grants and interest on student loans, which are generally recorded only when received. The following is a summary of the major components of net assets at June 30, 2008.
Park Hall Woodworth Commons David Letterman Communication and Media Building
Management’s Discussion and Analysis
9
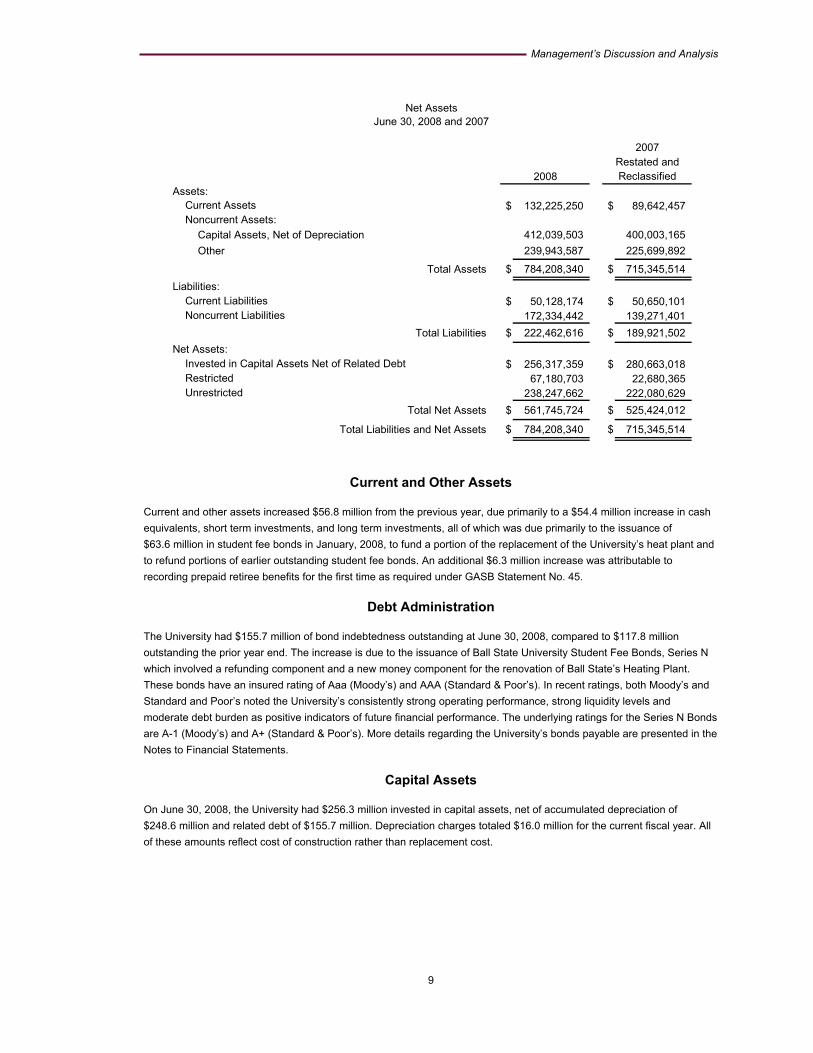
Assets: $ 132,225,250 $ 89,642,457
Capital Assets, Net of Depreciation 412,039,503 400,003,165 Other 239,943,587 225,699,892
Total Assets $ 784,208,340 $ 715,345,514 Liabilities:
$ 50,128,174 $ 50,650,101 172,334,442 139,271,401
Total Liabilities $ 222,462,616 $ 189,921,502
$ 256,317,359 $ 280,663,018 67,180,703 22,680,365 238,247,662 222,080,629
Total Net Assets $ 561,745,724 $ 525,424,012
Total Liabilities and Net Assets $ 784,208,340 $ 715,345,514
Net AssetsJune 30, 2008 and 2007
Current LiabilitiesNoncurrent Liabilities
Current AssetsNoncurrent Assets:
2007
2008Restated andReclassified
Restricted Unrestricted
Net Assets:Invested in Capital Assets Net of Related Debt
Current and Other Assets
Current and other assets increased $56.8 million from the previous year, due primarily to a $54.4 million increase in cash equivalents, short term investments, and long term investments, all of which was due primarily to the issuance of $63.6 million in student fee bonds in January, 2008, to fund a portion of the replacement of the University’s heat plant and to refund portions of earlier outstanding student fee bonds. An additional $6.3 million increase was attributable to recording prepaid retiree benefits for the first time as required under GASB Statement No. 45.
Debt Administration
The University had $155.7 million of bond indebtedness outstanding at June 30, 2008, compared to $117.8 million outstanding the prior year end. The increase is due to the issuance of Ball State University Student Fee Bonds, Series N which involved a refunding component and a new money component for the renovation of Ball State’s Heating Plant. These bonds have an insured rating of Aaa (Moody’s) and AAA (Standard & Poor’s). In recent ratings, both Moody’s and Standard and Poor’s noted the University’s consistently strong operating performance, strong liquidity levels and moderate debt burden as positive indicators of future financial performance. The underlying ratings for the Series N Bonds are A-1 (Moody’s) and A+ (Standard & Poor’s). More details regarding the University’s bonds payable are presented in the Notes to Financial Statements.
Capital Assets
On June 30, 2008, the University had $256.3 million invested in capital assets, net of accumulated depreciation of $248.6 million and related debt of $155.7 million. Depreciation charges totaled $16.0 million for the current fiscal year. All of these amounts reflect cost of construction rather than replacement cost.

Management’s Discussion and Analysis
10
Construction during 2008, included $5.0 million expended for the major renovation of DeHority Complex, $3.5 million expended for construction of the new North Residence Hall, and $1.0 million expended for renovation of the L. A. Pittenger Student Center, all of which were funded from internally designated capital repair and replacement accounts. Also, $4.1million was expended for the expansion and improvement of the Student Recreation and Wellness Facilities. Funding for the Recreation and Wellness Facilities will be provided by a combination of private support and student fee bonds to be issued in fiscal 2009.
Renovation or construction of several other campus facilities was completed during 2008. This included an additional $3.5 million expended for the renovation and expansion of Scheumann Football Stadium, $2.9 million for construction of the new Park Hall, and $1.9 million for construction of the new David Letterman Communication and Media Building.
Current operating funds were utilized to purchase $5.2 million in capital equipment, some of which replaced mostly fully-depreciated equipment dispositions originally costing $6.6 million.
A project is currently underway to improve the University’s heating and cooling energy generation operation in order to upgrade the capability of this important infrastructure element. As the equipment ages and the campus expands, this project is critical to ensure the University’s ability to generate an adequate amount of heating and cooling in a reliable and cost-effective manner. This project is expected to cost $44.9 million and is being financed by student fee bonds issued in 2008. Approximately $0.6 million was expended on the heat plant project in 2008. The schedule for completion is 2011.
In 2007, the Indiana General Assembly approved $33.0 million in bonding authority for Phase I of the Central Campus Renovation Project and Utilities Improvement. This project involves the strategic renovation of three adjacent campus buildings: Teachers College (constructed in 1966), Applied Science and Technology (constructed in two phases between 1948 and 1950), and North Quadrangle (constructed in three phases in 1926, 1932, and 1953). Each structure, now decades old, is in critical need of renovation to address emerging instructional and technological requirements as well as outdated and inefficient mechanical and electrical systems. The University plans to complete this project in two phases and is currently seeking funding from the State for the second phase.
Dehority Complex L.A. Pittenger Student Center North Residence Hall
Student Recreation and Wellness Facility
North Quad Building Teachers College Applied Science & Technology

Management’s Discussion and Analysis
11
Additions and renovations to the Ball Honors House will begin in the fall of 2008. When renovations are completed, this 1930’s era residence will become the new home to the Honors College. The historic structure will include space reconfigured for offices, classrooms, and gathering areas. This project is expected to be complete in 2009 and was made possible through the generous contributions of the late Edmund F. and Virginia B. Ball, the house’s former residents.
Many of the buildings on campus were constructed 40 to 60 years ago. The University’s ability to keep capital assets in good condition in order to accomplish its mission is an ongoing challenge requiring a strong commitment
to long-range planning. In the net assets section, this planning will be described in greater detail.
Net Assets
In addition to net capital assets, the university had other net assets totaling $305.4 million. This includes $67.2 million in restricted net assets which was comprised of: $0.9 million in nonexpendable endowment restricted for student scholarships, $3.0 million restricted for debt service, $2.3 million restricted for student loans, $55.5 million restricted for construction, and $5.4 million restricted for external grants.
The remaining balance of $238.2 million is in unrestricted net assets, which do not have externally imposed restrictions, but are internally restricted for specific authorized purposes. Unrestricted net assets represent resources derived from student fees, state appropriations, and revenue from auxiliary enterprises, and are internally restricted for specific purposes at the close of each fiscal year. These specific purposes include self-insurance reserves, prepaid expense for retiree benefits as calculated in accordance with GASB Statement No. 45, student scholarships, student loans, funding for instructional and athletic camps, workshops, and field trips, campus expansion and development, new building construction, and stewardship and renewal of capital assets. These internally restricted amounts are further discussed in the following sections.
One of the major challenges confronting the University is the stewardship of facilities and equipment resources. This includes modernization and renewal of 118 buildings (96 of which are considered major) totaling 7.0 million gross square feet. Campus buildings involve 33 acres of roof area, contain 107 elevators, 406 technology-equipped, general-purpose classrooms, and technologically complex mechanical operating systems in each structure. The average building at Ball State University is 40 years old. The University also owns 1,043 acres of land, 715 of which are developed. Under the ground, the University has over 17 miles of steam, condensate and chilled water piping; over 22 miles of sewers; over eight miles of water piping; over 50 miles of electrical power distribution wiring; and over 5,319 miles of communication cable to connect buildings. Above the ground, the University has 1,354 outside lighting poles, 33 miles of sidewalks and service roads, and 66 acres of parking. All of these assets have their own unique life cycles for maintenance and renewal, and many systems or elements are now at or near replacement.
Stewardship and Renewal of State Supported Academic and Administrative Buildings
The current replacement value of campus facilities is approximately $1.7 billion based on an analysis of existing facilities and current construction cost indices. Building construction and ongoing renewal of University property is financed following methods specific to the type and use of the facility involved. The ongoing renewal of facilities and infrastructure systems support Ball State University’s mission of becoming a nationally recognized institution of excellence.
Ball Honors House

Management’s Discussion and Analysis
12
Gross Square Feet of Campus Buildings by Year
(in thousands)
0500
1,0001,5002,0002,5003,0003,5004,000
19101920
19301940
19501960
19701980
19902000
2008
State Suppo rted N o n-State Suppo rted
New North Residence Hall $ 46.5 Student Wellness & Recreaton Facilities - A 39.0 Dehority Complex Renovaton 30.0 L.A. Pittenger Student Center Renovaton 22.9 East Campus Site Improvements 1.0 Noyer Commons 1.0
Total Major Projects in Progress $ 140.4
Note A:
Budget
Major Construction Projects in ProgressNon-State Supported Buildings
($1.0 million or greater)
Funded by $10.0 million in private gifts and $29.0 million in student fee bonds.
(in millions)
All academic and administrative buildings are funded through bond financing and state appropriated funds allocated on a biennial basis by the Indiana General Assembly. Approximately 50 percent of the campus square footage is dedicated to academic and administrative uses. Significant reductions in the state appropriations for repair and rehabilitation in recent biennia have created a steep increase in unfunded projects. For instance, for the fiscal years 2004 and 2005, only 25 percent of the formula funding for renewal and replacement was appropriated, and during 2004, the amount was further reduced to 12.5 percent for the year. The appropriation in 2005-2007 increased to 43 percent of its full funding level. For the 2007-2009 biennium, the appropriation is at 50 percent of the formula funding. To partially offset the decrease in state appropriations, $2.2 million has been allocated for maintenance and equipment for targeted academic buildings. Further deferral of these necessary expenditures will result in a deterioration of the University’s facilities and greater renewal costs, unless remedied in the near future.
Stewardship and Renewal of Non-State Supported Buildings
The remaining 50 percent of campus square footage consists of buildings which are not state supported. As depicted in the graph, the gross square footage of non-state supported buildings such as dining and residence halls, parking facilities, the student center, Emens Auditorium, athletic facilities, and conference venues, increased substantially in the 1950’s and 1960’s. These non-state supported buildings have a current replacement value of approximately $647.4 million. Between now and 2015, over $209.8 million, in current dollars, is planned for investment in renewal projects on these facilities. Currently, $113.2 million has been allocated from auxiliary operations revenues and student fees for
the stewardship and renewal of these facilities. The following tables list major non-state supported projects currently underway or in the planning process for the next few years.
Following several national reports with titles such as “Crumbling Academe” and “The Decaying American Campus: A Ticking Time Bomb,” attention was focused on the need for a systematic and thoughtful approach to long-term facility stewardship. Financial Planning Guidelines for Facility Renewal and Adaption, a study sponsored by the Lilly Endowment and conducted by the Society for College and University Planning, the National Association of College and
Johnson Halls Renovation $ 52.5 Studebaker East Renovation 20.3 Elliott Hall Renovaton 14.1 Studebaker West Sprinkler System 1.0
Total Major Projects in Planning $ 87.9
Budget(in millions)
Major Construction Projects in PlanningNon-State Supported Buildings
($1.0 million or greater)

Management’s Discussion and Analysis
13
Component Life-Cycle Illustrations Years Roofs 15-20 Masonry Tuck Pointing 30-40 HVAC Systems 15-25 Foundations 80-100 Windows 40-50 Electrical Systems 15-30 Exterior Door Systems 15-20 Elevators 20-30 Lighting Fixtures 20-30
University Business Officers, the Association of Physical Plant Administrators of Universities and Colleges, and Coopers and Lybrand (now PricewaterhouseCoopers) estimates that between two percent and four percent of plant replacement cost needs to be provided, on average, each year in order to adequately fund repairs, renewal, and adapting facilities to changing code requirements and to evolving, contemporary needs. The Component Life-Cycle Illustrations table provides several examples of major repair and renewal components, as well as the typical life cycle for each. Obviously, given the timing of these major repair and renewal projects, the amount spent in any given year will vary greatly from other years, which explains why the balance in this classification will increase and decrease over time.
Based on this and other studies, as well as direct experience over many years managing complex University facilities, an annual target of three percent of current replacement value is in order to adequately fund this stewardship responsibility for housing, dining, and other non-state supported buildings and avoid even higher costs brought about by accumulated deferred maintenance. For parking facilities, which are comprised of multi-level structures and paved and gravel lots, an annual target of two percent of current replacement value has been established. This methodology, which provides generational equity in funding across multiple student populations, is based on the premise that users should pay their fair share for the deterioration of the facilities they use. The goal is to maintain competitive, quality facilities at the lowest long-term cost to students.
During 2001 and 2002, a comprehensive study of residential and dining units was undertaken as part of a process that led to the creation of a plan for the investment of more than $250.0 million in renewal and new construction projects over the next 15 years. Unlike capital expenditures for academic buildings, these improvements must be financed utilizing residence and dining revenues accumulated over past years, together with debt to be serviced utilizing future residence and dining revenues. All of this will need to be accomplished while, at the same time, maintaining room and board rates that are competitive with other housing options available to students.
The largest portion of the $113.2 million for the stewardship and renewal of non-state supported facilities is $73.8 million in the Residence Hall and Dining Hall Repair and Replacement account. The current replacement value for these facilities is $464.9 million. The University is committed to offering a strong residential experience for students. Part of that commitment is providing the type of accommodations that students attending college today expect. Park Hall, which opened in Fall 2007, is an example of that commitment, and it was very well received by residents and visitors alike. In each of the two years that Park Hall has now been opened, it was the first residence hall to be filled. Overall, occupancy in available student housing is at 99 percent for Fall 2008. Over the next seven years, the University plans to use more than $168.2 million from the Residence Hall and Dining Repair and Replacement account, in current dollars, for scheduled major projects as well as ongoing capital repair and replacement projects. These uses include several major projects, like the renovation of DeHority Complex and construction of the new North Residence Hall, which are currently underway.
The University’s parking facilities consist of three parking garages with 1,498 spaces and 66 acres of surface parking with an additional 7,954 spaces. The current replacement value for these facilities is $48.0 million. A long-term plan is in place to provide for necessary periodic maintenance and major renovations to insure that these facilities will serve the University
for years to come. The Parking Facilities Renewal account currently contains $3.8 million, funded primarily from parking revenues, including permits, daily fees, and citations. The University plans to spend more than $6.6 million, in current dollars, over the next seven years and over $9.3 million in the next ten years for major and ongoing renewal of these facilities.
Examples of the remaining non-state supported facilities include the student center, health center, conference centers, Emens Auditorium and recreational and athletic facilities, with a total current replacement value of $134.4 million. Each of these facilities has its own renewal plan, based on its age and life cycle of its various components. In order to fund the renewal of these facilities, Emens Auditorium

Management’s Discussion and Analysis
14
$35.5 million has been allocated from the applicable auxiliary revenues, as well as the student fees allocated for the support of these activities each year. Over the next seven years, more than $35.1 million in current dollars will be used from this account for major renovations as well as regular ongoing capital renewal projects. For example, as mentioned previously, major renovations are underway for the L. A. Pittenger Student Center, which will be financed using funds from the Facilities Renewal account for non-state supported buildings. In addition, Worthen Arena is approaching an age when certain significant rehabilitation projects must be undertaken to avoid costly deferred maintenance in future years
Campus Development, Technological Advancement, and Other Capital Projects
Since 1922, the University has had a plan in place for orderly campus development, with regular updates to keep current with changing conditions and strategic goals. Many University buildings currently in operation occupy land that the University purchased over many years’ time. For example, in the case of the land where the Music Instruction Building and McKinley Avenue Parking Structure are located, the last parcel was purchased in 2003. In addition, the final parcels necessary to construct the new North Residence Hall were purchased in the 2008 fiscal year. Experience shows that looking to the future and acquiring property substantially ahead of a specific need is the most desirable and cost effective approach. Strategic acquisitions yield lower costs, more orderly planning and help prevent negative community relations. The University has identified three areas directly east of campus for expansion and has initiated a program targeted at acquiring properties in these areas. The University has allocated $16.4 million for campus development purposes.
For over 30 years, Ball State University has operated with state-of-the-art computing equipment to meet the campus needs through a centralized University Computing Service. This has been accomplished by a consistent funding methodology supported by an annual allocation for technology equipment renewal. Presently, this account has a balance of $7.0 million for this purpose as well as for other campus automated systems (library, etc.). Like many institutions of higher education, Ball State University must look toward the future as it plans for a new generation of administrative hardware and software systems to better achieve its academic mission. Toward this purpose, $6.1 million has been set aside for the purchase and/or development of new University wide administrative systems technology. The University has developed a plan for major administrative technology systems upgrade and replacement during the next five to seven years. This plan involves a phased process to assess and map existing technology systems; install a new business intelligence and data warehouse system to significantly improve the analysis and reporting of administrative information; replace outdated hardware and software systems with newer technologies and solutions; and upgrade existing legacy systems to better integrate the use of data across campus administrative units. The University’s goal is full implementation of this administrative systems technology within the coming years to coincide with the goals and mission of the University’s Strategic Plan.
The University has allocated $11.7 million for several capital projects that are either in progress or recently authorized, including furnishings and equipment for the Central Campus Academic Project and replacement or upgrade of the campus telephone system.
Insurance and Other Exposures
The University’s student fee revenue bonds are secured by pledges and first liens on student fees. While the Indiana General Assembly has appropriated amounts each year equal to the required payment on these bonds in the form of a Fee Replacement Appropriation, there is no guarantee that this appropriation will be renewed in any subsequent year, as the current General Assembly cannot legally bind future General Assemblies. To ensure that the University can meet its immediate obligations to bondholders, $11.5 million has been allocated from student fees for principal and interest payments on student fee revenue bonds.
Because of its scale of operations, Ball State University is able to reduce operating costs by self-insuring, where possible, rather than purchasing higher cost insurance coverage from an outside carrier. This means, however, that the University
Worthen Arena

Management’s Discussion and Analysis
15
must provide reserves similar to the reserves that are required of commercial insurers. Self-insurance reserves total $15.8 million, of which $13.0 million pertains to the self-insured health care plan for employees, retirees, and their families. Of the $13.0 million, $6.0 million represents claims that were incurred but not yet paid as of year end, while $5.8 million is available for higher than anticipated claims in any given year. These amounts are established each year in consultation with the University’s consulting actuaries. The remaining $1.2 million in health care reserves consists primarily of funds received and accrued for the Medicare Retiree Drug Subsidy and rebates received from the University’s prescription benefit manager. These receipts arrived late in the fiscal year and, in some cases, after the close of the fiscal year, resulting in the recording of a receivable at year end to recognize the income. Of the remaining $2.7 million in reserves, $1.3 million pertains to the employee and retiree life insurance plan, while the remaining $1.4 million is available to cover higher than expected expenditures in unemployment and workers’ compensation, as well as the high deductibles for property and casualty insurance. In addition to the insurance reserves, the requirements of GASB Statement No. 45 resulted in the recognition of $6.3 million in prepaid retiree health care expense, which resulted in an increase in net assets by that amount.
As discussed earlier, one of the primary emphases of Ball State University’s new strategic plan is a more selective and diverse student body. As this plan is implemented, however, it is anticipated that there may be an initial short-term decrease in overall enrollment. It is further anticipated that student fee revenues will decrease as a result of this temporary downturn. In order to provide the financing to partially offset the potential loss in student fees, the University has allocated $7.1 million from the general fund for the Student Selectivity Enrollment Contingency Allowance. In the long term, higher retention rates and increased quality should restore and eventually increase the overall number of enrolled students.
The University has taken steps to deal with unexpected expenses or catastrophic events, such as a major pandemic, a major weather-related event, other adverse acts of nature, or other claims. To help defray the unexpected costs of such an event, $4.5 million has been allocated.
Other Allocations
The University has designated $0.4 million for emergency loans benefiting students with demonstrated need whose financial aid packages have not been finalized. The University has also designated $1.9 million in unrestricted private donations to be used as an endowment for student scholarship purposes.
The unrestricted net assets also contain $33.8 million in operating funds throughout the University. These funds represent residual balances in operating accounts that will be carried forward to the next year for the intended purposes. It also includes fees collected but not yet expensed for specific purposes, including workshops, academic and athletic camps, and conferences.
Each year, the University is required by the Government Accounting Standards Board to recognize the market value of its investments as of June 30, even though the University seldom disposes of any investment instrument prior to its maturity. Because the interest rates on June 30, 2008, were slightly lower than the coupon rates on some of the longer-term investments purchased in prior years, the market adjustment was positive, and the largest portion, $0.3 million, was applied to the balances in unrestricted net assets.

Management’s Discussion and Analysis
16
TThhee SSttaatteemmeenntt ooff RReevveennuueess,, EExxppeennsseess aanndd CChhaannggeess iinn NNeett AAsssseettss
The following is a summary of the revenues and expenses resulting in the changes in net assets for the year ended June 30, 2008. Note that, for purposes of this statement, state appropriations are considered non-operating revenues.
Operating Revenues $ 205,666,146 $ 192,134,631 Operating Expenses 379,483,947 352,481,118
Net Operating Income/(Loss) $ (173,817,801) $ (160,346,487) Net Non-Operating Revenues 198,879,477 187,867,780 Other Revenue – Capital Appropriations and Gifts 11,260,036 14,759,674
Increase in Net Assets $ 36,321,712 $ 42,280,967 Net Assets - Beginning of Year 525,424,012 497,497,308 Restatement - Change in Accounting Policy - (14,354,263)
Net Assets - End of Year $ 561,745,724 $ 525,424,012
Change in Net AssetsYear Ended June 30, 2008 and 2007
2008 ReclassifiedRestated and
2007
Operating Revenues
Operating revenues increase net assets and include all transactions that result in sales and/or receipts from goods and services such as tuition and fees, housing, dining and athletics. In addition, federal, state and private grants are considered operating if they are not for financial aid or capital purposes.
Student tuition and fees net revenue increased $4.6 million as a result of rate increases, and auxiliary enterprises revenue, including housing and dining net revenues, increased $4.7 million, due primarily to rate increases and increased occupancy in the residence halls. Scholarship allowances, generated by federal and state financial aid funds as well as internally generated discounts, have reduced tuition and fees revenue by $46.9 million and room and board revenue by $4.2 million.
Grants and Contracts revenue, totaling $24.9 million in 2008, compared to $25.8 million in 2007, was essentially unchanged from the previous year. A reclassification of most federal and state grants for student financial aid to non-operating revenues resulted in federal and state grants and contracts decreasing in both 2007 and 2008. This was necessary due to a recent change in the GASB Implementation Guide which ruled that such aid was essentially a gift and therefore a non-exchange transaction.
Sales and Services of Educational Departments increased by $3.8 million, due primarily to increases in the Center for Media Design and the Computer Showcase.
Operating Expenses
Operating expenses reduce net assets and comprise all the costs necessary to perform and conduct the programs and primary purposes of the University. Included in this total are student aid payments of $6.6 million, which are in addition to $46.9 million and $4.2 million in scholarships and fee remissions netted against tuition and fees revenue and room and board revenues, respectively. Overall, operating expenses increased by $27.0 million over last year. This increase was largely due to a $15.8 million increase in salaries and benefits. Other operating expenses are also higher, due primarily to increases in other supplies and expenses arising from externally funded expenditures related to fund raising, promotion of the University, and the Center for Media Design.

Management’s Discussion and Analysis
17
05
1015
2025
3035
4045
2003 2004 2005 2006 2007 2008
Total Health Care Expenditures (in millions of dollars)
Approximately 98 percent of the University’s employees electing the health care benefit were members of one of the three options available within the Preferred Provider Organization (PPO) Plan for fiscal year 2008. The University receives sizable discounts from in-network providers, offered two less expensive health care options, and has implemented improved wellness initiatives. These initiatives include active efforts to inform employees and retirees of ways to better manage their chronic medical conditions as part of a Health Enhancement Program. Consequently, health care costs increased at rates lower than earlier expected. While efforts will continue to reduce the rate of increase in health care costs, it is expected that next year the rates will increase by more than the actual increase this year, due to higher costs for physicians, hospitals and prescription drugs, and increased usage by the University’s employees and retirees. This is due to the aging demographic profile of this population, technological advances in diagnostic techniques, expensive new prescription drugs and advances in surgical procedures. According to published results of surveys of employers, insurers, actuaries and third party administrators, conducted by reputable human resources consulting firms, costs are expected to continue to increase for the foreseeable future.
Non-Operating Revenues and Expenses
Non-operating revenues increase net assets, and non-operating expenses reduce net assets. Non-operating revenues and expenses are generated from transactions that are primarily non-exchange in nature, consisting mainly of state appropriations, federal and state scholarships and grants, private gifts, interest expense and investment income (interest and dividend income and realized and unrealized gains and losses).
For 2008, state appropriations increased by $2.6 million from the previous year. In addition, the University received $3.3 million of the appropriation withheld in prior years and expects to receive the final $3.3 million in 2009. Therefore, this amount has been reclassified as a current receivable.
Private support increased by $5.1 million, which represents increased sharing by the Ball State University Foundation of the costs of fund raising as well as efforts to promote the University.
Federal and State Scholarships and Grants increased by $3.2 million. In prior years, these were reported under operating revenues. A recent clarification by GASB resulted in the grants which are non-exchange in nature being reported as non-operating. Last year’s amount has been reclassified for comparison purposes.
Other Revenues
Other revenues increase net assets and consist of capital appropriations, gifts and grants, as well as items that are typically non-recurring, extraordinary, or unusual to the University.
Capital appropriations financed by the State of Indiana for renewal and replacement were $3.4 million, an increase of $0.8 million over the prior year. In addition, the University received $7.9 million in capital gifts through the Ball State University Foundation to fund the expansion and renovation of Scheumann Football Stadium and construction of the new Student Recreation and Wellness Facilities.
Renewal and Replacement Appropriations (millions of dollars)
2003 2004 2005 2006 2007 2008
$0.0 $0.7 $0.7 $2.6 $2.6 $3.4

Management’s Discussion and Analysis
18
Total Revenues by Source
Tuition and Fees, Net of Scholarship
Allowances 26%
State Appropriations
34%
Auxiliary Enterprises, Net of Scholarship
Allowances12% Other Revenues
5%
Private Gifts2%
Capital Gifts2%
Scholarships and Grants
8%
Investment Income
4%
Grants and Contracts
6%
Capital Appropriations
< 1%
Total Expenses by Source
Salaries and Benefits
67%
Other Operating Expenses
26%
Interest on Capital Asset Related
Debt1%
Student Aid Payments
2%
Depreciation4%

Management’s Discussion and Analysis
19
SSttaatteemmeenntt ooff CCaasshh FFlloowwss
The Statement of Cash Flows provides relevant information about the cash receipts and cash payments of the University during the period. Unlike the Statement of Revenues, Expenses and Changes in Net Assets, which reports revenues when they are earned and expenses when they are incurred, regardless of when cash is received or disbursed, the Statement of Cash Flows reports actual cash received and disbursed. The focus of the Statement of Cash Flows is on the increase or decrease in cash and cash equivalents. The Statement of Cash Flows helps the user assess the University’s ability to generate future net cash flows, meet obligations as they come due, and assess the University’s needs for external financing.
2007Restated and
2008 Reclassified
Operating Activities $ (167,688,714) $ (148,391,792)Non-Capital Financing Activities 193,268,186 172,232,107Capital and Related Financing Activities 11,865,066 (54,092,536)Investing Activities (29,312,375) (24,756,379)
$ 8,132,163 $ (55,008,600)23,229,424 78,238,024
$ 31,361,587 $ 23,229,424
Cash FlowsYear Ended June 30, 2008 and 2007
Cash and Equivalents – End of Year
Cash and Equivalents Provided By/(Used In):
Net Increase in Cash and EquivalentsCash and Equivalents – Beginning of Year
The major components of cash flows provided from operating activities are tuition and fees and auxiliary enterprise activities (housing and dining fees). More cash was provided by tuition and fees and auxiliary enterprise activities than in the prior year due to rate increases and increased occupancy in the residence halls. The major components of cash flows used in operating activities are payments for employees (including benefits) and payments to suppliers. More cash was used for these activities than in the prior year due to pay increases, increased externally funded expenditures for the Center for Media Design, fund raising, promotion of the University, and an increase in cash disbursed for the prepayment of future retiree health care costs, a significant portion of which pertained to prior year amounts received after June 30, 2007.
Cash flows provided from non-capital financing activities primarily reflect state appropriations received of $144.6 million and federal and state scholarships and grants receipts of $35.2 million.
Cash flows from capital financing activities reflect an increase in cash for the year, due to the issuance of bonds for capital projects that have not as yet incurred significant expenditures.
Cash flows from investing activities, most of which consist of reinvesting the proceeds from investments as they mature, resulted in a net decrease in cash due to increased investment purchases utilizing the proceeds of the bond issue.
EEccoonnoommiicc FFaaccttoorrss TThhaatt WWiillll AAffffeecctt tthhee FFuuttuurree
As a public institution, the economic health of the University is closely tied to that of the State of Indiana, in that the University relies on the State as a major source of funding for the future educational program-related needs of the University. In the foreseeable future from a financing standpoint, the University’s success and, ultimately, its economic health will be driven by the ability to realize the major goals and objectives contained in the University’s Strategic Plan. To do so will improve the institutions’ ability to secure resources to keep pace with changes in enrollment; to replace retiring faculty and administrative personnel with talented new replacements; to relieve existing salary compression in selected areas; to provide adequate resources to encourage growth in research and sponsored programs; to maintain, modernize and renew campus facilities and keep pace with technological advances. Managing these obligations has been accomplished historically through ongoing reallocations and reductions while seeking increases in existing revenue

Management’s Discussion and Analysis
20
streams and adding new sources of revenue, and this will continue. Further elaboration of some of these major challenges is presented in greater detail in the following discussion.
As anticipated, the University’s enrollment declined slightly in Fall 2007, as new, higher admission standards were implemented. Through a combination of attracting more qualified students and the related benefit of higher retention rates, the University expects enrollment to stabilize within the next two years and then increase. By executing components of the Strategic Plan related to providing immersion experiences for all students, securing national recognition for additional program areas, as well as taking steps that add to the vibrancy of the campus experience for students, the ability to attract greater numbers of high ability students will be enhanced.
In the next ten years, it is projected that a significant number of faculty and administration will retire from Ball State University with a similar experience expected in some sectors on a national level. The result will be significant pressure to support competitive salary and benefit programs to enable the University to attract on the open market the best available personnel. Meeting this challenge is critical to preserving the quality of a Ball State University education and achieving national stature in identified programs.
Like all employers, the University is challenged by the need and desire to offer a quality health care program in a very fluid cost environment. Technological advances in medical testing and treatment, as well as new prescription drugs, and federal and state legislative and regulatory pronouncements, all add to the cost and uncertainty involved in the management of this important employee benefit. In an additional effort to manage long-term health care costs, the University recently has initiated a comprehensive Health Enhancement Program for employees and their families. It is expected that over time this investment will more than be returned through lower costs and improved productivity. It is also expected that Federal government action will take place in the years ahead that will likely have a positive impact on the University’s long-term funding structure. The University will continue to monitor developments in this area and take whatever actions are necessary to offer the most effective and efficient health care program possible. Based on the plan the University has followed, the current status of the health care program for both active employees and retirees provides a positive asset in recruiting and retaining university personnel.
It is anticipated that Ball State University’s underlying credit rating will increase in the coming year, saving the University in terms of the cost of borrowing. This is due to four recent developments. First, the State’s underlying Credit Rating was raised by Standard and Poor’s to AAA in July of 2008; only nine other states are rated AAA. In addition, Moody’s has announced that they plan on recalibrating the rating for all of the U.S. public sector debt they rate. It is anticipated that many public institutions of higher education will experience a one notch increase in their ratings. Additionally, the Ball State Strategic Plan was well received by the rating analysts last year and another year of promising results will work in the University’s favor. Finally, according to a recent article in the Journal of Accountancy regarding GASB Statement No. 45, Accounting and Financial Reporting by employers for Postemployment Benefits Other than Pensions, bond rating agencies have indicated that a decision not to fund these benefits signals a lack of management recognition of a major liability, which could affect the rating decision and result in higher interest costs. Since Ball State University has been engaged in funding this liability since the mid-1980’s, with the result that, for the most recent actuarial projection, dated July 1, 2007, the liability for retiree health care and life insurance combined was 91.2 percent funded, this should be a positive factor in future credit ratings.
The University must ensure that the necessary resources are provided to keep pace with the growing needs to renew aging facilities and to adapt these facilities to the changing academic needs that will occur over the life of any long-lived asset. Financial Planning Guidelines for Facility Renewal and Adaptation, a study cited earlier in this report, estimates that between two percent and four percent of plant replacement cost needs to be provided, on average, each year to accomplish this task. With the combination of internally designated sources and state-appropriated funds, the University will have the resources necessary to retain the effectiveness of its physical assets in achieving the University’s mission.
In summary, as the financial statements indicate, the University has been an effective steward of the human, physical and financial resources entrusted to it, based on a planned approach to addressing long-term needs and liabilities while facing shorter-term challenges not unlike other public institutions nationwide. When all of this is taken into consideration, Ball State University remains in a strong position to be a major asset of significant benefit to the citizens of the State of Indiana.

Management’s Discussion and Analysis
21
This page intentionally left blank

Financial Statements
22
Restated and
Assets:Current Assets:
Cash and Cash Equivalents $ 31,361,587 $ 23,229,424 Short Term Investments 44,451,795 14,692,883 Accrued Interest Receivable – Investments 4,379,221 4,363,588 Accounts Receivable, Net, and Unbilled Costs 29,429,094 34,292,462 Inventories 1,551,670 1,471,005 Deposit with Bond Trustee 11,546,628 9,033,160 Notes Receivable, Net 1,516,953 1,744,691 Prepaid Retiree Benefits (See Note J) 6,303,323 - Prepaid Expenses 1,684,979 815,244
Total Current Assets $ 132,225,250 $ 89,642,457 Noncurrent Assets:
Endowment Investments $ 2,820,802 $ 2,655,022 State Appropriation Receivable - 3,339,406 Accounts and Notes Receivable, Net 10,475,681 9,544,609 Other Long Term Investments 226,647,103 210,160,855 Capital Assets, Net (See Note B) 412,039,504 400,003,165
Total Noncurrent Assets $ 651,983,090 $ 625,703,057
Total Assets $ 784,208,340 $ 715,345,514
Liabilities:Current Liabilities:
Accounts Payable and Accrued Liabilities $ 28,168,885 $ 27,491,520 Deposits 5,172,983 8,225,682 Deferred Revenue 8,764,731 7,384,896 Long Term Liabilities – Current Portion 8,021,575 7,548,003
Total Current Liabilities $ 50,128,174 $ 50,650,101 Noncurrent Liabilities:
Liability for Compensated Absences $ 7,762,157 $ 7,878,457 Advances on Long Term Grants 2,535,417 7,076,695 Perkins Loan Program – Federal Capital Contribution 9,340,173 9,085,813 Long Term Liabilities, net 152,696,695 115,230,436
Total Noncurrent Liabilities $ 172,334,442 $ 139,271,401
Total Liabilities $ 222,462,616 $ 189,921,502 Net Assets:
Invested in Capital Assets, Net of Related Debt $ 256,317,359 $ 280,663,018 Restricted for:
Nonexpendable Scholarships 912,496 883,021 Expendable:
Debt Service 2,994,946 2,637,682 Loans 2,292,847 2,159,328 Construction 55,548,137 12,084,971 External Grants 5,432,277 4,915,363
Unrestricted (See Note B) 238,247,662 222,080,629 Total Net Assets $ 561,745,724 $ 525,424,012
Total Liabilities and Net Assets $ 784,208,340 $ 715,345,514
Ball State University
Statement of Net AssetsJune 30, 2008 and 2007
Reclassified2008
2007

Financial Statements
23
2008 2007Assets:
Cash $ 248,043 $ 227,972 Interest and Dividends Receivable 73,611 157,045 Contributions Receivable (Net of Allowances: 2008 - $787,055; 2007 - $661,005) 21,563,680 19,116,806 Property Held for Sale 2,142,508 2,132,417 Beneficial Interest in Remainder Trusts 1,910,864 3,896,360 Note Receivable - 1,174,712 Investments in Marketable Securities 195,936,094 203,165,498 Investments Held in Split-Interest Agreements 2,601,648 3,593,698 Bond Issue Costs and Other Assets 173,638 108,411 Cash Surrender Value of Life Insurance 895,567 842,941 Property and Equipment 2,490,442 2,215,835 Beneficial Interest in Perpetual Trusts 1,816,762 1,820,731
Total Assets $ 229,852,857 $ 238,452,426 Liabilities:
Accounts Payable $ 5,296,320 $ 9,373,748 Grants Payable 1,341,508 1,341,508 Accrued Expenses 143,169 317,590 Line of Credit 5,000,000 - Annuity Obligations 1,921,262 1,697,570 Trust Obligations 860,831 1,101,290 Bonds Payable 10,000,000 10,000,000
Total Liabilities $ 24,563,090 $ 23,831,706 Net Assets:
Unrestricted $ 29,559,889 $ 48,225,761 Temporarily Restricted 52,682,379 48,595,356 Permanently Restricted 123,047,499 117,799,603
Total Net Assets $ 205,289,767 $ 214,620,720
Total Liabilities and Net Assets $ 229,852,857 $ 238,452,426
See Note A in Notes to Financial Statements
Ball State UniversityFoundation
Statement of Financial PositionJune 30, 2008 and 2007

Financial Statements
24
Operating Revenues:Student Tuition and Fees $ 155,172,883 $ 146,877,924 Scholarship Allowances (46,947,251) (43,258,798)
Net Student Tuition and Fees $ 108,225,632 $ 103,619,126 Federal Grants and Contracts (See Note B) 9,728,707 10,933,414 State Grants and Contracts (See Note B) 2,770,172 912,118 Other Governmental Grants and Contracts 248,363 197,285 Non-Governmental Grants and Contracts 12,201,608 13,761,467 Sales and Services of Educational Departments 16,410,865 12,603,951 Auxiliary Enterprises:
Residential Life (Net of Scholarships and Allowances: 2008 - $4,230,573; 2007 - $2,672,084) 43,599,172 38,908,958
Other 8,823,332 8,807,124 Other Operating Revenues 3,658,295 2,391,188
Total Operating Revenues $ 205,666,146 $ 192,134,631 Operating Expenses:
Personnel Services $ 193,246,069 $ 181,170,578 Benefits (See Note J) 63,418,317 59,719,361 Utilities 10,067,117 9,002,330 Repairs and Maintenance 14,518,914 12,623,133 Other Supplies and Expenses 75,632,944 68,742,163 Student Aid 6,567,478 5,994,656 Depreciation 16,033,108 15,228,897
Total Operating Expenses $ 379,483,947 $ 352,481,118
Operating Income/(Loss) $ (173,817,801) $ (160,346,487) Non-Operating Revenues/(Expenses):
Federal and State Scholarship and Grants (See Note B) $ 35,206,521 $ 31,973,890 State Appropriations 141,253,533 138,634,176 Investment Income 17,089,020 15,998,849 Interest on Capital Asset Related Debt (5,733,666) (5,567,224) Private Gifts 8,762,676 3,653,610 Other Non-Operating Income 2,301,393 3,174,479
Net Non-Operating Revenues/(Expenses) $ 198,879,477 $ 187,867,780
Income Before Other Revenues, Expenses, Gains or Losses $ 25,061,676 $ 27,521,293 Capital Appropriation 3,363,151 2,621,019 Capital Gifts 7,896,885 12,138,655
$ 36,321,712 $ 42,280,967
525,424,012 497,497,308 Restatement – Change in Accounting Policy (See Note B) - (14,354,263)
Net Assets – Beginning of Year as Restated $ 525,424,012 $ 483,143,045
Net Assets – End of Year $ 561,745,724 $ 525,424,012
2007
Ball State University
Statement of Revenues, Expensesand Changes in Net Assets
June 30, 2008 and 2007
Increase in Net Assets
Net Assets – Beginning of Year
ReclassifiedRestated and
2008

Rev
enue
s, G
ains
and
Oth
er S
uppo
rt:
Con
tribu
tions
$1,
225,
266
$13
,255
,764
$8,
760,
261
$
23,2
41,2
91
$
1,10
5,00
0
$
4,18
8,14
0
$
15,2
70,3
97
$
20,5
63,5
37
P
rom
otio
nal A
ctiv
ities
and
Oth
er R
even
ue41
,944
-
-
41,9
44
55
,410
-
-
55,4
10
In
vest
men
t Inc
ome
(5,3
65,9
00)
6,23
7,14
9
(3
,192
,604
)
(2
,321
,355
)
21
,358
,433
5,
895,
989
5,72
6,35
5
32,9
80,7
77
C
hang
e in
Val
ue o
f Spl
it-In
tere
st A
gree
men
ts(7
4,49
2)
(125
,437
)
(707
,253
)
(907
,182
)
-
16
7,37
8
54,9
97
22
2,37
5
O
pera
ting
Sup
port
Fees
1,01
3,18
3
(1
68,7
40)
(8
44,4
43)
-
835,
044
(1
92,4
18)
(6
42,6
26)
-
$(3
,159
,999
)
$
19,1
98,7
36
$
4,01
5,96
1
$20
,054
,698
$23
,353
,887
$
10,0
59,0
89
$
20,4
09,1
23
$
53,8
22,0
99
N
et A
sset
s R
elea
sed
from
Res
trict
ions
13,8
79,7
78
(15,
111,
713)
1,
231,
935
-
14,1
21,6
72
(14,
258,
048)
13
6,37
6
-
Tota
l Rev
enue
s, G
ains
and
Oth
er S
uppo
rt$
10,7
19,7
79
$4,
087,
023
$5,
247,
896
$
20,0
54,6
98
$
37,4
75,5
59
$(4
,198
,959
)
$
20,5
45,4
99
$
53,8
22,0
99
Expe
nses
:U
nive
rsity
Cap
ital P
roje
cts
$24
,476
,772
$
-
$
-
$
24,4
76,7
72
$
-
$
-
$
-
$
-
U
nive
rsity
Pro
gram
s-
-
-
18,2
23,4
19
-
-
18,2
23,4
19
M
anag
emen
t and
Gen
eral
1,35
4,31
3
-
-
1,
354,
313
2,
559,
767
-
-
2,55
9,76
7
Fund
Rai
sing
3,55
4,56
6
-
-
3,
554,
566
1,
832,
009
-
-
1,83
2,00
9
Tota
l Exp
ense
s$
29,3
85,6
51
$-
$-
$29
,385
,651
$22
,615
,195
$
-
$
-
$
22,6
15,1
95
Cha
nge
in N
et A
sset
s$
(18,
665,
872)
$
4,08
7,02
3
$
5,24
7,89
6
$(9
,330
,953
)
$
14,8
60,3
64
$(4
,198
,959
)
$
20,5
45,4
99
$
31,2
06,9
04
N
et A
sset
s, B
egin
ning
of Y
ear
48,2
25,7
61
48,5
95,3
56
11
7,79
9,60
3
214,
620,
720
33
,365
,397
52
,794
,315
97,2
54,1
04
18
3,41
3,81
6
Net
Ass
ets,
End
of Y
ear
$29
,559
,889
$
52,6
82,3
79
$
123,
047,
499
$
205,
289,
767
$
48,2
25,7
61
$48
,595
,356
$11
7,79
9,60
3
$21
4,62
0,72
0
See
Not
e A
in N
otes
to F
inan
cial
Sta
tem
ents
Res
trict
edR
estri
cted
Unr
estri
cted
Res
trict
edU
nres
trict
edTe
mpo
raril
y20
07
Bal
l Sta
te U
nive
rsity
Foun
datio
n
Stat
emen
t of A
ctiv
ities
Yea
rs E
nded
Jun
e 30
, 200
8 an
d 20
07
Res
trict
edP
erm
anen
tly20
08
Tota
lTo
tal
Tem
pora
rily
Per
man
ently
25
Financial Statements

Financial Statements
26
Restated and
Source / (Uses) of Cash:Operating Activities:
Tuition and Fees $ 106,655,429 $ 103,719,562 Grants and Contracts 21,178,589 20,689,519 Payments to Suppliers (75,978,927) (62,184,380) Payment for Maintenance and Repair (14,518,914) (12,623,133) Payments for Utilities (10,067,117) (9,002,330) Payments for Personnel Services (191,303,169) (180,942,303) Payments for Benefits (70,520,384) (63,668,868) Payments for Scholarships and Fellowships (6,782,906) (4,433,318) Auxiliary Enterprise Charges:
Room and Board 43,682,354 38,553,058 Other 9,481,817 7,952,130
Sales and Services of Educational Activities 16,848,728 12,017,315 Other Receipts/Disbursements/Advances 3,635,786 1,530,956
Net Cash Provided/(Used) by Operating Activities $ (167,688,714) $ (148,391,792) Non-Capital Financing Activities:
Federal and State Scholarships and Grants $ 35,206,521 $ 31,973,890 State Appropriations 144,592,938 142,711,238 William D. Ford Direct Lending Receipts 55,341,412 53,381,980 William D. Ford Direct Lending Disbursements (55,341,412) (53,381,980) PLUS Loans Receipts 25,641,458 29,473,548 PLUS Loans Disbursements (25,641,458) (29,473,548) Private Gifts 13,895,506 (8,086,794) Foundation Receipts 1,584,588 3,788,384 Foundation Disbursements (1,584,588) (3,788,384) Other Non-Operating Revenue 2,301,393 3,174,479 Other Receipts (2,728,172) 2,459,294
Net Cash Provided/(Used) by Non-Capital Financing Activities $ 193,268,186 $ 172,232,107 Capital Financing Activities:
Proceeds from Capital Debt $ 65,650,249 $ - Capital Appropriations 3,363,151 2,621,019
Capital Gifts 7,896,885 12,138,655 Unamortized Bond Premium (463,295) (185,837) Purchases of Capital Assets (29,797,003) (57,022,917) Principal Paid on Capital Debt (27,233,003) (6,854,881) Interest Paid on Capital Debt (5,038,450) (5,611,621) Deposits with Trustee (2,513,468) 823,046
Net Cash Provided/(Used) by Capital Financing Activities $ 11,865,066 $ (54,092,536) Investing Activity:
Proceeds from Sales and Maturities of Investments $ 216,001,165 $ 58,681,745 Interest on Investments 13,957,809 13,052,406 Purchase of Investments (259,271,349) (96,490,530)
Net Cash Provided/(Used) by Investing Activities $ (29,312,375) $ (24,756,379) Net Increase/(Decrease) in Cash $ 8,132,163 $ (55,008,600)
Cash – Beginning of the Year $ 23,229,424 $ 78,238,024 Cash – End of the Year 31,361,587 23,229,424
Net Increase/(Decrease) in Cash $ 8,132,163 $ (55,008,600)
2008 Reclassified
2007
Ball State University
Statement of Cash FlowsJune 30, 2008 and 2007

Financial Statements
27
Restated and
Reconciliation of Net Operating Revenues/(Expenses) to Net Cash Provided/(Used) by Operating Activities:
Operating Income/(Loss) $ (173,817,801) $ (160,346,487) Adjustments to Reconcile Income/(Loss) to Net Cash
Provided/(Used) by Operating Activities:Depreciation Expense 16,033,108 15,228,897 Equipment Retired 1,727,556 1,291,259 Changes in Assets and Liabilities:
Operating Receivables, Net (3,634,045) (5,210,362) Inventories (80,665) (435,106) Other Assets (7,173,058) 5,144 Accounts Payable (31,971) 1,863,998 Deferred Revenue 1,379,835 190,763 Deposits Held for Others (70,167) 739,433 Compensated Absences (116,300) 111,254 Advance on Long Term Grants (4,541,278) (5,170,462) Long Term State Appropriations Receivable 3,339,406 3,339,406 Long Term Accounts and Notes Receivable (703,334) 471
Net Cash Provided/(Used) by Operating Activities $ (167,688,714) $ (148,391,792)
2008 Reclassified
2007
Ball State University
Statement of Cash FlowsJune 30, 2008 and 2007
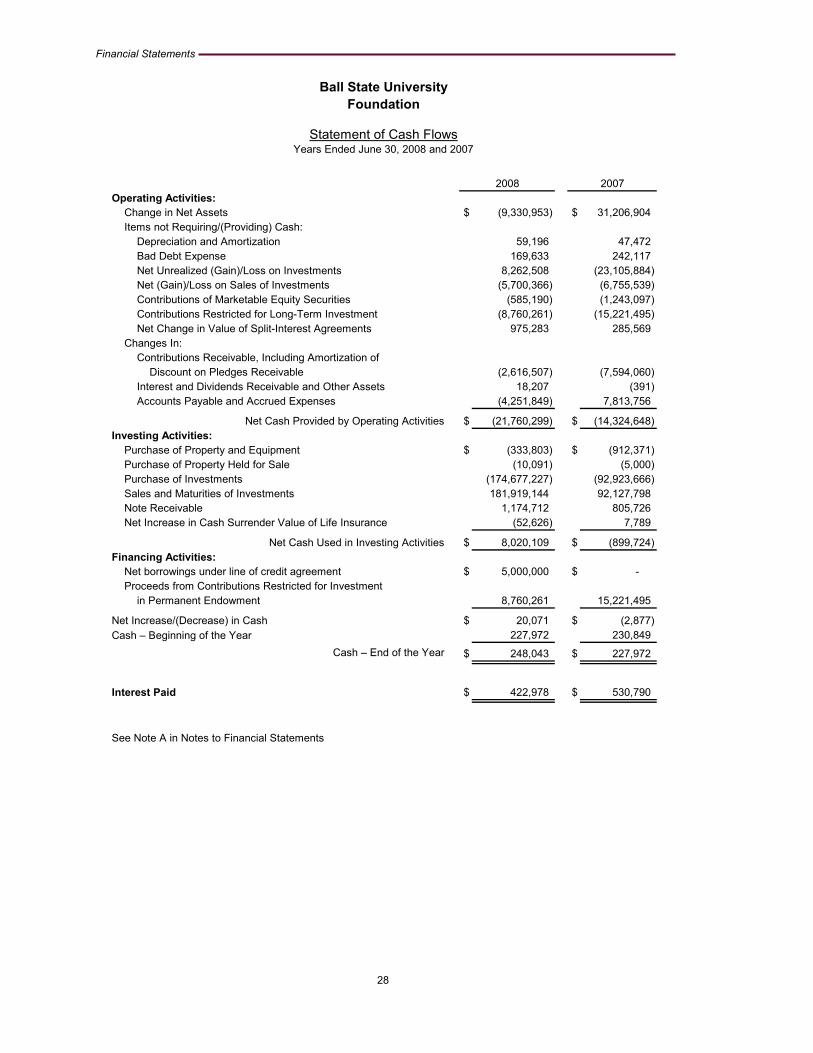
Financial Statements
28
Operating Activities:Change in Net Assets $ (9,330,953) $ 31,206,904 Items not Requiring/(Providing) Cash:
Depreciation and Amortization 59,196 47,472 Bad Debt Expense 169,633 242,117 Net Unrealized (Gain)/Loss on Investments 8,262,508 (23,105,884) Net (Gain)/Loss on Sales of Investments (5,700,366) (6,755,539) Contributions of Marketable Equity Securities (585,190) (1,243,097) Contributions Restricted for Long-Term Investment (8,760,261) (15,221,495) Net Change in Value of Split-Interest Agreements 975,283 285,569
Changes In:Contributions Receivable, Including Amortization of
Discount on Pledges Receivable (2,616,507) (7,594,060) Interest and Dividends Receivable and Other Assets 18,207 (391) Accounts Payable and Accrued Expenses (4,251,849) 7,813,756
Net Cash Provided by Operating Activities $ (21,760,299) $ (14,324,648) Investing Activities:
Purchase of Property and Equipment $ (333,803) $ (912,371) Purchase of Property Held for Sale (10,091) (5,000) Purchase of Investments (174,677,227) (92,923,666) Sales and Maturities of Investments 181,919,144 92,127,798 Note Receivable 1,174,712 805,726 Net Increase in Cash Surrender Value of Life Insurance (52,626) 7,789
Net Cash Used in Investing Activities $ 8,020,109 $ (899,724) Financing Activities:
Net borrowings under line of credit agreement $ 5,000,000 $ - Proceeds from Contributions Restricted for Investment
in Permanent Endowment 8,760,261 15,221,495
Net Increase/(Decrease) in Cash $ 20,071 $ (2,877) Cash – Beginning of the Year 227,972 230,849
Cash – End of the Year $ 248,043 $ 227,972
Interest Paid $ 422,978 $ 530,790
See Note A in Notes to Financial Statements
20072008
Ball State UniversityFoundation
Statement of Cash FlowsYears Ended June 30, 2008 and 2007

29
BBaallll SSttaattee UUnniivveerrssiittyy NNootteess ttoo FFiinnaanncciiaall SSttaatteemmeennttss
JJuunnee 3300,, 22000088
NNoottee AA –– SSiiggnniiffiiccaanntt AAccccoouunnttiinngg PPoolliicciieess
Reporting Entity
Ball State University is a public institution of higher education governed by a nine-member Board of Trustees in accordance with IC 20-12-57.5. The University is considered to be a component unit of the State of Indiana because the Governor of Indiana appoints the Trustees, one of whom is a full-time student at the University and two of whom are nominated or selected by the Ball State University Alumni Association. All members of the Board of Trustees are appointed for terms of four years, except for the student member whose term is two years. No more than six of the non-student Trustees may be of the same sex, and at least one of them must be a resident of Delaware County, Indiana.
Ball State University is included in the State’s financial statements as a discrete component unit. Transactions with the State of Indiana relate primarily to appropriations for operations, repairs and rehabilitations and debt service for academic buildings; appropriations and other revenues for operation of the Indiana Academy for Science, Mathematics and Humanities, as well as grants for other purposes; and payments to State retirement programs for University employees.
Financial Statements
The financial statements of Ball State University are prepared in accordance with the principles outlined in “Statement No. 35” of the Governmental Accounting Standards Board. Ball State University has elected to report its financial results as a special-purpose government engaged only in business-type activities, using proprietary fund accounting and financial reporting. Required financial statements consist of:
Management’s Discussion and Analysis Statement of Net Assets Statement of Revenues, Expenses and Changes in Net Assets Statement of Cash Flows Notes to Financial Statements Required Supplemental Information other than Management Discussion and Analysis, if applicable.
The financial statements have been prepared using the economic resource measurement focus and the accrual basis of accounting with the following exceptions, which are common practices in colleges and universities:
Interest on student loans is recorded only when received. Gifts are recorded when received.
Major sources of revenues recorded in advance of the year in which the predominant amount of service is rendered are classified as deferred income on the Statement of Net Assets. Advances on exchange activities are recorded as deferred income. All other earned receipts are reported as revenue in the period they are received. Internal service activity revenues, including overhead charges, are offset against the expenses of internal service activities. Restricted and unrestricted resources are spent and tracked at the discretion of the department within the guidelines of donor restrictions.
Operating Revenues
Operating revenues encompass all revenues from exchange transactions arising from the activities necessary to carry out the primary mission of the University, including tuition and fees, grants and contracts, sales and services of educational departments and auxiliary enterprises net revenues. Revenues from investing activities, Ball State University Foundation donations, Federal and State Financial Aid, and state appropriations are considered to be non-operating revenue.

Notes to Financial Statements
30
Student Tuition and Fees
Student tuition and fees are net of scholarship allowances funded from University funds as well as scholarships and fellowships funded from federal, state and other grants, to the extent that these funds offset all or a portion of each student’s tuition and fees. Scholarships and grants awarded by third parties directly to students without University involvement in the decision-making process are not treated as a reduction of tuition and fees but rather as a source of direct payment.
Ball State University conducts summer classes, which for billing purposes are considered either as part of the first five-week summer session, the second five-week summer session, or the ten-week summer semester. The first summer session takes place during May and June, while the second summer session takes place during June and July, with slightly more days falling in July. The summer semester takes place during the two summer sessions. Bills for first summer session and summer semester are due on or about the middle of May, while bills for the second summer session are due on or about the middle of June. By June 30, students have exhausted their rights to any refund of tuition and fees. Therefore, all summer tuition and fees are reported as revenue for the year ended June 30 of that summer. Faculty salaries for summer are paid in June for first summer session and half of summer semester and in July for second summer session and the second half of summer semester.
Cash and Investments
Investments are reported at fair value. Investments with a maturity date of one year or less are considered to be short-term investments, with the exception of those with a maturity date of three months or less, which are considered to be cash equivalents. All other investments are considered to be long-term.
Accounts Receivable and Notes Receivable
Accounts Receivable and Notes Receivable are both reported net of a calculated reserve for uncollectible items. The reserves as of June 30, 2008, and June 30, 2007, were $3,862,308 and $3,490,415 respectively for accounts receivable. For notes receivable, the reserves were $1,593,147 and $1,593,147 for the same dates.
Inventories
Inventories are stated at the lower of cost or market value, based on a physical count. Cost is based on purchases, and determined on a moving average basis for Central Stores and a first-in, first-out basis for all other inventories.
Capital Assets
Capital assets consist of land and land improvements, infrastructure, buildings and building improvements, construction in progress, and equipment and are recorded at cost or, for contributed assets, at fair value at the date of acquisition. All land and building acquisitions are capitalized. Capital assets also include land improvements and infrastructure costing in excess of $100,000. Building improvements are capitalized if the project costs more than $100,000 or twenty percent of the building’s replacement value and either extends the useful life of the building, changes the use or purpose of the original building, or expands the total square footage of the building. The University capitalizes equipment with a cost of $5,000 or more and a useful life in excess of one year. Construction costs that cross fiscal years are capitalized as Construction in Progress, but not depreciated until the assets are placed in service. Non-capital equipment and facility costs, routine repairs, and maintenance are charged to operating expenses in the year in which the expense was incurred.
Depreciation expense is computed using the straight-line method over the estimated useful lives of the respective assets, generally fifty years for buildings, ten to fifty years for exhaustible land improvements, and three to ten years for equipment. Land and inexhaustible land improvements are not depreciated. The library collection is not depreciated. All items in the collection are deemed to retain their full value if they are still on hand. All new additions to the collection are treated as an expense at the time of purchase.

Notes to Financial Statements
31
The art collection, housed primarily in the Ball State University Museum of Art, is not included, due to the difficulty in determining an accurate value, plus the restrictions in place regarding sales of artwork and use of the funds resulting from such sales, as well as disposition of the artwork in the unlikely event that the museum would cease to exist.
Component Unit
The Ball State University Foundation (foundation) is a legally separate, tax-exempt Indiana nonprofit corporation that is an Internal Revenue Code Section 170(b) (1) (A) organization organized and operated for the benefit of Ball State University. Under the reporting standards of the Governmental Accounting Standards Board (GASB), the foundation is defined to be a component unit of the University. The foundation acts primarily as a fund-raising organization to supplement the resources that are available to the University in support of its programs. The foundation by-laws allow for thirty-one voting directors, seven of whom serve by position. The seven directors who serve by position include the President of the University Board of Trustees, the University President, the Vice-Presidents of Business Affairs and Advancement and two other members of the University Board of Trustees. Although the University does not control the timing or amount of receipts from the foundation, the majority of resources, or income thereon, that the foundation holds and invests are restricted to the activities of the University by the donors. Because these restricted resources held by the foundation can only be used by, or for the benefit of, the University, the foundation is considered a component unit of the University and is discretely presented in the University’s financial statements.
Transactions with the foundation primarily involve the funding of expenditures for which university funds are not available. These include both unrestricted funds and those restricted by donors. Expenditures include scholarships, funding of distinguished professorships, capital expenditures and operational support. Complete financial statements for the foundation can be requested from the foundation office at: 2800 W. Bethel Ave., Muncie, IN 47306.
The foundation is a private nonprofit organization that reports under FASB standards, including FASB Statement No. 117, Financial Reporting for Not-for-Profit Organizations. As such, certain revenue recognition criteria and presentation features are different from GASB revenue recognition criteria and presentation features. No modifications have been made to the foundation’s financial information in the University’s financial reporting entity for these differences.
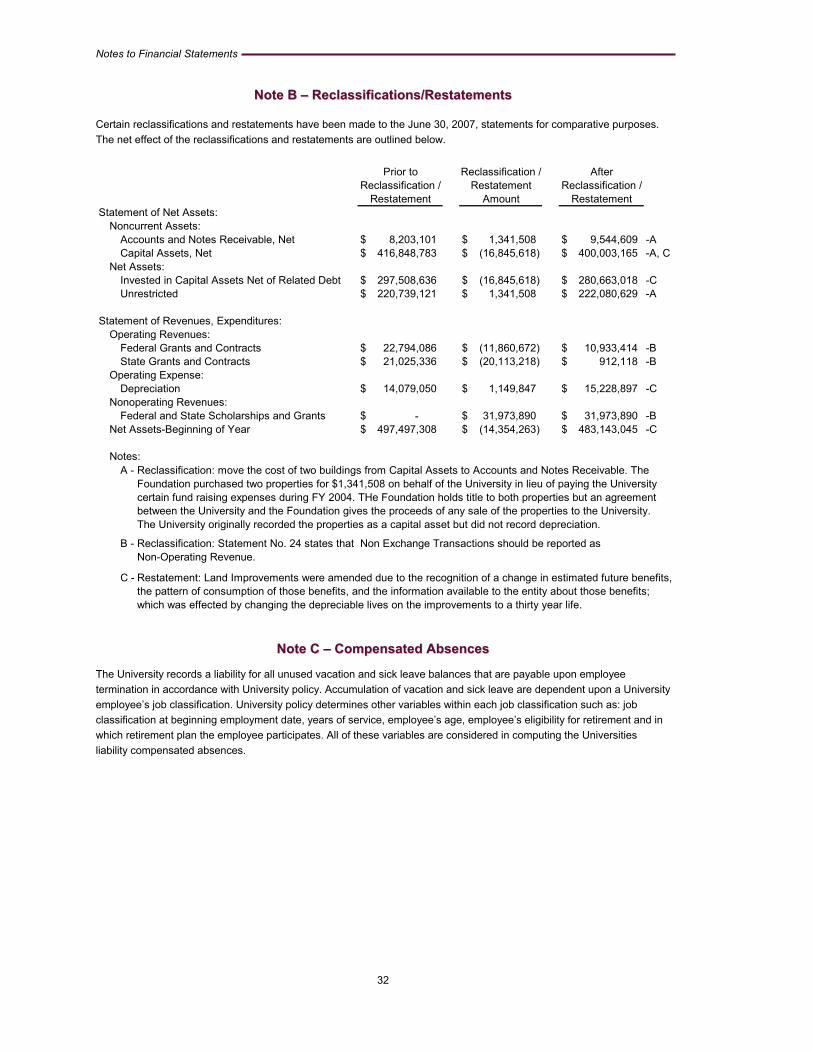
Notes to Financial Statements
32
NNoottee BB –– RReeccllaassssiiffiiccaattiioonnss//RReessttaatteemmeennttss
Certain reclassifications and restatements have been made to the June 30, 2007, statements for comparative purposes. The net effect of the reclassifications and restatements are outlined below.
Statement of Net Assets:Noncurrent Assets:
Accounts and Notes Receivable, Net $ 8,203,101 $ 1,341,508 $ 9,544,609 -ACapital Assets, Net $ 416,848,783 $ (16,845,618) $ 400,003,165 -A, C
Net Assets: Invested in Capital Assets Net of Related Debt $ 297,508,636 $ (16,845,618) $ 280,663,018 -CUnrestricted $ 220,739,121 $ 1,341,508 $ 222,080,629 -A
Statement of Revenues, Expenditures:
Operating Revenues: Federal Grants and Contracts $ 22,794,086 $ (11,860,672) $ 10,933,414 -BState Grants and Contracts $ 21,025,336 $ (20,113,218) $ 912,118 -B
Operating Expense:Depreciation $ 14,079,050 $ 1,149,847 $ 15,228,897 -C
Nonoperating Revenues:Federal and State Scholarships and Grants $ - $ 31,973,890 $ 31,973,890 -B
Net Assets-Beginning of Year $ 497,497,308 $ (14,354,263) $ 483,143,045 -C
Notes:A -
B -
C -
Restatement Reclassification /
Reclassification: move the cost of two buildings from Capital Assets to Accounts and Notes Receivable. The Foundation purchased two properties for $1,341,508 on behalf of the University in lieu of paying the University certain fund raising expenses during FY 2004. THe Foundation holds title to both properties but an agreement between the University and the Foundation gives the proceeds of any sale of the properties to the University. The University originally recorded the properties as a capital asset but did not record depreciation.
Reclassification: Statement No. 24 states that Non Exchange Transactions should be reported asNon-Operating Revenue.
Restatement: Land Improvements were amended due to the recognition of a change in estimated future benefits, the pattern of consumption of those benefits, and the information available to the entity about those benefits; which was effected by changing the depreciable lives on the improvements to a thirty year life.
Prior to Reclassification / After
RestatementRestatementReclassification /
Amount
NNoottee CC –– CCoommppeennssaatteedd AAbbsseenncceess
The University records a liability for all unused vacation and sick leave balances that are payable upon employee termination in accordance with University policy. Accumulation of vacation and sick leave are dependent upon a University employee’s job classification. University policy determines other variables within each job classification such as: job classification at beginning employment date, years of service, employee’s age, employee’s eligibility for retirement and in which retirement plan the employee participates. All of these variables are considered in computing the Universities liability compensated absences.

Notes to Financial Statements
33
NNoottee DD –– CCaappiittaall AAsssseettss
Land and Inexhaustible Improvements $ 13,021,263 $ 1,528,143 $ - $ 14,549,406 Exhaustible Land Improvements 33,987,178 1,921,496 - 35,908,674 Infrastructure 14,397,838 1,112,655 - 15,510,493 Educational Buildings 299,166,551 1,108,458 1,296,955 298,978,054 Utility Buildings 15,139,101 - - 15,139,101 Educational Equipment 41,538,212 4,698,062 3,125,322 43,110,952 Auxiliary Enterprise Buildings 206,607,598 5,843,675 515,460 211,935,813 Auxiliary Enterprise Equipment 12,610,127 527,719 3,451,975 9,685,871 Construction in Process 2,046,325 12,858,860 - 14,905,185 Other Property 689,650 197,935 - 887,585
Total $ 639,203,843 $ 29,797,003 $ 8,389,712 $ 660,611,134
Less Accumulated Depreciation:Infrastructure $ 3,518,372 $ 343,587 $ - $ 3,861,959 Exhaustible Land Improvements 15,504,111 1,079,266 - 16,583,377 Educational Buildings 101,692,909 5,979,560 165,719 107,506,750 Utility Buildings 7,055,645 302,781 - 7,358,426 Educational Equipment 30,585,017 3,566,772 2,837,955 31,313,834 Auxiliary Enterprise Buildings 70,969,493 4,239,481 232,297 74,976,677 Auxiliary Enterprise Equipment 9,833,333 511,508 3,426,185 6,918,656 Other Property 41,798 10,153 - 51,951
Total $ 239,200,678 $ 16,033,108 $ 6,662,156 $ 248,571,630
Capital Assets, Net $ 400,003,165 $ 13,763,895 $ 1,727,556 $ 412,039,504
Book ValueJuly 1, 2007
Book ValueJune 30, 2008Additions Deductions
NNoottee EE –– NNootteess PPaayyaabbllee
A loan agreement in the amount of $1,500,000 dated June 1, 2006, was executed with Mutual Federal Savings Bank, Muncie, Indiana, in order to refinance an earlier note payable in the amount of $1,500,000. The proceeds from the original note provided interim financing for the construction and renovation of surface parking areas on campus. The loan was due on June 1, 2008, but was paid early by the University on March 18, 2008. Interest expense for the fiscal year ended June 30, 2008, was $47,475.
NNoottee FF –– BBoonnddss PPaayyaabbllee
Parking System Revenue Bonds, Series 1989, were issued on August 8, 1989. The $2,905,000 Current Interest Bonds included in the issue were dated July 1, 1989. They have all been retired. The $740,942 of Capital Appreciation Bonds included in the issue were dated as of the issue date. Proceeds from the sale of the bonds were used to fund the expansion and renovation of surface parking on campus and to fund the costs of issuance.
Parking System Revenue Bonds, Series 2003, in the amount of $6,495,000 were dated and issued on August 27, 2003. Proceeds from the bonds were used to partially fund construction of the McKinley Parking Structure.
Housing and Dining System Revenue Bonds, Series 2006, in the amount of $35,425,000 were dated and issued on January 19, 2006. Proceeds from the bonds were used to partially fund construction of Park Residence Hall and the expansion and renovation of Woodworth Dining Hall.
Student Fee Bonds, Series I, in the amount of $38,770,000, dated January 1, 1999, were issued on January 12, 1999. Proceeds from Series I were used to fund a portion of the construction of the Art and Journalism Building and to refund the outstanding Student Fee Bonds, Series G.

Notes to Financial Statements
34
Student Fee Bonds, Series K, in the amount of $21,975,000, were dated and issued on January 3, 2002. Proceeds from Series K bonds were used to fund construction of the Music Instruction Building and to fund the cost of issuance and an amount of capitalized interest.
Student Fee Bonds, Series L, in the amount of $16,425,000, were dated and issued on July 21, 2004. Proceeds from Series L Bonds were used solely to refund all of the outstanding Student Fee Bonds remaining in Series J.
Student Fee Bonds, Series M, in the amount of $21,280,000, were dated and issued on December 15, 2004. Proceeds from Series M bonds were used to fund construction and reconfiguration of the David Letterman Communication and Media Building and to fund the cost of issuance and a certain amount of capitalized interest.
Student Fee Bonds, Series N, in the amount of $63,615,000, were dated and issued on January 30, 2008. Proceeds from Series N bonds will be used to fund a portion of the improvements to the University’s heating and cooling energy generation operation and to refund portions of the outstanding Student Fee Bonds remaining in Series I and K.
The bond payable liability reported in the Statement of Net Assets includes premiums received on certain bond series. The premiums are being amortized over the life of each series and reduce the recorded interest expense. The current portion of Unamortized Premium on Bonds and Capitalized Interest on Parking Bonds, and Unamortized Deferred Costs are reflected in the Statement of Net Assets as Accounts Payable and Accrued Liabilities.
Note Payable $ - $ - $ 1,500,000 $ - Outstanding Bonds Payable 8,021,575 147,700,569 6,048,003 111,792,144
Notes and Bonds Payable $ 8,021,575 $ 147,700,569 $ 7,548,003 $ 111,792,144 Unamortized Premiums on Bonds 378,558 5,898,817 185,837 3,018,948 Capitalized Interest on Parking Bonds 238,425 222,787 231,997 419,344 Unamoritized Deferred Costs (187,579) (1,125,478) - -
Total $ 8,450,979 $ 152,696,695 $ 7,965,837 $ 115,230,436
Long Term Liability
Current PortionJune 30, 2008 June 30, 2007
Current Portion Noncurrent PortionNoncurrent Portion

Notes to Financial Statements
35
Long term bonds outstanding at June 30, 2008, were:
Date of Original Retired OutstandingIssue Issue 2007-2008 June 30, 2008
Parking System Revenue Bonds of 1989:Current Interest, 5.90% to 6.75% 07/01/89 $ 2,905,000 $ - $ - Capital Appreciation, 6.90% 07/01/89 740,942 98,003 177,144
Parking System Revenue Bonds of 2003:Current Interest, 2.00% to 5.00% 08/14/03 3,985,000 65,000 3,740,000 Term Bonds, 4.75% 08/14/03 2,510,000 - 2,510,000
Housing and Dining System RevenueBonds of 2006:
Current Interest, 3.50% to 5.00% 01/19/06 35,425,000 1,190,000 32,970,000
Student Fee Bonds, Series I:Current Interest, 3.25% to 5.20% 01/01/99 38,770,000 8,605,000 13,415,000
Student Fee Bonds, Series K:Current Interest, 4.00% to 4.60% 01/03/02 5,700,000 720,000 2,370,000 Term Bonds, 5.25% to 5.75% 01/03/02 16,275,000 13,510,000 2,765,000
Student Fee Bonds, Series L:Current Interest, 3.00% to 5.50% 07/21/04 16,425,000 815,000 14,320,000
Student Fee Bonds, Series M:Current Interest, 3.00% to 5.00% 12/15/04 19,355,000 730,000 17,915,000 Term Bonds, 3.80% 12/15/04 1,925,000 - 1,925,000
Student Fee Bonds, Series N:Current Interest, 3.50% to 5.00% 01/30/08 63,615,000 - 63,615,000
$ 207,630,942 $ 25,733,003 $ 155,722,144
The principal and interest on bonds are, for the most part, payable from net revenues of specific auxiliary enterprises and/or from student fees.
Future debt service requirements for all bonds outstanding are as follows:
Interest andCapital
Principal Appreciation2009 $ 8,021,575 $ 6,881,959 2010 8,105,569 6,796,380 2011 8,570,000 6,212,233 2012 8,940,000 5,842,872 2013 9,315,000 5,458,325 2014-2018 41,270,000 21,727,063 2019-2023 41,925,000 11,955,224 2024-2028 29,575,000 2,707,177
Total $ 155,722,144 $ 67,581,233
NNoottee GG –– DDeeffeeaasseedd BBoonnddss
Escrow accounts have been established with First Merchants Bank, N.A., Muncie, Indiana to meet all future debt service requirements of certain series of defeased Building Facilities Fee Bonds. The funds held in the escrow accounts are invested in federal, state and local government securities.
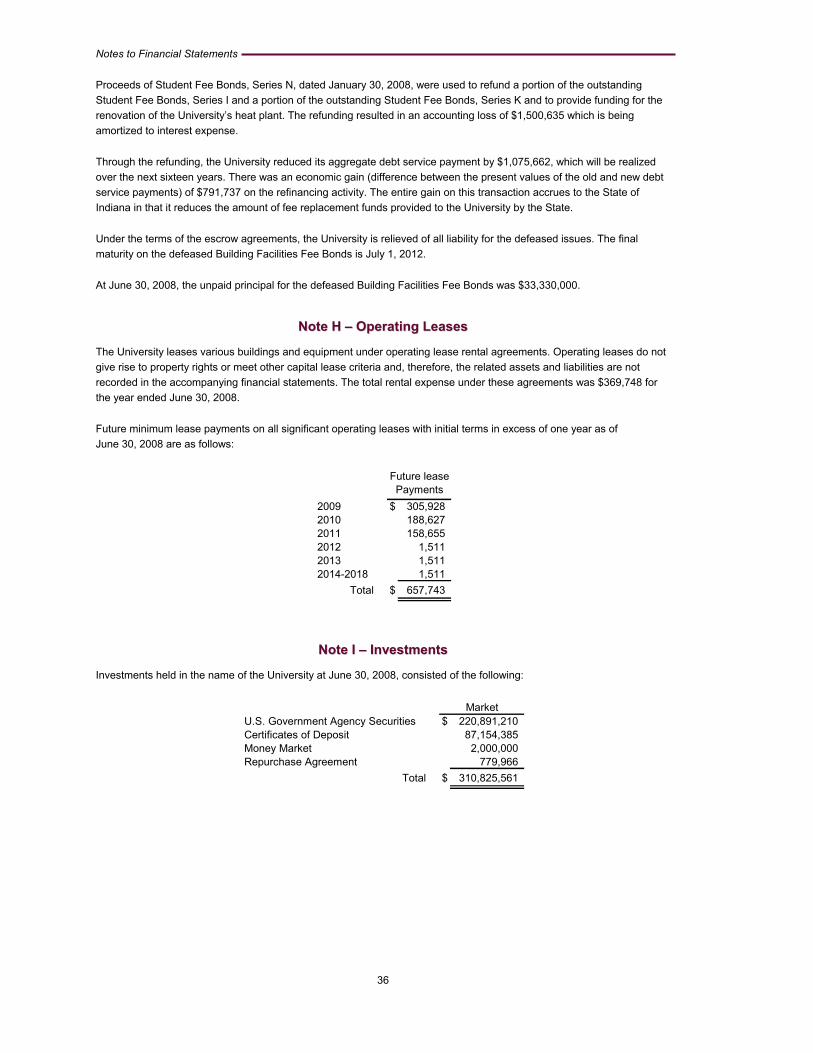
Notes to Financial Statements
36
Proceeds of Student Fee Bonds, Series N, dated January 30, 2008, were used to refund a portion of the outstanding Student Fee Bonds, Series I and a portion of the outstanding Student Fee Bonds, Series K and to provide funding for the renovation of the University’s heat plant. The refunding resulted in an accounting loss of $1,500,635 which is being amortized to interest expense.
Through the refunding, the University reduced its aggregate debt service payment by $1,075,662, which will be realized over the next sixteen years. There was an economic gain (difference between the present values of the old and new debt service payments) of $791,737 on the refinancing activity. The entire gain on this transaction accrues to the State of Indiana in that it reduces the amount of fee replacement funds provided to the University by the State.
Under the terms of the escrow agreements, the University is relieved of all liability for the defeased issues. The final maturity on the defeased Building Facilities Fee Bonds is July 1, 2012.
At June 30, 2008, the unpaid principal for the defeased Building Facilities Fee Bonds was $33,330,000.
NNoottee HH –– OOppeerraattiinngg LLeeaasseess
The University leases various buildings and equipment under operating lease rental agreements. Operating leases do not give rise to property rights or meet other capital lease criteria and, therefore, the related assets and liabilities are not recorded in the accompanying financial statements. The total rental expense under these agreements was $369,748 for the year ended June 30, 2008.
Future minimum lease payments on all significant operating leases with initial terms in excess of one year as of June 30, 2008 are as follows:
2009 $ 305,928 2010 188,627 2011 158,655 2012 1,511 2013 1,511 2014-2018 1,511
Total $ 657,743
PaymentsFuture lease
NNoottee II –– IInnvveessttmmeennttss
Investments held in the name of the University at June 30, 2008, consisted of the following:
MarketU.S. Government Agency Securities $ 220,891,210 Certificates of Deposit 87,154,385 Money Market 2,000,000 Repurchase Agreement 779,966
Total $ 310,825,561

Notes to Financial Statements
37
In compliance with its Investment Policy, Ball State University does not invest in foreign securities and is, therefore, not subject to foreign currency risk. Types of investments held are authorized by the University’s Board of Trustees and comply with applicable state statutes. They may consist of any of the following:
Obligations of agencies of the United States Government. At June 30, 2008, the University held Agency Securities totaling $220,891,210 comprised of the following:
Federal Home Loan Bank $ 96,720,030Federal Home Loan Mortgage Corporation 82,336,350Federal National Mortgage Association 36,872,430Federal Farm Credit 4,962,400
$ 220,891,210
Market
Certificates of deposit and interest-bearing deposit accounts at banks and savings banks incorporated under the laws of Indiana and national banking associations with banking offices in Indiana. At June 30, 2008, the University’s certificates of deposit of $87,154,385 were comprised of:
The Huntington National Bank, Indianapolis, Indiana $ 39,220,850Irwin Union Bank & Trust Co., Columbus, Indiana 30,000,000First Merchants Bank, N.A., Muncie, Indiana 9,271,385Marshal & Ilsley Bank, Indianapolis, Indiana 8,662,150
$ 87,154,385
Market
Money market mutual funds comprised of US Treasury and Agency securities and commercial paper rated A-1 (Standard & Poor’s) or P-1 (Moody’s).
Repurchase agreements collateralized at 105 percent of the par value with United States Treasury and Agency securities.
Types of investments held by the Ball State University Foundation, a component unit, are authorized by the Foundation’s Board of Trustees. They include a broader selection of investments including corporate bonds, common and preferred stocks, private equity, hedge funds, foreign investments and common trusts and mutual funds.
Market values are determined by reviewing quoted market prices. The premium or discount on market securities is amortized or accreted to determine investment value.
All investments owned by the University are held in safekeeping by the issuing or selling bank or in a custodial account with a brokerage firm. The University’s investment policy allows up to 20 percent of the University’s investments to be placed in certificates of deposit and interest-bearing deposit accounts with a single financial institution, and up to five percent with a single issuer of commercial paper.
Cash deposits of $13,029,678, as well as certificates of deposit and interest-bearing deposit accounts are insured by the Federal Deposit Insurance Corporation up to $100,000; amounts exceeding $100,000 are insured by the Indiana Public Depository Fund.
Disclosures Related to Interest Rate Risk
Interest rate risk refers to changes in market interest rates having an adverse effect on the fair value of investments. Generally, the longer the term (life) of an investment, the greater its susceptibility to changes in market interest rates. The University manages its exposure to interest rate risk by purchasing a mixture of short-, intermediate- and long-term investments as a source of funds to meet the cash flow needs of current and future operations of the University.
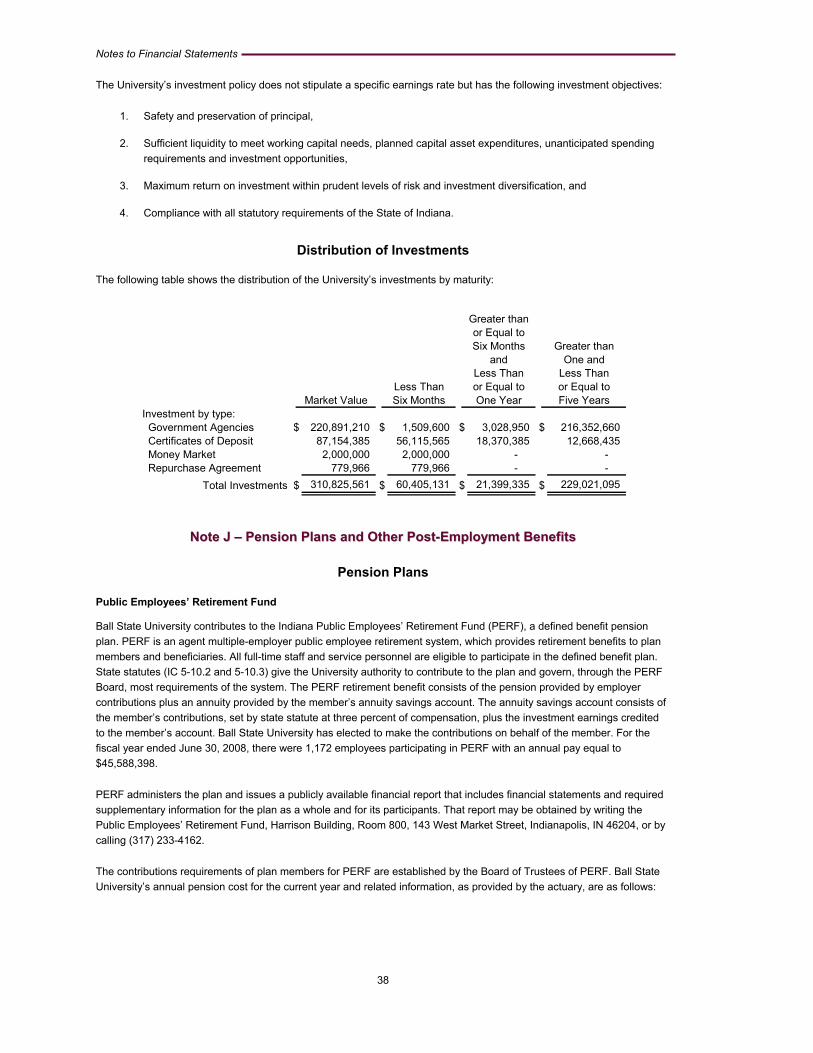
Notes to Financial Statements
38
The University’s investment policy does not stipulate a specific earnings rate but has the following investment objectives:
1. Safety and preservation of principal,
2. Sufficient liquidity to meet working capital needs, planned capital asset expenditures, unanticipated spending requirements and investment opportunities,
3. Maximum return on investment within prudent levels of risk and investment diversification, and
4. Compliance with all statutory requirements of the State of Indiana.
Distribution of Investments
The following table shows the distribution of the University’s investments by maturity:
Investment by type:Government Agencies $ 220,891,210 $ 1,509,600 $ 3,028,950 $ 216,352,660 Certificates of Deposit 87,154,385 56,115,565 18,370,385 12,668,435 Money Market 2,000,000 2,000,000 - - Repurchase Agreement 779,966 779,966 - -
Total Investments $ 310,825,561 $ 60,405,131 $ 21,399,335 $ 229,021,095
Market ValueLess ThanSix Months
Greater than or Equal toSix Months
andLess Than or Equal toOne Year
Greater than One and
Less Thanor Equal toFive Years
NNoottee JJ –– PPeennssiioonn PPllaannss aanndd OOtthheerr PPoosstt--EEmmppllooyymmeenntt BBeenneeffiittss
Pension Plans
Public Employees’ Retirement Fund
Ball State University contributes to the Indiana Public Employees’ Retirement Fund (PERF), a defined benefit pension plan. PERF is an agent multiple-employer public employee retirement system, which provides retirement benefits to plan members and beneficiaries. All full-time staff and service personnel are eligible to participate in the defined benefit plan. State statutes (IC 5-10.2 and 5-10.3) give the University authority to contribute to the plan and govern, through the PERF Board, most requirements of the system. The PERF retirement benefit consists of the pension provided by employer contributions plus an annuity provided by the member’s annuity savings account. The annuity savings account consists of the member’s contributions, set by state statute at three percent of compensation, plus the investment earnings credited to the member’s account. Ball State University has elected to make the contributions on behalf of the member. For the fiscal year ended June 30, 2008, there were 1,172 employees participating in PERF with an annual pay equal to $45,588,398.
PERF administers the plan and issues a publicly available financial report that includes financial statements and required supplementary information for the plan as a whole and for its participants. That report may be obtained by writing the Public Employees’ Retirement Fund, Harrison Building, Room 800, 143 West Market Street, Indianapolis, IN 46204, or by calling (317) 233-4162.
The contributions requirements of plan members for PERF are established by the Board of Trustees of PERF. Ball State University’s annual pension cost for the current year and related information, as provided by the actuary, are as follows:
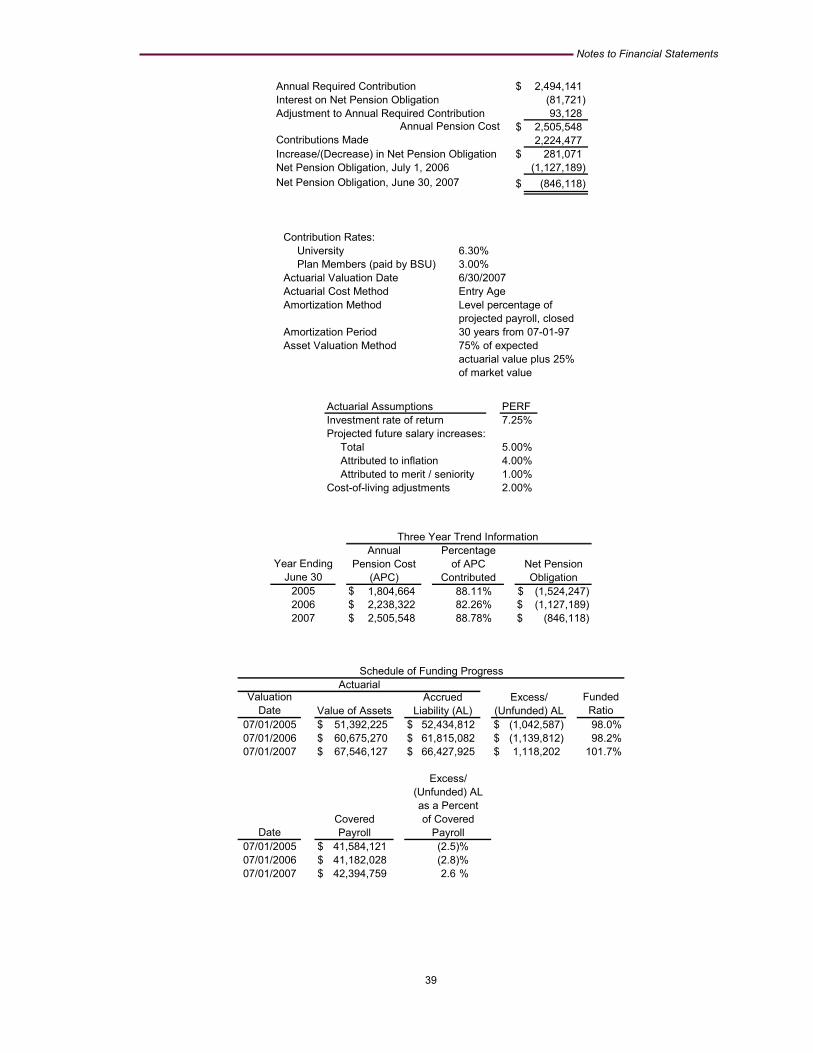
Notes to Financial Statements
39
Annual Required Contribution $ 2,494,141 Interest on Net Pension Obligation (81,721) Adjustment to Annual Required Contribution 93,128
$ 2,505,548 2,224,477
Increase/(Decrease) in Net Pension Obligation $ 281,071 Net Pension Obligation, July 1, 2006 (1,127,189)
$ (846,118)
Annual Pension CostContributions Made
Net Pension Obligation, June 30, 2007
Contribution Rates:University 6.30%Plan Members (paid by BSU) 3.00%
Actuarial Valuation Date 6/30/2007Actuarial Cost Method Entry AgeAmortization Method Level percentage of
projected payroll, closedAmortization Period 30 years from 07-01-97Asset Valuation Method 75% of expected
actuarial value plus 25%of market value
Actuarial Assumptions PERFInvestment rate of return 7.25%Projected future salary increases:
Total 5.00%Attributed to inflation 4.00%Attributed to merit / seniority 1.00%
Cost-of-living adjustments 2.00%
Year EndingJune 30
2005 $ 1,804,664 88.11% $ (1,524,247) 2006 $ 2,238,322 82.26% $ (1,127,189)2007 $ 2,505,548 88.78% $ (846,118)
AnnualPension Cost
(APC)
Percentageof APC
ContributedNet Pension Obligation
Three Year Trend Information
ValuationDate
Funded Ratio
07/01/2005 $ 51,392,225 $ 52,434,812 $ (1,042,587) 98.0%07/01/2006 $ 60,675,270 $ 61,815,082 $ (1,139,812) 98.2%07/01/2007 $ 67,546,127 $ 66,427,925 $ 1,118,202 101.7%
Date07/01/2005 $ 41,584,121 (2.5)%07/01/2006 $ 41,182,028 (2.8)%07/01/2007 $ 42,394,759 2.6 %
Covered Payroll
Schedule of Funding ProgressActuarial
Value of AssetsAccrued
Liability (AL)Excess/
(Unfunded) AL
Excess/(Unfunded) ALas a Percent of Covered
Payroll

Notes to Financial Statements
40
Teachers’ Retirement Fund
The Teachers’ Retirement Fund (TRF) is a cost-sharing, multiple employer public retirement system, which provides retirement benefits to plan members and beneficiaries. All faculty and professional personnel are eligible to participate in the defined benefits plan. State statute (IC 5-10.2) gives the University authority to contribute and governs most requirements of the system. The TRF retirement benefit consists of the pension provided by employer contributions plus an annuity provided by the member’s annuity savings account. The annuity savings account consists of the member’s contributions, set by state statute at three percent of compensation, plus the interest credited to the member’s account. Ball State University has elected to make the contributions on behalf of the member. For the fiscal year ended June 30, 2008, there were 440 employees participating in TRF with annual pay equal to $23,555,776. The University contributes at an actuarially determined rate. The current rate has been actuarially determined under the entry age normal cost method to be 7.25 percent of covered payroll. The University’s contributions to the plan, including those made to the annuity on behalf of the members, for the fiscal years ended June 30, 2008, 2007, and 2006, were $2,419,703, $2,470,540, and $2,637,012, respectively. The University contributed 100 percent of required contributions for each of the fiscal years.
Certain employees who participate in TRF are also eligible for supplementary retirement benefits under a noncontributory plan wherein the employee may designate one or more of the following companies to administer the funds:
ING Financial Advisers, LLC Fidelity Investments Institutional Services Company, Inc. Lincoln Financial Group Teachers Insurance and Annuity Association - College Retirement Equities Fund
The same companies administer the funds in the Alternate Pension Plan which is designed to provide benefits comparable to those under TRF and the supplementary plan.
TRF issues a publicly available financial report that includes financial statements and required supplementary information for the plan as a whole and for its participants. That report may be obtained by writing the Teachers’ Retirement Fund, 150 W. Market Street, Suite 300, Indianapolis, IN 46204, or by calling (317) 232-3860.
Alternate Pension
Faculty and professional personnel of the University have the option, in accordance with IC 21-38-3-3 and IC 21-38-7-3, to participate in a defined contribution plan administered by the same companies as the TRF supplementary retirement contribution. Benefit provisions are established and/or amended by the Ball State University Board of Trustees. The plan purchases individual annuity contracts for members and provides for immediate vesting. The University contributes 12.27 percent of each participating employee’s base salary. For the fiscal year ended June 30, 2008, the University contributed $11,149,775 to this plan for 1,562 participating employees with annual payroll totaling $90,870,209.
Early Retirement Program
Eligible employees may participate in an early retirement program. The plan provides a severance payment equivalent to 15 percent of the employee’s final year’s pay. Such payments are made in the final year of employment; therefore, no liability exists beyond the end of the fiscal year in which employment terminates. The plan also permits participants to select a cash settlement option in lieu of life insurance that is equal to 40 percent of that life insurance. Payment is made in two equal installments on January 31 of the calendar year following the calendar year in which retirement takes place and the next succeeding January 31. As of June 30, 2008, $434,700 is recorded as a liability representing payments to be made in 2009 and 2010 to employees who retired under the program by June 30, 2008.
Other Post-Employment Benefits Retiree Health and Life Insurance Plans
In addition to providing pension benefits, the University, as authorized by the Ball State University Board of Trustees, provides certain health care and life insurance benefits for retired employees. Substantially, all of the University’s regular employees may become eligible for those benefits if they retire from the University after accruing the required years of service (15 years at age 50; ten years at age 60 for those hired before September 1, 1999). As of June 30, 2008, approximately 1,766 participants were eligible and were receiving one or both of these benefits.

Notes to Financial Statements
41
Plan Description
The Ball State University Retiree Health and Life Insurance Plans (Plans) are single-employer defined benefit health and life insurance plans administered by the University. The Plans provide medical, dental, and prescription drug insurance benefits to eligible retirees and spouses and life insurance benefits to eligible retirees. IC 21-38-3-3 assigns authority to the Ball State University Board of Trustees to establish and amend benefit provisions for the University. The Plans issue a publicly available financial report that includes financial statements and required supplementary information for the plans as a whole and for the participants. That report may be obtained by contacting Ball State University, Office of Controller and Business Services, AD 301, Muncie, IN 47306.
Funding Policy
The contribution requirements for members of the Plans are established by the Ball State University Board of Trustees. The required contribution is based on projected pay-as-you-go financing requirements, as well as amounts necessary to prefund benefits as determined annually by the University. In addition, the University has followed a practice of contributing additional amounts generated by savings within the employee plans as well as the retiree plans. For the fiscal year ended June 30, 2008, the University contributed $6,977,806 for current claims and estimated applicable administrative costs and an additional $6,000,000 from Medicare prescription drug subsidies, rebates on prescription drugs, and savings generated within the employee and retiree plans this year and last year, in order to prefund benefits. Plan members receiving benefits contributed $2,482,440, or approximately 25 percent of the total premiums assessed, through their required contributions, which for health insurance ranged, for those not eligible for Medicare, from $87.60 to $259.74 per month for single coverage and $227.42 to $674.28 for family coverage. For those eligible for Medicare, the monthly premiums were $89.72 for medical and prescription drug coverage and $9.22 for optional dental coverage. These premium amounts were also paid by Medicare-eligible spouses for their coverage. Retiree life insurance monthly premiums are on a sliding scale based on coverage in the last year employed, with $37,500 being the maximum amount available for retirees. The monthly premium is $.07 per $1,000 of coverage.
Annual OPEB Cost and Net OPEB Obligation
The University’s annual other postemployment benefit (OPEB) cost is calculated based on the annual required contribution (ARC) of the employer, an amount actuarially determined in accordance with the parameters of GASB Statement 45. The ARC represents a level of funding that, if paid on an ongoing basis, is projected to cover normal cost each year and amortize any unfunded actuarial liabilities (or funding excess) over a period not to exceed 30 years. The following table shows the components of the University’s annual OPEB cost for the fiscal year, the amount actually contributed to the plan, and changes in the University’s net OPEB obligation (asset) to the plan:
Annual required contribution $ 6,208,821 Interest on net OPEB obligation 465,662 Adjustment to annual required contribution -
Annual OPEB cost $ 6,674,483 Contributions made 12,977,806
Increase (decrease) in net OPEB obligation $ (6,303,323) Net OPEB obligation, beginning of year -
Net OPEB obligation, end of year $ (6,303,323)

Notes to Financial Statements
42
The University’s annual OPEB cost, the percentage of the annual OPEB cost contributed to the plan and the net OPEB obligation for 2008 (subsequent financial reports will show two previous years data; not required for 2008 since this is the effective date for GASB Statement 45) were as follows:
Percentage of Annual
Year OPEB CostEnding Contributed
Health Insurance 6/30/2008 $ 6,674,483 194.4% $ (6,303,323) Life Insurance 6/30/2008 $ - - % $ -
Obligation (Asset)Net OPEB Annual
OPEB Cost
Funded Status and Funding Progress
UAAL asValu- a % of ation Funded CoveredDate Ratio Payroll
Health 7/1/07 $ 148,827,822 $ 171,887,451 $ 23,059,629 86.6% $ 136,645,256 16.9 %Life 7/1/07 25,238,907 19,036,901 (6,202,006) 132.6% $ 136,645,256 (4.5)%
Total $ 174,066,729 $ 190,924,352 $ 16,857,623 91.2% $ 136,645,256 12.3 %
(AAL)Value of
AcruedLiability
Payroll
Actuarial
CoveredAAL(UAAL)
Unfunded
Assets
As of June 30, 2007, the most recent actuarial valuation date, the health insurance plan was 86.6 percent funded. The actuarial accrued liability for benefits was $171,887,451, and the actuarial value of assets was $148,827,822, resulting in an unfunded actuarial accrued liability (UAAL) of $23,059,629. The covered payroll (annual payroll of active employees covered by the plan) was $136,645,256, and the ratio of UAAL to covered payroll was 16.9 percent. As of the same date, the life insurance plan was 132.6 percent funded. The actuarial accrued liability for benefits was $19,036,901, and the actuarial value of assets was $25,238,907, resulting in an unfunded actuarial accrued liability (UAAL) of ($6,202,006). The covered payroll (annual payroll of active employees covered by the plan) was $136,645,256, and the ratio of the UAAL to covered payroll was (4.5 percent).
Actuarial valuations of an ongoing plan involve estimates of the value of reported amounts and assumptions about the probability of occurrence of events far into the future. Examples include assumptions about future employment, mortality, and the healthcare cost trend. Amounts determined regarding the funded status of the plan and the annual required contributions of the employer are subject to continual revision as actual results are compared with past expectations and new estimates are made about the future. The Schedule of Funding Progress, presented as required supplementary information following the notes to the financial statements, will present in future reports multiyear trend information about whether the actuarial value of plan assets is increasing or decreasing over time relative to the actuarial accrued liabilities for benefits.
Actuarial Methods and Assumptions
Projections of benefits for financial reporting purposes are based on the substantive plan (the plan as understood by the employer and the plan members) and include the types of benefits provided at the time of each valuation and the historical pattern of sharing of benefit costs between the employer and plan members to that point. The actuarial methods and assumptions used include techniques that are consistent with the long-term perspective of the calculations.
In the June 30, 2007, actuarial valuation, the projected unit credit actuarial cost method was used. The actuarial assumptions included a 7.50 percent investment rate of return (net of administrative expenses), which is the expected long-term investment return on plan assets, and is appropriate as long as the University makes annual contributions (through a combination of benefits paid from general assets and contributions to the VEBA) that are at least as large as the ARC. If the OPEB is “unfunded,” the ARC would be calculated using a discount rate reflective of the University’s internal rates of return, which would result in a significantly larger ARC. The actuarial assumptions also included an annual healthcare cost trend rate initially of nine percent for non-Medicare medical, eight percent for Medicare eligible medical, ten percent for prescription drugs, five percent for dental, and four percent for administrative costs, reduced to an ultimate rate of four percent for administrative costs and five percent for everything else after eight years. A payroll growth rate of four percent is assumed throughout. The actuarial value of the plan assets is market value. The UAAL is being

Notes to Financial Statements
43
amortized as a level percentage of projected payroll on a closed basis. The remaining amortization period at June 30, 2007, was 30 years.
The VEBA trust fund established for the sole purpose of funding future retiree health care had the following activity for the year ended June 30, 2008:
$ 148,827,822 Transfer from Ball State University 6,000,000 Reinvested Net Earnings 14,330,972 Unrealized Gain (Loss) (26,321,660)
$ 142,837,134 Fund Balance at June 30, 2008
Market Value at July 1, 2007
These funds cannot under any circumstances revert to the University.
The Life Insurance Continuance Fund established for the sole purpose of funding future retiree life insurance benefits had the following activity for the year ended June 30, 2008:
Fund Balance at July 1, 2007 $ 25,502,751 Reinvested Net Earnings 1,821,707 Unrealized Gain (Loss) (4,097,939) Death Claims and Related Charges (905,316)
$ 22,321,203 Fund Balance at June 30, 2008
NNoottee KK –– IInncclluuddeedd EEnnttiittiieess
Ball State University operates Burris Laboratory School and the Indiana Academy for Science, Mathematics and Humanities under the direction of the Teachers College. The financial activity for these entities is included in the exhibits.
NNoottee LL –– CCoonnttiinnggeenntt LLiiaabbiilliittyy
The University is presently involved as a defendant or codefendant in various matters of litigation. The University’s administration believes that the ultimate disposition of any of these matters would not have a material adverse effect upon the financial condition of the University.
NNoottee MM –– RRiisskk MMaannaaggeemmeenntt
The University is exposed to risks of loss related to: torts; theft of, damage to, or destruction of assets; errors or omissions; job-related illnesses or injuries to employees; life, health and other medical benefits provided to employees and their dependents; and, long-term disability benefits provided to employees.
The University handles these risks of loss through combinations of risk retention and commercial insurance. For buildings, contents and general liability the risk retention per incident is $100,000. The University retains the entire risk for job-related illnesses or injury to employees, property damage to its auto fleet, and short-term disability. Auto liability, life insurance and long-term disability are handled through fully insured commercial policies. The University retains the risk for its medical benefits.
Separate funds and accounts have been established to measure the results of the various combinations of risk retention and commercial insurance. Periodically (in some cases annually), after reviewing exposures with insurance consultants and actuaries, adjustments are made to reflect potential liabilities arising from risk retention. The University accounts for

Notes to Financial Statements
44
incurred, but not reported, health care claims by calculating an amount based on a review of applicable claims submitted after year end, as well as past experience. This estimated liability was $5.2 million at June 30, 2008. Claims activity for the year was as follows:
Unpaid health care claims at July 1, 2007 $ 5,181,000 Claims incurred 41,144,152 Claims paid 40,345,152
Unpaid health care claims at June 30, 2008 $ 5,980,000

Required Supplemental Information
45
BBaallll SSttaattee UUnniivveerrssiittyy RReeqquuiirreedd SSuupppplleemmeennttaall IInnffoorrmmaattiioonn
JJuunnee 3300,, 22000088
UAAL asa % of
Valuation Funded CoveredDate Ratio Payroll
Health 7/1/07 $ 148,827,822 $ 171,887,451 $ 23,059,629 86.58% $ 136,645,256 16.9 %Life 7/1/07 $ 25,238,907 $ 19,036,901 $ (6,202,006) 132.58% $ 136,645,256 (4.5)%
Covered Payroll
Retiree Health and Life Insurance PlansOther Post-Employment Benefits
Value ofAssets
Accrued Liability (AAL)
Actuarial
AAL (UAAL)Unfunded

Supplemental Information
46
This page intentionally left blank

47
SSuupppplleemmeennttaall IInnffoorrmmaattiioonn
The following supplemental information has not been subjected to the auditing procedures applied to the basic financial statements and accordingly, the
State Board of Accounts expresses no opinion thereon.

Supplemental Information
48
0
4,000
8,000
12,000
16,000
20,000
24,000
84 86 88 90 92 94 96 98 00 02 04 06 08
Off CampusOn Campus
0
4,000
8,000
12,000
16,000
20,000
24,000
84 86 88 90 92 94 96 98 00 02 04 06 08
Graduate
Undergraduate
0
4,000
8,000
12,000
16,000
20,000
24,000
84 86 88 90 92 94 96 98 00 02 04 06 08
Non-ResidentResident
SSttuuddeenntt EEnnrroollllmmeenntt Fall Headcount 1984-2008

Supplemental Information
49
CCaammppuuss EEnnrroollllmmeenntt bbyy CCoouunnttyy Fall 2008
Lake 478
Porter 245
LaPorte186
St. Joseph 460
Elkhart 351
LaGrange 55
Steuben 84
Dekalb 78
Noble 85 Kosciusko
161
Marshall 137Starke
27
Jasper 49 Newton
13
Benton 27
Pulaski 40
Fulton 42
Whitley 66
Allen 791
Adams 116
Wells 102
Hunt- ington 96
Wabash 104 Miami
71 Cass
92 White
57
Carroll 41
Tippecanoe 218
Howard 241
Grant313 Black-
ford 95
Jay 139
Randolph 194
Delaware 1,947
Madison 772
Tipton 79
Clinton 84
Warren 15
Fountain 16 Mont-
gomery 55
Ver
mill
ion
12
Parke 11
Boone 176
Hamilton 1,116
Wayne 209
Henry 345
Hancock 292
Marion 1,508
Hendricks 358 Putnam
51
Vigo 51 Clay
20
Morgan 75
Johnson 291
Shelby 100
Rush 70
Fayette 52
Union 19
Owen 14
Franklin 90 Decatur
74 Barthol-omew 147
Brown 18
Monroe 86 Sullivan
6 Greene 15
Dear- born 103
Ripley 48 Jennings
29Jackson 43 Lawrence
45
Ohio Switzerland
5 Knox 20 Daviess
16
Martin 3
Gibson 10
Pike 6
Dubois 48
Orange 16
Washington 12
Scott 24
Jefferson 48
Posey 23
Van
der
117
Warrick 71 Spencer
27
Perry11
Crawford 2
Harrison 25
Floyd 95
Clark 73
10
-bur
gh
In-State 14,358Out-of-State 2,092International 451Total On-Campus 16,901

Alas
ka1
Haw
aii
5Pu
erto
Ric
o15
US
Citi
zens
Liv
ing
Abro
ad
3
Was
hing
ton
13
Idah
o2
Mon
tana
1O
rego
n3
Wyo
min
g 1
Nor
th D
akot
a3
S
outh
Dak
ota
2
Neb
rask
a8
Min
neso
ta25
Wis
cons
in4 7
Mic
higa
n15
9
Cal
iforn
i a33
Nev
ada
1U
tah
3C
olor
ado
17
Kan
sas
12 Okl
ahom
a 7
Ariz
ona
8
New
M
exic
o 4
Texa
s37
Loui
sian
a
Ark
ansa
s4
Mis
sour
i46
Iow
a10
Illin
ois
441
Indi
ana
14,3
5 8
Ohi
o84
3
Kent
ucky
55
Tenn
esse
e
5Al
abam
a3
Geo
rgia
18
Flor
ida
40
Sou
thC
arol
ina
6
Nor
thC
arol
ina
12
Virg
inia
28
Wes
tVa
.Penn
sylv
ania
42
Ne w
Yor
k28
Verm
ont
3
New
Ham
pshi
re
2
Mai
ne -0- Mas
s.14
13C
onne
ctic
ut
New
Jer
sey
13
Mar
ylan
d24
Del
awar
e 3
11
2
3
In-S
tate
14,3
58O
ut-o
f-Sta
te2,
092
Inte
rnat
iona
l45
1To
tal O
n-C
ampu
s 1
6,90
1
D.C
. 11
R.I.
2
Mis
s-is
sipp
i
50
CCaa mm
pp uuss
EEnn rr
oo llll mm
ee nntt bb
yy SS
tt aatt ee
Fa
ll 20
08
Supplemental Information

51
020406080100
120
140
160
180
200
97-98
98-99
99-00
00-01
01-02
02-03
03-04
04-05
05-06
06-07
07-08
Rem
issi
on o
f Fee
s
Stu
dent
Em
ploy
men
t
Sch
olar
ship
s, G
rant
s, &
Aw
ards
Loan
s
SStt uu
dd eenn tt
FFii nn
aa nncc ii
aa ll AA
ss ssii ss
tt aann cc
ee 19
97-9
8 th
roug
h 20
07-0
8 (in
milli
ons
of d
olla
rs)
Supplemental Information
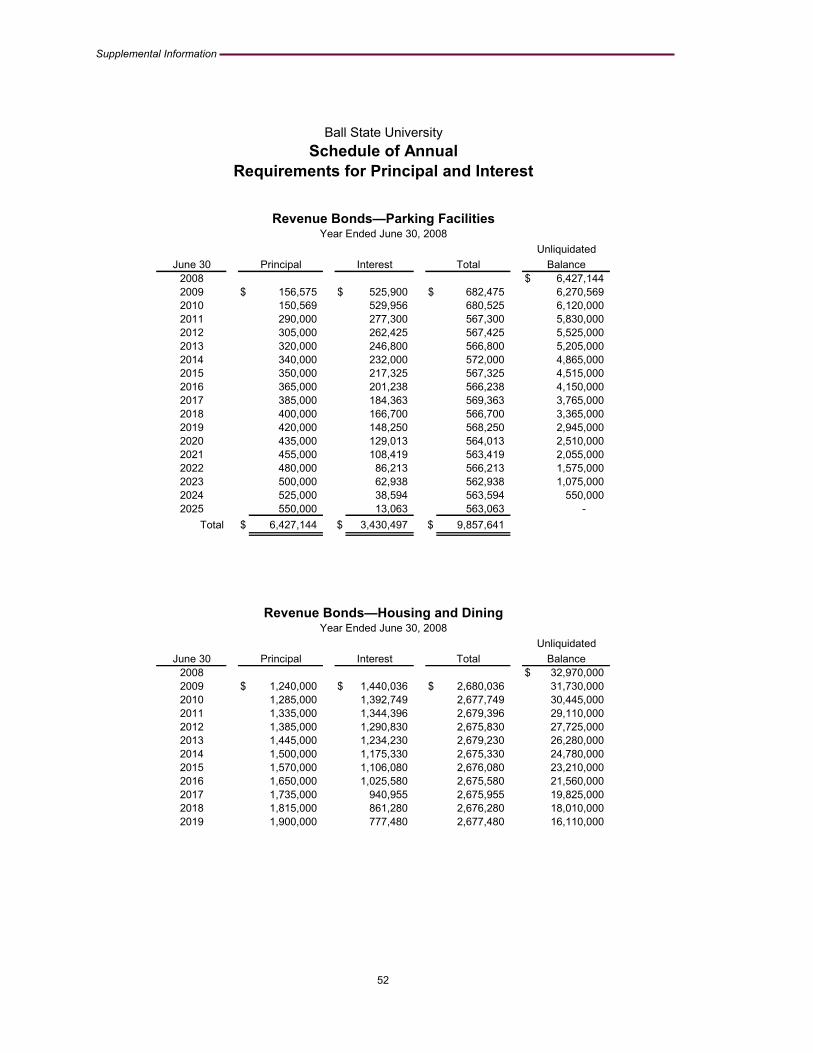
Supplemental Information
52
Revenue Bonds—Parking FacilitiesYear Ended June 30, 2008
UnliquidatedJune 30 Principal Interest Total Balance
2008 $ 6,427,144 2009 $ 156,575 $ 525,900 $ 682,475 6,270,569 2010 150,569 529,956 680,525 6,120,000 2011 290,000 277,300 567,300 5,830,000 2012 305,000 262,425 567,425 5,525,000 2013 320,000 246,800 566,800 5,205,000 2014 340,000 232,000 572,000 4,865,000 2015 350,000 217,325 567,325 4,515,000 2016 365,000 201,238 566,238 4,150,000 2017 385,000 184,363 569,363 3,765,000 2018 400,000 166,700 566,700 3,365,000 2019 420,000 148,250 568,250 2,945,000 2020 435,000 129,013 564,013 2,510,000 2021 455,000 108,419 563,419 2,055,000 2022 480,000 86,213 566,213 1,575,000 2023 500,000 62,938 562,938 1,075,000 2024 525,000 38,594 563,594 550,000 2025 550,000 13,063 563,063 -
Total $ 6,427,144 $ 3,430,497 $ 9,857,641
Revenue Bonds—Housing and DiningYear Ended June 30, 2008
UnliquidatedJune 30 Principal Interest Total Balance
2008 $ 32,970,000 2009 $ 1,240,000 $ 1,440,036 $ 2,680,036 31,730,000 2010 1,285,000 1,392,749 2,677,749 30,445,000 2011 1,335,000 1,344,396 2,679,396 29,110,000 2012 1,385,000 1,290,830 2,675,830 27,725,000 2013 1,445,000 1,234,230 2,679,230 26,280,000 2014 1,500,000 1,175,330 2,675,330 24,780,000 2015 1,570,000 1,106,080 2,676,080 23,210,000 2016 1,650,000 1,025,580 2,675,580 21,560,000 2017 1,735,000 940,955 2,675,955 19,825,000 2018 1,815,000 861,280 2,676,280 18,010,000 2019 1,900,000 777,480 2,677,480 16,110,000
Ball State UniversitySchedule of Annual
Requirements for Principal and Interest

Supplemental Information
53
Revenue Bonds—Housing and DiningYear Ended June 30, 2008
UnliquidatedJune 30 Principal Interest Total Balance
2020 $ 1,990,000 $ 688,190 $ 2,678,190 $ 14,120,000 2021 2,085,000 594,275 2,679,275 12,035,000 2022 2,190,000 487,400 2,677,400 9,845,000 2023 2,300,000 375,150 2,675,150 7,545,000 2024 2,410,000 267,944 2,677,944 5,135,000 2025 2,515,000 164,794 2,679,794 2,620,000 2026 2,620,000 55,675 2,675,675 -
Total $ 32,970,000 $ 15,222,374 $ 48,192,374
Student Fee BondsYear Ended June 30, 2008
UnliquidatedJune 30 Principal Interest Total Balance
2008 $ 116,325,000 2009 $ 6,625,000 $ 4,916,022 $ 11,541,022 109,700,000 2010 6,670,000 4,873,674 11,543,674 103,030,000 2011 6,945,000 4,590,537 11,535,537 96,085,000 2012 7,250,000 4,289,617 11,539,617 88,835,000 2013 7,550,000 3,977,295 11,527,295 81,285,000 2014 7,460,000 3,665,140 11,125,140 73,825,000 2015 6,985,000 3,377,619 10,362,619 66,840,000 2016 5,885,000 3,122,514 9,007,514 60,955,000 2017 5,280,000 2,863,876 8,143,876 55,675,000 2018 5,550,000 2,587,063 8,137,063 50,125,000 2019 5,840,000 2,295,913 8,135,913 44,285,000 2020 6,140,000 1,994,845 8,134,845 38,145,000 2021 6,455,000 1,681,613 8,136,613 31,690,000 2022 5,235,000 1,393,075 6,628,075 26,455,000 2023 5,500,000 1,132,450 6,632,450 20,955,000 2024 5,765,000 863,063 6,628,063 15,190,000 2025 4,325,000 619,088 4,944,088 10,865,000 2026 4,540,000 401,476 4,941,476 6,325,000 2027 3,090,000 214,738 3,304,738 3,235,000 2028 3,235,000 68,744 3,303,744 -
Total $ 116,325,000 $ 48,928,362 $ 165,253,362
Ball State UniversitySchedule of Annual
Requirements for Principal and Interest
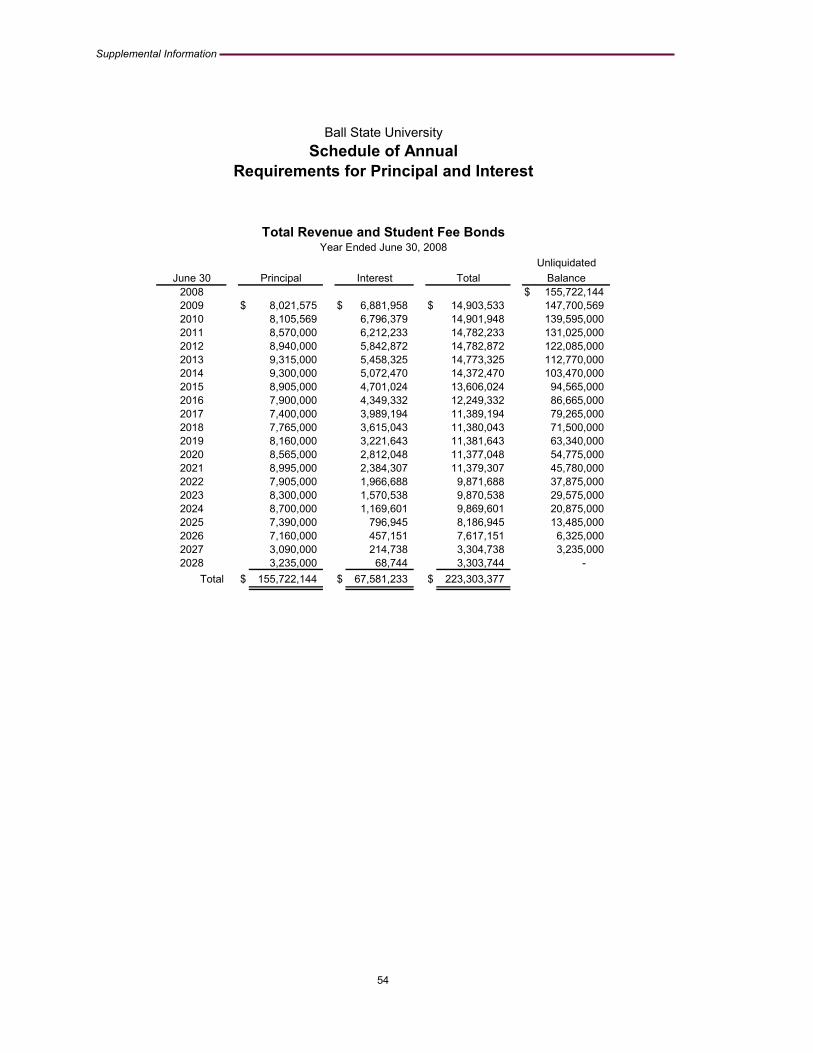
Supplemental Information
54
Total Revenue and Student Fee BondsYear Ended June 30, 2008
UnliquidatedJune 30 Principal Interest Total Balance
2008 $ 155,722,144 2009 $ 8,021,575 $ 6,881,958 $ 14,903,533 147,700,569 2010 8,105,569 6,796,379 14,901,948 139,595,000 2011 8,570,000 6,212,233 14,782,233 131,025,000 2012 8,940,000 5,842,872 14,782,872 122,085,000 2013 9,315,000 5,458,325 14,773,325 112,770,000 2014 9,300,000 5,072,470 14,372,470 103,470,000 2015 8,905,000 4,701,024 13,606,024 94,565,000 2016 7,900,000 4,349,332 12,249,332 86,665,000 2017 7,400,000 3,989,194 11,389,194 79,265,000 2018 7,765,000 3,615,043 11,380,043 71,500,000 2019 8,160,000 3,221,643 11,381,643 63,340,000 2020 8,565,000 2,812,048 11,377,048 54,775,000 2021 8,995,000 2,384,307 11,379,307 45,780,000 2022 7,905,000 1,966,688 9,871,688 37,875,000 2023 8,300,000 1,570,538 9,870,538 29,575,000 2024 8,700,000 1,169,601 9,869,601 20,875,000 2025 7,390,000 796,945 8,186,945 13,485,000 2026 7,160,000 457,151 7,617,151 6,325,000 2027 3,090,000 214,738 3,304,738 3,235,000 2028 3,235,000 68,744 3,303,744 -
Total $ 155,722,144 $ 67,581,233 $ 223,303,377
Ball State UniversitySchedule of Annual
Requirements for Principal and Interest

Supplemental Information
55
This page intentionally left blank