state bank of pakistan · year, the bank carried out thematic inspections of internal credit risk...
TRANSCRIPT
STATE BANK OF PAKISTAN
ANNUAL PERFORMANCE REVIEW
FY2016-17
Our Vision
To be an independent and credible central bank that achieves
monetary and financial stability and inclusive financial sector
development for the long-term benefit of the people of Pakistan
Our Mission
To promote monetary and financial stability and foster a sound
and dynamic financial system, so as to achieve sustained and
equitable economic growth and prosperity in Pakistan

The Team
Mr. Saleem Ullah [email protected]
Mr. Tanweer Ahmed [email protected]
Mr. Inzar Gul [email protected]

1
Contents
Governor’s Review
1
Governance Structure 7
1 Enhancing Effectiveness of Monetary Policy
17
1.1 Monetary Policy Stance in FY17
17
1.2 Money and Debt Market
18
1.3 Foreign Exchange Reserve Management
18
1.4 Home Remittances
19
1.4 Research
20
1.5 Economic Analysis / Publications
21
1.6 Data Management System
21
2 Payments Systems
23
2.1 Payment Systems Performance
23
2.2 Major Developments in Payment Systems
27
2.3 Improving efficiency of Government Receipts and Payments
28
2.4 Implementation of Currency Management Strategy 30
2.5 Going Forward 31
3 Strengthening Financial System Stability and Effectiveness 33
3.1 Institutionalization of Financial Stability Framework 33
3.2 Progress toward Risk-Based Supervision Framework
35
3.3 Strengthening Regulatory Framework 36
3.4 Supervisory Initiatives
38
3.5 Enhancements in SBP’s Conduct Regulation and Supervision Regime 39
3.6 International Cooperation in Banking Supervision
39
4 Broadening Access to Financial Services
41
4.1 National Financial Inclusion Strategy (NFIS)
41
4.2 Agricultural Finance 44
4.3 Microfinance
45
4.4 Small and Medium Enterprises (SMEs) Finance
46
4.5 SBP Refinance Facilities
48
4.6 Housing Finance
48
4.7 Infrastructure Finance and Green Banking
49
5 Islamic Banking
51
5.1 Overview
51
5.2 Initiatives for Promotion of Islamic Banking during FY17
51
5.3 Liquidity Management Solutions for Islamic Banking Industry
53
5.4 Awareness and Capacity Building Programs
53
5.5 Global Participation 54

State Bank of Pakistan Annual Report FY17
6 Institutional Strengthening 55
6.1 HR Developments 55
6.2 Strengthening IT Systems 57
6.3 Enterprise Risk Management (ERM) 58
6.4 Business Continuity Management 59
6.5 Risk Based Audit Function 60
6.6 Legal Services Function 60
6.7 SBP Library 60
6.8 Effective External Relations 61
6.9 Museum & Art Gallery 62
7 SBP Subsidiaries 65
7.1 SBP Banking Services Corporation (SBP-BSC) 65
7.2 National Institute of Banking and Finance (NIBAF) 68
8 Financial Performance 71
8.1 Overview 71
8.2 Income 72
8.3 Expenditure 73
8.4 Net Profit 74
8.5 Balance Sheet Summary 74
9 Consolidated Financial Statements of SBP and its Subsidiaries 77
10 Unconsolidated Financial Statements of SBP 135
11 Financial Statements of SBP-BSC (Bank) 185
12 Financial Statements of NIBAF 211
13 Financial Statements of PSPC 233
Annexure
A Chronology of Important Policy Announcements 1
A-1 Banking Policy & Supervision Group 1
A-2 Development Finance Group 2
A-3 Financial Market/Reserve Management Group 2
A-4 Operations and Financial Resource Management Group 3
B Organizational Chart 5
C Management Directory 7

1
Governor’s Review
I am honored to present the SBP Performance Review for FY17, during which the economy witnessed
numerous positives and some key challenges particularly in the external sector. The growth
momentum further strengthened during the year with the growth rate surpassing 5 percent mark (5.3
percent) for the first time in last 10 years. The investment to GDP ratio improved to15.8 percent; the
credit off take by the private sector registered strong growth of over 67 percent, inflation at 4.2
percent remained well below the target of 6 percent. The external sector however remained under
stress with imports surpassing USD 50 billion for the first time, exports and remittances registering
negative growth and trade and current account deficit increasing to USD 32 billion and USD 12
billion respectively. The SBP kept a close watch on these developments and took measures and policy
actions to help the economy maintain the growth momentum while ensuring price stability.
The low inflation environment enabled us to continue with the accommodative monetary policy
stance and keep the policy rate unchanged at 5.75 percent. The accommodative monetary policy
coupled with improvement in overall business environment and energy availability and upswing in
CPEC projects, etc fueled credit demand, causing credit off take by the private sector to grow by over
67 percent. The improvement in the growth of deposits and relatively lesser government borrowing
from banks also contributed in the private sector credit growth. The country’s financial markets also
exhibited stability during the year with the overnight interest rate hovering around the policy rate and
KIBOR averaging around 6.1 percent. The SBP closely monitored the liquidity and interest rate
movements in the market and intervened as and when needed to implement its monetary policy
stance. The constitution of an independent Monetary Policy Committee (MPC) in 2015 has enhanced
the independence and credibility of the monetary policy formulation process. During the year, we also
started publishing the minutes of the MPC meetings, which has further improved transparency and
credibility of the process besides enabling the market to better appreciate SBP’s stance on the
country’s overall economic conditions generally and the monetary policy particularly.
On the external front, while exports declined by 1.6 percent to USD 20.4 billion, imports grew by
18.7 percent to USD 53 billion. The import growth however, can be significantly attributed to
machinery imports both for CPEC and non CPEC energy and infrastructure projects as well as for
BMR projects in textile sector. The completion of these projects in the short to medium term will
further augment the growth momentum besides generating export surpluses. The Home remittances
declined marginally to USD 19.3 billion from USD 19.9 billion last year, which can largely be
attributed to the continued weakening of economies of Saudi Arabia, Middle East and UAE in the
wake of sharp decline in oil prices during last 3 years. It can also partly be attributed to increased
disclosure requirements in the US with resultant increase in compliance costs and sharp depreciation
of the British Pound against the US Dollar after Brexit. The decline in remittances was contained due
to the proactive role of PRI in facilitating expats in remitting funds back home to their families.
The challenges faced on the external front resulted in decline of about USD 2 billion in our foreign
exchange (FX) reserves, which reduced to USD 21 billion at the close of the year. The SBP owns
about three fourth of the country’s FX reserves whereas one fourth are owned by commercial banks.

State Bank of Pakistan Annual Report FY17
2
A large bulk of the SBP’s reserves is being managed in house whereas a small portion is with external
fund managers. Keeping in view the developments in international financial markets particularly the
US market, SBP gradually increased its allocation to short term US treasuries as yields on US
treasuries improved. Further, to diversify the investment portfolio and improve yields without
increasing the investment risk, the investment in Islamic Sukuks was enhanced. The yield on the FX
portfolio increased to 0.85 percent in FY17 as compared to 0.79 percent in FY16 while maintaining
the overall risk profile of the portfolio i.e. low risk (mostly against AAA rated sovereigns) and highly
liquid.
The SBP vision 2020 envisages strengthening of the financial stability regime and improving the
efficiency and effectiveness of the financial system. The passage of the Deposit Protection Act by
parliament during the year plugged a major gap in our financial stability framework. This has paved
the way for the establishment of a Deposit Protection Corporation (DPC) as an SBP subsidiary. The
SBP Board has also approved an initial investment of Rs500 million in the DPC equity. The DPC will
commence its operations in FY18 after constitution of its Board by the Federal Government. To
further strengthen the financial stability regime, the SBP signed a Letter of Understanding (LoU) with
the Securities and Exchange Commission of Pakistan (SECP) to establish a Council of Regulators to
mitigate systemic risk covering the broader spectrum of the financial sector. The Council will provide
a forum for deliberating issues related to systemic risk, particularly those having cross market and
stability implications, and will suggest arrangements necessary for a coordinated response against the
crisis. Besides the Council of Regulators, work is also underway for the establishment of an
overarching National Financial Stability Council (NFSC) comprising SBP, SECP and Ministry of
Finance to discuss and resolve systemic issues.
In order to optimally utilize supervisory resources, we are moving towards Risk Based Supervision
(RBS), which is a forward looking approach for assessment of risks and control functions in financial
institutions. The development of the requisite architecture for RBS is under process; draft
methodologies for identification of significant risks and assessment of control functions have been
developed, which are being currently tested for assessing their effectiveness. The thematic inspections
initiated since 2015 are part of the drive to move towards risk based supervision system. During the
year, the Bank carried out thematic inspections of internal credit risk rating systems of banks,
customers’ risk profiling, transaction monitoring systems, human resource practices, business model
and credit risk assessment of DFIs and the Exchange Companies’ systems and capacity to manage the
risk of money laundering. These reviews/inspections have enabled the Bank to better assess industry
wide risks in these areas and effective requisite controls in place to mitigate risks.
On the regulatory front, to improve corporate governance in banks/DFIs, comprehensive guidelines
on performance evaluation of the Board members were issued in line with international standards and
best practices on corporate governance. The Bank also issued guidelines on governance and
remuneration practices of the Boards and senior management of banks/DFIs to make them more
accountable and responsible and align their compensation with risk adjusted performance in a fair and
transparent manner. Similarly, to provide an enabling regulatory environment for managing risks
associated with the use of technology, instructions for technology governance and risk management in
financial institutions were issued. Further to ensure Fair Treatment of Consumers by the banks,
Conduct Assessment Framework (CAF), a self assessment conduct monitoring tool for banks, MFBs
and DFIs was issued. CAF will also serve as a conduct monitoring tool for SBP to gather conduct
related data, address the gaps and maintain risk profiles of the banks.

Governor’s Review
3
Improving financial inclusion has been the hall mark of the SBP’s financial system deepening and
broadening strategy. Under the National Financial Inclusion Strategy (NFIS) launched in 2015, the
Asaan Mobile Account (AMA) Scheme was initiated which provides an integrated platform to digital
financial service providers to open digital transaction account of any person having a basic mobile
phone. The Branchless Banking (BB) regulations were also amended allowing opening of accounts
through biometric devices. The initiative has been a huge success with over 87 percent increase in
Branchless Banking Accounts during the year. We also launched the National Financial Literacy
Program (NFLP) to enhance financial literacy of the target groups i.e. farmers, MSEs (Micro and
Small Enterprises), students, etc. Agriculture Finance, which is the major pillar of SBP’s financial
inclusion strategy, continued expanding with disbursements to the sector crossing Rs 700 billion mark
for the first time in the country’s history. Encouragingly, the outreach of agricultural finance also
increased to 3.27 million farmers during the year from 2.40 million last year. The expansion of
agriculture finance outreach during the year could among others also be attributed to Government of
Punjab E-Credit scheme for the farmers, which was designed and implemented with our active
support and facilitation.
The SBP has been playing a leading role in the promotion and development of the Islamic finance
industry in the country. The Bank’s efforts and contributions in the development of the industry has
national and international recognition. In a major development during the year, the Federal
Government accepted SBP’s long outstanding recommendation and provided tax neutrality to Islamic
banking institutions (IBIs) and their customers through Finance Bill 2017. This will ensure a level
playing field for both conventional and Islamic finance banks and their clients; earlier it was skewed
more in favor of conventional finance which was one of the key issues that had constrained its growth
in the past. The Bank is also working with the industry and the Government to ensure regular issuance
of Sukuks. It has also been absorbing some of the liquidity of IBIs through Bai Muajjal (credit sale)
of Government Ijarah Sukuk; during the year Rs 24.6 billion was absorbed through this mode.
Further, to encourage risk sharing modes of financing (Musharakah, Mudarabah and Wakalah), the
Bank during the year exempted IBIs from the requirement of using KIBOR as a benchmark rate in the
pricing of such products.
The development of a robust Payments System is amongst the strategic objectives envisaged in the
SBP vision 2020. While the work is underway for the development of a National Payment System
Strategy, the Bank during the year signed an agreement with the World Bank to seek its technical and
financial support for the development of a National Payments Gateway (NPG). The Bank is also
working actively with Federal and Provincial Governments to automate Government payments and
receipts, which constitute a significant part of the country’s payment system. Last year, the Bank had
facilitated the Punjab Government in launching its flagship E-Stamping project, whereas during the
current year necessary support was extended to the Sindh Revenue Board to initiate online collection
of taxes. Similarly, the Bank has partnered with the FBR to initiate online collection of FBR taxes and
customs duty. The project is at an advanced stage and is most likely to be operational by December
2017. Further to automate the Government payments and gradually eliminate cheques from the
government payments, the Bank is working with AGPR and CGA to directly credit funds in the
beneficiaries’ accounts through RTGS. The pilot for this project is expected to be completed during
FY18 in Islamabad after which it will be gradually rolled out across the country.
Despite the speedy growth being witnessed in the digitization of payment and settlement systems,
cash transactions are going to stay in the foreseeable future, particularly in a cash denominated
economy like ours. We have thus actively pursued automation of the cash processing functions both
in the Central Bank and the banking industry to ensure issuance of machine authenticated cash to the

State Bank of Pakistan Annual Report FY17
public. The first phase of Currency Management Strategy launched in 2015, was implemented during
the year whereby banks started disbursing machine authenticated banknotes (Rs500 and above) in 30
big cities. These cities host 73 percent of banks’ branches, 71 percent of ATMs and 88 percent of
deposits. In the second phase from January 2018, the banks shall issue machine authenticated
banknotes of Rs 100 and above through their branches and ATMS across the country. The SBP during
the year also started issuing higher denomination banknotes (Rs500 and above) with enhanced
security features and improved look and feel. Further, during the year the old design banknotes of Rs
10, 50, 100 and 1000 were demonetized after approval by the Federal Government. These banknotes
ceased to be legal tender with effect from December 1, 2016. However, the SBP-BSC offices will
continue to exchange these banknotes till December 31, 2021. The Bank during the year also acquired
the banknote and prize bonds printing business of Pakistan Security Printing Corporation from the
Federal Government. The acquisition has enabled us to have effective and enhanced control over the
full spectrum of banknote printing function, which was necessary considering the critical and
strategic importance of banknotes for the Bank.
We are also investing heavily in our HR and IT systems to enhance the HR skills mix and improve the
technological infrastructure as envisaged in Vision 2020. Training and development has been a key
element of our strategy to hire and maintain a suitably trained and motivated workforce. During the
year, over 1000 officers were imparted training in functional, managerial and leadership areas at
NIBAF and reputed training institutes and business schools in the country including LUMS, IBA, and
PIMS. We have also started sending our middle and senior management officials to Federal
Government Training Programs for civil servants in Lahore and Karachi. Further, 224 officers were
sent on foreign training in different funded and unfunded programs to give them exposure to the
developments being made in central banking policies, practices, systems, etc. The workforce
rationalization project has also been initiated to objectively assess the manpower needs for
undertaking the assigned functions and strategic goals.
In order to strengthen the IT infrastructure, several initiatives have been taken including up-gradation
of application software and IT systems, automation of business process and implementation of
security protocols / policies. While the up-gradation of RTGS and Globus currency was successfully
completed during the year, the upgrade of Globus Banking is in process and will be completed in the
near future. The Bank has well defined institutional arrangements for Business Continuation Plans
(BCP), which are periodically tested to assess their capacity and readiness to respond to the crisis
situations. Similarly a robust and state of the art DR site is functional to continue the time sensitive
critical functions in case of disasters. A comprehensive assessment of IT security was made and
changes in IT governance and access control systems, etc were made where necessary.
The development of a robust Enterprise Risk Management (ERM) Framework is also at an advanced
stage, which would enable the Bank to assess, measure and mitigate the risks associated with its
mandate and functions. The Board has approved the ERM Framework, which would align risk
assessment process with modern techniques and make it more objective. To foster the risk culture and
enhance capacity of the Bank’s employees in ERM, multiple training sessions on ERM were
arranged. Further, two rounds of Risk Control and Self Assessment (RCSA) exercises were completed
through bottom up approach for risk identification, analysis, prioritization and mitigation in the Bank
and its subsidiaries. An Incident Reporting Policy has also been introduced and enforced across the
organization for prompt reporting of control weaknesses to trigger remedial actions.
Lastly, I wish to express my thanks and gratitude to my predecessor Mr. Ashraf Mahmood Wathra
and SBP Board of Directors under whose leadership the Bank made remarkable progress towards
4

Governor’s Review
5
achieving its strategic goals. I would also like to express my deepest appreciation of the senior
management team and the staff of SBP who worked tirelessly to realize the organizational goals. The
institutional capacity and a culture of professionalism built over the years give me optimism for even
more improvement in the Bank’s performance in the years to come.
Tariq Bajwa
Governor/Chairman
October 30, 2017

7
Governance Structure
The State Bank of Pakistan (SBP) is governed under the SBP Act, 1956, which gives the Bank the
authority to function as the central bank of the country. The Act mandates the Bank to regulate the
monetary and credit system of Pakistan and to foster economic growth in the best national interest
with a view to securing monetary stability and to maximize utilization of the country’s productive
resources.
Board of Directors
The SBP is governed by a Board of Directors, which is responsible for the general supervision and
direction of the affairs of the Bank, other than the functions assigned to the Monetary Policy
Committee. The ten-member Board is chaired by the Governor SBP and comprising of eight non-
executive Directors and the Federal Secretary Finance. Non-executive members of the Board are
appointed by the Federal Government for a period of 3 years, under Section 9(2)(c) of the SBP Act,
1956. The Governor is also the Chief Executive Officer and manages the affairs of the Bank. Seven
meetings of the Board were held during FY17. One vacant position on the Board emerged consequent
to resignation of Mr. Zafar Masud in August 2016.
Executive Management The Governor being the Chief Executive heads the executive management. He is assisted by one or
more Deputy Governors. In addition to the Governor and Deputy Governors, the management
hierarchy includes Executive Directors, Chief Economic Advisor and departmental heads.
(Organogram is placed at Annexure-B).
The Governor The Governor is appointed by the President of Pakistan for a term of three years which is renewable
once. During the year, Mr. Ashraf Mahmood Wathra completed his 3 year term as Governor on April
28, 2017 and Mr. Riaz Riazuddin, Deputy Governor (Policy) was appointed as Acting Governor till
appointment of the Governor. Subsequently, Mr. Tariq Bajwa, the present Governor, was appointed
on July 7, 2017 for a 3 year term.
Deputy Governors The Governor is assisted by one or more Deputy Governors (DGs) appointed by the Federal
Government for a period not exceeding five years. Presently, Mr. Riaz Riazuddin and Mr. Jameel
Ahmad are serving as Deputy Governors since March 30, 2015 and April 11, 2017 respectively.
Mr. Jameel Ahmad was serving as Executive Director (Banking Supervision Group) before assuming
responsibilities as DG. Earlier, Mr. Saeed Ahmad remained Deputy Governor till March 2017. He
was reappointed after completing his first term as DG on January 21, 2017, but he resigned after his
appointment to another government institution.

State Bank of Pakistan Annual Report FY17
8
Board of Directors1
Mr. Tariq Bajwa, Governor, Chairman Board of Directors and Chairman Monetary Policy Committee
A career civil servant by profession, Mr. Bajwa joined the Civil Service of Pakistan in 1981 and
assumed various Secretariat, Field and Staff assignments, including, among others, General Manager
PIA, Head of Pakistan's Trade Mission in Los Angeles, and Advisor Finance to the United Nations
Development Program (UNDP). Mr. Bajwa also served as Chairman, FBR for over 2 years till October,
2015 before his appointment as Secretary, Economic Affairs Division. His last assignment as Civil
Servant was Secretary Finance from where he retired on June 18, 2017. He holds a Master's degree in
Public Administration from Kennedy School of Government, Harvard University, where he was
awarded the prestigious Littauer Fellowship, and an LLB from the University of the Punjab, Lahore.
Mr. Shahid Mahmood (Member, SBP Board since June 19, 2017)
Secretary, Finance Division, Government of Pakistan and ex-officio member of the
SBP Board. Mr. Mahmood has served as Additional Secretary (External Finance)/
Special Assistant to Finance Minister, Special Secretary, Finance Division, and
Principal Secretary to the Chief Minister, Punjab. He holds a Master’s degree in
English Literature from Government College, Lahore, and a Bachelor’s degree in
Economics & Statistics from the same institution.
Dr. Tariq Hassan (Member, SBP Board since March 22, 2016)
Attorney and Advocate, Supreme Court of Pakistan and Chairman, Audit Oversight
Board. Dr. Hassan is a former Chairman, Securities and Exchange Commission of
Pakistan, and previously has also served as advisor to the Finance Minister of
Pakistan. He has also been associated as legal Counsel with the World Bank in
Washington, DC, International Fund for Agriculture Development in Rome, and
Shearman & Sterling in New York. In addition to practicing law, he has been
teaching law as an adjunct professor at George Washington University and Fletcher
School of Law & Diplomacy, USA; and Departments of Law at LUMS University
and International Islamic University, Pakistan. He did his PhD in Juridical Science
from Harvard University, USA.
Hafiz Mohammad Yousaf (Member, SBP Board since March 22, 2016)
A Chartered Accountant by profession with professional experience of over 30
years. He has served as Member SECP Board and President, Institute of Chartered
Accountants of Pakistan, besides holding other important responsibilities. He is
Fellow member of Institute of Chartered Accountants of Pakistan (FCA).
1 Board Composition is as of June 30, 2017.

Governance Structure
9
Mr. Zubyr Soomro (Member, SBP Board since March 22, 2016)
Educated at the London School of Economics and SOAS, Zubyr Soomro has been a
career international banker with over 30 years at Citibank with assignments in the
Middle East, Turkey, UK and Pakistan. In 1997 he was appointed as Chairman and
President of United Bank and tasked with restructuring it for Privatisation after
which he stayed on to head Citibank’s Pakistan franchise. He has been Chairman /
President of Pakistan Banks Association, American Business Council and OICCI.
Currently he is the Chairman of the Pakistan Microfinance Investment Company
and on the Boards of Acumen, Grameen Foundation USA, EFG Hermes, LRBT and
Aitchison College and a Member of the Finance Minister’s Economic Advisory
Council.
Khawaja Iqbal Hassan (Member, SBP Board since March 22, 2016)
A seasoned banker who established a commercial bank and a leading investment
banking firm, with 35 years’ experience in the financial sector. He is serving on the
Boards of prominent public and private enterprises. He has also served on many
Task Forces established by the Government of Pakistan. Mr. Hassan was awarded
the Sitara-i-Imtiaz for his meritorious contributions to national interest.
Mr. Ardeshir Khursheed Marker (Member, SBP Board since March 22, 2016)
A businessman by profession, Mr. Ardeshir Khursheed Marker is partner and
Director at Green Bean Coffee Company Ltd. He is also a partner in Merck Marker
Pvt. Ltd. and manages its financial and business development areas. Mr. Marker
holds a Masters Degree in Economics from the London School of Economics.
Mr. Mohammad Riaz (Member, SBP Board since March 22, 2016)
A public servant of long standing, Mr. Mohammad Riaz has served as Secretary,
National Assembly of Pakistan. He has successfully undertaken various
assignments at the Federal Board of Revenue in the capacity as Member, Director
General and Head of the Customs & Excise. Mr. Riaz has also served as Counsel
General of Pakistan at Turkey and Commercial and Economic Counselor at
Embassy of Pakistan in France. He holds a Masters Degree in Development
Economics from Williams College, USA.
Mr. Sarmad Amin (Member, SBP Board since March 22, 2016)
A progressive entrepreneur and a businessman, Mr. Sarmad Amin is a member of
Lahore Chamber of Commerce and Industry (LCCI) and All Pakistan Textile Mills
Association (APTMA). He has remained Vice President of LCCI and member
Executive Committee of APTMA. Presently, Mr. Amin is Chairman of Samin
Textiles Limited besides being member of the Boards of several conglomerates. He
is also honorary Consul of the Republic of Austria for Pakistan. He graduated from
the University of the Punjab, Lahore.
Corporate Secretary The Corporate Secretary is the Secretary to the Board, Committees of the Board and the Monetary
Policy Committee (MPC) and acts as a focal person for communication between the Board and the
management. The position is responsible for recording the proceedings of the meetings of the Board

State Bank of Pakistan Annual Report FY17
10
its Committees and MPC and ensuring compliance with statutory and regulatory requirements for
effective implementation of the Board’s decisions.
The Corporate Secretary is also responsible for ensuring effective Corporate Governance standards
and availability of relevant information to the Board and MPC members to facilitate informed
decision-making. In addition to the responsibilities of organizing meetings of the Board, its
Committees and MPC, the Corporate Secretary interfaces with the Federal Government on matters
related to the Governor, Deputy Governors, Directors of the Board and External Members of the
MPC.
Monetary Policy Committee (MPC) The Monetary Policy Committee is an independent, statutory body responsible for formulating the
Monetary Policy. The MPC consists of ten members, with the Governor as Chairman, three members
of the Board nominated by the SBP Board, three senior executives of the SBP nominated by the
Governor, and three external members (economists) appointed by the Federal Government on the
recommendation of the SBP Board. The external members are appointed for a term of three years.
Present composition of the MPC includes Mr. Tariq Bajwa, Governor SBP as Chairman MPC,
Mr. Khawaja Iqbal Hassan, Mr. Mohammad Riaz and Mr. Ardeshir Khursheed Marker, members SBP
Board. Dr. Asad Zaman, Dr. Qazi Masood Ahmad and Dr. Aliya Hashmi Khan are the three external
members whereas Mr. Riaz Riazuddin Deputy Governor (Policy), Mr. Jameel Ahmad Deputy
Governor (Banking & FMRM) and Mr. Inayat Hussain - Executive Director (FS & BSG) are the three
executive members of MPC. The Committee met six times during FY17.
Brief profiles of external members of the MPC are as follows:
Dr. Asad Zaman (Member, MPC since January 25, 2016)
[BS Math MIT (1974), Ph.D. Econ Stanford (1978)] has taught at leading
universities like Columbia, U. Penn., Johns Hopkins, Cal. Tech. and Bilkent
University, Ankara. Currently he is Vice Chancellor of Pakistan Institute of
Development Economics. His textbook Statistical Foundations of Econometric
Techniques (Academic Press, NY, 1996) are widely used as a reference in
advanced graduate courses. He is managing editor of International Econometric
Review and Pakistan Development Review. His publications in top ranked journals
like Annals of Statistics, Journal of Econometrics, Econometric Theory, Journal of
Labor Economics, etc. have over 1000 citations as per Google Scholar.
Dr. Qazi Masood Ahmed (Member, MPC since January 25, 2016)
Professor and the Director, Centre for Business and Economic Research, Institute
of Business Administration (IBA), earlier also served the institute as the
Chairperson, Centre for Executive Education (CEE). Other current assignment
includes member Tax Advisory Council, the Federal Board of Revenue,
Government of Pakistan and member, Board of Governor, Sindh Education
Foundation. Dr Qazi also served Government of Sindh as its Chief Economist for
two years. His research and teaching experience is spread over 25 years and he has
published over 50 papers in international and national journals. Additionally, he
also served the Applied Economics Research Centre, University of Karachi and
Social Policy and Development Centre for more than fifteen years.
Governance Structure
11
Dr. Aliya Hashmi Khan (Member, MPC since March 22, 2016)
Ex-Professor of Economics and Dean Faculty of Social Sciences at Quaid e Azam
University. Dr. Aliya Hashmi Khan has research interests in the areas of Macro
Economics, Labor Economics and HR Development. She has been contributing as
Director/ Member on Boards of several organizations and advisory bodies. She has
been awarded the President’s Medal in 2010 for services rendered in the economic
empowerment of women.
Committees of the Board Committees of the Board extend the oversight function of the Board in certain specialized areas. The
details of the Committees of the SBP Board are summarized as under:
Committee on Audit The Committee assists the Board in reviewing SBP’s financial statements, auditing, accounting and
related reporting processes, the system of internal controls, governance, business practices and
standards of conduct established by the management and the Board. The Committee met seven times
during the year. It is chaired by Hafiz Mohammad Yousaf, with M/s Khawaja Iqbal Hassan, Ardeshir
Khursheed Marker and Sarmad Amin as members.
Committee on Investment
The Committee assists the Board in fulfilling its oversight responsibilities relating to management of
foreign exchange reserves. It reviews the strategy and policy for management of the reserves; and
approves operational guidelines for investment, appointment of asset managers, custodians,
investment consultants, among other matters. It also reviews the performance of the foreign exchange
reserves managed in-house and externally, and the appropriateness of the approved investment policy,
its benchmarks and guidelines on an annual basis or as warranted by the global market conditions.
The Committee met three times during the year. It is chaired by Mr. Shahid Mahmood, with
M/s Khawaja Iqbal Hassan and Sarmad Amin as members.
Committee on Human Resources The Committee assists the Board in reviewing and approving HR policies prepared by the
management. It reviews all the proposals requiring approval of the Board on formulation, revision,
modification or interpretation of HR policies, and submits its recommendations to the Board. The
Committee also reviews the terms and conditions of employment of senior level Bank officers
including those reporting directly to the Governor. The Committee met four times during the year. It
is chaired by Mr. Zubyr Soomro, with Mr. Mohammad Riaz as member.
Publications Review Committee (PRC)
Publications Review Committee of the Board assists the Board in the review and approval of the
Annual and Quarterly Reports on the State of the Pakistan Economy, Annual Performance Review of
SBP, and the Financial Stability Review. The Committee deliberates on the said draft reports and
reviews them for the consideration and final approval of the Board. The Committee met six times
during the year. It is chaired by Mr. Ardeshir Khursheed Marker, with Mr. Mohammad Riaz as
member.
Enterprise Risk Management Committee
The Committee assists the Board in fulfilling the oversight responsibilities with respect to risk
management in the Bank. The Committee also reviews and approves Bank’s risk management policy,
provides an ongoing input to management, monitors the Bank’s risk profile and its potential exposure

State Bank of Pakistan Annual Report FY17
12
to different risks. The Committee also coordinates, when required, with the ERM Committee of the
management and with other Committees of the Board. The Committee is also mandated to oversee
risks emerging from the subsidiaries until such time that the subsidiaries set up their own ERM
framework. The Committee met four times during the year. It is chaired by Khawaja Iqbal Hassan,
with Mr. Zubyr Soomro and Dr. Tariq Hassan as members.
Financial Law Reform Committee (FLRC) The Committee assists the Board in proposing a cohesive and comprehensive legal framework,
reflecting the principles of financial regulatory authorities as practiced globally and applicable in the
domestic environment. Besides formulating its recommendations regarding amendments in the legal
framework, the Committee also takes into account comments and observations of the various
departments on inconsistencies and anomalies in the legal framework. The Committee met eight times
during the year. It is chaired by Dr. Tariq Hassan, with Hafiz Mohammad Yousaf as member.
Corporate Management Team (CMT) and CMT-HoDs forum The Corporate Management Team (CMT) serves as the principal forum for discussion and
consultation on critical management and operational issues. It facilitates decision making and their
implementation, especially in matters where several departments are involved. The CMT is headed by
the Governor and comprising of Deputy Governors and Executive Directors, as well as Managing
Directors of the SBP subsidiaries i.e. SBP-BSC, NIBAF, PSPC and DPC. In addition to the CMT,
combined meetings of the CMT and the Heads of Departments (HoDs) provide a broader platform to
deliberate issues of wider implications. Depending on the agenda, HoDs of SBP-BSC are also invited
to attend the meetings.

Governance Structure
13
Corporate Management Team (CMT)2
Mr. Tariq Bajwa
Governor
Mr. Riaz Riazuddin
Deputy Governor
(Policy)
Mr. Jameel Ahmad
Deputy Governor
(Banking & FMRM)
Syed Irfan Ali
Executive Director (BPRG)
Mr. Inayat Hussain
Executive Director (FRM, FS & BSG)
Syed Samar Hasnain
Executive Director (DFG)
Mr. Muhammad Ali
Malik Executive Director
(FMRM)
Dr. Saeed Ahmed
Executive Director (MPRG &
HR)/
Chief Economist
Mr. Amjad Manzoor
Executive Director/CIO
Mr. Mohammad Mansoor Ali
Director OCS/ Corporate
Secretary
Mr. Amer Aziz
Managing Director
(NIBAF)
Mr. Qasim Nawaz
Managing Director (SBP-BSC)
Mr. Muhammad Haroon
Rasheed Malik
Managing Director (PSPC)
Ms. Lubna Farooq
Managing Director (DPC)
2 CMT Composition as of September 29, 2017

State Bank of Pakistan Annual Report FY17
14
Management Committees In addition to the CMT, following are the major management committees which assist the Governor
in making decisions and in formulation of various policies:
Banking Policy Committee
Monetary Operations Committee
Budget Committee of Management
Business Continuity Planning Committee
Data Warehouse Committee
Derivatives Approval & Review Team
Strategic Plan Steering Committee
Enterprise Risk Management Committee
Investment Committee of Management
Library Committee
Management Committee on Information Technology
Management Committee on Properties and Equipment
Payment Systems Policy Committee
Publications Review Committee
Refund Committee (Export Refund Committee)
Financial Stability Executive Committee
Sports Committee
SBP Subsidiaries The SBP Act, 1956 (as amended) provides for the establishment of subsidiaries for managing
functions like receipt, supply, and exchange of currency notes and related operational functions, to
protect small depositors in case a bank cease to be a going concern and for training and development
needs of its employees etc. In line with these provisions, SBP holds four subsidiaries, including the
State Bank of Pakistan-Banking Services Corporation (SBP-BSC), National Institute of Banking and
Finance (NIBAF), Pakistan Security Printing Corporation (PSPC) and Deposit Protection Corporation
(DPC).
SBP-BSC
Established under the SBP-BSC Ordinance 2001, SBP-BSC is a fully owned subsidiary of SBP with
the mandate to perform tasks such as currency management, facilitating the inter-bank settlement
system, and sale/purchase of savings instruments of the Government on behalf of National Savings
Organization. Additionally, SBP-BSC collects revenue and makes payments for and on behalf of the
Government as well as carrying out operational work relating to development finance, management of
public debt, foreign exchange operations and export refinance. The Board of Directors of SBP-BSC,
chaired by the Governor SBP, comprises all members of the SBP Board and the Managing Director of
SBP-BSC.
NIBAF
National Institute of Banking and Finance (NIBAF) is the training arm of SBP with the mandate to
develop, design and conduct training and capacity building programs for the employees of SBP and
SBP-BSC. The subsidiary also conducts international courses on central and commercial banking in
collaboration with the Federal Government. Further, NIBAF also conducts training programs for
banks and financial institutions.
Governance Structure
15
Pakistan Security Printing Corporation (PSPC)
The PSPC is a new addition in the SBP family. It was acquired during the year from the Federal
Government to have full control over the full spectrum of banknote printing function. The core
mandate and function of PSPC is to print banknotes and prize bonds as per the indent raised by SBP.
The Bank during the year constituted its Board and appointed its Managing Director. The Governor is
the Chairman of PSPC Board, whereas DG (Policy), MD BSC and ED Financial Resource
Management, JS Internal Finance are the Board members.
Deposit Protection Corporation (DPC)
DPC has been established under the Deposit Protection Corporation Act of 2016 as a wholly owned
subsidiary of State Bank of Pakistan. It will provide the much needed “safety net” to the small
depositors and thus plug a major gap in our financial stability regime. The DPC will initiate an
explicit deposit insurance scheme, the membership of which shall be mandatory for all banking
companies operating in the country including Islamic banks. The insurance premium to be collected
from banking companies shall be the major source of fund for DPC to protect/payback small
depositors in case of failure of their bank. While the appointment of the DPC Board is under process
with the Federal Government, the Bank has appointed its MD. The DPC will be made operational
after constitution of its Board.

17
1 Enhancing Effectiveness of Monetary Policy
1.1 Monetary Policy Stance in FY17 The SBP followed an accommodative policy stance in FY17 and kept the policy rate unchanged at
5.75 percent. This policy stance was largely assisted by favorable macroeconomic conditions albeit
some external sector pressures due to decline in both exports and workers’ remittances. Hence, with
the overarching objective of price stability, the policy stance assisted and strengthened economic
recovery process along with stability in financial and foreign exchange markets.
The accommodative monetary policy stance along with improvement in law and order and energy
situation led to healthy growth of over 67 percent in credit off take by the private sector enabling the
economy to grow by 5.3 percent, the highest in last 10 years. From demand side, private sector credit
benefited from historic low interest rates, strengthening aggregate demand, growing momentum of
CPEC-related projects, improved energy supplies, and relatively higher public sector developmental
expenditures. From supply side, improvement in the growth of banks’ deposit and less government
borrowing from banks enhanced banks’ lending capacity.
The stable policy rate coupled with SBP’s money market operations helped to contain volatility in the
money market overnight repo rate. This stability also translated into market interest rates as well. The
daily average yields on 3-month, 12-month MTBs and 3-year PIBs remained around 5.92 percent,
5.97 percent and 6.40 percent respectively in FY17. This trend also transmitted somewhat to 6-month
Karachi Interbank Offer Rate (KIBOR) which stayed around 6.10 percent on average during the same
period.
1.1.1 Monetary Policy Committee
The Monetary Policy Committee (MPC) regularly met during the year to review and deliberate on
SBP’s monetary policy stance within the overall macroeconomic conditions and their projections.
Trade-offs between conflicting objectives were thoroughly reviewed through empirical as well as
technical analyses and forward looking decision making approach gained further importance. The
Bank during the year started posting proceedings of the MPC meetings along-with the voting pattern
on its website. The publications of the proceedings improved transparency and credibility of
monetary policy formulation process, enabled the market to better appreciate the SBP monetary
policy stance and facilitated aligning market expectations besides improving monetary policy
transmission mechanism.
1.1.2 Roadmap for Adoption of Flexible Inflation Targeting
The SBP Strategic Plan 2016-2020 envisages implementation of flexible inflation targeting regime.
For this purpose, a road map is being prepared which would delineate the requisites steps involved in
moving towards a flexible inflation targeting regime. The roadmap would also highlight the main
questions to be addressed in adopting inflation targeting. Finally, a detailed report would be prepared
with recommendations on different aspects of the flexible inflation targeting regime. The Key aspects
of FIT being researched include:
Choice of suitable nominal anchor for flexible inflation targeting (FIT) regime
Optimal range of inflation to target in the FIT regime
Monetary policy communication in FIT regime

State Bank of Pakistan Annual Report FY17
18
1.2 Money and Debt Market The SBP conducts regular Open Market Operations (OMOs) to implement its monetary policy stance
and keep the money market overnight repo rate close to the SBP target rate i.e. “Policy Rate”. As a
result of timely interventions by the Bank, the volatility in the money market overnight repo rate
reduced significantly; the standard deviation of the overnight repo rate reduced to 0.19 in FY17 from
0.42 in FY16. Further, significant reduction in maintenance of excess cash reserves by banks was also
witnessed during the year, which is indicative of better utilization of available liquidity. The banks’
recourse to SBP’s Corridor facilities also reduced significantly during the year to 44 times from 73
times last year, reflecting improved liquidity management by banks and SBP.
1.2.1 SLR Reduction for Islamic Banks
The infrequent issuance of Sukuk by the Government during last 3 years has resulted into a significant
decline in the supply of Sukuk making it difficult for Islamic Banks (IBs) to comply with the
Statutory Liquidity Requirements (SLR). The maturity of GOP Bai-Muajjal of Rs 225 billion in
November 2016 further reduced the pool of SLR eligible securities for IBs. In the absence of SLR
eligible securities, IBs would have to keep cash for maintaining their SLR which could have adversely
impacted their competitiveness. Accordingly, the SLR for IBs was reduced from 19 percent to 14
percent with effect from November 17, 2016.
1.2.2 Successful completion of IMF EFF Program
The IMF’s Extended Fund Facility (EFF) program was successfully completed during the year with
SBP playing a vital role both in negotiations and achieving quantitative targets of NIR, NDA,
forward/SWAP transactions and other structural benchmarks set under the EFF.
1.3 Foreign Exchange Reserve Management
Global financial markets were marked by a great deal of uncertainty in FY17 due to a number of
unexpected political developments especially US electing Trump, UK voting to leave EU, a closely
fought election in France and a constitutional referendum in Italy. All these political events were a
challenge to the prevailing global economic policy environment of fiscal austerity combined with un-
conventional monetary policies and led to a high degree of uncertainty to the future path of economic
growth and policies. The shift in sentiments – especially in the U.S. after the presidential election –
along with the improved global data and the prospect for a move away from unconventional monetary
policy and fiscal austerity to monetary policy normalization and fiscal stimulus led many market
observers to believe that the U.S. economy is about to pivot to a new paradigm. The US Federal
Reserve in particular was prompted to increase the pace of rate hikes implementing three rate hikes
since Trump’s election.
In line with the overall principles of safety, liquidity and return and keeping in mind the current
market conditions, SBP gradually increased its allocation to short term US treasuries, which proved
beneficial as yields on US treasuries improved. SBP also continued with its policy of investment
diversification to include higher yielding instruments without increasing the investment risk as well as
enhancing the investment in Islamic Sukuk.

Enhancing Effectiveness of Monetary Policy
19
Box 1.1: Initiatives Taken to Improve Effectiveness of Foreign Exchange Regime During FY17
The Parliament passed the amendments in Foreign Exchange Regulation Act (FERA), 1947 proposed by SBP
empowering SBP to impose monetary penalties on its regulatees for violation of foreign exchange
rules/regulations. It will enable SBP to more effectively administer the foreign exchange business of
authorized dealers and exchange companies in Pakistan.
Capacity building of authorized dealers, exchange companies and law enforcement agencies in collaboration
with Institute of Bankers Pakistan and National Institute of Banking and Finance is being done on continuous
basis. So far around 1500 officials have been given training in foreign exchange rules and regulations at
different locations across the country.
In order to facilitate stakeholders and to strengthen monitoring of import payments from Pakistan, SBP and
Pakistan Customs have developed Electronic Import Form (EIF) module in Pakistan Customs’ Web Based
system WeBOC. The project has successfully been implemented and is operational since September, 2016.
The permissible offshore accounts of resident entities were brought under SBP regulatory ambit. The
registration/acknowledgment procedures of capital account transactions of private sector were simplified
along with segregation of China Pakistan Economic Corridor (CPEC) projects in order to establish a database
of foreign exchange obligations. These instructions will also enable SBP in effective assessment of foreign
exchange implications of CPEC.
In order to promote the culture of documentation, the regulatory due diligence of export of securities
(Issue/Transfer) to non-resident investors against their investment into Pakistan (FDI-Inward) was enhanced.
The instructions will also facilitate real investors and discourage money launderers to channelize their funds as
foreign investment in Pakistan.
In view of peculiar nature of trade with Afghanistan through land routes, especially through Torkham and
Chaman borders, banks have been allowed to register contracts of the Pakistani importers and make payments
there against, as and when required, through a more liberalized mechanism in terms of which routing of
transport documents has been allowed directly from exporter to importer, without involving exporter’s or
importer’s bank.
The foreign portfolio investment through banking channel was further streamlined during the year whereby
non-resident portfolio investors were allowed to use their funds in Special Convertible Rupee Account to meet
margin requirements of ready/cash market transactions in Pakistan Stock Exchange. The foreign investors
have also been permitted to pledge their unencumbered securities in favor of National Clearing Company of
Pakistan to meet such margins till settlement of respective transactions.
Exchange Companies are required to submit various reports/returns to SBP according to their scope of
business. In order to facilitate Exchange Companies and enhance integrity of reporting of data, an integrated
reporting system has been implemented to enable Exchange Companies to submit comprehensive data to SBP
through web based online system.
1.4 Home Remittances During FY17, Home remittances declined by 3.1 percent to USD 19.3 billion as compared to USD
19.9 billion in the preceding year. The fall in home remittances was recorded for the first time since
FY04. This decline is mainly attributed to the following factors:
A sharp decline in oil prices appears to be the most significant factor as home remittances
from Middle East fell by 5.1 percent to US Dollar 12.1 billion in FY17 compared with US
Dollar 12.8 billion in the preceding year. Consequently, the share of home remittances from
Middle East declined to 62.7 percent in FY17 from 64.0 percent in FY16. Qatar is the only
Middle Eastern country which posted positive growth of 6.2 percent in remittances to
Pakistan during the year.

State Bank of Pakistan Annual Report FY17
20
Increased disclosure requirements and subsequent increase in compliance costs in USA led to
a fall in home remittances by 3.2 percent in FY17. Specifically, home remittances declined
from US Dollar 2.5 billion in FY16 to US Dollar 2.4 billion in FY17.
Home remittances from UK to Pakistan declined by 9.4 percent during FY17 mainly due to a
sharp depreciation in British Pound against US Dollar (i.e. 12.3 percent) after the
announcement of Brexit to end-June 2017. This suggests that if adjusted for depreciation,
remittances from UK have actually increased in British Pound terms.
Money Service Businesses (MSBs) in UK and Australia are facing problems in transferring
funds due to closure of bank accounts as banks adopted wholesale de-risking policy. MSBs
without a bank account have to share their income with other entities for transferring their
funds.
Box 1.2: Initiatives Taken for Growth of Home Remittances
Pre Departure Briefings: PRI in coordination with Bureau of Emigration & Overseas Employment
(BE&OE), 3 commercial banks and one microfinance bank is conducting a financial training program at
Protectorate of Emigrant Offices. All seven Protectorate Offices throughout the country are participating in the
project. The main objective of this program is to create awareness amongst intended emigrant workers
regarding sending remittances through formal channels and to accelerate the process of financial inclusion.
IBAN Account Number: PRI in collaboration with SBP and commercial banks is promoting use of
International Bank Account Number (IBAN) format by the remitters and beneficiaries to enhance efficiency
and reduce instances of remittance not reaching beneficiaries due to incomplete/incorrect account numbers.
PRI Call Center Infrastructure Enhancement: In order to further expedite the home remittance complaint
resolution process, PRI call center automation enhancement and integration was initiated during the year; it
would be completed and made operational by December 2017.
Increase in Outreach: New domestic financial institutions have been included for payment of remittances.
The network of ZTBL branches has started payments of home remittances under an agreement with a bank.
Similarly, the network of FINCA Microfinance Bank and NRSP Microfinance Bank entered in home
remittance business. As far as overseas outreach is concerned, domestic financial institutions have made over
36 new agency arrangements with overseas tie ups in FY17 including New Zealand.
1.5 Research The SBP continued conducting research on key macroeconomic issues and challenges faced by the
country. Forecasts from the SBP’s Forecasting and Policy Analysis System (FPAS) for Pakistan were
prepared, which are used by the Monetary Policy Committee of the Bank while approving the
monetary policy statement every 2 months. The FPAS model provided scenario analysis for real
interest rate, real exchange rate, manufacturing production and inflation.
Research relating to the extension of Dynamic stochastic general equilibrium (DSGE) and Forecasting
and Policy Analysis System (FPAS) models continued during the year by considering government and
external sectors, in collaboration with Professor Dr. Ehsan Choudhri (of Carleton University, Canada)
under the aegis of International Growth Center (IGC) Pakistan. Further, a valuable theoretical
contribution was made by developing a Fully Modified HP Filter, which is an important tool for
business cycle estimation with reduced end point bias (SBP Working Paper 88).
After successfully completing the first phase of the Management and Organizational Practices Survey
(MOPS) in Punjab, the second phase was launched, during the year, to extend the survey across the

Enhancing Effectiveness of Monetary Policy
21
country in collaboration with Pakistan Bureau of Statistics and the London School of Economics. This
study will help to assess important aspects of management practices, like data-driven and
decentralized decision making, by manufacturing firms in the country. Such awareness is necessary to
take decision about required policy intervention(s) to improve firm’s level productivity in Pakistan.
As per practice the 21st Zahid Husain Memorial Lecture was organized in December 2016. Professor
Timothy John Besley, the W. Arthur Lewis Professor of Development Economics and Political
Science at London School of Economics, UK, delivered the lecture. He highlighted the role of state
capacities as drivers of economic growth. A video documentary on the history of SBP was also
played before the lecture to highlight the role of Mr. Zahid Husain, the first governor and founder of
SBP, in formation of SBP and others services rendered by him for the nation. Government officials,
federal secretaries, faculty members of various universities and bankers attended the lecture.
SBP also organized two seminars under Pakistan and World Economy Series: one by Professor Dr.
Ehsan Choudhri (of Carleton University, Canada) and other by Dr. Andrei Zlate of Federal Reserve
Bank of Boston, USA. SBP also published 13 working papers during the year contributed by officers
in monetary policy and research cluster of the Bank. The 12th Volume of the SBP Research Bulletin
was also released during this year.
1.6 Economic Analysis / Publications
The SBP publishes its flagship quarterly and annual reports on the state of Pakistan economy that
provide in-depth analysis of economic trends, issues and challenges. During FY17, these reports
covered a wide array of subjects. For instance, the increasingly dominant role of consumption in GDP
growth was analyzed and its implications on private investment evaluated. Similarly, the main
challenges faced by the food industry were discussed, which included the presence of informal
players, inefficiency of supply chains, and the small land holding by majority of farmers. With
regards to the external sector, the widening discrepancy between the import data provided by Pakistan
Bureau of Statistics (PBS) and SBP, and the steps SBP was undertaking to improve the reporting of
import and external financing data (to minimize the discrepancy and increase the accuracy of Balance
of Payment data), were highlighted in one of our quarterly reports. Moreover, SBP provided analytical
and data support for relevant sections of the Economic Survey of Pakistan 2016-17, published by the
Ministry of Finance.
In the Annual Report for FY16, a thematic chapter on social sector developments was included. The
chapter provided a detailed analysis of developments and progress in Pakistan’s social sector
indicators – comprising population and demographics, health, education, poverty, income inequality,
and government spending on social sectors – from the year 2000 onwards. The country’s relative
progress in social indicators under the Millennium Development Goals (MDG) framework was also
discussed. The chapter was widely covered in the print media, with academics and social scientists
largely appreciating the quality and depth of the analysis. On the fiscal side, the gaps in taxation
system and the need for structural reforms were highlighted. Moreover, post-18th Amendment fiscal
federalism issues including the increasing responsibility of provinces for greater revenue
mobilization, especially from agriculture and services sectors, were highlighted. Similarly, the
importance and ways of increasing savings through National Savings Schemes (NSS) and the need to
manage contingent liabilities were discussed in detail.
1.7 Data Management System As envisaged in SBP Vision 2020, all major statistics are compiled according to the international
standards and most of the data compilation processes at SBP are automated. The balance of payments

State Bank of Pakistan Annual Report FY17
22
statistics, monetary statistics, flow of funds accounts and debt statistics are compiled according to the
guidelines of the relevant manuals prepared by the international agencies such as IMF, UN, World
Bank. The statistics being produced by SBP are used for analysis, research and policy formation
within and outside SBP by various stakeholders.
Further a number of improvements in data compilation and dissemination were made during the year
including the following:
Augmentation of availability of BOP data series as per guidelines of Balance of Payments and
International Investment Position Manual of the IMF, sixth edition (BPM6). To fulfill the
requirements of researches, a comparable time series data for undertaking meaningful
analysis has been made available.
Started Compiling Government Domestic Debt data as per Public Sector Debt Guide 2013 of
IMF. This has brought our debt statistics in line with the international standards.
Work on compilation of rent and price index of commercial properties was initiated for the
first time in Pakistan. Field surveys for collection of the required data are in progress; the
indices will be compiled on half-yearly basis. The indices will help to investigate the behavior
of commercial properties market and will be used to monitor the evolution of property prices
over time. The indices will allow buyers and sellers to estimate values of commercial
properties at a particular point of time.
Enhanced the coverage of monetary statistics under the guidelines of MFSM 2008 to fulfill
the requirements of Special Data Dissemination Standard (SDDS) and General Data
Dissemination Standard (GDDS) and to adopt international standards.
Compilation of Flow of Funds Accounts according to SNA 2008 was started to adopt the
latest international guidelines for compilation of Flow of funds accounts.

23
2 Payment System
SBP has been playing a leading role in development of National Payment Systems architecture and
infrastructure as the Regulator, Operator and Facilitator. Development of a modern and robust
payment system is an important strategic goal of SBP Vision 2020. Under this goal SBP is developing
the National Payment System strategy, modernizing the clearing and settlement infrastructure for
reducing cost, improving efficiency, enhancing security, and strengthening its regulatory and
supervisory oversight.
In Pakistan, a number of critical financial market infrastructures, including payment systems, have
been developed over the years. The major ones are i) the Pakistan Real-time Interbank Settlement
Mechanism (PRISM) - which is the RTGS system of Pakistan; ii) National Institutional Facilitation
Technologies (NIFT) for Clearing of Paper instruments; iii) National Clearing Company of Pakistan
Limited (NCCPL) for clearing and settlement of all book entry securities, and iv) 1Link that operates
and manages an ATM Switch, an Interbank Funds Transfer (IBFT) facility, a Utility Bills Payments
facility and the recently started domestic payment scheme, PayPak. In addition POS networks,
Internet Banking, Mobile Banking, Call Center and IVR Banking and Branchless Banking are
important components of country’s payments infrastructure.
2.1 Payment Systems Performance Payment Systems performance can be assessed based on the growth and advancement in available
infrastructure of payment system and the resultant growth in number and value of transactions being
processed by the payment system. The usage of electronic payment modes has been increasing at a
fast pace since last 5-6 years, both the large value and retail payments. The momentum continued
during FY17 as both the volumes and value of electronic payments maintained their upward growth
trajectory. Similarly, users of internet banking and usage of pay cards registered handsome growth.
2.1.1 Large Value Payment System (PRISM)
PRISM is used for large value interbank funds transfers by financial institution and for settlement of
trades of government securities and paper instruments. Presently, there are 42 direct participants of
PRISM comprising of 32 banks, 7 Development Finance Institutions (DFIs), 2 Microfinance Banks
(MFBs) and the Central Depository Company (CDC). In addition, there are 150 plus indirect
participants as well comprising mainly of insurance companies, investment companies and brokerage
houses.
The major payments processed through PRISM
(RTGS) include third party transfers (Customer
payments) and inter-bank funds transfers.
Recently, SBP has also allowed banks to
transfer home remittances through PRISM.
Since the launch of PRISM system in 2008, a
growing trend in the volume and value of
transactions has been witnessed, which is
largely driven by third party transfers,
especially PRI transfers.
The total value of transactions processed by
-
200,000
400,000
600,000
800,000
1,000,000
1,200,000
-
50,000
100,000
150,000
200,000
250,000
300,000
FY10 FY11 FY12 FY13 FY14 FY15 FY16 FY17
Vo
lum
e o
f T
ran
sact
ions
-N
um
ber
in U
nit
Val
ue
of
Tra
nsa
ctio
ns -
Bil
lio
n R
upe
es
Interbank Funds Transfer Retails Cheques Clearing
Securities Settlements Total Volume of Transactions
Figure 2.1:PRISM Transactions

State Bank of Pakistan Annual Report FY17
24
PRISM increased from Rs 231.7 trillion in FY16 to Rs 279.5 trillion in FY17 showing an increase of
20.6 percent; while the volume of transactions grew by 19.4 percent from 930 thousand to 1,110.1
thousand in FY 17.The significant increase in volume is attributed to the increase in the number of
home remittances transactions. Further, to enhance the outreach of large value Electronic Funds
Transfers (EFT) system the PRISM membership was allowed to Islamic Banking Branches (IBBs) of
conventional banks.
2.1.2 Retail Payment Systems
Retail payment services in the country are being offered by 30 Banks, 4 specialized Banks, 11
Microfinance Banks, and 8 Development Finance Institutions (DFIs). These entities have 14,689
branches amongst them registering an increase of 8.5percent from the previous year.1 Key payment
services being offered by these financial institutions are discussed below:
Real Time Online Bank Transfers
Real Time Online Branches are connected with the centralized core banking systems of the banks in
order to provide real time online banking facilities for cash deposits, cash withdrawals and Intra-bank
fund transfer facility. Besides 14,273, bank branches, 155 sub-branches and 355 permanent booths are
also providing limited banking facilities to the customers. During FY17, a total of 143.6 million
transactions were processed valuing at Rs 31.1 trillion which was 23% of total e-banking transactions
by volume and 84% by value.
Payment Cards
Payment cards have recorded a very significant growth in the last 5 years. This shows growing
acceptability of the cards and electronic modes of payments by the general public. As of June 30,
2017, there were over 17.9 million debit cards, over 8 million ATM only cards and around 1.3 million
credit cards. Overall, during FY17, the number of plastic cards in Pakistan increased by 8.8 percent to
36.6 million (breakup at Table 2.2).
SBP has taken a number of steps to promote not just the card issuance in Pakistan but also their
acceptance especially at Point of Sale (POS) terminals. The country’s first domestic payment scheme,
PayPak, was launched in April 2016 with the objective of giving consumers the choice of a low cost
payment card that could be used within the country. During FY17, SBP continued to work with
PayPak payment scheme originator (1Link) and the card issuing and acquiring banks in Pakistan to
initiate mass level card issuance and acceptance. PayPak cards are now being issued by 9 major banks
(who have 73 percent of the total market share in terms of card issuance) and are being accepted on all
ATM machines and on 25 percent of POS terminals. SBP has also granted permission for Co-
branding of Payment cards to 1Link thus encouraging international payment schemes to partner with
PayPak for joint issuance of cards.
The payment cards have also become a preferred method of disbursing social welfare cash transfers in
the country. The number of these social welfare cards (like the Benazir Income Support Program-
BISP card) was over 9 million as of 30th June 2017. However, the use of these cards is limited to cash
withdrawals only. SBP during the year also started segregating debit cards from pre-paid cards and
social welfare cards. For this purpose, separate heads have been included in the payment cards section
of the reported data.
1 Note: (This year 123 overseas branches were also included in the total count).

Payment System
25
Automated Teller Machines (ATMs)
ATMs are the most frequently used channel for withdrawal of cash. ATM infrastructure in Pakistan
comprises of 12,689 ATMs installed by 32 banks, this shows an 11.5 percent growth over the
previous year. About 10,478 (83 percent) of the total ATMs are installed at bank branches (on-site
ATMs), whereas 2,207(17.4 percent) are installed at business places, hospitals, shopping malls (off-
site ATMs) and 4 ATMs are operational in mobile vehicles. Out of total installed ATMs, 1,583 ATMs
are also equipped with biometric sensors for authentication. A total of 397.7 million transactions were
processed on ATMs valuing at around Rs 4.6 Trillion. Overall, this amounts to 64% of total e-banking
volume and 12% in value. During Ramzan and the ensuing Eid ul Fitr holidays in 2017, a total of Rs
442 Billion were withdrawn through ATMs.
Point of Sales (POS)
The total number of POS machines grew by 7.3 percent to 54,490 during the year whereas the value
of total transactions processed through POS machines grew by 23 percent to Rs 246 Billion. In order
to encourage the use of POS machines, banks and third party providers are being encouraged to
incentivize merchants, by offering them associated value added services. In addition, more convenient
payment methods like QR Codes and mobile apps are also being introduced in the market by payment
schemes and new Fintechs; however, their uptake is still in infancy stage and limited to upscale
outlets and their acceptance among the masses is yet to be seen.
Internet Banking and other Channels
As of June 2017, Internet Banking, Mobile Phone Banking and Call Centers/ IVR Banking services
were being offered by 25, 18 and 25 Banks respectively. During FY17, 25.2 million transactions were
processed through internet banking, valuing around Rs 969 Billion. Mobile phone banking, accounted
for 7.4 million transactions with a total value of Rs 141Billion in FY17. This represents a yearly
growth of 32 percent (volume) for internet banking transactions and 12 percent (volume) for mobile
banking transactions.
However, as the use of internet and mobile banking has gone up the use of Call Centers/ IVR banking
has shown a downwards trend, with a negative growth of 63 percent YOY. It has been observed that
customers prefer mobile banking and internet banking over call centers/ IVR as a result banks have
started to move away from offering this facility.
E-Commerce in Pakistan has also started picking up with 571 merchants offering their products
online. During FY 17, 1.2 million transactions valuing Rs 9.4 Billion were processed through e-
commerce.
Table 2.2 gives summary details of transactions settled through various modes including internet
banking, ATMs, e-commerce, etc.

State Bank of Pakistan Annual Report FY17
26
Table 2.2 Payment & Settlements Systems
Unit FY13 FY14 FY15 FY16 FY17p CAGR%
1. Paper Based Instruments (Cheques, Pay Orders,
Demand Drafts and others)
No. of Transactions* Million 359.0 362.0 361.6 339.7 451.8 5.9%
Value of Transactions Trillion Rs 107.0 115.2 127.2 134.4 139.6 6.9%
2. Electronic Banking and its Composition
No. of Transactions Million 320.5 403.6 469.1 543.8 625.8 18.2%
Value of Transactions Trillion Rs 29.7 33.7 35.9 37.2 37.1 5.7%
2.1. Real-time Online Banking (RTOB)
No. of Transactions Million 89.1 98.5 113.8 135.4 143.6 12.7%
Value of Transactions Trillion Rs 27.1 30.2 31.6 32.3 31.1 3.5%
2.2 Automated Teller Machines (ATMs)
No. of Transactions Million 199.8 258.5 300.3 342.9 397.7 18.8%
Value of Transactions Trillion Rs 2.0 2.6 3.2 3.7 4.6 22.9%
2.3. Point of Sale (POS)
No. of Transactions Million 17.3 24.3 32.1 39.2 50.5 30.7%
Value of Transactions Billion Rs 87.0 124.6 172.1 199.8 246.0 29.7%
2.4. Internet Banking
No. of Transactions Million 9.6 15.6 16.0 19.0 25.2 27.3%
Value of Transactions Billion Rs 498.8 675.6 797.7 880.5 968.7 18.0%
2.5. Mobile Phone Banking
No. of Transactions Million 4.2 6.2 6.1 6.6 7.4 15.4%
Value of Transactions Billion Rs 27.0 67.4 106.9 112.5 141.4 51.3%
2.6. Call Center & IVR Banking
No. of Transactions Thousand 639.2 666.0 765.6 714.8 261.9 -20.0%
Value of Transactions Billion Rs 8.2 9.5 9.5 10.1 7.8 -1.2%
2.7. e-Commerce
No. of Transactions Million 1.2
Value of Transactions Billion Rs 9.4
3. Numbers of:
i. Real Time Online Branches (RTOB) Number 10,013 10,640 11,315 12,674 14,150 9.0%
ii. Automated Teller Machines (ATM) Number 6,757 8,240 9,597 11,381 12,689 17.1%
iii. Point of Sale (POS) Number 33,748 34,428 41,183 50,769 54,490 12.7%
4. Payment Cards Thousand 22,288 25,353 27,294 33,660 36,632 13.2%
i. Debit Cards** Thousand 20,267 23,061 25,024 27,411 17,857 -3.1%
ii. Credit Cards Thousand 1,088 1,334 1,370 1,450 1,292 4.4%
iii. Proprietary ATMs only Cards Thousand 933 958 900 4,799 8,043 71.4%
iv. Pre-Paid Cards Thousand 316
v. Social Welfare Cards Thousand 9,124
P - Provisional as on June 30, 2016
* OTC cash deposit for FY 17, have been included in Paper Based instruments.
** Debit cards shows negative growth as social welfare cards and pre-paid cards have been removed from the total of debit cards.

Payment System
27
2.2 Major Developments in Payment Systems Payment systems landscape has undergone a major shift in the past few years with exponential growth
in retail electronic payments and transfers. SBP has been promoting growth of e-payment systems by
strengthening the payment infrastructure and encouraging market players to provide value added
products and services to the consumers. Some of the key achievements are discussed below:
2.2.1 RTGS Up-gradation Pakistan Real Time Interbank Settlement Mechanism (PRISM) is the only large value payment
system in the country that processes transactions on real time gross settlement basis. Realizing its
systemic importance, SBP initiated the upgrade of PRISM. After comprehensive testing by the
participants, the system went live on May 22, 2017. The upgrade implementation included scalability
of funds transfer system, new system for securities trading and the deployment of system on new
servers with advanced operating system. The enhanced features of the upgraded RTGS system have
allowed the PRISM participants an efficient mechanism for monitoring of funds and Government
securities, allowing them to manage liquidity at an optimal level.
2.2.2 Implementation of Straight through Processing (STP) Implementation of Straight Through processing (STP) is an important SBP initiative to ensure speedy
transfer of funds in beneficiaries’ accounts. Under the STP, PRISM is integrated with participants’
(Banks’) core banking systems. The STP ensures that the information/transaction entered in the
system is processed end to end without any manual/human intervention. Last year, the SBP had
advised the direct participants of PRISM to implement the STP. As a result of rigorous follow up
during the year under review, 32 out of 42 participants had successfully implemented the STP by the
year end. The applications of 3 other participants were under process whereas 4 participants were in
the process of completing the preliminary requirements including development of middleware and
placement of additional firewall for enhanced security. The remaining PRISM participants were
granted exemption based on low transactional volumes.
2.2.3 Channeling of Home Remittances through PRISM Overseas Pakistanis have been sending Home remittances to Pakistan for decades, but the digital shift
is making that process easier than ever. In order to enable fast and secure transfer of home remittances
across banks and to bring efficiency in the overall process, the SBP allowed the use of PRISM for
inter-bank transfer of Home Remittances. This process facilitates transfer of home remittances into
beneficiaries’ accounts across banks and avoids manual reentry at various stages. By June 30, 2017,
24 out of 25 Pakistan Remittances Initiatives (PRI) member banks had implemented the system for
interbank transfer of home remittances through PRISM.
2.2.4 Islamic Banking Branches allowed PRISM Membership To enhance the outreach of large value electronic funds transfers (EFT) system, the direct
membership of PRISM was extended to Islamic Banking Branches (IBBs) of conventional banks
during the year. Accordingly, IBBs were advised to establish separate operational set-up of PRISM
subject to fulfillment of certain conditions as specified in PSD Circular No. 06 of 2016.
2.2.5 CDNS awarded Clearinghouse Membership In order to facilitate the Account holders of Central Directorate of National Savings (CDNS) in
smooth and expeditious receipt of their profits in their accounts with commercial banks, SBP during
the year allowed CDNS to become a direct member of NIFT. Banks were advised to accept profit
coupons and withdrawals slips pertaining to CDNS schemes at their counters for receiving the funds

State Bank of Pakistan Annual Report FY17
28
in the customers’/beneficiaries’ accounts through normal clearing mechanism. In addition, banks were
also advised to endorse coupons and withdrawal slips before submitting them to NIFT.
2.2.6 PayPak Gains Traction Since its launch in 2016, the SBP has been actively working with Payment Service Providers to
encourage the issuance of PayPak cards and increase its uptake in the country. Encouragingly by end
of June 2017, 9 payment service providers with a total market share of 73 percent (total cards issued)
had started issuing PayPak cards to their customers. Out of 6 acquirers, 4 had started updating their
POS machines to accept PayPak cards; overall 25percent of the POS machines in Pakistan had been
upgraded to accept PayPak cards. Further, all ATM machines in Pakistan were accepting PayPak
cards.
2.3 Improving efficiency of Government Payments and Receipts The Government payments and receipts constitute a significant part of the country’s overall payment
system. Thus improving efficiency, security and simplification of Government payments and receipts
is imperative for attaining the goals set under National Payments Systems Blueprint in the SBP Vision
2020. Several initiatives have been taken to achieve these goals including implementation of e-cheque
reconciliation system in SBP BSC offices, initiation of projects for online collection of taxes and
duties and elimination of cheques and paper instruments from Government payments.
2.3.1 Online marking of Cheque / Instruments for Government Payments In order to enhance efficiency in processing government payments, a project of ‘E-Cheque
Reconciliation System’ was started in 2016. This project is being implemented in a phased manner.
Initially as a pilot project, has now been rolled out at all SBP-BSC Offices. This system has
significantly reduced the hassle of manually searching the cheque numbers from the paper based
schedules and has enabled SBP-BSC to reconcile and report system generated cheques issued by
AGPRs/AGs/DAOs on behalf of federal, provincial and district governments. The system has brought
transparency in government payments and ensured timely and accurate online reporting to Account
Offices. The NBP, being an agent of SBP for government banking business, has been asked to
implement the system at all of its branches dealing with government payments. The implementation
of the system in NBP will result in even larger efficiency gains due to large number of branches
dealing in government payments across the country.
2.3.2 Punjab Land Record Authority (PLRA) receipts through Bank of Punjab (BOP)
Under Government of Punjab project for establishment of bank booths at Arazi Record Centers
(ARCs) for collections of fee and Fard issuance, SBP authorized BOP to start collection of PLRA
receipts by establishing booths at all 144 ARCs across Punjab province. In the new environment, the
booths will be connected through LAN with ARCs. This will not only bring efficiency in the PLRA
affairs but will also facilitate the citizens to pay their fees and get PLRA services under one roof in an
efficient manner.
2.3.3 Online Collection of Sindh Sales Tax by Sindh Revenue Board (SRB)
In order to collect taxes electronically and facilitate tax payers, SRB had approached SBP for
introducing online tax collection through Alternate Delivery Channels (ADCs). The SBP has been
working with SRB to develop the requisite system, which was completed during the year and SRB
was allowed to initiate online collection of Sindh Sales Tax (SST) through ADCs. Under the new
mechanism, the tax payers can pay the SST through online bank portals and ATMs. This mechanism
has provided the much needed convenience to the tax payers besides improving transparency and
system wide efficiency.

Payment System
29
2.3.4 Online collection of FBR Taxes
SBP in collaboration with FBR and 1Link has developed the mechanism for on line collection of all
types of Government taxes (P2G). This will allow taxpayers to pay taxes using internet banking
accounts or ATMs without visiting bank branches. This will be an additional option for payment of
taxes besides the existing tax payment facility being offered at SBP-BSC offices and NBP branches.
Initially the online tax payment facility will be made available for all FBR taxes including income tax,
sales tax, excise duty and customs duty; in the next phase the facility will be extended to other
Government entities and provincial governments as well . The system is likely to be operational by
December 31, 2017.
2.3.5 Online Collection of Customs’ duty
In order to comply with the WTO’s Trade Facilitation Agreement (TFA), the FBR approached SBP to
digitize its collection of customs’ duty through WeBOC system. WeBOC is a paperless system,
which enables importers and exporters across the country to file online customs documents including
Goods Declarations (GDs) for Customs Clearance of their consignments. The SBP, Customs and
1link has developed the detailed mechanism for online collection of customs duty. This will allow the
importers to pay the duty using their internet banking account or ATMs from across the country. As
usual traders will generate their Payment Slip Identification (PSID), which will be used at ADCs e.g.
bank’s online portals and ATMS to fetch the payment details. The trader after verification, approves
the payment whereby the traders’ account will be debited and the Government’s account with SBP
will be credited through 1Link. As soon as the traders’ account is debited, the system will send a
message to WeBOC that the payment against the particular PSID has been received enabling the
traders to get their goods released.
The proposed mechanism will benefit in multiple ways i.e. compliance of WTO’s agreement by
Customs, reduction in the cycle of realization of revenue receipts in Government Treasury,
convenience to the traders, prevention of leakages in the system and facilitation in the forensic audit
and traceability of transactions
2.3.6 Collection of E-Stamp Duty by Board of Revenue Sindh (BOR)
SBP is also supporting the Board of Revenue Sindh project for shifting to e-Stamping like Punjab did
last year. In this regard, BOR has developed the conceptual framework with the technical help of e-
governance team of NADRA, and also developed online property valuation and tax calculator with
other features on website. Currently, BOR is under discussion with relevant authorities in reforming
legal framework to provide legal backup to the new payment mechanism.
2.3.7 Elimination of Cheques in Government Payments
In coordination with Financial Accounting & Budgetary System (FABS) of Controller General of
Accounts (CGA), SBP has initiated a project to gradually eliminate the paper instruments (cheques)
from government payments. Under the proposed system, AGPR/accounting offices would prepare
bank wise payment details of beneficiaries on message type MT-102 format and place the same at
SBP Data Acquisition Portal (DAP); the SBP after necessary authentication would process the
message file through RTGS. As a result, accounts of all the beneficiaries would be credited on real
time basis by the respective banks through straight through processing (STP). The pilot for this
project is expected to be completed during FY18 in Islamabad after which it will be gradually rolled
out across the country.

State Bank of Pakistan Annual Report FY17
30
2.4 Implementation of Currency Management Strategy The first phase of the Currency Management Strategy introduced in August 2015, was implemented
during the year whereby banks started disbursing machine authenticated cash (Rs500 and above
denominations) in 30 big cities. These cities host 73 percent of banks’ branches, 71 percent of ATMs
and 88 percent of deposits. As at the close of FY17, a total of 1,443 desktop note sorting machines
were installed in banks and 8,687 bank branches in the 30 big cities were issuing machine
authenticated banknotes. The second phase of the strategy will be implemented from January 2, 2018
across the country. This would almost eliminate the possibility of issuance of any counterfeit
banknote from banking system besides improving the quality of banknotes in circulation. SBP during
the year also issued banknotes packing guidelines to standardize the banknotes packets and bundles,
which is necessary for promoting interbank exchange of cash. A platform for interbank exchange of
cash was also introduced during the year enabling banks to place their surplus cash in the interbank
cash market or meet their cash needs from the market. In case the requisite cash is not available in the
interbank market, the SBP-BSC will provide the cash. Similarly if the surplus cash could not be
absorbed by the interbank market, the same is deposited with SBP-BSC against payment of fee.
2.4.1 Issuance of Banknotes with Enhanced Security Features
The SBP during the year started issuing higher denomination banknotes (Rs500 and above) with
enhanced security features. The enhancement in the security features of higher denomination
banknotes was part of the SBP currency management strategy and is aimed at keeping the security
feature of the banknotes at par with the advancements in banknotes printing technologies. These were
also necessary to align the security feature with the ongoing drive to automate the currency
management functions in the banking industry. The new higher denomination banknotes have
enlarged Optical Variable Ink (OVI) flag and crispier feel and look due to varnishing.
2.4.2 Demonetization of Old Design Banknotes
The old design banknotes of Rs 10, 50, 100 and 1000 were demonetized during the year after approval
by the Federal Government. These old designed banknotes ceased to be legal tender and exchangeable
from commercial banks with effect from December 1, 2016. The SBP-BSC field offices will however
continue to exchange the old design banknotes from general public till December 31, 2021. An
extensive awareness campaign was run through electronic and print media to inform the general
public to get their old design banknotes exchanged from commercial banks by November 30, 2016.
The public awareness campaign included the following measures:
Advertisements in national and local newspapers of different languages as well as magazines
Telecast of video message on satellite Television channels, social media and within premises
of banks’ branches
Broadcast of audio message through radio channels
Display of posters at public places and banks’ branches
Display of message on banks’ ATMs and websites
Distribution of leaflets at public places and banks’ branches
2.4.3 Acquisition of Pakistan Security Printing Corporation (PSPC) by SBP
The SBP has acquired the currency business (banknote and prize bonds) of Pakistan Security Printing
Corporation from Government of Pakistan as per “Share Purchase Agreement (SPA)” executed
between Finance Division and SBP in June 2017. The acquisition would entail following benefits to
SBP:

Payment System
31
Effective and enhanced control over the full spectrum of banknote printing enabling
SBP to introduce such security features in banknotes as may be needed to protect the
integrity of banknotes.
Efficient conceptualization of decisions and their executions, particularly in
introduction and deployment of state of the art banknote printing technology and for
expansion of production capacity.
Administrative ease in resolution of operational issues and effective coordination.
Better control over operations and security environment of banknote printing, safe
keeping and transportation of banknotes from printing press to SBP.
Overall efficiency gains due to an independent workload analysis and Business Process
Reviews (BPR).
2.5 Going Forward
Due to rapid technological progress, the global payment landscape is transforming very rapidly. New
payment methods coupled with ubiquitous technology and faster payment processing infrastructure
are enabling both businesses and consumers to accept and make payments from the comfort of their
homes and offices. Following the global trends, the payment systems landscape in Pakistan has also
transformed rapidly during last 6-7 years with stellar growth in payment cards, mobile, internet
banking transactions, etc. This reflects growing acceptability and tendency of the market to absorb
such innovative products. The need of the hour is to capitalize on the technological innovation to
develop products that suit the market needs and enhance customer facilitation. The initiation of
projects like development of National Payment Gateway, online collection of taxes and duties and
elimination of cheques from government payments will have far reaching implications on banking
system efficiency, effectiveness and access. Similarly the initiation of domestic payment schemes
would give flip to SBP efforts to promote e-payments in the country.
Notwithstanding, the highly positive outlook for growth of electronic and digital payments, the cash is
going to stay in the foreseeable future. The SBP thus along with promotion of electronic and digital
payments would also ensure adequate availability of good quality banknotes across the country. The
implementation of currency management strategy across the country in 2018 will totally transform
and automate the cash management function making it efficient and cost effective besides enhancing
the system’s ability to ensure the integrity of its banknotes.

33
3 Strengthening Financial System Stability and Effectiveness
The banking sector constitutes around 74 percent of the country’s financial sector with an asset base
equivalent to almost 55 percent of the country GDP. Thus the stability and buoyancy of the banking
system is critically important for SBP. The SBP Vision 2020 accordingly envisions improving the
financial stability regime and enhancing efficiency and effectiveness of the financial system amongst
the key strategic goals of the Bank. The initiatives taken by the SBP in this direction included
establishment of financial stability framework, institutionalization of deposit protection mechanism,
streamlining and strengthening regulatory regime, emphasis on awareness creation and fair treatment
of consumers.
3.1 Institutionalization of Financial Stability Framework The SBP Vision 2020 envisages designing and implementing a formal Financial Stability structure in
the country. With a view to institutionalize the financial stability function in SBP, a new department
namely Financial Stability Department (FSD) was established in 2016 to monitor and assess financial
system wide risks and propose measures to mitigate such risks. Further, the Financial Stability
Executive Committee has also been constituted under the chairmanship of the Governor to serve as an
internal forum for discussions and coordination on financial system stability issues.
During FY17, SBP and Securities and Exchange Commission of Pakistan (SECP) signed a Letter of
Understanding (LoU) to establish a Council of Regulators (CoR) to mitigate systemic risk covering
the broader spectrum of financial sector. The Council will provide a forum for deliberating issues
related to systemic risk, particularly those having cross market and stability implications. It will
suggest possible arrangements for crisis preparedness and come up with a coordinated response. The
formation of the Council is aligned with international practices in the post global financial crisis
scenario. It will not only facilitate SBP and SECP in achieving their statutory and strategic objectives
but also further enhance their collaboration for ensuring the financial system stability. Besides the
CoR, work is underway for establishment of an overarching National Financial Stability Council
(NFSC) comprising SBP, SECP and Ministry of Finance to discuss and resolve the systemic level
issues.
3.1.1 Financial Stability Mandate in the Law
In line with international best practices, the SBP is strengthening its Financial Stability regime.
Presently SBP however lacks the “explicit legal mandate for financial stability”, which is inconsistent
with international best practices. As per the in-house study conducted during the year, it is highly
desirable for regulators/central banks to have legitimate legal powers and mandate to pursue financial
system stability goal depending upon the size of economies and structure of financial markets. Most
countries’ central banks have explicit legal mandate for attaining financial stability by virtue of their
legal framework. SBP has reviewed the legal framework vis-à-vis international best practices and
identified some areas for explicitly covering the financial stability mandate and other related
provisions in the relevant laws.
3.1.2 Deposit Protection Corporation (DPC)
The deposit insurance scheme is widely acknowledged as one of the key components of financial
stability regime. It provides a variety of benefits to the financial system including i) contribute
towards a stable financial system and protects financially unsophisticated depositors from the loss of
their deposits, ii) create a formal protection mechanism thus removing the uncertainty about how
State Bank of Pakistan Annual Report FY17
34
depositors will be treated in case of bank failures, and iii) reducing the potential fiscal burden on the
government. The SBP Vision 2020 accordingly envisaged establishment of Deposit Protection
Corporation (DPC) as a key milestone towards achieving the financial stability goal. The Deposit
Protection Corporation Act was promulgated in August 2016 which has allowed for the establishment
of Deposit Protection Corporation (DPC) as a wholly-owned subsidiary of SBP. In terms of Section
12 of DPA, SBP has already appointed Managing Director of DPC for the period of five years. The
general superintendence, direction and management of DPC shall vest in the Board to be appointed
by the Federal Government. The SBP has approached the Federal Government for nomination of the
Directors on the DPC Board. The DPC would become operational after the constitution of the Board.
The membership of DPC is mandatory for all scheduled banks. The periodic premium payments to be
made by the banks shall be the major source of funding for the DPC. The threshold of deposit
coverage and rate of premium shall be determined by the DPC Board. The DPC will invest the
premium received from the banks in secured investments (mainly government bonds) and will build-
up the resource/funds base for payment to the depositors in case of failure of a bank. The DPC will
also set up a separate Shari’ah compliant insurance scheme (takaful) for protection of deposits of
Islamic banking Institutions.
3.1.3 Self-Assessment of FSB’s Key Attributes on Effective Resolution Regime An effective resolution regime is essential to minimize disruptions to smooth functioning of the
financial system. Such a regime helps maintain confidence and allows system to perform all its
critical functions. In 2014, Financial Stability Board (FSB) issued Key Attributes of Effective
Resolution Regimes for Financial Institutions.
SBP during the year initiated the Project “Self-Assessment of FSB’s Key Attributes on Effective
Resolution Regime along with policy recommendations” to assess the capacity and effectiveness of
SBP Resolution Regime, identify the gaps, if any and develop recommendations to fill the gaps. The
study mapped out the key attributes standard with the current legal and supervisory framework of the
SBP resolution regimes for the financial institutions under its supervision. In view of the assessment,
key policy recommendations on SBP’s resolution regime were prepared and approved by the
Governor, which include proposed changes in legal framework, development of supervisory
framework and institutional arrangements.
3.1.4 Assessment of Banks’ Resilience through Stress Tests
Stress testing is an integral part of the financial stability assessment toolkit of central banks around the
world. SBP is also using ‘stress tests’ to assess the resilience of banks and the banking system against
various hypothetical (extreme but plausible) macro-financial shocks. Presently, such stress tests are
conducted on quarterly basis and based on the results the banks whose capital falls short of the
required minimum are identified. The toolkit and the framework of stress testing are being regularly
enhanced and upgraded in line with the latest developments and advancements in the area.
3.1.5 Flagship reports (Financial Stability Review)
The Financial Stability Review (FSR) is amongst the flagship reports being published by SBP. The
FSR for the year 2016 was issued during the year, which focused more on identifying emerging risks
and vulnerabilities in the financial system, assessing their impact and suggesting remedial measure
where necessary. The review for the first time also covered the demand side analysis such as risks to
the corporate sector and the household sector. Further, the global developments and their implications

Strengthening Financial System Stability and Effectiveness
35
on the domestic financial sector were discussed in detail in the review1. Moreover, the FSR 2016
discussed the resilience of the banking system under various stress scenarios. Besides the FSR,
Quarterly Performance Reviews (QPRs) and Quarterly Compendium (QC) of Statistics of the Banking
System were issued during the year to apprise the general public about the latest performance and
financial soundness indicators of the banking sector.
3.2 Progress toward Risk-Based Supervision Framework In order to further strengthen its supervisory regime, SBP is developing a “Risk Based Supervision
Framework”. Risk Based Supervision (RBS), being a forward looking approach, will upgrade SBP’s
supervisory methodology from the existing CAMELS/CAELS framework. The RBS model would
improve risk and control assessment of financial institutions. RBS requires allocation of supervisory
resources to institutions and areas which are significant in terms of riskiness or impact of failure. This
approach will ultimately help prioritize supervisory resources and articulate prompt and effective
response to financial stress.
Currently the project team is in the process of developing architecture of RBS framework and has
developed draft methodologies for identification of significant activities, assessment of inherent risks
(credit, market, liquidity, operational) and internal controls (internal audit, risk management,
compliance). First Testing exercise based on the draft methodologies for assessment of various
inherent risks and control functions including internal audit, compliance and risk management has
been completed. Aggregation of risk and control rating in order to formulate the risk profile is under
process.
3.2.1 Framework for Identification of Domestic Systemically Important Banks (D-SIBs)
Global financial crisis of 2007-08 had exposed the vulnerabilities of prevailing financial system and
illustrated how failure of large institutions might lead to catastrophic consequences for the entire
financial system and economy at large. In this backdrop, the FSB developed policy framework on
Global Systemically Important Financial Institutions (G-SIFIs) that was endorsed by G-20 leaders at
the Cannes Summit in November 2011. Later in 2012, BIS and FSB extended the G-SIFIs framework
for D-SIBs. The rationale for devising enhanced framework for D-SIBs corresponds to G-SIFIs
framework, that is, the prevailing regulatory regime and policies are not sufficient to address the
"negative externalities" that large financial firms create.
In case of Pakistan, the initial assessment suggested that given the financial industry structure, there
are no G-SIFIs in Pakistan; however, some banks are systemically important, the failure of which may
significantly impact the financial sector. Taking cue from benchmark BIS methodology, a framework
for identification and enhanced regulations and supervision of D-SIBs is being designed. It is
expected that D-SIBs framework will help in maintaining financial stability and facilitate in
minimizing the cost to the economy in any episode of financial crisis.
3.2.2 Development of large exposure framework
Large exposures trigger systemic risk and thus demand supervisory attention. One of the limitations of
Basel capital standards is that it does not take care of concentrated exposure with some standardized
procedures but, instead, considers large number of granular exposure, by default. In order to
overcome this issue, Basel Committee on Banking Supervision (BCBS) introduced “Supervisory
framework for measuring and controlling large exposures” in April 2014. This framework is,
1 The FSR-2016 may be accessed through http://www.sbp.org.pk/FSR/2016/index.htm

State Bank of Pakistan Annual Report FY17
36
generally, aligned with risk based capital standards and represents a common minimum standard for
measuring, aggregating and controlling concentration risk across jurisdictions.
In the light of BCBS new standards on large exposures, SBP has conducted an assessment and
identified gaps between its existing rules on large exposures and those prescribed by BCBS. Based on
the gap analysis, SBP prepared a set of draft guidelines on framework for large exposures and
conducted a Quantitative Impact Study (QIS) involving few sample banks. SBP is now in the process
of consultation with the stakeholders for revision of large exposure framework in line with BCBS
guidelines.
3.3 Strengthening Regulatory Framework
3.3.1 Strengthening of Corporate Governance Regime
In line with international standards and best practices on good governance, SBP has further
strengthened the corporate governance regime for banking industry. On this front, comprehensive
guidelines on performance evaluation of the Board members have been issued. Further, the definition
of ‘Independent Director’ has been revised in line with legal framework of Pakistani banking industry
and emerging trends in the country’s corporate culture. The minimum number of independent
directors on the banks’ Boards has also been increased to 33 percent from 25 percent.
3.3.2 Self Assessment on Compliance with BCBS Core Principles of Effective Banking
Supervisions (BCPs)
The Core Principles for Effective Banking Supervision (Core Principles), issued by BCBS, are used
by countries as a benchmark for assessing the quality of their supervisory systems and for identifying
future work to achieve a baseline level of sound supervisory practices. Post global financial crisis, the
BCBS revisited the earlier BCPs with the objective to strengthen the supervisory practices and came
up with certain enhancements in their September 2012 document. The revised document has taken
account of several key trends including systemically important banks, a macro-perspective in
supervision of individual bank and banking group, crisis management, recovery and resolution
measures to reduce probability and impact of bank failure.
With the revision in the BCPs, SBP has conducted Self-Assessment of Compliance with the
principles. Based on the areas highlighted in the assessment, SBP has initiated work on further
strengthening its regulatory and supervisory framework.
3.3.3 Guidelines and Disclosures on Governance and Remuneration Practices
The SBP issued guidelines on governance and remuneration practices in January, 2017 to provide
banks/DFIs with detailed policy guidance to align remuneration practices with internationally adopted
best principles and standards. These guidelines support remuneration practices by taking into
consideration the ever expanding risk profiles and the direct link of risk taking behavior with
remuneration. It will make the Board and senior management of Banks/DFIs more accountable and
responsible, and align their compensation with risk adjusted performance in a fair, transparent and
timely manner.
3.3.4 Amendments in Financial Institutions (Recovery of Finances) Ordinance 2001
In order to effectively deal with the issue of Non-Performing Loans, SBP in consultation with the
banking industry proposed amendments in the Financial Institutions (Recovery of Finances)
Ordinance 2001 (FIRO). The FIRO Amendment Act 2016 received the assent of the President of
Pakistan on August 12, 2016. Currently, drafting of Rules under FIRO is in process. The Rules would,

Strengthening Financial System Stability and Effectiveness
37
among others, enable banks to reduce the stock of NPLs through mechanism of non-judicial
foreclosure in an effective and transparent manner. This would also help in expansion of mortgage
and infrastructure financing.
3.3.5 Enterprise Technology Governance and Risks Management Framework
AS envisaged in its Vision 2020, SBP has issued Technology Governance and Risk Management
Framework for Financial Institutions (FIs). The framework is based on international standards and
recognized practices for technology governance and risk management and shall serve as SBP's
baseline requirement for all FIs. It aims to provide enabling regulatory environment for managing
risks associated with the use of technology. The instructions are focused on strengthening the
proactive and reactive environments in FIs to various facets and dimensions of the information
technology i.e. security, operations, audit and related domains. They are also aimed to ensure that
technology operations in FIs are safe and secure.
The framework shall apply to all FIs which includes commercial banks, Islamic Banks, Development
Finance Institutions (DFIs) and Microfinance Banks (MFBs). The framework is not "one-size-fits-all"
and implementation of the same needs to be risk-based and commensurate with size, nature and types
of products and services and complexity of technology operations of the individual FI. The FIs shall
assess and conduct a gap analysis between their current status and this framework and draw a time-
bound action plan to address the gaps and comply with the guidelines provided in this framework.
3.3.6 Framework for Outsourcing Risk Management in Financial Institutions
Keeping in view the importance of outsourcing of activities by financial institutions; SBP initiated
review of its existing guidelines on outsourcing arrangements with a view to identify the gaps
between the guidelines vis-à-vis market practices. The revised regulatory instructions titled
Framework for Risk Management in Outsourcing Arrangements by Financial Institutions have been
issued which cover the new areas like governance of outsourcing arrangements, risk management in
outsourcing arrangements, in-sourcing of services, group outsourcing, and outsourcing by foreign
branches of banks and collaboration by FIs with Fintechs (Financial Technologies). The framework
shall help in coverage and mitigation of the risks like strategic risk in terms of roles and
responsibilities of Board and senior management of FIs, technology risk and legal risk related to the
outsourcing arrangements by FIs.
3.3.7 Step towards Enhancing Efficiencies in Regulatory Reporting
SBP has been fully cognizant of utilizing information technology as a tool for enhancing its
operational efficiencies. SBP’s Data Acquisition Portal is vital in acquiring quantitative and
qualitative returns in electronic form from reporting entities. Quarterly Reporting Chart of Accounts
(RCOA) is the most comprehensive return containing several thousand data elements being acquired
through DAP4. In order to further improve efficiencies, timeline for submission of quarterly RCOA
by reporting entities was reduced from 14 working days to 12 working days. These timelines shall be
considered for further reduction after assessment of quality of reported data and the banks’ capacity to
report error-free data.
3.3.8 Strengthening of Consumer Financing Regulations
SBP periodically reviews its regulatory framework in order to align it with changing business
environment and international best practices. The Prudential Regulations for Consumer Financing
were revised during the year to promote consumer financing in sustainable and fair manner while
ensuring financial stability of the banks/DFIs. The revised regulations provide more discretion to

State Bank of Pakistan Annual Report FY17
38
banks/DFIs in decision making in line with their dynamic business environment. Under these
regulations, amongst others, banks/DFIs were advised:
To develop common glossary of important terms. The development of common nomenclature
of Important Terms facilitate the general public to have better understanding of the banks’
products and services and terms and conditions thereof enabling them to make meaningful
comparison between the financing products offered by different banks.
To initiate assessments for introduction of differentiated loan pricing in all consumer
financing products, which interalia should be sensitive to loan product characteristics,
borrowers’ risk assessment, timely regular repayments and exemplary behavior.
To maintain general provision against performing loans on tiered basis linked with gross non
performing loan ratio (GNPLR) of the banks/DFIs. The regulation aims to incentivize
banks/DFIs which have lower GNPLR and promote better risk management practices.
3.4 Supervisory Initiatives The on-site inspections of banks, DFIs, microfinance banks and exchange companies were conducted
as per approved inspection plan FY17. Based on the inspection findings, major areas of supervisory
concerns and violations of regulatory instructions pertaining to corporate governance, risk
management, internal audit and compliance, AML/CFT, IT risk, service quality, settlement risk, etc.
were taken up with the banks’ BoDs and senior management for corrective actions. In addition,
statutory reports on written-off loan and advances were prepared as per requirement of section 25AA
of the BCO 1962. Further, inspections of selected overseas branches of locally incorporated Pakistani
banks were also conducted in order to assess their soundness and stability.
3.4.1 Thematic Inspections
Thematic inspection is a supervisory tool, which focuses on the assessment of specific risk areas,
business activities, processes and practices across the industry. The cross-institutional approach
creates a benchmark for further policy improvement, corrective actions across industry and guidance
to strengthen controls in financial institutions. SBP’s approach of thematic inspections is also a step
towards more focused risk based supervision of the financial institutions. During FY17, thematic
inspections were carried out in the areas of internal credit risk rating systems of banks, customers’ risk
profiling, transaction monitoring systems of banks, human resource practices in banks, business
model and credit risk of DFIs and ML risk management in exchange companies.
3.4.2 Special Investigations
The SBP conducts special investigations/ inspections on issues/complaints received from internal or
external stakeholders. During the year various special investigations were carried out including mis-
utilization of export proceeds, Meat Export (under invoicing), AML aspect in the withdrawal /
remittance from foreign currency accounts, misappropriation of funds in Abandoned Properties
Organization, assessment of impact of higher bank charges and interest rates on consumer credit and
various special inspections of Exchange Companies on the request of internal stakeholders.
3.4.3 Inspection Framework for Exchange Companies
During FY17, SBP successfully carried out parallel test run of its revised risk-based framework for
inspection of Exchange Companies. The Risk Assessment and Control Evaluation Regime (RACER)
provides a more objective basis for assessment and risk profiling of the exchange companies and
would help supervisory staff to focus on important business activities of the companies. The resultant

Strengthening Financial System Stability and Effectiveness
39
inspection findings would help Exchange Companies improve their risk management practices,
governance frameworks and process level controls.
3.5 Enhancements in SBP’s Conduct Regulation and Supervision Regime Fair Treatment of Consumers (FTC) being a crucial prerequisite for inclusive yet sustainable financial
growth is amongst the important regulatory objectives of SBP. The “Fair Treatment of Consumers
(FTC) regime” is one of the key tactical objectives under the strategic goal for improving efficiency,
effectiveness and fairness of the banking system. With the strategically enhanced focus on business
conduct of banks, MFBs and DFIs, SBP envisions to gradually step back from direct handling of
complaints while enhancing its conduct regulation and supervision regime. The key initiatives and
achievements in conduct regulation and supervision during the year include:
Conduct Assessment Framework (CAF): The Conduct Assessment Framework (CAF) has
been issued to demonstrate SBP resolve to ensure Fair Treatment of Consumers by banks,
DFIs and MFBs. CAF was issued after a successful pilot run, which besides institutionalizing
the conduct assessment would help banks to diagnose the conduct risk area (s) and develop
the necessary capacity to manage such risks. Under the framework the banks will make self
assessment of their business conduct and share the findings with SBP on annual basis for
revalidation. CAF will also serve as conduct monitoring tool for SBP to gather conduct
related data, address the gaps and maintain risk profiles of the banks.
Banks’ Capacity Building in Consumers’ Fair Treatment: In order to inculcate the
customer service orientation and create better understanding of CAF amongst the banks a
three day training module was developed and conducted through Institute of Bankers Pakistan
(IBP). Further, engagement sessions on large scale with higher management of banks, MFBs
and DFIs are often undertaken to sensitize them about FTC and responsible banking conduct.
Enhanced Conduct Supervision: In order to strengthen the FTC regime, SBP has to adopt
effective conduct monitoring tools to collect market data, highlight malpractices, analyze the
root causes and recommend corrective actions. Accordingly, thematic off-site examinations
have been carried out to review efficiency of call centers and complaint handling procedures
of banks, MFBs and DFIs through questionnaires, surveys and mystery shopping through
telephone calls. The general findings and the regulatory expectations regarding the complaint
handling procedures have been placed on SBP website whereas the sector specific findings
along with recommendations have been shared with respective banks, MFBs and DFIs for
exclusive guidance to bridge the gaps. Further, on the basis of review of efficiency of call
centers, areas have been identified for issuance of guidelines to improve their efficiency,
which will be issued after receipt of feedback from Pakistan Banks Association.
Consumer Awareness and Empowerment: SBP has been running the Consumer Awareness
campaigns since the recent past to enhance consumers’ understanding and awareness about
their rights through seminars across the country and through print and electronic media. In
FY17 a “Know Your Rights and Responsibility Booklet” was prepared which
comprehensively covers rights and responsibilities of the banking consumers.
3.6 International Cooperation in Banking Supervision
3.6.1 FSB Regional Consultative Group for Asia (FSB-RCG ASIA) SBP is a member of Financial Stability Board (FSB) - Regional Consultative Group of Asia (RCG
Asia) since its inception in 2011. The purpose of the RCGs is to bring together financial authorities

State Bank of Pakistan Annual Report FY17
40
from FSB member and non-member countries to exchange views on vulnerabilities affecting financial
systems, policy initiatives underway and planned to promote financial stability and the
implementation of these initiatives. Governor SBP remained co-chair of RCG Asia for about two
years effective from July 1, 2015. During SBP’s tenure, the RCG Asia held 3 RCG meetings and
workshop on Fintech and Cyber security in Hong Kong in May 2016. SBP and Hong Kong Monetary
Authority co-chaired the 11th meeting on December 2, 2016 in Hong Kong where SBP called for
effective implementation of Macro-prudential Policy Framework to mitigate systemic risks. In the
latest (12th) RCG Asia meeting held in Bangkok in June 2017, RCG Asia members discussed (i)
Cyber security regulatory approaches and intelligence sharing; (ii) Crisis Preparedness and Resolution
Regimes; (iii) Addressing misconduct in light of governance and corporate culture; among other
financial stability issues.
3.6.2 Correspondent Banking Coordination Group (CBCG)
The FSB established Correspondent Banking Coordination Group (CBCG) to assess and address the
decline in correspondent banking in light of the four-point action plan outlined in a FSB Report (on
correspondent banking) to the G20. The FSB also created four Work Streams (WSs) of technical
experts to coordinate the work pertaining to the action plan at a more detailed level: (i) Data collection
and analysis (WS-1), (ii) Clarifying regulatory expectations (WS-2), (iii) Domestic capacity-building
in jurisdictions that are home to affected respondent banks (WS-3) and (iv) Strengthening tools for
due diligence by correspondent banks (WS-4). The Deputy Governor (Banking & FMRM) represents
SBP on the CBCG, while SBP is also represented on WS-2 and WS-4. Lately, the CBCG has formed
the Remittance Task Force (RTF) to coordinate work on identifying and addressing issues relating to
remittance providers’ access to banking services. SBP is an active member of the task force.
3.6.3 SAARCFINANCE Seminar on “Financial Stability”
SBP conducted a seminar on “Financial Stability” under SAARCFINANCE Forum on March 27-28,
2017 at NIBAF, Islamabad. The representatives from five SAARC Central Bank members
participated in the Seminar. The seminar covered broad topics related to financial stability including
(i) the Financial Stability Frameworks, (ii) Bank Resolution and Crisis Management; (iii) banking
sector perspective on Financial Stability; (iv) Systemic Risk Management in the Securities and Capital
Market; and (v) Opportunities and Challenges provided by Fintech.
3.6.4 National Risk Assessment
Pakistan carried out National Risk Assessment (NRA) with the assistance of World Bank. DG-FMU
was the National Coordinator of the project. NRA is mandatory for all countries as per revised
Financial Action Task Force (FATF) recommendations. Working Groups of stakeholders, consisting
officers from SBP were formed to prepare reports of their respective disciplines. The SBP actively
contributed in development and carrying out the assessment of following modules/areas:
Banking Sector vulnerability
Financial Inclusion
Other Financial Institutions

41
4 Broadening Access to Financial Services
Pakistan has been a pioneer in championing financial inclusion for over a decade. The SBP together
with all stakeholders is working to develop a market based inclusive financial system, serving
effectively to financial services needs of all segments of the economy, with greater focus on
agriculture, microfinance, SMEs and low cost housing. These sectors though commercially less
attractive but are strategically important areas as the agriculture sector alone contributes 19.5 percent
to the country’s GDP and employees 42.3 percent of the labour force, whereas the SMEs accounts for
90 percent of the business establishments in the country and employees 80 percent of non-agriculture
labour force. During FY17, the Bank took a number of policy and regulatory initiatives for enhancing
the outreach of financial system to less privileged and so far unbanked / under banked segments of the
society. The initiatives included implementation of National Financial Inclusion Strategy, promotion
of financial literacy, streamlining and promoting access to simple, low-cost and innovative alternative
delivery channels for financial services in agriculture, SMEs and microfinance.
4.1 National Financial Inclusion Strategy (NFIS) The strategy approved and adopted in May 2015 aims to enhance access to formal financial system to
50 percent of the adult population by 2020. The NFIS covers priority areas such as i) Digital Financial
Services and Payment Systems, ii) Microfinance, Agricultural and Housing finance, iii) SME finance,
iv) Islamic finance, v) Financial Literacy and Consumer Protection, vi) Insurance and vii) Pensions.
The progress made on the NFIS implementation and initiatives taken under the NFIS have been
covered in Box 4.1 and Box 4.2.
Box 4.1: NFIS Implementation Status
In order to implement the strategy, a coordination mechanism was established with participation from both the public
and private sector stakeholders. It consists of the following governance bodies:
NFIS Council: NFIS Council chaired by the Federal Finance Minister is the primary platform for achieving
Pakistan’s financial inclusion objectives and vision. The NFIS Council has held 5 meetings and the last
meeting was held on April 07, 2017.
NFIS steering committee: The steering committee is chaired by SBP Governor, with the overall
responsibility of implementing the strategy. The Steering Committee has held 4 meetings and the last meeting
took place in March 2017 wherein the recommendations particularly on pension and insurance were reviewed.
Technical Committees (TCs): Technical Committees (TCs) have been functioning in seven focus areas with
members from the private sector, ministries, government departments, regulatory bodies, associations and
networks to identify plans, address technical issues and propose solutions to the Steering Committee to
achieve the NFIS targets. The Technical Committees have so far held 30 meetings and conducted deliberations
to firm-up the NFIS action plan.
Box 4.2: Initiatives under NFIS Strategy
Asaan (Easy) Mobile Account (AMA) Scheme: The NFIS Council in its meeting held in January 2017
approved an Asaan (Easy) Mobile Account (AMA) scheme under which the digital finance service providers
will join an integrated platform, allowing any person with a basic mobile phone to open a digital transaction
account swiftly through a unified Unstructured Supplementary Service Data (USSD) code or String from
anywhere, at any time. The objective of the scheme is to improve accessibility of new customers for account
opening, drive usage of digital financial services through increased number of account-to-account transactions
across various networks and provide digital access to a range of quality financial services.

State Bank of Pakistan Annual Report FY17
42
Opening of Asaan Accounts: To enhance the outreach of basic financial services to unbanked or underserved
segments of the population and achieve the targets set out in NFIS, SBP introduced the Low Risk “Asaan
Account” with simplified due diligence requirements, minimum initial deposits Rs100 and monthly
withdrawal limit of Rs 500,000 and overall deposit limit of Rs 500,000. The initiative resulted into addition of
2.60 million accounts in the banking system as of June 2017.
Rationalization of NADRA’s verification Cost: After concerted efforts by all the stakeholders, NADRA has
reduced the verification cost to PKR 10/- to meet low cost KYC requirements for opening of Branchless
Banking (BB) accounts.
Adjustment of Withholding Tax (WHT) on cash withdrawals: The proposal for adjustment of WHT on
cash withdrawals by BB agents was approved and incorporated in Finance Bill 2017-18.
Pakistan Financial Inclusion and Infrastructure Project (FIIP): To support the implementation of
Pakistan’s NFIS, the World Bank has approved a Financial Inclusion and Infrastructure Project (FIIP) worth
US$ 137 Million. The Project will focus on improving market infrastructure and institutional capacity;
supporting the uptake and usage of digital payments and financial services; and improving access to financial
services for microenterprises and SMEs (MSMEs). The project will also be instrumental in increasing access
and usage of financial services by women and women-owned MSMEs.
4.1.1 Impart financial literacy to at least 1.1 million people
As per Access to Finance Survey – 2015, 40 percent of the population reported lack of understanding
of financial products as the main reason for financial exclusion. In order to enhance the financial
education and awareness among the low income segment population, SBP has taken following
initiatives (see Box 4.3).
Box 4.3: Financial Literacy Initiatives
National Financial Literacy Program: SBP is implementing National Financial Literacy Program (NFLP).
NFLP is a 5 year program with the intended objective of imparting financial literacy to 1 million people. The
program is implemented in phased manner. The first phase of the project included project conceptualization;
development of proposal; deliberation /coordination with key stakeholders regarding their roles and
responsibilities; formalization of project governance structure and implementation plan and management and
funding approval of the project. The 2nd phase of the project is currently under progress which includes
revision/ up-gradation of NFLP curriculum, building partnerships/alliances with banks /MFBs, training of
master trainers and field trainers, geographical mapping of the target beneficiaries, financial and management
approval of first year implementation plan. It is expected that with the completion of remaining activities such
as development of mass media campaign, development of information portal and enhancement of capabilities
of concerned staff, the project will formally be launched in October 2017.
Child and Youth Financial Literacy Program (CYFLP): The key objective of the program is to provide
basic financial education to children and youth and train them for their future roles as social and economic
actors. Currently, Enclude Ltd is in a process of finalizing curriculum, trainer manuals, online learning portal,
dedicated website of the program, training teachers of participating institutions for onward delivery of CYFLP
curriculum to target audience. It is expected that after the current summer vacations, the program will be rolled
out at the class room level.
Farmers’ Financial Literacy Programs: In FY17, SBP conducted 08 farmers financial literacy programs in
various agri-intensive districts of the country including AJK and GB. The purpose of these programs was to
familiarize farmers with the banking services and financing facilities available to them along with the
procedure/documentation required to obtain and service a loan availed from bank. Agri-credit officers from
participating banks were also trained as master trainers in these iterations to conduct farmers’ financial
education programs at grass root level.

Broadening Access to Financial Services
43
4.1.2 Branchless Banking
SBP has been encouraging banks to fully exploit
the advancements in Information &
Communications Technologies (ICT) for
increasing their outreach to hitherto unbanked
and under banked areas. The Branchless
Banking (BB) has been the SBP’s flagship
initiative for increasing financial inclusion. The
availability of new mobile banking applications
and platforms, biometric verification mechanism
and emergence of 3G / 4G spectrum has created
ease and opportunity for the branchless banking
operators. Keeping the latest developments in
view and to provide ongoing regulatory support
to financial institutions for enhancing BB
services to low income/unbanked masses; SBP
issued revised version of Branchless Banking
Regulations for the banking industry during the
year (see Box 4.4).
The number of BB accounts exhibited a phenomenal growth, increasing by 87.38 percent to reach
27.3 million as at the close of FY17. This was attributed to SBP’s permission to banks for account
opening through biometric devices at agent locations as well as remote account opening through the
customer’s cell phone. The overall deposits witnessed 12.30 percent growth, rising from Rs 13.73 to
Rs 15.42 billion; however the average deposits declined as the rise in deposits was not commensurate
with the profound increase in accounts.
The outreach of BB services expanded significantly during FY17, as the retail network of BB agents
witnessed a 16.15 percent growth. As a result, by the end of FY17, a total of 402,710 BB agents had
established their footprints across the country to provide basic banking facilities. However, due to
technology upgrade process at the agent level; the active agents of the largest BB provider declined,
which brought a reduction of 21.77 percent in over all active agents.
In terms of volume, BB transactions increased by 26.15 percent to reach 551 million transactions
during FY 17. A total of 93,000 biometric devices have been installed at agents locations to facilitate
paperless and hassle-free account opening of customers, contributing positively towards establishment
of an inclusive financial system (see Table 4.1). The initiatives taken in the area of branchless
banking have been covered in Box 4.4.
Box 4.4: Initiatives for Promotion of Branchless Banking during FY17.
Amended BB regulations to allow remote account opening and other enablers: In Jul-2016, the BB
regulations were revised to ensure their responsiveness to changing market dynamics and technological
advancements witnessed during recent years. The revised regulations allow account opening through
biometric devices placed at BB agents as well as through the customer’s biometrically verified SIM (without
need for visiting the agent). This enabling revision in the regulations is expected to contribute significantly in
SBP efforts for extending the outreach of financial system to the un-banked segments of our economy.
Pilot Project on digital credit for microfinance borrowers - Ongoing since 2016: To focus on the
previously neglected dimension of financial inclusion, Telenor MFB was allowed to evaluate the feasibility
for digital credit in the country. The MFB is offering digital credit via pilot project, wherein small ticket sized
Table 4.1: Branchless Banking Indicators
Indicators FY16 FY17 Annual
Growth
Number of Agents 346,716 402,710 16.15%
Number of Active BB Agents
236,874 185,297 -21.77%
Number of Accounts 14,576,387 27,312,964 87.38%
Deposits (Rs In
millions) 13,734 15,423 12.30%
No. of transactions
('000') 437,197 551,543 26.15%
Value of transactions (Rs in millions)
2,065,172 2,427,823 17.56%
Average size of
transaction (in Rs) 4,724 4,402 -6.81%
Average daily
transactions (in Rs) 1,197,799 1,511,077 26.15%
Average deposit in
accounts (in Rs) 942 565 -40.07%

State Bank of Pakistan Annual Report FY17
44
loans (PKR 1500-3500) are being offered to the customers for short tenures of 7, 15 and 30 days. The findings
of this project will pave a way in setting the course of action for digital credit in future.
Capacity Building of Branchless Banking Agents on nationwide scale: The agents training curriculum
offered by banks only covered limited areas of BB operations, and thus substantial knowledge gap exists
among the BB agents. To address the issue SBP has developed a universal curriculum for capacity building of
the BB agents in consultation with the industry. Phase-1 of the project has been completed, in which two
Train-the-Trainers sessions have been conducted and 73 officers of banks have been trained on this
curriculum. These officers will further impart training to their respective agents on nationwide basis in phase-2
under this program.
4.2 Agricultural Finance
During FY 17, banks have surpassed the
agricultural credit disbursement target of Rs
700 billion set by Agricultural Credit Advisory
Committee (ACAC) for the year. Agri. lending
banks have disbursed Rs704.5 billion which is
17.8 percent higher than the last year’s
disbursements of Rs 598.3 billion. Further, the
agri. outstanding portfolio increased to Rs
405.8 billion on end June, 2017 registering a
significant growth of 17.4 percent over the last
year’s position of Rs 345.6 billion. Similarly,
the agricultural credit outreach has increased to
3.27 million farmers at end June 2017 from
2.40 million farmers last year (see Table 4.2).
This increase in borrowers can be mainly
attributed to inclusion of 15 Micro Finance Institutions/Rural Support Programs in the SBP’s Agri.
Indicative Credit Target Scheme, as they collectively provided credit to more than 0.55 million
farmers during FY17.
SBP adopted a multifaceted strategy and made all-out efforts for ensuring the achievement of the agri.
credit targets by banks which included; sensitizing banks to adopt agri. financing as a viable business
line, exploring new financing products; value chain financing, warehouse receipts financing,
digitization of credit, execution of credit guarantee scheme for small and marginalized farmers and
inclusion of Microfinance Institutions/ Rural Support Programs for catering the credit needs of
marginalized farmers etc. The Box 4.5 below captures the major initiatives taken during the year to
promote agricultural financing:
Box 4.5: Initiatives for Promotion of Agricultural Credit during FY17
Support in designing and implementation of Government of Punjab E-Credit Scheme: SBP supported
Government of Punjab in designing and implementation of GoPB E-Credit scheme. The E-Credit scheme has
been designed to use the advancements in Information & Communication Technology (ICT) for lowering
delivery cost, increasing financial outreach and bringing operational efficiencies for banks and borrowers.
Implementation of Credit Guarantee Scheme for Small and Marginalized Farmers: The Credit
Guarantee Scheme for Small and Marginalized Farmers was implemented in line with the Government’s
budgetary announcement. Under the scheme, agri credit target of Rs 2 billion was assigned to Participating
financial institutions for disbursement to small farmers across the country (four provinces, FATA, AJK and
GB). The scheme aims to encourage financial institutions to lend to small farmers who do not have adequate
collateral (acceptable to banks) in order to meet their working capital requirements. Since its launch, the total
number of borrowers under the scheme had reached 44,694 by March 2017.
Table 4.2: Growth in Agriculture Finance (Rupees in billions)
Bank FY16 FY17
Target Actual Target Actual
Five Big Commercial Banks 305.7 311.4 340.0 342.0
Specialized Banks
ZTBL 102.0 91.0 102.5 92.5
PPCBL 12.5 10.3 12.5 10.9
Domestic Private Banks 131.8 123.1 139.6 139.1
Islamic Banks 7.9 8.5 11.0 12.3
Microfinance Banks 40.1 53.9 60.1 87.8
Microfinance Institutions - - 34.3 19.9
Total 600.0 598.3 700.0 704.5
Source: Agricultural Credit & Microfinance Department, SBP

Broadening Access to Financial Services
45
Adoption of Automation of Land Revenue Records for Verification of Agri-credit documents: SBP has
been promoting the use of ICT and alternative delivery channels for delivery of financial services. SBP during
the year facilitated signing of an MOU between Pakistan Agriculture Research (PAR), UBL and Sindh Board
of Revenue (BoR) to initiate a pilot project to collect farmers’ information through mobile phone applications
to be used by the bank for selection of borrowers. Simultaneously, the review and verification of clients’ land
and cultivation record will also be made available to the bank by BoR through an online portal.
Pilot project for improving farmers’ productivity through use of Unmanned Aerial Vehicles (UAV)
technology: SBP, in collaboration with University of Agriculture Faisalabad (UAF), is supporting a pilot
project wherein borrowers of participating banks (ZTBL, NBP and Faysal Bank) will be provided with
technical advisory for crop management and yield enhancement through the use of modern technology and
quality inputs, precision agriculture, timely availability of financing and guidance through service providers.
The information gathered through UAV technology will also be beneficial for the banks in assessing their
portfolio quality and taking timely corrective measures where necessary.
Training program on Islamic Agriculture Financing: In order to promote Shari’ah based agricultural
financing, 02 five-day training programs were organized in Karachi and Lahore. Over 40 participants
comprising banks’ agriculture credit heads, product specialists, agri. sales team, credit team and risk managers
attended the programs. The training programs were conducted by industry and subject experts and Shari’ah
scholars with the intent of enhancing banks’ capacity in developing financing products for the agri-sector.
4.3 Microfinance The microfinance banking industry grew by
52.5 percent during the year with its assets
base reaching to Rs 203.3 billion and
microcredit portfolio to Rs 111.9 billion as
at end FY17. Similarly, the number of
borrowers of MFBs grew by 29.9 percent to
2.209 million during FY17.
Microfinance banks (MFBs) collectively
injected fresh equity of Rs 5.25 billion
during FY17, which resulted in 23.2 percent
increase in overall equity base that reached
Rs 27.9 billion at the end of FY17 from Rs 22.7
billion last year. The growth in MFBs’ deposits
base also remained impressive at 68.3 percent
during the period with the aggregate deposit
base reaching Rs 146.5 billion compared to Rs
87 billion as at the close of preceding year.
Concurrently, the number of depositors
increased to 21.951 million from 12.782 million last year thus registering a 71.7 percent growth in
retail outreach over June, 2016 (see Table 4.3). The impressive growth in the amount and the number
of depositors can be ascribed to large number of M-wallet accounts mobilized by Mobilink
Microfinance Bank (MMFB). During FY17, MMFB alone contributed 84.1 percent (or 7.7 million) of
9.1 million additional deposits mobilized by the MFBs.
As of June 2017, the microfinance sector comprises of 51 microfinance providers including 11deposit
taking MFBs licensed by SBP and 40 Non Bank – Microfinance Providers licensed by the Securities
& Exchange Commission of Pakistan. The sector was able to extend micro-credit services to over
5.202 million low income borrowers by June 30, 2017, registering an increase of 25 percent from
Table 4.3: Microfinance Banking Indicators (Rupees in billions)
Indicators FY16 FY17 Annual
Growth
No. of Borrowers 1,700,302 2,209,237 29.9%
Gross Loan Portfolio 72.861 111.859 53.5%
Deposits 87.023 146.455 68.3%
No. of Depositors 12,781,691 21,951,479 71.7%
Equity 22.677 27.930 23.2%
Assets 133.324 203.302 52.5%
Borrowings 14.576 13.873 4.8%)
Source: Agricultural Credit & Microfinance Department, SBP.
Table 4.4: Microfinance Industry Indicators
(Rupees in billions)
Indicators FY16 FY17 Annual
Growth
Total No. of Borrowers 4,161,247 5,202,872 25.0%
Gross loan portfolio 108.881 171.008 57.1%
Average Loan Balance (in Rs.) 26,165 32,868 25.6%

State Bank of Pakistan Annual Report FY17
46
4.161 million last year. Concurrently, a growth of 57 percent (or Rs 62.127 billion) was also
registered in the gross loan (micro-credit) portfolio that increased to Rs 171 billion from Rs 108.8
billion during the preceding year. The average loan balances also increased by Rs 6,703 (or 25.6
percent) to reach Rs 32,868 (see Table 4.4).
Box 4.6: Initiatives for Promotion of Microfinance Banking during FY17
Strengthening of AML/CFT Regime for MFBs: SBP has further strengthened regulations regarding
AML/CFT Regime in MFBs. MFBs are required to install Biometric Verification System (BVS) on all
branches by end 2017. They shall develop a Transaction Monitoring System (TMS) by June 30, 2018 capable
of producing meaningful alerts based on pre-defined parameters/thresholds for analysis and possible reporting
of suspicious transactions.
Amendments in MFI Ordinance 2001: The major amendments being proposed in the MFI Ordinance are:
Surrender of Unclaimed Deposits/electronic money with Branchless Banking to SBP as required
under Section 31 of BCO 1962 and BPD Circular Letter No.21 of 2004.
Applicability of the Financial Institutions (Recovery of Finances) Ordinance, 2001, to MFBs.
Inclusion of MFBs in Banking Mohtasib’s jurisdiction.
Prudential Regulations for MFBs are also being amended, the major proposed amendments are:
Inclusion of new definitions in the Regulations
Inclusion of Islamic microfinance terms in the Regulations
Upward revision of micro credit limits for borrowers
Facilitated the creation of Pakistan Microfinance Investment Company (PMIC) for providing funding to
liquidity constrained MFBs and MFIs.
A Line of Credit (LoC) is being established with the funding support of the Government of Pakistan under
World Bank’s Financial Inclusion Infrastructure Project. The LoC will allow MFBs to improve women and
microenterprises’ access to credit.
4.4 Small and Medium Enterprise Finance The SME sector contributes significantly in economic and social development especially through
employment generation and poverty alleviation. In Pakistan, the SME sector contributes 30 percent
towards the country’s GDP, employs more than 80 percent of the non-agricultural workforce,
accounts for 35 percent of the value added in the manufacturing industry and generates 25 percent in
the export earnings.
Financial sector penetration generally remains low for SMEs. The key reason for this includes banks’
hesitance to lend to SMEs. A number of factors contribute to this reluctance including a high risk
perception, high transaction cost of lending and products suitcase that is incompatible with the SMEs’
business needs. Equally important are the demand side issues which limit SMEs ability to access
financial services from formal banking channels. The demand side issues include low level of
financial literacy; high transaction cost and lack of proper accounts management by SMEs.
The FY17 however witnessed some positive trends in financing to SMEs, which grew by 28 percent
to Rs 380 billion as at end June 2017. The number of SME borrowers also increased from 164,733 in
June, 2016 to 176,847 in June, 2017 registering a growth of 7 percent. The Non Performing Loans
(NPLs) ratio for SMEs also declined from 27.37 percent in June 2016 to 20.69 percent in June 2017.
Further, details of initiatives taken by SBP for promotion of SME financing are given in Box 4.7.

Broadening Access to Financial Services
47
Box 4.7: Major Initiatives to Promote SME Finance during FY17
SME Financing Targets: SBP introduced SME financing targets for banks and DFIs for the first time in
2016. The targets assigned to banks/DFIs for CY 2016 were fully achieved and SME financing crossed Rs 400
billion as of December 2016. Share of SME financing in total private sector credit also increased from 8
percent in December 2015 to 9 percent in Dec-16 (an increase of around Rs 96 billion from December 2015
to December 2016). It is expected that SME financing portfolio will reach over Rs 500 billion by end of
December 2017 as per SBP assigned targets.
Strengthening Secured Transactions Reform Framework: Financial Institutions (Secured Transactions)
Act, 2016 has been approved that provides for establishment of Secured Transaction Registry Office in the
country to register charge on assets especially moveable assets of borrowers, particularly, un-incorporated
companies. SBP has started working with MoF and World Bank to establish the secured transactions registry
in a timely manner.
Credit Guarantee Scheme for Small and Rural Enterprises: Credit Guarantee Scheme (CGS) for Small
and Rural Enterprises was launched in March 2010 in collaboration with UK’s Department for International
Development (DFID). The Scheme provides risk coverage of upto 60 percent to lending banks on their short
to medium term loans to small, micro and rural enterprises. To improve the scheme’s structure and usability,
some important changes were introduced in January, 2017. The risk coverage increased from 40 percent to 60
percent for women borrowers, start-up businesses and small, rural and micro enterprises operating in the
under-served areas of the country. Moreover, the extent of risk coverage has been linked with the level of loan
collateralization. The lower the loan collateralization, the higher is the risk coverage extended under the
Scheme. This will encourage banks to lend to fresh and collateral deficient borrowers. In addition, the
participating financial institutions have been provided the facility of financial assistance under the Scheme,
whereby they can claim 2 percent of the allocated guarantee limit against the expenditure incurred by them to
target specific sectors under the Scheme.
Refinancing Facility for Modernization of SMEs: It is a medium to long term financing facility provided to
SME borrowers as defined in SBP prudential regulations for modernization of their existing units and setting
up of new SME units to produce quality products. Under this facility, financing is available against local
purchase/import of new machinery for BMR at subsidized rate for a maximum period of 10 years. To
encourage banks and DFIs to increase financing under this Scheme, the spread of banks/DFIs has been
increased to 4 percent against loans of all tenors under the Scheme.
Prime Minister Youth Business Loan Scheme (PMYBL): Government has provided an opportunity to
banks to increase their outreach and capture new SME clients/startups especially small enterprises through the
PMYBL Scheme. SBP supervises this scheme and closely monitors performance of banks under this Scheme.
Eighteen banks are working as PMYBL executing agencies. As of June 30, 2017, cumulative number of
applications received under PMYBL was 80,991. Cumulatively, 18,443 beneficiaries had been disbursed an
amount of Rs 18,483 million.
SME Melas: SBP in coordination with SBP-BSC offices organized four Melas (Expos) during the year. The
events witnessed active participation from the banking industry, SMEDA, chambers of commerce and
industry and SMEs. The Melas provided an effective platform for interaction between the SMEs and the
banking sector enabling them to better appreciate each others’ stance on issues related to SME finance and
resolution thereof. These Expos provided the banks an opportunity to market their SME specific financing
products and better understand the needs and requirements of SMEs for bringing about further improvement.
Capacity Building/Training Sessions: SBP as part of efforts to promote SMEs access to finance conducted
and arranged training pertaining to SME supply chain financing, SME banking and finance, business potential
of marble and granite sector, and NFAS (Non Financial Advisory Services). Moreover, to further the cause,
SBP launched various SME certification courses in association with IBP. These training programs targeted
credit risk managers, credit administration personnel, branch managers and relationship managers.
SME Web Portal: SME web portal was established in FY 2017 with the aim of facilitating all the relevant
stakeholders to access information related to SMEs from a single platform. A well diversified set of
information is accessible through this web portal including policies and regulations with respect to SME
finance, various SBP refinance facilities, SME related events and seminars and international publications.
Efforts are being made to increase the richness of information available at the web portal.

State Bank of Pakistan Annual Report FY17
48
4.5 SBP Refinance Facilities SBP is constantly pursuing its objectives of facilitating the exporters and industrialization of the
country by providing financing under its short term and long term financing schemes. Following are
the initiatives taken by SBP to boost country’s exports and industrialization.
4.5.1 Export Finance Scheme
The markup rate on loans under Export Finance Scheme (EFS) was brought down to 3.0 percent with
effect from July 1, 2016 to facilitate exporters in enhancing exports. Three months additional period
was allowed to exporters of rice and leather sectors facing problems in achieving required export
performance to enable them to meet the performance under EFS Part–II for FY16. The outstanding
export finance as of June 30, 2017 was Rs 237.4 billion which is 16.7 percent higher than the
preceding year.
4.5.2 Long Term Financing Facility
SBP maintained mark up rate under Long Term Financing Facility (LTFF) for export oriented
projects at 6 percent during FY17. The mark up rate under LTFF was further reduced to 5 percent for
textile sector including spinning and ginning sub-sectors. During FY17, Rs 47.3 billion were
disbursed under the LTFF as compared to 24.7 billion in the preceding year, whereas, the total
outstanding financing under the LTFF as on June 30, 2017 stood at Rs 82.8 billion.
4.5.3 Other SBP Refinance Facilities
To reduce financial cost for investment in agriculture, SME and renewable energy sectors, the markup
rates for following long term schemes were maintained at 6 percent p.a. during FY17:
Financing Facility for Storage of Agricultural Produce
Refinancing Facility for Modernization of SMEs
Scheme for Financing Power Plants Using Renewable Energy
4.6 Housing Finance The housing finance sector also kept its growth momentum during the year with outstanding amount
of housing finance increasing by 15.5 percent to Rs 75.9 billion as at end June, 2017 from Rs 65.7
billion last year. The mortgage to GDP ratio, in Pakistan, is around 0.5 percent, which is very low
when compared with other regional countries like India. Considering the low penetration of banks and
FIs in the country housing finance market, the SBP has been making concerted efforts to help develop
the sector through policy, regulatory and promotional initiatives.
Following major initiatives were taken during the year to promote housing finance in Pakistan.
Pakistan Mortgage Refinance Company (PMRC)
The establishment of the mortgage refinance company will provide long term funding to banks and
financial institutions against their housing finance portfolio. This would address a major issue
hindering the growth of primary mortgage market in the country. The PMRC would serve as a secured
source of long-term funding at attractive rates for banks. It was incorporated with SECP in 2015 and
its Board was also constituted. Further, the Federal Government and banks are in the process of
injecting the committed equity.
Amendments in Housing Finance Prudential Regulations
To strengthen the existing regulatory framework for housing finance, market consultation was carried
out and based on the stakeholder’s feedback; the Prudential Regulations have been revised to facilitate
the growth of the sector.

Broadening Access to Financial Services
49
Consumer Awareness Sessions on Housing Finance for General Public
Through continued efforts of SBP, most of the financial institutions are now offering housing finance
products. Furthermore, declining interest rate in Pakistan has also enhanced the affordability of
mortgages. To create awareness among general public about available housing fiancé products, SBP
during the FY 16-17 organized awareness sessions in Multan, Lahore and Rawalpindi respectively.
4.7 Infrastructure Finance and Green Banking Infrastructure projects have recently seen increase in financing from banks and DFIs. As of June
2017, the outstanding amount against infrastructure sectors reached Rs 557.8 billion as compared to
Rs 417.8 billion during the previous year, witnessing growth of 33.5 percent. Non-performing loans
(NPLs) as a percentage of gross outstanding loan portfolios decreased from 3.39 percent in June 2016
to 2.46 percent in June 2017.
The Green Banking initiative, which was initiated around two years back, started maturing into a
recognized activity off-shooting into a number of developmental measures during the year. The Green
Banking may be seen as a model of banking that envisions reorientation of banking practices to
incorporate resource efficiency, renewable energy and environmental protection in their policies,
products, services and operations. The Green Banking has the potential to address two major concerns
of Pakistan i.e. energy shortfall and climate change. Further, major initiatives taken by SBP to
promote infrastructure finance and green banking during the year are given in Box 4.8.
Box 4.8: Major Initiatives to Promote Infrastructure Finance and Green Banking
Prudential Regulations for Infrastructure Project Financing: Banks/DFIs had proposed, at different
forums, to introduce a separate set of prudential regulations for infrastructure financing in line with similar
regulations for SMEs, Housing and Agriculture financing. The Prudential Regulations for Infrastructure
Project Financing were issued vide IH&SMEFD Circular No. 06 dated December 30, 2016. Apart from
providing prudent measures to banks/DFIs in financing infrastructure, these regulations also provide
incentives/ regulatory relaxations for encouraging lending to this important sector.
Revised SBP Financing Scheme for Renewable Energy: The revised refinancing scheme for renewable
energy was issued in June 2016. Under this Scheme, end borrowers can avail financing up-to Rs. 6 billion at a
subsidized rate of 6 percent for 12 years. Financing can be availed for installation of up-to 50 MW hydro,
solar, wind, biomass based renewable energy projects. Further, the scheme also incentivizes establishment of
small scale renewable energy solutions of less than 1 MW. Since the issuance of this revised facility in 2016,
SBP has approved financing of Rs 21.9 billion against requests for 12 renewable energy projects out of which
Rs 3.65 billion has already been disbursed. The outstanding refinance under the Scheme, as of June, 2017 is
Rs 3.59 billion.
Accreditation under the Green Climate Fund (GCF): SBP has increased collaboration with the Ministry of
Climate Change, Government of Pakistan, to explore possibility of participation of banks/ DFIs under the
UN’s Green Climate Fund (GCF) to attract international funding. A number of banks/ DFIs have shown
interest for accreditation under the GCF. Two banks have submitted their applications for accreditation to the
GCF during the year.
Awareness/ Training Sessions on Green Banking, Renewable Energy and Energy Efficiency Financing:
SBP organized awareness sessions on green banking, renewable energy and energy efficiency financing in
major cities during the year. These sessions were attended by SBP, banks, business chambers and officials
from relevant government departments.

51
5 Islamic Banking
5.1 Overview During FY17, the Islamic Banking
Industry (IBI) continued its growth
momentum, recording improvement in all
key performance indicators. Assets and
deposits of IBI reached Rs 2,035 billion
and Rs 1,720 billion, with encouraging
growth of 16.6 percent and 17.7 percent,
respectively at end June 2017. The IBI
share in overall banking assets and
deposits also increased from 11.4 percent
and 13.2 percent in FY16 to 11.6 percent
and 13.7 percent respectively during FY17 (Table 5.1).
Another key area showing strengthening of the Islamic banking industry is improvement in the
financing to deposit ratio (FDR). The FDR of IBI stood at 56.8 percent markedly surpassing the FDR
of conventional banking industry, which stood at 48.7 percent as at end June 2017. This points to
more focus of Islamic banking institutions on core banking business as compared to their
conventional counterparts. The growth of the industry and its growing market share in overall banking
industry seems promising in view of its shorter history as compared to the long established
conventional banking.
In terms of outreach, the Islamic banking industry has further strengthened its presence across the
country. During the year, 21 Islamic banking institutions (5 full-fledged Islamic banks and 16
conventional banks having Islamic banking branches) were operating in the country. During the
period under review, Burj Bank Limited was merged into AlBaraka Bank (Pakistan) Limited, owing
to which the number of IBIs adjusted at 21. Branch network of IBI reached to 2,320 branches spread
across 110 districts of the country as of June 30, 2017.
5.2 Initiatives for Promotion of Islamic Banking The consistent positive growth of the Islamic banking industry among others can also be attributed to
the supportive policy and regulatory environment being promoted by SBP. The SBP efforts and
initiatives for promotion and growth of Islamic banking have national and international recognition.
The following section highlights the key initiatives taken during FY17 for promotion of Islamic
banking in the country.
5.2.1 Committees for Promotion of Islamic Banking
For development of Islamic banking and finance in the country, a high level Steering Committee was
constituted by the Federal Government in December 2013. The Steering Committee comprised of
renowned Shari’ah scholars, senior government officials, industry experts and business leaders. The
committee submitted its report in March 2016 and gave several recommendations for development of
the Islamic Banking Industry on sound footings. In order to implement the recommendations of the
Table 5.1: Industry Progress and Market Share (Rs in billions)
Islamic Banking Industry
Progress
Growth (YoY) Share in Overall
Banking Industry
Jun-16 Jun-17 Jun -16 Jun-17 Jun-16 Jun-17
Total
Assets 1,745 2,035 16.8% 16.6% 11.4% 11.6%
Deposits 1,461 1,720 14.1% 17.7% 13.2% 13.7%
Total IBIs 22 21 _ _ _ _
Total
Branches* 2,146 2,320 26.1 16.3 _ _
Source: Data/information submitted by banks under quarterly Reporting Charts of Accounts (RCOA)
*Number includes sub-branches

State Bank of Pakistan Annual Report FY17
52
Steering Committee, an Implementation Committee and its four Sub-Committees have been formed
by the Government, namely:
(1) Sub-Committee on Legal and Regulatory Framework
(2) Sub-Committee on Taxation
(3) Sub-Committee on Islamic Capital Market
(4) Sub-Committee on Awareness and Capacity Building
These sub-committees are working diligently for smooth and efficient implementation of the Steering
Committee’s recommendations in their respective areas.
5.2.2 Exemption from KIBOR as Benchmark Rate
SBP, being aware of the significance of innovation, provides full support to the Islamic banking
industry and aligns its regulatory and supervisory framework to the ongoing changes in the industry
dynamics. To encourage participatory modes of financing, the Islamic banking institutions (IBIs),
during the year were exempted from the requirement of using KIBOR as benchmark rate on
Musharakah, Mudarabah and Wakalah (Agency) based financing. This will not only encourage IBIs
to make more use of participatory modes of financing but will also increase confidence of masses in
Shari’ah compliant financial system of the country.
5.2.3 External Shari’ah Audit Report - Shari’ah Governance Framework
For strengthening Shari’ah Governance Framework and to ensure transparency, necessary instructions
were issued to IBIs during FY17 on the role and responsibilities of external Shari’ah auditors. The
instructions cover important areas including avoidance of conflict of interest, training and capacity
building of staff of external Audit firms in Shari’ah audit, Fit and Proper Criteria (FAPC) for Shari’ah
scholars to be engaged for external Shari’ah audit of IBIs, verification of distribution of profit and loss
to the depositors prior to its disbursement, submission of copy of external Shari’ah audit report to
SBP.
5.2.4 Publication of Urdu Translation of Shari’ah Board Report
In order to enhance public understanding of IBIs’ Shari’ah Boards’ reports, IBIs were advised to
publish the Urdu translation of their Shari’ah Board’s report in their annual report with effect from
December 31, 2016.
5.2.5 Tax Neutrality
The tax neutrality for Shari’ah compliant banking is an essential component of the overall policy
environment for development of Islamic banking and finance. The Government on the SBP’s
recommendation provided the much needed and long awaited tax neutrality to Islamic banking
industry through Finance Bill 2017. The major changes in the taxation laws and provisions made for
the purpose include the following:
Trade based Islamic modes of finance offered by Islamic financial institutions (IFIs) have
been exempted from definition of “Supply” under Sales Tax Act 1990. This will exempt the
purchases made by IFIs for onward sale to their clients under trade based modes of finance
from the levy of sales tax.
Customers availing financing under Musharaka and Diminishing Musharaka modes have
been provided with equal tax treatment as available under conventional financing products.
Turnover tax on Murabaha and Commodity Murabaha transactions to be levied on gross
income instead of gross receipts.
Allowing benefit of depreciation under Ijarah financing.

Islamic Banking
53
5.3 Liquidity Management Solutions for Islamic Banking Industry Considering the importance of liquidity management solutions for Islamic banking industry, SBP has
been conducting Shari’ah compliant Open Market Operations (OMOs) by utilizing Ijara Sukuk (Bai
Muajjal of Sukuk) issued by the GOP. During FY17, the following transactions were carried out by
GoP and SBP to offer such mechanism/product to the industry for its liquidity management:
GoP Ijara Sukuk-In support of the objective to provide the Islamic financial market an
investment avenue amid rising liquidity levels, SBP, with consultation and consent of GoP,
successfully conducted auction of Fixed Rental Rate-Government of Pakistan Ijara Sukuk
(FRR-GIS) on June 29, 2017 to raise Rs 71.007 billion for the GoP.
Bai-Muajjal of GIS by SBP-Under this transaction, SBP purchased GoP Ijara Sukuk (GIS-
15) worth Rs 7.15 billion and 17.492 billion from IBIs on Bai-Muajjal basis for a period of 6
months and one year respectively through competitive auction process.
5.4 Awareness and Capacity Building Programs As per recommendations made by the high-powered Steering Committee, SBP is actively engaged in
awareness creation among masses and capacity building of the industry. During FY17, SBP in
collaboration with various reputed national and international institutions arranged following seminars,
training programs and workshops on Islamic banking:
Seven iterations of a training program titled “Fundamentals of Islamic Banking Operations
(FIBO)”were completed in collaboration with National Institute of Banking and Finance
(NIBAF) at Peshawar, Lahore, Sargodha, Hyderabad, Sialkot, Islamabad and Quetta. This is a
special training program designed for branch managers, operation managers, and relationship
managers of banks. The academia engaged with Islamic Banking and Finance and local
Shari’ah scholars are also invited in these programs.
A seminar on Islamic finance was organized in Lahore in collaboration with ‘Islamic Finance
News – RED Money Group’, the world's leading Islamic finance news provider. The program
was well represented by local Islamic finance industry. The special feature of this event was
a ‘Closed-Door Dialogue’ wherein the think-tank had critical review of the current profile of
the industry to make recommendations in setting its future direction.
In order to broaden the talent pool of Shari’ah scholars for Islamic financial industry, a
religious school was facilitated in designing and conducting a customized training program
for those Shari’ah scholars who were not associated with Islamic financial industry. The
initiative has been quite successful to provide Shari’ah scholars a platform wherein they
could see the practical application of Shari’ah principles in developing banking solutions.
SBP also facilitated COMSATS University to conduct awareness-cum-capacity building
programs for bankers, Shari’ah scholars and academia in six cities of second tier category;
Abbottabad, Attock, Sahiwal, Wah Cant, Vehari and Islamabad. The inaugural program of the
series was conducted at Abbottabad during the year, which was well received by the
participants.
SBP supported Dunya Media Group in its Islamic Finance Awareness Drive 2017 for
enhancing awareness about Islamic finance among the masses. Under the Drive, awareness

State Bank of Pakistan Annual Report FY17
54
sessions were arranged for different stakeholders at Chambers of Commerce and Industries,
and leading educational institutes.
5.5 Global Participation
Having developed and put in place a robust regulatory and Shari’ah governance system for Islamic
banking industry, SBP is recognized as an active global partner. Its representation and active
participation in various forums of international institutions dealing with Islamic finance is considered
instrumental in crafting the future outlook of Islamic financial industry. SBP has been actively
represented in various working groups, tasks forces, technical committee and Council of Islamic
Financial Services Board (IFSB) and has actively contributed in the development of prudential
standards for global Islamic finance industry. Further, SBP also participated in various senior level
programs arranged by international institutions like IFSB, Accounting and Auditing Organization for
Islamic Financial Institutions (AAOIFI) Islamic Research and Training Institute (IRTI), and Islamic
Development Bank (IDB).
5.5.1 Global Recognition
SBP was given an honorary award in recognition of contributions made to the global Islamic banking
and finance industry at the Islamic Finance Forum of South Asia (IFFSA) Awards 2016, held in
Colombo, Sri Lanka. Further, Global Islamic Finance Awards (GIFA) Committee gave Special Award
(Advocacy Role) 2016 to Mr. Saeed Ahmed, the then SBP Deputy Governor for spearheading several
key initiatives to promote and develop Islamic banking and finance industry of Pakistan.

55
6 Institutional Strengthening
6.1 HR Developments The SBP Vision 2020 envisages significant
enhancement in the HR skill mix of the Bank through
training and capacity building initiatives and fresh
inductions at entry, middle and senior management
levels. For achieving the requisite improvement in the
skills mix a focused approach was adopted whereby the
line departments were mobilized to partner with HR
group. The year witnessed major initiatives in the areas
of workforce rationalization, talent resourcing,
promotions, capacity building and HR automation.
6.1.1 HR Profile
The Bank’s initiatives are designed to ensure that its total
HR resource mix remains relevant and competitive. During
the year, the Bank’s workforce increased by 2 percent,
from 1,190 employees in FY16 to 1209 employees. The grade-wise comparison of organizational
workforce for FY17 and FY16 is given in Table 6.1. The Bank places a high priority on continuously
improving gender composition across different hierarchies. Currently, the female representation is at
11 percent as compared to 10 percent in the preceding year. The employee turnover was recorded at
1 percent as compared 2 percent in FY16.
6.1.2 HR Planning
The annual HR planning exercise was conducted to assess
the manpower requirements in the light of business needs,
departmental structure, existing working strength and future
developmental projects. After detailed review and
discussion with concerned Directors, the Manpower
Rationalization Committee approved 63 additional
vacancies during FY17.
Reorganization
During FY17, the ‘Office of Chief Information Security
Officer’ (CISO) was established to formulate and
implement the IT security strategy. The CISO Office shall
identify, develop, implement and maintain processes to
reduce Information Technology (IT) risks in the Bank while
establishing appropriate standards and controls.
Talent Resourcing
The SBP pursued a merit-based talent resourcing policy
under which it initiated several recruitment drives to equip
the Bank with qualified candidates at the entry and mid-to-
senior level positions. Based on the manpower
Table 6.1: HR Profile of State Bank of Pakistan
Position/Grade FY17 FY16
Governor/DGs 2 3
OG-8 13 12
OG-7 33 37
OG-6 58 51
OG-5 113 108
OG-4 227 218
OG-3 321 272
OG-2 296 298
OG-1 36 70
Support Staff 104 114
Contractual
Employees 6 7
Total 1,209 1,190
Table 6.2: Recruitments during FY16
Grade & Designation Numbers
OG-2
Assistant Director 60
Junior Software Engineer 6
Legal Officers 4
IT Auditors 4
Assistant Director- IT Security 2
IT Professionals 3
OG-3
Law Officers 2
Senior Analyst 2
Deputy Director- Financial Stability 2
Deputy Director- Finance 4
Executive Secretary 2
OG-7
Chief Information Security Officer 1
Contractual Hiring
Scholars for SBP Memorial Chairs 4
Museum & Art Gallery 2
Grand Total 97

State Bank of Pakistan Annual Report FY17
56
requirements, 60 fresh graduates were inducted through State Bank Officers’ Training Scheme
(SBOTS) and Economic Analysts Training Scheme (EATS). Additionally, 37 professionals were
appointed on lateral hiring in the specialized areas of Information Technology, Internal Audit,
Financial Stability, Law and Finance. The Grade-wise recruitments made during FY17 are shown in
the Table 6.2.
Employer Branding
The Bank has taken several initiatives to promote SBP as an ‘employer of choice’ for young graduates
as well as for senior professionals. The annual internship programs being organized regularly and
visits of SBP middle and senior management officers to reputed Business Schools and Colleges across
are targeted towards this end. Further, to increase the outreach and utilize social media platforms,
advertisements for various positions were also posted on the official Twitter and LinkedIn accounts.
Further, to encourage Pakistanis living abroad, platforms like “jobs.ac.uk” and American Economic
Associates were also utilized. The career page of SBP website was revamped to incorporate essential
details for stakeholders. Going forward, the Bank would introduce E-Recruitment module which shall
improve the processes, add efficiency and reduce turn-around time of recruitment cycles.
Career Development
Providing fair and transparent career development opportunities to
all employees is an important part of SBP strategy to maintain a
highly skilled and motivated workforce. Keeping in view with
organizational requirements, 185 promotions were made in
various grades during the year as shown in Table 6.3.
Capacity Building
During FY17, 110 in-house training programs were conducted
through NIBAF on the basis of Training Need Assessment
conducted in FY16. Further, to ensure a pool of internal resources, a select group of officers went
through a comprehensive residential ToT program on Instructional Design. Additionally, specialized
institution-wide trainings covering International
Certification of Enterprise Risk Management
and International BCP Good Practice Guideline
were conducted. A refresher course for OG-1
officers was also conducted which was attended
by 58 officers.
The local trainings were supplemented with
foreign trainings in reputed international
institutions/ central banks. Accordingly, 244
officials proceeded on foreign trainings/
seminars/ study visit programs during the period.
Employee Engagement Survey
In FY17, the Bank conducted the Employee
Engagement Survey through a Consultant,
wherein 74 percent of the Bank’s officers
participated in the survey. The survey was aimed at gauging the level of engagement and
disengagement at SBP and to recognize factors that affect the employee engagement level. Based on
Table 6.3: Grade-wise Promotion
Promotion to Grade No. of Officers
OG-8 3
OG-7 1
OG-6 8
OG-5 20
OG-4 35
OG-3 86
OG-2 32
Total 185
Table 6.4: Foreign Trainings/ Seminars
Organization/ Institute Participants
International Monetary Fund 57
Deutsche BundesBank 14
Federal Reserve Bank of New York 13
Bank Negara, Malaysia 4
SEACEN Centre 2
Bank of England – CCBS 4
Financial Stability Institute – Bank of
International Settlements 8
Study Centre of Gerzensee 4
Asian Development Bank 4
World Bank 11
Others 123
Total 244

Institutional Strengthening
57
the survey results, action plan will be prepared to address the identified issues which cause employee
disengagement.
6.1.2 HR Automation Initiatives
To improve service delivery standards, various HR operations were automated which are briefly
discussed as follow:
Implementation of Promotion Module
The promotion application process was automated during the year, which enabled integration of
various functions e.g. PMS, qualification, training, leave, last promotion date, etc. The module will
also generate multiple reports related to the promotion process including the evaluation reports.
Updation in Training Module
In order to keep track of the individual mandatory training hours, real time access was also given to
officers while the Departmental Training Coordinators were given access to monitor their
departmental training hours and foreign training data.
Updation in Rest and Recreation Module Subsequent to introduction of Online Leave Application, its inter-linkage has been created with Rest
and Recreation (R&R) Module to automate disbursement of R&R allowance
Internship
As a part of corporate social responsibility and to promote SBP as the employer of choice, the annual
6-week Summer Internship Program was arranged for students of Bachelors/ Masters Degree
programs. Over 100 students from major educational institutions across the country as well as reputed
foreign universities attended the internship program. The program enabled the participants to enhance
their understanding of central banking functions and help build SBP’s image as an employer of
choice.
6.1.3 Future HR Initiatives
Having a futuristic outlook, the SBP is committed to ensure alignment of its workforce with the
organizational strategic objectives. In this regard, various HR policies are being reviewed to meet the
changing dynamics of the organization. Further, to build a competency-based assessment framework,
SBP would introduce Assessment and Development Centre which would be used as a systematic tool
for evaluating potential and existing employees against a required set of competencies and skill set.
The project on ‘Workload Analysis and Job Evaluation’ will also be undertaken to determine the ideal
headcount of the organization and assess the need of various jobs on a set of defined factors. A
holistic review of PMS and reward system has also been made by the HR Consultant which would
result in introduction and implementation of new system as per best market practices. Going forward,
the strategic partnership between the HR and line departments would be further strengthened to fully
align the HR capacity with the strategic goals.
6.2 Strengthening IT Systems The development of a secure, reliable and robust IT infrastructure is a critically important component
of SBP’s strategy for institutional strengthening. The initiatives taken in this direction included
implementation of Knowledge Management Program, upgradation of application software / IT
systems, automation of business process and implementation of security protocols / policies.

State Bank of Pakistan Annual Report FY17
58
6.2.1 Enterprise IT Strategy
A comprehensive IT Strategy was developed during the year, which provides a roadmap for
revamping of the existing IT infrastructure and moving towards next generation of systems to enable
the Bank to achieve its strategic objectives and improve its business operations. The emerging
challenges like IT security, IT governance and standardization, optimization and an accelerated move
towards a digital working environment are the key strategic drivers of the IT Strategy.
6.2.2 Knowledge Management Program
In order to achieve excellence in IT usage and move towards corporate digital operating environment,
an Enterprise wide Knowledge Management Program was initiated under strategic objective of SBP
Vision 2020. The program has following three stages:
Phase-I: Electronic Case management and enterprise content management
Phase-II: Identification and preservation of other knowledge assets, and historical record
Phase-III: Accessing and preservation of tacit knowledge
A high level road map for the Phase-I has been developed and after review of similar systems
implemented in world’s leading institutions like Asian Development Bank, Bank Negara Malaysia
and Securities Commission Malaysia, the procurement process for acquisition of requisite technology
components has been initiated.
6.2.3 Establishing New Main Data Center & strengthening Technology Infrastructure
The replacement of existing Main Data Center with a new state of the art facility as per best industry
standards is the key initiative under IT strategy developed during the year. The architecture and low-
level design of the Data Center has been finalized and various alternatives are being evaluated to take
the project forward to the next level i.e. acquisition and implementation phase. For strengthening the
technology infrastructure, the latest virtualization based technology have been adopted and the
existing Servers and allied components e.g. storage area network and operating systems have been
replaced with state of the art systems for hosting new and upgraded business systems and
applications. Further, more than 500 desktop computers and laptops after reaching obsolescence have
been replaced organization wide. The IT security fabric of the setup has been further enhanced in
critical business domains by employing Intrusion Detection and Prevention Systems and related
process controls. A comprehensive cyber security assessment has also been carried out with the help
of the World Bank’s experts and changes in IT governance and access control are being made
accordingly.
6.2.4 Core Business Application Upgrades
The Real Time Gross Settlement System, which was deployed in 2008-09, has been successfully
upgraded for improving its reliability and performance. Additional corporate payment streams with
IBAN support have been added in the system. Similarly, the migration of Globus Currency Issue and
Management Systems to its latest release of T24 has been successfully completed; whereas migration
of Core Banking System is in progress which is expected to be completed by November 2017.
6.3 Enterprise Risk Management (ERM) The Bank has completed two rounds of Risk Control and Self Assessment (RCSA) through bottom up
approach for risk identification, analysis, prioritization and mitigation for its staff and subsidiaries. An
Incident Reporting Policy has been introduced and enforced across the organization for report of
incidents to provide information on control weaknesses to trigger remedial actions in order to
strengthen the Bank’s risk management framework. The Banks’ Enterprise Risk Management
Framework has been reworked to align risk assessment process with modern techniques and to make

Institutional Strengthening
59
it as objective as possible. The Bank has also arranged multiple training sessions on ERM to foster
risk culture and enhance capacity of its employees in ERM.
6.3.1 Investment Risk Management
In order to bring its investment risk management function at par with global best practices and
effectively manage/mitigate the multifaceted risks emerging from reserve management activities, the
Bank has broadened the coverage of market and credit risk indicators. These indicators enabled the
bank to monitor credit risk build-up through industry, sector and security specific implied risk
premiums. Additional market risk indicators are key inputs for carrying out customized stress testing
and formulating expected scenarios that may increase downside risk. In addition, to mitigate the risks
associated with outsourced portfolios, the fund managers due diligence mechanism was significantly
strengthened by analyzing their policies such as stop-loss limit, derivative usage policies, transaction
processing, and internal controls. Fund managers’ selection framework was also aligned with the
reserve management objectives by incorporating guidelines and procedures for carrying out
comprehensive assessment of investment philosophy and capabilities, security selection mechanism,
portfolio construction process, and risk control environment of prospective managers.
6.4 Business Continuity Management
The Business Continuation Plan (BCP) is aimed at ensuring continuity of critical functions and
preventing any major disruption in financial system of the country in the face of a catastrophe such as
natural disaster, fire, civil strife, sabotage or an act of war. The Bank has improved its level of
preparedness and readiness to an unprecedented level by establishing a state of the art Disaster
Recovery (DR) Site and fully equipped Backup Site(s) for critical time sensitive functions. The Bank
periodically tests its DR and Back-up sites to assess the robustness of the Bank’s BCP at all the field
offices. Training workshops are also conducted for the critical persons to keep them abreast with the
latest developments in BCP. To increase the level of readiness at the central bank, following
initiatives were taken during the year:
Around 200 BCP exercises were conducted in SBP and SBP-BSC. Additionally, quarterly
BCP Combined Staff Relocation Exercises were conducted that included participants from all
the critical and support departments of SBP and SBP-BSC.
A Critical Functions Review Committee (CFRC), comprising of Chief Managers and BCP
Coordinator to review the critical functions of the field offices and the existing BCP
document was formed. The CFRC worked to assess the criticality of functions,
interdependencies between different functions, legal / statutory obligations and documents
and resources required to ensure continuity of the critical functions. The CFRC had proposed
function based templates for outlining critical functions.
The BCP Communication Cards were updated. The cards ensure that in the event of a
disaster, the key persons are contacted in a planned manner. These cards clearly elaborate the
responsibilities of various committees for managing the situation under crisis, a brief on what-
to-do list and information on the activation levels.
SBP has included certification from Business Continuity Institute (BCI) in the approved list
of certification under Professional Development Incentive Program (PDIP). During FY17, six
officers of SBP acquired international BCP certification from BCI, UK.

State Bank of Pakistan Annual Report FY17
60
SBP acquired corporate membership of BCI, UK. This membership would provide SBP
access to a wealth of information on the subject as well as to international forums on Business
Continuity Planning (BCP).
6.5 Risk Based Audit Function The Bank has in place an independent internal audit department, providing an independent and
objective audit assurance on the effectiveness of its governance, risk management and control
processes. The Department conducts financial, operational and information technology (IT) audit of
Bank’s operations. The Internal Audit Charter, approved by Audit Committee of the Board, mandates
the independence and authority of audit Department and the Director Audit reports functionally to
Audit Committee of the Board.
The Audit Department also undertakes ongoing quality assurance of audit activities and ensures that
these are in conformance with the international standards and best practices. It is also responsible for
following up and reporting of outstanding audit recommendations on a periodic basis. The internal
audit function also performs special assignments that are received from Governor / Audit Committee.
During FY17, the following significant initiatives were taken by the Department in line with its
strategic direction:
Provision of End-to-End Assurance and theme based auditing
Adoption of Criteria based auditing
Structured usage of data analytics
Structured usage of sampling techniques
Enhancing audit management software
Enhanced focus on Cyber security and IT Governance
6.6 Legal Services Function
The SBP has an extensive legal services function that ensures that overall business of the Bank is in
full conformity with the laws. For this purpose all major policies and business decisions are legally
vetted by the law professionals in the Bank’s Legal Services Department (LSD). LSD provides legal
opinion to various departments of SBP and its subsidiaries. During FY17, the Department provided
opinion in 3,185 references, forwarded by various departments of SBP and its subsidiaries to ensure
that legal risk associated with the business decision is appropriately addressed. Similarly, the
Department manages litigation cases against SBP and its subsidiaries in consultation with Advocates.
Currently, there are 336 cases where the Bank’s decisions /circulars have been challenged.
During FY17, the Legal Services Department (LSD) has been instrumental in the promulgation of
certain laws which included Deposit Protection Corporation Act 2016, Financial Institutions
(Recovery of Finances) (Amendment) Act, 2016, Credit Bureaus (Amendment) Act, 2016, Foreign
Exchange Regulations (Amendment) Act, 2016, Offences in Respect of Banks (Special Courts
Amendment) Act, 2016 and Financial Institutions (Secured Transactions) Act 2016.
6.7 SBP Library The SBP Library supports research, training and learning initiatives of SBP employees, the banking
community, students, and the general public through provision of high quality books, journals and
other information resources. During FY17, the Library has taken several initiatives for improving
discoverability of its knowledge base, promoting access to electronic sources, enhancing effectiveness
of the Library System and ensuring accuracy in the inventory management. The Library subscribed
Ebsco Discovery Service that has made the searching more simple and efficient through provision of a

Institutional Strengthening
61
single interface for all library databases. The library also subscribed OpenAthens Authentication
Service for selected 200 users, which further simplified the remote accessibility of library resources
beyond office premises and VPN Authentication Service to the entire SBP community. Further, the
Library Information & Management System was also made more efficient and effective with
addition/modification of a number of new features/reports. The Table 6.5 below gives a summary of
the library operations during the year.
Table 6.5 SBP Library Services at a Glance (FY13 to FY17) (numbers)
Operational Areas FY13 FY14 FY15 FY16 FY17
(1) Procurement (a) Books (i) Purchased 2,061 1,560 1,633 1,650 3,037
(ii) Complimentarily acquired 253 250 204 160 209
(b) Periodical issues 3,291 2,649 2,719 2,542 3,565
(2) Technical
processing
(a) Books catalogued 2,460 2,401 1,948 1,837 3,580
(b) Articles indexed 4,697 3,561 4,069 3,300 6,624
(3) Circulation
(Books loaned)
(a) The SBP employees (active and retired) 16,612 26,653 25,844 26,334 31,029
(b) General public 2,175 2,146 2,211 1,885 1,815
(4) Membership (a) The SBP employees (active and retired) 45 60 106 85 242
(b) General public 184 180 143 106 145
(5) Visitation (a) The SBP employees (active and retired) 17,874 17,703 16,693 14,598 19,890
(b) General public 8,873 7,619 7,056 7,217 4,521
(6) Documents
Downloads
(a) Downloaded documents delivery through email 2,767 3,343 1,745 3,503 3,971
(b) Bank-wide article downloads through subscribed
resources --- 18,555 9,747 12,178 15,373
6.8 Effective External Relations The SBP being aware of the importance of timely communication of its decisions and action in a clear
and well designed manner has been strengthening its external relations and communication function.
The Bank during the year significantly enhanced its presence and outreach in print, electronic and
social media to inform and educate the public on SBP policies, stance and actions on variety of central
banking and economic issues. During FY17, 181 press releases along with Urdu translation were
issued to print and electronic media about SBP decisions and initiatives. To enhance its media
outreach, the Bank started sending its communications (press releases) to reporters and media houses
in six cities other than Karachi. During FY17, SBP website was revamped and launched along with its
Urdu version on August 14, 2016. After the launch of new website, the number of visitors increased
three times to more than 1,500,000 as compared to the previous year. On social media front, the
number of followers on SBP’s Twitter account (@statebank_Pak) has reached to over 7000 followers
with over 3000 tweets, which is reflective of increased information sharing through twitter. The Box
6.1 below gives a brief of initiatives taken on external relations front.
Box 6.1: Initiative for promotion of external relations during FY17.
Urdu translation of SBP’s flagship publications i.e. SBP Annual and quarterly reports on State of Pakistan’s
Economy, and Financial Stability Review were arranged and released concurrently alongwith its English
version. Simultaneous release of monetary policy decisions in Urdu along with the English versions was also
arranged.
To create awareness about demonetization of old design banknotes of Rs10, 50, 100 and 1000, a
comprehensive public awareness campaign on demonetization of old design banknotes was conducted via
print and electronic media.

State Bank of Pakistan Annual Report FY17
62
During the year, 230 advertisements in print media and 287 in electronic media were placed for the transfer of
information, concepts and awareness to both general and specific audiences.
SBP arranged media coverage of Managing Director IMF, Ms. Christine Lagarde at her visit to Pakistan in
October 2016 and her keynote speech in a seminar titled, “Emerging markets in the world economy” at
Islamabad. Key Government functionaries and eminent personalities from international institutions attended
the event and it was widely covered by electronic and print media.
During FY17, a condolence gathering to pay homage to the late Abdul Sattar Edhi was held in July 2016.
Subsequently, a special ceremony was held on the eve of issuance of Rs 50 coin to commemorate the services
of the late Abdul Sattar Edhi. Bothe these events were extensively covered in print and electronic media.
6.9 Museum & Art Gallery The SBP has a well reputed Museum & Art Gallery, which has been playing a key role in educating
the visitors specially the students about the history of SBP, currency notes and coins. The SBP
Museum has eight galleries i.e. Coin Galleries I & II, Stamp Gallery, Currency Gallery, History of
State Bank Gallery, Governors’ Gallery, Sadequain’s Gallery and the Contemporary Art Gallery, each
depicting subject-wise history ranging from origin to present day status.
The History Gallery shows history of SBP from 1948, while the Governors’ Gallery shows brief
profiles of the former governors with their portraits.
The Art Gallery is one of the most attractive parts of the Museum, displaying Sadequain’s four huge
paintings and collages of metal and wood. A restored large triptych by Zahoor ul-Akhlaq, donated by
philanthropist Ava Cawasjee is displayed in the Contemporary Art Gallery, where temporary
exhibitions of young artists are also held on non profit basis.
Museum’s Archives Section deals with the acquisition of Archival Material related to historical
manuscripts, history of Pakistan, Art, historical books, etc.
The Technical Section has a Conservation Lab which is responsible for conservation of coins, archival
material, etc.
The Replica/Modeling Section is unique as it is responsible for preparing replicas/models as
souvenirs for the visitors. The objective of this section is to replicate the antiquities for
education and to discourage smuggling of the originals. The Shop has replicas of artifacts as well
as special museum publications and interactive videos and demos. The literature available thus serves
its educational purpose.
Research Section deals with publication and research. The researched and digitized data is published
as yearly plan; the purpose of the publication is to not only safeguard the data but also to encourage
young researchers. The publication section facilitates research on the museum and its collection by
scholars from Pakistan as well as abroad.
6.9.1 Visitors’ Flow Souvenir Shop During FY17, around 11466 visitors (3808 Male, 2476 Female and 5182 children) visited the
museum. Special occasions also provided an opportunity to a large numbers of visitors to visit the
SBP Museum, the number of which is other than above mentioned figures. The Museum’s Souvenir
Shop, in a very short span of time has become one of the best Souvenir Shops in Pakistan. A total sale
of Rs 2,034,400 was recorded on non-profit basis in FY17. The major events, programs organized by
the museum during the year are given in Box 6.2.

Institutional Strengthening
63
Box 6.2: SBP Museum’s Initiatives During FY17
Independence Day Celebrations: SBP Museum celebrates Independence in luminous and exclusive way
with special exhibitions every year since 2010. On August 14, 2016 an exhibition depicting rare photographs
of the old buildings of Karachi was held along with a solo show of the amateur artist Mustaque Lashari. He
used tea and coffee as painting medium instead of the traditional paints. A large number of bank
officers/employees with their families and public visited the exhibition.
International Day of Persons with Disabilities: SBP’s Museum celebrated “International Day of Persons
with Disabilities" on December 3, 2016. Students of KVTC (Karachi Vocational Training Centre) alongwith
two other educational institutions visited SBP Museum. The role of SBP Museum was appreciated by the print
and electronic media on this occasion.
Conservation and Restoration of Oil Painting Workshop: The Museum invited artist Muhammad Azam, a
qualified and experienced Art restorer and Conservationist having a vast experience in this field, to conduct a
one month Workshop on Conservation of Paintings. The participation was free of cost to attract large number
of participants.
Exhibition of Drawings of Late Abdul Sattar Edhi By Jimmy Engineer: On January 30, 2017, the Museum
held an exhibition of the ten pencil drawings of the great social worker late Abdul Sattar Edhi, generously
donated by the well known Pakistani Painter Jimmy Engineer. The generosity and cause of Mr. Jimmy
Engineer was highly appreciated on the occasion.
Digital Photography Workshop for the Visually Impaired: The Museum has adopted “Beat Disability” as
its special slogan and as a part of this initiative arranged a special three days photography workshop for the
visually impaired in May 2017. The Blind Resource Foundation Pakistan, Karachi sent their seven students
and two teachers for participation. Trained by the Museum staff these participants clicked photographs. These
Photographs were sold on August 14, 2017 after framing and the sale proceeds were given to the participants
who clicked the photos.
Summer Camp: SBP Museum as per its tradition organized Summer Camp this year also for the children of
SBP employees. The 2017 summer camp program was formulated to teach the children not only about the
dying arts and crafts of our country e.g. calligraphy (one of the traditional methods of writing beautifully and
artistically) but also about the current useful techniques of civil defense. Thus they were also given
firefighting and first aid lessons.

65
7 SBP Subsidiaries
7.1 SBP Banking Services Corporation (SBP-BSC) The SBP Banking Services Corporation (SBP-BSC), a fully owned subsidiary of SBP continued to
play its role as the operational arm of the SBP. SBP-BSC is engaged in managing currency
operations, provision of banking facilities to the federal and provincial governments, financial
institutions, managing foreign exchange operations and adjudication of cases relating to foreign
exchange proceeds. It also supports SBP in expanding the outreach of financial system through
dissemination of SBP policies and initiatives for development finance besides implementing SBP
export refinance credit guarantee schemes. The SBP-BSC also works as the agent of National Savings
Organization for sale / purchase of prize bonds and instruments (DSC, SSC, etc), managing prize
money draws and payment of prize money claims. Besides these core assignments, the SBP-BSC also
provides auxiliary services to SBP in the areas of engineering, procurement, medical services and
internal bank security.
7.1.1 Currency Management
The availability of clean and fit banknotes having state of the art security features is amongst the
primary responsibilities of central banks. Pakistan is predominantly a cash-oriented economy with
relatively high CIC (Currency-in-Circulation) to GDP ratio of 13.2 percent. The CIC grew by about
17 percent during the year to over Rs 4 trillion in FY17 from Rs 3.424 trillion as at end-June 2016.
Under the Currency Management Strategy (CMS) of the Bank, SBP-BSC continued its drive to
automate currency management operations in all its 16 offices across the country. For the purpose two
high-end Banknote Processing and Authentication System (BPAS) machines were installed at Karachi
and 53 Desktop and Countertop note authentication and sorting machines were installed at SBP-BSC
field offices. This has enabled SBP-BSC to process, sort and detect counterfeit banknotes in an
automated environment and issue only machine authenticated cash to banks and public as required by
the CMS.
The second phase of automation of currency management processes was also initiated during the year
under which more BPAS along with Banknote Destruction Systems (BDS) would be procured and
installed at the SBP-BSC offices having large cash volumes. While in the first phase of automation
the focus was on building the capacity to issue only machine authenticated banknotes to public, in the
second phase the end to end automation of cash processing function right from issuance to destruction
will be made. This will bring huge efficiency gains, improve transparency and enable SBP-BSC to
lead and steer the automation of cash processing function in the banking industry.
The issuance of fresh banknotes to public on special occasions like Eids is another important
component of SBP-BSC’s currency management function. For the purpose it not only issues large
volumes of fresh cash to banks for onward issuance to their clients but also issues cash to the public
from its counters. In order to ensure convenient and hassle free distribution of fresh cash to public, the
SBP-BSC had initiated SMS based service in 2015 on pilot basis on a limited scale. Considering the
huge success of the pilot project, the facility was expanded to over 100 districts and 500 branches in
2016 and to 1000 commercial bank branches in 120 cities for Eid-ul-Fitr during FY17. This service
received overwhelming response from public as 1.5 million people obtained fresh currency notes of
around Rs 25 billion using the facility.

State Bank of Pakistan Annual Report FY17
66
7.1.2 Government Banking
As a part of its core functions, SBP-BSC maintains accounts of federal, provincial and local
governments and consolidates the receipts and payments on their behalf. During FY17, SBP-BSC
processed approximately 7.04 million transactions of government payments/receipts through its field
offices as compared to 8.01 million transactions processed during FY16. The reduction in the number
of transactions can largely be attributed to initiation of E-Stamping facility by Government of Punjab
under which all non judicial stamp papers are issued by Bank of Punjab (BOP) through its branches in
36 districts across the province. The BOP is operating as SBP agent for collection of stamp duty in the
province of Punjab.
In line with SBP Vision 2020, the Bank has initiated the automation of government payments and
receipts which includes collection of government taxes through Electronic Fund Transfer (EFT) and
Alternative Delivery Channels (ADCs) e.g. ATMs, Mobile Banking, etc. In this regard, the Sindh
Revenue Board (SRB) has already started collection of their taxes through ADCs, whereas collection
of taxes for FBR and Custom Authorities will also be initiated shortly. The Bank has also made
concerted efforts for consolidation of payment through paper-based instruments for Central Military
Accounts and Naval Accounts. Another significant initiative is the implementation of e-cheque
reconciliation of Financial Accounting & Budgeting System (FABS), which provides a single solution
on issuance of cheques by different government departments and reporting reconciliation of payments
made against these cheques by SBP-BSC offices. The move would improve operational efficiency of
SBP-BSC and would enable the government departments including AG, AGPR and DAOs to have
real-time information.
7.1.3 Foreign Exchange Operations
The SBP-BSC being the SBP’s operational arm is also responsible for ensuring smooth
implementation of the Bank’s foreign exchange policy. The Bank has delegated its operational forex
functions like monitoring of forex transactions, follow up with delinquent exporters, processing
banks’ requests for approval of commercial foreign exchange remittances, etc to the SBP-BSC. The
SBP-BSC undertakes these operations to facilitate all genuine trade and remittance transactions and
check and discourage fraudulent practices by taking penal action against unscrupulous elements.
During FY17, the Bank approved around 17,000 cases of forex trade and successfully managed
repatriation of USD 317.67 million from exporters who failed to repatriate proceeds of their exports
within due date. It also managed verification of 577,478 entries in EE-1/EF-1 statements. During the
year, the Bank disbursed approximately Rs 30 billion in 20,638 cases processed under various subsidy
schemes. Further, 2,061 cases were referred to Foreign Exchange Adjudication Courts against
delinquent exporters, importers and ADs for legal proceedings. The Bank recovered USD 18.25
million of duplicate imports and levied Rs 45.08 million penalties on importers who failed to ensure
import of goods in Pakistan against advance payments. Bank approved 11,341 cases of Government’s
FE allocation, valuing Rs 205 billion.
For monitoring and verification of export performance of exporters and allocation of limit for Export
Finance Scheme, Part-II, the Bank initiated automation of verification of EE-1/EF-1 statements. It is
expected that this system will be available for confirmation of EE-1 and EF-1 statements for
performance year FY18. The Bank has also established Airport Booth System (ABS) at the joint SBP-
Customs Airport booths for recording and maintenance of data-base of FCY cash currency export and
import by exchange companies. The testing of ABS is under process, which is expected to be
functional at airport booths by December 2017.
SBP Subsidiaries
67
7.1.4 Resolution of Foreign Exchange Overdue Cases
The SBP-BSC has been entrusted with responsibility of adjudicating the cases relating to the
violations of different sections of Foreign Exchange Regulation Act (FERA), 1947. During FY17, the
SBP-BSC helped repatriation of highest level of stuck up foreign exchange proceeds amounting to
USD 78.7 million, which is 36 percent higher than the proceeds repatriated last year. The total number
of complaints pertaining to the delinquent exporters/Authorized Dealers received on a country-wide
basis stood at 2,503, whereas, 3,308 complaints were disposed of during FY17 as compared to 2,784
complaints during FY16. A total amount of Rs 4.873 million was also recovered from the defaulting
exporters during FY17 in terms of penalty imposed under FERA.
7.1.5 Financial Inclusion The SBP-BSC has been augmenting the Bank’s efforts for expanding the outreach of financial system
to the un-served and underserved areas and sectors of the economy including agriculture, SMEs,
Microenterprises. The SBP-BSC arranged periodic follow-up and review meetings with participating
financial institutions across 144 districts, for monitoring the achievement of Rs 700 billion indicative
target for disbursements to agriculture sector during FY17.The SBP-BSC also supervises the
refinance facilities to commercial banks against various schemes introduced by SBP, including Export
Refinance Scheme (ERF), Islamic Export Refinance Scheme (IERS), etc. During FY17; Rs 481.46
billion was disbursed under ERFs while Rs 91.51 billion was disbursed under IERS. On-site
verifications teams from eleven field offices of the SBP-BSC completed verification of 13,068 cases
during the year aggregating to Rs 516.61 billion disbursed to commercial banks under various
schemes.
The SBP-BSC also facilitated a number of focus group meetings, awareness programs, seminars and
workshops for dissemination of SBP’s policy initiatives regarding Islamic Banking, Agri Finance,
Microfinance, SME Finance and Housing Finance at grassroots level. Other significant initiatives
include preparation of feasibility studies for establishing fruit pulp units (mango pulp in Sindh and
apricot in Gilgit), initiation of a project on economic mapping to facilitate policy makers and business
owners in decision making regarding investment besides holding public gatherings (Melas) in
different cities for awareness regarding SME Finance.
The credit guarantee schemes, largely funded with the support of Department for International
Development (DFID), UK and Provincial/ Federal Governments are designed to help financial
institutions to get acquainted with sectors perceived risky by them. Under the schemes, credit
guarantees against lending of Rs 10.32 billion to priority sectors including Rs1.85 billion to
microfinance were extended to Banks/DFIs. Further, the SBP-BSC has also been playing a vital role
in monitoring Prime Minister’s Youth Business Loan Program (PMYBL) and processed subsidy
claims of Rs 495.10 million during FY17.
7.1.6 Human Resource Management
The SBP-BSC has taken various organizational development initiatives as a part of its continued
improvement plan. The SBP-BSC’s HR profile has undergone a major shift whereby large number of
employees with traditional skills mix has been replaced with young, qualified and suitably trained
staff. This has been possible due to lucrative early retirement scheme under which bulk of the
employees are opting for early retirement at the age of 55 years. During FY17, 237 employees retired
and to fill the resource gap, 276 young officers were inducted at OG-1 and OG-2 level. To implement
the succession planning and to keep motivation level intact, 309 employees were promoted in
accordance with promotion policy. Further, the SBP-BSC reviewed and updated/improved a number
of its existing policies including promotion policy for OG-1 and above officers, performance

State Bank of Pakistan Annual Report FY17
68
improvement and separation policy, leave policy, code of conduct, reward and recognition,
communication and whistle blowing policies. Also to improve operational efficiency, Performance
Management and Leave Management Systems have been automated during FY17. The SBP-BSC
during the year also constituted an Event Management Team (EMT) to organize different events,
conferences, seminars in SBP-BSC and its field offices.
7.2 National Institute of Banking and Finance In line with SBP’s strategic goals, NIBAF further scaled up its training and development initiatives to
effectively cope with the mandatory pre-inductions and on job training requirements of SBP and SBP-
SBP-BSC. During FY17, a comprehensive training plan was developed pertaining to function specific
programs, IT, soft skills and managerial skills. These largely included pre-induction training
programs, skill up-gradation, management development, leadership, central banking, commercial
banking and enterprise risk management. In collaboration with SBP and SBP-BSC, NIBAF also
arranged specialized training programs to develop expertise and understanding of priority sectors.
This year, NIBAF conducted 207.2 weeks of
training against the target of 166 weeks, which is
24.6 percent higher than the target set for the year
and 32 percent higher as compared to the last fiscal
year. Out of 207.2 weeks of training at NIBAF,
SBP received 87.4 weeks of training; SBP-BSC
65.8 weeks , whereas international participants,
priority sectors and other financial institution
received 12.6, 38.8 and 2.6 weeks of training
respectively. During FY17, more than 32 percent of
overall training weeks were apportioned to
induction level training programs. Specifically,
NIBAF organized two pre-induction training
programs namely, State Bank Officers Training
Scheme and Economic Analyst Training Scheme
for SBP attended by 40 and 20 officers respectively.
Similarly, NIBAF organized induction level
training for SBP-BSC that included two batches of
Officer Training Program (OTP) and Young
Professional Induction Program (YPIP). Apart from
class room trainings, it included hands-on practice
in IT Lab, exposure visits to SBP-BSC Field Office, financial institutions and NIFT (Table 7.1).
To equip SBP and SBP-BSC officers with the latest developments and enhance their understanding
regarding banking and finance, NIBAF conducted a number of skills up-gradation training programs
spreading over 67.8 weeks, which were attended by around 3,619 officers of SBP and SBP-BSC.
These courses include risk management, Basel Accord-current challenges and new developments,
financial modeling, AML/KYC/CFT, Islamic capital market-Sukuk, corporate governance, situational
leadership, payment and settlement system, issues in Pakistan Economy, financial markets and
financial instruments, exchange policy and regulatory framework, financial stability, risk rating
framework in banks, treasury operations, priority financing, audit, E-filling and withholding tax,
communication, soft skills, time and stress management, etc.
Table.7.1: NIBAF Progress During FY 17
Training Program
Target
Weeks
Total
weeks
A SBP (1+2) 67.0 87.4
1. Pre Induction 42.0 44.3
2. Skill Up-gradation 25.0 43.1
B SBP BSC (1+2) 70.0 65.8
1. Pre Induction 52.0 41.1
2. Skill Up-gradation 18.0 24.7
C International Training 4.0 12.6
D Priority Sector
(i+ii+iii+iv+v) 17.2 38.8
i) Microfinance 5.0 5.2
ii) SME Finance 1.0 1.6
iii) Islamic Finance 10.2 25.0
iv) Agri Finance 1.0 4.2
iv) NFLP - 2.8
E Other Financial Institution 8.0 2.6
Total weeks (A+B+C+D+E) 166.2 207.2

SBP Subsidiaries
69
Moreover, with a view to equip SBP and SBP-BSC officers with the latest tools and techniques, seven
iterations of Management Development Programs (MDP) were conducted wherein more than 158
officers of SBP and SBP-BSC participated. The program included training on workers role in
harmonious industrial relations, customer management skills, currency management, PPRA rules,
mechanism and calculation of WHT, end user cyber security session, capacity building of
adjudication officers, contract labor management, foreign exchange and soft skills programs.
NIBAF also hold an inter-institutional seminar on Forecasting and Financial Modeling, which was
attended by the experts and policy makers of SBP, Ministry of Planning, Ministry of Finance and
PIDE. The formal deliberations and presentations aimed at bringing harmony and consistency in
forward looking monetary and fiscal policy framework and formulation.
7.2.1 International Training Programs
The regional developing countries including SAARC / ECO members, Africa, Far East, Central Asian
Republics and Afghanistan were among beneficiaries of international training programs organized by
NIBAF. Over the years a great deal of effort has been made for expanding outreach to international
participants, which has translated into strong demand for NIBAF’s training programs. During FY17,
12.6 weeks of training activities at the institute accounted for international training programs
compared to 15.9 weeks last year. This includes international courses on central banking, commercial
banking and English-language course for friendly countries with the support of SBP and Economic
Affairs Division, GoP under Pakistan Technical Assistance Program. During FY17, NIBAF
conducted four international training programs and a seminar on SAARC Finance wherein delegates
from 23 countries participated including Afghanistan, Azerbaijan, Bangladesh, China, Cambodia,
Ethiopia, Fiji, Indonesia, Kenya, Kyrgyz Republic, Libya, Maldives, Mauritius, Nepal, Sierra Leon,
Sri Lanka, Sudan, Tajikistan, Thailand, Turkmenistan, Uganda and Zimbabwe. NIBAF also hosted a
seminar on Financial Stability for SAARC region which was attended by more than 30 delegates
representing Afghanistan, Bangladesh and Sri Lanka. The participants of SAARC countries
deliberated on different aspects of financial stability and shared their experiences and knowledge in
the perspective of global financial and economic integration.
NIBAF has also been playing an important role in enhancing professional development, human
capacity building and productivity of neighboring country Afghanistan. Specifically, it organized a
customized training program for 15 mid-level officers of Afghanistan International Bank (AIB) for
progressive learning of commercial bank’s operation with particular emphasis on the role and
functions of credit administration and Special Asset Management (SAM). Notably, AIB signed a
MoU with NIBAF where the later will facilitate AIB in capacity building of its human resources in
the area of banking and finance.
7.2.2 Priority Sector Programs
In line with the SBP Vision 2020, NIBAF continued to organize various training programs to develop
understanding and bridge the skill gap in the priority sectors i.e. Islamic banking, initiatives under
National Financial Literacy program (NFLP) and micro-finance. During FY17, a series of iteration of
Fundamental of Islamic Banking Operations (FIBO) and Islamic Banking Certificate Course (IBCC)
were conducted. This includes seven iterations of FIBO at Hyderabad, Quetta, Lahore, Sargodha,
Sialkot, Islamabad and Peshawar. The 5-days programs were attended by 231 participants of different
financial institutions/banks besides academia. Further, NIBAF successfully arranged the 36th, 37th
and 38th Islamic Banking Certificate Courses at Karachi and Lahore that were attended by over 102
officers representing different financial institutions. NIBAF’s IBCC has received an overwhelming
response and so far 1282 bankers and academician, both domestic and foreigner have been certified.

State Bank of Pakistan Annual Report FY17
70
The program spread over 17- working days (96-hours) containing 16 modules wherein seasoned
bankers / Shari’ah scholars imparted comprehensive quality contents.
Access of under-privileged communities to financial services through micro-finance is one of the
important initiatives set under SBP Vision 2020. In order to improve understanding and skill set
relating to micro-finance, NIBAF conducted three executive level programs for micro-finance banks
and micro-finance institutions in Karachi and Lahore. Similarly, to enhance skill gap at branch level,
three middle management development programs for FINCA micro-finance bank and for Khushhali
micro-finance bank were organized. These training programs were attended by a total of 184
participants.
To create awareness regarding financial intermediation and its potential benefits among the general
public, Train the Trainers (ToT) programs were organized under National Financial Literacy Program
(NFLP). The ToTs were designed to train the trainers of SBP-BSC and commercial banks. It aimed at
giving detailed orientation and exposure of the NFLP contents; develop an ability to follow the
trainer’s manual and to demonstrate requisite skills needed to effectively deliver the session at grass
roots level. The workshops were run through a blend of approaches including trainers’ presentations,
follow-up discussions, role play and individual/group assignments beside field visits and de-briefing
sessions. The scheme helped to identify the potential Master Trainer candidates. In all, 147
participants attended the ToTs from SBP-BSC and commercial banks.

71
8 Financial Performance
8.1 Overview The SBP’s profit for FY17 registered a modest growth of 4 percent over the last year’s profit
increasing to Rs 238,064 million from Rs 229,353 million in FY16. This is primarily attributable to
increase in the discount income by Rs 21,086 million and interest earned on foreign asset by Rs 5,365
million partly offset by decrease of Rs 17,519 million in income on reverse repo transactions. The
lending to the Federal Government and commercial banks remained major sources of SBP’s profit
followed by earnings on the foreign exchange reserves. The growth in expenses during the year also
remained modest with just over 2 percent increase. The note printing charges, agency commission
paid to National Bank of Pakistan for undertaking government banking business on behalf of the Bank
and establishment cost are the major expense heads constituting over 90 percent of the expenses.
Towards the end of FY17, the Bank added another subsidiary i.e. the Pakistan Security Printing
Corporation (PSPC). Accordingly, this financial performance review includes seventeen days
operational performance of PSPC also.
Table 8.1 gives a comparative summary of Bank’s annual profit and loss account for FY17 and FY16.
Table 8.1: Summary Statement of Profit and Loss (million rupees)
Description 2017 2016
Income
Discount / interest /markup and/or return earned 260,871 252,831
Less: Interest/mark-up expense 21,369 25,454
Net discount / interest /markup and/or return income 239,502 227,377
Commission income 2,591 1,909
Exchange gain – net 24,570 25,779
Dividend Income 12,249 12,226
Share of profit from associates 26 -
Other operating (loss) / income – net 574 2,756
Other income – net 302 161
Total income net of interest expenses 279,814 270,208
Expenditure
Bank notes printing charges 9,128 7,731
Agency commission 9,679 8,969
General administrative and other expenses 22,942 24,250
(Reversal of Provisions) / Provisions - net (4) (95)
Less: Total expenditure- net of reversal of provisions 41,745 40,855
Profit for the year 238,069 229,353
Taxation (5) -
Surplus Profit for the year after tax
238,064
229,353

State Bank of Pakistan Annual Report FY17
72
8.2 Income
8.2.1 Net Interest / Markup
The interest / markup income increased by
just over 3 percent to Rs 260,871 million.
However, the interest earned on lending to
Federal Government increased by 14 percent
due to a significant rise in the government
borrowings from the Bank. The interest
earned on lending to commercial banks
through reverse repos reduced by 22 percent
due to significantly lower volumes of reverse
repos. The Government borrowings from Bank
provided additional space to commercial
banks for lending to the private sector during
FY17. It also substantially improved liquidity
in the interbank market, thus requiring
comparatively lower liquidity injections
through reverse repos by the Bank (Table
8.2 and 8.3).
The income on FCY assets registered almost
50 percent increase during the year, which is
partly attributable to an increase in yield on
the reserves due to upward movement of interest rates in international financial markets and partly to
an increase in the average volume of foreign exchange reserves during the year1.
The interest earned on Export Finance Facility (EFF) and other related refinance facilities declined to
Rs 6,400 million in FY17 from Rs 7,201 million in FY16 due to reduction in the interest/mark-up
rates. Although the average outstanding loans to banks under refinance schemes increased
significantly during the year to Rs 287 billion
from Rs 199 billion in FY16; the average
interest/mark-up rate reduced from 3.5 percent in
FY16 to 2.2 percent in FY17 causing a decline
of over Rs 2 billion in the interest/mark-up
earned on refinance schemes.
The Bank incurs interest/ markup expense on
FCY and domestic liabilities. FCY liabilities
include deposits of international organizations
and central banks, International Monetary Fund
liabilities and currency swap arrangements. The
domestic liabilities include Sukuk purchased
under Bai Muajjal agreement and repo
transactions. The interest/ markup expense
witnessed a decline of Rs 4,085 million which is
1 The reserves as at close of FY17 were about USD 2 billion lower than the reserves as at close of FY16.
Table 8.2: Interest/Discount/Return Income on Foreign and
Domestic Assets (million rupees)
Description 2017 2016
Discount, interest / mark-up on:
Government Securities 171,400 150,313
Securities purchased under agreement to
resell
63,194 80,713
Income from export loans 6,401 8,683
Foreign assets 18,006 12,641
Others 1,870 481
Total 260,871 252,831
Table 8.3: Lending to Government, Banks and Financial Institutions
(million rupees)
Description 2017 2016
Government securities 2,522,216 2,050,313
Overdraft /loans to Governments 7,279 955
Securities purchased under agreement to
resell 1,533,373 1,533,574
Banks and financial institutions 345,352 335,244
Total 4,408,220 3,902,730
Yield on Treasury Bills 5.90% to
6.01%
5.89% to
6.24%
Mark-up on Loans to Banks and FIs 0 to 9.75 0 to 9.75
Table 8.4: Foreign Currency Reserves (million rupees)
Description 2017 2016
At fair value through Profit or Loss 379,452 269,943
Unrealized gain / (loss) on -derivative
financial instruments 2,689 -3,905
Held to maturity 337,120 238,549
Loans and receivables
Deposit accounts 90,761 26,378
Current accounts 20,926 6,690
Securities purchased under agreement
to resale 178,482 569,237
Money market placements 773,108 870,751
Total 1,782,539 1,977,644

Financial Performance
73
primarily due to reduction in expense on Sukuks purchased under Bai Muajjal agreement. However,
this was partly offset by increase of Rs 3,040 million in the charges on allocation of SDRs.
8.2.2 Commission Income
The Bank earns commission income on management of public debt, market treasury bills, prize
bonds, national saving schemes and government securities as well on issuance of drafts and payment
orders. The commission income increased by 36 percent year-on-year basis largely due to increase in
commission on market treasury bills.
8.2.3 Exchange Gain – Net
The exchange gains/ (losses) arise on the FCY
assets and liabilities of the Bank. The exchange
account includes both the realized and the
unrealized gains and losses. Major part of the
foreign currency assets of the Bank are USD
denominated whereas the foreign currency
liability exposure is mainly SDR denominated.
Accordingly, the movement in the PKR/ SDR
and PKR/USD exchange rates directly affects
the exchange account.
The Bank earned net exchange gain of Rs 24,569 million during FY17 as against Rs 25,779 million
earned during FY16, registering a decline of 5 percent (see Table 8.5). The PKR depreciated against
USD by Rs 0.020 and appreciated against SDR by Rs 0.366; accordingly, the depreciation against
USD resulted in exchange gain of Rs 8,059 million and appreciation against SDR resulted in
exchange gain of Rs 2,723 million. The remaining net exchange gain of Rs 12,049 million is due to
appreciation and depreciation of PKR against other currencies.
8.2.4 Dividend Income
The SBP holds equity investment in banks and
financial institutions under section 17 6(A) of
SBP Act 1956 and dividends earned on these
investments is also one of the sources of its
income. The breakup of dividend income on
listed and unlisted shares held by SBP is given
in Table 8.6.
8.2.5 Other Operating Income – net
The other operating income declined to Rs 574 million in FY17 from Rs 2,756 million last year. The
reduction is primarily attributed to loss on re-measurement of FCY securities by Rs 4,898 million
which was partly offset by gain of Rs 3,311 million on conversion of debts into shares.
8.3 Expenditure The total expenditure during the year was Rs 41,745 million as against Rs 40,855 million in FY16,
thus registering an increase of 2.18 percent over the previous year’s expenditure. The increase was
due to 18 percent and 8 percent rise in the banknote printing chares and agency commission
respectively, impact of which was partly offset by reduction of Rs 2.5 billion in salary cost and
retirement benefits. An analysis of major components of Bank’s expenditure is given as follows;
Table 8.5 Breakup of the Exchange Account
(million rupees)
Description 2017 2016
Gain / (loss) on:
Foreign currency placements, deposits and
other accounts - net 21,802 38,323 Forward covers under Exchange Risk
Coverage - -
IMF fund facilities 2,643 -10,985
Special Drawing Rights of the IMF 80 -1,611
Exchange risk fee income 44 52
Total 24,569 25,779
Table 8.6 Breakup of the Dividend Income
(million rupees)
Description 2017 2016
Listed 11,999 11,999
Unlisted 250 227
Total 12,249 12,226

State Bank of Pakistan Annual Report FY17
74
8.3.1 Bank Notes Printing Charges The banknote printing charges increased to Rs 9,128 million in FY17 from Rs 7,731 million in FY16,
thereby registering an increase of 18 percent. The increase is largely attributed to increase in quantity
of banknotes printed (Rs 1,295 million) and partly to price escalation (Rs 139 million).
8.3.2 Agency Commission
The Agency commission paid to NBP and BOP increased by 8 percent during the year to Rs 9,679
million from Rs 8,969 million in FY16. The increase is attributable to rise in the government receipts
and payments handled by the agent banks (particularly NBP) during the year.
8.3.3 General Administrative and Other
Expenses The general administrative expenses include
employees’ salaries and benefits, retirement
benefits and other operating expenses i.e. fund
managers and custodians’ expenses, training
expenses, postage and telephone charges, legal
and professional expenses, depreciation, repair
and maintenance, etc. A summary of the general
administrative and other expenses is given in Table 8.7. The overall general and administrative
expenses decreased to Rs 22,942 million in FY17 from Rs 24,251 million in FY16, thus registering a
decline of Rs 1,309 million, which is primarily attributable to reduced salary and retirement expenses,
impact of which was partly offset by increase in depreciation expense Table 8.7.
8.4 Net Profit A summary of the distributable profits of the
Bank is presented in Table 8.8.
8.5 Balance Sheet Summary The assets stood at Rs 6,866 billion as at June
30, 2017 as compared to Rs 6,450 billion on
June 30, 2016, registering an increase of Rs 416
billion primarily due to increase in investments
in Market Related Treasury Bills. The increase is further augmented due to acquisition and
consolidation of PSPC assets which led to an increase of Rs 71 billion in the balance sheet of the
Bank.
The liabilities of the Bank stood at Rs 6,296 billion as at June 30, 2017 as compared to Rs 5,830
billion as at June 30, 2016, registering an increase of Rs 466 billion. The increase in GDP growth led
to an increase in currency in circulation while banks’ deposits also witness a significant growth due to
improved liquidity in the market. The increase was partly offset by decrease in government balances
at year end. A comparative analysis of SBP assets and liabilities for FY16 and FY17 are given in the
Figure 8.1 to 8.4.
Table 8.7: General, Administrative and other expenses
(million rupees)
Description 2017 2016
Salaries & other benefits 9,380 9,752
Retirement benefits 7,692 9,827
Repair and maintenance 647 638
Fund managers’ and custodian expenses 476 495
Training 123 102
Others 4,624 3,425
Total 22,942 24,250
Table 8.8: Net Profit
(million rupees)
Description 2017 2016
Net Profit for the year 238,064 229,353
Less: Loss on re-measurement of
Staff retirement defined benefit plans 3,806 15,327
Profit before appropriations 234,258 214,026

Financial Performance
75
Gold Reserves held by the
Bank
4%Foreign
Currency Accounts and
Investments26%
Securities Purchased
under
Agreement to Resell22%
Investment Local39%
Others9%
Figure 8.1: SBP Assets 2017
Gold Reserves held by the
Bank
4%
Foreign Currency
Accounts and
Investments31%Securities
Purchased under
Agreement to Resell24%
Investment Local33%
Others8%
Figure 8.2: SBP Assets 2016
Banknotes in Circulation
66%
Current Accounts of Governments
3%
Payable to the International
Monetary
Fund12%
Deposits of Banks and Financial
Institutions11%
Others8%
Figure 8.3: SBP Liabilities 2017
Banknotes in Circulation
61%
Current Accounts of Governments
10%
Payable to the International
Monetary Fund
13%
Deposits of Banks and Financial
Institutions7%
Others9%
Figure 8.4: SBP Liabilities 2016

9 Consolidated Financial Statements of SBP and its Subsidiaries
A. F. FERGUSON & CO.
Chartered Accountants
State Life Building No. 1-C
I. I. Chundrigar Road
P.O. Box 4716
Karachi-74000
EY FORD RHODES
Chartered Accountants
Progressive Plaza
Beaumont Road
P. O. Box 15541
Karachi-75530
Independent Auditor's Report
To the Board of Directors of State Bank of Pakistan
Opinion
We have audited the consolidated financial statements of the State Bank of Pakistan (the Bank) and its
subsidiaries, SBP Banking Services Corporation, National Institute of Banking and Finance
(Guarantee) Limited and Pakistan Security Printing Corporation (Private) Limited (together “the
Group”), which comprise the consolidated balance sheet as at June 30, 2017, and the consolidated
profit and loss account, consolidated statement of comprehensive income, consolidated statement of
changes in equity and consolidated statement of cash flows for the year then ended, and notes to the
consolidated financial statements, including a summary of significant accounting policies.
In our opinion, the accompanying consolidated financial statements give a true and fair view of the
consolidated financial position of the Group as at June 30, 2017, and of its consolidated financial
performance and its consolidated cash flows for the year then ended in accordance with International
Financial Reporting Standards (IFRSs).
Basis for Opinion
We conducted our audit in accordance with International Standards on Auditing (ISAs). Our
responsibilities under those standards are further described in the ‘Auditor’s Responsibilities for the
Audit of the Financial Statements’ section of our report. We are independent of the Group in
accordance with the International Ethics Standards Board for Accountants’ Code of Ethics for
Professional Accountants as adopted by the Institute of Chartered Accountants of Pakistan (the Code),
and we have fulfilled our other ethical responsibilities in accordance with these requirements and the
Code. We believe that the audit evidence we have obtained is sufficient and appropriate to provide a
basis for our opinion.
Responsibilities of Management and Those Charged with Governance for the Consolidated
Financial Statements
Management is responsible for the preparation and fair presentation of the consolidated financial
statements in accordance with IFRSs, and for such internal control as management determines is
77

State Bank of Pakistan Annual Report FY17
A. F. FERGUSON & CO.
Chartered Accountants EY FORD RHODES
Chartered Accountants
necessary to enable the preparation of consolidated financial statements that are free from material
misstatement, whether due to fraud or error.
In preparing the consolidated financial statements, management is responsible for assessing the
Group’s ability to continue as a going concern, disclosing, as applicable, matters related to going
concern and using the going concern basis of accounting unless management either intends to
liquidate the Group or to cease operations, or has no realistic alternative but to do so.
Those charged with governance are responsible for overseeing the Group’s financial reporting
process.
Auditor’s Responsibilities for the Audit of the Consolidated Financial Statements
Our objectives are to obtain reasonable assurance about whether the consolidated financial statements
as a whole are free from material misstatement, whether due to fraud or error, and to issue an auditor’s
report that includes our opinion. Reasonable assurance is a high level of assurance, but is not a
guarantee that an audit conducted in accordance with ISAs will always detect a material misstatement
when it exists. Misstatements can arise from fraud or error and are considered material if, individually
or in the aggregate, they could reasonably be expected to influence the economic decisions of users
taken on the basis of these consolidated financial statements.
As part of an audit in accordance with ISAs, we exercise professional judgment and maintain
professional skepticism throughout the audit. We also:
Identify and assess the risks of material misstatement of the consolidated financial statements,
whether due to fraud or error, design and perform audit procedures responsive to those risks,
and obtain audit evidence that is sufficient and appropriate to provide a basis for our opinion.
The risk of not detecting a material misstatement resulting from fraud is higher than for one
resulting from error, as fraud may involve collusion, forgery, intentional omissions,
misrepresentations, or the override of internal control.
Obtain an understanding of internal control relevant to the audit in order to design audit
procedures that are appropriate in the circumstances, but not for the purpose of expressing an
opinion on the effectiveness of the Group’s internal control.
Evaluate the appropriateness of accounting policies used and the reasonableness of
accounting estimates and related disclosures made by management.
Conclude on the appropriateness of management’s use of the going concern basis of
accounting and, based on the audit evidence obtained, whether a material uncertainty exists
related to events or conditions that may cast significant doubt on the Group’s ability to
continue as a going concern. If we conclude that a material uncertainty exists, we are required
to draw attention in our auditor’s report to the related disclosures in the consolidated financial
statements or, if such disclosures are inadequate, to modify our opinion. Our conclusions are
78

Consolidated Financial Statements of SBP and its Subsidiaries
A. F. FERGUSON & CO.
Chartered Accountants EY FORD RHODES
Chartered Accountants
based on the audit evidence obtained up to the date of our auditor’s report. However, future
events or conditions may cause the Group to cease to continue as a going concern.
Evaluate the overall presentation, structure and content of the consolidated financial
statements, including the disclosures, and whether the consolidated financial statements
represent the underlying transactions and events in a manner that achieves fair presentation.
We communicate with those charged with governance regarding, among other matters, the planned
scope and timing of the audit and significant audit findings, including any significant deficiencies in
internal control that we identify during our audit.
We also provide those charged with governance with a statement that we have complied with relevant
ethical requirements regarding independence, and to communicate with them all relationships and
other matters that may reasonably be thought to bear on our independence, and where applicable,
related safeguards.
A. F. Ferguson & Co.
Chartered Accountants
Karachi
Salman Hussain
Audit Engagement Partner
Dated: October 27, 2017
EY Ford Rhodes
Chartered Accountants
Karachi
Omer Chughtai
Audit Engagement Partner
79

State Bank of Pakistan Annual Report FY17
Note 2017 2016
ASSETS
Cash and bank balances held by a subsidiary 6 2,190,657 -
Gold reserves held by the Bank 7 270,361,202 287,170,323
Local currency - coins 8 861,860 488,198
Foreign currency accounts and investments 9 1,782,539,188 1,977,084,370
Earmarked foreign currency balances 10 10,319,532 5,147,596
Special Drawing Rights of the International Monetary Fund 11 63,657,319 67,656,236
Reserve tranche with the International Monetary Fund
under quota arrangements 12 17,382 17,455
Securities purchased under agreement to resell 13 1,533,373,313 1,533,574,159
Current accounts of Governments 24.2 7,279,247 955,474
Investments - local 14 2,694,286,076 2,147,418,594
Long Term Investment in associates 15 2,134,590 -
Loans, advances and bills of exchange 16 362,703,790 350,571,180
Taxation - net 398,414 -
Assets held with the Reserve Bank of India 17 5,758,914 6,012,137
Balances due from the Governments of India and
Bangladesh (former East Pakistan) 18 9,917,256 9,214,881
Property, plant and equipment 19 111,142,903 60,074,805
Intangible assets 20 107,554 24,986
Deferred taxation 21 193,274 -
Other assets 22 8,657,388 4,348,162
Total assets 6,865,899,859 6,449,758,556
LIABILITIES
Bank notes in circulation 23 4,167,135,807 3,554,922,057
Bills payable 630,547 598,142
Current accounts of Governments 24.1 178,601,965 606,657,778
Payable to Islamic Banking Institutions against Bai Muajjal transactions 25 25,137,230 44,952,938
Payable under bilateral currency swap agreement 26 155,550,410 158,507,631
Deposits of banks and financial institutions 27 669,337,539 391,760,469
Other deposits and accounts 28 164,665,074 161,552,998
Payable to the International Monetary Fund 29 787,381,266 778,739,505
Other liabilities 30 57,515,443 49,579,000
Deferred liability - staff retirement benefits 31 89,806,875 82,419,258
Endowment fund 98,421 94,207
Total liabilities 6,295,860,577 5,829,783,983
Net assets 570,039,282 619,974,573
REPRESENTED BY
Share capital 32 100,000 100,000
Reserves 33 100,664,452 175,944,238
Unappropriated profit 44,154,941 3,712,051
Unrealised appreciation on gold reserves held by the Bank 34 266,327,601 283,342,601
Unrealised appreciation on remeasurement of investments - local 14.6 93,302,881 91,386,276
Surplus on revaluation of property, plant and equipment 65,489,407 65,489,407
Total equity 570,039,282 619,974,573
CONTINGENCIES AND COMMITMENTS 35
The annexed notes from 1 to 56 form an integral part of these consolidated financial statements.
___________________________ ___________________________ ___________________________
Tariq Bajwa Riaz Riazuddin Inayat Hussain
Governor Deputy Governor Executive Director
CONSOLIDATED BALANCE SHEET
AS AT JUNE 30, 2017
--------------------(Rupees in '000)--------------------
Pursuant to the requirements of section 26 (1) of the SBP Act, 1956, the assets of the Group specifically earmarked against the liabilities of the issue department
have been detailed in note 23.1 to these consolidated financial statements.
STATE BANK OF PAKISTAN AND ITS SUBSIDIARIES
80

Note 2017 2016
Discount, interest / mark-up and / or profit earned 36 260,870,627 252,831,070
Less: interest / mark-up expense 37 (21,368,844) (25,454,480)
239,501,783 227,376,590
Commission income 38 2,591,194 1,909,180
Exchange gain - net 39 24,569,638 25,779,375
Dividend income 12,248,843 12,226,343
Share of profit from associates 40 26,196 -
Other operating income - net 41 574,355 2,756,112
Other income - net 42 302,049 160,960
279,814,058 270,208,560
Less: Operating expenses
- Cost of preparation of bank notes and printing charges 43 9,127,971 7,730,740
- Agency commission 44 9,679,298 8,968,647
- General administrative and other expenses 45 22,941,749 24,250,586
(Reversal of provision against) / Provision for / write-off:
- loans and advances - net 16.4 (6,139) (756)
- claims 30.3.2 - (232)
- other doubtful assets 30.3.1.1 16,842 (86,213)
- others (14,674) (7,338)
(3,971) (94,539)
41,745,047 40,855,434
Profit before taxation 238,069,011 229,353,126
Taxation 46 5,414 -
Profit after taxation 238,063,597 229,353,126
The annexed notes from 1 to 56 form an integral part of these consolidated financial statements.
___________________________ ___________________________ ___________________________
Tariq Bajwa Riaz Riazuddin Inayat Hussain
Governor Deputy Governor Executive Director
Consolidated Financial Statements of SBP and its Subsidiaries
CONSOLIDATED PROFIT AND LOSS ACCOUNT
FOR THE YEAR ENDED JUNE 30, 2017
------- (Rupees in '000) -------
STATE BANK OF PAKISTAN AND ITS SUBSIDIARIES
81

Note 2017 2016
Profit after taxation for the year 238,063,597 229,353,126
Other comprehensive income
Items that will be reclassified subsequently to consolidated profit and loss account
when specific conditions are met:
Unrealised appreciation on remeasurement of investments - local
- Appreciation during the year 14.6 1,918,895 7,391,288
- Share of associates of other comprehensive income / (loss) - net of deferred tax (2,290) -
1,916,605 7,391,288
Unrealised (diminution) / appreciation on gold reserves held by the Group 7 (17,015,000) 39,975,291
(15,098,395) 47,366,579
Items that will not be reclassified subsequently to the consolidated profit and loss account:
Remeasurements of staff retirement defined benefit plans - net of deferred tax 45.3.4 & 45.4.6 (3,805,653) (15,327,075)
Remeasurements of property, plant and equipment - 39,511,003
(3,805,653) 24,183,928
Total comprehensive income for the year 219,159,549 300,903,633
The annexed notes from 1 to 56 form an integral part of these consolidated financial statements.
___________________________ ___________________________ ___________________________
Tariq Bajwa Riaz Riazuddin Inayat Hussain
Governor Deputy Governor Executive Director
State Bank of Pakistan Annual Report FY17
------- (Rupees in '000) -------
CONSOLIDATED STATEMENT OF COMPREHENSIVE INCOME
FOR THE YEAR ENDED JUNE 30, 2017
STATE BANK OF PAKISTAN AND ITS SUBSIDIARIES
82

STATE BANK OF PAKISTAN AND ITS SUBSIDIARIES
CONSOLIDATED STATEMENT OF CHANGES IN EQUITY
FOR THE YEAR ENDED JUNE 30, 2017
Balance as at July 1, 2015 100,000 - 164,644,238 2,600,000 1,600,000 1,500,000 900,000 4,700,000 - - 243,367,310 83,994,988 25,978,404 529,384,940
Total comprehensive income for the year
Profit for the year - - - - - - - - - 229,353,126 - - - 229,353,126
Other comprehensive income
Unrealised appreciation on remeasurement of investments - local - - - - - - - - - - - 7,391,288 - 7,391,288
Unrealised appreciation on gold reserves held by the Bank - - - - - - - - - - 39,975,291 - - 39,975,291
Remeasurements of staff retirement defined benefit plans - - - - - - - - - (15,327,075) - - (15,327,075)
Remeasurements of property, plant and equipment - - - - - - - - - - - - 39,511,003 39,511,003
- - - - - - - - - 214,026,051 39,975,291 7,391,288 39,511,003 300,903,633
Transactions with owners
Dividend - - - - - - - - - (10,000) - - - (10,000)
Profit transferred to the Government of Pakistan - - - - - - - - - (210,304,000) - - - (210,304,000)
- - - - - - - - (210,314,000) - - - (210,314,000)
Balance as at June 30, 2016 100,000 - 164,644,238 2,600,000 1,600,000 1,500,000 900,000 4,700,000 - 3,712,051 283,342,601 91,386,276 65,489,407 619,974,573
Total comprehensive income for the year
Profit after taxation for the year - - - - - - - - 238,063,597 - - 238,063,597
Transfer to the reserve fund 1,999,567 - - - - - - (1,999,567) - - - -
Transfer from the reserve fund - 65,464,000 (65,464,000) - - - - - - - - - - -
Reserve created as a result of acquisition of PSPC (note 2) - - - - - - - - (41,279,353) - - - - (41,279,353)
Share of other comprehensive income of associates - net of deferred tax - - - - - - - - - - - - - -
Other comprehensive income
Share in loss of associates relating to investment classified as " available for sale" (2,290) (2,290)
Unrealised appreciation on remeasurement of investments - local - - - - - - - - - - - 1,918,895 - 1,918,895
Unrealised appreciation on gold reserves held by the Bank - - - - - - - - - - (17,015,000) - - (17,015,000)
Remeasurements of staff retirement defined benefit plans - - - - - - - - - (3,805,653) - - - (3,805,653)
- 65,464,000 (63,464,433) - - - - - (41,279,353) 232,258,377 (17,015,000) 1,916,605 - 177,880,196
Transactions with owners
Dividend - - - - - - - - - (10,000) - - - (10,000)
Profit transferred to the Government of Pakistan - - (36,000,000) - - - - - - (191,805,487) - - - (227,805,487)
- (36,000,000) - - - - - - (191,815,487) - - - (227,815,487)
Balance as at June 30, 2017 100,000 65,464,000 65,179,805 2,600,000 1,600,000 1,500,000 900,000 4,700,000 (41,279,353) 44,154,941 266,327,601 93,302,881 65,489,407 570,039,282
The annexed notes from 1 to 56 form an integral part of these consolidated financial statements.
________________________ ________________________ ________________________
Tariq Bajwa Riaz Riazuddin Inayat Hussain
Governor Deputy Governor Executive Director
Reserve created as a
result of acquisition
of PSPC (note 2)
Consolidated Financial Statements of SBP and its Subsidiaries
-------------------------------------------------Reserves--------------------------------------------------
Reserve for
acquisition of
PSPC
-------------------------------------------------------------------------------------------------------------------------(Rupees in '000)----------------------------------------------------------------------------------------------------------------------
Share
capital Reserve fund Rural credit fundIndustrial credit
fund
Export credit
fund
Loans
guarantee fund
TotalHousing credit
fund
Unappropriated
profit / (loss)
Unrealised
appreciation /
(diminution) on
gold reserves held
by the Bank
Unrealised
appreciation /
(diminution) on
remeasurement of
investments - local
Surplus on
revaluation of
property, plant and
equipment
83
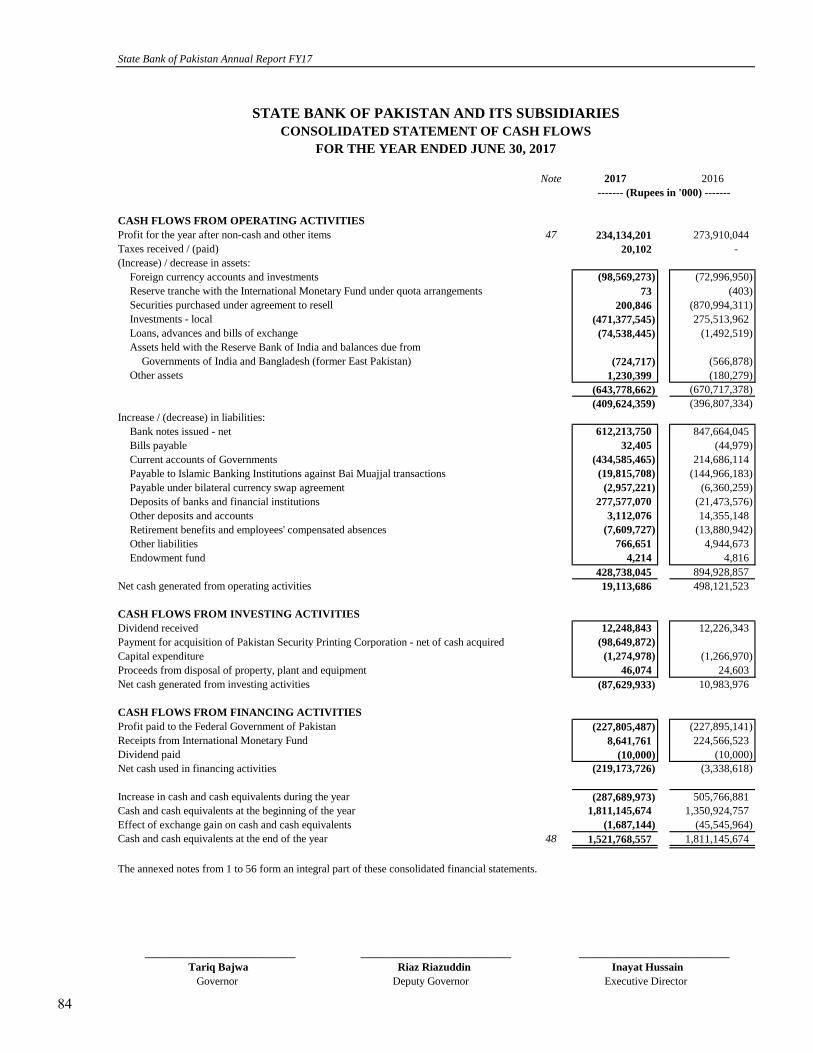
STATE BANK OF PAKISTAN AND ITS SUBSIDIARIES
CONSOLIDATED STATEMENT OF CASH FLOWS
FOR THE YEAR ENDED JUNE 30, 2017
Note 2017 2016
CASH FLOWS FROM OPERATING ACTIVITIES
Profit for the year after non-cash and other items 47 234,134,201 273,910,044
Taxes received / (paid) 20,102 -
(Increase) / decrease in assets:
Foreign currency accounts and investments (98,569,273) (72,996,950)
Reserve tranche with the International Monetary Fund under quota arrangements 73 (403)
Securities purchased under agreement to resell 200,846 (870,994,311)
Investments - local (471,377,545) 275,513,962
Loans, advances and bills of exchange (74,538,445) (1,492,519)
Assets held with the Reserve Bank of India and balances due from
Governments of India and Bangladesh (former East Pakistan) (724,717) (566,878)
Other assets 1,230,399 (180,279)
(643,778,662) (670,717,378)
(409,624,359) (396,807,334)
Increase / (decrease) in liabilities:
Bank notes issued - net 612,213,750 847,664,045
Bills payable 32,405 (44,979)
Current accounts of Governments (434,585,465) 214,686,114
Payable to Islamic Banking Institutions against Bai Muajjal transactions (19,815,708) (144,966,183)
Payable under bilateral currency swap agreement (2,957,221) (6,360,259)
Deposits of banks and financial institutions 277,577,070 (21,473,576)
Other deposits and accounts 3,112,076 14,355,148
Retirement benefits and employees' compensated absences (7,609,727) (13,880,942)
Other liabilities 766,651 4,944,673
Endowment fund 4,214 4,816
428,738,045 894,928,857
Net cash generated from operating activities 19,113,686 498,121,523
CASH FLOWS FROM INVESTING ACTIVITIES
Dividend received 12,248,843 12,226,343
Payment for acquisition of Pakistan Security Printing Corporation - net of cash acquired (98,649,872)
Capital expenditure (1,274,978) (1,266,970)
Proceeds from disposal of property, plant and equipment 46,074 24,603
Net cash generated from investing activities (87,629,933) 10,983,976
CASH FLOWS FROM FINANCING ACTIVITIES
Profit paid to the Federal Government of Pakistan (227,805,487) (227,895,141)
Receipts from International Monetary Fund 8,641,761 224,566,523
Dividend paid (10,000) (10,000)
Net cash used in financing activities (219,173,726) (3,338,618)
Increase in cash and cash equivalents during the year (287,689,973) 505,766,881
Cash and cash equivalents at the beginning of the year 1,811,145,674 1,350,924,757
Effect of exchange gain on cash and cash equivalents (1,687,144) (45,545,964)
Cash and cash equivalents at the end of the year 48 1,521,768,557 1,811,145,674
The annexed notes from 1 to 56 form an integral part of these consolidated financial statements.
___________________________ ___________________________ ___________________________
Tariq Bajwa Riaz Riazuddin Inayat Hussain
Governor Deputy Governor Executive Director
------- (Rupees in '000) -------
State Bank of Pakistan Annual Report FY17
84

STATE BANK OF PAKISTAN AND ITS SUBSIDIARIES
NOTES TO AND FORMING PART OF THE CONSOLIDATED FINANCIAL STATEMENTS
FOR THE YEAR ENDED JUNE 30, 2017
1. STATUS AND NATURE OF OPERATIONS
1.1 The Group comprises of State Bank of Pakistan ("the Bank") as the "Parent entity" and following subsidiaries:
- SBP Banking Services Corporation
- National Institute of Banking and Finance (Guarantee) Limited
- Pakistan Security Printing Corporation (Private) Limited
- Deposit Protection Corporation - non operational
1.1.1
- formulating and implementing the monetary policy;
- facilitating free competition and stability in the financial system;
- licensing and supervision of banks including micro finance banks, development financial institutions and exchange companies;
- organising and managing the inter-bank settlement system and promoting smooth functioning of payment systems;
- providing of loans and advances to the Governments, banks, financial institutions and local authorities under various facilities;
- purchasing, holding and selling of shares of banks and financial institutions on the directives of the Federal Government; and
- acting as a depository of the Government under specific arrangements between the Government and certain institutions.
1.1.2 The head office of the Bank is situated at I.I.Chundrigar Road, Karachi, in the province of Sindh, Pakistan.
1.1.3 The subsidiaries of the Bank and the nature of their respective activities are as follows:
a) SBP Banking Services Corporation - wholly owned subsidiary:
b) National Institute of Banking and Finance (Guarantee) Limited - wholly owned subsidiary:
The head office of the Institute is situated at Pitras Bukhari Road Islamabad, Pakistan.
c) Pakistan Security Printing Corporation (Private) Limited - wholly owned subsidiary:
The registered office and the factory are located at Jinnah Avenue, Malir Halt Karachi, in the province of Sindh, Pakistan.
d)
State Bank of Pakistan is the central bank of Pakistan and is incorporated under the State Bank of Pakistan Act, 1956. The Bank is
primarily responsible for monitoring of credit and foreign exchange, management of currency and also acts as the banker to the
Government. The activities of the Bank include:
SBP Banking Services Corporation was established in Pakistan under the SBP Banking Services Corporation Ordinance, 2001 and
commenced its operations with effect from January 2, 2002. It is responsible for carrying out certain statutory and administrative
functions and activities on behalf of the State Bank of Pakistan, as transferred or delegated by the Bank under the provisions of the
Ordinance.
National Institute of Banking and Finance (Guarantee) Limited 'the Institute' was incorporated in Pakistan under the repealed
Companies Ordinance, 1984 as a company limited by guarantee having share capital. It is engaged in providing education and
training in the field of banking, finance and allied areas.
The head office of the Banking Services Corporation (BSC) is situated at I.I.Chundrigar Road, Karachi, in the province of Sindh,
Pakistan.
During the year the Bank acquired 100% share holding in Pakistan Security Printing Corporation (Private) Limited (“the PSPC”).
The effective date of the acquisition of the Corporation is June 14, 2017. The PSPC was incorporated in Pakistan under the
repealed Companies ordinance, 1984 (the Ordinance). The PSPC is principally engaged in the printing of currency notes and
national prize bonds.
Deposit Protection Corporation - non operational
Deposit Protection Corporation ("the DPC") has been incorporated as a wholly owned subsidiary of SBP and is established under
the Deposit Protection Corporation Act 2016. It has been established for the protection of small depositors in order to ensure the
financial stability of and maintain public interest in, the financial system, and for matters connected therewith or ancillary thereto.
Consolidated Financial Statements of SBP and its Subsidiaries
85
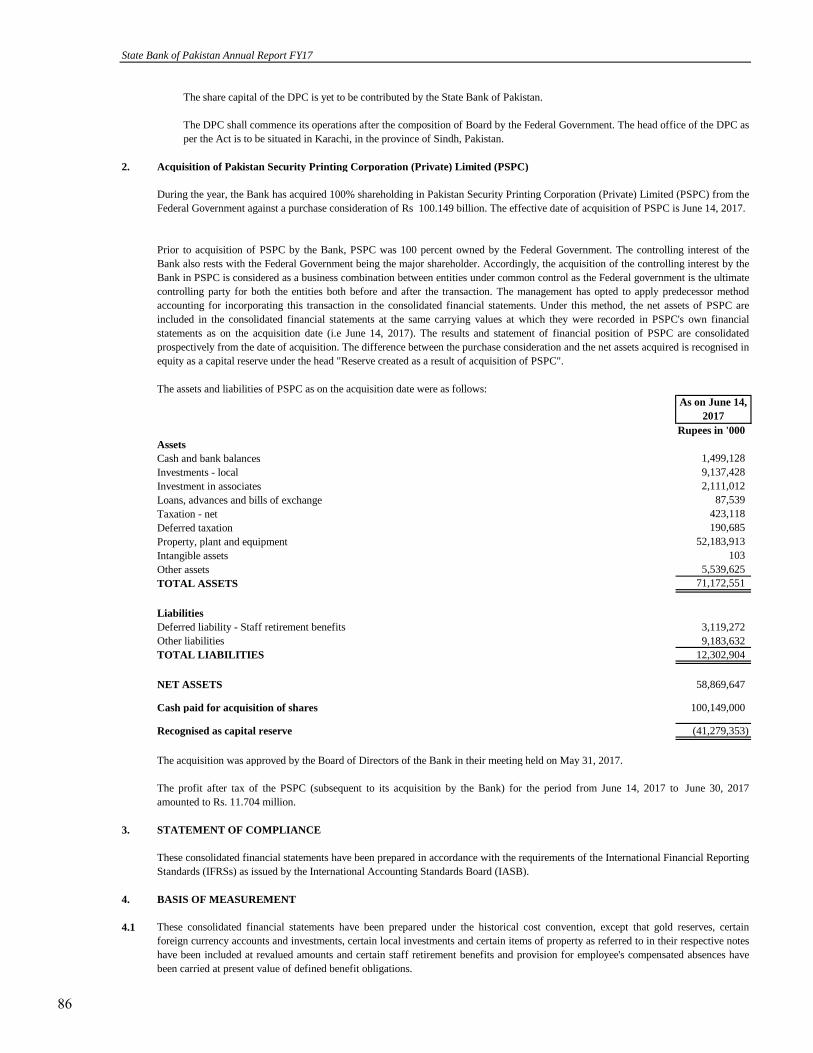
The share capital of the DPC is yet to be contributed by the State Bank of Pakistan.
2. Acquisition of Pakistan Security Printing Corporation (Private) Limited (PSPC)
The assets and liabilities of PSPC as on the acquisition date were as follows:
As on June 14,
2017
Rupees in '000
Assets
Cash and bank balances 1,499,128
Investments - local 9,137,428
Investment in associates 2,111,012
Loans, advances and bills of exchange 87,539
Taxation - net 423,118
Deferred taxation 190,685
Property, plant and equipment 52,183,913
Intangible assets 103
Other assets 5,539,625
TOTAL ASSETS 71,172,551
Liabilities
Deferred liability - Staff retirement benefits 3,119,272
Other liabilities 9,183,632
TOTAL LIABILITIES 12,302,904
NET ASSETS 58,869,647
Cash paid for acquisition of shares 100,149,000
Recognised as capital reserve (41,279,353)
The acquisition was approved by the Board of Directors of the Bank in their meeting held on May 31, 2017.
3. STATEMENT OF COMPLIANCE
4. BASIS OF MEASUREMENT
4.1 These consolidated financial statements have been prepared under the historical cost convention, except that gold reserves, certain
foreign currency accounts and investments, certain local investments and certain items of property as referred to in their respective notes
have been included at revalued amounts and certain staff retirement benefits and provision for employee's compensated absences have
been carried at present value of defined benefit obligations.
These consolidated financial statements have been prepared in accordance with the requirements of the International Financial Reporting
Standards (IFRSs) as issued by the International Accounting Standards Board (IASB).
During the year, the Bank has acquired 100% shareholding in Pakistan Security Printing Corporation (Private) Limited (PSPC) from the
Federal Government against a purchase consideration of Rs 100.149 billion. The effective date of acquisition of PSPC is June 14, 2017.
Prior to acquisition of PSPC by the Bank, PSPC was 100 percent owned by the Federal Government. The controlling interest of the
Bank also rests with the Federal Government being the major shareholder. Accordingly, the acquisition of the controlling interest by the
Bank in PSPC is considered as a business combination between entities under common control as the Federal government is the ultimate
controlling party for both the entities both before and after the transaction. The management has opted to apply predecessor method
accounting for incorporating this transaction in the consolidated financial statements. Under this method, the net assets of PSPC are
included in the consolidated financial statements at the same carrying values at which they were recorded in PSPC's own financial
statements as on the acquisition date (i.e June 14, 2017). The results and statement of financial position of PSPC are consolidated
prospectively from the date of acquisition. The difference between the purchase consideration and the net assets acquired is recognised in
equity as a capital reserve under the head "Reserve created as a result of acquisition of PSPC".
The DPC shall commence its operations after the composition of Board by the Federal Government. The head office of the DPC as
per the Act is to be situated in Karachi, in the province of Sindh, Pakistan.
The profit after tax of the PSPC (subsequent to its acquisition by the Bank) for the period from June 14, 2017 to June 30, 2017
amounted to Rs. 11.704 million.
State Bank of Pakistan Annual Report FY17
86
4.2
4.3 Use of estimates and judgments
4.3.1 Fair value of financial instruments
4.3.2 Effective Interest Rate (EIR) method
4.3.3 Impairment against loans and advances
4.3.4 Impairment of available-for-sale investments
4.3.5 Retirement benefits
4.3.6 Useful life and residual value of property and equipment
The preparation of financial statements in conformity with IFRS requires management to make judgments, estimates and assumptions
that affect the application of policies and reported amounts of assets and liabilities that are not readily available from other sources. The
estimates and associated assumptions are based on historical experiences and various other factors that are believed to be reasonable
under the circumstances, the result of which form the basis of making judgments about the carrying values of assets and liabilities and
income and expenses. Actual results may differ from these estimates. The estimates and underlying assumptions are reviewed on an
ongoing basis.
Revisions to accounting estimates are recognised in the period in which the estimate is revised if the revision affects only that period, or
in the period of revision and future periods if the revision affects both current and future periods. Judgments made by the management in
the application of IFRS and estimates that have a significant risk of material adjustment to the carrying amounts of assets and liabilities
are as follows:
The consolidated financial statements ('the financial statements') are presented in Pakistani Rupees (PKR), which is the Group's
functional and presentation currency.
The Group determines that available-for-sale investments are impaired when there is a significant or prolonged decline in the fair value
below its cost. The determination of what is significant or prolonged requires judgment. In making this judgment, the Group evaluates
among other factors, the normal volatility in security price. In addition, impairment may be appropriate when there is evidence of
deterioration in the financial health of the investee, industry and sector performance, changes in technology, and operational and
financing cash flows.
The fair value of financial instruments is the price that would be received to sell an asset or paid to transfer a liability in an orderly
transaction in the principal (or most advantageous) market at the measurement date under current market conditions (i.e., an exit price)
regardless of whether that price is directly observable or estimated using another valuation technique. When the fair values of financial
assets and financial liabilities recorded in the consolidated balance sheet cannot be derived from active markets, they are determined
using a variety of valuation techniques that include the use of valuation models. The inputs to these models are taken from observable
markets where possible, but where this is not feasible, estimation is required in establishing fair values. Judgements and estimates may
include items like considerations of liquidity and model inputs related to items such as credit risk (both own and counterparty), funding
value adjustments, correlation and volatility. For further details about determination of fair value please see Note 5.5 to these
consolidated financial statements.
The Group’s EIR methodology recognises interest income using a rate of return that represents the best estimate of a constant rate of
return over the expected behavioural life of financial instruments. This, by nature, requires an element of estimation regarding the
expected behaviour and life-cycle of the instruments, as well as clubbing of and other determinable fee income / expense to the cost of
acquisition of financial instruments that are integral parts of the instrument.
The Group reviews its loan portfolio to assess recoverability of loans and advances and impairment allowance required there against on a
continuous basis. While assessing this requirement, various factors including the delinquency in the account, financial position of the
borrower, quality of collateral and other relevant factors are considered. The amount of impairment may require adjustment in case
borrowers do not perform according to the expectations.
The key actuarial assumptions concerning the valuation of defined benefit plans and the sources of estimation are disclosed in note
45.3.1 and 45.4.1 to these consolidated financial statements.
Estimates of useful life and residual value of property, plant and equipment and intangibles are based on the management’s best estimate.
Consolidated Financial Statements of SBP and its Subsidiaries
87

4.4 New and amended standards and interpretations that are not yet effective:
Standards
-
-
- IFRS 16 ‘Leases’
-
Amendments
- Amendments to IAS 7 – ‘Statement of cash flows’ on disclosure initiative
-
-
- Amendment to IAS 40 - ‘Investment property’ relating to transfers of investment property
-
-
Interpretations
- IFRIC 22, 'Foreign currency transactions and advance consideration’
- IFRIC 23, 'Uncertainty over income tax treatment'
Improvements
-
-
-
-
IFRS 12, 'Disclosure of interests in other entities’ regarding clarification of the scope of the
standard.
January 1, 2017
January 1, 2018
January 1, 2019
January 1, 2018
Date yet to be finalized
January 1, 2017
Amendments to IFRS 2 - ‘Share based payments’ on clarifying how to account for certain
types of share-based payment transactions
January 1, 2018
Amendments to IFRS 4 - ‘Insurance contracts’ regarding the implementation of IFRS 9,
‘Financial instruments’
January 1, 2018
January 1, 2018
Amendments to IFRS 10 – ‘Consolidated Financial Statements’ and IAS 28 – ‘Investments
in Associates and Joint Ventures’ regarding sale or contribution of assets between an
investor and its associate or joint venture
Amendment to IAS 12 – ‘Income taxes’ on recognition of deferred tax assets for unrealised
losses
January 1, 2017
IFRS 1, 'First-time adoption of IFRS’ , regarding the deletion of short-term exemptions for
first-time adopters regarding IFRS 7, IAS 19, and IFRS 10
IAS 28, 'Investments in associates and joint ventures’ regarding measuring an associate or
joint venture at fair value
January 1, 2018
The Group expects that the adoption of the above standards, amendments, interpretations and improvements will not have any material
impact on the Group's financial statements in the period of initial application other than the initial application of IFRS 9, 'Financial
instruments' and IFRS 15, 'Revenue from contracts with customers' as described below:
IFRS 9, Financial Instruments (Hedge Accounting and amendments to IFRS 9, IFRS 7 and IAS 39) sets out the principles of
classification, measurement and derecognition of financial assets and financial liabilities, introduces new rules for hedge
accounting and a new impairment model for financial assets. The standard replaces IAS 39 'Financial Instruments: Recognition
and Measurement' except for the recognition requirements. The adoption of the standard introduces expanded disclosure
requirements and changes in presentation of the financial instruments which are expected to change the nature and extent of the
Group's disclosures about its financial instruments particularly in the year of the adoption of the new standard. The standard is
mandatorily effective for periods beginning on or after January 1, 2018 with early adoption permitted (subject to local regulation
requirements). the Group intends to adopt IFRS 9 on its mandatory date and the management is in the process of assessing the
impacts of IFRS 9 on the consolidated financial statements of the Group.
January 1, 2018
The following standards, amendments and interpretations would be effective from the dates mentioned below against the respective
standard or interpretation:
IFRS 15 ‘Revenue from contracts with customers’
IFRS 9 ‘Financial instruments’ January 1, 2018
Effective date (annual periods
beginning on or after)
January 1, 2019
Early adoption is permitted only if
IFRS 15 is adopted at the same time.
IFRS 17, ‘Insurance contracts’ January 1, 2021
State Bank of Pakistan Annual Report FY17
88

-
4.5
5. SIGNIFICANT ACCOUNTING POLICIES
5.1 Basis of consolidation
5.2 Bank notes in circulation and local currency - coins
5.3 Financial assets and financial liabilities
Financial instruments carried on the consolidated balance sheet include cash and bank balances held by a subsidiary, local currency -
coins, foreign currency accounts and investments, earmarked foreign currency balances, investments - local, loans, advances and bills of
exchange, assets held with Reserve Bank of India (other than gold held by Reserve Bank of India), balances due from the governments of
India and Bangladesh, taxation, other assets, bank notes in circulation, bills payable, deposits of banks and financial institutions,
balances and securities under repurchase and reverse repurchase transactions, payable to Islamic Banking Institutions against Bai Muajjal
transactions, current accounts of Governments, balances with the International Monetary Fund (IMF), amount payable under bilateral
currency swap agreement, other deposits and accounts and other liabilities. The particular recognition and measurement methods adopted
are disclosed in the individual policy statements associated with each financial instrument.
All financial assets and financial liabilities are measured initially at their fair value plus transaction costs, except in the case of financial
assets and financial liabilities recorded at fair value through profit or loss where transaction cost is taken directly to the consolidated
profit and loss account. Any difference between the fair value of consideration given and the amount determined using the valuation
techniques detailed in note 5.5 is recognised in the consolidated profit and loss account.
The management determines the appropriate classification of its financial instruments at the time of initial recognition in the following
categories:
The liability of the Bank towards bank notes issued as a legal tender under the State Bank of Pakistan Act, 1956, is stated at face value
and is represented by the specified assets of the Issue Department of the Group as per the requirements stipulated in the State Bank of
Pakistan Act, 1956. The cost of producing the notes including printing charges is charged to the consolidated profit and loss account as
and when incurred. Any un-issued fresh bank notes lying with the Bank and previously issued notes held by the Bank are not reflected in
the balance sheet.
The Group also issues coins of various denominations on behalf of the Government of Pakistan (GoP). These coins are purchased from
the GoP at their respective face values. The coins held by the Group form part of the assets of the Issue Department.
IFRS 15, ‘Revenue from contracts with customers’ deals with revenue recognition and establishes principles for reporting useful
information to users of financial statements about the nature, amount, timing and uncertainty of revenue and cash flows arising
from an entity’s contracts with customers. Revenue is recognised when a customer obtains control of a good or service and thus
has the ability to direct the use and obtain the benefits from the good or service. The standard replaces IAS 18 ‘Revenue’ and IAS
11 ‘Construction contracts’ and related interpretations. The standard is effective for annual periods beginning on or after January
1, 2018 and earlier application is permitted. The management is in the process of assessing the impact of IFRS 15 on the
consolidated financial statements of the Group.
New and amended standards, interpretations and amendments to published approved accounting standards that are effective in
the current year
There are certain new and amended standards and interpretations that are mandatory for the accounting period beginning on or after July
1, 2016 but are considered not to be relevant or do not have any significant effect on the Group's operations and are, therefore, not
disclosed in these consolidated financial statements.
All material inter group balances and transactions have been eliminated.
The consolidated financial statements include collectively the financial statements of the State Bank of Pakistan and its subsidiaries.
Financial statements of the subsidiaries have been consolidated on a line-by-line basis.
The significant accounting policies applied in the preparation of these consolidated financial statements are set out below. These policies
have been consistently applied to all the years presented, unless otherwise stated.
Subsidiaries are entities controlled by the Bank. The Bank controls an entity if it is exposed to, or has rights to, variable returns from its
involvement with the investee and has the ability to effect these returns through its power over the investee. The financial statements of
subsidiaries are included in the consolidated financial statements from the date on which control commences until the date when control
ceases.
All financial assets are initially recognised on the trade date, i.e. the date at which the Group becomes a party to the contractual
provisions of the instruments. This includes purchases or sale of financial assets that require delivery of asset within the time frame
generally established by regulations in market conventions.
Consolidated Financial Statements of SBP and its Subsidiaries
89

5.3.1 Financial assets and financial liabilities at 'fair value through profit or loss' / 'held for trading'
5.3.2 Held to maturity investments
5.3.3 Loans and receivables
5.3.4 Available-for-sale financial assets
5.3.5 Investment in associates
5.3.6 Financial liabilities at amortised cost
Financial assets at fair value through profit or loss are financial assets held for trading and financial assets designated upon initial
recognition as at fair value through profit or loss.A financial asset is classified as held for trading if acquired principally for the purposes
of selling in the short term.These assets and liabilities are either acquired / assumed for generating a profit from short term fluctuations in
market price, interest rate movements, dealer’s margin or securities included in a portfolio in which a pattern of short term profit making
exists. These are initially recognised at fair value and transaction costs associated with the instrument are taken directly to the
consolidated profit and loss account. These instruments are subsequently re-measured at fair value. All related realised and unrealised
gains and losses are recognised in the consolidated profit and loss account directly. Derivatives are also categorised as financial assets
and financial liabilities at 'fair value through profit or loss'.
These are the non derivative financial assets which are either designated in this category or which do not fall in any of the other
categories. Subsequent to initial recognition, these securities are measured at fair value, except investments in those securities the fair
value of which cannot be determined reliably and are stated at cost. Gain or loss on changes in fair value is taken to and kept in equity
until the investments are sold or disposed off, or until the investments are determined to be impaired. At that time, cumulative gain or
loss previously recognised in equity is re-classified to the consolidated profit and loss account.
These are non-derivative financial assets with fixed or determinable payments that are not quoted in an active market. Subsequent to
initial recognition, these assets are carried at amortised cost less impairment losses, if any, and premiums and / or discounts are
accounted for using the effective interest method.
All loans and receivables are recognized when cash is advanced to borrowers. When a loan becomes uncollectible, it is written off
against the related provision for impairment. Subsequent recoveries are credited in the consolidated profit and loss account.
Financial liabilities with a fixed maturity are measured at amortised cost using the effective interest rate. These include deposits of banks
and financial institutions, other deposits and accounts, securities sold under agreement to repurchase, payable under bilateral currency
swap agreement, current accounts of Governments, current account with SBP- Banking Services Corporation, current account with
National Institute of Banking and Finance (Guarantee) Limited, payable to Islamic Banking Institutions against Bai Muajjal transactions,
payable to the IMF, bank notes in circulation, bills payable and other liabilities.
Entities in which the Group has significant influence but not control and which are neither its subsidiaries nor joint ventures are
classified as associates and are accounted for by using the equity method of accounting.
These investments are initially recognised at cost, thereafter the carrying amount is increased or decreased to recognise the Group share
of profit or loss of associates. Share of post acquisition profit and loss of associates is accounted for in the consolodiated profit and loss
account. Distribution received from investee reduces the carrying amount of investment. The Group's share of associates' other
comprehensive income is recognised in consolidated Other Comprehensive Income of the Group.
The carrying amount of the investment is tested for impairment, by comparing its recoverable amount (higher of value in use and fair
value less costs to sell) with its carrying amount and loss, if any is recognised in the consolidated profit and loss account.
Unrealised gains / losses arising from transactions with associated companies are eliminated against the investment in the associates to
the extent of Group's interest in the associates. Unrealised losses are eliminated in the same way as unrealised gains except that they are
only eliminated to the extent that there is no evidence of impairment.
The Group accounts for its share of comprehensive income from associates as at year end on the basis of latest available financial
statement of associates but not older than three months.
These are non-derivative financial assets with fixed or determinable payments and fixed maturity that the Group has the positive intent
and ability to hold till maturity. After initial measurement, held-to-maturity investments are subsequently measured at amortised cost
using the effective interest rate method, less impairment losses, if any. Amortised cost is calculated by taking into account any discount
or premium on acquisition and fees that are integral part of the effective interest rate. The effective interest rate method is a method of
calculating the amortised cost of financial assets or financial liabilities and of allocating the interest income or interest expense over the
relevant period in the consolidated profit and loss account. The losses arising from impairment of such investments are recognised in the
consolidated profit and loss account.
State Bank of Pakistan Annual Report FY17
90

5.4 Derecognition of financial asset and financial liabilities
a)
b)
5.5 Fair value measurement principles
5.6 Offsetting
5.7 Derivative financial instruments
5.8 Collateralised borrowing / lending
5.8.1 Reverse repurchase and repurchase agreements
5.8.2 Payable under bilateral currency swap agreement
5.9 Payable to Islamic Banking Institutions against Bai Muajjal transactions
The Group purchases Government of Pakistan (GoP) Ijara sukuks on deferred payment basis (Bai Muajjal) from Islamic Banks. The
deferred price is agreed at the time of purchase and such proceeds are paid to the Islamic Banks at the end of the agreed period. The
difference between the fair value and deferred price represents financing cost and is recognised in consolidated profit and loss account
on a time proportion basis as "mark-up expense". Amount payable to Islamic Banking Institutions under deferred payment basis on
purchase of sukuks is reported at transaction value plus profit payable thereon (i.e. at amortised cost).
A financial liability is derecognised when the obligation under the liability is discharged or cancelled or expired. Where an existing
financial liability is replaced by another from the same lender on substantially different terms, or the terms of an existing liability
are substantially modified, such an exchange or modification is treated as a derecognition of the original liability and the
recognition of new liability, and the difference in the respective carrying amount is recognised in the consolidated profit and loss
account.
The fair value of financial instruments traded in active markets at the balance sheet date is based on their quoted market prices or dealer
price quotation without any deduction for transaction costs. If there is no active market for a financial asset, the Group establishes fair
value using valuation techniques. These include the use of recent arms length transaction, discounted cash flow analysis and other
revaluation techniques commonly used by market participants. Investments in securities of which the fair value cannot be determined
reliably are carried at cost.
On derecognition of a financial asset, the difference between the carrying amount of the asset (or the carrying amount allocated to
the portion of the asset transferred), and the sum of (i) the consideration previously received (including any new asset obtained less
any new liability assumed) and (ii) any cumulative gain or loss that had been previously recognised in other comprehensive
income, is recognised in the consolidated profit and loss account.
Financial assets
Financial liabilities
Securities sold subject to a commitment to repurchase them at a pre-determined price, are retained on the balance sheet and a liability is
recorded in respect of the consideration received as “Securities sold under agreement to repurchase”. Conversely, securities purchased
under analogous commitment to resell are not recognized on the consolidated balance sheet and an asset is recorded in respect of the
consideration paid as “Securities purchased under agreement to resell”. The difference between the sale and repurchase price in the
repurchase transaction and the purchase price and resell price in reverse repurchase transaction represents expense and income
respectively, and is recognised in the consolidated profit and loss account on time proportion basis. Both repurchase and reverse
repurchase transactions are reported at transaction value inclusive of any accrued expense / income.
A financial asset and a financial liability are offset and the net amount is reported in the consolidated financial statements when the
Group has a legally enforceable right to set off the recognised amount and it intends either to settle on a net basis or to realise the asset
and to settle the liability simultaneously.
The Group uses derivative financial instruments which include forwards, futures and swaps. Derivatives are initially recorded at fair
value and are re-measured to fair value on subsequent reporting dates. Forwards, futures and swaps are shown under commitments. The
resultant gains or losses from derivatives are included in the consolidated profit and loss account.
Bilateral currency swap agreements with counterpart central banks involve the purchase / sale and subsequent resale / repurchase of local
currencies of counterpart central banks against PKR at the applicable exchange rate (determined in accordance with the terms of the
agreement). The actual use of facility by the Group / counterpart central bank in the agreement is recorded as borrowing / lending in
books of the Group and interest is charged / earned at agreed rates to the consolidated profit and loss account on a time proportion basis
from the date of actual use. Any unutilised limit of the counterpart's drawing is reported as commitments.
The Group derecognises a financial asset when the contractual rights to receive the cash flows from the financial asset expires, or it
transfers the rights to receive the contractual cash flows in a transaction in which substantially all the risks and rewards of
ownership of the financial asset are transferred or in which the Group neither transfers nor retains substantially all the risks and
rewards of ownership and it does not retain control of the financial asset.
Consolidated Financial Statements of SBP and its Subsidiaries
91

5.10 Gold reserves
5.11 Cash and cash equivalents
5.12 Property, plant and equipment
5.13 Leased Assets
Depreciation on assets held under finance lease is charged in a manner consistent with that for depreciable assets owned by the PSPC.
5.14 Investment Property
Property, plant and equipment except land, buildings and capital work-in-progress (CWIP) are stated at cost less accumulated
depreciation and accumulated impairment losses, if any. Freehold land is stated at revalued amount. Leasehold land and buildings are
stated at revalued amount less accumulated depreciation and accumulated impairment losses, if any. CWIP is stated at cost less
accumulated impairment losses, if any and consists of expenditure incurred and advances made in respect of fixed assets in the course of
their acquisition, construction and installation. CWIP assets are capitalised to relevant asset category as and when work is completed.
Estimates of useful life and residual value of property, plant and equipment are based on the management's best estimate. The assets'
residual value, depreciation method and useful life are reviewed, and adjusted, if appropriate, at each balance sheet date.
Assets held under finance lease are stated at the lower of their fair value or present value of minimum lease payments at inception less
accumulated depreciation and accumulated impairment losses, if any. The outstanding obligations under the lease agreements net of
financial charges allocable to future periods are shown in other liabilities .
The financial charges are allocated to accounting periods in a manner so as to provide a constant periodic rate of return on the
outstanding liability.
Gold is recorded at the cost, which is the prevailing market rate, at initial recognition. Subsequent to initial measurement, it is revalued at
the closing market rate fixed by the London Bullion Market Association on the last working day of the year which is also the requirement
of State Bank of Pakistan Act, 1956 and State Bank of Pakistan General Regulation No.42(vi). Appreciation or diminution, if any, on
revaluation is taken to equity under the head “unrealised appreciation on gold reserves held by the Group”. Appreciation / diminution
realised on disposal of gold is taken to the consolidated profit and loss account. Unrealised appreciation / diminution on gold reserves
held with the Reserve Bank of India is not recognised in the consolidated statement of changes in equity pending transfer of these assets
to the Group subject to final settlement between the Governments of Pakistan and India. Instead it is shown in "other liabilities" as
provision for other doubtful assets.
Increase in carrying amount arising on revaluation of land and buildings is recognised in consolidated other comprehensive income and
credited to surplus on revaluation of property, plant and equipment. Decreases that offset previous increases of the same assets are
charged against surplus on revaluation of property, plant and equipment in equity, while all other decreases are charged to the
consolidated profit and loss account. The surplus on revaluation realised on sale of property, plant and equipment is transferred to un-
appropriated profit to the extent reflected in the surplus on revaluation of property, plant and equipment account. The amount of sale
proceeds exceeding the balance in surplus on revaluation of property, plant and equipment account is taken to the consolidated profit and
loss account.
Depreciation on additions is charged to the consolidated profit and loss account from the month in which the asset is available for use
while no depreciation is charged in the month in which the assets are deleted / disposed off. Normal repairs and maintenance are charged
to the consolidated profit and loss account as and when incurred. Major renewals and improvements are capitalised and the assets so
replaced, if any, are retired. Gains and losses on disposal of fixed assets are included in the consolidated profit and loss account.
Depreciation on property, plant and equipment is charged to the consolidated profit and loss account using the straight-line method
whereby the cost / revalued amount of an asset is written off over its estimated useful life at the rates specified in note 19.1 to these
consolidated financial statements. The useful life of assets is reviewed and adjusted, if appropriate, at each balance sheet date.
Cash and cash equivalents include cash and bank balances of subsidiary company, foreign currency accounts and investments (other than
held to maturity investments), local currency coins, earmarked foreign currency balances, SDRs, balances in the current and deposit
accounts and securities that are realisable in known amounts of cash within three months from the date of original investments and which
are subject to insignificant changes in value.
State Bank of Pakistan Annual Report FY17
Investment properties are measured initially at cost, including related transaction costs. These properties are carried at cost less
accumulated depreciation subsequent to initial recognition.
Additions to investment properties consists of cost of capital nature. The profit on disposal is determined as a difference between sales
proceeds and the carrying amount of the assets at the commencement of the accounting period plus capital expenditure in the period.
92

5.15 Intangibles
5.16 Accounts receivables and other receivables
5.17 Impairment of financial assets
a) Financial assets carried at amortised cost
b) Available-for-sale financial assets
5.18 Impairment of non-financial assets
The carrying amounts of the Group’s assets are reviewed at each balance sheet date to determine whether there is any indication of
impairment of any asset or a group of assets. If such indication exists, the recoverable amount of such assets is estimated. The
recoverable amount is higher of an asset's fair value less cost to sell and value in use. In assessing the value in use, future cash flows are
estimated which are discounted to present value using a discount rate that reflects the current market assessments of the time value of
money and the risk specific to the asset. In determining fair value less cost to sell, an appropriate valuation model is used. An impairment
loss is recognised in the consolidated profit and loss account whenever the carrying amount of an asset or a group of assets exceeds its
recoverable amount. Impairment loss on revalued assets is adjusted against the related revaluation surplus to the extent that the
impairment loss does not exceed the surplus on revaluation of that asset.
Intangible assets are carried at cost less accumulated amortisation and accumulated impairment losses, if any.
Intangible assets are amortised using straight-line method over the period specified in note 20.1 to these consolidated financial
statements. Where the carrying amount of an asset exceeds its estimated recoverable amount, it is written down immediately to its
recoverable amount.
Accounts receivables and other receivables are carried at invoice amount less an allowance for any uncollectible amounts. Known bad
debts are written off when identified.
For available-for-sale financial assets, the Group assesses at each balance sheet date whether there is an objective evidence that an
investment is impaired. In case of equity investment classified as available-for-sale, significant or prolonged decline in the fair
value of the security below its cost is considered in determining whether the assets are impaired. If any such evidence exist for
available-for-sale financial assets, the cumulative loss measured as the difference between the acquisition cost and the current fair
value, less any impairment loss on that financial asset previously recognised in consolidated profit and loss account, is reclassified
from consolidated other comprehensive income and recognised in the consolidated profit and loss account. Impairment losses
recognised in the consolidated profit and loss account on equity instruments are not reversed through the income statement till the
time the investments are sold or disposed off.
The Group assesses at each balance sheet date whether there is any objective evidence that a financial asset or a group of financial assets
is impaired. A financial asset or a group of financial assets is deemed to be impaired if there is an objective evidence of impairment as a
result of one or more events that has occurred after the initial recognition of the assets (an incurred 'loss event') and that loss event (or
events) has an impact on estimated future cash flows, of the financial asset or a group of financial assets that can be reliably estimated.
Evidence of impairment may include indication that the borrower or group of borrowers is experiencing significant financial difficulty,
the probability that they will enter bankruptcy or other financial reorganisation, default or delinquency in interest or principal payment
and where observable data indicates that there is measurable decrease in the estimated future cash flows, such as changes in arrears or
economic conditions that correlate with defaults, if any.
For financial assets carried at amortised cost, the Group first assesses whether objective evidence of impairment exists for financial
assets that are individually significant, or collectively for financial assets that are not individually significant. If the Group
determines that no objective evidence of impairment exists for individually assessed financial assets, it includes the assets in a
group of financial assets with similar credit risk characteristics and collectively assesses them for impairment. Assets that are
individually assessed for impairment and for which an impairment loss is, or continues to be, recognised are not included in the
collective assessment of impairment.
If there is objective evidence that an impairment loss has been incurred, the amount of the loss is measured as the difference
between the asset's carrying value and the present value of estimated future cash flows discounted at the financial asset's original
effective interest rate. The carrying value of the assets is reduced through the use of an allowance account and the amount of the
loss is recognised in the consolidated profit and loss account. If in a subsequent year the amount of the estimated impairment loss
increases or decreases because of an event occurring after the impairment was recognised, the previously recognised impairment
loss is increased or reduced by adjusting the allowance account. If in a subsequent period the amount of impairment loss decreases
and the decrease can be linked objectively to an event occurring after the write down, the write down or allowance is reversed
through the consolidated profit and loss account.
Consolidated Financial Statements of SBP and its Subsidiaries
93

5.19 Stores and spares
5.20 Stock-in-trade-PSPC
5.21 Stationery and other consumables
5.22 Provisions
5.23 Transactions and balances with the International Monetary Fund
-
-
-
- service charge is recognised in the consolidated profit and loss account at the time of receipt of the IMF tranches.
- charges on borrowings under credit schemes and fund facilities;
- charges on net cumulative allocation of SDRs;
- exchange gain or loss: and
- return on holdings of SDRs.
5.24 Staff retirement benefits
5.24.1 The Bank operates:
a)
The Group reviews the carrying amount of stores and spares on a regular basis and provision is made for obsolescence if there is any
change in usage pattern and physical form.
Raw materials are valued at lower of cost determined on weighted average basis and net realisable value except for items in transit which
are stated at cost incurred upto the balance sheet date.
Stationery and other consumables are valued at the lower of cost and net realisable value. Cost comprises of cost of purchases and other
costs incurred in bringing the items to their present location and condition. Replacement cost of the items is used to measure the net
realisable value. Provision is made for items which are not used for a considerable period of time.
Work-in-process and finished goods are valued at lower of cost determined on weighted average basis and net realisable value. Cost in
relation to work-in-process and finished goods represents direct cost of materials, direct wages and an appropriate portion of production
overheads.
Net realisable value signifies the estimated selling price in the ordinary course of business less the estimated cost of completion and the
costs necessary to be incurred to make the sale.
Provisions are recognised when the Group has a present legal or constructive obligation as a result of past events, it is probable that an
outflow of economic resources will be required to settle the obligation and a reliable estimate of the amount can be made. Provisions are
reviewed at each balance sheet date and are adjusted to reflect the current best estimates.
Transactions and balances with the International Monetary Fund (IMF) are recorded on following basis:
the Government’s contribution for quota with the IMF is recorded by the Group as depository of the Government. Exchange
differences arising on these balances are transferred to the Government of Pakistan account.
State Bank of Pakistan Annual Report FY17
an unfunded contributory provident fund (old scheme) for those employees who joined the Bank prior to 1975 and opted to remain
under the old scheme. Under this scheme, contribution is made both by the Bank and employee at the rate of 6% of the monetized
salary. The Bank provided an option to employees covered under old scheme to join the funded Employer Contributory Provident
Fund Scheme - ECPF (new scheme) effective from June 1, 2007. Under this scheme, contribution is made both by the Bank and
employee at the rate of 6% of the monetized salary. Moreover, employees joining the Bank service after June 1, 2007 are covered
under the new scheme.
the cumulative allocation of Special Drawing Rights (SDRs) by the IMF is recorded as a liability and is translated at closing
exchange rate for SDRs prevailing at the balance sheet date. Exchange differences on translation of SDRs is recognised in the
consolidated profit and loss account.
exchange gains or losses arising on revaluation of borrowings from the IMF are recognised in the consolidated profit and loss
account.
All other income or charges pertaining to balances with the IMF are taken to the consolidated profit and loss account, including the
following:
Stores and spares held by PSPC are valued at the lower of cost determined on weighted average method and net realisable value. Stores
and spares in transit are valued at cost incurred upto the balance sheet date. Local purchases of engineering stores are charged to the
consolidated profit and loss account at the time of purchase.
94
b)
c)
d)
e)
f) an unfunded benevolent fund scheme;
g) an unfunded post retirement medical benefit scheme; and
h) six months post retirement benefit facility.
5.24.2 The SBP Banking Service Corporation operates the following staff retirement benefit schemes for employees:
a)
b)
c)
d)
e)
Following are other staff retirement benefit schemes operated for employees of the Corporation:
- an unfunded benevolent fund scheme;
- an unfunded post retirement medical benefit scheme; and
-
5.24.3 The Pakistan Security Printing Corporation (Private) Limited operates following staff retirement benefits scheme for employees:
a)
b)
5.24.4
six months post retirement benefit facility.
Obligations for contributions to defined contribution provident fund plans are recognised as an expense in the consolidated profit and
loss account as and when incurred.
an unfunded gratuity scheme (old scheme) for all employees other than those who opted for the new general provident fund
scheme, or joined the Bank after 1975 and are entitled only to pension scheme benefits;
a funded Employees Gratuity Fund (EGF) was introduced by the Bank effective from June 1, 2007 for all its employees other than
those who opted for pension scheme or unfunded gratuity scheme (old scheme);
employees who have completed the prescribed qualifying period of more than ten years of service and opt for the scheme are
entitled to post retirement pension benefit; and
gratuity for employees who have opted for gratuity instead of pension or those who have completed five years of service but have
not yet completed ten years of service.
an unfunded pension scheme for those employees who joined the Bank after 1975 and before the introduction of EGF which is
effective from June 1, 2007;
an un-funded gratuity scheme (old scheme) for all employees other than the employees who opted for the new general contributory
provident fund scheme or transferred employees who joined SBP after 1975 and are entitled only to pension scheme benefits;
a funded New Gratuity Fund (NGF) which was introduced by the Corporation effective from July 1, 2010 for all its employees
other than those who opted for pension scheme or unfunded gratuity scheme (old scheme);
an un-funded pension scheme for those employees who joined the SBP after 1975 and before the introduction of EGF which is
effective from July 1, 2010;
Consolidated Financial Statements of SBP and its Subsidiaries
an unfunded General Provident Fund (GPF) scheme for all those employees who joined the Bank after 1975 and those employees
who had joined prior to 1975 but opted for this scheme. Under this scheme contribution is made by the employee only at the rate of
5% of the monetized salary;
an un-funded contributory provident fund (old scheme) for transferred employees who joined SBP prior to 1975 and opted to
remain under the old scheme. Under this scheme, contribution is made both by the Corporation and employee at the rate of 6% of
the monetized salary. The Corporation provided an option to employees covered under old scheme to join the funded New
Contributory Provident Fund Scheme - NCPF (new scheme) effective from July 1, 2010. Under this scheme contribution is made
by both the employer and employee at the rate of 6% of the monetized salary. Moreover, employees joining the Corporation service
after July 1, 2010 are covered under the new scheme.
an un-funded general contributory provident fund (new scheme) for transferred employees who joined SBP after 1975 or who had
joined SBP prior to 1975 but have opted for this new scheme. Under this scheme contribution is made by the employee only at the
rate of 5% of the monetized salary.
An approved funded defined benefit funded pension scheme for all its permanent employees under the Pakistan Security Printing
Corporation (Private) Limited Employees (Pension and Gratuity) Regulations 1993 (the regulations). As a result of business
reorganisation, employees relating to National Security Printing Corporation (Private) Limited (NSPC) were transferred to NSPC and as
per the business transfer agreement dated May 19, 2017 the cost of gratuity or pension are to be borne by transferee company i.e. NSPC,
accordingly, the pension fund has become a multi-employer fund. Under the scheme, the employees are entitled to the following:
95

5.24.5
5.24.6
5.25 Compensated absences
5.26 Trade and other payables
5.27 Borrowing costs
5.28 Leases
5.29 Deferred income
5.30 Revenue recognition
-
-
- Commission income is recognised when related services are rendered.
- Dividend income is recognised when the Group’s right to receive the dividend is established.
- Gains / losses on disposal of securities are recognised in the consolidated profit and loss account at the trade date.
- Training, education and hostel services are recognised on accrual basis.
- Rental income from property is accrued on time proportion basis at agreed rates.
- Return on bank deposits is recognised on accrual basis taking into account the effective yield.
- Scrap sales and miscellaneous income are recognised on receipt basis.
- All other revenues are recognised on a time proportion basis.
5.31 Finances under profit and loss sharing arrangements
5.32 Foreign currency translation
The Group makes annual provision in respect of liability for employees’ compensated absences based on actuarial estimates. The liability
is estimated using the Projected Unit Credit Method.
Grants received on account of capital expenditure are recorded as deferred income. These are amortised over the useful life of the
relevant asset.
Transactions denominated in foreign currencies are translated to Pak Rupees at the foreign exchange rate prevailing at the date of
transaction. Monetary assets and liabilities in foreign currencies are translated into rupees at the closing rate of exchange prevailing at the
balance sheet date.
Discount, interest / mark-up and / or return on loans and advances and investments are recorded on time proportion basis that takes
into account the effective yield on the asset. However, income on balances with Bangladesh (former East Pakistan), doubtful loans
and advances and overdue return on investments is recognised on receipt basis.
The Group provides various finances to financial institutions under profit and loss sharing arrangements. Share of profit / loss under
these arrangements is recognised on an accrual basis.
Annual provisions are made by the Group to cover the obligations arising under defined benefit schemes based on actuarial
recommendations. The actuarial valuations are carried out under the "Projected Unit Credit Method". The most recent valuation in this
regard was carried out as at June 30, 2017. The amount arising as a result of remeasurements are recognised in the consolidated balance
sheet immediately, with a charge or credit to consolidated other comprehensive income in the period in which they occur.
The above staff retirement benefits are vested on completion of prescribed qualifying period of service.
Revenue from sale of goods is measured at fair value of the consideration received or receivable. Revenue is recognised when the
significant risks and rewards of ownership have been transferred to the buyer, recovery of the consideration is probable, the
associated costs and possible return of goods can be estimated reliably, and there is no continuing management involvement with
the goods. The Group records revenue from sale of goods on dispatch of goods to its customers.
Liabilities for trade and other amounts payable are carried at amortised cost, which is the fair value of the consideration to be paid in
future for goods and services received, whether or not billed.
Borrowing costs relating to the acquisition, construction or production of a qualifying asset are recognised as part of the cost of that
asset. All other borrowing costs are recognised as an expense in the period in which these are incurred.
Liabilities against assets subject to finance lease are accounted for at the net present value of minimum payments under the lease
arrangements. Financial charges under lease arrangements are allocated to periods during the lease term so as to produce a constant
periodic rate of financial cost on the remaining balance of principal liability for each period.
State Bank of Pakistan Annual Report FY17
96

5.33 Taxation
Current
Deferred
Note 2017 2016
6. CASH AND BANK BALANCES HELD BY A SUBSIDIARY
With banks in current accounts 6.1 2,184,161 -
Cash in hand 6,496 -
2,190,657 -
6.1
Note 2017 2016
7. GOLD RESERVES HELD BY THE BANK
Opening balance 2,074,032 287,170,323 247,150,713
Additions during the year 1,602 205,879 44,319
(Diminution) / appreciation for the year due to revaluation 34 (17,015,000) 39,975,291
23.1 2,075,634 270,361,202 287,170,323
Note 2017 2016
8. LOCAL CURRENCY - COINS
Coins held as an asset of the Issue Department 8.1 & 23.1 861,860 488,198
Exchange differences arising under Exchange Risk Coverage Scheme and on currency swap transactions are recognised in the
consolidated profit and loss account on an accrual basis.
Commitments for outstanding foreign exchange forward, future and swap contracts disclosed in note 35.2 to these consolidated financial
statements are translated at forward rates applicable to their respective maturities. Contingent liabilities / commitments for letters of
credit and letters of guarantee denominated in foreign currencies are expressed in PKR terms at the closing rate of exchange prevailing at
the balance sheet date.
Net content in
troy ounces ---------(Rupees in '000)--------
--------------- (Rupees in '000) --------------
This includes remunerative accounts carrying mark-up ranging from 3.75% to 6.25% per annum.
---------(Rupees in '000)--------
Deferred tax is recognised using the balance sheet method, providing for temporary differences between the carrying amounts of assets
and liabilities for financial reporting purposes and amounts used for taxation purposes. Deferred tax is not recognised for the temporary
differences relating to initial recognition of goodwill, initial recognition of assets or liabilities in a transaction that is not a business
combination and that affects neither accounting nor taxable profits and differences relating to investments in subsidiaries to the extent
that they probably will not reverse in the foreseeable future.
The charge for current taxation is based on expected taxable income for the year at the current rates of taxation, after taking into
consideration available tax credits, rebates, tax losses, etc. The charge for current tax also includes adjustments to tax payable in respect
of previous years including those arising from assessments finalised during the year and are separately disclosed.
Deferred tax is measured at the tax rates that are expected to be applied to the temporary differences when they reverse, based on the
laws that have been enacted or substantively enacted by the reporting date.
A deferred tax asset is recognised only to the extent that it is probable that future taxable profits will be available against which the assets
can be utilised. Deferred tax assets are reviewed at each reporting date and are reduced to the extent that it is no longer probable that the
related tax benefits will be realised.
Exchange gains and losses are taken to the consolidated profit and loss account except for certain exchange differences on balances with
the International Monetary Fund which are transferred to the Government of Pakistan account.
Income tax expense comprises of current and deferred tax. Income tax expense is recognised in the consolidated profit and loss account
or statement of comprehensive income to which it relates. Income tax expense is recognised based on management’s estimate of the
weighted average effective annual income tax rate expected for the full financial year.
The income of the Bank and the SBP Banking Services Corporation are exempt from tax under applicable laws. However, in case of the
Institute, the Institute is eligible for hundred percent (100%) tax credit on taxes payable by the Institute under clause (d) of sub-section 2
of section 100C of the Income Tax Ordinance, 2001, introduced under the Finance Act, 2015.The income of PSPC is subject to tax at
applicable rates.
Consolidated Financial Statements of SBP and its Subsidiaries
97

8.1
9. FOREIGN CURRENCY ACCOUNTS AND INVESTMENTS
These essentially represent foreign currency reserves held by the Group, the details of which are as follows:
Note 2017 2016
At fair value through profit or loss - held-for-trading
- Investments 9.1 379,452,397 269,942,861
- Unrealised gain / (loss) on derivative financial instruments - net 9.2 2,688,587 (3,904,829)
Held to maturity investment 9.3 337,120,388 238,549,410
Loans and receivables
- Deposit accounts 90,760,872 26,378,414
- Current accounts 20,926,003 6,689,560
- Securities purchased under agreement to resell 9.4 178,482,457 569,237,084
- Money market placements 9.5 773,108,484 870,191,870
1,782,539,188 1,977,084,370
The above foreign currency accounts and investments are held as follows:
Issue Department 23.1 1,495,115,694 1,237,112,270
Banking Department 287,423,494 739,972,100
1,782,539,188 1,977,084,370
9.1
9.2
9.3
9.4
9.5
10. EARMARKED FOREIGN CURRENCY BALANCES
These represent foreign currency cash balances held by the Group to meet foreign currency commitments of the Group.
11. SPECIAL DRAWING RIGHTS OF THE INTERNATIONAL MONETARY FUND
Note 2017 2016
SDRs are held as follows:
- By the Issue Department 23.1 51,051,350 51,179,450
- By the Banking Department 12,605,969 16,476,786
63,657,319 67,656,236
----------------(Rupees in '000)---------------
This represents unrealised gain / (loss) on foreign currency swaps, futures and forward contracts (including transactions executed by the
Fund Managers on behalf of the Bank) entered into with various counterparties.
Special Drawing Rights (SDRs) are the foreign reserve assets which are allocated by the International Monetary Fund (IMF) to its
member countries in proportion to their quota in the IMF. In addition, the member countries can purchase the SDRs from the IMF and
other member countries in order to settle their obligations. The figures given below represent the rupee value of the SDRs held by the
Group as at June 30, 2017. Interest is credited by the IMF on the SDR holding of the Group at weekly interest rates on daily products of
SDRs held during each quarter.
State Bank of Pakistan Annual Report FY17
--------------- (Rupees in '000) --------------
This represents investment in sovereign bonds of foreign countries carrying yield ranging from 0.82 % to 4.11 % per annum and having
maturities from July 06, 2017 to September 24, 2018 (2016: 0.19% to 3.45% per annum and having maturities from July 07, 2016 to
May 05, 2017).
These represent money market placements carrying interest in USD ranging from 0.85% to 1.52% per annum (2016: 0.40% to 0.85%
per annum) and GBP ranging from 0.10 % to 0.20% per annum (2016: 0.33% per annum) and having maturities from July 03, 2017 to
September 22, 2017 (2016: from July 04, 2016 to September 30, 2016).
This represents investments made (by the bank) in foreign sukuks, investments made in international markets and balances maintained
(on behalf of the Bank) through reputable Fund Managers. The activities of the Fund Managers are being monitored through a
custodian. Furthermore, the foreign sukuks purchased by the bank are also held with the custodian. The market value of the investments
and carrying amount of deposit accounts as on June 30, 2017 cumulatively amounts to USD 4,103.57 million (2016: USD 3,331.83
million).
These represent lending under repurchase agreements and carry mark-up in USD ranging from 0.02 % to 1.16 % per annum (2016:
0.40% to 0.48% per annum) and GBP at 0.33% per annum (2016: 0.26% per annum) and these are due to mature on July 03, 2017
(2016: July 01, 2016).
As mentioned in note 5.2, the Group is responsible for issuing coins of various denominations on behalf of the Government. This
balance represents the face value of coins held by the Group at the year end (also refer note 23.1).
98

2017 2016
12. RESERVE TRANCHE WITH THE INTERNATIONAL
MONETARY FUND UNDER QUOTA ARRANGEMENTS
Quota allocated by the International Monetary Fund 296,398,560 297,633,877
Liability under quota arrangements (296,381,178) (297,616,422)
17,382 17,455
13. SECURITIES PURCHASED UNDER AGREEMENT TO RESELL
14. INVESTMENTS - LOCAL Note 2017 2016
Loans and receivables
Government securities
- Market Related Treasury Bills (MRTBs) 2,518,817,198 2,047,573,403
- Federal Government scrips 2,740,000 2,740,000
14.1 2,521,557,198 2,050,313,403
Others
- Term Deposit Receipt 14.2 6,207,070 -
2,527,764,268 2,050,313,403
Held to maturity
Government securities
- Pakistan Investment Bonds 105,118 -
- Market Treasury Bills 14.1 659,000 643,839
764,118 643,839
Investments in banks and other financial institutions
- Preference shares - unlisted 14.3 54,160,348 -
54,924,466 643,839
Fair value through profit and loss
- Mutual Funds 1,582,086 -
Available - for - sale investments
- Mutual Funds 27,164 -
Investments in banks and other financial institutions
Ordinary shares
- Listed 94,406,896 92,487,082
- Unlisted 16,319,632 4,712,706
14.4 110,726,528 97,199,788
Term Finance Certificates 84,722 84,722
Certificates of Deposits 33,705 33,705
110,872,119 97,318,215
Provision against diminution in value of investments 14.5 (856,863) (856,863)
110,015,256 96,461,352
2,694,286,076 2,147,418,594
The above investments are held as follows:
Issue Department - MRTBs 23.1 2,344,098,193 1,973,105,293
Banking Department / subsidiaries 350,187,883 174,313,301
2,694,286,076 2,147,418,594
----------------(Rupees in '000)---------------
--------------- (Rupees in '000) --------------
This represents collateralised lendings made to various financial institutions under repurchase arrangement carrying mark-up at rates
ranging from 5.77% to 6.25% per annum (2016: 5.77% to 6.25% per annum) and are due to mature from July 4, 2017 to July 7, 2017
(2016: July 4, 2016 to July 11, 2016). The fair value of securities collateralised as on June 30, 2017 amounts to Rs. 1,534,782 million
(2016: Rs. 1,535,800 million). The collaterals held by the Group consist of Pakistan Investment Bonds and Market Treasury Bills.
Consolidated Financial Statements of SBP and its Subsidiaries
99
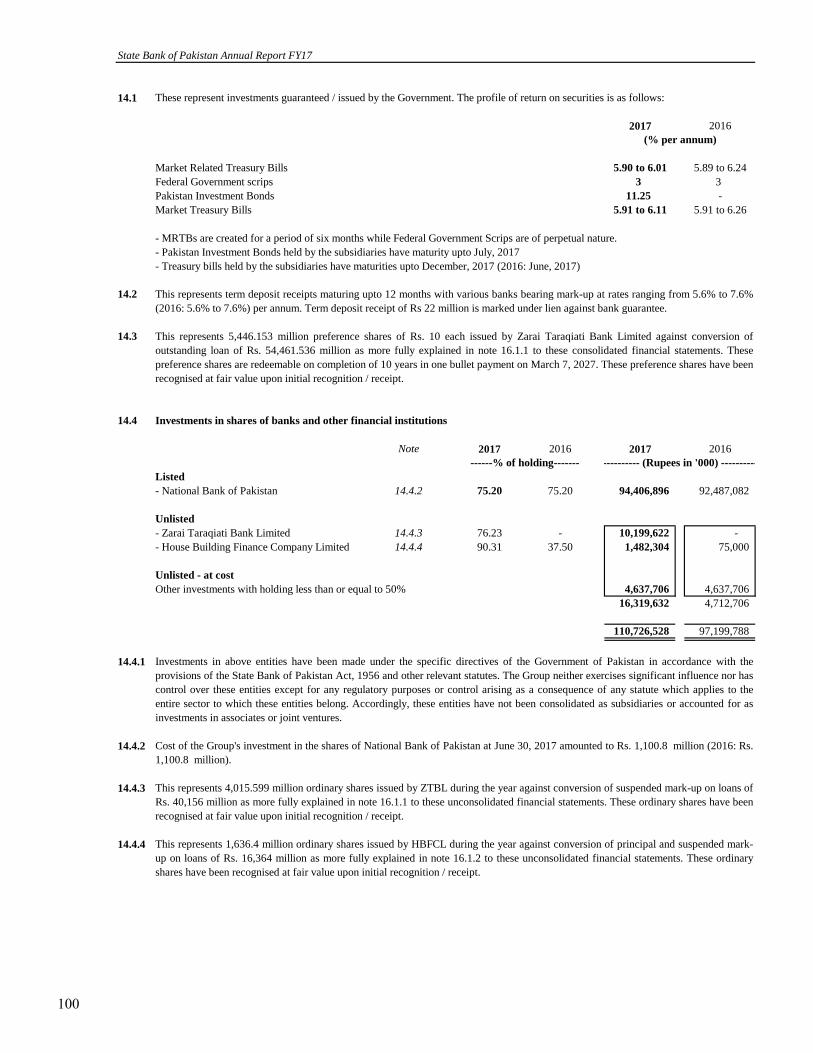
14.1 These represent investments guaranteed / issued by the Government. The profile of return on securities is as follows:
2017 2016
Market Related Treasury Bills 5.90 to 6.01 5.89 to 6.24
Federal Government scrips 3 3
Pakistan Investment Bonds 11.25 -
Market Treasury Bills 5.91 to 6.11 5.91 to 6.26
- MRTBs are created for a period of six months while Federal Government Scrips are of perpetual nature.
- Pakistan Investment Bonds held by the subsidiaries have maturity upto July, 2017
- Treasury bills held by the subsidiaries have maturities upto December, 2017 (2016: June, 2017)
14.2
14.3
14.4 Investments in shares of banks and other financial institutions
Note 2017 2016 2017 2016
Listed
- National Bank of Pakistan 14.4.2 75.20 75.20 94,406,896 92,487,082
Unlisted
- Zarai Taraqiati Bank Limited 14.4.3 76.23 - 10,199,622 -
- House Building Finance Company Limited 14.4.4 90.31 37.50 1,482,304 75,000
Unlisted - at cost
Other investments with holding less than or equal to 50% 4,637,706 4,637,706
16,319,632 4,712,706
110,726,528 97,199,788
14.4.1
14.4.2
14.4.3
14.4.4
------------- (Rupees in '000) -------------
Investments in above entities have been made under the specific directives of the Government of Pakistan in accordance with the
provisions of the State Bank of Pakistan Act, 1956 and other relevant statutes. The Group neither exercises significant influence nor has
control over these entities except for any regulatory purposes or control arising as a consequence of any statute which applies to the
entire sector to which these entities belong. Accordingly, these entities have not been consolidated as subsidiaries or accounted for as
investments in associates or joint ventures.
Cost of the Group's investment in the shares of National Bank of Pakistan at June 30, 2017 amounted to Rs. 1,100.8 million (2016: Rs.
1,100.8 million).
------% of holding-------
This represents 4,015.599 million ordinary shares issued by ZTBL during the year against conversion of suspended mark-up on loans of
Rs. 40,156 million as more fully explained in note 16.1.1 to these unconsolidated financial statements. These ordinary shares have been
recognised at fair value upon initial recognition / receipt.
This represents 1,636.4 million ordinary shares issued by HBFCL during the year against conversion of principal and suspended mark-
up on loans of Rs. 16,364 million as more fully explained in note 16.1.2 to these unconsolidated financial statements. These ordinary
shares have been recognised at fair value upon initial recognition / receipt.
State Bank of Pakistan Annual Report FY17
This represents term deposit receipts maturing upto 12 months with various banks bearing mark-up at rates ranging from 5.6% to 7.6%
(2016: 5.6% to 7.6%) per annum. Term deposit receipt of Rs 22 million is marked under lien against bank guarantee.
This represents 5,446.153 million preference shares of Rs. 10 each issued by Zarai Taraqiati Bank Limited against conversion of
outstanding loan of Rs. 54,461.536 million as more fully explained in note 16.1.1 to these consolidated financial statements. These
preference shares are redeemable on completion of 10 years in one bullet payment on March 7, 2027. These preference shares have been
recognised at fair value upon initial recognition / receipt.
(% per annum)
100

Note 2017 2016
14.5 Provision against diminution in value of investments - local - net
Opening balance 856,863 856,863
Reversal during the year - -
Closing balance 856,863 856,863
14.6
91,386,276 83,994,988
1,918,895 7,391,288
Share in loss of associates relating to "Available for sale investment" (2,290)
93,302,881 91,386,276
15. INVESTMENTS IN ASSOCIATES Percentage
holding
Investments in associates are accounted for using equity method of accounting: %
Security Papers Limited 40.03 1,624,763
SICPA Inks Pakistan (Private) Limited 47 509,827
2,134,590
15.1 Summarised financial statements of the associates are as follows:
Security
Papers
Limited
SICPA Inks
Pakistan
(Private)
Limited
(audited) (unaudited)
June 30, March 31,
2017 2017
Total Assets of the Company 5,679,207 1,982,402
Total Liabilities of the Company 1,078,750 510,972
Year ended
June 30,
Year ended
March 31,
2017 2017
Total Revenue of the Company 2,842,085 2,519,454
Profit after tax of the Company 937,653 554,503
Total Other comprehensive (loss) / income of the Company (142,265) 1,509
15.2
Note 2017 2016
16. LOANS, ADVANCES AND BILLS OF EXCHANGE
Government owned / controlled financial institutions 16.1 47,796,089 102,794,207
Private sector financial institutions 16.2 297,555,950 232,449,996
345,352,039 335,244,203
Employees 16.3 19,489,724 20,675,412
364,841,763 355,919,615
Provision against doubtful balances 16.4 (2,137,973) (5,348,435)
362,703,790 350,571,180
--------------------------------------------------------------------------------------------------------------------------------------------------------------------------------------------------------------------------------------------------------------------------------------------------------------------------------------------------------------------------------------------------------------------------------------------------------------------------------------------------------------------Rupees '000--------------------------------------------------------------------------------------------------------------------------------------------------------------------------------------------------------------------------------------------------------------------------------------------------------------------------------------------------------------------------------------------------------------------------------------------------------------------------------------------------------------------
--------------------------------------------------------------------------------------------------------------------------------------------------------------------------------------------------------------------------------------------------------------------------------------------------------------------------------------------------------------------------------------------------------------------------------------------------------------------------------------------------------------------Rupees '000--------------------------------------------------------------------------------------------------------------------------------------------------------------------------------------------------------------------------------------------------------------------------------------------------------------------------------------------------------------------------------------------------------------------------------------------------------------------------------------------------------------------
Consolidated Financial Statements of SBP and its Subsidiaries
------------- (Rupees in '000) -------------
------------- (Rupees in '000) -------------
Closing balance
Unrealised appreciation on remeasurement of investments - local
Opening balance
Appreciation for the year
2017
--------------- (Rupees in '000) --------------
The market value of SPL as at June 30, 2017 is Rs 105.59 per share i.e. an aggregate amount of Rs 2,504.779 million. The breakup
value based on net assets of SICPA as per latest unaudited financial statements as on March 31, 2017 is Rs 258.146 per share i.e. an
aggregate amount of Rs 691.573 million.
101

16.1 Loans and advances to Government owned / controlled financial institutions
2017 2016 2017 2016 2017 2016
Agricultural sector (16.1.1) 439,900 50,767,526 - - 439,900 50,767,526
Industrial sector (16.1.1 &16.1.2) 8,063,316 4,821,191 - - 8,063,316 4,821,191
Export sector (16.2.1 ) 25,554,323 19,020,317 3,567 3,567 25,557,890 19,023,884
Housing sector (16.2.2) - - - 11,242,300 - 11,242,300
Others (16.2.1, 16.2.3 &16.2.4) 13,734,983 16,939,306 - - 13,734,983 16,939,306
47,792,522 91,548,340 3,567 11,245,867 47,796,089 102,794,207
16.1.1
a)
b)
c) The principal of the preference shares and return thereon shall be guaranteed by the Federal Government.
d)
16.1.2
Scheduled banks Other financial institutions
As at June 30, 2016 the exposure to the agricultural and industrial sectors included Rs. 50,174.09 million and Rs. 1,083.12 million
respectively, representing the cumulative Government guaranteed financing of Rs. 51,257.21 million to Zarai Taraqiati Bank Limited
(ZTBL) in addition to the unsecured subordinated loan to ZTBL amounting to Rs. 3,204 million classified in other loans and advances.
The entire exposure had been overdue since 2002.
Total
------------------------------------------- (Rupees in '000) -------------------------------------------
A tripartite meeting was held on July 11, 2014 between Ministry of Finance (MoF), ZTBL and the Bank ( the parties ) wherein it was
decided that the total outstanding amount of Rs. 89,490 million, including suspended mark-up of Rs. 35,029 million will be converted to
an equity investment of the Bank in ZTBL. The conversion plan was re-negotiated between all the parties in a tripartite meeting held on
November 16, 2015. The MoF approved the re-negotiated conversion plan on April 4, 2016 as detailed below:
The re-negotiated conversion plan was subject to completion of all legal and statutory formalities and the fair value exercise of the entity.
During the current year, 5,446.15 million redeemable preference shares equivalent to Rs. 54,461 million carrying profit of 7.5 percent
per annum payable half yearly were issued. These preference shares are redeemable in 10 years in one bullet payment on March 7, 2027.
As a result of conversion of outstanding loan amount into preference shares, the provision amounting to Rs. 3,204 million held against
unsecured sub-ordinated loan to ZTBL has been reversed and the entire principal exposure against ZTBL amounting to Rs. 54,461
million (representing loan amount) has been derecognised. The preference shares received have been recognised at their fair value as
disclosed in note 14.3 to these consolidated financial statements. In addition, ZTBL has also issued 4,015.6 million ordinary shares
having face value of Rs. 10 each in lieu of mark-up which has been suspended by the Bank in prior years aggregating to Rs. 40,156
million. These shares have been recognised at their fair value (using expected dividend discount method) aggregating to Rs. 10,200
million as disclosed in note 14.4 and the related gain arising due to reversal of suspended mark-up is reflected in note 41.1 to these
consolidated financial statements.
This represented loan receivable from House Building Finance Company Limited (HBFCL) against seven credit lines on profit and loss
sharing basis amounting to Rs. 11,242 million. All of these credit lines were overdue since 2006. These credit lines were secured by
guarantee from the Federal Government.
During the current year, the Ministry of Finance (MoF) vide its letter no. F.No.1(3) IF-II/2016-1122 dated January 09, 2017 approved
the conversion of credit lines of Rs. 11,242 million along with the outstanding suspended mark-up of Rs. 5,122 million (net of Rs 1,378
million in respect of share of loss payable under profit and loss sharing arrangement) into ordinary shares of the HBFCL effective from
December 31, 2016. As a result of conversion of outstanding loan amount into ordinary shares the entire exposure (representing
principal amount) amounting to Rs. 11,242 million has been derecognised. The ordinary shares received have been recognised at their
fair value as disclosed in note 14.4 to these consolidated financial statements. Further, the share of loss amounting to Rs 1,378 million
payable in respect of profit and loss sharing arrangements by the Group to HBFCL has been written back. The net loss amounting to Rs.
8,457 arising on this arrangement is reflected in note 41.1 to these consolidated financial statements.
State Bank of Pakistan Annual Report FY17
The Bank’s principal debt amount of Rs. 54,461 million outstanding against ZTBL as on December 31, 2015 will be converted
into redeemable preference shares carrying a profit of 7.5% per annum, redeemable in 10 years in one bullet payment on
December 31, 2025.
The mark-up on preference shares shall be payable half yearly on June 30th and December 31st each year and shall be the
contractual obligation of ZTBL.
Mark-up on the existing debt shall be accrued upto December 31, 2015 as per existing arrangements leading to increase in accrued
mark-up amount from Rs. 35,029 million as on June 30, 2014 to Rs. 40,156 million as on December 31, 2015. The accrued mark-
up of Rs. 40,156 million as on December 31, 2015 will be converted into ordinary shares of ZTBL.
102

16.1.3
16.1.4
16.2 Loans and advances to private sector financial institutions
2017 2016 2017 2016 2017 2016
Agricultural sector 744,204 947,390 420,901 151,398 1,165,105 1,098,788
Industrial sector 72,186,912 38,550,364 8,892,963 4,923,344 81,079,875 43,473,708
Export sector (16.2.1) 212,825,188 185,597,057 - - 212,825,188 185,597,057
Others (16.2.2) 2,485,782 2,280,443 - - 2,485,782 2,280,443
288,242,086 227,375,254 9,313,864 5,074,742 297,555,950 232,449,996
16.2.1
16.2.2
16.3 The interest / mark-up rate profile of the interest / mark-up bearing loans and advances is as follows:
2017 2016
Government owned / controlled and private sector financial institutions 0 to 9.75 0 to 9.75
Employees loans (where applicable) 0 to 10 0 to 10
2017 2016
16.4 Provision against doubtful assets
Opening balance 5,348,435 5,349,191
Charge for the year 127
Reversal during the year on:
- issuance of preference shares of Zarai Taraqiati Bank Limited (3,204,323) -
- cash recovery (6,266) (756)
Closing balance 2,137,973 5,348,435
-----------------(Rupees in '000)----------------
Scheduled banks Other financial institutions Total
-----------------------------------------------------------------------------(Rupees in '000) -------------------------------------------------------------------------
This includes exposure to the Industrial Development Bank Limited (IDBL) under Locally Manufactured Machinery (LMM) credit line
amounting to Rs. 1,054 million (2016: Rs. 1,054 million). Furthermore, loans and advances also include loans amounting to Rs. 13,000
million and Rs. 340.78 million (2016: Rs. 13,000 million and Rs. 340.78 million) to IDBL which are secured by the Government
guarantee and other Government securities respectively. The Federal Government vide its vesting order dated November 13, 2012 had
transferred and vested all assets and liabilities of IDBP into the IDBL with effect from November 13, 2012. The Cabinet Committee on
Privatisation, in its meeting held on May 07, 2016 approved the inclusion of IDBL in the 'Privatisation Program For Early
Implementation'.
These balances include Rs. 417.7 million (2016: Rs. 423 million) which are recoverable from various financial institutions operating in
Bangladesh (former East Pakistan). The realisability of these balances is subject to final settlement between the Governments of Pakistan
and Bangladesh (former East Pakistan).
Export sector loans of scheduled banks are fully secured against demand promissory notes.
In the year 2015, the Bank in continuation of a scheme of amalgamation of two commercial banks duly sanctioned by the Federal
Government under Section 47 of the Banking Companies Ordinance 1962 and under Section 17 of the State Bank of Pakistan Act 1956,
extended a 10-year financing facility of Rs.5,000 million with a bullet payment of markup and principal at maturity to an Islamic
Commercial Bank (ICB) which is secured against Government of Pakistan Ijara Sukuk. The 10-year facility was provided on the basis
of Mudaraba to be remunerated at profit sharing ratio declared by the ICB on its remunerative current accounts on monthly basis (the last
declared rate in this respect is 0.01% per annum). In accordance with the requirements of accounting framework of the Bank the 10-year
financing facility had been recognized at fair value on initial recognition. The amortized cost as of June 30, 2017 is Rs. 2,465 million
(2016: Rs. 2,255 million). The principal amount (Rs. 5,000 million) of the facility along with the profit will be recovered at its respective
maturity.
Consolidated Financial Statements of SBP and its Subsidiaries
(% per annum)
103

Note 2017 2016
17. ASSETS HELD WITH THE RESERVE BANK OF INDIA
Gold reserves
- Opening balance 4,650,103 4,002,690
- (Diminution) / appreciation for the year due to revaluation 30.3.1.1 (275,565) 647,413
4,374,538 4,650,103
Sterling securities 450,221 467,390
Government of India securities 231,832 222,024
Rupee coins 4,769 4,576
17.1 5,061,360 5,344,093
Indian notes representing assets receivable from the Reserve Bank of India 17.2 697,554 668,044
23.1 5,758,914 6,012,137
17.1
17.2
Note 2017 2016
18. BALANCES DUE FROM THE GOVERNMENTS OF INDIA
AND BANGLADESH (FORMER EAST PAKISTAN)
India
Advance against printing of notes 39,616 39,616
Receivable from the Reserve Bank of India 837 837
40,453 40,453
Bangladesh (former East Pakistan)
Inter office balances 819,924 819,924
Loans, advances and commercial papers 18.1 9,056,879 8,354,504
9,876,803 9,174,428
18.2 9,917,256 9,214,881
18.1
18.2
Note 2017 2016
19. PROPERTY, PLANT AND EQUIPMENT
Operating fixed assets 19.1 110,679,814 59,608,532
Capital work-in-progress 19.5 463,089 466,273
111,142,903 60,074,805
State Bank of Pakistan Annual Report FY17
-----------------(Rupees in '000)----------------
-----------------(Rupees in '000)----------------
-----------------(Rupees in '000)----------------
These assets were allocated to the Government of Pakistan as its share of the assets of the Reserve Bank of India under the provisions
of Pakistan (Monetary System and Reserve Bank) Order, 1947. The transfer of these assets to the Group is subject to final settlement
between the Governments of Pakistan and India (also refer note 30.3.1).
These represent Pak Rupee equivalent of Indian rupee notes which were in circulation in Pakistan until retirement from circulation
under the Pakistan (Monetary System and Reserve Bank) Order, 1947. Realisability of these assets is subject to final settlement
between the Governments of Pakistan and India (also refer note 30.3.1).
These represent interest bearing loans and advances (including commercial papers) provided to the Government of Bangladesh (former
East Pakistan).
The realisability of the above balances is subject to final settlement between the Government of Pakistan and Government of
Bangladesh (former East Pakistan) and India (also refer notes 30.1 and 30.3.1).
104

19.1 Operating fixed assets
Freehold land * 13,041,840 51,072,000 53,000 64,166,840 - - - - 64,166,840 -
Leasehold land * 38,491,706 - 563 38,492,269 - - 1,226,621 1,226,621 37,265,648 30-99 years
Buildings on 2,301,474 735,132 63,068 2,944,098 - 2,686 149,526 148,985 2,795,113 20 years
freehold land * (155,576) ** (3,227) **
Buildings on 4,509,573 - 146,469 4,303,486 - - 292,527 287,594 4,015,892 20 years
leasehold land * (352,556) ** (4,933) **
Plant and Machinery - 6,678,201 30,155 7,817,504 - 6,362,813 65,327 6,930,358 887,146 10%-20%
1,110,647 ** 502,846 **
(1,499) (628)
Furniture and 268,758 44,044 16,376 298,252 203,182 34,618 13,865 220,950 77,302 10%-20%
fixtures (30,926) (30,715)
Office equipment 1,979,570 193,651 583,288 2,120,930 1,629,247 157,668 146,590 1,406,365 714,565 10%-33%
(602,515) ** (494,686) **
(33,064) (32,454)
EDP equipment 2,381,280 - 172,848 2,438,079 1,912,107 - 256,440 2,054,636 383,443 33.33%
(116,049) (113,911)
Motor vehicles 676,031 59,872 129,563 784,290 297,164 44,486 122,047 410,425 373,865 20%
(81,176) (53,272)
63,650,232 58,782,900 1,195,330 123,365,748 4,041,700 6,602,271 2,272,943 12,685,934 110,679,814
(262,714) (230,980)
Freehold land * 3,791,658 - 9,250,182 13,041,840 - - - - 13,041,840 -
Leasehold land * 16,811,005 72,751 21,607,950 38,491,706 2,197,006 428,963 (2,625,969) - 38,491,706 30-99 years
Buildings on 1,138,375 158,764 1,004,335 2,301,474 849,525 223,312 (1,072,837) - 2,301,474 20 years
freehold land *
Buildings on 2,307,509 195,010 2,007,054 4,509,573 1,547,259 395,417 (1,942,676) - 4,509,573 20 years
leasehold land *
Furniture and 253,350 16,677 - 268,758 189,244 14,819 - 203,182 65,576 10%
fixtures (1,269) (881)
Office equipment 1,755,707 235,424 - 1,979,570 1,504,187 132,273 - 1,629,247 350,323
(11,561) (7,213) 20%
EDP equipment 1,945,437 462,876 - 2,381,280 1,746,053 191,062 - 1,912,107 469,173
(27,033) (25,008)
33.33%
Motor vehicles 588,139 129,905 - 676,031 212,888 112,340 - 297,164 378,867
(42,013) (28,064)
28,591,180 1,271,407 33,869,521 63,650,232 8,246,162 1,498,186 (5,641,482) 4,041,700 59,608,532 20%
(81,876) (61,166)
* These represent revalued assets.
** Adjustments represents reclassifications within different categories of assets.
***
Consolidated Financial Statements of SBP and its Subsidiaries
2017
--------------------------------------------------------------- (Rupees in '000) ---------------------------------------------------------------
This includes investment property having nil book value. The fair value of the investment property was assessed to be Rs 32.315 million as at March 31, 2017 as a result of
revaluation exercise carried out by an independent valuer
Useful life /
Rate of
depreciation
Cost /
revalued
amount at
July 1, 2015
Additions /
(deletions) /
adjustments
** during the
year
Accumulated
depreciation at
July 1, 2015
Depreciation
for the year/
(deletions)
Accumulated
depreciation at
June 30, 2016
Net book
value at June
30, 2016
Cost /
revalued
amount at
June 30, 2016
Revaluation
during the
year
Reversal due
to revaluation
2016
--------------------------------------------------------------- (Rupees in '000) ---------------------------------------------------------------
Cost /
revalued
amount at
July 1, 2016
Additions /
(deletions)
during the
year
Cost /
revalued
amount at
June 30, 2017
Accumulated
depreciation
at July 1, 2016
Depreciation
for the year/
(deletions)
Accumulated
depreciation
at June 30,
2017
Net book
value at June
30, 2017
Useful life /
Rate of
depreciation
Accumulated
depreciation
transferred
from PSPC
Asset
transferred
from PSPC
105

19.2
19.3
2017 2016
Freehold land 92,858 39,858
Leasehold land 157,415 159,077
Buildings on freehold land 327,372 485,202
Buildings on leasehold land 710,875 1,052,028
1,288,520 1,736,165
19.4
2017
(Rupees in '000)
Freehold land 3,241
Building on leasehold land 107,928
111,169
2017 2016
19.5 Capital work-in-progress
Buildings on freehold land 63,536 43,634
Buildings on leasehold land 229,031 311,309
Furniture and fixtures 50,637 -
Office equipment 23,068 44,467
EDP equipment 92,329 66,863
Plant and Machinery 4,488 -
463,089 466,273
20. INTANGIBLE ASSETS
Software 20.1 4,732 3,833
Capital work-in-progress 102,822 21,153
107,554 24,986
20.1 Intangible assets
Software 2017 613,585 20,533 4,027 638,145 609,752 20,430 3,231 633,413 4,732 20 - 33.33
Software 2016 610,844 - 2,741 613,585 606,641 - 3,111 609,752 3,833 33.33
Accumulated
amortisation
transferred
from PSPC
Amortisation
for the year
Accumulated
amortisation
at June 30
Net book value at
June 30
State Bank of Pakistan Annual Report FY17
Annual rate of
amortisation %
During the year, the management has reassessed the classification of fixed assets and reclassified certain fixed assets as “plant and
machinery” from buildings on freehold / leasehold land and office equipment. Further, the management has also revised the depreciation
on those assets ranging from 5 to 20 percent per annum to 10 percent per annum with effect from July 1, 2016. The revision has been
made after taking into account the expected pattern of recovery of economic benefits associated with the use of those assets. The
revision has been accounted for as change in accounting estimate as defined in IAS-8 'Accounting Policies, Changes in Accounting
Estimates and Errors'. Had this change in estimate not been made, the depreciation for the year would have decreased by Rs. 4.6 million
with a corresponding increase in profit for the year.
Land and buildings of the Group are carried at revalued amount. The latest revaluation of assets of SBP was carried out on June 30,
2016 by M/S M.J.Surveyors (Pvt.) Ltd which resulted in a surplus of Rs. 33,870 million. The revaluation was carried out based on the
market value assessment being the fair value of the land and buildings. The carrring value of these assets as at June 30, 2017 amount to
Rs. 56,440 million. Had there been no revaluation, the carrying value of the revalued assets would have been as follows:
---------(Rupees in '000)--------
Land and buildings of PSPC have been recorded based on their revalued amount as appearing in the financial statements of the PSPC as
at June 30, 2017. These assets were ravalued on April 1, 2017 by M/s Iqbal A. Nanjee & Co. (Private) Limited based on the market
value assessment being the fair value of the land and buildings. Their carring value as at June 30, 2017 was Rs. 51,804 million. Had
there been no revaluation of these assets, their carrying value would have been as follows:
---------(Rupees in '000)--------
---------------------------------------------------------------(Rupees in '000) ---------------------------------------------------------------
Cost at
July 1
Asset
transferred
from PSPC
Additions
during the
year
Cost at
June 30
Accumulate
d
amortisation
at July 1
106

21. DEFERRED TAXATION June 30, 2017
Rupees '000
Deductible temporary differences
Property, plant and equipment 468
Stores and spares 8,176
Stock-in-trade 15,321
Loans and advances 1,667
Other receivables 8,846
Liabilities under finance lease 5,053
Deferred liabilities - pension payable 626,542
666,073
Taxable temporary differences
Long term investment in associates (262,849)
Short term investments (22,782)
Surplus on revaluation of property, plant and equipment (187,168)
(472,799)
Deferred taxation asset 193,274
Note 2017 2016
22. OTHER ASSETS
Commission receivable and others 22.1 4,999,406 2,136,336
Unrealised gain on derivative financial instruments - net 505,076 1,442,497
Medical, stationery consumables and stamps on hand 166,013 139,829
Other advances, deposits and prepayments 664,338 629,500
Stores and spares - net 248,608 -
Stock-in-trade - net 2,073,947 -
8,657,388 4,348,162
22.1
Note 2017 2016
23. BANK NOTES IN CIRCULATION
Total bank notes issued 23.1 4,167,247,213 3,555,067,671
Bank notes held by the Banking Department (111,406) (145,614)
Bank notes in circulation 4,167,135,807 3,554,922,057
23.1
Note 2017 2016
Gold reserves held by the Bank 7 270,361,202 287,170,323
Local currency - coins 8 861,860 488,198
Foreign currency accounts and investments 9 1,495,115,694 1,237,112,270
Special Drawing Rights of the International Monetary Fund 11 51,051,350 51,179,450
Investments - local 14 2,344,098,193 1,973,105,293
Assets held with the Reserve Bank of India 17 5,758,914 6,012,137
4,167,247,213 3,555,067,671
24. CURRENT ACCOUNTS OF GOVERNMENTS
24.1 Current accounts of Governments - payable balances
Federal Government 24.3 76,078,530 313,688,605
Provincial Governments
- Punjab 24.4 38,899,196 96,833,336
- Sindh 24.5 20,398,680 89,107,726
- Khyber Pakhtunkhwa 24.6 31,526,641 77,207,052
- Baluchistan 24.7 2,459,725 19,091,164
Gilgit - Baltistan Administration Authority 24.8 9,239,193 10,729,895
102,523,435 292,969,173
178,601,965 606,657,778
---------------(Rupees in '000)--------------
---------------(Rupees in '000)--------------
The liability for bank notes issued of the Issue Department is recorded at its face value in the consolidated balance sheet. In accordance
with section 26 (1) of SBP Act 1956, this liability is supported by the following assets of the Issue Department.
This includes Rs 11.684 million to be collected and paid (net) on behalf of National Security Printing Corporation (NSPC) on no-charge
basis in accordance with the common facilities agreement dated May 19, 2017.
---------------(Rupees in '000)--------------
Consolidated Financial Statements of SBP and its Subsidiaries
107

Note 2017 2016
24.2 Current accounts of Governments - receivable balances
Government of Azad Jammu and Kashmir 24.9 7,279,247 955,474
7,279,247 955,474
24.3 Federal Government
Non-food account 40,062 973,642
Zakat fund accounts 80,317,636 7,884,671
Railways accounts (29,518,688) (13,313,227)
Other accounts 25,239,520 318,143,519
76,078,530 313,688,605
24.4 Provincial Government - Punjab
Non-food account 24,344,157 82,846,743
Zakat fund account 753,583 401,259
Other accounts 13,801,456 13,585,334
38,899,196 96,833,336
24.5 Provincial Government - Sindh
Non-food account 18,180,177 84,389,116
Zakat fund account 1,694,383 1,526,526
Other accounts 524,120 3,192,084
20,398,680 89,107,726
24.6 Provincial Government - Khyber Pakhtunkhwa
Non-food account 29,771,904 67,829,675
Zakat fund account 1,281,569 1,186,629
Other accounts 473,168 8,190,748
31,526,641 77,207,052
24.7 Provincial Government - Baluchistan
Non-food account 1,183,617 16,553,943
Zakat fund account 999,379 833,822
Other accounts 276,729 1,703,399
2,459,725 19,091,164
24.8 Gilgit - Baltistan Administration Authority 9,239,193 10,729,895
24.9 Government of Azad Jammu and Kashmir (7,279,247) (955,474)
Classified as receivable balance 24.10 7,279,247 955,474
- -
24.10 These balances carry mark-up at rates ranging from 5.89% to 6.01% per annum (2016: 6.18% to 6.88% per annum).
25 PAYABLE TO ISLAMIC BANKING INSTITUTIONS AGAINST BAI MUAJJAL TRANSACTIONS
26. PAYABLE UNDER BILATERAL CURRENCY SWAP AGREEMENT
26.1 Payable under bilateral currency swap agreement with the People's Bank of China (PBoC)
This represents amount payable to various Islamic Banking Institutions against purchases of Government of Pakistan (GoP) Ijara
Sukuks by the Bank on Bai Muajjal basis (deferred payment basis) having profit rates ranging from 5.32% to 5.97% per annum (2016:
4.75% to 5.74% per annum) and maturities on December 31, 2017 and June 21, 2018 (2016: February 10, 2017 and March 15, 2017).
---------------(Rupees in '000)--------------
A bilateral currency swap agreement was entered between the Bank and the PBoC on December 23, 2011 in order to promote bilateral
trade, finance direct investment, provide short term liquidity support and for any other purpose mutually agreed between the two central
banks. The original agreement was for tenure of 3 years with overall limit of CNY 10,000 million and equivalent PKR, which was
renewed on December 23, 2014 for a further period of three years. The Bank has purchased CNY 5,000 million, CNY 1,500 million
and CNY 3,500 million against PKR during the year with maturity bucket of three months and six months (2016: CNY 5,000 million,
CNY 1,500 million and CNY 3,500 million with maturity buckets of six months, three months and two months respectively). These
purchases have been fully utilized as on June 30, 2017 and the same amounts are outstanding as on June 30, 2017. Interest is charged
on outstanding balance at agreed rates. As at June 30, 2017, the Bank's commitment under this agreement is Rs. 154,595 million (2016:
Rs. 165,000 million).
State Bank of Pakistan Annual Report FY17
108
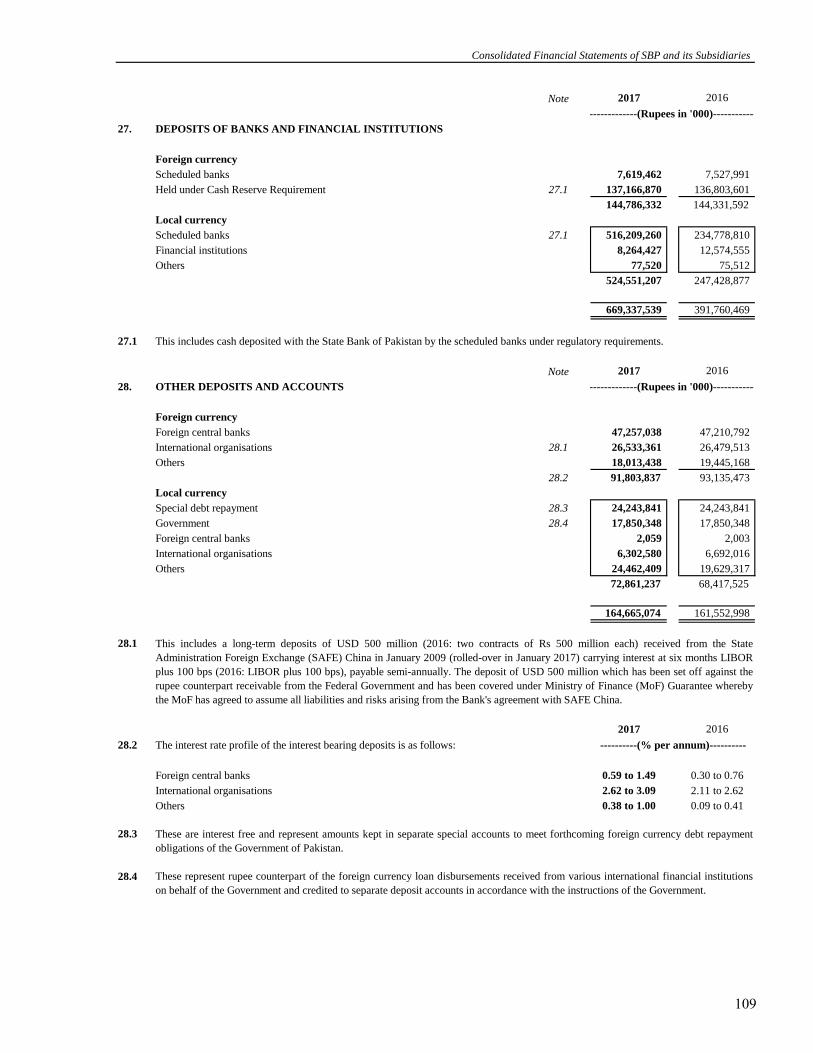
Note 2017 2016
27. DEPOSITS OF BANKS AND FINANCIAL INSTITUTIONS
Foreign currency
Scheduled banks 7,619,462 7,527,991
Held under Cash Reserve Requirement 27.1 137,166,870 136,803,601
144,786,332 144,331,592
Local currency
Scheduled banks 27.1 516,209,260 234,778,810
Financial institutions 8,264,427 12,574,555
Others 77,520 75,512
524,551,207 247,428,877
669,337,539 391,760,469
27.1 This includes cash deposited with the State Bank of Pakistan by the scheduled banks under regulatory requirements.
Note 2017 2016
28. OTHER DEPOSITS AND ACCOUNTS
Foreign currency
Foreign central banks 47,257,038 47,210,792
International organisations 28.1 26,533,361 26,479,513
Others 18,013,438 19,445,168
28.2 91,803,837 93,135,473
Local currency
Special debt repayment 28.3 24,243,841 24,243,841
Government 28.4 17,850,348 17,850,348
Foreign central banks 2,059 2,003
International organisations 6,302,580 6,692,016
Others 24,462,409 19,629,317
72,861,237 68,417,525
164,665,074 161,552,998
28.1
2017 2016
28.2 The interest rate profile of the interest bearing deposits is as follows:
Foreign central banks 0.59 to 1.49 0.30 to 0.76
International organisations 2.62 to 3.09 2.11 to 2.62
Others 0.38 to 1.00 0.09 to 0.41
28.3
28.4
Consolidated Financial Statements of SBP and its Subsidiaries
-----------------(Rupees in '000)----------------
These are interest free and represent amounts kept in separate special accounts to meet forthcoming foreign currency debt repayment
obligations of the Government of Pakistan.
These represent rupee counterpart of the foreign currency loan disbursements received from various international financial institutions
on behalf of the Government and credited to separate deposit accounts in accordance with the instructions of the Government.
----------(% per annum)----------
-----------------(Rupees in '000)----------------
This includes a long-term deposits of USD 500 million (2016: two contracts of Rs 500 million each) received from the State
Administration Foreign Exchange (SAFE) China in January 2009 (rolled-over in January 2017) carrying interest at six months LIBOR
plus 100 bps (2016: LIBOR plus 100 bps), payable semi-annually. The deposit of USD 500 million which has been set off against the
rupee counterpart receivable from the Federal Government and has been covered under Ministry of Finance (MoF) Guarantee whereby
the MoF has agreed to assume all liabilities and risks arising from the Bank's agreement with SAFE China.
109

Note 2017 2016
29. PAYABLE TO THE INTERNATIONAL MONETARY FUND
Borrowings under:
- Fund facilities 29.1 & 29.3 643,054,775 634,172,641
- Allocation of SDRs 29.2 144,326,457 144,566,830
787,381,232 778,739,471
Current account for administrative charges 34 34
787,381,266 778,739,505
29.1
29.2
Note 2017 2016
29.3 Interest profile of amount payable to the IMF is as under:
Fund facilities 29.3.1 1.05 to 1.63 1.05 to 1.07
29.3.1
Note 2017 2016
30. OTHER LIABILITIES
Local currency
Provision against overdue mark-up 30.1 8,662,726 7,960,351
Remittance clearance account 2,215,088 2,259,587
Exchange loss payable under exchange risk coverage scheme 239,068 233,121
Dividend payable 30.2 10,000 10,000
Share of loss payable under profit and loss sharing arrangements - 1,377,691
Other accruals and provisions 30.3 29,835,773 31,126,910
Liabilities against assets subject to finance leases 16,904
Payable to NSPC 7,983,186 -
Others 30.4 8,552,698 6,611,340
57,515,443 49,579,000
30.1
30.2
Note 2017 2016
30.3 Other accruals and provisions
Agency commission 12,451,275 12,440,190
Provision for employees' compensated absences 45.4.10 7,098,384 7,475,810
Provision for other doubtful assets 30.3.1 6,652,772 6,911,495
Other provisions 30.3.2 2,848,701 2,848,701
Others 784,641 1,450,714
29,835,773 31,126,910
This includes dividend payable on shares held by the Government of Pakistan and Government controlled entities amounting to Rs. 9.99
million (2016: Rs. 9.99 million).
--------------(Rupees in '000)---------------
State Bank of Pakistan Annual Report FY17
--------------(Rupees in '000)---------------
This represents amount payable against allocation of SDRs. A charge is levied by the IMF on the SDR allocation of the Bank at weekly
interest rate applicable on daily product of SDR.
The IMF levies a basic rate of interest (charges) on loans based on the SDR interest rate and imposes surcharges depending on the
amount and maturity of the loan and the level of credit outstanding. Interest rates are determined by the IMF on weekly basis. Charges
are, however, payable on quarterly basis.
IMF provides financing to its member countries from General Resources Account (GRA) held in its General Department. GRA credit is
normally governed by the IMF’s general lending policies (also known as “credit tranche” policies, which provide financing for Balance
of Payments [BoP] needs).
-----------------(Rupees in '000)----------------
This represents suspended mark-up which is recoverable from Government of Bangladesh (former East Pakistan) subject to the final
settlement between the Governments of Pakistan and Bangladesh (former East Pakistan).
Under GRA financing i.e. Extended Fund Facility (EFF) was granted by IMF in FY 2013-14. The total facility amounts to SDR 4,393
million having repayment period of 4½–10 years, with repayments in twelve equal semi-annual installments. A total amount of SDR
4,393 million has been disbursed under twelve (12) tranches of EFF up to June 30, 2017 (2016: SDR 4,320 million). The repayments
under this facility would start in March 2018 and would continue till September 2026.
--------(% per annum)-------
110

Note 2017 2016
30.3.1 Provision for other doubtful assets
Provision against assets held with / receivable from Government of India and
the Reserve Bank of India
- Issue Department 5,758,914 6,012,137
- Banking Department 40,483 40,483
5,799,397 6,052,620
Provision against assets receivable from Government of
Bangladesh (former East Pakistan)
- Issue Department - -
- Banking Department 853,375 858,875
853,375 858,875
30.3.1.1 6,652,772 6,911,495
30.3.1.1 Movement of provisions for other doubtful assets
Opening balance 6,911,495 6,350,295
Charge / (reversal) for the year - net 16,842 (86,213)
(Diminution) / appreciation relating to gold reserves held by
the Reserve Bank of India (275,565) 647,413
Closing balance 6,652,772 6,911,495
30.3.2 Movement of other provisions
Opening balance 2,848,701 2,848,933
Reversal during the year - (232)
Closing balance 2,848,701 2,848,701
Home Specific claims Others Total
remittance (note 30.3.2.1) (note 30.3.2.2)
Balance as at July 1, 2015 260,363 1,600,000 988,570 2,848,933
Reversal during the year - - (232) (232)
Balance as at June 30, 2016 260,363 1,600,000 988,338 2,848,701
(Charge) / Reversal during the year - - - -
Balance as at June 30, 2017 260,363 1,600,000 988,338 2,848,701
30.3.2.1 This represents provision made against a claim under arbitration.
30.3.2.2 This represents provision made in respect of various litigations and claims against the Group.
30.4
Note 2017 2016
31. DEFERRED LIABILITY - STAFF RETIREMENT BENEFITS
Unfunded staff retirement benefits
Pension 61,733,525 58,018,505
Gratuity scheme 48,799 41,822
Post retirement medical benefits 21,789,331 21,135,683
Benevolent fund scheme 1,602,183 1,755,433
Six months post retirement facility 527,426 480,397
45.3.3 85,701,264 81,431,840
Provident fund scheme 959,344 987,418
86,660,608 82,419,258
Funded staff retirement benefits
Staff pension scheme 45.4.2 3,146,267 -
Total 89,806,875 82,419,258
This includes liability maintained against balances due from Government of Bangladesh (former East Pakistan) amounting to Rs.
778.399 million (2016: Rs. 778.399 million).
-----------------(Rupees in '000)----------------
----------------------------------------- (Rupees in '000) -----------------------------------------
-----------------(Rupees in '000)----------------
Consolidated Financial Statements of SBP and its Subsidiaries
111

32. SHARE CAPITAL
2017 2016 2017 2016
---(Number of shares)---
Authorised share capital
1,000,000 1,000,000 Ordinary shares of Rs. 100 each 100,000 100,000
Issued, subscribed and paid-up capital
1,000,000 1,000,000 Fully paid-up ordinary shares of Rs. 100 each 100,000 100,000
33. RESERVES
33.1 Reserve fund
33.2 Reserve for acquisition of PSPC
33.3 Other funds
Note 2017 2016
34. UNREALISED APPRECIATION ON GOLD RESERVES
HELD BY THE BANK
Opening balance 283,342,601 243,367,310
(Diminution) / appreciation for the year due to revaluation 7 (17,015,000) 39,975,291
266,327,601 283,342,601
35. CONTINGENCIES AND COMMITMENTS
35.1 Contingencies
State Bank of Pakistan
a) Contingent liability in respect of guarantees given on behalf of:
Federal Government 16,889,529 21,486,999
Federal Government owned / controlled bodies and authorities 7,103,733 7,605,996
23,993,262 29,092,995
b) Certain employees of the Bank who had retired under the Early Retirement Incentive Scheme (ERIS) introduced in the year 2000 had
filed a case against the Bank in the Federal Services Tribunal (FST) for the enhancement of their entitlement paid under the above
scheme amounting to Rs. 157 million approximately. The Tribunal has decided the case in favour of these employees and has
directed that the entitlement under the above scheme should include the effect of subsequent increases in certain staff retirement and
other benefits. The Bank, in response to the above decision of the Tribunal filed a civil petition for leave to appeal in the Supreme
Court of Pakistan. In prior years, the Honorable Bench of the Supreme Court of Pakistan set aside the judgment of FST and allowed
employees to avail proper forum. The employees have filed an appeal in the Honorable Lahore High Court, Rawalpindi Bench, the
decision of which is pending. The management is confident that the Bank would not have to bear any additional expenditure on this
account and, accordingly, no provision has been made in this respect.
-----------------(Rupees in '000)----------------
State Bank of Pakistan Annual Report FY17
The shares of the Bank are held by the Government of Pakistan and certain Government controlled entities except for 200 shares held by
the Central Bank of India (held by Deputy Custodian Enemy Property, Banking Policy and Regulations Department, State Bank of
Pakistan) and 500 shares held by the State of Hyderabad.
This represents appropriations made out of the annual profits of the State Bank of Pakistan in accordance with the provisions of the
State Bank of Pakistan Act, 1956.
These represent appropriations made out of the surplus profits of the State Bank of Pakistan for certain specified purposes in
accordance with the provisions of the State Bank of Pakistan Act, 1956.
-----------------(Rupees in '000)----------------
During the current year the Board of Directors of the Bank in its meeting held on June 29, 2017 has approved the creation of a special
reserve fund by the name of "The Reserve for Acquisition of PSPC" and has appropriated an amount of Rs. 65,464 million from
"Reserve Fund" to "The Reserve for Acquisition of PSPC".
112

c)
Note 2017 2016
d) Other claims against the Bank not acknowledged as debts 35.1.1 353,153 353,640
35.1.1 These represent various claims filed against the Bank's role as a regulator and certain other cases.
National Instiute of Banking and Finance (Guarantee) Limited
a)
b)
Pakistan Security Printing Corporation (Private) Limited
a)
b)
The PSPC is defending certain cases filed by its ex-employees on account of their reinstatement in the PSPC and compensation for
loss of their jobs. Management considers that the probability of any significant liability arising from such cases is remote.
In the previous years the tax authorities initiated proceedings for amendment of deemed assessments for tax years 2004 to 2009 by
issuing notices under sections 122 (5A) read with 122(9) of the Income Tax Ordinance, 2001. The amended orders were passed and
certain demands were raised for which the PSPC subsequently filed rectification application as a result of which the demands were
rectified to Rs 34.9 million. The PSPC, having paid the aforesaid net demand of Rs 34.9 million, had filed appeals before the
Commissioner of Inland Revenue - Appeals {CIR(A)} which were decided against the PSPC. The PSPC, further filed appeal before
the Appellate Tribunal Inland Revenue (ATIR) which vide order dated June 29, 2015 partially upheld the action of the Additional
Commissioner Inland Revenue for amending the aforesaid assessments.
Further, the PSPC's miscellaneous application before ATIR on the matter of allocation of expenses has been dismissed. A reference
before the High Court of Sindh has been filed by the PSPC, the adjudication of which is pending to date. The management, however,
is continuing with its view that the net demand will eventually be revoked and the amount paid will be refunded / adjusted in favour
of the PSPC.
During the current year, the Institute has filed an appeal before the Commissioner Inland Revenue Appeals II (CIRA) challenging the
compulsory registration of the Institute done by the department vide its order dated February 19, 2016. This appeal was disposed of
by the CIRA on February 9, 2017 because it was not maintainable under the law (as it was outside the jurisdiction) and the case can
now be taken to the Honorable Islamabad High Court. Consequently, the Institute intends to file writ petition against the above
orders before the Honorable Islamabad High Court.
The Institute, based on the advice of its legal counsel, is of the view that the Institute has valid grounds and there are fair chances of
success before the Honorable Islamabad High Court. Accordingly, no provision has been recognized in these consolidated financial
statements.
The Finance Act 2015 extended the scope of services covered under Islamabad Capital Territory (Tax on Services) Ordinance, 2001
(ICTO) and some new services were brought within the purview of sales tax which are detailed in schedule to the ICTO. During the
year 2016, the Institute received a notice from the tax department dated January 20, 2016 claiming that the services provided by the
Institute fall within the purview of serial numbers 13, 19 and 38 of schedule to the ICTO and accordingly the Institute should get
itself registered for sales tax, obtain Sales Tax Registration number (STRN), file returns for six months from July 2015 to December
31, 2015 and settle the outstanding liability in respect of sales tax for those six months. The management believes that the Institute
does not fall under the purview of serial numbers 13, 19 and 38 of schedule to the ICTO mainly on the ground that NIBAF is a
training institute and is not liable to be registered under sales tax on services. A reply was sent from the Institute’s management to
the Assistant Commissioner Inland Revenue (ACIR) justifying the non-applicability of serial numbers 13, 19 and 38 of schedule to
the ICTO to the Institute. However, the ACIR maintained the tax department’s view and ordered the compulsory registration of the
Institute with immediate effect through its order dated February 19, 2016.
Moreover, the Institute received a show cause notice on March 10, 2016 for filing the tax returns for the period from July 2015 to
December 2015 and payment of the due amount of sales tax on services. Subsequently, the department passed the following order on
April 11, 2016:
Imposition of sales tax amounting to Rs.13,675,649; and
Imposition of a penalty under section 33(1) of the Sales Tax Act, 1990 for non-filing amounting to Rs.35,000 along
with default surcharge and penalty under section 33(5) of the Sales Tax Act, 1990.
The Institute challenged the above order passed by the ACIR before the Commissioner Inland Revenue Appeals II (CIRA).
However, the matter was decided against the Institute.
In addition to these claims, there are several other investigations / lawsuits filed by various parties as a result of the regulatory
actions / investigations taken by the Bank in its capacity as regulator and banker to the government, which the Bank is currently
contesting in various courts of laws / forums. The management of the Bank, believes that the Bank has reasonable position in respect
of these litigations and accordingly no provision for any liability may be needed in the consolidated financial statements.
-----------------(Rupees in '000)----------------
Consolidated Financial Statements of SBP and its Subsidiaries
113

Note 2017 2016
35.2 Commitments
35.2.1 Foreign currency forward and swap contracts - sale 935,079,726 802,656,331
35.2.2 Foreign currency forward and swap contracts - purchase 498,678,723 595,499,305
35.2.3 Futures - sale 43,038,829 18,044,108
35.2.4 Futures - purchase 35,430,566 14,656,485
35.2.5 Capital Commitments 35.2.5.1 272,021 935,886
35.2.6 Letter of Guarantee / Credit 4,701,000 -
35.2.5.1 This represents amounts committed by the bank to purchase assets from successful bidders.
35.2.7
35.2.8
36. DISCOUNT, INTEREST / MARK-UP AND / OR PROFIT EARNED Note 2017 2016
Discount, interest / mark-up on Government transactions
- Government securities 36.1 171,399,674 150,313,267
- Federal Government Scrips 82,769 82,200
- Loans and advances to and current accounts of Governments 36.2 442,256 327,520
Securities purchased under agreement to resell 63,193,756 80,712,710
Interest income on preference shares 1,333,659 -
Return on loans and advances to financial institutions 6,400,591 8,683,044
Foreign currency loan and advance including deposits 9,034,732 4,258,735
Foreign currency securities 8,970,869 8,382,254
Profit on Sukuks purchased under Bai Muajjal agreement 11,412 70,542
Others 909 798
260,870,627 252,831,070
36.1 This represents income earned on Market Related Treasury Bills, Market Treasury Bills and Pakistan Investment Bonds.
2017 2016
36.2 Interest profile on loans and advances to facilities are as under: -----(% per annum)----
Mark-up on facility 6.89 to 6.01 6.18 to 6.88
Additional mark-up (where ways and means facility limit is exceeded) 4 4
Note 2017 2016
37. INTEREST / MARK-UP EXPENSE
Deposits 19,087,345 15,866,387
Securities sold under agreement to repurchase 152,737 218,111
Return on Sukuks purchased under Bai Muajjal agreement 1,735,682 9,287,535
Charges on allocation of Special Drawing Rights of the IMF 388,071 78,609
Others 5,009 3,838
21,368,844 25,454,480
38. COMMISSION INCOME
Market Treasury Bills 38.1 1,163,377 472,821
Management of public debts 38.1 959,936 989,118
Prize Bonds and National Saving Certificates 38.1 459,422 439,041
Draft / payment orders 8,408 8,148
Others 51 52
2,591,194 1,909,180
38.1 These represent commission income earned from services provided to the Federal Government.
-----------(Rupees in '000)---------
-----------(Rupees in '000)---------
The Group has made commitments to extend advance under ways and means limits to the Provincial Governments of Pakistan,
Government of Azad Jammu and Kashmir and Gilgit-Baltistan Administration Authority in the normal course of its operations. The
unutilised limits as on June 30, 2017 amounted to Rs. 67,325 million (2016: Rs. 71,945 million).
In case the Governments exceed their respective ways and means limits, the Bank charges a penal rate of 4% over and above the
normal rate of return on the amount exceeding the ways and means limit.
State Bank of Pakistan Annual Report FY17
-----------(Rupees in '000)---------
Commitments in respect of bilateral currency swap agreements with People's Bank of China have been disclosed in note 26 to these
consolidated financial statements.
114

39. EXCHANGE GAIN - NET Note 2017 2016
Gain / (loss) on:
- Foreign Currency placements, Deposits, securities and Other Accounts - net 21,802,161 38,322,960
- Forward covers under Exchange Risk Coverage Scheme (109) 6
- IMF Fund Facilities 2,642,689 (10,984,606)
- Special Drawing Rights of the IMF 80,160 (1,611,329)
24,524,901 25,727,031
Others 446 -
Exchange risk fee income 44,291 52,344
24,569,638 25,779,375
40. SHARE OF PROFIT FROM ASSOCIATES
Security Papers Limited 14,058 -
SICPA Inks Pakistan (Private) Limited 12,138 -
26,196 -
41. OTHER OPERATING INCOME - NET
Penalties levied on banks and financial institutions 1,131,474 1,017,004
License / Credit Information Bureau fee recovered 904,202 817,885
Gain / (loss) on sale of investment-net
Local - 'at fair value through profit or loss' - 58,663
Foreign - 'at fair value through profit or loss' 39,949 201,043
39,949 259,706
Gain / loss on restructuring of exposure of Zarai Taraqiati
Bank Limited and House Building Finance Company Limited 41.1 3,311,793 -
Gain / (loss) on remeasurement of securities classified
as 'fair value through profit or loss' (4,930,365) 559,888
Sales of prize bond to Government of Pakistan 6,306
Others 110,996 101,629
574,355 2,756,112
41.1 Gain / loss on restructuring of exposure of Zarai Taraqiati Bank
Limited (ZTBL) and House Building Finance Company Limited (HBFCL)
ZTBL:
- Fair value loss on recognition of preference shares (1,634,847) -
- Reversal of previously suspended mark-up on issuance
of equity shares to the Bank 10,199,622 -
- Reversal of provision of loans and advances on issuance of
preference shares 16.4 3,204,323 -
11,769,098 -
HBFCL:
- Loss arising on conversion of loans into ordinary shares (9,834,996) -
- Share of loss payable under profit and loss sharing arrangements written back 1,377,691 -
(8,457,305) -
3,311,793 -
42. OTHER INCOME - NET
Gain on disposal of property, plant and equipment 14,340 3,893
Liabilities and provisions written back - net 11,780 12,327
Grant income under foreign assistance program 9,064 11,808
Others 266,865 132,932
302,049 160,960
43. COST OF PREPARATION OF BANK NOTES AND PRINTING CHARGES
44. AGENCY COMMISSION
-----------(Rupees in '000)---------
Agency commission is mainly payable to National Bank of Pakistan (NBP) under an agreement for providing banking services to
Federal and Provincial Governments as an agent of the Bank. Furthermore, a small portion of the agency commission also pertains to
Bank of Punjab (BOP), which was appointed as agent of the Bank, during last year, to collect Government of Punjab’s taxes and
receipts.
This includes bank notes printing charges paid to Pakistan Security Printing Corporation (Private) Limited - PSPC until June 13, 2017
at agreed rates under specific arrangements. PSPC became part of the group consequent to its acquisition by the Bank effective June
14, 2017.
Consolidated Financial Statements of SBP and its Subsidiaries
115

Note 2017 2016
45. GENERAL ADMINISTRATIVE AND OTHER EXPENSES
Salaries and other benefits 9,379,672 9,751,687
Retirement benefits and employees' compensated absences 45.1 7,691,921 9,827,094
Rent and taxes 56,481 54,189
Insurance 49,958 34,017
Electricity, gas and water 399,577 368,646
Depreciation 19.1 2,273,363 1,498,186
Amortisation of intangible assets 20 3,231 3,111
Repairs and maintenance 647,007 638,414
Auditors' remuneration 45.2 14,337 12,397
Legal and professional 53,536 39,048
Fund managers / custodian expenses 475,909 495,428
Travelling expenses 543,492 449,223
Daily expenses 106,964 83,681
Fuel 43,876 47,597
Conveyance 24,647 25,017
Postages, telegram / telex and telephone 228,128 218,832
Training 122,700 102,813
Stationery 23,881 22,740
Remittance of treasure 132,636 92,744
Books and newspapers 37,289 29,693
Advertisement 48,554 43,068
Uniforms 36,345 29,936
Others 548,245 383,025
22,941,749 24,250,586
45.1 This includes an amount relating to defined contribution plan aggregating Rs. 238,396 million (2016: Rs. 169,553 million).
45.2 Auditors' remuneration
State Bank of Pakistan
Audit fee 3,000 3,000 6,000 2,610 2,610 5,220
Out of pocket expenses 500 500 1,000 415 415 830
3,500 3,500 7,000 3,025 3,025 6,050
SBP Banking Services Corporation
Audit fee 2,500 2,500 5,000 2,090 2,090 4,180
Out of pocket expenses 1,000 1,000 2,000 885 885 1,770
3,500 3,500 7,000 2,975 2,975 5,950
National Institute of Banking and Finance
Audit fee - 225 225 - 225 225
Out of pocket expenses - 63 63 - 172 172
- 288 288 - 397 397
Pakistan Security Printing Corporation
Audit fee - 49 49 - - -
Out of pocket expenses - - - - - -
- 49 49 - 397 -
7,000 7,337 14,337 6,000 6,794 12,397
45.3 Staff retirement benefits-unfunded (State Bank of Pakistan and SBP Banking Services Corporation)
45.3.1
2017
- Discount rate for year end obligation 7.75% p.a. 7.25% p.a.
- Salary increase rate (where applicable) 8.75% p.a. 8.25% p.a.
- Pension indexation rate (where applicable) 6.25% p.a. 4.75% p.a.
- Medical cost increase rate 7.75% p.a. 6.25% -7.25% p.a
- Petrol price increase rate (where applicable) 8.75% p.a. 8.25% p.a.
- Personnel turnover
SBP 4.8% p.a. 18.1% p.a
SBP-BSC 9.2% p.a. 11.50% p.a
- Normal retirement age 60 Years 60 Years
State Bank of Pakistan Annual Report FY17
Assumptions regarding future mortality are based on actuarial advice in accordance with published statistics and experience in
Pakistan. The rates assumed are based on the adjusted SLIC 2001 - 2005 mortality tables with 1 year setback.
-----------(Rupees in '000)---------
During the year the actuarial valuations of the defined benefit obligations were carried out under the Projected Unit Credit Method
using following significant assumptions:
Total A. F. Ferguson
& Co.
EY Ford
RhodesTotal
EY Ford
Rhodes
A. F. Ferguson
& Co.
2016
-------------------------------------------------- (Rupees in '000) --------------------------------------------------
2017 2016
116

45.3.2
Discount rate risk
Salary increase / inflation risk
Pension Increase risk
Mortality risk
The risk that the actual mortality experience is higher than that of expected i.e. the actual life expectancy is longer than assumed.
Withdrawal risk
The risk of actual withdrawals experience may differ from that assumed in the calculation.
45.3.3 Change in present value of defined benefit obligation
Present value of defined benefit obligation July 1, 2016 58,018,505 41,822 21,135,683 1,755,433 480,397 81,431,840
Current service cost 1,107,980 5,899 371,178 6,432 33,884 1,525,373
Interest cost on defined benefit obligation 4,003,135 3,032 1,500,117 119,954 34,158 5,660,396
Benefits Paid (5,605,702) - (888,841) (201,804) (18,483) (6,714,830)
Remeasurements:
Actuarial (gains) / losses from changes in demographic assumptions -
Actuarial (gains) / losses from changes in financial assumptions 3,011,670 - 388,832 (45,471) 8,593 3,363,624
Experience adjustments 1,197,937 (1,954) (717,638) (32,361) (11,123) 434,861
Present value of defined benefit obligation as on June 30, 2017 61,733,525 48,799 21,789,331 1,602,183 527,426 85,701,264
Present value of defined benefit obligation July 1, 2015 48,607,941 28,021 19,118,366 1,478,246 378,600 69,611,174
Current service cost 1,271,085 6,880 404,467 69,061 27,945 1,779,438
Past service cost 256,513 1,822 22,147 - 16,745 297,227
Interest cost on defined benefit obligation 4,218,033 2,909 2,024,005 124,370 37,475 6,406,792
Benefits Paid (10,692,125) (408) (860,673) (405,313) (31,347) (11,989,866)
Remeasurements: -
Actuarial (gains) / losses from changes in demographic assumptions 5,390,076 - 870,054 204,736 (17,971) 6,446,895
Actuarial (gains) / losses from changes in financial assumptions 1,249,593 5,158 164,030 232,928 40,419 1,692,128
Experience adjustments 7,717,389 (2,560) (606,713) 51,405 28,531 7,188,052
Present value of defined benefit obligation as on June 30, 2016 58,018,505 41,822 21,135,683 1,755,433 480,397 81,431,840
45.3.4 Remeasurements recognised during the period in consolidated statement of comprehensive income
2017 2016
- Actuarial (gains) / losses from changes in demographic and financial assumptions 3,363,624 8,139,023
- Experience adjustments 434,861 7,188,052
3,798,485 15,327,075
45.3.5 Amount recognised in the consolidated profit and loss account
Current service cost 1,107,980 5,899 371,178 6,432 33,884 1,525,373
Interest cost on defined benefit obligation 4,003,135 3,032 1,500,117 119,954 34,158 5,660,396
Contribution made by Employees - - - (19,326) - (19,326)
5,111,115 8,931 1,871,295 107,060 68,042 7,166,443
Consolidated Financial Statements of SBP and its Subsidiaries
-----(Rupees in '000)-----
2016
Gratuity
Scheme
Six months post
retirement
facility
Pension
------------------------------------------------------------------Rupees in 000------------------------------------------------------------------
Post
retirement
medical
benefits
Benevolent
fund scheme
Through its defined benefit plan, the Group is exposed to a number of risks, the most significant of which are detailed below:
Pension Gratuity
Scheme
Post
retirement
medical
benefits
Benevolent
fund scheme
Six months post
retirement
facility
Total
2017
The risk of changes in discount rate since discount rate is based on corporate / government bonds. Any decrease in bond yields will
impact plan liabilities.
The risk that the actual salary increase is higher / lower than the expected salary increase, where benefits are linked with final salary at
the time of cessation of service, is likely to have an impact on liability.
The risk that the actual salary increase are higher than the expected, where benefits are being paid in form of monthly pension, is likely
to have an impact on liability.
------------------------------------------------------------------Rupees in 000------------------------------------------------------------------
Total
Pension Gratuity
scheme
Post
retirement
medical
benefits
Benevolent
fund scheme
Six months post
retirement
facility
Total
-------------------------------------------------------------(Rupees in '000)----------------------------------------------------------
2017
117

Current service cost 1,271,085 6,880 404,467 69,061 27,945 1,779,438
Past service cost 256,513 1,822 22,147 - 16,745 297,227
Interest cost on defined benefit obligation 4,218,033 2,909 2,024,005 124,370 37,475 6,406,792
Contribution made by Employees - - - (12,184) - (12,184)
5,745,631 11,611 2,450,619 181,247 82,165 8,471,273
45.3.6 Movement of present value of defined benefit obligation
Net recognised liabilities at July 1, 2016 58,018,505 41,822 21,135,683 1,755,433 480,397 81,431,840
Amount recognised in the consolidated profit and loss account 5,111,115 8,931 1,871,295 107,060 68,042 7,166,443
Remeasurements 4,209,607 (1,954) (328,806) (77,832) (2,530) 3,798,485
Benefits paid during the year (5,605,702) - (888,841) (201,804) (18,483) (6,714,830)
Employees contribution / amount transferred - - - 19,326 - 19,326
Net recognised liabilities at June 30, 2017 61,733,525 48,799 21,789,331 1,602,183 527,426 85,701,264
Net recognised liabilities at July 1, 2015 48,607,941 28,021 19,118,366 1,478,246 378,600 69,611,174
Amount recognised in the consolidated profit and loss account 5,745,631 11,611 2,450,619 181,247 82,165 8,471,273
Remeasurements 14,357,058 2,598 427,371 489,069 50,979 15,327,075
Benefits paid during the year (10,692,125) (408) (860,673) (405,313) (31,347) (11,989,866)
Employees contribution / amount transferred - - - 12,184 - 12,184
Net recognised liabilities at June 30, 2016 58,018,505 41,822 21,135,683 1,755,433 480,397 81,431,840
45.3.7 The sensitivity of the defined benefit obligation to changes in the weighted principal assumptions is:
Pension
Discount rate 1% (4,482,955) 5,300,468
Salary increase rate 1% 1,362,038 (1,284,489)
Pension increase rate 1% 3,931,550 (3,345,546)
Expected mortality rates 1 Year (127,573) 177,650
Gratuity
Discount rate 1% (6,197) 7,384
Salary increase rate 1% 7,244 (6,197)
Post retirement medical benefit
Discount rate 1% (2,938,449) 3,755,316
Salary increase 1% 2,710,088 (2,141,140)
Post-Retirement medical cost increase rate 1% 1,155,532 (929,300)
Expected mortality rates 1 Year 135,888 (130,252)
Benevolent
Discount rate 1% (82,813) 94,022
Six months post retirement benefit
Discount rate 1% (42,697) 48,990
Salary / Petrol price increase rate 1% 48,969 (43,519)
Pension Gratuity
Scheme
Pension Gratuity
Scheme
Post
retirement
medical
benefits
-------------------------------------------------------------(Rupees in '000)----------------------------------------------------------
Post
retirement
medical
benefits
Benevolent
fund scheme
Six months post
retirement
facility
Total
Total
Total
Benevolent
fund scheme
Six months post
retirement
facility
Six months post
retirement
facility
-------------------------------------------------------------(Rupees in '000)----------------------------------------------------------
2016
2017
-------------------------------------------------------------(Rupees in '000)----------------------------------------------------------
Pension Gratuity
Scheme
Post
retirement
medical
benefits
Benevolent
fund scheme
2016
Decrease in
assumption
(Rupees in '000)
State Bank of Pakistan Annual Report FY17
The above sensitivity analysis are based on a change in an assumption while holding all other assumptions constant. When calculating
the sensitivity of the defined benefit obligation to significant actuarial assumptions, the same method (present value of the defined
benefit obligation calculated with the projected unit credit method at the end of the reporting period) has been applied as when
calculating the liability of all schemes recognised within the balance sheet.
Impact on defined benefit obligation - Increase /
(Decrease)
Change in
Assumption
Increase in
assumption
118

45.3.8 Duration of defined benefit obligation
The weighted average duration of the defined benefit obligation is 8 Years 6-14 Years 14-16 Years 5-7 Years 5-9.66 Years
45.3.9 Estimated expenses to be charged to consolidated profit and loss account for the year ending June 30, 2018
Current service cost 1,041,589 6,624 480,431 6,287 36,937 1,571,868
Interest cost on defined benefit obligation 4,784,348 3,782 1,688,673 124,170 40,876 6,641,849
Amount chargeable to the consolidated profit
and loss account 5,825,937 10,406 2,169,104 130,457 77,813 8,213,717
45.4 Funded Staff Retirement Benefits - PSPC
45.4.1
2017
- Discount rate 9.00% p.a
- Expected rate of increase in salaries 9.00% p.a
- Expected rate of increase in monthly pension 5.00% p.a
- Pre-Retirement Mortality SLIC 2001-2005
- Post-Retirement Mortality SLIC 2001-2005
45.4.2 Through its defined benefit plan, the Group is exposed to a number of risks, the most significant of which are detailed below:
Investment risks
Longevity risks
Salary increase risk
The risk arises when the actual increases are higher than expectation and impacts the liability accordingly.
Withdrawal risk
2017
The amounts recognised in the consolidated balance sheet are determined as follows: Rupees in 000
Present value of defined benefit obligations 4,957,302
Fair value of plan assets (1,811,035)
3,146,267
Consolidated Financial Statements of SBP and its Subsidiaries
During the year, the actuarial valuations of the defined benefit obligations were carried out under the Projected Unit Credit Method
using the following significant assumptions:
The risk arises when the actual performance of the investments is lower than expectation thus creating a shortfall in the funding
objectives.
The risk arises when the actual lifetime of retirees is longer than expectation. This risk is measured at the plan level over the entire
retiree population.
The risk of actual withdrawals varying with the actuarial assumptions can impose a risk to the benefit obligation. The movement of the
liability can go either way.
PensionGratuity
Scheme
Six months post
retirement
facility
Based on the actuarial advice, the management estimates that charge in respect of defined benefit plans for the year ending June 30,
2018 would be as follows:
------------------------------------------------------------------Rupees in 000'------------------------------------------------------------------
TotalPensionGratuity
Scheme
Post
retirement
medical
benefits
Benevolent
fund scheme
Six months post
retirement
facility
Post
retirement
medical
benefits
Benevolent fund
scheme
119
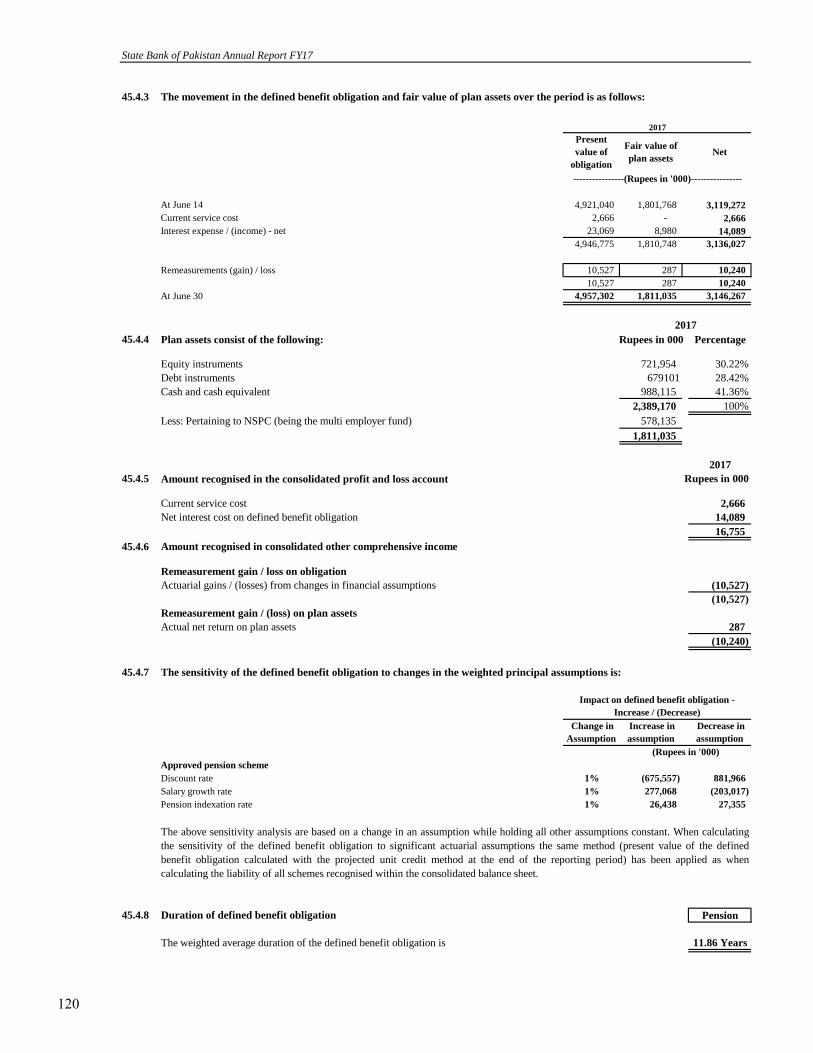
45.4.3 The movement in the defined benefit obligation and fair value of plan assets over the period is as follows:
At June 14 4,921,040 1,801,768 3,119,272
Current service cost 2,666 - 2,666
Interest expense / (income) - net 23,069 8,980 14,089
4,946,775 1,810,748 3,136,027
Remeasurements (gain) / loss 10,527 287 10,240
10,527 287 10,240
At June 30 4,957,302 1,811,035 3,146,267
45.4.4 Plan assets consist of the following: Rupees in 000 Percentage
Equity instruments 721,954 30.22%
Debt instruments 679101 28.42%
Cash and cash equivalent 988,115 41.36%
2,389,170 100%
Less: Pertaining to NSPC (being the multi employer fund) 578,135
1,811,035
2017
45.4.5 Amount recognised in the consolidated profit and loss account Rupees in 000
Current service cost 2,666
Net interest cost on defined benefit obligation 14,089
16,755
45.4.6 Amount recognised in consolidated other comprehensive income
Remeasurement gain / loss on obligation
Actuarial gains / (losses) from changes in financial assumptions (10,527)
(10,527)
Remeasurement gain / (loss) on plan assets
Actual net return on plan assets 287
(10,240)
45.4.7 The sensitivity of the defined benefit obligation to changes in the weighted principal assumptions is:
Approved pension scheme
Discount rate 1% (675,557) 881,966
Salary growth rate 1% 277,068 (203,017)
Pension indexation rate 1% 26,438 27,355
45.4.8 Duration of defined benefit obligation Pension
The weighted average duration of the defined benefit obligation is 11.86 Years
Change in
Assumption
Increase in
assumption
Decrease in
assumption
Impact on defined benefit obligation -
Increase / (Decrease)
2017
The above sensitivity analysis are based on a change in an assumption while holding all other assumptions constant. When calculating
the sensitivity of the defined benefit obligation to significant actuarial assumptions the same method (present value of the defined
benefit obligation calculated with the projected unit credit method at the end of the reporting period) has been applied as when
calculating the liability of all schemes recognised within the consolidated balance sheet.
Present
value of
obligation
Fair value of
plan assetsNet
2017
----------------(Rupees in '000)----------------
(Rupees in '000)
State Bank of Pakistan Annual Report FY17
120

45.4.9 Estimated expenses to be charged to consolidated profit and loss account for the year ending June 30, 2018
Pension
Rupees in 000'
Current service cost 285,669
Interest cost on defined benefit obligation 57,363
Amount chargeable to the consolidated profit and loss account 343,032
45.4.10 Employees' compensated absences
Note 2017 2016
46. TAXATION -----------(Rupees in '000)---------
Current - for the period 4,602 -
4,602 -
Deferred 812 -
5,414 -
46.1 This represent taxation charge on the profits of PSPC from the date of its acquisition till June 30, 2017.
47. PROFIT FOR THE YEAR AFTER NON-CASH AND OTHER ITEMS
Profit for the year 238,069,011 229,353,126
Adjustments for:
Depreciation 19 2,273,363 1,498,186
Amortisation of intangible assets 20 3,231 3,111
Provision / (reversal) for / write-off:
- retirement benefits and employees' compensated absences 45 7,691,921 9,827,094
- loans and advances (6,139) (756)
- claims - (232)
- other doubtful assets 16,842 (86,213)
Gain on restructuring of exposure of Zarai Taraqiati -
Bank Limited (ZTBL) and House Building Finance Company Limited (HBFCL) 41.1 (3,311,793)
Gain on disposal of property, plant and equipment (14,340) (3,893)
Share of Profir from associate (26,196) -
Dividend income (12,248,843) (12,226,343)
Effect of exchange gain on cash and cash equivalents 1,687,144 45,545,964
234,134,201 273,910,044
48. CASH AND CASH EQUIVALENTS
Cash and bank balances 6 2,190,657 -
Local currency 8 861,860 488,198
Foreign currency accounts and investments 9 1,444,739,189 1,737,853,644
Earmarked foreign currency balances 10 10,319,532 5,147,596
Special Drawing Rights of the IMF 11 63,657,319 67,656,236
1,521,768,557 1,811,145,674
Based on the actuarial advice, the management estimates that charge in respect of defined benefit plans for the year ending June 30,
2018 would be as follows:
The Group's liability for employees' compensated absences determined through an actuarial valuation carried out under the Projected
Unit Credit Method amounted to Rs. 7,098.384 million (2016: Rs. 7,475.81 million). An amount of Rs. 281.365 million (2016: Rs.
1,217.59 million) has been charged to the consolidated profit and loss account in the current period based on the actuarial advice.
Expected charge in respect of the scheme for the year ending June 30, 2018 would be Rs 950.287 million. The benefits paid during the
year amounted to Rs 658.791 million (2016: Rs 1645.64 million). In case of 1% increase / decrease in discount rate the net charge for
the year would decrease / increase by Rs. 383.3 million and Rs. 437.101 million respectively and the net liability would also be
affected by the same amount. In case of 1% increase / decrease in salary rate the net charge for the year would increase / decrease by
452.505 million and Rs. 405.464 million respectively and the net liability would also be affected by the same amount.
Consolidated Financial Statements of SBP and its Subsidiaries
121

49. RELATED PARTY TRANSACTIONS
49.1 Governments and related entities
2017 2016
Transactions during the year
- Creation of MRTBs 6,250,800,000 4,294,300,000
- Retirement / rollover of MRTBs 5,799,530,000 4,558,055,859
- Investment purchased / matured and re-invested 11,471 (30,204)
- Outstanding foreign currency swap contracts 89,778,296 183,961,130
-
49.2 Remuneration to key management personnel
2017 2016
Short-term employee benefit 453,614 341,346
Post-employment benefit 56,169 105,272
Loans disbursed during the year 60,458 173,047
Loans repaid during the year 77,397 92,324
Directors' fees 13,584 12,181
Number of key management personnel 37 32
50. RISK MANAGEMENT POLICIES
50.1 Credit risk management
State Bank of Pakistan Annual Report FY17
The Group enters into transactions with related parties in its normal course of business. Related parties include the Federal Government
as major shareholder of the Group, Provincial Governments, Government of Azad Jammu and Kashmir, Gilgit-Baltistan
Administration Authority, Government controlled enterprises / entities, retirement benefit plans, directors and key management
personnel of the Group.
The Group is primarily subject to interest / mark-up rate, credit, currency and liquidity risks. The policies and procedures for managing
these risks are outlined in notes 50.1 to 50.10 to these consolidated financial statements. The Group has designed and implemented a
framework of controls to identify, monitor and manage these risks. The senior management is responsible for advising the Governor on
the monitoring and management of these risks.
Credit risk is the risk that one party to a financial instrument will fail to discharge an obligation and cause the other party to incur a
financial loss. Credit risk in the Group's portfolio is monitored, reviewed and analysed by the appropriate officials and the exposure is
controlled through counterparty and credit limits. Counterparties are allocated to a particular class based mainly on their credit rating.
Foreign currency placements are made in approved currencies and government securities. Loans and advances to scheduled Banks and
financial institutions are usually secured either by Government guarantees or by demand promissory notes. Equity exposures based on
their nature are not exposed to credit risk. Geographical exposures are controlled by country limits and are updated as and when
necessary with all limits formally reviewed on a periodic basis. The Group's exposure to credit risk associated with foreign investments
is managed by monitoring compliance with investment limits for counterparties. The Group's credit risk mainly lies with exposure
towards government sector and financial institutions.
Key management personnel of the Group include members of the Board of Directors of the Bank, Governor of the Bank, Deputy
Governors of the Bank and other executives of the Group who have responsibility for planning, directing and controlling the activities
of the Group. Fee of the non-executive members of the Board of Directors is determined by the Board. According to section 10 of the
State Bank of Pakistan Act, 1956, the remuneration of the Governor is determined by the President of Pakistan. Deputy Governors are
appointed and their salaries are fixed by the Federal Government. Details of remuneration of key management personnel of the Group
are as follows:
-----------(Rupees in '000)---------
The Group is acting as an agent of the Federal Government and is responsible for functions conferred upon as disclosed in note 1 to
these consolidated financial statements. Balances outstanding from and transaction with the Federal and Provincial Governments and
related entities not disclosed elsewhere in the consolidated financial statements are given below:
Commission income from sale of Market Treasury Bills, issuance of prize bonds, national saving certificates and management of
public debt (refer note 38).
-----------(Rupees in '000)---------
Short-term benefits include salary and benefits, medical benefits and free use of Group maintained cars in accordance with their
entitlements. Post employment benefits include gratuity, pension, benevolent fund, post retirement medical benefits, six months post
retirement facility and contributory provident fund.
122

50.2 Concentrations of risk
50.2.1 Geographical analysis
Financial assets `
Cash and bank balances held by a subsidiary 2,190,657 - - - - - 2,190,657
Local currency - coins 861,860 - - - - - 861,860
Foreign currency accounts and investments 23,961,146 453,088,974 652,637,412 560,768,972 48,496,151 43,586,533 1,782,539,188
Earmarked foreign currency balances 10,319,532 - - - - - 10,319,532
Special Drawing Rights of the International Monetary Fund - - 63,657,319 - - - 63,657,319
Reserve tranche with the International Monetary
Fund under quota arrangements - - 17,382 - - - 17,382
Securities purchased under agreement to resell 1,533,373,313 - - - - - 1,533,373,313
Current accounts of Governments 7,279,247 - - - - - 7,279,247
Investments - local 2,694,286,076 - - - - - 2,694,286,076
Loans, advances and bills of exchange 362,286,041 417,749 - - - - 362,703,790
Assets held with the Reserve Bank of India - 1,384,376 - - - - 1,384,376
Balances due from the Governments of India and
Bangladesh (former East Pakistan) - 9,917,256 - - - - 9,917,256
Other assets 2,677,144 743,347 117,504 559,715 2,307 - 4,100,017
Total financial assets 4,637,235,016 465,551,702 716,429,617 561,328,687 48,498,458 43,586,533 6,472,630,013
Financial assets
Local currency - coins 488,198 - - - - 488,198
Foreign currency accounts and investments 19,082,343 490,232,443 841,281,192 534,829,640 91,658,752 1,977,084,370
Earmarked foreign currency balances 5,147,596 - - - - 5,147,596
Special Drawing Rights of the International Monetary Fund - - 67,656,236 - - 67,656,236
Reserve tranche with the International Monetary
Fund under quota arrangements - - 17,455 - - 17,455
Securities purchased under agreement to resell 1,533,574,159 - - - - 1,533,574,159
Current accounts of Governments 955,474 - - - - 955,474
Investments - local 2,147,418,594 - - - - 2,147,418,594
Loans, advances and bills of exchange 350,147,931 423,249 - - - 350,571,180
Assets held with the Reserve Bank of India - 1,362,034 - - - 1,362,034
Balances due from the Governments of India and
Bangladesh (former East Pakistan) - 9,214,881 - - - 9,214,881
Other assets 2,616,622 1,050,258 25,909 301,694 36,508 4,030,991
Total financial assets 4,059,430,917 502,282,865 908,980,792 535,131,334 91,695,260 6,097,521,168
Consolidated Financial Statements of SBP and its Subsidiaries
America Europe Australia Others Grand Total
Australia
---------------------------------------------------------------------------- (Rupees in '000) ----------------------------------------------------------------------------
2016
Asia (other
than
Pakistan)
America EuropePakistan
2017
---------------------------------------------------------------------------- (Rupees in '000) ----------------------------------------------------------------------------
Concentration risk arises when a number of counterparties are engaged in similar business activities or have similar economic features
that would cause their ability to meet contractual obligations to be similarly effected by changes in economic, political or other
conditions. The Group's significant concentrations arising from financial instruments at the balance sheet date without taking any
collateral held or other credit enhancements is shown below:
Grand Total
The geographical analyses is based on composition of financial assets in the specific continents other than for Pakistan which has been disclosed separately. All continents
having significant composition have been presented separately while the remaining have been clubbed under "Others".
Asia (other
than
Pakistan)
Pakistan
123

50.2.2 Industrial analysis
Financial assets
Cash and bank balances held by a subsidiary 6,496 - - 2,184,161 - 2,190,657
Local currency - coins 861,860 - - - - 861,860
Foreign currency accounts and investments 831,724,378 213,375,369 2,494,010 718,737,738 16,207,693 1,782,539,188
Earmarked foreign currency balances 10,319,532 - - - - 10,319,532
Special Drawing Rights of the International Monetary Fund
Monetary Fund - 63,657,319 - - - 63,657,319
Reserve tranche with the International Monetary
Fund under quota arrangements - 17,382 - - - 17,382
Securities purchased under agreement to resell - - - 1,533,373,313 - 1,533,373,313
Current accounts of Governments 7,279,247 - - - - 7,279,247
Investments - local 2,522,321,316 - 160,249,170 11,715,590 - 2,694,286,076
Loans, advances and bills of exchange 13,340,783 - 32,990,934 296,890,086 19,481,987 362,703,790
Assets held with the Reserve Bank of India 1,384,376 - - - - 1,384,376
Balances due from the Governments of India and
Bangladesh (former East Pakistan) 9,917,256 - - - - 9,917,256
Other assets 1,844,622 252,614 267,856 1,222,763 512,162 4,100,017
Total financial assets 3,398,999,866 277,302,684 196,001,970 2,564,123,651 36,201,842 6,472,630,013
Financial assets
Local currency - coins 488,198 - - - - 488,198
Foreign currency accounts and investments 936,159,121 178,478,743 1,087,680 848,890,453 12,468,373 1,977,084,370
Earmarked foreign currency balances 5,147,596 - - - - 5,147,596
Special Drawing Rights of the International Monetary Fund
Monetary Fund - 67,656,236 - - - 67,656,236
Reserve tranche with the International Monetary
Fund under quota arrangements - 17,455 - - - 17,455
Securities purchased under agreement to resell - - - 1,533,574,159 - 1,533,574,159
Current accounts of Governments 955,474 - - - - 955,474
Investments - local 2,050,957,242 - - 96,461,352 - 2,147,418,594
Loans, advances and bills of exchange 423,249 - 98,119,245 231,360,884 20,667,802 350,571,180
Assets held with the Reserve Bank of India 1,362,034 - - - - 1,362,034
Balances due from the Governments of India and - - - - -
Bangladesh (former East Pakistan) 9,214,881 - - - - 9,214,881
Other assets 1,237,025 111,047 - 1,896,310 786,609 4,030,991
Total financial assets 3,005,456,622 246,263,481 99,206,925 2,712,183,158 33,922,784 6,097,521,168
---------------------------------------------------------------------------- (Rupees in '000) ----------------------------------------------------------------------------
2017
---------------------------------------------------------------------------- (Rupees in '000) ----------------------------------------------------------------------------
Others Grand Total
Grand
Total
Sovereign SupranationalPublic Sector
Entities
State Bank of Pakistan Annual Report FY17
Banks &
Financial
Institutions
Sovereign SupranationalPublic Sector
Entities
Banks &
Financial
Institutions
Others
2016
124

50.3 Credit exposure by credit rating
Sovereign
(50.3.1) AAA AA A BBB
Lower than
BBBUnrated Grand Total
Financial assets
Cash and bank balances held by a subsidiary - - - 2,184,161 - - 6,496 2,190,657
Local currency - coins 861,860 - - - - - - 861,860
Foreign currency accounts and investments 2,818,137 327,909,180 790,607,846 646,085,502 12,836,602 - 2,281,921 1,782,539,188
Earmarked foreign currency balances 10,319,532 - - - - - - 10,319,532
Special Drawing Rights of the International
Monetary Fund - - - - - - 63,657,319 63,657,319
Reserve tranche with the International Monetary
Fund under quota arrangements - - - - - - 17,382 17,382
Securities purchased under agreement to resell - - - 1,532,117,992 - 1,255,321 - 1,533,373,313
Current accounts of Governments 7,279,247 - - - - - - 7,279,247
Investments - local 2,576,481,664 - - 6,207,070 - - 1,609,250 2,584,297,984
Loans, advances and bills of exchange 13,340,783 106,832,276 204,791,850 17,816,145 - 23,000 19,899,736 362,703,790
Assets held with the Reserve Bank of India - - - - 1,384,376 - - 1,384,376
Balances due from the Governments of India
and Bangladesh (former East Pakistan) - - - - 40,453 9,876,803 - 9,917,256
Other assets 1,844,622 280,764 224,919 889,481 21,250 - 838,981 4,100,017
Total financial assets 2,612,945,845 435,022,220 995,624,615 2,205,300,351 14,282,681 11,155,124 88,311,085 6,362,641,921
Sovereign
(50.3.1)
AAA AA A BBB Lower than
BBB
Unrated Grand Total
Financial assets
Local currency - coins 488,198 - - - - - - 488,198
Foreign currency accounts and investments - 340,043,611 950,304,290 655,800,370 11,179,378 19,075,404 681,317 1,977,084,370
Earmarked foreign currency balances 5,147,596 - - - - - - 5,147,596
Special Drawing Rights of the International
Monetary Fund - - - - - - 67,656,236 67,656,236
Reserve tranche with the International Monetary
Fund under quota arrangements - - - - - - 17,455 17,455
Securities purchased under agreement to resell - - - 1,532,762,001 - 812,158 - 1,533,574,159
Current accounts of Governments 955,474 - - - - - - 955,474
Investments - local 2,050,957,242 - - - - - - 2,050,957,242
Loans, advances and bills of exchange 75,846,587 81,063,739 146,636,085 24,650,228 955,253 40,489 21,378,799 350,571,180
Assets held with the Reserve Bank of India - - - - 1,362,034 - - 1,362,034
Balances due from the Governments of India
and Bangladesh (former East Pakistan) - - - - 40,453 9,174,428 - 9,214,881
Other assets 1,766,876 421,338 487,247 1,093,113 - - 262,383 4,030,957
Total financial assets 2,135,161,973 421,528,688 1,097,427,622 2,214,305,712 13,537,118 29,102,479 89,996,190 6,001,059,782
50.3.1
50.3.2 The collateral held as security against financial assets to cover the credit risk are disclosed in the respective notes.
50.4 Details of financial assets impaired and provision recorded there against:
2017 2016 2017 2016
-----------------------------(Rupees in '000)-------------------------
Available for sale investment - unlisted 2,431,758 2,431,758 856,863 856,863
Loans and advances - agriculture sector 18,587 18,587 18,587 18,587
Loans and advances - industrial sector 1,054,285 1,054,285 1,054,285 1,054,285
Loans and advances - others 15,128,995 15,128,995 4,275,563 4,275,563
Assets held with the Reserve Bank of India 1,384,376 1,362,034 1,384,376 1,362,034
Balances due from the Governments of India and Bangladesh [(former East Pakistan)
including loans recoverable from financial institutions operating in Bangladesh] 10,340,535 9,638,160 10,340,535 9,638,160
Gross Amount Impairment Provision
The credit quality of financial assets is managed by the Group using external credit ratings. The table below shows the credit quality by
class of assets for all financial assets that are neither past due nor impaired as at the reporting date and are exposed to credit risk, based on
the rating of external rating agencies. The Group uses lower of the credit rating of Moody's, Standard & Poor's and Fitch to categorise its
financial assets in foreign currency accounts and investments. For domestic financial assets, credit ratings of JCR-VIS and PACRA are
used.
2017
2016
---------------------------------------------------------------------------- (Rupees in '000) ----------------------------------------------------------------------------
---------------------------------------------------------------------------- (Rupees in '000) ----------------------------------------------------------------------------
Government securities and balances, pertaining to Pakistan are rated as sovereign. The international rating of Pakistan is B- (as per
Moodys).
Consolidated Financial Statements of SBP and its Subsidiaries
125

50.5 Liquidity analysis with interest / mark-up rate risk
50.5.1
Grand
Maturity Maturity Sub-total Maturity Maturity Sub-total Total
up to one after up to one after
year one year year one year
Financial assets
Non-derivatives assets:
Cash and bank balances held by a subsidiary 1,231,312 - 1,231,312 959,345 - 959,345 2,190,657
Local currency - coins - - - 861,860 - 861,860 861,860
Foreign currency accounts and investments 1,506,549,874 250,388,472 1,756,938,346 22,232,615 679,640 22,912,255 1,779,850,601
Earmarked foreign currency balances - - - 10,319,532 - 10,319,532 10,319,532
Special Drawing Rights of the International - - - -
Monetary Fund 63,657,319 - 63,657,319 - - - 63,657,319
Reserve tranche with the International Monetary - - - -
Fund under quota arrangements - - - 17,382 - 17,382 17,382
Securities purchased under agreement to resell 1,533,129,822 - 1,533,129,822 243,491 - 243,491 1,533,373,313
Current accounts of Governments* 7,575,105 - 7,575,105 (295,858) - (295,858) 7,279,247
Investments - local 2,475,250,955 56,900,348 2,532,151,303 151,935,151 10,199,622 162,134,773 2,694,286,076
Loans, advances and bills of exchange 244,351,283 83,664,077 328,015,360 18,150,023 16,538,407 34,688,430 362,703,790
Assets held with the Reserve Bank of India - - - 1,384,376 - 1,384,376 1,384,376
Balances due from the Governments of India
and Bangladesh (former East Pakistan) 9,056,879 - 9,056,879 860,377 - 860,377 9,917,256
Other assets - - - 3,593,850 1,091 3,594,941 3,594,941
5,840,802,549 390,952,897 6,231,755,446 210,262,144 27,418,760 237,680,904 6,469,436,350
Derivatives assets
Foreign currency accounts and investments - 44,081 44,081 2,644,506 - 2,644,506 2,688,587
Other assets - - - 505,076 - 505,076 505,076
- 44,081 44,081 3,149,582 - 3,149,582 3,193,663
Grand Total 5,840,802,549 390,996,978 6,231,799,527 213,411,726 27,418,760 240,830,486 6,472,630,013
Financial liabilities
Bank notes in circulation - - - 4,167,135,807 - 4,167,135,807 4,167,135,807
Bills payable - - - 630,547 - 630,547 630,547
Current accounts of the Government * 178,601,965 - 178,601,965 - - - 178,601,965
Payable to islamic banking institutions
against Bai Muajjal transactions 25,098,651 - 25,098,651 38,579 - 38,579 25,137,230
Payable under bilateral currency swaps agreements 154,669,000 - 154,669,000 881,410 - 881,410 155,550,410
Deposits of banks and financial institutions 96,686,622 - 96,686,622 572,650,917 - 572,650,917 669,337,539
Other deposits and accounts 85,599,474 - 85,599,474 79,065,600 - 79,065,600 164,665,074
Payable to International Monetary Fund 144,192,970 622,436,124 766,629,094 20,752,172 20,752,172 787,381,266
Other liabilities 5,160 11,674 16,834 31,344,852 - 31,344,852 31,361,686
684,853,842 622,447,798 1,307,301,640 4,872,499,884 - 4,872,499,884 6,179,801,524
Derivatives liabilities
Foreign currency accounts and investments - (103,955) (103,955) 906,473 3,102,311 4,008,784 3,904,829
684,853,842 622,343,843 1,307,197,685 4,873,406,357 3,102,311 4,876,508,668 6,183,706,353
On balance sheet gap (a) 5,155,948,707 (231,346,865) 4,924,601,842 (4,659,994,631) 24,316,449 (4,635,678,182) 288,923,660
Foreign currency forward and swap contracts - sale - - - (935,079,726) - (935,079,726) (935,079,726)
Foreign currency forward and swap contracts - purchase - - - 498,678,723 - 498,678,723 498,678,723
Futures - sale - - - (43,038,829) - (43,038,829) (43,038,829)
Futures - purchase - - - 35,430,566 - 35,430,566 35,430,566
Capital Commitment - - - (272,021) - (272,021) (272,021)
Off balance sheet gap - - - (444,281,287) - (444,281,287) (444,281,287)
Total yield / interest risk sensitivity gap 5,155,948,707 (231,346,865) 4,924,601,842 (4,215,713,344) 24,316,449 (4,191,396,895) 733,204,947
Cumulative yield / interest risk sensitivity gap 5,155,948,707 4,924,601,842 9,849,203,684 5,633,490,340 5,657,806,789 1,466,409,894 1,466,409,894
Contingent liabilities in respect of guarantees given - - - 3,382,264 20,608,998 23,991,262 23,991,262
(a) On-balance sheet gap represents the net amounts of on-balance sheet items.
*
---------------------------------------------------------------------------- (Rupees in '000) ----------------------------------------------------------------------------
The Group has the contractual right and intention to offset these balances against their respective non-interest bearing deposit balances. Mark-up on these balances is charged only when
these balances are in debit.
State Bank of Pakistan Annual Report FY17
Interest / mark-up rate risk is the risk that the value of a financial instrument will fluctuate due to changes in the market interest / mark-
up rates. The Group has adopted appropriate policies to minimise its exposure to this risk.
2017
Interest / mark-up bearing Non interest / mark-up bearing
126

Grand
Maturity Maturity Sub-total Maturity Maturity Sub-total Total
up to one after up to one after
year one year year one year
Financial assets
Non-derivatives assets:
Local currency - coins - - - 488,198 - 488,198 488,198
Foreign currency accounts and investments 1,623,513,653 348,154,813 1,971,668,466 8,639,389 681,344 9,320,733 1,980,989,199
Earmarked foreign currency balance - - - 5,147,596 - 5,147,596 5,147,596
Special Drawing Rights of International - - - -
Monetary Fund 67,656,236 - 67,656,236 - - - 67,656,236
Reserve tranche with the International Monetary - - - - -
Fund under quota arrangements - - - 17,455 - 17,455 17,455
Securities purchased under agreement to resell 1,533,280,018 - 1,533,280,018 294,141 - 294,141 1,533,574,159
Current accounts of Governments 2,955,474 - 2,955,474 (2,000,000) - (2,000,000) 955,474
Investments - local 2,017,734,979 2,740,000 2,020,474,979 126,943,615 - 126,943,615 2,147,418,594
Loans, advances and bills of exchange 297,930,617 30,364,651 328,295,268 4,433,931 17,841,981 22,275,912 350,571,180
Assets held with the Reserve Bank of India - - - 1,362,034 - 1,362,034 1,362,034
Balances due from the Governments of India
and Bangladesh (former East Pakistan) 8,354,504 - 8,354,504 860,377 - 860,377 9,214,881
Other assets - - - 2,586,543 1,951 2,588,494 2,588,494
5,551,425,481 381,259,464 5,932,684,945 148,773,279 18,525,276 167,298,555 6,099,983,500
Derivatives assets
Other assets - - - 1,442,497 - 1,442,497 1,442,497
Grand Total 5,551,425,481 381,259,464 5,932,684,945 150,215,776 18,525,276 168,741,052 6,101,425,997
Financial liabilities
Bank notes issued - - - 3,554,922,057 - 3,554,922,057 3,554,922,057
Bills payable - - - 598,142 - 598,142 598,142
Current accounts of the Government * - - - 606,657,778 - 606,657,778 606,657,778
Payable to islamic banking institutions -
against Bai Muajjal transactions 44,068,109 - 44,068,109 884,829 - 884,829 44,952,938
Payable under bilateral currency swaps agreements 157,812,000 - 157,812,000 695,631 - 695,631 158,507,631
Deposits of banks and financial institutions - - - 391,760,469 - 391,760,469 391,760,469
Other deposits and accounts 87,730,857 - 87,730,857 73,822,141 - 73,822,141 161,552,998
Payable to International Monetary Fund 144,554,785 633,076,488 777,631,273 - 1,108,232 1,108,232 778,739,505
Other liabilities - - - 20,791,527 - 20,791,527 20,791,527
434,165,751 633,076,488 1,067,242,239 4,650,132,574 1,108,232 4,651,240,806 5,718,483,045
Derivatives liabilities
Foreign currency accounts and investments - (103,955) (103,955) 906,473 3,102,311 4,008,784 3,904,829
434,165,751 632,972,533 1,067,138,284 4,651,039,047 4,210,543 4,655,249,590 5,722,387,874
On balance sheet gap (a) 5,117,259,730 (251,713,069) 4,865,546,661 (4,500,823,271) 14,314,733 (4,486,508,538) 379,038,123
Foreign currency forward and swap contracts - sale - - - (802,656,331) - (802,656,331) (802,656,331)
Foreign currency forward and swap contracts - purchase - - - 595,499,305 - 595,499,305 595,499,305
Futures - sale - - - (18,044,108) - (18,044,108) (18,044,108)
Futures - purchase - - - 14,656,485 - 14,656,485 14,656,485
Capital Commitment - - - (935,886) - (935,886) (935,886)
Off balance sheet gap - - - (211,480,535) - (211,480,535) (211,480,535)
Total yield / interest risk sensitivity gap 5,117,259,730 (251,713,069) 4,865,546,661 (4,289,342,736) 14,314,733 (4,275,028,003) 590,518,658
Cumulative yield / interest risk sensitivity gap 5,117,259,730 4,865,546,661 9,731,093,322 5,441,750,586 5,456,065,319 1,181,037,317 1,181,037,317
Contingent liabilities in respect of guarantees given - - - 4,022,903 25,070,092 29,092,995 29,092,995
(a) On-balance sheet gap represents the net amounts of on-balance sheet items.
*
50.5.2
50.6 Interest rate risk
50.6.1 Cash flow interest rate risk
2016
Interest / mark-up bearing Non interest / mark-up bearing
Consolidated Financial Statements of SBP and its Subsidiaries
The Group does not keep a sizable portion of its foreign currency accounts and investments in floating rate securities, therefore the profit
/ loss attributable to the Group's exposure to interest rate on its variable rate instruments is negligible.
If interest rates had been 10 basis points higher/ lower and all other variables were held constant, the Group's profit for the year ended
June 30, 2017 would increase / decrease by Rs. 806.82 (2016: Rs. 566 million). This is mainly attributable to the Group's exposure to
interest rates on its variable rate instruments.
Cash flow interest rate risk is the risk of loss arising from changes in variable interest rates. The sensitivity analysis below have been
determined based on the exposure to interest rates for floating rate assets and liabilities, the analysis is prepared assuming the amount of
average assets and liabilities outstanding at the balance sheet date was outstanding for the whole year.
The Group has the contractual right and intention to offset these balances against their respective non-interest bearing deposit balances. Mark-up on these balances is charged only when
these balances are in debit.
---------------------------------------------------------------------------- (Rupees in '000) ----------------------------------------------------------------------------
The effective interest / mark-up rate for the monetary financial assets and liabilities are mentioned in their respective notes to the
consolidated financial statements.
127

50.6.2 Fair value interest rate risk
50.7 Currency risk management
2017 2016
US Dollar 1,072,083,483 1,270,462,855
Pound Sterling (62,074,847) (78,830,048)
Chinese Yuan (87,260,316) (3,698,119)
Euro (224,807,106) (268,904,801)
Japanese Yen (55,935,160) (48,103,822)
United Arab Emirates Dirham 1,625,688 6,190,362
Australian Dollar (139,679) (92,021)
Canadian Dollar (19,128) 22,191
Others 35,014,019 152,216
678,486,954 877,198,813
50.8 Price Risk
State Bank of Pakistan Annual Report FY17
The Group also enters into forward foreign exchange contracts with the commercial banks and financial institutions to hedge against
the currency risk on foreign currency transactions.
The composition of the Group's financial instruments and the correlation thereof to different variables is expected to change over time.
Accordingly, the sensitivity analyses in note 50.6 and 50.7 to these consolidated financial statements prepared as of June 30, 2017 are
not necessarily indicative of the effects on the Group's profit and loss of future movements in different variables.
Price risk is the risk that the fair value or future cash flows of a financial instrument will fluctuate because of changes in market prices
(other than those arising from interest rate risk or currency risk) whether those changes are caused by factors specific to the individual
financial instrument or its issuer or factors affecting all similar financial instruments traded in the market.
-----------(Rupees in '000)---------
Net exposure in Special Drawing Rights (SDR) is allocated to its five basket currencies i.e. the US dollar, the Euro, the Chinese
renminbi, the Japanese yen and the British pound sterling in the ratio of their percentage allocated by IMF for SDR basket.
The sensitivity analyses calculates the effect of reasonably possible movement of the currency rate against Pak Rupee, with all other
variables held constant, on the consolidated profit and loss account and equity. If the Rupee had weakened / strengthened 1 percent
against the principal currencies to which the Group had significant exposure as at June 30, 2017 with all other variables constant profit
for the year would have been Rs. 6,748.87 million higher / lower (2016: Rs. 8,771.99 million). Net foreign currency exposure of the
Group is as follows:
Fair value interest rate risk is the risk that the value of a financial instrument will fluctuate because of changes in market interest rates.
The Group is exposed to fair value interest rate risk on its fixed income securities classified as 'financial assets at fair value through
profit or loss'. To manage its fair value interest rate risk arising from investments in these securities, the management adopts practices
mentioned in note 50.10 to these consolidated financial statements.
As at June 30, 2017, a 10 basis points shift in market value, mainly as a result of change in interest rates with all other variables held
constant, would result in consolidated profit for the year to increase by Rs. 1,562.32 million (2016: Rs. 1,897.5 million) or decrease by
Rs. 1,565.47 million (2017: Rs. 1,918.47 million) mainly as a result of an increase or decrease in the fair value of fixed rate financial
assets classified as financial asset at fair value through profit or loss.
Currency risk is the risk that the value of a financial instrument will fluctuate due to changes in foreign exchange rates. Foreign
currency activities result mainly from the Group's holding of foreign currency assets under its foreign reserves management function
and the overall level of these assets is determined based on the prevailing extent of credit and liquidity risks. In order to avoid losses
arising from adverse changes in the rates of exchange, the Group's compliance with the limits established for foreign currency positions
is being regularly monitored by the management.
The Group also holds from time to time, foreign currency assets and liabilities that arise from the implementation of domestic monetary
policies. Any foreign currency exposure relating to these implementation activities are hedged through the use of foreign currency
forwards, swaps and other transactions.
128

50.9 Liquidity risk management
50.10 Portfolio risk management
51. Fair Value of Financial Instruments
2017 2016 2017 2016
Financial assets
Cash and bank balances held by a subsidiary 2,190,657 - 2,190,657 -
Local currency - coins 861,860 488,198 861,860 488,198
Foreign currency accounts and investments 1,782,539,188 1,977,084,370 1,782,539,188 1,977,084,370
Earmarked foreign currency balances 10,319,532 5,147,596 10,319,532 5,147,596
Special Drawing Rights of the International Monetary Fund 63,657,319 67,656,236 63,657,319 67,656,236
Reserve tranche with the International Monetary Fund
under quota arrangements 17,382 17,455 17,382 17,455
Securities purchased under agreement to resell 1,533,373,313 1,533,574,159 1,533,373,313 1,533,574,159
Current accounts of Governments 7,279,247 955,474 7,279,247 955,474
Investments - local 2,694,286,076 2,147,418,594 2,694,286,076 2,147,419,039
Loans, advances and bills of exchange 362,703,790 350,571,180 362,703,790 350,571,180
Assets held with the Reserve Bank of India 1,384,376 1,362,034 1,384,376 1,362,034
Balances due from the Governments of India and
Bangladesh (former East Pakistan) 9,917,256 9,214,881 9,917,256 9,214,881
Other assets 4,100,017 4,030,957 4,100,017 4,030,957
Consolidated Financial Statements of SBP and its Subsidiaries
The Group is exposed to equity securities price risk because of investment in listed equity securities by the Group classified as available-
for-sale. These investments are held as per the specific directives of the Government of Pakistan in accordance with the provisions of the
State Bank of Pakistan Act, 1956 and other relevant statutes. Accordingly, price risk on listed equity securities can not be managed by
the Group.
In case of 5% increase or decrease in KSE 100 index on June 30, 2017, other comprehensive income would increase or decrease by Rs.
945.623 million (2016: Rs. 901.429 million) and equity of the Group would increase or decrease by the same amount as a result of gains
/ (losses) on equity securities classified as available-for-sale.
The analysis is based on the assumption that the equity index would increase or decrease by 5% with all other variables held constant
and all the Group’s equity instruments move according to the historical correlation with the index. This represents management's best
estimate of a reasonable possible shift in the KSE 100 index. The composition of the Group's investment portfolio and the correlation
thereof to the KSE index is expected to change over time. Accordingly, the sensitivity analysis prepared as of June 30, 2017 is not
necessarily indicative of the effect on the Group's equity of future movements in the level of KSE 100 index.
Liquidity risk is the risk that an entity will encounter difficulty in raising funds to meet commitments associated with the financial
instruments. In order to reduce the level of liquidity risk arising out of the local currency activities, the Group manages the daily liquidity
position of the banking system including advancing and withdrawal of funds from the system for smoothening out daily peaks and
troughs.
The risk arising out of the Group's obligations for foreign currency balances or deposits is managed through available reserves generated
mainly from borrowings and open market operations. The maturity profile of Group's financial assets and financial liabilities is given in
note 50.5.1.
The Group has appointed external managers to invest a part of the foreign exchange reserves in international fixed income securities. The
external managers are selected after conducting a thorough due diligence by the Group and externally hired investment consultants, and
appointed after the approval of the Board of Directors of the Bank. The mandates awarded to the managers require them to outperform
the benchmarks which are based on fixed income global aggregate indices. The benchmarks are customised to exclude certain securities,
currencies, and maturities to bring it to an acceptable level of risk and within the Group's approved risk appetite. Managers are provided
investment guidelines within which they have to generate excess returns over the benchmark. Safe custody of the portfolio is provided
through carefully selected global custodian who is independent of the portfolio managers. The custodian also provides valuation,
compliance, corporate actions and recovery, and other value added services which are typically provided by such custodian. The
valuations provided by the custodian are reconciled with the portfolio managers, and recorded accordingly.
Fair value is the amount for which an asset could be exchanged, or a liability settled, between knowledgeable, willing parties in an arm’s
length transaction, and is usually determined by the quoted market price. The following tables summarises the carrying amounts and fair
values of financial assets and liabilities.
Carrying Value Fair value
-----------------------------(Rupees in '000)-----------------------------
129

2017 2016 2017 2016
Financial Liability
Bank notes in circulation 4,167,135,807 3,554,922,057 4,167,135,807 3,554,922,057
Bills payable 630,547 598,142 630,547 598,142
Current accounts of Governments 178,601,965 606,657,778 178,601,965 606,657,778
Payable to Islamic Banking Institutions against Bai
Muajjal transactions 25,137,230 44,952,938 25,137,230 44,952,938
Payable under bilateral currency swap agreement 155,550,410 158,507,631 155,550,410 158,507,631
Deposits of banks and financial institutions 669,337,539 391,760,469 669,337,539 391,760,469
Other deposits and accounts 164,665,074 161,552,998 164,665,074 161,552,998
Payable to the International Monetary Fund 787,381,266 778,739,505 787,381,266 778,739,505
Other liabilities 31,361,686 20,791,527 31,361,686 20,791,527
51.1
- Quoted prices (unadjusted) in active markets for identical assets or liabilities (Level 1).
-
-
Level 1 Level 2 Level 3 Total
Recurring Fair Value Measurements
On balance sheet
Financial Assets
Foreign currency accounts and investments - held for trading 379,452,397 - - 379,452,397
Investments - local 96,016,146 - - 96,016,146
Non-Financial Assets
Operating fixed assets (Land and buildings) - - 108,243,493 108,243,493
Gold reserves held by the Bank 270,361,202 - - 270,361,202
745,829,745 - 108,243,493 854,073,238
Off balance sheet financial instruments
Foreign currency forward and swap contracts - sale - 935,079,726 - 935,079,726
Foreign currency forward and swap contracts - purchase - 498,678,723 - 498,678,723
Futures - sale 43,038,829 - - 43,038,829
Futures - purchase 35,430,566 - - 35,430,566
Non-Recurring Fair Value Measurements
On balance sheet
Financial Assets
Investments - local - 54,160,348 11,681,926 65,842,274
Level 1 Level 2 Level 3 Total
Recurring Fair Value Measurements
On balance sheet
Financial Assets
Foreign currency accounts and investments - held for trading 269,942,861 - - 269,942,861
Investments - local 92,487,082 - - 92,487,082
Non-Financial Assets
Operating fixed assets (Land and buildings) - 58,344,593 - 58,344,593
Gold reserves held by the Bank 327,189,933 - - 327,189,933
689,619,876 58,344,593 - 747,964,469
Off balance sheet
Foreign currency forward and swap contracts - sale - 802,656,331 - 802,656,331
Foreign currency forward and swap contracts - purchase - 595,499,305 - 595,499,305
Futures - sale 18,044,108 - - 18,044,108
Futures - purchase 14,656,485 - - 14,656,485
There were no transfers between levels 1 and 2 during the year.
Fair value
-----------------------------(Rupees in '000)-----------------------------
The table below analyses financial and non-financial assets carried at fair value, by valuation method. The different levels have been
defined as follows:
State Bank of Pakistan Annual Report FY17
2016
-----------------------------(Rupees in '000)-----------------------------
The Group's policy is to recognise transfers into and out of the different fair value hierarchy levels at the date the event or change in
circumstances that caused the transfer occurred.
-----------------------------(Rupees in '000)-----------------------------
Inputs other than quoted prices included within level 1 that are observable for the asset or liability, either directly (that is, as prices)
or indirectly (that is, derived from prices) (Level 2).
Inputs for the assets or liabilities that are not based on observable market data (i.e. unobservable inputs e.g. estimated future cash
flows) (Level 3).
2017
Carrying Value
130

(a) Financial assets in level 1
(b) Financial assets in level 2
(c) Financial assets in level 3
51.2 Valuation techniques used in determination of fair values within level 2 and level 3
Decrease in
assumption by
50 basis points
ZTBL
Preference
shares
7.94%
Discounted
Cash flow
Method
Risk free
discount rate for
a 10 year
Instrument
1,860,218
17.50% Risk adjusted
discount rate80,312
2.82%Disbursement
level(481,872)
15.85% Deposits growth (321,248)
14.66% Risk adjusted
discount rate16,364
8.00%Disbursement
level(4,298)
Consolidated Financial Statements of SBP and its Subsidiaries
Financial assets included in level 1 comprise of foreign currency investments, gold reserves, investments in listed shares and mutual
funds.
Financial assets included in level 2 comprise of preference shares of ZTBL and derivative finanacial instruments in respect of forward
foreign exchange contracts.
Certain categories of operating fixed assets (land and building) and unlisted equity shares of ZTBL and HBFCL are classified as level 3
assets.
Item Valuation approach and input used
Operating fixed assets (Land and
building)
Land and buildings are revalued to their fair values on a periodic basis by involving
professional valuers. The fair values of land and building are determined by physically
analysing the condition of land and building and in case of land by ascertaining the current
market value of similar land, which is selling in near vicinity. Moreover, for buildings, the
valuer has also considered prevailing current cost of construction for relevant type of civil
work carried out thereon, where ever required. The management considers the above
parameters used as the "highest and best use" and best evidence of fair value for its land and
building. Note 19.1 to these consolidated financial statements highlights the year of valuation
and external valuer name. The effect of changes in the unobservable inputs used in the
valuations cannot be determined with certainty. Accordingly, a qualitative disclosure of
sensitivity has not been presented in these consolidated financial statements.
Forward foreign exchange contracts The valuation has been determined by interpolating the mid rates announced by State Bank of
Pakistan.
HBFCL
Ordinary
Shares
Cash Flow to
Equity
(16,364)
13,678
ZTBL
Ordinary
Shares
Dividend
Discount
Model
(80,312)
1,646,396
1,084,212
Un-observable
Inputs
The finance department of the Bank includes a team which performed the valuations of
preference shares of ZTBL and ordinary shares of ZTBL and HBFCL acquired during the
year as more fully explained in notes 16.1.1 and 16.1.2 respectively to these consolidated
financial statements. The team reports to the Director Finance and is responsible for ensuring
that the final reported fair value figures are in accordance with IFRS.
Relationship of unobservable
inputs to fair value
Increase in
assumption by
50 basis points
(Rupees in '000)
(1,799,149)
Investment in unlisted preference and
ordinary shares
Description Range of InputsValuation
method
131

-
-
-
52. CLASSIFICATION OF FINANCIAL INSTRUMENTS
Loans and Assets at fair Held to Available for Total
receivables value through maturity sale
profit or loss
Financial assets
Cash and bank balances held by a subsidiary 2,190,657 - - - 2,190,657
Local currency - coins 861,860 - - - 861,860
Foreign currency accounts and investments 1,063,277,816 382,140,984 337,120,388 - 1,782,539,188
Earmarked foreign currency balances 10,319,532 - - - 10,319,532
Special Drawing Rights of the International Monetary Fund 63,657,319 - - - 63,657,319
Reserve tranche with the International Monetary Fund
under quota arrangements 17,382 - - - 17,382
Securities purchased under agreement to resell 1,533,373,313 - - - 1,533,373,313
Current accounts of Governments 7,279,247 - - - 7,279,247
Investments - local 2,527,764,268 1,582,086 54,924,466 110,015,256 2,694,286,076
Loans, advances and bills of exchange 362,703,790 - - - 362,703,790
Assets held with the Reserve Bank of India 1,384,376 - - - 1,384,376
Balances due from the Governments of India and
Bangladesh (former East Pakistan) 9,917,256 - - - 9,917,256
Other assets 3,594,941 505,076 - - 4,100,017
Loans and Assets at fair Held to Available for Total
receivables value through maturity sale
profit or loss
Financial assets
Local currency - coins 488,198 - - - 488,198
Foreign currency accounts and investments 1,472,496,928 266,038,032 238,549,410 - 1,977,084,370
Earmarked foreign currency balances 5,147,596 - - - 5,147,596
Special Drawing Rights of the International Monetary Fund 67,656,236 - - -
Reserve tranche with the International Monetary Fund -
under quota arrangements 17,455 - - - 17,455
Securities purchased under agreement to resell 1,533,574,159 - - - 1,533,574,159
Current accounts of Governments 955,474 - - - 955,474
Investments - local 2,050,313,403 - 643,839 96,461,352 2,147,418,594
Loans, advances and bills of exchange 350,571,180 - - - 350,571,180
Assets held with the Reserve Bank of India 1,362,034 - - - 1,362,034
Balances due from the Governments of India and
Bangladesh (former East Pakistan) 9,214,881 - - - 9,214,881
Other assets 2,588,460 1,442,497 - - 4,030,957
Item
2017
Valuation approach and input used
----------------------------------------------------------(Rupees in '000)----------------------------------------------------------
2016
----------------------------------------------------------(Rupees in '000)----------------------------------------------------------
State Bank of Pakistan Annual Report FY17
Deposits growth of the entities based on the historic trends of similar entities in the market.
The deposits growth is critical from the point of having sufficient cash flows to pay dividend.
The main level 3 inputs used by the Bank are derived and evaluated as follows:
Discount margin/spreads represent the discount rates used when calculating the present value
of future cash flows. In discounted cash flow models such spreads are added to the
benchmark rate when discounting the future expected cash flows. Hence, these spreads
reduce the net present value of an asset or increase the value of a liability. They generally
reflect the premium an investor expects to achieve over the benchmark interest rate to
compensate for the higher risk driven by the uncertainty of the cash flows caused by the
credit quality of the asset. They can be implied from market prices and are usually
unobservable for illiquid or complex instruments.
Discount rates used for cashflows in the Dividend Discount Method (DDM) which is based
on post-tax rate that reflects expected return on similar types of entities by the investors. This
also takes into account the risks being faced by similar types of entities.
Disbursement growth level on a year to year basis keeping in view the past trends of the
entities, general market conditions and market penetration.
132
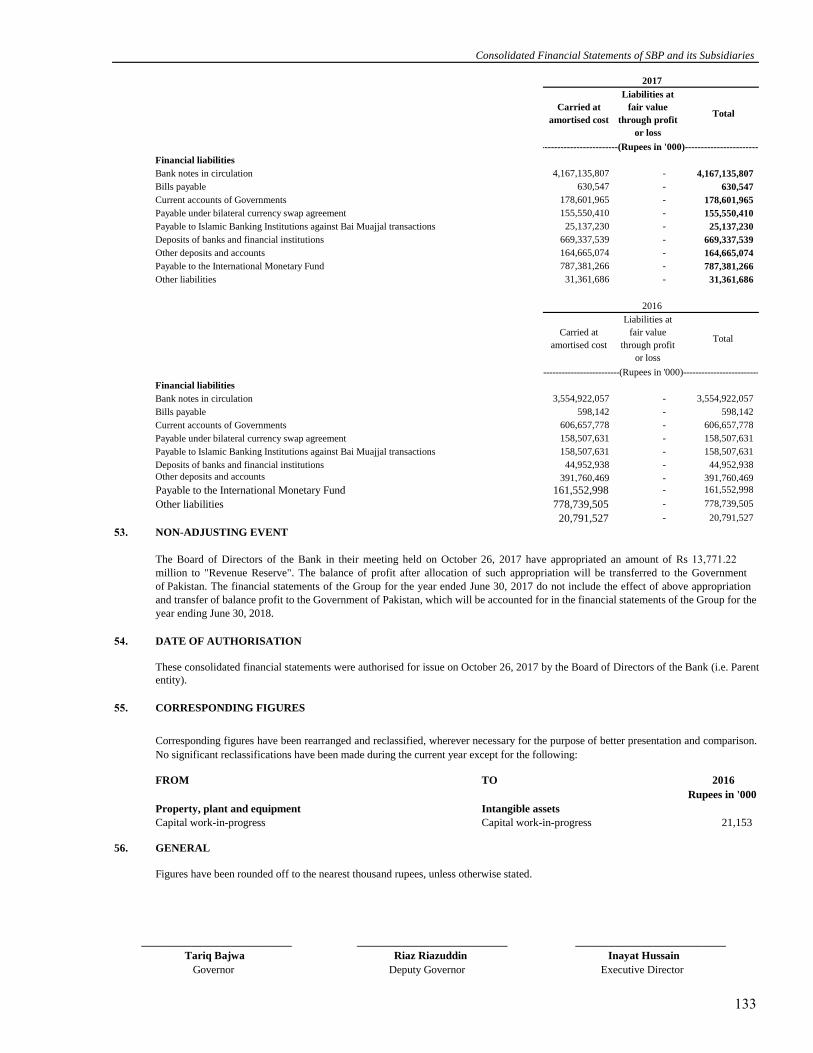
Financial liabilities
Bank notes in circulation 4,167,135,807 - 4,167,135,807
Bills payable 630,547 - 630,547
Current accounts of Governments 178,601,965 - 178,601,965
Payable under bilateral currency swap agreement 155,550,410 - 155,550,410
Payable to Islamic Banking Institutions against Bai Muajjal transactions 25,137,230 - 25,137,230
Deposits of banks and financial institutions 669,337,539 - 669,337,539
Other deposits and accounts 164,665,074 - 164,665,074
Payable to the International Monetary Fund 787,381,266 - 787,381,266
Other liabilities 31,361,686 - 31,361,686
Financial liabilities
Bank notes in circulation 3,554,922,057 - 3,554,922,057
Bills payable 598,142 - 598,142
Current accounts of Governments 606,657,778 - 606,657,778
Payable under bilateral currency swap agreement 158,507,631 - 158,507,631
Payable to Islamic Banking Institutions against Bai Muajjal transactions 158,507,631 - 158,507,631
Deposits of banks and financial institutions 44,952,938 - 44,952,938
Other deposits and accounts 391,760,469 - 391,760,469
Payable to the International Monetary Fund 161,552,998 - 161,552,998
Other liabilities 778,739,505 - 778,739,505
20,791,527 - 20,791,527
FROM TO 2016
Rupees in '000
Intangible assets
21,153
56. GENERAL
Figures have been rounded off to the nearest thousand rupees, unless otherwise stated.
___________________________ ___________________________ ___________________________
Tariq Bajwa Riaz Riazuddin Inayat Hussain
Governor Deputy Governor Executive Director
Consolidated Financial Statements of SBP and its Subsidiaries
----------------------------------------------------------(Rupees in '000)----------------------------------------------------------
----------------------------------------------------------(Rupees in '000)----------------------------------------------------------
2016
Carried at
amortised cost
Corresponding figures have been rearranged and reclassified, wherever necessary for the purpose of better presentation and comparison.
No significant reclassifications have been made during the current year except for the following:
Liabilities at
fair value
through profit
or loss
Total
Liabilities at
fair value
through profit
or loss
Carried at
amortised costTotal
Capital work-in-progress
2017
Property, plant and equipment
Capital work-in-progress
53. NON-ADJUSTING EVENT
The Board of Directors of the Bank in their meeting held on October 26, 2017 have appropriated an amount of Rs 13,771.22 million to "Revenue Reserve". The balance of profit after allocation of such appropriation will be transferred to the Government of Pakistan. The financial statements of the Group for the year ended June 30, 2017 do not include the effect of above appropriation and transfer of balance profit to the Government of Pakistan, which will be accounted for in the financial statements of the Group for the year ending June 30, 2018.
54. DATE OF AUTHORISATION
These consolidated financial statements were authorised for issue on October 26, 2017 by the Board of Directors of the Bank (i.e. Parent entity).
55. CORRESPONDING FIGURES
133

10 Unconsolidated Financial Statements of SBP
A. F. FERGUSON & CO.
Chartered Accountants
State Life Building No. 1-C
I. I. Chundrigar Road
P.O. Box 4716
Karachi-74000
EY FORD RHODES
Chartered Accountants
Progressive Plaza
Beaumont Road
P. O. Box 15541
Karachi-75530
Independent Auditor's Report
To the Board of Directors of State Bank of Pakistan
Opinion
We have audited the financial statements of the State Bank of Pakistan (the Bank), which comprise
the unconsolidated balance sheet as at June 30, 2017, and the unconsolidated profit and loss account,
unconsolidated statement of comprehensive income, unconsolidated statement of changes in equity
and unconsolidated statement of cash flows for the year then ended, and notes to the unconsolidated
financial statements, including a summary of significant accounting policies.
In our opinion, the accompanying unconsolidated financial statements give a true and fair view of the
financial position of the Bank as at June 30, 2017, and of its financial performance and its cash flows
for the year then ended in accordance with International Financial Reporting Standards (IFRSs).
Basis for Opinion
We conducted our audit in accordance with International Standards on Auditing (ISAs). Our
responsibilities under those standards are further described in the ‘Auditor’s Responsibilities for the
Audit of the Financial Statements’ section of our report. We are independent of the Bank in
accordance with the International Ethics Standards Board for Accountants’ Code of Ethics for
Professional Accountants as adopted by the Institute of Chartered Accountants of Pakistan (the Code),
and we have fulfilled our other ethical responsibilities in accordance with these requirements and the
Code. We believe that the audit evidence we have obtained is sufficient and appropriate to provide a
basis for our opinion.
Responsibilities of Management and Those Charged with Governance for the Financial
Statements
Management is responsible for the preparation and fair presentation of the financial statements in
accordance with IFRSs, and for such internal control as management determines is necessary to
enable the preparation of financial statements that are free from material misstatement, whether due to
fraud or error.
In preparing the financial statements, management is responsible for assessing the Bank’s ability to
continue as a going concern, disclosing, as applicable, matters related to going concern and using the
135

State Bank of Pakistan Annual Report FY17
A. F. FERGUSON & CO.
Chartered Accountants EY FORD RHODES
Chartered Accountants
going concern basis of accounting unless management either intends to liquidate the Bank or to cease
operations, or has no realistic alternative but to do so.
Those charged with governance are responsible for overseeing the Bank’s financial reporting process.
Auditor’s Responsibilities for the Audit of the Financial Statements
Our objectives are to obtain reasonable assurance about whether the financial statements as a whole
are free from material misstatement, whether due to fraud or error, and to issue an auditor’s report that
includes our opinion. Reasonable assurance is a high level of assurance, but is not a guarantee that an
audit conducted in accordance with ISAs will always detect a material misstatement when it exists.
Misstatements can arise from fraud or error and are considered material if, individually or in the
aggregate, they could reasonably be expected to influence the economic decisions of users taken on
the basis of these unconsolidated financial statements.
As part of an audit in accordance with ISAs, we exercise professional judgment and maintain
professional skepticism throughout the audit. We also:
Identify and assess the risks of material misstatement of the financial statements, whether due
to fraud or error, design and perform audit procedures responsive to those risks, and obtain
audit evidence that is sufficient and appropriate to provide a basis for our opinion. The risk of
not detecting a material misstatement resulting from fraud is higher than for one resulting
from error, as fraud may involve collusion, forgery, intentional omissions, misrepresentations,
or the override of internal control.
Obtain an understanding of internal control relevant to the audit in order to design audit
procedures that are appropriate in the circumstances, but not for the purpose of expressing an
opinion on the effectiveness of the Bank’s internal control.
Evaluate the appropriateness of accounting policies used and the reasonableness of
accounting estimates and related disclosures made by management.
Conclude on the appropriateness of management’s use of the going concern basis of
accounting and, based on the audit evidence obtained, whether a material uncertainty exists
related to events or conditions that may cast significant doubt on the Bank’s ability to
continue as a going concern. If we conclude that a material uncertainty exists, we are required
to draw attention in our auditor’s report to the related disclosures in the financial statements
or, if such disclosures are inadequate, to modify our opinion. Our conclusions are based on
the audit evidence obtained up to the date of our auditor’s report. However, future events or
conditions may cause the Bank to cease to continue as a going concern.
136

Unconsolidated Financial Statements of SBP
A. F. FERGUSON & CO.
Chartered Accountants
EY FORD RHODES
Chartered Accountants
Evaluate the overall presentation, structure and content of the financial statements, including
the disclosures, and whether the financial statements represent the underlying transactions and
events in a manner that achieves fair presentation.
We communicate with those charged with governance regarding, among other matters, the planned
scope and timing of the audit and significant audit findings, including any significant deficiencies in
internal control that we identify during our audit.
We also provide those charged with governance with a statement that we have complied with relevant
ethical requirements regarding independence, and to communicate with them all relationships and
other matters that may reasonably be thought to bear on our independence, and where applicable,
related safeguards.
A. F. Ferguson & Co.
Chartered Accountants Karachi
Salman Hussain
Audit Engagement Partner
Dated: October 27, 2017
EY Ford Rhodes
Chartered Accountants
Karachi
Omer Chughtai
Audit Engagement Partner
137

Note 2017 2016
ASSETS
Gold reserves held by the Bank 5 270,361,202 287,170,323
Local currency - coins 6 861,860 488,198
Foreign currency accounts and investments 7 1,782,539,188 1,977,084,370
Earmarked foreign currency balances 8 10,319,532 5,147,596
Special Drawing Rights of the International Monetary Fund 9 63,657,319 67,656,236
Reserve tranche with the International Monetary Fund
under quota arrangements 10 17,382 17,455
Securities purchased under agreement to resell 11 1,533,373,313 1,533,574,159
Current accounts of Governments 20.2 7,279,247 955,474
Investments - local 12 2,786,883,898 2,147,804,015
Loans, advances and bills of exchange 13 353,115,078 339,717,748
Assets held with the Reserve Bank of India 14 5,758,914 6,012,137
Balances due from the Governments of India and
Bangladesh (former East Pakistan) 15 9,917,256 9,214,881
Property, plant and equipment 16 58,041,805 59,549,539
Intangible assets 17 107,458 24,986
Other assets 18 4,324,654 4,129,946
Total assets 6,886,558,106 6,438,547,063
LIABILITIES
Bank notes in circulation 19 4,167,135,807 3,554,922,057
Bills payable 630,547 598,142
Current accounts of Governments 20.1 178,601,965 606,657,778
Current account with SBP Banking Services Corporation - a subsidiary 50,746,464 47,810,651
Current account with National Institute of Banking
and Finance (Guarantee) Limited - a subsidiary 135,612 22,818
Payable to Islamic Banking Institutions against Bai Muajjal transactions 21 25,137,230 44,952,938
Payable under bilateral currency swap agreement 22 155,550,410 158,507,631
Deposits of banks and financial institutions 23 669,337,539 391,760,469
Other deposits and accounts 24 164,027,283 161,460,194
Payable to the International Monetary Fund 25 787,381,266 778,739,505
Other liabilities 26 45,311,133 44,384,298
Deferred liability - unfunded staff retirement benefits 27 31,462,468 28,872,260
Total liabilities 6,275,457,724 5,818,688,741
Net assets 611,100,382 619,858,322
REPRESENTED BY
Share capital 28 100,000 100,000
Reserves 29 141,919,438 175,919,871
Unappropriated profit 43,957,846 3,620,167
Unrealised appreciation on gold reserves held by the Bank 30 266,327,601 283,342,601
Unrealised appreciation on remeasurement of investments - local 12.6 93,306,090 91,386,276
Surplus on revaluation of property, plant and equipment 65,489,407 65,489,407
Total equity 611,100,382 619,858,322
CONTINGENCIES AND COMMITMENTS 31
The annexed notes from 1 to 50 form an integral part of these unconsolidated financial statements.
____________________________ ____________________________ ____________________________
Tariq Bajwa Riaz Riazuddin Inayat Hussain
Governor Deputy Governor Executive Director
Pursuant to the requirements of section 26 (1) of SBP Act, 1956, the assets of the Bank specifically earmarked against the liabilities of the issue department have
been detailed in note 19.1 to these unconsolidated financial statements.
State Bank of Pakistan Annual Report FY17
STATE BANK OF PAKISTAN
UNCONSOLIDATED BALANCE SHEET
AS AT JUNE 30, 2017
--------------------(Rupees in '000)--------------------
138

Note 2017 2016
Discount, interest / mark-up and / or profit earned 32 260,827,528 252,789,943
Less: interest / mark-up expense 33 (21,368,844) (25,454,480)
239,458,684 227,335,463
Commission income 34 2,591,194 1,909,180
Exchange gain - net 35 24,569,614 25,779,375
Dividend income 12,248,843 12,226,343
Other operating income - net 36 599,968 2,756,112
Other income - net 37 270,878 129,166
279,739,181 270,135,639
Less: Operating expenses
- Bank notes printing charges 38 9,164,435 7,730,740
- Agency commission 39 9,679,298 8,968,647
- General administrative and other expenses 40 22,948,328 24,268,793
(Reversal of provision against) / Provision for / write-off:
- loans and advances 13.1 (6,266) -
- claims 26.3.2 - (232)
- other doubtful assets 26.3.1.1 16,842 (86,213)
- others (14,674) (7,338)
(4,098) (93,783)
41,787,963 40,874,397
Profit for the year 237,951,218 229,261,242
The annexed notes from 1 to 50 form an integral part of these unconsolidated financial statements.
____________________________ ____________________________ ____________________________
Tariq Bajwa Riaz Riazuddin Inayat Hussain
Governor Deputy Governor Executive Director
Unconsolidated Financial Statements of SBP
--------------------(Rupees in '000)------------------
STATE BANK OF PAKISTAN
UNCONSOLIDATED PROFIT AND LOSS ACCOUNT
FOR THE YEAR ENDED JUNE 30, 2017
139

Note 2017 2016
Profit for the year 237,951,218 229,261,242
Other comprehensive income
Items that will be reclassified to profit and loss when specific conditions are met:
Unrealised appreciation on remeasurement of investments - local 12.6 1,919,814 7,391,288
Unrealised (diminution) / appreciation on gold reserves held by the Bank 5 (17,015,000) 39,975,291
(15,095,186) 47,366,579
Items that will not be reclassified subsequently to the profit and loss account:
Remeasurements of staff retirement defined benefit plans - SBP 40.6.3.1 (2,130,727) (3,153,251)
Remeasurements of property, plant and equipment - SBP - 39,511,003
Remeasurements of staff retirement defined benefit plans allocated by - SBP
Banking Services Corporation - a subsidiary 40.6.3.1 (1,667,758) (12,173,824)
(3,798,485) 24,183,928
Total comprehensive income for the year 219,057,547 300,811,749
The annexed notes from 1 to 50 form an integral part of these unconsolidated financial statements.
____________________________ ____________________________ ____________________________
Tariq Bajwa Riaz Riazuddin Inayat Hussain
Governor Deputy Governor Executive Director
------ (Rupees in '000) -------
State Bank of Pakistan Annual Report FY17
UNCONSOLIDATED STATEMENT OF COMPREHENSIVE INCOME
FOR THE YEAR ENDED JUNE 30, 2017
STATE BANK OF PAKISTAN
140

STATE BANK OF PAKISTAN
UNCONSOLIDATED STATEMENT OF CHANGES IN EQUITY
FOR THE YEAR ENDED JUNE 30, 2017
Balance as at July 1, 2015 100,000 - 164,619,871 2,600,000 1,600,000 1,500,000 900,000 4,700,000 - 243,367,310 83,994,988 25,978,404 529,360,573
Total comprehensive income for the year
Profit for the year - - - - - - - - 229,261,242 - - - 229,261,242
Other comprehensive income -
Unrealised appreciation on remeasurement of investments - local (note 12.6) - - - - - - - - - - 7,391,288 - 7,391,288
Unrealised appreciation on gold reserves held by the Bank (note 5) - - - - - - - - - 39,975,291 - - 39,975,291
Remeasurements of staff retirement defined benefit plans - SBP - - - - - - - - (3,153,251) - - - (3,153,251)
Remeasurements of property, plant and equipment - SBP - - - - - - - - - - - 39,511,003 39,511,003
Remeasurements of staff retirement defined benefit plans allocated by - SBP
Banking Services Corporation - a subsidiary (note 40.6.3.1) - - - - - - - - (12,173,824) - - - (12,173,824)
- - - - - - - - 213,934,167 39,975,291 7,391,288 39,511,003 300,811,749
Transactions with owners
Dividend - - - - - - - - (10,000) - - - (10,000)
Profit transferred to the Government of Pakistan - - - - - - - - (210,304,000) - - - (210,304,000)
- - - - - - - - (210,314,000) - - - (210,314,000)
Balance as at June 30, 2016 100,000 - 164,619,871 2,600,000 1,600,000 1,500,000 900,000 4,700,000 3,620,167 283,342,601 91,386,276 65,489,407 619,858,322
Total comprehensive income for the year
Profit for the year - - - - - - - - 237,951,218 - - - 237,951,218
Transfer to the reserve fund - - 1,999,567 - - - - - (1,999,567) - - - -
Transfer from the reserve fund - 65,464,000 (65,464,000) - - - - - - - - - -
Other comprehensive income
Unrealised appreciation on remeasurement of investments - local (note 12.5) - - - - - - - - - - 1,919,814 - 1,919,814
Unrealised diminution on gold reserves held by the Bank (note 5) - - - - - - - - - (17,015,000) - - (17,015,000)
Remeasurements of staff retirement defined benefit plans - SBP - - - - - - - - (2,130,727) - - - (2,130,727)
Remeasurements of staff retirement defined benefit plans allocated by - SBP
Banking Services Corporation - a subsidiary (note 40.6.3.1) - - - - - - - - (1,667,758) - - - (1,667,758)
- 65,464,000 (63,464,433) - - - - - 232,153,166 (17,015,000) 1,919,814 - 219,057,547
Transactions with owners
Dividend - - - - - - - - (10,000) - - - (10,000)
Profit transferred to the Government of Pakistan - - (36,000,000) - - - - - (191,805,487) - - - (227,805,487)
- - (36,000,000) - - - - - (191,815,487) - - - (227,815,487)
Balance as at June 30, 2017 100,000 65,464,000 65,155,438 2,600,000 1,600,000 1,500,000 900,000 4,700,000 43,957,846 266,327,601 93,306,090 65,489,407 611,100,382
The annexed notes from 1 to 50 form an integral part of these unconsolidated financial statements.
________________________ ________________________ ________________________
Tariq Bajwa Riaz Riazuddin Inayat Hussain
Governor Deputy Governor Executive Director
-------------------------------------------------------Reserves--------------------------------------------------
Unconsolidated Financial Statements of SBP
The reserve for
acquisition of
PSPC
-------------------------------------------------------------------------------------------------------------------------(Rupees in '000)----------------------------------------------------------------------------------------------------------------------
Total
Reserve fundRural credit
fund
Industrial
credit fund
Loans
guarantee fund
Housing credit
fund
Share capital
Unrealised
appreciation /
(diminution) on
gold reserves held
by the Bank
Unrealised
appreciation on
remeasurement of
investments -
local
Surplus on
revaluation of
property, plant
and equipmentUnappropriated
profit / (loss)
Export credit
fund
141

Note 2017 2016
CASH FLOWS FROM OPERATING ACTIVITIES
Profit for the year after non-cash and other items 41 234,033,776 273,808,937
(Increase) / decrease in assets:
Foreign currency investments and placements (98,569,273) (72,996,950)
Reserve tranche with the International Monetary Fund under quota arrangements 73 (403)
Securities purchased under agreement to resell 200,846 (870,994,311)
Investments - local (472,577,454) 275,474,092
Loans, advances and bills of exchange (10,186,741) (1,217,700)
Assets held with the Reserve Bank of India and balances due from
Governments of India and Bangladesh (former East Pakistan) (724,717) (566,878)
Other assets (194,708) (137,870)
(582,051,974) (670,440,020)
(348,018,198) (396,631,083)
Increase / (decrease) in liabilities:
Bank notes issued - net 612,213,750 847,664,045
Bills payable 32,405 (44,979)
Current accounts of Governments (434,585,465) 214,686,114
Current account with SBP Banking Services Corporation - a subsidiary (69,554,900) (11,681,745)
Current account of National Institute of Banking and Finance (Guarantee)
Limited - a subsidiary 112,794 79,199
Payable to Islamic Banking Institutions against Bai Muajjal transactions (19,815,708) (144,966,183)
Payable under bilateral currency swap agreement (2,957,221) (6,360,259)
Deposits of banks and financial institutions 277,577,070 (21,473,576)
Payment of retirement benefits and employees' compensated absences (2,240,110) (2,774,862)
Other deposits and accounts 2,567,089 14,282,206
Other liabilities 2,472,152 4,987,837
365,821,856 894,397,797
Net cash generated from operating activities 17,803,658 497,766,714
CASH FLOWS FROM INVESTING ACTIVITIES
Dividend received 12,248,843 12,226,343
Capital expenditure (637,300) (901,270)
Proceeds from disposal of property, plant and equipment 26,895 13,712
Acquisition of Pakistan Security Printing Corporation (Private) Limited - a subsidiary (100,149,000) -
Net cash (used in) / generated from investing activities (88,510,562) 11,338,785
CASH FLOWS FROM FINANCING ACTIVITIES
Profit paid to the Government of Pakistan (227,805,487) (227,895,141)
Receipts from the International Monetary Fund 8,641,761 224,566,523
Dividend paid (10,000) (10,000)
Net cash used in financing activities (219,173,726) (3,338,618)
(Decrease) / increase in cash and cash equivalents during the year (289,880,630) 505,766,881
Cash and cash equivalents at the beginning of the year 1,811,145,674 1,350,924,757
Effect of exchange loss on cash and cash equivalents (1,687,144) (45,545,964)
Cash and cash equivalents at the end of the year 42 1,519,577,900 1,811,145,674
The annexed notes from 1 to 50 form an integral part of these unconsolidated financial statements.
____________________________ ____________________________ ____________________________
Tariq Bajwa Riaz Riazuddin Inayat Hussain
Governor Deputy Governor Executive Director
STATE BANK OF PAKISTAN
UNCONSOLIDATED STATEMENT OF CASH FLOWS
FOR THE YEAR ENDED JUNE 30, 2017
------(Rupees in '000)------
State Bank of Pakistan Annual Report FY17
142

NOTES TO AND FORMING PART OF THE UNCONSOLIDATED FINANCIAL STATEMENTS
FOR THE YEAR ENDED JUNE 30, 2017
1. STATUS AND NATURE OF OPERATIONS
1.1
- formulating and implementing the monetary policy;
- facilitating free competition and stability in the financial system;
- licensing and supervision of banks including micro finance banks, development financial institutions and exchange companies;
- organising and managing the inter-bank settlement system and promoting smooth functioning of payment systems;
- providing of loans and advances to the Governments, banks, financial institutions and local authorities under various facilities;
- purchasing, holding and selling of shares of banks and financial institutions on the directives of the Federal Government; and
- acting as a depository of the Government under specific arrangements between the Government and certain institutions.
1.2 The head office of the Bank is situated at I.I.Chundrigar Road, Karachi, in the province of Sindh, Pakistan.
1.3
The subsidiaries of the Bank and the nature of their respective activities are as follows:
a) SBP Banking Services Corporation - wholly owned subsidiary:
b)
The head office of the Institute is situated at Pitras Bukhari Road Islamabad, Pakistan.
c) Pakistan Security Printing Corporation (Private) Limited - wholly owned subsidiary:
The registered office and the factory are located at Jinnah Avenue, Malir Halt Karachi, in the province of Sindh, Pakistan.
d)
The share capital of the DPC is yet to be contributed by the State Bank of Pakistan.
2 STATEMENT OF COMPLIANCE
SBP Banking Services Corporation was established in Pakistan under the SBP Banking Services Corporation Ordinance, 2001 ("the
Ordinance") and commenced its operations with effect from January 2, 2002. It is responsible for carrying out certain statutory and
administrative functions and activities on behalf of the State Bank of Pakistan, as transferred or delegated by the Bank under the
provisions of the Ordinance.
The head office of the SBP Banking Services Corporation (BSC) is situated at I.I.Chundrigar Road, Karachi, in the province of
Sindh, Pakistan.
These unconsolidated financial statements have been prepared in accordance with the requirements of the International Financial
Reporting Standards (IFRSs) as issued by the International Accounting Standards Board (IASB).
Deposit Protection Corporation - non operational
National Institute of Banking and Finance (Guarantee) Limited ("the Institute") was incorporated in Pakistan under the repealed
Companies Ordinance, 1984 as a company limited by guarantee having share capital. It is engaged in providing education and
training in the field of banking, finance and allied areas.
National Institute of Banking and Finance (Guarantee) Limited - wholly owned subsidiary:
The DPC shall commence its operations after the composition of it's Board by the Federal Government. The head office of the DPC
as per the Act is to be situated in Karachi, in the province of Sindh, Pakistan.
Unconsolidated Financial Statements of SBP
STATE BANK OF PAKISTAN
State Bank of Pakistan ("the Bank") is the central bank of Pakistan and is incorporated under the State Bank of Pakistan Act, 1956. The
Bank is primarily responsible for monitoring of credit and foreign exchange, management of currency and also acts as the banker to the
Government. The activities of the Bank include:
These financial statements are unconsolidated (separate) financial statements of the Bank in which investments in subsidiaries are
carried at cost. The consolidated financial statements of the Bank and its subsidiaries are presented separately.
Deposit Protection Corporation ("the DPC") has been incorporated as a wholly owned subsidiary of SBP and is established under
the Deposit Protection Corporation Act 2016. It has been established for the protection of small depositors in order to ensure the
financial stability of and maintain public interest in, the financial system, and for matters connected therewith or ancillary thereto.
During the year the Bank acquired 100% share holding in Pakistan Security Printing Corporation (Private) Limited (“the PSPC”).
The effective date of the acquisition of the Corporation is June 14, 2017. The PSPC was incorporated in Pakistan under the repealed
Companies ordinance, 1984 (the Ordinance). The PSPC is principally engaged in the printing of currency notes and national prize
bonds.
143

3 BASIS OF MEASUREMENT
3.1
3.2
3.3 Use of estimates and judgments
3.3.1 Fair value of financial instruments
3.3.2 Effective Interest Rate (EIR) method
3.3.3 Impairment against loans and advances
3.3.4 Impairment of available-for-sale investments
3.3.5 Retirement benefits
The Bank determines that available-for-sale investments are impaired when there is a significant or prolonged decline in the fair value
below its cost. The determination of what is significant or prolonged requires judgment. In making this judgment, the Bank evaluates
among other factors, the normal volatility in security price. In addition, impairment may be appropriate when there is evidence of
deterioration in the financial health of the investee, industry and sector performance, changes in technology, and operational and
financing cash flows.
These unconsolidated financial statements have been prepared under the historical cost convention, except that gold reserves, certain
foreign currency accounts and investments, certain local investments and certain items of property as referred to in their respective notes
have been included at revalued amounts and certain staff retirement benefits and provision for employee's compensated absences have
been carried at present value of defined benefit obligations.
The unconsolidated financial statements ('the financial statements') are presented in Pakistani Rupees (PKR), which is the Bank's
functional and presentation currency.
The preparation of financial statements in conformity with IFRS requires management to make judgments, estimates and assumptions
that affect the application of policies and reported amounts of assets and liabilities that are not readily available from other sources. The
estimates and associated assumptions are based on historical experiences and various other factors that are believed to be reasonable
under the circumstances, the result of which form the basis of making judgments about the carrying values of assets and liabilities and
income and expenses. Actual results may differ from these estimates. The estimates and underlying assumptions are reviewed on an
ongoing basis.
Revisions to accounting estimates are recognised in the period in which the estimate is revised if the revision affects only that period, or
in the period of revision and future periods if the revision affects both current and future periods. Judgments made by the management
in the application of IFRS and estimates that have a significant risk of material adjustment to the carrying amounts of assets and
liabilities are as follows:
The key actuarial assumptions concerning the valuation of defined benefit plans and the sources of estimation are disclosed in note
40.6.1 to these unconsolidated financial statements.
The Bank reviews its loan portfolio to assess recoverability of loans and advances and impairment allowance required there against on a
continuous basis. While assessing this requirement, various factors including the delinquency in the account, financial position of the
borrower, quality of collateral and other relevant factors are considered. The amount of impairment may require adjustment in case
borrowers do not perform according to the expectations.
State Bank of Pakistan Annual Report FY17
The Bank’s EIR methodology recognises interest income using a rate of return that represents the best estimate of a constant rate of
return over the expected behavioural life of financial instruments. This, by nature, requires an element of estimation regarding the
expected behaviour and life-cycle of the instruments, as well as clubbing of and other determinable fee income / expense to the cost of
acquisition of financial instruments that are integral parts of the instrument.
The fair value of financial instruments is the price that would be received to sell an asset or paid to transfer a liability in an orderly
transaction in the principal (or most advantageous) market at the measurement date under current market conditions (i.e., an exit price)
regardless of whether that price is directly observable or estimated using another valuation technique. When the fair values of financial
assets and financial liabilities recorded in the statement of financial position cannot be derived from active markets, they are determined
using a variety of valuation techniques that include the use of valuation models. The inputs to these models are taken from observable
markets where possible, but where this is not feasible, estimation is required in establishing fair values. Judgements and estimates may
include items like considerations of liquidity and model inputs related to items such as credit risk (both own and counterparty), funding
value adjustments, correlation and volatility. For further details about determination of fair value please see Note 4.4 to these
unconsolidated financial statements.
144

3.3.6 Useful life and residual value of property, plant and equipment and intangible assets
3.4 New and amended standards and interpretations that are not yet effective:
Standards
-
-
- IFRS 16 ‘Leases’
-
Amendments
- Amendments to IAS 7 – ‘Statement of cash flows’ on disclosure initiative
-
-
- Amendment to IAS 40 - ‘Investment property’ relating to transfers of investment property
-
-
Interpretations
- IFRIC 22, 'Foreign currency transactions and advance consideration'
- IFRIC 23, 'Uncertainty over income tax treatments'
Improvements
-
-
-
January 1, 2018IFRS 15 ‘Revenue from contracts with customers’
The following standards, amendments and interpretations would be effective from the dates mentioned below against the respective
standard or interpretation:
Effective date (annual periods
beginning on or after)
Estimates of useful life and residual value of property, plant and equipment and intangibles are based on the management’s best
estimate.
January 1, 2017
Amendments to IFRS 10 – ‘Consolidated Financial Statements’ and IAS 28 – ‘Investments
in Associates and Joint Ventures’ regarding sale or contribution of assets between an investor
and its associate or joint venture
Date yet to be finalized
January 1, 2018
January 1, 2017
IFRS 17, ‘Insurance contracts’
Amendments to IFRS 2 - ‘Share based payments’ on clarifying how to account for certain
types of share-based payment transactions
Amendments to IFRS 4 - ‘Insurance contracts’ regarding the implementation of IFRS 9,
‘Financial instruments’
Amendment to IAS 12 – ‘Income taxes’ on recognition of deferred tax assets for unrealised
losses
IFRS 1, 'First-time adoption of IFRS’ , regarding the deletion of short-term exemptions for
first-time adopters regarding IFRS 7, IAS 19, and IFRS 10
IFRS 12, 'Disclosure of interests in other entities’ regarding clarification of the scope of the
standard.
IAS 28, 'Investments in associates and joint ventures’ regarding measuring an associate or
joint venture at fair value
January 1, 2018
January 1, 2018
January 1, 2017
January 1, 2018
January 1, 2019
Unconsolidated Financial Statements of SBP
January 1, 2021
January 1, 2018
January 1, 2018
January 1, 2018
IFRS 9 ‘Financial instruments’
January 1, 2019
Early adoption is permitted only if
IFRS 15 is adopted at the same time.
145

-
-
3.5
4 SIGNIFICANT ACCOUNTING POLICIES
4.1 Bank notes in circulation and local currency - coins
4.2 Financial assets and financial liabilities
All financial assets and financial liabilities are measured initially at their fair value plus transaction costs, except in the case of financial
assets and financial liabilities recorded at fair value through profit or loss where transaction cost is taken directly to the profit and loss
account. Any difference between the fair value of consideration given and the amount determined using the valuation techniques
detailed in note 4.4 is recognised in the profit and loss account.
New and amended standards, interpretations and amendments to published approved accounting standards that are effective
in the current year
There are certain new and amended standards and interpretations that are mandatory for the accounting period beginning on or after
July 1, 2016 but are considered not to be relevant or do not have any significant effect on the Bank's operations and are, therefore, not
disclosed in these unconsolidated financial statements.
IFRS 9, Financial Instruments (Hedge Accounting and amendments to IFRS 9, IFRS 7 and IAS 39) sets out the principles of
classification, measurement and derecognition of financial assets and financial liabilities, introduces new rules for hedge accounting
and a new impairment model for financial assets. The standard replaces IAS 39 'Financial Instruments: Recognition and
Measurement' except for the recognition requirements. The adoption of the standard introduces expanded disclosure requirements
and changes in presentation of the financial instruments which are expected to change the nature and extent of the Bank's disclosures
about its financial instruments particularly in the year of the adoption of the new standard. The standard is mandatorily effective for
periods beginning on or after January 1, 2018 with early adoption permitted (subject to local regulation requirements). The Bank
intends to adopt IFRS 9 on its mandatory date and the management is in the process of assessing the impacts of IFRS 9 on the
financial statements of the Bank.
IFRS 15, ‘Revenue from contracts with customers’ deals with revenue recognition and establishes principles for reporting useful
information to users of financial statements about the nature, amount, timing and uncertainty of revenue and cash flows arising from
an entity’s contracts with customers. Revenue is recognised when a customer obtains control of a good or service and thus has the
ability to direct the use and obtain the benefits from the good or service. The standard replaces IAS 18 ‘Revenue’ and IAS 11
‘Construction contracts’ and related interpretations. The standard is effective for annual periods beginning on or after January 1,
2018 and earlier application is permitted. The management is in the process of assessing the impact of IFRS 15 on the financial
statements of the Bank.
All financial assets are initially recognised on the trade date, i.e. the date at which Bank becomes a party to the contractual provisions of
the instruments. This includes purchases or sale of financial assets that require delivery of asset within the time frame generally
established by regulations in market conventions.
The Bank expects that the adoption of the above standards, amendments, interpretations and improvements will not have any material
impact on the Bank's financial statements in the period of initial application other than the initial application of IFRS 9, 'Financial
instruments' and IFRS 15, 'Revenue from contracts with customers' as described below:
The significant accounting policies applied in the preparation of these unconsolidated financial statements are set out below. These
policies have been consistently applied to all the years presented, unless otherwise stated.
The liability of the Bank towards bank notes issued as a legal tender under the State Bank of Pakistan Act, 1956, is stated at face value
and is represented by the specified assets of the Issue Department of the Bank as per the requirements stipulated in the State Bank of
Pakistan Act, 1956. The cost of printing of notes is charged to the profit and loss account as and when incurred. Any un-issued fresh
bank notes lying with the Bank and previously issued notes held by the Bank are not reflected in the balance sheet.
The Bank also issues coins of various denominations on behalf of the Government of Pakistan (GoP). These coins are purchased from
the GoP at their respective face values. The coins held by the Bank form part of the assets of the Issue Department.
State Bank of Pakistan Annual Report FY17
Financial instruments carried on the balance sheet include local currency - coins, foreign currency accounts and investments, earmarked
foreign currency balances, investments - local, loans, advances and bills of exchange, current account with SBP Banking Services
Corporation - a subsidiary, current account with National Institute of Banking and Finance (Guarantee) Limited - a subsidiary, assets
held with Reserve Bank of India (other than gold held by Reserve Bank of India), balances due from the governments of India and
Bangladesh, other assets, bank notes in circulation, bills payable, deposits of banks and financial institutions, balances and securities
under repurchase and reverse repurchase transactions, payable to Islamic Banking Institutions against Bai Muajjal transactions, current
accounts of Governments, balances with the International Monetary Fund (IMF), amount payable under bilateral currency swap
agreement, other deposits and accounts and other liabilities. The particular recognition and measurement methods adopted are disclosed
in the individual policy statements associated with each financial instrument.
146

4.2.1 Financial assets and financial liabilities at 'fair value through profit or loss'
4.2.2 Held to maturity investments
4.2.3 Loans and receivables
4.2.4 Available-for-sale financial assets
4.2.5 Financial liabilities at amortised cost
4.3 Derecognition of financial asset and financial liabilities
a) Financial assets
These are non-derivative financial assets with fixed or determinable payments that are not quoted in an active market. Subsequent to
initial recognition, these assets are carried at amortised cost less impairment losses, if any, and premiums and / or discounts are
accounted for using the effective interest method.
All loans and receivables are recognized when cash is advanced to borrowers. When a loan becomes uncollectible, it is written off
against the related provision for impairment. Subsequent recoveries are credited in the profit and loss account.
Financial liabilities with a fixed maturity are measured at amortised cost using the effective interest rate. These include deposits of
banks and financial institutions, other deposits and accounts, securities sold under agreement to repurchase, payable under bilateral
currency swap agreement, current accounts of Governments, current account with SBP- Banking Services Corporation, current account
with National Institute of Banking and Finance (Guarantee) Limited, payable to Islamic Banking Institutions against Bai Muajjal
transactions, payable to the IMF, bank notes in circulation, bills payable and other liabilities.
These are non-derivative financial assets with fixed or determinable payments and fixed maturity that the Bank has the positive intent
and ability to hold till maturity. After initial measurement, held-to-maturity investments are subsequently measured at amortised cost
using effective interest rate, less impairment losses, if any. Amortised cost is calculated by taking into account any discount or premium
on acquisition and fees that are integral part of the effective interest rate. The effective interest rate method is a method of calculating
the amortised cost of financial assets or financial liabilities and of allocating the interest income or interest expense over the relevant
period in the profit and loss account. The losses arising from impairment of such investments are recognised in the profit and loss
account.
These are the non derivative financial assets which are either designated in this category or which do not fall in any of the other
categories. Subsequent to initial recognition, these securities are measured at fair value, except investments in those securities the fair
value of which cannot be determined reliably and are stated at cost. Gain or loss on changes in fair value is taken to and kept in equity
until the investments are sold or disposed off, or until the investments are determined to be impaired. At that time, cumulative gain or
loss previously recognised in equity is re-classified to the profit and loss account.
The Bank derecognises a financial asset when the contractual rights to receive the cash flows from the financial asset expires, or it
transfers the rights to receive the contractual cash flows in a transaction in which substantially all the risks and rewards of
ownership of the financial asset are transferred or in which the Bank neither transfers nor retains substantially all the risks and
rewards of ownership and it does not retain control of the financial asset.
The management determines the appropriate classification of its financial instruments at the time of initial recognition in the following
categories:
On derecognition of a financial asset, the difference between the carrying amount of the asset (or the carrying amount allocated to
the portion of the asset transferred), and the sum of (i) the consideration previously received (including any new asset obtained less
any new liability assumed) and (ii) any cumulative gain or loss that had been previously recognised in other comprehensive income,
is recognised in the profit and loss account.
These assets and liabilities are either acquired / assumed for generating a profit from short term fluctuations in market price, interest
rate movements, dealer’s margin or securities included in a portfolio in which a pattern of short term profit making exists. These are
initially recognised at fair value and transaction costs associated with the instrument are taken directly to the profit and loss account.
These instruments are subsequently re-measured at fair value. All related realised and unrealised gains and losses are recognised in the
profit and loss account directly. Derivatives are also categorised as financial assets and financial liabilities at 'fair value through profit
or loss'.
Unconsolidated Financial Statements of SBP
147

b) Financial liabilities
4.4 Fair value measurement principles
4.5 Impairment of financial assets
a) Financial assets carried at amortised cost
b) Available-for-sale financial assets
4.6 Offsetting of financial assets and financial liabilities
4.7 Derivative financial instruments
If there is objective evidence that an impairment loss has been incurred, the amount of the loss is measured as the difference between
the asset's carrying value and the present value of estimated future cash flows discounted at the financial asset's original effective
interest rate. The carrying value of the assets is reduced through the use of an allowance account and the amount of the loss is
recognised in the profit and loss account. If in a subsequent year the amount of the estimated impairment loss increases or decreases
because of an event occurring after the impairment was recognised, the previously recognised impairment loss is increased or
reduced by adjusting the allowance account. If in a subsequent period the amount of impairment loss decreases and the decrease can
be linked objectively to an event occurring after the write down, the write down or allowance is reversed through the profit and loss
account.
The Bank assesses at each balance sheet date whether there is any objective evidence that a financial asset or a group of financial assets
is impaired. A financial asset or a group of financial assets is deemed to be impaired if there is an objective evidence of impairment as a
result of one or more events that has occurred after the initial recognition of the assets (an incurred 'loss event') and that loss event (or
events) has an impact on estimated future cash flows, of the financial asset or a group of financial assets that can be reliably estimated.
Evidence of impairment may include indication that the borrower or group of borrowers is experiencing significant financial difficulty,
the probability that they will enter bankruptcy or other financial reorganisation, default or delinquency in interest or principal payment
and where observable data indicates that there is measurable decrease in the estimated future cash flows, such as changes in arrears or
economic conditions that correlate with defaults, if any.
A financial asset and a financial liability are offset and the net amount is reported in the financial statements when the Bank has a
legally enforceable right to set off the recognised amount and it intends either to settle on a net basis or to realise the asset and to settle
the liability simultaneously.
For financial assets carried at amortised cost, the Bank first assesses whether objective evidence of impairment exists for financial
assets that are individually significant, or collectively for financial assets that are not individually significant. If the Bank determines
that no objective evidence of impairment exists for individually assessed financial assets, it includes the assets in a group of
financial assets with similar credit risk characteristics and collectively assesses them for impairment. Assets that are individually
assessed for impairment and for which an impairment loss is, or continues to be, recognised are not included in the collective
assessment of impairment.
A financial liability is derecognised when the obligation under the liability is discharged or cancelled or expired. Where an existing
financial liability is replaced by another from the same lender on substantially different terms, or the terms of an existing liability are
substantially modified, such an exchange or modification is treated as a derecognition of the original liability and the recognition of
new liability, and the difference in the respective carrying amount is recognised in the profit and loss account.
The Bank uses derivative financial instruments which include forwards, futures and swaps. Derivatives are initially recorded at fair
value and are re-measured to fair value on subsequent reporting dates. Forwards, futures and swaps are shown under commitments in
note 31.2. The resultant gains or losses from derivatives are included in the profit and loss account.
For available-for-sale financial assets, the Bank assesses at each balance sheet date whether there is an objective evidence that an
investment is impaired. In case of equity investment classified as available-for-sale, significant or prolonged decline in the fair value
of the security below its cost is considered in determining whether the assets are impaired. If any such evidence exist for available-
for-sale financial assets, the cumulative loss measured as the difference between the acquisition cost and the current fair value, less
any impairment loss on that financial asset previously recognised in profit and loss account, is reclassified from other comprehensive
income and recognised in the profit and loss account. Impairment losses recognised in the profit and loss account on equity
instruments are not reversed through the income statement till the time the investments are sold or disposed off.
State Bank of Pakistan Annual Report FY17
The fair value of financial instruments traded in active markets at the balance sheet date is based on their quoted market prices or dealer
price quotation without any deduction for transaction costs. If there is no active market for a financial asset, the Bank establishes fair
value using valuation techniques. These include the use of recent arms length transaction, discounted cash flow analysis and other
revaluation techniques commonly used by market participants. Investments in securities of which the fair value cannot be determined
reliably are carried at cost.
148

4.8 Collateralised borrowings / lending
4.8.1 Reverse repurchase and repurchase agreements
4.8.2 Payable under bilateral currency swap agreement
4.9 Payable to Islamic Banking Institutions against Bai Muajjal transactions
4.10 Gold reserves held by the Bank
4.11 Property, plant and equipment
Depreciation on additions is charged to the profit and loss account from the month in which the asset is available for use while no
depreciation is charged in the month in which the assets are deleted / disposed off. Normal repairs and maintenance are charged to the
profit and loss account as and when incurred. Major renewals and improvements are capitalised and the assets so replaced, if any, are
retired. Gains and losses on disposal of fixed assets are included in the profit and loss account.
Estimates of useful life and residual value of property, plant and equipment are based on the management's best estimate. The assets'
residual value, depreciation method and useful life are reviewed, and adjusted, if appropriate, at each balance sheet date.
Depreciation on property, plant and equipment is charged to the profit and loss account using the straight-line method whereby the cost
/ revalued amount of an asset is written off over its estimated useful life at the rates specified in note 16.1 to these unconsolidated
financial statements. The useful life of assets is reviewed and adjusted, if appropriate, at each balance sheet date.
Gold is recorded at the cost, which is the prevailing market rate, at initial recognition. Subsequent to initial measurement, it is revalued
at the closing market rate fixed by the London Bullion Market Association on the last working day of the year which is also the
requirement of State Bank of Pakistan Act, 1956 and State Bank of Pakistan General Regulation No.42(vi). Appreciation or diminution,
if any, on revaluation is taken to equity under the head “unrealised appreciation on gold reserves held by the Bank”. Appreciation /
diminution realised on disposal of gold is taken to the profit and loss account. Unrealised appreciation / diminution on gold reserves
held with the Reserve Bank of India is not recognised in the statement of changes in equity pending transfer of these assets to the Bank
subject to final settlement between the Governments of Pakistan and India. Instead it is shown in other liabilities as provision for other
doubtful assets.
The Bank purchases Government of Pakistan (GoP) Ijara sukuks on deferred payment basis (Bai Muajjal) from Islamic Banks. The
deferred price is agreed at the time of purchase and such proceeds are paid to the Islamic Banks at the end of the agreed period. The
difference between the fair value and deferred price represents financing cost and is recognised in profit and loss account on a time
proportion basis as "mark-up expense". Amount payable to Islamic Banking Institutions under deferred payment basis on purchase of
sukuks is reported at transaction value plus profit payable thereon (i.e. at amortised cost).
Bilateral currency swap agreements with counterpart central banks involve the purchase / sale and subsequent resale / repurchase of
local currencies of counterpart central banks against PKR at the applicable exchange rate (determined in accordance with the terms of
the agreement). The actual use of facility by the Bank / counterpart central bank in the agreement is recorded as borrowing / lending in
books of the Bank and interest is charged / earned at agreed rates to the profit and loss account on a time proportion basis from the date
of actual use. Any unutilised limit of the counterpart's drawing is reported as commitments in notes 22 and 31.2.6.
Securities sold subject to a commitment to repurchase them at a pre-determined price, are retained on the balance sheet and a liability is
recorded in respect of the consideration received as “Securities sold under agreement to repurchase”. Conversely, securities purchased
under analogous commitment to resell are not recognized on the balance sheet and an asset is recorded in respect of the consideration
paid as “Securities purchased under agreement to resell”. The difference between the sale and repurchase price in the repurchase
transaction and the purchase price and resell price in reverse repurchase transaction represents expense and income respectively, and is
recognised in the profit and loss account on time proportion basis. Both repurchase and reverse repurchase transactions are reported at
transaction value inclusive of any accrued expense / income.
Increase in carrying amount arising on revaluation of land and buildings is recognised in other comprehensive income and credited to
surplus on revaluation of property, plant and equipment. Decreases that offset previous increases of the same assets are charged against
surplus on revaluation of property, plant and equipment in equity, while all other decreases are charged to the profit and loss account.
The surplus on revaluation realised on sale of property, plant and equipment is transferred to un-appropriated profit to the extent
reflected in the surplus on revaluation of property, plant and equipment account. The amount of sale proceeds exceeding the balance in
surplus on revaluation of property, plant and equipment account is taken to the profit and loss account.
Property, plant and equipment except land, buildings and capital work-in-progress (CWIP) are stated at cost less accumulated
depreciation and accumulated impairment losses, if any. Freehold land is stated at revalued amount. Leasehold land and buildings are
stated at revalued amount less accumulated depreciation and accumulated impairment losses, if any. CWIP is stated at cost less
accumulated impairment losses, if any and consists of expenditure incurred and advances made in respect of fixed assets in the course
of their acquisition, construction and installation. CWIP assets are capitalised to relevant asset category as and when work is completed.
Unconsolidated Financial Statements of SBP
149

4.12 Intangibles
Intangible assets are carried at cost less accumulated amortisation and accumulated impairment losses, if any.
4.13 Impairment of non-financial assets
4.14 Compensated absences
4.15 Staff retirement benefits
The Bank operates:
a)
b)
c) following are other staff retirement benefit schemes:
-
-
-
- an unfunded benevolent fund scheme;
- an unfunded post retirement medical benefit scheme; and
- six months post retirement benefit facility.
The above staff retirement benefits are vested on completion of prescribed qualifying period of service.
4.16 Deferred income
an unfunded contributory provident fund (old scheme) for those employees who joined the Bank prior to 1975 and opted to remain
under the old scheme. Under this scheme, contribution is made both by the Bank and employee at the rate of 6% of the monetized
salary. The Bank provided an option to employees covered under old scheme to join the funded Employer Contributory Provident
Fund Scheme - ECPF (new scheme) effective from June 1, 2007. Under this scheme, contribution is made both by the Bank and
employee at the rate of 6% of the monetized salary. Moreover, employees joining the Bank service after June 1, 2007 are covered
under the new scheme.
Obligations for contributions to defined contribution provident fund plans are recognised as an expense in the profit and loss account as
and when incurred.
Intangible assets are amortised using straight-line method over the period of three years. Where the carrying amount of an asset exceeds
its estimated recoverable amount, it is written down immediately to its recoverable amount.
an unfunded pension scheme for those employees who joined the Bank after 1975 and before the introduction of EGF which is
effective from June 1, 2007;
an unfunded gratuity scheme (old scheme) for all employees other than those who opted for the new general provident fund
scheme, or joined the Bank after 1975 and are entitled only to pension scheme benefits;
a funded Employees Gratuity Fund (EGF) was introduced by the Bank effective from June 1, 2007 for all its employees other
than those who opted for pension scheme or unfunded gratuity scheme (old scheme);
The Bank makes annual provision in respect of liability for employees’ compensated absences based on actuarial estimates. The liability
is estimated using the Projected Unit Credit Method.
an unfunded General Provident Fund (GPF) scheme for all those employees who joined the Bank after 1975 and those employees
who had joined prior to 1975 but opted for this scheme. Under this scheme contribution is made by the employee only at the rate of
5% of the monetized salary.
Annual provisions are made by the Bank to cover the obligations arising under defined benefit schemes based on actuarial
recommendations. The actuarial valuations are carried out under the "Projected Unit Credit Method". The most recent valuation in this
regard was carried out as at June 30, 2017. The amount arising as a result of remeasurements are recognised in the balance sheet
immediately, with a charge or credit to other comprehensive income in the period in which they occur.
State Bank of Pakistan Annual Report FY17
The carrying amounts of the Bank’s assets are reviewed at each balance sheet date to determine whether there is any indication of
impairment of any asset or a group of assets. If such indication exists, the recoverable amount of such assets is estimated. The
recoverable amount is higher of an asset's fair value less cost to sell and value in use. In assessing the value in use, future cash flows are
estimated which are discounted to present value using a discount rate that reflects the current market assessments of the time value of
money and the risk specific to the asset. In determining fair value less cost to sell, an appropriate valuation model is used. An
impairment loss is recognised in the profit and loss account whenever the carrying amount of an asset or a group of assets exceeds its
recoverable amount. Impairment loss on revalued assets is adjusted against the related revaluation surplus to the extent that the
impairment loss does not exceed the surplus on revaluation of that asset.
Grants received on account of capital expenditure are recorded as deferred income. These are amortised over the useful life of the
relevant asset.
150

4.17 Revenue recognition
-
- Commission income is recognised when related services are rendered.
- Dividend income is recognised when the Bank’s right to receive the dividend is established.
- Gains / losses on disposal of securities are recognised in the profit and loss account at the trade date.
- All other revenues are recognised on a time proportion basis.
4.18 Finances under profit and loss sharing arrangements
4.19 Taxation
4.20 Foreign currency translation
4.21 Transactions and balances with the International Monetary Fund
-
-
-
-
- charges on borrowings under credit schemes and fund facilities;
- charges on net cumulative allocation of SDRs;
- exchange gain or loss: and
- return on holdings of SDRs.
4.22 Provisions
All other income or charges pertaining to balances with the IMF are taken to the profit and loss account, including the following:
the cumulative allocation of Special Drawing Rights (SDRs) by the IMF is recorded as a liability and is translated at closing
exchange rate for SDRs prevailing at the balance sheet date. Exchange differences on translation of SDRs is recognised in the profit
and loss account.
service charge is recognised in the profit and loss account at the time of receipt of the IMF tranches.
Exchange gains and losses are taken to the profit and loss account except for certain exchange differences on balances with the
International Monetary Fund, referred to in note 4.21, which are transferred to the Government of Pakistan account.
Discount, interest / mark-up and / or profit earned on loans and advances and investments are recorded on time proportion basis that
takes into account the effective yield on the asset. However, income on balances with Bangladesh (former East Pakistan), doubtful
loans and advances and overdue return on investments are recognised as income on receipt basis.
The Bank provides various finances to financial institutions under profit and loss sharing arrangements. Share of profit / loss under
these arrangements is recognised on an accrual basis.
Exchange differences arising under Exchange Risk Coverage Scheme and on currency swap transactions are recognised in the profit
and loss account on an accrual basis.
the Government’s contribution for quota with the IMF is recorded by the Bank as depository of the Government. Exchange
differences arising on these balances are transferred to the Government of Pakistan account.
The income of the Bank is exempt from tax under section 49 of the State Bank of Pakistan Act, 1956 and clause 66(xx) of Part I of
second schedule to the Income Tax Ordinance, 2001.
Transactions denominated in foreign currencies are translated to Pak Rupees at the foreign exchange rate prevailing at the date of
transaction. Monetary assets and liabilities in foreign currencies are translated into rupees at the closing rate of exchange prevailing at
the balance sheet date.
Unconsolidated Financial Statements of SBP
Commitments for outstanding foreign exchange forward, future and swap contracts disclosed in note 31.2 to these unconsolidated
financial statements are translated at forward rates applicable to their respective maturities. Contingent liabilities / commitments for
letters of credit and letters of guarantee denominated in foreign currencies are expressed in PKR terms at the closing rate of exchange
prevailing at the balance sheet date.
Transactions and balances with the International Monetary Fund (IMF) are recorded on following basis:
Provisions are recognised when the Bank has a present legal or constructive obligation as a result of past events, it is probable that an
outflow of economic resources will be required to settle the obligation and a reliable estimate of the amount can be made. Provisions are
reviewed at each balance sheet date and are adjusted to reflect the current best estimates.
exchange gains or losses arising on revaluation of borrowings from the IMF are recognised in the profit and loss account.
151

4.23 Cash and Cash Equivalents
Note 2017 2016
5 GOLD RESERVES HELD BY THE BANK
Opening balance 2,074,032 287,170,323 247,150,713
Additions during the year 1,602 205,879 44,319
(Diminution) / appreciation for the year due to revaluation 30 (17,015,000) 39,975,291
19.1 2,075,634 270,361,202 287,170,323
Note 2017 2016
6 LOCAL CURRENCY - COINS
Coins held as an asset of the Issue Department 6.1 & 19.1 861,860 488,198
6.1
7
These essentially represent foreign currency reserves held by the Bank, the details of which are as follows:
Note 2017 2016
At fair value through profit or loss - held-for-trading:
- Investments 7.1 379,452,397 269,942,861
- Unrealised gain / (loss) on derivative financial instruments - net 7.2 2,688,587 (3,904,829)
Held to maturity investment 7.3 337,120,388 238,549,410
Loans and receivables
- Deposit accounts 7.1 90,760,872 26,378,414
- Current accounts 20,926,003 6,689,560
- Securities purchased under agreement to resell 7.4 178,482,457 569,237,084
- Money market placements 7.5 773,108,484 870,191,870
1,782,539,188 1,977,084,370
The above foreign currency accounts and investments are held as follows:
Issue Department 19.1 1,495,115,694 1,237,112,270
Banking Department 287,423,494 739,972,100
1,782,539,188 1,977,084,370
7.1
7.2
7.3
7.4
7.5 These represents money market placements carrying interest in USD ranging from 0.85% to 1.52% per annum (2016: 0.40% to 0.85%
per annum) and GBP ranging from 0.10 % to 0.20% per annum (2016: 0.33% per annum) and having maturities from July 03, 2017 to
September 22, 2017 (2016: from July 04, 2016 to September 30, 2016).
This represents investments made (by the Bank) in foreign sukuks, investments made in international markets and balances maintained
(on behalf of the Bank) through reputable Fund Managers. The activities of the Fund Managers are being monitored through a
custodian. Furthermore, the foreign sukuks purchased by the Bank are also held with the custodian. The market value of the investments
and carrying amount of deposit accounts as on June 30, 2017 cumulatively amounts to USD 4,103.57 million (2016: USD 3,331.83
million).
--------------------(Rupees in '000)--------------------
FOREIGN CURRENCY ACCOUNTS AND INVESTMENTS
This represents unrealised gain / (loss) on foreign currency swaps, futures and forward contracts (including transactions executed by the
Fund Managers on behalf of the Bank) entered into with various counterparties.
As mentioned in note 4.1, the Bank is responsible for issuing coins of various denominations on behalf of the Government. This balance
represents the face value of coins held by the Bank at the year end (also refer note 19.1).
-------- (Rupees in '000) --------------
State Bank of Pakistan Annual Report FY17
--------------------(Rupees in '000)--------------------
Cash and cash equivalents include foreign currency accounts and investments (other than held to maturity investments), local currency
coins, earmarked foreign currency balances, SDRs, balances in the current and deposit accounts and securities that are realisable in
known amounts of cash within three months from the date of original investments and which are subject to insignificant changes in
value.
Net content in
troy ounces
This represents investment in sovereign bonds of foreign countries carrying yield ranging from 0.82 % to 4.11 % per annum and having
maturities from July 06, 2017 to September 24, 2018 (2016: 0.19% to 3.45% per annum and having maturities from July 07, 2016 to
May 05, 2017).
These represent lending under repurchase agreements and carry mark-up in USD ranging from 0.02 % to 1.16 % per annum (2016:
0.40% to 0.48% per annum) and GBP at 0.33% per annum (2016: 0.26% per annum) and these are due to mature on July 03, 2017
(2016: July 01, 2016).
152

8 EARMARKED FOREIGN CURRENCY BALANCES
These represent foreign currency cash balances held by the Bank to meet foreign currency commitments of the Bank.
9 SPECIAL DRAWING RIGHTS OF THE INTERNATIONAL MONETARY FUND
Note 2017 2016
SDRs are held as follows:
- By the Issue Department 19.1 51,051,350 51,179,450
- By the Banking Department 12,605,969 16,476,786
63,657,319 67,656,236
10 RESERVE TRANCHE WITH THE INTERNATIONAL
MONETARY FUND UNDER QUOTA ARRANGEMENTS
Quota allocated by the International Monetary Fund 296,398,560 297,633,877
Liability under quota arrangements (296,381,178) (297,616,422)
17,382 17,455
11 SECURITIES PURCHASED UNDER AGREEMENT TO RESELL
12 INVESTMENTS - LOCAL Note 2017 2016
Loans and receivables
Government securities
Market Related Treasury Bills (MRTBs) 2,518,817,198 2,047,573,403
Federal Government scrips 2,740,000 2,740,000
12.1 2,521,557,198 2,050,313,403
Held to maturity
Investments in banks and other financial institutions
Preference shares - unlisted 12.2 54,160,348 -
Available-for-sale investments
Investments in banks and other financial institutions
Ordinary shares
- Listed 94,406,896 92,487,082
- Unlisted 16,319,632 4,712,706
12.3 110,726,528 97,199,788
Term Finance Certificates 84,722 84,722
Certificates of Deposits 33,705 33,705
110,844,955 97,318,215
Provision against diminution in value of investments 12.4 (856,863) (856,863)
109,988,092 96,461,352
Investments in wholly owned subsidiaries - at cost
Pakistan Security Printing Corporation (Private) Limited 12.5 100,149,000 -
SBP Banking Services Corporation 1,000,000 1,000,000
National Institute of Banking and Finance (Guarantee) Limited 29,260 29,260
101,178,260 1,029,260
2,786,883,898 2,147,804,015
The above investments are held as follows:
Issue Department - MRTBs 19.1 2,344,098,193 1,973,105,293
Banking Department 442,785,705 174,698,722
2,786,883,898 2,147,804,015
---------- (Rupees in '000) ---------
Special Drawing Rights (SDRs) are the foreign reserve assets which are allocated by the International Monetary Fund (IMF) to its
member countries in proportion to their quota in the IMF. In addition, the member countries can purchase the SDRs from the IMF and
other member countries in order to settle their obligations. The figures given below represent the rupee value of the SDRs held by the
Bank as at June 30, 2017. Interest is credited by the IMF on the SDR holding of the Bank at weekly interest rates on daily products of
SDRs held during each quarter.
-------- (Rupees in '000) -----------
This represents collateralised lendings made to various financial institutions under repurchase arrangement carrying mark-up ranging
from 5.77% to 6.25% per annum (2016: 5.77% to 6.25% per annum) and are due to mature from July 4, 2017 to July 7, 2017 (2016:
July 4, 2016 to July 11, 2016). The fair value of securities collateralised as on June 30, 2017 amounts to Rs. 1,534,782 million (2016:
Rs. 1,535,800 million). The collaterals held by the Bank consist of Pakistan Investment Bonds and Market Treasury Bills.
Unconsolidated Financial Statements of SBP
153

12.1 These represent investments guaranteed / issued by the Government. The profile of return on securities is as follows:
2017 2016
Market Related Treasury Bills 5.90 to 6.01 5.89 to 6.24
Federal Government scrips 3 3
12.2
12.3 Investments in shares of banks and other financial institutions
Note 2017 2016 2017 2016
Listed
- National Bank of Pakistan 12.3.2 75.20 75.20 94,406,896 92,487,082
Unlisted
- Zarai Taraqiati Bank Limited 12.3.3 76.23 - 10,199,622 -
- House Building Finance Company Limited 12.3.4 90.31 37.50 1,482,304 75,000
Unlisted - at cost
Other investments with holding less than or equal to 50% 4,637,706 4,637,706
16,319,632 4,712,706
110,726,528 97,199,788
12.3.1
12.3.2
12.3.3
12.3.4
2017 2016
12.4 Provision against diminution in value of investments
Opening balance 856,863 856,863
Charge / (reversal) during the year - -
Closing balance 856,863 856,863
12.5
State Bank of Pakistan Annual Report FY17
During the year, the Bank acquired 100% share holding in Pakistan Security Printing Corporation (Private) Limited from Federal
Government for a total consideration of Rs. 100,149 million. This was approved by the Board of Directors of the Bank in their meeting
held on May 31, 2017.
MRTBs are created for a period of six months while Federal Government Scrips are of perpetual nature.
(% per annum)
--------------- (Rupees in '000) --------------
Cost of the Bank's investment in the shares of National Bank of Pakistan at June 30, 2017 amounted to Rs. 1,100.8 million (2016: Rs.
1,100.8 million).
% of holding --------------- (Rupees in '000) --------------
Investments in above entities have been made under the specific directives of the Government of Pakistan in accordance with the
provisions of the State Bank of Pakistan Act, 1956 and other relevant statutes. The Bank neither exercises significant influence nor has
control over these entities except for any regulatory purposes or control arising as a consequence of any statute which applies to the
entire sector to which these entities belong. Accordingly, these entities have not been consolidated as subsidiaries or accounted for as
investments in associates or joint ventures.
This represents 5,446.153 million preference shares of Rs. 10 each carring mark-up at the rate of 7.5 percent per annum payable semi-
annually, issued by Zarai Taraqiati Bank Limited against conversion of outstanding loan of Rs. 54,461.536 million as more fully
explained in note 13.2.1 to these unconsolidated financial statements. These preference shares are redeemable on completion of 10 years
in one bullet payment on March 7, 2027. These preference shares have been recognised at fair value upon initial recognition / receipt.
This represents 4,015.599 million ordinary shares issued by ZTBL during the year against conversion of suspended mark-up on loans of
Rs. 40,156 million as more fully explained in note 13.1.1 to these unconsolidated financial statements. These ordinary shares have been
recognised at fair value upon initial recognition / receipt.
This represents 1,636.4 million ordinary shares issued by HBFCL during the year against conversion of principal and suspended mark-
up on loans of Rs. 16,364 million as more fully explained in note 13.1.2 to these unconsolidated financial statements. These ordinary
shares have been recognised at fair value upon initial recognition / receipt.
154

Note 2017 2016
12.6 Unrealised appreciation on remeasurement of investments - local
Opening balance 91,386,276 83,994,988
Appreciation for the year 1,919,814 7,391,288
Closing balance 93,306,090 91,386,276
13 LOANS, ADVANCES AND BILLS OF EXCHANGE
Government owned / controlled financial institutions 13.2 47,796,089 102,794,207
Private sector financial institutions 13.3 297,555,950 232,449,996
345,352,039 335,244,203
Employees 9,893,275 9,814,370
355,245,314 345,058,573
Provision against doubtful balances (2,130,236) (5,340,825)
353,115,078 339,717,748
13.1 Provision against doubtful assets
Opening balance 5,340,825 5,340,825
Reversal during the year on:
- issuance of preference shares of Zarai Taraqiati Bank Limited 13.2.1 (3,204,323) -
- cash recovery (6,266) -
Closing balance 2,130,236 5,340,825
13.2 Loans and advances to Government owned / controlled financial institutions
2017 2016 2017 2016 2017 2016
Agricultural sector (13.2.1) 439,900 50,767,526 - - 439,900 50,767,526
Industrial sector (13.2.1 &13.2.3) 8,063,316 4,821,191 - - 8,063,316 4,821,191
Export sector (13.3.1 ) 25,554,323 19,020,317 3,567 3,567 25,557,890 19,023,884
Housing sector (13.2.2) - - - 11,242,300 - 11,242,300
Others (13.2.1, 13.2.3 &13.2.4) 13,734,983 16,939,306 - - 13,734,983 16,939,306
47,792,522 91,548,340 3,567 11,245,867 47,796,089 102,794,207
13.2.1
a)
b)
c) The principal of the preference shares and return thereon shall be guaranteed by the Federal Government.
d)
The mark-up on preference shares shall be payable half yearly on June 30th and December 31st each year and shall be the
contractual obligation of ZTBL.
Mark-up on the existing debt shall be accrued upto December 31, 2015 as per existing arrangements leading to increase in
accrued mark-up amount from Rs. 35,029 million as on June 30, 2014 to Rs. 40,156 million as on December 31, 2015. The
accrued mark-up of Rs. 40,156 million as on December 31, 2015 will be converted into ordinary shares of ZTBL.
A tripartite meeting was held on July 11, 2014 between Ministry of Finance (MoF), ZTBL and the Bank ( the parties ) wherein it was
decided that the total outstanding amount of Rs. 89,490 million, including suspended mark-up of Rs. 35,029 million will be converted
to an equity investment of the Bank in ZTBL. The conversion plan was re-negotiated between all the parties in a tripartite meeting held
on November 16, 2015. The MoF approved the re-negotiated conversion plan on April 4, 2016 as detailed below:
The Bank’s principal debt amount of Rs. 54,461 million outstanding against ZTBL as on December 31, 2015 will be converted
into redeemable preference shares carrying a profit of 7.5% per annum, redeemable in 10 years in one bullet payment on
December 31, 2025.
------------------------------------------- (Rupees in '000) -------------------------------------------
As at June 30, 2016 the exposure to the agricultural and industrial sectors included Rs. 50,174.09 million and Rs. 1,083.12 million
respectively, representing the cumulative Government guaranteed financing of Rs. 51,257.21 million to Zarai Taraqiati Bank Limited
(ZTBL) in addition to the unsecured subordinated loan to ZTBL amounting to Rs. 3,204 million classified in other loans and advances.
The entire exposure had been overdue since 2002.
--------------- (Rupees in '000) --------------
Scheduled banks Other financial institutions Total
Unconsolidated Financial Statements of SBP
155

13.2.2
13.2.3
13.2.4
13.3 Loans and advances to private sector financial institutions
2017 2016 2017 2016 2017 2016
Agricultural sector 744,204 947,390 420,901 151,398 1,165,105 1,098,788
Industrial sector 72,186,912 38,550,364 8,892,963 4,923,344 81,079,875 43,473,708
Export sector (13.3.1) 212,825,188 185,597,057 - - 212,825,188 185,597,057
Others (13.3.2) 2,485,782 2,280,443 - - 2,485,782 2,280,443
288,242,086 227,375,254 9,313,864 5,074,742 297,555,950 232,449,996
13.3.1
13.3.2
13.4 The interest / mark-up rate profile of the interest / mark-up bearing loans and advances is as follows:
2017 2016
Government owned / controlled and private sector financial institutions 0 to 9.75 0 to 9.75
Employees loans (where applicable) 0 to 10 0 to 10
State Bank of Pakistan Annual Report FY17
During the current year, the Ministry of Finance (MoF) vide its letter no. F.No.1(3) IF-II/2016-1122 dated January 09, 2017 approved
the conversion of credit lines of Rs. 11,242 million along with the outstanding suspended mark-up of Rs. 5,122 million (net of Rs 1,378
million in respect of share of loss payable under profit and loss sharing arrangement- refer note 26) into ordinary shares of the HBFCL
effective from December 31, 2016. As a result of conversion of outstanding loan amount into ordinary shares the entire exposure
(representing principal amount) amounting to Rs. 11,242 million has been derecognised. The ordinary shares received have been
recognised at their fair value as disclosed in note 12.3 to these unconsolidated financial statements. Further, the share of loss amounting
to Rs 1,378 million payable in respect of profit and loss sharing arrangements by the Bank to HBFCL has been written back and taken
to income as disclosed in note 36.1 to these unconsolidated financial statements. The net loss amounting to Rs. 8,457 arising on this
arrangement is reflected in note 36.1 to these unconsolidated financial statements.
The re-negotiated conversion plan was subject to completion of all legal and statutory formalities and the fair value exercise of the
entity. During the current year, 5,446.15 million redeemable preference shares equivalent to Rs. 54,461 million carrying profit of 7.5
percent per annum payable half yearly were issued. These preference shares are redeemable in 10 years in one bullet payment on March
7, 2027. As a result of conversion of outstanding loan amount into preference shares, the provision amounting to Rs. 3,204 million held
against unsecured sub-ordinated loan to ZTBL has been reversed and the entire principal exposure against ZTBL amounting to Rs.
54,461 million (representing loan amount) has been derecognised. The preference shares received have been recognised at their fair
value as disclosed in note 12.2 to these unconsolidated financial statements. In addition, ZTBL has also issued 4,015.6 million ordinary
shares having face value of Rs. 10 each in lieu of mark-up which has been suspended by the Bank in prior years aggregating to Rs.
40,156 million. These shares have been recognised at their fair value (using expected dividend discount method) aggregating to Rs.
10,200 million as disclosed in note 12.3 and the related gain arising due to reversal of suspended mark-up is reflected in note 36.1 to
these unconsolidated financial statements.
(% per annum)
In the year 2015, the Bank in continuation of a scheme of amalgamation of two commercial banks duly sanctioned by the Federal
Government under Section 47 of the Banking Companies Ordinance 1962 and under Section 17 of the State Bank of Pakistan Act
1956, extended a 10-year financing facility of Rs.5,000 million with a bullet payment of markup and principal at maturity to an Islamic
Commercial Bank (ICB) which is secured against Government of Pakistan Ijara Sukuk. The 10-year facility was provided on the basis
of Mudaraba to be remunerated at profit sharing ratio declared by the ICB on its remunerative current accounts on monthly basis (the
last declared rate in this respect is 0.01% per annum). In accordance with the requirements of accounting framework of the Bank the 10-
year financing facility had been recognized at fair value on initial recognition. The amortized cost as of June 30, 2017 is Rs. 2,465
million (2016: Rs. 2,255 million). The principal amount (Rs. 5,000 million) of the facility along with the profit will be recovered at its
respective maturity.
This represented loan receivable from House Building Finance Company Limited (HBFCL) against seven credit lines on profit and loss
sharing basis amounting to Rs. 11,242 million. All of these credit lines were overdue since 2006. These credit lines were secured by
guarantee from the Federal Government.
Export sector loans of scheduled banks are fully secured against demand promissory notes.
These balances include Rs. 417.7 million (2016: Rs. 423 million) which are recoverable from various financial institutions operating in
Bangladesh (former East Pakistan). The realisability of these balances is subject to final settlement between the Governments of
Pakistan and Bangladesh (former East Pakistan).
This includes exposure to the Industrial Development Bank Limited (IDBL) under Locally Manufactured Machinery (LMM) credit line
amounting to Rs. 1,054 million (2016: Rs. 1,054 million). Furthermore, loans and advances also include loans amounting to Rs. 13,000
million and Rs. 340.78 million (2016: Rs. 13,000 million and Rs. 340.78 million) to IDBL which are secured by the Government
guarantee and other Government securities respectively. The Federal Government vide its vesting order dated November 13, 2012 had
transferred and vested all assets and liabilities of IDBP into the IDBL with effect from November 13, 2012. The Cabinet Committee on
Privatisation, in its meeting held on May 07, 2016 approved the inclusion of IDBL in the 'Privatisation Program For Early
Implementation'.
Scheduled banks Other financial institutions Total
------------------------------------------- (Rupees in '000) -------------------------------------------
156

Note 2017 2016
14 ASSETS HELD WITH THE RESERVE BANK OF INDIA
Gold reserves
- Opening balance 4,650,103 4,002,690
- (Diminution) / appreciation for the year due to revaluation 26.3.1.1 (275,565) 647,413
4,374,538 4,650,103
Sterling securities 450,221 467,390
Government of India securities 231,832 222,024
Rupee coins 4,769 4,576
14.1 5,061,360 5,344,093
Indian notes representing assets receivable from the Reserve Bank of India 14.2 697,554 668,044
19.1 5,758,914 6,012,137
14.1
14.2
Note 2017 2016
15 BALANCES DUE FROM THE GOVERNMENTS OF INDIA
AND BANGLADESH (FORMER EAST PAKISTAN)
India
Advance against printing of notes 39,616 39,616
Receivable from the Reserve Bank of India 837 837
40,453 40,453
Bangladesh (former East Pakistan)
Inter office balances 819,924 819,924
Loans, advances and commercial papers 15.1 9,056,879 8,354,504
9,876,803 9,174,428
15.2 9,917,256 9,214,881
15.1
15.2
Note 2017 2016
16 PROPERTY, PLANT AND EQUIPMENT
Operating fixed assets 16.1 57,587,578 59,129,090
Capital work-in-progress 16.4 454,227 420,449
58,041,805 59,549,539
Unconsolidated Financial Statements of SBP
--------------- (Rupees in '000) --------------
--------------- (Rupees in '000) --------------
--------------- (Rupees in '000) --------------
These represent interest bearing loans and advances (including commercial papers) provided to the Government of Bangladesh (former
East Pakistan).
The realisability of the above balances is subject to final settlement between the Government of Pakistan and Government of
Bangladesh (former East Pakistan) and India (also refer notes 26.1 and 26.3.1).
These assets were allocated to the Government of Pakistan as its share of the assets of the Reserve Bank of India under the provisions of
Pakistan (Monetary System and Reserve Bank) Order, 1947. The transfer of these assets to the Bank is subject to final settlement
between the Governments of Pakistan and India (also refer note 26.3.1).
These represent Pak Rupee equivalent of Indian rupee notes which were in circulation in Pakistan until retirement from circulation
under the Pakistan (Monetary System and Reserve Bank) Order, 1947. Realisability of these assets is subject to final settlement between
the Governments of Pakistan and India (also refer note 26.3.1).
157
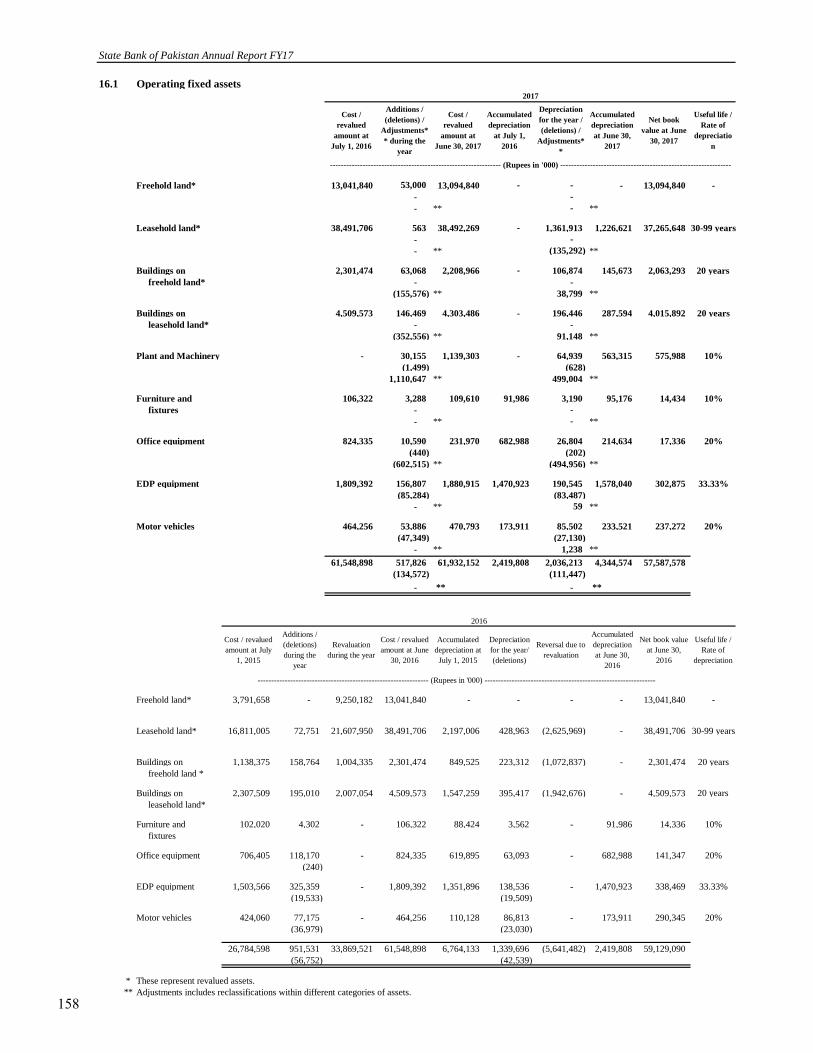
16.1 Operating fixed assets
Freehold land* 13,041,840 53,000 13,094,840 - - - 13,094,840 -
- -
- ** - **
Leasehold land* 38,491,706 563 38,492,269 - 1,361,913 1,226,621 37,265,648 30-99 years
- -
- ** (135,292) **
Buildings on 2,301,474 63,068 2,208,966 - 106,874 145,673 2,063,293 20 years
freehold land* - -
(155,576) ** 38,799 **
Buildings on 4,509,573 146,469 4,303,486 - 196,446 287,594 4,015,892 20 years
leasehold land* - -
(352,556) ** 91,148 **
Plant and Machinery - 30,155 1,139,303 - 64,939 563,315 575,988 10%
(1,499) (628)
1,110,647 ** 499,004 **
Furniture and 106,322 3,288 109,610 91,986 3,190 95,176 14,434 10%
fixtures - -
- ** - **
Office equipment 824,335 10,590 231,970 682,988 26,804 214,634 17,336 20%
(440) (202)
(602,515) ** (494,956) **
EDP equipment 1,809,392 156,807 1,880,915 1,470,923 190,545 1,578,040 302,875 33.33%
(85,284) (83,487)
- ** 59 **
Motor vehicles 464,256 53,886 470,793 173,911 85,502 233,521 237,272 20%
(47,349) (27,130)
- ** 1,238 **
61,548,898 517,826 61,932,152 2,419,808 2,036,213 4,344,574 57,587,578
(134,572) (111,447)
- ** - **
Freehold land* 3,791,658 - 9,250,182 13,041,840 - - - - 13,041,840 -
Leasehold land* 16,811,005 72,751 21,607,950 38,491,706 2,197,006 428,963 (2,625,969) - 38,491,706 30-99 years
Buildings on 1,138,375 158,764 1,004,335 2,301,474 849,525 223,312 (1,072,837) - 2,301,474 20 years
freehold land *
Buildings on 2,307,509 195,010 2,007,054 4,509,573 1,547,259 395,417 (1,942,676) - 4,509,573 20 years
leasehold land*
Furniture and 102,020 4,302 - 106,322 88,424 3,562 - 91,986 14,336 10%
fixtures
Office equipment 706,405 118,170 - 824,335 619,895 63,093 - 682,988 141,347 20%
(240)
EDP equipment 1,503,566 325,359 - 1,809,392 1,351,896 138,536 - 1,470,923 338,469 33.33%
(19,533) (19,509)
Motor vehicles 424,060 77,175 - 464,256 110,128 86,813 - 173,911 290,345 20%
(36,979) (23,030)
26,784,598 951,531 33,869,521 61,548,898 6,764,133 1,339,696 (5,641,482) 2,419,808 59,129,090
(56,752) (42,539)
* These represent revalued assets.
** Adjustments includes reclassifications within different categories of assets.
2016
Depreciation
for the year/
(deletions)
Accumulated
depreciation
at June 30,
2016
Net book value
at June 30,
2016
Useful life /
Rate of
depreciation
Cost / revalued
amount at July
1, 2015
Additions /
(deletions)
during the
year
Cost / revalued
amount at June
30, 2016
Accumulated
depreciation at
July 1, 2015
Revaluation
during the year
Useful life /
Rate of
depreciatio
n
Net book
value at June
30, 2017
State Bank of Pakistan Annual Report FY17
2017
--------------------------------------------------------------- (Rupees in '000) ---------------------------------------------------------------
--------------------------------------------------------------- (Rupees in '000) ---------------------------------------------------------------
Reversal due to
revaluation
Cost /
revalued
amount at
July 1, 2016
Additions /
(deletions) /
Adjustments*
* during the
year
Cost /
revalued
amount at
June 30, 2017
Accumulated
depreciation
at July 1,
2016
Depreciation
for the year /
(deletions) /
Adjustments*
*
Accumulated
depreciation
at June 30,
2017
158

16.2
16.3
Note 2017 2016
Freehold land 92,858 39,858
Leasehold land 157,415 159,077
Buildings on freehold land 327,372 485,202
Buildings on leasehold land 710,875 1,052,028
1,288,520 1,736,165
16.4 Capital work-in-progress
Buildings on freehold land 63,536 43,634
Buildings on leasehold land 224,657 311,309
Office equipment 50,637 44,467
Plant and machinery 23,068 -
EDP equipment 92,329 21,039
454,227 420,449
17 INTANGIBLE ASSETS
Software 17.1 4,636 3,833
Capital work-in-progress 102,822 21,153
107,458 24,986
17.1 Intangible assets
Software 2017 613,390 4,027 617,417 609,557 3,224 612,781 4,636 33.33
Software 2016 610,649 2,741 613,390 606,500 3,057 609,557 3,833 33.33
Note 2017 2016
18 OTHER ASSETS
Commission receivable and others 3,231,736 2,117,472
Unrealised gain on derivative financial instruments - net 505,076 1,442,497
Other advances, deposits and prepayments 587,842 569,977
4,324,654 4,129,946
19 BANK NOTES IN CIRCULATION
Total bank notes issued 19.1 4,167,247,213 3,555,067,671
Bank notes held by the Banking Department (111,406) (145,614)
Bank notes in circulation 4,167,135,807 3,554,922,057
Net book value
at June 30
Annual rate of
amortisation %
During the year, the management has reassessed the classification of fixed assets and reclassified certain fixed assets as “plant and
machinery” from buildings on freehold / leasehold land and office equipment. Further, the management has also revised the
depreciation on those assets ranging from 5 to 20 percent per annum to 10 percent per annum with effect from July 1, 2016. The
revision has been made after taking into account the expected pattern of recovery of economic benefits associated with the use of those
assets. The revision has been accounted for as change in accounting estimate as defined in IAS-8 'Accounting Policies, Changes in
Accounting Estimates and Errors'. Had this change in estimate not been made, the depreciation for the year would have decreased by
Rs. 4.6 million with a corresponding increase in profit for the year.
Land and Buildings of the Bank are carried at revalued amount. The latest revaluation was carried out on June 30, 2016 by M/S
M.J.Surveyors (Pvt.) Ltd which resulted in a surplus of Rs. 33,870 million. The revaluation was carried out based on the market value
assessment being the fair value of the land and buildings. Had there been no revaluation, the carrying value of the revalued assets
would have been as follows:
---------------------------------------------------------------(Rupees in '000) ---------------------------------------------------------------
--------------- (Rupees in '000) --------------
Cost at
July 1
Additions
during the
year
Cost at
June 30
Accumulated
amortisation
at July 1
Amortisation
for the year
Accumulated
amortisation
at June 30
--------- (Rupees in '000) ---------
Unconsolidated Financial Statements of SBP
159

19.1
Note 2017 2016
Gold reserves held by the Bank 5 270,361,202 287,170,323
Local currency - coins 6 861,860 488,198
Foreign currency accounts and investments 7 1,495,115,694 1,237,112,270
Special Drawing Rights of the International Monetary Fund 9 51,051,350 51,179,450
Investments - local 12 2,344,098,193 1,973,105,293
Assets held with the Reserve Bank of India 14 5,758,914 6,012,137
4,167,247,213 3,555,067,671
20 CURRENT ACCOUNTS OF GOVERNMENTS
20.1 Current accounts of Governments - payable balances
Federal Government 20.3 76,078,530 313,688,605
Provincial Governments
- Punjab 20.4 38,899,196 96,833,336
- Sindh 20.5 20,398,680 89,107,726
- Khyber Pakhtunkhwa 20.6 31,526,641 77,207,052
- Baluchistan 20.7 2,459,725 19,091,164
Gilgit - Baltistan Administration Authority 20.8 9,239,193 10,729,895
102,523,435 292,969,173
178,601,965 606,657,778
20.2 Current accounts of Governments - receivable balance
Government of Azad Jammu and Kashmir 20.9 7,279,247 955,474
7,279,247 955,474
20.3 Federal Government
Non-food account 40,062 973,642
Zakat fund accounts 80,317,636 7,884,671
Railways accounts (29,518,688) (13,313,227)
Other accounts 25,239,520 318,143,519
76,078,530 313,688,605
20.4 Provincial Government - Punjab
Non-food account 24,344,157 82,846,743
Zakat fund account 753,583 401,259
Other accounts 13,801,456 13,585,334
38,899,196 96,833,336
20.5 Provincial Government - Sindh
Non-food account 18,180,177 84,389,116
Zakat fund account 1,694,383 1,526,526
Other accounts 524,120 3,192,084
20,398,680 89,107,726
20.6 Provincial Government - Khyber Pakhtunkhwa
Non-food account 29,771,904 67,829,675
Zakat fund account 1,281,569 1,186,629
Other accounts 473,168 8,190,748
31,526,641 77,207,052
20.7 Provincial Government - Baluchistan
Non-food account 1,183,617 16,553,943
Zakat fund account 999,379 833,822
Other accounts 276,729 1,703,399
2,459,725 19,091,164
20.8 Gilgit - Baltistan Administration Authority 9,239,193 10,729,895
20.9 Government of Azad Jammu and Kashmir (7,279,247) (955,474)
Classified as receivable balance 20.10 7,279,247 955,474
- -
--------------- (Rupees in '000) --------------
State Bank of Pakistan Annual Report FY17
The liability for bank notes issued by the Issue Department is recorded at its face value in the balance sheet. In accordance with section
26 (1) of SBP Act 1956, this liability is supported by the following assets of the Issue Department.
160

20.10 These balances carry mark-up at rates ranging from 5.89% to 6.01% per annum (2016: 6.18% to 6.88% per annum).
21 PAYABLE TO ISLAMIC BANKING INSTITUTIONS AGAINST BAI MUAJJAL TRANSACTIONS
22 PAYABLE UNDER BILATERAL CURRENCY SWAP AGREEMENT
22.1 Payable under bilateral currency swap agreement with the People's Bank of China (PBoC)
23 DEPOSITS OF BANKS AND FINANCIAL INSTITUTIONS Note 2017 2016
Foreign currency
Scheduled banks 7,619,462 7,527,991
Held under Cash Reserve Requirement 23.1 137,166,870 136,803,601
144,786,332 144,331,592
Local currency
Scheduled banks 23.1 516,209,260 234,778,810
Financial institutions 8,264,427 12,574,555
Others 77,520 75,512
524,551,207 247,428,877
669,337,539 391,760,469
23.1 This includes cash deposited with the State Bank of Pakistan by the scheduled banks under regulatory requirements.
Note 2017 2016
24 OTHER DEPOSITS AND ACCOUNTS
Foreign currency
Foreign central banks 47,257,038 47,210,792
International organisations 24.1 26,533,361 26,479,513
Others 18,013,438 19,445,168
24.2 91,803,837 93,135,473
Local currency
Special debt repayment 24.3 24,243,841 24,243,841
Government 24.4 17,850,348 17,850,348
Foreign central banks 2,059 2,003
International organisations 6,302,580 6,692,016
Others 23,824,618 19,536,513
72,223,446 68,324,721
164,027,283 161,460,194
24.1
2017 2016
24.2 The interest rate profile of the interest bearing deposits is as follows:
Foreign central banks 0.59 to 1.49 0.30 to 0.76
International organisations 2.62 to 3.09 2.11 to 2.62
Others 0.38 to 1.00 0.09 to 0.41
(% per annum)
This includes a long-term deposits of USD 500 million (2016: two contracts of Rs 500 million each) received from the State
Administration Foreign Exchange (SAFE) China in January 2009 (rolled-over in January 2017) carrying interest at six months LIBOR
plus 100 bps (2016: LIBOR plus 100 bps), payable semi-annually. The deposit of USD 500 million which has been set off against the
rupee counterpart receivable from the Federal Government and has been covered under Ministry of Finance (MoF) Guarantee whereby
the MoF has agreed to assume all liabilities and risks arising from the Bank's agreement with SAFE China.
This represents amount payable to various Islamic Banking Institutions against purchases of Government of Pakistan (GoP) Ijara
Sukuks by the Bank on Bai Muajjal basis (deferred payment basis) having profit rates ranging from 5.32% to 5.97% per annum (2016:
4.75% to 5.74% per annum) and maturities on December 31, 2017 and June 21, 2018 (2016: February 10, 2017 and March 15, 2017).
A bilateral currency swap agreement was entered between the Bank and the PBoC on December 23, 2011 in order to promote bilateral
trade, finance direct investment, provide short term liquidity support and for any other purpose mutually agreed between the two
central banks. The original agreement was for tenure of 3 years with overall limit of CNY 10,000 million and equivalent PKR, which
was renewed on December 23, 2014 for a further period of three years. The Bank has purchased CNY 5,000 million, CNY 1,500
million and CNY 3,500 million against PKR during the year with maturity bucket of three months and six months (2016: CNY 5,000
million, CNY 1,500 million and CNY 3,500 million with maturity buckets of six months, three months and two months respectively).
These purchases have been fully utilized as on June 30, 2017 and the same amounts are outstanding as on June 30, 2017. Interest is
charged on outstanding balance at agreed rates. As at June 30, 2017, the Bank's commitment under this agreement is Rs. 154,595
million (2016: Rs. 165,000 million).
--------------- (Rupees in '000) --------------
--------------- (Rupees in '000) --------------
Unconsolidated Financial Statements of SBP
161

24.3
24.4
Note 2017 2016
25 PAYABLE TO THE INTERNATIONAL MONETARY FUND
Borrowings under:
- Fund facilities 25.1 & 25.3 643,054,775 634,172,641
- Allocation of SDRs 25.2 144,326,457 144,566,830
787,381,232 778,739,471
Current account for administrative charges 34 34
787,381,266 778,739,505
25.1
25.2
Note 2017 2016
25.3 Interest profile of amount payable to the IMF is as under:
Fund facilities 25.3.1 1.05 to 1.63 1.05 to 1.07
25.3.1
Note 2017 2016
26 OTHER LIABILITIES
Local currency
Provision against overdue mark-up 26.1 8,662,726 7,960,351
Remittance clearance account 2,215,088 2,259,587
Exchange loss payable under exchange risk coverage scheme 239,068 233,121
Dividend payable 26.2 10,000 10,000
Share of loss payable under profit and loss sharing arrangements - 1,377,691
Other accruals and provisions 26.3 26,203,559 26,254,831
Others 26.4 7,980,692 6,288,717
45,311,133 44,384,298
26.1
26.2
Note 2017 2016
26.3 Other accruals and provisions
Agency commission 12,451,275 12,440,190
Provision for employees' compensated absences 40.6.9 2,643,068 2,551,971
Provision for other doubtful assets 26.3.1 6,652,772 6,911,495
Other provisions 26.3.2 2,848,701 2,848,701
Others 1,607,743 1,502,474
26,203,559 26,254,831
(% per annum)
The IMF levies a basic rate of interest (charges) on loans based on the SDR interest rate and imposes surcharges depending on the
amount and maturity of the loan and the level of credit outstanding. Interest rates are determined by the IMF on weekly basis. Charges
are, however, payable on quarterly basis.
--------- (Rupees in '000) --------
IMF provides financing to its member countries from General Resources Account (GRA) held in its General Department. GRA credit
is normally governed by the IMF’s general lending policies (also known as “credit tranche” policies, which provide financing for
Balance of Payments [BoP] needs).
Under GRA financing i.e. Extended Fund Facility (EFF) was granted by IMF in FY 2013-14. The total facility amounts to SDR 4,393
million having repayment period of 4½–10 years, with repayments in twelve equal semi-annual installments. A total amount of SDR
4,393 million has been disbursed under twelve (12) tranches of EFF up to June 30, 2017 (2016: SDR 4,320 million). The repayments
under this facility would start in March 2018 and would continue till September 2026.
This represents amount payable against allocation of SDRs. A charge is levied by the IMF on the SDR allocation of the Bank at weekly
interest rate applicable on daily product of SDR.
State Bank of Pakistan Annual Report FY17
This represents suspended mark-up which is recoverable from Government of Bangladesh (former East Pakistan) subject to the final
settlement between the Governments of Pakistan and Bangladesh (former East Pakistan).
-------- (Rupees in '000) ---------
This includes dividend payable on shares held by the Government of Pakistan and Government controlled entities amounting to Rs.
9.99 million (2016: Rs. 9.99 million).
These are interest free and represent amounts kept in separate special accounts to meet forthcoming foreign currency debt repayment
obligations of the Government of Pakistan.
These represent rupee counterpart of the foreign currency loan disbursements received from various international financial institutions
on behalf of the Government and credited to separate deposit accounts in accordance with the instructions of the Government.
---------- (Rupees in '000) --------------
162
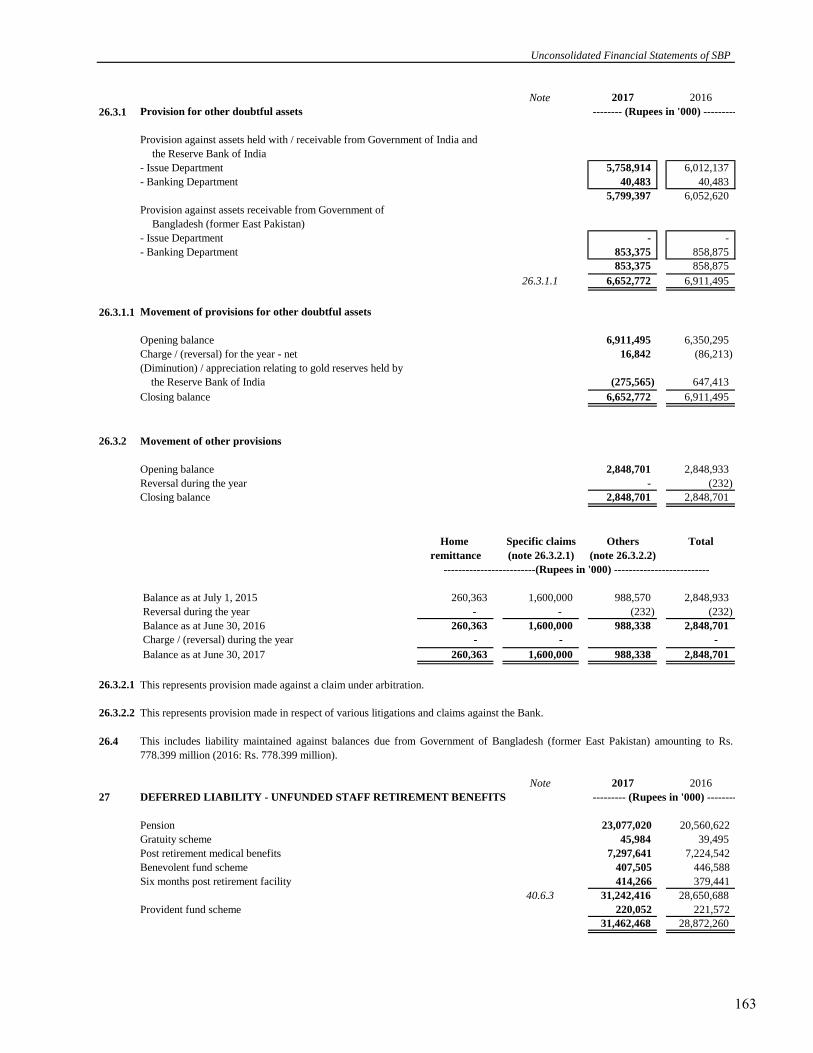
Note 2017 2016
26.3.1 Provision for other doubtful assets
Provision against assets held with / receivable from Government of India and
the Reserve Bank of India
- Issue Department 5,758,914 6,012,137
- Banking Department 40,483 40,483
5,799,397 6,052,620
Provision against assets receivable from Government of
Bangladesh (former East Pakistan)
- Issue Department - -
- Banking Department 853,375 858,875
853,375 858,875
26.3.1.1 6,652,772 6,911,495
26.3.1.1 Movement of provisions for other doubtful assets
Opening balance 6,911,495 6,350,295
Charge / (reversal) for the year - net 16,842 (86,213)
(Diminution) / appreciation relating to gold reserves held by
the Reserve Bank of India (275,565) 647,413
Closing balance 6,652,772 6,911,495
26.3.2 Movement of other provisions
Opening balance 2,848,701 2,848,933
Reversal during the year - (232)
Closing balance 2,848,701 2,848,701
Home Specific claims Others Total
remittance (note 26.3.2.1) (note 26.3.2.2)
Balance as at July 1, 2015 260,363 1,600,000 988,570 2,848,933
Reversal during the year - - (232) (232)
Balance as at June 30, 2016 260,363 1,600,000 988,338 2,848,701
Charge / (reversal) during the year - - -
Balance as at June 30, 2017 260,363 1,600,000 988,338 2,848,701
26.3.2.1
26.3.2.2 This represents provision made in respect of various litigations and claims against the Bank.
26.4
Note 2017 2016
27 DEFERRED LIABILITY - UNFUNDED STAFF RETIREMENT BENEFITS
Pension 23,077,020 20,560,622
Gratuity scheme 45,984 39,495
Post retirement medical benefits 7,297,641 7,224,542
Benevolent fund scheme 407,505 446,588
Six months post retirement facility 414,266 379,441
40.6.3 31,242,416 28,650,688
Provident fund scheme 220,052 221,572
31,462,468 28,872,260
Unconsolidated Financial Statements of SBP
--------- (Rupees in '000) --------
This includes liability maintained against balances due from Government of Bangladesh (former East Pakistan) amounting to Rs.
778.399 million (2016: Rs. 778.399 million).
-------------------------(Rupees in '000) --------------------------
This represents provision made against a claim under arbitration.
-------- (Rupees in '000) ---------
163

28 SHARE CAPITAL
2016 2017 2016
Authorised share capital
1,000,000 1,000,000 Ordinary shares of Rs. 100 each 100,000 100,000
1,000,000 1,000,000 Fully paid-up ordinary shares of Rs. 100 each 100,000 100,000
29 RESERVES
29.1 Reserve fund
29.2 The reserve for acquisition of PSPC
29.3 Other funds
Note 2017 2016
30 UNREALISED APPRECIATION ON GOLD
RESERVES HELD BY THE BANK
Opening balance 283,342,601 243,367,310
(Diminution) / appreciation for the year due to revaluation 5 (17,015,000) 39,975,291
266,327,601 283,342,601
31 CONTINGENCIES AND COMMITMENTS
31.1 Contingencies
a) Contingent liability in respect of guarantees given on behalf of:
Federal Government 31.1.1 16,889,529 21,486,999
Federal Government owned / controlled bodies and authorities 7,103,733 7,605,996
23,993,262 29,092,995
b)
State Bank of Pakistan Annual Report FY17
Certain employees of the Bank who had retired under the Early Retirement Incentive Scheme (ERIS) introduced in the year 2000
had filed a case against the Bank in the Federal Services Tribunal (FST) for the enhancement of their entitlement paid under the
above scheme amounting to Rs. 157 million approximately. The Tribunal has decided the case in favour of these employees and has
directed that the entitlement under the above scheme should include the effect of subsequent increases in certain staff retirement
and other benefits. The Bank, in response to the above decision of the Tribunal filed a civil petition for leave to appeal in the
Supreme Court of Pakistan. In prior years, the Honorable Bench of the Supreme Court of Pakistan set aside the judgment of FST
and allowed employees to avail proper forum. The employees have filed an appeal in the Honorable Lahore High Court, Rawalpindi
Bench, the decision of which is pending. The management is confident that the Bank would not have to bear any additional
expenditure on this account and, accordingly, no provision has been made in this respect.
2017
--------- (Rupees in '000) ---------
--------------- (Number of shares) --------------
Issued, subscribed and
paid-up capital
The shares of the Bank are held by the Government of Pakistan and certain Government controlled entities except for 200 shares held by
the Central Bank of India (held by Deputy Custodian Enemy Property, Banking Policy and Regulations Department, State Bank of
Pakistan) and 500 shares held by the State of Hyderabad.
This represents appropriations made out of the annual profits of the State Bank of Pakistan in accordance with the provisions of the
State Bank of Pakistan Act, 1956.
These represent appropriations made out of the surplus profits of the State Bank of Pakistan for certain specified purposes in
accordance with the provisions of the State Bank of Pakistan Act, 1956.
---------- (Rupees in '000)--------
During the current year the Board of Directors in its meeting held on June 29, 2017 has approved the creation of a special reserve fund
by the name of "The Reserve for Acquisition of PSPC" and has appropriated an amount of Rs. 65,464 million from "Reserve Fund" to
"The Reserve for Acquisition of PSPC".
164

c)
Note 2017 2016
d) Other claims against the Bank not acknowledged as debts 31.1.2 350,216 350,678
31.1.1 Above guarantees are secured by counter guarantees either from the Government of Pakistan or local financial institutions.
31.1.2 These represent various claims filed against the Bank's role as a regulator and certain other cases.
Note 2017 2016
31.2 Commitments
31.2.1 Foreign currency forward and swap contracts - sale 935,079,726 802,656,331
31.2.2 Foreign currency forward and swap contracts - purchase 498,678,723 595,499,305
31.2.3 Futures - sale 43,038,829 18,044,108
31.2.4 Futures - purchase 35,430,566 14,656,485
31.2.5 Capital Commitments 31.2.5.1 189,027 386,844
31.2.5.1 This represents amounts committed by the bank to purchase assets from successful bidders.
31.2.6
31.2.7
Note 2017 2016
32 DISCOUNT, INTEREST / MARK-UP AND /
OR PROFIT EARNED
Discount, interest / mark-up on Government transactions:
- Market Related Treasury Bills 171,366,069 150,272,738
- Federal Government Scrips 82,200 82,200
- Loans and advances to and current accounts of Governments 32.1 442,256 327,520
Securities purchased under agreement to resell 63,193,756 80,712,710
Interest income on preference shares 1,333,659 -
Return on loans and advances to financial institutions 6,392,333 8,683,044
Foreign currency loan and advance including deposits 9,034,732 4,258,735
Foreign currency securities 8,970,869 8,382,254
Profit on sukuks purchased under Bai Muajjal agreement 10,745 70,542
Others 909 200
260,827,528 252,789,943
2017 2016
32.1 Interest profile on loans and advances to facilities are as under:
Mark-up on facility 6.89 to 6.01 6.18 to 6.88
Additional mark-up (where ways and means facility limit is exceeded) 4 4
------(Rupees in '000)------
(% per annum)
--------- (Rupees in '000) ------------
In addition to these claims, there are several other investigations / lawsuits filed by various parties as a result of the regulatory
actions / investigations taken by the Bank in its capacity as regulator and banker to the government, which the Bank is currently
contesting in various courts of laws / forums. The management of the Bank, believes that the Bank has reasonable position in
respect of these litigations and accordingly no provision for any liability may be needed in the unconsolidated financial
statements.
The Bank has made commitments to extend advance under ways and means limits to the Provincial Governments of Pakistan,
Government of Azad Jammu and Kashmir and Gilgit-Baltistan Administration Authority in the normal course of its operations. The
unutilised limits as on June 30, 2017 amounted to Rs. 67,325 million (2016: Rs. 71,945 million).
In case the Governments exceed their respective ways and means limits, the Bank charges a penal rate of 4% over and above the
normal rate of return on the amount exceeding the ways and means limit.
Commitments in respect of bilateral currency swap agreements with the People's Bank of China have been disclosed in note 22 to these
unconsolidated financial statements.
--------- (Rupees in '000) ------------
Unconsolidated Financial Statements of SBP
165

Note 2017 2016
33 INTEREST / MARK-UP EXPENSE
Deposits 19,087,345 15,866,387
Securities sold under agreement to repurchase 152,737 218,111
Return on Sukuks purchased under Bai Muajjal agreement 1,735,682 9,287,535
Charges on allocation of Special Drawing Rights of the IMF 388,071 78,609
Others 5,009 3,838
21,368,844 25,454,480
34 COMMISSION INCOME
Market Treasury Bills 34.1 1,163,377 472,821
Management of public debts 34.1 959,936 989,118
Prize Bonds and National Saving Certificates 34.1 459,422 439,041
Draft / payment orders 8,408 8,148
Others 51 52
2,591,194 1,909,180
34.1 These represent commission income earned from services provided to the Federal Government.
Note 2017 2016
35 EXCHANGE GAIN - NET
Gain / (loss) on:
- Foreign currency placements, deposits, securities and
other accounts - net 21,802,161 38,322,960
- Forward covers under Exchange Risk Coverage Scheme (109) 6
- IMF Fund Facilities 2,642,689 (10,984,606)
- Special Drawing Rights of the IMF 80,160 (1,611,329)
24,524,901 25,727,031
Others 446 -
Exchange risk fee income 44,267 52,344
24,569,614 25,779,375
36 OTHER OPERATING INCOME - NET
Penalties levied on banks and financial institutions 1,131,474 1,017,004
License / Credit Information Bureau fee recovered 904,202 817,885
Gain on disposal of investment:
Local - 'at fair value through profit or loss' - 58,663
Foreign - 'at fair value through profit or loss' 39,949 201,043
39,949 259,706
Gain / loss on restructuring of exposure of Zarai Taraqiati
Bank Limited and House Building Finance Company Limited 36.1 3,311,793 -
(Loss) / Gain on remeasurement of securities classified
as 'fair value through profit or loss' (4,898,446) 559,888
Others 110,996 101,629
599,968 2,756,112
36.1 Gain / loss on restructuring of exposure of Zarai Taraqiati Bank
Limited (ZTBL) and House Building Finance Company Limited (HBFCL)
ZTBL:
- Fair value loss on recognition of preference shares (1,634,847) -
- Reversal of previously suspended mark-up on issuance
of equity shares to the Bank 10,199,622 -
- Reversal of provision of loans and advances on issuance of
preference shares 13.1 3,204,323 -
11,769,098 -
HBFCL:
- Loss arising on conversion of loans into ordinary shares (9,834,996) -
- Share of loss payable under profit and loss sharing arrangements written back 1,377,691 -
(8,457,305) -
3,311,793 -
State Bank of Pakistan Annual Report FY17
------(Rupees in '000)------
------(Rupees in '000)------
166

Note 2017 2016
37 OTHER INCOME - NET
Gain / (loss) on disposal of property, plant and equipment 3,770 (501)
Liabilities and provisions written back - net 11,780 12,327
Grant income under foreign assistance program 9,064 11,808
Income from subsidiaries 37.1 41,572 40,027
Others 204,692 65,505
270,878 129,166
37.1 Income from subsidiaries
SBP Banking Services Corporation 41,572 40,027
41,572 40,027
38 BANK NOTES PRINTING CHARGES
39 AGENCY COMMISSION
Note 2017 2016
40 GENERAL ADMINISTRATIVE AND OTHER EXPENSES
Salaries and other benefits 3,509,361 3,476,133
Retirement benefits and employees' compensated absences 40.1 2,838,624 3,559,566
Rent and taxes 18,877 28,303
Insurance 34,810 24,872
Electricity, gas and water 50,509 45,055
Depreciation 16.1 2,036,213 1,339,696
Amortisation of intangible assets 17.1 3,224 3,057
Repairs and maintenance 407,768 430,930
Auditors' remuneration 40.5 7,000 6,050
Legal and professional 44,231 27,917
Fund managers / custodian expenses 475,909 495,428
Travelling expenses 255,719 222,894
Daily expenses 76,326 56,784
Fuel 39,974 43,579
Conveyance 7,191 8,199
Postages, telegram / telex and telephone 215,210 204,511
Training 215,139 190,270
Stationery 8,224 9,915
Books and newspapers 35,309 27,923
Advertisement 37,147 11,057
Uniforms 1,361 1,443
Others 135,064 99,261
10,453,190 10,312,843
Expenses allocated by:
SBP Banking Services Corporation 40.2 5,071,183 6,411,699
Expenses reimbursed to:
SBP Banking Services Corporation 40.3 7,423,955 7,544,251
22,948,328 24,268,793
Unconsolidated Financial Statements of SBP
The above represents income of subsidiaries for the year ended June 30, 2017 transferred to the Bank in accordance with the
arrangements mentioned in note 40.4 to these unconsolidated financial statements.
Bank notes printing charges are paid to Pakistan Security Printing Corporation (Private) Limited (which has become a wholly owned
subsidiary of the Bank during the current year) at agreed rates under specific arrangements.
------(Rupees in '000)------
Agency commission is mainly payable to National Bank of Pakistan (NBP) under an agreement for providing banking services to
Federal and Provincial Governments as an agent of the Bank. Furthermore, a small portion of the agency commission also pertains to
Bank of Punjab (BOP), which was appointed as agent of the Bank, during last year, to collect Government of Punjab’s taxes and
receipts.
------(Rupees in '000)------
167

40.1 This includes an amount relating to defined contribution plan aggregating Rs. 196.209 million (2016: Rs. 136.150 million).
Note 2017 2016
40.2 Expenses allocated by SBP Banking Services Corporation
Retirement benefits and employees' compensated absences 4,853,297 6,267,528
Depreciation 217,886 144,171
5,071,183 6,411,699
40.3 Expenses reimbursed to SBP Banking Services Corporation
Salaries and other benefits 5,709,601 6,153,682
Rent and taxes 37,604 25,550
Insurance 12,979 7,309
Electricity, gas and water 323,968 304,736
Repairs and maintenance 218,084 189,716
Auditors' remuneration 40.5 7,000 5,950
Legal and professional 9,270 11,078
Travelling expenses 16,864 21,725
Daily expenses 30,638 26,897
Recreation allowance 258,419 198,127
Fuel 2,810 3,002
Conveyance 17,456 16,818
Postage and telephone 11,399 12,898
Training 203,964 146,112
Remittance of treasure 132,636 92,744
Stationery 10,408 9,444
Books and newspapers 1,813 1,626
Advertisement 11,028 32,011
Bank guards 147,587 117,499
Uniforms 34,983 28,493
Others 225,444 138,834
7,423,955 7,544,251
40.4
40.5 Auditors' remuneration
State Bank of Pakistan
Audit fee 3,000 3,000 6,000 2,610 2,610 5,220
Out of pocket expenses 500 500 1,000 415 415 830
3,500 3,500 7,000 3,025 3,025 6,050
SBP Banking Services Corporation
Audit fee 2,500 2,500 5,000 2,090 2,090 4,180
Out of pocket expenses 1,000 1,000 2,000 885 885 1,770
3,500 3,500 7,000 2,975 2,975 5,950
7,000 7,000 14,000 6,000 6,000 12,000
State Bank of Pakistan Annual Report FY17
------(Rupees in '000)------
SBP Banking Services Corporation (the Corporation), a wholly owned subsidiary of the Bank, carries out certain functions and activities
principally relating to public dealing on behalf of the Bank and incurs administrative costs in this respect. Accordingly, under mutually
agreed arrangements, all of the above costs have been reimbursed to or allocated by the Corporation while profit of the Corporation for
the year ended June 30, 2017, as mentioned in note 37.1 to these unconsolidated financial statements, has also been transferred to the
Bank.
----------------------------------------------- (Rupees in '000) ------------------------------------------------
2017 2016
EY Ford
Rhodes
A. F.
Ferguson &
Co.
Total EY Ford
Rhodes
A. F. Ferguson
& Co.
Total
168

40.6 Staff retirement benefits
40.6.1
2017 2016
-Discount rate for year end obligation 7.75% p.a 7.25% p.a
-Salary increase rate (where applicable) 8.75% p.a 8.25% p.a
-Pension increase rate (where applicable) 6.25% p.a 4.75% p.a
-Medical cost increase rate 7.75% p.a 6.25% - 7.25% p.a
-Petrol price increase rate (where applicable) 8.75% p.a 8.75% p.a
-Personnel turnover 4.80% p.a 11.50% p.a
-Normal retirement age 60 Years 60 Years
40.6.2 Through its defined benefit plan, the Bank is exposed to a number of risks, the most significant of which are detailed below:
Discount rate risk
Salary increase / inflation risk
Pension Increase risk
Mortality risk
The risk that the actual mortality experience is higher than that of expected i.e. the actual life expectancy is longer than assumed.
Withdrawal risk
The risk of actual withdrawals experience may differ from that assumed in the calculation.
40.6.3 Change in present value of defined benefit obligation
Present value of defined benefit obligation July 1, 2016 20,560,622 39,495 7,224,542 446,588 379,441 28,650,688
Current service cost 300,044 5,602 126,215 3,833 27,355 463,049
Interest cost on defined benefit obligation 1,432,230 2,863 512,898 30,811 26,914 2,005,716
Benefits Paid (1,611,441) - (300,185) (43,228) (16,419) (1,971,273)
Liability transferred to SBP - BSC (15,507) - (17,763) (1,121) (2,100) (36,491)
Remeasurements:
Actuarial (gains) / losses from changes in financial assumptions 1,117,608 - 144,363 (14,781) 76 1,247,266
Experience adjustments 1,293,464 (1,976) (392,429) (14,597) (1,001) 883,461Present value of defined benefit obligation as on June 30, 2017 23,077,020 45,984 7,297,641 407,505 414,266 31,242,416
Present value of defined benefit obligation July 1, 2015 17,827,447 26,441 6,489,738 369,979 290,624 25,004,229
Current service cost 321,209 6,639 119,027 15,825 22,480 485,180
Past service cost 256,513 1,822 22,147 - 16,745 297,227
Interest cost on defined benefit obligation 1,637,429 2,755 665,247 33,308 29,259 2,367,998
Benefits Paid (2,066,604) (408) (308,103) (56,712) (23,932) (2,455,759)
Liability transferred to SBP - BSC (136,419) - (52,610) (5,028) (7,381) (201,438)
Remeasurements: -
Actuarial (gains) / losses from changes in demographic assumptions 797,254 - 93,993 18,623 (4,895) 904,975
Actuarial losses from changes in financial assumptions 363,392 5,076 63,896 79,867 36,759 548,990
Experience adjustments 1,560,401 (2,830) 131,207 (9,274) 19,782 1,699,286
Present value of defined benefit obligation as on June 30, 2016 20,560,622 39,495 7,224,542 446,588 379,441 28,650,688
Unconsolidated Financial Statements of SBP
Assumptions regarding future mortality are based on actuarial advice in accordance with published statistics and experience in
Pakistan. The rates assumed are based on the adjusted SLIC 2001 - 2005 mortality tables with 1 year setback.
During the year the actuarial valuations of the defined benefit obligations were carried out under the Projected Unit Credit Method
using, following significant assumptions:
The risk that the actual salary increase are higher than the expected, where benefits are being paid in form of monthly pension, is likely
to have an impact on liability.
The risk of changes in discount rate since discount rate is based on corporate / government bonds. Any decrease in bond yields will
impact plan liabilities.
2017
PensionGratuity
scheme
Post
retirement
medical
benefits
Benevolent
fund scheme
Six months post
retirement
benefits
Total
\------------------------------------------------------------------(Rupees in '000)------------------------------------------------------------------
2016
PensionGratuity
scheme
Post retirement
medical
benefits
Benevolent
fund scheme
Six months post
retirement
benefits
Total
\------------------------------------------------------------------(Rupees in '000)------------------------------------------------------------------
The risk that the actual salary increase is higher / lower than the expected salary increase, where benefits are linked with final salary at
the time of cessation of service, is likely to have an impact on liability.
169
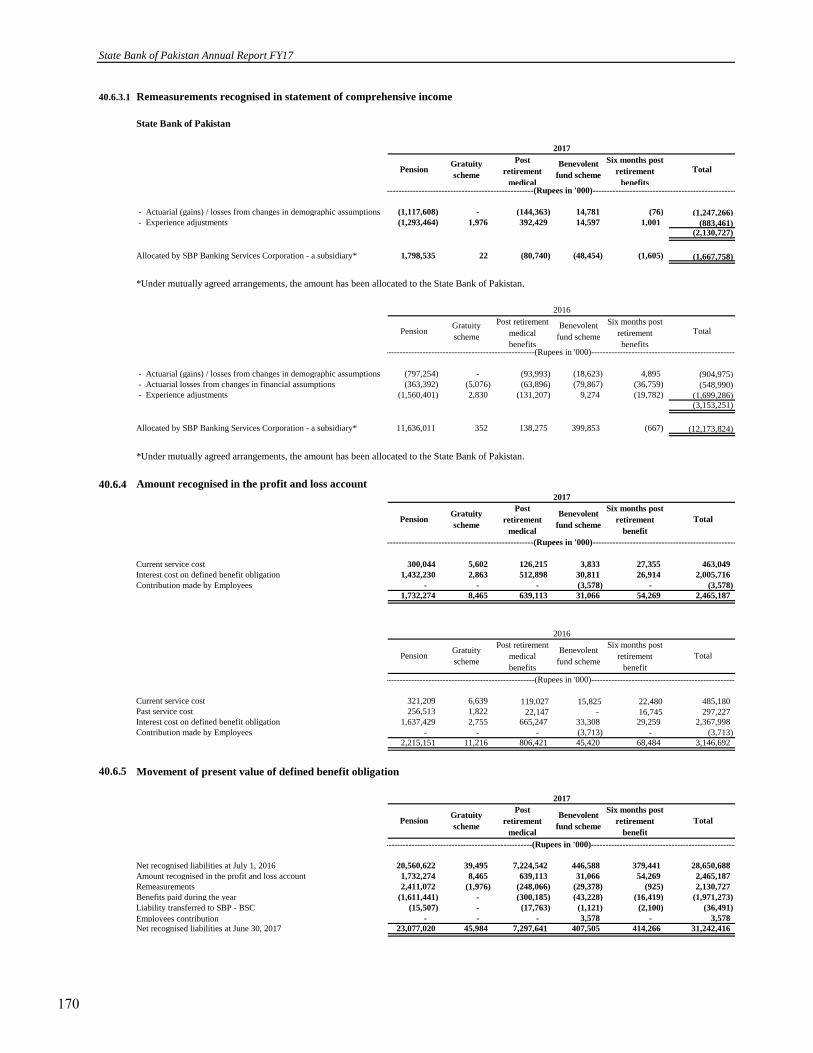
40.6.3.1 Remeasurements recognised in statement of comprehensive income
State Bank of Pakistan
- Actuarial (gains) / losses from changes in demographic assumptions (1,117,608) - (144,363) 14,781 (76) (1,247,266)
- Experience adjustments (1,293,464) 1,976 392,429 14,597 1,001 (883,461)(2,130,727)
Allocated by SBP Banking Services Corporation - a subsidiary* 1,798,535 22 (80,740) (48,454) (1,605) (1,667,758)
*Under mutually agreed arrangements, the amount has been allocated to the State Bank of Pakistan.
- Actuarial (gains) / losses from changes in demographic assumptions (797,254) - (93,993) (18,623) 4,895 (904,975)
- Actuarial losses from changes in financial assumptions (363,392) (5,076) (63,896) (79,867) (36,759) (548,990)
- Experience adjustments (1,560,401) 2,830 (131,207) 9,274 (19,782) (1,699,286)(3,153,251)
Allocated by SBP Banking Services Corporation - a subsidiary* 11,636,011 352 138,275 399,853 (667) (12,173,824)
*Under mutually agreed arrangements, the amount has been allocated to the State Bank of Pakistan.
40.6.4 Amount recognised in the profit and loss account
Current service cost 300,044 5,602 126,215 3,833 27,355 463,049
Interest cost on defined benefit obligation 1,432,230 2,863 512,898 30,811 26,914 2,005,716
Contribution made by Employees - - - (3,578) - (3,578)
1,732,274 8,465 639,113 31,066 54,269 2,465,187
Current service cost 321,209 6,639 119,027 15,825 22,480 485,180
Past service cost 256,513 1,822 22,147 - 16,745 297,227
Interest cost on defined benefit obligation 1,637,429 2,755 665,247 33,308 29,259 2,367,998
Contribution made by Employees - - - (3,713) - (3,713)
2,215,151 11,216 806,421 45,420 68,484 3,146,692
40.6.5 Movement of present value of defined benefit obligation
Net recognised liabilities at July 1, 2016 20,560,622 39,495 7,224,542 446,588 379,441 28,650,688
Amount recognised in the profit and loss account 1,732,274 8,465 639,113 31,066 54,269 2,465,187
Remeasurements 2,411,072 (1,976) (248,066) (29,378) (925) 2,130,727
Benefits paid during the year (1,611,441) - (300,185) (43,228) (16,419) (1,971,273)
Liability transferred to SBP - BSC (15,507) - (17,763) (1,121) (2,100) (36,491)
Employees contribution - - - 3,578 - 3,578
Net recognised liabilities at June 30, 2017 23,077,020 45,984 7,297,641 407,505 414,266 31,242,416
State Bank of Pakistan Annual Report FY17
2017
Total
2017
PensionGratuity
scheme
Post
retirement
medical
Benevolent
fund scheme
Six months post
retirement
benefits
Total
\------------------------------------------------------------------(Rupees in '000)------------------------------------------------------------------
2016
PensionGratuity
scheme
\------------------------------------------------------------------(Rupees in '000)------------------------------------------------------------------
PensionGratuity
scheme
Post
retirement
medical
Benevolent
fund scheme
Six months post
retirement
benefit
Gratuity
scheme
Post retirement
medical
benefits
Benevolent
fund scheme
Six months post
retirement
benefit
Total
2016
Pension
\-----------------------------------------------------------------(Rupees in '000)------------------------------------------------------------------
2017
PensionGratuity
scheme
Post
retirement
medical
Benevolent
fund scheme
Six months post
retirement
benefit
Total
Post retirement
medical
benefits
Benevolent
fund scheme
Six months post
retirement
benefits
Total
\------------------------------------------------------------------(Rupees in '000)------------------------------------------------------------------
\------------------------------------------------------------------(Rupees in '000)------------------------------------------------------------------
170

Net recognised liabilities at July 1, 2015 17,827,447 26,441 6,489,738 369,979 290,624 25,004,229
Amount recognised in the profit and loss account 2,215,151 11,216 806,421 45,420 68,484 3,146,692
Remeasurements 2,721,047 2,246 289,096 89,216 51,646 3,153,251
Benefits paid during the year (2,066,604) (408) (308,103) (56,712) (23,932) (2,455,759)
Liability transferred to SBP - BSC (136,419) - (52,610) (5,028) (7,381) (201,438)
Employees contribution - - - 3,713 - 3,713
Net recognised liabilities at June 30, 2016 20,560,622 39,495 7,224,542 446,588 379,441 28,650,688
40.6.6 The sensitivity of the defined benefit obligation to changes in the weighted principal assumptions is:
Pension
Discount rate 1% (1,747,072) 2,042,892
Salary increase rate 1% 396,109 (368,665)
Pension increase rate 1% 1,687,146 (1,463,609)
Expected mortality rates 1 Year (544,668) 592,713
Gratuity
Discount rate 1% (6,030) 7,207
Salary increase rate 1% 7,063 (6,030)
Post retirement medical benefit
Discount rate 1% (881,305) 1,116,601
Salary increase 1% 45,920 (40,588)
Post-Retirement medical cost increase rate 1% 1,103,767 (881,483)
Expected mortality rates 1 Year (132,048) 134,926
Benevolent
Discount rate 1% (26,571) 30,704
Six months post retirement benefit
Discount rate 1% (37,197) 42,864
Salary / Petrol price increase rate 1% 42,590 (37,681)
40.6.7 Duration of defined benefit obligation
PensionGratuity
scheme
Post
retirement
medical
benefit
Benevolent
fund scheme
Six months post
retirement
benefit
Weighted average duration of the defined benefit obligation 8 Years 14 Years 14 Years 7 Years 9.66 Years
40.6.8 Estimated expenses to be charged to profit and loss account for the year ending June 30, 2018
Current service cost 300,364 6,289 149,148 3,601 29,295 488,697
Interest cost on defined benefit obligation 1,788,469 3,564 565,567 31,582 32,106 2,421,288
Amount chargeable to profit and loss account 2,088,833 9,853 714,715 35,183 61,401 2,909,985
Unconsolidated Financial Statements of SBP
Six months post
retirement
benefit
Total
The above sensitivity analysis are based on a change in an assumption while holding all other assumptions constant. When calculating
the sensitivity of the defined benefit obligation to significant actuarial assumptions, the same method (present value of the defined
benefit obligation calculated with the projected unit credit method at the end of the reporting period) has been applied as when
calculating the liability of all schemes recognised within the balance sheet.
\------------------------------------------------------------------(Rupees in '000)------------------------------------------------------------------
Impact on defined benefit obligation - Increase /
(Decrease)
Change in
Assumption
Increase in
assumption
Decrease in
assumption
(Rupees in '000)
2016
PensionGratuity
scheme
Post retirement
medical
benefits
Benevolent
fund scheme
-------------------------------------------------------------(Rupees in '000)----------------------------------------------------------
Based on the actuarial advice, the management estimates that charge in respect of defined benefit plans for the year ending June 30,
2018 would be as follows:
PensionGratuity
scheme
Post
retirement
medical benefit
Six months post
retirement
benefit
TotalBenevolent
fund scheme
171

40.6.9 Employees' compensated absences
Note 2017 2016
41 PROFIT FOR THE YEAR AFTER NON-CASH ITEMS
AND OTHER ITEMS
Profit for the year 237,951,218 229,261,242
Adjustments for:
Depreciation 16.1 & 40.2 2,254,099 1,483,867
Amortisation of intangible assets 17.1 3,224 3,057
Provision / (reversal) for / write-off:
- retirement benefits and employees' compensated absences 7,691,921 9,827,094
- loans and advances (6,266) -
- claims - (232)
- other doubtful assets 26.3.1.1 16,842 (86,213)
Gain / loss on restructuring of exposure of Zarai Taraqiati
Bank Limited (ZTBL) and House Building Finance Company Limited (HBFCL) 36.1 (3,311,793) -
(Gain) / loss on disposal of property, plant and equipment 37 (3,770) 501
Dividend income (12,248,843) (12,226,343)
Effect of exchange loss on cash and cash equivalents 1,687,144 45,545,964
234,033,776 273,808,937
42 CASH AND CASH EQUIVALENTS
Local currency - coins 6 861,860 488,198
Foreign currency accounts and investments 1,444,739,189 1,737,853,644
Earmarked foreign currency balances 10,319,532 5,147,596
Special Drawing Rights of the International Monetary Fund 9 63,657,319 67,656,236
1,519,577,900 1,811,145,674
43 RELATED PARTY TRANSACTIONS
2017 2016
43.1 National Institute Of Banking And Finance (Guarantee) Limited
Balances at the year end
Payable against training programs 2,223 22,818
Current account with the Institute 135,612 -
Transactions during the year
Training expense charged 199,306 153,335
Payments / (Receipts) 219,901 (56,380)
The Bank's liability for employees' compensated absences determined through an actuarial valuation carried out under the Projected
Unit Credit Method amounted to Rs. 2,643.068 million (2016:Rs. 2,551.97 million). An amount of Rs. 171.511 million (2016:Rs.
274.64 million) has been charged to the profit and loss account in the current period based on the actuarial advice. Expected charge in
respect of the scheme for the year ending June 30, 2018 would be Rs 384.126 million. The benefits paid during the year amounted to
Rs. 68.969 million (2016: Rs 181.223 million). In case of 1% increase / decrease in discount rate the net charge for the year would
decrease / increase by Rs. 217.243 million and Rs. 252.194 million respectively and the net liability would also be affected by the same
amount. In case of 1% increase / decrease in salary rate the net charge for the year would increase / decrease by Rs. 253.290 million
and Rs. 222.612 million respectively and the net liability would also be affected by the same amount. The weighted average duration
for the liability against employee's compensated absences is 9 years.
State Bank of Pakistan Annual Report FY17
------(Rupees in '000)------
The Bank enters into transactions with related parties in its normal course of business. Related parties include the Federal Government
as major shareholder of the Bank, Provincial Governments, Government of Azad Jammu and Kashmir, Gilgit-Baltistan Administration
Authority, Government controlled enterprises / entities, retirement benefit plans, directors and key management personnel of the Bank.
Rupees in '000
172

2017 2016
43.2 Pakistan Security Printing Corporation (Private) Limited
Balances at the year end
Payable against printing charges 788,031 -
Receivable against salaries 941 -
Transactions during the year
Printing charges 396,169 -
43.3 Governments and related entities
2017 2016
Transactions during the year
- Creation of MRTBs 6,250,800,000 4,294,300,000
- Retirement / rollover of MRTBs 5,799,530,000 4,558,055,859
- Outstanding foreign currency swap contracts 89,778,296 183,961,130
-
43.4 Remuneration to key management personnel
2017 2016
Short-term employee benefit 360,060 264,955
Post-employment benefit 56,127 105,272
Loans disbursed during the year 60,458 173,047
Loans repaid during the year 77,397 92,324
Directors' fees 13,050 11,711
Number of key management personnel 18 17
43.5 Subsidiaries of the Bank
44 RISK MANAGEMENT POLICIES
Rupees in '000
Material transactions with the subsidiaries have been disclosed in note 37.1 and 40 to these unconsolidated financial statements. The
subsidiaries of the Bank and their primary activities are given in note 1.3 to these unconsolidated financial statements.
Key management personnel of the Bank include members of the Board of Directors of the Bank, Governor of the Bank, Deputy
Governors of the Bank and other executives of the Bank who have responsibility for planning, directing and controlling the activities of
the Bank. Fee of the non-executive members of the Board of Directors is determined by the Board. According to section 10 of the State
Bank of Pakistan Act, 1956, the remuneration of the Governor is determined by the President of Pakistan. Deputy Governors are
appointed and their salaries are fixed by the Federal Government. Details of remuneration of key management personnel of the Bank
are as follows:
------(Rupees in '000)------
Short-term benefits include salary and benefits, medical benefits and free use of Bank maintained cars in accordance with their
entitlements. Post employment benefits include gratuity, pension, benevolent fund, post retirement medical benefits, six months post
retirement facility and contributory provident funds.
------(Rupees in '000)------
Commission income from sale of Market Treasury Bills, issuance of prize bonds, national saving certificates and management of
public debt (refer note 34.1)
Unconsolidated Financial Statements of SBP
The Bank is primarily subject to interest / mark-up rate, credit, currency and liquidity risks. The policies and procedures for managing
these risks are outlined in notes 44.1 to 44.10 to these unconsolidated financial statements. The Bank has designed and implemented a
framework of controls to identify, monitor and manage these risks. The senior management is responsible for advising the Governor on
the monitoring and management of these risks.
The Bank is acting as an agent of the Federal Government and is responsible for functions conferred upon as disclosed in note 1 to
these unconsolidated financial statements. Balances outstanding from and transactions with the Federal and Provincial Governments
and related entities not disclosed elsewhere in the financial statements are given below:
173

44.1 Credit risk management
44.2 Concentrations of risk
44.2.1 Geographical analysis
Pakistan
Asia (other
than
Pakistan)
America Europe Australia Others Grand Total
Financial assets `
Local currency - coins 861,860 - - - - - 861,860
Foreign currency accounts and investments 23,961,146 453,088,974 652,637,412 560,768,972 48,496,151 43,586,533 1,782,539,188
Earmarked foreign currency balances 10,319,532 - - - - - 10,319,532
Special Drawing Rights of the International
Monetary Fund - - 63,657,319 - - - 63,657,319
Reserve tranche with the International Monetary
Fund under quota arrangements - - 17,382 - - - 17,382
Securities purchased under agreement to resell 1,533,373,313 - - - - - 1,533,373,313
Current accounts of Governments 7,279,247 - - - - - 7,279,247
Investments - local 2,685,705,638 - - - - - 2,685,705,638
Loans, advances and bills of exchange 352,697,329 417,749 - - - - 353,115,078
Assets held with the Reserve Bank of India - 1,384,376 - - - - 1,384,376
Balances due from the Governments of India and
Bangladesh (former East Pakistan) - 9,917,256 - - - - 9,917,256
Other assets 2,675,299 743,347 117,504 559,715 2,307 - 4,098,172
Total financial assets 4,616,873,364 465,551,702 716,429,617 561,328,687 48,498,458 43,586,533 6,452,268,361
Pakistan
Asia (other than
Pakistan) America Europe Australia Others Grand Total
Financial assets
Local currency - coins 488,198 - - - - - 488,198
Foreign currency accounts and investments 19,082,343 490,232,443 841,281,192 534,829,640 91,658,752 - 1,977,084,370
Earmarked foreign currency balances 5,147,596 - - - - - 5,147,596
Special Drawing Rights of the International
Monetary Fund - - 67,656,236 - - - 67,656,236
Reserve tranche with the International Monetary - - - - - -
Fund under quota arrangements - - 17,455 - - - 17,455
Securities purchased under agreement to resell 1,533,574,159 - - - - - 1,533,574,159
Current accounts of Governments 955,474 - - - - - 955,474
Investments - local 2,146,774,755 - - - - - 2,146,774,755
Loans, advances and bills of exchange 339,294,499 423,249 - - - - 339,717,748
Assets held with the Reserve Bank of India - 1,362,034 - - - - 1,362,034
Balances due from the Governments of India and -
Bangladesh (former East Pakistan) - 9,214,881 - - - - 9,214,881
Other assets 2,591,740 1,050,258 25,909 301,694 36,508 - 4,006,109
Total financial assets 4,047,908,764 502,282,865 908,980,792 535,131,334 91,695,260 - 6,085,999,015
State Bank of Pakistan Annual Report FY17
Credit risk is the risk that one party to a financial instrument will fail to discharge an obligation and cause the other party to incur a
financial loss. Credit risk in the Bank's portfolio is monitored, reviewed and analysed by the appropriate officials and the exposure is
controlled through counterparty and credit limits. Counterparties are allocated to a particular class based mainly on their credit rating.
Foreign currency placements are made in approved currencies and government securities. Loans and advances to scheduled banks and
financial institutions are usually secured either by Government guarantees or by demand promissory notes. Equity exposure based on
their nature are not exposed to credit risk. Geographical exposures are controlled by country limits and are updated as and when
necessary with all limits formally reviewed on a periodic basis. The Bank's exposure to credit risk associated with foreign investments is
managed by monitoring compliance with investment limits for counterparties. The Bank's credit risk mainly lies with exposure towards
government sector and financial institutions.
Concentration risk arises when a number of counterparties are engaged in similar business activities or have similar economic features
that would cause their ability to meet contractual obligations to be similarly effected by changes in economic, political or other
conditions. The Bank's significant concentrations arising from financial instruments at the balance sheet date without taking any
collateral held or other credit enhancements is shown below:
2017
---------------------------------------------------------------------------- (Rupees in '000) ----------------------------------------------------------------------------
2016
---------------------------------------------------------------------------- (Rupees in '000) ----------------------------------------------------------------------------
The geographical analyses is based on composition of financial assets in the specific continents other than for Pakistan which has been disclosed separately. All continents
having significant composition have been presented separately while the remaining have been clubbed under "Others".
174

44.2.2 Industrial analysis
Sovereign Supranational Public Sector Banks & Others Grand Total
Entities Financial
Institutions
Financial assets
Local currency - coins 861,860 - - - - 861,860
Foreign currency accounts and investments 831,724,378 213,375,369 2,494,010 718,737,738 16,207,693 1,782,539,188
Earmarked foreign currency balances 10,319,532 - - - - 10,319,532
Special Drawing Rights of the International
Monetary Fund - 63,657,319 - - - 63,657,319
Reserve tranche with the International Monetary
Fund under quota arrangements - 17,382 - - - 17,382
Securities purchased under agreement to resell - - - 1,533,373,313 - 1,533,373,313
Current accounts of Governments 7,279,247 - - - - 7,279,247
Investments - local 2,521,557,198 - 160,249,170 3,899,270 - 2,685,705,638
Loans, advances and bills of exchange 13,340,783 - 32,990,934 296,890,086 9,893,275 353,115,078
Assets held with the Reserve Bank of India 1,384,376 - - - - 1,384,376
Balances due from the Governments of India and
Bangladesh (former East Pakistan) 9,917,256 - - - - 9,917,256
Other assets 1,844,622 252,614 267,856 1,222,763 510,317 4,098,172
Total financial assets 3,398,229,252 277,302,684 196,001,970 2,554,123,170 26,611,285 6,452,268,361
Sovereign Supranational Public Sector Banks & Others Grand Total
Entities Financial
Institutions
Financial assets
Local currency - coins 488,198 - - - - 488,198
Foreign currency accounts and investments 936,159,121 178,478,743 1,087,680 848,890,453 12,468,373 1,977,084,370
Earmarked foreign currency balances 5,147,596 - - - - 5,147,596
Special Drawing Rights of the International
Monetary Fund - 67,656,236 - - - 67,656,236
Reserve tranche with the International Monetary
Fund under quota arrangements - 17,455 - - - 17,455
Securities purchased under agreement to resell - - - 1,533,574,159 - 1,533,574,159
Current accounts of Governments 955,474 - - - - 955,474
Investments - local 2,050,313,403 - - 96,461,352 - 2,146,774,755
Loans, advances and bills of exchange 423,249 - 98,119,245 231,360,884 9,814,370 339,717,748
Assets held with the Reserve Bank of India 1,362,034 - - - - 1,362,034
Balances due from the Governments of India and
Bangladesh (former East Pakistan) 9,214,881 - - - - 9,214,881
Other assets 1,237,025 111,047 - 1,896,310 761,727 4,006,109
Total financial assets 3,005,300,981 246,263,481 99,206,925 2,712,183,158 23,044,470 6,085,999,015
2016
---------------------------------------------------------------------------- (Rupees in '000) ----------------------------------------------------------------------------
2017
---------------------------------------------------------------------------- (Rupees in '000) ----------------------------------------------------------------------------
Unconsolidated Financial Statements of SBP
175

44.3 Credit exposure by credit rating
Sovereign
(44.3.1) AAA AA A BBB
Lower than
BBBUnrated Grand Total
Financial assets
Local currency - coins 861,860 - - - - - - 861,860
Foreign currency accounts and investments 2,818,137 327,909,180 790,607,846 646,085,502 12,836,602 - 2,281,921 1,782,539,188
Earmarked foreign currency balances 10,319,532 - - - - - - 10,319,532
Special Drawing Rights of the International
Monetary Fund - - - - - - 63,657,319 63,657,319
Reserve tranche with the International Monetary
Fund under quota arrangements - - - - - - 17,382 17,382
Securities purchased under agreement to resell - - - 1,532,117,992 - 1,255,321 - 1,533,373,313
Current accounts of Governments 7,279,247 - - - - - - 7,279,247
Investments - local 2,575,717,546 - - - - - - 2,575,717,546
Loans, advances and bills of exchange 13,340,783 106,832,276 204,791,850 17,816,145 - 23,000 10,311,024 353,115,078
Assets held with the Reserve Bank of India - - - - 1,384,376 - - 1,384,376
Balances due from the Governments of India
and Bangladesh (former East Pakistan) - - - - 40,453 9,876,803 - 9,917,256
Other assets 1,844,622 280,764 224,919 889,481 21,250 - 837,136 4,098,172
Total financial assets 2,612,181,727 435,022,220 995,624,615 2,196,909,120 14,282,681 11,155,124 77,104,782 6,342,280,269
Sovereign
(44.3.1) AAA AA A BBB
Lower than
BBBUnrated Grand Total
----------------------------------------------------------(Rupees in 000')---------------------------------------------------------
Financial assets
Local currency - coins 488,198 - - - - - - 488,198
Foreign currency accounts and investments - 340,043,611 950,304,290 655,800,370 11,179,378 19,075,404 681,317 1,977,084,370
Earmarked foreign currency balances 5,147,596 - - - - - - 5,147,596
Special Drawing Rights of the International
Monetary Fund - - - - - - 67,656,236 67,656,236
Reserve tranche with the International Monetary
Fund under quota arrangements - - - - - - 17,455 17,455
Securities purchased under agreement to resell - - - 1,532,762,001 - 812,158 - 1,533,574,159
Current accounts of Governments 955,474 - - - - - - 955,474
Investments - local 2,050,313,403 - - - - - - 2,050,313,403
Loans, advances and bills of exchange 75,846,587 81,063,739 146,636,085 24,650,228 955,253 40,489 10,525,367 339,717,748
Assets held with the Reserve Bank of India - - - - 1,362,034 - - 1,362,034
Balances due from the Governments of India -
and Bangladesh (former East Pakistan) - - - - 40,453 9,174,428 - 9,214,881
Other assets 1,764,564 421,338 487,247 1,093,113 - - 239,847 4,006,109
Total financial assets 2,134,515,822 421,528,688 1,097,427,622 2,214,305,712 13,537,118 29,102,479 79,120,222 5,989,537,663
44.3.1
44.3.2 The collateral held as security against financial assets to cover the credit risk are disclosed in the respective notes.
44.4 Details of financial assets impaired and provisions recorded there against:
2017 2016 2017 2016
Available for sale investment - unlisted 2,431,758 2,431,758 856,863 856,863
Loans and advances - agriculture sector 12,321 18,587 12,321 18,587
Loans and advances - industrial sector 1,054,285 1,054,285 1,054,285 1,054,285
Loans and advances - others 1,063,630 4,267,953 1,063,630 4,267,953
Assets held with the Reserve Bank of India 1,384,376 1,362,034 1,384,376 1,362,034
Balances due from the Governments of India and Bangladesh [(former East Pakistan)
including loans recoverable from financial institutions operating in Bangladesh] 10,340,535 9,638,160 10,340,535 9,638,160
State Bank of Pakistan Annual Report FY17
-----------------------------(Rupees in '000)-----------------------------
Gross Amount Impairment Provision
The credit quality of financial assets is managed by the Bank using external credit ratings. The table below shows the credit quality by class of assets
for all financial assets that are neither past due nor impaired as at the reporting date and are exposed to credit risk, based on the rating of external
rating agencies. The Bank uses lower of the credit rating of Moody's, Standard & Poor's and Fitch to categorise its financial assets in foreign
currency accounts and investments. For domestic financial assets credit rating of JCR-VIS and PACRA are used.
2016
2017
----------------------------------------------------------(Rupees in 000')---------------------------------------------------------
Government securities and balances, pertaining to Pakistan, are rated as sovereign. The international rating of Pakistan is B- (as per Moody's).
176

44.5 Liquidity analysis with interest / mark-up rate risk
44.5.1
Grand
Maturity Maturity Sub-total Maturity Maturity Sub-total Total
up to one after up to one after
year one year year one year
Financial assets
Non-derivatives assets:
Local currency - coins - - - 861,860 - 861,860 861,860
Foreign currency accounts and investments 1,506,549,874 250,388,472 1,756,938,346 22,232,615 679,640 22,912,255 1,779,850,601
Earmarked foreign currency balances - - - 10,319,532 - 10,319,532 10,319,532
Special Drawing Rights of the International
Monetary Fund 63,657,319 - 63,657,319 - - - 63,657,319
Reserve tranche with the International Monetary -
Fund under quota arrangements - - - 17,382 - 17,382 17,382
Securities purchased under agreement to resell 1,533,129,822 - 1,533,129,822 243,491 - 243,491 1,533,373,313
Current accounts of Governments* 7,575,105 - 7,575,105 (295,858) - (295,858) 7,279,247
Investments - local 2,468,370,000 56,900,348 2,525,270,348 150,235,668 10,199,622 160,435,290 2,685,705,638
Loans, advances and bills of exchange 244,254,109 83,641,459 327,895,568 16,492,850 8,726,660 25,219,510 353,115,078
Assets held with the Reserve Bank of India - - - 1,384,376 - 1,384,376 1,384,376
Balances due from the Governments of India and
Bangladesh (former East Pakistan) 9,056,879 - 9,056,879 860,377 - 860,377 9,917,256
Other assets - - - 3,592,061 1,035 3,593,096 3,593,096
5,832,593,108 390,930,279 6,223,523,387 205,944,354 19,606,957 225,551,311 6,449,074,698
Derivatives assets
Foreign currency accounts and investments - 44,081 44,081 2,644,506 - 2,644,506 2,688,587
Other assets - - - 505,076 - 505,076 505,076
- 44,081 44,081 3,149,582 - 3,149,582 3,193,663
Grand Total 5,832,593,108 390,974,360 6,223,567,468 - 209,093,936 19,606,957 228,700,893 - 6,452,268,361
Financial liabilities
Bank notes in circulation - - - 4,167,135,807 - 4,167,135,807 4,167,135,807
Bills payable - - - 630,547 - 630,547 630,547
Current accounts of the Governments* 178,601,965 - 178,601,965 - - - 178,601,965
Current account with SBP Banking Services
Corporation - a subsidiary - - - 50,746,464 - 50,746,464 50,746,464
Current account with National Institute of Banking -
and Finance (Guarantee) Limited - a subsidiary - - - 135,612 - 135,612 135,612
Payable to Islamic Banking Institutions
against Bai Muajjal transactions 25,098,651 - 25,098,651 38,579 - 38,579 25,137,230
Payable under bilateral currency swaps agreements 154,669,000 - 154,669,000 881,410 - 881,410 155,550,410
Deposits of banks and financial institutions 96,686,622 - 96,686,622 572,650,917 - 572,650,917 669,337,539
Other deposits and accounts 85,599,474 - 85,599,474 78,427,809 - 78,427,809 164,027,283
Payable to the International Monetary Fund 144,192,970 622,436,124 766,629,094 20,752,172 - 20,752,172 787,381,266
Other liabilities - - - 19,157,376 - 19,157,376 19,157,376
684,848,682 622,436,124 1,307,284,806 4,910,556,693 - 4,910,556,693 6,217,841,499
On balance sheet gap (a) 5,147,744,426 (231,461,764) 4,916,282,662 (4,701,462,757) 19,606,957 (4,681,855,800) 234,426,862
Foreign currency forward and swap contracts - sale - - - (935,079,726) - (935,079,726) (935,079,726)
Foreign currency forward and swap contracts -
purchase - - - 498,678,723 - 498,678,723 498,678,723
Futures - sale - - - (43,038,829) - (43,038,829) (43,038,829)
Futures - purchase - - - 35,430,566 - 35,430,566 35,430,566
Capital Commitments - - - (189,027) (189,027) (189,027)
Off balance sheet gap - - - (444,198,293) - (444,198,293) (444,198,293)
Total yield / interest risk sensitivity gap 5,147,744,426 (231,461,764) 4,916,282,662 (4,257,264,464) 19,606,957 (4,237,657,507) 678,625,155
Cumulative yield / interest risk sensitivity gap 5,147,744,426 4,916,282,662 9,832,565,324 5,575,300,860 5,594,907,817 1,357,250,310 1,357,250,310
Contingent liabilities in respect of guarantees given - - - 3,384,264 20,608,998 23,993,262 23,993,262
(a) On-balance sheet gap represents the net amounts of on-balance sheet items.
*
Unconsolidated Financial Statements of SBP
Interest / mark-up rate risk is the risk that the value of a financial instrument will fluctuate due to changes in the market interest / mark-up rates. The Bank has adopted
appropriate policies to minimise its exposure to this risk.
2017
Interest / mark-up bearing Non interest / mark-up bearing
---------------------------------------------------------------------------- (Rupees in '000) ----------------------------------------------------------------------------
The Bank has the contractual right and intention to offset these balances against their respective non-interest bearing deposit balances. Mark-up on these balances is charged only when these balances are in debit
177

Grand
Maturity Maturity Sub-total Maturity Maturity Sub-total Total
up to one after up to one after
year one year year one year
Financial assets
Non-derivatives assets:
Local currency - coins - - - 488,198 - 488,198 488,198
Foreign currency accounts and investments 1,623,513,653 348,154,813 1,971,668,466 8,639,389 681,344 9,320,733 1,980,989,199
Earmarked foreign currency balances - - - 5,147,596 - 5,147,596 5,147,596
Special Drawing Rights of the International
Monetary Fund 67,656,236 - 67,656,236 - - - 67,656,236
Reserve tranche with the International Monetary -
Fund under quota arrangements - 17,455 17,455 17,455
Securities purchased under agreement to resell 1,533,280,018 - 1,533,280,018 294,141 - 294,141 1,533,574,159
Current accounts of Governments 2,955,474 2,955,474 (2,000,000) (2,000,000) 955,474
Investments - local 2,017,100,000 2,740,000 2,019,840,000 126,934,755 - 126,934,755 2,146,774,755
Loans, advances and bills of exchange 297,929,581 30,352,200 328,281,781 2,694,854 8,741,113 11,435,967 339,717,748
Assets held with the Reserve Bank of India - 1,362,034 1,362,034 1,362,034
Balances due from the Governments of India and -
Bangladesh (former East Pakistan) 8,354,504 - 8,354,504 860,377 - 860,377 9,214,881
Other assets - - - 2,563,293 319 2,563,612 2,563,612
5,550,789,466 381,247,013 5,932,036,479 147,002,092 9,422,776 156,424,868 6,088,461,347
Derivatives assets
Other assets - - - 1,442,497 - 1,442,497 1,442,497
Grand Total 5,550,789,466 381,247,013 5,932,036,479 148,444,589 9,422,776 157,867,365 6,089,903,844
Financial liabilities
Bank notes in circulation - - - 3,554,922,057 3,554,922,057 3,554,922,057
Bills payable - - - 598,142 598,142 598,142
Current accounts of the Governments* - - - 606,657,778 606,657,778 606,657,778
Current account with SBP Banking Services
Corporation - a subsidiary - - - 47,810,651 47,810,651 47,810,651
Current account with National Institute of Banking -
and Finance (Guarantee) Limited - a subsidiary - 22,818 22,818 22,818
Payable to Islamic Banking Institutions -
against Bai Muajjal transactions 44,068,109 44,068,109 884,829 884,829 44,952,938
Payable under bilateral currency swaps agreements 157,812,000 - 157,812,000 695,631 - 695,631 158,507,631
Deposits of banks and financial institutions - - - 391,760,469 - 391,760,469 391,760,469
Other deposits and accounts 87,730,857 - 87,730,857 73,729,337 - 73,729,337 161,460,194
Payable to the International Monetary Fund 144,554,785 633,076,488 777,631,273 - 1,108,232 1,108,232 778,739,505
Other liabilities - - - 20,471,428 - 20,471,428 20,471,428
434,165,751 633,076,488 1,067,242,239 4,697,553,140 1,108,232 4,698,661,372 - 5,765,903,611
Derivative Liabilities
Foreign currency accounts and investments - (103,955) (103,955) 906,473 3,102,311 4,008,784 3,904,829
434,165,751 632,972,533 1,067,138,284 4,698,459,613 4,210,543 4,702,670,156 5,769,808,440
On balance sheet gap (a) 5,116,623,715 (251,725,520) 4,864,898,195 (4,550,015,024) 5,212,233 (4,544,802,791) 320,095,404
Foreign currency forward and swap contracts - sale - - - (802,656,331) - (802,656,331) (802,656,331)
Foreign currency forward and swap contracts -
purchase - - - 595,499,305 - 595,499,305 595,499,305
Futures - sale - - - (18,044,108) - (18,044,108) (18,044,108)
Futures - purchase 14,656,485 - 14,656,485 14,656,485
Capital Commitments - - - (386,844) (386,844) (386,844)
Off balance sheet gap - - - (210,931,493) - (210,931,493) (210,931,493)
Total yield / interest risk sensitivity gap 5,116,623,715 (251,725,520) 4,864,898,195 (4,339,083,531) 5,212,233 (4,333,871,298) 531,026,897
Cumulative yield / interest risk sensitivity gap 5,116,623,715 4,864,898,195 9,729,796,390 5,390,712,859 5,395,925,092 1,062,053,794 1,062,053,794
Contingent liabilities in respect of guarantees given - - - 4,022,903 25,070,092 29,092,995 29,092,995
(a) On-balance sheet gap represents the net amounts of on-balance sheet items.
*
44.5.2
44.6 Interest rate risk
44.6.1 Cash flow interest rate risk
State Bank of Pakistan Annual Report FY17
Cash flow interest rate risk is the risk of loss arising from changes in variable interest rates. The sensitivity analysis below have been determined based on the exposure to
interest rates for floating rate assets and liabilities. The analysis is prepared assuming the amount of average assets and liabilities outstanding at the balance sheet date was
outstanding for the whole year.
The Bank has the contractual right and intention to offset these balances against their respective non-interest bearing deposit balances. Mark-up on these balances is charged only when these balances are in debit.
2016
Interest / mark-up bearing Non interest / mark-up bearing
---------------------------------------------------------------------------- (Rupees in '000) ----------------------------------------------------------------------------
The effective interest / mark-up rate for the monetary financial assets and liabilities are mentioned in their respective notes to the financial statements.
178

44.6.2 Fair value interest rate risk
Fair value interest rate risk is the risk that the value of a financial instrument will fluctuate because of changes in market interest rates.
44.7 Currency risk management
2017 2016
US Dollar 1,072,083,483 1,270,462,855
Pound Sterling (62,074,847) (78,830,048)
Chinese Yuan (87,260,316) (3,698,119)
Euro (224,807,106) (268,904,801)
Japanese Yen (55,935,160) (48,103,822)
United Arab Emirates Dirham 1,625,688 6,190,362
Australian Dollar (139,679) (92,021)
Canadian Dollar (19,128) 22,191
Others 35,014,019 152,216
678,486,954 877,198,813
44.8 Price Risk
Net exposure in Special Drawing Rights (SDR) is allocated to its five basket currencies i.e. the US dollar, the Euro, the Chinese
renminbi, the Japanese yen and the British pound sterling in the ratio of their percentage allocated by IMF for SDR basket.
The composition of the Bank's financial instruments and the correlation thereof to different variables is expected to change over time.
Accordingly, the sensitivity analyses in note 44.6 and 44.7 to these unconsolidated financial statements is prepared as of June 30, 2017
are not necessarily indicative of the effects on the Bank's profit and loss of future movements in different variables.
Price risk is the risk that the fair value or future cash flows of a financial instrument will fluctuate because of changes in market prices
(other than those arising from interest rate risk or currency risk) whether those changes are caused by factors specific to the individual
financial instrument or its issuer or factors affecting all similar financial instruments traded in the market.
If interest rates had been 10 basis points higher/ lower and all other variables were held constant, the bank's profit for the year ended
June 30, 2017 would increase / decrease by Rs. 806.82 million (2016: Rs. 566 million). This is mainly attributable to the Bank's
exposure to interest rates on its variable rate instruments.
The Bank also enters into forward foreign exchange contracts with the commercial banks and financial institutions to hedge against the
currency risk on foreign currency transactions.
The Bank does not keep a sizable portion of its foreign currency accounts and investments in floating rate securities, therefore the
profit / loss attributable to the Bank exposure to interest rate on its variable rate instruments is negligible.
The Bank is exposed to fair value interest rate risk on its fixed income securities, classified as financial assets at fair value through
profit or loss. To manage its fair value interest rate risk arising from investments in these securities, the management adopts practices
mentioned in note 44.10 to these unconsolidated financial statements.
As at June 30, 2017, a 10 basis points shift in market value, mainly as a result of change in interest rates with all other variables held
constant, would result in profit for the year to increase by Rs. 1,562.32 million (2016: Rs. 1,897.5 million) or decrease by Rs 1,565.47
million (2016: Rs. 1,918.47 million) mainly as a result of a increase or decrease in the fair value of fixed rate financial assets classified
as financial asset at fair value through profit and loss.
Currency risk is the risk that the value of a financial instrument will fluctuate due to changes in foreign exchange rates. Foreign
currency activities result mainly from the Bank's holding of foreign currency assets under its foreign reserves management function
and the overall level of these assets is determined based on the prevailing extent of credit and liquidity risks. In order to avoid losses
arising from adverse changes in the rates of exchange, the Bank's compliance with the limits established for foreign currency positions
is being regularly monitored by the management.
The Bank also holds from time to time, foreign currency assets and liabilities that arise from the implementation of domestic monetary
policies. Any foreign currency exposure relating to these implementation activities are hedged through the use of foreign currency
forwards, swaps and other transactions.
The sensitivity analysis calculates the effect of reasonably possible movement of the currency rate against Pak Rupee, with all other
variables held constant, on the profit and loss account and equity. If the Rupee had weakened / strengthened 1 percent against the
principal currencies to which the Bank had significant exposure as at June 30, 2017 with all other variables constant profit for the year
would have been Rs. 6,784.87 million higher / lower (2016: Rs. 8,771.99 million). Net foreign currency exposure of the Bank is as
follows:
(Rupees in '000)
Unconsolidated Financial Statements of SBP
179

44.9 Liquidity risk management
44.10 Portfolio risk management
45 FAIR VALUE OF FINANCIAL INSTRUMENTS
2017 2016 2017 2016
Financial assets
Local currency - coins 861,860 488,198 861,860 488,198
Foreign currency accounts and investments 1,782,539,188 1,977,084,370 1,782,539,188 1,977,084,370
Earmarked foreign currency balances 10,319,532 5,147,596 10,319,532 5,147,596
Special Drawing Rights of the International Monetary Fund 63,657,319 67,656,236 63,657,319 67,656,236
Reserve tranche with the International Monetary Fund
under quota arrangements 17,382 17,455 17,382 17,455
Securities purchased under agreement to resell 1,533,373,313 1,533,574,159 1,533,373,313 1,533,574,159
Current accounts of Governments 7,279,247 955,474 7,279,247 955,474
Investments - local 2,786,883,898 2,147,804,015 2,786,883,898 2,147,804,015
Loans, advances and bills of exchange 353,115,078 339,717,748 353,115,078 339,717,748
Assets held with the Reserve Bank of India 1,384,376 1,362,034 1,384,376 1,362,034
Balances due from the Governments of India and
Bangladesh (former East Pakistan) 9,917,256 9,214,881 9,917,256 9,214,881
Other assets 4,098,172 4,006,109 4,098,172 4,006,109
State Bank of Pakistan Annual Report FY17
Fair value is the price that would be received to sell an asset or paid to transfer a liability in an orderly transaction between market
participants at the measurement date. The following tables summarizes the carrying amounts and fair values of financial assets and
liabilities.
Carrying Value Fair value
-----------------------------(Rupees in '000)-----------------------------
The Bank has appointed external managers to invest a part of the foreign exchange reserves in international fixed income securities. The
external managers are selected after conducting a thorough due diligence by the Bank and externally hired investment consultants, and
appointed after the approval of the Board. The mandates awarded to the managers require them to outperform the benchmarks which are
based on fixed income global aggregate indices. The benchmarks are customised to exclude certain securities, currencies, and maturities
to bring it to an acceptable level of risk and within the Bank's approved risk appetite. Managers are provided investment guidelines
within which they have to generate excess returns over the benchmark. Safe custody of the portfolio is provided through carefully
selected global custodian who is independent of the portfolio managers. The custodian also provides valuation, compliance, corporate
actions and recovery, and other value added services which are typically provided by such custodian. The valuations provided by the
custodian are reconciled with the portfolio managers, and recorded accordingly.
The Bank is exposed to equity securities price risk because of investment in listed equity securities by the Bank classified as available-
for-sale. These investments are held as per the specific directives of the Government of Pakistan in accordance with the provisions of the
State Bank of Pakistan Act, 1956 and other relevant statutes. Accordingly, price risk on listed equity securities can not be managed by
the Bank.
In case of 5% increase or decrease in KSE 100 index on June 30, 2017, other comprehensive income would increase or decrease by Rs.
945.623 million (2016: Rs. 901.429 million) and equity of the Bank would increase or decrease by the same amount as a result of gains
/ (losses) on equity securities classified as available-for-sale.
The analysis is based on the assumption that the equity index would increase or decrease by 5% with all other variables held constant
and all the Bank’s equity instruments move according to the historical correlation with the index. This represents management's best
estimate of a reasonable possible shift in the KSE 100 index. The composition of the Bank's investment portfolio and the correlation
thereof to the KSE index is expected to change over time. Accordingly, the sensitivity analysis prepared as of June 30, 2017 is not
necessarily indicative of the effect on the Bank's equity instruments of future movements in the level of KSE 100 index.
Liquidity risk is the risk that an entity will encounter difficulty in raising funds to meet commitments associated with the financial
instruments. In order to reduce the level of liquidity risk arising out of the local currency activities, the Bank manages the daily liquidity
position of the banking system including advancing and withdrawal of funds from the system for smoothening out daily peaks and
troughs.
The risk arising out of the Bank's obligations for foreign currency balances or deposits is managed through available reserves generated
mainly from borrowings and open market operations. The maturity profile of Bank's financial assets and financial liabilities is given in
note 44.5.1 to these unconsolidated financial statements.
180

2017 2016 2017 2016
Financial Liability
Bank notes in circulation 4,167,135,807 3,554,922,057 4,167,135,807 3,554,922,057
Bills payable 630,547 598,142 630,547 598,142
Current accounts of Governments 178,601,965 606,657,778 178,601,965 606,657,778
Current account with SBP Banking Services Corporation - a subsidiary 50,746,464 47,810,651 50,746,464 47,810,651
Current account with National Institute of Banking
and Finance (Guarantee) Limited - a subsidiary 135,612 22,818 135,612 22,818
Payable to Islamic Banking Institutions against Bai
Muajjal transactions 25,137,230 44,952,938 25,137,230 44,952,938
Payable under bilateral currency swap agreement 155,550,410 158,507,631 155,550,410 158,507,631
Deposits of banks and financial institutions 669,337,539 391,760,469 669,337,539 391,760,469
Other deposits and accounts 164,027,283 161,460,194 164,027,283 161,460,194
Payable to the International Monetary Fund 787,381,266 778,739,505 787,381,266 778,739,505
Other liabilities 19,157,376 20,471,428 19,157,376 20,471,428
45.1
-
-
-
Level 1 Level 2 Level 3 Total
Recurring Fair Value Measurements
On balance sheet
Financial Assets
Foreign currency accounts and investments - held for trading 379,452,397 - - 379,452,397
Investments - local 94,406,896 - - 94,406,896
Non-Financial Assets
Operating fixed assets (Land and buildings) - - 56,439,673 56,439,673
Gold reserves held by the Bank 270,361,202 - - 270,361,202
744,220,495 - 56,439,673 800,660,168
Off balance sheet
Foreign currency forward and swap contracts - sale - 935,079,726 - 935,079,726
Foreign currency forward and swap contracts - purchase - 498,678,723 - 498,678,723
Futures - sale 43,038,829 - - 43,038,829
Futures - purchase 35,430,566 - - 35,430,566
Non-Recurring Fair Value Measurements
On balance sheet
Financial Assets
Investments - local - 54,160,348 11,681,926 65,842,274
Level 1 Level 2 Level 3 Total
Recurring Fair Value Measurements
On balance sheet
Financial Assets
Foreign currency accounts and investments - held for trading 269,942,861 - - 269,942,861
Investments - local 92,487,082 - - 92,487,082
Non-Financial Assets
Operating fixed assets (Land and buildings) - - 58,344,593 58,344,593
Gold reserves held by the Bank 287,170,323 - - 287,170,323
649,600,266 - 58,344,593 707,944,859
Off balance sheet
Foreign currency forward and swap contracts - sale - 802,656,331 - 802,656,331
Foreign currency forward and swap contracts - purchase - 595,499,305 - 595,499,305
Futures - sale 18,044,108 - - 18,044,108
Futures - purchase 14,656,485 - - 14,656,485
-----------------------------(Rupees in '000)-----------------------------
-----------------------------(Rupees in '000)-----------------------------
Inputs for the assets or liabilities that are not based on observable market data (i.e. unobservable inputs e.g. estimated future cash
flows) (Level 3).
The table below analyses financial and non-financial assets carried at fair value, by valuation method. The different levels have been
defined as follows:
Quoted prices (unadjusted) in active markets for identical assets or liabilities (Level 1).
Inputs other than quoted prices included within level 1 that are observable for the asset or liability, either directly (that is, as
prices) or indirectly (that is, derived from prices) (Level 2).
Carrying Value Fair value
2017
-----------------------------(Rupees in '000)-----------------------------
2016
Unconsolidated Financial Statements of SBP
181

There were no transfers between levels 1 and 2 during the year.
(a) Financial assets in level 1
(b) Financial assets in level 2
(c) Financial assets in level 3
45.2 Valuation techniques used in determination of fair values within level 2 and level 3
Decrease in
assumption by
50 basis points
ZTBL
Preference
shares
7.94%
Discounted
Cashflow
Method
Risk free
discount rate for
a 10 year
Instrument
1,860,218
17.50% Risk adjusted
discount rate80,312
2.82%Disbursement
level(481,872)
15.85% Deposits growth (321,248)
14.66% Risk adjusted
discount rate16,364
8.00%Disbursement
level(4,298)
Operating fixed assets (Land and building)
The finance department of the Bank includes a team which performed the valuations of preference shares of
ZTBL and ordinary shares of ZTBL and HBFCL acquired during the year as more fully explained in notes
13.2.1 and 13.2.2 respectively to these unconsolidated financial statements. The team reports to the Director
Finance and is responsible for ensuring that the final reported fair value figures are in accordance with IFRS.
Increase in
assumption by
50 basis points
(1,799,149)
13,678
Land and buildings are revalued to their fair values on a periodic basis by involving professional valuers.
The fair values of land and building are determined by physically analysing the condition of land and
building and in case of land by ascertaining the current market value of similar land, which is selling in near
vicinity. Moreover, for buildings, the valuer has also considered prevailing current cost of construction for
relevant type of civil work carried out thereon, where ever required. The management considers the above
parameters used as the "highest and best use" and best evidence of fair value for its land and building. Note
16.2 to these unconsolidated financial statements highlights the year of valuation and external valuer name.
The effect of changes in the unobservable inputs used in the valuations cannot be determined with certainty.
Accordingly, a qualitative disclosure of sensitivity has not been presented in these unconsolidated financial
statements.
1,084,212
(16,364)
Relationship of unobservable
inputs to fair value
ZTBL
Ordinary
Shares
The Bank's policy is to recognise transfers into and out of the different fair value hierarchy levels at the date the event or change in
circumstances that caused the transfer occurred.
Financial assets included in level 1 comprise of financial instruments in note 7.1 related to foreign currency accounts and investments
and investment in listed shares in note 12.2 classified as available-for-sale.
Item
Financial assets included in level 2 comprise of prefernce shares of ZTBL as disclosed in note 12 classified as held to maturity,
derivative financial assets in note 7.1 related to foreign currency accounts and investments and other assets in note 18 classified at fair
value through profit or loss.
Forward foreign exchange contracts
Valuation approach and input used
The valuation has been determined by interpolating the mid rates announced by State Bank of Pakistan.
1,646,396
Investment in unlisted preference and
ordinary shares
State Bank of Pakistan Annual Report FY17
Certain categories of operating fixed assets (land and building) and unlisted equity shares of ZTBL and HBFCL are classified as level 3
fair value.
Description Range of InputsValuation
method
Un-observable
Inputs
(Rupees in '000)
HBFCL
Ordinary
Shares
Dividend
Discount
Model
Cash Flow to
Equity
(80,312)
182

-
-
-
46 CLASSIFICATION OF FINANCIAL INSTRUMENTS
Loans and Assets at fair Held to Available for Total
receivables value through maturity sale
profit or loss
Financial assets
Local currency - coins 861,860 - - - 861,860
Foreign currency accounts and investments 1,063,277,816 382,140,984 337,120,388 - 1,782,539,188
Earmarked foreign currency balances 10,319,532 - - - 10,319,532
Special Drawing Rights of the International Monetary Fund 63,657,319 - - - 63,657,319
Reserve tranche with the International Monetary Fund
under quota arrangements 17,382 - - - 17,382
Securities purchased under agreement to resell 1,533,373,313 - - - 1,533,373,313
Current accounts of Governments 7,279,247 - - - 7,279,247
Investments - local 2,521,557,198 - 54,160,348 109,988,092 2,685,705,638
Loans, advances and bills of exchange 353,115,078 - - - 353,115,078
Assets held with the Reserve Bank of India 1,384,376 - - - 1,384,376
Balances due from the Governments of India and
Bangladesh (former East Pakistan) 9,917,256 - - - 9,917,256
Other assets 3,593,096 505,076 - - 4,098,172
Loans and Assets at fair Held to Available for Total
receivables value through maturity sale
profit or loss
Financial assets
Local currency - coins 488,198 - - - 488,198
Foreign currency accounts and investments 1,472,496,928 266,038,032 238,549,410 - 1,977,084,370
Earmarked foreign currency balances 5,147,596 - - - 5,147,596
Special Drawing Rights of the International Monetary Fund 67,656,236 - - - 67,656,236
Reserve tranche with the International Monetary Fund
under quota arrangements 17,455 - - - 17,455
Securities purchased under agreement to resell 1,533,574,159 - - - 1,533,574,159
Current accounts of Governments 955,474 - - - 955,474
Investments - local 2,050,313,403 - - 96,461,352 2,146,774,755
Loans, advances and bills of exchange 339,717,748 - - - 339,717,748
Assets held with the Reserve Bank of India 1,362,034 - - - 1,362,034
Balances due from the Governments of India and -
Bangladesh (former East Pakistan) 9,214,881 - - - 9,214,881
Other assets 2,563,612 1,442,497 - - 4,006,109
Deposits growth of the entities based on the historic trends of similar entities in the market. The deposits
growth is critical from the point of having sufficient cash flows to pay dividend.
The main level 3 inputs used by the Bank are derived and evaluated as follows:
Discount margin/spreads represent the discount rates used when calculating the present value of future
cash flows. In discounted cash flow models such spreads are added to the benchmark rate when
discounting the future expected cash flows. Hence, these spreads reduce the net present value of an asset
or increase the value of a liability. They generally reflect the premium an investor expects to achieve over
the benchmark interest rate to compensate for the higher risk driven by the uncertainty of the cash flows
caused by the credit quality of the asset. They can be implied from market prices and are usually
unobservable for illiquid or complex instruments.
Discount rates used for cashflows in the Dividend Discount Method (DDM) which is based on post-tax
rate that reflects expected return on similar types of entities by the investors. This also takes into account
the risks being faced by similar types of entities.
Disbursement growth level on a year to year basis keeping in view the past trends of the entities, general
market conditions and market penetration.
Valuation approach and input used
Unconsolidated Financial Statements of SBP
----------------------------------------------------------(Rupees in '000)----------------------------------------------------------
2016
----------------------------------------------------------(Rupees in '000)----------------------------------------------------------
Item
2017
183

Carried at Liabilities at fair Total
amortised value through
cost profit or loss
Financial liabilities
Bank notes in circulation 4,167,135,807 - 4,167,135,807
Bills payable 630,547 - 630,547
Current accounts of Governments 178,601,965 - 178,601,965
Current account with SBP Banking Services Corporation - a subsidiary 50,746,464 - 50,746,464
Current account with National Institute of Banking and Finance
(Guarantee) Limited - a subsidiary 135,612 - 135,612
Payable to Islamic Banking Institutions against Bai Muajjal transactions 25,137,230 - 25,137,230
Payable under bilateral currency swap agreement 155,550,410 - 155,550,410
Deposits of banks and financial institutions 669,337,539 - 669,337,539
Other deposits and accounts 164,027,283 - 164,027,283
Payable to the International Monetary Fund 787,381,266 - 787,381,266
Other liabilities 19,157,376 - 19,157,376
Carried at Liabilities at fair Total
amortised value through
cost profit or loss
Financial liabilities
Bank notes in circulation 3,554,922,057 - 3,554,922,057
Bills payable 598,142 - 598,142
Current accounts of Governments 606,657,778 - 606,657,778
Current account with SBP Banking Services Corporation - a subsidiary 47,810,651 - 47,810,651
Current account with National Institute of Banking and Finance
(Guarantee) Limited - a subsidiary 22,818 - 22,818
Payable to Islamic Banking Institutions against Bai Muajjal transactions 44,952,938 - 44,952,938
Payable under bilateral currency swap agreement 158,507,631 - 158,507,631
Deposits of banks and financial institutions 391,760,469 - 391,760,469
Other deposits and accounts 161,460,194 - 161,460,194
Payable to the International Monetary Fund 778,739,505 - 778,739,505
Other liabilities 20,471,428 - 20,471,428
47 NON-ADJUSTING EVENT
48
49
TO 2016
Intangible assets
21,153
50 GENERAL
Figures have been rounded off to the nearest thousand rupees, unless otherwise stated.
____________________________ ____________________________ ____________________________
Tariq Bajwa Riaz Riazuddin Inayat Hussain
Governor Deputy Governor Executive Director
----------------------------------------------------------(Rupees in '000)----------------------------------------------------------
----------------------------------------------------------(Rupees in '000)----------------------------------------------------------
Capital work-in-progress
2017
Rupees in '000
FROM
Property, plant and equipment
Capital work-in-progress
State Bank of Pakistan Annual Report FY17
The Board of Directors of the Bank in their meeting held on October 26, 2017 have appropriated an amount of Rs 13,771.22 million to "Revenue Reserve". The balance of profit after allocation of such appropriation will be transferred to the Government of Pakistan. The financial statements of the Bank for the year ended June 30, 2017 do not include the effect of above appropriation and transfer of balance profit to the Government of Pakistan, which will be accounted for in the financial statements of the Bank for the year ending June 30, 2018.
DATE OF AUTHORISATION
These financial statements were authorised for issue on October 26, 2017 by the Board of Directors of the Bank.
CORRESPONDING FIGURES
Corresponding figures have been rearranged and reclassified, wherever necessary for the purpose of better presentation and comparison. No significant reclassifications have been made during the current year except for the following:
2016
184

11 Financial Statements of SBP-BSC (Bank)
A. F. FERGUSON & CO.
Chartered Accountants
State Life Building No. 1-C
I. I. Chundrigar Road
P.O. Box 4716
Karachi-74000
EY FORD RHODES
Chartered Accountants
Progressive Plaza
Beaumont Road
P. O. Box 15541
Karachi-75530
Independent Auditor's Report
To the Board of Directors and State Bank of Pakistan
Opinion
We have audited the financial statements of the SBP Banking Services Corporation (the Corporation),
which comprise the balance sheet as at June 30, 2017, and the profit and loss account, statement of
comprehensive income, statement of changes in equity and statement of cash flows for the year then
ended, and notes to the financial statements, including a summary of significant accounting policies.
In our opinion, the accompanying financial statements give a true and fair view of the financial
position of the Corporation as at June 30, 2017, and of its financial performance and its cash flows for
the year then ended in accordance with International Financial Reporting Standards (IFRSs).
Basis for Opinion
We conducted our audit in accordance with International Standards on Auditing (ISAs). Our
responsibilities under those standards are further described in the ‘Auditor’s Responsibilities for the
Audit of the Financial Statements’ section of our report. We are independent of the Corporation in
accordance with the International Ethics Standards Board for Accountants’ Code of Ethics for
Professional Accountants as adopted by the Institute of Chartered Accountants of Pakistan (the Code),
and we have fulfilled our other ethical responsibilities in accordance with these requirements and the
Code. We believe that the audit evidence we have obtained is sufficient and appropriate to provide a
basis for our opinion.
Responsibilities of Management and Those Charged with Governance for the Financial
Statements
Management is responsible for the preparation and fair presentation of the financial statements in
accordance with IFRSs, and for such internal control as management determines is necessary to
enable the preparation of financial statements that are free from material misstatement, whether due to
fraud or error.
In preparing the financial statements, management is responsible for assessing the Corporation’s
ability to continue as a going concern, disclosing, as applicable, matters related to going concern and
185

State Bank of Pakistan Annual Report FY17
A. F. FERGUSON & CO.
Chartered Accountants EY FORD RHODES
Chartered Accountants
using the going concern basis of accounting unless management either intends to liquidate the
Corporation or to cease operations, or has no realistic alternative but to do so.
Those charged with governance are responsible for overseeing the Corporation’s financial reporting
process.
Auditor’s Responsibilities for the Audit of the Financial Statements
Our objectives are to obtain reasonable assurance about whether the financial statements as a whole
are free from material misstatement, whether due to fraud or error, and to issue an auditor’s report that
includes our opinion. Reasonable assurance is a high level of assurance, but is not a guarantee that an
audit conducted in accordance with ISAs will always detect a material misstatement when it exists.
Misstatements can arise from fraud or error and are considered material if, individually or in the
aggregate, they could reasonably be expected to influence the economic decisions of users taken on
the basis of these financial statements.
As part of an audit in accordance with ISAs, we exercise professional judgment and maintain
professional skepticism throughout the audit. We also:
Identify and assess the risks of material misstatement of the financial statements, whether due
to fraud or error, design and perform audit procedures responsive to those risks, and obtain
audit evidence that is sufficient and appropriate to provide a basis for our opinion. The risk of
not detecting a material misstatement resulting from fraud is higher than for one resulting
from error, as fraud may involve collusion, forgery, intentional omissions, misrepresentations,
or the override of internal control.
Obtain an understanding of internal control relevant to the audit in order to design audit
procedures that are appropriate in the circumstances, but not for the purpose of expressing an
opinion on the effectiveness of the Corporation’s internal control.
Evaluate the appropriateness of accounting policies used and the reasonableness of
accounting estimates and related disclosures made by management.
Conclude on the appropriateness of management’s use of the going concern basis of
accounting and, based on the audit evidence obtained, whether a material uncertainty exists
related to events or conditions that may cast significant doubt on the Corporation’s ability to
continue as a going concern. If we conclude that a material uncertainty exists, we are required
to draw attention in our auditor’s report to the related disclosures in the financial statements
or, if such disclosures are inadequate, to modify our opinion. Our conclusions are based on
the audit evidence obtained up to the date of our auditor’s report. However, future events or
conditions may cause the Corporation to cease to continue as a going concern.
Evaluate the overall presentation, structure and content of the financial statements, including
the disclosures, and whether the financial statements represent the underlying transactions and
events in a manner that achieves fair presentation.
186

Financial Statements of SBP-BSC (Bank)
A. F. FERGUSON & CO.
Chartered Accountants EY FORD RHODES
Chartered Accountants
We communicate with those charged with governance regarding, among other matters, the planned
scope and timing of the audit and significant audit findings, including any significant deficiencies in
internal control that we identify during our audit.
We also provide those charged with governance with a statement that we have complied with relevant
ethical requirements regarding independence, and to communicate with them all relationships and
other matters that may reasonably be thought to bear on our independence, and where applicable,
related safeguards.
A. F. Ferguson & Co.
Chartered Accountants Karachi
Salman Hussain
Audit Engagement Partner
Dated: October 27, 2017
EY Ford Rhodes
Chartered Accountants
Karachi
Omer Chughtai
Audit Engagement Partner
187

Note 2017 2016
ASSETS
Current account with the State Bank of Pakistan 50,746,464 47,810,651
Investments 5 532,178 525,525
Employee loans 6 9,481,894 10,853,432
Advances, deposits and prepayments 7 49,581 64,601
Medical and stationery consumables 8 164,822 138,878
Property and equipment 9 880,477 486,205
Total assets 61,855,416 59,879,292
LIABILITIES
Deposits and other liabilities 10 5,657,276 5,332,294
Deferred liabilities - unfunded staff retirement benefits 11 55,198,140 53,546,998
Total liabilities 60,855,416 58,879,292
Net assets 1,000,000 1,000,000
REPRESENTED BY:
Share capital 12 1,000,000 1,000,000
CONTINGENCIES AND COMMITMENTS 13
The annexed notes from 1 to 23 form an integral part of these financial statements.
___________________________ ___________________________
Qasim Nawaz Muhammad Habib Khan
Managing Director Director Accounts
State Bank of Pakistan Annual Report FY17
------(Rupees in '000)------
SBP BANKING SERVICES CORPORATION
BALANCE SHEET
AS AT JUNE 30, 2017
188

SBP BANKING SERVICES CORPORATION
PROFIT AND LOSS ACCOUNT
FOR THE YEAR ENDED JUNE 30, 2017
Note 2017 2016
Discount and interest earned 14 31,352 38,008
Net operating expenses 15 12,495,138 13,955,950
Reimbursable from the State Bank of Pakistan (7,423,955) (7,544,251)
Allocated to the State Bank of Pakistan (5,071,183) (6,411,699)
- -
Operating profit 31,352 38,008
Gain on disposal of property and equipment 10,220 1,123
Other income - 896
Profit for the year 41,572 40,027
The annexed notes from 1 to 23 form an integral part of these financial statements.
___________________________ ___________________________
Qasim Nawaz Muhammad Habib Khan
Managing Director Director Accounts
------(Rupees in '000)------
Financial Statements of SBP-BSC (Bank)
189
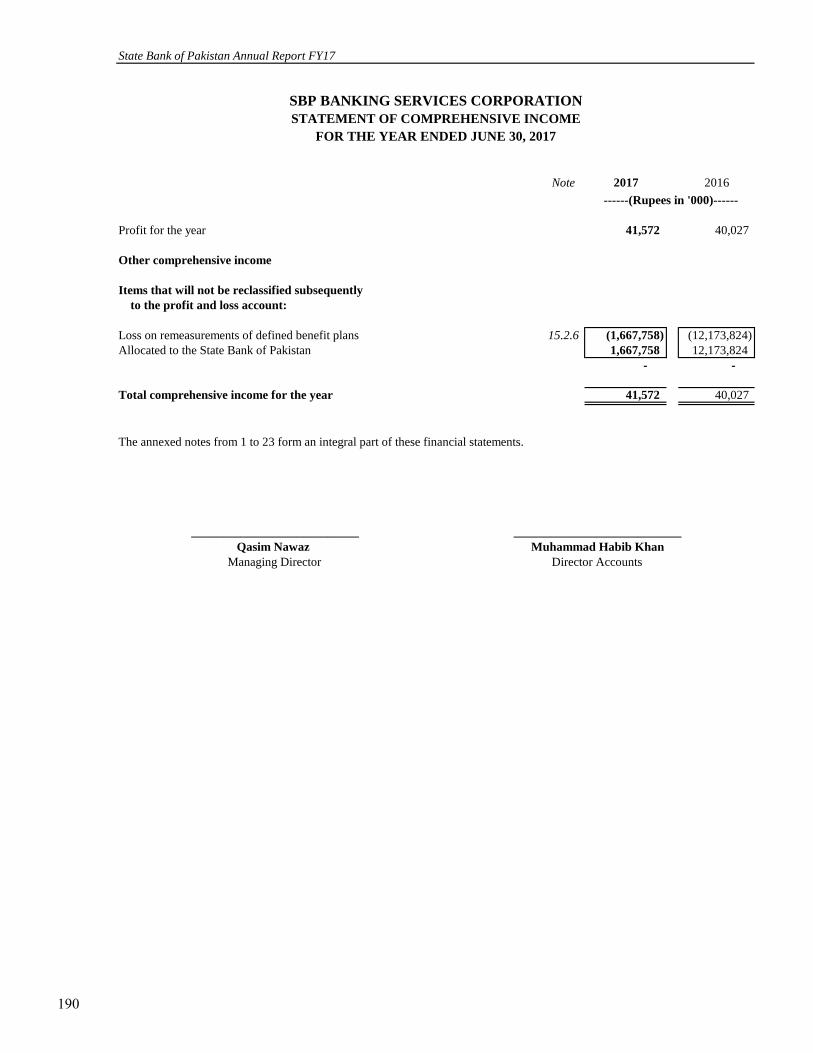
SBP BANKING SERVICES CORPORATION
STATEMENT OF COMPREHENSIVE INCOME
FOR THE YEAR ENDED JUNE 30, 2017
Note 2017 2016
Profit for the year 41,572 40,027
Other comprehensive income
Items that will not be reclassified subsequently
to the profit and loss account:
Loss on remeasurements of defined benefit plans 15.2.6 (1,667,758) (12,173,824)
Allocated to the State Bank of Pakistan 1,667,758 12,173,824
- -
Total comprehensive income for the year 41,572 40,027
The annexed notes from 1 to 23 form an integral part of these financial statements.
___________________________ ___________________________
Qasim Nawaz Muhammad Habib Khan
Managing Director Director Accounts
------(Rupees in '000)------
State Bank of Pakistan Annual Report FY17
190

SBP BANKING SERVICES CORPORATION
STATEMENT OF CHANGES IN EQUITY
FOR THE YEAR ENDED JUNE 30, 2017
Share Unappropriated Total
capital profit
Balance as at July 1, 2015 1,000,000 - 1,000,000
Total comprehensive income for the year - 40,027 40,027
Transaction with the owner
Profit transferred to the State Bank of Pakistan - (40,027) (40,027)
Balance as at June 30, 2016 1,000,000 - 1,000,000
Total comprehensive income for the year - 41,572 41,572
Transaction with the owner
Profit transferred to the State Bank of Pakistan - (41,572) (41,572)
Balance as at June 30, 2017 1,000,000 - 1,000,000
The annexed notes from 1 to 23 form an integral part of these financial statements.
___________________________ ___________________________
Qasim Nawaz Muhammad Habib Khan
Managing Director Director Accounts
---------------- (Rupees in '000) ----------------
Financial Statements of SBP-BSC (Bank)
191

SBP BANKING SERVICES CORPORATION
STATEMENT OF CASH FLOWS
FOR THE YEAR ENDED JUNE 30, 2017
Note 2017 2016
CASH FLOWS FROM OPERATING ACTIVITIES
Profit after adjustment of non-cash items 16 15,868 30,071
Profit transferred to the State Bank of Pakistan (41,572) (40,027)
Income on Government securities received during the year 15,201 28,577
(10,503) 18,621
(Increase) / decrease in assets
Current account with the State Bank of Pakistan - excluding depreciation and
expense in respect of staff retirement benefits and compensated absences (1,535,308) 575,665
Medical and stationery consumables (25,944) (6,399)
Employee loans 1,371,538 (275,575)
Advances, deposits and prepayments 15,020 (25,494)
Increase in liabilities
Deposits and other liabilities 793,505 31,319
Net cash generated from operating activities 608,308 318,137
CASH FLOWS FROM INVESTING ACTIVITIES
Investments - net (6,370) 26,451
Capital expenditure (620,765) (352,231)
Proceeds from disposal of property and equipment 18,827 7,643
Net cash used in investing activities (608,308) (318,137)
Net increase in cash and cash equivalents - -
Cash and cash equivalents at beginning of the year - -
Cash and cash equivalents at the end of the year - -
The annexed notes from 1 to 23 form an integral part of these financial statements.
___________________________ ___________________________
Qasim Nawaz Muhammad Habib Khan
Managing Director Director Accounts
-------(Rupees in '000)-------
State Bank of Pakistan Annual Report FY17
192

SBP BANKING SERVICES CORPORATION
NOTES TO AND FORMING PART OF THE FINANCIAL STATEMENTS
FOR THE YEAR ENDED JUNE 30, 2017
1. STATUS AND NATURE OF OPERATIONS
1.1
-
-
- receipt, supply and exchange of bank notes and coins;
- dealing in prize bonds and other savings instruments of the Government; and
- operational work relating to management of debt and foreign exchange.
1.2 The head office of the Corporation is situated at I.I. Chundrigar Road, Karachi, in the province of Sindh, Pakistan.
2. STATEMENT OF COMPLIANCE
3. BASIS OF MEASUREMENT
3.1
3.2
3.3 Use of estimates and judgments
3.3.1 Retirement benefits
3.3.2 Useful life and residual value of property and equipment
Financial Statements of SBP-BSC (Bank)
SBP Banking Services Corporation (the Corporation) was constituted under the SBP Banking Services Corporation Ordinance, 2001
(the Ordinance) as a wholly owned subsidiary of the State Bank of Pakistan (SBP) and commenced its operations with effect from
January 2, 2002. The Corporation is responsible for carrying out certain statutory and administrative functions and activities on behalf
of SBP, as transferred or delegated by SBP under the provisions of the Ordinance mainly including:
disbursing of loans and advances to the Governments, banks, financial institutions and local authorities and facilitating in inter-
bank settlement system;
collecting revenue and making payments for and on behalf of, and maintaining accounts of the Governments, local bodies,
authorities, companies, banks and other financial institutions;
Any assets, liabilities, income and expenditure directly relating to the above activities are accounted for in the books of SBP while the
cost incurred by the Corporation in carrying out the above activities are either reimbursed from or allocated to SBP (including the
portion charged to the statement of comprehensive income) and are accounted for as deduction from the expenditure while net profit /
loss, if any, of the Corporation is transferred to / recovered from SBP.
These financial statements have been prepared under the historical cost convention, except that certain staff retirement benefits and
provision for employees' compensated absences have been carried at present value of defined benefit obligations.
These financial statements have been prepared in accordance with the requirements of the International Financial Reporting Standards
(IFRSs) as issued by the International Accounting Standards Board (IASB).
The financial statements are presented in Pakistani Rupees (PKR) which is the Corporation's functional and presentation currency.
Revisions to accounting estimates are recognised in the period in which the estimate is revised if the revision affects only that period, or
in the period of revision and future periods if the revision affects both current and future periods. Judgments made by the management
in the application of International Financial Reporting Standards (IFRSs) and estimates that have a significant risk of material
adjustment to the carrying amounts of assets and liabilities are as follows:
The preparation of financial statements in conformity with International Financial Reporting Standards (IFRSs), requires management
to make judgments, estimates and assumptions that affect the application of policies and reported amounts of assets and liabilities that
are not readily available from other sources. The estimates and associated assumptions are based on historical experiences and various
other factors that are believed to be reasonable under the circumstances, the result of which form the basis of making judgments about
the carrying values of assets and liabilities, income and expenses. Actual results may differ from these estimates. The estimates and
underlying assumptions are reviewed on an ongoing basis.
The key actuarial assumptions concerning the valuation of defined benefit plans and sources of estimation are disclosed in note 15.2.2
to these financial statements.
Estimates of useful life and residual value of property and equipment are based on the management’s best estimate. Rates of
depreciation are given in note 9.1.
193

3.3.3 Provision against obsolete medical and stationery consumables
3.4
Standards
- IFRS 9 - Financial instruments
- IFRS 15 - Revenue from contracts with customers
- IFRS 16 - Leases
- IFRS 17 - Insurance contracts
Amendments
- IAS 7 - Statement of cash flows: on disclosure initiative
-
-
- IAS 40 - Investment property: relating to transfers of investment property
-
-
Interpretations
- IFRIC 22 - Foreign currency transactions and advance consideration
- IFRIC 23 - Uncertainty over income tax treatment
Improvements
-
-
-
State Bank of Pakistan Annual Report FY17
January 1, 2018
January 1, 2019
IAS 12 - Income Taxes: on recognition of deferred tax assets for unrealised losses January 1, 2017
IFRS 1 - First-time adoption of IFRS: regarding the deletion of short-term exemptions for first-
time adopters regarding IFRS 7, IAS 19, and IFRS 10
January 1, 2018
January 1, 2018
Date yet to be finalisedIFRS 10 - Consolidated Financial Statements and IAS 28 - Investment in Associates and Joint
Ventures: regarding sale or contribution of assets between an investor and its associate or joint
venture
IFRS 2 - Share-based Payments: clarifying how to account for certain types of share-based
payment transactions
January 1, 2018IFRS 4 - Insurance contracts: regarding the implementation of IFRS 9, ‘Financial
instruments’
January 1, 2021
January 1, 2019
Early adoption is permitted only
if IFRS 15 is adopted at the same
time.
The Corporation exercises judgment and makes provision for obsolete items based on their future usability. Management believes that
changes in outcome of estimates will not have a material effect on the financial statements.
January 1, 2018
January 1, 2018
Effective date (annual periods
beginning on or after)
The following standards, amendments and interpretations would be effective from the dates mentioned below against the respective
standard or interpretation:
January 1, 2018
January 1, 2017
IFRS 12 - Disclosure of interests in other entities: regarding clarification of the scope of the
standard.
IAS 28 - Investments in associates and joint ventures: regarding measuring an associate or joint
venture at fair value
January 1, 2018
January 1, 2017
The Corporation expects that the adoption of the above standards and amendments will not have any material impact on the
Corporation's financial statements in the period of initial application.
New and amended standards and interpretations that are not yet effective:
194

3.5
4. SIGNIFICANT ACCOUNTING POLICIES
4.1 Financial instruments
4.1.1 Financial assets
4.1.1.1 Classification
a) Financial assets 'at fair value through profit or loss'
b) Loans and receivables
c) Held to maturity
d) Available for sale financial assets
4.1.1.2 Initial recognition and measurement
4.1.1.3 Subsequent measurement
Subsequent to initial recognition, financial assets are valued as follows:
a) Financial asset 'at fair value through profit or loss' and 'available for sale'
Financial Statements of SBP-BSC (Bank)
These are non-derivative financial assets with fixed or determinable payments that are not quoted in an active market. The Corporation's
loans and receivables comprise of current account with the State Bank of Pakistan, employee loans and other advances and deposits.
These are non-derivative financial assets with fixed or determinable payments and fixed maturity that the Corporation has a positive
intent and ability to hold till maturity.
These are the non derivative financial assets which are either designated in this category or which do not fall in any of the other
categories.
All financial assets are recognised at the time the Corporation becomes a party to the contractual provisions of the instrument. Regular
purchases and sales of financial assets are recognised on the trade date - the date on which the Corporation commits to purchase or sell
the assets. Financial assets are initially recognised at fair value plus transaction costs except for financial assets carried at fair value
through profit or loss. Financial assets carried at fair value through profit or loss are initially recognised at fair value while the
transaction costs associated with these financial assets are taken directly to the profit and loss account. Any difference between the fair
value of consideration given and the amount determined using the valuation techniques detailed in note 4.1.4 to these financial
statements is recognised in the profit and loss account.
Financial assets 'at fair value through profit or loss' are marked to market using the closing market rates and are carried on the balance
sheet at fair value. Net gains and losses arising on changes in fair values of these financial assets are taken to the profit and loss account
in the period in which these arise.
The management determines the appropriate classification of its financial assets in accordance with the requirements of International
Accounting Standard 39 (IAS 39) "Financial Instruments: Recognition and Measurement" at the time of purchase of financial assets
and re-evaluates this classification on a regular basis. The financial assets of the Corporation are categorised as follows:
Financial assets that are acquired principally for the purpose of generating profit from short-term fluctuations in prices are classified as
financial assets 'at fair value through profit or loss' category.
The principal accounting policies applied in the preparation of these financial statements are set out below. These have been
consistently applied to all the years presented.
New and amended standards, interpretations and amendments to published approved accounting standards that are effective
in the current year
There are certain new and amended standards and interpretations that are mandatory for the accounting period beginning on or after
July 1, 2016 but are considered not to be relevant or do not have any significant effect on the Corporation's operations and are,
therefore, not disclosed in these financial statements.
195

b) Financial assets classified as 'Loans and receivables' and 'held to maturity'
Loans and receivables and held to maturity financial assets are carried at amortised cost.
4.1.1.4 Impairment
a) Assets carried at amortised cost
b) Assets classified as 'available for sale'
4.1.2 Financial liabilities
4.1.3 Derecognition of financial assets and financial liabilities
a) Financial assets
b) Financial liabilities
On derecognition of a financial asset, the difference between the carrying amount of the asset (or the carrying amount allocated to
the portion of the asset transferred), and the sum of (i) the consideration received (including any new asset obtained less any new
liability assumed) and (ii) any cumulative gain or loss that had been recognised in other comprehensive income is recognised in
the profit and loss account.
In case of equity investments classified as available for sale, a significant or prolonged decline in the fair value of the security below its
cost is also evidence that the assets are impaired.
Financial liabilities with a fixed maturity are measured at amortised cost using the effective interest rate. These include deposits and
other liabilities.
If any evidence for impairment exists, the cumulative loss is removed from other comprehensive income and recognised in the profit
and loss account. For investments, other than equity instruments, the increase in fair value in a subsequent period thereby resulting in
reversal of impairment is reversed through profit and loss account. Impairment losses recognised in profit and loss account on equity
instruments are not reversed through profit and loss account.
The Corporation assesses at each balance sheet date whether there is an objective evidence that a financial asset is impaired.
For financial assets carried at amortised cost, the Corporation first assesses whether objective evidence of impairment exists for
financial assets that are individually significant, or collectively for financial assets that are not individually significant. If the
Corporation determines that no objective evidence of impairment exists for individually assessed financial assets, it includes the assets
in a group of financial assets with similar credit risk characteristics and collectively assesses them for impairment. Assets that are
individually assessed for impairment and for which an impairment loss is, or continues to be, recognised are not included in a collective
assessment of impairment.
If there is objective evidence that an impairment loss has been incurred, the amount of the loss is measured as the difference between
the asset's carrying value and the present value of estimated future cash flows discounted at the financial asset's original effective
interest rate. The carrying value of the assets is reduced through the use of an allowance account and the amount of the loss is
recognised in the profit and loss account.
If, in a subsequent period, the amount of impairment loss decreases and the decrease can be linked objectively to an event occurring
after the write down, the write down or allowance is reversed through the profit and loss account.
State Bank of Pakistan Annual Report FY17
'Available for sale' financial assets are marked to market using the closing market rates and are carried on the balance sheet at fair value.
Net gains and losses arising on changes in fair values of these financial assets are recognised in other comprehensive income, except
investments in those securities the fair value of which cannot be determined reliably and are stated at cost.
The Corporation derecognises a financial asset when the contractual rights to receive the cash flows from the financial asset
expire, or it transfers the rights to receive the contractual cash flows in a transaction in which substantially all the risks and
rewards of ownership of the financial asset are transferred or in which the Corporation neither transfers nor retains substantially
all the risks and rewards of ownership and it does not retain control of the financial asset.
A financial liability is derecognised when the obligation under the liability is discharged or cancelled or expired. Where an
existing financial liability is replaced by another from the same lender on substantially different terms, or the terms of an existing
liability are substantially modified, such an exchange or modification is treated as a derecognition of the original liability and the
recognition of new liability, and the difference in the respective carrying amount is recognised in the profit and loss account.
196

4.1.4 Fair value measurement principles
4.1.5 Offsetting of financial assets and financial liabilities
4.2 Employee loans
4.3 Medical and stationery consumables
Medical and stationery consumables are valued at lower of weighted average cost and the net realisable value.
Provision for obsolete items is determined based on the management's assessment regarding their future usability.
4.4 Property and equipment
Gains and losses on disposal of property and equipment are recognised in the profit and loss account.
4.5 Impairment of non-financial assets
4.6 Compensated absences
Financial Statements of SBP-BSC (Bank)
The Corporation makes annual provision in respect of liability for employees' compensated absences based on actuarial estimates using
Projected Unit Credit Method.
The fair value of financial instruments traded in active markets at the balance sheet date is based on their quoted market prices or dealer
price quotation without any deduction for transaction costs. If there is no active market for a financial asset, the Corporation establishes
fair value using valuation techniques. These include the use of recent arms length transaction, discounted cash flow analysis and other
revaluation techniques commonly used by market participants. Investments in securities of which the fair value cannot be determined
reliably are carried at cost.
Estimates of useful life and residual value of property and equipment are based on the management’s best estimate. The assets' residual
value, depreciation method and useful life are reviewed, and adjusted if appropriate, at each balance sheet date.
The carrying amounts of the Corporation’s assets are reviewed at each balance sheet date to determine whether there is any indication of
impairment of any asset or a group of assets. If such indication exists, the recoverable amount of such assets is estimated. The
recoverable amount is higher of an asset fair value less cost to sell and value in use. In assessing the value in use, estimated future cash
flows are discounted to present value using a discount rate that reflects the current market assessments of the time value of money and
the risk specific to the asset. In determining fair value less cost to sell, an appropriate valuation model is used. An impairment loss is
recognised in the profit and loss account whenever the carrying amount of an asset or a group of assets exceeds its recoverable amount.
Net realisable value represents estimated selling price in the ordinary course of business less the estimated cost necessary to make the
sale.
Subsequent costs are included in the asset's carrying amount or recognised as a separate asset, as appropriate, only when it is probable
that future economic benefit associated with the item will flow to the Corporation and the cost of the item can be measured reliably.
Normal repairs and maintenance are charged to the profit and loss account as and when incurred.
Financial assets and financial liabilities are offset and the net amount is reported in the balance sheet when there is a legally enforceable
right to set off the recognised amounts and there is an intention to settle on a net basis, or realise the assets and settle the liabilities
simultaneously.
These are initially recognized at fair value and subsequently carried at amortised cost less estimates made for any doubtful receivables
based on a review of all outstanding amounts at the balance sheet date.
Property and equipment are stated at historical cost less accumulated depreciation and accumulated impairment losses, if any, except
capital work-in-progress which is stated at cost less accumulated impairment losses, if any. Historical cost includes expenditure that are
directly attributable to the acquisition of the items.
Depreciation on property and equipment is charged to profit and loss account by applying the straight-line method at the rates specified
in note 9.1 to the financial statements, whereby the depreciable amount of an asset is written off over its estimated useful life.
Depreciation on additions is charged to the profit and loss account from the month in which the asset is available for use while no
depreciation is charged in the month in which the asset is disposed off.
197

4.7 Staff retirement benefits
a)
b)
c)
-
-
-
- an un-funded contributory benevolent fund scheme;
- an un-funded post retirement medical benefit scheme; and
- six months post retirement benefit facility.
4.8 Revenue recognition
-
- All other revenues are recognised on a time proportion basis.
4.9 Taxation
4.10 Provisions
Obligations for contributions to defined contribution provident fund plans are recognised as an expense in the profit and loss account as
and when incurred.
Provisions are recognised when the Corporation has a present legal or constructive obligation as a result of past events, it is probable
that an outflow of resources embodying economic benefits will be required to settle the obligation and a reliable estimate of the amount
can be made. Provisions are reviewed at each balance sheet date and adjusted to reflect the current best estimate.
The key actuarial assumptions concerning the valuation of defined benefit plans and the sources of estimation are disclosed in note
15.2.2 to these financial statements.
Annual provisions are made by the Corporation to cover the obligations arising under defined benefits schemes based on actuarial
recommendations. The actuarial valuations are carried out under the "Projected Unit Credit Method". The most recent valuation in this
regard is carried out as at June 30, 2017. The amount arising as a result of remeasurements are recognised in the balance sheet
immediately, with a charge or credit to other comprehensive income in the period in which they occur. The amount arising as a result of
remeasurement is allocated to the State Bank of Pakistan however, the liability is retained in the balance sheet of the Corporation.
The income of the Corporation is exempt from tax under section 25 of the SBP Banking Services Corporation Ordinance, 2001 and
clause 66 (xx) of Part 1 of the second schedule to the Income Tax Ordinance, 2001.
The Corporation operates the following staff retirement benefit schemes for employees transferred from SBP (transferred employees)
and other employees:
an un-funded contributory provident fund (old scheme) for transferred employees who joined SBP prior to 1975 and opted to
remain under the old scheme. Under this scheme, contribution is made both by the Corporation and employee at the rate of 6% of
the monetized salary. The Corporation provided an option to employees covered under old scheme to join the funded New
Contributory Provident Fund Scheme - NCPF (new scheme) effective from July 1, 2010. Under this scheme contribution is made
by both the employer and employee at the rate of 6% of the monetized salary. Moreover, employees joining the Corporation
service after July 1, 2010 are covered under the new scheme.
Discount, interest / mark-up and / or return on loans and investments are recorded on a time proportion basis that takes into
account the effective yield on the asset.
the following other staff retirement benefit schemes:
an un-funded pension scheme for those employees who joined the SBP after 1975 and before the introduction of EGF
which is effective from July 1, 2010;
an un-funded gratuity scheme (old scheme) for all employees other than the employees who opted for the new general
contributory provident fund scheme or transferred employees who joined SBP after 1975 and are entitled only to pension
scheme benefits;
an un-funded general contributory provident fund (new scheme) for transferred employees who joined SBP after 1975 or who had
joined SBP prior to 1975 but have opted for this new scheme. Under this scheme contribution is made by the employee only at the
rate of 5% of the monetized salary.
a funded New Gratuity Fund (NGF) which was introduced by the Corporation effective from July 1, 2010 for all its
employees other than those who opted for pension scheme or unfunded gratuity scheme (old scheme);
State Bank of Pakistan Annual Report FY17
198

Note 2017 2016
------(Rupees in '000)------
5. INVESTMENTS
Held to maturity
Market Treasury Bills 5.1 & 5.2 532,178 525,525
532,178 525,525
5.1
5.2
Note 2017 2016
------(Rupees in '000)------
6. EMPLOYEE LOANS
Considered good 9,481,894 10,853,432
Considered doubtful 7,737 7,610
6.1 9,489,631 10,861,042
Provision against doubtful loans 6.2 (7,737) (7,610)
9,481,894 10,853,432
6.1
These loans have been given in respect of:-
- Housing loans - Secured against equitable mortgage of the property.
- Motor vehicle loans - Secured against hypothecation of the vehicle.
- Computer and personal loans, given on personal guarantee of two employees of the Corporation.
Note 2017 2016
------(Rupees in '000)------
6.2 Provision held against employee loans
Opening balance 7,610 8,366
Charge for the year 127 -
Reversals during the year - (756)
Closing balance 7,737 7,610
7. ADVANCES, DEPOSITS AND PREPAYMENTS
Advances, deposits and prepayments 40,844 55,964
Others 8,737 8,637
49,581 64,601
8. MEDICAL AND STATIONERY CONSUMABLES
Medical and stationery consumables 8.1 165,894 139,845
Provision against obsolete items (1,072) (967)
164,822 138,878
8.1 These include stocks of medicine, stationery, engineering items and printing press.
This represents loans given to the permanent employees of the Corporation, which are recoverable in equal monthly installments till the
retirement of an employee except that the personal loan are repayable in twenty four equal monthly installments. These include loans
amounting to Rs. 12.974 million (2016: Rs. 13.487 million) that carry mark up at 10% per annum (2016: 10% per annum). Maximum
maturity of loans is upto year 2056 (2016: year 2056).
Market Treasury Bills carry mark-up at the rate of 5.91% to 5.99% per annum (2016: 6.00% to 6.26% per annum) and are having
maturities from August 3, 2017 to September 14, 2017 (2016: August 18, 2016 to June 8, 2017).
The fair value of these investments as at June 30, 2017 is Rs. 532.062 million (2016: Rs. 525.970 million). Market Treasury Bills have
been revalued on the basis of yields published by Reuters (PKRV) for Government securities.
Financial Statements of SBP-BSC (Bank)
199

Note 2017 2016
------(Rupees in '000)------
9. PROPERTY AND EQUIPMENT
Operating fixed assets 9.1 880,477 440,381
Capital work-in-progress - 45,824
880,477 486,205
9.1 Operating fixed assets
The following is a statement of operating fixed assets:
Furniture and 147,456 11,086 127,676 102,357 9,426 81,128 46,548 10
fixtures (30,866) (30,655)
Office equipment 1,096,573 567,498 1,632,112 901,308 113,496 983,217 648,895 20
(31,959) (31,587)
EDP equipment 550,587 12,328 530,262 419,907 66,031 453,624 76,638 33.33
(32,653) (32,314)
Motor vehicles 168,219 75,677 210,069 98,882 28,933 101,673 108,396 20
(33,827) (26,142)
1,962,835 666,589 2,500,119 1,522,454 217,886 1,619,642 880,477
(129,305) (120,698)
Furniture and 137,562 10,965 147,456 92,757 10,283 102,357 45,099 10
fixtures (1,071) (683)
Office equipment 989,159 116,443 1,096,573 844,132 62,097 901,308 195,265 20
(9,029) (4,921)
EDP equipment 420,849 137,517 550,587 373,466 52,196 419,907 130,680 33.33
(7,779) (5,755)
Motor vehicles 127,546 41,482 168,219 80,096 19,595 98,882 69,337 20
(809) (809)
1,675,116 306,407 1,962,835 1,390,451 144,171 1,522,454 440,381
(18,688) (12,168)
---------------------------------------------------------(Rupees in '000)---------------------------------------------------------
As at July
01, 2016
As at June
30, 2017
Charge for
the year /
(deletions)
As at June 30,
2017
As at June 30,
2016
As at July 01,
2015
Charge for the
year /
(deletions)
As at June 30,
2016
Net book value
as at June 30,
2016
State Bank of Pakistan Annual Report FY17
As at July
01, 2016
Additions /
(deletions)
---------------------------------------------------------(Rupees in '000)---------------------------------------------------------
Cost Accumulated Depreciation
2016
Annual rate
of
depreciation
%
Net book value
as at June 30,
2017
2017
Cost Accumulated Depreciation
Annual rate of
depreciation %As at July 01,
2015
Additions /
(deletions)
200

Note 2017 2016
10. DEPOSITS AND OTHER LIABILITIES
Provision for employees' compensated absences 15.2.10 4,455,316 4,923,839
Deposits 637,791 92,804
Others 564,169 315,651
5,657,276 5,332,294
11. DEFERRED LIABILITIES - UNFUNDED STAFF
RETIREMENT BENEFITS
Gratuity 2,815 2,327
Pension 38,656,505 37,457,883
Benevolent fund scheme 1,194,678 1,308,845
Post retirement medical benefits 14,491,690 13,911,141
Six months post retirement benefits 113,160 100,956
15.2.4 54,458,848 52,781,152
Provident fund scheme 739,292 765,846
55,198,140 53,546,998
12. SHARE CAPITAL
2017 2016 2017 2016
Authorised share capital
1,000 1,000 Ordinary shares of Rs. 1,000,000 each 1,000,000 1,000,000
Issued, subscribed and paid-up capital
Fully paid-up ordinary shares of
Rs. 1,000,000 each
509 509 - issued for cash 509,000 509,000
491 491 - issued against consideration in kind 491,000 491,000
1,000 1,000 1,000,000 1,000,000
13. CONTINGENCIES AND COMMITMENTS
13.1 Contingencies
Claims against the Corporation not acknowledged as debts 13.1.1 2,962 2,962
13.1.1
Note 2017 2016
13.2 Commitments
Capital commitments 13.2.1 68,840 548,624
13.2.1 This represent amounts committed by the Corporation to purchase assets from successful bidders.
2017 2016
14. DISCOUNT AND INTEREST EARNED
Interest income on Government securities 30,685 37,410
Interest on employee loans 667 598
31,352 38,008
---------(Rupees in '000)---------
(Number of shares) ---------(Rupees in '000)---------
----------(Rupees in '000)----------
These mainly represent various cases filed by ex-employees of the Corporation on account of computational differences in settlement
of their retirement benefit amounts. The management believes that these cases will be decided in favour of the Corporation and hence
no provision has been recognised in these financial statements.
----------(Rupees in '000)----------
Financial Statements of SBP-BSC (Bank)
201

15. NET OPERATING EXPENSES Note 2017 2016
Reimbursable from the State Bank of Pakistan
Salaries, wages and other benefits 5,709,601 6,153,682
Rent and taxes 37,604 25,550
Insurance 12,979 7,309
Electricity, gas and water 323,968 304,736
Repair and maintenance 218,083 189,716
Auditors' remuneration 15.1 7,000 5,950
Legal and professional 9,270 11,078
Travelling 16,864 21,725
Daily expenses 30,638 26,897
Passages / rest and recreational allowance 258,419 198,127
Fuel 2,810 3,002
Conveyance 17,456 16,818
Postages and telephone 11,399 12,898
Training 203,964 146,112
Remittance of treasure 132,636 92,744
Stationery 10,408 9,444
Books and newspapers 1,813 1,626
Advertisement 11,028 32,011
Bank guards charges 147,587 117,499
Uniforms 34,984 28,493
Others 225,444 138,834
7,423,955 7,544,251
Allocated to the State Bank of Pakistan
Retirement benefits and employees' compensated absences 15.2 to 15.2.10 4,853,297 6,267,528
Depreciation 9.1 217,886 144,171
5,071,183 6,411,699
12,495,138 13,955,950
15.1 Auditors' remuneration
Audit fee 2,500 2,500 5,000 2,090 2,090 4,180
Out of pocket expenses 1,000 1,000 2,000 885 885 1,770
3,500 3,500 7,000 2,975 2,975 5,950
15.2 Staff retirement benefits
15.2.1
15.2.2
2017 2016
- Discount rate for year end obligation 7.75% p.a. 7.25% p.a.
- Salary increase rate (where applicable) 8.75% p.a. 8.25% p.a.
- Pension increase rate (where applicable) 6.25% p.a. 4.75% p.a.
- Medical cost increase rate (where applicable) 7.75% p.a. 7.25% p.a.
- Petrol price increase rate (where applicable) 8.75% p.a. 8.25% p.a.
- Personnel turnover 9.2% p.a. 18.1% p.a.
- Normal retirement age 60 Years 60 Years
During the year the actuarial valuations of the defined benefit obligations were carried out under the Projected Unit Credit Method
using following significant assumptions:
Assumptions regarding future mortality are based on actuarial advice in accordance with the published statistics and experience in
Pakistan. The rates assumed are based on the adjusted SLIC 2001 - 2005 mortality tables with 1 year setback.
----------(Rupees in '000)----------
State Bank of Pakistan Annual Report FY17
Charge for the year in respect of defined contribution plan amounted to Rs. 42.187 million (2016: Rs. 33.403 million).
EY Ford Rhodes Total
2017
------------------------------------------------------------ (Rupees in '000) ------------------------------------------------------------
2016
A.F.Ferguson &
Co.EY Ford Rhodes
A.F.Ferguson &
Co.Total
202

15.2.3 Through its defined benefit plan, the Corporation is exposed to a number of risks, the most significant of which are detailed below:
Discount rate risk
The risk that the actual mortality experience is higher than that of expected i.e. the actual life expectancy is longer than assumed.
Withdrawal risk
Pension Increase risk
15.2.4 Change in present value of defined benefit obligation
Present value of defined benefit obligation as on July 1, 2016 37,457,883 2,327 13,911,141 1,308,845 100,956 52,781,152
Current service cost 807,936 297 244,963 2,599 6,529 1,062,324
Interest cost on defined benefit obligation 2,570,905 169 987,219 89,143 7,244 3,654,680
Benefits paid (3,994,261) - (588,656) (158,576) (2,064) (4,743,557)
Liability transferred from SBP 15,507 - 17,763 1,121 2,100 36,491
Remeasurements:
Actuarial (gains) / losses from changes in financial assumptions 1,894,062 - 244,469 (30,690) 8,517 2,116,358
Experience adjustments (95,527) 22 (325,209) (17,764) (10,122) (448,600)
Present value of defined benefit obligation as on June 30, 2017 38,656,505 2,815 14,491,690 1,194,678 113,160 54,458,848
Present value of defined benefit obligation as on July 1, 2015 30,780,494 1,580 12,628,628 1,108,267 87,976 44,606,945
Current service cost 949,876 241 285,440 53,236 5,465 1,294,258
Interest cost on defined benefit obligation 2,580,604 154 1,358,758 91,062 8,216 4,038,794
Benefits paid (8,625,521) - (552,570) (348,601) (7,415) (9,534,107)
Liability transferred from SBP 136,419 - 52,610 5,028 7,381 201,438
Remeasurements:
Actuarial (gains) / losses from changes in demographic assumptions 4,592,822 - 776,061 186,113 (13,076) 5,541,920
Actuarial losses from changes in financial assumptions 886,201 82 100,134 153,061 3,660 1,143,138
Experience adjustments 6,156,988 270 (737,920) 60,679 8,749 5,488,766
Present value of defined benefit obligation as on June 30, 2016 37,457,883 2,327 13,911,141 1,308,845 100,956 52,781,152
Financial Statements of SBP-BSC (Bank)
The risk of changes in discount rate since discount rate is based on corporate / government bonds. Any decrease in bond yields will
increase plan liabilities.
Mortality risk
Salary increase / inflation risk
The risk that the actual salary increase is higher / lower than the expected salary increase, where benefits are linked with final salary at
the time of cessation of service, is likely to have an impact on liability.
The risk that the actual pension increase are higher than the expected, where benefits are being paid in form of monthly pension, is
likely to have an impact on liability.
TotalBenevolent
fund scheme
Post retirement
medical
benefits
Six months post
retirement
facility
The risk of actual withdrawals experience may differ from that assumed in the calculation.
2017
------------------------------------------------------------------Rupees in '000------------------------------------------------------------------
------------------------------------------------------------------Rupees in '000------------------------------------------------------------------
PensionGratuity
Scheme
Post
retirement
medical
benefits
Benevolent
fund scheme
Six months post
retirement
facility
Total
Gratuity
SchemePension
2016
203

15.2.4.1 Amount recognised in the Statement of Comprehensive Income
- Actuarial (gains) / losses from changes in financial assumptions 1,894,062 - 244,469 (30,690) 8,517 2,116,358
- Experience adjustments (95,527) 22 (325,209) (17,764) (10,122) (448,600)
1,667,758
- Actuarial (gains) / losses from changes in demographic assumptions 4,592,822 - 776,061 186,113 (13,076) 5,541,920
- Actuarial losses from changes in financial assumptions 886,201 82 100,134 153,061 3,660 1,143,138
- Experience adjustments 6,156,988 270 (737,920) 60,679 8,749 5,488,766
12,173,824
15.2.5 Amount recognised in the profit and loss account
Current service cost 807,936 297 244,963 2,599 6,529 1,062,324
Interest cost on defined benefit obligation 2,570,905 169 987,219 89,143 7,244 3,654,680
Contribution made by employees - - - (15,748) - (15,748)
3,378,841 466 1,232,182 75,994 13,773 4,701,256
Current service cost 949,876 241 285,440 53,236 5,465 1,294,258
Interest cost on defined benefit obligation 2,580,604 154 1,358,758 91,062 8,216 4,038,794
Contribution made by employees - - - (8,471) - (8,471)
3,530,480 395 1,644,198 135,827 13,681 5,324,581
15.2.6 Movement of present value of defined benefit obligation
Net recognised liabilities at July 1, 2016 37,457,883 2,327 13,911,141 1,308,845 100,956 52,781,152
Amount recognised in the profit and loss account 3,378,841 466 1,232,182 75,994 13,773 4,701,256
Remeasurements 1,798,535 22 (80,740) (48,454) (1,605) 1,667,758
Benefits paid during the year (3,994,261) - (588,656) (158,576) (2,064) (4,743,557)
Employees contribution - - - 15,748 - 15,748
Liability transferred from SBP 15,507 - 17,763 1,121 2,100 36,491
Net recognised liabilities at June 30, 2017 38,656,505 2,815 14,491,690 1,194,678 113,160 54,458,848
------------------------------------------------------------------Rupees in '000------------------------------------------------------------------
------------------------------------------------------------------Rupees in '000------------------------------------------------------------------
2017
2016
PensionGratuity
Scheme
Post retirement
medical
benefits
Benevolent
fund scheme
Six months post
retirement
facility
Total
PensionGratuity
Scheme
Post
retirement
medical
benefits
Benevolent
fund scheme
Six months post
retirement
facility
Total
Gratuity
SchemePension
Benevolent
fund scheme
Post
retirement
medical
benefits
Six months post
retirement
facility
Total
------------------------------------------------------------------Rupees in '000------------------------------------------------------------------
2016
2017
2017
Total
Gratuity
SchemePension
Benevolent
fund scheme
Post retirement
medical
benefits
------------------------------------------------------------------Rupees in '000------------------------------------------------------------------
Six months post
retirement
facility
Total
Gratuity
SchemePension
Benevolent
fund scheme
Post
retirement
medical
benefits
Six months post
retirement
facility
State Bank of Pakistan Annual Report FY17
------------------------------------------------------------------Rupees in '000------------------------------------------------------------------
204

Net recognised liabilities at July 1, 2015 30,780,494 1,580 12,628,628 1,108,267 87,976 44,606,945
Amount recognised in the profit and loss account 3,530,480 395 1,644,198 135,827 13,681 5,324,581
Remeasurements 11,636,011 352 138,275 399,853 (667) 12,173,824
Benefits paid during the year (8,625,521) - (552,570) (348,601) (7,415) (9,534,107)
Employees contribution - - - 8,471 - 8,471
Liability transferred from SBP 136,419 - 52,610 5,028 7,381 201,438
Net recognised liabilities at June 30, 2016 37,457,883 2,327 13,911,141 1,308,845 100,956 52,781,152
15.2.7 The sensitivity of the defined benefit obligation to changes in the weighted principal assumptions is:
Pension
Discount rate 1% (2,735,883) 3,257,576
Salary increase rate 1% 965,929 (915,824)
Pension increase rate 1% 2,244,404 (1,881,937)
Expected mortality rates 1 Year 417,095 (415,063)
Gratuity Scheme
Discount rate 1% (167) 177
Salary increase rate 1% 181 (167)
Discount rate 1% (2,057,144) 2,638,715
Medical cost increase rate 1% 2,664,168 (2,100,552)
Salary increase rate 1% 51,765 (47,817)
Expected mortality rates 1 Year 267,936 (265,178)
Benevolent fund scheme
Discount rate 1% (56,242) 63,318
Six months post retirement facility
Discount rate 1% (5,500) 6,126
Salary increase rate 1% 6,379 (5,838)
Petrol Increase Rate 1% 6,379 (5,838)
15.2.8 Duration of defined benefit obligation
The weighted average duration of the defined benefit obligation is 8 Years 6 Years 16 Years 5 Years 5 Years
Financial Statements of SBP-BSC (Bank)
PensionBenevolent
fund schemeTotal
Impact on defined benefit obligation - Increase /
(Decrease)
Change in
Assumption
------------------------------------------------------------------Rupees in '000------------------------------------------------------------------
Post retirement
medical
benefits
Six months post
retirement
facility
Post
retirement
medical
benefits
Benevolent fund
scheme
Increase in
assumption
Decrease in
assumption
Six months post
retirement
facility
The above sensitivity analysis is based on a change in an assumption while holding all other assumptions constant. When calculating the
sensitivity of the defined benefit obligation to significant actuarial assumptions the same method (present value of the defined benefit
obligation calculated with the projected unit credit method at the end of the reporting period) has been applied as when calculating the
liability of all schemes recognised within the balance sheet.
PensionGratuity
Scheme
Post retirement medical benefits
2016
---------(Rupees in '000)---------
Gratuity
Scheme
205

15.2.9 Estimated expenses to be charged to profit and loss account for the year ending June 30, 2018
Current service cost 741,225 335 331,283 2,686 7,444 1,082,973
Interest cost on defined benefit obligation 2,995,879 218 1,123,106 92,588 8,770 4,220,561
Amount chargeable to profit and loss account 3,737,104 553 1,454,389 95,274 16,214 5,303,534
15.2.10 Employees' compensated absences
2017 2016
16. PROFIT AFTER ADJUSTMENT OF NON-CASH ITEMS
Profit for the year 41,572 40,027
Adjustments for:
Interest income on Government securities (15,484) (8,833)
Gain on disposal of property and equipment (10,220) (1,123)
(25,704) (9,956)
15,868 30,071
17. RELATED PARTY TRANSACTIONS
Transaction and balances with related parties are as follows:
2017 2016
Associated undertaking - National Institute of Banking and Finance
(Guarantee) Limited - Subsidiary of Parent entity
Balances at the year end - transferred to State Bank of Pakistan
Payable against training programs 32,849 51,760
Transactions during the year - reimbursable from State Bank of Pakistan
Training expense charged during the year 132,820 114,845
18. RISK MANAGEMENT POLICIES
---------------- (Rupees in '000) ----------------
The Corporation is primarily subject to interest / mark-up rate and credit risks. The policies and procedures for managing these risks are
outlined in notes 18.1 to 18.7 to these financial statements. The Corporation has designed and implemented a framework of controls to
identify, monitor and manage these risks. The senior management is responsible for advising the Managing Director on the monitoring
and management of these risks.
---------------- (Rupees in '000) ----------------
The Corporation is a wholly owned subsidiary of the State Bank of Pakistan (parent entity), therefore all subsidiaries and associated
undertakings of the Parent entity are related parties of the Corporation. Other related parties comprise of key management personnel of
the Corporation which include members of the Board of Directors, Managing Director and other executives of the Corporation who
have responsibilities for planning, directing and controlling the activities of the Corporation.
The Corporation is responsible for carrying out certain statutory and administrative functions and activities on behalf of SBP, as
transferred or delegated by SBP under the provisions of the Ordinance. The accounting treatment of assets, liabilities, income and
expenditure relating to such activities are detailed in note 1.1 to these financial statements (also refer note 15).
State Bank of Pakistan Annual Report FY17
The Corporation's liability for employees' compensated absences determined through an actuarial valuation carried out under the
Projected Unit Credit Method amounted to Rs. 4,455.316 million (2016: Rs. 4,923.839 million). An amount of Rs. 109.854 million
(2016: Rs. 942.947 million) has been charged to the profit and loss account in the current period based on the actuarial advice.
Expected charge in respect of the scheme for the year ending June 30, 2018 would be Rs. 566.161 million. The benefits paid during the
year amounted to Rs. 589.822 million (2016: Rs. 1,464.415 million). In case of 1% increase / decrease in discount rate the net charge
for the year would decrease / increase by Rs. 166.057 million and Rs. 184.907 million respectively and the net liability would also be
affected by the same amount. In case of 1% increase / decrease in salary rate the net charge for the year would increase / decrease by
Rs. 199.215 million and Rs. 182.852 million respectively and the net liability would also be affected by the same amount. The weighted
average duration for the liability against employee's compensated absences is 4 years.
Based on the actuarial advice, the management estimates that charge / (reversal) in respect of defined benefit plans for the year ending
June 30, 2018 would be as follows:
------------------------------------------------------------------Rupees in '000------------------------------------------------------------------
Six months post
retirement
benefits
TotalGratuity
SchemePension
Benevolent fund
scheme
Post retirement
medical benefits
206
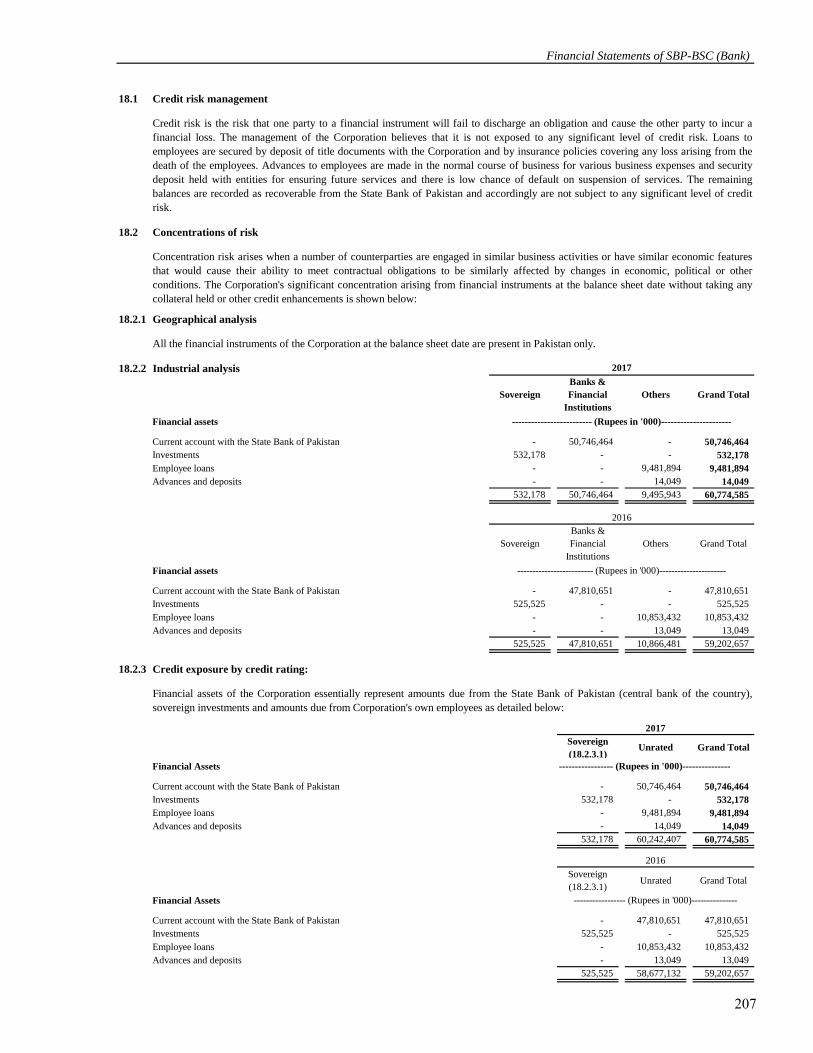
18.1 Credit risk management
18.2 Concentrations of risk
18.2.1 Geographical analysis
All the financial instruments of the Corporation at the balance sheet date are present in Pakistan only.
18.2.2 Industrial analysis
Financial assets
Current account with the State Bank of Pakistan - 50,746,464 - 50,746,464
Investments 532,178 - - 532,178
Employee loans - - 9,481,894 9,481,894
Advances and deposits - - 14,049 14,049
532,178 50,746,464 9,495,943 60,774,585
Financial assets
Current account with the State Bank of Pakistan - 47,810,651 - 47,810,651
Investments 525,525 - - 525,525
Employee loans - - 10,853,432 10,853,432
Advances and deposits - - 13,049 13,049
525,525 47,810,651 10,866,481 59,202,657
18.2.3 Credit exposure by credit rating:
Sovereign
(18.2.3.1)Unrated Grand Total
Financial Assets
Current account with the State Bank of Pakistan - 50,746,464 50,746,464
Investments 532,178 - 532,178
Employee loans - 9,481,894 9,481,894
Advances and deposits - 14,049 14,049
532,178 60,242,407 60,774,585
Sovereign
(18.2.3.1)Unrated Grand Total
Financial Assets
Current account with the State Bank of Pakistan - 47,810,651 47,810,651
Investments 525,525 - 525,525
Employee loans - 10,853,432 10,853,432
Advances and deposits - 13,049 13,049
525,525 58,677,132 59,202,657
----------------- (Rupees in '000)---------------
Financial assets of the Corporation essentially represent amounts due from the State Bank of Pakistan (central bank of the country),
sovereign investments and amounts due from Corporation's own employees as detailed below:
2017
------------------------- (Rupees in '000)----------------------
------------------------- (Rupees in '000)----------------------
2016
Sovereign
Banks &
Financial
Institutions
Others Grand Total
----------------- (Rupees in '000)---------------
2016
2017
Sovereign
Banks &
Financial
Institutions
Others Grand Total
Credit risk is the risk that one party to a financial instrument will fail to discharge an obligation and cause the other party to incur a
financial loss. The management of the Corporation believes that it is not exposed to any significant level of credit risk. Loans to
employees are secured by deposit of title documents with the Corporation and by insurance policies covering any loss arising from the
death of the employees. Advances to employees are made in the normal course of business for various business expenses and security
deposit held with entities for ensuring future services and there is low chance of default on suspension of services. The remaining
balances are recorded as recoverable from the State Bank of Pakistan and accordingly are not subject to any significant level of credit
risk.
Concentration risk arises when a number of counterparties are engaged in similar business activities or have similar economic features
that would cause their ability to meet contractual obligations to be similarly affected by changes in economic, political or other
conditions. The Corporation's significant concentration arising from financial instruments at the balance sheet date without taking any
collateral held or other credit enhancements is shown below:
Financial Statements of SBP-BSC (Bank)
207

18.2.3.1 Government securities and balances are rated as sovereign. The international rating of Pakistan is B- (as per Moody's).
18.3 Details of financial assets impaired and provision recorded there against:
2017 2016 2017 2016
Employee loans 7,737 7,610 7,737 7,610
18.4 Liquidity analysis with interest rate risk
Maturity Maturity Sub total Maturity Maturity Sub total
upto one after one upto one after one
year year year year
Financial assets
Current account with the State Bank
of Pakistan* - - - 50,746,464 - 50,746,464 50,746,464
Investments 516,694 - 516,694 15,484 - 15,484 532,178
Employee loans 1,006 11,968 12,974 1,657,173 7,811,747 9,468,920 9,481,894
Advances and deposits - - - 5,312 8,737 14,049 14,049
517,700 11,968 529,668 52,424,433 7,820,484 60,244,917 60,774,585
Financial liabilities
Deposits and other liabilities - - - 1,201,960 - 1,201,960 1,201,960
On balance sheet gap 517,700 11,968 529,668 51,222,473 7,820,484 59,042,957 59,572,625
Capital Commitments - - - 68,840 - 68,840 68,840
Off balance sheet gap - - - 68,840 - 68,840 68,840
Total yield / interest risk sensitivity gap 517,700 11,968 529,668 51,153,633 7,820,484 58,974,117 59,503,785
Cumulative yield / interest risk sensitivity gap 517,700 529,668 1,059,336 52,212,969 60,033,453 119,007,570 119,007,570
Maturity Maturity Sub total Maturity Maturity Sub total
upto one after one upto one after one
year year year year
Financial assets
Current account with the State Bank
of Pakistan* - - - 47,810,651 - 47,810,651 47,810,651
Investments 516,692 - 516,692 8,833 - 8,833 525,525
Employee loans 1,036 12,451 13,487 1,739,077 9,100,868 10,839,945 10,853,432
Advances and deposits - - - 4,412 8,637 13,049 13,049
517,728 12,451 530,179 49,562,973 9,109,505 58,672,478 59,202,657
Financial liabilities
Deposits and other liabilities - - - 408,455 - 408,455 408,455
On balance sheet gap 517,728 12,451 530,179 49,154,518 9,109,505 58,264,023 58,794,202
Capital Commitments - - - 548,624 - 548,624 548,624
Off balance sheet gap - - - 548,624 - 548,624 548,624
Total yield / interest risk sensitivity gap 517,728 12,451 530,179 48,605,894 9,109,505 57,715,399 58,245,578
Cumulative yield / interest risk sensitivity gap 517,728 530,179 1,060,358 49,666,252 58,775,757 116,491,156 116,491,156
18.5
18.6 Currency risk management
18.7 Liquidity risk management
Currency risk is the risk that the value of a financial instrument will fluctuate due to changes in foreign exchange rates. However, at
balance sheet date all of the Corporation's financial instruments are denominated in local currency.
Liquidity risk is the risk that the Corporation will encounter difficulties in raising funds to meet commitments associated with the
financial instruments. The Corporation believes that it is not exposed to any significant level of liquidity risk as all its settlements are
routed through the State Bank of Pakistan. The maturity profile of Corporation's financial assets and financial liabilities is given in
note 18.4 to these financial statements.
*All cash settlements of the Corporation are routed through the current account maintained with the State Bank of Pakistan as the Corporation functions and acts on behalf
of the SBP.
Non interest / mark-up bearing
----------------------------------------------------------------------------------------------------------------------(Rupees in '000) ----------------------------------------------------------------------------------------------------------------------
Interest / mark-up bearing
Total
Total
The interest / mark-up for the financial assets and liabilities are mentioned in their respective notes to and forming part of the financial
statements.
State Bank of Pakistan Annual Report FY17
---------------------------------------------------------------------- (Rupees in '000) ------------------------------------------------------------------------
2016
2017
Interest / mark-up bearing Non interest / mark-up bearing
Interest rate risk is the risk that the value of a financial instrument or its cash flow will fluctuate due to changes in the market interest
rates. The Corporation has adopted appropriate policies to minimize its exposure to this risk.
------------------------- (Rupees in '000)------------------------
Gross amount Impairment / Provision
208

19. FAIR VALUE OF FINANCIAL ASSETS AND LIABILITIES
- Quoted prices (unadjusted) in active markets for identical assets or liabilities (level 1);
-
- Inputs for the asset or liability that are not based on observable market data (unobservable inputs) (level 3).
20. CLASSIFICATION OF FINANCIAL INSTRUMENTS
Loans and Held to Total
receivables maturity
Financial assets
Current account with the State Bank of Pakistan 50,746,464 - 50,746,464
Investments - 532,178 532,178
Employee loans 9,481,894 - 9,481,894
Advances and deposits 14,049 - 14,049
60,242,407 532,178 60,774,585
Loans and Held to Total
receivables maturity
Financial assets
Current account with the State Bank of Pakistan 47,810,651 - 47,810,651
Investments - 525,525 525,525
Employee loans 10,853,432 - 10,853,432
Advances and deposits 13,049 - 13,049
58,677,132 525,525 59,202,657
2017 2016
Financial liabilities - at amortised cost
Deposits and other liabilities 1,201,960 408,455
___________________________ ___________________________
Qasim Nawaz Muhammad Habib Khan
Managing Director Director Accounts
Inputs other than quoted prices within level 1 that are observable for the asset or liabilities, whether directly (i.e. as prices) or
indirectly (i.e. derived from prices) (level 2); and
The carrying amount of all the financial assets and financial liabilities is considered to be reasonable approximation of fair value except
for held to maturity investments whose fair value is disclosed in note 5.2 to these financial statements which have been valued under
level 2. These are carried at amortised cost in accordance with the Corporation's policy.
21. DATE OF AUTHORISATION FOR ISSUE
These financial statements were authorised for issue on October 26, 2017 by the Board of Directors of the Corporation.
22. CORRESPONDING FIGURES
Corresponding figures have been rearranged and reclassified, wherever necessary, for the purpose of better presentation and
comparison. There have been no significant rearrangement or reclassification during the year.
23. GENERAL
Figures in these financial statements have been rounded off to the nearest thousand rupees.
----------------(Rupees in '000)---------------------
2017
---------------(Rupees in '000)--------------------
2016
-----------(Rupees in '000)-------------
Underlying the definition of fair value is the presumption that the Corporation is a going concern without any intention or requirement
to curtail materiality the scale of its operations or to undertake a transaction on adverse terms.
Fair value is the price that would be received to sell an asset or paid to transfer a liability in an orderly transaction between market
participants at the measurement date. Consequently, differences can arise between carrying value and the fair value estimates.
As per the requirements of IFRS 13 (Fair Value Measurement), the Corporation shall classify fair value instruments using a fair value
hierarchy that reflects the significance of inputs in making the measurements. The fair value hierarchy has the following levels:
Financial Statements of SBP-BSC (Bank)
209

12 Financial Statements of NIBAF
A. F. FERGUSON & CO. Chartered Accountants State Life Building No. 1-C I. I. Chundrigar RoadP.O. Box 4716Karachi-74000
AUDITORS' REPORT TO THE MEMBERS
We have audited the annexed balance sheet of National Institute of Banking and Finance (Guarantee) Limited as at June 30, 2017 and the related income and expenditure account, cash flow statement and statement of changes in equity together with the notes forming part thereof, for the year then ended and we state that we have obtained all the information and explanations which, to the best of our knowledge and belief, were necessary for the purposes of our audit.
It is the responsibility of the Company's management to establish and maintain a system of internal control, and prepare and present the above said statements in conformity with the approved accounting standards and the requirements of the Companies Ordinance, 1984. Our responsibility is to express an opinion on these statements based on our audit.
We conducted our audit in accordance with the auditing standards as applicable in Pakistan. These standards require that we plan and perform the audit to obtain reasonable assurance about whether the above said statements are free of any material misstatement. An audit includes examining, on a test basis, evidence supporting the amounts and disclosures in the above said statements. An audit also includes assessing the accounting policies and significant estimates made by management, as well as, evaluating the overall presentation of the above said statements. We believe that our audit provides a reasonable basis for our opinion and, after due verification, we report that:
(a) in our opinion, proper books of account have been kept by the Company as required by the
Companies Ordinance, 1984;
(b) in our opinion:
(i) the balance sheet and income and expenditure account together with the notes thereon
have been drawn up in conformity with the Companies Ordinance, 1984, and are in
agreement with the books of account and are further in accordance with accounting
policies consistently applied;
(ii) the expenditure incurred during the year was for the purpose of the Company's
business; and
211

State Bank of Pakistan Annual Report FY17
A. F. FERGUSON & CO. Chartered Accountants
(iii) the business conducted, investments made and the expenditure incurred during the
year were in accordance with the objects of the Company;
(c) in our opinion and to the best of our information and according to the explanations given to
us, the balance sheet, income and expenditure account, cash flow statement and statement
of changes in equity together with the notes forming part thereof conform with approved
accounting standards as applicable in Pakistan, and, give the information required by the
Companies Ordinance, 1984, in the manner so required and respectively give a true and fair
view of the state of the Company's affairs as at June 30, 2017 and of the surplus, its cash
flows and changes in equity for the year then ended; and
(d) in our opinion, no Zakat was deductible at source under the Zakat and Ushr Ordinance,
1980.
A. F. Ferguson & Co. Chartered Accountants Karachi
Salman Hussain Audit Engagement Partner
Dated: October 18, 2017
212
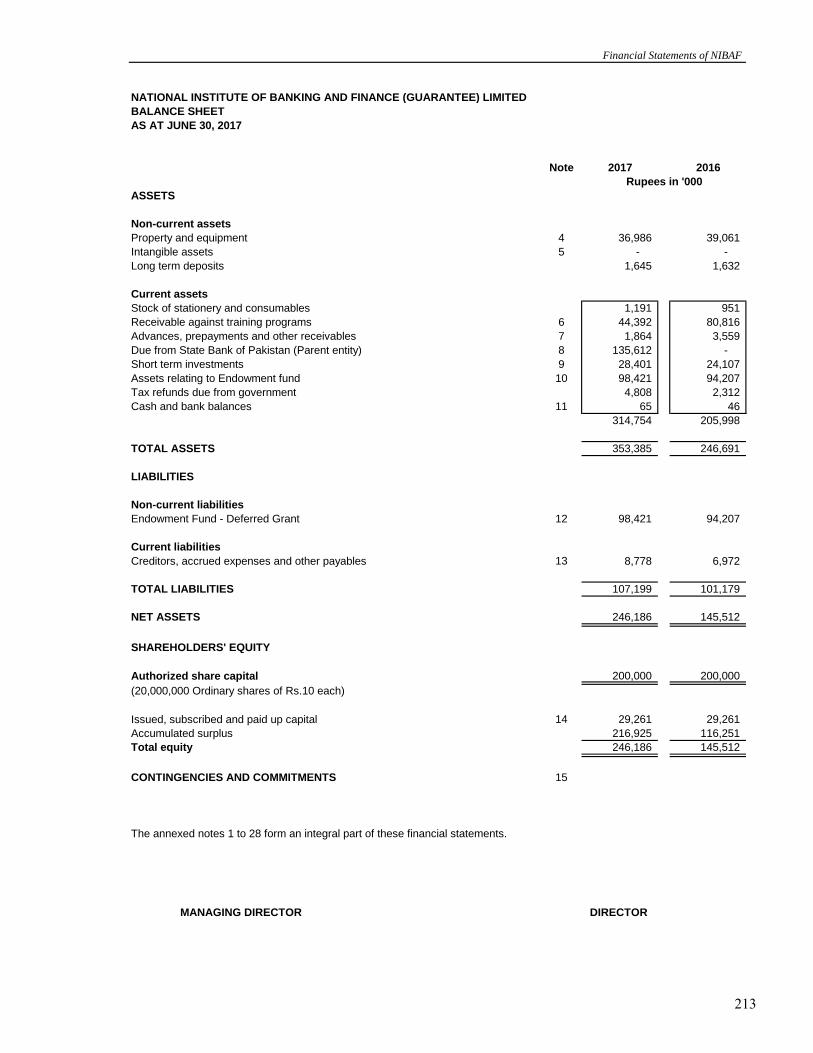
NATIONAL INSTITUTE OF BANKING AND FINANCE (GUARANTEE) LIMITED
BALANCE SHEET
AS AT JUNE 30, 2017
Note 2017 2016
ASSETS
Non-current assets
Property and equipment 4 36,986 39,061
Intangible assets 5 - -
Long term deposits 1,645 1,632
Current assets
Stock of stationery and consumables 1,191 951
Receivable against training programs 6 44,392 80,816
Advances, prepayments and other receivables 7 1,864 3,559
Due from State Bank of Pakistan (Parent entity) 8 135,612 -
Short term investments 9 28,401 24,107
Assets relating to Endowment fund 10 98,421 94,207
Tax refunds due from government 4,808 2,312
Cash and bank balances 11 65 46
314,754 205,998
TOTAL ASSETS 353,385 246,691
LIABILITIES
Non-current liabilities
Endowment Fund - Deferred Grant 12 98,421 94,207
Current liabilities
Creditors, accrued expenses and other payables 13 8,778 6,972
TOTAL LIABILITIES 107,199 101,179
NET ASSETS 246,186 145,512
SHAREHOLDERS' EQUITY
Authorized share capital 200,000 200,000
(20,000,000 Ordinary shares of Rs.10 each)
Issued, subscribed and paid up capital 14 29,261 29,261
Accumulated surplus 216,925 116,251
Total equity 246,186 145,512
CONTINGENCIES AND COMMITMENTS 15
The annexed notes 1 to 28 form an integral part of these financial statements.
MANAGING DIRECTOR DIRECTOR
Rupees in '000
Financial Statements of NIBAF
213

NATIONAL INSTITUTE OF BANKING AND FINANCE (GUARANTEE) LIMITED
INCOME AND EXPENDITURE ACCOUNT
FOR THE YEAR ENDED JUNE 30, 2017
Note 2017 2016
INCOME
Training and education fee 16 366,876 302,880
Hostel and training halls 17 26,367 31,803
Other income 18 2,106 5,569
395,349 340,252
EXPENDITURE
Operating, administrative and general expenses 19 (296,080) (249,973)
Less: Income transferred from endowment fund 12 1,405 1,605
(294,675) (248,368)
Operating surplus for the year before taxation 100,674 91,884
Taxation 20 - -
Surplus for the year after taxation 100,674 91,884
Other comprehensive income for the year - -
Total comprehensive surplus for the year 100,674 91,884
The annexed notes 1 to 28 form an integral part of these financial statements.
MANAGING DIRECTOR DIRECTOR
Rupees in '000
State Bank of Pakistan Annual Report FY17
214

NATIONAL INSTITUTE OF BANKING AND FINANCE (GUARANTEE) LIMITED
CASH FLOW STATEMENT
FOR THE YEAR ENDED JUNE 30, 2017
2017 2016
CASH FLOWS FROM OPERATING ACTIVITIES
Operating surplus for the year before taxation 100,674 91,884
Adjustments for non cash items
Income from investments (1,515) (1,514)
Reversal of provision against doubtful receivables (10) -
Depreciation 13,409 14,319
Amortisation - 54
Gain on disposal of property and equipment (350) (3,271)
11,534 9,588
Operating income before working capital changes 112,208 101,472
Changes in working capital
(Increase) / decrease in current assets
Stock of stationery and consumables (240) 21
Receivable against training programs 36,434 (28,480)
Advances, prepayments and other receivables 1,695 (3,066)
Due from State Bank of Pakistan (Parent entity) (135,612) -
(97,723) (31,525)
Increase / (decrease) in current liabilities
Creditors, accrued expenses and other payables 1,806 (2,117)
Due to State Bank of Pakistan (Parent entity) - (56,380)
1,806 (58,497)
Net changes in working capital (95,917) (90,022)
Withholding tax deducted (2,496) (1,234)
Long term deposits (13) -
Net cash generated from operating activities 13,782 10,216
CASH FLOWS FROM INVESTING ACTIVITIES
Capital expenditure (11,334) (13,492)
Sale proceeds from disposal of property and equipment 350 3,271
Investments made during the year (30,069) (47,435)
Investments redeemed during the year 27,290 47,440
Endowment fund investments made during the year (384,813) (94,562)
Endowment fund investments redeemed during the year 384,813 94,562
Net cash used in investing activities (13,763) (10,216)
Net increase in cash and cash equivalents during the year 19 -
Cash and cash equivalents at the beginning of the year 46 46
Cash and cash equivalents at the end of the year 65 46
The annexed notes 1 to 28 form an integral part of these financial statements.
MANAGING DIRECTOR DIRECTOR
Rupees in '000
Financial Statements of NIBAF
215

NATIONAL INSTITUTE OF BANKING AND FINANCE (GUARANTEE) LIMITED
STATEMENT OF CHANGES IN EQUITY
FOR THE YEAR ENDED JUNE 30, 2017
Share
Capital
Accumulated
SurplusTotal
Balance at July 01, 2015 29,261 24,367 53,628
Total comprehensive surplus for the year - 91,884 91,884
Balance at June 30, 2016 29,261 116,251 145,512
Total comprehensive surplus for the year - 100,674 100,674
Balance at June 30, 2017 29,261 216,925 246,186
The annexed notes 1 to 28 form an integral part of these financial statements.
MANAGING DIRECTOR DIRECTOR
-----------------------------Rupees in '000 -----------------------------
State Bank of Pakistan Annual Report FY17
216

NATIONAL INSTITUTE OF BANKING AND FINANCE (GUARANTEE) LIMITED
NOTES TO AND FORMING PART OF THE FINANCIAL STATEMENTS
FOR THE YEAR ENDED JUNE 30, 2017
1
1.1
1.2
2 BASIS OF PREPARATION
2.1 Statement of compliance
2.2
2.3
Standards, Interpretations or Amendments
- IFRS 9 – Financial Instruments
- IFRS 15 – Revenue from contracts with customers
- IFRS 16 – Leases
2.4 Basis of measurement
These financial statements have been prepared under the historical cost convention except as stated otherwise.
Financial Statements of NIBAF
New and amended standards, interpretations and amendments to published approved accounting standards
that are effective in the current year
New and amended standards and interpretations to published approved accounting standards that are not
yet effective in the current year
The Companies Act, 2017 (the Act) has been enacted on May 30, 2017 superseding the Companies Ordinance,
1984. Subsequent to the promulgation of the Companies Act, 2017, the SECP through a press release dated July 20,
2017 has allowed companies whose financial year closes on or before June 30, 2017 to prepare their financial
statements in accordance with the provisions of the repealed Companies Ordinance, 1984. Accordingly, the financial
statements of the Institute for the year ended June 30, 2017 have been prepared in accordance with the provisions of
the repealed Ordinance while the financial statements of the Institute for the year ending June 30, 2018 will be
prepared in accordance with the provisions of the new Companies Act, 2017. The Management is currently in the
process of assessing the impact of the provisions of the Act on the financial statements of the Institute.
These financial statements have been prepared in accordance with the approved accounting standards as applicable
in Pakistan. As per the requirements of circular no.CLD/CCD/PR(11)/2017 dated July 20, 2017 issued by the
Securities and Exchange Commission of Pakistan (SECP), companies the financial year of which closes on or before
June 30, 2017 shall prepare their financial statements in accordance with the provisions of the repealed Companies
Ordinance, 1984. Accordingly approved accounting standards comprise of International Financial Reporting
Standards (IFRSs) issued by the International Accounting Standards Board and the Accounting Standard for Not for
Profit Organisations (NPOs) issued by the Institute of Chartered Accountants of Pakistan, as are notified under the
Companies Ordinance, 1984, provisions of and directives issued thereunder. In case requirements differ, the
provisions or directives of the Companies Ordinance, 1984 prevail.
Further, the following new standards have been issued by IASB which are yet to be notified by the SECP for the
purpose of applicability in Pakistan.
Effective date (accounting period
beginning on or after)
STATUS AND NATURE OF BUSINESS
National Institute of Banking and Finance (Guarantee) Limited (“the Institute”) was incorporated under the repealed
Companies Ordinance, 1984 on March 21, 1993 in Pakistan, as a private company limited by guarantee having
share capital. The Institute is engaged in providing education and training in the field of banking, finance and allied
areas. State Bank of Pakistan is the Parent entity of the Institute ("the Parent entity").
These financial statements are presented in Pakistani Rupee which is the Institute's functional and presentation
currency.
The impact of standards, interpretations and amendments to published approved accounting standards that are not
yet effective is yet to be determined by the Management of the Institute.
There are certain new and amended standards and interpretations that are mandatory for the accounting period
beginning on or after July 1, 2017 but are considered not to be relevant or do not have any significant effect on the
Institute's operations and are, therefore, not disclosed in these financial statements.
January 1, 2018
January 1, 2018
January 1, 2019
There are certain new and amended standards and interpretations that are mandatory for the accounting period
beginning on or after July 1, 2016 but are considered not to be relevant or do not have any significant effect on the
Institute's operations and are, therefore, not disclosed in these financial statements.
217

2.5 Significant accounting estimates
(a) Property and equipment
(b) Intangible assets
(c) Impairment
The Institute’s assessment relating to impairment of assets is discussed in note 3.3.
(d) Provision for slow moving stocks and other receivables
(e) Provision for doubtful receivables
3 SIGNIFICANT ACCOUNTING POLICIES
3.1 Property and equipment
The assets' residual values and useful lives are reviewed, and adjusted, if appropriate, at each balance sheet date.
State Bank of Pakistan Annual Report FY17
The Institute exercises judgment and makes provision for slow moving stocks based on their future usability.
Provision for other receivables is determined using judgment based on past business practices, probability of
recovery and lapsed time period of due balance. Management believes that changes in outcome of estimates
will not have a material effect on the financial statements.
The Institute makes provisions for doubtful receivables when the collection of full amount is not probable.
Management believes that changes in outcome of estimates will not have a material effect on the financial
statements.
Property and equipment are stated at cost less accumulated depreciation and accumulated impairment losses, if any,
except capital work-in-progress which is stated at cost less accumulated impairment losses, if any.
Subsequent costs are included in the asset's carrying amounts or recognised as a separate asset, as appropriate,
only when it is probable that future economic benefits associated with the item will flow to the Institute and the cost of
the item can be measured reliably. Normal repairs and maintenance are charged to income as and when incurred.
Gains and losses on sale or retirement of property and equipment are included in the income and expenditure
account.
The significant accounting policies applied in the preparation of these financial statements are set out below. These
policies have been consistently applied to all the years presented, unless otherwise stated.
Depreciation is charged to income and expenditure account applying the straight line method, whereby the
depreciable amount of an asset is written off over its estimated useful life. Depreciation is charged on additions from
the month the asset is available for use and on disposals up to the month preceding the month of disposal. The rates
of depreciation are stated in note 4.1 to these financial statements.
The areas where various assumptions and estimates are significant to the Institute's financial statements or where
judgment was exercised in application of accounting policies are as follows:
The Institute reviews the residual values and useful lives of intangible assets on a regular basis. Any change
in the estimates in future years might affect the carrying amounts of the respective items of intangible assets
with a corresponding effect on amortisation and impairment.
The preparation of financial statements in conformity with approved accounting standards requires management to
make estimates and assumptions that affect the reported amounts of assets and liabilities, income and expenses. It
also requires management to exercise judgment in application of the Institute's accounting policies. The estimates
and associated assumptions are based on historical experience and various other factors that are believed to be
reasonable under the circumstances. These estimates and assumptions are reviewed on an ongoing basis.
Revisions to accounting estimates are recognised in the period in which the estimate is revised if the revision affects
only that period, or in the period of revision and future periods if the revision affects both the current and future
periods.
The Institute reviews the residual values and useful lives of property and equipment on a regular basis. Any
change in the estimates in future years might affect the carrying amounts of the respective items of property
and equipment with a corresponding effect on depreciation charge and impairment.
218

3.2 Intangible - computer softwares
3.3 Impairment
3.4 Deferred grants
3.5 Stock of stationery and consumables
3.6 Receivable against training programs and other receivables
3.7 Financial Instruments
Financial Assets
3.7.1 Classification
a) Financial assets 'at fair value through profit or loss'
b) Loans and receivables
c) Held to maturity
d) Available for sale financial assets
Grants related to specific assets are set up as deferred grants and recognized as income on a systematic basis over
the useful life of the related assets.
Financial assets intended to be held for an indefinite period of time, which may be sold in response to needs for
liquidity or changes in equity prices, are classified as 'available for sale'. Available for sale financial instruments are
those non-derivative financial assets that are designated as available for sale or are not classified as (a) loans and
receivables, (b) held to maturity and (c) financial assets 'at fair value through profit or loss'.
Stock of stationery and consumables are valued at the lower of cost and net realizable value. Cost comprises cost of
purchases and other costs incurred in bringing the items to their present location and condition. Replacement cost of
the items is used to measure the net realizable value. The valuation is done on moving average basis. Provision is
made for stocks which are not used for a considerable period of time or stocks which are not expected to be used in
future.
An estimate for doubtful receivable against training programs and other receivables is made when collection of the
full amount is no longer probable. Bad debts are written off when identified.
Financial assets that are acquired principally for the purpose of generating profit from short-term fluctuations in prices
are classified in financial assets 'at fair value through profit or loss' category.
These are non-derivative financial assets with fixed or determinable payments that are not quoted in an active
market. The Institute's loans and receivables comprise of long term deposits, receivable against training programs,
advances and other receivables, due from State Bank of Pakistan and bank balances in the balance sheet.
These are financial assets with fixed or determinable payments and fixed maturity with the Institute having positive
intent and ability to hold till maturity.
Receivable against training programs are recognised and carried at original invoice amount less an allowance for
any doubtful receivable.
The carrying amounts of the Institute’s assets are reviewed at each balance sheet date to determine whether there is
any indication of impairment loss. If any such indication exists and where the carrying value exceeds the estimated
recoverable amount, the assets are written down to their recoverable amount and the differences are recognized as
expense in the income and expenditure account.
Computer softwares are stated at cost less accumulated amortisation. Software costs are capitalised only when it is
probable that future economic benefits attributable to the software will flow to the Institute and these are amortised
applying the straight line method at the rates stated in note 5.1 to these financial statements.
Financial Statements of NIBAF
The management determines the appropriate classification of its financial assets in accordance with the
requirements of International Accounting Standard 39 (IAS 39) "Financial Instruments: Recognition and
Measurement" at the time of purchase of financial assets and re-evaluates this classification on a regular basis. The
financial assets of the Institute are categorised as follows:
219

3.7.1.1 Initial recognition and measurement
3.7.1.2 Subsequent measurement
3.7.1.3 Impairment
a) Assets carried at amortised cost
3.7.1.4 Offsetting of financial assets and liabilities
3.7.2 Financial liabilities
3.7.3 Derecognition
All financial liabilities are recognised at the time when the Institute becomes a party to the contractual provisions of
the instrument.
Financial assets and financial liabilities are offset and the net amount is reported in the balance sheet when there is
a legally enforceable right to set off the recognised amounts and there is a intention to settle on a net basis, or to
realise the assets and settle the liabilities simultaneously.
Subsequent to initial recognition, financial assets categorised as "loans and receivables" and "held to maturity" are
valued at amortised cost.
Financial assets are derecognised at the time when the Institute loses control of the contractual rights that comprise
the financial assets. Financial liabilities are derecognised at the time when they are extinguished i.e. when the
obligation specified in the contract is discharged, cancelled, or expires. Any gain or loss on derecognition of financial
assets and financial liabilities is taken to the income and expenditure account.
Currently, the financial assets of the Institute have been classified under "loans and receivables" and "held to
maturity" categories.
All financial assets are recognised at the time the Institute becomes a party to the contractual provisions of the
instrument. Regular purchases and sales of financial assets are recognised on the trade date - the date on which the
Institute commits to purchase or sell the assets. Financial assets are initially recognised at fair value plus transaction
costs except for financial assets carried at fair value through profit or loss. Financial assets carried at fair value
through profit or loss are initially recognised at fair value while the transaction costs associated with these financial
assets are taken directly to the income and expenditure account.
If, in a subsequent period, the amount of the impairment loss decreases and the decrease can be related objectively
to an event occurring after the impairment was recognised (such as an improvement in the debtor’s credit rating), the
reversal of the previously recognised impairment loss is recognised in the income and expenditure account.
A financial asset or a group of financial assets is impaired and impairment losses are recorded only if there is
objective evidence of impairment as a result of one or more events that occurred after the initial recognition of the
asset (a ‘loss event’) and that loss event (or events) has an impact on the estimated future cash flows of the financial
asset or group of financial assets that can be reliably estimated.
Evidence of impairment may include indications that the debtors or a group of debtors is experiencing significant
financial difficulty or default in payments, the probability that they will enter bankruptcy, and where observable data
indicate that there is a measurable decrease in the estimated future cash flows, such as changes in economic
conditions that correlate with defaults.
The Institute assesses at each balance sheet date whether there is objective evidence that a financial asset is
impaired.
For loans and receivables category, the amount of the loss is measured as the difference between the asset’s
carrying amount and the present value of estimated future cash flows (excluding future credit losses that have not
been incurred) discounted at the financial asset’s original effective interest rate. The carrying amount of the asset is
reduced and the amount of the loss is recognised in the income and expenditure account. If a loan or held-to-maturity
investment has a variable interest rate, the discount rate for measuring any impairment loss is the current effective
interest rate determined under the contract. As a practical expedient, the Institute also evaluates impairment on the
basis of an instrument’s fair value using an observable market price.
State Bank of Pakistan Annual Report FY17
220

3.8 Creditors, accrued expenses and other payables
3.9 Cash and cash equivalents
Cash and cash equivalents comprise cash in hand and cash with banks in current account.
3.10 Provisions
3.11 Revenue recognition
(i)
(ii)
(iii)
(iv) Other income is recognised as and when earned.
3.12 Allocation of deficit to the State Bank of Pakistan (Parent Entity)
3.13 Taxation
3.14 Endowment fund - Deferred Grant
a)
b)
c)
d)
e)
To provide assistance in such activities as field surveys, experiments, collection and dissemination of
information, seminars, conferences and trainings etc. aimed at increasing awareness, introducing
improvements and enhancing efficiency in areas related to Banking and Finance in general and Rural Finance
in particular.
To conduct research and trainings to increase awareness of commercial banks regarding possibilities,
prospects and risks, to develop demand driven products and services, instituting enhanced portfolio
management capability and installing systems and procedures for reducing costs etc.
To promote gathering of information on rural finance by collecting and analysing data, conducting survey
thereby working as a main training hub.
The Institute is eligible for hundred percent (100%) tax credit on taxes payable by the Institute under clause (d) of sub-
section 2 of section 100C of the Income Tax Ordinance, 2001, introduced under the Finance Act, 2015.
The Institute has established an Endowment fund effective from July 1, 2011 for utilisation of the amount in line with
the purpose of grant received from the SBP. The terms of references / rules and regulations of the Endowment fund
have been formulated. The aims and objective of NIBAF Endowment Fund are as under:
Capacity building of SBP and its subsidiaries (including SBP-BSC, NIBAF and others, if any) as well as other
banking professionals in realms of Rural Finance, Microfinance, Agriculture and SMEs etc.
To encourage, promote, support and undertake academic and scientific investigations, innovative research,
inventions and developments in various Banking and Finance related areas.
Liabilities for creditors, accrued expenses and other amounts payable are carried at amortized cost, which is the fair
value of the consideration to be paid in future for goods and services received, whether or not billed to the Institute.
Income from endowment fund is recognised on an accrual basis and determined in accordance with the
NIBAF Endowment Fund Rules.
The Institute has an arrangement with the State Bank of Pakistan (SBP) whereby deficit incurred by the Institute is
allocated to the SBP. This allocation is credited directly to the Statement of Changes in Equity as transactions with
owners.
Training, education and hostel services are recognised on an accrual basis.
Income on investment is accounted for on a time proportion basis using the applicable rates.
Provisions are recognised in the balance sheet when the Institute has a present legal or constructive obligation as a
result of past events, it is probable that an outflow of resources embodying economic benefits will be required to
settle the obligation and a reliable estimate can be made. Provisions are reviewed at each balance sheet date and
adjusted to reflect the current best estimate.
Financial Statements of NIBAF
221

f)
g)
3.15 Retirement benefits
4 PROPERTY AND EQUIPMENT
4.1 The following is a statement of property and equipment:
Cost
Balance as at July 01, 2015 13,768 21,022 60,143 36,532 131,465
Additions during the year 1,410 - 811 11,248 13,469
Transfer in during the year - 279 - 981 1,260
Disposals during the year (198) - (2,292) (5,206) (7,696)
Balance as at June 30, 2016 14,980 21,301 58,662 43,555 138,498
Balance as at July 01, 2016 14,980 21,301 58,662 43,555 138,498
Additions during the year 2,002 2,442 5,200 - 9,644
Transfer in during the year - 3,159 - - 3,159
Disposals during the year (60) - (665) - (725)
Balance as at June 30, 2017 16,922 26,902 63,197 43,555 150,576
Allowance for depreciation
Balance as at July 01, 2015 8,062 20,691 40,159 22,665 91,577
Depreciation charge for the year 974 330 7,083 5,932 14,319
Transfer in during the year - 256 - 981 1,237
Disposals during the year (198) - (2,292) (5,206) (7,696)
Balance as at June 30, 2016 8,838 21,277 44,950 24,372 99,437
Balance as at July 01, 2016 8,838 21,277 44,950 24,372 99,437
Depreciation charge for the year 1,134 226 5,997 6,052 13,409
Transfer in during the year - 1,469 - - 1,469
Disposals during the year (60) - (665) - (725)
Balance as at June 30, 2017 9,912 22,972 50,282 30,424 113,590
Carrying amounts - 2017 7,010 3,930 12,915 13,131 36,986
Carrying amounts - 2016 6,142 24 13,712 19,183 39,061
Rate of depreciation 10% 33% 20% 20%
4.2
4.3
For any other purpose which the Institute's Board of Directors may consider fit for the overall benefit Institute
and its stakeholders.
To create linkages with national and international organisations for the strengthening of Rural finance related
activities.
State Bank of Pakistan Annual Report FY17
The depreciation charge for the year has been allocated to operating, administrative and general expenses - (Refer
note 19).
VehiclesOffice
equipment
Electronic
data
processing
equipment
The permanent employees of the Institute represent employees who are either deputed by the State Bank of
Pakistan (Parent entity) or State Bank of Pakistan - Banking Service Corporation (related entity). All the employees of
the Institute are entitled to retirement benefits in accordance with the rules and regulations of the retirement fund /
schemes of the Parent entity. The respective expenses are borne by the Parent entity and is not charged to the
Institute.
Land and buildings in use of the Institute is owned by the State Bank of Pakistan. No rent for its use has been
charged by the State Bank of Pakistan to the Institute.
Property and equipment
Furniture
and
fixtures
Total
----------------------------------------------------Rupees in '000 ----------------------------------------------------
222

5 INTANGIBLE ASSETS - COMPUTER SOFTWARE
5.1 The following is a statement of intangible assets:
2017 2016
Cost
Balance as at the beginning of the year 195 195
Additions during the year - -
Disposals during the year - -
Balance as at end of the year 195 195
Allowance for amortisation
Balance as at the beginning of the year 195 141
Amortisation for the year - 54
Disposals during the year - -
Balance as at end of the year 195 195
Carrying amounts - -
Rate of amortisation 33% 33%
5.2
Note 2017 2016
6 RECEIVABLE AGAINST TRAINING PROGRAMS
UNSECURED
Associated undertaking
SBP Banking Services Corporation 32,849 51,760
State Bank of Pakistan 2,223 22,818
35,072 74,578
Others
Considered good 9,320 6,238
Considered doubtful 1,444 1,454
10,764 7,692
Provision for doubtful receivables 6.1 (1,444) (1,454)
9,320 6,238
44,392 80,816
6.1 Provision for doubtful receivables
Opening balance 1,454 1,454
Additions during the year - -
Reversal during the year (10) -
1,444 1,454
7 ADVANCES, PREPAYMENTS AND OTHER RECEIVABLES
Advances to staff - unsecured, considered good 1,212 1,452
Receivable from Endowment fund upon maturity of Investment 237 1,605
Advances to supplier - unsecured, considered good - 109
Prepayments 415 393
1,864 3,559
Financial Statements of NIBAF
Rupees in '000
The amortisation for the year has been allocated to operating, administrative and general expenses - (Refer note 19).
Rupees in '000
223

2017 2016
8 DUE FROM STATE BANK OF PAKISTAN (PARENT ENTITY)
State Bank of Pakistan (Parent entity) 135,612 -
Opening balance - 56,380
Received / (Payments) during the year 135,612 (56,380)
Closing balance 135,612 -
Note 2017 2016
9 SHORT TERM INVESTMENTS
Held to maturity
Market Treasury Bills
Cost 9.1 28,330 24,080
Accrued profits 71 27
28,401 24,107
9.1
9.2
Note 2017 2016
10 ASSETS RELATING TO ENDOWMENT FUND
Held to maturity
Market Treasury Bills
Cost 10.1 98,512 94,562
Accrued profits 146 1,250
Less: income payable to the Institute (237) (1,605)
98,421 94,207
10.1
10.2
2017 2016
11 CASH AND BANK BALANCES
Cash in hand 60 34
Cash in bank - current account 5 12
SBP Banking Services Corporation (Associated undertaking)
65 46
12 ENDOWMENT FUND - DEFERRED GRANT
Opening balance 94,207 89,391
Interest income on investments 5,619 6,421
Less: income allocated to the Institute (at the rate of 25 percent) (1,405) (1,605)
Closing balance 98,421 94,207
State Bank of Pakistan Annual Report FY17
These carry return at the rate of 6.1% per annum and having maturities from September 14, 2017 to September 28,
2017 (2016: 5.91% per annum having maturity on June 22, 2017).
These carry return at the rate of 6.1% per annum and having maturity on December 21, 2017 (2016: 6.17% per
annum having maturity on July 7, 2016).
Rupees in '000
This represented capital grant amounting to US dollar one million received by the Institute in January 2005 from the
State Bank of Pakistan (Parent Entity) for establishment of a Rural Finance Resource Centre. The grant was
disbursed by the State Bank of Pakistan out of the proceeds of loan received by the Government of Pakistan (GoP)
from Asian Development Bank vide loan agreement No. 1987-PAK dated December 23, 2002. The Institute has
established an Endowment fund effective from July 1, 2011 for utilisation of the amount in line with the purpose of
grant received from SBP. The NIBAF Endowment Fund Rules, detailing the investment and utilisation of the grant,
have been formulated and approved by the Board of Directors in their meeting held on August 12, 2015.
Rupees in '000
Rupees in '000
This represents the current account of the Institute with the State Bank of Pakistan (Parent entity) to manage the
financial affairs of the Institute. Further, the settlement of trainings provided to SBP and SBP BSC are also settled
through current account.
Rupees in '000
The fair value of investments as at June 30, 2017 is Rs 28.4 million (2016: Rs 24.11 million). Market Treasury Bills
have been revalued on the basis of yields published by Reuters (PKRV) for government securities.
The fair value of investments as at June 30, 2017 is Rs 98.66 million (2016: Rs 95.81 million). Market Treasury Bills
have been revalued on the basis of yields published by Reuters (PKRV) for government securities.
224

Note 2017 2016
13 CREDITORS, ACCRUED EXPENSES AND OTHER PAYABLES
Creditors 5,947 3,058
Traveling and training cost 1,145 1,010
Accrued expenses 778 2,524
Retention money / deposits 908 380
8,778 6,972
14 ISSUED, SUBSCRIBED AND PAID UP CAPITAL
Issued, subscribed and paid-up capital
2,926,084 ordinary shares of Rs.10 each issued for cash 14.1 29,261 29,261
14.1
15 CONTINGENCIES AND COMMITMENTS
15.1 Tax related contingencies
a)
b)
2017 2016
15.2 Commitments in respect of capital expenditure 98 418
15.3
Financial Statements of NIBAF
Rupees in '000
State Bank of Pakistan holds 2,926,083 (2016: 2,926,083) ordinary shares and the Governor of State Bank of Pakistan
holds 1 (2016: 1) share of the Institute as at the balance sheet date.
Rupees in '000
There were no other contingencies and commitments outstanding as at June 30, 2017 and 2016 except as disclosed
in notes 15.1 and 15.2.
The Finance Act 2015 extended the scope of services covered under Islamabad Capital Territory (Tax on Services)
Ordinance, 2001 (ICTO) and some new services were brought within the purview of sales tax which are detailed in
schedule to the ICTO. During the year 2016, the Institute received a notice from the tax department dated January 20,
2016 claiming that the services provided by Institute fall within the purview of serial numbers 13, 19 and 38 of schedule
to the ICTO and accordingly the Institute should get itself registered for sales tax, obtain Sales Tax Registration
number (STRN), file returns for six months from July 2015 to December 31, 2015 and settle the outstanding liability in
respect of sales tax for those six months. The management believes that the Institute does not fall under the purview
of serial numbers 13, 19 and 38 of schedule to the ICTO mainly on the ground that NIBAF is a training institute and is
not liable to be registered under sales tax on services. A reply was sent from the Institute’s management to the
Assistant Commissioner Inland Revenue (ACIR) justifying the non-applicability of serial numbers 13, 19 and 38 of
schedule to the ICTO to the Institute. However, the ACIR maintained the tax department’s view and ordered the
compulsory registration of the Institute with immediate effect through its order dated February 19, 2016.
Moreover, the Institute received a show cause notice on March 10, 2016 for filing the tax returns for the period from
July 2015 to December 2015 and payment of the due amount of sales tax on services. Subsequently, the department
passed the following order on April 11, 2016:
Imposition of a penalty under section 33(1) of the Sales Tax Act, 1990 for non-filing amounting to Rs.35,000 along
with default surcharge and penalty under section 33(5) of the Sales Tax Act, 1990.
The Institute challenged the above order passed by the ACIR before the Commissioner Inland Revenue Appeals II
(CIRA). However, the matter was decided against the Institute.
During the current year, the Institute has filed an appeal before the Commissioner Inland Revenue Appeals II (CIRA)
challenging the compulsory registration of the Institute done by the department vide its order dated February 19, 2016.
This appeal was disposed of by the CIRA on February 9, 2017 because it was not maintainable under the law (as it
was outside his jurisdiction) and the case can now be taken to the Honorable Islamabad High Court. Consequently, the
Institute intends to file writ petition against the above orders before the Honorable Islamabad High Court.
The Institute, based on the advice of its legal counsel, is of the view that the Institute has valid grounds and there are
fair chances of success before the Honorable Islamabad High Court. Accordingly, no provision has been recognized in
these financial statements.
Imposition of sales tax amounting to Rs.13,675,649; and
225

2017 2016
16 TRAINING AND EDUCATION FEE
Domestic courses 330,509 263,652
International courses 20,590 15,375
Islamic banking courses 15,777 23,853
366,876 302,880
16.1
Note 2017 2016
17 HOSTEL AND TRAINING HALLS INCOME
Rental income 15,417 21,206
Service charges 979 667
Food and beverages 9,971 9,930
26,367 31,803
18 OTHER INCOME
Income from financial assets
Interest on investments 1,515 1,514
Income from non-financial assets
Reversal of provision against doubtful receivables 6.1 10 -
Gain on disposal of property and equipment 350 3,271
Others - net 231 784
591 4,055
2,106 5,569
19 OPERATING, ADMINISTRATIVE AND GENERAL EXPENSES
Salaries, wages and other benefits 142,694 121,791
Training cost 35,723 34,611
Repairs and maintenance 20,615 17,768
Lodging, catering and allied services 29,685 21,473
Travelling and conveyance 11,379 6,477
Printing and stationery 5,235 3,381
Medical 402 417
Electricity, gas and water 24,324 18,855
Telephone and fax 1,095 1,044
Vehicles running and maintenance 1,092 1,016
General consumables 1,092 961
Security charges 3,725 3,069
Insurance 2,090 1,836
Newspapers, books and periodicals 167 144
Postage and courier 424 379
Entertainment 711 779
Auditors' remuneration 19.1 288 397
Legal and professional 613 53
Depreciation 4.1 13,409 14,319
Amortisation 5.1 - 54
Others 1,317 1,149
296,080 249,973
19.1 Auditors' remuneration
Audit fee 225 225
Out of pocket expenses 45 154
270 379
Sindh Sales Tax on Services 18 18
288 397
State Bank of Pakistan Annual Report FY17
From July 1, 2015 training & allied services including hostel facility provided to trainee officers of State Bank of
Pakistan (parent entity) are billed to State Bank of Pakistan. Previously, no amount was being charged to SBP for
these training related services provided by the Institute. However, deficit at the end of every year was being passed on
to SBP.
Rupees in '000
Rupees in '000
226

20 TAXATION
(a) return has been filed;
(b) tax required to be deducted or collected has been deducted or collected and paid; and
(c) withholding tax statements for the immediately preceding tax year have been filed.
21 FINANCIAL RISK MANAGEMENT
(a) Credit risk
(i) Receivable against training programs, advances, deposits, bank balances and other receivables
(ii) Investments
(b) Liquidity risk
Financial Statements of NIBAF
The operations of the Institute fall within the purview of clause (d) of sub-section 2 of section 100C of the Income Tax
Ordinance, 2001 and the Institute intends to comply with the above-mentioned requirements. Hence, the Institute will
be eligible to claim tax credit equal to 100 percent of the tax payable by the Institute. The Institute has recorded a net
surplus of Rs 100.674 million during the year ended June 30, 2017. Tax credit of hundred percent is allowed under
section 100C of the Income Tax Ordinance, 2001 in respect of tax charge on net surplus earned by the Institute and
consequently no charge has been recognised in these financial statements for the year ended June 30, 2017.
Credit risk is the risk of financial loss to the Institute if a customer or counterparty to a financial instrument fails to
meet its contractual obligations, and arises principally from the Institute’s receivables against training programs,
advances, deposits, other receivables, bank balances and investment securities.
The Board of Directors has overall responsibility for the establishment and oversight of the Institute’s risk management
framework. The Board has delegated the responsibility for developing and monitoring the Institute’s risk management
policies to its management. The management reports regularly to the Board of Directors on its activities. The Institute’s
risk management policies are established to identify and analyse the risks faced by the Institute, to set appropriate risk
limits and controls, and to monitor risks and adherence to limits. Risk management policies and systems are reviewed
regularly to reflect changes in market conditions and the Institute’s activities. The Institute, through its training and
management standards and procedures, aims to develop a disciplined and constructive control environment in which
all employees understand their roles and obligations. The management monitors compliance with the Institute’s risk
management policies and procedures, and reviews the adequacy of the risk management framework in relation to the
risks faced by the Institute.
The income of the Institute was exempt from tax under clause (92) of Part I of the Second Schedule to the Income Tax
Ordinance, 2001 uptil tax year 2013 and for the tax year 2014 under clauses (59) and (60) of Part I of the Second
Schedule to the Income Tax Ordinance, 2001. The Finance Act 2014 (applicable for tax year 2015) deleted clauses
(59) and (60) as mentioned above and introduced a new section 100C in the Income Tax Ordinance, 2001. As per
Section 100C, non profit organisations, trusts or welfare organisations as mentioned in sub section 2 of section 100C
are allowed a tax credit equal to one hundred percent of the tax payable, including minimum and final tax payable
under any of the provisions of the Income Tax Ordinance, 2001, subject to the following conditions, namely-
The Institute is primarily subject to credit risk, liquidity risk and market risk. The policies and procedures for managing
these risks are outlined below. The Institute has designed and implemented a framework of controls to identify,
monitor and manage these risks.
The Institute’s exposure to credit risk is influenced mainly by the individual characteristics of each customer.
Since the majority of the customers are either commercial banks and government owned entities including the
Parent entity and its subsidiary, the Institute is less likely to be exposed to credit risk. The Institute also
provides trainings to other central banks which are conducted in coordination with Government of Pakistan
and has no history of significant default risk.
The Institute limits its exposure to credit risk by only investing in Market Treasury Bills. This investment is in
Subsidiary General Ledger Account (SGLA) maintained by the State Bank of Pakistan - Banking Services
Corporation, Karachi. The Institute's management does not expect the counterparty to fail to meet its
obligations.
Liquidity risk is the risk that the Institute will not be able to meet its financial obligations as they fall due. The
Institute believes that it is not exposed to any significant level of liquidity risk.
227

(c) Market risk
(i) Currency risk
The Institute is not exposed to currency risk.
(ii) Interest rate risk
(iii) Other market price risk
21.1 Financial instruments by category
Assets
Long term deposits 1,645 - - 1,645
Receivable against training programs 44,392 - - 44,392
Advances and other receivables 1,449 - - 1,449
Due from State Bank of Pakistan (Parent entity) 135,612 - - 135,612
Short term investments - 28,401 - 28,401
Assets relating to Endowment fund - 98,421 - 98,421
Cash and bank balances 65 - - 65
183,163 126,822 - 309,985
Liabilities
Creditors, accrued expenses and other payables - 8,778 8,778
- 8,778 8,778
Assets
Long term deposits 1,632 - - 1,632
Receivable against training programs 80,816 - - 80,816
Advances and other receivables 3,166 - - 3,166
Short term investments - 24,107 - 24,107
Assets relating to Endowment fund - 94,207 - 94,207
Cash and bank balances 46 - - 46
85,660 118,314 - 203,974
Liabilities
Creditors, accrued expenses and other payables - 6,972 6,972
- 6,972 6,972
State Bank of Pakistan Annual Report FY17
-------------------------------------As at June 30, 2017------------------------------------
-------------------------------------------------Rupees in '000-------------------------------------------------
Liabilities at fair
value through
profit or loss
Total
--------------------------------------------------------------------As at June 30, 2017--------------------------------------------------------------------
Held to maturity
Financial assets
at 'fair value
through profit or
loss'
-------------------------------------------------Rupees in '000-------------------------------------------------
Loans and
receivablesTotal
Financial
liabilities at
amortised cost
-------------------------------------As at June 30, 2016------------------------------------
Held to maturity
Financial assets
at 'fair value
through profit or
loss'
Liabilities at fair
value through
profit or loss
Total
--------------------------------------------------------------------As at June 30, 2016--------------------------------------------------------------------
-----------------------------------------------------------------Rupees in '000-----------------------------------------------------------------
Financial
liabilities at
amortised cost
Market risk is the risk that changes in market prices, such as foreign exchange rates, interest rates and equity
prices will affect the Institute’s income or the value of its holdings of financial instruments. The objective of market
risk management is to manage and control market risk exposures within acceptable parameters, while optimizing
the return.
The primary goal of the Institute’s investment strategy is to maximize investment returns on surplus funds. The
Institute adopts a policy of minimizing its price risk by investing in fixed rate investments like Market Treasury
Bills. Currently, the Institute is not exposed to price risks as the investments are currently being carried at
amortised cost.
-----------------------------------------------------------------Rupees in '000-----------------------------------------------------------------
Loans and
receivablesTotal
The interest rate risk is the risk that the value of the financial instrument will fluctuate due to changes in the
market interest rates. Sensitivity to interest rate risk arises from mismatches of financial assets and liabilities
that mature in a given period. The Institute is not exposed to Interest rate risk as it has fixed rate securities.
228
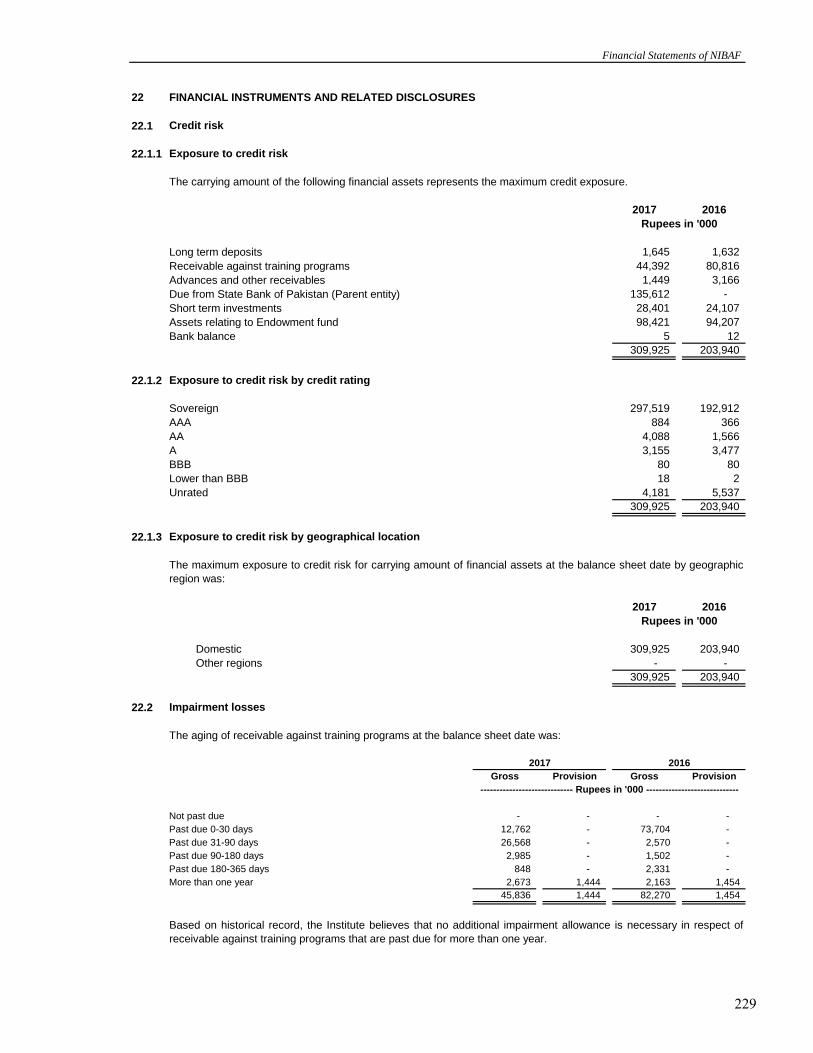
22 FINANCIAL INSTRUMENTS AND RELATED DISCLOSURES
22.1 Credit risk
22.1.1 Exposure to credit risk
The carrying amount of the following financial assets represents the maximum credit exposure.
2017 2016
Long term deposits 1,645 1,632
Receivable against training programs 44,392 80,816
Advances and other receivables 1,449 3,166
Due from State Bank of Pakistan (Parent entity) 135,612 -
Short term investments 28,401 24,107
Assets relating to Endowment fund 98,421 94,207
Bank balance 5 12
309,925 203,940
22.1.2 Exposure to credit risk by credit rating
Sovereign 297,519 192,912
AAA 884 366
AA 4,088 1,566
A 3,155 3,477
BBB 80 80
Lower than BBB 18 2
Unrated 4,181 5,537
309,925 203,940
22.1.3 Exposure to credit risk by geographical location
2017 2016
Domestic 309,925 203,940
Other regions - -
309,925 203,940
22.2 Impairment losses
The aging of receivable against training programs at the balance sheet date was:
Gross Provision Gross Provision
Not past due - - - -
Past due 0-30 days 12,762 - 73,704 -
Past due 31-90 days 26,568 - 2,570 -
Past due 90-180 days 2,985 - 1,502 -
Past due 180-365 days 848 - 2,331 -
More than one year 2,673 1,444 2,163 1,454
45,836 1,444 82,270 1,454
Financial Statements of NIBAF
The maximum exposure to credit risk for carrying amount of financial assets at the balance sheet date by geographic
region was:
Rupees in '000
2017 2016
Based on historical record, the Institute believes that no additional impairment allowance is necessary in respect of
receivable against training programs that are past due for more than one year.
Rupees in '000
----------------------------- Rupees in '000 -----------------------------
229

22.3 Liquidity risk
June 30, 2017
Creditors, accrued expenses and other payables 8,778 8,778 7,870 908 -
8,778 8,778 7,870 908 -
June 30, 2016
Creditors, accrued expenses and other payables 6,972 6,972 6,592 380 -
6,972 6,972 6,592 380 -
*The analysis of financial liabilities aging is based on management best estimate
22.4 Market risk
22.5 Fair value of financial assets and liabilities
- Quoted prices (unadjusted) in active markets for identical assets or liabilities (level 1);
-
- - Inputs for the asset or liability that are not based on observable market data (unobservable inputs) (level 3)
The Institute does not have any investments which are carried at fair value.
23 CAPITAL MANAGEMENT
24 TRANSACTIONS WITH RELATED PARTIES
State Bank of Pakistan Annual Report FY17
As per the requirements of IFRS 13 (Fair Value Measurement), the Institute shall classify fair value instruments using
a fair value hierarchy that reflects the significance of inputs in making the measurements. The fair value hierarchy has
the following levels:
Inputs other than quoted prices within level 1 that are observable for the asset or liabilities, whether directly (i.e.
as prices) or indirectly (i.e. derived from prices) (level 2); and
The Institute's objective when managing capital, is to safeguard the Institute's ability to continue as a going concern
and maintain a strong capital base to support the sustained development of its business activities. The Institute is not
subject to externally imposed capital requirements. Further, the parent's support is available to continue its operations.
Upto three
months
Carrying
amount
Short term investments and assets relating to endowment fund have fair market value of Rs. 28.4 million and Rs.
98.66 million respectively as disclosed in notes 9.2 and 10.2 to the financial statements which are being valued under
level 2. These are carried at amortised cost in these financial statements in accordance with the Institute’s accounting
policy.
The Institute is a wholly owned subsidiary of the State Bank of Pakistan (Parent entity); therefore all subsidiaries and
associated undertakings of State Bank of Pakistan are the related parties of the Institute. Other related parties
comprise of directors and key management personnel and entities over which the directors are able to exercise
significant influence.
------------------- Contractual cash flows--------------------------
The following analysis details the Institute's financial liabilities into relevant maturity groupings based on the remaining
period at the balance sheet to the contractual maturity dates. The amounts disclosed in the table are the contractual
undiscounted cash flows.
Fair value is the price that would be received to sell an asset or paid to transfer a liability in an orderly transaction
between market participants at the measurement date. Consequently, differences can arise between carrying value
and the fair value estimates.
Underlying the definition of fair value is the presumption that the Institute is a going concern without any intention or
requirement to curtail materiality the scale of its operations or to undertake a transaction on adverse terms.
The estimated fair value of all other financial assets and liabilities is not considered to be significantly different from
carrying values as the items are either short term in nature or are periodically repriced.
Total Over one
year
Over three
months and
upto one
year
--------------------------------------------- Rupees in '000 ---------------------------------------------
The Institute is not exposed to market risk.
230

State Bank of Pakistan (Parent Entity) 2017 2016
Balances at the year end
Receivable against training programs 2,223 22,818
Due from the Parent entity 135,612 -
Transactions during the year
Revenue charged 199,306 153,335
Receipts / (Payments) 219,901 (56,380)
Associated undertaking - SBP - Banking Services Corporation
(Subsidiary of Parent entity)
Balances at the year end
Receivable against training programs 32,849 51,760
Transactions during the year
Revenue charged 132,820 114,845
24.1 Remuneration of Managing Director, Non-Executive Directors and Executives
Fees - 282 - - 470 -
Managerial remuneration 18,675 - 65,534 17,870 - 51,105
Fuel allowance 709 - 3,104 738 - 2,539
Telephone allowance 111 - 839 217 - 880
Contribution to Provident fund 1,121 - 1,921 944 - 1,170
House rent allowance - - 224 - - 336
Others 348 - 222 351 - 241
20,964 282 71,844 20,120 470 56,271
Number of persons 1 2 15 1 3 15
24.1.1 The Managing Director has been provided free use of the Institute's maintained car.
24.1.2
25
26
26.1
27
28
MANAGING DIRECTOR DIRECTOR
Financial Statements of NIBAF
------------------------------------------------------- (Rupees in '000) -------------------------------------------------------
Transactions and balances with related parties including remuneration and benefits to key management personnel and
Managing Director under the terms of their employment are as follows:
Managing
Director
Managing
Director
All the employees of the Institute are entitled to retirement benefits in accordance with the rules and regulations of the retirement fund / schemes of the Parent entity. The respective expenses are borne by the Parent entity and are not charged to the Institute as all employees are on deputation.
NUMBER OF EMPLOYEES
The average number of employees for the year ended June 30, 2017 were 29 (2016: 25) and number of employees as at June 30, 2017 were 31 ( 2016: 27).
CORRESPONDING FIGURES
Corresponding figures have been rearranged and reclassified, wherever necessary, for the purpose of better presentation and comparison. There have been no significant re-arrangements or reclassifications during the current year.
GENERAL
Figures in these financial statements have been rounded off to the nearest thousand rupees.
DATE OF AUTHORISATION OF FINANCIAL STATEMENTS
These financial statements were authorised for issue on October 18, 2017 by the Board of Directors of the Institute.
Non-
Executive
Director
Executives
Non-
Executive
Director
Executives
Rupees in '000
2017 2016
------------------------------------------------------- (Rupees in '000) -------------------------------------------------------
231

13 Financial Statements of PSPC
A. F. FERGUSON & CO. Chartered Accountants State Life Building No. 1-C I. I. Chundrigar RoadP.O. Box 4716Karachi-74000
AUDITORS’ REPORT TO THE MEMBERS
We have audited the annexed balance sheet of Pakistan Security Printing Corporation (Private) Limited as at June 30, 2017 and the related profit and loss account, statement of comprehensive income, cash flow statement and statement of changes in equity together with the notes forming part thereof, for the year then ended and we state that we have obtained all the information and explanations which, to the best of our knowledge and belief, were necessary for the purposes of our audit.
It is the responsibility of the Corporation’s management to establish and maintain a system of internal control, and prepare and present the above said statements in conformity with the approved accounting standards and the requirements of the Companies Ordinance, 1984. Our responsibility is to express an opinion on these statements based on our audit.
We conducted our audit in accordance with the auditing standards as applicable in Pakistan. These standards require that we plan and perform the audit to obtain reasonable assurance about whether the above said statements are free of any material misstatement. An audit includes examining, on a test basis, evidence supporting the amounts and disclosures in the above said statements. An audit also includes assessing the accounting policies and significant estimates made by management, as well as, evaluating the overall presentation of the above said statements. We believe that our audit provides a reasonable basis for our opinion and, after due verification, we report that-
(a) in our opinion, proper books of accounts have been kept by the Corporation asrequired by the Companies Ordinance, 1984;
(b) in our opinion-(i) the balance sheet and profit and loss account together with the notes thereon
have been drawn up in conformity with the Companies Ordinance, 1984, andare in agreement with the books of accounts and are further in accordance withaccounting policies consistently applied except for the change as stated in note5 with which we concur;
(ii) the expenditure incurred during the year was for the purpose of the Corporation’sbusiness; and
233

State Bank of Pakistan Annual Report FY17
A. F. FERGUSON & CO. Chartered Accountants
(iii) the business conducted, investments made and the expenditure incurred during the year were in accordance with the objects of the Corporation;
(c) in our opinion and to the best of our information and according to the explanations given to us, the balance sheet, profit and loss account, statement of comprehensive income, cash flow statement and statement of changes in equity together with the notes forming part thereof conform with approved accounting standards as applicable in Pakistan, and give the information required by the Companies Ordinance, 1984, in the manner so required and respectively give a true and fair view of the state of the Corporation’s affairs as at June 30, 2017 and of the profit, its total comprehensive income, cash flows and changes in equity for the year then ended; and
(d) in our opinion, no zakat was deductible at source under the Zakat and Ushr Ordinance, 1980.
Chartered Accountants
Karachi, October 25, 2017
Audit Engagement Partner: Khurshid Hasan
234

PAKISTAN SECURITY PRINTING CORPORATION (PRIVATE) LIMITED
BALANCE SHEET
AS AT JUNE 30, 2017
Note 2017 2016
ASSETS
NON CURRENT ASSETS
Property, plant and equipment 6 52,183,635 883,284
Investment property 7 - -
Intangibles 8 96 495
52,183,731 883,779
Long term investment in associates 9 2,134,590 1,988,032
Other long term investments 10 27,164 120,195
Long term loans 11 96,168 61,626
Long term deposits 12 12,836 13,176
Deferred taxation 13 193,273 693,601
54,647,762 3,760,409
CURRENT ASSETS
Stores and spares - net 14 248,608 333,567
Stock-in-trade - net 15 2,073,947 2,515,499
Trade debts - net 16 1,702,777 2,493,084
Loans and advances 17 26,781 19,507
Trade deposits and prepayments 18 4,821 13,973
Accrued mark-up 90,233 91,708
Other receivables 19 1,744,036 23,386
Current maturity of long term investments 10 99,955 199,932
Short term investments 20 7,704,086 6,087,047
Taxation - net 398,414 221,446
Cash and bank balances 21 1,275,911 1,787,567
15,369,569 13,786,716
TOTAL ASSETS 70,017,331 17,547,125
EQUITY AND LIABILITIES
SHARE CAPITAL AND RESERVES
Authorised capital 1,000,000 (June 30, 2016: 1,000,000)
ordinary shares of Rs 1,000 each 1,000,000 1,000,000
Issued, subscribed and paid up capital 22 1,000,000 1,000,000
Reserves 23 6,365,491 11,166,608
TOTAL EQUITY 7,365,491 12,166,608
Surplus on revaluation of property,
plant and equipment - net 24 51,505,483 -
NON CURRENT LIABILITIES
Liabilities against assets subject to finance leases 25 11,674 17,563
Deferred liabilities 26 3,146,267 3,622,195
3,157,941 3,639,758
CURRENT LIABILITIES
Trade and other payables 27 2,208,535 1,732,736
Payable to NSPC 19.1 5,774,651 -
Accrued mark-up 70 112
Current portion of liabilities against assets subject to finance leases 25 5,160 7,911
7,988,416 1,740,759
11,146,357 5,380,517
TOTAL EQUITY AND LIABILITIES 70,017,331 17,547,125
CONTINGENCIES AND COMMITMENTS 28
Chief Financial Officer Chief Executive Officer
Chief Executive Officer Director
The annexed notes 1 to 50 form an integral part of these financial statements.
--------------------------------------------------------------------------------------------------------------------------------------------------------------------------------------------------------------------------------------------------------------------------------------------------------------------------------------------------------------------------------------------------------------------------------------------------------------------------------------------------------------------Rupees '000--------------------------------------------------------------------------------------------------------------------------------------------------------------------------------------------------------------------------------------------------------------------------------------------------------------------------------------------------------------------------------------------------------------------------------------------------------------------------------------------------------------------
Financial Statements of PSPC
235

PAKISTAN SECURITY PRINTING CORPORATION (PRIVATE) LIMITED
PROFIT AND LOSS ACCOUNT
FOR THE YEAR ENDED JUNE 30, 2017
Note 2017 2016
CONTINUING OPERATIONS:
Net sales 9,476,192 7,786,290
Cost of sales 29 (7,106,566) (6,218,583)
GROSS PROFIT 2,369,626 1,567,707
Administrative expenses 30 (515,159) (490,653)
Other expenses 31 (110,604) (60,271)
Other income 32 686,498 514,386
60,735 (36,538)
Operating profit 2,430,361 1,531,169
Finance cost 33 (1,915) (1,876)
Share of profit from associates 34 562,453 381,787
2,990,899 1,911,080
Taxation 35 (945,961) (534,612)
2,044,938 1,376,468
DISCONTINUED OPERATIONS:
36 697,930 947,283
Profit for the year 2,742,868 2,323,751
EARNINGS PER SHARE 37
- Continuing operations 2,045 1,377
- Discontinued operations 698 947
2,743 2,324
Chief Financial Officer Chief Executive Officer
Chief Executive Officer Director
State Bank of Pakistan Annual Report FY17
(Represented
Note 2)
PROFIT BEFORE TAXATION FROM
CONTINUING OPERATIONS
--------------------------------------------------------------------------------------------------------------------------------------------------------------------------------------------------------------------------------------------------------------------------------------------------------------------------------------------------------------------------------------------------------------------------------------------------------------------------------------------------------------------Rupees '000--------------------------------------------------------------------------------------------------------------------------------------------------------------------------------------------------------------------------------------------------------------------------------------------------------------------------------------------------------------------------------------------------------------------------------------------------------------------------------------------------------------------
The annexed notes 1 to 50 form an integral part of these financial statements.
--------------------------------------------------------------------------------------------------------------------------------------------------------------------------------------------------------------------------------------------------------------------------------------------------------------------------------------------------------------------------------------------------------------------------------------------------------------------------------------------------------------------Rupees--------------------------------------------------------------------------------------------------------------------------------------------------------------------------------------------------------------------------------------------------------------------------------------------------------------------------------------------------------------------------------------------------------------------------------------------------------------------------------------------------------------------
PROFIT AFTER TAXATION FROM
CONTINUING OPERATIONS
Profit after taxation from discontinued operations
236

PAKISTAN SECURITY PRINTING CORPORATION (PRIVATE) LIMITED
STATEMENT OF COMPREHENSIVE INCOME
FOR THE YEAR ENDED JUNE 30, 2017
2017 2016
Profit for the year 2,742,868 2,323,751
Other comprehensive income for the year:
Items that may be reclassified subsequently to profit and loss
Share of other comprehensive income of associates (58,904) (20,349)
Deferred tax 7,364 2,544
(51,540) (17,805)
Unrealised appreciation during the year on available-for-sale
investments of the Corporation 5,967 783
Total items that may be reclassified subsequently to profit and loss (45,573) (17,022)
Items that will not be reclassified subsequently to profit and loss
Remeasurement of post retirement benefits obligation of
associates (notes 9.1 and 9.2) 2,664 23
Remeasurement of post retirement benefits obligation of the
Corporation (219,863) (520,759)
Deferred tax 65,959 156,228
(153,904) (364,531)
Total items that will not be reclassified subsequently to profit and loss (151,240) (364,508)
Total comprehensive income for the year 2,546,055 1,942,221
Total comprehensive income for the year attributable to
owners of the Corporation arising from
- Continuing operations 1,877,855 1,093,361
- Discontinued operations 668,200 848,860
2,546,055 1,942,221
The annexed notes 1 to 50 form an integral part of these financial statements.
Chief Financial Officer Chief Executive Officer
Chief Executive Officer Director
--------------------------------------------------------------------------------------------------------------------------------------------------------------------------------------------------------------------------------------------------------------------------------------------------------------------------------------------------------------------------------------------------------------------------------------------------------------------------------------------------------------------Rupees '000--------------------------------------------------------------------------------------------------------------------------------------------------------------------------------------------------------------------------------------------------------------------------------------------------------------------------------------------------------------------------------------------------------------------------------------------------------------------------------------------------------------------
Financial Statements of PSPC
237

PAKISTAN SECURITY PRINTING CORPORATION (PRIVATE) LIMITED
CASH FLOW STATEMENT
FOR THE YEAR ENDED JUNE 30, 2017
Note 2017 2016
CASH FLOWS FROM OPERATING ACTIVITIES
Cash generated from operations 40 3,021,234 3,125,748
Taxes paid (1,276,150) (1,304,041)
Pension paid (83,163) (84,558)
Long term loans (51,391) (20,194)
Long term deposits - net 46 (672)
Net cash generated from operating activities 1,610,576 1,716,283
CASH FLOWS FROM INVESTING ACTIVITIES
Capital expenditure (124,740) (115,947)
Purchase of intangible - (10)
Investment in subsidiary (1,000,000) -
Proceeds from sale of long term investments 200,000 -
Purchase of short term investments (6,553,260) (6,230,052)
Proceeds from sale of property, plant and equipment 1,414 923
Proceeds from sale of short term investments 3,653,273 6,480,508
Mark-up received 451,208 368,155
Dividends received 359,656 291,717
Net cash (utilised in) / generated from investing activities (3,012,449) 795,294
CASH FLOWS FROM FINANCING ACTIVITIES
Finance lease rentals paid (9,783) (10,052)
Dividend paid (600,000) (600,000)
Net cash utilised in financing activities (609,783) (610,052)
(2,011,656) 1,901,525
Cash and cash equivalents at the beginning of the year 3,287,567 1,386,042
Cash and cash equivalents at the end of the year 41 1,275,911 3,287,567
Chief Financial Officer
Chief Executive Officer
State Bank of Pakistan Annual Report FY17
--------------------------------------------------------------------------------------------------------------------------------------------------------------------------------------------------------------------------------------------------------------------------------------------------------------------------------------------------------------------------------------------------------------------------------------------------------------------------------------------------------------------Rupees '000--------------------------------------------------------------------------------------------------------------------------------------------------------------------------------------------------------------------------------------------------------------------------------------------------------------------------------------------------------------------------------------------------------------------------------------------------------------------------------------------------------------------
The annexed notes 1 to 50 form an integral part of these financial statements.
Chief Executive Officer
Director
Net (decrease) / increase in cash and cash equivalents
during the year
238

PAKISTAN SECURITY PRINTING CORPORATION (PRIVATE) LIMITED
STATEMENT OF CHANGES IN EQUITY
FOR THE YEAR ENDED JUNE 30, 2017
Surplus on
revaluation of
investments
Asset
acquisition
reserve
Sub-total
capital
reserves
General
reserve
Unappropriated
profit
Sub-total
revenue
reserves
Balance as at July 1, 2015 1,000,000 37,986 2,400,000 2,437,986 5,955,501 1,430,900 7,386,401 9,824,387 10,824,387
Transactions with owners - Final
cash dividend for the year ended
June 30, 2015 @ 60 % (i.e. Rs 600 per share) - - - - - (600,000) (600,000) (600,000) (600,000)
Transfer to general reserve - - - - 40,547 (40,547) - - -
Transfer to asset acquisition reserve - - 1,400,000 1,400,000 - (1,400,000) (1,400,000) - -
Total comprehensive income for
the year ended June 30, 2016
Profit for the year - - - - - 2,323,751 2,323,751 2,323,751 2,323,751
Other comprehensive loss - (17,022) - (17,022) - (364,508) (364,508) (381,530) (381,530)
- (17,022) - (17,022) - 1,959,243 1,959,243 1,942,221 1,942,221
Balance as at June 30, 2016 1,000,000 20,964 3,800,000 3,820,964 5,996,048 1,349,596 7,345,644 11,166,608 12,166,608
Transactions with owners - Final
cash dividend for the year ended
June 30, 2016 @ 60% (i.e. Rs 600 per share) - - - - - (600,000) (600,000) (600,000) (600,000)
Specie dividend - Net asset attributable to
discontinued operations as on March 31, 2017 - - - - (5,131,717) (1,616,000) (6,747,717) (6,747,717) (6,747,717)
- - - - (5,131,717) (2,216,000) (7,347,717) (7,347,717) (7,347,717)
Transfer to general reserve - - - - 23,751 (23,751) - - -
Transfer to asset acquisition reserve - - 1,700,000 1,700,000 - (1,700,000) (1,700,000) - -
Total comprehensive income for
the year ended June 30, 2017
Profit for the year - - - - - 2,742,868 2,742,868 2,742,868 2,742,868
Other comprehensive loss - (45,573) - (45,573) - (151,240) (151,240) (196,813) (196,813)
- (45,573) - (45,573) - 2,591,628 2,591,628 2,546,055 2,546,055
Surplus on revaluation of property, plant
and equipment - incremental depreciation
for the year - net of deferred tax - - - - - 545 545 545 545
Balance as at June 30, 2017 1,000,000 (24,609) 5,500,000 5,475,391 888,082 2,018 890,100 6,365,491 7,365,491
The annexed notes 1 to 50 form an integral part of these financial statements.
Chief Financial Officer Chief Executive Officer
Chief Executive Officer Director
Financial Statements of PSPC
Issued,
subscribed
and paid-up
capital
Revenue reserves Grand total
--------------------------------------------------------------------------------------------------------------------------------------------------------------------------------------------------------------------------------------------------------------------------------------------------------------------------------------------------------------------------------------------------------------------------------------------------------------------------------------------------------------------Rupees '000--------------------------------------------------------------------------------------------------------------------------------------------------------------------------------------------------------------------------------------------------------------------------------------------------------------------------------------------------------------------------------------------------------------------------------------------------------------------------------------------------------------------
Capital reserves Total reserves
239

PAKISTAN SECURITY PRINTING CORPORATION (PRIVATE) LIMITED
1. THE CORPORATION AND ITS OPERATIONS
1.1
1.2
2. BUSINESS REORGANISATION
3. SIGNIFICANT ACCOUNTING INFORMATION AND POLICIES
3.1
3.2
3.3
3.3.1
State Bank of Pakistan Annual Report FY17
Consequently, the profit and loss and net cash flows attributable to the operating, investing and
financing activities (including those relating to the prior period, as ‘re-presented’) pertaining to non-
currency business of the Corporation have been disclosed as discontinued operations in these
financial statements.
NOTES TO AND FORMING PART OF THE FINANCIAL STATEMENTS
FOR THE YEAR ENDED JUNE 30, 2017
Pakistan Security Printing Corporation (Private) Limited ("the Corporation") was incorporated in
Pakistan under the Companies Ordinance, 1984 (now Companies Act, 2017) and was wholly owned
by the Government of Pakistan upto June 13, 2017. Effective June 14, 2017, the Corporation has
become subsidiary of the State Bank of Pakistan. The registered office and the factory are located at
Jinnah Avenue, Malir Halt, Karachi, in the province of Sindh. The Corporation is principally engaged
in the printing of currency and prize bonds on behalf of the State Bank of Pakistan.
Standard and amendments to approved accounting standards which became effective during
the year ended June 30, 2017
There were certain new amendments to the approved accounting standards which became effective
during the year ended June 30, 2017 but are considered not to be relevant or have any significant
effect on the Company's financial reporting and are, therefore, not disclosed in these financial
statements.
Basis of measurement
Statement of compliance
These financial statements have been prepared under the historical cost convention unless
otherwise specifically stated.
These financial statements have been prepared in accordance with approved accounting standards
as applicable in Pakistan. As per the requirements of circular No. CLD/CCD/PR(11)/2017 dated July
20, 2017 issued by the Securities & Exchange Commission of Pakistan (SECP), companies the
financial year of which closes on or before June 30, 2017 shall prepare their financial statements in
accordance with the provisions of the repealed Companies Ordinance, 1984. Accordingly, approved
accounting standards comprise of such International Financial Reporting Standards (IFRSs) issued
by the International Accounting Standards Board as are notified under the Companies Ordinance,
1984, provisions of and directives issued under the Companies Ordinance, 1984. In case
requirements differ, the provisions of or directives under the Companies Ordinance, 1984 prevail.
New standards, amendments to approved accounting standards and new interpretations
During the year, in accordance with the decisions taken in the Corporation’s extra ordinary general
meetings (EOGMs) held on December 27, 2016 and January 6, 2017, a subsidiary company [i.e.
National Security Printing Company (Private) Limited – NSPC] was formed and the assets and
liabilities pertaining to the Corporation’s non-currency business were hived-down / transferred to
NSPC through a business transfer agreement dated May 18, 2017. Subsequently, the Board of
Directors of the Corporation in its meeting held on May 18, 2017 approved the distribution, effective
May 19, 2017, of the Corporation's shares in NSPC to every shareholder, whose name was
appearing in the register of members of the Corporation with the ratio of 1 share of NSPC for 1000
shares held in the Corporation, as dividend in specie.
The consolidated financial statements have not been prepared for the year ended June 30, 2017 as
National Security Printing Company (Private) Limited – NSPC was not a subsidiary of the
Corporation at the end of the financial year i.e. as at June 30, 2017.
240

3.3.2
3.4 Property, plant and equipment
3.4.1 Owned
Financial Statements of PSPC
Property, plant and equipment are stated at cost less accumulated depreciation and accumulated
impairment, if any, except for land and buildings which upto March 31, 2017 were stated at cost less
accumulated depreciation and accumulated impairment, if any. As more fully stated in note 5 to
these financial statements, with effect from April 1, 2017, the Corporation has revised its accounting
policy in respect of lands and buildings due to which these are now carried at revalued amounts less
any accumulated depreciation and subsequent accumulated impairment, if any.
Amendments to approved accounting standards that are effective for the Corporation's
accounting periods beginning after July 1, 2017:
Depreciation on additions is charged from the month in which the asset is available for use and
continued to be depreciated until it is derecognised, that is, upto the month preceding the month of
disposal. An item of property, plant and equipment is derecognised upon disposal or when no future
economic benefits are expected from its use.
Depreciation is charged to profit and loss account applying the straight line method whereby the
depreciable amount of an asset is depreciated over its estimated useful life at the rates specified in
note 6.1 to these financial statements.
An asset's carrying amount is written down immediately to its recoverable amount if the carrying
amount is greater than the recoverable amount.
Residual values, useful lives and methods of depreciation are reviewed at each balance sheet date
and adjusted if expectations differ significantly from previous estimates.
No depreciation is charged if the asset's residual value exceeds its carrying amount.
Useful lives are determined by the management based on expected usage of the asset, expected
physical wear and tear, technical and commercial obsolescence, legal and similar limits on the use of
the assets and other similar factors.
There are certain new standards and amendments to the approved accounting standards that will
become effective for the Corporation’s annual accounting periods beginning on or after July 1, 2017.
However, these amendments will not have a significant impact on the financial reporting of the
Corporation and, therefore, have not been disclosed in these financial statements. The following new
standards have been notified by the SECP to be applicable for the annual accounting periods
beginning July 1, 2018, the impacts of which on the Corporation’s future financial statements are
being assessed:
IFRS 9 Financial Instruments
IFRS 9 addresses the classification, measurement and derecognition of financial assets and financial
liabilities.
IFRS 15 Revenue from Contracts with Customers
This will replace IAS 18 which covers contracts for goods and services and IAS 11 which covers
construction contracts. The new standard is based on the principle that revenue is recognised when
control of a good or service transfers to a customer – so the notion of control replaces the existing
notion of risks and rewards.
In addition to the foregoing, the Companies Act 2017 which is not effective on these financial
statements, has added certain disclosure requirements which will be applicable in future and also
there may be certain changes in the measurement and presentation of the surplus on revaluation of
property, plant and equipment.
241

3.4.2 Capital work in progress
3.4.3 Leased
3.5 Investment properties
3.6 Intangible assets
State Bank of Pakistan Annual Report FY17
Costs associated with maintaining computer software are recognised as an expense as and when
incurred.
An intangible asset is an identifiable non-monetary asset without physical substance.
Amortisation is charged to the profit and loss account on a straight line basis over the estimated
useful life at the rates specified in note 8.1 to these financial statements unless such lives are
indefinite. All intangible assets with an indefinite useful life are systematically tested for impairment at
each balance sheet date. Amortisation on additions to intangible assets is charged from the date on
which an item is acquired or capitalised and upto the date preceding the disposal.
Assets held under finance lease are stated at the lower of their fair value or present value of
minimum lease payments at inception less accumulated depreciation and accumulated impairment
losses, if any. The outstanding obligations under the lease agreements are shown as a liability net of
financial charges allocable to future periods.
The financial charges are allocated to accounting periods in a manner so as to provide a constant
periodic rate of return on the outstanding liability.
These are stated at cost less accumulated impairment losses, if any. All expenditure connected with
specific assets incurred during installation and construction period are carried under this head.
These are transferred to specific assets as and when these assets are available for use.
Intangible assets are recognised when it is probable that the expected future economic benefits will
flow to the entity and the cost of the asset can be measured reliably. Cost of the intangible asset
includes purchase cost and directly attributable expenses incidental to bring the asset for its intended
use.
Consistent with prior years, investment properties, principally leasehold building, are held for long
term rental yields and are not occupied by the Corporation. Investment properties are measured
initially at cost, including related transaction costs. These properties are carried at cost.
Additions to investment properties consists of cost of capital nature. The profit on disposal is
determined as a difference between sales proceeds and the carrying amount of the assets at the
commencement of the accounting period plus capital expenditure in the period.
Major renewals, replacements and improvements that meet the recognition criteria in IAS 16
"Property, Plant and Equipment" are capitalised and the assets so replaced, if any, are retired.
Normal repairs and maintenance are charged to the profit and loss account as and when incurred.
Gains and losses on disposals of the assets are included in the profit and loss account in the year in
which disposal is made.
Depreciation on assets held under finance lease is charged in a manner consistent with that for
depreciable assets owned by the Corporation.
Useful lives of intangible operating assets are reviewed, at each balance sheet date and adjusted if
the impact of amortisation is significant.
242

3.7 Impairment
3.6 Stores and spares
3.7 Stock-in-trade
3.10 Trade debts and other receivables
3.11 Taxation
Current
Financial Statements of PSPC
Trade debts and other receivables are recognised initially at fair value and subsequently measured
at amortised cost using the effective interest method less provision for impairment. A provision for
doubtful trade debts and other receivables is established when there is objective evidence that the
Corporation will not be able to collect all amounts due according to the original terms of the
receivable. Significant financial difficulties of the debtor, probability that the debtor will enter
bankruptcy or financial reorganisation, and default or delinquency in payments are considered
indicators that the trade receivable is impaired. Debts, considered irrecoverable, are written off, as
and when identified.
The Corporation assesses at each balance sheet date whether there is any indication that property,
plant and equipment and intangible assets may be impaired. If such indication exists, the carrying
amounts of such assets are reviewed to assess whether they are recorded in excess of their
recoverable amounts. Where carrying values exceed recoverable amounts, assets are written down
to their recoverable amounts and the differences are recognised in the profit and loss account.
Raw materials are valued at lower of cost determined on weighted average basis and net realisable
value except for items in transit which are stated at cost incurred upto the balance sheet date.
Work-in-process and finished goods are valued at lower of cost determined on weighted average
basis and net realisable value. Cost in relation to work-in-process and finished goods represents
direct cost of materials, direct wages and an appropriate portion of production overheads.
Income tax expense comprises of current and deferred tax. Income tax expense is recognised in
profit and loss account or statement of comprehensive income to which it relates.
Provision for current taxation is based on taxable income for the year at the current rates of taxation
after taking into account tax credits and tax rebates available, if any, and tax paid on final tax basis
or minimum tax on turnover or seventeen percent of accounting profit, whichever is higher. The
charge for the current tax also includes adjustments where necessary, relating to prior years which
arise from the assessments made / finalised during the year.
The Corporation reviews the carrying amount of stores and spares on a regular basis and provision
is made for obsolescence if there is any change in usage pattern and physical form.
Stores and spares are valued at the lower of cost determined on weighted average method and net
realisable value. Stores and spares in transit are valued at cost incurred upto the balance sheet
date. Local purchases of engineering stores are charged to the profit and loss account at the time of
purchase.
Net realisable value signifies the estimated selling price in the ordinary course of business less the
estimated cost of completion and the costs necessary to be incurred to make the sale.
243

Deferred tax
3.12 Cash and cash equivalents
3.13 Borrowing costs
3.14 Provisions
3.15 Trade and other payables
3.16 Leases
State Bank of Pakistan Annual Report FY17
Borrowing costs relating to the acquisition, construction or production of a qualifying asset are
recognised as part of the cost of that asset. All other borrowing costs are recognised as an expense
in the period in which these are incurred.
Unrecognised deferred income tax assets are reassessed at each balance sheet date and are
recognised to the extent that it becomes probable that future taxable profit will allow deferred tax
asset to be recovered.
Deferred tax assets and liabilities are measured at the tax rate that are expected to apply to the year
when the asset is utilised or the liability is settled, based on the tax rates that have been enacted or
substantially enacted at the balance sheet date.
Deferred tax liabilities are recognised for all major taxable temporary differences.
The carrying amount of the deferred tax asset is reviewed at each balance sheet date and is
recognised only to the extent that it is probable that future taxable profits will be available against
which the assets may be utilised. Deferred tax assets are reduced to the extent that it is no longer
probable that the related tax benefit will be realised.
Provisions are recognised when the Corporation has a present legal or constructive obligation as a
result of past events, it is probable that an outflow of resources embodying economic benefits will be
required to settle the obligation and a reliable estimate can be made of the amount of the obligation.
Provisions are reviewed periodically and adjusted to reflect the current best estimates.
Deferred tax is recognised using the balance sheet liability method on all temporary differences
between the carrying amounts of the assets and liabilities and their tax bases.
Deferred tax assets are recognised for all major deductible temporary differences to the extent that it
is probable that taxable profit will be available against which the deductible temporary differences
can be utilised.
Cash and cash equivalents are carried in the balance sheet at cost. For the purpose of the cash flow
statement, cash and cash equivalents comprise of cash in hand, deposits held with banks and other
short term highly liquid investments with maturities of three months or less from the date of
acquisition.
Liabilities for trade and other amounts payable are carried at cost which is the fair value of the
consideration to be paid in future for goods and services whether billed or not.
Liabilities against assets subject to finance lease are accounted for at the net present value of
minimum payments under the lease arrangements. Financial charges under lease arrangements are
allocated to periods during the lease term so as to produce a constant periodic rate of financial cost
on the remaining balance of principal liability for each period.
244
3.17 Staff retirement benefits
Defined benefit plan
(a)
(b)
3.18 Employees' compensated absences
3.19 Revenue recognition
-
-
-
-
-
-
-
-
-
Rental income from property is accrued on time proportion basis at agreed rates.
The Corporation accounts for the liability in respect of employees' compensated absences in the year
in which these are earned. Annual provisions to cover the obligations under the scheme are based
on estimates and are charged to profit and loss account currently. As the component of the liability
involved is not material, the Corporation does not carry out actuarial valuation for the said liability.
The Corporation operates an approved defined benefit funded pension scheme for all its permanent
employees under the Pakistan Security Printing Corporation (Private) Limited Employees (Pension
and Gratuity) Regulations 1993 (the regulations). During the year as a result of business
reorganisation (note 2 above), employees relating to NSPC were transferred to NSPC and as per the
business transfer agreement dated May 19, 2017 the cost of gratuity or pension are to be borne by
transferee company i.e. NSPC, accordingly, the pension fund has become a multi-employer fund.
Contribution to the pension fund is made based on the actuarial valuation carried out on annual basis
using Projected Unit Credit method. All actuarial gains and losses are recognised in "other
comprehensive income" as they occur. Under the scheme, the employees are entitled to the
following:
Interest income on available-for-sale debt securities, held-to-maturity investments and loans and
receivables are recognised using effective interest rate method.
Gains / (losses) arising on sale of investments are included in the profit and loss account in the
period in which they arise.
employees who have completed the prescribed qualifying period of more than ten years of
service and opt for the scheme are entitled to post retirement pension benefit; and
Unrealised gains / (losses) arising on revaluation of securities classified as held for trading are
included in profit and loss account in the period in which they arise.
Scrap sales and miscellaneous income are recognised on receipt basis.
Unrealised gains / (losses) arising on revaluation of securities classified as 'available-for-sale'
are included in other comprehensive income in the period in which they arise.
Dividend income is recognised when the Corporation's right to receive the dividend is
established.
Return on bank deposits is recognised on accrual basis taking into account the effective yield.
gratuity for employees who have opted for gratuity instead of pension or those who have
completed five years of service but have not yet completed ten years of service. Provision for
gratuity has been calculated on the basis of projected unit credit method.
Revenue from sale of goods is measured at fair value of the consideration received or
receivable. Revenue is recognised when the significant risks and rewards of ownership have
been transferred to the buyer, recovery of the consideration is probable, the associated costs
and possible return of goods can be estimated reliably, and there is no continuing management
involvement with the goods. The Corporation records revenue from sale of goods on dispatch of
goods to its customers.
Financial Statements of PSPC
All the
245

3.20 Foreign currency transactions
3.21 Dividend and other appropriations
3.22 Financial instruments
3.22.1 Financial assets
a) Financial assets at fair value through profit or loss
b) Loans and receivables
c) Held to maturity
d) Available for sale financial assets
State Bank of Pakistan Annual Report FY17
The Corporation classifies its financial assets in the following categories: at fair value through profit
or loss, loans and receivables, available for sale and held to maturity. The classification depends on
the purpose for which the financial assets were acquired. Management determines the classification
of its financial assets at the time of initial recognition.
Financial assets at fair value through profit or loss are financial assets held for trading and
financial assets designated upon initial recognition as at fair value through profit or loss. A
financial asset is classified as held for trading if acquired principally for the purpose of selling in
the short term. Assets in this category are classified as current assets.
These are non-derivative financial assets with fixed or determinable payments that are not
quoted in an active market.
These are non-derivative financial assets with fixed or determinable payments and fixed
maturity that are quoted in an active market, where management has the intention and ability to
hold till maturity are carried at amortised cost.
These are non-derivatives that are either designated in this category or not classified in any of
the other categories. They are included in non-current assets unless management intends to
dispose of the investments within twelve months from the balance sheet date. Available for sale
financial assets in such case are classified as short term investments in the balance sheet.
Dividend is recognised as a liability in the period in which it is declared. Appropriations of profit are
reflected in the statement of changes in equity in the period in which such appropriations are
approved.
Foreign exchange differences are recognised in the profit and loss account.
These financial statements are presented in Pakistan Rupee (functional and presentation currency).
Transactions in foreign currencies are recorded in Pakistan Rupee at the exchange rates
approximating those prevailing on the date of transaction. Monetary assets and liabilities in foreign
currencies are reported in Pakistan Rupee at the exchange rates approximating those prevalent at
the balance sheet date. Non-monetary items that are measured in terms of historical cost in a foreign
currency are translated using the exchange rates as at the dates of the initial transactions. Non-
monetary items measured at fair value in foreign currencies are translated using the exchange rates
at the date when the fair value was determined.
246

3.22.2
3.22.3 Measurement
3.22.4
3.22.5
3.22.6 Impairment
Financial assets are initially recognised at fair value plus transaction costs for all financial assets not
carried at fair value through profit or loss. Financial assets carried at fair value through profit or loss
are initially recognised at fair value and transaction costs are expensed in the profit and loss
account.
Recognition
Financial Statements of PSPC
Financial assets are derecognised when the rights to receive cash flows from the assets have
expired or have been transferred and the Corporation has transferred substantially all risks and
rewards of ownership.
Available for sale financial assets and financial assets at fair value through profit or loss are
subsequently carried at fair value. 'Loans and receivables' and 'held to maturity' investments are
carried at amortised cost using effective interest rate method.
Gains or losses arising, from changes in the fair value of the 'financial assets at fair value through
profit or loss' are recognised in the profit and loss for the year. Changes in the fair value of
instruments classified as 'available for sale' are recognised in 'Other comprehensive income' until
derecognised or impaired, when the accumulated fair value adjustments recognised in unrealised
surplus on revaluation of investments are included in the profit / loss for the year.
The fair values of quoted investments are based on current prices. If the market for a financial asset
is not active (for unlisted securities), the Corporation measures the investments at cost less
impairment in value, if any.
Fair value measurement principles
Derecognition
Financial assets other than those carried at fair value through profit or loss are reviewed at each
balance sheet date to determine whether there is any indication of impairment. If such indication
exists, the assets recoverable amount is estimated. An impairment loss is recognised whenever the
carrying amount of an asset exceeds its recoverable amount. Impairment losses are recognised in
the profit and loss account. If an available-for-sale investment is impaired, the cumulative loss is
removed from equity and is recognised in the profit and loss account.
If in subsequent period the amount of impairment loss decreases, the reduction in impairment loss
on financial assets other than the investments classified as available-for-sale are recognised in the
profit and loss account. However, impairment losses recognised in the profit and loss account on
available-for-sale equity instruments are not reversed through the profit and loss account.
When securities classified as available for sale are sold or impaired, the accumulated fair value
adjustments recognised as "Other comprehensive income" are included in the profit and loss
account as gains and losses on disposal of short term investments. Interest on available for sale
securities calculated using effective interest method is recognised in the profit and loss account.
Dividends on available for sale equity instruments are recognised in the profit and loss account
when the Corporation's right to receive payments is established.
All financial assets are recognised at the time when the Corporation becomes a party to the
contractual provisions of the instrument. Regular purchases and sales of investments are recognised
at trade date i.e. the date on which the Corporation commits to purchase or sell the asset.
247

3.22.7 Financial liabilities
3.22.8
3.23 Contingent liabilities
A contingent liability is disclosed when:
-
-
3.24 Investment in associates
there is present obligation that arises from past events but it is not probable that an outflow of
resources embodying economic benefits will be required to settle the obligation or the amount of
the obligation cannot be measured with sufficient reliability.
Unrealised gains / losses arising from transactions with associated companies are eliminated against
the investment in the associates to the extent of Corporation's interest in the associates. Unrealised
losses are eliminated in the same way as unrealised gains except that they are only eliminated to the
extent that there is no evidence of impairment.
The Corporation accounts for its share of comprehensive income from associates as at year end on
the basis of latest available financial statement of associates but not older than three months.
Entities in which the Corporation has significant influence but not control and which are neither its
subsidiaries nor joint ventures are classified as associates and are accounted for by using the equity
method of accounting.
All financial liabilities are recognised at the time when the Corporation becomes a party to the
contractual provisions of the instrument.
Off-setting of financial assets and financial liabilities
A financial asset and a financial liability is offset and the net amount is reported in the financial
statements if the Corporation has a legally enforceable right to set-off the transaction and also
intends either to settle on a net basis or to realise the asset and settle the liability simultaneously.
These investments are initially recognised at cost, thereafter the carrying amount is increased or
decreased to recognise the Corporation's share of profit or loss of associates. Share of post
acquisition profit and loss of associates is accounted for in the Corporation's profit and loss account.
Distribution received from investee reduces the carrying amount of investment. The Corporation's
share of associate's other comprehensive income is recognised in other comprehensive income of
the Corporation.
there is a possible obligation that arises from past events and whose existence will be confirmed
only by the occurrence or non occurrence of one or more uncertain future events not wholly
within the control of the Corporation; or
Financial liabilities, other than those at fair value through profit or loss, are measured at amortised
cost using the effective yield method.
State Bank of Pakistan Annual Report FY17
The carrying amount of the investment is tested for impairment, by comparing its recoverable amount
(higher of value in use and fair value less costs to sell) with its carrying amount and loss, if any is
recognised in the profit and loss account.
A financial liability is derecognised when the obligation under the liability is discharged, cancelled or
expired. Where an existing financial liability is replaced by another from the same lender on
substantially different terms, or the terms of an existing liability are substantially modified, such an
exchange and modification is treated as a derecognition of the original liability and the recognition of
a new liability, and the difference in respective carrying amounts is recognised in the profit and loss
account.
248

4. CRITICAL ACCOUNTING ESTIMATES AND JUDGEMENTS
a)
b)
c)
d)
e)
f)
g)
h)
i)
j)
5. CHANGE IN ACCOUNTING POLICY
Financial Statements of PSPC
Had there been no change in the accounting policy, property plant and equipment would have been
reported at Rs 482.122 million at the reporting date and profit before tax for the year would have
been higher by Rs 0.545 million.
assumptions and estimates used in disclosure and assessment of provision for contingencies
(note 28).
assumptions and estimates used in determining the provision for slow moving stores and spares
(note 14);
assumptions and estimates used in writing down items of stock-in-trade to their net realisable
value (note 15);
assumptions and estimates used in calculating the provision for impairment for trade debts (note
16);
The preparation of financial statements in conformity with approved accounting standards requires
the use of certain critical accounting estimates. It also requires management to exercise its judgment
in the process of applying the Corporation’s accounting policies. Estimates and judgements are
continually evaluated and are based on historic experience and other factors, including expectation
of future events that are believed to be reasonable under the circumstances. In the process of
applying the Corporation’s accounting policies, the management has made the following estimates
and judgments which are significant to the financial statements:
Assumptions and estimates used in determining the recoverable amount, residual values and
useful lives of property, plant and equipment (note 6);
assumptions and estimates used in measurement of fair value of investments (note 20);
assumptions and estimates used in the recognition of current and deferred taxation (notes 13
and 35);
assumptions and estimates used in accounting for defined benefit plan (note 26); and
Estimates and judgements are continually evaluated and are based on historical experience and
other factors, including expectation of future events that are believed to be reasonable under the
circumstances.
Upto March 31, 2017, the land and buildings of the Corporation were stated at cost less accumulated
depreciation and impairment, if any. With effect from April 1, 2017, the Corporation has revised its
accounting policy in respect of subsequent measurement of land and buildings which are now carried
at revalued amount less accumulated depreciation and impairment, if any. The management
believes that the new policy provides reliable and more relevant information to the users of these
financial statements because the land and buildings were purchased / constructed several years
back and therefore cost of these assets does not represent the current values.
In accordance with the requirements of International Accounting Standard (IAS) 8 ‘Accounting
policies, changes in accounting estimates and errors’ and IAS 16 ‘Property, plant and equipment’,
the change in this policy is accounted for prospectively with effect from April 1, 2017. Accordingly,
there is no impact as at the beginning of the earliest period presented i.e. July 1, 2015.
assumptions and estimates used in determining the useful lives and residual values of
intangibles (note 8);
Assumptions and estimates used in determining the fair value of land and buildings (note 6);
249

Note
6. PROPERTY, PLANT AND EQUIPMENT
Operating fixed assets 6.1
Capital work in progress 6.3
6.1 Operating fixed assets
6.1.1 The following is a statement of operating fixed assets:
Leased
Freehold
land
Plant and
machinery
Power and
other
installation
Furniture
and
fixtures
Office
equipment
and
machinery
Vehicles Sub total Vehicles
Freehold
land
Leasehold
land
As at July 1, 2015
Cost 3,241 434,148 2,732 7,425,364 284,865 53,213 229,533 18,949 8,452,045 45,392 8,497,437
Accumulated depreciation - (311,074) (2,732) (6,501,951) (171,263) (41,399) (184,127) (18,370) (7,230,916) (21,039) (7,251,955)
Net book value 3,241 123,074 - 923,413 113,602 11,814 45,406 579 1,221,129 24,353 1,245,482
Year ended June 30, 2016
Additions - 2,145 - 15,584 - 2,177 16,448 46 36,400 7,692 44,092
Transfers from capital work
in progress during the
year (note 6.3.1) - 2,464 - 74,992 - - - - 77,456 - 77,456
Transfers
Cost - - - - - - - 3,770 3,770 (3,770) -
Accumulated depreciation - - - - - - - (3,656) (3,656) 3,656 -
Net book value - - - - - - - 114 114 (114) -
Disposals
Cost - - - - - - - (3,815) (3,815) - (3,815)
Accumulated depreciation - - - - - - - 3,771 3,771 - 3,771
Net book value - - - - - - - (44) (44) - (44)
Depreciation charge for
the year - (11,045) - (459,548) (24,606) (2,684) (13,983) (369) (512,235) (8,600) (520,835)
Net book value as at
June 30, 2016 3,241 116,638 - 554,441 88,996 11,307 47,871 326 822,820 23,331 846,151
Year ended June 30, 2017
Additions - - - 4,982 519 1,707 3,423 - 10,631 - 10,631
Transfers from capital work
in progress during the
year (note 6.3.1) - 2,503 - 133,844 - - - - 136,347 - 136,347
Transfers
Cost - - - - - - - 3,846 3,846 (3,846) -
Accumulated depreciation - - - - - - - (3,398) (3,398) 3,398 -
Net book value - - - - - - - 448 448 (448) -
Disposals
Cost - - - - - - - (5,281) (5,281) - (5,281)
Accumulated depreciation - - - - - - - 5,228 5,228 - 5,228
Net book value - - - - - - - (53) (53) - (53)
Depreciation charge for
the year - (11,991) - (126,519) (24,062) (2,771) (12,751) (538) (178,632) (7,035) (185,667)
Transfer to investment
Cost - - (2,732) - - - - - (2,732) - (2,732)
Accumulated depreciation - - 2,732 - - - - - 2,732 - 2,732
- - - - - - - - - - -
Discontinued operations
- note 36
Cost - - - (1,256,741) (5,208) (13,053) (55,753) - (1,330,755) (3,111) (1,333,866)
Accumulated depreciation - - - 937,816 3,090 12,121 52,629 - 1,005,656 2,145 1,007,801
- - - (318,925) (2,118) (932) (3,124) - (325,099) (966) (326,065)
Revaluation adjustment
Cost 51,068,759 293,872 - - - - - - 51,362,631 - 51,362,631
Accumulated depreciation - 330,798 - - - - - - 330,798 - 330,798
51,068,759 624,670 - - - - - - 51,693,429 - 51,693,429
Net book value as at
June 30, 2017 51,072,000 731,820 - 247,823 63,335 9,311 35,419 183 52,159,891 14,882 52,174,773
As at June 30, 2016
Cost 3,241 438,757 2,732 7,515,940 284,865 55,390 245,981 18,950 8,565,856 49,314 8,615,170
Accumulated depreciation - (322,119) (2,732) (6,961,499) (195,869) (44,083) (198,110) (18,624) (7,743,036) (25,983) (7,769,019)
Net book value 3,241 116,638 - 554,441 88,996 11,307 47,871 326 822,820 23,331 846,151
As at June 30, 2017
Cost 51,072,000 735,132 - 6,398,025 280,176 44,044 193,651 17,515 58,740,543 42,357 58,782,900
Accumulated depreciation - (3,312) - (6,150,202) (216,841) (34,733) (158,232) (17,332) (6,580,652) (27,475) (6,608,127)
Net book value 51,072,000 731,820 - 247,823 63,335 9,311 35,419 183 52,159,891 14,882 52,174,773
Annual rates of
depreciation - 5% 5% 10% 10% - 20% 10% - 20% 10% - 33% 20% 20%
State Bank of Pakistan Annual Report FY17
------------------------------------------------------------------------------------ (Rs in '000)---------------------------------------------------------------------------------------------------------
Owned Total
11
846,151
37,133
883,284
2016
52,174,773
8,862
52,183,635
2017
--------------------------------------------------------------------------------------------------------------------------------------------------------------------------------------------------------------------------------------------------------------------------------------------------------------------------------------------------------------------------------------------------------------------------------------------------------------------------------------------------------------------Rupees '000--------------------------------------------------------------------------------------------------------------------------------------------------------------------------------------------------------------------------------------------------------------------------------------------------------------------------------------------------------------------------------------------------------------------------------------------------------------------------------------------------------------------
Building on
250

6.1.2
6.1.3
Net book
value
2017
Rupees '000
Freehold land 3,241
Building on leasehold land 107,928
6.2 Depreciation charge for the year has been allocated as follows:
Note 2017 2016
(Represented -
Note 2)
Cost of sales attributable to:
- Continuing operations 29 98,771 417,310
- Discontinued operations 59,959 74,218
158,730 491,528
Administrative expenses attributable to:
- Continuing operations 30 24,637 26,840
- Discontinued operations 2,300 2,467
26,937 29,307
185,667 520,835
2017 2016
6.3 Capital work in progress
Civil works 4,374 4,099
Plant and machinery 4,488 33,034
8,862 37,133
6.3.1 The movement in capital work in progress is as follows:
Balance as at beginning of the year 37,133 35,042
Additions during the year
- Plant and machinery 111,331 72,984
- Civil works 2,778 6,563
114,109 79,547
Transfers to operating fixed assets
- Plant and machinery (133,844) (74,992)
- Building on freehold land (2,503) (2,464)
(136,347) (77,456)
Less: Discontinued operations 36 (6,033) -
Balance at end of the year 8,862 37,133
Financial Statements of PSPC
--------------------------------------------------------------------------------------------------------------------------------------------------------------------------------------------------------------------------------------------------------------------------------------------------------------------------------------------------------------------------------------------------------------------------------------------------------------------------------------------------------------------Rupees '000--------------------------------------------------------------------------------------------------------------------------------------------------------------------------------------------------------------------------------------------------------------------------------------------------------------------------------------------------------------------------------------------------------------------------------------------------------------------------------------------------------------------
Had there been no revaluations, related figures would have been as follows:
The land has been valued on the basis of fair market value while buildings' revaluation represents
current cost of construction for relevant type of civil works. Land and buildings are carried at revalued
amounts (level 3) determined by professional valuer based on their assessment of the market values.
The unobservable inputs used in the valuations can not be determined with certainty, accordingly, a
qualitative disclosure of sensitivity has not been presented in these special purpose financial
statements.
Subsequent to completion of the revaluation exercise as at March 31, 2017, a reassessment of the
fair values of the land and buildings was conducted as at June 30, 2017, whereby it was confirmed
that there is no material change in the values assessed as at March 31, 2017.
The fair valuation of land has been assessed based on the use of the land which is not its current use
i.e. ‘highest and best use’ concept. The Corporation is continuing with the land’s current use because
of the fact that the complete printing facility / factory is situated on such land.
--------------------------------------------------------------------------------------------------------------------------------------------------------------------------------------------------------------------------------------------------------------------------------------------------------------------------------------------------------------------------------------------------------------------------------------------------------------------------------------------------------------------Rupees '000--------------------------------------------------------------------------------------------------------------------------------------------------------------------------------------------------------------------------------------------------------------------------------------------------------------------------------------------------------------------------------------------------------------------------------------------------------------------------------------------------------------------
251

2017
7. INVESTMENT PROPERTY Rupees '000
Cost 2,732
Accumulated depreciation (2,732)
Balance as at June 30, 2017 -
7.1
7.2
8. INTANGIBLES
Note 2017 2016
Computer software
As at July 1
Cost 21,246 21,236
Accumulated amortisation (20,751) (20,345)
Net book value 495 891
Year ended June 30
Additions during the year - 10
Amortisation for the year 8.1 & 8.2 (252) (406)
Less: Discontinued operations 36
- Cost (713) -
- Accumulated depreciation 566 -
Net book value as at June 30 96 495
As at June 30
Cost 20,533 21,246
Accumulated amortisation (20,437) (20,751)
Net book value 96 495
8.1
8.2 Amortisation charge for the year has been allocated as follows:
Note 2017 2016
(Represented -
Note 2)
Cost of sales attributable to:
- Continuing operations 29 109 109
- Discontinued operations 107 143
216 252
Administrative expenses attributable to:
- Continuing operations 30 36 154
252 406
State Bank of Pakistan Annual Report FY17
Computer software are being amortised over a useful life of 5 years.
For better presentation, the investment property has been separately classified in these financial
statements. The impact of this reclassification is not material in the overall context of these financial
statements.
During the year a revaluation exercise was carried out by an independent valuer. The fair value the
investment property was assessed to be Rs 32.315 million as at March 31, 2017.
--------------------------------------------------------------------------------------------------------------------------------------------------------------------------------------------------------------------------------------------------------------------------------------------------------------------------------------------------------------------------------------------------------------------------------------------------------------------------------------------------------------------Rupees '000--------------------------------------------------------------------------------------------------------------------------------------------------------------------------------------------------------------------------------------------------------------------------------------------------------------------------------------------------------------------------------------------------------------------------------------------------------------------------------------------------------------------
--------------------------------------------------------------------------------------------------------------------------------------------------------------------------------------------------------------------------------------------------------------------------------------------------------------------------------------------------------------------------------------------------------------------------------------------------------------------------------------------------------------------Rupees '000--------------------------------------------------------------------------------------------------------------------------------------------------------------------------------------------------------------------------------------------------------------------------------------------------------------------------------------------------------------------------------------------------------------------------------------------------------------------------------------------------------------------
252

9. LONG TERM INVESTMENTS IN ASSOCIATES
Note 2017 2016
Security Papers Limited 9.1 1,624,763 1,557,788
SICPA Inks Pakistan (Private) Limited 9.2 509,827 430,244
2,134,590 1,988,032
9.1 Security Papers Limited
Ownership interest 40.03% 40.03%
Cost 5,032 5,032
Share of post acquisition after tax profits 9.3 & 9.4 2,608,621 2,306,785
Share in after tax other comprehensive income 9.4 (64,042) (7,094)
Effect of restatement on other comprehensive income 7,970 7,970
Dividend received (932,818) (754,905)
1,624,763 1,557,788
9.2 SICPA Inks Pakistan (Private) Limited
Ownership interest 47.00% 47.00%
Cost 26,790 26,790
Share of post acquisition after tax profits 9.6 1,422,945 1,162,328
Effect of restatement on after tax profits 375 375
Share in after tax other comprehensive income 9.6 (2,666) (3,375)
Effect of restatement on other comprehensive income (528) (528)
Dividend received 9.7 (937,089) (755,346)
509,827 430,244
9.3
Note 2017 2016
Opening balance 2,306,785 2,111,737
Share of after tax profit from associate
For the year ended June 30 9.4 375,342 252,537
Unrealised gain on transactions 9.5 (73,506) (57,489)
301,836 195,048
Closing balance 2,608,621 2,306,785
9.4
--------------------------------------------------------------------------------------------------------------------------------------------------------------------------------------------------------------------------------------------------------------------------------------------------------------------------------------------------------------------------------------------------------------------------------------------------------------------------------------------------------------------Rupees '000--------------------------------------------------------------------------------------------------------------------------------------------------------------------------------------------------------------------------------------------------------------------------------------------------------------------------------------------------------------------------------------------------------------------------------------------------------------------------------------------------------------------
--------------------------------------------------------------------------------------------------------------------------------------------------------------------------------------------------------------------------------------------------------------------------------------------------------------------------------------------------------------------------------------------------------------------------------------------------------------------------------------------------------------------Rupees '000--------------------------------------------------------------------------------------------------------------------------------------------------------------------------------------------------------------------------------------------------------------------------------------------------------------------------------------------------------------------------------------------------------------------------------------------------------------------------------------------------------------------
The movement in share of post acquisition after tax profit for Security Papers Limited (SPL) is as
follows:
These amounts are based on audited annual financial statements of SPL as at and for the year ended
June 30, 2017.
Investments in the following associates are accounted for using equity method of accounting:
Financial Statements of PSPC
253

9.5
9.6
9.7
9.8 Summarised financial statements of the associates are as follows:
June 30, June 30, March 31, March 31,
2017 2016 2017 2016
Assets 5,679,207 5,272,613 1,982,402 1,562,288
Liabilities 1,078,750 1,023,124 510,972 362,497
2017 2016 2017 2016
Revenue 2,842,085 2,583,566 2,519,454 1,910,764
Profit after tax 937,653 630,871 554,503 397,318
Other comprehensive (loss) / income (142,265) (46,016) 1,509 (4,057)
9.9
State Bank of Pakistan Annual Report FY17
(audited) (unaudited)
Year ended March 31,
These amounts are based on annual audited financial statements of SICPA Inks Pakistan (Private)
Limited (SICPA) as at and for the year ended December 31, 2016 which have been adjusted using the
unaudited interim financial information for the three months periods ended March 31, 2016 and 2017.
--------------------------------------------------------------------------------------------------------------------------------------------------------------------------------------------------------------------------------------------------------------------------------------------------------------------------------------------------------------------------------------------------------------------------------------------------------------------------------------------------------------------Rupees '000--------------------------------------------------------------------------------------------------------------------------------------------------------------------------------------------------------------------------------------------------------------------------------------------------------------------------------------------------------------------------------------------------------------------------------------------------------------------------------------------------------------------
During the year ended June 30, 2017, the Corporation received a dividend from SICPA subsequent to
March 31, 2017 (being the date of the associate's financial information used for recording share of
profit from associate) amounting to Rs 181.743 million (2016: Rs 133.657 million) which has been
adjusted in the carrying value of investment in associate as at June 30, 2017.
Security Papers
Limited
The market value of SPL as at June 30, 2017 is Rs 145.95 per share (2016: Rs 105.59 per share) i.e.
an aggregate amount of Rs 3,462.188 million (2016: Rs 2,504.779 million). The breakup value based
on net assets of SICPA as per latest unaudited financial statements as on March 31, 2017 is Rs
258.150 per share (March 31: Rs 210.49 per share) i.e. an aggregate amount of Rs 691.572 million
(March 31: Rs 563.902 million).
This represents the effect of elimination of unrealised gain on transactions between the associate i.e.
SPL and the Corporation to the extent of its interest in the associate (40.03%).
SICPA Inks Pakistan
(Private) Limited
--------------------------------------------------------------------------------------------------------------------------------------------------------------------------------------------------------------------------------------------------------------------------------------------------------------------------------------------------------------------------------------------------------------------------------------------------------------------------------------------------------------------Rupees '000--------------------------------------------------------------------------------------------------------------------------------------------------------------------------------------------------------------------------------------------------------------------------------------------------------------------------------------------------------------------------------------------------------------------------------------------------------------------------------------------------------------------
Year ended June 30,
254

10. OTHER LONG TERM INVESTMENTS
Note 2017 2016
10.1 27,164 21,197
Held-to-maturity - Pakistan Investment Bonds 10.2 99,955 298,930
Less: Current maturity (99,955) (199,932)
- 98,998
27,164 120,195
10.1 Available-for-sale investment include:
2017 2016
2,217,429 1,995,981 27,164 21,197
10.2
11. LONG TERM LOANS
2017 2016
Long term loans to employees 106,818 68,111
Less: Current maturity (10,650) (6,485)
96,168 61,626
11.1
11.2
12. LONG TERM DEPOSITS
Note 2017 2016
Considered good
Security deposits 12.1 7,766 7,180
Lease deposits 3,697 4,623
Others 1,373 1,373
12,836 13,176
--------------------------------------------------------------------------------------------------------------------------------------------------------------------------------------------------------------------------------------------------------------------------------------------------------------------------------------------------------------------------------------------------------------------------------------------------------------------------------------------------------------------Rupees '000--------------------------------------------------------------------------------------------------------------------------------------------------------------------------------------------------------------------------------------------------------------------------------------------------------------------------------------------------------------------------------------------------------------------------------------------------------------------------------------------------------------------
Financial Statements of PSPC
This represents Pakistan Investment Bonds having face value of Rs 200 million and Rs 100 million
carrying a coupon rate of 11.25% each having maturity on July 18, 2016 and July 17, 2017,
respectively.
--------------------------------------------------------------------------------------------------------------------------------------------------------------------------------------------------------------------------------------------------------------------------------------------------------------------------------------------------------------------------------------------------------------------------------------------------------------------------------------------------------------------Rupees '000--------------------------------------------------------------------------------------------------------------------------------------------------------------------------------------------------------------------------------------------------------------------------------------------------------------------------------------------------------------------------------------------------------------------------------------------------------------------------------------------------------------------
--------------------------------------------------------------------------------------------------------------------------------------------------------------------------------------------------------------------------------------------------------------------------------------------------------------------------------------------------------------------------------------------------------------------------------------------------------------------------------------------------------------------Rupees '000--------------------------------------------------------------------------------------------------------------------------------------------------------------------------------------------------------------------------------------------------------------------------------------------------------------------------------------------------------------------------------------------------------------------------------------------------------------------------------------------------------------------
The fair value adjustment in accordance with the requirements of IAS 39 arising in respect of these
loans is not considered material in the overall context of these financial statements and hence not
recognised.
Available-for-sale - Al Hamra Islamic Stock Fund
(formely MCB Pakistan Islamic Stock Fund)
Al Hamra Islamic Stock Fund
(formerly MCB Pakistan Islamic
Stock Fund)
The amount represents a housing loan scheme introduced by the Corporation for all its permanent
employees who have completed a minimum service period of eight years. The loan is granted to
selected employees on the basis of the years of service with the Corporation with equal opportunity for
the employees in all categories. The loan is granted at a service cost of 3% per annum on the
outstanding loan amount. The loan is repayable in 10 years in equal monthly installments.
This represents available-for-sale investment at fair value with Al Hamra Islamic Stock Fund (formely
MCB Pakistan Islamic Stock Fund) having cost of Rs 10 million (2016: Rs 10 million).
---------- Number of units ---------
2017 2016 Name of investee
--------------------------------------------------------------------------------------------------------------------------------------------------------------------------------------------------------------------------------------------------------------------------------------------------------------------------------------------------------------------------------------------------------------------------------------------------------------------------------------------------------------------Rupees '000--------------------------------------------------------------------------------------------------------------------------------------------------------------------------------------------------------------------------------------------------------------------------------------------------------------------------------------------------------------------------------------------------------------------------------------------------------------------------------------------------------------------
255

12.1
13. DEFERRED TAXATION
2017 2016
Deductible temporary differences
Property, plant and equipment 467 30,844
Stores and spares 8,176 12,770
Stock-in-trade 15,321 19,244
Trade debts - 100,154
Loans and advances 1,667 1,722
Other receivables 8,846 9,141
Liabilties under finance lease 5,053 7,721
Deferred liabilities - pension payable 626,542 771,156
666,072 952,752
Taxable temporary differences
Long term investment in associates (262,849) (244,526)
Short term investments (22,782) (14,625)
Surplus on revaluation of property plant and
equipment (187,168) -
(472,799) (259,151)
Deferred taxation asset 193,273 693,601
13.1 The movement in temporary differences is as follows:
State Bank of Pakistan Annual Report FY17
--------------------------------------------------------------------------------------------------------------------------------------------------------------------------------------------------------------------------------------------------------------------------------------------------------------------------------------------------------------------------------------------------------------------------------------------------------------------------------------------------------------------Rupees '000--------------------------------------------------------------------------------------------------------------------------------------------------------------------------------------------------------------------------------------------------------------------------------------------------------------------------------------------------------------------------------------------------------------------------------------------------------------------------------------------------------------------
These include deposits provided to K-Electric Limited, Sui Southern Gas Company Limited and
Karachi Water & Sewerage Board in respect of utilities availed by the Corporation from respective
suppliers.
Property, plant and equipment
and equipment 30,844 (12,035) - - (18,342) 467
Long term investment
in associates (244,526) (25,687) - 7,364 - (262,849)
Stores and spares 12,770 866 - - (5,460) 8,176
Stock-in-trade 19,244 (1,442) - - (2,481) 15,321
Trade debts 100,154 7,318 - - (107,472) -
Loans and advances 1,722 (55) - - - 1,667
Other receivables 9,141 (295) - - - 8,846
Short term investments (14,625) (24,834) - - 16,677 (22,782)
Liabilties under finance lease 7,721 (2,328) - - (340) 5,053
Deferred liabilities -
pension payable 771,156 - - 65,959 (210,573) 626,542
Revaluation surplus on property
plant and equipment - 233 (187,401) - - (187,168)
693,601 (58,259) (187,401) 73,323 (327,991) 193,273
Balance as
at July 1, 2016
Recognised in
profit or loss
Recognised
in OCI
Balance as at
June 30, 2017
--------------------------------------------------------------------------------------------------------------------------------------------------------------------------------------------------------------------------------------------------------------------------------------------------------------------------------------------------------------------------------------------------------------------------------------------------------------------------------------------------------------------Rupees '000--------------------------------------------------------------------------------------------------------------------------------------------------------------------------------------------------------------------------------------------------------------------------------------------------------------------------------------------------------------------------------------------------------------------------------------------------------------------------------------------------------------------
Transfer to
NSPC
(note 36)
Recognised
in revaluation
surplus
256
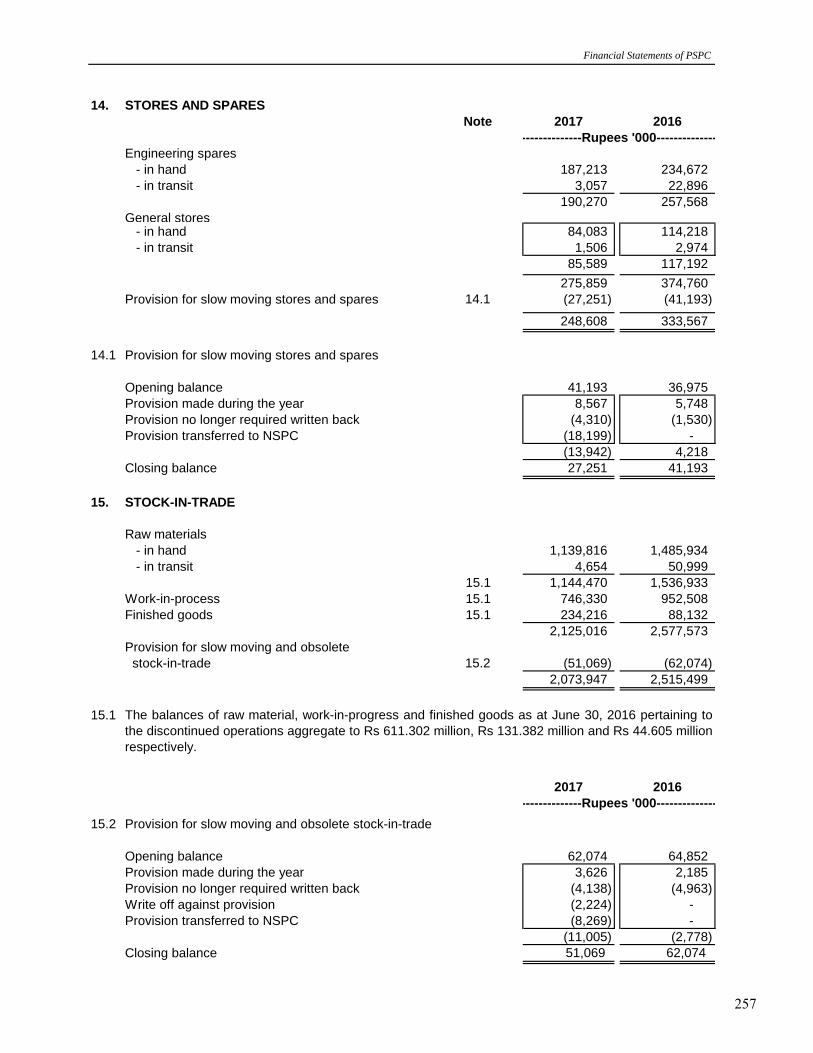
14. STORES AND SPARES
Note 2017 2016
Engineering spares
- in hand 187,213 234,672
- in transit 3,057 22,896
190,270 257,568
General stores- in hand 84,083 114,218
- in transit 1,506 2,974
85,589 117,192
275,859 374,760
Provision for slow moving stores and spares 14.1 (27,251) (41,193)
248,608 333,567
14.1 Provision for slow moving stores and spares
Opening balance 41,193 36,975
Provision made during the year 8,567 5,748
Provision no longer required written back (4,310) (1,530)
Provision transferred to NSPC (18,199) -
(13,942) 4,218
Closing balance 27,251 41,193
15. STOCK-IN-TRADE
Raw materials
- in hand 1,139,816 1,485,934
- in transit 4,654 50,999
15.1 1,144,470 1,536,933
Work-in-process 15.1 746,330 952,508
Finished goods 15.1 234,216 88,132
2,125,016 2,577,573
Provision for slow moving and obsolete
stock-in-trade 15.2 (51,069) (62,074)
2,073,947 2,515,499
15.1
2017 2016
15.2 Provision for slow moving and obsolete stock-in-trade
Opening balance 62,074 64,852
Provision made during the year 3,626 2,185
Provision no longer required written back (4,138) (4,963)
Write off against provision (2,224) -
Provision transferred to NSPC (8,269) -
(11,005) (2,778)
Closing balance 51,069 62,074
--------------------------------------------------------------------------------------------------------------------------------------------------------------------------------------------------------------------------------------------------------------------------------------------------------------------------------------------------------------------------------------------------------------------------------------------------------------------------------------------------------------------Rupees '000--------------------------------------------------------------------------------------------------------------------------------------------------------------------------------------------------------------------------------------------------------------------------------------------------------------------------------------------------------------------------------------------------------------------------------------------------------------------------------------------------------------------
The balances of raw material, work-in-progress and finished goods as at June 30, 2016 pertaining to
the discontinued operations aggregate to Rs 611.302 million, Rs 131.382 million and Rs 44.605 million
respectively.
Financial Statements of PSPC
--------------------------------------------------------------------------------------------------------------------------------------------------------------------------------------------------------------------------------------------------------------------------------------------------------------------------------------------------------------------------------------------------------------------------------------------------------------------------------------------------------------------Rupees '000--------------------------------------------------------------------------------------------------------------------------------------------------------------------------------------------------------------------------------------------------------------------------------------------------------------------------------------------------------------------------------------------------------------------------------------------------------------------------------------------------------------------
257

16. TRADE DEBTS
Note 2017 2016
Unsecured
Considered good
- Due from related parties 16.1 & 16.4 1,702,777 2,462,883
- Due from others 16.3 - 30,201
1,702,777 2,493,084
Considered doubtful
- Due from a related party - 322,669
- Due from others - 408
- 323,077
1,702,777 2,816,161
Less: Provision for doubtful debts 16.2 - (323,077)
1,702,777 2,493,084
16.1 Trade debts include the following amounts due from
related parties:
State Bank of Pakistan 1,702,777 866,409
Director General Pakistan Post Office - 1,407,061
Director General Immigration and Passports - 512,082
1,702,777 2,785,552
16.2 Provision for doubtful debts
Opening balance 323,077 74,639
Provision made during the year 493,794 1,095,534
Provision no longer required written back (458,632) (847,096)
35,162 248,438
Provision transferred to NSPC (358,239) -
Closing balance - 323,077
16.3
2017 2016
Upto 1 month - 9,432
1 to 6 months - 17,868
More than 6 months - 2,901
- 30,201
16.4 Ageing analysis of the amounts due from related parties is as follows:
State Bank of Pakistan 788,031 914,746 - 1,702,777 866,409
Director General Pakistan
Post Office (note 16.5) - - - - 1,407,061
Director General
Immigration and Passports - - - - 512,082
788,031 914,746 - 1,702,777 2,785,552
State Bank of Pakistan Annual Report FY17
19
--------------------------------------------------------------------------------------------------------------------------------------------------------------------------------------------------------------------------------------------------------------------------------------------------------------------------------------------------------------------------------------------------------------------------------------------------------------------------------------------------------------------Rupees '000--------------------------------------------------------------------------------------------------------------------------------------------------------------------------------------------------------------------------------------------------------------------------------------------------------------------------------------------------------------------------------------------------------------------------------------------------------------------------------------------------------------------
As at June
30, 2016
--------------------------------------------------------------------------------------------------------------------------------------------------------------------------------------------------------------------------------------------------------------------------------------------------------------------------------------------------------------------------------------------------------------------------------------------------------------------------------------------------------------------Rupees '000--------------------------------------------------------------------------------------------------------------------------------------------------------------------------------------------------------------------------------------------------------------------------------------------------------------------------------------------------------------------------------------------------------------------------------------------------------------------------------------------------------------------
Upto 1
month
1 to 6
months
As at June 30, 2017, trade debts due from other than related parties of Rs Nil (2016: Rs 30.201 million)
were past due but not impaired. These related to a number of independent customers with whom there
was no history of default. The ageing analysis of these trade receivables was as follows:
More than
6 months
--------------------------------------------------------------------------------------------------------------------------------------------------------------------------------------------------------------------------------------------------------------------------------------------------------------------------------------------------------------------------------------------------------------------------------------------------------------------------------------------------------------------Rupees '000--------------------------------------------------------------------------------------------------------------------------------------------------------------------------------------------------------------------------------------------------------------------------------------------------------------------------------------------------------------------------------------------------------------------------------------------------------------------------------------------------------------------
As at June
30, 2017
258
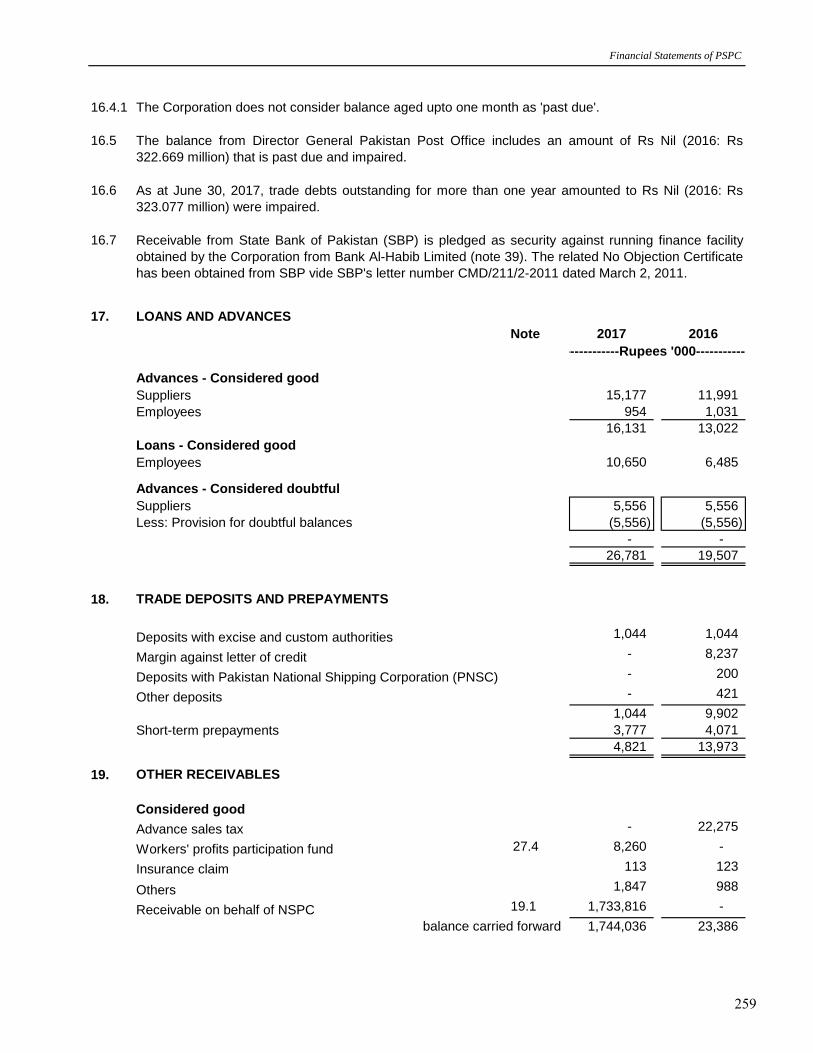
16.4.1 The Corporation does not consider balance aged upto one month as 'past due'.
16.5
16.6
16.7
17. LOANS AND ADVANCES
Note 2017 2016
Advances - Considered good
Suppliers 15,177 11,991
Employees 954 1,031
16,131 13,022
Loans - Considered good
Employees 10,650 6,485
Advances - Considered doubtful
Suppliers 5,556 5,556
Less: Provision for doubtful balances (5,556) (5,556)
- -
26,781 19,507
18. TRADE DEPOSITS AND PREPAYMENTS
Deposits with excise and custom authorities 1,044 1,044
Margin against letter of credit - 8,237
Deposits with Pakistan National Shipping Corporation (PNSC) - 200
Other deposits - 421
1,044 9,902
Short-term prepayments 3,777 4,071
4,821 13,973
19. OTHER RECEIVABLES
Considered good
Advance sales tax - 22,275
Workers' profits participation fund 27.4 8,260 -
Insurance claim 113 123
Others 1,847 988
Receivable on behalf of NSPC 19.1 1,733,816 -
balance carried forward 1,744,036 23,386
Receivable from State Bank of Pakistan (SBP) is pledged as security against running finance facility
obtained by the Corporation from Bank Al-Habib Limited (note 39). The related No Objection Certificate
has been obtained from SBP vide SBP's letter number CMD/211/2-2011 dated March 2, 2011.
--------------------------------------------------------------------------------------------------------------------------------------------------------------------------------------------------------------------------------------------------------------------------------------------------------------------------------------------------------------------------------------------------------------------------------------------------------------------------------------------------------------------Rupees '000--------------------------------------------------------------------------------------------------------------------------------------------------------------------------------------------------------------------------------------------------------------------------------------------------------------------------------------------------------------------------------------------------------------------------------------------------------------------------------------------------------------------
Financial Statements of PSPC
As at June 30, 2017, trade debts outstanding for more than one year amounted to Rs Nil (2016: Rs
323.077 million) were impaired.
The balance from Director General Pakistan Post Office includes an amount of Rs Nil (2016: Rs
322.669 million) that is past due and impaired.
259

2017 2016
balance brought forward 1,744,036 23,386
Considered doubtful
Sales tax recoverable
- On sale of assets to SICPA Inks Pakistan (Private) Limited 26,529 26,529
- Others 2,959 2,959
29,488 29,488
1,773,524 52,874
Less: Provision for doubtful balances (29,488) (29,488)
1,744,036 23,386
19.1
20. SHORT TERM INVESTMENTS
Note 2017 2016
Loans and receivables - Term deposit receipts 20.1 6,122,000 4,822,000
Designated as at fair value through profit or
loss - Investments in Mutual funds 20.2 & 20.3 1,582,086 1,265,047
7,704,086 6,087,047
20.1
20.2 Designated as at fair value through profit or loss - Investments in Mutual funds:
2017 2016
MCB Cash Management Optimizer
Fund 66,978 63,579
Meezan Islamic Fund 516,381 422,759
MCB DCF Income Fund 71,286 67,915
106,798 81,706
58,063 55,488
- 61,740
- 122,760
- 116,628
NAFA Islamic Asset Allocation Fund 128,778 107,548
NAFA Islamic Stock Fund 231,840 64,940
Al-Ameen Shariah Stock Fund 63,960 50,000
MFPF-Meezan Asset Allocation Plan II 76,064 49,984
- MSAF Meezan Strategic Allocation Plan I 131,323 -
- MSAF Meezan Strategic Allocation Plan II 130,615 -
- 1,582,086 1,265,047
State Bank of Pakistan Annual Report FY17
1,201,932 1,229,420
4,370,591
2,602,512
This represents term deposit receipts maturing upto 12 months with various banks bearing mark-up
ranging from 5.6% to 6.15% (2016: 5.6% to 7.6%) per annum. Term deposit receipt of Rs 22 million
(2016: Rs 22 million) with Faysal Bank Limited is marked under lien against bank guarantee (note
28.1.3).
6,385,120 6,758,035
666,328
2016
---------- Number of units ---------
--------------------------------------------------------------------------------------------------------------------------------------------------------------------------------------------------------------------------------------------------------------------------------------------------------------------------------------------------------------------------------------------------------------------------------------------------------------------------------------------------------------------Rupees '000--------------------------------------------------------------------------------------------------------------------------------------------------------------------------------------------------------------------------------------------------------------------------------------------------------------------------------------------------------------------------------------------------------------------------------------------------------------------------------------------------------------------
This represents amount to be collected on behalf of NSPC on no-charge basis in accordance with the
common facilities agreement dated May 19, 2017. The related payable has been separately recognised
on the balance sheet.
--------------------------------------------------------------------------------------------------------------------------------------------------------------------------------------------------------------------------------------------------------------------------------------------------------------------------------------------------------------------------------------------------------------------------------------------------------------------------------------------------------------------Rupees '000--------------------------------------------------------------------------------------------------------------------------------------------------------------------------------------------------------------------------------------------------------------------------------------------------------------------------------------------------------------------------------------------------------------------------------------------------------------------------------------------------------------------
2017 Name of investee
--------------------------------------------------------------------------------------------------------------------------------------------------------------------------------------------------------------------------------------------------------------------------------------------------------------------------------------------------------------------------------------------------------------------------------------------------------------------------------------------------------------------Rupees '000--------------------------------------------------------------------------------------------------------------------------------------------------------------------------------------------------------------------------------------------------------------------------------------------------------------------------------------------------------------------------------------------------------------------------------------------------------------------------------------------------------------------
633,652
46,502,735
NAFA Islamic Principal Protected Fund II
Meezan Capital Preservation Fund II
MFPF Meezan Capital Preservation Plan I-
-
550,287
2,000,000
2,096,103
669,794
6,011,758 6,168,107
Atlas Money Market Fund
7,028,702
110,732 115,695
ABL Islamic Stock Fund
2,645,091
640,442
-
31,418,031
17,691,631
417,331
7,538,791
388,712
260
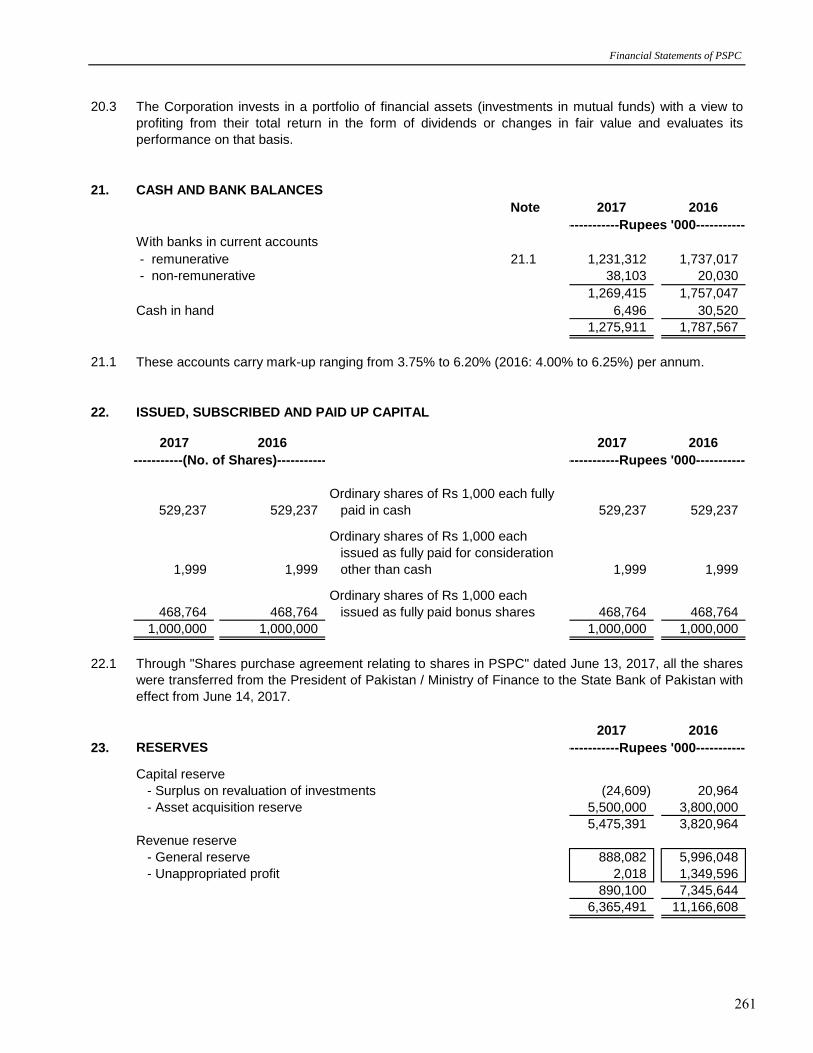
20.3
21. CASH AND BANK BALANCES
Note 2017 2016
With banks in current accounts
- remunerative 21.1 1,231,312 1,737,017
- non-remunerative 38,103 20,030
1,269,415 1,757,047
Cash in hand 6,496 30,520
1,275,911 1,787,567
21.1
22. ISSUED, SUBSCRIBED AND PAID UP CAPITAL
2017 2016
529,237 529,237
1,999 1,999
468,764 468,764
1,000,000 1,000,000
22.1
2017 2016
23. RESERVES
Capital reserve
- Surplus on revaluation of investments (24,609) 20,964
- Asset acquisition reserve 5,500,000 3,800,000
5,475,391 3,820,964
Revenue reserve
- General reserve 888,082 5,996,048
- Unappropriated profit 2,018 1,349,596
890,100 7,345,644
6,365,491 11,166,608
2017 2016
--------------------------------------------------------------------------------------------------------------------------------------------------------------------------------------------------------------------------------------------------------------------------------------------------------------------------------------------------------------------------------------------------------------------------------------------------------------------------------------------------------------------Rupees '000--------------------------------------------------------------------------------------------------------------------------------------------------------------------------------------------------------------------------------------------------------------------------------------------------------------------------------------------------------------------------------------------------------------------------------------------------------------------------------------------------------------------
issued as fully paid for consideration
other than cash
paid in cash
--------------------------------------------------(No. of Shares)--------------------------------------------------
Ordinary shares of Rs 1,000 each
529,237
1,999
529,237
468,764
1,000,000
issued as fully paid bonus shares
1,999
1,000,000
--------------------------------------------------------------------------------------------------------------------------------------------------------------------------------------------------------------------------------------------------------------------------------------------------------------------------------------------------------------------------------------------------------------------------------------------------------------------------------------------------------------------Rupees '000--------------------------------------------------------------------------------------------------------------------------------------------------------------------------------------------------------------------------------------------------------------------------------------------------------------------------------------------------------------------------------------------------------------------------------------------------------------------------------------------------------------------
Financial Statements of PSPC
--------------------------------------------------------------------------------------------------------------------------------------------------------------------------------------------------------------------------------------------------------------------------------------------------------------------------------------------------------------------------------------------------------------------------------------------------------------------------------------------------------------------Rupees '000--------------------------------------------------------------------------------------------------------------------------------------------------------------------------------------------------------------------------------------------------------------------------------------------------------------------------------------------------------------------------------------------------------------------------------------------------------------------------------------------------------------------
Through "Shares purchase agreement relating to shares in PSPC" dated June 13, 2017, all the shares
were transferred from the President of Pakistan / Ministry of Finance to the State Bank of Pakistan with
effect from June 14, 2017.
Ordinary shares of Rs 1,000 each
468,764
Ordinary shares of Rs 1,000 each fully
These accounts carry mark-up ranging from 3.75% to 6.20% (2016: 4.00% to 6.25%) per annum.
The Corporation invests in a portfolio of financial assets (investments in mutual funds) with a view to
profiting from their total return in the form of dividends or changes in fair value and evaluates its
performance on that basis.
261

24. SURPLUS ON REVALUATION OF PROPERTY PLANT AND EQUIPMENT 2017
- NET Rupees '000
Surplus on revaluation of:
- Freehold land 51,068,759
- Buildings on freehold land 624,670
51,693,429
Less: Transferred to unappropriated profit
(545)
Related deferred tax liability (233)
(778)
51,692,651
Less: related deferred tax liability on:
Surplus arising on property, plant and equipment during the year (187,401)
Incremental depreciation charged during the year on
assets transferred to profit and loss account 233
Deferred tax liability recognised on surplus (187,168)
51,505,483
25. LIABILITIES AGAINST ASSETS SUBJECT TO FINANCE LEASES
Not later than one year 5,890 730 5,160 9,141 1,230 7,911
Later than one year
and not later than
five years 13,347 1,673 11,674 18,890 1,327 17,563
19,237 2,403 16,834 28,031 2,557 25,474
Less: shown in
current maturity (5,160) (7,911)
Long term portion 11,674 17,563
25.1
26. DEFERRED LIABILITIES Note 2017 2016
Defined benefit plan (staff pension scheme) - funded 26.3 3,146,267 3,622,195
26.1
State Bank of Pakistan Annual Report FY17
--------------------------------------------------------------------------------------------------------------------------------------------------------------------------------------------------------------------------------------------------------------------------------------------------------------------------------------------------------------------------------------------------------------------------------------------------------------------------------------------------------------------Rupees '000--------------------------------------------------------------------------------------------------------------------------------------------------------------------------------------------------------------------------------------------------------------------------------------------------------------------------------------------------------------------------------------------------------------------------------------------------------------------------------------------------------------------
2017
Present
value of
minimum
lease
payments
Financial
charges
2016
Minimum
lease
payments
Present
value of
minimum
lease
payments
Financial
charges
Minimum
lease
payments
As stated in note 3.17 the Corporation operates a defined benefit plan i.e. an approved funded pension
scheme for all its permanent employees subject to attainment of retirement age and minimum service
of the prescribed period. Actuarial valuation of the scheme is carried out every year and the latest
actuarial valuation was carried out as at June 30, 2017. The disclosures made in notes 26.2 to 26.16
are based on the information included in that actuarial report.
--------------------------------------------------------------------------------------------------------------------------------------------------------------------------------------------------------------------------------------------------------------------------------------------------------------------------------------------------------------------------------------------------------------------------------------------------------------------------------------------------------------------Rupees '000--------------------------------------------------------------------------------------------------------------------------------------------------------------------------------------------------------------------------------------------------------------------------------------------------------------------------------------------------------------------------------------------------------------------------------------------------------------------------------------------------------------------
The above represents finance leases entered into to procure the Corporation's vehicles. The financing
rate used as discounting factor ranges from 6.34% to 7.99% (2016: 6.34% to 7.99%).The Corporation
intends to exercise its option to purchase the leased assets on completion of the respective lease
periods. The liabilities against assets subject to finance lease are secured by the lessor's charge over
the leased assets. The cost of operating and maintaining the leased assets are borne by the
Corporation.
surplus relating to incremental depreciation charged
during the year - net of deferred tax
262

26.2
2017 2016
- Discount rate - per annum 9.25% p.a 9.0% p.a
- Expected rate of increase in salaries - annual 9.25% p.a 9.0% p.a
- Expected rate of increase in monthly pension 5.25% p.a 5.0% p.a
- Pre-Retirement Mortality SLIC 2001-2005 SLIC 2001-2005
- Post-Retirement Mortality SLIC 2001-2005 SLIC 2001-2005
26.3 Balance sheet reconciliation
Note 2017 2016
Present value of defined benefit obligation 26.4 4,957,302 6,005,357
Fair value of plan assets 26.5 (1,811,035) (2,383,162)
Net liability in the balance sheet 3,146,267 3,622,195
26.4 Present value of defined benefit obligation
as at July 1, 2016 / 2015 6,005,357 4,927,211
Less: Discontinued operations (1,674,196) -
Employees transferred to NSPC 124,014 -
Current service cost 57,250 133,138
Interest cost 495,342 506,198
Benefits paid (276,492) (212,555)
Past service cost - 246,438
Remeasurement loss on obligation 226,027 404,927
Present value as at June 30 4,957,302 6,005,357
26.5 Movement in fair value of plan assets
Fair value as at July 1, 2016 / 2015 2,383,162 2,383,449
Less: Discontinued operations 26.5.1 (635,706) -
Employees transferred from NSPC 57,934 -
Expected return on plan assets 192,810 243,542
Corporation's contributions 83,163 84,558
Benefits paid (276,492) (212,555)
Remeasurement gain / (loss) on fair
value of plan assets 6,164 (115,832)
Fair value as at June 30 1,811,035 2,383,162
26.5.1
2017 2016
26.6 Movement in net liability in the balance sheet is as
follows:
Opening balance of net liability 3,622,195 2,543,762
Less: Discontinued operations (1,038,490) -
Employees transferred from NSPC 66,080 -
Charge for the year 26.8 359,782 642,232
Corporation's contributions (83,163) (84,558)
Net remeasurement loss for the year 26.10 219,863 520,759
Closing balance of net liability 3,146,267 3,622,195
26.7 Charge for the year has been allocated as under: (Represented
Note 2)
- Continuing operations 222,816 366,897
- Discontinued operations 53,346 135,701
276,162 502,598
Administrative expenses:
- Continuing operations 67,467 101,933
- Discontinued operations 16,153 37,701
83,620 139,634
359,782 642,232
--------------------------------------------------------------------------------------------------------------------------------------------------------------------------------------------------------------------------------------------------------------------------------------------------------------------------------------------------------------------------------------------------------------------------------------------------------------------------------------------------------------------Rupees '000--------------------------------------------------------------------------------------------------------------------------------------------------------------------------------------------------------------------------------------------------------------------------------------------------------------------------------------------------------------------------------------------------------------------------------------------------------------------------------------------------------------------
Financial Statements of PSPC
The projected unit credit method using the following significant assumptions was used for this valuation:
Cost of sales:
These plan assets are still in the name of the Corporation and are being held for and on behalf of NSPC in accordance
with the common facilities and cost sharing agreement dated May 19, 2017.
--------------------------------------------------------------------------------------------------------------------------------------------------------------------------------------------------------------------------------------------------------------------------------------------------------------------------------------------------------------------------------------------------------------------------------------------------------------------------------------------------------------------Rupees '000--------------------------------------------------------------------------------------------------------------------------------------------------------------------------------------------------------------------------------------------------------------------------------------------------------------------------------------------------------------------------------------------------------------------------------------------------------------------------------------------------------------------
263

26.8
2017 2016
(Represented
Note 2)
Current service cost:
Continuing operations 46,191 97,191
Discontinued operations 11,059 35,947
57,250 133,138
Past service cost:
Continuing operations - 179,900
Discontinued operations - 66,538
- 246,438
Net interest cost:
Continuing operations 244,093 191,739
Discontinued operations 58,439 70,917
302,532 262,656
359,782 642,232
26.9 Actual return on plan assets
Expected return on plan assets:
- Continuing operations 155,564 177,786
- Discontinued operations 37,246 65,756
192,810 243,542
value of plan assets:
- Continuing operations 4,973 (84,557)
- Discontinued operations 1,191 (31,275)
6,164 (115,832)
Actual return on plan assets 198,974 127,710
26.10 Remeasurement recognised in other comprehensive income
Remeasurement loss on defined benefit obligation
Continuing operations 182,365 295,597
Discontinued operations 43,662 109,330
226,027 404,927
Remeasurement (gain) / loss on fair value of plan assets
Continuing operations (4,973) 84,557
Discontinued operations (1,191) 31,275
(6,164) 115,832
219,863 520,759
26.11 Plan assets comprise of the following:
Percentage
%
(Rs in '000) Percentage
%
Equity instruments 721,954 30.22 601,734 25.25
Debt instruments 679,101 28.42 1,309,386 54.94
Cash and cash equivalents 988,115 41.36 472,042 19.81
2,389,170 100.00 2,383,162 100.00
Less: Pertaining to NSPC 578,135
1,811,035
26.12 Expected charge to profit and loss account in respect of post employment benefit plan for the year ending June 30, 2018
is Rs 285.669 million (2016: Rs 382.866 million) and expected contribution to such plan for the year ending June 30,
2018 is Rs 57.363 million.
(Rs in '000)
The following amounts have been recognised in the profit and loss account in respect of the pension plan:
2017 2016
--------------------------------------------------------------------------------------------------------------------------------------------------------------------------------------------------------------------------------------------------------------------------------------------------------------------------------------------------------------------------------------------------------------------------------------------------------------------------------------------------------------------Rupees '000--------------------------------------------------------------------------------------------------------------------------------------------------------------------------------------------------------------------------------------------------------------------------------------------------------------------------------------------------------------------------------------------------------------------------------------------------------------------------------------------------------------------
Remeasurement gain / (loss) on fair
State Bank of Pakistan Annual Report FY17
264

26.13
1% (512,085) 668,546
1% 210,023 (153,891)
1% 20,040 20,736
26.14
26.15 The weighted average duration of the defined benefit obligation is 11.86 years.
26.16
Asset volatility
Inflation risk
Life expectancy / withdrawal rate
27. TRADE AND OTHER PAYABLES Note 2017 2016
Creditors
- Payable to associates 27.1 636,331 650,119
- Payable to others 23,046 18,956
- Payable to SBP 941 -
Bills payable 4,655 18,492
Accrued liabilities 27.2 494,063 608,750
Advances from customers of NSPC
(2016: the Corporation) 273,378 290,281
Advance from SBP 27.3 594,877 9,199
Sales tax payable 38,343 -
Workers' profits participation fund 27.4 & 19 - 22,728
Deposits and retention money 17,955 18,020
Advance rent and security deposits 1,721 1,655
Others 123,225 94,536
2,208,535 1,732,736
27.1 Payable to associates
Security Papers Limited 421,290 301,976
SICPA Inks Pakistan (Private) Limited 215,041 348,143
636,331 650,119
--------------------------------------------------------------------------------------------------------------------------------------------------------------------------------------------------------------------------------------------------------------------------------------------------------------------------------------------------------------------------------------------------------------------------------------------------------------------------------------------------------------------Rupees '000--------------------------------------------------------------------------------------------------------------------------------------------------------------------------------------------------------------------------------------------------------------------------------------------------------------------------------------------------------------------------------------------------------------------------------------------------------------------------------------------------------------------
Through its defined benefit plan, the fund is exposed to a number of risks, the most significant of
which are detailed below:
The plan liabilities are calculated using a discount rate set with reference to corporate bond yields; if
plan assets underperform this yield, this will create a deficit. The fund believes that due to long-term
nature of the plan liabilities and the strength of the Corporation's support, the current investment
strategy manages this risk adequately.
The majority of the plan's benefit obligations are linked to inflation and higher inflation will lead to
higher liabilities. However, the fund manages plan assets to off set inflationary impacts.
The majority of the plan's obligations are to provide benefits on severance with the Corporation or on
achieving retirement. Any change in life expectancy / withdrawal rate would impact plan liabilities.
Salary growth rate
Impact on defined benefit obligation
The above sensitivity analysis are based on a change in an assumption while holding all other
assumptions constant. In practice, this is unlikely to occur, and changes in some of the assumptions
may be correlated. When calculating the sensitivity of the defined benefit obligation to significant
actuarial assumptions the same method (present value of the defined benefit obligation calculated
with the projected unit credit method at the end of the reporting period) has been applied as when
calculating the pension liability recognised within the balance sheet.
The sensitivity of the defined benefit obligation to changes in the weighted principal assumptions is:
Financial Statements of PSPC
--------------------------------------------------------------------------------------------------------------------------------------------------------------------------------------------------------------------------------------------------------------------------------------------------------------------------------------------------------------------------------------------------------------------------------------------------------------------------------------------------------------------Rupees '000--------------------------------------------------------------------------------------------------------------------------------------------------------------------------------------------------------------------------------------------------------------------------------------------------------------------------------------------------------------------------------------------------------------------------------------------------------------------------------------------------------------------
Increase in
assumption
Decrease in
assumption
Pension indexation rate
Change in
assumptions
Discount rate
265

27.1.1
27.2
27.3
Note 2017 2016
27.4 Workers' profits participation fund
Liability at the beginning of the year 22,728 9,831
Allocation for the year 27.4.1 141,740 132,728
164,468 142,559
Payments made during the year (172,728) (119,831)
(Receivable) / payable at the end of the year 19 (8,260) 22,728
27.4.1
28. CONTINGENCIES AND COMMITMENTS
28.1 Contingencies
28.1.1
28.1.2
28.1.3
28.2 Commitments
Payable to associates includes Rs 3.173 million payable in respect of procurements made on behalf of
NSPC for its production activities.
This amount includes Rs 8.511 million payable in respect of bonus and leave encashment for employees
of NSPC.
This represents advance from SBP for the production of prize bonds.
--------------------------------------------------------------------------------------------------------------------------------------------------------------------------------------------------------------------------------------------------------------------------------------------------------------------------------------------------------------------------------------------------------------------------------------------------------------------------------------------------------------------Rupees '000--------------------------------------------------------------------------------------------------------------------------------------------------------------------------------------------------------------------------------------------------------------------------------------------------------------------------------------------------------------------------------------------------------------------------------------------------------------------------------------------------------------------
The Corporation is defending certain cases filed by its ex-employees on account of their reinstatement in
the Corporation and compensation for loss of their jobs. Management considers that the probability of
any significant liability arising from such cases is remote.
Allocation for the year includes Rs 48.878 million (2016: Rs 78.851 million) pertaining to the discontinued
operations.
Letters of credit for raw material and stores and spares outstanding at the year end amounted to Rs
11.031 million (2016: Rs 82.823 million).
In the previous years the tax authorities initiated proceedings for amendment of deemed assessments
for tax years 2004 to 2009 by issuing notices under sections 122 (5A) read with 122(9) of the Income
Tax Ordinance, 2001. The amended orders were passed and certain demands were raised for which the
Corporation subsequently filed rectification application as a result of which the demands were rectified to
Rs 34.9 million. The Corporation, having paid the aforesaid net demand of Rs 34.9 million, had filed
appeals before the Commissioner of Inland Revenue - Appeals {CIR(A)} which were decided against the
Corporation. The Corporation, further filed appeal before the Appellate Tribunal Inland Revenue (ATIR)
which vide order dated June 29, 2015 partially upheld the action of the Additional Commissioner Inland
Revenue for amending the aforesaid assessments.
Further, the Corporation's miscellaneous application before ATIR on the matter of allocation of expenses
has been dismissed. A reference before the High Court of Sindh has been filed by the Corporation, the
adjudication of which is pending to date. The management, however, is continuing with its view that the
net demand will eventually be revoked and the amount paid be refunded / adjusted in favour of the
Corporation.
Capital commitments at the year end amounted to Rs 15.368 million (2016: Rs 6.297 million).
State Bank of Pakistan Annual Report FY17
Outstanding letters of guarantee amounted to Rs 22 million (2016: Rs 22 million).
266

Note 2017 2016
(Represented
Note 2)
29. COST OF SALES
Raw material
Opening stock 925,631 468,556
Purchases including in transit 5,729,701 4,840,371
Closing stock (1,144,470) (925,631)
5,510,862 4,383,296
Salaries, wages and benefits 29.1 1,154,751 1,121,498
Stores and spares 255,820 260,967
Fuel and power 108,829 105,641
Insurance 8,641 8,837
Transportation 1,420 1,236
Rent, rates and taxes 18,909 16,680
Depreciation 6.2 98,771 417,310
Provision for obsolete stores and spares - net 5,458 4,587
Provision for slow moving and obsolete
stock-in-trade - net 3,383 -
Repairs and maintenance 55,506 35,385
Amortisation 8.2 109 109
1,711,597 1,972,250
Manufacturing cost 7,222,459 6,355,546
Opening work-in-process 821,126 653,617
Closing work-in-process (746,330) (821,126)
74,796 (167,509)
Cost of goods manufactured 7,297,255 6,188,037
Opening stock of finished goods 43,527 74,073
Closing stock of finished goods (234,216) (43,527)
(190,689) 30,546
7,106,566 6,218,583
29.1
--------------------------------------------------------------------------------------------------------------------------------------------------------------------------------------------------------------------------------------------------------------------------------------------------------------------------------------------------------------------------------------------------------------------------------------------------------------------------------------------------------------------Rupees '000--------------------------------------------------------------------------------------------------------------------------------------------------------------------------------------------------------------------------------------------------------------------------------------------------------------------------------------------------------------------------------------------------------------------------------------------------------------------------------------------------------------------
Financial Statements of PSPC
15
Salaries, wages and benefits include Rs 222.816 million (represented - 2016: Rs 366.897 million) in
respect of staff retirement benefits of officers, staff and workers.
15
267

30. ADMINISTRATIVE EXPENSES
Note 2017 2016
(Represented
Note 2)
Salaries, wages and benefits 30.1 353,513 335,004
Directors' meeting fee and expenses 5,409 3,254
Fuel and power 16,662 14,057
Insurance 1,695 1,565
Travelling and entertainment 8,090 11,708
Depreciation 6.2 24,637 26,840
Amortisation 8.2 36 154
Security charges 74,418 68,865
Repairs and maintenance 11,605 11,268
Donations - 5,600
Communication 2,603 2,579
Legal and professional charges 750 1,781
Advertisements 8,132 3,520
Printing and stationery 300 493
Operating lease rentals 113 122
Others 7,196 3,843
515,159 490,653
30.1
31. OTHER EXPENSES
Note 2017 2016
(Represented
Note 2)
Auditors' remuneration 31.1 17,502 1,337
Exchange loss - net 106 2,632
Workers' profit participation fund 27.4 92,862 53,877
Loss on sale of investments - 2,359
Others 134 66
110,604 60,271
31.1 Auditors' remuneration
Audit fee 770 770
Fee for half yearly review 137 137
Other services 16,400 235
17,307 1,142
Out of pocket expense 195 195
17,502 1,337
State Bank of Pakistan Annual Report FY17
--------------------------------------------------------------------------------------------------------------------------------------------------------------------------------------------------------------------------------------------------------------------------------------------------------------------------------------------------------------------------------------------------------------------------------------------------------------------------------------------------------------------Rupees '000--------------------------------------------------------------------------------------------------------------------------------------------------------------------------------------------------------------------------------------------------------------------------------------------------------------------------------------------------------------------------------------------------------------------------------------------------------------------------------------------------------------------
--------------------------------------------------------------------------------------------------------------------------------------------------------------------------------------------------------------------------------------------------------------------------------------------------------------------------------------------------------------------------------------------------------------------------------------------------------------------------------------------------------------------Rupees '000--------------------------------------------------------------------------------------------------------------------------------------------------------------------------------------------------------------------------------------------------------------------------------------------------------------------------------------------------------------------------------------------------------------------------------------------------------------------------------------------------------------------
Salaries, wages and benefits include Rs 67.467 million (represented - 2016: Rs 101.933 million) in
respect of retirement benefits of officers, staff and workers.
268

32. OTHER INCOME
Note 2017 2016
(Represented
Note 2)
Income from financial assets
Gain on remeasurement of short term investments 32.1 226,328 97,779
Return on investment in Pakistan Investment Bonds 11,675 36,536
Gain on sale of investments 32.1 22,805 -
Mark-up on bank deposits 32.1 376,041 336,449
Bonus / dividend income 20,130 15,730
Service charges on long term loans 11 1,886 1,354
658,865 487,848
Income from non financial assets
- related parties
Rental income from associate
- SICPA Inks Pakistan (Private) Limited 8,380 8,380
Service charges recovered from associate
- Security Papers Limited 340 565
8,720 8,945
- others
Rental income - other 8,585 7,804
Scrap sales 5,145 3,645
Reversal of provision for slow moving
and obsolete stock-in-trade - net 15.2 - 4,215
Gain on disposal of operating fixed assets 1,361 879
Miscellaneous income 3,822 1,050
18,913 17,593
686,498 514,386
32.1
Note 2017 2016
33. FINANCE COST
Financial charges on liabilities against assets
subject to finance lease 1,143 1,355
Bank charges 772 521
1,915 1,876
34. SHARE OF PROFIT FROM ASSOCIATES
Security Papers Limited 9.3 301,836 195,048
SICPA Inks Pakistan (Private) Limited 9.2 260,617 186,739
562,453 381,787
35. TAXATION
Current - for the year 787,111 549,660
- prior year 11,997 (7,552)
799,108 542,108
Deferred 146,853 (7,496)
945,961 534,612
--------------------------------------------------------------------------------------------------------------------------------------------------------------------------------------------------------------------------------------------------------------------------------------------------------------------------------------------------------------------------------------------------------------------------------------------------------------------------------------------------------------------Rupees '000--------------------------------------------------------------------------------------------------------------------------------------------------------------------------------------------------------------------------------------------------------------------------------------------------------------------------------------------------------------------------------------------------------------------------------------------------------------------------------------------------------------------
--------------------------------------------------------------------------------------------------------------------------------------------------------------------------------------------------------------------------------------------------------------------------------------------------------------------------------------------------------------------------------------------------------------------------------------------------------------------------------------------------------------------Rupees '000--------------------------------------------------------------------------------------------------------------------------------------------------------------------------------------------------------------------------------------------------------------------------------------------------------------------------------------------------------------------------------------------------------------------------------------------------------------------------------------------------------------------
These amounts have been netted off against share of other income aggregating Rs 30.960 million
relating to NSPC.
Financial Statements of PSPC
269

35.1 Relationship between tax expense and accounting profit
Note 2017 2016
(Represented
Note 2)
Profit before taxation form continuing operations 2,990,899 1,911,080
Profit before taxation form discontinued operations 929,540 1,498,665
Profit before taxation 3,920,439 3,409,745
Tax applicable at the rate of 31% (2016: 32%) 1,215,336 1,091,118
Difference in effective tax rate of equity-accounted investees (103,719) (74,446)
Tax effect of income taxed at lower rates (27,148) (34,962)
Tax credits (43,262) (37,421)
Tax effect of change in tax rate for next year 18,732 36,318
Tax effects of notional expenses allowed on rental income (532) (499)
Super tax 106,167 113,438
1,165,574 1,093,546
Prior year tax effect 11,997 (7,552)
1,177,571 1,085,994
35.1.1 Tax from continuing operations 35 945,961 534,612
Tax from discontinued operations 36 231,610 551,382
1,177,571 1,085,994
36. DISCONTINUED OPERATIONS
36.1
Note March 31
2017
Rupees '000
Assets attributable to discontinued operations
Property, plant and equipment 332,098
Intangibles 147
Long term loans 19,051
Long term deposits 294
Deferred taxation 327,991
Stores and spares - net 82,545
Stock-in-trade - net 857,679
Loans and advances 2,177
Trade deposits and prepayments 15,260
Trade debts - net 36.3 1,708,503
Cash and bank balances 1,000,000
4,345,745
Liabilities associated with discontinued operations
Deferred liabilities 1,038,490
Trade and other payables 36.3 458,323
Liabilities against asset subject to finance lease 36.3 1,134
1,497,947
Net assets attributable to discontinued operations 2,847,798
36.2
36.3
State Bank of Pakistan Annual Report FY17
These balances have been settled through current account i.e. payable to NSPC.
As explained in note 2, during the year the Corporation transferred its Non-Currency business to its
subsidiary i.e. NSPC. As a result, assets and liabilities of the Non-Currency business have been
classified as assets and liabilities attributable to discontinued operations in these financial statements, a
summary of which is as follows:
--------------------------------------------------------------------------------------------------------------------------------------------------------------------------------------------------------------------------------------------------------------------------------------------------------------------------------------------------------------------------------------------------------------------------------------------------------------------------------------------------------------------Rupees '000--------------------------------------------------------------------------------------------------------------------------------------------------------------------------------------------------------------------------------------------------------------------------------------------------------------------------------------------------------------------------------------------------------------------------------------------------------------------------------------------------------------------
In addition to the aforementioned net assets of Rs 2,847.798 million, the Corporation had committed
amounts of Rs 1 million and Rs 3,898.919 million as investment in share capital and working capital
arrangement for NSPC which has been settled through cash and the current account, respectively.
270

For the
period from
July 1, 2016
to March 31,
2017
For the year
from July 1,
2015 to June
30, 2016
Financial performance of discontinued operations
Sales 2,426,024 3,984,610
Sales tax (369,367) (561,802)
Net sales 2,056,657 3,422,808
Cost of sales (940,659) (1,395,507)
Gross profit 1,115,998 2,027,301
Administrative expenses (142,533) (447,948)
Other expenses (48,878) (81,189)
Other income 4,953 501
(186,458) (528,636)
Profit before taxation 929,540 1,498,665
Taxation (231,610) (551,382) Profit after taxation 697,930 947,283
Cash flow relating to discontinued operations
Net cash generated from operating activities 2,044,957 1,884,706
Net cash used in investing activities (19,204) 346,534
Net cash used in financing activities (3,285) (1,575)
37. EARNINGS PER SHARE 2017 2016
Profit after taxation from continuing operations 2,044,938 1,376,468
Profit after taxation from discontinued operations 697,930 947,283
Weighted average number of ordinary shares
outstanding during the year 1,000,000 1,000,000
Earnings per share - continuing operations 2,045 1,377
Earnings per share - discontinued operations 698 947
There are no dilutive potential ordinary shares outstanding as at June 30, 2017 or 2016.
38. TRANSACTIONS AND BALANCES WITH RELATED PARTIES
38.1
38.2
2017 2016
Transactions with parent / common control
and directorship - note 38.8
Sale of bank notes 9,397,810 7,558,827
Sale of prize bonds 78,382 227,463
Charge of staff deputed at the Corporation 941 -
--------------------------------------------------------------------------------------------------------------------------------------------------------------------------------------------------------------------------------------------------------------------------------------------------------------------------------------------------------------------------------------------------------------------------------------------------------------------------------------------------------------------Rupees '000--------------------------------------------------------------------------------------------------------------------------------------------------------------------------------------------------------------------------------------------------------------------------------------------------------------------------------------------------------------------------------------------------------------------------------------------------------------------------------------------------------------------
Financial Statements of PSPC
--------------------------------------------------------------------------------------------------------------------------------------------------------------------------------------------------------------------------------------------------------------------------------------------------------------------------------------------------------------------------------------------------------------------------------------------------------------------------------------------------------------------Rupees '000--------------------------------------------------------------------------------------------------------------------------------------------------------------------------------------------------------------------------------------------------------------------------------------------------------------------------------------------------------------------------------------------------------------------------------------------------------------------------------------------------------------------
Related parties comprise of parent i.e. State Bank of Pakistan associates [Security Papers Limited and
SICPA Inks Pakistan (Private) Limited], entities under common control / directorship, employee benefit
plans and key management personnel of the Corporation.
--------------------------------------------------------------------------------------------------------------------------------------------------------------------------------------------------------------------------------------------------------------------------------------------------------------------------------------------------------------------------------------------------------------------------------------------------------------------------------------------------------------------Rupees '000--------------------------------------------------------------------------------------------------------------------------------------------------------------------------------------------------------------------------------------------------------------------------------------------------------------------------------------------------------------------------------------------------------------------------------------------------------------------------------------------------------------------
--------------------------------------------------------------------------------------------------------------------------------------------------------------------------------------------------------------------------------------------------------------------------------------------------------------------------------------------------------------------------------------------------------------------------------------------------------------------------------------------------------------------Rupees--------------------------------------------------------------------------------------------------------------------------------------------------------------------------------------------------------------------------------------------------------------------------------------------------------------------------------------------------------------------------------------------------------------------------------------------------------------------------------------------------------------------
--------------------------------------------------(No. of Shares)--------------------------------------------------
Significant transactions with related parties other than those specifically included in investment in
associates (note 9), other long term investments (note 10), transactions with employee's pension fund
(note 26), cost of sales (note 29), administrative expenses (note 30), other income (note 32) are as
follows:
271

2017 2016
Transactions with associated undertakings
Purchase of paper from Security Papers Limited 2,835,186 2,437,617
Sharing of group pool expenses with Security Papers Limited 30,826 36,236
Purchase of ink from SICPA Inks Pakistan (Private) Limited 2,236,563 1,983,411
Share of group pool expenses with SICPA Inks
Pakistan (Private) Limited 2,015 2,062
Transactions with entities under common control /
directorship
Expenses borne on behalf of NSPC 707,772 -
Investment in subsidiary 6,066,879 -
Sale of postal and non-postal-items to Director General
Pakistan Post Office 599,744 674,246
Sale of passports to Director General Immigration and
Passports 1,368,802 1,524,889
Sale of ballot papers to Election Commission of Pakistan - 324,577
Sale of census form to Pakistan Bureau of Statistics 199,752 -
Transactions with Government of Pakistan
Maturity of PIBs 200,000 -
Markup income 11,675 36,536
Key management personnel
38.3
38.4
38.5
38.6
38.7
Managing
Director
Managing
Director
Directors
Directors' fee - 3,254
Managerial remuneration 4,435 4,814 -
Bonus 974 861 -
Ex-gratia 2,033 768 -
Staff retirement benefits 269 233 -
Medical expenses 319 527 -
Others 1,180 1,782 300
9,210 8,985 3,554
1 1 3
38.8
-
The related party status of outstanding balances as at June 30, 2017 is included in notes 9, 10, 16.1, 19,
26 and 27. These are to be settled in the ordinary course of business.
-
State Bank of Pakistan Annual Report FY17
-
-
Upto June 13, 2017, State Bank of Pakistan was a related party of the Corporation because of the
common control / directorship.
Transactions with employee benefit funds are carried out based on the terms of employment of the
employees and according to the actuarial advice (note 26).
Key management personnel are those persons having authority and responsibility for planning, directing
and controlling the activities of the Corporation. The Corporation considers its Chief Executive /
Managing Director and all its directors as its key management personnel. There are 6 directors (2016: 4
directors) of the Corporation including the Managing Director.
All sales transactions with State Bank of Pakistan, Director General Pakistan Post Office and Director
General Immigration and Passports are carried out by the Corporation using the "Cost Plus Mark-up
Method" approved by the Ministry of Finance. All other transactions with related parties are entered on
mutually agreed terms.
2016
630
Note 38.7
-
Remuneration of the Managing Director and Directors of the Corporation is as follows:
Number of persons 3
--------------------------------------------------------------------------------------------------------------------------------------------------------------------------------------------------------------------------------------------------------------------------------------------------------------------------------------------------------------------------------------------------------------------------------------------------------------------------------------------------------------------Rupees '000--------------------------------------------------------------------------------------------------------------------------------------------------------------------------------------------------------------------------------------------------------------------------------------------------------------------------------------------------------------------------------------------------------------------------------------------------------------------------------------------------------------------
6,039
2017
--------------------------------------------------------------------------------------------------------------------------------------------------------------------------------------------------------------------------------------------------------------------------------------------------------------------------------------------------------------------------------------------------------------------------------------------------------------------------------------------------------------------Rupees '000--------------------------------------------------------------------------------------------------------------------------------------------------------------------------------------------------------------------------------------------------------------------------------------------------------------------------------------------------------------------------------------------------------------------------------------------------------------------------------------------------------------------
-
Directors
5,409
272

39. RUNNING FINANCE - unavailed
40. CASH GENERATED FROM OPERATIONS
Note 2017 2016
Profit before taxation from continuing and discontinued 3,920,439 3,409,745
operations
Adjustments for non cash items and other items:
Depreciation 185,667 520,835
Gain on disposal of operating fixed assets (1,361) (879)
Gain on remeasurement of short term investments (186,904) (97,779)
Expense for pension fund 359,782 642,232
Mark-up on bank deposits (439,082) (336,449)
Return on investment in Pakistan Investment Bonds (11,675) (36,536)
Share of profit from associates (562,453) (381,787)
Provision for doubtful debts - net 35,162 248,438
Provision for slow moving and obsolete stock-in-trade
and stores and spares - net 3,745 1,440
Amortisation 252 406
Financial charges on leased vehicles 1,143 1,355
Gain / (loss) on sale of investments (30,148) 2,359
Service charges on long term loans (2,202) (1,855)
Bonus / dividend income (20,130) (15,730)
Working capital changes 40.1 (231,001) (830,047)
3,021,234 3,125,748
40.1 Working capital changes
(Increase) / decrease in current assets
Stores and spares (1,845) (9,435)
Stock-in-trade (415,615) (586,712)
Trade debts 755,145 (300,470)
Loans and advances (9,451) (6,526)
Trade deposits and prepayments (6,108) (10,858)
Other receivables (1,720,650) (7,216)
(1,398,524) (921,217)
(Decrease) / increase in current liabilities
Trade and other payables 475,799 91,567
Payable to NSPC 691,766 -
Accrued mark-up (42) (397)
1,167,523 91,170
(231,001) (830,047)
40.2
41. CASH AND CASH EQUIVALENTS
Loans and receivables - Term deposit receipts with
contractual maturity of less than three months 20 - 1,500,000
Cash and bank balances 21 1,275,911 1,787,567
1,275,911 3,287,567
Cashflow statement has been prepared on an aggregate basis for continuing and discontinued
operations for the year ended June 30, 2017.
Financial Statements of PSPC
--------------------------------------------------------------------------------------------------------------------------------------------------------------------------------------------------------------------------------------------------------------------------------------------------------------------------------------------------------------------------------------------------------------------------------------------------------------------------------------------------------------------Rupees '000--------------------------------------------------------------------------------------------------------------------------------------------------------------------------------------------------------------------------------------------------------------------------------------------------------------------------------------------------------------------------------------------------------------------------------------------------------------------------------------------------------------------
The Corporation has a short-term running finance facility available from Bank Al-Habib Limited which is
secured by way of a registered hypothecation charge against its receivable from SBP (see note 16.7).
The facility amounts to Rs 250 million (2016: Rs 250 million) and the rate of mark-up is three months
average KIBOR (2016: KIBOR).
273

42. FINANCIAL INSTRUMENTS BY CATEGORY
2017 2016
FINANCIAL ASSETS
Loans and receivables at amortised cost
Long term loans 96,168 61,626
Long-term deposits 12,836 13,176
Trade debts 1,702,777 2,493,084
Loans 10,650 6,485
Trade deposits - 8,858
Accrued mark-up 90,233 91,708
Other receivables 1,735,776 23,386
Short term investments 6,122,000 4,822,000
Cash and bank balances 1,275,911 1,787,567
11,046,351 9,307,890
Fair value through profit or loss
Short term investments 1,582,086 1,265,047
Available-for-sale
Other long-term investments - Al Hamra Islamic Stock Fund 27,164 21,197
Held-to-maturity
Other long-term investments - Pakistan Investment Bonds 99,955 298,930
12,755,556 10,893,064
FINANCIAL LIABILITIES
Financial liabilities at amortised cost
Liabilities against assets subject to finance leases 16,834 25,474
Trade and other payables 1,300,216 1,431,601
Payable to NSPC 5,774,651 -
Accrued mark-up 70 112
7,091,771 1,457,187
43. FINANCIAL INSTRUMENTS AND RELATED DISCLOSURES
43.1
43.1.1 Credit risk and concentration of credit risk
Out of the total financial assets of Rs 12,755.556 million (2016: Rs 10,893.064 million), the financial assets
that are subject to credit risk amounted to Rs 12,649.105 million (2016: Rs 10,563.614 million).
The analysis below summarises the credit quality of the Corporation's financial assets as at June 30,
2017 / 2016.
Credit risk represents the accounting loss that would be recognised at the reporting date if counter
parties fail to perform as contracted.
The Corporation’s activities expose it to certain financial risks. Such financial risks emanate from
various factors that include, but not limited to credit risk, liquidity risk and market risk. The Corporation’s
overall risk management focuses on the unpredictability of financial markets and seeks to minimise
potential adverse effects on the Corporation’s financial performance. Risks measured and managed by
the Corporation are explained in notes 43.1.1, 43.1.2 and 43.1.3 below:
--------------------------------------------------------------------------------------------------------------------------------------------------------------------------------------------------------------------------------------------------------------------------------------------------------------------------------------------------------------------------------------------------------------------------------------------------------------------------------------------------------------------Rupees '000--------------------------------------------------------------------------------------------------------------------------------------------------------------------------------------------------------------------------------------------------------------------------------------------------------------------------------------------------------------------------------------------------------------------------------------------------------------------------------------------------------------------
State Bank of Pakistan Annual Report FY17
274

The bank balances along with credit ratings are tabulated below:
2017 2016
A-1+ 1,269,415 1,757,047
AM1+ 854,383 -
AM2+ 589,439 -
AM2 - 137,194
AM2++ 138,264 1,127,853
1,582,086 1,265,047
43.1.2 Liquidity risk
Maturity
within one
year
Maturity after
one year
Total
h
Liabilities against assets subject to finance leases 5,890 13,347 19,237
Trade and other payables 1,300,216 - 1,300,216
Payable to NSPC 5,774,651 - 5,774,651
Accrued mark-up 70 - 70
7,080,827 13,347 7,094,174
Liabilities against assets subject to finance leases 9,141 18,890 28,031
Trade and other payables 1,408,873 - 1,408,873
Accrued mark-up 112 - 112
1,418,126 18,890 1,437,016
June 30, 2017
Credit ratings
Credit ratings
Financial Statements of PSPC
Term deposit receipts of the Corporation as at June 30, 2017 are kept with commercial banks having
minimum credit rating of A-1.
As at June 30, 2017, trade debts balance is with State Bank of Pakistan, the parent company.
Accordingly the credit risk is minimal. Debtors of NSPC classified in other receivables balance are
primarily with government units, therefore the risk is minimal.
--------------------------------------------------------------------------------------------------------------------------------------------------------------------------------------------------------------------------------------------------------------------------------------------------------------------------------------------------------------------------------------------------------------------------------------------------------------------------------------------------------------------Rupees '000--------------------------------------------------------------------------------------------------------------------------------------------------------------------------------------------------------------------------------------------------------------------------------------------------------------------------------------------------------------------------------------------------------------------------------------------------------------------------------------------------------------------
The management forecasts the liquidity of the Corporation on basis of expected cash flow considering
the level of liquid assets necessary to meet such risk.
Liquidity risk is the risk that an enterprise will encounter difficulties in raising funds to meet
commitments associated with financial instruments. The management believes that it is not exposed to
any significant level of liquidity risk.
--------------------------------------------------------------------------------------------------------------------------------------------------------------------------------------------------------------------------------------------------------------------------------------------------------------------------------------------------------------------------------------------------------------------------------------------------------------------------------------------------------------------Rupees '000--------------------------------------------------------------------------------------------------------------------------------------------------------------------------------------------------------------------------------------------------------------------------------------------------------------------------------------------------------------------------------------------------------------------------------------------------------------------------------------------------------------------
The analysis of credit rating of short term investments is as follows:
June 30, 2016
Financial liabilities
Financial liabilities
Financial liabilities in accordance with their contractual maturities are presented below:
275
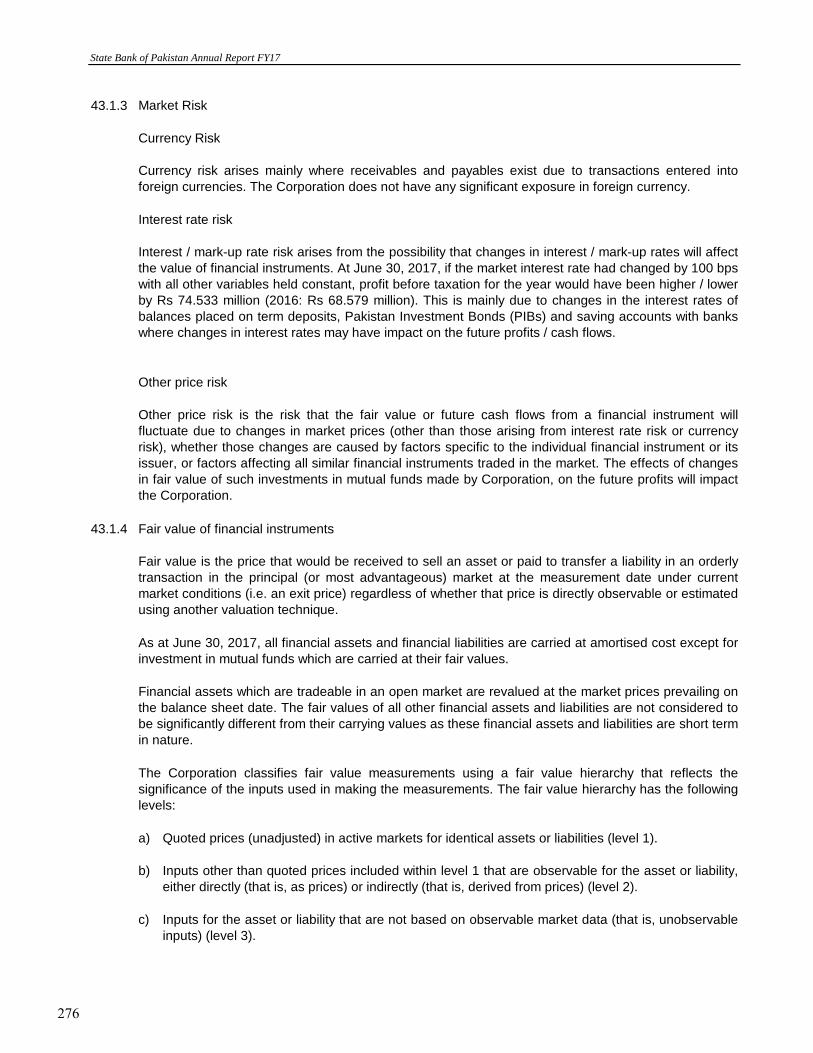
43.1.3
Currency Risk
Interest rate risk
Other price risk
43.1.4 Fair value of financial instruments
a)
b)
c)
State Bank of Pakistan Annual Report FY17
The Corporation classifies fair value measurements using a fair value hierarchy that reflects the
significance of the inputs used in making the measurements. The fair value hierarchy has the following
levels:
Quoted prices (unadjusted) in active markets for identical assets or liabilities (level 1).
Inputs other than quoted prices included within level 1 that are observable for the asset or liability,
either directly (that is, as prices) or indirectly (that is, derived from prices) (level 2).
Inputs for the asset or liability that are not based on observable market data (that is, unobservable
inputs) (level 3).
Market Risk
Currency risk arises mainly where receivables and payables exist due to transactions entered into
foreign currencies. The Corporation does not have any significant exposure in foreign currency.
Other price risk is the risk that the fair value or future cash flows from a financial instrument will
fluctuate due to changes in market prices (other than those arising from interest rate risk or currency
risk), whether those changes are caused by factors specific to the individual financial instrument or its
issuer, or factors affecting all similar financial instruments traded in the market. The effects of changes
in fair value of such investments in mutual funds made by Corporation, on the future profits will impact
the Corporation.
Interest / mark-up rate risk arises from the possibility that changes in interest / mark-up rates will affect
the value of financial instruments. At June 30, 2017, if the market interest rate had changed by 100 bps
with all other variables held constant, profit before taxation for the year would have been higher / lower
by Rs 74.533 million (2016: Rs 68.579 million). This is mainly due to changes in the interest rates of
balances placed on term deposits, Pakistan Investment Bonds (PIBs) and saving accounts with banks
where changes in interest rates may have impact on the future profits / cash flows.
Fair value is the price that would be received to sell an asset or paid to transfer a liability in an orderly
transaction in the principal (or most advantageous) market at the measurement date under current
market conditions (i.e. an exit price) regardless of whether that price is directly observable or estimated
using another valuation technique.
As at June 30, 2017, all financial assets and financial liabilities are carried at amortised cost except for
investment in mutual funds which are carried at their fair values.
Financial assets which are tradeable in an open market are revalued at the market prices prevailing on
the balance sheet date. The fair values of all other financial assets and liabilities are not considered to
be significantly different from their carrying values as these financial assets and liabilities are short term
in nature.
276

There were no transfers between level 1, 2 or 3 of the fair value hierarchy during the year.
The valuation techniques used are as follows:
Level 1: Quoted prices (unadjusted) in active markets
Financial assets
Level 1 Level 2 Level 3 Total
Short term investments - at fair value through
profit and loss 1,582,086 - - 1,582,086
Investments - Available-for-sale 27,164 - 27,164
1,609,250 - - 1,609,250
Financial assets
Level 1 Level 2 Level 3 Total
Short term investments - at fair value through
profit and loss 1,265,047 - - 1,265,047
Investments - Available-for-sale 21,197 - 21,197
1,286,244 - - 1,286,244
44. CAPITAL RISK MANAGEMENT
45. PLANT CAPACITY AND ACTUAL PRODUCTION
2017 2016
(Represented
Note 2)
Actual production 105,992 92,223
Due to nature of business of the Corporation, installed capacity is not relevant.
Financial Statements of PSPC
The fair value of financial instruments traded in active markets is based on Net Asset Values (NAVs) of
the units of the mutual funds at the reporting date. A market is regarded as active when it is a market in
which transactions for the asset or liability take place with sufficient frequency and volume to provide
pricing information on an ongoing basis.
Level 2: Inputs other than quoted prices included within level 1 that are observable.
Level 3 fair values for debt securities are determined using a discounted cash flow technique, which
uses expected cash flows and a market-related discount rate (PKRV rates for the purpose).
--------------------------Rupees '000--------------------------
The following table analysis within the fair value hierarchy of the Corporation's financial assets (by
class) measured at fair value at June 30, 2017:
2017
--------------------------Rupees '000--------------------------
2016
The Corporation’s objectives when managing capital are to safeguard the Corporation’s ability to
continue as a going concern in order to provide returns for shareholders and benefits for other
stakeholders and to maintain an optimal capital structure.
In order to maintain or adjust the capital structure, the Corporation may adjust the amount of dividends
paid to shareholders, return capital to shareholders or issue new shares or sell assets to reduce debt.
As at June 30, 2017 and 2016, the Corporation had surplus reserves to meet its requirements.
-------------Reams-------------
277

46. PROVIDENT FUND RELATED DISCLOSURES
2017 2016
Size of the fund - Total assets 137,094 739,153
Cost of investments made 137,094 737,378
Percentage of investments made 100% 100%
Fair value of investments 137,094 739,153
The break-up of fair value of investments is:
Rupees '000 ----%---- Rupees '000 ----%----
Bank balances 137,094 100% 712,379 96.38%
Mutual funds - 0% 26,774 3.62%
137,094 100% 739,153 100%
47. NUMBER OF EMPLOYEES
2017 2016
Average number of employees during the year 952 1,056
Number of employees as at June 30 778 1,031
Unaudited
The fund was constituted under the Provident Fund Rules of the Corporation being a contributory
provident fund on August 8, 1963. However, the Ministry of Finance approved the establishment of
Employees' Pension Fund with effect from November 1, 1993 as a replacement of the contributory
provident fund. The provident fund has subsequently been converted to a non-contributory fund in
which contributions are only made by the members at a minimum of 8.33 % of half of their
consolidated pay.
During the year ended June 30, 2016, a meeting was held among the trustees of the PSPC Provident
Fund on April 1, 2016 in which the majority of the trustees including the chairman of the fund agreed
to close the fund with the immediate effect and with the consent of all members. Further during the
year, Corporation realised all the investment and distributed among the members of fund with the
exception of profit accrued on those investment which has been placed in the bank account.
The following information is based on latest un-audited financial statements of the fund:
--------------------------------------------------------------------------------------------------------------------------------------------------------------------------------------------------------------------------------------------------------------------------------------------------------------------------------------------------------------------------------------------------------------------------------------------------------------------------------------------------------------------Rupees '000--------------------------------------------------------------------------------------------------------------------------------------------------------------------------------------------------------------------------------------------------------------------------------------------------------------------------------------------------------------------------------------------------------------------------------------------------------------------------------------------------------------------
The total and average number of employees during the year and as at June 30, 2017 and 2016
respectively are as follows:
----------No of employees----------
2017 2016
The investments out of provident fund were made in accordance with the provisions of Section 227 of
the Companies Ordinance, 1984 and the rules formulated for this purpose.
State Bank of Pakistan Annual Report FY17
278
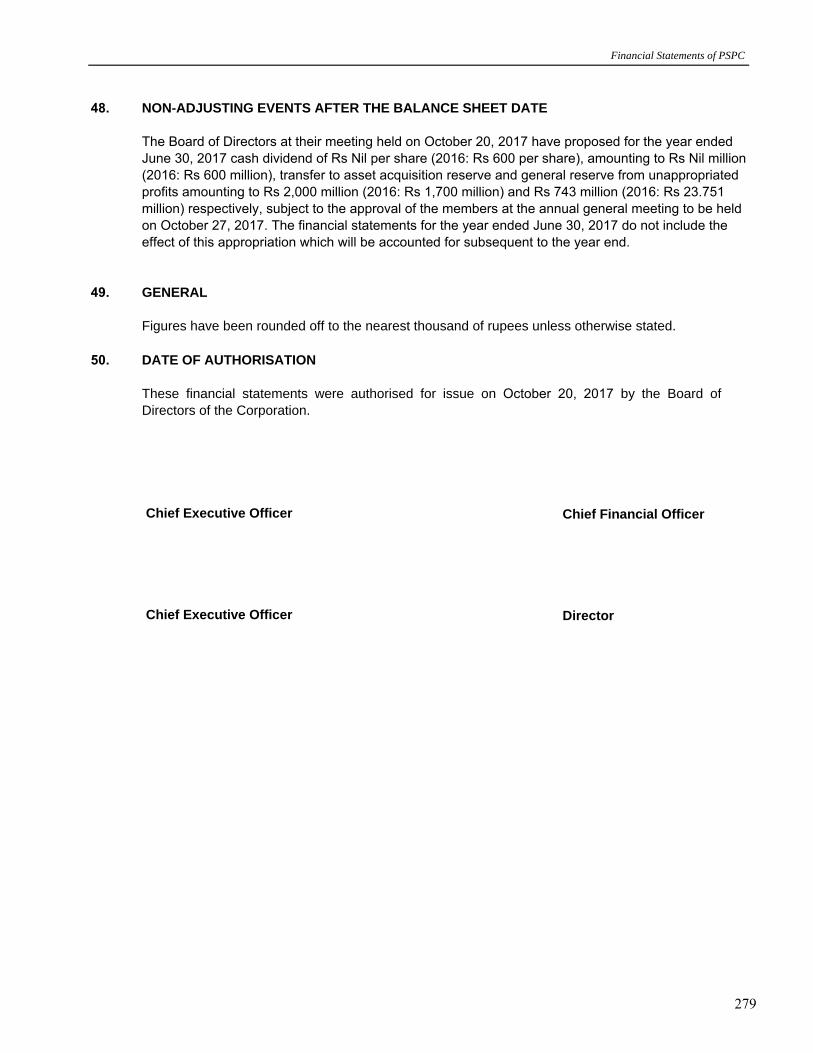
Chief Executive Officer Chief Financial Officer
Chief Executive Officer Director
48. NON-ADJUSTING EVENTS AFTER THE BALANCE SHEET DATE
The Board of Directors at their meeting held on October 20, 2017 have proposed for the year ended June 30, 2017 cash dividend of Rs Nil per share (2016: Rs 600 per share), amounting to Rs Nil million (2016: Rs 600 million), transfer to asset acquisition reserve and general reserve from unappropriated profits amounting to Rs 2,000 million (2016: Rs 1,700 million) and Rs 743 million (2016: Rs 23.751 million) respectively, subject to the approval of the members at the annual general meeting to be held on October 27, 2017. The financial statements for the year ended June 30, 2017 do not include the effect of this appropriation which will be accounted for subsequent to the year end.
49. GENERAL
Figures have been rounded off to the nearest thousand of rupees unless otherwise stated.
50. DATE OF AUTHORISATION
These financial statements were authorised for issue on October 20, 2017 by the Board of Directors of the Corporation.
Financial Statements of PSPC
279

1
A Chronology of Important Policy Announcements
A-1 Banking Policy & Supervision Group Guidelines for Conversion of a Conventional Bank into an Islamic Bank: In order to promote
Islamic banking and facilitate banks desirous of converting their entire banking operations from
conventional to Islamic, SBP has developed detailed guidelines for conversion of a conventional
bank into an Islamic bank. The guidelines include eligibility criteria, necessary measures / process
including In-principle approval to start conversion process, conversion of existing conventional
banking branches into Islamic banking and issuance of full-fledged Islamic Bank license (IBD
Circular No.1 dated July 6, 2016).
Revised Prudential Regulations for Consumer Financing: In order to align the Prudential
Regulations for consumer financing with changing business environment and international best
practices; the SBP in consultation with the banks/DFIs, has revised the Prudential Regulations for
Consumer Financing which prescribe minimum benchmarks in critical risk and operational areas
and aimed at promoting consumer financing in sustainable and fair manner while ensuring the
financial stability (BPRD Circular No.10 dated August 3, 2016).
Guidelines on Performance Evaluation of Board of Directors: To keep pace with the ever
changing business environment and to align our regulatory regime with best international
practices, “Guidelines on Performance Evaluation of Board of Directors” have been developed.
These guidelines are meant to facilitate the Board of Directors to carry out their performance
evaluation including individual board members and committees. The guidelines provide basic
mechanism, techniques and approaches to be incorporated in performance evaluation model of
each bank/DFI. Henceforth, the Board of Directors shall annually conduct their performance
evaluation whereas the same should be undertaken by an external independent evaluator at least
once in every three years. The chairman of the Board of Directors shall be responsible for the
implementation of these guidelines with immediate effect (BPRD Circular No.11 dated August 22,
2016).
Guidelines for Training and Development of Bank Employees: In order to establish a continuous
learning atmosphere and encourage the banks to enhance the overall capacity of their employees,
banks are advised to implement the specific parameters / guidelines which include to prepare a
comprehensive training and development policy embodied in the strategic plans led by the
Human Resources Committee of the Board alongwith allocation of specific budget for training and
development (BPRD Circular No.12 dated September 30, 2016).
Conduct Assessment Framework for Banks: To promote the concept of responsible banking, a
Conduct Assessment Framework (CAF) effective from January 1, 2107 was introduced for self
assessment by the banks. The banks are required to undertake their assessment as of 31st
December on an annual basis The CAF would develop a periodic, reliable, diagnostic and
comparable mechanism which will help banks to deliver their commitment to Fair Treatment of
Consumers (FTC) Framework in an optimum manner and manage their Conduct Risk (BC&CPD
Circular No.3 dated November 4, 2016).

State Bank of Pakistan Annual Report FY17
2
External Shari’ah Audit-Shari’ah Governance Framework for Islamic Banking Institutions (IBIs):
The SBP after consultation with and feedback received from various stakeholders, has issued
instructions on the External Shari’ah Audit which stipulates instruction regarding Shari’ah Board
members of IBIs, capacity building of staff conducting Shari’ah audit, a Fit and Proper Criteria
(FAPC) for Shari’ah scholars to be engaged for external Shari’ah audit of IBIs, review and
provide opinion on bank’s pool management practices & IT based system. As per instructions,
Shari’ah Compliance Department of the IBI shall be responsible to verify distribution of profit
and loss to the depositors prior to its disbursement. The Institute of Chartered Accountants of
Pakistan (ICAP) may develop comprehensive guidelines to conduct external Shari’ah Audit in
consultation with external Audit firms (IBD Circular Letter No.1 dated March 27, 2017).
Enterprise Technology Governance & Risk Management Framework for Financial Institutions:
With a vision to provide baseline technology governance and risk management principles to
Financial Institutions, SBP developed a framework on ‘Enterprise Technology Governance & Risk
Management in Financial Institutions’. The framework which included guidelines on development
of information/cyber security management framework, IT services delivery & operations
management, acquisition & implementation of IT systems, business continuity & disaster recovery
and IT audit (BPRD Circular No.5 dated May 30, 2017).
A-2 Development Finance Group
Soft Loans under Prime Minister’s National Health Program (PMNHP): In order to facilitate the
private hospitals enrolled under the Prime Minister’s National Health Program (PMNHP), a
scheme of soft loan was launched for upgradation of their facilities including equipment purchase,
operation theatre up-gradation and improvement in emergency services for provision of better
treatment services to the poorest segments of population (IH&SMEFD Circular No. 5 dated July
15, 2016).
Prudential Regulations for Infrastructure Project Financing (IPF): With a view to promote
infrastructure financing in Pakistan, the SBP issued Prudential Regulations for Infrastructure
Project Financing containing regulations regarding credit appraisal, collateral arrangements,
security package and regulatory compliance (IH&SMEFD Circular No. 6 dated December 30,
2016).
Revised Prudential Regulations for Housing Finance: With the aim to further facilitate the
promotion of Housing Finance, Prudential Regulations (PRs) for Housing Finance have been
revised in consultation with the stakeholders which include Regulations regarding Development of
Financing Documents, Information Disclosure, Facilities to Related Persons, Types of Housing
Finance, Debt Burden Ratio and Property Assessment (IH&SMEFD Circular No. 3 dated April
18, 2017).
A-3 Financial Market/Reserve Management Group
Amendment in the Foreign Exchange Regulation Act, 1947: The amendment in Foreign Exchange
Regulation Act (FERA), 1947 proposed by SBP has been passed by the Parliament and the related
Notification stands issued on July 27, 2016. The amendment empowers SBP to impose monetary
penalty on its regulatees for violation of foreign exchange rules/regulations or instructions issued
there under. As a result of the above empowerment, SBP would be able to effectively administer
the foreign exchange business of authorized dealers and exchange companies in Pakistan (FE
circular letter No. 11 dated October 07, 2016).

Chronology of Important Policy Announcements
3
Reduction of SLR for Islamic Banks/Branches: While resolving the issue of liquidity management
being faced by Islamic banks, SBP reduced their SLR requirement. Effective from November 17,
2016, all Islamic banks/Islamic banking branches will maintain SLR of 14% (excluding CRR) of
total demand liabilities (including time deposits with tenor of less than 1 year). Time liabilities
(including time deposits with tenor of 1 year and above) will not require any SLR (DMMD
circular No. 16, November 15, 2016).
Monthly Statements of Onshore/Offshore Foreign Currency Accounts and Reporting of Capital
Account Transactions: To comply with latest guidelines of International Monetary Fund on
Balance of Payment and International Investment Position, SBP has simplified the reporting and
registration / acknowledgement procedures of foreign private loans along with segregation of
China Pakistan Economic Corridor projects (CPEC). This regulation has enabled effective
assessment of foreign exchange implications of CPEC related foreign loans for the country (EPD
circular letter No.14 dated December 07, 2016).
Registration of Export of Securities against Foreign Direct Investment: In order to promote the
culture of documented economy in the country with reference to export of securities
(Issue/Transfer) to non-resident investors against their investment into Pakistan (FDI-Inward),
SBP has enhanced the regulatory due diligence. The instructions will also facilitate real investors
and discourage money launderers to channelize their funds as foreign investment in Pakistan (EPD
circular letter No. 06 dated February 24, 2017).
A-4 Operations and Financial Resource Management Group
Public Awareness regarding Demonetization of Old Design and Bigger Size Banknotes: In order
to enhance public awareness about demonetization and exchange of old design banknotes, SBP
advised banks to display the last date of exchange of old design banknotes in their branches, as a
slide show on ATM machines, on the homepage of their websites and to place banknote
demonetization video on their websites and also play the video on the TV monitors in waiting
areas of their branches (FD Circular letter No. 06 dated November 15, 2016).
Direct Membership of RTGS for Islamic Banking Branches of Conventional Banks: In order to
improve the efficiency of the financial services of the Banking System and to enhance the
outreach of electronic transfer of large value funds, SBP allowed direct membership of RTGS
(PRISM) System to Islamic Banking Branches (IBBs) of Conventional Banks. The PRISM
Participants having Islamic Banking Branches (IBBs) were allowed to establish a separate PRISM
setup for their RTGS operations (PSD Circular No. 06 dated December 5, 2016).
Clearinghouse Membership for Central Directorate of National Savings (CDNS): To facilitate the
investors of CDNS, it has been allowed direct membership of Clearinghouse (NIFT) with effect
from January 12, 2017. The banks are advised to accept at their counters, the profit coupon /
withdrawals slips pertaining to CDNS schemes and to properly endorse such instrument before
submission to NIFT for clearing (PSD Circular No. 01 dated January 11, 2017).
Banknotes Packing Instructions: In order to ensure that the cash to be traded in the interbank
market and/or surrendered to SBP under the SBP Currency Management Strategy is packed
properly, uniformly and consistently, SBP issued instructions to banks regarding Preparation of
Banknote Packets /bundles, transportation mechanism, Interbank Trading of Cash and deposit
with SBP (FD Circular No. 02 dated March 10, 2017).
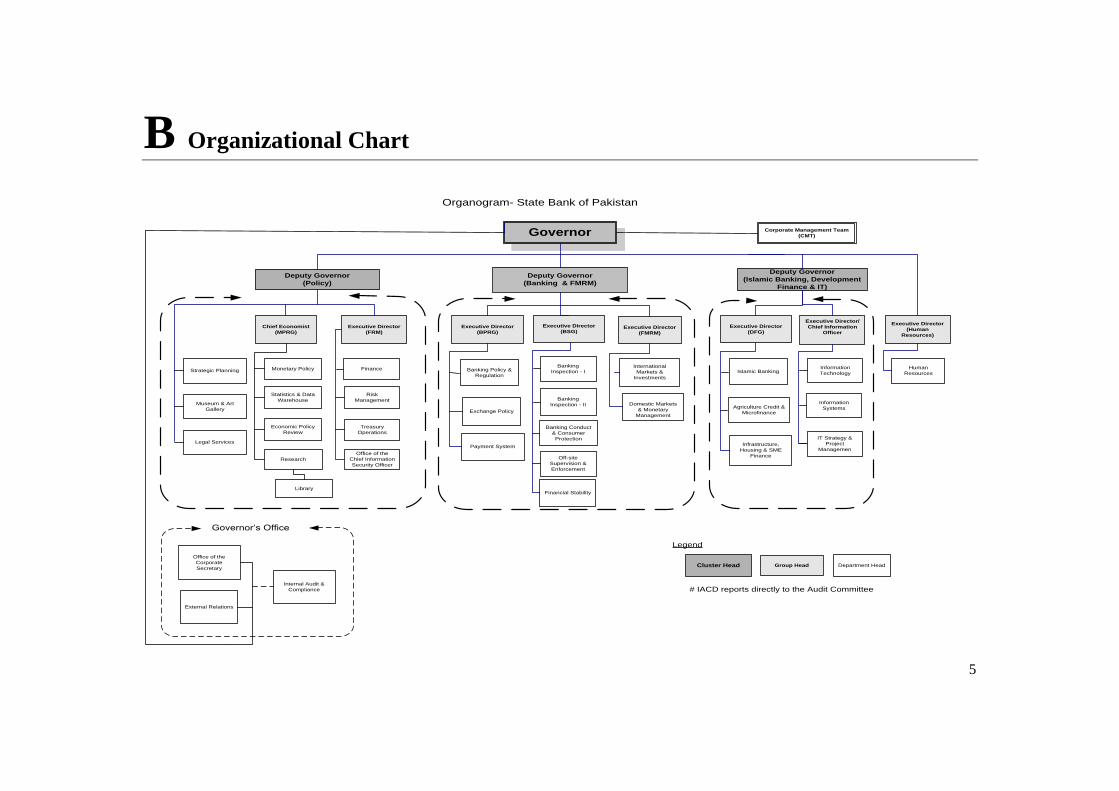
5
B Organizational Chart
Governor Corporate Management Team
(CMT)
Deputy Governor
(Policy)
International
Markets &
Investments
Domestic Markets
& Monetary
Management
Office of the
Corporate
Secretary
Agriculture Credit &
Microfinance
External Relations
Internal Audit &
Compliance
Infrastructure,
Housing & SME
Finance
Strategic Planning Islamic Banking
Statistics & Data
Warehouse
Monetary Policy
Economic Policy
Review
Research
Library
Chief Economist
(MPRG)Executive Director
(FMRM)
Executive Director
(DFG)
Deputy Governor
(Islamic Banking, Development
Finance & IT)
Legend
Cluster Head Group Head Department Head
# IACD reports directly to the Audit Committee
Governor’s Office
Organogram- State Bank of Pakistan
Executive Director
(BPRG)
Off-site
Supervision &
Enforcement
Banking Policy &
Regulation
Banking Conduct
& Consumer
Protection
Executive Director
(BSG)
Exchange Policy
Banking
Inspection - I
Banking
Inspection - II
Executive Director
(Human
Resources)
Human
Resources
Information
Technology
Executive Director/
Chief Information
Officer
Museum & Art
Gallery
Finance
Treasury
Operations
Executive Director
(FRM)
Risk
Management
Legal ServicesIT Strategy &
Project
Managemen
Information
Systems
Financial Stability
Office of the
Chief Information
Security Officer
Payment System
Deputy Governor
(Banking & FMRM)

7
C Management Directory*
Name Designation E-mail Phone
Governor/Deputy Governors
Mr. Tariq Bajwa Governor [email protected] 021-99212447
021-99212448
Mr. Riaz Riazuddin Deputy Governor
(Policy) [email protected] 021-99221535
Mr. Jameel Ahmad Deputy Governor
(Banking & FMRM) [email protected]
021-99212451
021-99212452
Executive Directors/Chief Economist
Mr. Amjad Manzoor ED /CIO [email protected] 021-99221551
Mr. Inayat Hussain ED – FRM, FS & BSG [email protected] 021-99221496
Mr. Muhammad Ali
Malik ED – FMRM
k 021-99221960
Dr. Saeed Ahmed CE/ED-HR [email protected] 021-99221285
Syed Irfan Ali ED – BPRG [email protected] 021-99221216
Mr. Riaz Nazar Ali
Chunara ED – IA&C [email protected] 021-99221519
Syed Samar Hasnain ED – DFG [email protected] 021-99221606
Managing Directors of SBP Subsidiaries
Mr. Amer Aziz MD – NIBAF [email protected] 051-9269833
Ms. Lubna Farooq
Malik MD – DPC [email protected] 021-99221602
Mr. Muhammad
Haroon Rasheed Malik MD – PS&PC [email protected] 021-99248683
Mr. Qasim Nawaz MD – SBP-BSC [email protected] 021-99221349
Directors/Head of Departments (HODs)
Mr. Abid Qamar Director – ERD [email protected] 021-99221979
Mr. Altaf Hussain Director – TOD [email protected] 021-99221177
Mr. Aniq Aziz Director – IMID [email protected] 021-99221962
Mr. Arshad Mehmood
Bhatti
Director – BID I & BID
II [email protected] 021-99221878
Mr. Asif Mahmood Director – SPD [email protected] 021-99221130
Mr. Asim Iqbal Director – ITS&PM [email protected] 021-99221249
Dr. Asma Ibrahim Director – M&AG [email protected] 021-99221011
Dr. Azizullah Khattak Director – S&DWD [email protected] 021-99221565

State Bank of Pakistan Annual Report FY17
8
Name Designation E-mail Phone
Mr. Fazal Mahmood Director – EPD [email protected] 021-99221459
Mr. Ghulam
Muhammad Abbasi Director – IBD [email protected] 021-99221414
Mr. Irfan Ismail Head – OSED [email protected] 021-99221965
Mr. Mohammad
Mansoor Ali Corporate Secretary [email protected] 021-99221522
Mr. Mohsin Rasheed Director – RMD [email protected] 021-99221110
Mr. Muhammad Akhtar
Javed Head – BPRD [email protected] 021-99221680
Mr. Muhammad Akmal Director – BC&CPD [email protected] 021-99221432
Dr. Muhammad Ali
Choudhary Director – MPD [email protected] 021-99221137
Mr. Muhammad Amin Director – ITD [email protected] 021-99221504
Mr. Muhammad Amin
Khan Lodhi Head – DMMD [email protected] 021-99221865
Dr. Muhammad Farooq
Arby Director – RD [email protected] 021-99221299
Mr. Muhammad Javaid
Ismail Director – FSD [email protected] 021-99221504
Mr. Nasser Jahangir
Khan
Chief Information
Security Officer [email protected] 021-99221145
Mr. Noor Ahmed Head – AC&MFD [email protected] 021-99221579
Dr. Omar Farooq Saqib Director – EP&RD [email protected] 021-99221161
Mr. Rahat Saeed Director – ISD [email protected] 021-99221245
Ms. Sahar. Z. Babar Director –HRD [email protected] 021-99221871
Mr. Saleem Ullah Director – Finance [email protected] 021-99221481
Mr. Shahid Mahmud
Khan Legal Advisor [email protected] 021-99221863
Syed Basit Aly Director – IH&SMEFD [email protected] 021-99221749
Syed Sohail Javaad Head – PSD [email protected] 021-99221169
Above list is in alphabetical order as of August 4, 2017.