state assessment results spring 2011
DESCRIPTION
Round Rock ISD August 18, 2011. State Assessment Results Spring 2011. Student Assessments Administered. Texas Assessment of Knowledge and Skills (TAKS) TAKS-Accommodated (TAKS-A) TAKS-Modified (TAKS-M) TAKS-Alternate (TAKS-Alt) Texas English Language Proficiency Assessment System (TELPAS) - PowerPoint PPT PresentationTRANSCRIPT
Round Rock ISDAugust 18, 2011
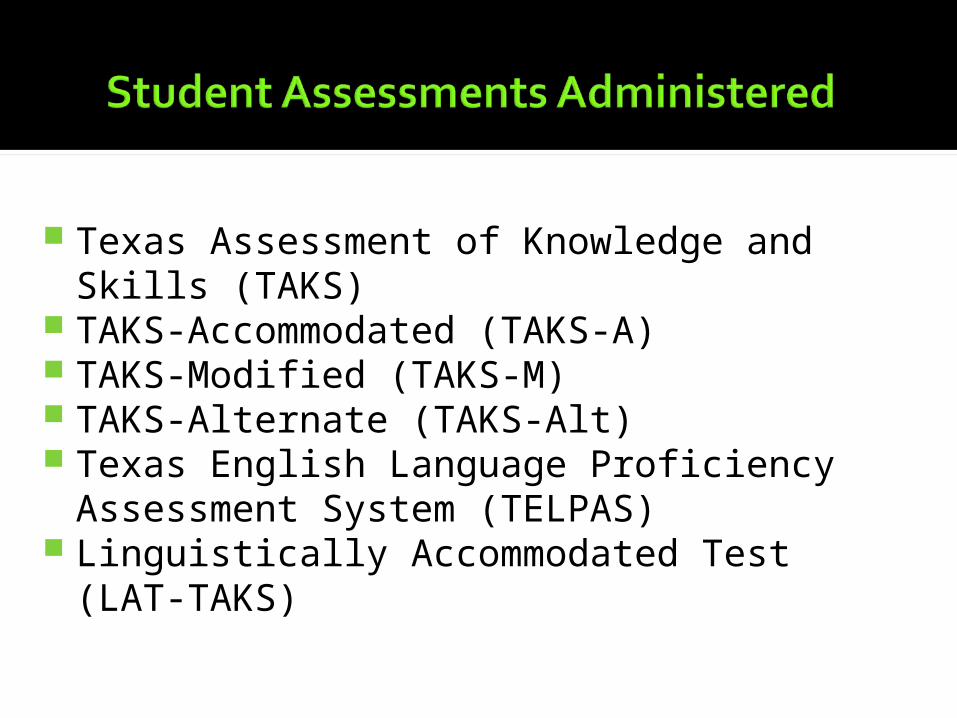
Texas Assessment of Knowledge and Skills (TAKS)
TAKS-Accommodated (TAKS-A) TAKS-Modified (TAKS-M) TAKS-Alternate (TAKS-Alt) Texas English Language Proficiency
Assessment System (TELPAS) Linguistically Accommodated Test (LAT-
TAKS)
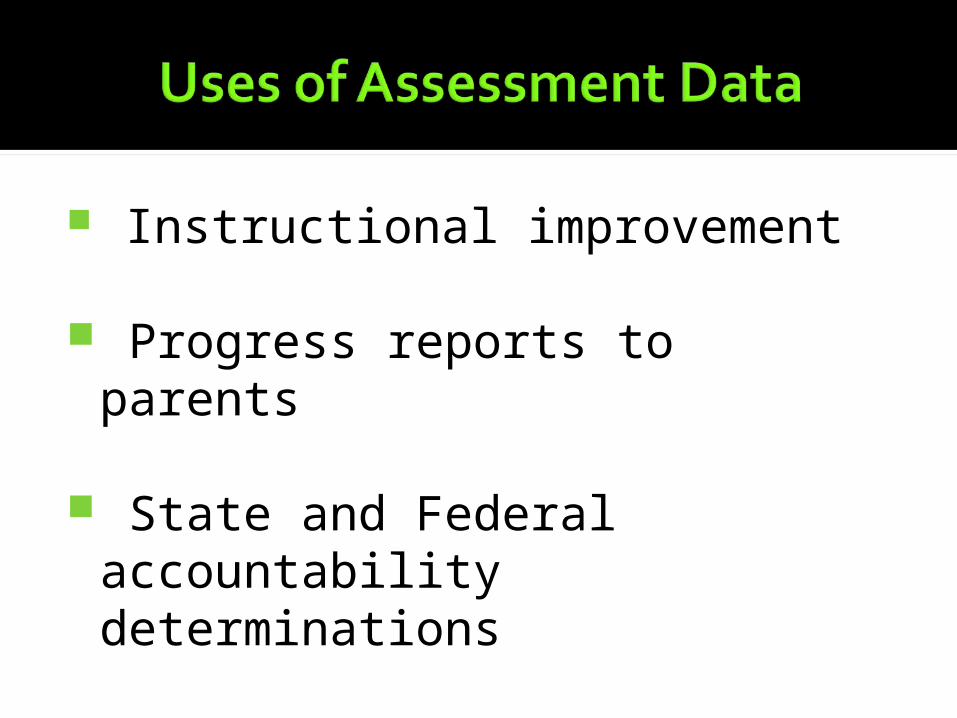
Instructional improvement
Progress reports to parents
State and Federal accountability determinations
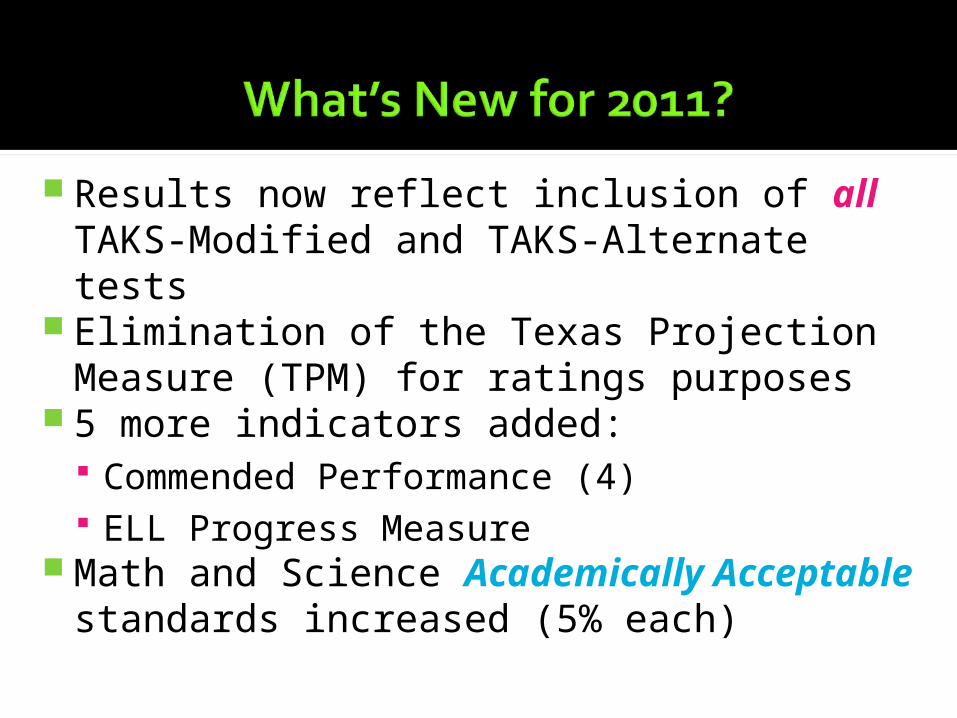
Results now reflect inclusion of all TAKS-Modified and TAKS-Alternate tests
Elimination of the Texas Projection Measure (TPM) for ratings purposes
5 more indicators added: Commended Performance (4) ELL Progress Measure
Math and Science Academically Acceptable standards increased (5% each)

. . . in general?

TAKS “MET STANDARD”
ALL AFR-AMER
HISP WHITE ECO DIS
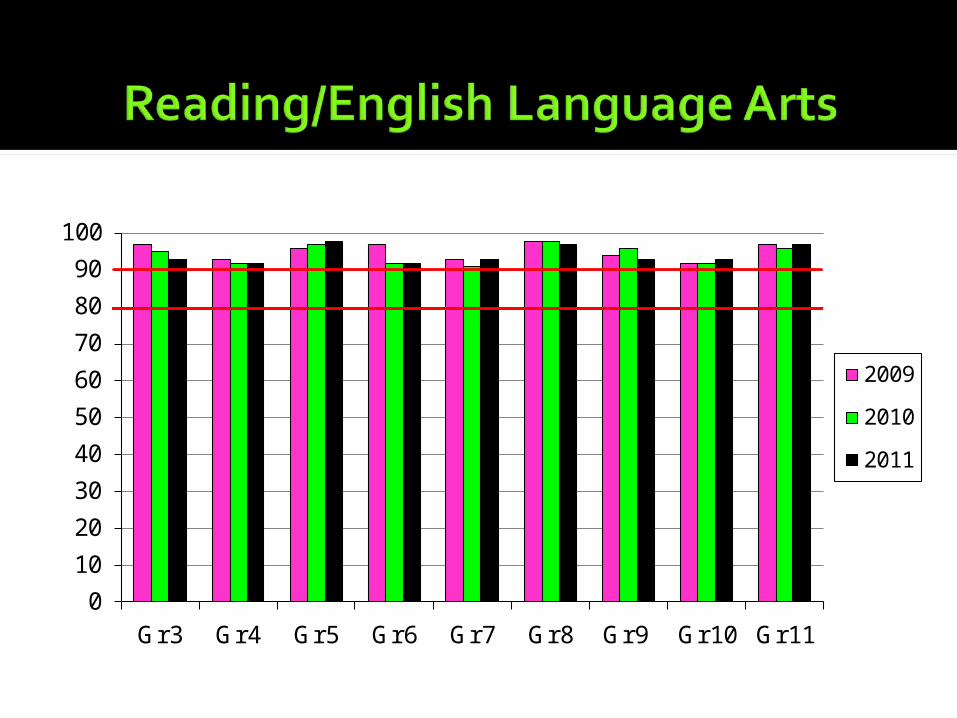
Reading/ELA 94 88 91 97 87
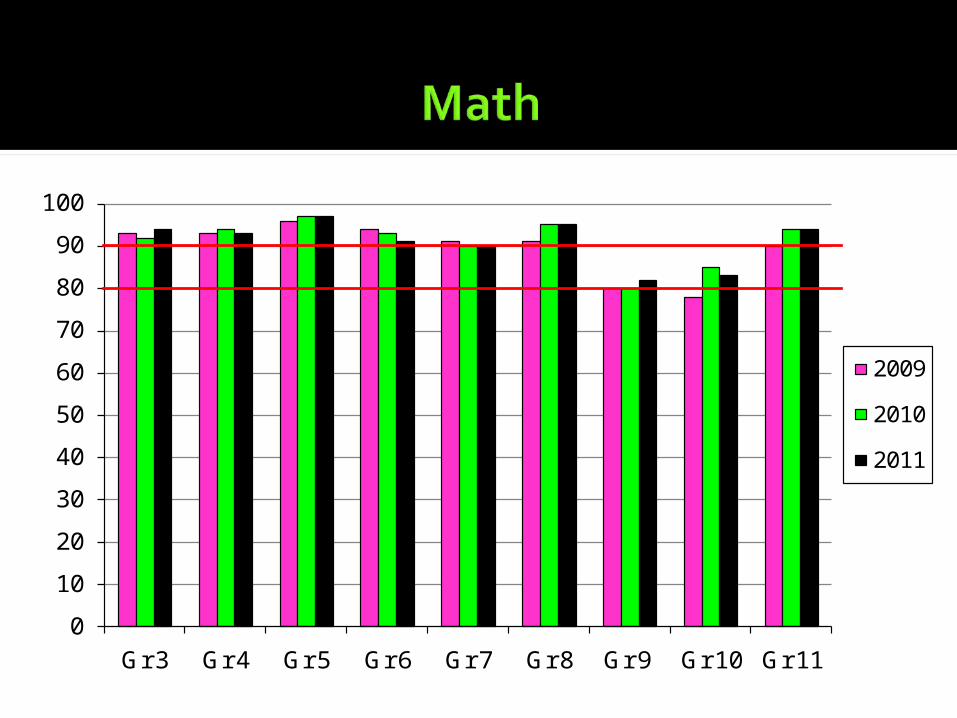
Math 91 78 86 95 81
Writing 95 88 92 96 89
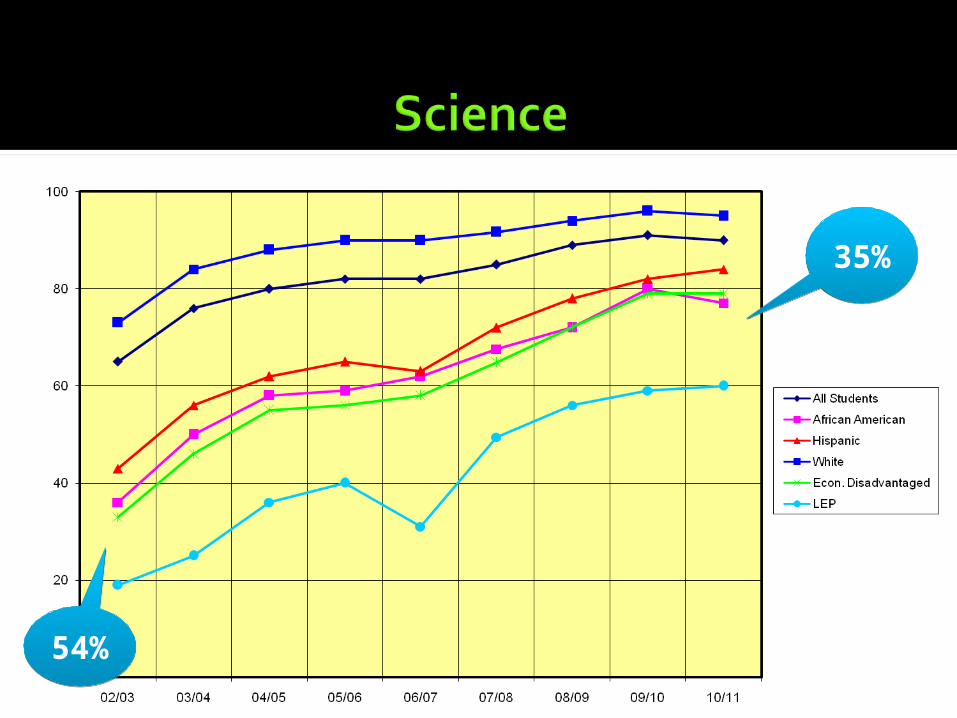
Science 90 77 84 95 79
Social Studies 97 93 95 98 93
TAKS “COMMENDED PERFORMANCE” AND “ELL PROGRESS MEASURE”
ALL ECO DIS
ELL PROGRESS MEASURE
Reading/ELA 48 27 88
Math 44 23
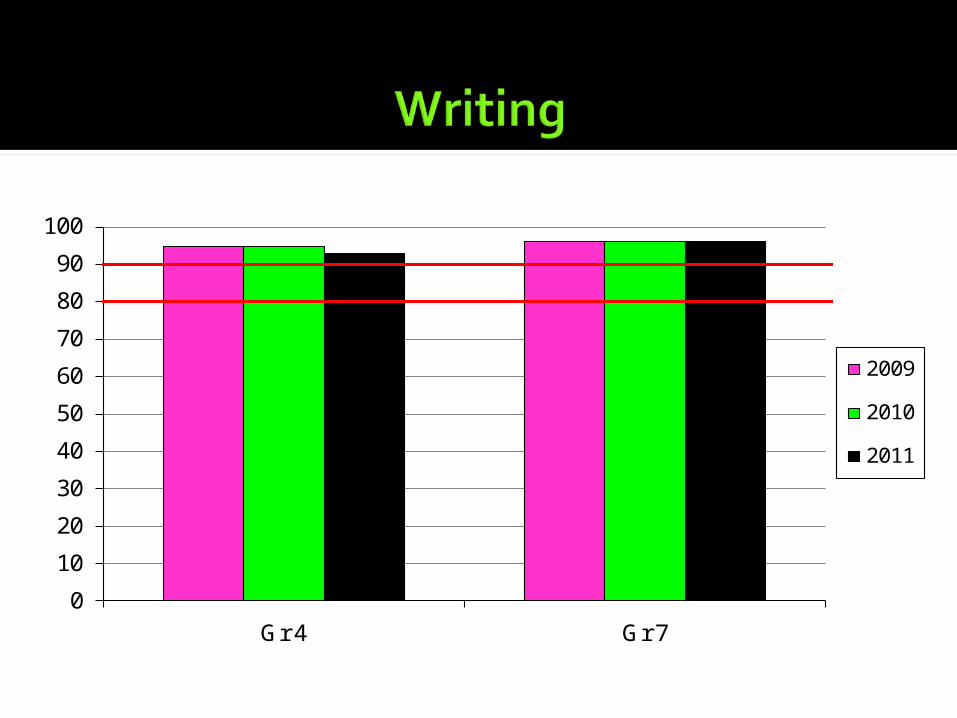
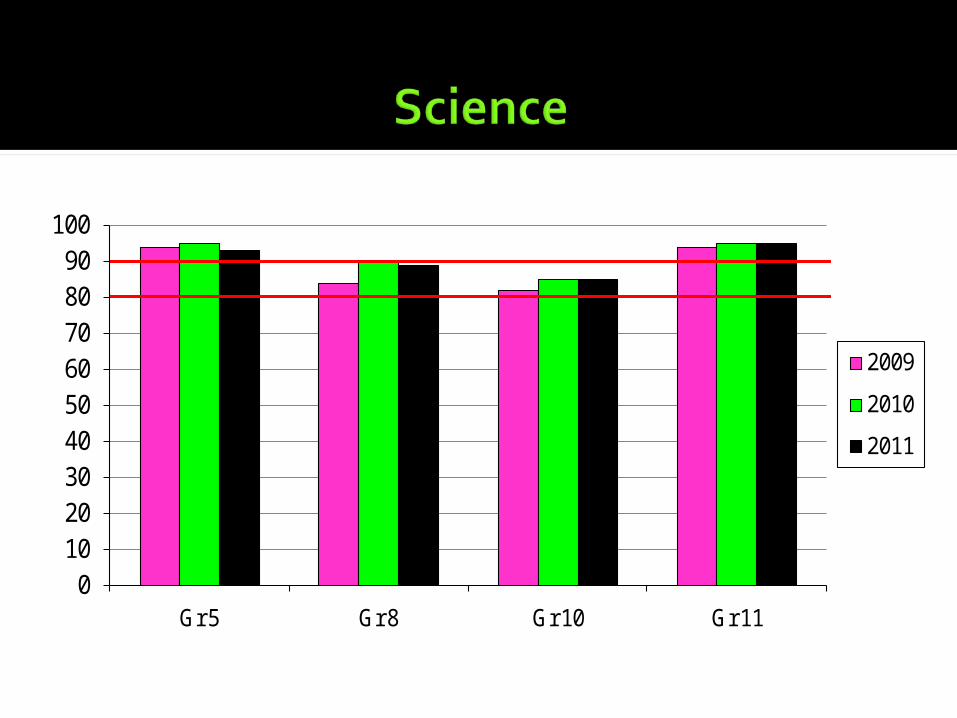
. . . by subject and grade?
0
10
20
30
40
50
60
70
80
90
100
Gr 3 Gr 4 Gr 5 Gr 6 Gr 7 Gr 8 Gr 9 Gr 10 Gr 11
2009
2010
2011
0
10
20
30
40
50
60
70
80
90
100
Gr 3 Gr 4 Gr 5 Gr 6 Gr 7 Gr 8 Gr 9 Gr 10 Gr 11
2009
2010
2011
0
10
20
30
40
50
60
70
80
90
100
Gr 4 Gr 7
2009
2010
2011
0102030405060708090
100
Gr 5 Gr 8 Gr 10 Gr 11
2009
2010
2011

0
10
20
30
40
50
60
70
80
90
100
Gr 8 Gr 10 Gr 11
2009
2010
2011
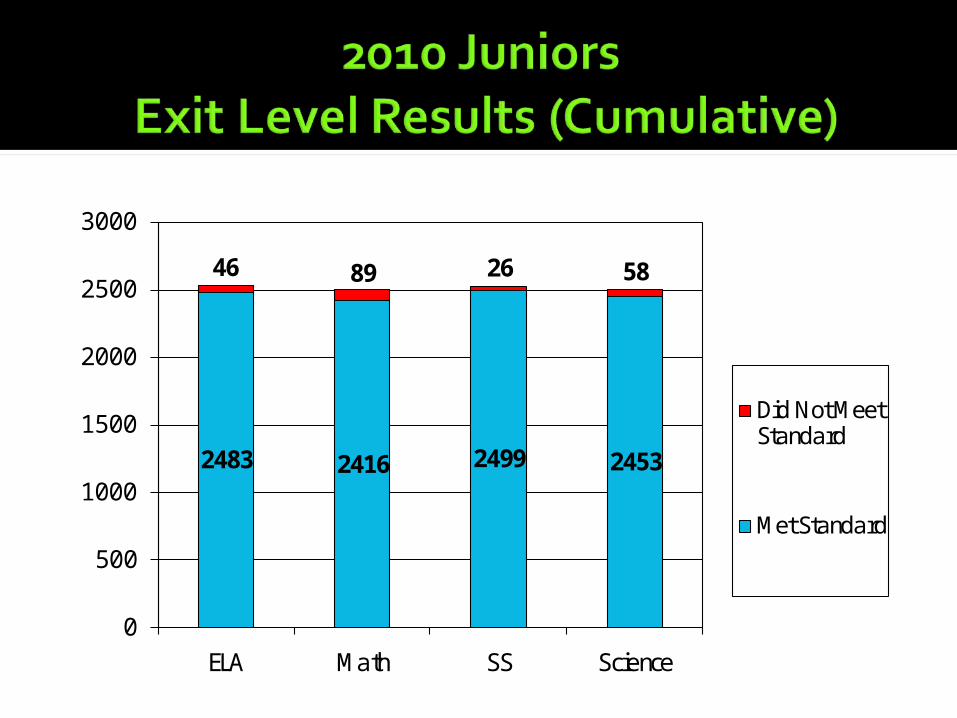
2483 2416 2499 2453
46 89 26 58
0
500
1000
1500
2000
2500
3000
ELA Math SS Science
Did Not Meet Standard
Met Standard

. . . in closing achievement gaps?

21%21%
45%45%
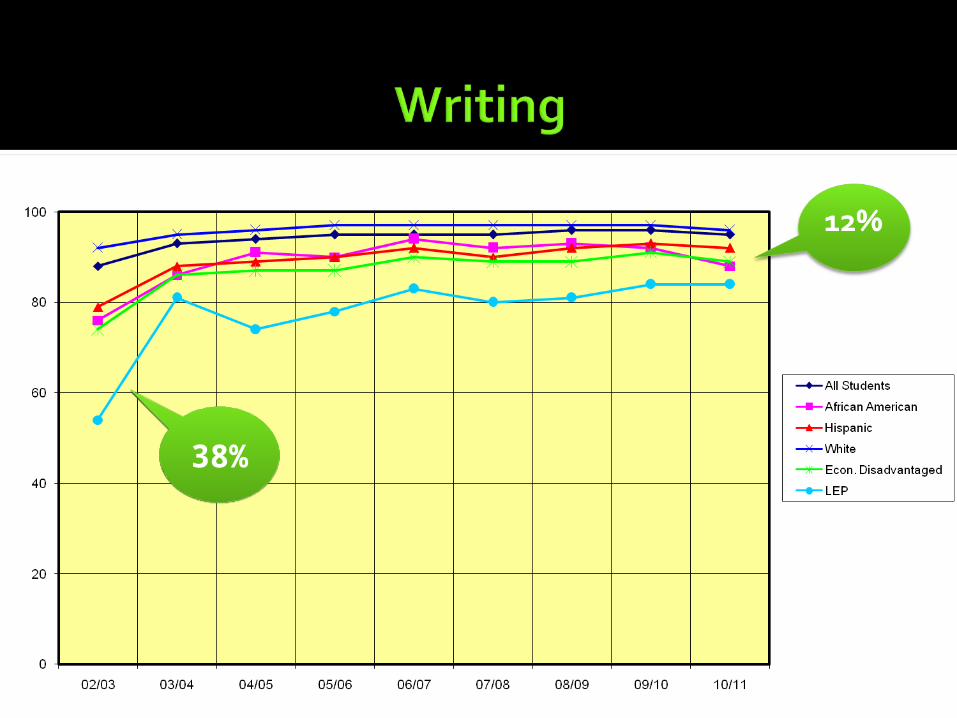
38%38%
54%54%
35%35%

40%40%
17%
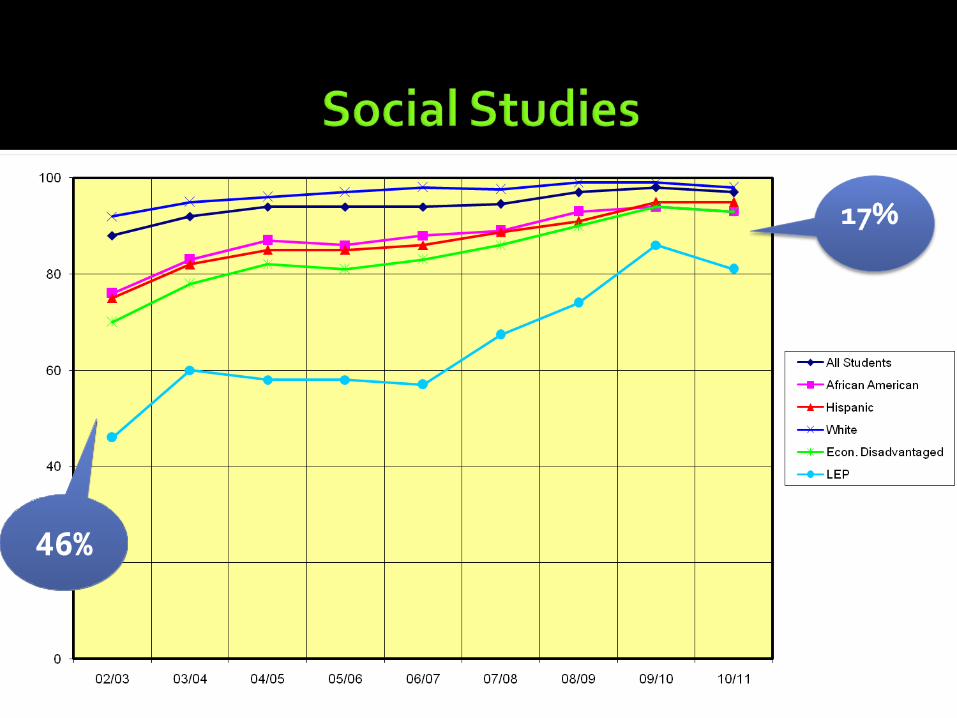
46%46%
State Accountability RatingsFederal Adequate Yearly Progress (AYP)
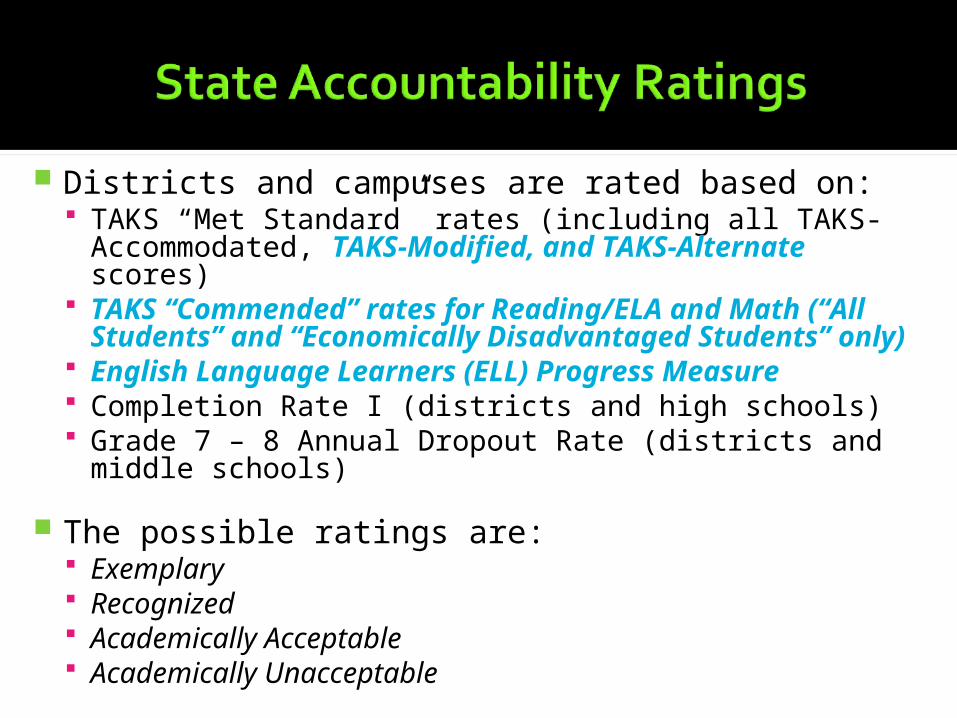
Districts and campuses are rated based on: TAKS “Met Standard” rates (including all TAKS-
Accommodated, TAKS-Modified, and TAKS-Alternate scores)
TAKS “Commended” rates for Reading/ELA and Math (“All Students” and “Economically Disadvantaged Students” only)
English Language Learners (ELL) Progress Measure Completion Rate I (districts and high schools) Grade 7 – 8 Annual Dropout Rate (districts and middle
schools)
The possible ratings are: Exemplary Recognized Academically Acceptable Academically Unacceptable
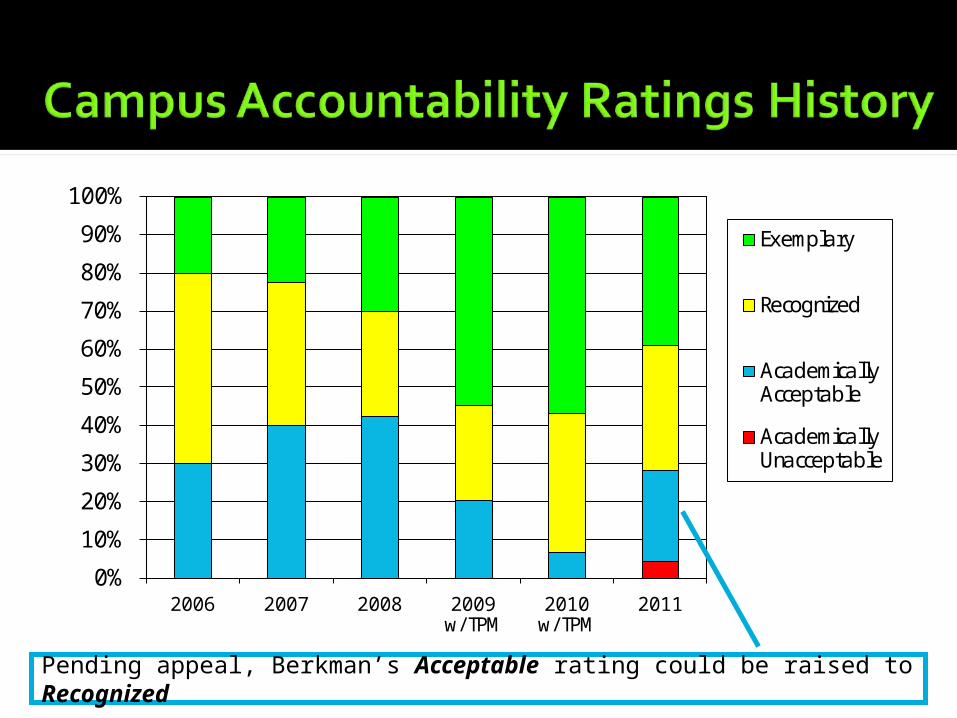
0%
10%
20%
30%
40%
50%
60%
70%
80%
90%
100%
2006 2007 2008 2009 w/ TPM
2010 w/ TPM
2011
Exemplary
Recognized
Academically Acceptable
Academically Unacceptable
Pending appeal, Berkman’s Acceptable rating could be raised to Recognized

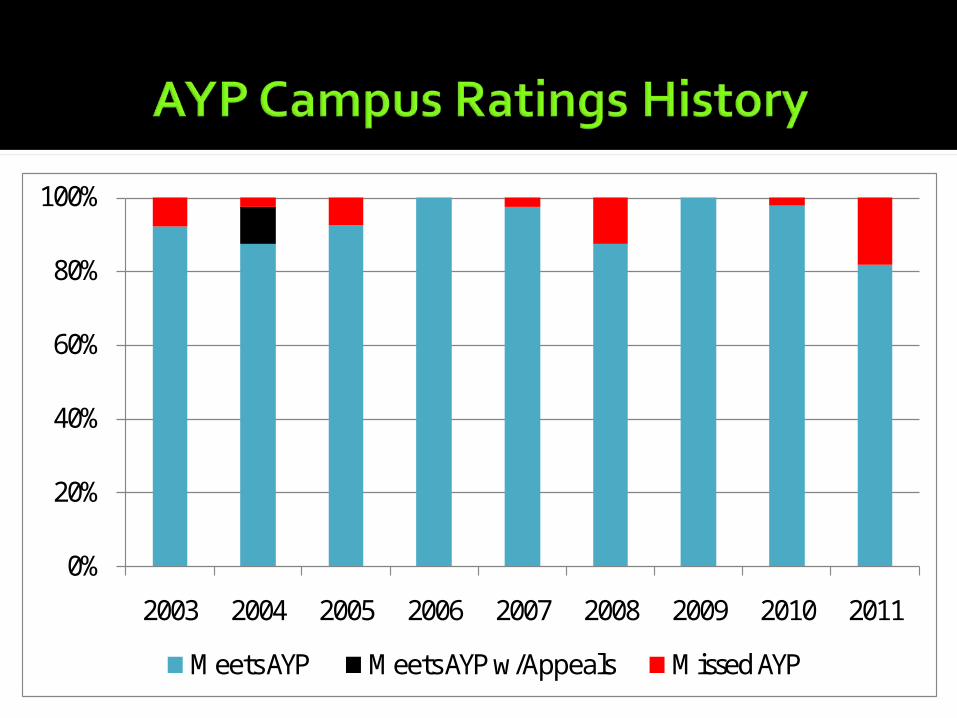
Year Rating
2004 Academically Acceptable
2005 Academically Acceptable
2006 Academically Acceptable
2007 Academically Acceptable
2008 Academically Acceptable
2009 Recognized
2010 Recognized
2011 Academically Acceptable*
*Although the District’s academic performance met the standard for a Recognized rating, accountability rules state that a district with a campus rated Academically Unacceptable cannot be rated Recognized or Exemplary
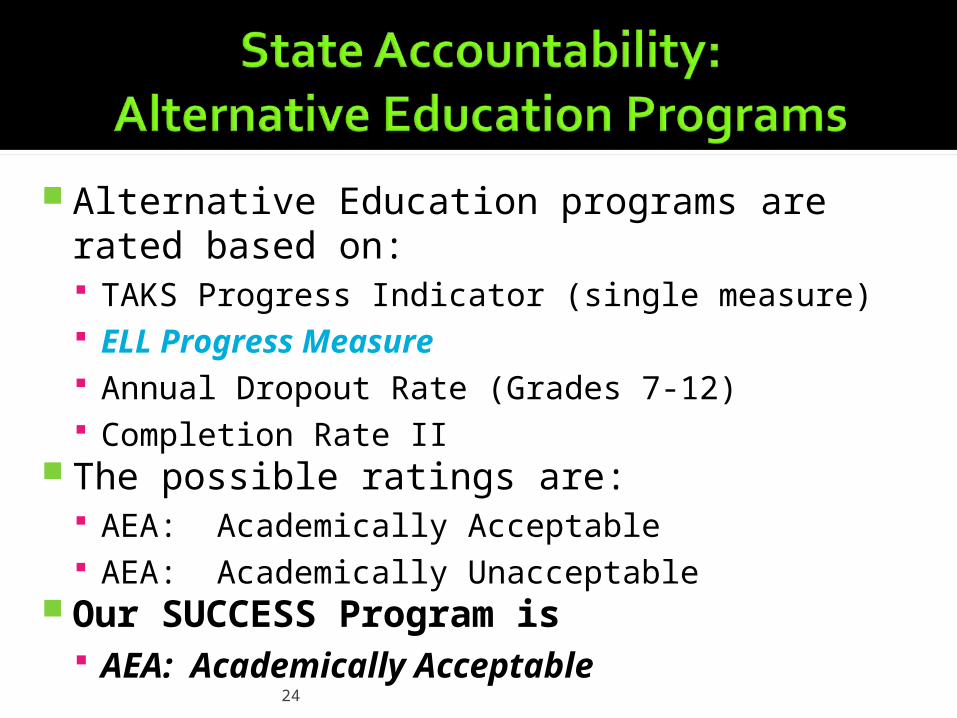
Alternative Education programs are rated based on: TAKS Progress Indicator (single measure) ELL Progress Measure Annual Dropout Rate (Grades 7-12) Completion Rate II
The possible ratings are: AEA: Academically Acceptable AEA: Academically Unacceptable
Our SUCCESS Program is AEA: Academically Acceptable 24

AYP Ratings are based on 7 student groups: Performance on reading and math tests (all test
versions) Participation in reading and math assessments (95%) Graduation Rate (75%) Attendance Rate (90%)
Performance standards increased this year: Reading/ELA – from 73% to 80% Math – from 67% to 75% TPM was eliminated for AYP purposes this year
The possible ratings are: Met AYP Missed AYP
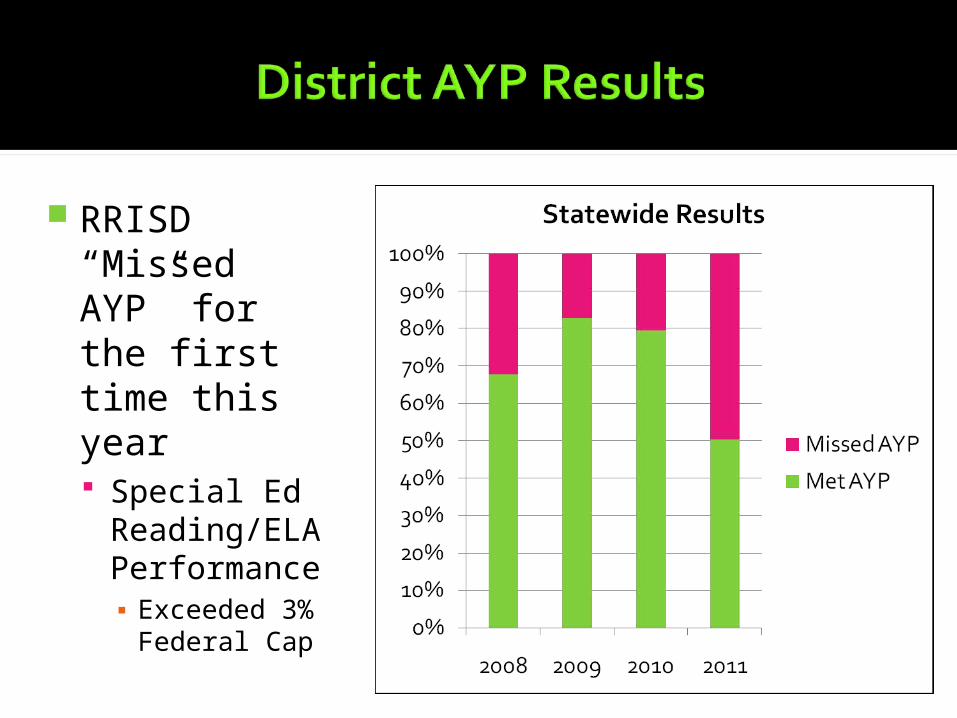
RRISD “Missed AYP” for the first time this year Special Ed
Reading/ELA Performance▪ Exceeded 3%
Federal Cap
0%
20%
40%
60%
80%
100%
2003 2004 2005 2006 2007 2008 2009 2010 2011
Meets AYP Meets AYP w/Appeals Missed AYP
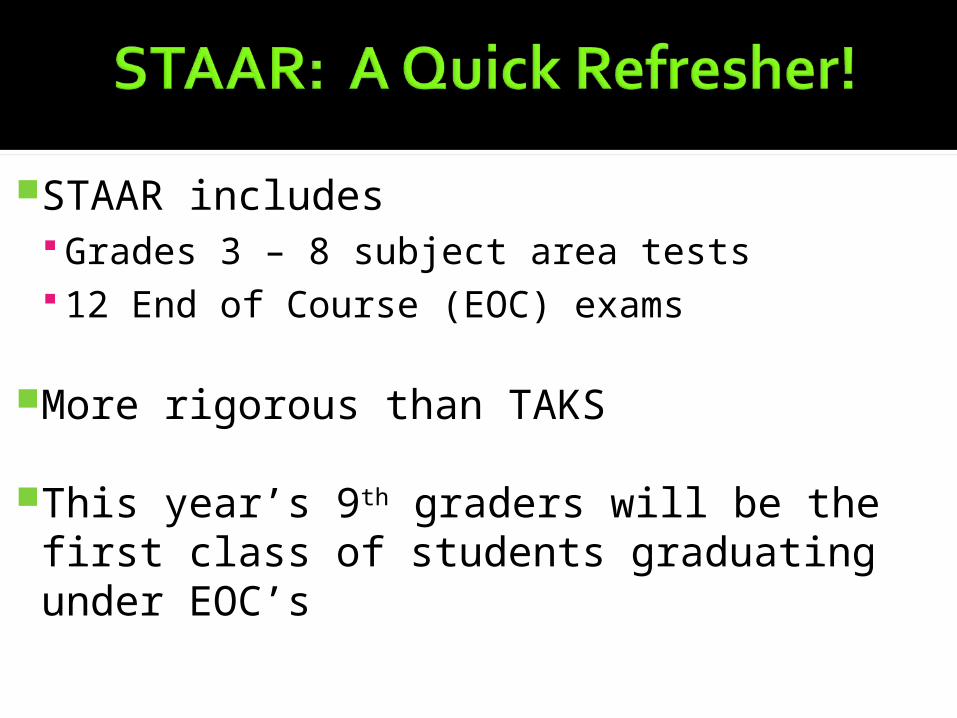
STAAR includes Grades 3 – 8 subject area tests 12 End of Course (EOC) exams
More rigorous than TAKS
This year’s 9th graders will be the first class of students graduating under EOC’s
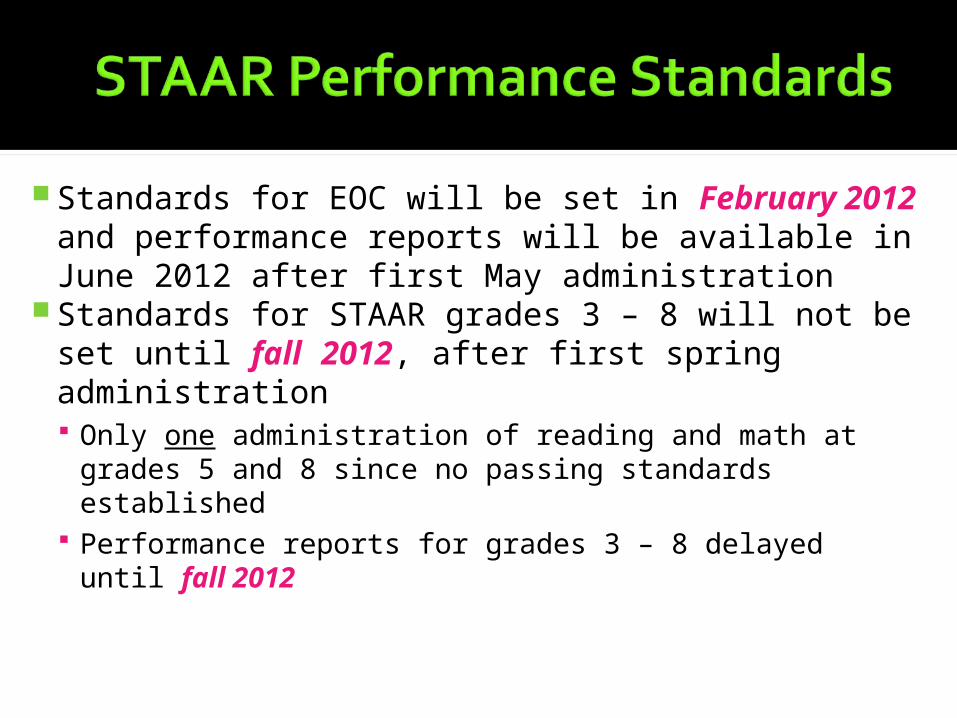
Standards for EOC will be set in February 2012 and performance reports will be available in June 2012 after first May administration
Standards for STAAR grades 3 – 8 will not be set until fall 2012, after first spring administration Only one administration of reading and math at
grades 5 and 8 since no passing standards established
Performance reports for grades 3 – 8 delayed until fall 2012

Level III: Advanced Academic Performance Students are well prepared for next grade or course.
For Algebra II and ELA III, this level will indicate college readiness
Level II: Satisfactory Academic Performance Students are sufficiently prepared for next grade or
course.Level I: Unsatisfactory Academic
Performance Students are not adequately prepared for next grade or
course.

Beginning with Spring 2012 test administration, there will be a 4-hour time limit for both STAAR EOC and STAAR grades 3 – 8 assessments Will allow special requests for extended time
There will be make-up opportunities for all grades and subjects, not just those used for AYP
Dyslexia accommodations will be expanded to high school students
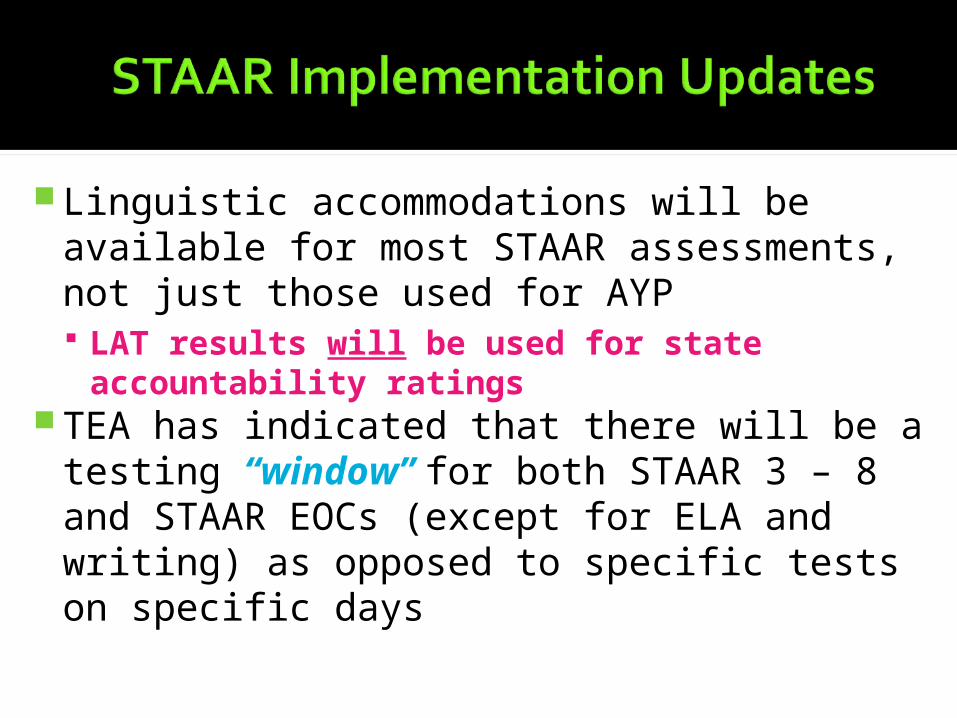
Linguistic accommodations will be available for most STAAR assessments, not just those used for AYP LAT results will be used for state
accountability ratingsTEA has indicated that there will be a
testing “window” for both STAAR 3 – 8 and STAAR EOCs (except for ELA and writing) as opposed to specific tests on specific days
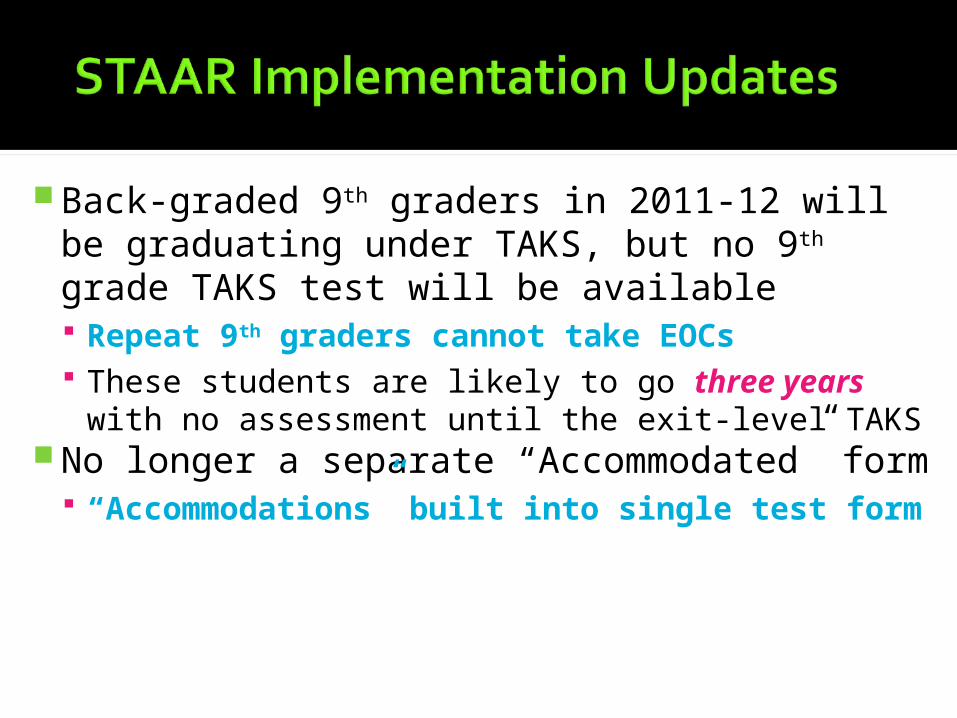
Back-graded 9th graders in 2011-12 will be graduating under TAKS, but no 9th grade TAKS test will be available Repeat 9th graders cannot take EOCs These students are likely to go three years
with no assessment until the exit-level TAKSNo longer a separate “Accommodated”
form “Accommodations” built into single test
form
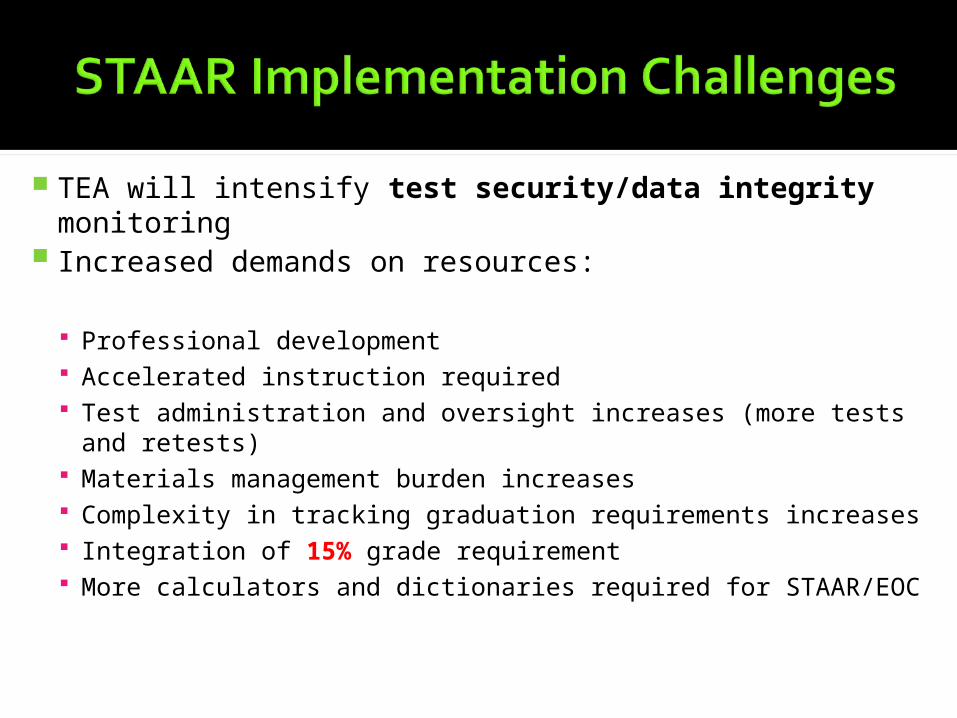
TEA will intensify test security/data integrity monitoring
Increased demands on resources: Professional development Accelerated instruction required Test administration and oversight increases (more tests and
retests) Materials management burden increases Complexity in tracking graduation requirements increases Integration of 15% grade requirement More calculators and dictionaries required for STAAR/EOC
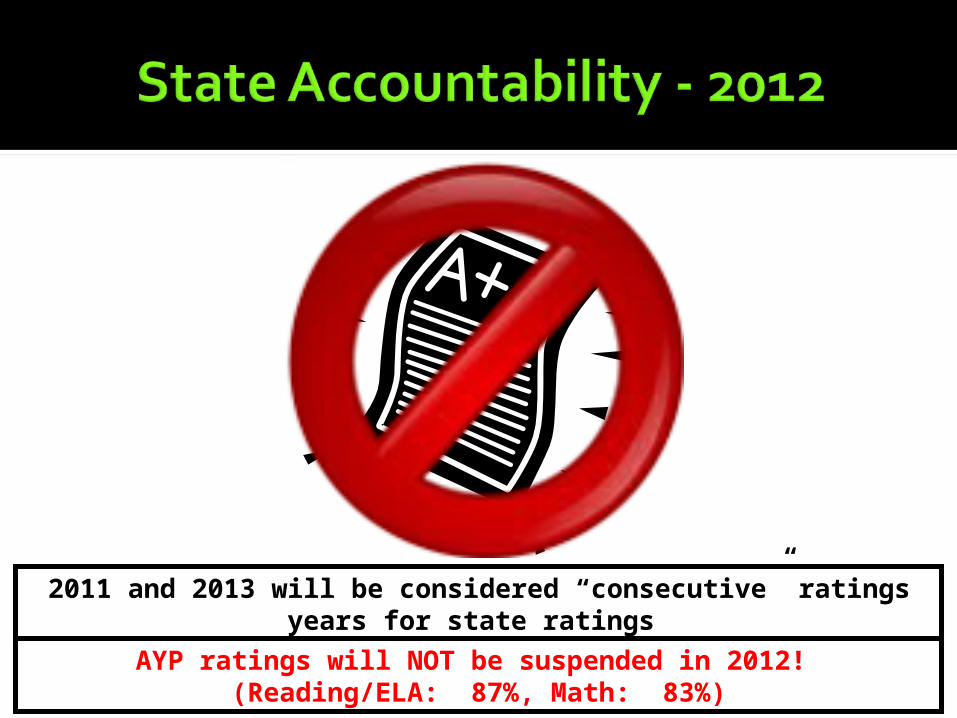
2011 and 2013 will be considered “consecutive” ratings years for state ratings
AYP ratings will NOT be suspended in 2012! (Reading/ELA: 87%, Math: 83%)
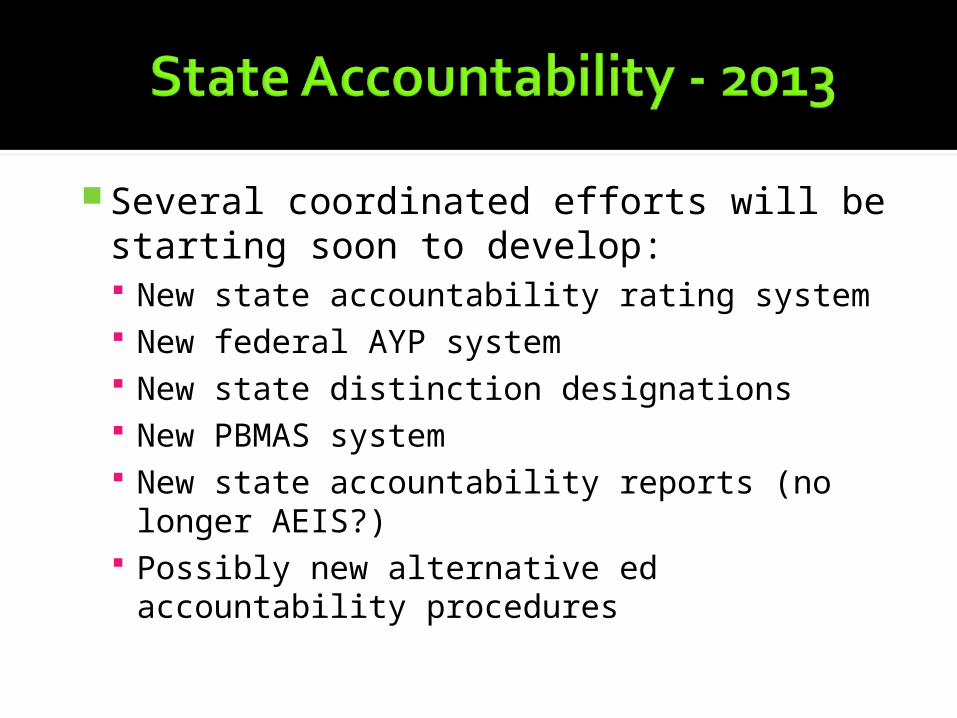
Several coordinated efforts will be starting soon to develop: New state accountability rating system New federal AYP system New state distinction designations New PBMAS system New state accountability reports (no longer
AEIS?) Possibly new alternative ed accountability
procedures

Focus shifts from minimum standards to standards based on postsecondary readiness
Ensure Texas is among top 10 states in postsecondary readiness and students graduating under RHSP/DAP plans by 2020
“Recognized” and “Exemplary” distinction ratings are based on student performance on college readiness standards rather than higher percentages of students performing at the satisfactory level
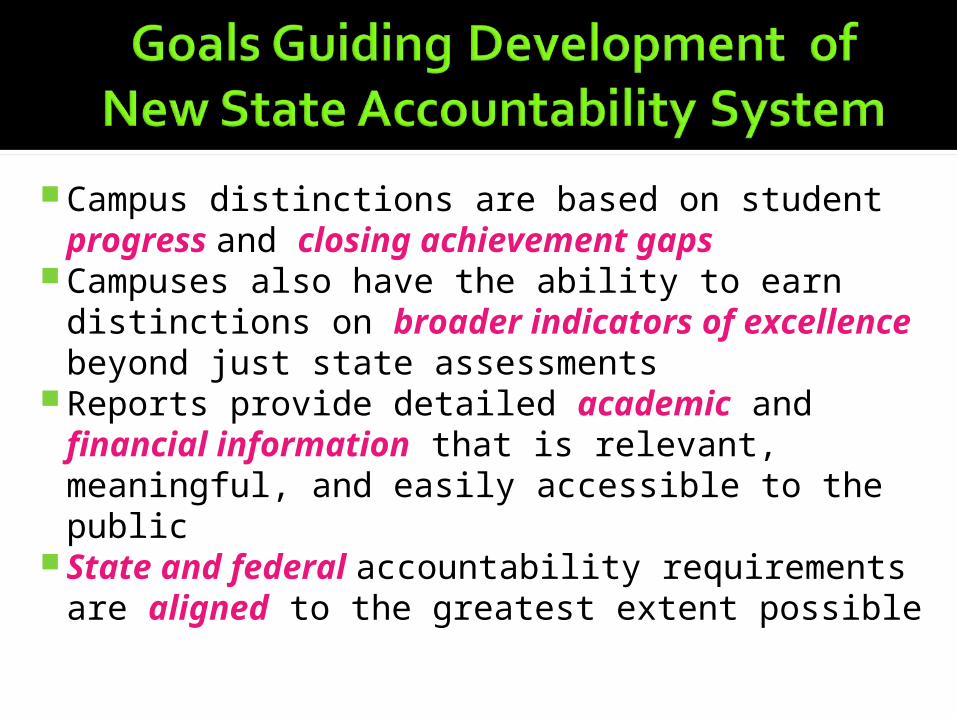
Campus distinctions are based on student progress and closing achievement gaps
Campuses also have the ability to earn distinctions on broader indicators of excellence beyond just state assessments
Reports provide detailed academic and financial information that is relevant, meaningful, and easily accessible to the public
State and federal accountability requirements are aligned to the greatest extent possible
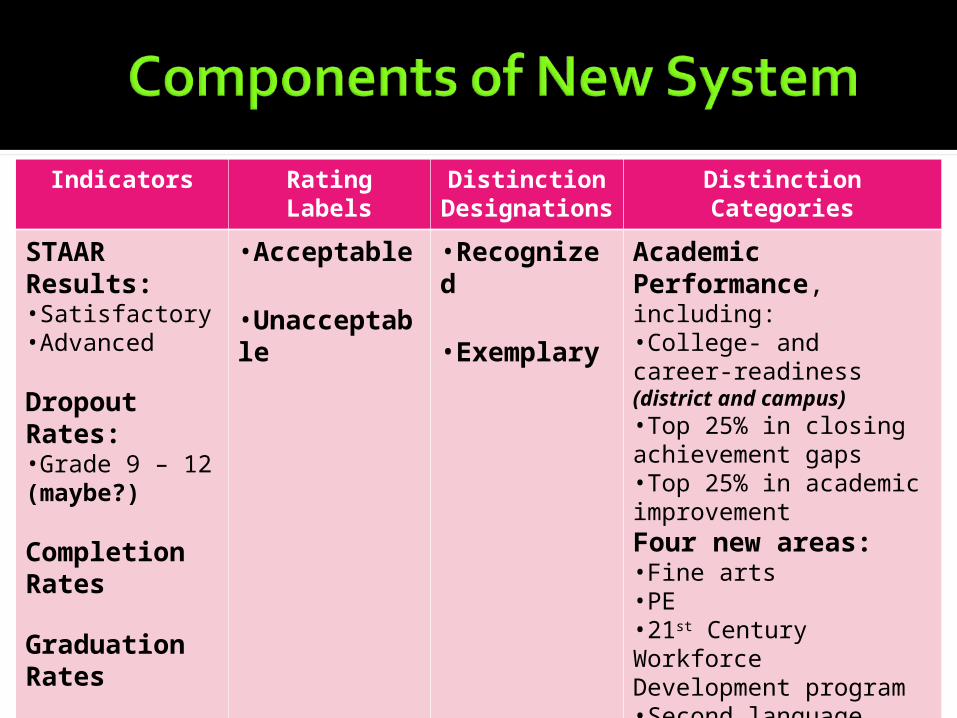
Indicators Rating Labels
Distinction Designation
s
Distinction Categories
STAAR Results:•Satisfactory•Advanced
Dropout Rates:•Grade 9 – 12 (maybe?)
Completion Rates
Graduation Rates
•Acceptable
•Unacceptable
•Recognized
•Exemplary
Academic Performance, including:•College- and career-readiness (district and campus)•Top 25% in closing achievement gaps•Top 25% in academic improvementFour new areas:•Fine arts•PE•21st Century Workforce Development program•Second language acquisition program
0%
10%
20%
30%
40%
50%
60%
70%
80%
90%
100%
2008 2009 2010 2011
Reading/ELA
Math
Writing
Science
Soc Studies
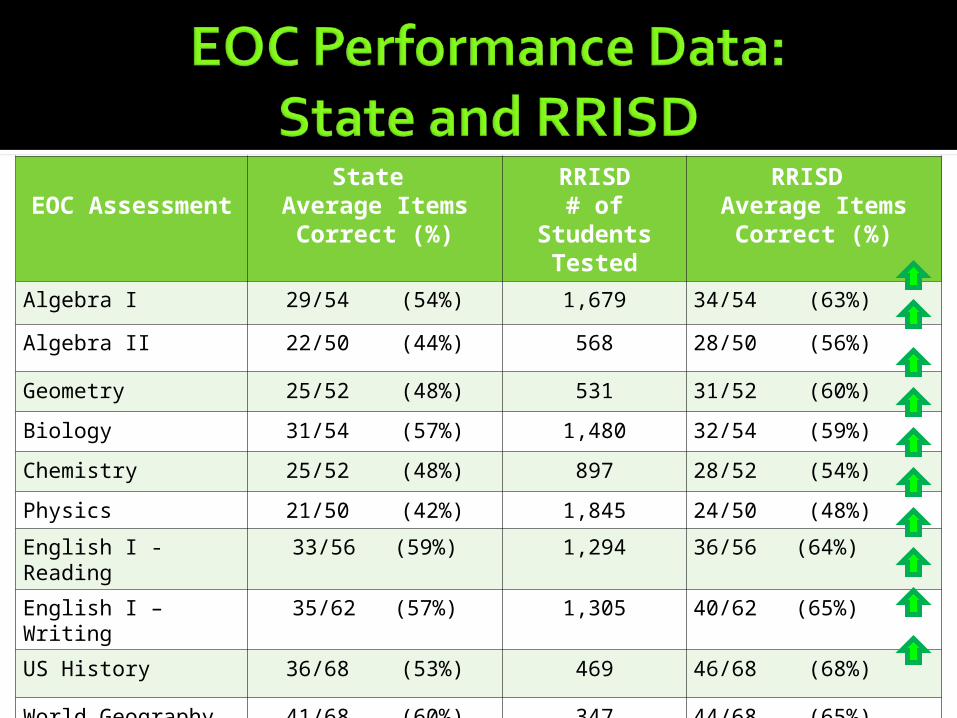
EOC Assessment
State Average Items
Correct (%)
RRISD# of
Students Tested
RRISD Average Items
Correct (%)
Algebra I 29/54 (54%) 1,679 34/54 (63%)
Algebra II 22/50 (44%) 568 28/50 (56%)
Geometry 25/52 (48%) 531 31/52 (60%)
Biology 31/54 (57%) 1,480 32/54 (59%)
Chemistry 25/52 (48%) 897 28/52 (54%)
Physics 21/50 (42%) 1,845 24/50 (48%)
English I - Reading 33/56 (59%) 1,294 36/56 (64%)
English I – Writing 35/62 (57%) 1,305 40/62 (65%)
US History 36/68 (53%) 469 46/68 (68%)
World Geography 41/68 (60%) 347 44/68 (65%)

School Start Window closes September 30 Appeal decisions announced in late
October, along with final ratings Gold Performance Acknowledgments will
be announced in late October AEIS reports will be available in November School Report Cards will be released in
early December List of Public Education Grant (PEG)
campuses will be released in December