state and trends in the diversity, abundance and ... · state and trends in the diversity,...
TRANSCRIPT
1
State and trends in the diversity, abundance and distribution of birds in Upper Hutt City
November 2015

State and trends in the diversity, abundance and distribution of birds in Upper Hutt City.
Nikki McArthur1, Susanne Govella2, Jono Walter2 and Delia Small2
1Wildlife Management International Ltd 2C/- Greater Wellington Regional Council PO Box 607 Shed 39 Blenheim 7240 2 Fryatt Quay New Zealand Pipitea www.wmil.co.nz Wellington 6011
This report was prepared by Wildlife Management International Limited for Greater Wellington Regional Council as fulfilment of the Contract of Services dated 25th August 2015.
1st November 2015
Citation:
This report should be cited as:
McArthur, N.; Govella, S.; Walter, J. and Small, D. 2015. State and trends in the diversity, abundance and distribution of birds in Upper Hutt City. Client report prepared for Greater Wellington Regional Council. Wildlife Management International Ltd, Blenheim.
All photographs in this report are copyright © WMIL unless otherwise credited, in which case the person or organization credited is the copyright holder.
Cover Image: Juvenile New Zealand fantail (Rhipidura fuliginosa) photographed on the Hutt River adjacent to Trentham Memorial Park, Upper Hutt (November 2014). Image courtesy of N. McArthur.

State and trends in the diversity, abundance and distribution of birds in Upper Hutt City
McArthur, N.; Govella, S.; Walter, J. and Small, D. 1
ABSTRACT
Five-minute bird counts have been carried out at 45 bird count stations situated in native forest habitat in six selected Upper Hutt City parks and reserves each year between 2011 and 2014. The aim of these surveys is to monitor trends in the diversity, abundance and distribution of native forest birds in Upper Hutt City’s reserve network, to provide a measure of local biodiversity management outcomes.
Between 26 and 31 bird species were detected during these bird counts each year, with approximately half of these species being native species and half being introduced and naturalised species. There has been little change in the number of native forest bird species detected in Upper Hutt reserves between 2011 and 2014, suggesting that the environmental management of these reserves is succeeding in maintaining native species diversity. Both rifleman and kakariki (red-crowned parakeet) are only present in very small numbers in one or two of the reserves surveyed, so may not be present in sufficient numbers to maintain viable populations in the long term. Both Keith George Memorial Park and Wi Tako Reserve once again emerge as important reserves in Upper Hutt City, as each supports populations of the majority of native forest bird species detected during these counts. On average, a higher number of native forest bird species were recorded per bird count station in Upper Hutt City reserves compared to those surveyed in Wellington City. This is because around 25% of the native forest bird species recorded in Wellington City reserves had very localised distributions (typically centred on Zealandia), whereas almost all species detected in Upper Hutt reserves had fairly widespread distributions.
Native bird species that feed predominantly on nectar or fruit have shown some significant year to year fluctuations in abundance between 2011 and 2014, likely due to annual variation in the local availability of food resources. In contrast, many of the insectivorous birds have shown relatively little change in abundance over the past four years. One exception is the fantail, which has undergone an 11-fold increase in abundance in Upper Hutt City reserves between 2011 and 2014. This is likely to represent a rapid local population recovery following a very heavy mortality event that occurred during the winter of 2011. Encounter rates for tomtit have been significantly higher in both 2013 and 2014 than during the preceding two years and this may be early evidence that local tomtit populations are responding to local mammalian predator control efforts.
Both this new survey design and the incorporation of bird distribution data collected by local citizen scientists has allowed us to map the distribution of birds in Upper Hutt City in much greater detail than previously. These counts have revealed that the north-eastern portion of Keith George Memorial Park and the southern portion of Wi Tako Reserve both support higher numbers of tomtits, fantails, whiteheads and bellbirds than remaining portions of both reserves. This suggests that the north-eastern and southern portions of these two reserves provide particularly high quality habitat for these native species, likely due to the presence of mature stands of both black and hard beech.
We recommend that these bird counts be continued on an annual basis to provide a consistent, repeatable measure of trends in bird diversity, abundance and distribution in Upper Hutt City. We also recommend that Upper Hut City considers investing additional resources towards further encouraging Upper Hutt City residents to report bird observations from suburban areas and other parks and reserves around the city using online biodiversity reporting tools.
Keywords: Upper Hutt City, five-minute bird count, bird abundance, Wi Tako Reserve, Keith George Memorial Park, citizen science, eBird, NatureWatch.

State and trends in the diversity, abundance and distribution of birds in Upper Hutt City
McArthur, N.; Govella, S.; Walter, J. and Small, D. 2
1 INTRODUCTION
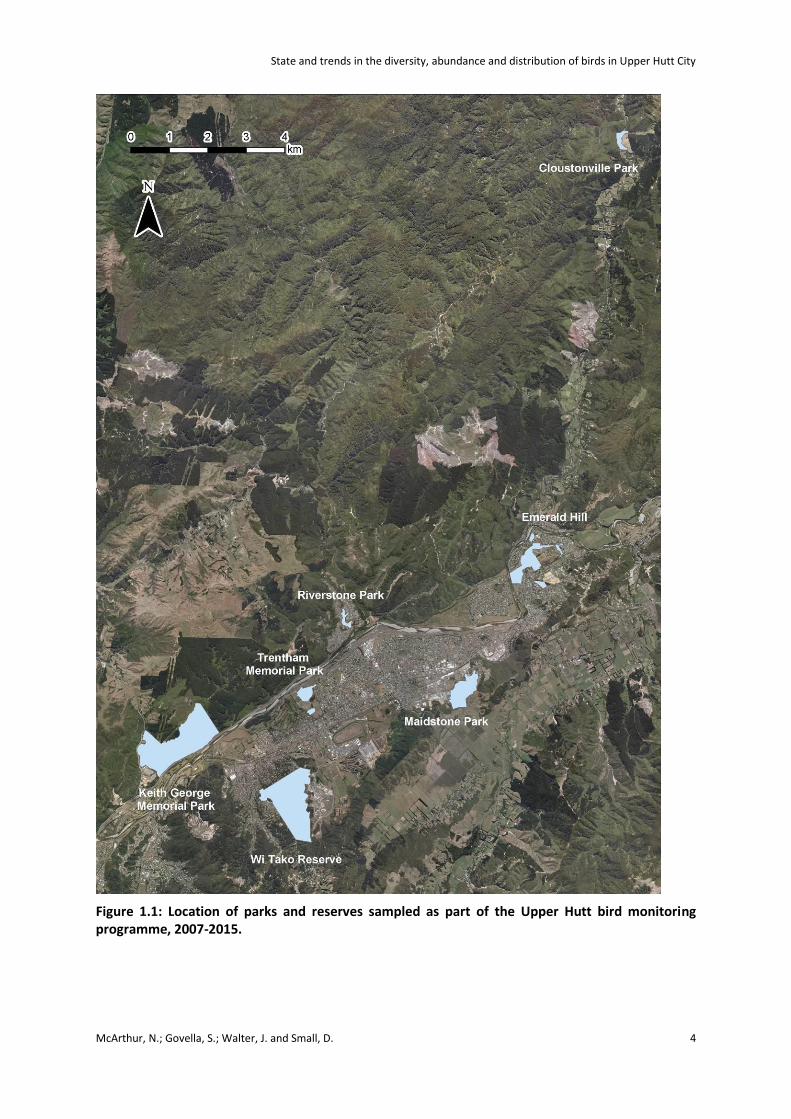
Annual bird monitoring is carried out in a number of parks and reserves in Upper Hutt City to monitor trends in the diversity, abundance and distribution of native birds in these reserves. Bird monitoring in Upper Hutt began in 2005 when five-minute bird count stations were established in Keith George Memorial Park as part of Greater Wellington Regional Council’s Key Native Ecosystem programme (Stephens et al, 2007). In 2006 and 2007, bird count stations were installed in a further six parks and reserves around Upper Hutt to provide a more detailed picture of city-wide trends in bird distribution and abundance (Figure 1.1).
The results of the first six years of bird counts have been reported in Stephens et al, (2007), Fea & Moylan (2008) and Govella et al, (2011). These authors reported that native bird diversity and abundance tended to be greater in the larger reserves with better habitat connectivity to surrounding areas of native or exotic forest habitat. Fantail (Rhipidura fuliginosa), tui (Prosthemadera novaeseelandiae), grey warbler (Gerygone igata) and silvereye (Zosterops lateralis) were the five most frequently encountered native bird species. Keith George Memorial Park emerged as a particularly important site for native birds in Upper Hutt because it was the only reserve sampled that supported large populations of both whitehead (Mohoua albicilla) and tomtit (Petroica macrocephala).
In 2011 this bird monitoring programme was replaced with a new survey designed to monitor changes in the apparent abundance of native forest birds across the entire network of selected reserves, rather than attempt to compare indices of abundance between individual reserves (McArthur et al, 2012). Tui were chosen as a focal species for this new survey design and a sample size of 90 five-minute bird counts was selected to ensure sufficient statistical power to detect a 25% or more change in the apparent abundance of tui from one year to the next.
These new bird count stations were surveyed in both 2011 and 2012 and the results of these counts confirmed that larger and better connected reserves such as Wi Tako Reserve and Keith George Memorial Park supported the greatest diversity of native forest bird species. In addition, the average number of native bird species recorded per bird count station each year was significantly higher in Upper Hutt City reserves than in the Wellington City parks and reserves network. This result is due to differences in patterns of bird distribution between the two cities. Whereas around a third of the native bird species detected in Wellington City reserves had fairly localised distributions centred on Zealandia, a pest-free sanctuary situated in the Karori Reservoir Valley, the majority of native bird species recorded in Upper Hutt City reserves had much more widespread distributions (McArthur et al, 2012).
Silvereye, grey warbler and tui were once again three of the most common bird species recorded in Upper Hutt reserves in both 2011 and 2012, although there was a significant reduction in both silvereye and tui abundance between years. Fantail abundance was extremely low in 2011, probably as a result of heavy mortality suffered during two unusually heavy snowfall events that occurred during winter 2011. Fantail abundance increased substantially between 2011 and 2012 however, suggesting that by the following year local fantail populations were already recovering from this severe weather event. Kakariki (Cyanoramphus sp.), bellbird (Anthornis melanura) and rifleman (Acanthisitta chloris) were all detected in Wi Tako Reserve for the first time in 2011, but this may have been a consequence of the improved search effort and coverage that was built into the new survey design, rather than evidence that recent re-colonisation events have occurred (McArthur et al, 2012).
These bird counts were repeated again in both 2013 and 2014 and this report provides a summary of the results of these more recent bird counts. In addition, this report also attempts for the first time to incorporate local ‘citizen science’ bird distribution data to provide additional information on the
State and trends in the diversity, abundance and distribution of birds in Upper Hutt City
McArthur, N.; Govella, S.; Walter, J. and Small, D. 3
distribution of native birds in adjacent urban and suburban habitats in the city. Thanks to the availability of online biodiversity reporting tools such as the New Zealand eBird and NatureWatch databases and citizen science projects such as the Great Kereru Count and New Zealand Garden Bird Survey, there is a growing interest among Upper Hutt City residents in collecting and sharing high-quality bird observations from around the city. These observations have the potential to complement the existing Upper Hutt City five-minute bird count dataset by providing distribution data from habitats not currently being sampled as part of this monitoring programme.
State and trends in the diversity, abundance and distribution of birds in Upper Hutt City
McArthur, N.; Govella, S.; Walter, J. and Small, D. 4
Figure 1.1: Location of parks and reserves sampled as part of the Upper Hutt bird monitoring programme, 2007-2015.

State and trends in the diversity, abundance and distribution of birds in Upper Hutt City
McArthur, N.; Govella, S.; Walter, J. and Small, D. 5
2 METHODS
2.1 Five-minute bird count data collection
Forty-five bird count stations were established at randomly-selected locations in six of seven selected Upper Hutt City parks and reserves in November 2011 and have been surveyed annually between 2011 and 2014 (Figure 2.1). Bird count stations were established at a minimum distance of 200 metres from one another and no less than 50 metres from the nearest forest edge. Each station was marked with a blue triangle affixed to a living tree. Due to the random placement of count stations, no station fell within the boundary of the smallest of the seven reserves, Riverstone Park, so no abundance data is collected at this reserve. Instead, a walk-through survey has been carried out each year to collect data on species diversity and distribution in this park.
Two five-minute bird counts were carried out at each station each year, with each count being carried out on a different day. All counts were carried out in November or early December each year and counts were made only on fine, calm days between 1.5 hours after sunrise and 1.5 hours before sunset (approximately 7.30 am to 6.30 pm). At each station, an observer spent five minutes recording the number of individuals of all species seen or heard from the count station (i.e. an unbounded count as per Dawson & Bull, 1975 and Hartley & Greene, 2012). Care was taken not to record the same bird twice during a count. Two experienced observers were employed to conduct the count each year, with each observer surveying each bird count station once.
Bird conspicuousness can vary in response to a number of variables such as time of year, weather, time of day and change in observer (Bibby et al, 2000). Because of this, every effort was made to standardise or sample the range of variation in each of these factors so that we could be fairly confident that any changes in the mean number of birds counted per station from one year to the next would more likely reflect changes in bird abundance rather than conspicuousness. Precautions taken include carrying out these counts during the same months each year and in similar weather conditions. Counts were carried out throughout the day, so sampled any variation in bird conspicuousness that occurred during the day.

State and trends in the diversity, abundance and distribution of birds in Upper Hutt City
McArthur, N.; Govella, S.; Walter, J. and Small, D. 6
Figure 2.1: Locations of bird count stations surveyed in Upper Hutt parks and reserves between 2011 and 2014 (Note: the single count station in Cloustonville Park is not shown).
2.2 Five-minute bird count data analysis
The Upper Hutt City five-minute bird count data were entered into a Microsoft Excel spreadsheet, along with five-minute bird count data collected from Wellington City (n=200) and south Wairarapa (n=45) reserves as well as Porirua Scenic Reserve (n=45), all of which were also surveyed between 2011 and 2014. Details of the survey design, location and number of reserves sampled in Wellington City can be found described in McArthur et al, (2015), whereas the south Wairarapa reserves sampled included O’Connor’s Bush in Greytown Memorial Park, Tauherenikau Bush at the Tauherenikau Racecourse and Waihora Bush (Waihora Stream on NW boundary of Aorangi Forest Park).
Once entered, these bird count data were used to calculate the mean number of native forest bird species detected per five-minute bird count for each reserve network and each year, in order to examine temporal and spatial patterns in the diversity of resident native species. For the purposes of this analysis, we defined a “native forest bird” as any native species capable of maintaining a functional population entirely within native forest habitat, and therefore likely to be a resident rather than transitory species in this habitat. We also used these data to calculate the mean number of birds of each species recorded per count for each network and each year, to create indices of the relative abundance and/or conspicuousness of each bird species in the Upper Hutt City reserves that we sampled (Dawson & Bull, 1975).
Because these raw data consist of relatively low counts which are naturally truncated at zero, the data are too skewed to conform to a normal distribution, a key assumption for many parametric tests for statistical significance (Fowler & Cohen, 1995). To deal with this, we first added a value of 1.0 to the
State and trends in the diversity, abundance and distribution of birds in Upper Hutt City
McArthur, N.; Govella, S.; Walter, J. and Small, D. 7
number of species and individuals recorded during each count in order to remove zero values from the dataset, then applied an a priori square root transformation to the data to ensure that they were approximately normally distributed and with approximately equal sample variances before we proceeded with any further analyses. Once we were satisfied that our transformed data met these assumptions, we used one-way analyses of variance (ANOVA) to test for statistically-significant differences in mean species diversity values and abundance indices in Upper Hutt City reserves between years. To test for difference in mean values between years and reserve networks, we used two-way ANOVAs. However, because two-way ANOVAs require sample sizes to be equal, we performed the test on a random sub-sample of 90 Wellington City bird counts in order to compare mean values with those calculated from the Upper Hutt City bird count data. In cases where the results of our ANOVAs did indicate that mean values varied significantly, we then applied two-tailed z-tests to the transformed dataset to determine which of the mean values in each group varied significantly from each other (Fowler & Cohen, 1995). Both the ANOVAs and z-tests are important because a statistically-significant result indicates that any difference between the two or more means being compared is very unlikely to have occurred due to chance sampling error, so instead is assumed to represent a real difference in the diversity or abundance of native forest birds between years, or between one or more of the four reserve networks/sites that we surveyed.
Patterns in the bird distribution among the Upper Hutt City reserves we sampled were examined by mapping the relative frequency at which each bird species was detected at each bird count station using ArcMap version 10.3.1. Although this technique does not explicitly take into account relative differences in abundance (less common species present within sight or earshot of a bid count station are less likely to be detected) or variation in detection probabilities between species (less conspicuous species will also be less likely to be detected), it should be sufficient to detect relatively large changes in species’ distributions (MacKenzie et al, 2006).
2.3 Citizen science data analysis
The New Zealand eBird database (http://ebird.org/content/newzealand/) is a citizen science enterprise run by the Cornell Lab of Ornithology in partnership with Birds New Zealand (formerly the Ornithological Society of New Zealand). The eBird database provides a facility for recreational birdwatchers to permanently record their observations in a standard format and in one centralised location and to make these observations available to researchers, conservation managers and environmental policy-makers (Scofield et al, 2012). Globally, the eBird database is now the largest and fastest-growing biodiversity database in the world, with over 150 000 unique users having already contributed over 250 million bird records describing the distribution of 98% of the world’s bird species (Sullivan et al, 2014).
The New Zealand eBird database now contains in excess of 100 000 bird records recorded by citizen scientists in the Wellington region. Automated data filters and an expert review process ensures that these data are of relatively high quality and accuracy (Sullivan et al, 2014). We used eBird’s “download data” tool to access the August 2015 release of the eBird basic dataset (EBD) and to build custom datasets containing citizen science records of all native forest bird species recorded in Upper Hutt City between 2011 and 2015. We formatted these datasets using Microsoft Excel, including removing any extraneous data fields and converting latitude/longitude coordinates into NZTM coordinates. We then saved these files as tab-delimited text files so that they could be imported into ArcMap. Once in ArcMap, we visually inspected these eBird records to locate and remove any records containing obvious location errors (e.g. records placed offshore, or for which location descriptions didn’t match the coordinates provided) before adding these records to the distribution maps created from the five-minute bird count data.
A key difference between these eBird datasets and the five-minute bird count data is that the temporal and spatial distribution of search effort spent by citizen scientists contributing to the EBD
State and trends in the diversity, abundance and distribution of birds in Upper Hutt City
McArthur, N.; Govella, S.; Walter, J. and Small, D. 8
varies unpredictably from year to year, whereas this search effort is standardised during these five-minute bird counts. Nonetheless, verified bird records submitted to eBird have the potential to complement distribution data derived from our five-minute bird count dataset by providing information describing the presence of native forest birds at locations and in habitats not sampled by these five-minute bird counts.

State and trends in the diversity, abundance and distribution of birds in Upper Hutt City
McArthur, N.; Govella, S.; Walter, J. and Small, D. 9
3 RESULTS
3.1 Species diversity
The total number of bird species detected during these five minute bird counts has varied little between 2011 and 2014, with between 26 and 31 bird species detected each year (Figure 3.1). Between 0% and 10% of these species detected each year are native species ranked as either Nationally Threatened or ‘At Risk’ under the New Zealand Threat Classification System and a further 45% to 54% are native species ranked as Not Threatened (Robertson et al, 2013). Between 41% and 46% of species detected are listed as Introduced and Naturalised (see Appendix).
Figure 3.1: Total number of bird species detected during five-minute bird counts carried out in Upper Hutt City parks and reserves, 2011-2014.
Thirteen of the native bird species detected between 2011 and 2014 were species that are typically found in native forest habitat and it is these species for which trends in relative abundance and distribution have been reported below. The remaining native species recorded were either open country or coastal species such as Australasian harrier (Circus approximans), paradise shelduck (Tadorna variegata) or black-backed gull (Larus dominicanus) and are not included in any further analyses.
Wi Tako Reserve and Keith George Memorial Park both supported the highest diversity of native forest bird species between 2011 and 2014. During most years, all of the native forest bird species detected in Upper Hutt reserves were present in these two reserves (Figure 3.2). Annual variation in the number of species detected in each of these reserves are caused by the detection or non-detection of relatively rare or inconspicuous species such as kakariki and rifleman, and by the recolonization of some of the smaller reserves by fantails following a severe reduction in local populations during the winter of 2011 (Figure 3.2; McArthur et al, 2012).
0
5
10
15
20
25
30
35
2011 2012 2013 2014
Nu
mb
er
of
spe
cie
s d
ete
cte
d
Year
Introduced andNaturalised
Native, NotThreatened
Native, NationallyThreatened or 'AtRisk'
State and trends in the diversity, abundance and distribution of birds in Upper Hutt City
McArthur, N.; Govella, S.; Walter, J. and Small, D. 10
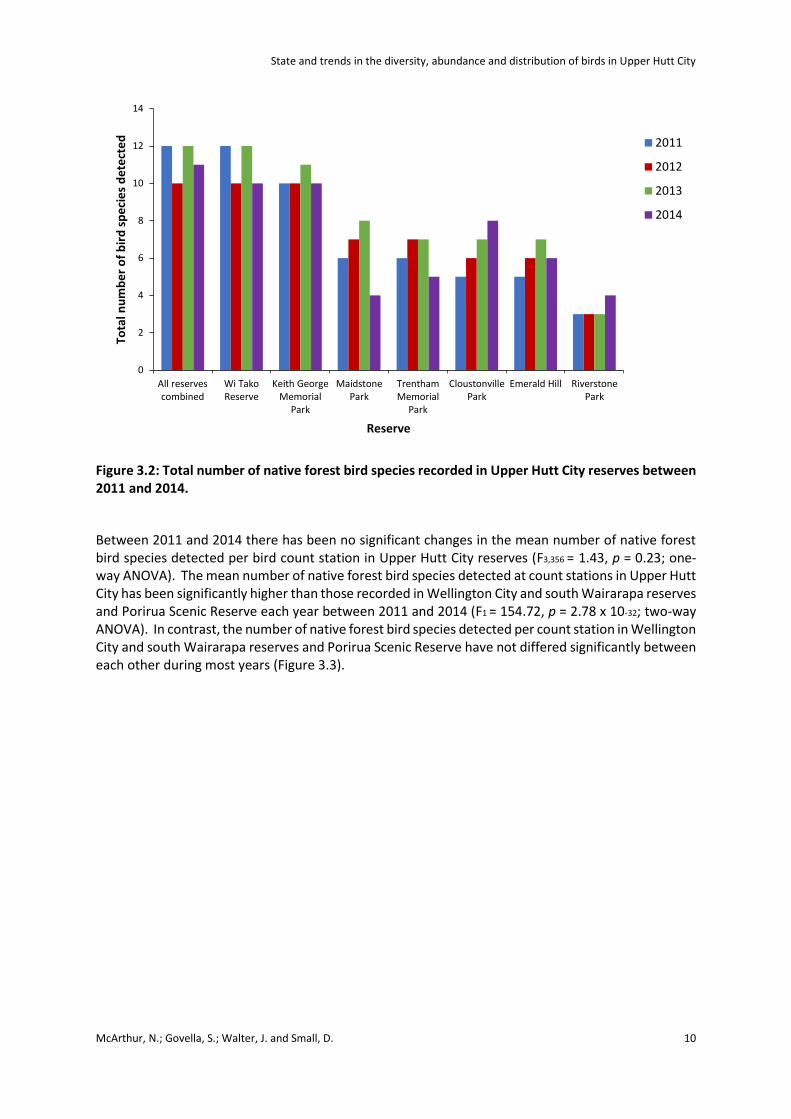
Figure 3.2: Total number of native forest bird species recorded in Upper Hutt City reserves between 2011 and 2014.
Between 2011 and 2014 there has been no significant changes in the mean number of native forest bird species detected per bird count station in Upper Hutt City reserves (F3,356 = 1.43, p = 0.23; one-way ANOVA). The mean number of native forest bird species detected at count stations in Upper Hutt City has been significantly higher than those recorded in Wellington City and south Wairarapa reserves and Porirua Scenic Reserve each year between 2011 and 2014 (F1 = 154.72, p = 2.78 x 10⁻³²; two-way ANOVA). In contrast, the number of native forest bird species detected per count station in Wellington City and south Wairarapa reserves and Porirua Scenic Reserve have not differed significantly between each other during most years (Figure 3.3).
0
2
4
6
8
10
12
14
All reservescombined
Wi TakoReserve
Keith GeorgeMemorial
Park
MaidstonePark
TrenthamMemorial
Park
CloustonvillePark
Emerald Hill RiverstonePark
Tota
l nu
mb
er
of
bir
d s
pe
cie
s d
ete
cte
d
Reserve
2011
2012
2013
2014
State and trends in the diversity, abundance and distribution of birds in Upper Hutt City
McArthur, N.; Govella, S.; Walter, J. and Small, D. 11
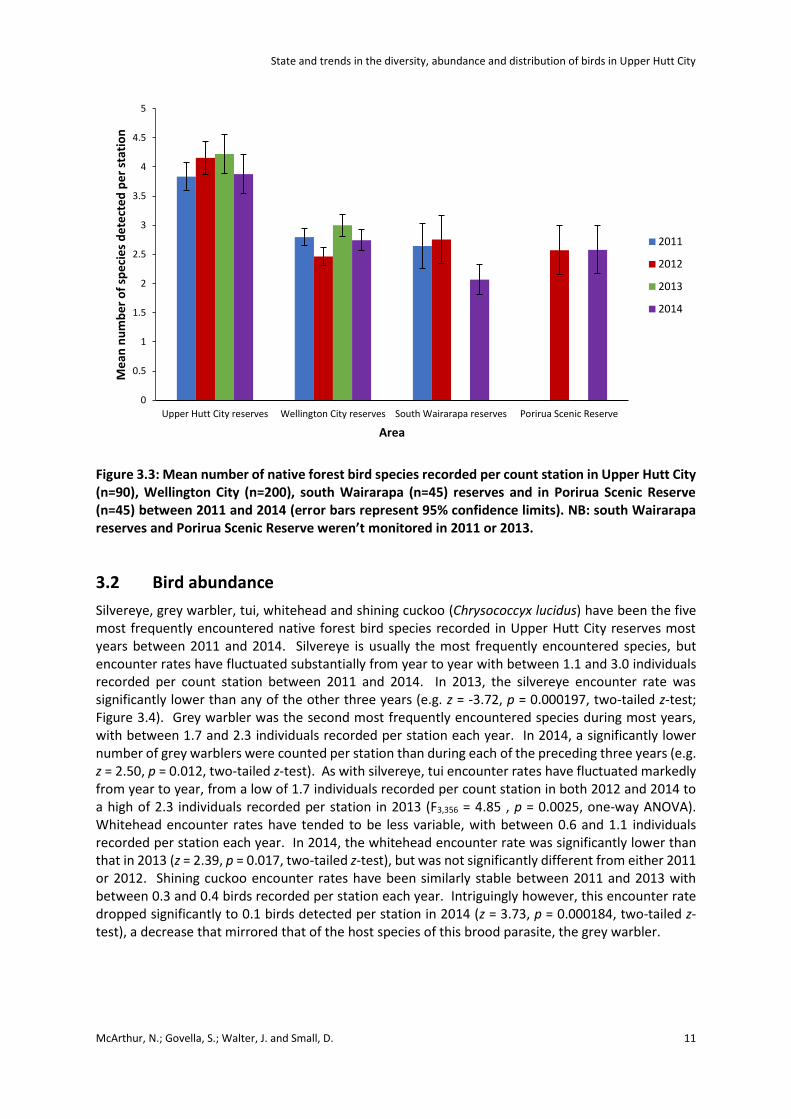
Figure 3.3: Mean number of native forest bird species recorded per count station in Upper Hutt City (n=90), Wellington City (n=200), south Wairarapa (n=45) reserves and in Porirua Scenic Reserve (n=45) between 2011 and 2014 (error bars represent 95% confidence limits). NB: south Wairarapa reserves and Porirua Scenic Reserve weren’t monitored in 2011 or 2013.
3.2 Bird abundance
Silvereye, grey warbler, tui, whitehead and shining cuckoo (Chrysococcyx lucidus) have been the five most frequently encountered native forest bird species recorded in Upper Hutt City reserves most years between 2011 and 2014. Silvereye is usually the most frequently encountered species, but encounter rates have fluctuated substantially from year to year with between 1.1 and 3.0 individuals recorded per count station between 2011 and 2014. In 2013, the silvereye encounter rate was significantly lower than any of the other three years (e.g. z = -3.72, p = 0.000197, two-tailed z-test; Figure 3.4). Grey warbler was the second most frequently encountered species during most years, with between 1.7 and 2.3 individuals recorded per station each year. In 2014, a significantly lower number of grey warblers were counted per station than during each of the preceding three years (e.g. z = 2.50, p = 0.012, two-tailed z-test). As with silvereye, tui encounter rates have fluctuated markedly from year to year, from a low of 1.7 individuals recorded per count station in both 2012 and 2014 to a high of 2.3 individuals recorded per station in 2013 (F3,356 = 4.85 , p = 0.0025, one-way ANOVA). Whitehead encounter rates have tended to be less variable, with between 0.6 and 1.1 individuals recorded per station each year. In 2014, the whitehead encounter rate was significantly lower than that in 2013 (z = 2.39, p = 0.017, two-tailed z-test), but was not significantly different from either 2011 or 2012. Shining cuckoo encounter rates have been similarly stable between 2011 and 2013 with between 0.3 and 0.4 birds recorded per station each year. Intriguingly however, this encounter rate dropped significantly to 0.1 birds detected per station in 2014 (z = 3.73, p = 0.000184, two-tailed z-test), a decrease that mirrored that of the host species of this brood parasite, the grey warbler.
0
0.5
1
1.5
2
2.5
3
3.5
4
4.5
5
Upper Hutt City reserves Wellington City reserves South Wairarapa reserves Porirua Scenic Reserve
Me
an n
um
be
r o
f sp
eci
es
de
tect
ed
pe
r st
atio
n
Area
2011
2012
2013
2014

State and trends in the diversity, abundance and distribution of birds in Upper Hutt City
McArthur, N.; Govella, S.; Walter, J. and Small, D. 12
Figure 3.4: Mean number of birds recorded per count station for relatively common or conspicuous native forest bird species recorded in Upper Hutt City reserves between 2011 and 2014 (error bars represent 95% confidence limits).
The eight remaining native forest bird species are typically encountered at rates of less than 0.5 birds per count station each year (Figure 3.5). Encounter rates for tomtit increased significantly from 0.26 – 0.29 individuals recorded per station in 2011 and 2012 to 0.7 individuals recorded in 2013 (e.g. z = -3.597, p = 0.000322, two-tailed z-test), and remained comparatively high with 0.41 individuals recorded per station in 2014. In contrast, New Zealand kingfisher (Todiramphus sanctus) encounter rates have remained relatively stable over the four years, with between 0.17 and 0.27 individuals counted per bird count station each year. The 0.06 kereru (Hemiphaga novaeseelandiae) recorded per station in 2014 was significantly lower than the 0.12 – 0.24 individuals recorded over the preceding three years (e.g. z = 2.789, p = 0.0053, two-tailed z-test). In contrast, bellbird encounter rates have been significantly higher between 2012 and 2014 than in 2011 (e.g. z = -2.13, p = 0.033, two-tailed z-test). Of all of the native bird species present in Upper Hutt reserves however, the New Zealand fantail has undergone the most dramatic change in abundance, with fantail encounter rates increasing from a low of 0.07 individuals counted per bird count station in 2011 to 0.78 individuals per station in 2014, representing an 11-fold increase in abundance over four years (z = -8.08, p = 6.66 x 10⁻¹⁶, two-tailed z-test).
Several other native species are sufficiently rare or inconspicuous that they are not detected during five-minute bird counts every year. Both kakariki and rifleman were detected in 2011 and 2013, but not in 2012 or 2014, and a single New Zealand falcon (Falco novaeseelandiae) was detected during a five-minute bird count in 2014. Morepork (Ninox novaeseelandiae) is possibly the only resident native species that has not yet been detected during these five-minute bird counts. Being a nocturnal species however, moreporks are fairly unlikely to be detected during these daytime counts. Morepork has been recorded by local citizen scientists in Harcourt Park, Keith George Memorial Park and in Wi Tako Reserve (NZ eBird database, http://ebird.org/content/newzealand/; accessed 19/10/2015) and a successful breeding attempt was monitored by Greater Wellington Regional Council contractors in Wi Tako Reserve in November 2009 (G. Falconer, personal communication).
0
0.5
1
1.5
2
2.5
3
3.5
4
Silvereye Grey warbler Tui Whitehead Shining cuckoo
Me
an n
um
be
r o
f b
ird
s co
un
ted
pe
r st
atio
n
Species
2011
2012
2013
2014

State and trends in the diversity, abundance and distribution of birds in Upper Hutt City
McArthur, N.; Govella, S.; Walter, J. and Small, D. 13
Figure 3.5: Mean number of birds recorded per count station for relatively rare or inconspicuous native forest bird species recorded in Upper Hutt City reserves between 2011 and 2014 (error bars represent 95% confidence limits).
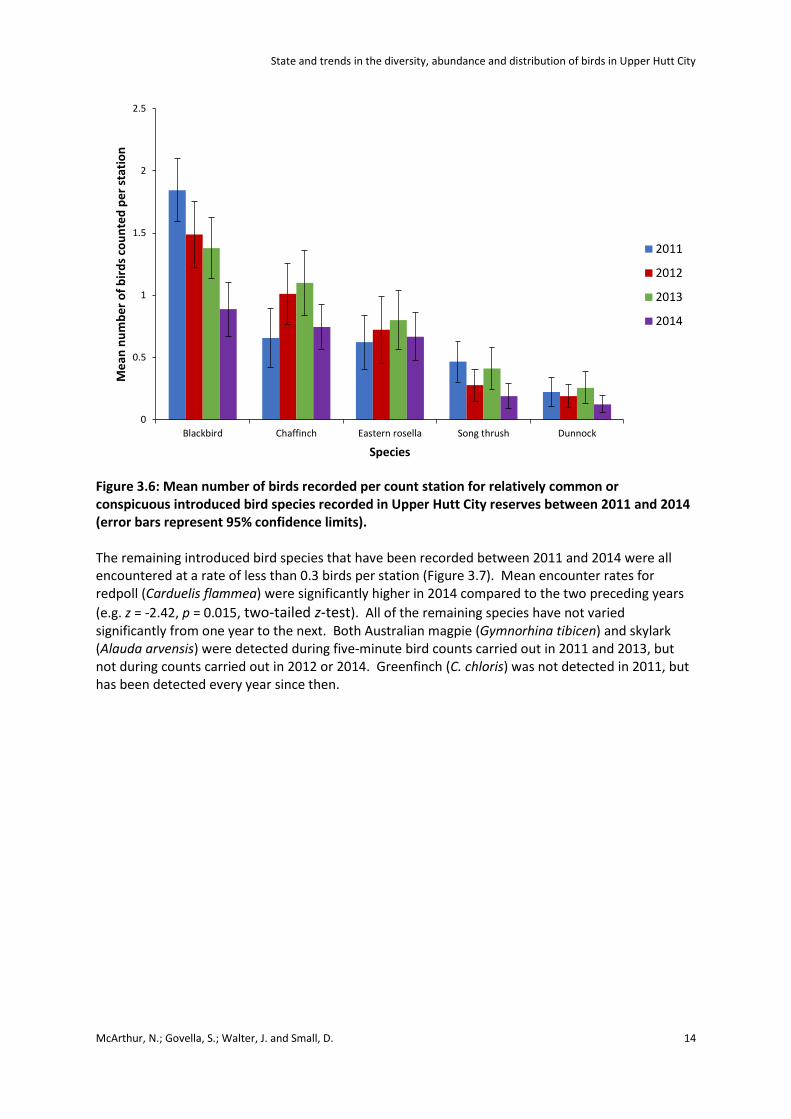
Blackbird (Turdus merula), chaffinch (Fringilla coelebs), eastern rosella (Platycercus eximius), song thrush (T. philomelos) and dunnock (Prunella modularis) have been the five most frequently encountered introduced bird species recorded in Upper Hutt City reserves between 2011 and 2014. Blackbird has been the most abundant species, with between 0.9 and 1.8 blackbirds counted per station each year. Blackbird encounter rates have decreased significantly between 2011 and 2014 (F3, 356 = 0.0012, p = 3.67 x 10⁻⁷, one-way ANOVA). In contrast, encounter rates for chaffinch, eastern rosella, song thrush and dunnock have not varied significantly from one year to the next (Figure 3.6).
0
0.1
0.2
0.3
0.4
0.5
0.6
0.7
0.8
0.9
1
Tomtit Kingfisher Kereru Bellbird Fantail Kakariki Rifleman NZ Falcon
Me
an n
um
be
r o
f b
ird
s co
un
ted
pe
r st
atio
n
Species
2011
2012
2013
2014
State and trends in the diversity, abundance and distribution of birds in Upper Hutt City
McArthur, N.; Govella, S.; Walter, J. and Small, D. 14
Figure 3.6: Mean number of birds recorded per count station for relatively common or conspicuous introduced bird species recorded in Upper Hutt City reserves between 2011 and 2014 (error bars represent 95% confidence limits). The remaining introduced bird species that have been recorded between 2011 and 2014 were all encountered at a rate of less than 0.3 birds per station (Figure 3.7). Mean encounter rates for redpoll (Carduelis flammea) were significantly higher in 2014 compared to the two preceding years
(e.g. z = -2.42, p = 0.015, two-tailed z-test). All of the remaining species have not varied significantly from one year to the next. Both Australian magpie (Gymnorhina tibicen) and skylark (Alauda arvensis) were detected during five-minute bird counts carried out in 2011 and 2013, but not during counts carried out in 2012 or 2014. Greenfinch (C. chloris) was not detected in 2011, but has been detected every year since then.
0
0.5
1
1.5
2
2.5
Blackbird Chaffinch Eastern rosella Song thrush Dunnock
Me
an n
um
be
r o
f b
ird
s co
un
ted
pe
r st
atio
n
Species
2011
2012
2013
2014

State and trends in the diversity, abundance and distribution of birds in Upper Hutt City
McArthur, N.; Govella, S.; Walter, J. and Small, D. 15
Figure 3.7: Mean number of birds recorded per count station for relatively rare or inconspicuous introduced bird species recorded in Upper Hutt City reserves between 2011 and 2014 (error bars represent 95% confidence limits).
3.3 Native bird distribution
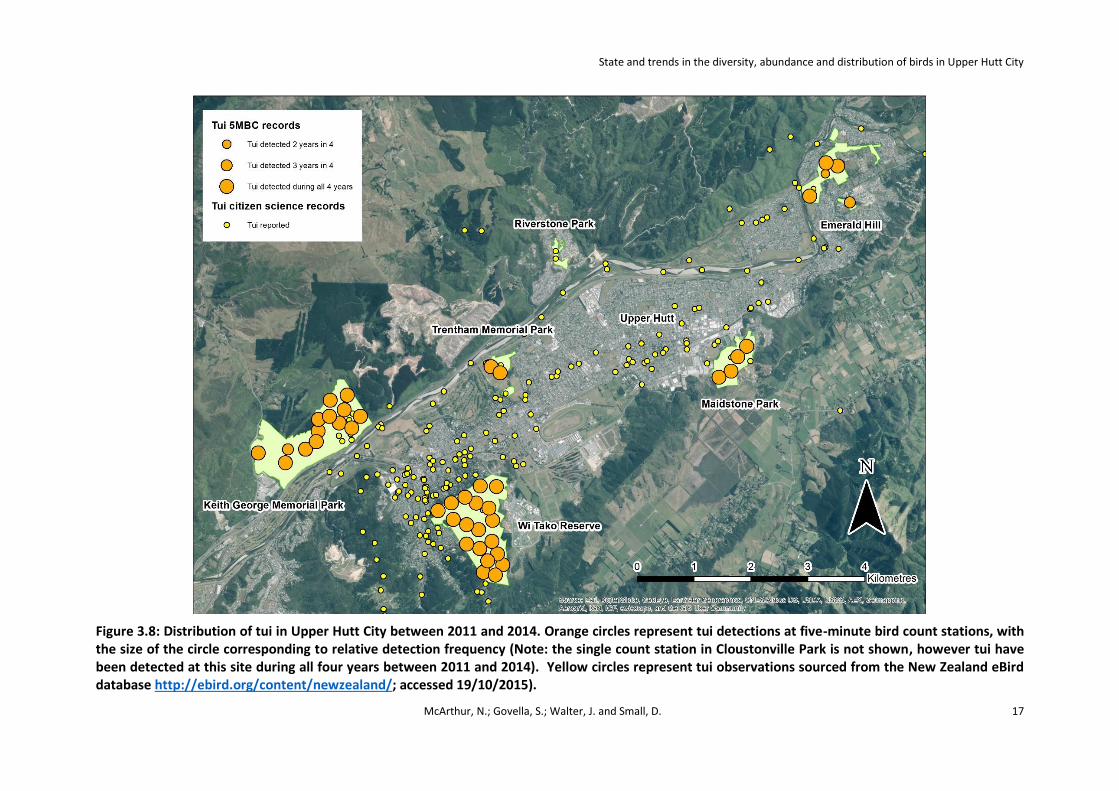
The tui is widespread across Upper Hutt City, and have been recorded at every one of the 45 five-minute bird count stations that have been surveyed between 2011 and 2014 (Figure 3.8). Tui are also frequently reported by local residents from suburban gardens throughout Upper Hutt, particularly between late August and early October when birds are attracted to flowering garden plants including kowhai (Sophora sp.), eucalypts (Eucalyptus spp.) and Banksias (Banksia spp.).
Upper Hutt’s other resident native honeyeater, the bellbird, is more restricted in distribution having only been detected in five of the seven reserves surveyed. Bellbirds have been detected in Keith George Memorial Park, Wi Tako Reserve, Maidstone Park, Emerald Hill and Cloustonville Park between 2011 and 2014. In Keith George Memorial Park, bellbirds are noticeably more frequently encountered in the north-eastern part of the reserve (Figure 3.9). Bellbirds are also regularly reported from south-western Upper Hutt suburbs including Pinehaven and Silverstream, and from north-eastern suburbs such as Birchville, Brown Owl and Emerald Hill. At the present time however, bellbirds appear to be absent or very infrequent visitors to central Upper Hutt.
The New Zealand pigeon, or kereru, has likewise been detected in only five of the seven reserves surveyed. Kereru have been detected in Keith George Memorial Park, Wi Tako Reserve, Trentham Memorial Park, Maidstone Park and Cloustonville Park. As with tui, kereru are a common visitor to suburban gardens throughout Upper Hutt, particularly in late winter and early spring when garden plants such as kowhai are flowering (Figure 3.10).
Fantails are now once again relatively widespread in Upper Hutt City and have been recorded in all of the seven Upper Hutt reserves sampled, with the exception of Riverstone Park. In Keith George Memorial Park, fantails are substantially more frequently encountered in the north-eastern part of the reserve. Fantails are also commonly reported from suburban gardens in Upper Hutt (Figure 3.12).
0
0.05
0.1
0.15
0.2
0.25
0.3
0.35
0.4
0.45
Goldfinch House sparrow Redpoll Yellowhammer Australianmagpie
Starling Skylark Greenfinch
Me
an n
um
be
r o
f b
ird
s co
un
ted
pe
r st
atio
n
Species
2011
2012
2013
2014

State and trends in the diversity, abundance and distribution of birds in Upper Hutt City
McArthur, N.; Govella, S.; Walter, J. and Small, D. 16
Tomtits have only been recorded in three of the seven reserves surveyed, Keith George Memorial Park, Wi Tako Reserve and Cloustonville Park. Tomtits are much more frequently encountered in north-eastern parts of Keith George Memorial Park and in southern parts of Wi Tako Reserve. Outside of these reserves, tomtits have also been reported from nearby native and exotic plantation forests with good habitat connectivity to surrounding tracts of forest, including the Akatarawa Forest, the Flux covenant near Moonshine Road and the Pinehaven and Silverstream spurs (Figure 3.12). Unlike other common native insectivores such as fantails and grey warblers, tomtits appear not to use suburban habitats, despite being present in adjacent areas of forest.
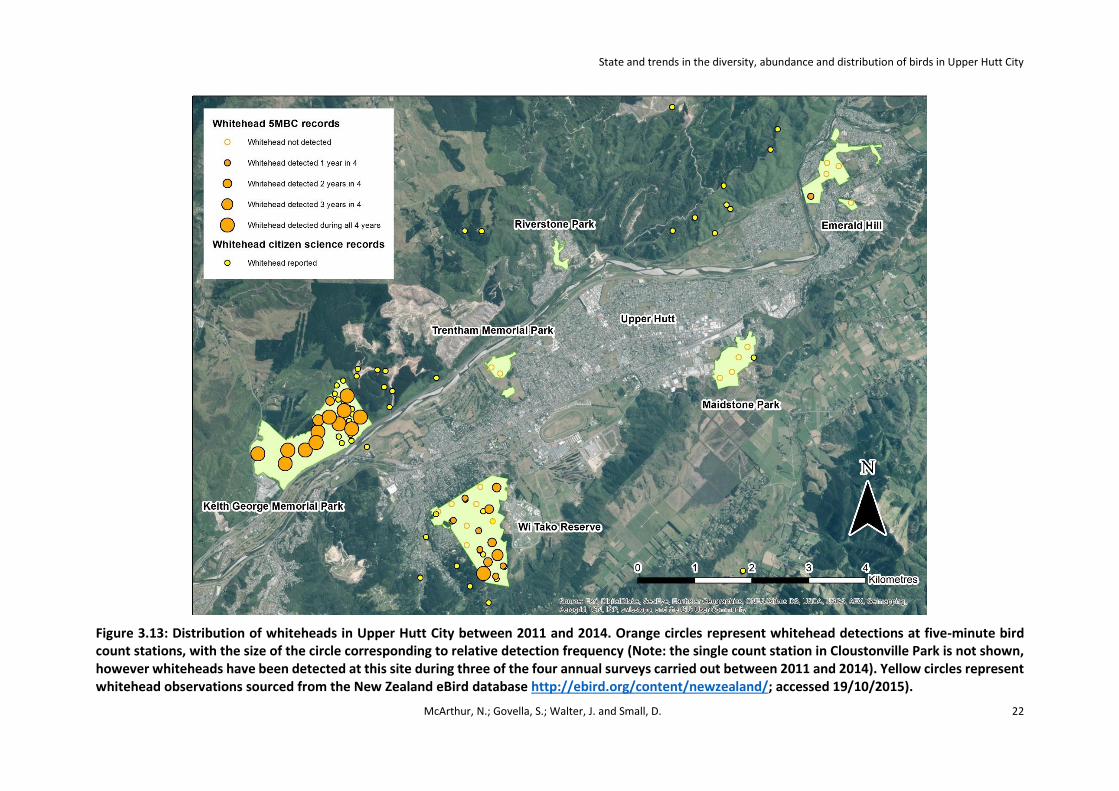
Whiteheads have been recorded in five of the seven reserves surveyed, including Keith George Memorial Park, Wi Tako Reserve, Emerald Hill, Cloustonville Park and Maidstone Park. At the latter site, whiteheads have been reported as occurring in the park by a local citizen scientist, but have not yet been detected during a five-minute bird count. In Wi Tako Reserve, whiteheads are substantially more frequently encountered in southern parts of the reserve. Whiteheads have also been recorded occurring in both native and exotic plantation forest on either side of the Hutt Valley, but are seldom reported from suburban habitats (Figure 3.13).
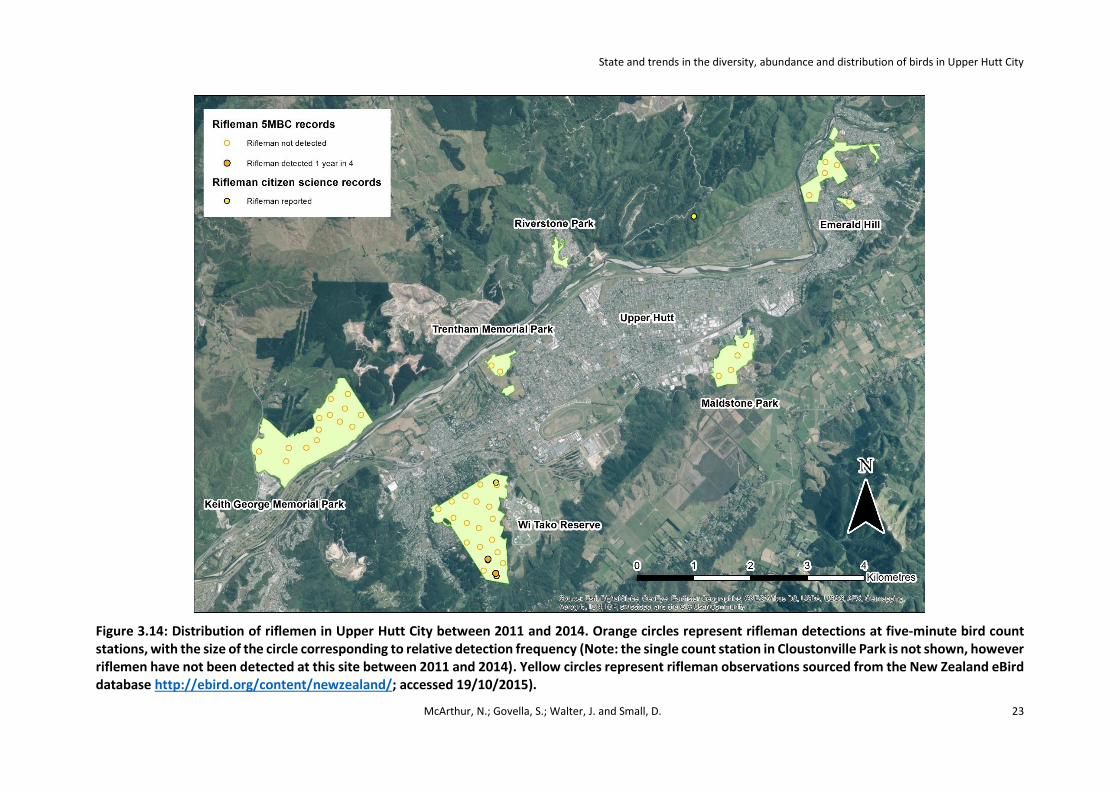
The rifleman is currently Upper Hutt’s most range-restricted species, having only been detected at two five-minute bird count stations in Wi Tako Reserve during the five-minute bird counts carried out between 2011 and 2014. Citizen scientist records are similarly rare, with only one sighting reported from the north-eastern corner of Wi Tako reserve and one record from the Akatarawa Forest near Totara Park (Figure 3.14).
The New Zealand falcon is the most highly threatened bird species present in Upper Hutt City, being classified as Nationally Vulnerable under New Zealand’s Threat Classification System (Robertson et al, 2013). The New Zealand falcon has been recorded once during five-minute bird counts carried out between 2011 and 2014, a single individual was detected at a bird count station in Emerald Hill in 2014. Being an extremely mobile and easily recognisable species, New Zealand falcons are regularly reported by local citizen scientists, however. Falcon sightings appear to peak in suburban habitats in Upper Hutt during late summer/autumn, likely due to a small annual influx of recently-independent juveniles dispersing from natal territories in nearby tracts of native forest such as the Akatarawa Forest, Belmont Regional Park and the Rimutaka/Orongorongo Ranges (Figures 3.15 and 4.2).
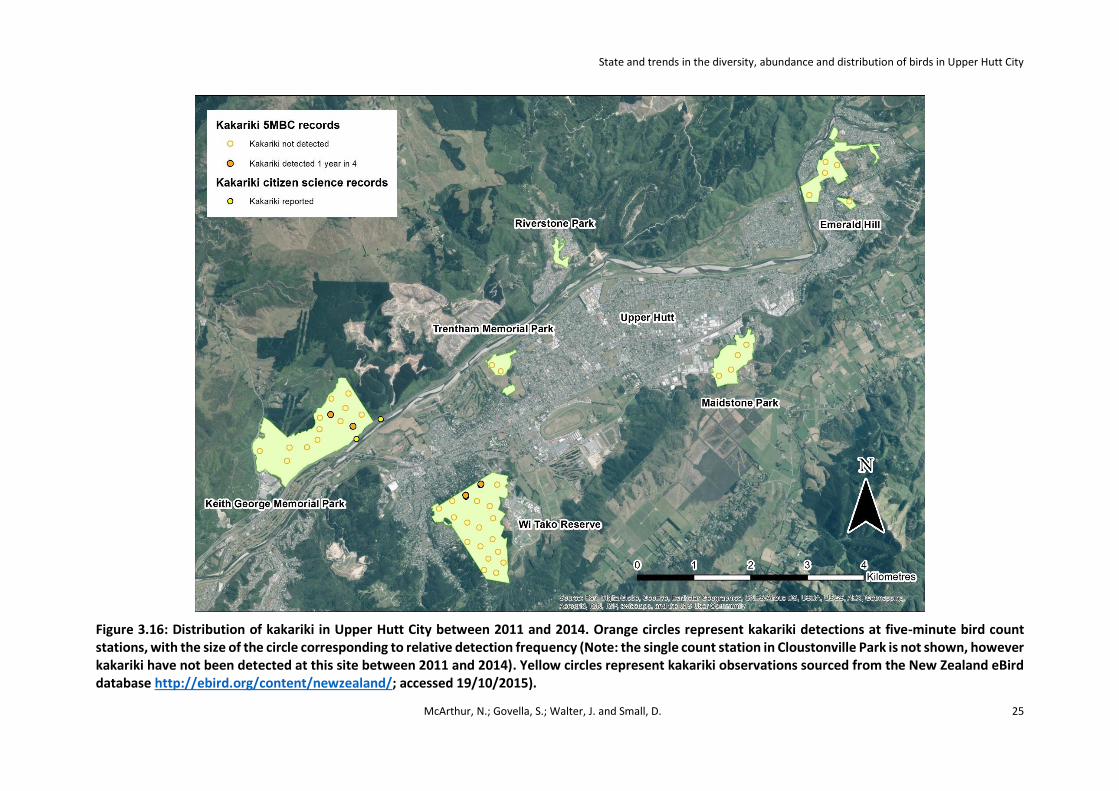
Kakariki have only been detected at two of the seven reserves surveyed between 2011 and 2014, Keith George Memorial Park and Wi Tako Reserve. One of Upper Hutt’s most uncommon native birds, kakariki have also only been reported by citizen scientists on a couple of occasions, both on the Hutt River adjacent to Keith George Memorial Park (Figure 3.16). In contrast, the introduced eastern rosella is extremely widespread in Upper Hutt. Eastern rosellas have been recorded in all of the reserves surveyed, with the exception of Riverstone Park. Furthermore, rosellas are frequently recorded by local citizen scientists visiting suburban gardens throughout Upper Hutt. As with a number of other species, eastern rosellas appear to be substantially more frequently encountered in north eastern parts of Keith George Memorial Park (Figure 3.17).
State and trends in the diversity, abundance and distribution of birds in Upper Hutt City
McArthur, N.; Govella, S.; Walter, J. and Small, D. 17
Figure 3.8: Distribution of tui in Upper Hutt City between 2011 and 2014. Orange circles represent tui detections at five-minute bird count stations, with the size of the circle corresponding to relative detection frequency (Note: the single count station in Cloustonville Park is not shown, however tui have been detected at this site during all four years between 2011 and 2014). Yellow circles represent tui observations sourced from the New Zealand eBird database http://ebird.org/content/newzealand/; accessed 19/10/2015).

State and trends in the diversity, abundance and distribution of birds in Upper Hutt City
McArthur, N.; Govella, S.; Walter, J. and Small, D. 18
Figure 3.10: Distribution of bellbirds in Upper Hutt City between 2011 and 2014. Orange circles represent bellbird detections at five-minute bird count stations, with the size of the circle corresponding to relative detection frequency (Note: the single count station in Cloustonville Park is not shown, however bellbirds have been detected at this site during three of the four annual surveys carried out between 2011 and 2014). Yellow circles represent bellbird observations sourced from the New Zealand eBird database http://ebird.org/content/newzealand/; accessed 19/10/2015).

State and trends in the diversity, abundance and distribution of birds in Upper Hutt City
McArthur, N.; Govella, S.; Walter, J. and Small, D. 19
Figure 3.9: Distribution of kereru in Upper Hutt City between 2011 and 2014. Orange circles represent kereru detections at five-minute bird count stations, with the size of the circle corresponding to relative detection frequency (Note: the single count station in Cloustonville Park is not shown, however kereru have been detected at this site during one of the four annual surveys carried out between 2011 and 2014). Yellow circles represent kereru observations sourced from the New Zealand eBird database http://ebird.org/content/newzealand/; accessed 19/10/2015).

State and trends in the diversity, abundance and distribution of birds in Upper Hutt City
McArthur, N.; Govella, S.; Walter, J. and Small, D. 20
Figure 3.11: Distribution of fantails in Upper Hutt City between 2011 and 2014. Orange circles represent fantail detections at five-minute bird count stations, with the size of the circle corresponding to relative detection frequency (Note: the single count station in Cloustonville Park is not shown, however fantails have been detected at this site during one of the four annual surveys carried out between 2011 and 2014). Yellow circles represent fantail observations sourced from the New Zealand eBird database http://ebird.org/content/newzealand/; accessed 19/10/2015).

State and trends in the diversity, abundance and distribution of birds in Upper Hutt City
McArthur, N.; Govella, S.; Walter, J. and Small, D. 21
Figure 3.12: Distribution of tomtits in Upper Hutt City between 2011 and 2014. Orange circles represent tomtit detections at five-minute bird count stations, with the size of the circle corresponding to relative detection frequency (Note: the single count station in Cloustonville Park is not shown, however tomtits have been detected at this site during three of the four annual surveys carried out between 2011 and 2014). Yellow circles represent tomtit observations sourced from the New Zealand eBird database (http://ebird.org/content/newzealand/; accessed 19/10/2015).
State and trends in the diversity, abundance and distribution of birds in Upper Hutt City
McArthur, N.; Govella, S.; Walter, J. and Small, D. 22
Figure 3.13: Distribution of whiteheads in Upper Hutt City between 2011 and 2014. Orange circles represent whitehead detections at five-minute bird count stations, with the size of the circle corresponding to relative detection frequency (Note: the single count station in Cloustonville Park is not shown, however whiteheads have been detected at this site during three of the four annual surveys carried out between 2011 and 2014). Yellow circles represent whitehead observations sourced from the New Zealand eBird database http://ebird.org/content/newzealand/; accessed 19/10/2015).
State and trends in the diversity, abundance and distribution of birds in Upper Hutt City
McArthur, N.; Govella, S.; Walter, J. and Small, D. 23
Figure 3.14: Distribution of riflemen in Upper Hutt City between 2011 and 2014. Orange circles represent rifleman detections at five-minute bird count stations, with the size of the circle corresponding to relative detection frequency (Note: the single count station in Cloustonville Park is not shown, however riflemen have not been detected at this site between 2011 and 2014). Yellow circles represent rifleman observations sourced from the New Zealand eBird database http://ebird.org/content/newzealand/; accessed 19/10/2015).

State and trends in the diversity, abundance and distribution of birds in Upper Hutt City
McArthur, N.; Govella, S.; Walter, J. and Small, D. 24
Figure 3.15: Distribution of NZ falcons in Upper Hutt City between 2011 and 2014. Orange circles represent NZ falcon detections at five-minute bird count stations, with the size of the circle corresponding to relative detection frequency (Note: the single count station in Cloustonville Park is not shown, however NZ falcons have not been detected at this site between 2011 and 2014). Yellow circles represent NZ falcon observations sourced from the New Zealand eBird database http://ebird.org/content/newzealand/; accessed 19/10/2015).
State and trends in the diversity, abundance and distribution of birds in Upper Hutt City
McArthur, N.; Govella, S.; Walter, J. and Small, D. 25
Figure 3.16: Distribution of kakariki in Upper Hutt City between 2011 and 2014. Orange circles represent kakariki detections at five-minute bird count stations, with the size of the circle corresponding to relative detection frequency (Note: the single count station in Cloustonville Park is not shown, however kakariki have not been detected at this site between 2011 and 2014). Yellow circles represent kakariki observations sourced from the New Zealand eBird database http://ebird.org/content/newzealand/; accessed 19/10/2015).

State and trends in the diversity, abundance and distribution of birds in Upper Hutt City
McArthur, N.; Govella, S.; Walter, J. and Small, D. 26
Figure 3.17: Distribution of eastern rosellas in Upper Hutt City between 2011 and 2014. Orange circles represent eastern rosella detections at five-minute bird count stations, with the size of the circle corresponding to relative detection frequency (Note: the single count station in Cloustonville Park is not shown, however eastern rosellas have been detected at this site during one of the four annual surveys carried out between 2011 and 2014). Yellow circles represent eastern rosella observations sourced from the New Zealand eBird database http://ebird.org/content/newzealand/; accessed 19/10/2015)
State and trends in the diversity, abundance and distribution of birds in Upper Hutt City
McArthur, N.; Govella, S.; Walter, J. and Small, D. 27
4 DISCUSSION
4.1 Species diversity
The number of native forest bird species detected during these five-minute counts has varied little since 2011, suggesting that current environmental management practices are succeeding at maintaining native species diversity in these parks and reserves. The majority of those native species that are present tend to be either those that are able to cope with significant modification and fragmentation of forest habitats and can persist in the presence of mammalian predators (e.g. grey warbler and silvereye), or those that possess strong dispersal abilities (e.g. kereru) that are able to reach these reserves from larger tracts of bush nearby (Heather & Robertson, 2015).
Two of the native forest bird species detected during these counts, rifleman and kakariki appear to be extremely uncommon and with very localised distributions, to the extent that they’re unlikely to be maintaining functional populations in the reserves in which they’ve been detected. Riflemen have only been detected at three locations in Wi Tako Reserve over the past four years, with only one or two birds observed on any one occasion. While current levels of mammalian pest control should be sufficient to allow a rifleman population to recover, the results of this monitoring suggests that this recovery isn’t occurring. Management options to improve the likelihood that riflemen will re-establish a self-sustaining population in Wi Tako Reserve include the installation of nest boxes to improve rifleman nesting success (Briskie et al, 2014) or a supplementary translocation of individuals from a nearby source population.
Kakariki (red-crowned parakeets) have a similarly localised distribution, having only been detected at several locations in or near Keith George Memorial Park and Wi Tako Reserve. While the current mammalian pest control regime in both reserves would typically be sufficient to maintain local populations of kakariki, the presence of introduced eastern rosellas at relatively high densities may reduce the likelihood that kakariki can maintain self-sustaining populations in these two reserves in the long-term. Eastern rosellas are considered to be a potential competitor for nest sites with native hole-nesters such as kakariki (Wright & Clout, 2001; Galbraith, 2010) and also carry avian pathogens such as beak and feather disease virus, a pathogen which is known to cause increased mortality in wild parakeet populations (Ortiz-Catedral et al, 2009; Galbraith, 2010). The presence of relatively high numbers of eastern rosellas in both Keith George Memorial Park and Wi Tako Reserve may mean that the re-establishment of kakariki will be relatively unlikely, irrespective of the level of mammalian pest control being maintained.
Nonetheless, Keith George Memorial Park and Wi Tako Reserve both continue to support populations of almost all of the native forest bird species detected during these five-minute bird counts between 2011 and 2014. This is unsurprising, given that these are by far the two largest reserves currently being monitored, and both are relatively well-connected to larger blocks of forest such as the Akatarawa Forest and Eastern Hutt hills, in comparison to some of the smaller reserves sampled as part of this monitoring programme. Both reserves should continue to be considered high priorities for habitat management within the Upper Hutt City reserves network, as both provide Upper Hutt City ratepayers with the opportunity to encounter the full range of native forest bird species that currently exists in the Upper Hutt reserves network.
Between 2011 and 2014, the mean number of native forest bird species recorded per bird count station was significantly higher in Upper Hutt City reserves than in Wellington City reserves. This pattern is most likely caused by the fact that at least a quarter of the bird species recorded during the Wellington City reserves five-minute bird counts have very localised distributions (centred on

State and trends in the diversity, abundance and distribution of birds in Upper Hutt City
McArthur, N.; Govella, S.; Walter, J. and Small, D. 28
Zealandia), so are only recorded at a relatively small proportion of the bird count stations surveyed. In contrast, almost all of the species recorded in Upper Hutt reserves were more widely distributed and were recorded at a large proportion of the bird count stations surveyed.
4.2 Bird abundance
In general, encounter rates for frugivorous and nectivorous bird species such as silvereye, tui, kereru and bellbird appear to have been more variable from year to year than those of insectivorous species such as grey warbler, tomtit and whitehead. These former species are all highly mobile and individual birds are known to move relatively long distances to exploit seasonally- or locally-available food resources (Stewart & Craig, 1985; Robertson, 2013; Heather & Robertson, 2015). Annual differences in the apparent abundance of these species are likely therefore to be caused by local movements of birds into or out of these reserves in response to changes in local food availability. Because of their mobility, the distributions of species such as tui, bellbird and silvereye are likely to vary both between and within years, so monitoring over longer timeframes will be required before we can expect to differentiate short-term fluctuations in distribution and conspicuousness from longer-term trends in abundance.
Although insectivorous bird species have tended to show less year-to-year variation in abundance in Upper Hutt City parks and reserves, one exception to this pattern has been the fantail. Fantail abundance and distribution declined significantly in Upper Hutt reserves between 2010 and 2011, before undergoing an extremely rapid, 11-fold increase in apparent abundance between 2011 and 2014. This initial decline was mirrored by similar dramatic declines in fantail numbers observed in 2011 in other Wellington forests such as Akatarawa Forest, Kaitoke Regional Park and the Wainuiomata Water Collection Area (McArthur et al, 2012; GWRC unpublished data). This sudden and widespread decline was probably a consequence of heavy fantail mortality that occurred during the two unusually severe snowfall events that occurred in the Wellington Region between the 24th and 26th July and 14th and 17th August 2011 (NIWA, 2012). During these events, snow fell to sea-level in Wellington City and record low temperatures were recorded across the region. At Wallaceville in Upper Hutt for example, the maximum recorded temperature on the 15th of August was the lowest ever observed at this site in 41 years of weather monitoring (NIWA, 2011). Fantails are known to be particularly susceptible to sudden declines and even local extinction following such severe weather events (Miskelly & Sagar, 2008), but populations often quickly recover thanks to this species’ high reproductive rate and good dispersal abilities (Heather & Robertson, 2015; Powlesland, 2013). The rapid increase in the apparent abundance and distribution of fantails in Upper Hutt reserves that has occurred between 2011 and 2014 therefore appears to represent a rapid recovery of the local fantail population following a heavy mortality event that occurred during the winter of 2011.
Significant declines in the encounter rates of both grey warblers and shining cuckoos between 2013 and 2014 may have occurred as a result of a change in the observers who carried out these bird counts in 2013 and 2014. Between 2011 and 2013, these bird counts were carried out by two of the four authors of this report (JW and SG), but in 2014 were carried out by the other two authors (NM and DS). Observer-related differences in field technique can be a significant source of variation in five-minute bird count datasets, even when all observers possess a similar level of skill and experience (Bibby et al, 2000; McArthur et al, 2013). For this reason, these apparent declines in grey warbler and shining cuckoo abundance may simply be a consequence in the change in observers that occurred between 2013 and 2014. On the other hand, the fact that shining cuckoo is a brood-parasite of the grey warbler means that the reproductive success of the former species is at least in part dependent on the presence of a large grey warbler population that experiences a similarly high level of reproductive success. The fact that both species declined in apparent abundance between 2013 and 2014, whereas other insectivorous bird populations were either stable or increasing over the same period suggests that this decline in encounter rate may represent a real local decline in both species

State and trends in the diversity, abundance and distribution of birds in Upper Hutt City
McArthur, N.; Govella, S.; Walter, J. and Small, D. 29
between 2013 and 2014. Further annual counts should reveal whether this is part of a longer-term, local decline or not.
The encounter rates for another insectivorous bird, the tomtit, were significantly higher in both 2013 and 2014 compared to the preceding two years. Tomtits are known to respond strongly to mammalian predator control, and current levels of predator control in both Wi Tako and Keith George Memorial Park (where the majority of tomtits have been recorded during these surveys) are proving successful at reducing populations of rats (Rattus spp.), possums (Trichosurus vulpecula) and mustelids (Mustela spp.) to low levels (GWRC, unpublished data). This apparent increase in tomtit abundance in these two reserves therefore may represent an early indication that this species is benefitting from ongoing pest control efforts in these two reserves.
The apparent abundance of redpolls was significantly higher in 2014 compared to the preceding three years. Because of the change in observers that occurred between 2013 and 2014, this again may be an observer-related effect, rather than a real increase in redpoll abundance in the Upper Hutt City reserve network. On the other hand, the 2014 beech mast event may have temporarily improved habitat quality for redpolls in the Wellington region, with very large flocks of several hundred to several thousand redpolls observed feeding on beech seeds in nearby blocks of native forest including the Tararua Forest Park and Rimutaka/Orongorongo Ranges during early-mid 2014 (BirdingNZ.net, http://www.birdingnz.net/forum/viewtopic.php?f=9&t=3706, accessed 19/10/2015). This unusual pulse of food availability may have led to a temporary improvement in redpoll survival and reproductive success, leading to an increase in redpoll abundance observed in Upper Hutt City reserves in late 2014.
4.3 Native bird distribution
The distribution of native forest birds in Upper Hutt City parks and reserves has not changed substantially from that reported previously (McArthur et al, 2012; McArthur et al, 2013). Those species with the strongest dispersal abilities, or those that are least susceptible to the impacts of mammalian predators and habitat fragmentation (including silvereye, tui, grey warbler and fantail) continue to have the most widespread distributions in Upper Hutt City parks and reserves. Those species with more limited dispersal abilities, or greater susceptibility to depredation by mammalian predators (including rifleman and tomtit) have more localised distributions and are typically only present in the larger and better connected reserves.
The new survey design implemented in 2011 has allowed us to map patterns in bird distribution in greater detail within the two larger reserves, Keith George Memorial Park and Wi Tako Reserve. One pattern that has emerged from this mapping is that several species, including tomtit, fantail, bellbird and rosella appear to be significantly more abundant and/or conspicuous in the north-eastern portion of Keith George Memorial Park than the south-eastern portion. Similarly, both tomtits and whiteheads appear to be significantly more abundant and/or conspicuous in the the southern half of Wi Tako Reserve in comparison to the northern half. In both cases, the portions of these reserves in which encounter rates for these species are higher both contain original, mature stands of hard beech (Fuscospora truncata) and black beech (F. solandri) whereas the remainder of both reserves consist of a mosaic of original and secondary growth broadleaf forest, mixed beech-broadleaf forest and shrubland (Wassilief & Clark, 1986; GWRC, 2015). It’s possible therefore, that both the north-eastern portion of Keith George Memorial Park and the southern portion of Wi Tako Reserve provide higher quality habitat for a number of native forest birds species than the remainder of each respective reserve.
The incorporation of bird observation data collected by local citizen scientists into the distribution maps provided in this report has enabled bird distribution in Upper Hutt City to be mapped in much greater detail than in previous reports. In this particular case, the Upper Hutt City five-minute bird

State and trends in the diversity, abundance and distribution of birds in Upper Hutt City
McArthur, N.; Govella, S.; Walter, J. and Small, D. 30
count dataset and local citizen science bird distribution datasets appear to be highly complementary. The original aim of this Upper Hutt City five-minute bird count monitoring programme was to sample bird populations in forested habitats in Upper Hutt City’s parks and reserve network, so it isn’t designed to provide any information on bird distribution in other habitats in the city such as suburban backyards. The majority of bird observations reported by local citizen scientists however are from these suburban habitats, so combining these two datasets provides a much more detailed and complete picture of bird distribution in Upper Hutt City than either of these datasets can provide on their own.
Although the incorporation of citizen science data sourced from the New Zealand eBird database into this monitoring programme has already substantially improved our ability to describe the distribution of birds in Upper Hutt City, further work could be done to improve this picture even further. Firstly, not all of the locally-available citizen science data has been incorporated into the maps contained in this report yet, due to time constraints and the fact that this data is currently scattered across a number of databases and reporting platforms. Further work could be done therefore to amalgamate bird distribution data we’ve already sourced from the New Zealand eBird database with additional data available from the NatureWatch NZ website, Garden Bird Survey dataset and Great Kereru Count dataset.
Furthermore, it’s our impression that the rate at which bird observations are being reported by Upper Hutt residents hasn’t yet reached its upper limit. Instead, we believe that current reporting rates are being limited by the degree to which the various biodiversity reporting tools are being promoted, the limited training opportunities available to local citizen scientists to learn how to use these tools and the lack of feedback citizen scientists receive regarding their observations. At present for example, only 5-10% of Wellington Region Birds New Zealand members submit their bird observations to the New Zealand eBird database on a regular basis (N. McArthur pers. obs.). Developing a more coordinated and systematic approach towards improving local citizen scientists’ awareness of the value of their observations (e.g. Figures 4.1 and 4.2), their awareness of tools available to record and share their observations and the training they need to use these tool effectively would increase both the quality and quantity of citizen science data available to local agencies for environmental reporting.

State and trends in the diversity, abundance and distribution of birds in Upper Hutt City
McArthur, N.; Govella, S.; Walter, J. and Small, D. 31
Figure 4.1: An example of how local citizen scientists can be encouraged to collect and share bird observations to aid biodiversity monitoring (Source: Upper Hutt leader, July 15th 2015; http://fairfaxmedia.newspaperdirect.com/epaper/viewer.aspx; accessed 30/10/2015).
Figure 4.2: A juvenile New Zealand falcon photographed perched on the edge of a trampoline in suburban Upper Hutt. The bird had been attracted to this suburban garden by a flock of house sparrows feeding on the lawn (Image courtesy of Sarah McAlpine).
State and trends in the diversity, abundance and distribution of birds in Upper Hutt City
McArthur, N.; Govella, S.; Walter, J. and Small, D. 32
5 Recommendations
Based on the results described in this report, we suggest that Upper Hutt City Council considers adopting the following recommendations:
- That the Council continues to undertake this five-minute bird count monitoring programme on an ongoing annual basis, to provide a consistent, repeatable measure of the state and trends in the diversity, distribution and abundance of birds in Upper Hutt City parks and reserves.
- That the Council considers investing additional resources into further enabling local citizen
scientists to take a greater role in monitoring and reporting trends in the distribution of birds in Upper Hutt City, in order to add value to the systematic five-minute bird count programme currently being carried out. Possible work-streams for an Upper Hutt City citizen science bird monitoring programme include the ongoing amalgamation of existing citizen science datasets and the development of a coordinated and strategic approach to promoting the use of fit-for-purpose online biodiversity reporting tools by Upper Hutt-based citizen scientists.
- That the Council considers installing rifleman nest boxes in the southern portion of Wi Tako Reserve to improve local rifleman nest success rates (see Briskie et al, 2014). Assistance with this project could be sought from local organisations such as the Upper Hutt Menz Shed or the Upper Hutt branch of Forest and Bird.
State and trends in the diversity, abundance and distribution of birds in Upper Hutt City
McArthur, N.; Govella, S.; Walter, J. and Small, D. 33
6 Acknowledgements
This work was instigated by Evan Gwerder, Horticultural Officer at Upper Hutt City Council and has been jointly funded by Upper Hutt City Council and Greater Wellington Regional Council. We would like to thank Annette Harvey, Ian Flux, Mark McAlpine, James Graham and Steve Playle for collecting the bird count data sourced from Wellington City and south Wairarapa reserves and Porirua Scenic Reserve. We also extend our thanks to the small but dedicated group of Upper Hutt-based citizen scientists collecting and sharing high-quality bird observations via the New Zealand eBird database. Thanks very much to Li Loo, Richard Farrell, Charlie Hopkins and Annette Harvey for their assistance with data entry and to Mike Bell and Philippa Crisp for providing useful comments on earlier drafts of this report.
State and trends in the diversity, abundance and distribution of birds in Upper Hutt City
McArthur, N.; Govella, S.; Walter, J. and Small, D. 34
7 REFERENCES
Bibby, C.J.; Burgess, N.D.; Hill, D.A. and Mustoe, S. 2000. Bird census techniques (2nd edition). Academic Press, London.
Briskie, J.V; Shorey, L. and Massaro, M. 2014. Nest boxes increase fledging success in the declining rifleman Acanthisitta chloris, New Zealand. Conservation Evidence 11: 12-15.
Dawson, D.G. and Bull, P.C. 1975. Counting birds in New Zealand forests. Notornis 22: 101-109.
Fea, N. and Moylan, S. 2008. Native bird monitoring: Regional report for Greater Wellington and Upper Hutt City Council. Unpublished report, Greater Wellington Regional Council, Upper Hutt.
Fowler, J. and Cohen, L. 1995. Statistics for Ornithologists. BTO guide 22. British Trust for Ornithology, Norfolk, United Kingdom.
Galbraith J.A. 2010. The ecology and impact of the introduced eastern rosella (Platycercus eximius) in New Zealand. Unpublished MSc thesis, University of Auckland.
Gill, B.J. (Convener); Bell, B.D.; Chambers, G.K.; Medway, D.G.; Palma, R.L.; Scofield, R.P.; Tennyson, A.J.D. and Worthy T.H. 2010. Checklist of the birds of New Zealand, Norfolk and Macquarie Islands, and the Ross Dependency, Antarctica. Te Papa Press, Wellington.
Govella, S.; McArthur, N. and Crisp, P. 2011. Native bird monitoring report, September 2011. Unpublished report, Greater Wellington Regional Council, Upper Hutt.
Greater Wellington Regional Council, 2015. Key Native Ecosystem Plan for Keith George Memorial Park. Publication No. GW/BD-G-15/115, Greater Wellington Regional Council, Wellington.
Hartley, L. and Greene, T. 2012. Incomplete counts: Five-minute bird counts. DoC inventory and monitoring toolbox (DOCDM-534972), Department of Conservation, Wellington. (http://www.doc.govt.nz/Documents/science-and-technical/inventory-monitoring/im-toolbox-birds-incomplete-five-min-counts.pdf; accessed 21/09/2015).
Heather, B.D. and Robertson, H.A. 2015. The field guide to the birds of New Zealand. Penguin, Auckland.
Mackenzie, D.I.; Nichols, J.D.; Royle, J.A.; Pollock, K.H.; Bailey, L.L. and Hines, J.E. 2006. Occupancy estimation and modelling: inferring patterns and dynamics of species occurrence. Elsevier Academic Press, Burlington, USA.
McArthur, N.; Govella, S. and Crisp, P. 2012. State and trends in the diversity, abundance and distribution of birds in Upper Hutt reserves, June 2012. Publication number GW/EMI-T-12/200, Greater Wellington Regional Council, Upper Hutt.
McArthur, N.; Govella, S. and Walter, J. 2013. State and trends in the diversity, abundance and distribution of birds in Upper Hutt City reserves. Greater Wellington Regional Council, Publication No. GW/ESCI-T-14/42, Wellington.
McArthur, N.; Harvey, A. and Flux, I. 2015. State and trends in the diversity, abundance and distribution of birds in Wellington City. Client report prepared for Greater Wellington Regional Council. Wildlife Management International Ltd, Blenheim.
Miskelly, C.M. and Sagar, P.M. 2008. Establishment and local extinction of fantails (Rhipidura fuliginosa) on the Snares Islands, New Zealand. Notornis 55: pp 170-171.
NIWA, 2011. National Climate Summary – August 2011: Snow and sunshine, very dry in the north and west. National Institute of Water and Atmospheric Research, Wellington.
State and trends in the diversity, abundance and distribution of birds in Upper Hutt City
McArthur, N.; Govella, S.; Walter, J. and Small, D. 35
NIWA, 2012. New Zealand national climate summary 2011: A year of extremes. National Institute of Water and Atmospheric Research, Wellington.
Ortiz-Catedral L., McInnes K., Hauber M.E. and Brunton D.H. 2009. First report of beak and feather disease virus (BFDV) in wild red-fronted parakeets (Cyanoramphus novaezelandiae) in New
Zealand. Emu, 109: pp 244-247.
Powlesland, R.G. 2013. Fantail. In Miskelly, C.M. (ed.) New Zealand Birds Online. www.nzbirdsonline.org.nz
Robertson, H.A. 2013. Tui. In Miskelly, C.M. (ed.) New Zealand Birds Online. www.nzbirdsonline.org.nz
Robertson, H.A.; Dowding, J.E.; Elliott, G.P.; Hitchmough, R.A.; Miskelly, C.M.; O’Donnell, C.J.F.; Powlesland, R.G.; Sagar, P.M.; Scofield, R.P. and Taylor, G.A. 2013. Conservation status of New Zealand birds, 2012. New Zealand Threat Classification Series 4, Department of Conservation, Wellington.
Scofield, R.P.; Christie, D.; Sagar, P.M. and Sullivan, B.L. 2012. eBird and avifaunal monitoring by the Ornithological Society of New Zealand. New Zealand Journal of Ecology 36(3): 279-286.
Stephens, C.; Moylan, S. and Hudson M. 2007. Native bird monitoring report for Upper Hutt sites 2007. Unpublished report, document reference #452228, Greater Wellington Regional Council, Upper Hutt.
Stewart, A.M. and Craig, J.L. 1985. Movements, spatial access to nectar and spatial organisation of the tui. New Zealand Journal of Zoology 12: pp 649-666.
Sullivan, B.L.; Aycrigg, J.L.; Barry, J.H.; Bonney, R.E.; Bruns, N.; Cooper, C.B.; Damoulas, T.; Dhondt, A.A.; Dietterich, T.; Farnsworth, A.; Fink, D.; Fitzpatrick, J.W.; Fredericks, T.; Gerbracht, J.; Gomes, C.; Hochachka, W.M.; Iliff, M.J.; Lagoze, C.; La Sorte, F.; Merrifield M.; Morris, W.; Phillips, T.B.; Reynolds, M.; Rodewald, A.D.; Rosenberg, K.V.; Trautmann, N.M.; Wiggins, A.; Winkler, D.W.; Wong, W.-K.; Wood, C.L.; Yu, J. and Kelling, S. 2014. The eBird enterprise: An integrated approach to development and application of citizen science. Biological Conservation 169: 31-40.
Wassilieff, M.C. and Clark, D.J. 1986. Scenic reserves of the lower North Island. Biological Survey of Reserves Series No. 14, Department of Lands and Survey, Wellington.
Wright D. and Clout M. 2001. The eastern rosella (Platycercus eximius) in New Zealand. Department of Conservation Science Internal Series No. 18. Department of Conservation, Wellington.
State and trends in the diversity, abundance and distribution of birds in Upper Hutt City
McArthur, N.; Govella, S.; Walter, J. and Small, D. 36
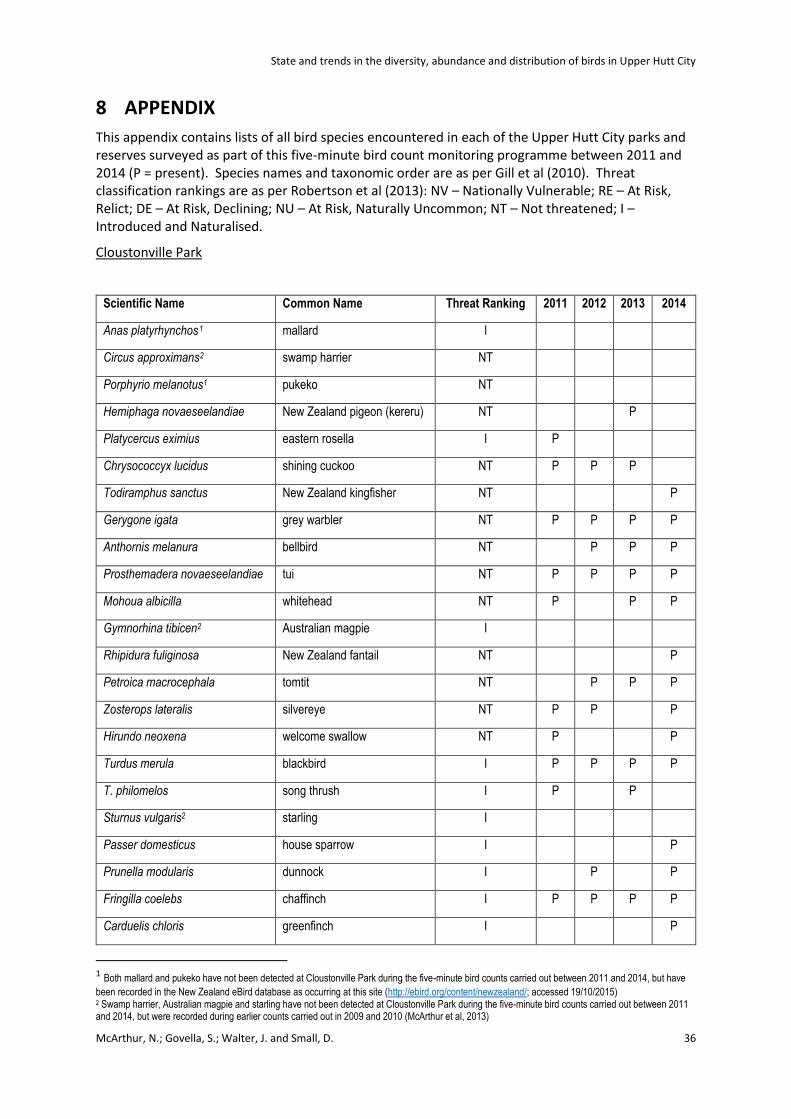
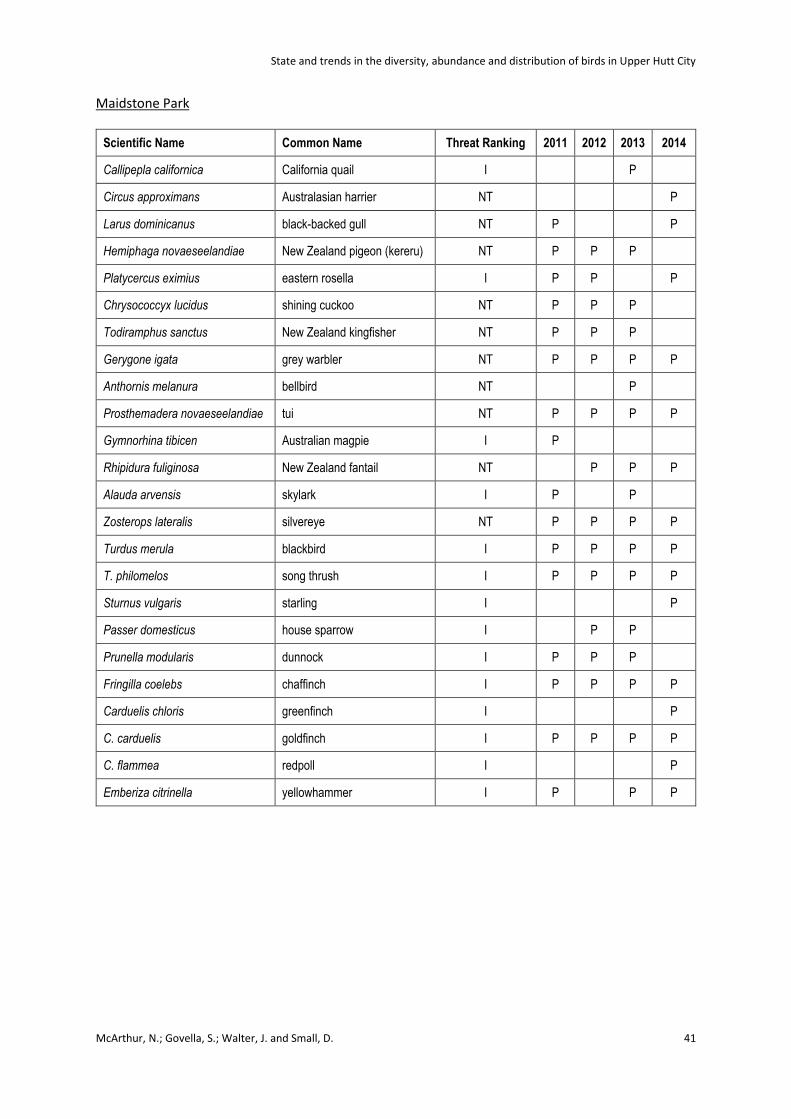
8 APPENDIX
This appendix contains lists of all bird species encountered in each of the Upper Hutt City parks and reserves surveyed as part of this five-minute bird count monitoring programme between 2011 and 2014 (P = present). Species names and taxonomic order are as per Gill et al (2010). Threat classification rankings are as per Robertson et al (2013): NV – Nationally Vulnerable; RE – At Risk, Relict; DE – At Risk, Declining; NU – At Risk, Naturally Uncommon; NT – Not threatened; I – Introduced and Naturalised.
Cloustonville Park
Scientific Name Common Name Threat Ranking 2011 2012 2013 2014
Anas platyrhynchos 1 mallard I
Circus approximans2 swamp harrier NT
Porphyrio melanotus1 pukeko NT
Hemiphaga novaeseelandiae New Zealand pigeon (kereru) NT P
Platycercus eximius eastern rosella I P
Chrysococcyx lucidus shining cuckoo NT P P P
Todiramphus sanctus New Zealand kingfisher NT P
Gerygone igata grey warbler NT P P P P
Anthornis melanura bellbird NT P P P
Prosthemadera novaeseelandiae tui NT P P P P
Mohoua albicilla whitehead NT P P P
Gymnorhina tibicen2 Australian magpie I
Rhipidura fuliginosa New Zealand fantail NT P
Petroica macrocephala tomtit NT P P P
Zosterops lateralis silvereye NT P P P
Hirundo neoxena welcome swallow NT P P
Turdus merula blackbird I P P P P
T. philomelos song thrush I P P
Sturnus vulgaris2 starling I
Passer domesticus house sparrow I P
Prunella modularis dunnock I P P
Fringilla coelebs chaffinch I P P P P
Carduelis chloris greenfinch I P
1 Both mallard and pukeko have not been detected at Cloustonville Park during the five-minute bird counts carried out between 2011 and 2014, but have
been recorded in the New Zealand eBird database as occurring at this site (http://ebird.org/content/newzealand/; accessed 19/10/2015) 2 Swamp harrier, Australian magpie and starling have not been detected at Cloustonville Park during the five-minute bird counts carried out between 2011 and 2014, but were recorded during earlier counts carried out in 2009 and 2010 (McArthur et al, 2013)

State and trends in the diversity, abundance and distribution of birds in Upper Hutt City
McArthur, N.; Govella, S.; Walter, J. and Small, D. 37
Emerald Hill and Harcourt Park
Scientific Name Common Name Threat Ranking 2011 2012 2013 2014
Tadorna variegata4 paradise shelduck NT
Circus approximans swamp harrier NT P
Falco novaeseelandiae New Zealand falcon NV P
Porphyrio melanotus pukeko NT P P
Vanellus miles3 spur-winged plover NT
Larus dominicanus4 black-backed gull NT
Platycercus eximius eastern rosella I P P P
Chrysococcyx lucidus shining cuckoo NT P P P
Ninox novaeseelandiae4 morepork NT
Todiramphus sanctus New Zealand kingfisher NT P P P
Gerygone igata grey warbler NT P P P
Anthornis melanura bellbird NT P P
Prosthemadera novaeseelandiae tui NT P P P P
Mohoua albicilla whitehead NT P
Gymnorhina tibicen Australian magpie I P P
Rhipidura fuliginosa New Zealand fantail NT P P P
Zosterops lateralis silvereye NT P P P P
Hirundo neoxena welcome swallow NT P
Turdus merula blackbird I P P P P
T. philomelos song thrush I P P P P
Sturnus vulgaris starling I P P P P
Passer domesticus house sparrow I P P P P
Prunella modularis dunnock I P P P
3 Spur-winged plover has not been detected in Emerald Hill or Harcourt Park during the five-minute bird counts carried out between 2011 and 2014, but were recorded during earlier counts carried out in 2009 and 2010 (McArthur et al, 2013) 4 Paradise shelduck, black-backed gull and morepork have not been detected in Emerald Hill or Harcourt Park during the five-minute bird counts carried out between 2011 and 2014, but have been recorded in the New Zealand eBird database as occurring at this site (http://ebird.org/content/newzealand/; accessed 19/10/2015)

State and trends in the diversity, abundance and distribution of birds in Upper Hutt City
McArthur, N.; Govella, S.; Walter, J. and Small, D. 38
Scientific Name Common Name Threat Ranking 2011 2012 2013 2014
Fringilla coelebs chaffinch I P P P P
Carduelis chloris greenfinch I P P P
C. carduelis goldfinch I P P P P
C. flammea redpoll I P P P
Emberiza citrinella yellowhammer I P P P
State and trends in the diversity, abundance and distribution of birds in Upper Hutt City
McArthur, N.; Govella, S.; Walter, J. and Small, D. 39
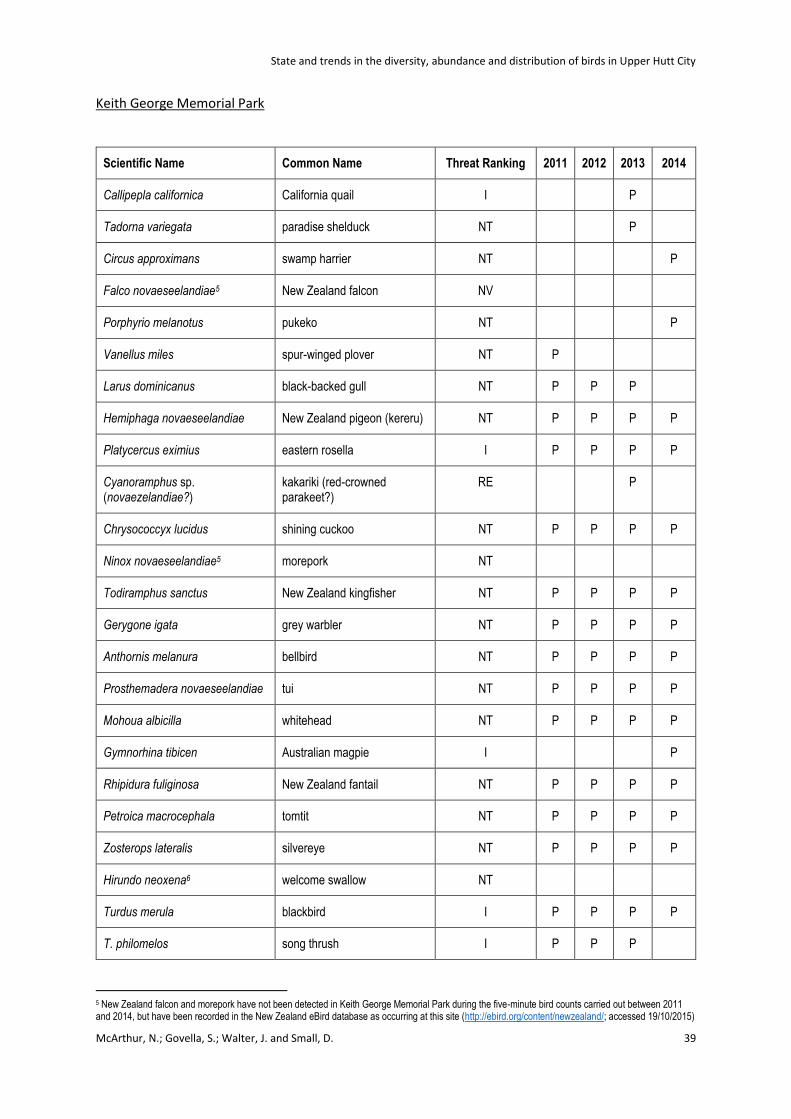
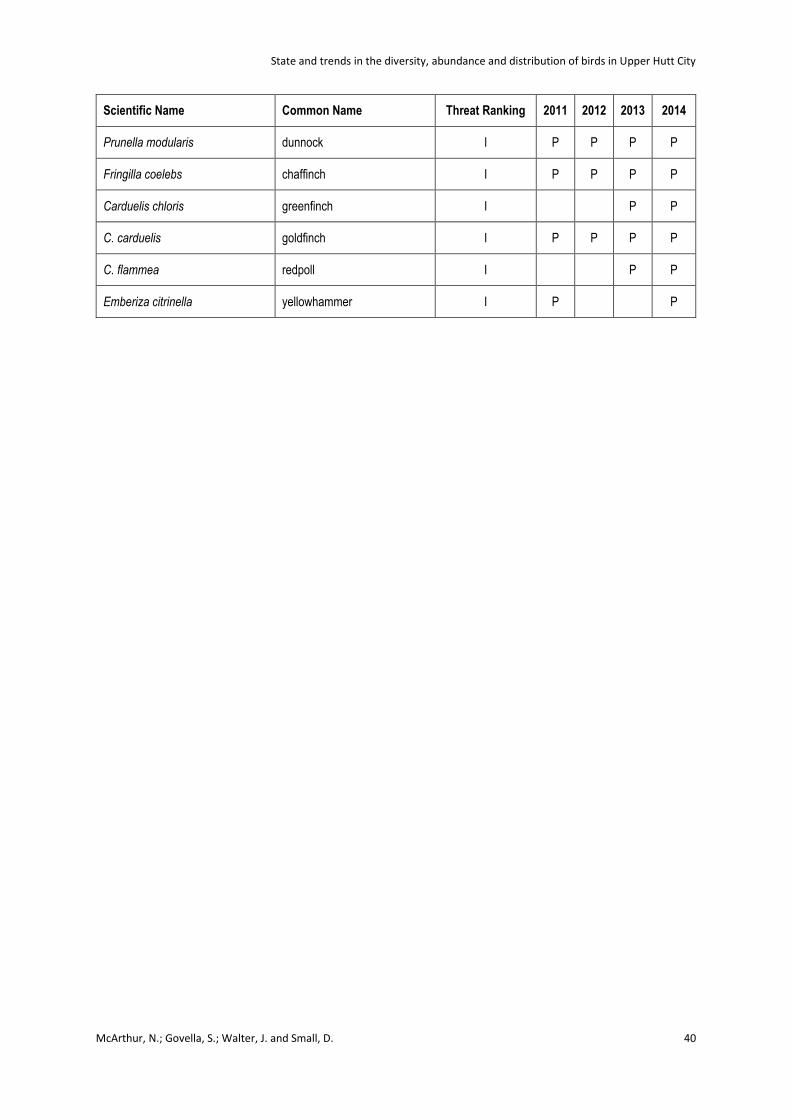
Keith George Memorial Park
Scientific Name Common Name Threat Ranking 2011 2012 2013 2014
Callipepla californica California quail I P
Tadorna variegata paradise shelduck NT P
Circus approximans swamp harrier NT P
Falco novaeseelandiae5 New Zealand falcon NV
Porphyrio melanotus pukeko NT P
Vanellus miles spur-winged plover NT P
Larus dominicanus black-backed gull NT P P P
Hemiphaga novaeseelandiae New Zealand pigeon (kereru) NT P P P P
Platycercus eximius eastern rosella I P P P P
Cyanoramphus sp. (novaezelandiae?)
kakariki (red-crowned parakeet?)
RE P
Chrysococcyx lucidus shining cuckoo NT P P P P
Ninox novaeseelandiae5 morepork NT
Todiramphus sanctus New Zealand kingfisher NT P P P P
Gerygone igata grey warbler NT P P P P
Anthornis melanura bellbird NT P P P P
Prosthemadera novaeseelandiae tui NT P P P P
Mohoua albicilla whitehead NT P P P P
Gymnorhina tibicen Australian magpie I P
Rhipidura fuliginosa New Zealand fantail NT P P P P
Petroica macrocephala tomtit NT P P P P
Zosterops lateralis silvereye NT P P P P
Hirundo neoxena6 welcome swallow NT
Turdus merula blackbird I P P P P
T. philomelos song thrush I P P P
5 New Zealand falcon and morepork have not been detected in Keith George Memorial Park during the five-minute bird counts carried out between 2011 and 2014, but have been recorded in the New Zealand eBird database as occurring at this site (http://ebird.org/content/newzealand/; accessed 19/10/2015)
State and trends in the diversity, abundance and distribution of birds in Upper Hutt City
McArthur, N.; Govella, S.; Walter, J. and Small, D. 40
Scientific Name Common Name Threat Ranking 2011 2012 2013 2014
Prunella modularis dunnock I P P P P
Fringilla coelebs chaffinch I P P P P
Carduelis chloris greenfinch I P P
C. carduelis goldfinch I P P P P
C. flammea redpoll I P P
Emberiza citrinella yellowhammer I P P
State and trends in the diversity, abundance and distribution of birds in Upper Hutt City
McArthur, N.; Govella, S.; Walter, J. and Small, D. 41
Maidstone Park
Scientific Name Common Name Threat Ranking 2011 2012 2013 2014
Callipepla californica California quail I P
Circus approximans Australasian harrier NT P
Larus dominicanus black-backed gull NT P P
Hemiphaga novaeseelandiae New Zealand pigeon (kereru) NT P P P
Platycercus eximius eastern rosella I P P P
Chrysococcyx lucidus shining cuckoo NT P P P
Todiramphus sanctus New Zealand kingfisher NT P P P
Gerygone igata grey warbler NT P P P P
Anthornis melanura bellbird NT P
Prosthemadera novaeseelandiae tui NT P P P P
Gymnorhina tibicen Australian magpie I P
Rhipidura fuliginosa New Zealand fantail NT P P P
Alauda arvensis skylark I P P
Zosterops lateralis silvereye NT P P P P
Turdus merula blackbird I P P P P
T. philomelos song thrush I P P P P
Sturnus vulgaris starling I P
Passer domesticus house sparrow I P P
Prunella modularis dunnock I P P P
Fringilla coelebs chaffinch I P P P P
Carduelis chloris greenfinch I P
C. carduelis goldfinch I P P P P
C. flammea redpoll I P
Emberiza citrinella yellowhammer I P P P

State and trends in the diversity, abundance and distribution of birds in Upper Hutt City
McArthur, N.; Govella, S.; Walter, J. and Small, D. 42
Riverstone Park
Scientific Name Common Name Threat Ranking 2011 2012 2013 2014
Callipepla californica California quail I P
Vanellus miles spur-winged plover NT P
Larus dominicanus black-backed gull NT P
Chrysococcyx lucidus6 shining cuckoo NT
Gerygone igata grey warbler NT P P P P
Prosthemadera novaeseelandiae tui NT P P P P
Rhipidura fuliginosa New Zealand fantail NT P
Alauda arvensis skylark I P
Zosterops lateralis silvereye NT P P P P
Turdus merula blackbird I P P P P
T. philomelos song thrush I P
Sturnus vulgaris starling I P
Passer domesticus house sparrow I P P P P
Prunella modularis dunnock I P P P
Fringilla coelebs chaffinch I P P P P
Carduelis chloris greenfinch I P
C. carduelis goldfinch I P P P
C. flammea redpoll I P P P
Emberiza citrinella yellowhammer I P P
6 Shining cuckoo has not been detected in Riverstone Park during the five-minute bird counts carried out between 2011 and 2014, but was recorded during earlier counts carried out in 2009 and 2010 (McArthur et al, 2013)

State and trends in the diversity, abundance and distribution of birds in Upper Hutt City
McArthur, N.; Govella, S.; Walter, J. and Small, D. 43
Trentham Memorial Park
Scientific Name Common Name Threat Ranking 2011 2012 2013 2014
Tadorna variegata7 paradise shelduck NT
Anas platyrhynchos 8 mallard I
Circus approximans8 swamp harrier NT
Falco novaeseelandiae8 New Zealand falcon NV
Porphyrio melanotus8 pukeko NT
Vanellus miles7 spur-winged plover NT
Larus dominicanus7 black-backed gull NT
Columbia livia8 rock pigeon I
Hemiphaga novaeseelandiae New Zealand pigeon (kereru) NT P P
Platycercus eximius eastern rosella I P P P P
Chrysococcyx lucidus shining cuckoo NT P P P
Todiramphus sanctus New Zealand kingfisher NT P P P P
Gerygone igata grey warbler NT P P P P
Prosthemadera novaeseelandiae tui NT P P P P
Gymnorhina tibicen Australian magpie I P
Rhipidura fuliginosa New Zealand fantail NT P P P P
Zosterops lateralis silvereye NT P P P P
Hirundo neoxena8 welcome swallow NT
Turdus merula blackbird I P P P P
T. philomelos song thrush I P P
Sturnus vulgaris starling I P P P
Passer domesticus house sparrow I P
Prunella modularis dunnock I P P P P
7 Paradise shelduck, spur-winged plover and black-backed gull have not been detected in Trentham Memorial Park during the five-minute bird counts carried out between 2011 and 2014, but were recorded during earlier counts carried out in 2009 and 2010 (McArthur et al, 2013) 8 Mallard, swamp harrier, New Zealand falcon, pukeko, rock pigeon, welcome swallow and yellowhammer have not been detected in Trentham Memorial Park during the five-minute bird counts carried out between 2011 and 2014, but have been recorded in the New Zealand eBird database as occurring at this site (http://ebird.org/content/newzealand/; accessed 19/10/2015)
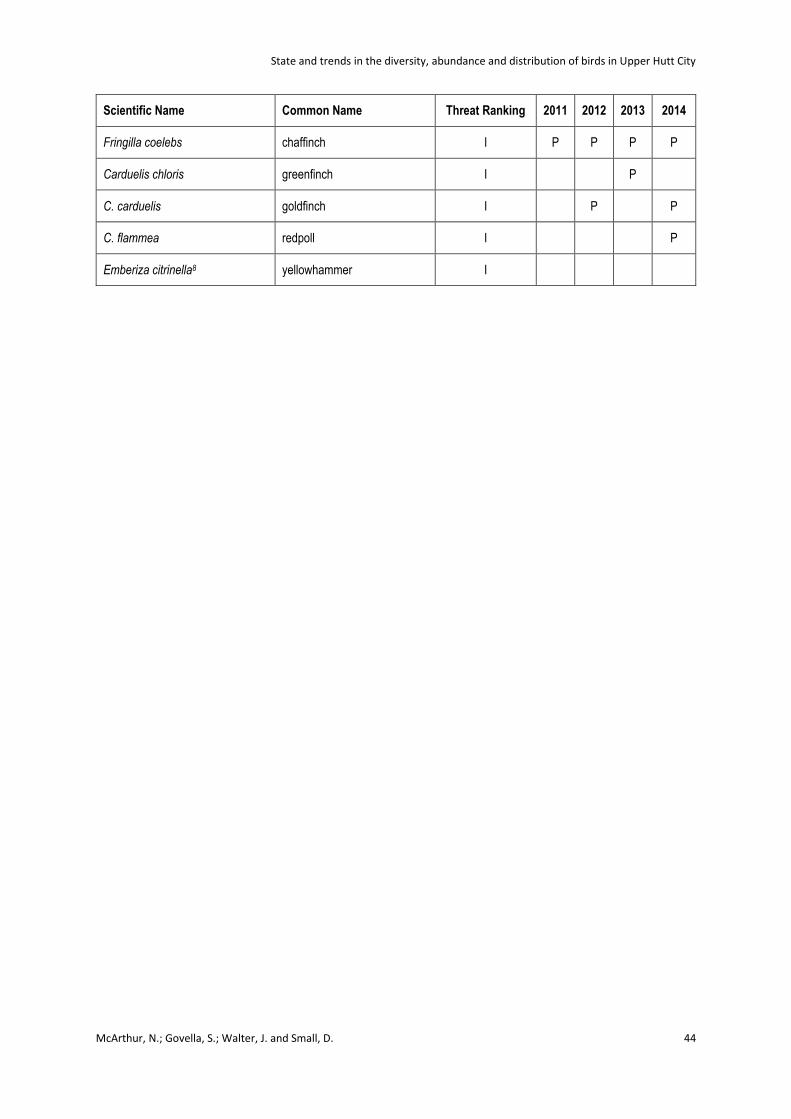
State and trends in the diversity, abundance and distribution of birds in Upper Hutt City
McArthur, N.; Govella, S.; Walter, J. and Small, D. 44
Scientific Name Common Name Threat Ranking 2011 2012 2013 2014
Fringilla coelebs chaffinch I P P P P
Carduelis chloris greenfinch I P
C. carduelis goldfinch I P P
C. flammea redpoll I P
Emberiza citrinella8 yellowhammer I
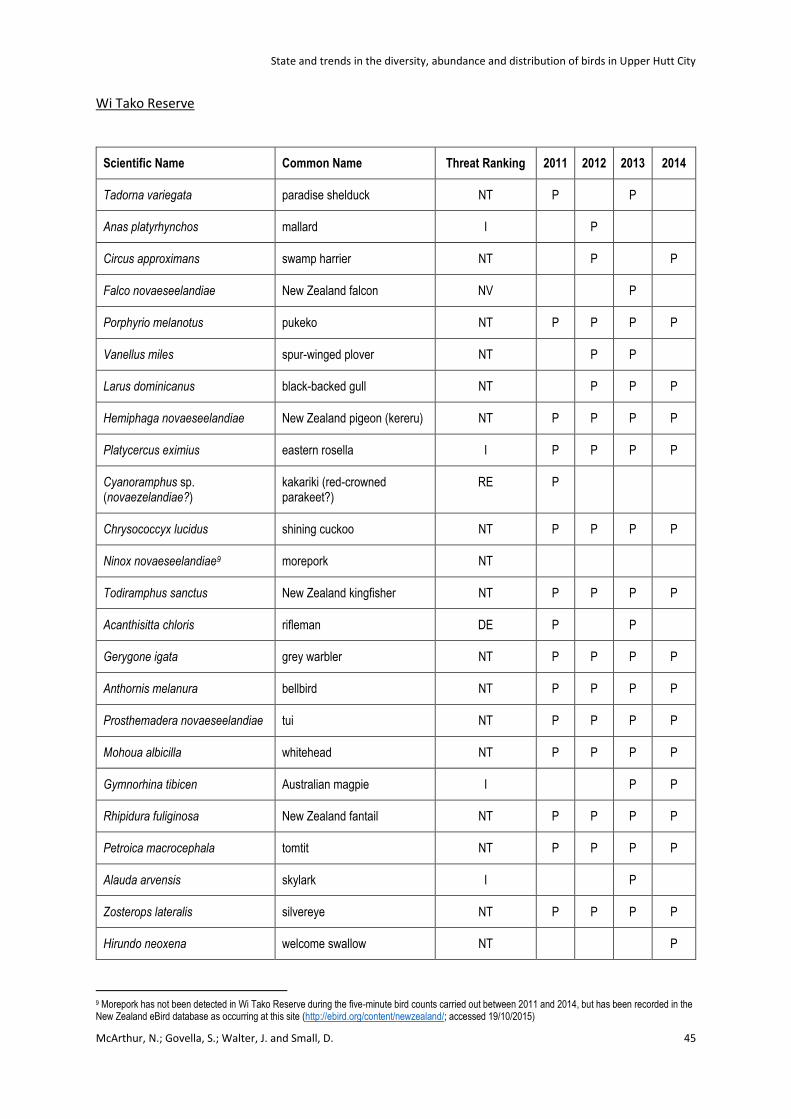
State and trends in the diversity, abundance and distribution of birds in Upper Hutt City
McArthur, N.; Govella, S.; Walter, J. and Small, D. 45
Wi Tako Reserve
Scientific Name Common Name Threat Ranking 2011 2012 2013 2014
Tadorna variegata paradise shelduck NT P P
Anas platyrhynchos mallard I P
Circus approximans swamp harrier NT P P
Falco novaeseelandiae New Zealand falcon NV P
Porphyrio melanotus pukeko NT P P P P
Vanellus miles spur-winged plover NT P P
Larus dominicanus black-backed gull NT P P P
Hemiphaga novaeseelandiae New Zealand pigeon (kereru) NT P P P P
Platycercus eximius eastern rosella I P P P P
Cyanoramphus sp. (novaezelandiae?)
kakariki (red-crowned parakeet?)
RE P
Chrysococcyx lucidus shining cuckoo NT P P P P
Ninox novaeseelandiae9 morepork NT
Todiramphus sanctus New Zealand kingfisher NT P P P P
Acanthisitta chloris rifleman DE P P
Gerygone igata grey warbler NT P P P P
Anthornis melanura bellbird NT P P P P
Prosthemadera novaeseelandiae tui NT P P P P
Mohoua albicilla whitehead NT P P P P
Gymnorhina tibicen Australian magpie I P P
Rhipidura fuliginosa New Zealand fantail NT P P P P
Petroica macrocephala tomtit NT P P P P
Alauda arvensis skylark I P
Zosterops lateralis silvereye NT P P P P
Hirundo neoxena welcome swallow NT P
9 Morepork has not been detected in Wi Tako Reserve during the five-minute bird counts carried out between 2011 and 2014, but has been recorded in the New Zealand eBird database as occurring at this site (http://ebird.org/content/newzealand/; accessed 19/10/2015)
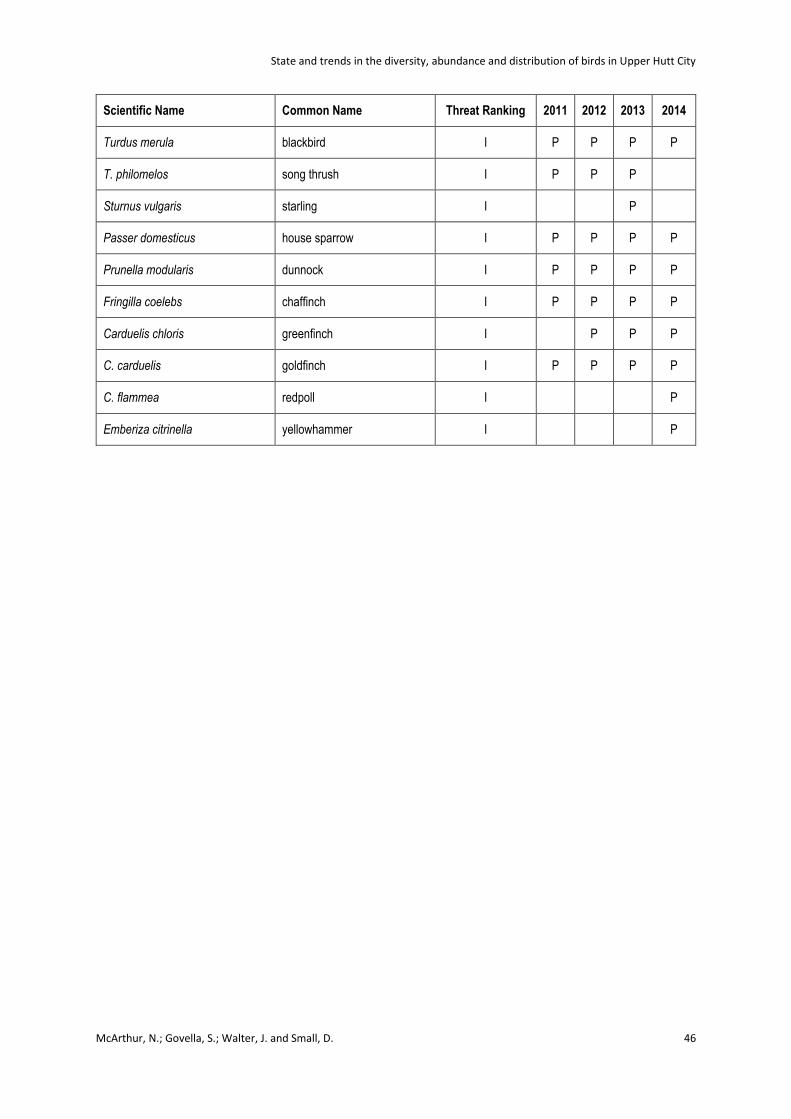
State and trends in the diversity, abundance and distribution of birds in Upper Hutt City
McArthur, N.; Govella, S.; Walter, J. and Small, D. 46
Scientific Name Common Name Threat Ranking 2011 2012 2013 2014
Turdus merula blackbird I P P P P
T. philomelos song thrush I P P P
Sturnus vulgaris starling I P
Passer domesticus house sparrow I P P P P
Prunella modularis dunnock I P P P P
Fringilla coelebs chaffinch I P P P P
Carduelis chloris greenfinch I P P P
C. carduelis goldfinch I P P P P
C. flammea redpoll I P
Emberiza citrinella yellowhammer I P