stat 31, section 1, last time statistical inference confidence intervals: –range of values to...
TRANSCRIPT

Stat 31, Section 1, Last Time• Statistical Inference
• Confidence Intervals:
– Range of Values to reflect uncertainty
– Bracket true value in 95% of repetitions
• Choice of sample size
– Choose n to get desired error
• Hypothesis Testing
– Yes – No questions, under uncertainty
Reading In Textbook
Approximate Reading for Today’s Material:
Pages 400-416, 425-428
Approximate Reading for Next Class:
Pages 431-439, 450-471
Hypothesis Tests
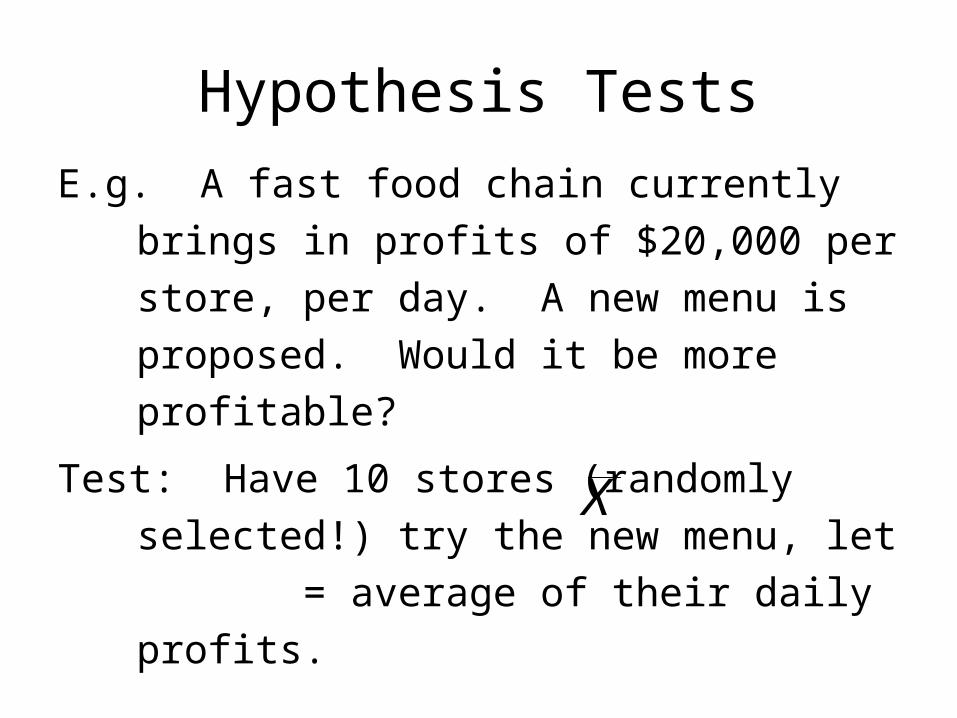
E.g. A fast food chain currently brings in
profits of $20,000 per store, per day. A
new menu is proposed. Would it be
more profitable?
Test: Have 10 stores (randomly selected!)
try the new menu, let = average of
their daily profits.
X

Hypothesis Testing
Note: Can never make a definite conclusion,
Instead measure strength of evidence.
Reason: have to deal with uncertainty
But: Can quantify uncertainty
Hypothesis Testing
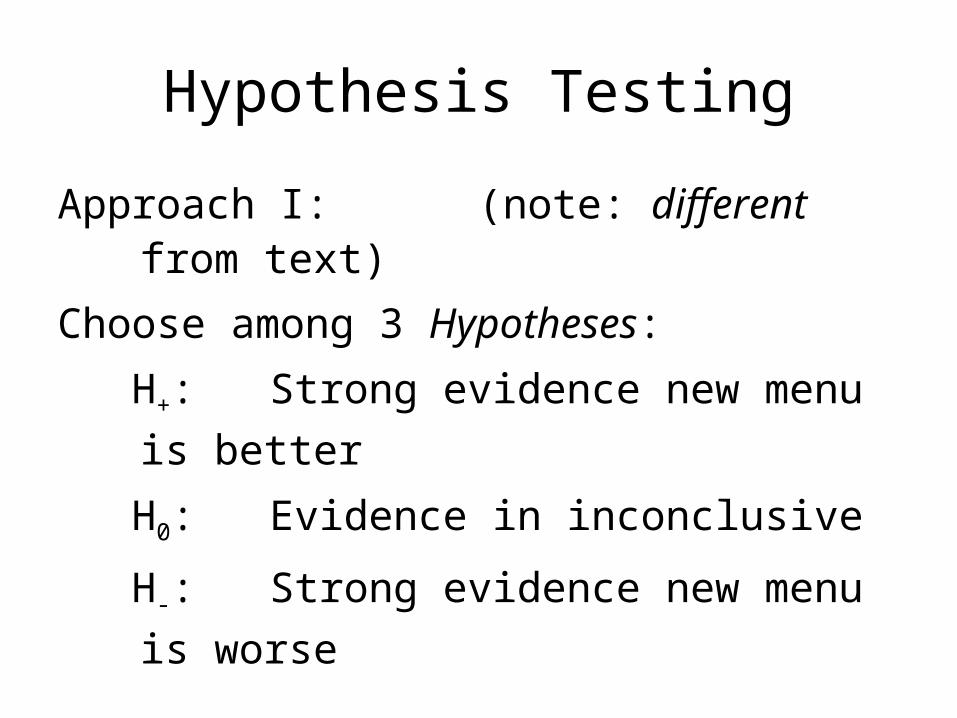
Approach I: (note: different from text)
Choose among 3 Hypotheses:
H+: Strong evidence new menu is better
H0: Evidence in inconclusive
H-: Strong evidence new menu is worse

Caution!!!
• Not following text right now
• This part of course can be slippery
• I am “breaking this down to basics”
• Easier to understand
(If you pay careful attention)
• Will “tie things together” later
• And return to textbook approach later

Fast Food Business Example
Base decision on best guess:
Will quantify strength of the evidence using
probability distribution of
E.g. Choose H+
Choose H0
Choose H-000,20$X
000,20$X
000,20$X
X

Fast Food Business Example
How to draw line?
(There are many ways,
here is traditional approach)
Insist that H+ (or H-) show strong evidence
I.e. They get burden of proof
(Note: one way of solving
gray area problem)

Fast Food Business Example
Suppose observe: ,
based on
Note , but is this conclusive?
or could this be due to natural sampling variation?
(i.e. do we risk losing money from new menu?)
400,2$s000,21$X10n
000,20$X
Fast Food Business Example
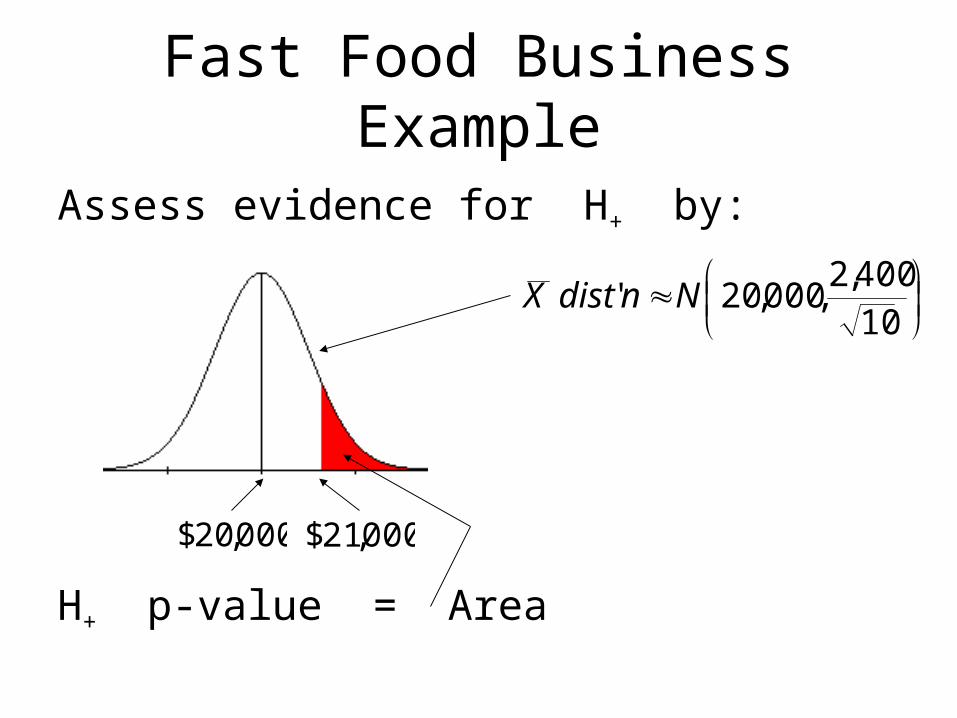
Assess evidence for H+ by:
H+ p-value = Area
10400,2
,000,20' NndistX
000,21$000,20$
Fast Food Business Example
Computation in EXCEL:
Class Example 22, Part 1:http://stat-or.unc.edu/webspace/postscript/marron/Teaching/stor155-2007/Stor155Eg24.xls
P-value = 0.094
i.e. About 10%
Is this “small”?
(where do we draw the line?)
Fast Food Business ExampleView 1: Even under H0, just by chance,
see values like , about 10% of the time,
• i.e. 1 in 10,
• so not “terribly convincing”???
• Could be a “fluke”?
But where is the boundary line?
000,21$X

P-value cutoffs
View 2: Traditional (and even “legal”) cutoff, called here the yes-no cutoff:
Say evidence is strong,
when P-value < 0.05
i. Just a commonly agreed upon value, but very widely used:
– Drug testing
– Publication of scientific papers

P-value cutoffsii. Say “results are statistically significant”
when this happens, i.e. P-value < 0.05
iii. Can change cutoff value 0.05, to some other level, often called
Greek “alpha”
E.g. your airplane safe to fly,
want
E.g. often called strongly significant
05.001.0
P-value cutoffs
View 3: Personal idea about cutoff,
called gray level (vs. yes-no above)
P-value < 0.01: “quite strong evidence”
0.01 < P-value < 0.1: “weaker evidence
but stronger for smaller P-val.”
0.1 < P-value: “very weak evidence, at
best”

Gray Level Cutoffs
View 3: gray level (vs. yes-no above)
Note: only about interpretation of P-value
E.g.: When P-value is given:
HW: 6.40 & (d) give gray level interp.
(no, no, relatively weak evidence)
6.41 & (d) give gray level interp.
(yes, not, moderately strong evidence)
Caution!!!
• Gray level viewpoint not in text
• Will see it is more sensible
• Hence I teach this
• Suggest you use this later in life
• Will be on HW & exams

Fast Food Business ExampleP-value of 0.094 for H+,
Is “quite weak evidence for H+”,
i.e. “only a mild suggestion”
This happens sometimes: not enough information in data for firm conclusion
Fast Food Business Example
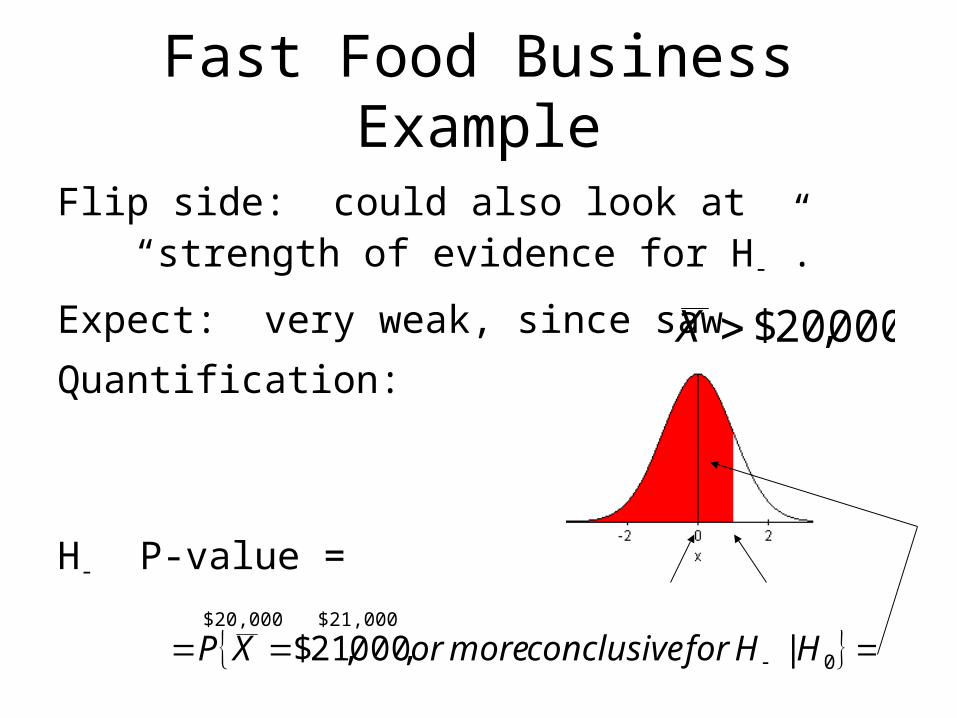
Flip side: could also look at “strength of evidence for H-”.
Expect: very weak, since saw
Quantification:
H- P-value = $20,000 $21,000
000,20$X
0|,000,21$ HHforconclusivemoreorXP

Fast Food Business Example
EXCEL Computation:
Class Example 24, part 1http://stat-or.unc.edu/webspace/postscript/marron/Teaching/stor155-2007/Stor155Eg24.xls
H- P-value = 0.906
>> ½, so no evidence at all for H-
(makes sense)
Fast Food Business ExampleA practical issue:
Since ,
May want to gather more data…
Could prove new menu clearly better
(since more data means more
information, which
could overcome uncertainty)
000,20$000,21$ X
Fast Food Business ExampleSuppose this was done, i.e. n = 10 is
replaced by n = 40, and got the same:
Expect: 4 times the data ½ of the SD
Impact on P-value?
Class Example 24, Part 2http://stat-or.unc.edu/webspace/postscript/marron/Teaching/stor155-2007/Stor155Eg24.xls
000,21$X

Fast Food Business Example
How did it get so small, with only ½ the SD?
mean = $20,000, observed $21,000
P-value = 0.094 P-value = 0.004
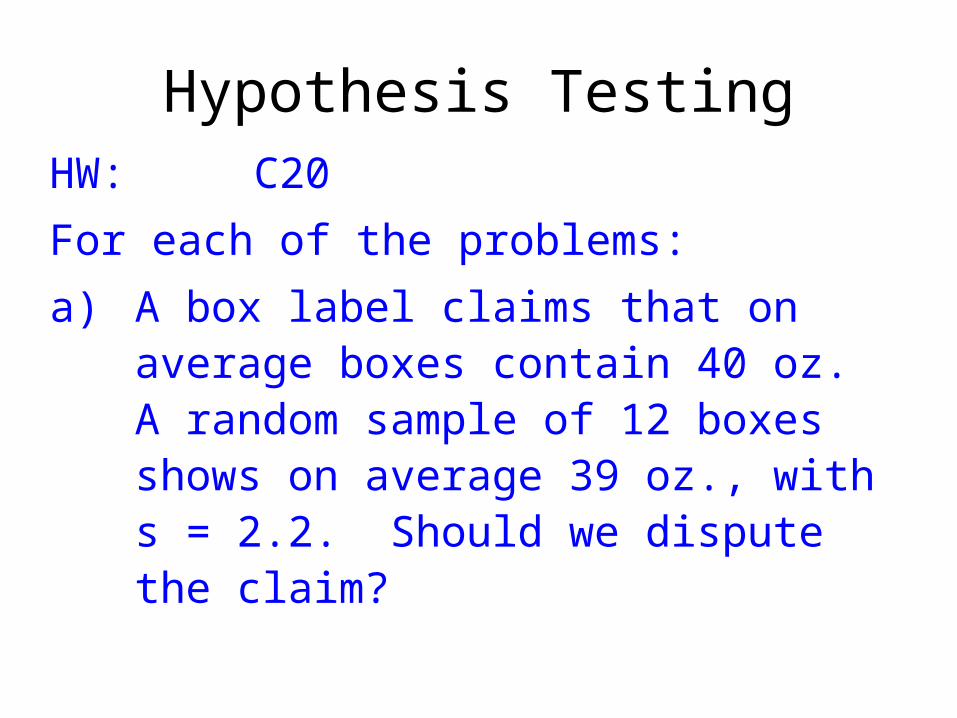
Hypothesis TestingHW: C20
For each of the problems:
a) A box label claims that on average boxes contain 40 oz. A random sample of 12 boxes shows on average 39 oz., with s = 2.2. Should we dispute the claim?

Hypothesis Testingb) We know from long experience that
Farmer A’s pigs average 570 lbs. A sample of 16 pigs from Farmer B averages 590 lbs, with an SD of 110. Is it safe to say B’s pigs are heavier on average?
c) Same as (b) except “lighter on average”.
d) Same as (b) except that B’s average is 630 lbs.

Hypothesis TestingDo:
i. Define the population mean of interest.
ii. Formulate H+, H0, and H-, in terms of mu.
iii. Give the P-values for both H+ and H-.(a. 0.942, 0.058, b. 0.234, 0.766,
c. 0.234, 0.766, d. 0.015, 0.985)
iv. Give a yes-no answer to the questions.(a. H- don’t dispute b. H- not safe
c. H- not safe d. H- safe)
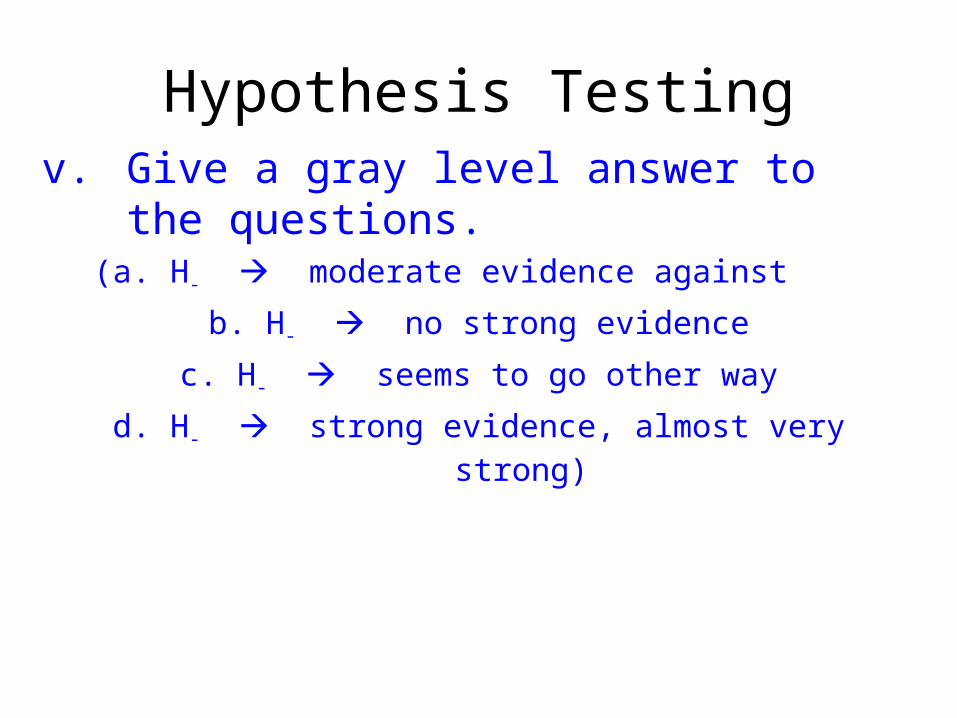
Hypothesis Testingv. Give a gray level answer to the
questions.(a. H- moderate evidence against
b. H- no strong evidence
c. H- seems to go other way
d. H- strong evidence, almost very strong)

And now for somethingcompletely different….
An amazing movie clip:
http://abfhm.free.fr/basket.htm
Thanks to Trent Williamson

Hypothesis Testing
Hypo Testing Approach II:
1-sided testing
(more conventional & is version in text)
Idea: only one of H+ and H- is usually
relevant, so combine other with H0

Attention!!!
• Now return to textbook presentation
• H-, H0, and H+ ideas are building blocks
• Will combine these
• In two different ways
• To get more conventional hypothesis
• As developed in text
Hypothesis Testing
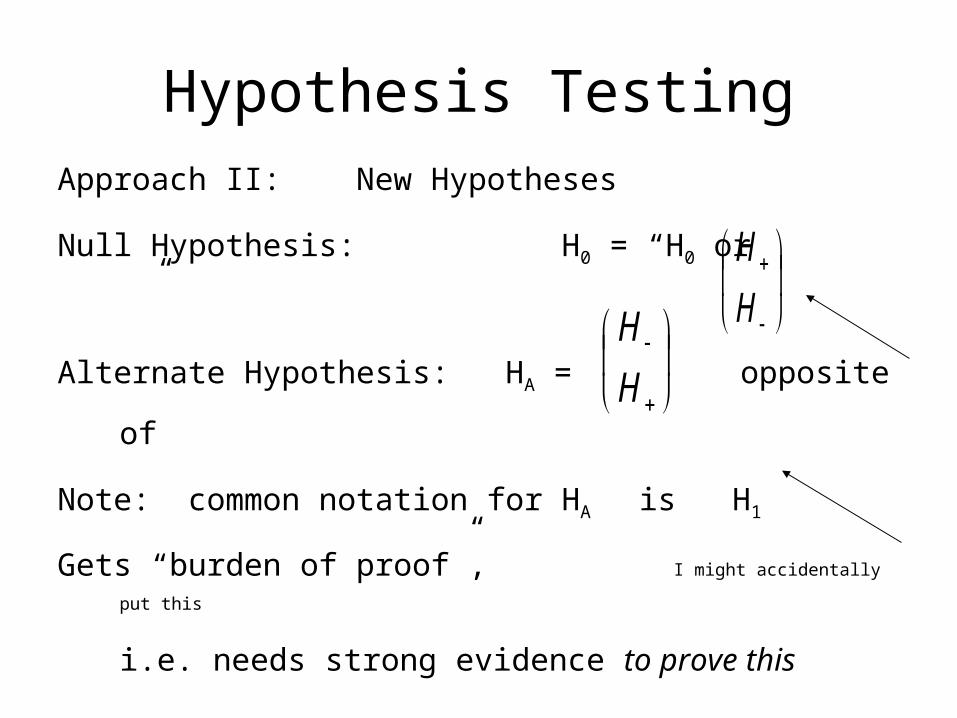
Approach II: New Hypotheses
Null Hypothesis: H0 = “H0 or ”
Alternate Hypothesis: HA = opposite of
Note: common notation for HA is H1
Gets “burden of proof”, I might accidentally put this
i.e. needs strong evidence to prove this
H
H
H
H

Hypothesis Testing
Weird terminology: Firm conclusion is
called “rejecting the null hypothesis”
Basics of Test: P-value =
Note: same as H0 in H+, H0, H- case,
so really just same as above
}&|..{ Ao HHbetweenboundarycmorsawWhatP

Fast Food Business Example
Recall: New menu more profitable???
Hypo testing setup:
P-val =
Same as before.
See: Class Example 24, part 3:http://stat-or.unc.edu/webspace/postscript/marron/Teaching/stor155-2007/Stor155Eg24.xls
000,20$:0 H
000,20$: AH
000,20$|000,21$ XP

Hypothesis TestingHW: 6.55, 6.61
Interpret with both yes-no and gray level
AlternateTerminology:
“Significant at the 5% level” =
= P-value < 0.05
“Test Statistic z” = N(0,1) cutoff

Hypothesis Testing
Hypo Testing Approach III:
2-sided tests
Main idea: when either of H+ or H- is
conclusive, then combine them
E.g. Is population mean equal to a given value, or different?
Note either bigger or smaller is strong evidence

Hypothesis Testing
Hypo Testing Approach III:
“Alternative Hypothesis” is:
HA = “H+ or H-”
General form: Specified Value
:0H
:AH

Hypothesis Testing, III
Note: “ ” always goes in HA, since cannot
have “strong evidence of =”.
i. e. cannot be sure about difference
between and + 0.000001
while can have convincing evidence for
“ ”
(recall HA gets “burden of proof”)
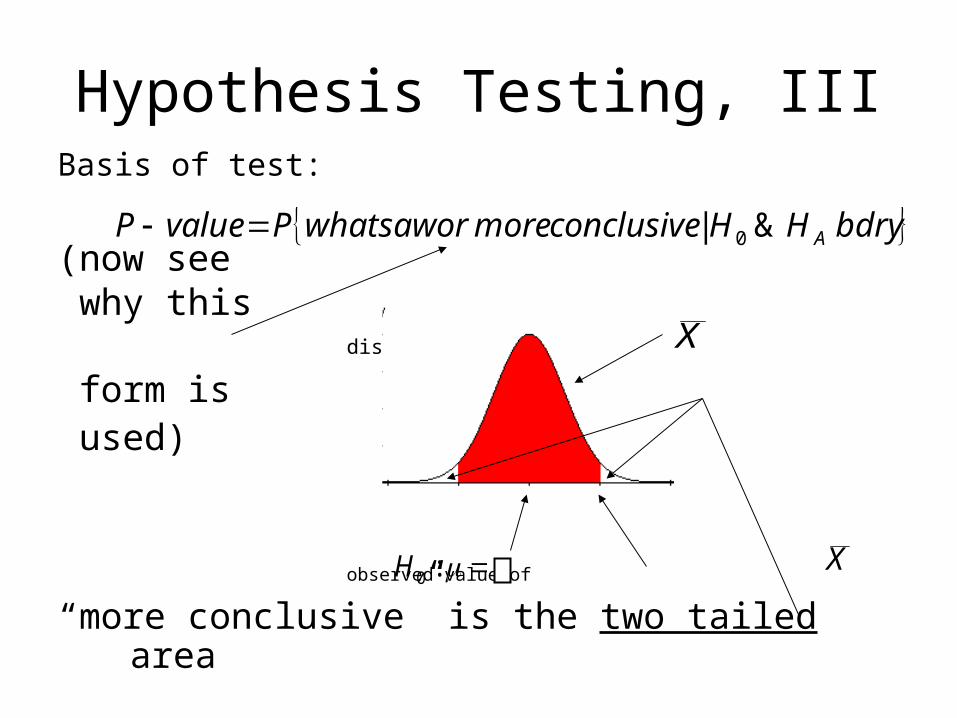
Hypothesis Testing, IIIBasis of test:
(now see why this distribution
form is used) observed value of
“more conclusive” is the two tailed areaX:0H
bdryHHconclusivemoreorsawwhatPvalueP A&| 0
X

Fast Food Business ExampleTwo Sided Viewpoint:
$1,000 $1,000
P-value = $20,000 $21,000
mutually exclusive “or” rule
000,20$:0 H
000,20$: AH
000,21$000,19$ XorXP
0000,21$000,19$ XPXP
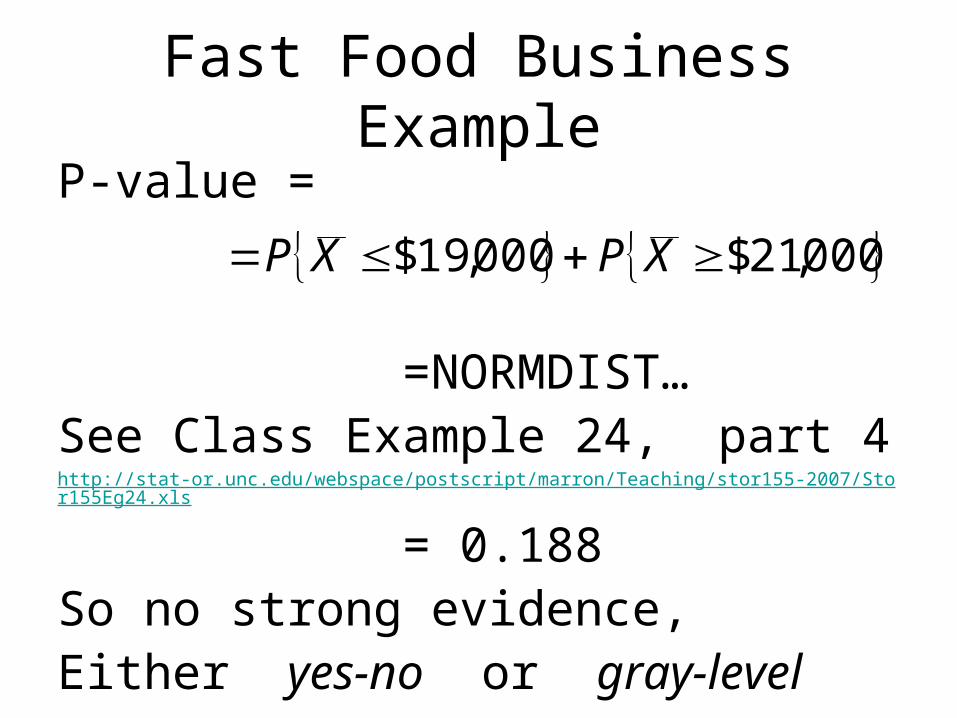
Fast Food Business Example
P-value =
=NORMDIST…See Class Example 24, part 4
http://stat-or.unc.edu/webspace/postscript/marron/Teaching/stor155-2007/Stor155Eg24.xls
= 0.188So no strong evidence,Either yes-no or gray-level
000,21$000,19$ XPXP

Fast Food Business Example
Shortcut: by symmetry
2 tailed Area = 2 x Area
See Class Example 24, part 4http://stat-or.unc.edu/webspace/postscript/marron/Teaching/stor155-2007/Stor155Eg24.xls

Hypothesis Testing, III
HW: 6.62 - interpret both yes-no & gray-level
(-2.20, 0.0278, rather strong evidence)

Hypothesis Testing, III
A “paradox” of 2-sided testing:Can get strange conclusions
(why is gray level sensible?)
Fast food example: suppose gathered more data, so n = 20, and other results are the same

Hypothesis Testing, III
One-sided test of:
P-value = … = 0.031
Part 5 of http://stat-or.unc.edu/webspace/postscript/marron/Teaching/stor155-2007/Stor155Eg24.xls
Two-sided test of:
P-value = … = 0.062
000,20$:0 H
000,20$: AH
000,20$:0 H
000,20$: AH

Hypothesis Testing, III
Yes-no interpretation:
Have strong evidence
But no evidence !?!
(shouldn’t bigger imply different?)
000,20$
000,20$

Hypothesis Testing, IIINotes:i. Shows that yes-no testing is different
from usual logic(so be careful with it!)
ii. Reason: 2-sided admits more uncertainty into process
(so near boundary could make a difference, as happened here)
iii. Gray level view avoids this:(1-sided has stronger evidence,
as expected)

Hypothesis Testing, III
Lesson: 1-sided vs. 2-sided issues need careful:
1. Implementation
(choice does affect answer)
2. Interpretation
(idea of being tested
depends on this choice)
Better from gray level viewpoint
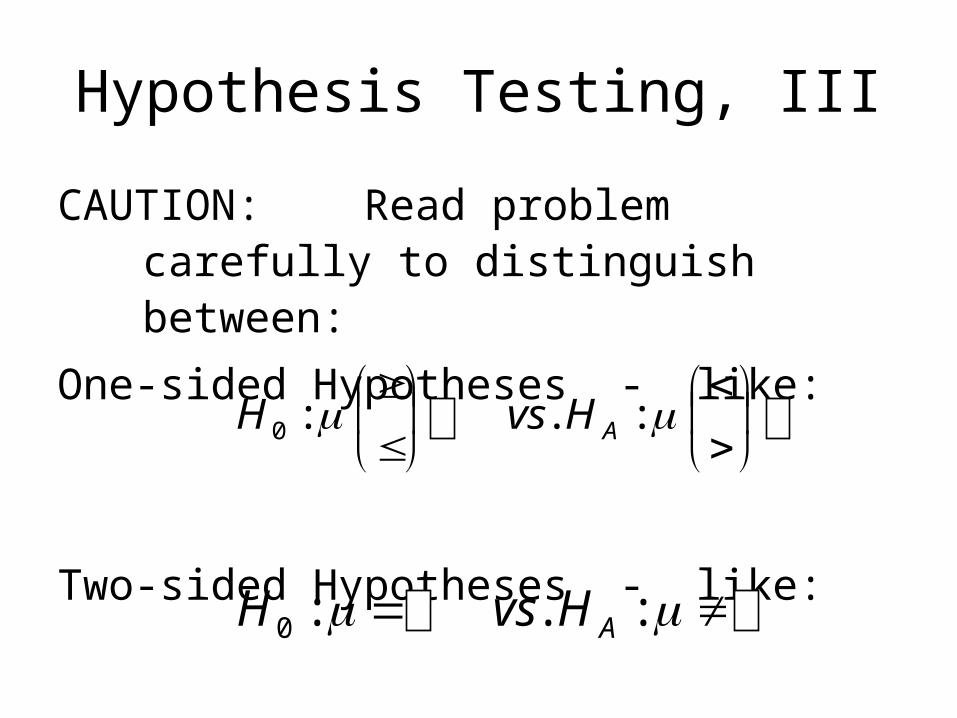
Hypothesis Testing, III
CAUTION: Read problem carefully to distinguish between:
One-sided Hypotheses - like:
Two-sided Hypotheses - like:
:.:0 AHvsH
:.:0 AHvsH
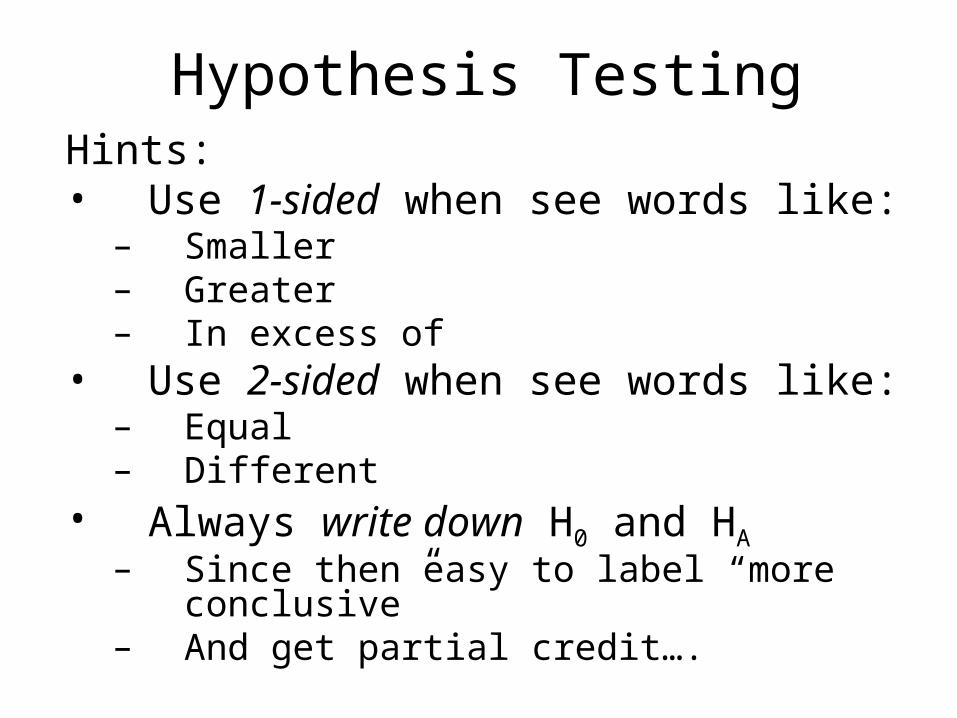
Hypothesis TestingHints:• Use 1-sided when see words like:
– Smaller– Greater– In excess of
• Use 2-sided when see words like:– Equal– Different
• Always write down H0 and HA – Since then easy to label “more conclusive”– And get partial credit….

Hypothesis Testing
E.g. Text book problem 6.34:
In each of the following situations, a
significance test for a population mean,
is called for. State the null hypothesis,
H0 and the alternative hypothesis, HA
in each case….

Hypothesis TestingE.g. 6.34aAn experiment is designed to measure the
effect of a high soy diet on bone density of rats.
Let = average bone density of high soy rats = average bone density of ordinary rats
(since no question of “bigger” or “smaller”)
O
OHSH :0OHSAH :
HS
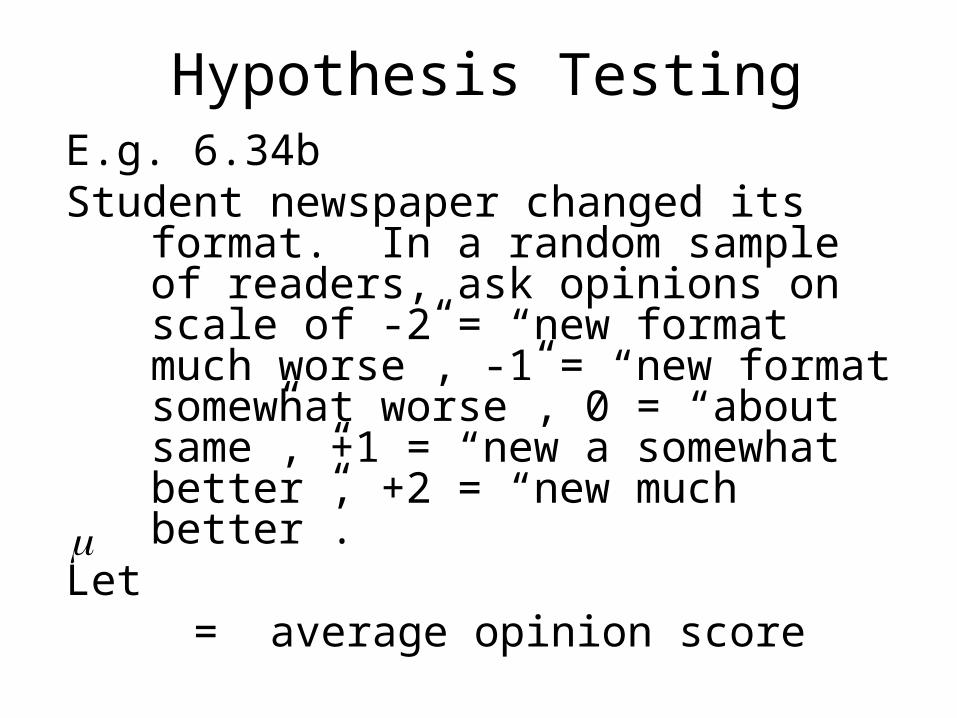
Hypothesis TestingE.g. 6.34bStudent newspaper changed its format. In a
random sample of readers, ask opinions on scale of -2 = “new format much worse”, -1 = “new format somewhat worse”, 0 = “about same”, +1 = “new a somewhat better”, +2 = “new much better”.
Let = average opinion score

Hypothesis TestingE.g. 6.34b (cont.)
No reason to choose one over other, so do two sided.
Note: Use one sided if question is of form: “is the new format better?”
0:0 H
0: AH

Hypothesis TestingE.g. 6.34cThe examinations in a large history class are
scaled after grading so that the mean score is 75. A teaching assistant thinks that his students have a higher average score than the class as a whole. His students can be considered as a sample from the population of all students he might teach, so he compares their score with 75.
= average score for all students of this TA75:0 H 75: AH
Hypothesis Testing
E.g. Textbook problem 6.36
Translate each of the following research
questions into appropriate and
Be sure to identify the parameters in each
hypothesis (generally useful, so already
did this above).
0H AH
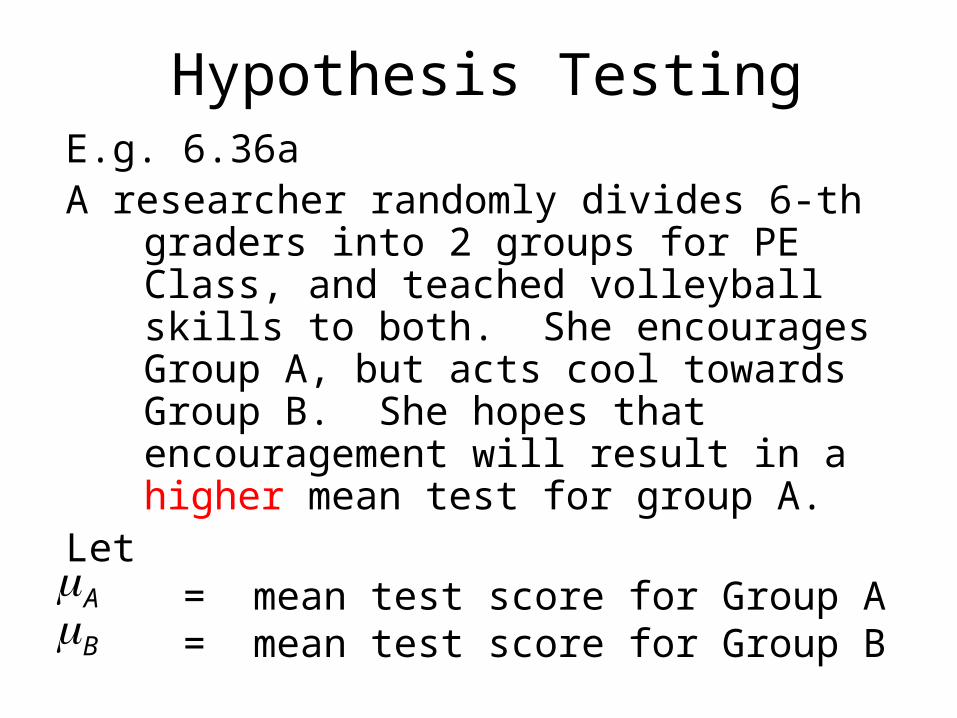
Hypothesis TestingE.g. 6.36aA researcher randomly divides 6-th graders
into 2 groups for PE Class, and teached volleyball skills to both. She encourages Group A, but acts cool towards Group B. She hopes that encouragement will result in a higher mean test for group A.
Let = mean test score for Group A = mean test score for Group BAB

Hypothesis TestingE.g. 6.36a
Recall: Set up point to be proven as HA
BAH :0
BAAH :
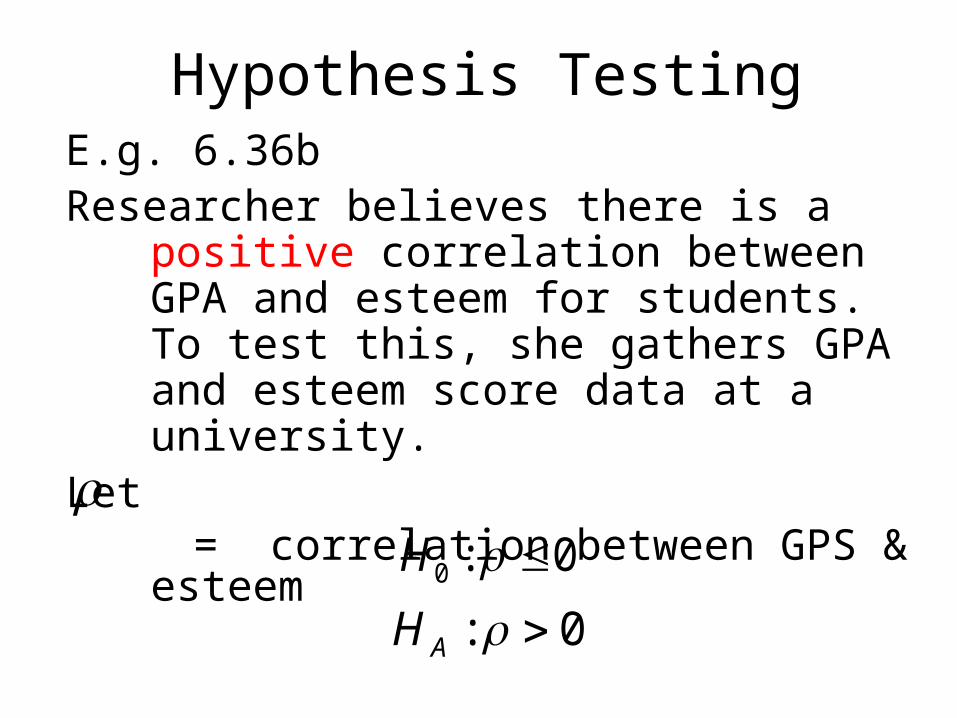
Hypothesis TestingE.g. 6.36bResearcher believes there is a positive
correlation between GPA and esteem for students. To test this, she gathers GPA and esteem score data at a university.
Let = correlation between GPS & esteem
0:0 H
0: AH
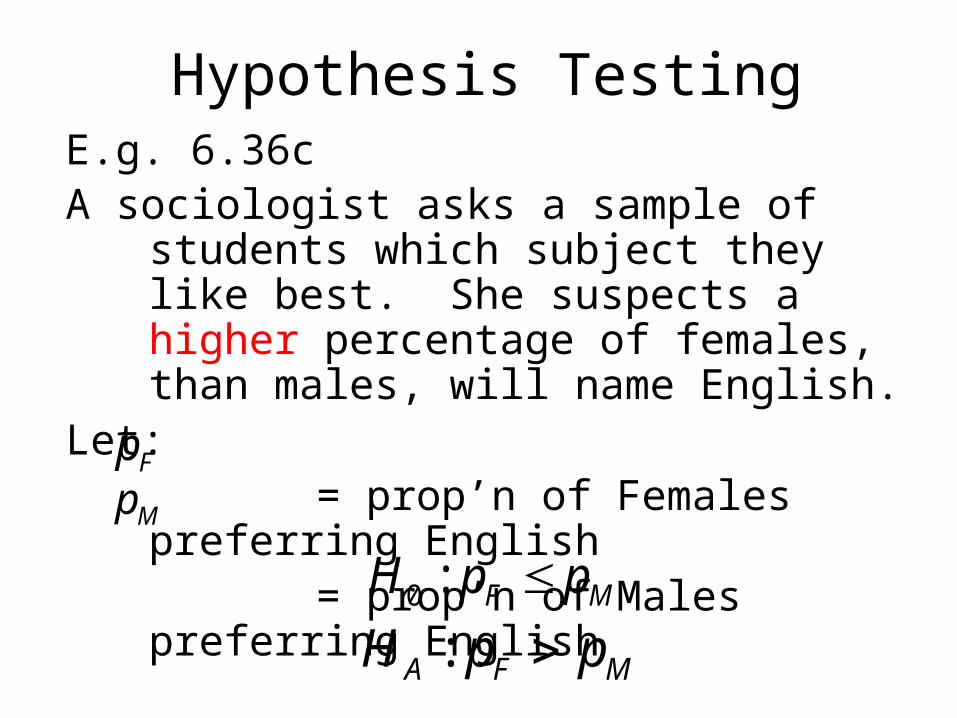
Hypothesis TestingE.g. 6.36cA sociologist asks a sample of students
which subject they like best. She suspects a higher percentage of females, than males, will name English.
Let: = prop’n of Females preferring English = prop’n of Males preferring English
Fp
MF ppH :0
MFA ppH :
Mp

Hypothesis Testing
HW on setting up hypotheses:
6.35, 6.37