start 3 superfund technical assessment and response team … · superfund technical assessment and...
TRANSCRIPT
START 3 Superfund Technical Assessment and Response Team 3 - Region 8
United States Environmental Protection Agency Contract No. EP-W-05-050
Expanded Site Investigation – Analytical Results Report PAVILLION AREA GROUNDWATER INVESTIGATION Pavillion, Fremont County, Wyoming TDD No. 0901-01
August 30, 2010
In association with: Garry Struthers Associates, Inc. LT Environmental, Inc. TechLaw, Inc. Tetra Tech EMI
TN & Associates, Inc.
URS OPERATING SERVICES, INC.
URS Operating Services, Inc. Pavillion Area Groundwater Plume - ARR START 3, EPA Region 8 Signature Page Contract No. EP-W-05-050 Revision: 0 Date: 8/2010 Page i of iv
TDD No. 0901-01 T:\START3\Pavillion Area GW Investigation\Pavillion_Area_GW_Plume_ESI\ARR\Final ARR\SIG-PAGE.doc
EXPANDED SITE INVESTIGATION ANALYTICAL RESULTS REPORT
PAVILLION AREA GW INVESTIGATION
Pavillion, Fremont County, Wyoming
CERCLIS ID # WYN000802735
EPA Contract No. EP-W-05-050 TDD No. 0910-01
Prepared By:
Rebecca Laramie, Deputy Program Manager
URS Operating Services, Inc. 1099 18th Street, Suite 710 Denver, CO 80202-1908
Approved: Date:
Robert Parker, Site Assessment Manager, EPA Region 8 Approved: Date:
Charles W. Baker, START 3 Program Manager, UOS Approved: Date:
Rebecca Laramie, Deputy Program Manager, START 3, UOS This document has been prepared for the U.S. Environmental Protection Agency under Contract No. EP-W-05-050. The material contained herein is not to be disclosed to, discussed with, or made available to any person or persons for any reason without prior express approval of a responsible officer of the U.S. Environmental Protection Agency. In the interest of conserving natural resources, this document is printed on recycled paper and double-sided as appropriate.

URS Operating Services, Inc. Pavillion Area Groundwater Plume - ARR START 3, EPA Region 8 Distribution List Contract No. EP-W-05-050 Revision: 0 Date: 8 /2010 Page ii of iv
TDD No. 0901-01 T:\START3\Pavillion Area GW Investigation\Pavillion_Area_GW_Plume_ESI\ARR\Final ARR\Dist-Lst.doc
DISTRIBUTION LIST U.S. ENVIRONMENTAL PROTECTION AGENCY Robert Parker (23 copies) Site Assessment Manager, EPA Region 8 URS OPERATING SERVICES, INC. Rebecca Laramie (1 copies) Deputy Program Manager, START 3, EPA Region 8 File (1copies) START 3, EPA Region 8
URS Operating Services, Inc. Pavillion Area Groundwater Investigation ESI – ARR START 3, EPA Region 8 Table of Contents Contract No. EP-W-05-050 Revision: 0 Date: 08/2010 Page iii of iv
EXPANDED SITE INSPECTION – ANALYTICAL RESULTS REPORT
PAVILLION AREA GROUNDWATER INVESTIGATION Pavillion, Fremont County, Wyoming
CERCLIS ID# WYN000802735
TABLE OF CONTENTS
PAGE #
SIGNATURE PAGE i DISTRIBUTION LIST ii TABLE OF CONTENTS iii
1.0 INTRODUCTION 1
2.0 OBJECTIVES 1
3.0 BACKGROUND INFORMATION 2 3.1 SITE LOCATION AND DESCRIPTION 3.2 SITE CHARACTERISTICS
3.2.1 Physical Geography 3.2.2 Geology and Hydrogeology 3.2.3 Surface Water Hydrology 3.2.4 Meteorology
3.3 SITE HISTORY AND BACKGROUND RESEARCH 3.3.1 Site History 3.3.2 Previous Work
4.0 PRELIMINARY PATHWAY ANALYSIS 9 4.1 SOURCE CHARACTERIZATION 4.2 GROUNDWATER PATHWAY 4.3 SURFACE WATER PATHWAY 4.4 SOIL EXPOSURE 4.5 AIR PATHWAY
5.0 DATA QUALITY OBJECTIVES PROCESS 14
6.0 FIELD ACTIVITIES 20 6.1 FIELD OBSERVATIONS
7.0 LABORATORY DATA ANALYSIS 25
8.0 ANALYTICAL RESULTS 26 8.1 Groundwater Chemistry 8.2 Bacterial Analysis 8.3 Isotopic Analysis
9.0 DATA VALIDATION AND INTERPRETATION 29 9.1 DATA QUALITY ASSESSMENT 9.2 DATA QUALITY INDICATORS
TDD No. 0901-01 T:\START3\Pavillion Area GW Investigation\Pavillion_Area_GW_Plume_ESI\ARR\Final ARR\ARR August 2010 Final.doc

URS Operating Services, Inc. Pavillion Area Groundwater Investigation ESI – ARR START 3, EPA Region 8 Table of Contents Contract No. EP-W-05-050 Revision: 0 Date: 08/2010 Page iv of iv
TDD No. 0901-01 T:\START3\Pavillion Area GW Investigation\Pavillion_Area_GW_Plume_ESI\ARR\Final ARR\ARR August 2010 Final.doc
9.2.1 Bias 9.2.2 Sensitivity 9.2.3 Precision 9.2.4 Accuracy 9.2.5 Representativeness 9.2.6 Completeness 9.2.7 Comparability 9.2.8 Data Usability Summary
10.0 SUMMARY AND CONCLUSIONS 36 10.1 BACKGROUND 10.2 SUMMARY OF RESULTS AND CONCLUSIONS
11.0 LIST OF REFERENCES 39 FIGURES Figure 1 Site Location Map Figure 2 Sample Locations Map Figure 3 Area of Influence Map Figure 4 Conceptual Site Model
TABLES
Table 1 Hazardous Chemicals in Drilling Fluids with an SCDM Value Table 2 Domestic Wells within a 4-Mile Radius Table 3 Population and Wetlands Within Four Miles of the Site Table 4 Threatened and Endangered Species in Fremont County Table 5 Laboratories and Test Methods Table 6 Sample Locations and Analyses Table 7 Pavillion Groundwater Plume Investigation ESI Analytes Table 8 Samples, Locations, and Sample Type Table 9 SVOA, TPH/DRO, Pesticide, and PCB Results Table 10 VOA and TPH/GRO Results Table 11 Wet Chemistry and Bacteriological Results Table 12 Metals Data Table 13 Fixed and Light Gases in Natural Gas from Production Wells and Domestic Water Wells Table 14 Isotopic Analyses Table 15 Gas Analysis by Chromatography Table 16 Additional Gas Analyses Table 17 C3 – C10 Gasoline Range Compounds in Production and Drinking Water Wells
APPENDICES
Appendix A Laboratory Data Appendix B Photo Log Appendix C EPA Figures Appendix D Chemicals Used in Oil and Gas Production (TEDX) Appendix E Study List of Chemicals Used in Drilling and Hydraulic Fracturing of Oil and Gas Wells Appendix F Chemicals (from MSDSs) Used by Natural Gas Producers the Pavillion, Wyoming Field

URS Operating Services, Inc. Pavillion Area Groundwater Investigation ESI – ARR START 3, EPA Region 8 Revision: 0 Contract No. EP-W-05-050 Date: 08/2010 Page 1 of 82
1.0 INTRODUCTION
This Analytical Results Report (ARR) for the Expanded Site Inspection (ESI) at the Pavillion Area
Groundwater (GW) Investigation site (Comprehensive Environmental Response, Compensation, and
Liability Information System [CERCLIS] ID# WYN000802735) in Fremont County, Wyoming, has been
prepared to satisfy the requirements of Technical Direction Document (TDD) No. 0901-01 issued to URS
Operating Services, Inc. (UOS) under the U.S. Environmental Protection Agency (EPA) Region 8
Superfund Technical Assessment and Response Team 3 (START 3) Contract No. EP-W-05-050. This
report has been prepared in accordance with the EPA “Guidance for Performing Site Inspections under
CERCLA,” Interim Final, September 1992, and the “Region 8 Supplement to Guidance for Performing
Site Inspections under CERCLA” (EPA 1992; EPA 1993). Field activities were conducted from January
18 to January 22, 2010, in Pavillion, Wyoming. Field activities followed the Site Inspection (SI) format
during the ESI, applicable UOS Technical Standard Operating Procedures (TSOPs), and the Generic
Quality Assurance Project Plan (QAPP) (UOS 2005b; UOS 2005a). This ARR is intended to be used in
conjunction with the Field Sampling Plan (FSP) (UOS 2010).
Contamination from chemicals of concern in the Pavillion area was originally alleged by local residents
when visual and odor parameters for several domestic wells changed. Visual changes included yellow
color, increased turbidity, oil sheen, and inclusion of small gas bubbles. A hydrocarbon odor was also
reported. Prior screening, sampling, and analyses conducted previous to EPA’s investigation indicated
chemicals of concern in domestic wells with unknown risks to health and unknown sources. A previous
SI performed by EPA narrowed the area of concern to an area in and around 11 wells that possessed
detections of methane; volatile petroleum hydrocarbons (VPH), tentatively identified semivolatile organic
compounds (SVOCs) and volatile organic compounds (VOCs); nitrate; arsenic; phthalates; and
caprolactam. These wells are located in Sections 2, 10, 11, 12, 13, 15, 17, 21, and 27 of T. 3N., R. 2 E.
and Section 7 of T. 3 N., R. 3 E. See Section 3.3.2 for a summary of previous work.
2.0 OBJECTIVES
The primary purpose of this ESI is to gather information for the evaluation of this site with regard to the
following objectives:
Quantify levels of chemicals of concern in wells, in order to determine risk(s), to the extent
practicable; and
Identify source(s) of chemicals of concern, to the extent practicable.
TDD No. 0901-01 T:\START3\Pavillion Area GW Investigation\Pavillion_Area_GW_Plume_ESI\ARR\Final ARR\ARR August 2010 Final.doc
URS Operating Services, Inc. Pavillion Area Groundwater Investigation ESI – ARR START 3, EPA Region 8 Revision: 0 Contract No. EP-W-05-050 Date: 08/2010 Page 2 of 82
The primary purpose of this report is to present the data obtained from EPA’s January 2010 sampling
event. EPA has not currently reached any conclusions regarding the source of compounds of concern in
domestic wells. EPA will continue to collect data and plans to prepare a report to identify the source(s) of
chemicals of concern, to the extent practicable.
3.0 BACKGROUND INFORMATION
3.1 SITE LOCATION AND DESCRIPTION
The Pavillion Area Groundwater Investigation site is located near Pavillion, Wyoming, in
Fremont County (Figure 1). The site is a rural community situated east of Pavillion in the Wind
River Basin, and is centered approximately where several complaints of foul odor and taste in
domestic water wells have been levied by residents. The site is centered in the southwest quarter
of Section 2, T. 3 N., R. 2 E. The latitude is 43° 15' 37.533" north and the longitude is 108° 36'
59.698" west. Land use surrounding the site is rural, with some residential properties located
among fields used for agriculture and natural gas production.
3.2 SITE CHARACTERISTICS
3.2.1 Physical Geography
The Pavillion Area Groundwater Investigation site is located in the Wind River Valley,
which is the major regional topographic expression. The valley is located in central
Wyoming, and is approximately 200 miles long by 100 miles wide, covering an area of
approximately 11,700 square miles (Fox and Dolton 1995). The site is at an elevation of
approximately 5,463 feet above mean sea level, and the terrain at the site slopes gently to
the south (U.S. Geological Survey [USGS] 1959). The site is located in a sparsely
populated rural area. The predominant vegetation in the area is a mixture of dryland
grasses and shrubs (UOS 2008).
3.2.2 Geology and Hydrogeology
Wind-River Basin
The site is located in the north-central portion of the the Wind River Basin, a structurally
controlled sedimentary basin in central Wyoming. The basin is bounded by the Owl
Creek and Bighorn Mountains to the north, the Wind River Range to the west, the
TDD No. 0901-01 T:\START3\Pavillion Area GW Investigation\Pavillion_Area_GW_Plume_ESI\ARR\Final ARR\ARR August 2010 Final.doc

URS Operating Services, Inc. Pavillion Area Groundwater Investigation ESI – ARR START 3, EPA Region 8 Revision: 0 Contract No. EP-W-05-050 Date: 08/2010 Page 3 of 82
Granite Mountains to the south, and the Casper Arch to the east (McGreevy 1969; Mason
2005).
The Wind River basin consists of a thick sequence of sedimentary rocks derived from the
nearby mountain ranges (Appendix C – Figure 1). These sedimentary rocks are laterally
and vertically variable in composition. Because of the variation, groundwater occurrence
in the area is complex and varies with location, elevation, and geologic unit. USGS
reports more than 30 water-bearing formations in the Wind River Basin. These units can
be separated into two main groups: an underlying bedrock aquifer consisting of Tertiarty-
aged rock units and an overlying sequence of young, unconsolidated alluvium and eolian
deposits. (Zelt et al. 1999). The Wind River Basin has a complicated structure created
by uplifting, folding, and faulting. The Wind River aquifer is the principal source of
domestic and stock water at the site.
In the Wind River Basin, the major stratigraphic units exposed at the surface are
Cretaceous, Tertiary, and Quaternary in age. The Cretaceous units include the Cody
Shale, a dull gray shale with gray siltstones and fine-grained sandstones, and the
Mesaverde Formation, a light colored massive to bedded sandstone with gray sandy shale
and coal beds present.
Tertiary aged units include the Wind River, Fort Union, and Indian Meadows
Formations. The Wind River Formation is the dominant outcrop present in the Wind
River Basin and is exposed over most of the central portion of the basin. This formation
is described as a red and white claystone and siltstone unit containing a lenticular coal
unit in the center of the formation, and mostly nontuffaceous except near the top (Love
and Christiansen 1985). The thickness of the Wind River formation varies from a few
meters at the basin margin to several thousand meters thick in the northern part of the
area (Seeland 1978). The Indian Meadows Formation is described as a red claystone to
sandstone with limestone present; the unit also contains Paleozoic boulders and Mesozoic
rocks, probably resulting from glaciations (Love and Christiansen 1985). The Indian
Meadow is absent along the southwestern side of the basin, and may be thousands of
meters thick or more in the subsurface along the north side of the basin (Seeland 1978).
The Fort Union Formation, the least abundant unit present in the basin, is described as a
brown to gray sandstone with gray to black shale and thin coal bed. Along the northern
TDD No. 0901-01 T:\START3\Pavillion Area GW Investigation\Pavillion_Area_GW_Plume_ESI\ARR\Final ARR\ARR August 2010 Final.doc
URS Operating Services, Inc. Pavillion Area Groundwater Investigation ESI – ARR START 3, EPA Region 8 Revision: 0 Contract No. EP-W-05-050 Date: 08/2010 Page 4 of 82
edge of the basin the Fort Union is 2,500 meters thick; along the west and south sides of
the basin the formation ranges in thickness from 50 to 350 meters (Seeland 1978).
Along with the previously mentioned formations, the basin contains various Quaternary
deposits including river alluvium, gravel pediment, and fan deposits, and Pleistocene
glacial deposits (Love and Christiansen 1985).
Pavillion Area Geology
This section was provided by EPA.
Erosion of the nearby mountains ranges uplifted during Late Cretaceous and early
Tertiary formed the sequence of sedimentary rocks of the Wind River Basin. Channel fill
and thin layers comprise the majority of the basin sediments depending on depth and
surface location. The accumulation of sediments in the basin stopped in the late tertiary
and erosion began to expose the more resistant layers of the Wind River formation in the
Pavillion area. (Morris 1959)
The Wind River formation in the Pavillion area is essentially horizontal with a slight dip
toward the center of the basin to the northeast. (Appendix C – Figures 2 and 3) Generally
the Wind River formation consists of poorly consolidated sandstone, siltstone, and shale.
The more resistant layers of the Wind River formation in the Pavillion area have formed
Muddy Ridge to the north of the project area and Indian Ridge which is located near the
southern end of the project area. (Morris 1959)
The Wind River formation consists of a complex series of interbedded lenticular sand
stone, siltstone, shale, claystone, conglomerate tuff, and fresh-water limestone. It has
been differentiated from the Fort Union formation below by a slight discordance or
unconformity on lignite beds of the Fort Union formation. Sandstone deposits were
deposited generally as lenticular lenses or as channel deposits which are sometimes
crossbedded. The cemented lenses are irregular, elongate masses up to 3 feet thick which
resist erosion and form ledges or ridges. (Morris, 1959) This geologic unit is exposed
from the west-central part to the northeast and south-central parts of the county and is
composed of "variegated claystone and sandstone; lenticular conglomerate" (Plafcan, M.,
et al,. 1995).
TDD No. 0901-01 T:\START3\Pavillion Area GW Investigation\Pavillion_Area_GW_Plume_ESI\ARR\Final ARR\ARR August 2010 Final.doc
URS Operating Services, Inc. Pavillion Area Groundwater Investigation ESI – ARR START 3, EPA Region 8 Revision: 0 Contract No. EP-W-05-050 Date: 08/2010 Page 5 of 82
Alluvial deposits along Five Mile Creek can range up to 1 mile wide but are generally
found to be a quarter of a mile to three quarters of a mile wide and the average thickness
is 40 feet. (Morris 1959)
Pavillion Area Hydrogeology
This section was provided by EPA.
“Ground-water movement is controlled by the location of recharge and discharge areas
and by the thickness and permeability of the geologic unit. Primary permeability is a
function of the grain size, sorting, and cementation between grains. Secondary
permeability created by fracturing and dissolution also is an important factor controlling
ground-water movement. Fractures along anticlines can provide important conduits for
vertical and horizontal ground-water flow.” (Plafcan, M., et al,. 1995).
Geologic units in Fremont County are recharged by one or a combination of the
following sources: (1) precipitation that infiltrates the geologic unit in its outcrop area,
(2) infiltration of surface water, (3) infiltration of irrigation water, and (4) leakage from
another geologic unit, either above or below. Ground-water movement is controlled by
the location of recharge and discharge areas and by the thickness and permeability of the
geologic unit.
Shallow wells in the weathered Wind River formation are typically completed in the
unconfined aquifer but wells in the Wind River formation obtaining water from deeper
lenticular sandstone beds can be semi-confined. (Morris 1959) (Appendix C – Figure 4).
Regarding shallow unconfined groundwater, both quality and water levels in the Pavillion
area are most likely indicative of flood irrigation volume and quality. Crops such as
alfalfa are irrigated and cut up to three times per year. The consumptive irrigation
requirement for alfalfa in the Riverton area is 24.37 inches. The irrigation season begins
in April and ends in October (Trelease, F.J., et al., 1970).
The colluvial-alluvial, alluvial and possibly terrace deposits in the Pavillion area together
make up the shallow unconfined groundwater. Due to increased recharge to this zone
during the irrigation season, the water table increases in elevation. Groundwater flow
directions follow the land contours in surficial deposits. In the project area near Indian
TDD No. 0901-01 T:\START3\Pavillion Area GW Investigation\Pavillion_Area_GW_Plume_ESI\ARR\Final ARR\ARR August 2010 Final.doc

URS Operating Services, Inc. Pavillion Area Groundwater Investigation ESI – ARR START 3, EPA Region 8 Revision: 0 Contract No. EP-W-05-050 Date: 08/2010 Page 6 of 82
Ridge, groundwater flow would be expected to flow along the slope of land until it
reaches alluvial deposits which are hydraulically connected to Five Mile Creek.
Groundwater flow in the alluvial deposits primarily moves down valley or discharges to
Five Mile Creek. It is expected that Five Mile Creek flow is largely dependent on the
amount of irrigation that is applied during the summer months recharging shallow
groundwater which ultimately provides base flow conditions through out the winter
months with some additional snow melt in the spring (Morris 1959).
In the lower reaches of Five Mile Creek where the creek cuts into the Wind River
formation shallow confined groundwater discharges to the creek from the Wind River
formation. Pieziometric surfaces in confined or semi-confined aquifers in the Wind
River Formation are mostly influenced by nearby pumping wells.
The Wind River Formation is the most areally extensive water-bearing unit that occurs at
the surface. Forty-eight percent of the wells evaluated in the 1995 Water Resources of
Fremont County report were completed in the Wind River Formation. Pump tests of
confined aquifers performed on Wind River formation wells in the Riverton area have
shown that sandstone layers are interconnected hydraulically. Transmissibility is 10,000
gallons per day (gpd) per feet or a transmissivity of 1,000 ft2 per day and storage
coefficient for the Wind River formation are between 0.00012 and 0.00021. Although
aquifers in the Wind River formation do not yield large quantities, it is the best source of
water for domestic use. The largest yield is 200gpm but larger yields could be obtained
by drilling deeper into the formation (Morris 1959) Richter reported a maximum yield of
3,000 gal/min from a well completed in the Wind River Formation (Richter 1981).
Economic Geology
As previously stated, the Wind River Basin has a complicated structure created by the
uplifting, folding, and faulting of the Laramide Orogeny. Various thrust faults run the
length of the basin along the north and northeast boundaries. A large amount of faulting
is also present in the north-central to northeastern part of the basin, including in the
Pavillion Area, and in the south part of the basin near the Granite Mountains (Love and
Christiansen 1985). The complex geologic structure and rock formations have resulted in
many structural and stratigraphic traps for hydrocarbons; consequently, drilling for
natural gas and oil is common in the area (Fox and Dolton 1995).
TDD No. 0901-01 T:\START3\Pavillion Area GW Investigation\Pavillion_Area_GW_Plume_ESI\ARR\Final ARR\ARR August 2010 Final.doc

URS Operating Services, Inc. Pavillion Area Groundwater Investigation ESI – ARR START 3, EPA Region 8 Revision: 0 Contract No. EP-W-05-050 Date: 08/2010 Page 7 of 82
In addition to the hydrocarbon production in the basin, uranium deposits occur along the
south and southeast basin margins (Seeland 1978, Soister 1968). Many of the lower
Eocene-aged strata are radioactive in the southeastern part of the basin; however, they
contain uranium minerals only in a few localities (Keefer 1965).
Water-yielding, Tertiary-aged formations in the basin include the White River, a highly
permeable and productive unit, yielding between 1 and 1,100 liters per minute, with a
maximum reported at 3,200 liters per minute; Tepee Trail, which yields small amounts of
water and is a confining layer; the Wagon Bed, which yields small amounts of water, but
is not considered an aquifer; the Wasatch, for which water yield is unknown; and the
Wind River, which represents a major aquifer in the basin and yields water between 4 and
11,000 liters per minute. These formations contain local artesian zones, are the principal
source of domestic and stock water on the Wind River Reservation, and are the major
source of industrial water in the southern part of the basin. The Willwood and Fort
Union Formations yield small amounts of water, although the Fort Union is not currently
used for domestic use (Zelt et al., 1999). The Aycross and Indian Meadows Formations
represent confining layers within the Tertiary units. A majority of the groundwater used
in the region comes from the younger aquifers, mostly because of the depth of the
aquifers (Zelt et al. 1999).
3.2.3 Surface Water Hydrology
Surface water and runoff generally flow from the site to Five-Mile Creek, then eastward
to the Boysen Reservoir. The annual mean flow of the Five-Mile Creek for the year of
2007 was 120 cubic feet per second (cfs) and the highest flow recorded was 253 cfs in
1999 (USGS 2008).
The principal streams of the area flow southeastward parallel to the axis of the Wind
River Basin. Five Mile Creek flow is more than likely sustained by surface runoff during
precipitation events. However return flows during irrigation and groundwater flow to
Five Mile Creek provides most of the flow for the entire year. The first irrigation canal
for the Riverton Irrigation project was completed in 1907.
TDD No. 0901-01 T:\START3\Pavillion Area GW Investigation\Pavillion_Area_GW_Plume_ESI\ARR\Final ARR\ARR August 2010 Final.doc
URS Operating Services, Inc. Pavillion Area Groundwater Investigation ESI – ARR START 3, EPA Region 8 Revision: 0 Contract No. EP-W-05-050 Date: 08/2010 Page 8 of 82
3.2.4 Meteorology
The climate of Wind River Valley is characterized as semiarid continental, with an
annual mean precipitation of approximately 11.5 inches and an annual net precipitation of
slightly more than 1 inch (University of Delaware 1986). The 2-year, 24-hour rainfall
event for the area is approximately 1.5 inches (Dunne and Leopold 1978).
3.3 SITE HISTORY AND BACKGROUND RESEARCH
3.3.1 Site History
Domestic well owners in the Pavillion area have filed complaints with the Wyoming
Department of Environmental Quality and EPA Region 8, and have reported a foul odor
and taste in their groundwater. Some domestic well owners suspect the foul odor and
taste originate from natural gas well activity in the area.
3.3.2 Previous Work
Previous EPA field activities at the site include a site inspection conducted by UOS in
2009. This site inspection consisted of collecting 37 residential well and 2 municipal
well water samples in Pavillion, Wyoming. Field activities were conducted from March
2 through March 6, 2009, and May 14 and May 15, 2009. Samples were analyzed for
some or all of the following parameters: Target Compound List (TCL) Volatile Organic
Compounds, Semi-volatile Organic Compounds, Target Analyte List (TAL) total metals,
pesticides, polychlorinated biphenyls (PCB), microbacteriological parameters, anions,
and petroleum hydrocarbons including Volatile Petroleum Hydrocarbons (VPH), and
Extractable Petroleum Hydrocarbons (EPH). Through the EPA Contract Laboratory
Program (CLP), 40 samples were analyzed for VOCs, 39 samples were analyzed for
SVOCs, 40 samples were analyzed for TAL total metals, 39 samples were analyzed for
pesticides, and 39 samples were analyzed for PCBs. Through the EPA Region 8
Laboratory, 14 samples were analyzed for SVOC Tentatively Identified Compounds
(TIC), 40 samples were analyzed for anions/ alkalinity, and 15 samples were analyzed for
dissolved methane. Through a commercial laboratory, 14 samples were analyzed for
VPH, 12 samples were analyzed for EPH and 6 samples were analyzed for
bacteriological parameters (UOS 2009).
TDD No. 0901-01 T:\START3\Pavillion Area GW Investigation\Pavillion_Area_GW_Plume_ESI\ARR\Final ARR\ARR August 2010 Final.doc

URS Operating Services, Inc. Pavillion Area Groundwater Investigation ESI – ARR START 3, EPA Region 8 Revision: 0 Contract No. EP-W-05-050 Date: 08/2010 Page 9 of 82
SVOC TICs including adamantanes, tris(2-butoxyethyl) phosphate also known as 2-
butoxyethanol phosphate (2-BEP), 2,4-bis(1-phenyl)-phenol, bisphenol-A, terpineol, 5-
hydroxymethyldihydrofuran, and limonene were detected in groundwater samples.
Bacterial testing was conducted for five wells. Of those five wells, two contained iron-
reducing bacteria and one contained iron- and sulfate-reducing bacteria. Heterotrophic
plate count testing (a measure of bacterial activity) revealed bacteria at levels between 2
and 130 MPN/mL (Most Probable Number of bacterial colonies per milliliter).
Arsenic was detected in sample PGDW25 at 31 micrograms per liter (µg/L), which
exceeds the Maximum Contaminant Level (MCL) of 10 µg/L.
VPHs were detected in the petroleum analyses for samples PGDW05 and PGDW30 at 26
µg/L and 25 µg/L, respectively.
Dissolved methane was detected in eight domestic wells above the non-detect value.
Nitrate was detected in sample PGDW22 at 43.6 milligrams per liter (mg/L), which
exceeds the MCL of 10 mg/L.
Many of the detections (arsenic, methane, adamantanes, tris (2-butoxyethyl) phosphate,
phthalates, caprolactam, and VPH) occured in a small number of wells. These wells and
the surrounding area are the focus of this ESI (Figure 2).
4.0 PRELIMINARY PATHWAY ANALYSIS
4.1 SOURCE CHARACTERIZATION
For the purpose of this report the site is considered an area of impacted groundwater in and
around the 11 wells identified in the previous Site Inspection.
Potential sources of contamination considered for this analysis include:
Natural gas production activities, such as abandoned pits, improperly plugged and
abandoned wells, improper well construction, improper well completion techniques, well
stimulation, and workover activities;
Agricultural activities, such as improper application or disposal of pesticides or
rodenticides;
TDD No. 0901-01 T:\START3\Pavillion Area GW Investigation\Pavillion_Area_GW_Plume_ESI\ARR\Final ARR\ARR August 2010 Final.doc

URS Operating Services, Inc. Pavillion Area Groundwater Investigation ESI – ARR START 3, EPA Region 8 Revision: 0 Contract No. EP-W-05-050 Date: 08/2010 Page 10 of 82
Industrial chemicals from local businesses that may include but not limited to: machinery
shops, repair shops, auto body work shops, and painting facilities;
Landowner/well owner management of wells, and well components;
Landowner’s septic systems, fuel storage and small scale dumps; and
Naturally occurring contaminants.
Potential source pathways include:
Downward infiltration of chemicals of concern from the surface;
Lateral emplacement of chemicals of concern from offset wells;
Upward migration of chemicals of concern from underlying sources;
Direct placement of chemicals of concern in domestic water wells; and
Infiltration from surface water bodies (i.e., Five Mile Creek).
4.2 GROUNDWATER PATHWAY
Groundwater is the primary pathway being considered in this investigation. The surrounding
residents obtain drinking water from private domestic wells. The Wyoming State Engineer’s
Office has records of approximately 83 private domestic wells within the 4-mile radius of the site
area center. The average number of persons per household in Fremont County, Wyoming, is 2.3
(U.S. Department of the Interior, Bureau of the Census [U.S. Census Bureau] 2000). Assuming
that each domestic well serves one household, the total number of residents using groundwater
within the 4-mile radius of the site is approximately 191 people. The data from the Wyoming
State Engineer’s Office website does not provide information on the current status of each well
within the 4-mile radius (Wyoming State Engineer’s Office 2008).
The town of Pavillion, Wyoming, located approximately 5 miles west of the study area center
area, has five municipal wells that supply water to 165 residents in 89 homes (UOS 2009). Four
of the municipal wells were running during the sampling time frame. All four of the wells were
considered purged and two were subsequently sampled. The sampled municipal wells were the
same two wells that were sampled during the 2009 Site Inspection.
TDD No. 0901-01 T:\START3\Pavillion Area GW Investigation\Pavillion_Area_GW_Plume_ESI\ARR\Final ARR\ARR August 2010 Final.doc

URS Operating Services, Inc. Pavillion Area Groundwater Investigation ESI – ARR START 3, EPA Region 8 Revision: 0 Contract No. EP-W-05-050 Date: 08/2010 Page 11 of 82
Within the 2-mile radius of the site there are eight stock wells used for ranching purposes.
TABLE 2 Domestic Wells within a 4-Mile Radius
Radius (miles) Number of Wells
Estimated Number of Persons Served by
Domestic Wells
0 – 0.25 0 0
0.25 – 0.50 2 5
0.50 – 1.0 7 16
1.0 – 2.0 15 35
2.0 – 3.0 21 48
3.0 – 4.0 38 87
Total 83 191
4.3 SURFACE WATER PATHWAY
Topography of the site slopes to the south and east. The surface water overland drainage flows
off the site mainly in the southeasterly direction 975 feet to Five-Mile Creek. The annual flow
rate of Five-Mile Creek is 120 cfs, and the creek is considered a fishery.
Four miles of the 15-mile target distance limit considered under the Hazard Ranking System
along Five-Mile Creek consists of wetlands (Figure 3). The wetlands start approximately 0.25
mile downstream of the site with Palustrine Scrub Shrub, and the remainder of the wetlands
consists of Palustrine Emergent land with a scattering of Palustrine Scrub Shrub (U.S. Fish and
Wildlife Service [USFWS] 1998). No drinking water intakes are documented along the 15-mile
target distance limit. No electronic floodplain information could be located at the time of the
preparation of this report.
Five-Mile Creek is used for recreational fishing. The species of fish that can be found in Five-
Mile Creek include: Burbot, Flathead Chubs, Lake Chubs, White Suckers, and Long-nose Dace.
The Burbot is a game fish eaten by local residents (Wyoming Game and Fish Department
[WGFD] 2009). This creek is classified as a fishery by the State of Wyoming.
Five locations along Five-Mile Creek were sampled to characterize background (upstream) and
downstream water quality.
TDD No. 0901-01 T:\START3\Pavillion Area GW Investigation\Pavillion_Area_GW_Plume_ESI\ARR\Final ARR\ARR August 2010 Final.doc

URS Operating Services, Inc. Pavillion Area Groundwater Investigation ESI – ARR START 3, EPA Region 8 Revision: 0 Contract No. EP-W-05-050 Date: 08/2010 Page 12 of 82
4.4 SOIL EXPOSURE
The contaminated groundwater is more than 2 feet below ground surface and, therefore, not
relevant to the soil exposure pathway. There are approximately 200 natural gas wells located in
the Pavillion natural gas field. Thirty wells in the field are listed as plugged and abandoned
(WOGCC 2008). The natural gas wells are situated on graveled pads and are unsecured. Access
is not restricted to the graveled pads. Workers associated with natural gas production frequently
visit the production wells. Approximately 59 residents live within the 1-mile radius of the site
area center (U.S. Census Bureau 2000).
There are no terrestrial sensitive environments identified within 200 feet of the center of the study
area (UOS 2008).
4.5 AIR PATHWAY
The site is located in a rural area on the Wind River Basin in north central Fremont County.
There are 9 residents within the 0.25-mile radius of the site center (UOS 2009), and a total of 161
people within the 4-mile radius. The potential contamination source at the site is a plume that is
more than 2 feet below ground surface and, therefore, not relevant to the air pathway. There are
357 natural gas wells in the study area. The natural gas wells are situated on graveled pads and
are unsecured. Since the site includes a residential area, access is not restricted and easily
accessible to the public.
An average of 2.3 people occupies each residence in Fremont County (U.S. Census Bureau 2000).
There are sensitive terrestrial environments identified within the 4-mile radius of the site. There
is a State Wildlife Management Area within the 1- to 2-mile radius of the site, and another State
Wildlife Management Area is located within the 3- to 4-mile radius of the site (WGFD 2008).
There are 1,212 acres of wetlands located within the 4-mile radius of the site. More than 1,000
acres of wetlands are part of the Ocean Lake, which is also designated as a State Wildlife
Management Area (USFWS 1998).
TDD No. 0901-01 T:\START3\Pavillion Area GW Investigation\Pavillion_Area_GW_Plume_ESI\ARR\Final ARR\ARR August 2010 Final.doc

URS Operating Services, Inc. Pavillion Area Groundwater Investigation ESI – ARR START 3, EPA Region 8 Revision: 0 Contract No. EP-W-05-050 Date: 08/2010 Page 13 of 82
TABLE 3 Population and Wetlands Within 4 Miles of the Site
Distance from Site
Estimated Population
(# of persons)
Wetlands
(acres)
On Site 0 0
0 – 0.25 Mile 0 0
>0.25 – 0.5 Mile 5 0
>0.5 – 1 Mile 16 0
>1 – 2 Miles 35 111
>2 – 3 Miles 48 45
>3 – 4 Miles 87 1,056
Total Within 4 Miles 191 1,212
Source: National Wetlands Inventory (USFWS 1998).
See the table below for a State of Wyoming Game and Fish list of endangered and threatened
species found in Fremont County (WGFD 2008).
TABLE 4 Threatened and Endangered Species in Fremont County
Species Scientific Name Status
Brown Pelican Pelecanus occidentalis Endangered
Wood Stork Mycteria americana Endangered
Bald Eagle Haliaeetus leucocephalus Threatened
Whooping Crane Grus americana Endangered
Piping Plover Charadrius melodus Endangered
Least Tern Sterna antillarum Endangered
Passenger Pigeon Ectopistes migartorius Extinct
Gray Wolf Canis lupus Threatened
Grizzly Bear Ursus arctos Threatened
Black-footed Ferret Mustela nigripes Endangered
Canada Lynx Lynx canadensis Threatened
TDD No. 0901-01 T:\START3\Pavillion Area GW Investigation\Pavillion_Area_GW_Plume_ESI\ARR\Final ARR\ARR August 2010 Final.doc

URS Operating Services, Inc. Pavillion Area Groundwater Investigation ESI – ARR START 3, EPA Region 8 Revision: 0 Contract No. EP-W-05-050 Date: 08/2010 Page 14 of 82
5.0 DATA QUALITY OBJECTIVES PROCESS
The EPA Data Quality Objectives (DQO) Process is a seven-step systematic planning approach to
develop acceptance or performance criteria for EPA-funded projects. The seven steps of the DQO
process are:
Step 1 The Problem Statement;
Step 2 Identifying the Decision;
Step 3 Identifying the Decision Inputs;
Step 4 Defining the Investigation Boundaries;
Step 5 Developing a Decision Rule;
Step 6 Defining Tolerance Limits on Decision Errors; and
Step 7 Optimizing the Sample Design.
These DQOs were developed by UOS and EPA based on research documented in the Preliminary
Assessment (UOS 2008) and sampling results from the Site Inspection. (UOS 2009)
The project team identified groundwater as the pathway of potential concern at the site. The possible
pathways of concern are presented in the Conceptual Site Model in Figure 4.
Project Objectives
Quantify levels of chemicals of concern in wells, in order to determine risk(s) to the extent
practicable; and
Identify source(s) of chemicals of concern, to the extent practicable.
Step 1: Problem Statement
Domestic well contamination in the Pavillion area was originally alleged by local residents when visual
and odor parameters for domestic wells changed. Visual changes included color, turbidity, sheen, and
inclusion of small bubbles/gas. A hydrocarbon odor was also reported.
The 2009 Site Inspection has narrowed the focus of the area of concern to an area in and around the 11
wells with methane, Total Purgeable Hydrocarbons (TPH), and SVOCs found in the dissolved aqueous
TDD No. 0901-01 T:\START3\Pavillion Area GW Investigation\Pavillion_Area_GW_Plume_ESI\ARR\Final ARR\ARR August 2010 Final.doc
URS Operating Services, Inc. Pavillion Area Groundwater Investigation ESI – ARR START 3, EPA Region 8 Revision: 0 Contract No. EP-W-05-050 Date: 08/2010 Page 15 of 82
phase above analytical detection limits, as well as the TICs listed in Section 3.3.2. These wells are
located in Sections 2, 10, 11, 12, 13, 15, 17, 21, and 27 of T. 3 N., R. 2 E., and Section 7 of T. 3 N., R. 3
E (see section 3.3.2).
Potential health risks identified in the 2009 Site Investigation include the following:
Arsenic above the MCL in one well;
Detections of the SVOCs caprolactam, dimethylphthalate, bis(2-ethylhexyl)phthalate, and the
TICs listed in Section 3.3.2;
Detections of dissolved methane as methane buildup, which could lead to a explosivity hazard;
and
Total TPH detected above 20 parts per billion (ppb) in two wells.
Conceptual Site Model (Figure 4)
The total depths of the domestic wells within the area range between 50 and 800 feet below
ground surface.
The principal industries in the area of concern are natural gas production and agriculture.
Domestic wells show chemicals of concern.
Potential sources include oil and natural gas production activities, agricultural sources, industrial
chemicals, landowner/well owner management of wells, and well components.
Potential source pathways at the site include:
B Downward infiltration of chemicals of concern from the surface;
B Lateral emplacement of chemicals of concern from offset wells;
B Upward migration of chemicals of concern from underlying sources;
B Direct placement of chemicals of concern in domestic water wells; and
B Infiltration from surface water bodies (i.e., Five Mile Creek).
The universe of materials/compounds used within the site area is not completely known.
TDD No. 0901-01 T:\START3\Pavillion Area GW Investigation\Pavillion_Area_GW_Plume_ESI\ARR\Final ARR\ARR August 2010 Final.doc
URS Operating Services, Inc. Pavillion Area Groundwater Investigation ESI – ARR START 3, EPA Region 8 Revision: 0 Contract No. EP-W-05-050 Date: 08/2010 Page 16 of 82
The hydrogeology (depth of freshwater zones used for drinking water, vertical and lateral
permeability characterization, water chemistry changes with depth) is not fully known.
Step 2: Identifying the Decision
The principal investigation questions that must be addressed are:
What are the levels of chemicals of concern in wells?
What are the sources of chemicals of concern found in well water?
Step 3: Identifying the Inputs to the Decision
Information was gathered to assist in defining the following:
The site conceptual model (see above discussion);
The pathway(s) for chemicals of concern; and
Chemicals of concern (identify and quantify).
Various sources of information that were consulted included:
Material Safety Data Sheets (MSDS) provided by oil and gas companies operating in the area,
EPA studies on oil and gas extraction-related chemicals, and the TEDX list of public MSDSs
collected from oil and gas extraction-related activities (specifically chemicals that are persistent,
toxic, and can be analyzed by conventional methodologies);
Information from local agricultural businesses regarding pesticide applications;
State regulatory agencies (WOGCC, WDEQ);
State and local assistance agencies (Fremont County Health, Agricultural Extension Agencies);
Interviews to determine chemical management practices by individuals at or near domestic wells;
Federal regulatory agencies (EPA, Bureau of Land Management [BLM], Bureau of Indian Affairs
[BIA]); and
Historical sampling and analysis reports including the data from the initial sampling event (2009
Site Investigation).
TDD No. 0901-01 T:\START3\Pavillion Area GW Investigation\Pavillion_Area_GW_Plume_ESI\ARR\Final ARR\ARR August 2010 Final.doc

URS Operating Services, Inc. Pavillion Area Groundwater Investigation ESI – ARR START 3, EPA Region 8 Revision: 0 Contract No. EP-W-05-050 Date: 08/2010 Page 17 of 82
Define the decision values for determining if additional action may be required:
Maximum Contaminant Levels (MCLs);
Integrated Risk Information System (IRIS);
Health risk benchmarks from EPA Regional Screening Levels (RSLs); and
Health Consultation by the Agency for Toxic Substances and Disease Registry (ATSDR).
Define the evidence to assist with determining the source of chemicals of concern:
Chemicals of concern exist in source and well/aquifer; and
Chemicals of concern pathway(s) have been identified.
Samples Collected (Tables 6 and 8):
Site activities involved collecting the following:
Twenty-one domestic well water samples,
Two municipal well samples,
Five gas product samples from natural gas wells,
Four liquid phase samples from natural gas wells,
Three soil samples using GeoProbe at pit remediation locations,
Three groundwater samples from monitoring wells at pit remediation locations,
Five surface water samples from Five-Mile Creek,
Five sediment samples, co-located with the surface water samples on Five-Mile Creek,
One filter media sample,
Four duplicate samples (one for each matrix); and
Quality assurance/quality control (QA/QC) blanks: two field blanks (one water and one gas) and
one VOC trip blank per cooler.
TDD No. 0901-01 T:\START3\Pavillion Area GW Investigation\Pavillion_Area_GW_Plume_ESI\ARR\Final ARR\ARR August 2010 Final.doc

URS Operating Services, Inc. Pavillion Area Groundwater Investigation ESI – ARR START 3, EPA Region 8 Revision: 0 Contract No. EP-W-05-050 Date: 08/2010 Page 18 of 82
Test Methods (Table 7):
The list of volatile and semi-volatile analytes (Table 7) included compounds from the MSDSs provided
by local oil and gas companies (Appendix F), the list of chemicals used in oil and gas production
provided by TEDX (Appendix D), and the EPA study list of compounds used in oil and gas production
(Appendix E). This data was analyzed for toxicity and persistence and compared to the available methods
for analysis to determine the most appropriate analyses for samples collected under this study. The TCL
of VOCs and SVOCs were analyzed for by a CLP laboratory, ALS Laboratory Group, using EPA
Statement of Work (SOW) SOM01.2.
Additional low level volatiles and semi-volatiles were analyzed at the EPA Region 8 Laboratory using
EPA methods SW846 8260 and 8270 respectively. The TICs from the 2009 Site Inspection, which
included adamantane, 2-BEP, and 1,3-dimethyl adamantane were also included in the EPA Region 8
Laboratory analysis. They were included in the calibration to get a quantification of the analytes. The
previous analyses were in essence a qualitative assessment of the TICs. Other analyses performed by the
EPA Region 8 Laboratory included: fixed light gases, such as methane, ethane, propane and butane by
EPA method 524.2; anions, ammonia, chloride, fluoride, nitrate, nitrite, phosphorous, and sulfate by EPA
method 300.0; alkalinity by EPA method 310.1; and Time of Flight (TOF) mass spectrometry.
The TCL of Pesticides and PCBs were analyzed by a CLP laboratory, ALS Laboratory Group, using EPA
SOW SOM01.2. The TAL metals were analyzed by a CLP laboratory, A4 Scientific, Incorporated, using
EPA SOW ILM05.4. These analyses were performed in order to determine if any pesticides, PCBs, or
metals were causing issues in domestic well water.
Petroleum hydrocarbon ranges in the form of Gasoline Range Organics (GRO), Total Purgeable
Hydrocarbons (TPH), Diesel Range Organics (DRO), and Total Extractable Hydrocarbons (TEH) were
analyzed by a commercial laboratory, Energy Laboratories, Incorporated, using method SW846 8015B.
These analyses were performed in order to determine if additional hydrocarbons, not specifically
calibrated for in the volatile and semivolatile analyses, were present. The GRO and DRO were also
analyzed at the EPA Region 8 Laboratory with a lower reporting limit.
Iron-related and sulfate-reducing bacterial testing as well as heterotrophic plate counts on all domestic
wells and three monitoring wells were included to determine if bacteria was causing issues in domestic
well water. The bacterialogical samples were analyzed by a commercial laboratory, Energy Laboratories,
TDD No. 0901-01 T:\START3\Pavillion Area GW Investigation\Pavillion_Area_GW_Plume_ESI\ARR\Final ARR\ARR August 2010 Final.doc

URS Operating Services, Inc. Pavillion Area Groundwater Investigation ESI – ARR START 3, EPA Region 8 Revision: 0 Contract No. EP-W-05-050 Date: 08/2010 Page 19 of 82
Incorporated. The methodologies used were method IRB-BART for the iron-related and sulfate-reducing
bacterial testing and method A9215E for the heterotrophic plate counts.
Another commercial laboratory, Zymax Forensics, performed fingerprinting analyses on the production
gases, dissolved gases, and liquid product. The production gas was analyzed for dissolved methane
isotopic analysis and light fixed gas analysis, the carbon range of C1 to C5, for a subset of wells to
determine if methane present in the sample was biogenic or thermogenic in nature. The dissolved gases
were analyzed for the carbon ranges of C3 to C10 and C10 to C40. The liquid product was analyzed for
the carbon range of C3 to C44.
Stable Isotope Analyses, to document release from specific source, was performed by Zymax Forensics.
This analysis included δD/H and δ13C on nine domestic wells and 5 production wells.
Step 4: Defining the Investigation Boundaries
The study area is defined as a 4-mile radius loosely centered on the domestic wells that had detections of
chemicals of concern in the Site Inspection, and includes a 15-mile section of Five-Mile Creek (Figure 1).
The target population is primarily residents within the study area who use water from domestic wells.
Step 5: Developing a Decision Rule
Values for determining if additional action may be required include:
Maximum Contaminant Levels (MCLs);
Integrated Risk Information System (IRIS);
Health risk benchmarks from EPA Regional Screening Levels (RSLs); and
Health Consultation by the Agency for Toxic Substances and Disease Registry (ATSDR).
Step 6: Defining Tolerance Limits on Decision Errors
Because sampling locations were limited to existing wells and shallow Geoprobe® samples, judgmental
sampling was used for this project. Judgmentally based samples cannot be analyzed by statistical means.
Therefore, error in the data will be controlled by:
Adhering to the project FSP, TSOPs, and the START QAPP (UOS 2005a);
Validating data, especially data addressing human health issues; and
TDD No. 0901-01 T:\START3\Pavillion Area GW Investigation\Pavillion_Area_GW_Plume_ESI\ARR\Final ARR\ARR August 2010 Final.doc

URS Operating Services, Inc. Pavillion Area Groundwater Investigation ESI – ARR START 3, EPA Region 8 Revision: 0 Contract No. EP-W-05-050 Date: 08/2010 Page 20 of 82
Achieving data quality goals as stated in section 8.0 of the FSP.
Step 7: Optimizing the Sample Design
The following deviations occurred from the Field Sampling Plan in regard to the number of samples
collected:
Sample PGDW35 could not be collected, as that well had been abandoned since the initial
sampling event. Instead, a sample was collected from an alternate well on the property that was
being used for domestic water; this well location was designated as PGDW48.
At the request of a landowner, sample location PGDW49 (a shallow stock well) was added to the
sampling event.
Winter conditions at the site made the collection of surface water and sediment samples difficult.
The number of sample locations was reduced from seven to five in order to reduce risk to field
personnel and meet schedule constraints caused by short daylight hours.
At location PGDW41, START contractor sampled the deeper well for analysis. EnCana was able
to take split samples of this deeper domestic well. EPA relinquished all samples taken from the
shallow well to an EnCana field representative.
6.0 FIELD ACTIVITIES
START team members mobilized from Denver, Colorado to Riverton, Wyoming on January 17, 2010 in
order to be on site Monday January 18, 2010. START team members mobilized to the temporary field
office, the Pavillion Recreation Center, at 7 a.m. to set up for sampling activities. The START Project
Manager Mark McDaniel and EPA personnel Luke Chavez, Rob Parker, Nathan Wiser, and Greg Oberley
met with an EnCana Oil & Gas (USA) (EnCana) representative to outline sampling plans as samples from
EnCana operating gas wells were scheduled to be taken.
TDD No. 0901-01 T:\START3\Pavillion Area GW Investigation\Pavillion_Area_GW_Plume_ESI\ARR\Final ARR\ARR August 2010 Final.doc

URS Operating Services, Inc. Pavillion Area Groundwater Investigation ESI – ARR START 3, EPA Region 8 Revision: 0 Contract No. EP-W-05-050 Date: 08/2010 Page 21 of 82
Site activities involved collecting the following:
Twenty-one domestic well water samples,
Two municipal well samples,
Five gas product samples from natural gas wells,
Four liquid phase samples from natural gas wells,
Three soil samples using GeoProbe at pit remediation locations,
Three groundwater samples from monitoring wells at pit remediation locations,
Five surface water samples from Five-Mile Creek,
Five sediment samples, co-located with the surface water samples on Five-Mile Creek,
One filter media sample,
Four duplicate samples (one for each matrix); and
Quality assurance/quality control (QA/QC) blanks: two field blanks (one water and one gas) and
one VOC trip blank per cooler.
START members were divided into teams to collect the various samples. All sample points were located
with a global positioning system (GPS) device after sample collection. All samples were photographed
and documented in accordance with the procedures outlined in UOS TSOP 4.5, “Sample Location
Documentation” (UOS 2005b). All groundwater samples were collected from existing wells. EnCana
representatives accompanied each START team and collected co-located samples at locations where
EnCana also had access to collect samples and on EnCana-owned properties. Figure 2 summarizes
sample locations.
Two START teams collected the domestic water well samples from January 18 to January 22, 2010. The
standard procedures for water sampling included notifying the property owner of the approximate time
START members would be on-site to collect samples, and requesting the property owner to begin purging
water 1 to 2 hours prior to the scheduled sampling time. All domestic wells were in continuous use by the
homeowners; therefore, one volume of water in the casing was flowed before parameter measurements
were taken. Additionally, purging exceeded the volume of any storage device located in the waterline
between the well and the sample. After one volume of the casing had been purged, water parameters
including pH, conductivity, and temperature were then monitored until all three parameters stabilized
TDD No. 0901-01 T:\START3\Pavillion Area GW Investigation\Pavillion_Area_GW_Plume_ESI\ARR\Final ARR\ARR August 2010 Final.doc
URS Operating Services, Inc. Pavillion Area Groundwater Investigation ESI – ARR START 3, EPA Region 8 Revision: 0 Contract No. EP-W-05-050 Date: 08/2010 Page 22 of 82
such that three successive measurements were within 10 percent of each other 1 minute apart. After
satisfying all of these requirements, team members collected a sample as close to the well as possible.
Sample locations PGDW40 and PGDW41 were both non-functioning domestic wells on parcels of land
that Pavillion Land Development had purchased. The electrical connections for both wells had been
disconnected at the time of the field-sampling event, and an EnCana representative stated that the wells
had additional problems such as inoperable pumps or no electricity to the property. START hired a local
well service company to refurbish the non-functioning domestic water wells at locations PGDW40 and
PGDW41. The well service company installed temporary pumps and well casings on January 21 and
January 22, 2010, so that water could be purged and sampled from the wells.
Two START team members met with a Town of Pavillion representative to collect the municipal well
samples on January 21, 2010. Since these wells were not flowing at the time of sampling, three times the
volume in the casing was purged prior to monitoring the water parameters. After three volumes of the
casing had been purged, water parameters including pH, conductivity, and temperature were then
monitored until all three parameters stabilized such that three successive measurements were within 10
percent of each other 1 minute apart. After satisfying all of these requirements, team members sampled
the wells.
Two START team members met with representatives from EnCana to collect samples from monitoring
wells at three waste pits that are included in the WDEQ Voluntary Remediation Program (VRP). The
monitoring wells were located near three EnCana natural gas well pads. Three times the volume in the
casing was purged prior to monitoring the water parameters. After three volumes of the casing had been
purged, water parameters including pH, conductivity, and temperature were then monitored until all three
parameters stabilized such that three successive measurements were within 10 percent of each other one
minute apart. After satisfying all of these requirements, team members sampled the wells. Due to the
slow recharge rates of the monitoring wells, there was not enough water sampled to perform the bacterial
analysis for these three samples.
START members Henry Schmelzer and Nathan Williams used a Geoprobe® truck-mounted direct-push
drill rig to profile soils at three waste pits that are included in the WDEQ VRP. The remediation pits
were located on three EnCana natural gas well pads. START members were required to attend an
EnCana contractor orientation meeting on the evening of January 18, 2010, during which an EnCana
representative provided the START team with approximate locations of the VRPs. The START
TDD No. 0901-01 T:\START3\Pavillion Area GW Investigation\Pavillion_Area_GW_Plume_ESI\ARR\Final ARR\ARR August 2010 Final.doc

URS Operating Services, Inc. Pavillion Area Groundwater Investigation ESI – ARR START 3, EPA Region 8 Revision: 0 Contract No. EP-W-05-050 Date: 08/2010 Page 23 of 82
Geoprobe® team met with a contracted utility locator to clear locations prior to any coring. Sampling
procedures were performed in accordance with UOS TSOP 4.16, “Surface and Shallow Depth Soil
Sampling” and UOS TSOP 4.27 “Basic Geoprobe Operations.” The Macro-Core® open-tube soil core
was used to core starting at ground surface and terminating immediately below the extent of
contamination. Stained soil with strong hydrocarbon odor was identified above the groundwater table at
each location, and a sample was collected.
Surface water and sediment samples were collected at five locations along Five-Mile Creek by multiple
START teams. Surface water sampling was conducted by chipping a hole through the ice and immersing
the sample bottles directly into the sample media. UOS measured field parameters, including pH,
temperature, and electrical conductivity of each sample collected, as described in TSOP 4.14 “Water
Sample Field Measurements.” Sediment samples were generally collected from the bank at the capillary
fringe zone of the water body.
Field parameters including pH, conductivity, and temperature were collected for each aqueous sample.
Each sample collected, its sample matrix, and which analyses were performed are detailed in Table 6.
Figure 2 identifies the sample locations.
START members Mark McDaniel and Chuck Baker collected five product samples from natural gas
wells. Samples PGPP01 and PPPG02 were gas phase only (no liquid phase product present at the time of
sampling). Samples PGPP04, PGPP05, and PGPP06 contained both gas and liquid phase product.
EnCana collected split samples at all natural gas well locations. Gas and liquid phase samples were
collected by Precision Analytics Inc. for both START and EnCana. Gas sample cylinders were attached
to the natural gas sales meter run and purged between 11 and 15 times (according to line pressure) before
sampling. Line pressure and temperature were recorded at each sample location. A field blank,
designated as PGPP03, for the gas samples was prepared by purging and then filling a sample cylinder
with nitrogen before mobilizing to the field. Since the liquid phase samples contained both hydrocarbon
and water phases, water parameters such as temperature, conductivity, and pH were not collected.
One opportunity sample was collected, PGFM20. This sample was a media filter collected from the
reverse osmosis system in the home. Sample PGDW20 was collected from the same home and was taken
at the well head.
QA/QC samples followed the requirements of the “Region 8 Supplement to Guidance for Performing Site
Inspections under CERCLA” (EPA 1993), and included a VOC trip blank per cooler to monitor for
TDD No. 0901-01 T:\START3\Pavillion Area GW Investigation\Pavillion_Area_GW_Plume_ESI\ARR\Final ARR\ARR August 2010 Final.doc

URS Operating Services, Inc. Pavillion Area Groundwater Investigation ESI – ARR START 3, EPA Region 8 Revision: 0 Contract No. EP-W-05-050 Date: 08/2010 Page 24 of 82
volatile contamination during transport, one field blank for methods that report tentatively identified
compounds, one gas-phase field blank, and one field duplicate with matrix spike and matrix spike
duplicate sample per matrix to measure the precision of field collection techniques and laboratory
methods.
6.1 FIELD OBSERVATIONS
Sample PGDW35 could not be collected, as that well had been abandoned since the initial
sampling event. Instead, a sample was collected from an alternate well on the property that was
being used for domestic water; this well location was designated as PGDW48.
At the request of a landowner, sample location PGDW49 (a shallow stock well) was added to the
sampling event.
Two wells were present at Pavillion Land Development owned property at 179 Indian Ridge
Road (sample location PGDW41): one shallow well (approximately 70 feet deep) and one deep
well (approximately 265 feet deep). Based on information from the Wyoming State Engineer’s
Office, EPA was aware of only one domestic well on the property. The well to be sampled,
which was identified on the access form dated January 18, 2010, signed by EnCana and Pavillion
Land Development, LLC, was the shallow well. EPA contacted the EnCana point of contact to
request permission and voluntary access to sample the additional (deep) well as an opportunity
sample. Because of poor cell phone coverage at the sampling location, EPA representatives Luke
Chavez and Nathan Wiser had to travel to another location to conduct this conversation with the
EnCana point of contact. Before he left the site, Mr. Chavez instructed START to sample the
shallow well, which was the well designated on the signed access form. This action was taken to
make prudent use of the START contractor’s time.
During the off-site conversation, the EnCana point of contact allowed EPA to sample only one
well, which was the deeper, 265-foot well, designated as PGDW41. By the time EPA returned to
the sample location, the START contractor had already finished sampling the shallow well. It
was noted that the shallow well sample had a visible sheen on the surface and that the water
“tasted bad,” according to a driller from the local well service company. Upon receiving access
from EnCana, the START contractor did sample the deeper (PGDW41) well and retained that
sample for analysis. EnCana was able to take split samples of this deeper domestic well. EPA
relinquished all samples taken from the shallow well to an EnCana representative.
TDD No. 0901-01 T:\START3\Pavillion Area GW Investigation\Pavillion_Area_GW_Plume_ESI\ARR\Final ARR\ARR August 2010 Final.doc

URS Operating Services, Inc. Pavillion Area Groundwater Investigation ESI – ARR START 3, EPA Region 8 Revision: 0 Contract No. EP-W-05-050 Date: 08/2010 Page 25 of 82
Winter conditions at the site made the collection of surface water and sediment samples difficult.
The number of sample locations was reduced from seven to five in order to reduce risk to field
personnel and meet schedule constraints due to fewer daylight hours.
Several domestic wells and all three monitoring wells had a sheen or odor at the time of sampling.
Other than the instances detailed above, all samples were collected as designed in the FSP.
7.0 LABORATORY DATA ANALYSIS
Sample names and sample locations are listed in Table 6 and presented in Figure 2. Samples were sent to
five laboratories for different analyses.
A4 Scientific, Inc. is part of the EPA CLP and provided TAL metals and mercury analysis of 40 samples,
including QA/QC. The samples were shipped via FedEx to:
A4 Scientific, Inc.
1544 Sawdust Road, Suite 505
The Woodlands, TX 77380
ALS Laboratory Group is part of the EPA CLP and provided VOC, SVOC, pesticide, and PCB analysis
of 41 samples, including QA/QC. The samples were shipped via FedEx to:
ALS Laboratory Group
960 West LeVoy Drive
Salt Lake City, UT 84123
Energy Laboratories, Inc. is a commercial laboratory and provided bacteriological testing of 27 samples,
including QA/QC. The test included Heterotrophic Plate Counts (HPC), Iron Reducing Bacteria (IRB),
and Sulphur Reducing Bacteria (SRB). The samples were shipped via FedEx to:
Energy Laboratories, Inc.
1120 South 27th Street
Billings, MT 59107-0916
EPA Region 8 Laboratory provided Time of Flight Mass Spectroscopy (TOF/MS) specific analyte
testing, low-level VOC and SVOC, anions and alkalinity, and light gases VOC analytic testing. The
samples were shipped via FedEx to:
TDD No. 0901-01 T:\START3\Pavillion Area GW Investigation\Pavillion_Area_GW_Plume_ESI\ARR\Final ARR\ARR August 2010 Final.doc
URS Operating Services, Inc. Pavillion Area Groundwater Investigation ESI – ARR START 3, EPA Region 8 Revision: 0 Contract No. EP-W-05-050 Date: 08/2010 Page 26 of 82
EPA Region 8 Laboratory
16194 West 45th Drive
Golden, CO 80403
Zymax Forensics Laboratory provided geochemistry fingerprinting analyses, including isotope,
hydrocarbon, and fixed gas analyses. The samples were shipped via FedEx to:
Zymax Forensics Laboratory
600 S. Andreasen Drive, Suite B
Escondido, CA 92029
All five laboratories indicated that the samples were received intact with no issues. The analytic tests and
the respective laboratories performing the tests are listed in Table 5.
8.0 ANALYTICAL RESULTS
Detections for compounds of interest in groundwater varied widely; for example m,p-xylene ranged from
non-detect at 0.1 µg/L to 46,000,000 µg/L. Due to the volume of detected analytes, they will not be
individually discussed here. See Appendix A for laboratory data; data summaries are located in the
following tables:
Table 9 SVOA, TPH/DRO, Pesticide, and PCB Results
Table 10 VOA and TPH/GRO Results
Table 11 Wet Chemistry and Bacteriological Results
Table 12 Metals Data
Table 13 Fixed and Light Gases in Natural Gas from Production Wells and Domestic Water Wells
Table 14 Isotopic Analyses
Table 15 Gas Analysis by Chromatography
Table 16 Additional Gas Analyses
Table 17 C3 – C10 Gasoline Range Compounds in Production and Drinking Water Wells
Element Geochemistry, Bacterial Analysis, and Isotopic groundwater analysis were also investigated in
the scope of this ARR and the results are presented below.
TDD No. 0901-01 T:\START3\Pavillion Area GW Investigation\Pavillion_Area_GW_Plume_ESI\ARR\Final ARR\ARR August 2010 Final.doc

URS Operating Services, Inc. Pavillion Area Groundwater Investigation ESI – ARR START 3, EPA Region 8 Revision: 0 Contract No. EP-W-05-050 Date: 08/2010 Page 27 of 82
8.1 GROUNDWATER CHEMISTRY
This Section was provided by EPA.
Groundwater samples were analyzed for a range of major, minor, and trace chemicals. Major
element geochemistry of groundwater can be used to classify compositional types and to evaluate
overall water quality.
Groundwater chemistry at Pavillion is dominated by Na2SO4-type (sodium-sulfate) compositions.
Maximum concentrations of sodium (Na+) and sulfate (SO4-2) in groundwater samples are <1200
mg/L and <4000 mg/L, respectively. These two major solutes typically comprise the primary
component of the total dissolved solid (TDS) load of groundwater. TDS values in groundwater
range from about 500 to 5300 mg/L. The pH of groundwater shows significant variability,
ranging from about 7 (near-neutral) to values as high as 10.5 (moderately alkaline). Typically,
the pH is lower in groundwater with elevated TDS values; whereas, the highest pH values
coincide with low TDS (<1000 mg/L). Of the major element components in groundwater, sulfate
concentrations and pH, in many samples, fall outside of desirable water quality limits.
Groundwater collected from depths less than 100 feet below ground surface are typically more
varied in composition. Rather than being dominated by Na2SO4-type compositions, shallow
groundwater tends to be Ca(HCO3)2 (calcium bicarbonate), CaSO4 (calcium-sulfate), or
Na(HCO3) -type (sodium bicarbonate). TDS values for shallow groundwater ranges from about
600 to 2500 mg/L. There appears to be no obvious geographical controls on the major element
chemistry of groundwater, other than deep groundwater being dominantly Na-SO4-type and
shallow groundwater being more varied, typically with calcium as the dominant cationic
component.
A Piper diagram is shown in Appendix C -Figure 5 for samples collected during the Phase 2
water sampling investigation. This diagram shows the relative distribution of major dissolved
anions (chloride, sulfate, and bicarbonate; lower right triangle) and major dissolved cations
(calcium, magnesium, sodium, and potassium; lower left triangle). The data trends show that
Pavillion groundwater is dominated by sulfate and bicarbonate (chloride-poor) and by sodium,
with a trend toward calcium and magnesium compositions. Deep groundwater tends to cluster at
the sulfate apex of the lower right triangle on the Piper diagram, with a trend toward more
bicarbonate-rich compositions coinciding with shallower depths. Similarly, deep groundwater
TDD No. 0901-01 T:\START3\Pavillion Area GW Investigation\Pavillion_Area_GW_Plume_ESI\ARR\Final ARR\ARR August 2010 Final.doc

URS Operating Services, Inc. Pavillion Area Groundwater Investigation ESI – ARR START 3, EPA Region 8 Revision: 0 Contract No. EP-W-05-050 Date: 08/2010 Page 28 of 82
clusters near the sodium plus potassium apex of the lower left triangle with a trend toward
calcium plus magnesium compositions at shallower depths.
8.2 BACTERIAL ANALYSIS
This Section was provided by EPA. Microbiological samples were collected from two public drinking water wells, three monitoring
wells and all domestic water wells. These samples were analyzed for nonpathogenic bacteria that
are naturally occurring in the subsurface. These bacteria will have increased populations in areas
where substrates (food sources) such as compounds containing carbon, iron, nitrogen and sulfate
are abundant.
Organic compounds can act as a growth substrate and typically lead to increases in microbial
populations. When this microbial activity increases, biodegradation or transformation of the
substrate occurs through a pathway that results in the oxidation of the parent compound. The
growth rate of the microbial population will be dependant on multiple factors related to nutrient
supply and environmental conditions, including but not limited to the concentration of substrate,
pH, and oxidation-reduction potential.
During the ESI sampling event, samples were analyzed for three types of bacteria: heterotrophs,
iron reducers, and sulfate reducers. These samples were analyzed using the following methods:
A9215 E method- heterotrophic bacteria
IRB-BART-iron related bacteria
Indicator- sulfate reducing bacteria
Heterotrophic bacteria tolerate a wide range of environmental conditions: temperature, pH,
salinity, etc. They can be either gram-positive or gram-negative and strictly aerobic or facultative
anaerobes (they can survive in both the presence and absence of oxygen).
Iron reducing bacteria are naturally found in the environment in many areas. They are typically
found in the transition zone where water flows between anaerobic and aerobic conditions. These
microbes have specialized enzymes capable of reducing insoluble ferric oxide into soluble ferrous
hydroxide. When this de-oxygenated water reaches a source of oxygen, iron bacteria use that
TDD No. 0901-01 T:\START3\Pavillion Area GW Investigation\Pavillion_Area_GW_Plume_ESI\ARR\Final ARR\ARR August 2010 Final.doc
URS Operating Services, Inc. Pavillion Area Groundwater Investigation ESI – ARR START 3, EPA Region 8 Revision: 0 Contract No. EP-W-05-050 Date: 08/2010 Page 29 of 82
oxygen to convert the soluble ferrous iron back into an insoluble reddish precipitate of ferric iron.
Iron bacteria often produce unpleasant tastes and odors.
Sulfate reducing bacteria reduce elemental sulfates to sulfides, particularly hydrogen sulfide.
Hydrogen sulfide is toxic and tends to have a rotten egg odor.
8.3 ISOTOPIC ANALYSIS
This Section was provided by EPA. Isotope analysis of methane was performed for eight wells which included 12C, 13C, 1H, and 2H
(deuterium). The results are expressed in δ D per mil for the isotopes of hydrogen and δ 13C per
mil for carbon. One additional well did not have a high enough concentration of methane to
perform the isotope analysis. Methane carbon and hydrogen isotope analysis was performed to
assist in determining the origin of methane in groundwater generated by microbial activity in
shallow groundwater or as thermogenic gas from deep gas producing reservoirs. Seven of the
eight wells on which isotope analysis were performed showed methane origin as either oxidized
thermogenic source or showed a mixture of thermogenic and microbially generated methane
(Coleman, et al., 1995) (Appendix C – Figure 6).
9.0 DATA VALIDATION AND INTERPRETATION
9.1 DATA QUALITY ASSESSMENT
Definitions of Data Qualifiers (Flags) Used in this Dataset:
U – The analyte was analyzed for but not detected. The value preceding the U is the Contract
Required Quantitation Limit (CRQL).
J – The identification of the analyte is acceptable, but quality assurance criteria indicate that the
quantitative values may be outside the normal expected range of precision; i.e., the quantitative
value is considered estimated.
R – Data is considered to be rejected and shall not be used. This flag denotes the failure of
quality control criteria such that it cannot be determined if the analyte is present or absent from
TDD No. 0901-01 T:\START3\Pavillion Area GW Investigation\Pavillion_Area_GW_Plume_ESI\ARR\Final ARR\ARR August 2010 Final.doc

URS Operating Services, Inc. Pavillion Area Groundwater Investigation ESI – ARR START 3, EPA Region 8 Revision: 0 Contract No. EP-W-05-050 Date: 08/2010 Page 30 of 82
the sample. Resampling and analysis are necessary to confirm or deny the presence of the
analyte.
UJ – This is a combination of the U and J flags. The analyte is not present. The reported value is
considered to be an estimated CRQL.
While the overall quality of the data is good, some anomalies and exceptions occur in any dataset
of significant size. These instances and their impact on the usability of the data are summarized
below.
CLP Laboratory Program
Inorganics:
Samples PGDW03, PGDW04, PGDW05D, PGDW20, PGDW22, PGDW 23, PGDW25,
PGDW32, PGDW39, PGDW42, PGDW43, PGDW44, PGDW45, PGDW47, PGDW48,
and PGSW01 were flagged as “J” or “UJ” for copper due to laboratory duplicate criteria
not being met, bias is unknown.
Antimony in samples PGDW05, PGDW43, PGDW46, PGDW47, PGDW49, PGSW02,
PGSW03, PGSW05, PGMW02, and PGMW03 were flagged as “U” at the CRQL due to
laboratory blank contamination.
Samples PGDW05D, PGDW40, PGPW01, PGPW02, PGSW01, PGSW02D, PGSW03,
PGSW04, PGSW05, PGMW01, and PGMW02 were qualified as non-detect or “U” for
copper due to laboratory blank contamination.
Samples PGDW30, PGDW40, PGDW41, PGDW43, PGDW46, PGDW49, PGSW01,
PGSW02, PGSW02D, PGSW03, PGSW05, PGMW01, PGMW01D, PGMW02,
PGMW03, PGPW01, and PGPW02 were flagged as “J” or “UJ” for silver due to a low
matrix spike recovery resulting in a low bias.
Several samples required a “J” flag added to the calcium result after serial dilution check
failed criteria. Since calcium will not drive decisions at the site, the specific samples will
not be discussed.
TDD No. 0901-01 T:\START3\Pavillion Area GW Investigation\Pavillion_Area_GW_Plume_ESI\ARR\Final ARR\ARR August 2010 Final.doc

URS Operating Services, Inc. Pavillion Area Groundwater Investigation ESI – ARR START 3, EPA Region 8 Revision: 0 Contract No. EP-W-05-050 Date: 08/2010 Page 31 of 82
Organics:
Carbon disulfide in all samples analyzed by the CLP laboratory was flagged as “U,”
removing detections between the method detection limit and CRQL due to laboratory
method blank contamination.
Trichlorofluoromethane in all samples analyzed by the CLP laboratory was flagged as
“U,” removing detections between the method detection limit and CRQL due to
laboratory holding blank contamination (contamination acquired from the sample storage
refrigerator).
Bis(2-ethylhexyl)phthalate in soil and sediment samples was flagged as “U” due to
laboratory blank contamination.
The field blank PGFB01 was extracted outside of hold time, and the results were flagged
as “J” or “UJ” (results potentially biased low).
Other minor exceedances of surrogates and continuing calibrations were flagged as “J” or
“UJ” where appropriate and are acceptable with the attached qualifiers.
Energy Laboratories, Inc.
Data from Energy Laboratories were acceptable as is with no additional qualifiers attached.
EPA Region 8 Laboratory
TPH/DRO results for samples PGDW48 and PGFB01 were extracted outside of hold
time and have been flagged as “J”; these sample results are potentially biased low.
TPH/DRO in sample PGSW02D was flagged “J” due to laboratory contamination of
phthalates; these results may be biased high.
The matrix spike recovery for PGMW01 TPH/DRO and TPH/GRO was high and the
results have been flagged as “J”, these results may be biased high.
The TPH/GRO surrogate recovery for PGFM20 was below acceptable limits and the
result was flagged as “J.” This sample consisted of filter media from a reverse osmosis
TDD No. 0901-01 T:\START3\Pavillion Area GW Investigation\Pavillion_Area_GW_Plume_ESI\ARR\Final ARR\ARR August 2010 Final.doc

URS Operating Services, Inc. Pavillion Area Groundwater Investigation ESI – ARR START 3, EPA Region 8 Revision: 0 Contract No. EP-W-05-050 Date: 08/2010 Page 32 of 82
water filtration system which is designed to absorb organics and metals; the data is likely
biased low.
Samples PGDW05, PGDW05D, PGDW10, PGDW22, PGDW23, PGDW44, and
PGDW45 were flagged as “J” due to exceedance of hold time for GC/FID light gases and
are potentially biased low.
All detected compounds in samples PGDW05, PGDW05D, PGDW10, PGDW20,
PGDW22, PGDW23, PGDW30, PGDW39, PGDW40, PGDW41PGDW45,PGDW47,
PGSW01, PGPP04, PGPP05, PPPG06 and PGFB01 were flagged as “J” due to
exceedance of hold time for 8270 semi-volatile organics and are potentially biased low.
All detected compounds in samples PGPP01, PGPP04, PGPP05, PGPP06, PGDW05,
PGDW05D, PGDW23, PGDW30, PGDW32, PGMW01, PGMW01D, and PGMW02
were flagged as “J” due to exceedance of hold time for 8260 volatile organics and are
potentially biased low.
For 8260, 8270, TPH GRO/DRO, and light gases analyses, several Continuing
Calibration Verification (CCV) checks, Initial Calibration Verifications (ICV), method
blanks, and laboratory control spikes had compounds that exceeded the upper or lower
control limits; these compounds have been flagged as “J.” There was no direct connection
in the case narrative to assign specific failures to associated sample.
There was method blank contamination associated with bis(2-ethylhexyl)phthalate, di-n-
butyl phthalate, and di-n-octyl phthalate for the Region 8 lab. In accordance with the
CLP National Functional Guidelines, EPA personnel compared each of the sample
concentrations with their associated method blank concentrations. Detections have been
changed to non-detect if the concentration in the sample is below 5x the concentration in
the blank.
Additionally, there was field blank contamination associated with bis(2-
ethylhexyl)phthalate, diethylphthalate, and phenol. In accordance with Risk Assessment
Guidance for Superfund, EPA personnel compared each of the sample concentrations
with the field blank concentration. Detections were changed to non-detect if the
concentration in the sample was either 5x below the concentration in the blank for
TDD No. 0901-01 T:\START3\Pavillion Area GW Investigation\Pavillion_Area_GW_Plume_ESI\ARR\Final ARR\ARR August 2010 Final.doc

URS Operating Services, Inc. Pavillion Area Groundwater Investigation ESI – ARR START 3, EPA Region 8 Revision: 0 Contract No. EP-W-05-050 Date: 08/2010 Page 33 of 82
phenol, or 10x below the concentration in the blank for the phthalate esters, as they are
deemed “common lab contaminants.”
The field blank had a detection for DRO in the EPH analysis that the Region 8 laboratory
attributed to a large peak of 2,4-bis(1,1-dimethylethyl) phenol that was detected in the
8270 analysis and comprised 43 percent of the DRO response. This compound was not
detected in any other samples. Analysis by EPA Region 8 Laboratory personnel
illustrated no overlap between the chromatogram for the field blank, which shows a
detection of predominately one peak, and the chromatograms of any of the other samples.
Additionally, none of the instrument blanks had detections over the laboratory reporting
limit. Due to the fact that the field blank peak was not detected in any of the other
samples, none of the data qualifiers for this data will be adjusted.
Zymax Forensics Laboratory
Data from Zymax Laboratories met acceptance criteria and require no additional qualifiers.
Field Analytical Data
Temperature, conductivity, and pH measurements were taken in the field using an Oakton
Instruments® model PCS Testr35. The pH and conductivity were calibrated at the beginning of
the day, and all samples were collected within 3 hours of calibration. Logbooks were reviewed
and field analytical data for all samples were found to be complete.
9.2 DATA QUALITY INDICATORS
9.2.1 Bias
Calibrations, serial dilutions, interference check samples, matrix spikes, and blanks were
reviewed as possible indicators of bias in the data. Negative blank contamination and
positive blank contamination (blank has detections for target analytes above the method
detection limit) was present in the laboratory data for some data points. Negative blank
contamination creates a potential low bias, while positive blank contamination creates a
high bias. Additionally, some samples were analyzed or extracted beyond hold times;
this creates a negative bias as well. See section 9.1 for results that may have a potential
bias.
TDD No. 0901-01 T:\START3\Pavillion Area GW Investigation\Pavillion_Area_GW_Plume_ESI\ARR\Final ARR\ARR August 2010 Final.doc

URS Operating Services, Inc. Pavillion Area Groundwater Investigation ESI – ARR START 3, EPA Region 8 Revision: 0 Contract No. EP-W-05-050 Date: 08/2010 Page 34 of 82
9.2.2 Sensitivity
Some reporting limits were raised by the data reviewer due to blank problems (as
discussed above in section 9.1). The elevated detection limits do not impact the end use
of the data because, with the exception of phthalates, these detections were below the
reporting limits.
9.2.3 Precision
Precision is monitored by instrument calibration and spike samples. All precision criteria
were met, with the exception of the several data points flagged as “J” in the Region 8
Laboratory data as discussed in section 9.1. These data are acceptable for their intended
use with the attached qualifiers.
9.2.4 Accuracy
All laboratory duplicates met criteria. The field duplicates had some relative percent
differences (RPD) that were greater than the 20 percent criteria set by the National
Functional Guidelines for Data Review (NFG). However, since most values associated
with high RPDs were within five times the CRDL, they are considered non-significant,
per NFG specifications. This variability is due to increasing error as values approach the
CRDL. Overall RPD from field sample duplicates and replicates was 18 percent for
domestic water samples, 16.5 percent for surface waters, 13 percent for sediment and soil
samples, and 44 percent for groundwater monitoring wells. The goals set in the NFG and
site DQOs were 20 percent RPD for water and 35 percent RPD for soils and sediment.
The higher RPD from the monitoring well PGMW01 is likely due to the extremely low
flow and recharge rate, as well as high levels of contaminants present. These two factors
may have created a non-homogeneous duplicate sample. Furthermore the difference
between PGMW01 and PGMW01D was demonstrated at both the EPA Region 8
Laboratory and the CLP Laboratory.
9.2.5 Representativeness
All samples were collected within a 5-day period using the same methodology. There
were no deviations from the FSP, TSOPs, or analytical methods employed to collect the
TDD No. 0901-01 T:\START3\Pavillion Area GW Investigation\Pavillion_Area_GW_Plume_ESI\ARR\Final ARR\ARR August 2010 Final.doc

URS Operating Services, Inc. Pavillion Area Groundwater Investigation ESI – ARR START 3, EPA Region 8 Revision: 0 Contract No. EP-W-05-050 Date: 08/2010 Page 35 of 82
data. While chain of custody (COC) and preservation requirements for the samples were
met, hold-time exceedances in the samples may create a low bias in the resulting data.
9.2.6 Completeness
Percent completeness (number of valid measurements / total number of measurements
planned) was 100 percent. Several samples were added to the study in the field. Sample
PGDW35 was not collected as the pump was not functioning in that well; instead sample
PGDW48 was collected from an alternate well at the property that is being used for
drinking water. All data points are valid, with the validation qualifiers attached. The
completeness is sufficient for the intended purpose.
9.2.7 Comparability
The data are homogeneous for several reasons:
All samples were collected during a single sampling event, eliminating seasonal
variation;
All samples were collected as specified in the FSP and TSOP, except where
noted in section 6.0; and
The same method. was used for samples with similar matrices and analyses
regardless of the lab that completed the analysis.
9.2.8 Data Usability Summary
All analytical data, including logbooks, COCs, and long form raw data packages, were
reviewed by a UOS chemist or by a third party data reviewer against the TSOP or EPA
method they were generated under, and found to be acceptable for their intended use with
the attached qualifiers, with exceptions noted below:
Results for samples that were analyzed or extracted beyond hold times should be
considered as having a potential low bias.
Results for samples that had a low surrogate recovery should be considered as
having a potential low bias.
TDD No. 0901-01 T:\START3\Pavillion Area GW Investigation\Pavillion_Area_GW_Plume_ESI\ARR\Final ARR\ARR August 2010 Final.doc
URS Operating Services, Inc. Pavillion Area Groundwater Investigation ESI – ARR START 3, EPA Region 8 Revision: 0 Contract No. EP-W-05-050 Date: 08/2010 Page 36 of 82
Results for samples that had a high surrogate recovery should be considered as
having a potential high bias.
Results that exceeded the upper linear calibration range and were not rerun at a
higher dilution should be considered as having a probable low bias.
Results for samples that had low recoveries in the corresponding spike sample
should be considered as having a potential low bias.
Results for samples that had high recoveries in the corresponding spike sample
should be considered as having a potential high bias.
Results for samples that had initial calibration, continuing calibration or DMC
recoveries low should be considered as having a potential low bias.
Results for samples that had initial calibration, continuing calibration or DMC
recoveries high should be considered as having a potential high bias.
10.0 SUMMARY AND CONCLUSIONS
Section 10.0, Summary and Conclusions, was provided by EPA.
10.1 BACKGROUND
EPA conducted an Expanded Site Inspection (ESI) in January 2010 in Pavillion, Wyoming. This
sampling effort is a follow up to a first round of sampling that took place in March 2009. The
focus of this investigation is to address potential groundwater contamination based on resident
complaints about odors, tastes and adverse changes in water quality in their private wells. The
objectives of this ESI are to:
Quantify levels of chemicals of concern in wells, in order to determine risk(s), to the
extent practicable; and,
Identify source(s) of chemicals of concern, to the extent practicable.
EPA’s investigation sampled 19 drinking water wells (17 private and 2 public) and 4
stock/irrigation wells in January 2010. EPA also sampled 3 shallow groundwater monitoring
wells and soils associated with inactive pits, as well as production fluids from 4 gas production
wells, and surface water and nearby sediment from 5 locations on Five Mile Creek.
TDD No. 0901-01 T:\START3\Pavillion Area GW Investigation\Pavillion_Area_GW_Plume_ESI\ARR\Final ARR\ARR August 2010 Final.doc

URS Operating Services, Inc. Pavillion Area Groundwater Investigation ESI – ARR START 3, EPA Region 8 Revision: 0 Contract No. EP-W-05-050 Date: 08/2010 Page 37 of 82
10.2 SUMMARY OF RESULTS AND CONCLUSIONS
A number of nearby drinking water and stock wells have low level detections of organic
compounds such as phenols, benzene, and naphthalene. Seventeen of 19 drinking water wells
sampled show detections of Total Petroleum Hydrocarbons. Two drinking water wells sampled
in January 2010 had constituents detected by EPA that exceeded a primary drinking water
standard. One well, which was not being used for drinking water during the sampling event,
exceeded the primary drinking water standards for lead and phthalate. The other drinking water
well exceeded one standard for nitrates. This well owner also had the same exceedance during
the Phase 1 sampling and was notified at each incident and was provided with assistance.
Four pesticides were detected in 4 private wells at very low concentrations, less than 10 parts per
trillion.
EPA was able to confirm and quantify the concentrations of some of the Tentatively Identified
Compounds (TICs) found during our March 2009 sampling event. Eleven wells were confirmed
to have 2-butoxyethanol phosphate, or 2-BEP, at very low concentrations (less than 5 ppb). The
compound 2- BEP is not a constituent typically found in drinking water wells. A USGS national
groundwater study using similar detection limits detected 2-BEP in only 1 of around 200 wells
sampled.
Methane identified in 7 drinking water wells was found to be of thermogenic origin, meaning it
originated within the natural gas reservoir. One drinking water well showed methane resulting
from microbial activity, known as biogenic methane.
Adamantane compounds were also confirmed in 4 drinking wells at low concentrations.
Adamantane compounds are commonly associated with hydrocarbon production fluids, and can
be found in other products.
EPA also performed analysis of the bacteria present in groundwater at some well locations. This
information is indicative of the level of microbial activity in groundwater. The microbial
organisms that were identified are not organisms that are harmful to health, but could lead to
concerns with odor.
TDD No. 0901-01 T:\START3\Pavillion Area GW Investigation\Pavillion_Area_GW_Plume_ESI\ARR\Final ARR\ARR August 2010 Final.doc

URS Operating Services, Inc. Pavillion Area Groundwater Investigation ESI – ARR START 3, EPA Region 8 Revision: 0 Contract No. EP-W-05-050 Date: 08/2010 Page 38 of 82
Sample results also indicated a number of inorganic constituents that EPA would expect to see
given the historic groundwater quality in the area. Although these constituents, such as sulfates,
iron and magnesium, are generally within the ranges seen in previous studies, they are in some
cases present at elevated levels.
Our sampling confirmed that shallow ground water located near inactive pits being addressed
under Wyoming DEQ’s voluntary clean-up program still contain significant levels of organic
compounds including benzene, naphthalene, phenol and hydrocarbons.
Two Town of Pavillion water supply wells were sampled as part of this ESI. EPA’s Public Water
Supply Program requires routine sampling and analysis of the system’s blended and treated water
that supplies drinking water to residents of the town of Pavillion. Because sampling for this
project was to assess the condition of groundwater in the vicinity and not to assess the finished
water that is in the Pavillion distribution system, the samples for this project were collected at the
well prior to treatment so as to represent the characteristics of the aquifer. Consequently, these
sample results are not indicative of the water provided by the Pavillion public water supply
system to its customers. Compounds detected in the untreated and unblended water included
caprolactam, butyl benzyl phthalate, and DRO at low levels.
These ESI sampling results show that groundwater in Pavillion contains a number of organic
compounds that were detected in monitoring wells, drinking water wells and stock wells.
The shallow groundwater is hydrologically connected to the aquifers that are being used for
drinking water in the area. Without more information on flow direction and contaminant
movement, significant uncertainty exists regarding future impacts to drinking water wells. These
sample results reflect a single snapshot in time and we are unable to determine any trends or
changes in condition.
EPA continues to further investigate and will be collecting data from two new monitoring wells
and a soil gas survey in the Pavillion field. EPA has not reached any conclusions about how
constituents of concern are occurring in domestic wells with this ARR. The additional
investigation results will help determine where the constituents are coming from. Even with the
additional information, EPA may not be able to definitively pinpoint a specific source or sources.
TDD No. 0901-01 T:\START3\Pavillion Area GW Investigation\Pavillion_Area_GW_Plume_ESI\ARR\Final ARR\ARR August 2010 Final.doc
URS Operating Services, Inc. Pavillion Area Groundwater Investigation ESI – ARR START 3, EPA Region 8 Revision: 0 Contract No. EP-W-05-050 Date: 08/2010 Page 39 of 82
11.0 LIST OF REFERENCES
Coleman, D. D., Liu, C.L., Hackley, K.C., Pelphrey, S. R. (1995) Isotopic identification of landfill
methane. Environmental Geosciences 4, 95-103
Dunne, T. and L.B. Leopold. 1978. “Water and Environmental Planning.” W.H. Freeman and
Company, San Francisco.
Fox, J.E., and G.L. Dolton. 1995. Wind River Basin Province and Bighorn Basin Province, USGS
National Oil and Gas Assessment.
Keefer, W.R.. 1965. Stratigraphy and Geologic History of the Uppermost Cretaceous, Paleocene, and
Lower Eocene Rocks in the Wind River Basin. Geological Survey Professional Paper 495-A. United
States Geologic Survey.
Love, J.D., and Christiansen, A.C., 1985 Geologic Map of Wyoming.
NPIRS 2009. National Pesticide Retrieval System. http://ppis.ceris.perdue.edu.
Mason, J.P., Sebree, S.K., Quinn, T.L. (2005) Monitoring Well and Sampling Design for Ground-Water Quality, Wind River Indian Reservation, Wyoming, USGS Scientific Investigations Report 2005-5027.
McGreevy, L. J., Hodson, W.G., and Rucker IV, S.J., (1969) Ground-Water Resources fo the Wind River
Indian Reservation, Wyoming, USGS Water Supply Paper 1576-I.
PAN 2009. PAN Pesticide database. http:www.pesticideinfo.org
Plafcan, M., Eddy-Miller, C.A., Ritz, G.F., Holland II, J.P.R. (1995) Water-Resources Investigations
Report 95-4095, Water Resources of Fremont County, Wyoming
Seeland, D.A. 1978. Eocene Fluvial Drainage Patterns and Their Implications for Uranium and
Hydrocarbon Exploration in Wind River Basin, Wyoming. Geological Survey Bulletin 1446. United
States Geologic Survey.
Soister, P.E. 1968. Stratigraphy of the Wind River Formation in South-Central Wind River Basin,
Wyoming. Shorter Contributions to General Geology, Geological Survey Professional Paper 594-A.
United States Geologic Survey.
TDD No. 0901-01 T:\START3\Pavillion Area GW Investigation\Pavillion_Area_GW_Plume_ESI\ARR\Final ARR\ARR August 2010 Final.doc

URS Operating Services, Inc. Pavillion Area Groundwater Investigation ESI – ARR START 3, EPA Region 8 Revision: 0 Contract No. EP-W-05-050 Date: 08/2010 Page 40 of 82
The Endocrine Disruption Exchange (TEDX). 2008. “Chemicals Used in Natural Gas Development in
Wyoming 09-22-08.” http://www.endocrinedisruption.com/chemicals.spreadsheets.php
U.S. Department of the Interior, Bureau of the Census 2000
U.S. Environmental Protection Agency (EPA). 1992. “Guidance for Performing Site Inspections Under
CERCLA.” Interim Final September 1992.
U.S. Environmental Protection Agency (EPA). 1993. “Region 8 Supplement to Guidance for Performing
Site Inspections Under CERCLA.” January 1993.
U.S. Environmental Protection Agency (EPA). 2008. EPA Oil and Gas Well Drilling Fluids Study List
(Preliminary). Obtained from Greg Oberley, U.S. EPA, December, 2008.
U.S. Fish and Wildlife Service (USFWS). 1998. National Wetlands Inventory Map of the 7.5 Minute
Topographic Map Quadrangle, Pavillion, Wyoming.
USGS Water Supply Paper 1375, 1959, Ground-water Resources of Riverton IrrigationProject Area,
Wyoming, D.A. Morris, O.M. Hackett, K.E. Vanlier and E.A. Moulder
U.S. Geological Survey (USGS). 1991. “Water Resources Data, Wyoming, Water Year 1991.” U.S.
Geological Survey Water-Data Report WY.91.1.
USGS 2001. Pesticides in Ground Water - Fremont County, Wyoming, 1998-99.
http://pubs.usgs.gov/fs/fs03500/#pesticids.
U.S. Geological Survey (USGS). 2008. AWater Resources Data, Wyoming: USGS Surface-Water
Annual Statistics”. September 23, 2008. http://waterdata.usgs.gov/wy/nwis/annual
U.S. Geological Survey (USGS). 2009. “Anthropogenic Organic Compounds in Source Water of
Selected Community Water Systems that Use Groundwater, 2002-05.” U.S. Geological Survey Scientific
Investigations Report 2009-5200. 2009.
University of Delaware, Center for Climatic Research, Department of Geography. 1986. Terrestrial
Water Budget Data Archive: Version 1.01, compiled by C.J. Willmott and C.M. Rowe.
TDD No. 0901-01 T:\START3\Pavillion Area GW Investigation\Pavillion_Area_GW_Plume_ESI\ARR\Final ARR\ARR August 2010 Final.doc

URS Operating Services, Inc. Pavillion Area Groundwater Investigation ESI – ARR START 3, EPA Region 8 Revision: 0 Contract No. EP-W-05-050 Date: 08/2010 Page 41 of 82
URS Operating Services, Inc. (UOS). 2005a. “Generic Quality Assurance Project Plan” for the
Superfund Technical Assessment and Response Team 2, Region 8. June 13, 2005.
URS Operating Services, Inc. (UOS). 2005b. “Technical Standard Operating Procedures for the
Superfund Technical Assessment and Response Team (START), EPA Region 8.”
URS Operating Services, Inc. (UOS). 2008. “Preliminary Assessment of Pavillion Area GW Plume.”
December 18, 2008.
URS Operating Services, Inc. (UOS). 2009. “Site Inspection - Pavillion Area GW Plume.” August 19,
2009.
URS Operating Services, Inc. (UOS). 2010. “Field Sampling Plan for Pavillion Area GW Plume
Expanded Site Investigation.” January 6, 2010.
Wyoming State Game and Fish.(WGFD) 2008. The Official State List of the Common and Scientific
Names of the Birds, Mammals, Amphibians, and Reptiles in Wyoming. September 23, 2008.
http://gf.state.wy.us
Trelease, F.J., Swartz, T.J., Burman, R.D., and Rechard, P.A., (1970) Consumptive use of Irrigation
Water in Wyoming, WRS-19, Wyoming Water Planning Report Number 5, Water Resources Series No.
19
Wyoming Oil and Gas Conservation Commission (WOGCC) 2008. Data retrieved from
http://wogcc.state.wy.us.
Wyoming State Engineers Office (WSEO). 2010. seo.state. wy.us/
Zelt, R.B., G. Boughton, K.A. Miller, J.P. Mason., and L.M. Gianakos. 1999. Environmental Setting of
the Yellowstone River Basin, Montana, North Dakota, and Wyoming. Water Resources Investigations
Report 98-4269. United States Geologic Survey.
TDD No. 0901-01 T:\START3\Pavillion Area GW Investigation\Pavillion_Area_GW_Plume_ESI\ARR\Final ARR\ARR August 2010 Final.doc

URS Operating Services, Inc. Pavillion Area Groundwater Investigation ESI – ARR START 3, EPA Region 8 Revision: 0 Contract No. EP-W-05-050 Date: 08/2010 Page 42 of 82
Figure 1 Site Location Map
TDD No. 0901-01 T:\START3\Pavillion Area GW Investigation\Pavillion_Area_GW_Plume_ESI\ARR\Final ARR\ARR August 2010 Final.doc

URS Operating Services, Inc. Pavillion Area Groundwater Investigation ESI – ARR START 3, EPA Region 8 Revision: 0 Contract No. EP-W-05-050 Date: 08/2010 Page 43 of 82
Figure 2 Sample Locations Map
TDD No. 0901-01 T:\START3\Pavillion Area GW Investigation\Pavillion_Area_GW_Plume_ESI\ARR\Final ARR\ARR August 2010 Final.doc

URS Operating Services, Inc. Pavillion Area Groundwater Investigation ESI – ARR START 3, EPA Region 8 Revision: 0 Contract No. EP-W-05-050 Date: 08/2010 Page 44 of 82
Figure 3 Area of Influence and Well locations
TDD No. 0901-01 T:\START3\Pavillion Area GW Investigation\Pavillion_Area_GW_Plume_ESI\ARR\Final ARR\ARR August 2010 Final.doc
URS Operating Services, Inc. Pavillion Area Groundwater Investigation ESI – ARR START 3, EPA Region 8 Revision: 0 Contract No. EP-W-05-050 Date: 08/2010 Page 45 of 82
TDD No. 0901-01 T:\START3\Pavillion Area GW Investigation\Pavillion_Area_GW_Plume_ESI\ARR\Final ARR\ARR August 2010 Final.doc
Figure 4 – Conceptual Site Model
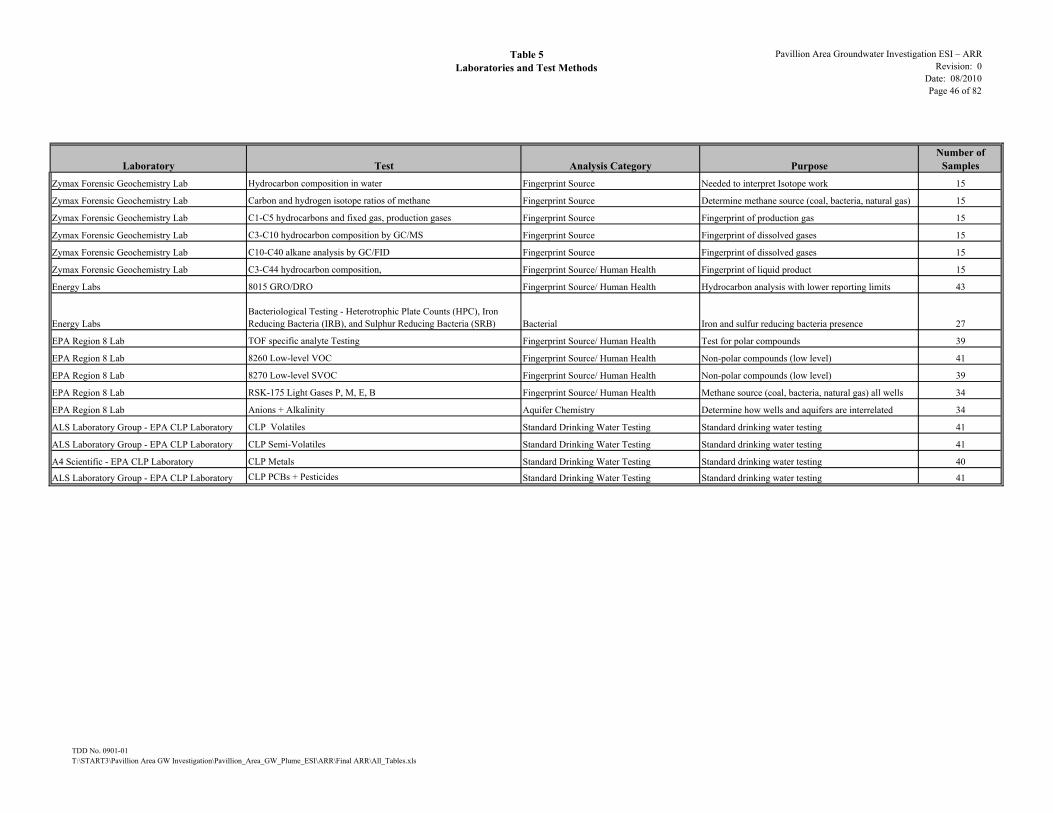
Table 5Laboratories and Test Methods
Pavillion Area Groundwater Investigation ESI – ARRRevision: 0
Date: 08/2010 Page 46 of 82
Laboratory Test Analysis Category PurposeNumber of
Samples
Zymax Forensic Geochemistry Lab Hydrocarbon composition in water Fingerprint Source Needed to interpret Isotope work 15
Zymax Forensic Geochemistry Lab Carbon and hydrogen isotope ratios of methane Fingerprint Source Determine methane source (coal, bacteria, natural gas) 15
Zymax Forensic Geochemistry Lab C1-C5 hydrocarbons and fixed gas, production gases Fingerprint Source Fingerprint of production gas 15
Zymax Forensic Geochemistry Lab C3-C10 hydrocarbon composition by GC/MS Fingerprint Source Fingerprint of dissolved gases 15
Zymax Forensic Geochemistry Lab C10-C40 alkane analysis by GC/FID Fingerprint Source Fingerprint of dissolved gases 15
Zymax Forensic Geochemistry Lab C3-C44 hydrocarbon composition, Fingerprint Source/ Human Health Fingerprint of liquid product 15
Energy Labs 8015 GRO/DRO Fingerprint Source/ Human Health Hydrocarbon analysis with lower reporting limits 43
Energy LabsBacteriological Testing - Heterotrophic Plate Counts (HPC), Iron Reducing Bacteria (IRB), and Sulphur Reducing Bacteria (SRB) Bacterial Iron and sulfur reducing bacteria presence 27
EPA Region 8 Lab TOF specific analyte Testing Fingerprint Source/ Human Health Test for polar compounds 39
EPA Region 8 Lab 8260 Low-level VOC Fingerprint Source/ Human Health Non-polar compounds (low level) 41
EPA Region 8 Lab 8270 Low-level SVOC Fingerprint Source/ Human Health Non-polar compounds (low level) 39
EPA Region 8 Lab RSK-175 Light Gases P, M, E, B Fingerprint Source/ Human Health Methane source (coal, bacteria, natural gas) all wells 34
EPA Region 8 Lab Anions + Alkalinity Aquifer Chemistry Determine how wells and aquifers are interrelated 34
ALS Laboratory Group - EPA CLP Laboratory CLP Volatiles Standard Drinking Water Testing Standard drinking water testing 41
ALS Laboratory Group - EPA CLP Laboratory CLP Semi-Volatiles Standard Drinking Water Testing Standard drinking water testing 41
A4 Scientific - EPA CLP Laboratory CLP Metals Standard Drinking Water Testing Standard drinking water testing 40
ALS Laboratory Group - EPA CLP Laboratory CLP PCBs + Pesticides Standard Drinking Water Testing Standard drinking water testing 41
TDD No. 0901-01T:\START3\Pavillion Area GW Investigation\Pavillion_Area_GW_Plume_ESI\ARR\Final ARR\All_Tables.xls

Table 6Sample Locations and Analyses
Pavillion Area Groundwater Investigation ESI – ARRRevision: 0
Date: 08/2010 Page 47 of 82
Sample Location Matrix
A4 Scientific CLP TAL Metals
ICP-AES
A4 Scientific CLP TAL Total Metals/Hg ICP-
MS and ICP/AES
A4 Scientific CLP TCL
Semivolatiles and Pesticides/ PCBs
Datachem Laboratories
CLP TCL Trace Volatiles
EPA Region 8 Lab SVOA/ MS-
TOF / GRO/DRO
EPA Region 8 Lab VOCs
EPA Region 8 Lab VOC Light
Gases
EPA Region 8 Alkalinity and
Anions
Energy Labs Bacteria HPC/
IRB/ SRBEnergy Labs GRO/DRO
Zymax Geochemistry
Forensics TestingPGDW03 Water X X X X X X X X XPGDW04 Water X X X X X X X X X XPGDW05 Water X X X X X X X X XPGDW05D Water X X X X X X X X XPGDW10 Water X X X X X X X X XPGDW20 Water X X X X X X X X X XPGDW22 Water X X X X X X X X XPGDW23 Water X X X X X X X X X XPGDW25 Water X X X X X X X X XPGDW30 Water X X X X X X X X X XPGDW32 Water X X X X X X X X XPGDW39 Water X X X X X X X X XPGDW40 Water X X X X X X X X X XPGDW41 Water X X X X X X X X X XPGDW42 Water X X X X X X X X XPGDW43 Water X X X X X X X X X XPGDW44 Water X X X X X X X X X XPGDW45 Water X X X X X X X X XPGDW46 Water X X X X X X X X XPGDW47 Water X X X X X X X X XPGDW48 Water X X X X X X X X XPGDW49 Water X X X X X X X X XPGFB01 Water X XPGMW01 Water X X X X X X X X XPGMW01D Water X X X X X X X X XPGMW02 Water X X X X X X X X XPGMW03 Water X X X X X X X X XPGPP01 Product X X XPGPP02 Product XPGPP03 Product XPGPP04 Product X X XPGPP05 Product X X XPGPP06 Product X X XPGPW01 Municipal Water X X X X X X X X XPGPW02 Municipal Water X X X X X X X X XPGSE01 Sediment X X X X XPGSE02 Sediment X X X X XPGSE02d Sediment X X X X XPGSE03 Sediment X X X X XPGSE04 Sediment X X X X XPGSE05 Sediment X X X X XPGSO01 Soil Boring X XPGSO02 Soil Boring X XPGSO03 Soil Boring X XPGSW01 Surface Water X X X X X X X XPGSW02 Surface Water X X X X X X X XPGSW02D Surface Water X X X X X X X XPGSW03 Surface Water X X X X X X X XPGSW04 Surface Water X X X X X X X XPGSW05 Surface Water X X X X X X X XPGTB01 Water X XPGFM20 Filter Sample X X
TDD No. 0901-01T:\START3\Pavillion Area GW Investigation\Pavillion_Area_GW_Plume_ESI\ARR\Final ARR\All_Tables.xls

Table 7Pavillion Groundwater Plume Investigation ESI Analytes
Pavillion Area Groundwater Investigation ESI – ARRRevision: 0
Date: 08/2010 Page 48 of 82
Analyte CAS Number Laboratory NameReporting
LimitReporting
Limit Units MethodALUMINUM 7429-90-5 A4 SCIENTIFIC 200 μg/L CLP Metals - 200.7 (ICP-AES)
IRON 7439-89-6 A4 SCIENTIFIC 100 μg/L CLP Metals - 200.7 (ICP-AES)
LEAD 7439-92-1 A4 SCIENTIFIC 10 μg/L CLP Metals - 200.7 (ICP-AES)
MAGNESIUM 7439-95-4 A4 SCIENTIFIC 5000 μg/L CLP Metals - 200.7 (ICP-AES)
MANGANESE 7439-96-5 A4 SCIENTIFIC 15 μg/L CLP Metals - 200.7 (ICP-AES)
NICKEL 7440-02-0 A4 SCIENTIFIC 40 μg/L CLP Metals - 200.7 (ICP-AES)
POTASSIUM 7440-09-7 A4 SCIENTIFIC 5000 μg/L CLP Metals - 200.7 (ICP-AES)
SILVER 7440-22-4 A4 SCIENTIFIC 10 μg/L CLP Metals - 200.7 (ICP-AES)
SODIUM 7440-23-5 A4 SCIENTIFIC 5000 μg/L CLP Metals - 200.7 (ICP-AES)
THALLIUM 7440-28-0 A4 SCIENTIFIC 25 μg/L CLP Metals - 200.7 (ICP-AES)
ANTIMONY 7440-36-0 A4 SCIENTIFIC 60 μg/L CLP Metals - 200.7 (ICP-AES)
ARSENIC 7440-38-2 A4 SCIENTIFIC 10 μg/L CLP Metals - 200.7 (ICP-AES)
BARIUM 7440-39-3 A4 SCIENTIFIC 200 μg/L CLP Metals - 200.7 (ICP-AES)
BERYLLIUM 7440-41-7 A4 SCIENTIFIC 5 μg/L CLP Metals - 200.7 (ICP-AES)
CADMIUM 7440-43-9 A4 SCIENTIFIC 5 μg/L CLP Metals - 200.7 (ICP-AES)
CHROMIUM 7440-47-3 A4 SCIENTIFIC 10 μg/L CLP Metals - 200.7 (ICP-AES)
COBALT 7440-48-4 A4 SCIENTIFIC 50 μg/L CLP Metals - 200.7 (ICP-AES)
COPPER 7440-50-8 A4 SCIENTIFIC 25 μg/L CLP Metals - 200.7 (ICP-AES)
VANADIUM 7440-62-2 A4 SCIENTIFIC 50 μg/L CLP Metals - 200.7 (ICP-AES)
ZINC 7440-66-6 A4 SCIENTIFIC 60 μg/L CLP Metals - 200.7 (ICP-AES)
CALCIUM 7440-70-2 A4 SCIENTIFIC 5000 μg/L CLP Metals - 200.7 (ICP-AES)
SELENIUM 7782-49-2 A4 SCIENTIFIC 35 μg/L CLP Metals - 200.7 (ICP-AES)
Aroclor-1260 11096-82-5 ALS 1 μg/L CLP - Arochlors
Aroclor-1254 11097-69-1 ALS 1 μg/L CLP - Arochlors
Aroclor-1268 11100-14-4 ALS 1 μg/L CLP - Arochlors
Aroclor-1221 11104-28-2 ALS 1 μg/L CLP - Arochlors
Aroclor-1232 11141-16-5 ALS 1 μg/L CLP - Arochlors
Aroclor-1248 12672-29-6 ALS 1 μg/L CLP - Arochlors
Aroclor-1016 12674-11-2 ALS 1 μg/L CLP - Arochlors
Aroclor-1262 37324-23-5 ALS 1 μg/L CLP - Arochlors
Aroclor-1242 53469-21-9 ALS 1 μg/L CLP - Arochlors
Heptachlor epoxide 1024-57-3 ALS 0.05 μg/L CLP - Pesticides
Endosulfan sulfate 1031-07-8 ALS 0.1 μg/L CLP - Pesticides
Aldrin 309-00-2 ALS 0.05 μg/L CLP - Pesticides
alpha-BHC 319-84-6 ALS 0.05 μg/L CLP - Pesticides
beta-BHC 319-85-7 ALS 0.05 μg/L CLP - Pesticides
delta-BHC 319-86-8 ALS 0.05 μg/L CLP - Pesticides
Endosulfan II 33213-65-9 ALS 0.1 μg/L CLP - Pesticides
4,4'-DDT 50-29-3 ALS 0.1 μg/L CLP - Pesticides
alpha-Chlordane 5103-71-9 ALS 0.05 μg/L CLP - Pesticides
gamma-Chlordane 5103-74-2 ALS 0.05 μg/L CLP - Pesticides
Endrin ketone 53494-70-5 ALS 0.1 μg/L CLP - Pesticides
gamma-BHC (Lindane) 58-89-9 ALS 0.05 μg/L CLP - Pesticides
Dieldrin 60-57-1 ALS 0.1 μg/L CLP - Pesticides
TDD No. 0901-01T:\START3\Pavillion Area GW Investigation\Pavillion_Area_GW_Plume_ESI\ARR\Final ARR\All_Tables.xls

Table 7Pavillion Groundwater Plume Investigation ESI Analytes
Pavillion Area Groundwater Investigation ESI – ARRRevision: 0
Date: 08/2010 Page 49 of 82
Analyte CAS Number Laboratory NameReporting
LimitReporting
Limit Units MethodEndrin 72-20-8 ALS 0.1 μg/L CLP - Pesticides
Methoxychlor 72-43-5 ALS 0.5 μg/L CLP - Pesticides
4,4'-DDD 72-54-8 ALS 0.1 μg/L CLP - Pesticides
4,4'-DDE 72-55-9 ALS 0.1 μg/L CLP - Pesticides
Endrin aldehyde 7421-93-4 ALS 0.1 μg/L CLP - Pesticides
Heptachlor 76-44-8 ALS 0.05 μg/L CLP - Pesticides
Toxaphene 8001-35-2 ALS 5 μg/L CLP - Pesticides
Endosulfan I 959-98-8 ALS 0.05 μg/L CLP - Pesticides
4-Nitroaniline 100-01-6 ALS 10 μg/L CLP - Semi-volatiles
4-Nitrophenol 100-02-7 ALS 10 μg/L CLP - Semi-volatiles
Benzaldehyde 100-52-7 ALS 5 μg/L CLP - Semi-volatiles
4-Bromophenyl-phenylether 101-55-3 ALS 5 μg/L CLP - Semi-volatiles
Caprolactam 105-60-2 ALS 5 μg/L CLP - Semi-volatiles
2,4-Dimethylphenol 105-67-9 ALS 5 μg/L CLP - Semi-volatiles
4-Methylphenol 106-44-5 ALS 5 μg/L CLP - Semi-volatiles
4-Chloroaniline 106-47-8 ALS 5 μg/L CLP - Semi-volatiles
2,2'-Oxybis(1-chloropropane) 108-60-1 ALS 5 μg/L CLP - Semi-volatiles
Phenol 108-95-2 ALS 5 μg/L CLP - Semi-volatiles
Bis(2-chloroethyl)ether 111-44-4 ALS 5 μg/L CLP - Semi-volatiles
Bis(2-chloroethoxy)methane 111-91-1 ALS 5 μg/L CLP - Semi-volatiles
Bis(2-ethylhexyl)phthalate 117-81-7 ALS 5 μg/L CLP - Semi-volatiles
Di-n-octylphthalate 117-84-0 ALS 5 μg/L CLP - Semi-volatiles
Hexachlorobenzene 118-74-1 ALS 5 μg/L CLP - Semi-volatiles
Anthracene 120-12-7 ALS 5 μg/L CLP - Semi-volatiles
2,4-Dichlorophenol 120-83-2 ALS 5 μg/L CLP - Semi-volatiles
2,4-Dinitrotoluene 121-14-2 ALS 5 μg/L CLP - Semi-volatiles
Pyrene 129-00-0 ALS 5 μg/L CLP - Semi-volatiles
Dimethylphthalate 131-11-3 ALS 5 μg/L CLP - Semi-volatiles
Dibenzofuran 132-64-9 ALS 5 μg/L CLP - Semi-volatiles
Atrazine 1912-24-9 ALS 5 μg/L CLP - Semi-volatiles
Benzo(g,h,i)perylene 191-24-2 ALS 5 μg/L CLP - Semi-volatiles
Indeno(1,2,3-cd)pyrene 193-39-5 ALS 5 μg/L CLP - Semi-volatiles
Benzo(b)fluoranthene 205-99-2 ALS 5 μg/L CLP - Semi-volatiles
Fluoranthene 206-44-0 ALS 5 μg/L CLP - Semi-volatiles
Benzo(k)fluoranthene 207-08-9 ALS 5 μg/L CLP - Semi-volatiles
Acenaphthylene 208-96-8 ALS 5 μg/L CLP - Semi-volatiles
Chrysene 218-01-9 ALS 5 μg/L CLP - Semi-volatiles
Benzo(a)pyrene 50-32-8 ALS 5 μg/L CLP - Semi-volatiles
2,4-Dinitrophenol 51-28-5 ALS 10 μg/L CLP - Semi-volatiles
4,6-Dinitro-2-methylphenol 534-52-1 ALS 10 μg/L CLP - Semi-volatiles
Dibenzo(a,h)anthracene 53-70-3 ALS 5 μg/L CLP - Semi-volatiles
Benzo(a)anthracene 56-55-3 ALS 5 μg/L CLP - Semi-volatiles
2,3,4,6-Tetrachlorophenol 58-90-2 ALS 5 μg/L CLP - Semi-volatiles
4-Chloro-3-methylphenol 59-50-7 ALS 5 μg/L CLP - Semi-volatiles
TDD No. 0901-01T:\START3\Pavillion Area GW Investigation\Pavillion_Area_GW_Plume_ESI\ARR\Final ARR\All_Tables.xls

Table 7Pavillion Groundwater Plume Investigation ESI Analytes
Pavillion Area Groundwater Investigation ESI – ARRRevision: 0
Date: 08/2010 Page 50 of 82
Analyte CAS Number Laboratory NameReporting
LimitReporting
Limit Units Method2,6-Dinitrotoluene 606-20-2 ALS 5 μg/L CLP - Semi-volatiles
N-Nitroso-di-n-propylamine 621-64-7 ALS 5 μg/L CLP - Semi-volatiles
Hexachloroethane 67-72-1 ALS 5 μg/L CLP - Semi-volatiles
4-Chlorophenyl-phenylether 7005-72-3 ALS 5 μg/L CLP - Semi-volatiles
Hexachlorocyclopentadiene 77-47-4 ALS 5 μg/L CLP - Semi-volatiles
Isophorone 78-59-1 ALS 5 μg/L CLP - Semi-volatiles
Acenaphthene 83-32-9 ALS 5 μg/L CLP - Semi-volatiles
Diethylphthalate 84-66-2 ALS 5 μg/L CLP - Semi-volatiles
Di-n-butylphthalate 84-74-2 ALS 5 μg/L CLP - Semi-volatiles
Phenanthrene 85-01-8 ALS 5 μg/L CLP - Semi-volatiles
Butylbenzylphthalate 85-68-7 ALS 5 μg/L CLP - Semi-volatiles
N-Nitrosodiphenylamine 86-30-6 ALS 5 μg/L CLP - Semi-volatiles
Fluorene 86-73-7 ALS 5 μg/L CLP - Semi-volatiles
Carbazole 86-74-8 ALS 5 μg/L CLP - Semi-volatiles
Hexachlorobutadiene 87-68-3 ALS 5 μg/L CLP - Semi-volatiles
Pentachlorophenol 87-86-5 ALS 10 μg/L CLP - Semi-volatiles
2,4,6-Trichlorophenol 88-06-2 ALS 5 μg/L CLP - Semi-volatiles
2-Nitroaniline 88-74-4 ALS 10 μg/L CLP - Semi-volatiles
2-Nitrophenol 88-75-5 ALS 5 μg/L CLP - Semi-volatiles
Naphthalene 91-20-3 ALS 5 μg/L CLP - Semi-volatiles
2-Methylnaphthalene 91-57-6 ALS 5 μg/L CLP - Semi-volatiles
2-Chloronaphthalene 91-58-7 ALS 5 μg/L CLP - Semi-volatiles
3,3'-Dichlorobenzidine 91-94-1 ALS 5 μg/L CLP - Semi-volatiles
1,1'-Biphenyl 92-52-4 ALS 5 μg/L CLP - Semi-volatiles
2-Methylphenol 95-48-7 ALS 5 μg/L CLP - Semi-volatiles
2-Chlorophenol 95-57-8 ALS 5 μg/L CLP - Semi-volatiles
1,2,4,5-Tetrachlorobenzene 95-94-3 ALS 5 μg/L CLP - Semi-volatiles
2,4,5-Trichlorophenol 95-95-4 ALS 5 μg/L CLP - Semi-volatiles
Acetophenone 98-86-2 ALS 5 μg/L CLP - Semi-volatiles
Nitrobenzene 98-95-3 ALS 5 μg/L CLP - Semi-volatiles
3-Nitroaniline 99-09-2 ALS 10 μg/L CLP - Semi-volatiles
MERCURY 7439-97-6 A4 SCIENTIFIC 0.2 μg/L CLP - Mercury (Cold Vapor)
IRON 7439-89-6 A4 SCIENTIFIC 100 μg/L CLP Metals - 200.8 (ICP-MS)
LEAD 7439-92-1 A4 SCIENTIFIC 1 μg/L CLP Metals - 200.8 (ICP-MS)
MANGANESE 7439-96-5 A4 SCIENTIFIC 1 μg/L CLP Metals - 200.8 (ICP-MS)
NICKEL 7440-02-0 A4 SCIENTIFIC 1 μg/L CLP Metals - 200.8 (ICP-MS)
SILVER 7440-22-4 A4 SCIENTIFIC 1 μg/L CLP Metals - 200.8 (ICP-MS)
THALLIUM 7440-28-0 A4 SCIENTIFIC 1 μg/L CLP Metals - 200.8 (ICP-MS)
ANTIMONY 7440-36-0 A4 SCIENTIFIC 2 μg/L CLP Metals - 200.8 (ICP-MS)
ARSENIC 7440-38-2 A4 SCIENTIFIC 1 μg/L CLP Metals - 200.8 (ICP-MS)
BARIUM 7440-39-3 A4 SCIENTIFIC 10 μg/L CLP Metals - 200.8 (ICP-MS)
BERYLLIUM 7440-41-7 A4 SCIENTIFIC 1 μg/L CLP Metals - 200.8 (ICP-MS)
CADMIUM 7440-43-9 A4 SCIENTIFIC 1 μg/L CLP Metals - 200.8 (ICP-MS)
CHROMIUM 7440-47-3 A4 SCIENTIFIC 2 μg/L CLP Metals - 200.8 (ICP-MS)
TDD No. 0901-01T:\START3\Pavillion Area GW Investigation\Pavillion_Area_GW_Plume_ESI\ARR\Final ARR\All_Tables.xls
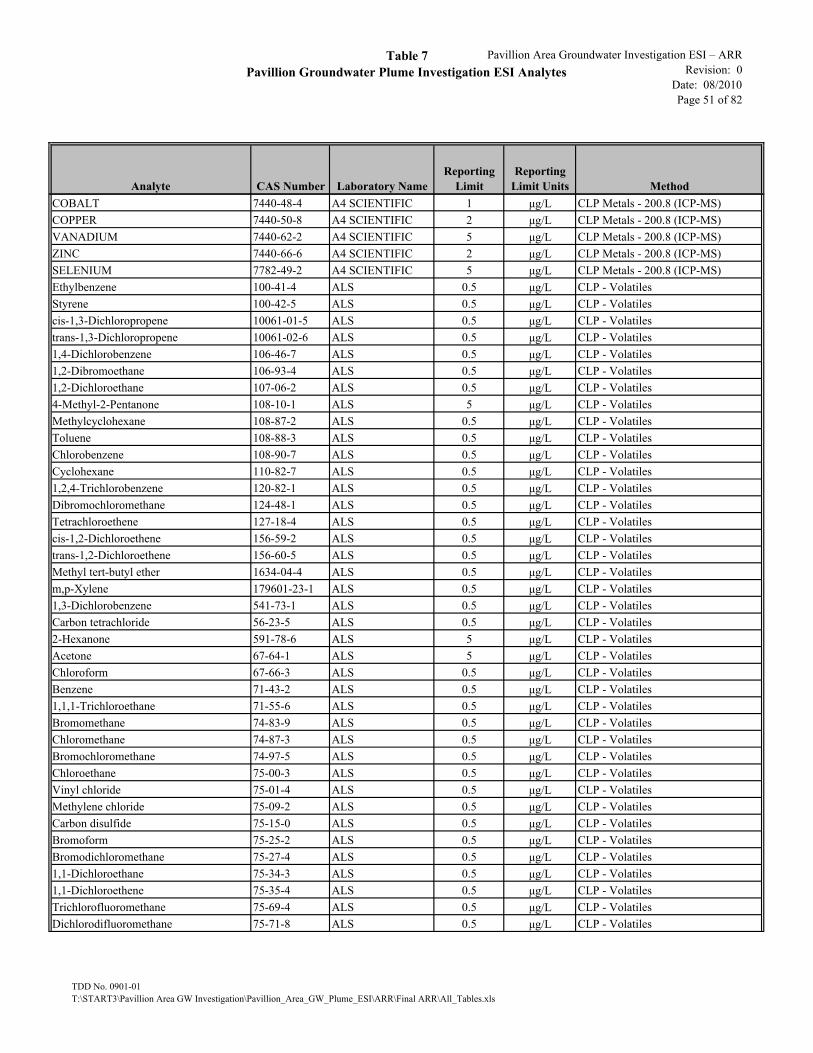
Table 7Pavillion Groundwater Plume Investigation ESI Analytes
Pavillion Area Groundwater Investigation ESI – ARRRevision: 0
Date: 08/2010 Page 51 of 82
Analyte CAS Number Laboratory NameReporting
LimitReporting
Limit Units MethodCOBALT 7440-48-4 A4 SCIENTIFIC 1 μg/L CLP Metals - 200.8 (ICP-MS)
COPPER 7440-50-8 A4 SCIENTIFIC 2 μg/L CLP Metals - 200.8 (ICP-MS)
VANADIUM 7440-62-2 A4 SCIENTIFIC 5 μg/L CLP Metals - 200.8 (ICP-MS)
ZINC 7440-66-6 A4 SCIENTIFIC 2 μg/L CLP Metals - 200.8 (ICP-MS)
SELENIUM 7782-49-2 A4 SCIENTIFIC 5 μg/L CLP Metals - 200.8 (ICP-MS)
Ethylbenzene 100-41-4 ALS 0.5 μg/L CLP - Volatiles
Styrene 100-42-5 ALS 0.5 μg/L CLP - Volatiles
cis-1,3-Dichloropropene 10061-01-5 ALS 0.5 μg/L CLP - Volatiles
trans-1,3-Dichloropropene 10061-02-6 ALS 0.5 μg/L CLP - Volatiles
1,4-Dichlorobenzene 106-46-7 ALS 0.5 μg/L CLP - Volatiles
1,2-Dibromoethane 106-93-4 ALS 0.5 μg/L CLP - Volatiles
1,2-Dichloroethane 107-06-2 ALS 0.5 μg/L CLP - Volatiles
4-Methyl-2-Pentanone 108-10-1 ALS 5 μg/L CLP - Volatiles
Methylcyclohexane 108-87-2 ALS 0.5 μg/L CLP - Volatiles
Toluene 108-88-3 ALS 0.5 μg/L CLP - Volatiles
Chlorobenzene 108-90-7 ALS 0.5 μg/L CLP - Volatiles
Cyclohexane 110-82-7 ALS 0.5 μg/L CLP - Volatiles
1,2,4-Trichlorobenzene 120-82-1 ALS 0.5 μg/L CLP - Volatiles
Dibromochloromethane 124-48-1 ALS 0.5 μg/L CLP - Volatiles
Tetrachloroethene 127-18-4 ALS 0.5 μg/L CLP - Volatiles
cis-1,2-Dichloroethene 156-59-2 ALS 0.5 μg/L CLP - Volatiles
trans-1,2-Dichloroethene 156-60-5 ALS 0.5 μg/L CLP - Volatiles
Methyl tert-butyl ether 1634-04-4 ALS 0.5 μg/L CLP - Volatiles
m,p-Xylene 179601-23-1 ALS 0.5 μg/L CLP - Volatiles
1,3-Dichlorobenzene 541-73-1 ALS 0.5 μg/L CLP - Volatiles
Carbon tetrachloride 56-23-5 ALS 0.5 μg/L CLP - Volatiles
2-Hexanone 591-78-6 ALS 5 μg/L CLP - Volatiles
Acetone 67-64-1 ALS 5 μg/L CLP - Volatiles
Chloroform 67-66-3 ALS 0.5 μg/L CLP - Volatiles
Benzene 71-43-2 ALS 0.5 μg/L CLP - Volatiles
1,1,1-Trichloroethane 71-55-6 ALS 0.5 μg/L CLP - Volatiles
Bromomethane 74-83-9 ALS 0.5 μg/L CLP - Volatiles
Chloromethane 74-87-3 ALS 0.5 μg/L CLP - Volatiles
Bromochloromethane 74-97-5 ALS 0.5 μg/L CLP - Volatiles
Chloroethane 75-00-3 ALS 0.5 μg/L CLP - Volatiles
Vinyl chloride 75-01-4 ALS 0.5 μg/L CLP - Volatiles
Methylene chloride 75-09-2 ALS 0.5 μg/L CLP - Volatiles
Carbon disulfide 75-15-0 ALS 0.5 μg/L CLP - Volatiles
Bromoform 75-25-2 ALS 0.5 μg/L CLP - Volatiles
Bromodichloromethane 75-27-4 ALS 0.5 μg/L CLP - Volatiles
1,1-Dichloroethane 75-34-3 ALS 0.5 μg/L CLP - Volatiles
1,1-Dichloroethene 75-35-4 ALS 0.5 μg/L CLP - Volatiles
Trichlorofluoromethane 75-69-4 ALS 0.5 μg/L CLP - Volatiles
Dichlorodifluoromethane 75-71-8 ALS 0.5 μg/L CLP - Volatiles
TDD No. 0901-01T:\START3\Pavillion Area GW Investigation\Pavillion_Area_GW_Plume_ESI\ARR\Final ARR\All_Tables.xls

Table 7Pavillion Groundwater Plume Investigation ESI Analytes
Pavillion Area Groundwater Investigation ESI – ARRRevision: 0
Date: 08/2010 Page 52 of 82
Analyte CAS Number Laboratory NameReporting
LimitReporting
Limit Units Method1,1,2-Trichloro-1,2,2-trifluoroethane 76-13-1 ALS 0.5 μg/L CLP - Volatiles
1,2-Dichloropropane 78-87-5 ALS 0.5 μg/L CLP - Volatiles
2-Butanone 78-93-3 ALS 5 μg/L CLP - Volatiles
1,1,2-Trichloroethane 79-00-5 ALS 0.5 μg/L CLP - Volatiles
Trichloroethene 79-01-6 ALS 0.5 μg/L CLP - Volatiles
Methyl acetate 79-20-9 ALS 0.5 μg/L CLP - Volatiles
1,1,2,2-Tetrachloroethane 79-34-5 ALS 0.5 μg/L CLP - Volatiles
1,2,3-Trichlorobenzene 87-61-6 ALS 0.5 μg/L CLP - Volatiles
o-Xylene 95-47-6 ALS 0.5 μg/L CLP - Volatiles
1,2-Dichlorobenzene 95-50-1 ALS 0.5 μg/L CLP - Volatiles
1,2-Dibromo-3-chloropropane 96-12-8 ALS 0.5 μg/L CLP - Volatiles
Isopropylbenzene 98-82-8 ALS 0.5 μg/L CLP - Volatiles
Heterotrophic Plate count NA Energy Laboratories 2 MFN/mL Microbiological - SM 9215
Iron Reducing Bacteria NA Energy Laboratories 100 CPU/mL Microbiological - IRB BART
Sulfur Reducing Bacteria NA Energy Laboratories Present/ Absen CPU/mL Microbiological - SRB BART
Total Purgeable Hydrocarbons NA Energy Laboratories 20 ug/L SW-846 8015B
Total Extractable Hydrocarbons NA Energy Laboratories 0.31 mg/L SW-846 8015B
1,2,4-Trichlorobenzene 120-82-1 EPA R8 Laboratory 0.5 μg/L EPA 8270D
1,2-Dichlorobenzene 95-50-1 EPA R8 Laboratory 0.5 μg/L EPA 8270D
1,3-Dichlorobenzene 541-73-1 EPA R8 Laboratory 0.5 μg/L EPA 8270D
1,4-Dichlorobenzene 106-46-7 EPA R8 Laboratory 0.5 μg/L EPA 8270D
2,4,5-Trichlorophenol 95-95-4 EPA R8 Laboratory 0.5 μg/L EPA 8270D
2,4,6-Trichlorophenol 88-06-2 EPA R8 Laboratory 0.5 μg/L EPA 8270D
2,4-Dichlorophenol 120-83-2 EPA R8 Laboratory 0.5 μg/L EPA 8270D
2,4-Dimethylphenol 105-67-9 EPA R8 Laboratory 0.5 μg/L EPA 8270D
2,4-Dinitrophenol 51-28-5 EPA R8 Laboratory 5 μg/L EPA 8270D
2,4-Dinitrotoluene 121-14-2 EPA R8 Laboratory 5 μg/L EPA 8270D
2,6-Dinitrotoluene 606-20-2 EPA R8 Laboratory 0.5 μg/L EPA 8270D
2-Chloronaphthalene 91-58-7 EPA R8 Laboratory 0.5 μg/L EPA 8270D
2-Chlorophenol 95-57-8 EPA R8 Laboratory 0.5 μg/L EPA 8270D
2-Methylnaphthalene 91-57-6 EPA R8 Laboratory 0.5 μg/L EPA 8270D
2-Methylphenol 95-48-7 EPA R8 Laboratory 0.5 μg/L EPA 8270D
2-Nitroaniline 88-74-4 EPA R8 Laboratory 0.5 μg/L EPA 8270D
2-Nitrophenol 88-75-5 EPA R8 Laboratory 0.5 μg/L EPA 8270D
3 & 4-Methylphenol 106-44-5 EPA R8 Laboratory 0.5 μg/L EPA 8270D
3-Nitroaniline 99-09-2 EPA R8 Laboratory 0.5 μg/L EPA 8270D
4,6-Dinitro-2-methylphenol 534-52-1 EPA R8 Laboratory 5 μg/L EPA 8270D
4-Bromophenyl phenyl ether 101-55-3 EPA R8 Laboratory 0.5 μg/L EPA 8270D
4-Chloro-3-methylphenol 59-50-7 EPA R8 Laboratory 0.5 μg/L EPA 8270D
4-Chloroaniline 106-47-8 EPA R8 Laboratory 0.5 μg/L EPA 8270D
4-Chlorophenyl phenyl ether 7005-72-3 EPA R8 Laboratory 0.5 μg/L EPA 8270D
4-Nitroaniline 100-01-6 EPA R8 Laboratory 0.5 μg/L EPA 8270D
4-Nitrophenol 100-02-7 EPA R8 Laboratory 5 μg/L EPA 8270D
Acenaphthene 83-32-9 EPA R8 Laboratory 0.5 μg/L EPA 8270D
TDD No. 0901-01T:\START3\Pavillion Area GW Investigation\Pavillion_Area_GW_Plume_ESI\ARR\Final ARR\All_Tables.xls

Table 7Pavillion Groundwater Plume Investigation ESI Analytes
Pavillion Area Groundwater Investigation ESI – ARRRevision: 0
Date: 08/2010 Page 53 of 82
Analyte CAS Number Laboratory NameReporting
LimitReporting
Limit Units MethodAcenaphthylene 208-96-8 EPA R8 Laboratory 0.5 μg/L EPA 8270D
Anthracene 120-12-7 EPA R8 Laboratory 0.5 μg/L EPA 8270D
Azobenzene 103-33-3 EPA R8 Laboratory 0.5 μg/L EPA 8270D
Benzo (a) anthracene 56-55-3 EPA R8 Laboratory 0.5 μg/L EPA 8270D
Benzo (a) pyrene 50-32-8 EPA R8 Laboratory 0.5 μg/L EPA 8270D
Benzo (g,h,i) perylene 191-24-2 EPA R8 Laboratory 0.5 μg/L EPA 8270D
Benzo (k) fluoranthene 207-08-9 EPA R8 Laboratory 0.5 μg/L EPA 8270D
Benzo(b)fluoranthene 205-99-2 EPA R8 Laboratory 0.5 μg/L EPA 8270D
Bis(2-chloroethoxy)methane 111-91-1 EPA R8 Laboratory 0.5 μg/L EPA 8270D
Bis(2-chloroethyl)ether 111-44-4 EPA R8 Laboratory 0.5 μg/L EPA 8270D
Bis(2-chloroisopropyl)ether 39638-32-9 EPA R8 Laboratory 0.5 μg/L EPA 8270D
Bis(2-ethylhexyl)phthalate 117-81-7 EPA R8 Laboratory 0.5 μg/L EPA 8270D
Butyl benzyl phthalate 85-68-7 EPA R8 Laboratory 0.5 μg/L EPA 8270D
Carbazole 86-74-8 EPA R8 Laboratory 0.5 μg/L EPA 8270D
Chrysene 218-01-9 EPA R8 Laboratory 0.5 μg/L EPA 8270D
Dibenz (a,h) anthracene 53-70-3 EPA R8 Laboratory 0.5 μg/L EPA 8270D
Dibenzofuran 132-64-9 EPA R8 Laboratory 0.5 μg/L EPA 8270D
Diethyl phthalate 84-66-2 EPA R8 Laboratory 0.5 μg/L EPA 8270D
Dimethyl phthalate 131-11-3 EPA R8 Laboratory 0.5 μg/L EPA 8270D
Di-n-butyl phthalate 84-74-2 EPA R8 Laboratory 0.5 μg/L EPA 8270D
Di-n-octyl phthalate 117-84-0 EPA R8 Laboratory 0.5 μg/L EPA 8270D
Fluoranthene 206-44-0 EPA R8 Laboratory 0.5 μg/L EPA 8270D
Fluorene 86-73-7 EPA R8 Laboratory 0.5 μg/L EPA 8270D
Hexachlorobenzene 118-74-1 EPA R8 Laboratory 0.5 μg/L EPA 8270D
Hexachlorobutadiene 87-68-3 EPA R8 Laboratory 0.5 μg/L EPA 8270D
Hexachlorocyclopentadiene 77-47-4 EPA R8 Laboratory 0.5 μg/L EPA 8270D
Hexachloroethane 67-72-1 EPA R8 Laboratory 0.5 μg/L EPA 8270D
Indeno (1,2,3-cd) pyrene 193-39-5 EPA R8 Laboratory 0.5 μg/L EPA 8270D
Isophorone 78-59-1 EPA R8 Laboratory 0.5 μg/L EPA 8270D
Naphthalene 91-20-3 EPA R8 Laboratory 0.5 μg/L EPA 8270D
Nitrobenzene 98-95-3 EPA R8 Laboratory 0.5 μg/L EPA 8270D
N-Nitrosodi-n-propylamine 621-64-7 EPA R8 Laboratory 0.5 μg/L EPA 8270D
Pentachlorophenol 87-86-5 EPA R8 Laboratory 0.5 μg/L EPA 8270D
Phenanthrene 85-01-8 EPA R8 Laboratory 0.5 μg/L EPA 8270D
Phenol 108-95-2 EPA R8 Laboratory 0.5 μg/L EPA 8270D
Pyrene 129-00-0 EPA R8 Laboratory 0.5 μg/L EPA 8270D
(R)-(+)-Limonene 5989-27-5 EPA R8 Laboratory 0.2 μg/L EPA 8270D
1,3-Dimethyl adamantane 702-79-4 EPA R8 Laboratory 0.2 μg/L EPA 8270D
2-Butoxyethanol 111-76-2 EPA R8 Laboratory 0.25 μg/L EPA 8270D
Tris (2-butoxyethyl) phosphate 78-51-3 EPA R8 Laboratory 0.3 μg/L EPA 8270D
Adamantane 281-23-2 EPA R8 Laboratory 0.2 μg/L EPA 8270D
Terpiniol 8000-41-7 EPA R8 Laboratory 0.2 μg/L EPA 8270D
Alkalinity NA EPA R8 Laboratory 5.0 μg/L EPA 310.1
Chloride 16887-00-6 EPA R8 Laboratory 0.5 μg/L EPA 300.0
TDD No. 0901-01T:\START3\Pavillion Area GW Investigation\Pavillion_Area_GW_Plume_ESI\ARR\Final ARR\All_Tables.xls

Table 7Pavillion Groundwater Plume Investigation ESI Analytes
Pavillion Area Groundwater Investigation ESI – ARRRevision: 0
Date: 08/2010 Page 54 of 82
Analyte CAS Number Laboratory NameReporting
LimitReporting
Limit Units MethodFluoride 16984-48-8 EPA R8 Laboratory 0.2 μg/L EPA 300.0
Nitrate as N NA EPA R8 Laboratory 0.5 μg/L EPA 300.0
Nitrite as N NA EPA R8 Laboratory 0.5 μg/L EPA 300.0
Sulfate as SO4 148-08-798 EPA R8 Laboratory 5.0 μg/L EPA 300.0
Ammonia 148-08-798 EPA R8 Laboratory 5.0 μg/L EPA 300.0
Total Phosphorus 148-08-798 EPA R8 Laboratory 5.0 μg/L EPA 300.0
Methane 74-82-8 EPA R8 Laboratory 5.0 μg/L EPA 524.2
Pentane 74-82-8 EPA R8 Laboratory 5.0 μg/L EPA 524.2
Butane NA EPA R8 Laboratory 5.0 μg/L EPA 524.2
MS/TOF Scan NA EPA R8 Laboratory TBD μg/L MS/ TOF
Isobutane NA Zymax Forensics 1.0 μg/L C3-C10 Hydrocarbons by GC/MS
Isobutene NA Zymax Forensics 1.0 μg/L C3-C10 Hydrocarbons by GC/MS
Butane NA Zymax Forensics 1.0 μg/L C3-C10 Hydrocarbons by GC/MS
3-Methyl-1-butene NA Zymax Forensics 1.0 μg/L C3-C10 Hydrocarbons by GC/MS
Isopentane NA Zymax Forensics 1.0 μg/L C3-C10 Hydrocarbons by GC/MS
1-Pentene NA Zymax Forensics 1.0 μg/L C3-C10 Hydrocarbons by GC/MS
2-Methyl-1-butene NA Zymax Forensics 1.0 μg/L C3-C10 Hydrocarbons by GC/MS
Pentane NA Zymax Forensics 1.0 μg/L C3-C10 Hydrocarbons by GC/MS
trans-2-Pentene NA Zymax Forensics 1.0 μg/L C3-C10 Hydrocarbons by GC/MS
cis-2-Pentene NA Zymax Forensics 1.0 μg/L C3-C10 Hydrocarbons by GC/MS
2-Methyl-2-butene NA Zymax Forensics 1.0 μg/L C3-C10 Hydrocarbons by GC/MS
2,2-Dimethylbutane NA Zymax Forensics 1.0 μg/L C3-C10 Hydrocarbons by GC/MS
Cyclopentene NA Zymax Forensics 1.0 μg/L C3-C10 Hydrocarbons by GC/MS
4-Methyl-1-pentene NA Zymax Forensics 1.0 μg/L C3-C10 Hydrocarbons by GC/MS
Cyclopentane NA Zymax Forensics 1.0 μg/L C3-C10 Hydrocarbons by GC/MS
2,3-Dimethylbutane NA Zymax Forensics 1.0 μg/L C3-C10 Hydrocarbons by GC/MS
2-Methylpentane NA Zymax Forensics 1.0 μg/L C3-C10 Hydrocarbons by GC/MS
3-Methylpentane NA Zymax Forensics 1.0 μg/L C3-C10 Hydrocarbons by GC/MS
Hexane NA Zymax Forensics 1.0 μg/L C3-C10 Hydrocarbons by GC/MS
trans-2-Hexene NA Zymax Forensics 1.0 μg/L C3-C10 Hydrocarbons by GC/MS
2-Methyl-2-pentene NA Zymax Forensics 1.0 μg/L C3-C10 Hydrocarbons by GC/MS
3-Methylcyclopentene NA Zymax Forensics 1.0 μg/L C3-C10 Hydrocarbons by GC/MS
3-Methyl-2-pentene NA Zymax Forensics 1.0 μg/L C3-C10 Hydrocarbons by GC/MS
cis-2-Hexene NA Zymax Forensics 1.0 μg/L C3-C10 Hydrocarbons by GC/MS
2,2-Dimethylpentane NA Zymax Forensics 1.0 μg/L C3-C10 Hydrocarbons by GC/MS
1,2-Dichloroethane (EDC) NA Zymax Forensics 1.0 μg/L C3-C10 Hydrocarbons by GC/MS
Methylcyclopentane NA Zymax Forensics 1.0 μg/L C3-C10 Hydrocarbons by GC/MS
2,4-Dimethylpentane NA Zymax Forensics 1.0 μg/L C3-C10 Hydrocarbons by GC/MS
1-Methylcyclopentene NA Zymax Forensics 1.0 μg/L C3-C10 Hydrocarbons by GC/MS
Benzene NA Zymax Forensics 1.0 μg/L C3-C10 Hydrocarbons by GC/MS
5-Methyl-1-hexene NA Zymax Forensics 1.0 μg/L C3-C10 Hydrocarbons by GC/MS
4,4-Dimethyl-2-pentene NA Zymax Forensics 1.0 μg/L C3-C10 Hydrocarbons by GC/MS
3,3-Dimethylpentane NA Zymax Forensics 1.0 μg/L C3-C10 Hydrocarbons by GC/MS
Thiophene NA Zymax Forensics 1.0 μg/L C3-C10 Hydrocarbons by GC/MS
TDD No. 0901-01T:\START3\Pavillion Area GW Investigation\Pavillion_Area_GW_Plume_ESI\ARR\Final ARR\All_Tables.xls

Table 7Pavillion Groundwater Plume Investigation ESI Analytes
Pavillion Area Groundwater Investigation ESI – ARRRevision: 0
Date: 08/2010 Page 55 of 82
Analyte CAS Number Laboratory NameReporting
LimitReporting
Limit Units MethodCyclohexane NA Zymax Forensics 1.0 μg/L C3-C10 Hydrocarbons by GC/MS
2-Methylhexane NA Zymax Forensics 1.0 μg/L C3-C10 Hydrocarbons by GC/MS
2,3-Dimethylpentane NA Zymax Forensics 1.0 μg/L C3-C10 Hydrocarbons by GC/MS
3-Methylhexane NA Zymax Forensics 1.0 μg/L C3-C10 Hydrocarbons by GC/MS
trans-1,3-Dimethylcyclopentane NA Zymax Forensics 1.0 μg/L C3-C10 Hydrocarbons by GC/MS
cis-1,3-Dimethylcyclopentane NA Zymax Forensics 1.0 μg/L C3-C10 Hydrocarbons by GC/MS
2-Methyl-1-hexene NA Zymax Forensics 1.0 μg/L C3-C10 Hydrocarbons by GC/MS
1,2-Dimethylcyclopentane NA Zymax Forensics 1.0 μg/L C3-C10 Hydrocarbons by GC/MS
2,2,4-Trimethylpentane NA Zymax Forensics 1.0 μg/L C3-C10 Hydrocarbons by GC/MS
Heptane NA Zymax Forensics 1.0 μg/L C3-C10 Hydrocarbons by GC/MS
trans-2-Heptene NA Zymax Forensics 1.0 μg/L C3-C10 Hydrocarbons by GC/MS
Methylcyclohexane NA Zymax Forensics 1.0 μg/L C3-C10 Hydrocarbons by GC/MS
2,5-Dimethylhexane NA Zymax Forensics 1.0 μg/L C3-C10 Hydrocarbons by GC/MS
2,4-Dimethylhexane NA Zymax Forensics 1.0 μg/L C3-C10 Hydrocarbons by GC/MS
2,3,4-Trimethylpentane NA Zymax Forensics 1.0 μg/L C3-C10 Hydrocarbons by GC/MS
2,3-Dimethylhexane NA Zymax Forensics 1.0 μg/L C3-C10 Hydrocarbons by GC/MS
1,2-Dibromoethane (EDB) NA Zymax Forensics 1.0 μg/L C3-C10 Hydrocarbons by GC/MS
2-Methylheptane NA Zymax Forensics 1.0 μg/L C3-C10 Hydrocarbons by GC/MS
4-Methylheptane NA Zymax Forensics 1.0 μg/L C3-C10 Hydrocarbons by GC/MS
Toluene NA Zymax Forensics 1.0 μg/L C3-C10 Hydrocarbons by GC/MS
2,3,3-Trimethylpentane NA Zymax Forensics 1.0 μg/L C3-C10 Hydrocarbons by GC/MS
3,4-Dimethylhexane NA Zymax Forensics 1.0 μg/L C3-C10 Hydrocarbons by GC/MS
2-Methylthiophene NA Zymax Forensics 1.0 μg/L C3-C10 Hydrocarbons by GC/MS
3-Ethyl-3-methylpentane NA Zymax Forensics 1.0 μg/L C3-C10 Hydrocarbons by GC/MS
3-Methylthiophene NA Zymax Forensics 1.0 μg/L C3-C10 Hydrocarbons by GC/MS
3-Methylheptane NA Zymax Forensics 1.0 μg/L C3-C10 Hydrocarbons by GC/MS
trans-1,4-Dimethylcyclohexane NA Zymax Forensics 1.0 μg/L C3-C10 Hydrocarbons by GC/MS
2-Methyl-1-heptene NA Zymax Forensics 1.0 μg/L C3-C10 Hydrocarbons by GC/MS
trans-1,2-Dimethylcyclohexane NA Zymax Forensics 1.0 μg/L C3-C10 Hydrocarbons by GC/MS
1-Octene NA Zymax Forensics 1.0 μg/L C3-C10 Hydrocarbons by GC/MS
Octane NA Zymax Forensics 1.0 μg/L C3-C10 Hydrocarbons by GC/MS
2,2-Dimethylheptane NA Zymax Forensics 1.0 μg/L C3-C10 Hydrocarbons by GC/MS
2,4,4-Trimethylhexane NA Zymax Forensics 1.0 μg/L C3-C10 Hydrocarbons by GC/MS
2,4-Dimethylheptane NA Zymax Forensics 1.0 μg/L C3-C10 Hydrocarbons by GC/MS
2,6-Dimethylheptane NA Zymax Forensics 1.0 μg/L C3-C10 Hydrocarbons by GC/MS
Ethylcyclohexane NA Zymax Forensics 1.0 μg/L C3-C10 Hydrocarbons by GC/MS
2,5-Dimethylheptane NA Zymax Forensics 1.0 μg/L C3-C10 Hydrocarbons by GC/MS
Ethylbenzene NA Zymax Forensics 1.0 μg/L C3-C10 Hydrocarbons by GC/MS
2-Ethylthiophene NA Zymax Forensics 1.0 μg/L C3-C10 Hydrocarbons by GC/MS
m,p-Xylenes NA Zymax Forensics 1.0 μg/L C3-C10 Hydrocarbons by GC/MS
3-Ethylheptane NA Zymax Forensics 1.0 μg/L C3-C10 Hydrocarbons by GC/MS
3-Methyloctane NA Zymax Forensics 1.0 μg/L C3-C10 Hydrocarbons by GC/MS
2,3-Dimethylheptane NA Zymax Forensics 1.0 μg/L C3-C10 Hydrocarbons by GC/MS
4-Methyloctane NA Zymax Forensics 1.0 μg/L C3-C10 Hydrocarbons by GC/MS
TDD No. 0901-01T:\START3\Pavillion Area GW Investigation\Pavillion_Area_GW_Plume_ESI\ARR\Final ARR\All_Tables.xls

Table 7Pavillion Groundwater Plume Investigation ESI Analytes
Pavillion Area Groundwater Investigation ESI – ARRRevision: 0
Date: 08/2010 Page 56 of 82
Analyte CAS Number Laboratory NameReporting
LimitReporting
Limit Units Method1,2,4-Trimethylcyclohexane NA Zymax Forensics 1.0 μg/L C3-C10 Hydrocarbons by GC/MS
Styrene NA Zymax Forensics 1.0 μg/L C3-C10 Hydrocarbons by GC/MS
2-Methyloctane NA Zymax Forensics 1.0 μg/L C3-C10 Hydrocarbons by GC/MS
1,1,2-Trimethylcyclohexane NA Zymax Forensics 1.0 μg/L C3-C10 Hydrocarbons by GC/MS
o-Xylene NA Zymax Forensics 1.0 μg/L C3-C10 Hydrocarbons by GC/MS
1-Nonene NA Zymax Forensics 1.0 μg/L C3-C10 Hydrocarbons by GC/MS
Nonane NA Zymax Forensics 1.0 μg/L C3-C10 Hydrocarbons by GC/MS
3,3,5-Trimethylheptane NA Zymax Forensics 1.0 μg/L C3-C10 Hydrocarbons by GC/MS
Isopropylbenzene NA Zymax Forensics 1.0 μg/L C3-C10 Hydrocarbons by GC/MS
Isopropylcyclohexane NA Zymax Forensics 1.0 μg/L C3-C10 Hydrocarbons by GC/MS
2,2-Dimethyloctane NA Zymax Forensics 1.0 μg/L C3-C10 Hydrocarbons by GC/MS
3-Methylnonane NA Zymax Forensics 1.0 μg/L C3-C10 Hydrocarbons by GC/MS
3,3-Dimethyloctane NA Zymax Forensics 1.0 μg/L C3-C10 Hydrocarbons by GC/MS
n-Propylbenzene NA Zymax Forensics 1.0 μg/L C3-C10 Hydrocarbons by GC/MS
1-Methyl-3-ethylbenzene NA Zymax Forensics 1.0 μg/L C3-C10 Hydrocarbons by GC/MS
1-Methyl-4-ethylbenzene NA Zymax Forensics 1.0 μg/L C3-C10 Hydrocarbons by GC/MS
1,3,5-Trimethylbenzene NA Zymax Forensics 1.0 μg/L C3-C10 Hydrocarbons by GC/MS
3,3,4-Trimethylheptane NA Zymax Forensics 1.0 μg/L C3-C10 Hydrocarbons by GC/MS
1-Methyl-2-ethylbenzene NA Zymax Forensics 1.0 μg/L C3-C10 Hydrocarbons by GC/MS
1,2,4-Trimethylbenzene NA Zymax Forensics 1.0 μg/L C3-C10 Hydrocarbons by GC/MS
1-Decene NA Zymax Forensics 1.0 μg/L C3-C10 Hydrocarbons by GC/MS
1-Methyl-3-isopropylbenzene NA Zymax Forensics 1.0 μg/L C3-C10 Hydrocarbons by GC/MS
Decane NA Zymax Forensics 1.0 μg/L C3-C10 Hydrocarbons by GC/MS
sec-Butylbenzene NA Zymax Forensics 1.0 μg/L C3-C10 Hydrocarbons by GC/MS
1,2,3-Trimethylbenzene NA Zymax Forensics 1.0 μg/L C3-C10 Hydrocarbons by GC/MS
Indane NA Zymax Forensics 1.0 μg/L C3-C10 Hydrocarbons by GC/MS
Indene NA Zymax Forensics 1.0 μg/L C3-C10 Hydrocarbons by GC/MS
1,3-Diethylbenzene NA Zymax Forensics 1.0 μg/L C3-C10 Hydrocarbons by GC/MS
n-Butylbenzene NA Zymax Forensics 1.0 μg/L C3-C10 Hydrocarbons by GC/MS
1,3-Dimethyl-5-ethylbenzene NA Zymax Forensics 1.0 μg/L C3-C10 Hydrocarbons by GC/MS
1,4-Diethylbenzene NA Zymax Forensics 1.0 μg/L C3-C10 Hydrocarbons by GC/MS
1-Methyl-2-propylbenzene NA Zymax Forensics 1.0 μg/L C3-C10 Hydrocarbons by GC/MS
1,4-Dimethyl-2-ethylbenzene NA Zymax Forensics 1.0 μg/L C3-C10 Hydrocarbons by GC/MS
1,3-Dimethyl-4-ethylbenzene NA Zymax Forensics 1.0 μg/L C3-C10 Hydrocarbons by GC/MS
1,2-Dimethyl-4-ethylbenzene NA Zymax Forensics 1.0 μg/L C3-C10 Hydrocarbons by GC/MS
1,3-Dimethyl-2-ethylbenzene NA Zymax Forensics 1.0 μg/L C3-C10 Hydrocarbons by GC/MS
Undecane NA Zymax Forensics 1.0 μg/L C3-C10 Hydrocarbons by GC/MS
1,2,4,5-Tetramethylbenzene NA Zymax Forensics 1.0 μg/L C3-C10 Hydrocarbons by GC/MS
1,2,3,5-Tetramethylbenzene NA Zymax Forensics 1.0 μg/L C3-C10 Hydrocarbons by GC/MS
1,2,3,4-Tetramethylbenzene NA Zymax Forensics 1.0 μg/L C3-C10 Hydrocarbons by GC/MS
Naphthalene NA Zymax Forensics 1.0 μg/L C3-C10 Hydrocarbons by GC/MS
2-Methylnaphthalene NA Zymax Forensics 1.0 μg/L C3-C10 Hydrocarbons by GC/MS
1-Methylnaphthalene NA Zymax Forensics 1.0 μg/L C3-C10 Hydrocarbons by GC/MS
Benzothiophene NA Zymax Forensics 1.0 μg/L C3-C10 Hydrocarbons by GC/MS
TDD No. 0901-01T:\START3\Pavillion Area GW Investigation\Pavillion_Area_GW_Plume_ESI\ARR\Final ARR\All_Tables.xls

Table 7Pavillion Groundwater Plume Investigation ESI Analytes
Pavillion Area Groundwater Investigation ESI – ARRRevision: 0
Date: 08/2010 Page 57 of 82
Analyte CAS Number Laboratory NameReporting
LimitReporting
Limit Units Methodn-Pentylbenzene NA Zymax Forensics 1.0 μg/L C3-C10 Hydrocarbons by GC/MS
δ13C Stable Carbon Isotopes - methane NA Zymax Forensics 0.32 1σ Stable Isotope Analysis CH4
δD - Stable Hydrogen Isotopes - methane NA Zymax Forensics 0.52 1σ Stable Isotope Analysis CH4
n-Pentane / n-Heptane NA Zymax Forensics Ratio NA Evaporation
2-Methylpentane / 2-Methylheptane NA Zymax Forensics Ratio NA Evaporation
Benzene / Cyclohexane NA Zymax Forensics Ratio NA Waterwashing
Toluene / Methylcyclohexane NA Zymax Forensics Ratio NA Waterwashing
Aromatics / Total Paraffins (n+iso+cyc) NA Zymax Forensics Ratio NA Waterwashing
Aromatics / Naphthenes NA Zymax Forensics Ratio NA Waterwashing
Olefins NA Zymax Forensics Ratio NA Biodegredation
3-Methylhexane / n-Heptane NA Zymax Forensics Ratio NA Biodegredation
Methylcyclohexane / n-Heptane NA Zymax Forensics Ratio NA Biodegredation
Isoparaffins + Naphthenes / Paraffins NA Zymax Forensics Ratio NA Biodegredation
Methylcyclohexane NA Zymax Forensics Ratio NA Octane Rating
% Paraffinic NA Zymax Forensics 0.01 % PIANO Relative Percentage
% Isoparaffinic NA Zymax Forensics 0.01 % PIANO Relative Percentage
% Aromatic NA Zymax Forensics 0.01 % PIANO Relative Percentage
% Naphthenic NA Zymax Forensics 0.01 % PIANO Relative Percentage
% Olefinic NA Zymax Forensics 0.01 % PIANO Relative Percentage
Propane NA Zymax Forensics 0.01 % C3-C44 Hydrocarbons by GC/MS
Isobutane NA Zymax Forensics 0.01 % C3-C44 Hydrocarbons by GC/MS
Isobutene NA Zymax Forensics 0.01 % C3-C44 Hydrocarbons by GC/MS
Butane/Methanol NA Zymax Forensics 0.01 % C3-C44 Hydrocarbons by GC/MS
trans-2-Butene NA Zymax Forensics 0.01 % C3-C44 Hydrocarbons by GC/MS
cis-2-Butene NA Zymax Forensics 0.01 % C3-C44 Hydrocarbons by GC/MS
3-Methyl-1-butene NA Zymax Forensics 0.01 % C3-C44 Hydrocarbons by GC/MS
Isopentane NA Zymax Forensics 0.01 % C3-C44 Hydrocarbons by GC/MS
1-Pentene NA Zymax Forensics 0.01 % C3-C44 Hydrocarbons by GC/MS
2-Methyl-1-butene NA Zymax Forensics 0.01 % C3-C44 Hydrocarbons by GC/MS
Pentane NA Zymax Forensics 0.01 % C3-C44 Hydrocarbons by GC/MS
trans-2-Pentene NA Zymax Forensics 0.01 % C3-C44 Hydrocarbons by GC/MS
cis-2-Pentene/t-Butanol NA Zymax Forensics 0.01 % C3-C44 Hydrocarbons by GC/MS
2-Methyl-2-butene NA Zymax Forensics 0.01 % C3-C44 Hydrocarbons by GC/MS
2,2-Dimethylbutane NA Zymax Forensics 0.01 % C3-C44 Hydrocarbons by GC/MS
Cyclopentane NA Zymax Forensics 0.01 % C3-C44 Hydrocarbons by GC/MS
2,3-Dimethylbutane/MTBE NA Zymax Forensics 0.01 % C3-C44 Hydrocarbons by GC/MS
2-Methylpentane NA Zymax Forensics 0.01 % C3-C44 Hydrocarbons by GC/MS
3-Methylpentane NA Zymax Forensics 0.01 % C3-C44 Hydrocarbons by GC/MS
Hexane NA Zymax Forensics 0.01 % C3-C44 Hydrocarbons by GC/MS
trans-2-Hexene NA Zymax Forensics 0.01 % C3-C44 Hydrocarbons by GC/MS
3-Methylcyclopentene NA Zymax Forensics 0.01 % C3-C44 Hydrocarbons by GC/MS
3-Methyl-2-pentene NA Zymax Forensics 0.01 % C3-C44 Hydrocarbons by GC/MS
cis-2-Hexene NA Zymax Forensics 0.01 % C3-C44 Hydrocarbons by GC/MS
3-Methyl-trans-2-pentene NA Zymax Forensics 0.01 % C3-C44 Hydrocarbons by GC/MS
TDD No. 0901-01T:\START3\Pavillion Area GW Investigation\Pavillion_Area_GW_Plume_ESI\ARR\Final ARR\All_Tables.xls

Table 7Pavillion Groundwater Plume Investigation ESI Analytes
Pavillion Area Groundwater Investigation ESI – ARRRevision: 0
Date: 08/2010 Page 58 of 82
Analyte CAS Number Laboratory NameReporting
LimitReporting
Limit Units MethodMethylcyclopentane NA Zymax Forensics 0.01 % C3-C44 Hydrocarbons by GC/MS
2,4-Dimethylpentane NA Zymax Forensics 0.01 % C3-C44 Hydrocarbons by GC/MS
Benzene NA Zymax Forensics 0.01 % C3-C44 Hydrocarbons by GC/MS
5-Methyl-1-hexene NA Zymax Forensics 0.01 % C3-C44 Hydrocarbons by GC/MS
Cyclohexane NA Zymax Forensics 0.01 % C3-C44 Hydrocarbons by GC/MS
2-Methylhexane/TAME NA Zymax Forensics 0.01 % C3-C44 Hydrocarbons by GC/MS
2,3-Dimethylpentane NA Zymax Forensics 0.01 % C3-C44 Hydrocarbons by GC/MS
3-Methylhexane NA Zymax Forensics 0.01 % C3-C44 Hydrocarbons by GC/MS
1-trans-3-Dimethylcyclopentane NA Zymax Forensics 0.01 % C3-C44 Hydrocarbons by GC/MS
1-cis-3-Dimethylcyclopentane NA Zymax Forensics 0.01 % C3-C44 Hydrocarbons by GC/MS
2,2,4-Trimethylpentane NA Zymax Forensics 0.01 % C3-C44 Hydrocarbons by GC/MS
n-Heptane NA Zymax Forensics 0.01 % C3-C44 Hydrocarbons by GC/MS
Methylcyclohexane NA Zymax Forensics 0.01 % C3-C44 Hydrocarbons by GC/MS
2,5-Dimethylhexane NA Zymax Forensics 0.01 % C3-C44 Hydrocarbons by GC/MS
2,4-Dimethylhexane NA Zymax Forensics 0.01 % C3-C44 Hydrocarbons by GC/MS
2,3,4-Trimethylpentane NA Zymax Forensics 0.01 % C3-C44 Hydrocarbons by GC/MS
Toluene/2,3,3-Trimethylpentane NA Zymax Forensics 0.01 % C3-C44 Hydrocarbons by GC/MS
2,3,3-Trimethylpentane NA Zymax Forensics 0.01 % C3-C44 Hydrocarbons by GC/MS
2,3-Dimethylhexane NA Zymax Forensics 0.01 % C3-C44 Hydrocarbons by GC/MS
2-Methylheptane NA Zymax Forensics 0.01 % C3-C44 Hydrocarbons by GC/MS
4-Methylheptane NA Zymax Forensics 0.01 % C3-C44 Hydrocarbons by GC/MS
3,4-Dimethylhexane NA Zymax Forensics 0.01 % C3-C44 Hydrocarbons by GC/MS
3-Ethyl-3-methylpentane NA Zymax Forensics 0.01 % C3-C44 Hydrocarbons by GC/MS
1,4-Dimethylcyclohexane NA Zymax Forensics 0.01 % C3-C44 Hydrocarbons by GC/MS
3-Methylheptane NA Zymax Forensics 0.01 % C3-C44 Hydrocarbons by GC/MS
2,2,5-Trimethylhexane NA Zymax Forensics 0.01 % C3-C44 Hydrocarbons by GC/MS
n-Octane NA Zymax Forensics 0.01 % C3-C44 Hydrocarbons by GC/MS
2,2-Dimethylheptane NA Zymax Forensics 0.01 % C3-C44 Hydrocarbons by GC/MS
2,4-Dimethylheptane NA Zymax Forensics 0.01 % C3-C44 Hydrocarbons by GC/MS
Ethylcyclohexane NA Zymax Forensics 0.01 % C3-C44 Hydrocarbons by GC/MS
2,6-Dimethylheptane NA Zymax Forensics 0.01 % C3-C44 Hydrocarbons by GC/MS
Ethylbenzene NA Zymax Forensics 0.01 % C3-C44 Hydrocarbons by GC/MS
m+p Xylenes NA Zymax Forensics 0.01 % C3-C44 Hydrocarbons by GC/MS
4-Methyloctane NA Zymax Forensics 0.01 % C3-C44 Hydrocarbons by GC/MS
2-Methyloctane NA Zymax Forensics 0.01 % C3-C44 Hydrocarbons by GC/MS
3-Ethylheptane NA Zymax Forensics 0.01 % C3-C44 Hydrocarbons by GC/MS
3-Methyloctane NA Zymax Forensics 0.01 % C3-C44 Hydrocarbons by GC/MS
o-Xylene NA Zymax Forensics 0.01 % C3-C44 Hydrocarbons by GC/MS
1-Nonene NA Zymax Forensics 0.01 % C3-C44 Hydrocarbons by GC/MS
n-Nonane NA Zymax Forensics 0.01 % C3-C44 Hydrocarbons by GC/MS
Isopropylbenzene NA Zymax Forensics 0.01 % C3-C44 Hydrocarbons by GC/MS
3,3,5-Trimethylheptane NA Zymax Forensics 0.01 % C3-C44 Hydrocarbons by GC/MS
2,4,5-Trimethylheptane NA Zymax Forensics 0.01 % C3-C44 Hydrocarbons by GC/MS
n-Propylbenzene NA Zymax Forensics 0.01 % C3-C44 Hydrocarbons by GC/MS
TDD No. 0901-01T:\START3\Pavillion Area GW Investigation\Pavillion_Area_GW_Plume_ESI\ARR\Final ARR\All_Tables.xls

Table 7Pavillion Groundwater Plume Investigation ESI Analytes
Pavillion Area Groundwater Investigation ESI – ARRRevision: 0
Date: 08/2010 Page 59 of 82
Analyte CAS Number Laboratory NameReporting
LimitReporting
Limit Units Method1-Methyl-3-ethylbenzene NA Zymax Forensics 0.01 % C3-C44 Hydrocarbons by GC/MS
1-Methyl-4-ethylbenzene NA Zymax Forensics 0.01 % C3-C44 Hydrocarbons by GC/MS
1,3,5-Trimethylbenzene NA Zymax Forensics 0.01 % C3-C44 Hydrocarbons by GC/MS
3,3,4-Trimethylheptane NA Zymax Forensics 0.01 % C3-C44 Hydrocarbons by GC/MS
1-Methyl-2-ethylbenzene NA Zymax Forensics 0.01 % C3-C44 Hydrocarbons by GC/MS
3-Methylnonane NA Zymax Forensics 0.01 % C3-C44 Hydrocarbons by GC/MS
1,2,4-Trimethylbenzene NA Zymax Forensics 0.01 % C3-C44 Hydrocarbons by GC/MS
Isobutylbenzene NA Zymax Forensics 0.01 % C3-C44 Hydrocarbons by GC/MS
sec-Butylbenzene NA Zymax Forensics 0.01 % C3-C44 Hydrocarbons by GC/MS
n-Decane NA Zymax Forensics 0.01 % C3-C44 Hydrocarbons by GC/MS
1,2,3-Trimethylbenzene NA Zymax Forensics 0.01 % C3-C44 Hydrocarbons by GC/MS
Indan NA Zymax Forensics 0.01 % C3-C44 Hydrocarbons by GC/MS
1,3-Diethylbenzene NA Zymax Forensics 0.01 % C3-C44 Hydrocarbons by GC/MS
1,4-Diethylbenzene NA Zymax Forensics 0.01 % C3-C44 Hydrocarbons by GC/MS
n-Butylbenzene NA Zymax Forensics 0.01 % C3-C44 Hydrocarbons by GC/MS
1,3-Dimethyl-5-ethylbenzene NA Zymax Forensics 0.01 % C3-C44 Hydrocarbons by GC/MS
1,4-Dimethyl-2-ethylbenzene NA Zymax Forensics 0.01 % C3-C44 Hydrocarbons by GC/MS
1,3-Dimethyl-4-ethylbenzene NA Zymax Forensics 0.01 % C3-C44 Hydrocarbons by GC/MS
1,2-Dimethyl-4-ethylbenzene NA Zymax Forensics 0.01 % C3-C44 Hydrocarbons by GC/MS
Undecene NA Zymax Forensics 0.01 % C3-C44 Hydrocarbons by GC/MS
1,2,4,5-Tetramethylbenzene NA Zymax Forensics 0.01 % C3-C44 Hydrocarbons by GC/MS
1,2,3,5-Tetramethylbenzene NA Zymax Forensics 0.01 % C3-C44 Hydrocarbons by GC/MS
1,2,3,4-Tetramethylbenzene NA Zymax Forensics 0.01 % C3-C44 Hydrocarbons by GC/MS
Naphthalene NA Zymax Forensics 0.01 % C3-C44 Hydrocarbons by GC/MS
2-Methyl-naphthalene NA Zymax Forensics 0.01 % C3-C44 Hydrocarbons by GC/MS
1-Methyl-naphthalene NA Zymax Forensics 0.01 % C3-C44 Hydrocarbons by GC/MS
Oxygen NA Zymax Forensics 0.01 % C3-C44 Hydrocarbons by GC/MS
Nitrogen NA Zymax Forensics 0.01 % C3-C44 Hydrocarbons by GC/MS
Carbon Disulfide NA Zymax Forensics 0.01 % C3-C44 Hydrocarbons by GC/MS
Hydrogen Sulfide NA Zymax Forensics 0.01 % C3-C44 Hydrocarbons by GC/MS
Methane NA Zymax Forensics 0.01 % Gas Analysis ASTM D 1945/3588
Ethane NA Zymax Forensics 0.01 % Gas Analysis ASTM D 1945/3588
Propane NA Zymax Forensics 0.01 % Gas Analysis ASTM D 1945/3588
i-Butane NA Zymax Forensics 0.01 % Gas Analysis ASTM D 1945/3588
n-Butane NA Zymax Forensics 0.01 % Gas Analysis ASTM D 1945/3588
neo-Pentane NA Zymax Forensics 0.01 % Gas Analysis ASTM D 1945/3588
i-Pentane NA Zymax Forensics 0.01 % Gas Analysis ASTM D 1945/3588
n-Pentane NA Zymax Forensics 0.01 % Gas Analysis ASTM D 1945/3588
2,2-Dimethylbutane NA Zymax Forensics 0.01 % Gas Analysis ASTM D 1945/3588
2,3-Dimethylbutane NA Zymax Forensics 0.01 % Gas Analysis ASTM D 1945/3588
2-Methylpentane NA Zymax Forensics 0.01 % Gas Analysis ASTM D 1945/3588
3-Methylpentane NA Zymax Forensics 0.01 % Gas Analysis ASTM D 1945/3588
n-Hexane NA Zymax Forensics 0.01 % Gas Analysis ASTM D 1945/3588
Methane NA Zymax Forensics 0.05 ppm v/v Gas Analysis EPA Method 18
TDD No. 0901-01T:\START3\Pavillion Area GW Investigation\Pavillion_Area_GW_Plume_ESI\ARR\Final ARR\All_Tables.xls

Table 7Pavillion Groundwater Plume Investigation ESI Analytes
Pavillion Area Groundwater Investigation ESI – ARRRevision: 0
Date: 08/2010 Page 60 of 82
Analyte CAS Number Laboratory NameReporting
LimitReporting
Limit Units MethodEthane NA Zymax Forensics 0.05 ppm v/v Gas Analysis EPA Method 18
Propanes NA Zymax Forensics 0.05 ppm v/v Gas Analysis EPA Method 18
Butanes NA Zymax Forensics 0.05 ppm v/v Gas Analysis EPA Method 18
Pentanes NA Zymax Forensics 0.05 ppm v/v Gas Analysis EPA Method 18
Hexanes NA Zymax Forensics 0.05 ppm v/v Gas Analysis EPA Method 18
Heptanes NA Zymax Forensics 0.05 ppm v/v Gas Analysis EPA Method 18
Octanes NA Zymax Forensics 0.05 ppm v/v Gas Analysis EPA Method 18
Nonanes NA Zymax Forensics 0.05 ppm v/v Gas Analysis EPA Method 18Decanes NA Zymax Forensics 0.05 ppm v/v Gas Analysis EPA Method 18
TDD No. 0901-01T:\START3\Pavillion Area GW Investigation\Pavillion_Area_GW_Plume_ESI\ARR\Final ARR\All_Tables.xls
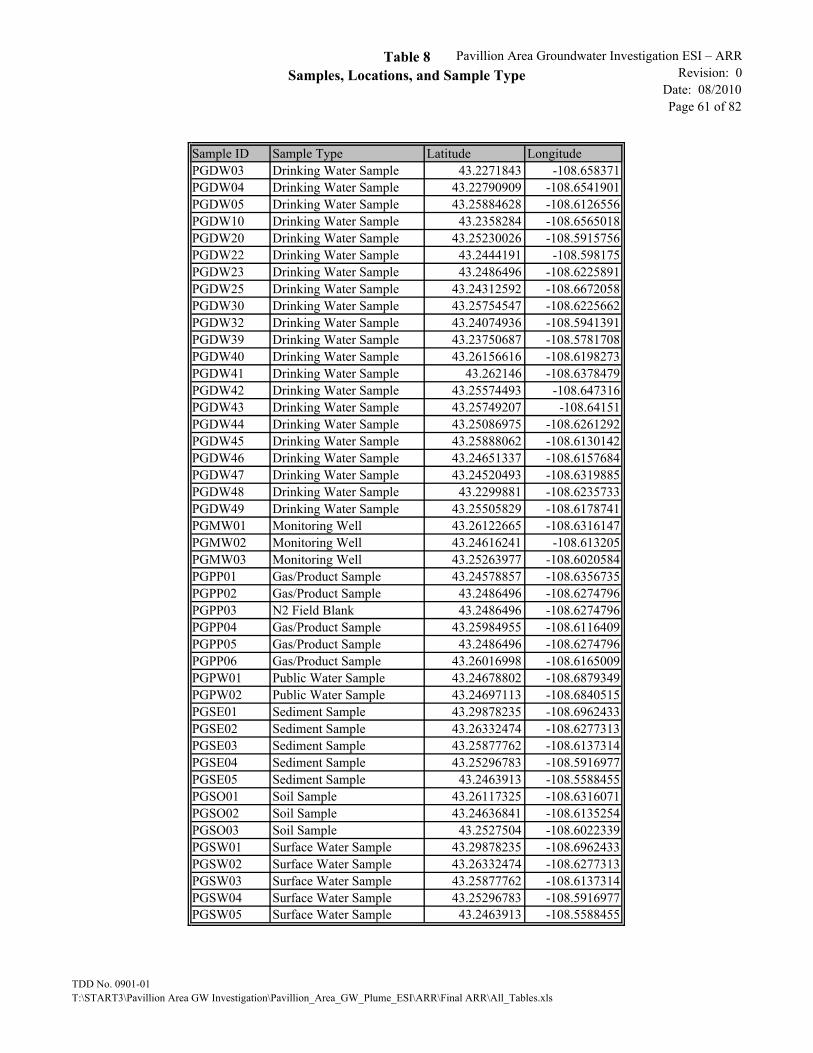
Table 8Samples, Locations, and Sample Type
Pavillion Area Groundwater Investigation ESI – ARRRevision: 0
Date: 08/2010 Page 61 of 82
Sample ID Sample Type Latitude LongitudePGDW03 Drinking Water Sample 43.2271843 -108.658371PGDW04 Drinking Water Sample 43.22790909 -108.6541901PGDW05 Drinking Water Sample 43.25884628 -108.6126556PGDW10 Drinking Water Sample 43.2358284 -108.6565018PGDW20 Drinking Water Sample 43.25230026 -108.5915756PGDW22 Drinking Water Sample 43.2444191 -108.598175PGDW23 Drinking Water Sample 43.2486496 -108.6225891PGDW25 Drinking Water Sample 43.24312592 -108.6672058PGDW30 Drinking Water Sample 43.25754547 -108.6225662PGDW32 Drinking Water Sample 43.24074936 -108.5941391PGDW39 Drinking Water Sample 43.23750687 -108.5781708PGDW40 Drinking Water Sample 43.26156616 -108.6198273PGDW41 Drinking Water Sample 43.262146 -108.6378479PGDW42 Drinking Water Sample 43.25574493 -108.647316PGDW43 Drinking Water Sample 43.25749207 -108.64151PGDW44 Drinking Water Sample 43.25086975 -108.6261292PGDW45 Drinking Water Sample 43.25888062 -108.6130142PGDW46 Drinking Water Sample 43.24651337 -108.6157684PGDW47 Drinking Water Sample 43.24520493 -108.6319885PGDW48 Drinking Water Sample 43.2299881 -108.6235733PGDW49 Drinking Water Sample 43.25505829 -108.6178741PGMW01 Monitoring Well 43.26122665 -108.6316147PGMW02 Monitoring Well 43.24616241 -108.613205PGMW03 Monitoring Well 43.25263977 -108.6020584PGPP01 Gas/Product Sample 43.24578857 -108.6356735PGPP02 Gas/Product Sample 43.2486496 -108.6274796PGPP03 N2 Field Blank 43.2486496 -108.6274796PGPP04 Gas/Product Sample 43.25984955 -108.6116409PGPP05 Gas/Product Sample 43.2486496 -108.6274796PGPP06 Gas/Product Sample 43.26016998 -108.6165009PGPW01 Public Water Sample 43.24678802 -108.6879349PGPW02 Public Water Sample 43.24697113 -108.6840515PGSE01 Sediment Sample 43.29878235 -108.6962433PGSE02 Sediment Sample 43.26332474 -108.6277313PGSE03 Sediment Sample 43.25877762 -108.6137314PGSE04 Sediment Sample 43.25296783 -108.5916977PGSE05 Sediment Sample 43.2463913 -108.5588455PGSO01 Soil Sample 43.26117325 -108.6316071PGSO02 Soil Sample 43.24636841 -108.6135254PGSO03 Soil Sample 43.2527504 -108.6022339PGSW01 Surface Water Sample 43.29878235 -108.6962433PGSW02 Surface Water Sample 43.26332474 -108.6277313PGSW03 Surface Water Sample 43.25877762 -108.6137314PGSW04 Surface Water Sample 43.25296783 -108.5916977PGSW05 Surface Water Sample 43.2463913 -108.5588455
TDD No. 0901-01T:\START3\Pavillion Area GW Investigation\Pavillion_Area_GW_Plume_ESI\ARR\Final ARR\All_Tables.xls
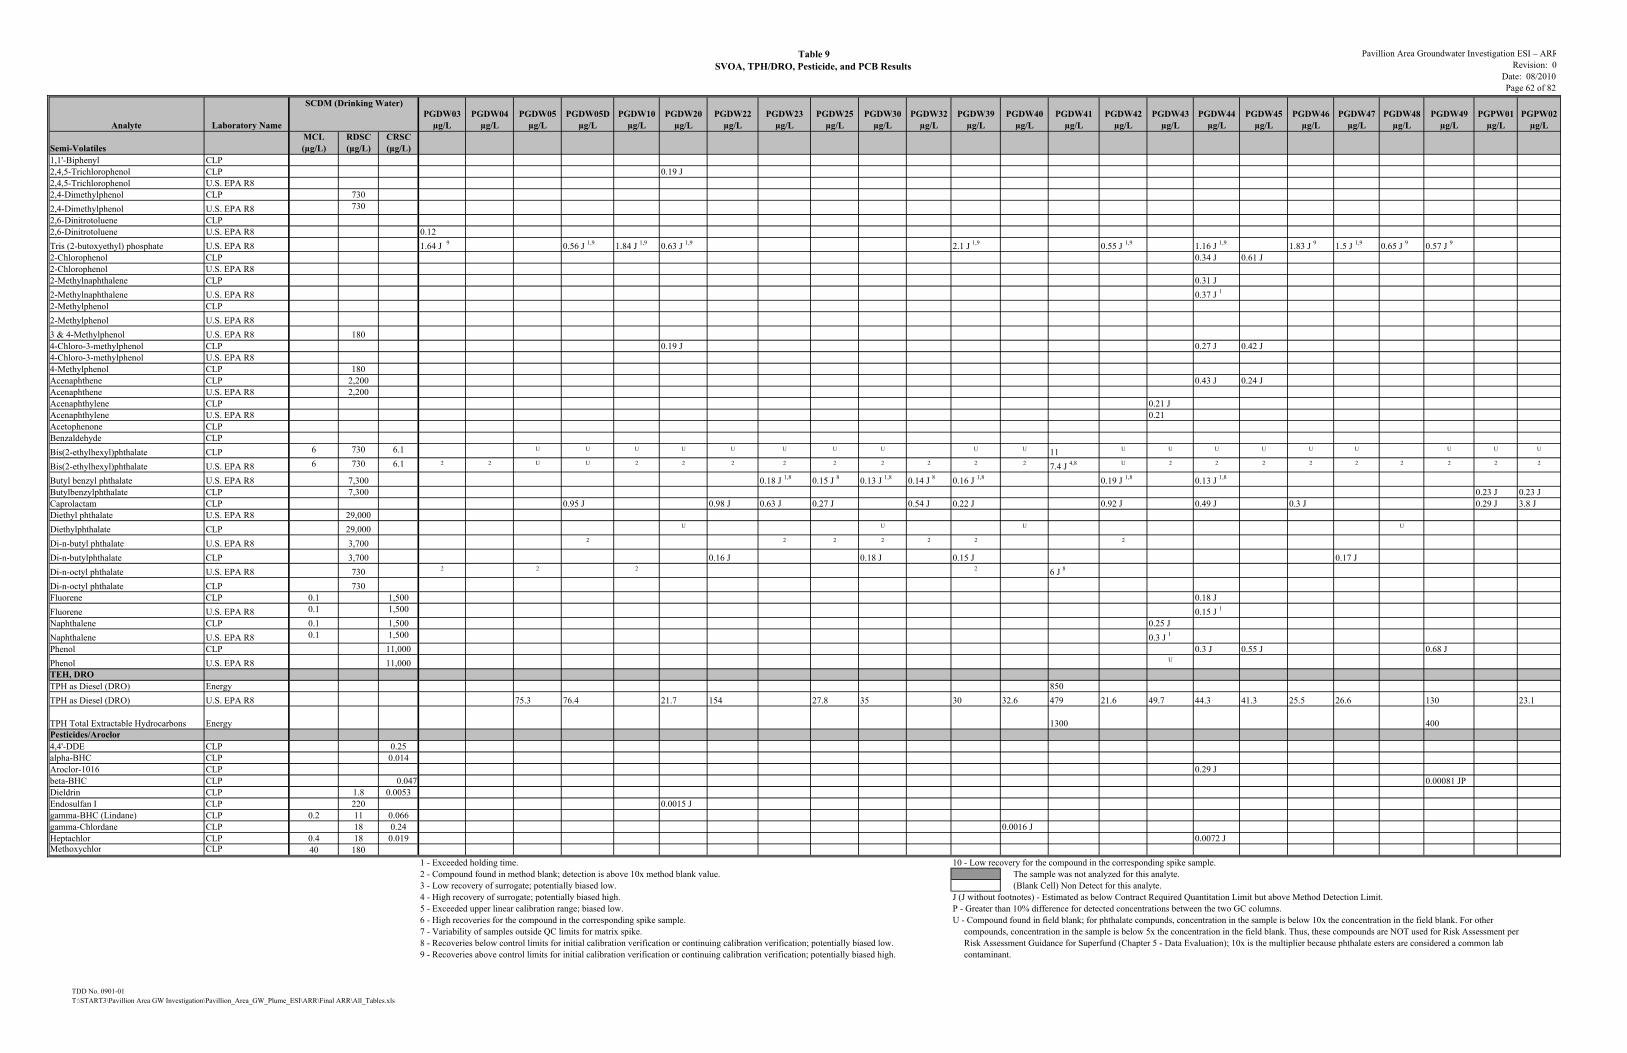
Table 9SVOA, TPH/DRO, Pesticide, and PCB Results
Pavillion Area Groundwater Investigation ESI – ARRRevision: 0
Date: 08/2010 Page 62 of 82
Analyte Laboratory NamePGDW03
µg/LPGDW04
µg/LPGDW05
µg/LPGDW05D
µg/LPGDW10
µg/LPGDW20
µg/LPGDW22
µg/LPGDW23
µg/LPGDW25
µg/LPGDW30
µg/LPGDW32
µg/LPGDW39
µg/LPGDW40
µg/LPGDW41
µg/LPGDW42
µg/LPGDW43
µg/LPGDW44
µg/LPGDW45
µg/LPGDW46
µg/LPGDW47
µg/LPGDW48
µg/LPGDW49
µg/LPGPW01
µg/LPGPW02
µg/L
Semi-VolatilesMCL(µg/L)
RDSC(µg/L)
CRSC(µg/L)
1,1'-Biphenyl CLP2,4,5-Trichlorophenol CLP 0.19 J2,4,5-Trichlorophenol U.S. EPA R82,4-Dimethylphenol CLP 730
2,4-Dimethylphenol U.S. EPA R8 730
2,6-Dinitrotoluene CLP2,6-Dinitrotoluene U.S. EPA R8 0.12
Tris (2-butoxyethyl) phosphate U.S. EPA R8 1.64 J 9 0.56 J 1,9 1.84 J 1,9 0.63 J 1,9 2.1 J 1,9 0.55 J 1,9 1.16 J 1,9 1.83 J 9 1.5 J 1,9 0.65 J 9 0.57 J 9
2-Chlorophenol CLP 0.34 J 0.61 J2-Chlorophenol U.S. EPA R82-Methylnaphthalene CLP 0.31 J
2-Methylnaphthalene U.S. EPA R8 0.37 J 1
2-Methylphenol CLP
2-Methylphenol U.S. EPA R8
3 & 4-Methylphenol U.S. EPA R8 1804-Chloro-3-methylphenol CLP 0.19 J 0.27 J 0.42 J4-Chloro-3-methylphenol U.S. EPA R84-Methylphenol CLP 180Acenaphthene CLP 2,200 0.43 J 0.24 JAcenaphthene U.S. EPA R8 2,200Acenaphthylene CLP 0.21 JAcenaphthylene U.S. EPA R8 0.21Acetophenone CLPBenzaldehyde CLP
Bis(2-ethylhexyl)phthalate CLP 6 730 6.1 U U U U U U U U U U 11 U U U U U U U U U
Bis(2-ethylhexyl)phthalate U.S. EPA R8 6 730 6.1 2 2 U U 2 2 2 2 2 2 2 2 2 7.4 J 4,8 U 2 2 2 2 2 2 2 2 2
Butyl benzyl phthalate U.S. EPA R8 7,300 0.18 J 1,8 0.15 J 8 0.13 J 1,8 0.14 J 8 0.16 J 1,8 0.19 J 1,8 0.13 J 1,8
Butylbenzylphthalate CLP 7,300 0.23 J 0.23 JCaprolactam CLP 0.95 J 0.98 J 0.63 J 0.27 J 0.54 J 0.22 J 0.92 J 0.49 J 0.3 J 0.29 J 3.8 JDiethyl phthalate U.S. EPA R8 29,000
Diethylphthalate CLP 29,000 U U U U
Di-n-butyl phthalate U.S. EPA R8 3,700 2 2 2 2 2 2 2
Di-n-butylphthalate CLP 3,700 0.16 J 0.18 J 0.15 J 0.17 J
Di-n-octyl phthalate U.S. EPA R8 730 2 2 2 2 6 J 8
Di-n-octyl phthalate CLP 730Fluorene CLP 0.1 1,500 0.18 J
Fluorene U.S. EPA R8 0.1 1,500 0.15 J 1
Naphthalene CLP 0.1 1,500 0.25 J
Naphthalene U.S. EPA R8 0.1 1,500 0.3 J 1
Phenol CLP 11,000 0.3 J 0.55 J 0.68 J
Phenol U.S. EPA R8 11,000 U
TEH, DROTPH as Diesel (DRO) Energy 850
TPH as Diesel (DRO) U.S. EPA R8 75.3 76.4 21.7 154 27.8 35 30 32.6 479 21.6 49.7 44.3 41.3 25.5 26.6 130 23.1
TPH Total Extractable Hydrocarbons Energy 1300 400Pesticides/Aroclor4,4'-DDE CLP 0.25alpha-BHC CLP 0.014Aroclor-1016 CLP 0.29 Jbeta-BHC CLP 0.047 0.00081 JPDieldrin CLP 1.8 0.0053Endosulfan I CLP 220 0.0015 Jgamma-BHC (Lindane) CLP 0.2 11 0.066gamma-Chlordane CLP 18 0.24 0.0016 JHeptachlor CLP 0.4 18 0.019 0.0072 JMethoxychlor CLP 40 180
1 - Exceeded holding time. 10 - Low recovery for the compound in the corresponding spike sample.2 - Compound found in method blank; detection is above 10x method blank value. The sample was not analyzed for this analyte.3 - Low recovery of surrogate; potentially biased low. (Blank Cell) Non Detect for this analyte.4 - High recovery of surrogate; potentially biased high. J (J without footnotes) - Estimated as below Contract Required Quantitation Limit but above Method Detection Limit.5 - Exceeded upper linear calibration range; biased low. P - Greater than 10% difference for detected concentrations between the two GC columns.6 - High recoveries for the compound in the corresponding spike sample. U - Compound found in field blank; for phthalate compunds, concentration in the sample is below 10x the concentration in the field blank. For other 7 - Variability of samples outside QC limits for matrix spike. compounds, concentration in the sample is below 5x the concentration in the field blank. Thus, these compounds are NOT used for Risk Assessment per 8 - Recoveries below control limits for initial calibration verification or continuing calibration verification; potentially biased low. Risk Assessment Guidance for Superfund (Chapter 5 - Data Evaluation); 10x is the multiplier because phthalate esters are considered a common lab 9 - Recoveries above control limits for initial calibration verification or continuing calibration verification; potentially biased high. contaminant.
SCDM (Drinking Water)
TDD No. 0901-01T:\START3\Pavillion Area GW Investigation\Pavillion_Area_GW_Plume_ESI\ARR\Final ARR\All_Tables.xls

Table 9SVOA, TPH/DRO, Pesticide, and PCB Results
Pavillion Area Groundwater Investigation ESI – ARRRevision: 0
Date: 08/2010 Page 63 of 82
Analyte Laboratory Name
Semi-VolatilesMCL(µg/L)
RDSC(µg/L)
CRSC(µg/L)
1,1'-Biphenyl CLP2,4,5-Trichlorophenol CLP2,4,5-Trichlorophenol U.S. EPA R82,4-Dimethylphenol CLP 730
2,4-Dimethylphenol U.S. EPA R8 730
2,6-Dinitrotoluene CLP2,6-Dinitrotoluene U.S. EPA R8
Tris (2-butoxyethyl) phosphate U.S. EPA R82-Chlorophenol CLP2-Chlorophenol U.S. EPA R82-Methylnaphthalene CLP
2-Methylnaphthalene U.S. EPA R82-Methylphenol CLP
2-Methylphenol U.S. EPA R8
3 & 4-Methylphenol U.S. EPA R8 1804-Chloro-3-methylphenol CLP4-Chloro-3-methylphenol U.S. EPA R84-Methylphenol CLP 180Acenaphthene CLP 2,200Acenaphthene U.S. EPA R8 2,200Acenaphthylene CLPAcenaphthylene U.S. EPA R8Acetophenone CLPBenzaldehyde CLP
Bis(2-ethylhexyl)phthalate CLP 6 730 6.1
Bis(2-ethylhexyl)phthalate U.S. EPA R8 6 730 6.1
Butyl benzyl phthalate U.S. EPA R8 7,300Butylbenzylphthalate CLP 7,300Caprolactam CLPDiethyl phthalate U.S. EPA R8 29,000
Diethylphthalate CLP 29,000
Di-n-butyl phthalate U.S. EPA R8 3,700
Di-n-butylphthalate CLP 3,700
Di-n-octyl phthalate U.S. EPA R8 730
Di-n-octyl phthalate CLP 730Fluorene CLP 0.1 1,500
Fluorene U.S. EPA R8 0.1 1,500
Naphthalene CLP 0.1 1,500
Naphthalene U.S. EPA R8 0.1 1,500
Phenol CLP 11,000
Phenol U.S. EPA R8 11,000TEH, DROTPH as Diesel (DRO) Energy
TPH as Diesel (DRO) U.S. EPA R8
TPH Total Extractable Hydrocarbons EnergyPesticides/Aroclor4,4'-DDE CLP 0.25alpha-BHC CLP 0.014Aroclor-1016 CLPbeta-BHC CLP 0.047Dieldrin CLP 1.8 0.0053Endosulfan I CLP 220gamma-BHC (Lindane) CLP 0.2 11 0.066gamma-Chlordane CLP 18 0.24Heptachlor CLP 0.4 18 0.019Methoxychlor CLP 40 180
SCDM (Drinking Water)PGFB01
µg/LPGFM20
µg/LPGMW01
µg/LPGMW01D
µg/LPGMW02
µg/LPGMW03
µg/LPGPP01
µg/LPGPP04P
µg/LPGPP05
µg/LPGPP06
µg/LPGSE01
µg/kgPGSE02
µg/kgPGSE02D
µg/kgPGSE03
µg/kgPGSE04
µg/kgPGSE05
µg/kgPGSO01
µg/kgPGSO02
µg/kgPGSO03
µg/kgPGSW01
µg/LPGSW02
µg/LPGSW02D
µg/LPGSW03
µg/LPGSW04
µg/LPGSW05
µg/L
0.86 J 1 J 0.76 J
1.6 J 5.6 J 39 J 5 J
12.7 5000 J 1
10 10 10 10
2.4 J 8.8 74 13
10.8 1 17.1 17 5400 J 1 110000 J 1
4.2 J 0.38 J
4.8 7760 J 1
12.8 6760 J 1, 8
0.39 J 24 J 3.5 J
41 J 73 J 34 J 64 J 66 J 54 J18 J 44 J 23 J 30 J 22 J
0.64 J U U U U U U U
0.58 J 1,8 500 J 1,8 6.5 J 8 7.46 J 8 U 28.8 J 8 2 2 2 10.3 J 8 U U
0.15 J 1,8 0.16 J 8
0.21 J0.89 J 2.3 J
0.18
0.36 J U U U
220 J 1,8 0.15 J 1 0.14 J
0.22 J
440 J 1,8 0.14 J 8
7.1 14 170 61 10 J
2.2 2.15 J 5 179 J 1 57.5 J 5 3430 J 1 30000 J 1 37800 J 1 210 J 1
12 15 41 J 2.3 J 17 J 36 J 23 J 29 J 24 J
0.13 J 1 5.6 7.13 J 5 22.5 6960 J 1
1200 600 39000 5200 1760000 841000 178000
26.5 J 1, # 752 638 J 2 1230 J 4 62100 4830 J 4 1720 538 151 108 103 207 J 2 102 90 86.6
1600 810 42000 5900 49000 53000 17000 2340000 1440000 243000
0.13 J 0.17 J 0.15 J 0.12 J0.016 J
0.016 J 0.029 J 0.019 J 0.0065 J 0.065 J 0.14 J 0.17 J 0.41 J 0.4 J0.002 J
0.0056 J
0.16 J1.1 J
TDD No. 0901-01T:\START3\Pavillion Area GW Investigation\Pavillion_Area_GW_Plume_ESI\ARR\Final ARR\All_Tables.xls

Table 10VOA and TPH/GRO Results
Pavillion Area Groundwater Investigation ESI – ARRRevision: 0
Date: 08/2010 Page 64 of 82
Analyte Laboratory NamePGDW03
µg/LPGDW04
µg/LPGDW05
µg/LPGDW05D
µg/LPGDW10
µg/LPGDW20
µg/LPGDW22
µg/LPGDW23
µg/LPGDW25
µg/LPGDW30
µg/LPGDW32
µg/LPGDW39
µg/LPGDW40
µg/LPGDW41
µg/LPGDW42
µg/LPGDW43
µg/LPGDW44
µg/LPGDW45
µg/LPGDW46
µg/LPGDW47
µg/LPGDW48
µg/L
Volatile Organic AnalysisMCL(µg/L)
RDSC(µg/L)
CRSC(µg/L)
1,1,2-Trichloro-1,2,2-trifluoroethane CLP 0.38 J
1,2,4-Trimethylbenzene U.S. EPA R8
1,3,5-Trimethylbenzene U.S. EPA R8
1,3-Dimethyl adamantane U.S. EPA R8 1.74 J 1 1.71 J 1 1.81 J 1 0.36 J 1
2-Butanone (MEK) CLP 22,000Acetone CLP 33,000
Adamantane U.S. EPA R8 0.21 J 1 0.21 J 1 0.3 J 1,4
Benzene CLP 5 150 1.5
Benzene U.S. EPA R8 5 150 1.5 0.54 J 1
Carbon disulfide CLP 3,700
Carbon disulfide U.S. EPA R8 3,700
Chloroform CLP 360
Chloroform U.S. EPA R8 360 0.24 J 1
Chloromethane CLP 0.27 JChloromethane U.S. EPA R8Cyclohexane CLPEthane U.S. EPA R8 10.9
Ethylbenzene CLP 700 3,700
Ethylbenzene U.S. EPA R8 700 3,700
Isopropylbenzene CLP 3,700
Isopropylbenzene U.S. EPA R8 3,700
m,p-Xylene CLP 10,000 73,000
m,p-Xylene U.S. EPA R8 10,000 73,000
Methane U.S. EPA R8 5.44 J 1 1 1 172 1 149 J 1 808 J 1 36.3 98.9 60 1 1
Methylcyclohexane CLPMethylene chloride CLP 5 2,200 11
Methylene chloride U.S. EPA R8 5 2,200 11
n-Butyl Benzene U.S. EPA R8
n-Propyl Benzene U.S. EPA R8
o-Xylene CLP 10,000 73,000
o-Xylene U.S. EPA R8 10,000 73,000
p-Isopropyltoluene U.S. EPA R8Propane U.S. EPA R8
sec-Butylbenzene U.S. EPA R8Styrene CLP 100 7,300
Styrene U.S. EPA R8 100 7,300 0.14 J 1
tert-Butylbenzene U.S. EPA R8
Toluene CLP 1,000 7,300 0.51
Toluene U.S. EPA R8
1,000 7,300
TPH, GROTPH as Gasoline (GRO) Energy
TPH as Gasoline (GRO) U.S. EPA R8 26.3 31.1 22.6
TPH Total Purgeable Hydrocarbons Energy 49 47 36
1 - Exceeded holding time.2 - Compound found in method blank; detection is above 10x method blank value.3 - Low recovery of surrogate; potentially biased low.4 - High recovery of surrogate; potentially biased high.5 - Exceeded upper linear calibration range; biased low.6 - High recoveries for the compound in the corresponding spike sample.7 - Variability of samples outside QC limits for matrix spike.8 - Recoveries below control limits for initial calibration verification or continuing calibration verification; potentially biased low.9 - Recoveries above control limits for initial calibration verification or continuing calibration verification; potentially biased high.10 - Low recovery for the compound in the corresponding spike sample.
The sample was not analyzed for this analyte. (Blank Cell) Non Detect for this analyte.
D - Diluted.J - Estimated as below Contract Required Quantitation Limit but above Method Detection Limit.
SCDM (Drinking Water)
TDD No. 0901-01T:\START3\Pavillion Area GW Investigation\Pavillion_Area_GW_Plume_ESI\ARR\Final ARR\All_Tables.xls
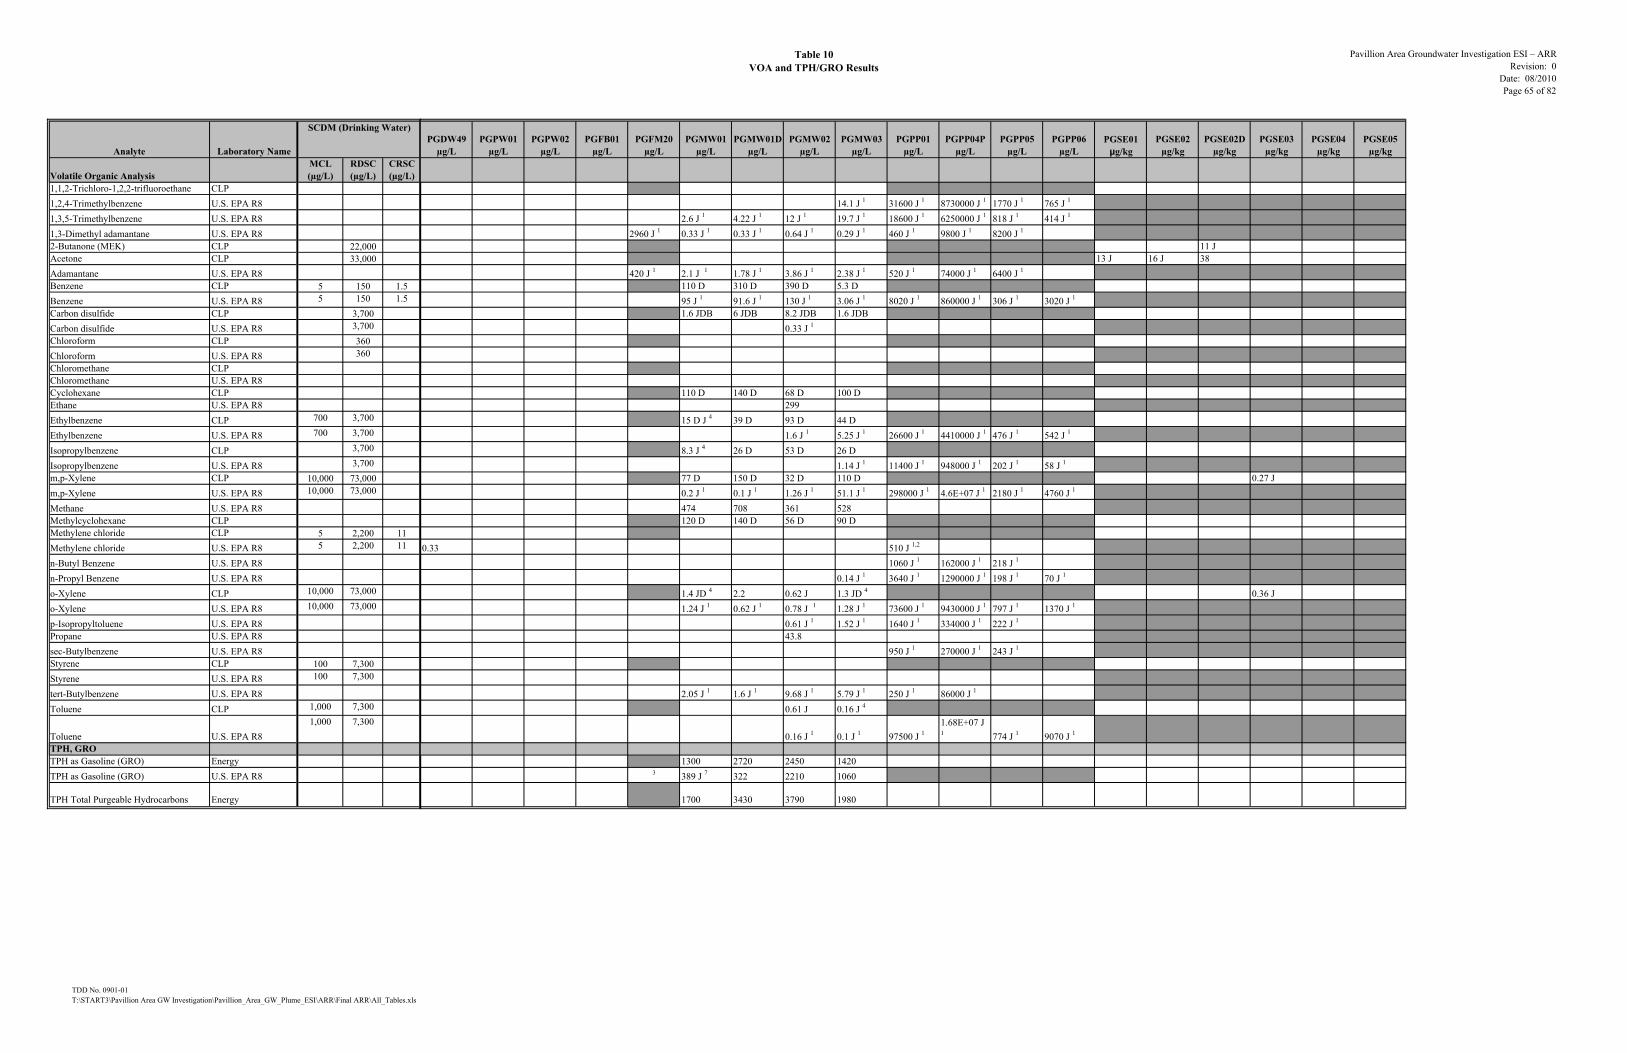
Table 10VOA and TPH/GRO Results
Pavillion Area Groundwater Investigation ESI – ARRRevision: 0
Date: 08/2010 Page 65 of 82
Analyte Laboratory Name
Volatile Organic AnalysisMCL(µg/L)
RDSC(µg/L)
CRSC(µg/L)
1,1,2-Trichloro-1,2,2-trifluoroethane CLP
1,2,4-Trimethylbenzene U.S. EPA R8
1,3,5-Trimethylbenzene U.S. EPA R8
1,3-Dimethyl adamantane U.S. EPA R82-Butanone (MEK) CLP 22,000Acetone CLP 33,000
Adamantane U.S. EPA R8Benzene CLP 5 150 1.5
Benzene U.S. EPA R8 5 150 1.5
Carbon disulfide CLP 3,700
Carbon disulfide U.S. EPA R8 3,700
Chloroform CLP 360
Chloroform U.S. EPA R8 360
Chloromethane CLPChloromethane U.S. EPA R8Cyclohexane CLPEthane U.S. EPA R8
Ethylbenzene CLP 700 3,700
Ethylbenzene U.S. EPA R8 700 3,700
Isopropylbenzene CLP 3,700
Isopropylbenzene U.S. EPA R8 3,700
m,p-Xylene CLP 10,000 73,000
m,p-Xylene U.S. EPA R8 10,000 73,000
Methane U.S. EPA R8Methylcyclohexane CLPMethylene chloride CLP 5 2,200 11
Methylene chloride U.S. EPA R8 5 2,200 11
n-Butyl Benzene U.S. EPA R8
n-Propyl Benzene U.S. EPA R8
o-Xylene CLP 10,000 73,000
o-Xylene U.S. EPA R8 10,000 73,000
p-Isopropyltoluene U.S. EPA R8Propane U.S. EPA R8
sec-Butylbenzene U.S. EPA R8Styrene CLP 100 7,300
Styrene U.S. EPA R8 100 7,300
tert-Butylbenzene U.S. EPA R8
Toluene CLP 1,000 7,300
Toluene U.S. EPA R8
1,000 7,300
TPH, GROTPH as Gasoline (GRO) Energy
TPH as Gasoline (GRO) U.S. EPA R8
TPH Total Purgeable Hydrocarbons Energy
SCDM (Drinking Water)PGDW49
µg/LPGPW01
µg/LPGPW02
µg/LPGFB01
µg/LPGFM20
µg/LPGMW01
µg/LPGMW01D
µg/LPGMW02
µg/LPGMW03
µg/LPGPP01
µg/LPGPP04P
µg/LPGPP05
µg/LPGPP06
µg/LPGSE01
µg/kgPGSE02
µg/kgPGSE02D
µg/kgPGSE03
µg/kgPGSE04
µg/kgPGSE05
µg/kg
14.1 J 1 31600 J 1 8730000 J 1 1770 J 1 765 J 1
2.6 J 1 4.22 J 1 12 J 1 19.7 J 1 18600 J 1 6250000 J 1 818 J 1 414 J 1
2960 J 1 0.33 J 1 0.33 J 1 0.64 J 1 0.29 J 1 460 J 1 9800 J 1 8200 J 1
11 J13 J 16 J 38
420 J 1 2.1 J 1 1.78 J 1 3.86 J 1 2.38 J 1 520 J 1 74000 J 1 6400 J 1
110 D 310 D 390 D 5.3 D
95 J 1 91.6 J 1 130 J 1 3.06 J 1 8020 J 1 860000 J 1 306 J 1 3020 J 1
1.6 JDB 6 JDB 8.2 JDB 1.6 JDB
0.33 J 1
110 D 140 D 68 D 100 D299
15 D J 4 39 D 93 D 44 D
1.6 J 1 5.25 J 1 26600 J 1 4410000 J 1 476 J 1 542 J 1
8.3 J 4 26 D 53 D 26 D
1.14 J 1 11400 J 1 948000 J 1 202 J 1 58 J 1
77 D 150 D 32 D 110 D 0.27 J
0.2 J 1 0.1 J 1 1.26 J 1 51.1 J 1 298000 J 1 4.6E+07 J 1 2180 J 1 4760 J 1
474 708 361 528120 D 140 D 56 D 90 D
0.33 510 J 1,2
1060 J 1 162000 J 1 218 J 1
0.14 J 1 3640 J 1 1290000 J 1 198 J 1 70 J 1
1.4 JD 4 2.2 0.62 J 1.3 JD 4 0.36 J
1.24 J 1 0.62 J 1 0.78 J 1 1.28 J 1 73600 J 1 9430000 J 1 797 J 1 1370 J 1
0.61 J 1 1.52 J 1 1640 J 1 334000 J 1 222 J 1
43.8
950 J 1 270000 J 1 243 J 1
2.05 J 1 1.6 J 1 9.68 J 1 5.79 J 1 250 J 1 86000 J 1
0.61 J 0.16 J 4
0.16 J 1 0.1 J 1 97500 J 11.68E+07 J 1 774 J 1 9070 J 1
1300 2720 2450 14203 389 J 7 322 2210 1060
1700 3430 3790 1980
TDD No. 0901-01T:\START3\Pavillion Area GW Investigation\Pavillion_Area_GW_Plume_ESI\ARR\Final ARR\All_Tables.xls

Table 10VOA and TPH/GRO Results
Pavillion Area Groundwater Investigation ESI – ARRRevision: 0
Date: 08/2010 Page 66 of 82
Analyte Laboratory Name
Volatile Organic AnalysisMCL(µg/L)
RDSC(µg/L)
CRSC(µg/L)
1,1,2-Trichloro-1,2,2-trifluoroethane CLP
1,2,4-Trimethylbenzene U.S. EPA R8
1,3,5-Trimethylbenzene U.S. EPA R8
1,3-Dimethyl adamantane U.S. EPA R82-Butanone (MEK) CLP 22,000Acetone CLP 33,000
Adamantane U.S. EPA R8Benzene CLP 5 150 1.5
Benzene U.S. EPA R8 5 150 1.5
Carbon disulfide CLP 3,700
Carbon disulfide U.S. EPA R8 3,700
Chloroform CLP 360
Chloroform U.S. EPA R8 360
Chloromethane CLPChloromethane U.S. EPA R8Cyclohexane CLPEthane U.S. EPA R8
Ethylbenzene CLP 700 3,700
Ethylbenzene U.S. EPA R8 700 3,700
Isopropylbenzene CLP 3,700
Isopropylbenzene U.S. EPA R8 3,700
m,p-Xylene CLP 10,000 73,000
m,p-Xylene U.S. EPA R8 10,000 73,000
Methane U.S. EPA R8Methylcyclohexane CLPMethylene chloride CLP 5 2,200 11
Methylene chloride U.S. EPA R8 5 2,200 11
n-Butyl Benzene U.S. EPA R8
n-Propyl Benzene U.S. EPA R8
o-Xylene CLP 10,000 73,000
o-Xylene U.S. EPA R8 10,000 73,000
p-Isopropyltoluene U.S. EPA R8Propane U.S. EPA R8
sec-Butylbenzene U.S. EPA R8Styrene CLP 100 7,300
Styrene U.S. EPA R8 100 7,300
tert-Butylbenzene U.S. EPA R8
Toluene CLP 1,000 7,300
Toluene U.S. EPA R8
1,000 7,300
TPH, GROTPH as Gasoline (GRO) Energy
TPH as Gasoline (GRO) U.S. EPA R8
TPH Total Purgeable Hydrocarbons Energy
SCDM (Drinking Water)PGSO01
µg/kgPGSO02
µg/kgPGSO03
µg/kgPGSW01
µg/LPGSW02
µg/LPGSW02D
µg/LPGSW03
µg/LPGSW04
µg/LPGSW05
µg/L
4600000 2490000 496000
5010000 888000 444000
6660000 3700000 940000
TDD No. 0901-01T:\START3\Pavillion Area GW Investigation\Pavillion_Area_GW_Plume_ESI\ARR\Final ARR\All_Tables.xls

Table 11Wet Chemistry and Bacteriological Results
Pavillion Area Groundwater Investigation ESI – ARRRevision: 0
Date: 08/2010 Page 67 of 82
Analyte Laboratory Name PGDW03 PGDW04 PGDW05 PGDW05D PGDW10 PGDW20 PGDW22 PGDW23 PGDW25 PGDW30 PGDW32 PGDW39 PGDW40BacteriologicalBacteria, Heterotrophic (MPN/ml) Energy 2 45 6 230 510 2 50Bacteria, Iron Related Energy Present Absent Present Present Absent Present Present Absent Absent Absent Absent Present
Bacteria, Approximate Iron Related Bacteria Population (CFU/ml) Energy 500
Not Aggressiv
e 9,000 9,000Not
Aggressive 9,000 2,300Not
aggressiveNot
aggressive
Not Aggressiv
e
Not Aggressiv
e 9,000Bacteria, Sulfate Reducing Energy Absent Absent Present Absent Absent Absent Absent Absent Present Absent Present Present
Bacteria, Approximate Sulfate Reducing Bacteria Population (CFU/ml) Energy 0 0 10 - 100 0 ec 0 0 c 10 - 100 0 10 - 100 10 - 100Wet Chemistry (mg/L)Alkalinity (ppm) U.S. EPA R8 28 38.3 88.4 89.1 147 67.9 337 54.2 295 94 31.5 129 86.3Sulfate as SO4 (ppm) U.S. EPA R8 570 532 287 287 293 1270 2780 368 441 333 368 3640 426Fluoride (ppm) U.S. EPA R8 0.8 0.9 0.9 1 0.9 0.8 1.5 0.9 2.4 0.3Chloride (ppm) U.S. EPA R8 20.7 23.3 16.5 16.9 7.5 32.6 74.6 19.7 9.5 15.5 21.4 52.9 13.1Nitrate as N (ppm) U.S. EPA R8 <0.3 <0.3 <0.3 <0.3 <0.3 <0.3 40.7 <0.3 1.7 <0.3 <0.3 <0.3 <0.3Nitrite as N (ppm) U.S. EPA R8 <0.3 <0.3 <0.3 <0.3 <0.3 <0.3 <0.3 <0.3 <0.3 <0.3 <0.3 <0.3 <0.3
1 - Exceeded holding time.2 - Compound found in method blank; detection is above 10x method blank value.3 - Low recovery of surrogate; potentially biased low.4 - High recovery of surrogate; potentially biased high.5 - Exceeded upper linear calibration range; biased low.6 - High recoveries for the compound in the corresponding spike sample.7 - Variability of samples outside QC limits for matrix spike.8 - Recoveries below control limits for initial calibration verification or continuing calibration verification; potentially biased low.9 - Recoveries above control limits for initial calibration verification or continuing calibration verification; potentially biased high.10 - Low recovery for the compound in the corresponding spike sample.
The sample was not analyzed for this analyte. (Blank Cell) Non Detect for this analyte.
TDD No. 0901-01T:\START3\Pavillion Area GW Investigation\Pavillion_Area_GW_Plume_ESI\ARR\Final ARR\All_Tables.xls

Table 11Wet Chemistry and Bacteriological Results
Pavillion Area Groundwater Investigation ESI – ARRRevision: 0
Date: 08/2010 Page 68 of 82
Analyte Laboratory NameBacteriologicalBacteria, Heterotrophic (MPN/ml) EnergyBacteria, Iron Related Energy
Bacteria, Approximate Iron Related Bacteria Population (CFU/ml) EnergyBacteria, Sulfate Reducing Energy
Bacteria, Approximate Sulfate Reducing Bacteria Population (CFU/ml) EnergyWet Chemistry (mg/L)Alkalinity (ppm) U.S. EPA R8Sulfate as SO4 (ppm) U.S. EPA R8Fluoride (ppm) U.S. EPA R8Chloride (ppm) U.S. EPA R8Nitrate as N (ppm) U.S. EPA R8Nitrite as N (ppm) U.S. EPA R8
PGDW41 PGDW42 PGDW43 PGDW44 PGDW45 PGDW46 PGDW47 PGDW48 PGDW49 PGPW01 PGPW02 PGFB01 PGFM20 PGMW01
74 2 48 4 240Present Present Present Present Present Present Present Absent Present Absent Absent Absent
150 150 2,300 500 9,000 9,000 150
Not Aggressiv
e 36,000
Not Aggressiv
e
Not Aggressiv
e
Not Aggressive
Present Absent Present Present Present Absent Present Absent Present Absent Absent Present
1 - 10 0 10 - 100 1 - 10 1 - 10 0 1 - 10 0100,000 - 1,000,000 0 0 1 - 10
108 88.5 113 100 379 329 44.1 89.8 243 74.7 82.8 4402670 311 2470 2880 213 126 330 1840 3160 300 847 1010
0.5 1 0.4 0.3 1.9 0.5 1.5 0.3 0.4 1.2 0.5 0.431.4 13.2 38.4 39.5 14.5 8.4 21.6 24.1 64.3 15.3 8.5 3.5<0.3 <0.3 <0.3 <0.3 0.3 2.3 <0.3 <0.3 7.7 <0.3 <0.3 <0.3<0.3 <0.3 <0.3 <0.3 <0.3 <0.3 <0.3 <0.3 <0.3 <0.3 <0.3 <0.3
TDD No. 0901-01T:\START3\Pavillion Area GW Investigation\Pavillion_Area_GW_Plume_ESI\ARR\Final ARR\All_Tables.xls

Table 11Wet Chemistry and Bacteriological Results
Pavillion Area Groundwater Investigation ESI – ARRRevision: 0
Date: 08/2010 Page 69 of 82
Analyte Laboratory NameBacteriologicalBacteria, Heterotrophic (MPN/ml) EnergyBacteria, Iron Related Energy
Bacteria, Approximate Iron Related Bacteria Population (CFU/ml) EnergyBacteria, Sulfate Reducing Energy
Bacteria, Approximate Sulfate Reducing Bacteria Population (CFU/ml) EnergyWet Chemistry (mg/L)Alkalinity (ppm) U.S. EPA R8Sulfate as SO4 (ppm) U.S. EPA R8Fluoride (ppm) U.S. EPA R8Chloride (ppm) U.S. EPA R8Nitrate as N (ppm) U.S. EPA R8Nitrite as N (ppm) U.S. EPA R8
PGMW01D PGMW02 PGMW03 PGPP01 PGPP04P PGPP05 PGPP06 PGSE01 PGSE02 PGSE02d PGSE03 PGSE04 PGSE05
4 13,000 16,000Absent Present Present
25 140,000 140,000Present Present Present
1 - 10 1 - 10 1 - 10
438 2750 536 6531040 108 28.40.6 0.2 1.4 3.23.9 265 6.4 203<0.3 1.9 <0.3 <300<0.3 <0.3 <0.3 <300
TDD No. 0901-01T:\START3\Pavillion Area GW Investigation\Pavillion_Area_GW_Plume_ESI\ARR\Final ARR\All_Tables.xls

Table 12Metals Data
Pavillion Area Groundwater Investigation ESI – ARRRevision: 0
Date: 08/2010 Page 71 of 82
MCLG(µg/L)
MCL(µg/L)
RDSC(µg/L)
CRSC(µg/L)
PGDW03µg/L
PGDW04µg/L
PGDW05µg/L
PGDW05Dµg/L
PGDW10µg/L
PGDW20µg/L
PGDW22µg/L
PGDW23µg/L
PGDW25µg/L
PGDW30µg/L
PGDW32µg/L
PGDW39µg/L
PGDW40µg/L
PGDW41µg/L
PGDW42µg/L
PGDW43µg/L
ALUMINUM 200 0 0 200 U 200 U 200 U 200 U 200 U 200 U 200 U 200 U 200 U 200 U 200 U 200 U 200 U 741 200 U 200 UANTIMONY 2 6 6 15 2 U 2 U 2 U 2 U 2 U 2 U 2 U 2 U 2 U 2 U 2 U 2 U 2 U 2 U 2 U 2.1 UARSENIC 1 0 10 11 0.057 0.42 J 0.32 J 0.36 J 1 U 1 U 0.5 J 0.47 J 1 U 0.46 J 1 U 0.53 J 0.32 J 1 U 0.89 J 1 U 1.3BARIUM 10 2,000 2,000 2,600 6.7 J 6 J 11.1 10.3 9.1 J 9.3 J 6.3 J 8.9 J 14 6.8 J 9.6 J 6.9 J 11.7 9.6 J 7.9 J 5.4 JBERYLLIUM 1 4 4 73 1 U 1 U 1 U 1 U 1 U 1 U 1 U 1 U 1 U 1 U 1 U 1 U 1 U 1 U 1 U 0.29 JCADMIUM 1 5 5 18 1 U 1 U 1 U 1 U 1 U 1 U 1 U 1 U 1 U 1 U 1 U 1 U 1 U 1 U 1 U 0.36 JCALCIUM 5000 16300 15500 3330 J 3150 J 5760 71700 397000 5820 70100 4050 J 6890 389000 6570 J 270000 J 5060 208000 JCHROMIUM 2 100 100 110 2 U 2 U 2 U 2 U 2 U 2 U 2 U 2 U 2 U 2 U 2 U 2 U 2 U 1.7 J 2 U 0.45 JCOBALT 1 1 U 1 U 1 U 1 U 1 U 1 U 0.33 J 1 U 1 U 1 U 1 U 0.42 J 1 U 0.51 J 1 U 0.57 JCOPPER 2 1,300 1,300 4.4 J 3.9 J 7.7 U 4.7 J 2.7 J 8.8 J 16.3 J 4.3 J 4.3 J 3.9 J 3 J 16.7 J 3.1 U 201 J 5.5 J 19.4 JIRON 100 100 U 100 U 66.6 J 64.7 J 100 U 300 100 U 100 U 100 U 44.1 J 125 330 1260 1880 96.6 J 403LEAD 1 0 15 1 U 1 U 0.42 J 1 U 1 U 1 U 1 U 1 U 1 U 1 U 1 U 1 U 0.91 J 38.3 1 U 0.81 JMAGNESIUM 5000 5000 U 5000 U 5000 U 5000 U 5000 U 8140 130000 5000 U 9630 5000 U 5000 U 147000 5000 U 57500 5000 U 13700MANGANESE 1 5,100 1.7 2.8 2.2 1.8 3.8 31.3 3 2.8 20.9 2.2 3.2 174 32.8 222 3 84.4MERCURY 0.2 2 2 11 0.2 U 0.2 U 0.2 U 0.2 U 0.2 U 0.2 U 0.2 U 0.2 U 0.2 U 0.2 U 0.2 U 0.2 U 0.2 U 0.2 U 0.2 U 0.2 UNICKEL 1 730 0.38 J 0.26 J 0.48 J 0.21 J 0.4 J 0.46 J 1.9 0.23 J 1 J 0.83 J 0.61 J 1.3 0.49 J 3.6 0.42 J 2.4POTASSIUM 5000 5000 U 5000 U 5000 U 5000 U 5000 U 5000 U 5830 5000 U 5000 U 5000 U 5000 U 5280 5000 U 2680 J 5000 U 5000 USELENIUM 5 50 50 180 5 U 5 U 5 U 5 U 5 U 0.98 J 3.9 J 5 U 1.3 J 5 U 5 U 1.2 J 5 U 1.4 J 5 U 3.9 JSILVER 1 180 1 U 1 U 1 U 1 U 1 U 1 U 1 U 1 U 1 U 1 U 1 U 1 U 1 U 1 U 1 U 0.3 JSODIUM 5000 251000 265000 189000 181000 195000 550000 908000 194000 269000 195000 193000 1110000 244000 1030000 181000 911000THALLIUM 1 0.5 2 1 U 1 U 0.23 J 1 U 1 U 1 U 1 U 1 U 1 U 1 U 1 U 1 U 1 U 1 U 1 U 0.76 JVANADIUM 5 260 5 U 5 U 5 U 5 U 5 U 5 U 5 U 5 U 5 U 5 U 5 U 5 U 5 U 2.7 J 5 U 1 JZINC 2 11,000 2.5 1.1 J 1.4 J 2 U 2 7.6 2.7 2 U 15.1 1.2 J 23.9 26.8 211 32.5 1.2 J 17.5
MCLG Maximum Contaminant Level Goal. A non-enforceable health goal that is set at a level at which no known or anticipated adverse effecton the health of persons occurs and which allows an adequate margin of safety.
MCL Maximum contaminant Level. The highest level of a contaminant that is allowed in drinking water. MCLs are set as close to the MCLG as feasible using the best available analytical and treatment technologies and taking cost into consideration. MCLs are enforceable standards.
SCDM Superfund Chemical Data MatrixRDSC Reference Dose Screening ConcentrationCRSC Cancer Risk Screening ConcentrationCRDL Contract Required Detection LimitJ Estimated as below Contract Required Quantitation Limit but above Method Detection Limit.U Non-Detect
SCDM (Drinking Water)
Analyte
CLP Limits - Water (µg/L)
TDD No. 0901-01T:\START3\Pavillion Area GW Investigation\Pavillion_Area_GW_Plume_ESI\ARR\Final ARR\All_Tables.xls
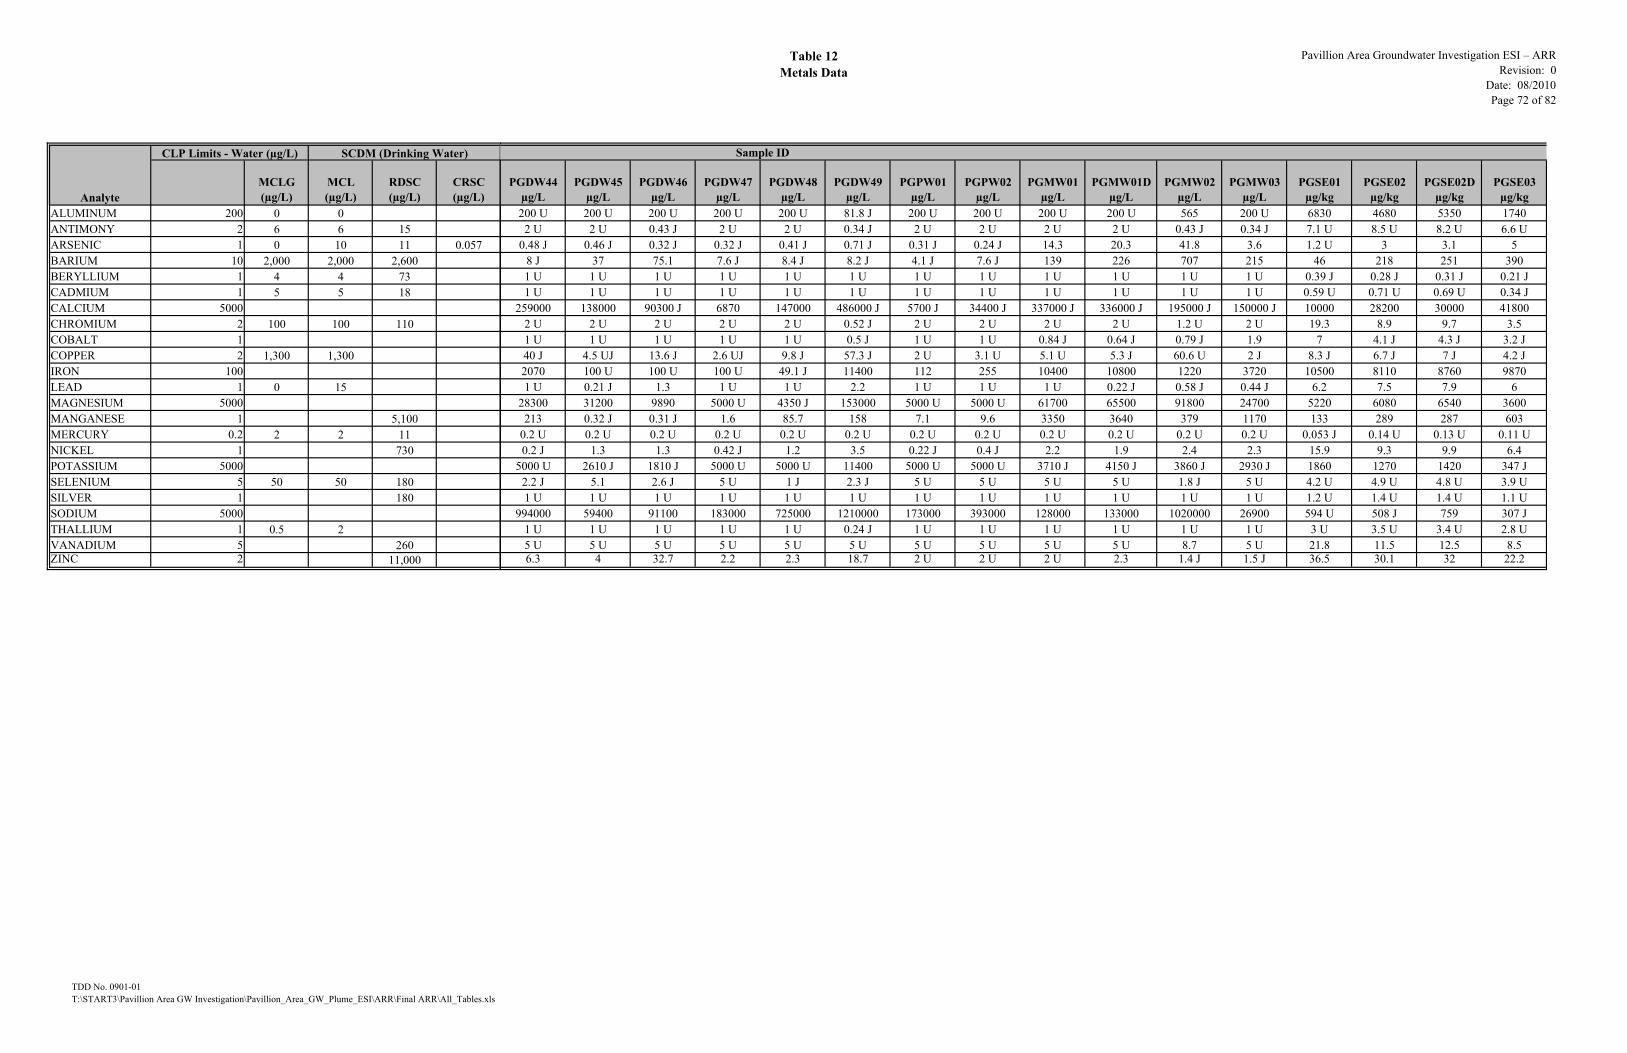
Table 12Metals Data
Pavillion Area Groundwater Investigation ESI – ARRRevision: 0
Date: 08/2010 Page 72 of 82
MCLG(µg/L)
MCL(µg/L)
RDSC(µg/L)
CRSC(µg/L)
ALUMINUM 200 0 0ANTIMONY 2 6 6 15ARSENIC 1 0 10 11 0.057BARIUM 10 2,000 2,000 2,600BERYLLIUM 1 4 4 73CADMIUM 1 5 5 18CALCIUM 5000CHROMIUM 2 100 100 110COBALT 1COPPER 2 1,300 1,300IRON 100LEAD 1 0 15MAGNESIUM 5000MANGANESE 1 5,100MERCURY 0.2 2 2 11NICKEL 1 730POTASSIUM 5000SELENIUM 5 50 50 180SILVER 1 180SODIUM 5000THALLIUM 1 0.5 2VANADIUM 5 260ZINC 2 11,000
SCDM (Drinking Water)
Analyte
CLP Limits - Water (µg/L)
PGDW44µg/L
PGDW45µg/L
PGDW46µg/L
PGDW47µg/L
PGDW48µg/L
PGDW49µg/L
PGPW01µg/L
PGPW02µg/L
PGMW01µg/L
PGMW01Dµg/L
PGMW02µg/L
PGMW03µg/L
PGSE01µg/kg
PGSE02µg/kg
PGSE02Dµg/kg
PGSE03µg/kg
200 U 200 U 200 U 200 U 200 U 81.8 J 200 U 200 U 200 U 200 U 565 200 U 6830 4680 5350 17402 U 2 U 0.43 J 2 U 2 U 0.34 J 2 U 2 U 2 U 2 U 0.43 J 0.34 J 7.1 U 8.5 U 8.2 U 6.6 U
0.48 J 0.46 J 0.32 J 0.32 J 0.41 J 0.71 J 0.31 J 0.24 J 14.3 20.3 41.8 3.6 1.2 U 3 3.1 58 J 37 75.1 7.6 J 8.4 J 8.2 J 4.1 J 7.6 J 139 226 707 215 46 218 251 3901 U 1 U 1 U 1 U 1 U 1 U 1 U 1 U 1 U 1 U 1 U 1 U 0.39 J 0.28 J 0.31 J 0.21 J1 U 1 U 1 U 1 U 1 U 1 U 1 U 1 U 1 U 1 U 1 U 1 U 0.59 U 0.71 U 0.69 U 0.34 J
259000 138000 90300 J 6870 147000 486000 J 5700 J 34400 J 337000 J 336000 J 195000 J 150000 J 10000 28200 30000 418002 U 2 U 2 U 2 U 2 U 0.52 J 2 U 2 U 2 U 2 U 1.2 U 2 U 19.3 8.9 9.7 3.51 U 1 U 1 U 1 U 1 U 0.5 J 1 U 1 U 0.84 J 0.64 J 0.79 J 1.9 7 4.1 J 4.3 J 3.2 J40 J 4.5 UJ 13.6 J 2.6 UJ 9.8 J 57.3 J 2 U 3.1 U 5.1 U 5.3 J 60.6 U 2 J 8.3 J 6.7 J 7 J 4.2 J2070 100 U 100 U 100 U 49.1 J 11400 112 255 10400 10800 1220 3720 10500 8110 8760 98701 U 0.21 J 1.3 1 U 1 U 2.2 1 U 1 U 1 U 0.22 J 0.58 J 0.44 J 6.2 7.5 7.9 6
28300 31200 9890 5000 U 4350 J 153000 5000 U 5000 U 61700 65500 91800 24700 5220 6080 6540 3600213 0.32 J 0.31 J 1.6 85.7 158 7.1 9.6 3350 3640 379 1170 133 289 287 603
0.2 U 0.2 U 0.2 U 0.2 U 0.2 U 0.2 U 0.2 U 0.2 U 0.2 U 0.2 U 0.2 U 0.2 U 0.053 J 0.14 U 0.13 U 0.11 U0.2 J 1.3 1.3 0.42 J 1.2 3.5 0.22 J 0.4 J 2.2 1.9 2.4 2.3 15.9 9.3 9.9 6.4
5000 U 2610 J 1810 J 5000 U 5000 U 11400 5000 U 5000 U 3710 J 4150 J 3860 J 2930 J 1860 1270 1420 347 J2.2 J 5.1 2.6 J 5 U 1 J 2.3 J 5 U 5 U 5 U 5 U 1.8 J 5 U 4.2 U 4.9 U 4.8 U 3.9 U1 U 1 U 1 U 1 U 1 U 1 U 1 U 1 U 1 U 1 U 1 U 1 U 1.2 U 1.4 U 1.4 U 1.1 U
994000 59400 91100 183000 725000 1210000 173000 393000 128000 133000 1020000 26900 594 U 508 J 759 307 J1 U 1 U 1 U 1 U 1 U 0.24 J 1 U 1 U 1 U 1 U 1 U 1 U 3 U 3.5 U 3.4 U 2.8 U5 U 5 U 5 U 5 U 5 U 5 U 5 U 5 U 5 U 5 U 8.7 5 U 21.8 11.5 12.5 8.56.3 4 32.7 2.2 2.3 18.7 2 U 2 U 2 U 2.3 1.4 J 1.5 J 36.5 30.1 32 22.2
Sample ID
TDD No. 0901-01T:\START3\Pavillion Area GW Investigation\Pavillion_Area_GW_Plume_ESI\ARR\Final ARR\All_Tables.xls

Table 12Metals Data
Pavillion Area Groundwater Investigation ESI – ARRRevision: 0
Date: 08/2010 Page 73 of 82
MCLG(µg/L)
MCL(µg/L)
RDSC(µg/L)
CRSC(µg/L)
ALUMINUM 200 0 0ANTIMONY 2 6 6 15ARSENIC 1 0 10 11 0.057BARIUM 10 2,000 2,000 2,600BERYLLIUM 1 4 4 73CADMIUM 1 5 5 18CALCIUM 5000CHROMIUM 2 100 100 110COBALT 1COPPER 2 1,300 1,300IRON 100LEAD 1 0 15MAGNESIUM 5000MANGANESE 1 5,100MERCURY 0.2 2 2 11NICKEL 1 730POTASSIUM 5000SELENIUM 5 50 50 180SILVER 1 180SODIUM 5000THALLIUM 1 0.5 2VANADIUM 5 260ZINC 2 11,000
SCDM (Drinking Water)
Analyte
CLP Limits - Water (µg/L)
PGSE04µg/kg
PGSE05µg/kg
PGSW01µg/L
PGSW02µg/L
PGSW02Dµg/L
PGSW03µg/L
PGSW04µg/L
PGSW05µg/L
1680 3290 200 U 93.6 J 200 U 90.2 J 99.9245 J 109 J7.5 U 8.1 U 2 U 0.37 J 2 U 0.43 J 2 U 0.34 J3.9 2.5 0.44 J 0.48 J 0.46 J 0.53 J 0.39 J 0.59 J356 162 36.4 33.1 32.3 33.8 30.7 31.7
0.63 U 0.67 U 1 U 1 U 1 U 1 U 1 U 1 U0.63 U 0.67 U 1 U 1 U 1 U 1 U 1 U 1 U40400 28100 316000 313000 J 316000 J 345000 J 295000 J 289000 J
4.5 7.3 2 U 2 U 2 U 2 U 2 U 2 U2.2 J 3.1 J 0.54 J 0.46 J 0.54 J 0.52 J 0.44 J 0.45 J2.6 J 3.7 J 2.7 UJ 2.7 U 2.4 U 2.3 U 2.2 U 2.6 U6360 6290 68.1 J 81.8 J 72 J 79.3 J 114 1145.7 5.5 1 U 0.24 J 0.2 J 0.23 J 0.34 J 0.33 J
2500 3710 94600 91100 90100 99000 86100 83100367 252 246 147 145 155 129 126
0.13 U 0.07 J 0.2 U 0.2 U 0.2 U 0.2 U 0.2 U 0.2 U4.2 J 6.3 2.4 3.2 2.9 2.9 2.9 2.6384 J 820 11800 10500 10200 11300 9160 88304.4 U 4.7 U 5 U 2.1 J 2.1 J 2.4 J 2.7 J 3.2 J1.3 U 1.3 U 1 U 1 U 1 U 1 U 1 U 1 U293 J 396 J 184000 262000 258000 286000 251000 2650003.1 U 3.4 U 1 U 1 U 1 U 1 U 1 U 1 U6.5 9.4 5 U 5 U 5 U 5 U 5 U 5 U14.2 21.6 2 U 1.1 J 1.2 J 2 U 1.4 J 1.4 J
TDD No. 0901-01T:\START3\Pavillion Area GW Investigation\Pavillion_Area_GW_Plume_ESI\ARR\Final ARR\All_Tables.xls

Table 13Fixed and Light Gases in Natural Gas from
Production Wells and Domestic Water Wells
Pavillion Area Groundwater Investigation ESI – ARRRevision: 0
Date: 08/2010 Page 74 of 82
AnalyteLaboratory
Name PGDW03 PGDW04 PGDW05 PGDW05D PGDW10 PGDW20 PGDW22 PGDW23 PGDW25 PGDW30Methane ZymaX 5.2 53 1300 820 6300Ethane ZymaX 52 1.7 1.8Propanes ZymaX 5.8Butanes ZymaX 7.3 6.9 12 3.1Pentanes ZymaX 11 1.3 2.3 3.9Hexanes ZymaX 4.7 2.4 0.77Heptanes ZymaX 2.5 0.5 0.79Octanes ZymaX 4.1 1.9 2.4 2.9Nonanes ZymaXDecanes ZymaXTotal ZymaX 5.2 82 1368 841 6313
The concentrations represent ppm of the gas hydrocarbons in the headspace created above the water in the 1 litre bottle.These are not concentrations in the water of the analyte.
The sample was not analyzed for this analyte. (Blank Cell) Non Detect for this analyte.
TDD No. 0901-01T:\START3\Pavillion Area GW Investigation\Pavillion_Area_GW_Plume_ESI\ARR\Final ARR\All_Tables.xls

Table 13Fixed and Light Gases in Natural Gas from
Production Wells and Domestic Water Wells
Pavillion Area Groundwater Investigation ESI – ARRRevision: 0
Date: 08/2010 Page 75 of 82
AnalyteLaboratory
NameMethane ZymaXEthane ZymaXPropanes ZymaXButanes ZymaXPentanes ZymaXHexanes ZymaXHeptanes ZymaXOctanes ZymaXNonanes ZymaXDecanes ZymaXTotal ZymaX
PGDW32 PGDW39 PGDW40 PGDW41 PGDW42 PGDW43 PGDW44 PGDW45 PGDW46 PGDW47270 12 5.4
1.4
3.7 1.80.75 0.542.8 0.47
2.1
270 19 1.4 10
TDD No. 0901-01T:\START3\Pavillion Area GW Investigation\Pavillion_Area_GW_Plume_ESI\ARR\Final ARR\All_Tables.xls

Table 13Fixed and Light Gases in Natural Gas from
Production Wells and Domestic Water Wells
Pavillion Area Groundwater Investigation ESI – ARRRevision: 0
Date: 08/2010 Page 76 of 82
AnalyteLaboratory
NameMethane ZymaXEthane ZymaXPropanes ZymaXButanes ZymaXPentanes ZymaXHexanes ZymaXHeptanes ZymaXOctanes ZymaXNonanes ZymaXDecanes ZymaXTotal ZymaX
PGDW48 PGDW49 PGPW01 PGPW02
TDD No. 0901-01T:\START3\Pavillion Area GW Investigation\Pavillion_Area_GW_Plume_ESI\ARR\Final ARR\All_Tables.xls

Table 14Isotopic Analysis
Pavillion Area Groundwater Investigation ESI – ARRRevision: 0
Date: 08/2010 Page 77 of 82
δ13C δD% VPDB % VSMOW
CH4 CH4
Sample IDPGDW04 -63.91 a-219.56PGDW05D -40.63 -179.79PGDW20 -40.61 -182.61PGDW23 -24.21 -178.65PGDW30 -14.46 -168.16PGDW40 -30.93 -175.39
PGDW41 -19.39 a-154.35PGDW43PGDW44 -14.87 a-142.87PGPP01 -28.54 -200.38PGPP02 -28.99 -204.03PGPP03PGPP04P -28.39 -196.66PGPP05 -27.49 -198.69PGPP06 -28.43 -194.96
VPDB Vienna PeeDee BelemniteVSMOW Vienna Standard Mean Ocean wateraEstimate results of δD at low concentrations.
The sample was not analyzed for this analyte. (Blank Cell) Non Detect for this analyte.
TDD No. 0901-01T:\START3\Pavillion Area GW Investigation\Pavillion_Area_GW_Plume_ESI\ARR\Final ARR\All_Tables.xls

Pavillion Area Groundwater Investigation ESI – ARRRevision: 0
Date: 08/2010 Page 78 of 82
Sample ID:Analyte: Mole % Weight % G/MCF Mole % Weight % G/MCF Mole % Weight % G/MCF Mole % Weight % G/MCF Mole % Weight % G/MCF Mole % Weight % G/MCFOxygen 0.00 0.00 0.00 0.00 0.00 0.00 0.02 0.04 2.2 3.78 0.07 0.12Nitrogen 0.71 1.11 0.69 1.13 100 100.00 0.61 0.91 7.92 11.9 0.71 1.13Carbon Dioxide 0.04 0.1 0.49 1.27 0.00 0.00 0.12 0.28 0.59 1.4 0.06 0.14Hydrogen SulfideMethane 92.45 83.14 94.5 88.67 0.00 0.00 90 75.98 84.73 72.9 93.09 84.89Ethane 4.1 6.91 1.044 3.52 6.19 0.897 0.00 0.00 0.00 4.67 7.4 1.191 3.31 5.34 0.843 3.98 6.81 1.015Propane 1.22 3.02 0.337 0.36 0.92 0.099 0.00 0.00 0.00 1.47 3.41 0.406 0.34 0.81 0.095 0.91 2.29 0.252i-Butane 0.41 1.34 0.135 0.14 0.48 0.047 0.00 0.00 0.00 0.58 1.76 0.189 0.12 0.38 0.04 0.33 1.09 0.108n-Butane 0.37 1.2 0.116 0.07 0.23 0.021 0.00 0.00 0.00 0.51 1.56 0.162 0.06 0.18 0.018 0.26 0.84 0.081neo-Pentane 0.00 0.00 0.00 0.00 0.00 0.00 0.00 0.00 0.00 0.02 0.06 0.006 0.00 0.00 0.00 0.00 0.00 0.00i-Pentane 0.19 0.77 0.07 0.05 0.23 0.02 0.00 0.00 0.00 0.35 1.32 0.127 0.04 0.15 0.014 0.16 0.64 0.057n-Pentane 0.12 0.47 0.042 0.02 0.09 0.008 0.00 0.00 0.00 0.22 0.84 0.08 0.01 0.05 0.004 0.09 0.39 0.0342,2-Dimethylbutane 0.01 0.05 0.004 0.00 0.00 0.00 0.00 0.00 0.00 0.02 0.09 0.007 0.00 0.00 0.00 0.01 0.05 0.0042,3-Dimethylbutane 0.06 0.3 0.023 0.03 0.14 0.01 0.00 0.00 0.00 0.21 0.94 0.075 0.00 0.00 0.00 0.06 0.31 0.0232-Methylpentane 0.1 0.46 0.034 0.03 0.14 0.01 0.00 0.00 0.00 0.26 1.17 0.094 0.03 0.16 0.012 0.09 0.46 0.0343-Methylpentane 0.00 0.00 0.00 0.00 0.00 0.00 0.00 0.00 0.00 0.00 0.00 0.00 0.00 0.00 0.00 0.00 0.00 0.00n-Hexane 0.04 0.18 0.016 0.02 0.08 0.007 0.00 0.00 0.00 0.13 0.57 0.053 0.02 0.09 0.008 0.05 0.24 0.021Hexanes Plus 0.2 0.95 0.082 0.08 0.42 0.035 0.00 0.00 0.00 0.81 3.66 0.339 0.62 2.86 0.26 0.12 0.58 0.05Totals 100 100 1.903 100 100 1.152 0.00 100.00 0.00 100 100 2.728 100 100 1.295 100 100 1.679
The sample was not analyzed for this analyte.G/MCF: Gallons/Thousand Cubic Feet
Sample ID: PGPP01 PGPP02 PGPP03 PGPP04P PGPP05 PGPP06Specific Gravity, Calculated 0.6159 0.5903 0.9672 0.6561 0.6437 0.6074Compressibility (Z) factor 0.9975 0.9978 0.9997 0.9971 0.9979 0.9976Gross Calorific ValueBTU/ft3 dry 1093.7 1042.9 0.0 1155 962.7 1078.9
BTU/ft3 wet 1074.7 1024.8 0.0 1134.9 946.0 1060.1Net Calorific ValueBTU/ft3 dry 987.8 940.5 0.0 1045 868.8 974.0
BTU/ft3 wet 970.6 924.1 0.0 1026.8 853.7 957.0CHONS Weight % Weight % Weight % Weight % Weight % Weight %Carbon 75.02 73.94 0.0 75.64 63.12 74.74Hydrogen 23.8 24 0.0 23.21 20.18 23.9Oxygen 0.07 0.93 0.0 0.25 4.8 0.23Nitrogen 1.11 1.13 100.0 0.91 11.9 1.13Sulfur 0.0 0.0 0.0 0.0 0.0 0.0
EPA 'F' Factor (60°F, 1ATM) 8513.2 8508 * 8516.1 8618.2 8509.1
* Out of rangeBTU British Thermal Unit
Table 15-BGas Analysis by Chromatography – ASTMD 3588
Table 15-AGas Analysis by Chromatography – ASTMD 1945
PGPP05 PGPP06PGPP01 PGPP02 PGPP03 PGPP04P
TDD No. 0901-01T:\START3\Pavillion Area GW Investigation\Pavillion_Area_GW_Plume_ESI\ARR\Final ARR\All_Tables.xls

Table 16Additional Gas Analysis
Pavillion Area Groundwater Investigation ESI – ARRRevision: 0
Date: 08/2010 Page 79 of 82
Sample ID: PGPP01 PGPP04PAnalyte:Evaporationn-Pentane/n-Heptane 0.12 0.162-Methylpentane/2-Methylheptane 0.39 0.49WaterwashingBenzene/Cyclohexane 0 0Toluene/Methylcyclohexane 0.3 0.2Aromatics/Total Paraffins (n + iso + cyc) 0.49 0.29Aromatics/Naphthenes 1.37 0.81Biodegradation(C4-C8 Para + Isopara)/C4-C8 Olefins 9.72 7.663-Methylhexane/n-Heptane 0.33 0.37Methylcyclohexane/n-Heptane 3.52 3.48Isoparaffins + Naphthenes/Paraffins 2.18 2.41Octane Rating2,2,4,-Trimethylpentane/Methylcyclohexane 0 0Relative Percentages-Bulk hydrocarbon composition as PIANO% Paraffinic 20.38 21.47% Isoparaffinic 21.34 25.51% Aromatic 31.55 21.22% Naphthenic 23.1 26.28% Olefinic 3.63 5.51
TDD No. 0901-01T:\START3\Pavillion Area GW Investigation\Pavillion_Area_GW_Plume_ESI\ARR\Final ARR\All_Tables.xls

Table 17C3-C10 Gasoline Range Compounds from Production Wells and Domestic Wells
(ug/L)
Pavillion Area Groundwater Investigation ESI – ARRRevision: 0
Date: 08/2010 Page 79 of 82
AnalyteLaboratory
Name PGMWO1D PGMW02 PGMW03 PGPP01 PGPP04W PGPP05 PGPP06 PGSW01 PGSW02 PGSW02D PGSW03 PGSW04 PGSW05 PGDW03 PGDW04 PGDW05 PGDW05D PGDW10 PGDW20 PGDW22 PGDW23 PGDW25 PGDW30Isobutane ZymaX 1363.4 1808.6 723.0 2.6 8.9Isobutene ZymaX 116.1Butane ZymaX 1379.9 1079.9 703.63-Methyl-1-butene ZymaXIsopentane ZymaX 1017.3 2685.2 422.61-Pentene ZymaX2-Methyl-1-butene ZymaXPentane ZymaX 2483.9 1212.9 48778.4trans-2-Pentene ZymaX 8.6cis-2-Pentene ZymaX2-Methyl-2-butene ZymaX 46.82,2-Dimethylbutane ZymaX 42.6 646.9Cyclopentene ZymaX 6.14-Methyl-1-pentene ZymaXCyclopentane ZymaX 240.3 191.3 186.02,3-Dimethylbutane ZymaX 97.9 1389.2 70.82-Methylpentane ZymaX 256.7 2002.4 147.13-Methylpentane ZymaX 178 1322.5 97.9Hexane ZymaX 301.4 1407.6 153.7trans-2-Hexene ZymaX2-Methyl-2-pentene ZymaX 66.83-Methylcyclopentene ZymaX3-Methyl-2-pentene ZymaXcis-2-Hexene ZymaX2,2-Dimethylpentane ZymaX1,2-Dichloroethane (EDC) ZymaXMethylcyclopentane ZymaX 720.5 1184.7 490.62,4-Dimethylpentane ZymaX 1070.6 81.41-Methylcyclopentene ZymaX 6.2Benzene ZymaX 2052.5 379.1 1953.05-Methyl-1-hexene ZymaX4,4-Dimethyl-2-pentene ZymaX3,3-Dimethylpentane ZymaX 161Thiophene ZymaXCyclohexane ZymaX 1139 1527.9 728.62-Methylhexane ZymaX 72.2 2095.0 142.12,3-Dimethylpentane ZymaX 7.4 320.83-Methylhexane ZymaX 92 2201.3 158.8trans-1,3-Dimethylcyclopentane ZymaX 74.6 822.8 63.8cis-1,3-Dimethylcyclopentane ZymaX 87.2 921.7 70.72-Methyl-1-hexene ZymaX1,2-Dimethylcyclopentane ZymaX 125.5 702.6 85.22,2,4-Trimethylpentane ZymaX 62.6Heptane ZymaX 227.9 2844.4trans-2-Heptene ZymaXMethylcyclohexane ZymaX 1799.9 5934.7 1089.02,5-Dimethylhexane ZymaX 14.8 1414.1 103.42,4-Dimethylhexane ZymaX 17.4 1478.7 112.32,3,4-Trimethylpentane ZymaX 76.32,3-Dimethylhexane ZymaX 24 1898.5 135.91,2-Dibromoethane (EDB) ZymaX2-Methylheptane ZymaX 2390.8 204.44-Methylheptane ZymaX 54 1860.8 144.3Toluene ZymaX 11329.2 1284.8 7288.42,3,3-Trimethylpentane ZymaX 1113,4-Dimethylhexane ZymaX 2167.4 189.22-Methylthiophene ZymaX3-Ethyl-3-methylpentane ZymaX 157.93-Methylthiophene ZymaX3-Methylheptane ZymaX 85.5 3145.6 253.0trans-1,4-Dimethylcyclohexane ZymaX 526.9 10460.3 928.22-Methyl-1-heptene ZymaXtrans-1,2-Dimethylcyclohexane ZymaX 193.1 5670.5 421.01-Octene ZymaXOctane ZymaX 208.5 3030.2 267.2
TDD No. 0901-01T:\START3\Pavillion Area GW Investigation\Pavillion_Area_GW_Plume_ESI\ARR\Final ARR\All_Tables.xls

Table 17C3-C10 Gasoline Range Compounds from Production Wells and Domestic Wells
(ug/L)
Pavillion Area Groundwater Investigation ESI – ARRRevision: 0
Date: 08/2010 Page 80 of 82
AnalyteLaboratory
Name PGMWO1D PGMW02 PGMW03 PGPP01 PGPP04W PGPP05 PGPP06 PGSW01 PGSW02 PGSW02D PGSW03 PGSW04 PGSW05 PGDW03 PGDW04 PGDW05 PGDW05D PGDW10 PGDW20 PGDW22 PGDW23 PGDW25 PGDW302,2-Dimethylheptane ZymaX 8.7 1299.8 97.72,4,4-Trimethylhexane ZymaX 59.4 4870.1 425.82,4-Dimethylheptane ZymaX 10.7 1699.7 132.42,6-Dimethylheptane ZymaX 38.3 2787.2 239.2Ethylcyclohexane ZymaX 184.2 5016.4 440.82,5-Dimethylheptane ZymaX 48.2 5706.2 512.0Ethylbenzene ZymaX 631.6 579.2 262.02-Ethylthiophene ZymaXm,p-Xylenes ZymaX 11512.9 3684.8 4291.93-Ethylheptane ZymaX 16.6 2047.9 188.43-Methyloctane ZymaX 81.2 10753.8 828.12,3-Dimethylheptane ZymaX 449.74-Methyloctane ZymaX 44.1 3917.7 316.41,2,4-Trimethylcyclohexane ZymaX 358.8Styrene ZymaX 22.12-Methyloctane ZymaX 36.4 3219.3 300.21,1,2-Trimethylcyclohexane ZymaX 34.8 4720.3 387.6o-Xylene ZymaX 2639.9 1306.9 1099.51-Nonene ZymaXNonane ZymaX 142.6 3916.8 377.23,3,5-Trimethylheptane ZymaX 3729.6 294.7Isopropylbenzene ZymaX 541.8 3427.3 336.5Isopropylcyclohexane ZymaX 19.4 4876.7 434.92,2-Dimethyloctane ZymaX 105.33-Methylnonane ZymaX 20.3 5908.1 637.93,3-Dimethyloctane ZymaX 39.7 1458.9 126.3n-Propylbenzene ZymaX 129.5 802.7 110.21-Methyl-3-ethylbenzene ZymaX 579.7 1652 412.61-Methyl-4-ethylbenzene ZymaX 192.3 793.6 154.91,3,5-Trimethylbenzene ZymaX 464.5 1566 365.93,3,4-Trimethylheptane ZymaX 2139.61-Methyl-2-ethylbenzene ZymaX 164 674.4 159.71,2,4-Trimethylbenzene ZymaX 694.7 2620.7 632.11-Decene ZymaX1-Methyl-3-isopropylbenzene ZymaX 44.7 1082.9 107.3Decane ZymaX 73.7 4153.3 407.8sec-Butylbenzene ZymaX 7 655.3 61.51,2,3-Trimethylbenzene ZymaX 155 903.7 170.3Indane ZymaX 9.1 358.8Indene ZymaX 79.11,3-Diethylbenzene ZymaX 626.3 63.6n-Butylbenzene ZymaX 178.91,3-Dimethyl-5-ethylbenzene ZymaX1,4-Diethylbenzene ZymaX 256.11-Methyl-2-propylbenzene ZymaX 133.21,4-Dimethyl-2-ethylbenzene ZymaX1,3-Dimethyl-4-ethylbenzene ZymaX 81.41,2-Dimethyl-4-ethylbenzene ZymaX1,3-Dimethyl-2-ethylbenzene ZymaXUndecane ZymaX 312.3 373.71,2,4,5-Tetramethylbenzene ZymaX1,2,3,5-Tetramethylbenzene ZymaX1,2,3,4-Tetramethylbenzene ZymaXNaphthalene ZymaX2-Methylnaphthalene ZymaX1-Methylnaphthalene ZymaXBenzothiophene ZymaXn-Pentylbenzene ZymaX
The sample was not analyzed for this analyte. (Blank Cell) Non Detect for this analyte.
TDD No. 0901-01T:\START3\Pavillion Area GW Investigation\Pavillion_Area_GW_Plume_ESI\ARR\Final ARR\All_Tables.xls

Table 17C3-C10 Gasoline Range Compounds from Production Wells and Domestic Wells
(ug/L)
Pavillion Area Groundwater Investigation ESI – ARRRevision: 0
Date: 08/2010 Page 81 of 82
AnalyteLaboratory
NameIsobutane ZymaXIsobutene ZymaXButane ZymaX3-Methyl-1-butene ZymaXIsopentane ZymaX1-Pentene ZymaX2-Methyl-1-butene ZymaXPentane ZymaXtrans-2-Pentene ZymaXcis-2-Pentene ZymaX2-Methyl-2-butene ZymaX2,2-Dimethylbutane ZymaXCyclopentene ZymaX4-Methyl-1-pentene ZymaXCyclopentane ZymaX2,3-Dimethylbutane ZymaX2-Methylpentane ZymaX3-Methylpentane ZymaXHexane ZymaXtrans-2-Hexene ZymaX2-Methyl-2-pentene ZymaX3-Methylcyclopentene ZymaX3-Methyl-2-pentene ZymaXcis-2-Hexene ZymaX2,2-Dimethylpentane ZymaX1,2-Dichloroethane (EDC) ZymaXMethylcyclopentane ZymaX2,4-Dimethylpentane ZymaX1-Methylcyclopentene ZymaXBenzene ZymaX5-Methyl-1-hexene ZymaX4,4-Dimethyl-2-pentene ZymaX3,3-Dimethylpentane ZymaXThiophene ZymaXCyclohexane ZymaX2-Methylhexane ZymaX2,3-Dimethylpentane ZymaX3-Methylhexane ZymaXtrans-1,3-Dimethylcyclopentane ZymaXcis-1,3-Dimethylcyclopentane ZymaX2-Methyl-1-hexene ZymaX1,2-Dimethylcyclopentane ZymaX2,2,4-Trimethylpentane ZymaXHeptane ZymaXtrans-2-Heptene ZymaXMethylcyclohexane ZymaX2,5-Dimethylhexane ZymaX2,4-Dimethylhexane ZymaX2,3,4-Trimethylpentane ZymaX2,3-Dimethylhexane ZymaX1,2-Dibromoethane (EDB) ZymaX2-Methylheptane ZymaX4-Methylheptane ZymaXToluene ZymaX2,3,3-Trimethylpentane ZymaX3,4-Dimethylhexane ZymaX2-Methylthiophene ZymaX3-Ethyl-3-methylpentane ZymaX3-Methylthiophene ZymaX3-Methylheptane ZymaXtrans-1,4-Dimethylcyclohexane ZymaX2-Methyl-1-heptene ZymaXtrans-1,2-Dimethylcyclohexane ZymaX1-Octene ZymaXOctane ZymaX
PGDW32 PGDW39 PGDW40 PGDW41 PGDW42 PGDW43 PGDW44 PGDW45 PGDW46 PGDW47 PGDW48 PGDW49 PGPW01 PGPW02 PGFB01 PGFM20 PGMW01
TDD No. 0901-01T:\START3\Pavillion Area GW Investigation\Pavillion_Area_GW_Plume_ESI\ARR\Final ARR\All_Tables.xls
Table 17C3-C10 Gasoline Range Compounds from Production Wells and Domestic Wells
(ug/L)
Pavillion Area Groundwater Investigation ESI – ARRRevision: 0
Date: 08/2010 Page 82 of 82
AnalyteLaboratory
Name2,2-Dimethylheptane ZymaX2,4,4-Trimethylhexane ZymaX2,4-Dimethylheptane ZymaX2,6-Dimethylheptane ZymaXEthylcyclohexane ZymaX2,5-Dimethylheptane ZymaXEthylbenzene ZymaX2-Ethylthiophene ZymaXm,p-Xylenes ZymaX3-Ethylheptane ZymaX3-Methyloctane ZymaX2,3-Dimethylheptane ZymaX4-Methyloctane ZymaX1,2,4-Trimethylcyclohexane ZymaXStyrene ZymaX2-Methyloctane ZymaX1,1,2-Trimethylcyclohexane ZymaXo-Xylene ZymaX1-Nonene ZymaXNonane ZymaX3,3,5-Trimethylheptane ZymaXIsopropylbenzene ZymaXIsopropylcyclohexane ZymaX2,2-Dimethyloctane ZymaX3-Methylnonane ZymaX3,3-Dimethyloctane ZymaXn-Propylbenzene ZymaX1-Methyl-3-ethylbenzene ZymaX1-Methyl-4-ethylbenzene ZymaX1,3,5-Trimethylbenzene ZymaX3,3,4-Trimethylheptane ZymaX1-Methyl-2-ethylbenzene ZymaX1,2,4-Trimethylbenzene ZymaX1-Decene ZymaX1-Methyl-3-isopropylbenzene ZymaXDecane ZymaXsec-Butylbenzene ZymaX1,2,3-Trimethylbenzene ZymaXIndane ZymaXIndene ZymaX1,3-Diethylbenzene ZymaXn-Butylbenzene ZymaX1,3-Dimethyl-5-ethylbenzene ZymaX1,4-Diethylbenzene ZymaX1-Methyl-2-propylbenzene ZymaX1,4-Dimethyl-2-ethylbenzene ZymaX1,3-Dimethyl-4-ethylbenzene ZymaX1,2-Dimethyl-4-ethylbenzene ZymaX1,3-Dimethyl-2-ethylbenzene ZymaXUndecane ZymaX1,2,4,5-Tetramethylbenzene ZymaX1,2,3,5-Tetramethylbenzene ZymaX1,2,3,4-Tetramethylbenzene ZymaXNaphthalene ZymaX2-Methylnaphthalene ZymaX1-Methylnaphthalene ZymaXBenzothiophene ZymaXn-Pentylbenzene ZymaX
PGDW32 PGDW39 PGDW40 PGDW41 PGDW42 PGDW43 PGDW44 PGDW45 PGDW46 PGDW47 PGDW48 PGDW49 PGPW01 PGPW02 PGFB01 PGFM20 PGMW01
TDD No. 0901-01T:\START3\Pavillion Area GW Investigation\Pavillion_Area_GW_Plume_ESI\ARR\Final ARR\All_Tables.xls