star’s presentations at the 2008 ams annual meeting · 1/18/2008 · star’s presentations at...
TRANSCRIPT

Slide 1
STAR’s Presentations at the 2008 AMS Annual Meeting
New Orleans, LA20 – 24 January 2008
1. I. Guch (Introduction)2. K. Pryor3. T. Schmit (2)4. L. Wang5. S. Goodman6. W. Wolf7. L. Zhou8. D. Lindsey9. R. Brummer10. B. Connell11. M. DeMaria12. L. Grasso13. D. Hillger14. M. Sengupta15. Y. Yu (3)16. B. Kuligowski17. C. Davenport18. X. Zhan19. X. Liang20. D. de Alwis21. R. Ferraro
AMS 2008

Slide 2
5th GOES Users’ Conference: Poster- An Initial Assessment of the GOES Microburst Windspeed Potential Index
Kenneth Pryor
• The GOES-sounder derived microburst products diagnose risk based on conceptual models of prototype environmental profiles.
• The GOES Microburst Windspeed Potential Index (MWPI) algorithm incorporates CAPE, and the temperature lapse rate and dew point depression difference between 670 and 850 mb. 670 mb represents the typical level of a convective cloud base over the U.S. Great Plains.
• Initial validation during the 2007 convective season indicated a strong correlation between MWPI values and observed surface downburst wind gusts.
– Correlation (r=.78) is statistically significant at the 97% confidence level.
– Represents a physical relationship between the MWPI and the strength of downburst wind gusts observed at the surface.
AMS 2008

Slide 3
Timothy J. Schmit NOAA/NESDIS
• The ABI is the next generation geostationary imager on GOES-R+.
• ABI improves over the current GOES imager by a factor of 3 spectrally, a factor or 4 spatially and a factor of 5 temporally.
• ABI will improve every product from the current Imager and will allow many new products.
• Synthetic and satellite data are being used to prepare for the ABI.
“Information volume”Imager and ABI:Current attributes defined to be 1.
From
AW
G P
roxy
The ABI (Advanced Baseline Imager) on GOES-R
AMS 2008
5th GOES Users’ Conference
Slide 4
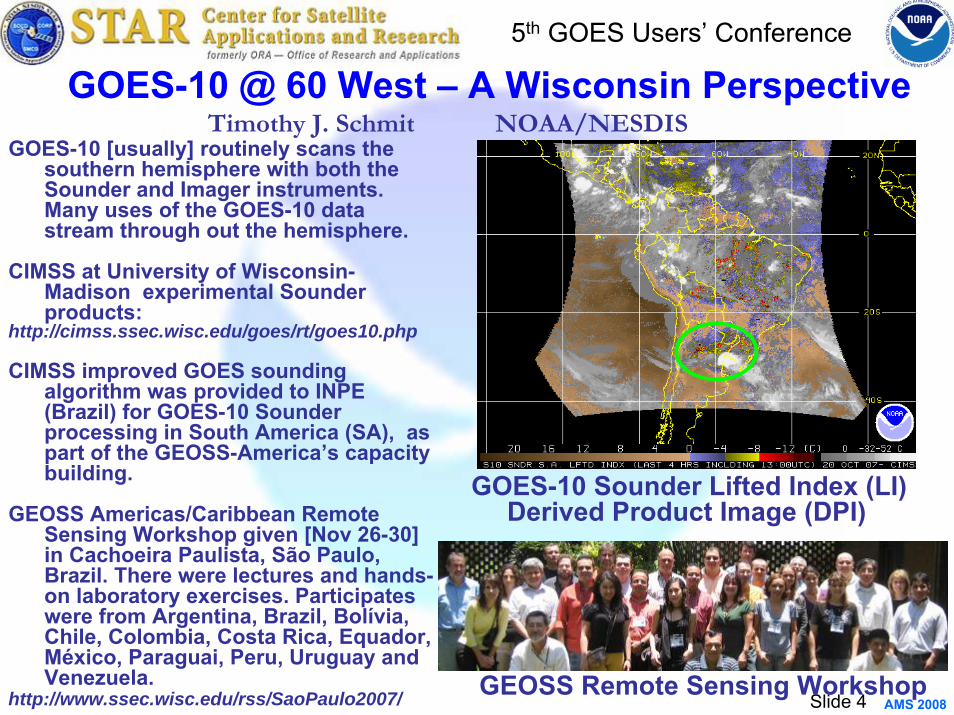
GOES-10 @ 60 West – A Wisconsin PerspectiveGOES-10 [usually] routinely scans the
southern hemisphere with both the Sounder and Imager instruments. Many uses of the GOES-10 data stream through out the hemisphere.
CIMSS at University of Wisconsin-Madison experimental Sounder products:
http://cimss.ssec.wisc.edu/goes/rt/goes10.php
CIMSS improved GOES sounding algorithm was provided to INPE (Brazil) for GOES-10 Sounder processing in South America (SA), as part of the GEOSS-America’s capacity building.
GEOSS Americas/Caribbean Remote Sensing Workshop given [Nov 26-30] in Cachoeira Paulista, São Paulo, Brazil. There were lectures and hands-on laboratory exercises. Participates were from Argentina, Brazil, Bolívia, Chile, Colombia, Costa Rica, Equador, México, Paraguai, Peru, Uruguay and Venezuela.
http://www.ssec.wisc.edu/rss/SaoPaulo2007/
GOES-10 Sounder Lifted Index (LI) Derived Product Image (DPI)
GEOSS Remote Sensing Workshop
Timothy J. Schmit NOAA/NESDIS
AMS 2008
5th GOES Users’ Conference

Slide 5
• Spectral convolution– IASI radiance convolved with GOES SRF – Focus on channel 3: spectral sensitive
channel
• Spatial collocation – Both sensor’s SZA < 10º
– SZA diff. < 1 º– Observational time diff. <15 min – Uniform constrain: stdev(BT)/mean(BT)
<0.001
ch3ch2
ch6 5 4
– One IASI footprint (4 pixels) compared with GOES pixels falling into IASI footprint
• Time Period– 03/2007- 12/2007– Sample number: 282
• Purpose– Fundamental support to the GSICS and
GOES-R Cal/Val
5th GOES User Conference:Poster – Inter-calibration of Geostationary Imagers with MetOP/IASI
Hyperspectral MeasurementsLikun Wang and Changyong Cao
Slide 6
GUC V and 3rd Conference on Meteorological Applications of Lightning DataOral – Geostationary Lightning Mapper for GOES-R and Beyond
Steven Goodman/ORA, Richard Blakeslee/NASA MSFC, William Koshak/NASA MSFC• Mission Requirements
– Provide continuous, full-disk lightning measurements for storm warning and nowcasting.
– Provide early warning of tornadic activity – Accumulate a long-term database to track decadal
changes [of lightning]• NASA Lead Role for Instrument
– Implementation Award Dec. 2007 to Lockheed Martin ATC for 1 Prototype, 4 Flight models
• NOAA Lead Role for L2 Algorithms– Clustering Algorithm
• Description: takes events and creates groups and flashes
• Pros: TRMM LIS and OTD heritage• Cons: non yet extended/optimal for GEO
– Cell Tracking Algorithm• Description: groups lightning to storm cells• Pros: LISDAD and RDT heritage, SCIT has
limitations• Cons: technically challenging, needs AWIPS
implementation for optimal utility– Flash Trending “Jump” Algorithm– Other Application Team Uses of GLM
• Hydology-Precipitation• AQ-NOx/Ozone• Clouds-Cloud Type/TRW, Hurricane Intensification• Aviation-Turbulence, Convective Initiation, Volcanoes AMS 2008
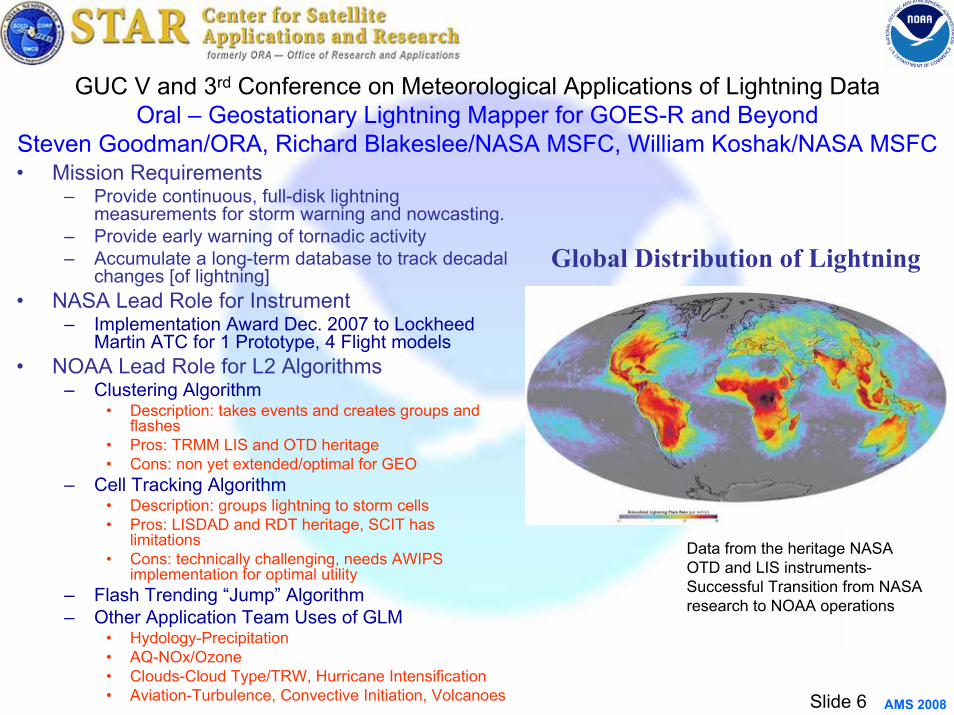
Data from the heritage NASA OTD and LIS instruments-Successful Transition from NASA research to NOAA operations
Global Distribution of Lightning

Slide 7
5th GOES Users’ Conference: Development of the GOES-R AWG Product Processing
System FrameworkWalter Wolf, Lihang Zhou, P. Keehn, Q. Guo, S. Sampson, S. Qiu, and Mitchell D. Goldberg
● The GOES-R Algorithm Working Group (AWG) Product Processing System Framework is under development at NOAA/NESDIS/STAR
● The goal is to develop a processing system where GOES-R AWG algorithms can be developed and tested is a well defined and organized manner
● Details of the framework will be presented:● Framework description● Algorithm information and how it is applied to the framework● Input configuration files● Interface between the framework and the product algorithms● Hardware and software infrastructure
Slide 8
5th GOES Users’ Conference: Quality Assurance of the GOES-R AWG Product
Processing SystemLihang Zhou, Walter Wolf, S. Qiu, P. Keehn, Q. Guo, S. Sampson, and Mitchell D. Goldberg
● The Algorithm Integration Team (AIT) is building a framework that can process all the GOES-R Level 2 products. The framework being built will be used to test the algorithms individually as well as a complete system with all products.
• Quality assurance activities will be performed throughout the GOES-R system software development life cycle.– Coding and Documentation Standards– Revision Control– Monitoring and Visualization– Verification and Validation
• The systematic approach for the quality assurance will enable faster and more efficient research to operation transitions.
Slide 9
5th GOES User’s Conference:Development of Severe Weather Products for the GOES-R ABI
D. T. Lindsey, D. Hillger, and L. Grasso
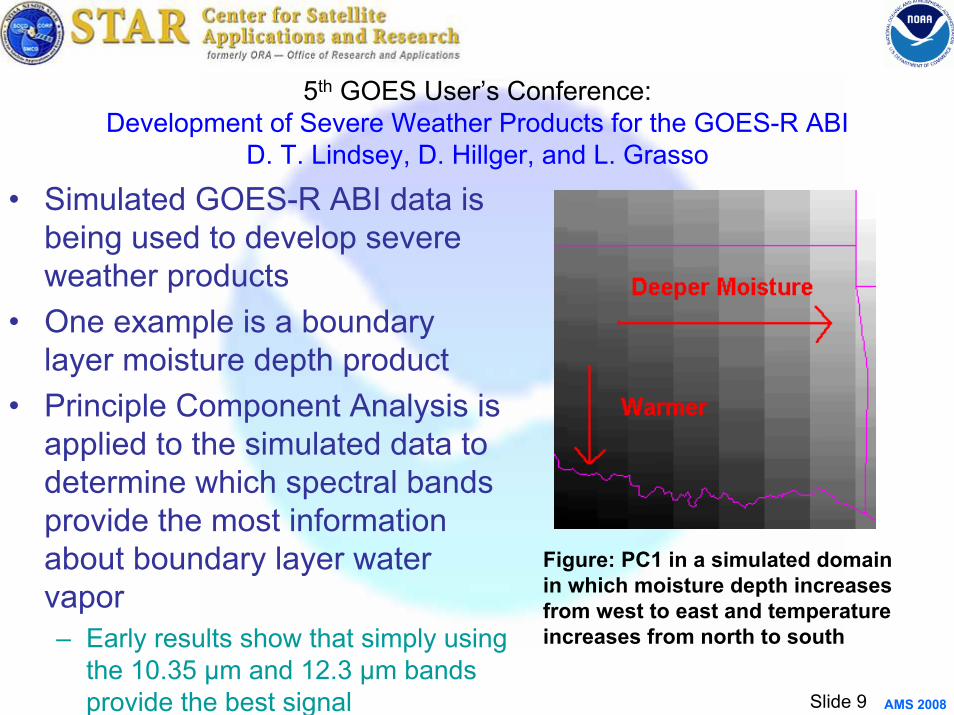
• Simulated GOES-R ABI data is being used to develop severe weather products
• One example is a boundary layer moisture depth product
• Principle Component Analysis is applied to the simulated data to determine which spectral bands provide the most information about boundary layer water vapor– Early results show that simply using
the 10.35 µm and 12.3 µm bands provide the best signal AMS 2008
Figure: PC1 in a simulated domain in which moisture depth increases from west to east and temperature increases from north to south
Slide 10
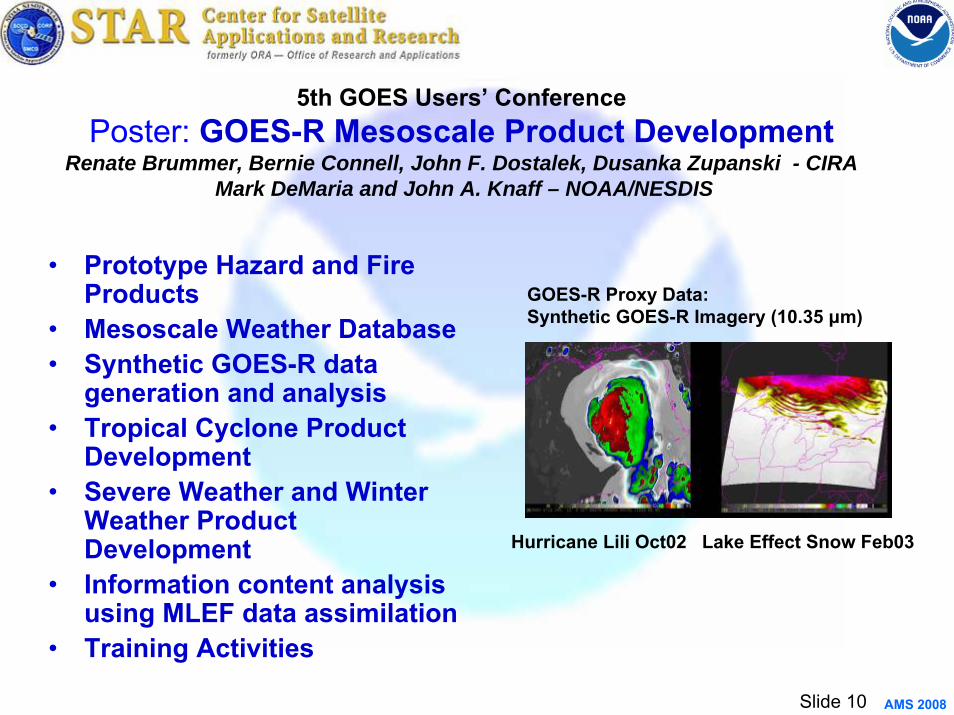
5th GOES Users’ ConferencePoster: GOES-R Mesoscale Product Development
Renate Brummer, Bernie Connell, John F. Dostalek, Dusanka Zupanski - CIRAMark DeMaria and John A. Knaff – NOAA/NESDIS
• Prototype Hazard and Fire Products
• Mesoscale Weather Database• Synthetic GOES-R data
generation and analysis• Tropical Cyclone Product
Development• Severe Weather and Winter
Weather Product Development
• Information content analysis using MLEF data assimilation
• Training Activities
AMS 2008
GOES-R Proxy Data:Synthetic GOES-R Imagery (10.35 μm)
Hurricane Lili Oct02 Lake Effect Snow Feb03

Slide 11
17th Symposium on Education (starts Sunday)Poster 1.54 – International focus group – virtually there with VISITview
B. Connell, V. Castro, M. Davison, A. Mostek, B. Fallas, K. Caesar, T. Whittaker
• Monthly bi-lingual virtual weather briefings– Collaborators: CIRA, CIMSS,
RMTCoE in Costa Rica and Barbados, NOAA NWS Training and NCEP/HPC International Desk
– Participants: forecasters, researchers, and students from Central and South America and the Caribbean.
– Utilize VISITview software and voice through the Internet.
• Keys to Success– (come find out what they are)
AMS 2008
Slide 12
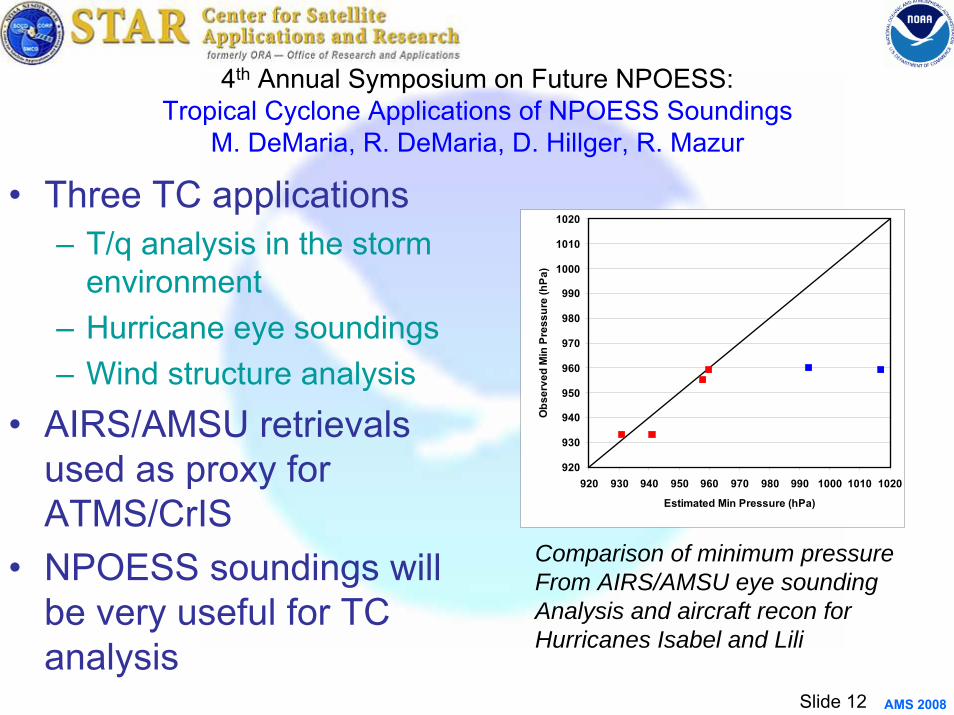
4th Annual Symposium on Future NPOESS:Tropical Cyclone Applications of NPOESS Soundings
M. DeMaria, R. DeMaria, D. Hillger, R. Mazur
• Three TC applications – T/q analysis in the storm
environment– Hurricane eye soundings– Wind structure analysis
• AIRS/AMSU retrievals used as proxy for ATMS/CrIS
• NPOESS soundings will be very useful for TC analysis
AMS 2008
920
930
940
950
960
970
980
990
1000
1010
1020
920 930 940 950 960 970 980 990 1000 1010 1020
Estimated Min Pressure (hPa)
Obs
erve
d M
in P
ress
ure
(hPa
)Comparison of minimum pressureFrom AIRS/AMSU eye sounding Analysis and aircraft recon for Hurricanes Isabel and Lili

Slide 13
5th GOES Users’ Conference:Synthetic GOES-R Imagery Development and Uses
Louie Grasso, Daniel Lindsey, Manajit Sengupta, and Mark DeMaria
AMS 2008
GOES-R AWG PROXY DATA FOR MESOSCALE WEATHER EVENTS.
GOES-R AWG PROXY DATA FOR FIRE HOT SPOTS
Slide 14
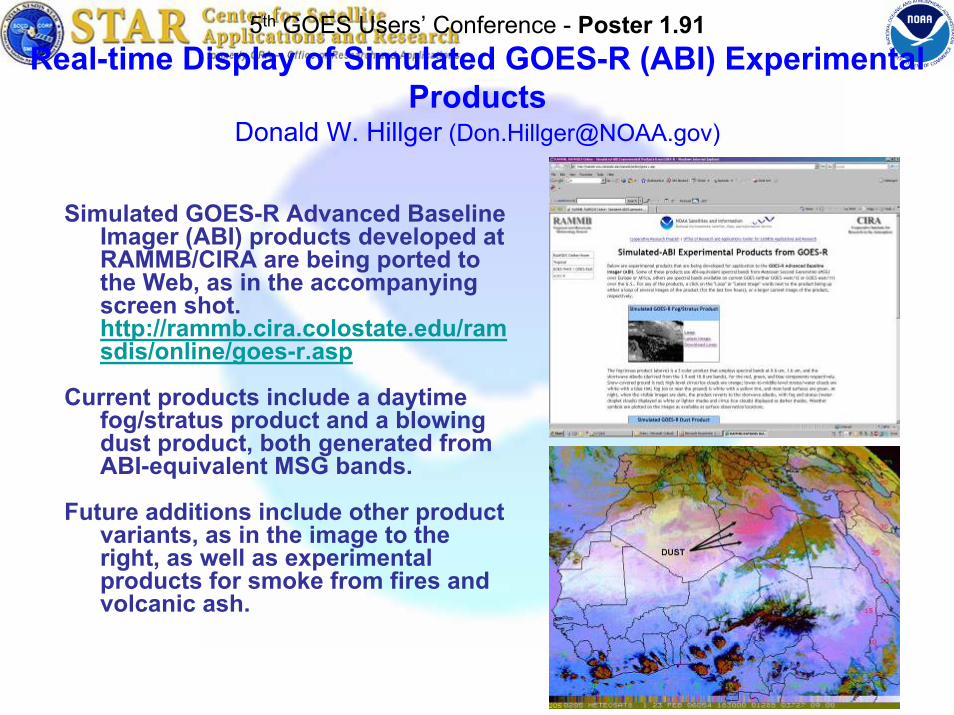
5th GOES Users’ Conference - Poster 1.91Real-time Display of Simulated GOES-R (ABI) Experimental
ProductsDonald W. Hillger ([email protected])
Simulated GOES-R Advanced Baseline Imager (ABI) products developed at RAMMB/CIRA are being ported to the Web, as in the accompanying screen shot. http://rammb.cira.colostate.edu/ramsdis/online/goes-r.asp
Current products include a daytime fog/stratus product and a blowing dust product, both generated from ABI-equivalent MSG bands.
Future additions include other product variants, as in the image to the right, as well as experimental products for smoke from fires and volcanic ash.

Slide 15
5th GOES Users ConferencePoster– Quantifying Uncertainties in Fire Size and Temperature Measured by GOES-R ABI
Manajit Sengupta, Louie Grasso, Don Hillger, Renate Brummer and Mark DeMaria
• Create Point Spread function for GOES-R ABI at high resolution.
Extract information from low resolution tables provided by MIT Lincoln Labs/U Wisconsin.
Use the information as constraint to create high resolution normalized point spread function assuming bivariate normal distribution.
• Create brightness temperatures distributions to characterize fire uncertainty
Compute brightness temperatures for 3 GOES-R ABI channels using assumed atmospheric profile and varying fire temperature.
Create distributions of GOES-R ABI pixel brightness temperatures for varying sub-pixel fire location within a GOES-R ABI pixel keeping the fire size and temperature constant.
Analyze uncertainty based on the brightness temperature distributions for different fire sizes and temperatures.
AMS 2008
3.9 µm Point spread function
Brightness temperature distribution
Slide 16
5th GOES Users’ Conference: Poster
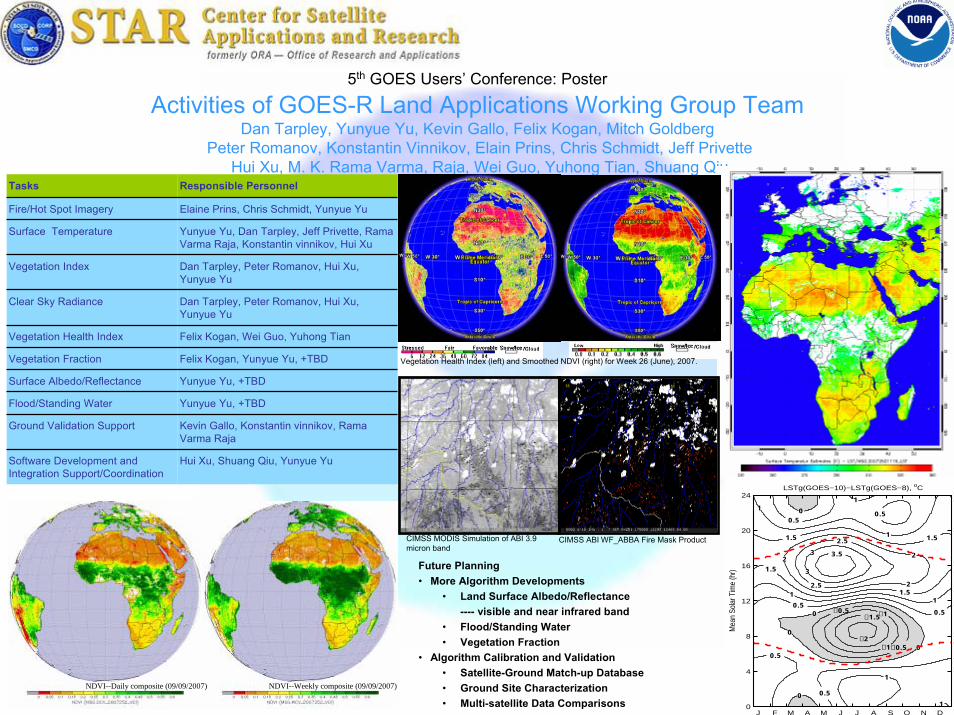
Activities of GOES-R Land Applications Working Group TeamDan Tarpley, Yunyue Yu, Kevin Gallo, Felix Kogan, Mitch Goldberg
Peter Romanov, Konstantin Vinnikov, Elain Prins, Chris Schmidt, Jeff Privette Hui Xu, M. K. Rama Varma, Raja, Wei Guo, Yuhong Tian, Shuang Qiu
AMS 2008
Tasks Responsible Personnel
Fire/Hot Spot Imagery Elaine Prins, Chris Schmidt, Yunyue Yu
Surface Temperature Yunyue Yu, Dan Tarpley, Jeff Privette, RamaVarma Raja, Konstantin vinnikov, Hui Xu
Vegetation Index Dan Tarpley, Peter Romanov, Hui Xu, Yunyue Yu
Clear Sky Radiance Dan Tarpley, Peter Romanov, Hui Xu, Yunyue Yu
Vegetation Health Index Felix Kogan, Wei Guo, Yuhong Tian
Vegetation Fraction Felix Kogan, Yunyue Yu, +TBD
Surface Albedo/Reflectance Yunyue Yu, +TBD
Flood/Standing Water Yunyue Yu, +TBD
Ground Validation Support Kevin Gallo, Konstantin vinnikov, RamaVarma Raja
Software Development and Integration Support/Coordination
Hui Xu, Shuang Qiu, Yunyue Yu
NDVI--Daily composite (09/09/2007) NDVI--Weekly composite (09/09/2007)
Vegetation Health Index (left) and Smoothed NDVI (right) for Week 26 (June), 2007.
Future Planning• More Algorithm Developments
• Land Surface Albedo/Reflectance ---- visible and near infrared band
• Flood/Standing Water • Vegetation Fraction
• Algorithm Calibration and Validation• Satellite-Ground Match-up Database• Ground Site Characterization• Multi-satellite Data Comparisons
CIMSS ABI WF_ABBA Fire Mask ProductCIMSS MODIS Simulation of ABI 3.9 micron band
−2−1.5 −1
−1
−0.5
−0.5
0
0
0
0
0
0.5
0.5
0.5
0.5
0.5
0.5
1
1
1
1
1
1
1
1.5 1.5
1.5
1.5
2
2 2
2.5
2.5
3
3.5
Mea
n So
lar T
ime
(hr)
LSTg(GOES−10)−LSTg(GOES−8), oC
−2
−1.5−1
−1
−0.5
−0.5
0
0
0
0
0
0.5
0.5
0.5
0.50.5
0.51
1
1
1
1
11
1.5 1.5
1.5
1.52
22
2.5
2.5
3
3
3.5
J F M A M J J A S O N D 0
4
8
12
16
20
24

Slide 17
5th GOES Users’ Conference: Poster
Applying Split Window Technique for Land Surface Temperature Measurement from GOES-R Advanced Baseline Imager
Yunyue Yu, Dan Tarpley, M.K Rama Varma Raja, Hui Xu, Konstantin Vinnikov
• AlgorithmNine candidate SW algorithms were analyzed and tested using MODTRAN radiative transfer model.
• Sensitivity StudyAlgorithm sensitivities to surface emissivity, atmospheric water vapor content, satellite zenith angle, coefficients miss-use were analytically estimated and demonstrated.
• EvaluationAlgorithm is applied to the GOES-8 and GOES-10 data. The derived LSTs were compared to the ground LSTs estimated from six sites of SURFRAD stations, for the year 2001.
• Summary–Split window technique is applied for generating
GOES-R LST product, which is simple, robust, yet accurate enough to meet the mission requirement.
–Coefficients of the LST algorithm should be stratified for daytime, nighttime and dry, moist atmospheric conditions.
–Two biggest errors are the surface emissivity uncertainty and the atmospheric absorption at very moist atmospheric conditions and/or large satellite zenith angle.
–The evaluation done is primarily, yet promising.AMS 2008
Scatter plot comparison of GOES-8 LST and SUFRAD LST of all the match-up data. Better statistical results of the LST differences are observed (not shown here) after removing residual noises using seasonal and annual signals.

Slide 18
AbstractThe Advanced Baseline Imager (ABI) instrument onboard the GOES-R series satellites, which is
expected to be launched in the year 2014, has considerable potential for providing accurate retrievalsof Land Surface Temperature (LST). At NOAA/NESDIS/STAR, Yu et al. (2008) have developed andrefined a number of independent unique split window LST retrieval algorithms applicable for the ABIsensor. These algorithms are being evaluated through radiative transfer model simulations as well asthrough ground-truth data. For the ground-truth evaluation, the LST algorithms have beenapplied to one year of GOES-8 and GOES-10 measurements in the year 2001, and then compared withcoincident LST estimates from Surface Radiation Network (SURFRAD) irradiance measurements. Thispaper describes a manual cloud filtering method which we developed for the SUFRAD-GOES datacomparison purpose.
The manual cloud filtering technique is applied to the spatially closest GOES pixel to the SURFRADsite, to determine if the pixel is cloudy or clear, in order to filter out the cloud-contaminated LSTretrievals. This way of pixel cloud filtering employs visual determination of cloudiness based onvisible channel 1 reflectance image, IR channel 4 brightness temperature image, daily time seriescurves of solar irradiance provided by the SURFRAD pyranometer, the broadband sky irradianceprovided by the SURFRAD PIR instrument and a number of channel differences. While the solarirradiance curve provides much help during the day time, the down-welling sky irradiance curve isshown to be the most useful tool along with the channel 4 brightness temperature images incloudiness determination irrespective of whether it is day or night. The combined use of GOES data infive different channels and the paired SURFRAD data of solar irradiance and down-welling skyradiance ensured high quality cloud filtered data during both day and night timings. The details of themanual cloud filtering criteria are discussed. The challenges in effective cloud filtering of GOES-dataand how the combined use of GOES and SURFRAD data can be successfully utilized to address themin the context of this study are demonstrated with examples. A future generalized automated clouddetection scheme for satellite based multi-band passive radiometer data is discussed.
The Manual Cloud Filtering of GOES-satellite data through combined use of satellite and ground measurements Purpose of the Study
This study is intended to develop an accurate cloud filtering procedure for evaluating the Infrared split window channels based Land Surface Temperature (LST) retrievals from Geostationary Satellites over contiguous United States of America. At present the tools developed in the study are manually employed to accomplish accurate cloud filtering. The eventual goal is to develop an automated threshold based cloud filtering scheme for land surface parameter retrievals using space based IR radiometer data.
Data sets used in the study 1.Ground based Surface Radiation Network (SURFRAD) data of solar irradiance.2.Ground based SURFRAD downwelling broadband (3 to 50 microns) thermal sky
irradiance.3.Ground based SURFAD LST.4.GOES Ch4, Ch5, & Ch2 Brightness Temperature data.5.GOES Ch1 (visible channel centered around 0.65 microns) reflectance data.
Results:
M.K. Rama Varma Raja2, Yunyue Yu1, Dan Tarpley1, Hui Xu2, K. Y. Vinnikov31NOAA/NESDIS Center for Satellite Applications and Research, email: [email protected], [email protected] I. M. Systems,Group, Inc. email: [email protected], [email protected] K. Y. Vinnikov, email: [email protected]
Down-looking PIR at 8 meter height from the ground
UP-looking PIR
Diffuse Radiometer
Down-looking PIR on the towerAt 8-m from ground
Thermometer
Anemometer
The temporal resolution of the SURFRAD data is 3-minutes. The SURFRAD down-looking Precision Infrared Radiometer (PIR) measures the up-welling radiation in the spectral range from 3 microns to 50 microns (Augustine et al., 2000; 2005). LST is estimated from this up-welling irradiance measurements. Similarly the up-looking PIR measures the down-welling sky irradiance in the same spectral range. The photograph of PIRs from Pennsylvania State University site is shown in Figures 2 a & b.
Figure 1. SURFRAD sites Figure 2a. SURFRAD suite Figure 2b. PIR tower
SUMMARY1. A new procedure for manual filtering of clouds which employs both satellite as well as ground-based
SURFRAD data sets has been developed and applied over one year (2001) of GOES-8 and GOES10 imager data matched with six different SURFRAD sites. These manually filtered data sets are then used to evaluate LST algorithm performance (see Yu et al. 2008, Poster P1.9) and also for studies on seasonal and diurnal cycles (see Vinnikov et al. 2008, Poster 1.56).
2. The developed manual cloud filtering demonstrates the usefulness of ground-based solar irradiance measurements and the down-welling broadband sky thermal irradiance measurements in identification and filtering of cloudiness in satellite pixel data in close proximity to SURFRAD site. The solar irradiance data are found to be mainly useful during day time in detection of clouds. But down-welling sky irradiance data are found to be useful for both day and night. In addition down-welling irradiance helps in detection of thin sub-visible clouds. Also it has been demonstrated that the use of ground-based SURFRAD data helps in potential false identification of cloudy pixels.
3. With increasing number of ground-based radiation measurement sites over Contiguous United States (CONUS) such as Climate Reference Network (CRN), SURFRAD, GEWEX, and other similar network, it might be possible to develop an efficient operational cloud filtering scheme for any satellite data over CONUS region or regions over the globe with similar network. Thus ground-based radiation data can be complementary to multi-band satellite radiometer data for cloud filtering purpose.
FUTURE WORKTo consolidate the manual cloud filtering tool into an automated cloud filtering algorithm for satellite data.
SURFace RADiation (SURFRAD) BudgetObserving NetworkFigure1 given below shows the location of the SURFRAD sites across United States. The latest addition is at Sioux Falls (SD) in 2003. At each of the observational sitesin the network a variety of ground based instruments are routinely providing variousradiance measurements. In addition to the radiance measuring instruments there are
co-located meteorological instruments for providing surface meteorological observations tocomplement the radiance data. Also there are cloud tracking cameras to provide informationon the sky conditions.
MethodologyThe spatially closest GOES pixel is chosen for cloud filtering. The spatially closest pixel is identified as the one with minimum resultant distance to SURFRAD site. Once the closest pixel is identified the corresponding GOES imager brightness temperature data from Channel 2 (Ch2), Channel 3 (Ch3), Channel 4 (Ch4), and Channel 5 (Ch5) are used to form the channel differences such as Ch4-Ch5, Ch4-Ch2 and Ch4-Ch3. In addition to the channel differences, the standard deviation of Ch4 brightness temperature for a 3 by 3 array with the spatially closest pixel as the center is computed. These estimated GOES channel differences and standard deviation are used in conjunction with ground based SURFRAD data to determine if the spatially closest pixel is cloudy or clear. The SURFRAD data sets used are the daily time series of down-welling solar irradiance measured by the up-looking SURFRAD pyranometer and down-welling broad-band sky irradiance measured by the up-looking Precision Infrared Radiometer with a band width from 3 microns to 50 microns. In addition to these, the daily LST values derived from the upwelling irradiance measured at the SURFRAD sites are also used in the determination of cloudy versus clear conditions. The temporally closest SURFRAD observation to the GOES observation time is picked-up for forming the coincident GOES-SURFRAD pair. The SURFRAD land surface temperature used in the cloud filtering corresponds to this temporally closest observation. For day time clear sky conditions the corresponding time series curve of SURFRAD down-welling solar irradiance should appear as a smooth parabolic curve without any distortion (see Figure 3a). If there is any distortion, then it is generally an indication of presence of cloudiness for the corresponding times (see Figure 3b).
The time series curve of solar irradiance is useful in determining cloudy or clear sky conditions during day time only. The time series of down-welling sky irradiance in the 3 microns to 50 microns band can be effectively used to determine the clear or cloudy conditions, irrespective of day or night. Ideally under clear sky conditions the daily down-welling infrared sky irradiance should appear as a smoothly varying curve as a function of time without any significant distortions or kinks (see Figure 4a). For most of the cloudy conditions, the sky irradiance measured at the SURFRAD site appeared to have enhancing kinks because of the fact that cloud is warmer than the sky radiation presumably coming from space or upper atmosphere (see Figure 4b). The distortions in the daily time series curves of down-welling solar irradiance and down-welling sky irradiance corresponding to the hour of GOES observation under analysis are visually diagnosed and used to determine if the spatially closest GOES pixel is cloudy or cloud less. Figures 4 (c and d) are hourly GOES Channel 4 and Channel 1 images respectively showing a clear case on October 18, 2001 at Goodwin Creek site.
Figure. 3a. The time series of the solar irradianceon February 3, 2001, measured by the SURFRADpyranometer at Goodwin Creek Site. Note that thesolar irradiance varies smoothly as a function of time.This is typical behavior of solar irradiance on a clear day.
Figure. 3b. The time series of the solar irradianceon February 4, 2001, measured by the SURFRADpyranometer at Goodwin Creek Site. The solarirradiance curve is highly distorted in this case indicating the presence of cloudiness over the site.
Figure 4a: Typical time series curve of down-wellingsky irradiance in the 3 microns to 50 microns bandon a clear day (October 18, 2001) at Goodwin Creek(black curve). Note that the sky irradiance pattern is relatively smooth varying in this case. Correspondingsky temperature time series also is shown (red curve).
Figure 4b: Time series curve of down-wellingsky irradiance (black) in the 3 microns to 50 microns band on February 3, 2001, at Goodwin Creek.Note that the sky irradiance pattern shows enhancingkinks at different times of the day, which is generallyan indication of the presence of cloudiness overthe site..
The Informal Criteria for visual cloud filtering 1. The difference between the top of the atmosphere channel 4 brightness temperature from GOES
satellite for the spatially closest pixel and the land surface temperature derived from SURFRAD measurements should be generally 5 K or less for clear sky conditions.
2. The standard deviation of the 3 by 3 pixel array GOES channel 4 brightness temperature should no exceed 1.5 K.
3. The absolute difference between GOES channel 4 and channel 2 brightness temperatures should not exceed 5 K.
4. The absolute difference between GOES channel 4 and channel 5 brightness temperatures should not exceed 1 K.
5. The time series curves of solar irradiance should be smoothly varying without distortions.6. The time series curves of down-welling infrared irradiance also should be smoothly varying in time
without any significant enhancement.7. The average reflectance for the spatially closest GOES-pixel should be generally less than 40% except
for snow conditions which can be mostly identified from sequence of hourly GOES images. Snow is more static than clouds.
8. Finally the 0.5 degree by 0.5 degree around the SURFRAD site must be visually clear of clouds to form coincident pairs of cloud-free SURFRAD and GOES data.
Figure 4c: Image of GOES Channel 4 BT, corresponding to16:02 GMT on October 18, 2001at Goodwin Creek. The orange cross mark at the center shows the SURFRAD site. The parameters on the image correspond to spatially closest GOES pixel and are: Ts (SURFRAD LST), Tb4 (GOES Ch4 BT),Dif (Ts-Tb4), SD (stdev of Tb4), GST (GOES retrieved LST), Df (Ts-GST), Dis(resultantdistance in km), T5 (Channel 5 BT), Df (Tb4-T5), AT (atmospheric temperature), Df (Ts-AT), Df(GST-Tb4), C42 (Tb4-Channel 2 BT), C43 (Tb4-Channel 3 BT).
Figure 4d: Image of GOES Channel 1reflectance Corresponding to 16:02 GMTon October 18, 2001 at Goodwin Creek. The parameter ‘R’ printed is the reflectancewhich corresponds to the spatially closest pixelto SURFRAD site. This case representsa clear-pixel case.
Figure. 5 (a,b,c,&d): The time series curve for SURFRAD down-welling infra-red irradiance, time series of SURFRAD solar irradiance, GOES East Channel 4 brightnessTemperature image for the hour 21:15 GMT, GOES channel 1 reflectance for the same hour, respectively on September 29, 2001 for Goodwin Creek site. The time seriescurves show consistently the cloudiness on this day between the period of nearly 17 GMT to 22 GMT. However, the derived parameters from GOES channels such asstandard deviation of brightness temperature, various channel differences, (GOES-SURFRAD) LST differences, etc. do not show clearly the presence of cloudiness at thesite during this period. The channel 1 reflectance value is low and looks normal, but the pattern is cloudy. If one relies exclusively on satellite channel derived parametersto detect cloudiness in this case, possibly this could be erroneously classified as clear. However the use of ground based SURFRAD data helped to correctly detect thepresence of cloudiness over the site. This example demonstrates the value of ground based data sets from routine observational network such as SURFRAD, CRN,GEWEX, etc. in efficient cloud filtering of satellite IR data for Land Surface applications.
(a) (b) (c) (d)
Figure. 6 (a,b,c,&d): The time series curve for SURFRAD down-welling infra-red irradiance, time series of SURFRAD solar irradiance, GOES East Channel 4 brightnessTemperature image for the hour 17:02 GMT, GOES channel 1 reflectance for the same hour, respectively on April 29, 2001 for Bondville site. The time seriescurves show consistently the clear-sky condition most of the hours on this day. Accordingly the derived standard deviation of GOES channel 4 brightness temperature issignificantly smaller. However (GOES-SURFRAD) LST differences are relatively larger for a number of GOES-hourly retrievals on this day including 17:02 GMT making ita suspicious retrieval with cloud contamination. The surface temperature estimate from SURFRAD and top-of-the atmosphere brightness temperature has larger difference(usually for most of the clear conditions it is 5K or less) which reduces further the confidence in retrieval. However the SURFRAD time series curves shown here confirm thatthe observations are made under clear-conditions as solar irradiance curve and down-welling irradiance curve do not show any impact of cloudiness. Thus the reason forobserved large difference in LST is not related to cloud contamination, but related to the representativeness of the SURFRAD LST for its surroundings. This exampledemonstrates the value of ground based data sets from routine observational network such as SURFRAD, CRN, GEWEX, etc. in avoiding false detection of cloudiness andensure efficient cloud detection of satellite IR data for Land Surface applications.
(a) (b) (c) (d)
Solar irradiancedoes not showany cloud effect
Figure 7a.
Broadbandsky irradianceshows kinksusually indicationof cloudiness
Figure 7b.
Figure 7 (a & b): Time seriescurves of SURFRAD solarirradiance and sky irradianceon May 9, 2001, for Desert Rock site.Comparison of these two curvesdemonstrates the usefulness ofsky irradiance measurements indetecting thin sub-visible clouds.

Slide 19
5th GOES-R Users Conference:Poster – Status Update from the GOES-R Hydrology Algorithm Team
R. J. Kuligowski
• GOES-R Algorithm Working Group (AWG) Hydrology Algorithm Team (AT)– Provide recommended, demonstrated, and validated algorithms for processing
GOES-R observations into• Probability of rainfall (0-3 h)• Rainfall potential (0-3 h)• Rainfall Rate / QPE
– Members from NOAA, NASA, ESSIC, UC-Irvine• Current Status
– Four rain rate estimation and three nowcasting algorithms were modified by the developers using SEVIRI data as an ABI proxy
– Developers provided evaluation fields to the Hydrology AT for 16 days in January, April, July, October 2005 over selected regions
– Intercomparison is underway; selection will be completed by end of February 2008
• Next Steps:– Derive the probability of rainfall algorithm from the selected rain rate and
nowcasting algorithms by calibrating against ground validation data– Integrate the source code from the selected algorithms into the AWG processing
framework, meeting requirements for code format and for internal and external documentation AMS 2008

Slide 20
XXIInd Conference on Hydrology:An improved GOES parallax correction scheme for rainfall estimation
J. C. Davenport and R.J. Kuligowski• Dated parallax adjustment
scheme– Standard atmosphere– Rounded off– High clouds only
• New scheme– Lookup with NAM model– All clouds– Preserves cloud morphology
• Verification– Much improved match between
paired east/west images
AMS 2008
Slide 21
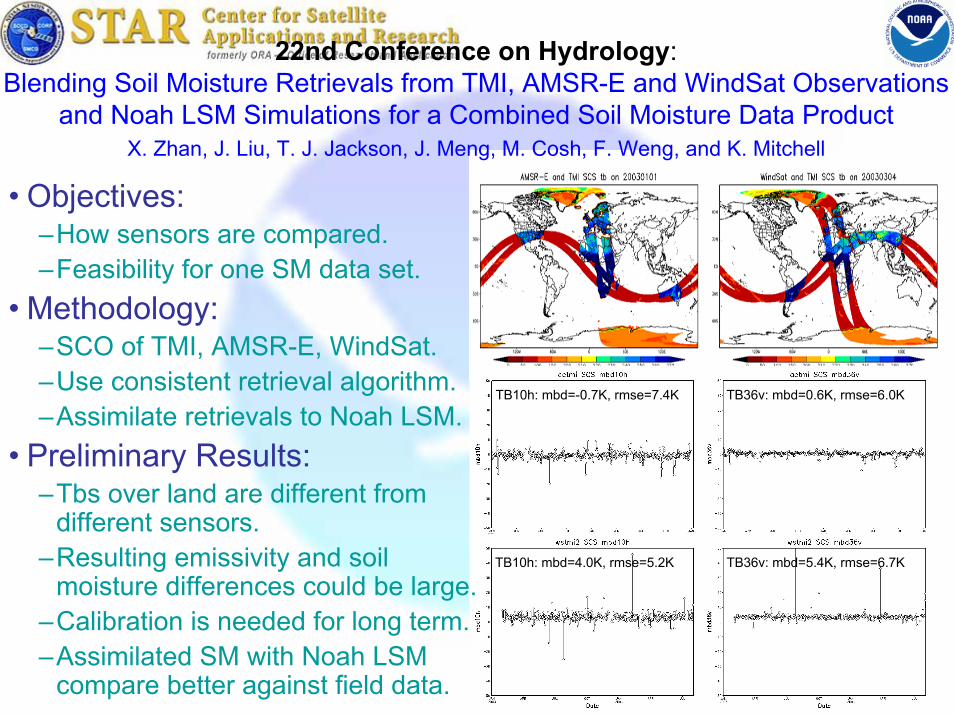
22nd Conference on Hydrology:Blending Soil Moisture Retrievals from TMI, AMSR-E and WindSat Observations
and Noah LSM Simulations for a Combined Soil Moisture Data ProductX. Zhan, J. Liu, T. J. Jackson, J. Meng, M. Cosh, F. Weng, and K. Mitchell
AMS 2008
TB10h: mbd=-0.7K, rmse=7.4K
TB10h: mbd=4.0K, rmse=5.2K TB36v: mbd=5.4K, rmse=6.7K
TB36v: mbd=0.6K, rmse=6.0K
• Objectives:–How sensors are compared.–Feasibility for one SM data set.
• Methodology:–SCO of TMI, AMSR-E, WindSat.–Use consistent retrieval algorithm.–Assimilate retrievals to Noah LSM.
• Preliminary Results:–Tbs over land are different from
different sensors.–Resulting emissivity and soil
moisture differences could be large.–Calibration is needed for long term.–Assimilated SM with Noah LSM
compare better against field data.
Slide 22
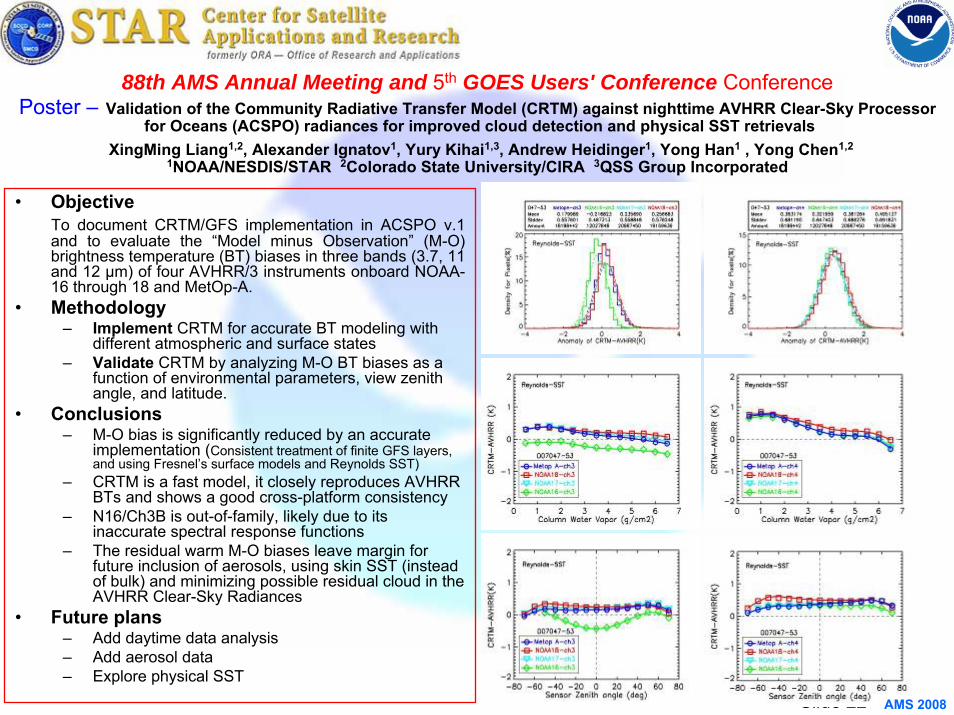
88th AMS Annual Meeting and 5th GOES Users' Conference ConferencePoster – Validation of the Community Radiative Transfer Model (CRTM) against nighttime AVHRR Clear-Sky Processor
for Oceans (ACSPO) radiances for improved cloud detection and physical SST retrievalsXingMing Liang1,2, Alexander Ignatov1, Yury Kihai1,3, Andrew Heidinger1, Yong Han1 , Yong Chen1,2
1NOAA/NESDIS/STAR 2Colorado State University/CIRA 3QSS Group Incorporated
• Objective To document CRTM/GFS implementation in ACSPO v.1 and to evaluate the “Model minus Observation” (M-O) brightness temperature (BT) biases in three bands (3.7, 11 and 12 μm) of four AVHRR/3 instruments onboard NOAA-16 through 18 and MetOp-A.
• Methodology– Implement CRTM for accurate BT modeling with
different atmospheric and surface states– Validate CRTM by analyzing M-O BT biases as a
function of environmental parameters, view zenith angle, and latitude.
• Conclusions– M-O bias is significantly reduced by an accurate
implementation (Consistent treatment of finite GFS layers, and using Fresnel’s surface models and Reynolds SST)
– CRTM is a fast model, it closely reproduces AVHRR BTs and shows a good cross-platform consistency
– N16/Ch3B is out-of-family, likely due to its inaccurate spectral response functions
– The residual warm M-O biases leave margin for future inclusion of aerosols, using skin SST (instead of bulk) and minimizing possible residual cloud in the AVHRR Clear-Sky Radiances
• Future plans– Add daytime data analysis– Add aerosol data– Explore physical SST
AMS 2008
Slide 23
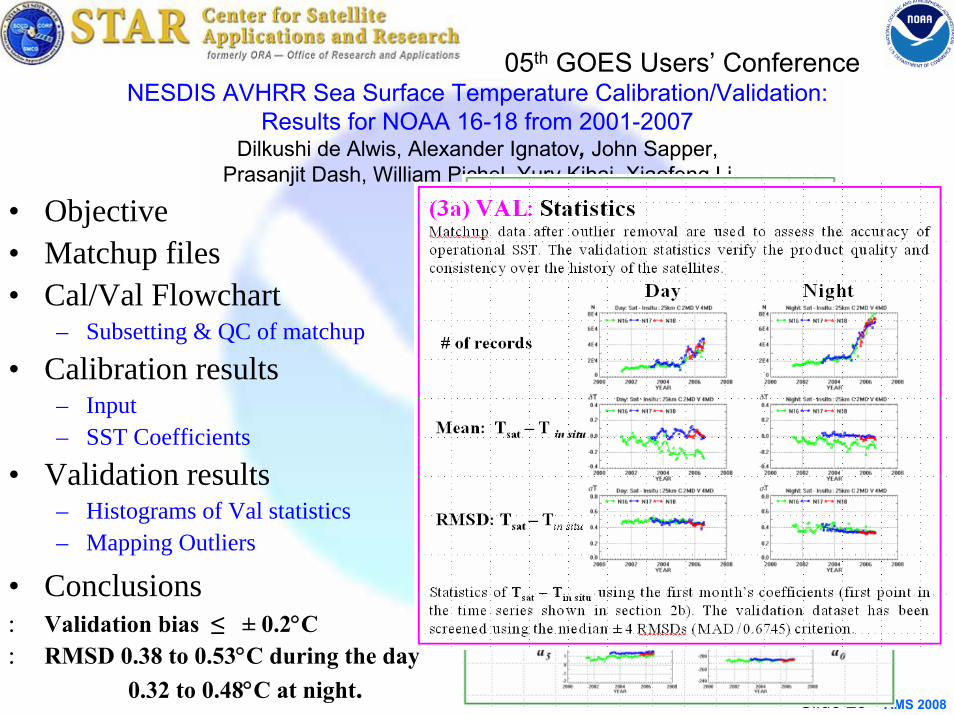
05th GOES Users’ Conference NESDIS AVHRR Sea Surface Temperature Calibration/Validation:
Results for NOAA 16-18 from 2001-2007 Dilkushi de Alwis, Alexander Ignatov, John Sapper,
Prasanjit Dash, William Pichel, Yury Kihai, Xiaofeng Li
• Objective• Matchup files• Cal/Val Flowchart
– Subsetting & QC of matchup
• Calibration results– Input– SST Coefficients
• Validation results– Histograms of Val statistics– Mapping Outliers
• Conclusions: Validation bias ≤ ± 0.2°C : RMSD 0.38 to 0.53°C during the day
0.32 to 0.48°C at night.AMS 2008

Slide 24
20th Conference on Climate Variability and Change: P2.6-A New Satellite Derived Precipitation Data Set for Studying Trends in Extreme Events
Ralph Ferraro, Tom Smith, Matt Sapiano, Renu Joseph and Huan Meng
• A new precipitation data set for climate studies has been developed that has the following attributes
– It uses all available passive microwave satellite data
– It uses the latest version of GPROF for use with SSM/I, TMI and AMSR-E
– It uses the latest version of the AMSU precipitation product
– It uses an Optimum Interpolation (OI) scheme to combine the data, which has been gridded to an hourly, 0.25 degree grid
– Initial data period: 1998 – 2006, future will expand to 1993 – 2007.
• Preliminary results:– Product comparable in quality to
GPCP, CMORPH, etc.– Some artifacts exist
• Bias between GPROF and AMSU?• Data set will be excellent to investigate
“other” climate signatures– Changes in rainfall distributions on 6-hr
to monthly time scale– Shifts in diurnal cycle of rainfall
AMS 2008