stars - arxiv.org · spin-orbit evolution of stars and exoplanets 3 over 70 stars,vidotto et...
TRANSCRIPT

MNRAS 000, 1–18 (2016) Preprint 12 September 2017 Compiled using MNRAS LATEX style file v3.0
A semi-empirical model for magnetic braking of solar-typestars
Leila Sadeghi Ardestani,1? Tristan Guillot,2 Pierre Morel 21School of Astronomy, Institute for Research in Fundamental Sciences (IPM), P. O. Box 19395-5531, Tehran, Iran2Universite Cote d’Azur, Observatoire de la Cote d’Azur, CNRS UMR 7293, 06304 Nice Cedex 4, France
Published: 14 August 2017
ABSTRACTWe develop new angular momentum evolution models for stars with masses of 0.5to 1.6 M and from the pre-main-sequence (PMS) through the end of their main-sequence (MS) lifetime. The parametric models include magnetic braking based onnumerical simulations of magnetised stellar winds, mass loss rate prescription, core-envelope decoupling as well as disk locking phenomena. We have also accounted forrecent developments in modelling dramatically weakened magnetic braking in starsmore evolved than the Sun. We fit the free parameters in our model by comparingmodel predictions to rotational distributions of a number of stellar clusters as wellas individual field stars. Our model reasonably successfully reproduces the rotationalbehaviour of stars during the PMS phase to the zero-age main-sequence (ZAMS) spinup, sudden ZAMS spin down, and convergence of the rotation rates afterwards. We findthat including core-envelope decoupling improves our models especially for low-massstars at younger ages. In addition, by accounting for the almost complete suppressionof magnetic braking at slow spin periods, we provide better fits to observations ofstellar rotations compared to previous models.
Key words: Spin-orbit Evolution - Angular Momentum Transfer - Magnetic Braking
1 INTRODUCTION
Angular momentum evolution in low-mass stars is a resultof a complex interplay between initial conditions during starformation, the stellar structure evolution, and the behaviourof stellar winds and magnetic fields. During the life of a low-mass star on the main-sequence (MS), angular momentumis lost to the magnetised wind (magnetic braking). By re-moving angular momentum, winds cause their host stars tospin down with time (e.g., Schatzman 1962; Kawaler 1988).Since rotation is the most important parameter that deter-mines the strength of a star’s magnetic dynamo, this spindown leads to a decrease in the magnetic activity of low-mass stars as they age (e.g., Skumanich 1972; Vidotto et al.2014).
The study of angular momentum evolution has bene-fited a lot from recent measurements of rotation rates instar-forming regions (e.g., Irwin et al. 2011), young openclusters (e.g., Hartman et al. 2010) and the field stars (e.g.,McQuillan et al. 2014; Leao et al. 2015) covering an agerange from 1 Myr to about 10 Gyr. These results provide adetailed view of how surface rotational velocity changes as
? E-mail: [email protected]
stars evolve from the PMS, through the ZAMS to the lateMS. And a number of models have been developed to ac-count for these observations (e.g., Irwin et al. 2007; Gal-let & Bouvier 2015; Johnstone et al. 2015). These modelsgenerally incorporate a wind braking law, disk locking andcore-envelope decoupling into their parametric models andin order to find an explanation for the observations.
In order to satisfy observational constraints, most ofthese models have to incorporate three major physical pro-cesses: star-disk interaction during the PMS, redistributionof angular momentum in the stellar interior, and angularmomentum loss due to stellar winds. Star-disk interactionprevents the star spinning up during the PMS, although it iscontracting at a fast rate. Recent theoretical advances havehighlighted the impact of accretion/ejection phenomena onthe angular momentum evolution of young suns (e.g., Mattet al. 2012; Zanni & Ferreira 2013). The amount of angu-lar momentum stored in the stellar interior throughout itsevolution is usually unknown because observations have sofar only revealed surface rotation, except for the Sun (e.g.,Hiremath 2013) and for a few evolved giants (e.g., Deheuvelset al. 2012).
It has recently been possible to gain a qualitative esti-mate of angular momentum loss rates due to magnetic brak-
© 2016 The Authors
arX
iv:1
709.
0305
4v1
[as
tro-
ph.S
R]
10
Sep
2017

2 L. S. Ardestani et al.
ing with 2D and 3D numerical simulations of realistic magne-tised stellar winds (e.g., Vidotto et al. 2011; Matt et al. 2012;Vidotto et al. 2014). Much of the difficulty to predict stellarwind torque arises from the uncertainty in our knowledge ofthe magnetic and stellar wind properties (both observationaland theoretical). There is still much work needed in order tounderstand how wind properties depend upon stellar mass,rotation rate, and time.
The aim of the present study is to develop new angu-lar momentum evolution models for a wide range of starsfrom F to M-type and from a few Myr to the end of theirmain-sequence life and incorporate some of the most recentadvances.
The structure of this article is as follows: in Section 2,we re-derive the parametrised model of Kawaler (1988), up-date it with available information and present our model forrotational evolution. In Section 3, we introduce our observa-tional sample of over 1500 stars in 13 clusters and a numberof individual field stars to derive observational constraintson the rotational evolution of stars. In Section 4, we calibratethe free parameters in our rotational evolution model usingthe observational constraints allowing us to find values thatgenerate best fit models. Finally in Section 5, we comparethe results of our rotational evolution model to observations.
2 PARAMETERISATION OF MAGNETICBRAKING
The angular momentum evolution of isolated low-mass starsis controlled by the balance between three main physicalmechanisms: angular momentum removal by magnetisedstellar winds (here after ”magnetic braking”), the star-diskinteraction, and the angular momentum transfer within thestellar interior. In this section we discuss the correspondingmodel assumptions.
2.1 General formalism
As first proposed by Schatzman (1962), following the pio-neering work of Parker (1958a), stars spin down because acoupling between their magnetic field and their ionised windtransfers angular momentum to the wind at the expense ofthat in the star. The stellar angular momentum J lost bystellar wind in unit time can be estimated as a function ofthe stellar mass loss rate ÛM and rotation frequency Ω:
dJdt=
23ÛMR2Ω
( rJR
)2, (1)
where R is the stellar radius and rJ is an equivalent ra-dius that is to be determined. It can be thought as thedistance after which wind material is no longer in boundto the star.1 An important parameter entering this esti-mation is the Alfven velocity in the radial direction, vA ≡Br (r)/
√µ0ρ(r), and the corresponding Alfven radius rA at
which vA(rA) = v(rA), v being the wind speed, and Br theradial component of the magnetic field.
1 Although it has been common to use the Alfven radius insteadof rJ in this expression, we believe that it is important to separate
these two quantities which are physically distinct.
The radius rJ depends mostly on the strength and ge-ometry of the stellar magnetic field and the launching of thestellar wind. For example, Mestel (1986) proposes that for aradial magnetic field Br = B0(r/R)−2 and rJ = rA, while for adipolar magnetic field Br = B0(r/R)−3 and rJ =
√rAR.
In order to express rA as a function of ÛM, M and B0we make two assumptions: (i) the wind velocity at rA is afraction of the escape speed at that location,
vA = K
√2GM
rA, (2)
where K ∼< 1, and (ii) the wind can be considered isotropic,
ÛM = 4πr2ρ(r)v(r). (3)
Solving for ρ(rA) it is easy for us to show that
r3A =
[r2ABr (rA)
]4
2K2GM ÛM2 . (4)
Given Br (rA), this last equation is used to find rA.With the above expressions for Br (rA) and rJ, we obtain
rJR=
[B4
0 R5
2K2GM ÛM2
]n/6=
[B2
0 R2
K ÛMvesc
]n/3(5)
with n = 2 for a radial field and n = 3/7 for a dipolar fieldand vesc is the surface escape velocity. The study of Matt& Pudritz (2008) shows that equation (5) has indeed thecorrect functional form for relatively slowly rotating stars,with the two parameters K1 and n which may be fitted tosimulations. However, for more rapidly rotating stars thecentrifugal acceleration changes the functional form slightly(Matt et al. 2012) to
rJR= K1K3
[B2
0 R2
ÛM(K22 v
2esc +Ω2R2)1/2
]m. (6)
where Matt et al. (2012) find K1 = 1.3, K2 = 0.0506,m = 0.2177. And all quantities are in cgs units. K3 = 1 isa coefficient that we will modify later. Equation 6 is equiv-alent to 5 in the limit that Ω2R2 K2
2 v2esc, m = n/3 and
K1 = (K2/K)2m. We can thus rewrite equation (1) as
dJdt=
23(K1K3)2 ÛM(1−2m)R(2+4m)B4m
0Ω
(K22 v
2esc +Ω2R2)m
. (7)
2.2 Magnetic field parameterisation
2.2.1 Empirical evidence
The question of how to estimate the magnetic field strengthis a difficult one. It has been known since Kraft (1967) thatrapidly rotating stars have higher levels of magnetic activ-ity than slowly rotating stars. At a given stellar mass, themagnetic field strength has approximately a power law de-pendence on rotation rate, such that B0 ∝ Ωa for slow ro-tators and saturates at fast rotation. Following the workof Saar (1996) it is usually assumed that the surface aver-age field strength is a strong function of the spin frequency.Wright et al. (2011) find B0 ∝ Ω2.3. Furthermore, using theresults of recent Zeeman-Doppler Imaging (ZDI) studies of
MNRAS 000, 1–18 (2016)

Spin-Orbit Evolution of Stars and Exoplanets 3
over 70 stars, Vidotto et al. (2014) showed that the large-scale field strength averaged over the stellar surface, BV ,scales with rotations as BV ∝ Ω1.32.
On the other hand, studies of the magnetic field inM-dwarfs indicate that the large-scale magnetic field is in-versely proportional to the Rossby number,
Ro =2πΩτc
, (8)
where τc is the convective turnover timescale which appearsto be a natural scaling factor for the stellar activity andmagnetic field. For example, Noyes et al. (1984) showed thatthe mean level of chromospheric emission is inversely relatedto the rotation period. Also, Baliunas et al. (1996) found asignificant correlation between the magnetic and rotationalmoments for the Mount Wilson sample. More recently, usinga sample of 66 stars in the range of 0.1 to 1.34 M, for whichthe large-scale surface magnetic field has been mapped usingthe Zeeman Doppler Imaging (ZDI) technique, See et al.(2017) have shown that the magnetic field strength and massloss show less scatter when plotted against Rossby numberrather than rotation period.
We therefore assume that magnetic field scales with theRossby number as B0 ∝ Ro−a. See et al. (2017) and Fol-som et al. (2016) provide predictions on the dependency ofmagnetic field strength on Rossby number using ZDI. Intheir figure 5, See et al. (2017) have plotted magnetic fieldstrength against Rossby number. Using the bisector ordinaryleast-squares method and after performing a cut for the crit-ical Rossby number (Rom
crit) at 0.1 they found a = 1.65±0.14.Using linear regression we were also able to fit their sam-ple with a = 0.8 ± 0.20. In addition, using a different sampleand the χ2 method, Folsom et al. (2016) have approximateda = 1.0± 0.1. We consider a as a free parameter to be deter-mined.
2.2.2 The convective turnover timescale
The convective turnover timescale is defined as the ratio ofthe pressure scale height (or the mixing length) to the con-vective velocity near the base of the outer convective zone.Here, we calculate it using the CESAM stellar evolution code(Morel & Lebreton 2008a), as described in Appendix A.
Fig. 1 shows how τc evolves as a function of time forstars of different masses. It is initially large (of order 20)and constant when the stars are fully convective. It thendecreases on the pre-main-sequence to become almost con-stant on the main-sequence. It is smaller for higher massstars, with a significant drop above 1.2 M which coincideswith the gradual suppression of the external convective zonefor stars of these masses and higher. The fact that our τcdiffers slightly from those of (Landin et al. 2010) is due to aslightly different location for the calculation of τc. We use thepressure scale height and they use the mixing length of 1.5times the scale height. The differential behaviour betweenstars of different masses is very similar, as it should.
In fig. 1, we also compare our results to those estimatedempirically by Wright et al. (2011). By necessity, due to thelarge number of stars required, the latter estimates applyonly to main-sequence stars. It is striking that although theτc is similar within an order-of-magnitude, the range, as afunction of stellar mass, is much smaller in the empirical
1 10 100 1000 10000Age/Myr
105
106
107
108
109
τc/s
1 day
1 month
1 year
0.6 MΟ •
0.8 MΟ •
1.0 MΟ •
1.2 MΟ •
1.4 MΟ •
Figure 1. Comparison between the convective turnover timescalecalculated in this work (solid) from those of Landin et al. (2010)
(dashed) and Wright et al. (2011) (dotted), for stellar masses
between 0.6 and 1.4 M, as labelled.
determination than in our calculations or those of Landinet al. (2010).
In this work, we choose to use τc based on our self-consistent CESAM calculations. We note that the compar-ison with the Rossby number in the literature is not nec-essarily straightforward because of the different definitionsand/or calculations used. However, with the exception ofthe pre-main-sequence evolution phase, the different defi-nitions and calculations lead to Ro which is approximatelyproportional between different methods. Hence we can useproportionality relations between Ro and other parametersbut stress that the absolute values of Ro are not directlycomparable.
2.2.3 Magnetic field saturation at fast spin
Based on the slow rotational evolution of young rapidlyrotating stars, there can be no serious doubt that bothmass loss rate and the magnetic field saturate at fast ro-tation (e.g., Pizzolato et al. 2003). The reason is that,without saturation, the most rapidly rotating stars wouldspin down much faster than observed. Thus using a criticalRossby number (Rom
crit) we can distinguish between the non-saturated (Ro ≥ Rom
crit) and saturated (Ro < Romcrit) regimes
as
B0 =
B
(ΩτcΩτc
)aif Ro ≥ Rom
crit
B(
1Rom
crit
2πΩτc
)aif Ro < Rom
crit.(9)
An estimate of Romcrit can be derived by fitting rotational
evolution models to the observational constraints. Donatiet al. (2008) and Reiners et al. (2009) find Rom
crit ≈ 0.1. Thisdetermination of Romcrit is accurate only within a factorabout 2 and in addition, as discussed in Sect. 2.2.2, it is notdefined in exactly the same way. Therefore, we treat Rom
crit asa free parameter and, by allowing a range 0.05 < Rom
crit < 0.2,we look for a value which best fits observations in section 4.
MNRAS 000, 1–18 (2016)

4 L. S. Ardestani et al.
2.2.4 Suppression of braking at slow spin
It has recently been shown by van Saders et al. (2016) thatstars more evolved than the Sun rotate faster than pre-viously expected. This indicates that magnetic braking isweaker in intermediate-age and old stars. Therefore, theysuggest the existence of another Rossby threshold, which wecall RoM
crit, above which magnetic braking is suppressed. Apossible explanation for this could be a change in field geom-etry from a simple dipole to a higher order field which couldproduce weakened braking (Reville et al. 2015). A realis-tic treatment should thus consider changes to equation (6)arising from this different field geometry, perhaps througha different m. In the absence of any knowledge about thebehaviour of these fields, we follow van Saders et al. (2016)and adopt a simple reduction of the angular momentum lossrate past this critical Rossby number through a change inthe K3 coefficient,
K3 =
1 if Ro < RoM
crit,
0.1 otherwise.(10)
Note that the K3 = 0.1 above the critical Rossby number isarbitrary.
Following van Saders et al. (2016), we adopt RoMcrit =
Ro,because of our choice of convective turnover timescaleτc, Ro = 1.113 while this value is equal to 2.16 for vanSaders et al..
2.3 Parameterisation of the mass loss
The question of how to consider mass loss is often left aside,probably because the change in angular momentum (equa-tion 7) does not depend on mass loss when m = 1/2. Thissolution was preferred for that reason by Kawaler (1988)and Bouvier et al. (1997). For other m an assumption mustbe made for ÛM. One can first note that, for m > 1/2, mag-netic braking increases when mass loss decreases, a slightlyproblematic result at least asymptotically. For m < 1/2,braking increases with mass loss, an intuitively more sat-isfactory result. In the particular case of the numericalsimulations by Matt et al. (2012) the spin-down timescaleτΩ ∝ ÛM−0.5646Ω−0.8708. Thus the dependence on ÛM is notnegligible.
As known since the pioneering work of Parker (1958b),mass loss is strongly linked to heating of the corona, whichin itself is linked to the production of energetic photons andparticles. Observations clearly indicate that the X and EUVirradiance of young stars (including the Sun) is orders ofmagnitude higher when young (e.g. Ribas et al. 2005). Thisactivity is presumably mostly related to the fast rotation ofthe stars. Separately, Tout & Pringle (1992) show that forfully convective T-Tauri stars, very strong winds of the orderof 10−7 M yr−1 are expected and are proportional to Ω. Fit-ting the spin rates of stars on the main-sequence, Johnstoneet al. (2015) estimate that the wind mass loss rate scaleswith stellar parameters as ÛM ∝ M−3.36R2Ω1.33.
See et al. (2017) estimate mass loss rates from mag-netic field measurements of young stars and a potential fieldsource surface model. Using their results, we consider massloss to be correlated with the Rossby number, and like the
magnetic field, saturate at fast rotation speed. Therefore,mass loss can be parameterised as
ÛM =
ÛM
(ΩτcΩτc
)dif Ro ≥ Rom
crit
ÛM(
1Rom
crit
2πΩτc
)dif Ro < Rom
crit.(11)
See et al. (2017) find d ranging between −1.36 and −1.62 withthe bisector ordinary least-squares method. Using linear re-gression, we were able to fit their data with d = 1.05 ± 0.12.We treat d as a parameter to be fitted within these extremevalues.2
2.4 Decoupling of the outer convective envelope
Up to now, we have implicitly assumed that the convectiveenvelope is tied to the rest of the star which rotates as a solidbody. In fact, as proposed by MacGregor & Brenner (1991)this is probably not the case and this has to be taken into ac-count: the stellar wind acts on the star’s magnetic field lineswhich originate in the dynamo region, in the convective zone.The rotation state of the stellar interior then depends on theability and speed at which angular momentum is transferredto the interior. MacGregor & Brenner (1991) proposed thata typical angular mixing timescale of the order of 107 yr wasrequired to explain the small amount of differential rota-tion observed with seismology between the solar convectivezone and radiative interior. Allain (1998) applied this pre-scription to the case of M-dwarfs and showed the effect tobe important to explain the efficient spin-up of M-dwarfs inyoung clusters. We will see that interior angular momentummixing also plays an essential role in F-dwarfs.
Following MacGregor & Brenner (1991), we assumethat any difference in angular momentum between theouter convective zone (characterised by an angular mo-mentum, moment of inertia and angular rotation linked byJcz = IczΩcz) and the inner radiative layer (characterised byJrad = IradΩrad) is mixed with a characteristic timescale τmix.The equations for the evolution of the rotation frequenciesin the outer convective zone (cz) and in the inner radiativezone (rad) are (Allain 1998)
dΩczdt
=Irad
I(Ωrad −Ωcz)
1τmix
+23
R2rad
IczΩcz
dMczdt
−ΩczIcz
dIczdt− dΩcz
dt
wind
(12)
and
dΩraddt
= − IczI(Ωrad −Ωcz)
1τmix
− 23
R2rad
IradΩcz
dMczdt
−ΩradIrad
dIraddt
, (13)
where Mcz is the mass of the convective zone and Rrad de-notes the radius of the radiative layer. We have thus addedanother free parameter, τmix (the characteristic timescale ittakes for angular momentum to travel between radiative and
2 The choice of a and d as names for the exponent is for consis-tency with a previous version of the paper in which more param-
eters were considered.
MNRAS 000, 1–18 (2016)

Spin-Orbit Evolution of Stars and Exoplanets 5
convective zones), which from previous studies is expectedto be of the order of 107 yr (Allain 1998). This timescaleagrees both with the lack of differential rotation in our Sunand the fast rotation of some M- and G-dwarfs in clustersyounger than about 100 Myr.
2.5 Disk locking
The disk-locking process arises from the observational ev-idence that stars that magnetically interact with their ac-cretion disk during the first few Myr of PMS evolution areprevented from spinning up in spite of contracting towardsthe ZAMS. This behaviour is believed to result from themagnetic interaction between the young stellar object andits accretion disk, even though the details of the process arestill to be understood (see Bouvier et al. 2014).
At the beginning, most stars have disks but lose themin a few Myr (see e.g. Haisch et al. 2001). From observationsof the Taurus-Auriga association, Bertout et al. (2007a)find that the average disk lifetime is a function of stellarmass (from about 0.3 to 1.6 M) and approximately equalto 4(M/M)0.75Myr.
Following Bouvier et al. (1997) and Gallet & Bouvier(2015), we assume that fastest rotating stars at any age arethose which lost their disk rapidly. Conversely, the stars ro-tating the slowest should have had their disks the longest.Furthermore, we assume that only the outer convective zone(source of the dynamo) is locked by the disk for a timescaleτdisk which we also treat as a free parameter.
3 OBSERVATIONAL CONSTRAINTS ANDMODELS
3.1 Observational Constraints
The set of free parameters introduced in our rotational evo-lution model above needs to be constrained by observationsin order for us to be able to study the distribution of stellarrotation rates at any age. For this reason, we use rotation pe-riods of stars in a number of open clusters from the literaturecovering an age range of 1 Myr to 2.5 Gyr. Determining theage of young stellar clusters can be very challenging, and infact, for very young clusters about 5−10Myr, age uncertain-ties may approximately be equal to the actual age estimate(Bell et al. 2013). Fortunately, the change in rotation rates atthese very young ages are relatively mild so that modellingdoes not suffer much from these uncertainties. The ages ofolder clusters are better known, with uncertainties close to10 percent. Therefore, we neglect the age uncertainties inthe rest of this paper.
Considering the fact that many of the stars in our sam-ple are likely to have companions, one might be concernedthat the fraction which are interacting would have a signifi-cant effect on angular momentum loss. Binaries may impactrotational evolution via gravitational or magnetic interac-tions. Stars in very close binaries can exert tidal forces oneach other, spinning them up or down more rapidly than pre-dicted for a single star. These systems are also close enoughfor one star to interact with the other’s large-scale magneticfield. And at the earliest evolutionary stages, a companion
Table 1. Statistical properties of the distributions of rotationrates used in this study. n? is the number of stars in each cluster,
P? is the mean rotation period of stars in the cluster in days and
σP(days) shows the standard deviation in the rotation period.The age uncertainties for clusters are generally not provided in
the literature and thus have not been included in this table.
Cluster age/Myr n? P?/days σP/days Ref.
ONC 1. 147 5.424 3.593 1NGC2264 3. 253 5.252 3.720 2CepOB3b 4. 450 2.389 2.742 3NGC2362 5. 166 5.751 4.127 1hPer 13. 323 3.780 3.327 4Pleiades 125. 50 4.032 3.029 5M35 150. 307 4.136 3.440 5M34 220. 83 6.710 0.887 8M37 550. 705 7.410 4.677 1Praesepe 600. 51 9.285 2.999 6Hyades 650. 53 10.995 3.865 6NGC6811 940. 70 9.259 3.190 7NGC6819 2500. 29 15.572 6.702 9
References: (1) Irwin & Bouvier (2009a); (2) Venuti et al. (2016);
(3) Littlefair et al. (2010); (4) Moraux et al. (2013); (5) Hartman
et al. (2010); (6) Meibom et al. (2009); (7) Delorme et al. (2011);(8) Meibom et al. (2011); (9) Meibom et al. (2015).
may truncate the protoplanetary disk, minimizing the im-pact of magnetic braking and allowing the young star to spinfaster than its single counterparts (e.g., Cieza et al. 2009).However, according to Duquennoy & Mayor (1991), onlyabout 4 percent of binaries have orbital periods short enoughto be tidally interacting even on circular orbits. When con-sidering eccentric planets, we estimate that another about10 percent with longer periods may be tidally interacting.In addition, the spin properties of spectroscopic binaries ap-pear not to differ from other stars (see Meibom et al. 2011,concerning the M34 cluster). This indicates that while du-plicity may be important in some cases, it does not play amajor role in the process.
It is generally common in the literature to report the ro-tation period of clusters as a function of their magnitudes orcolours like V , B−V , J −Ks, etc. This is while the rotationalevolution models require the mass of the stars. Our sampleincludes 13 clusters for which the statistical properties of thedistributions of rotation rates are shown in Table 1. For fourclusters (Praesepe, Hyades, NGC6811 and NGC6819) wehave converted the commonly reported colours into masses.For the remaining 9 clusters, the masses have been inferreddirectly from the references shown within Table 1.
In order to calculate the masses, we first extracted theage and metallicity of each cluster from the literature andusing the CMD interface3 (Girardi et al. 2004), calculatedtheir evolution tracks and isochrones. The isochrones pro-vided stellar masses as a function of different magnitudesand using a number of small adjustments in colour bandswe were able to gain the masses in the observed colours.The final step was to interpolate the masses at the samereported colours for each star in the cluster.
3 http://stev.oapd.inaf.it/cgi-bin/cmd
MNRAS 000, 1–18 (2016)

6 L. S. Ardestani et al.
Unlike clusters, masses are usually directly provided forfield stars in the literature and that has been used for theobjects in our sample. Table 4 shows the statistical proper-ties of the distributions of rotation rates for the field starsused in our sample.
3.2 Numerical method
We solve our ensemble of equations (7) to (13) using aRunge-Kutta driver with adaptive step size control. All thequantities which depend on stellar evolution, namely radius,moment of inertia, convective timescale are calculated froma stellar evolution grid which extends from 0.5 M to 2.0 Min steps of 0.02 M and metallicities between [Fe/H] = −0.5to 0.1 in steps of 0.1. This grid was calculated using CEPAM(Morel & Lebreton 2008b) with a mixing length parame-ter that was fitted to the Sun. Practically this means thatfor our solar metallicity 1.0 M mass star reaches a radiusof 1 R for an effective temperature of 5777 K in 4750 Myr.The small 200 Myr offset between the model age and theage of the Solar System is negligible given other sources ofuncertainty (see e.g., Bonanno & Frohlich 2015).
The separation between the two zones defined as thedeep radiative zone and the convective zone in equation (13)was obtained by looking at the first transition from a ra-diative to a convective zone, neglecting a possible centralconvective zone.
3.3 Comparison of existing models
At this stage, we are ready to compare the predictions ofcurrently existing rotational evolution models to our obser-vational sample. To perform this task, we implement therotational evolution models of Bouvier et al. (1997) [B97]and Johnstone et al. (2015) [J15] into our numerical code.Next, we allow each model to evolve for 12 Gyr and finallylook at snapshots from their evolution at the same age asthe clusters and field stars in our sample to compare howwell models can predict the rotation rates. For the case ofGallet & Bouvier (2015) [GB15], because this work uses val-ues of K1 which are mass-dependent (see 3.3.2), we directlyplot their published results. The assumptions of the differentmodels are summarised in Table 2.
3.3.1 The B97 Model
The model of B97 for the stellar braking of low-mass stars(0.5M < m < 1.1M ) with an outer convective zone stemsfrom Kawaler (1988)’s formulation. They use a dynamo re-lation which saturates for fast rotators beyond the spin rateof ωsat and is described by the following equations:
(dJdt
)w
=
−KΩ3
(R
R
)1/2 (M
M
)−1/2(Ω < ωsat),
−KΩω2sat
(R
R
)1/2 (M
M
)−1/2(Ω > ωsat)
(14)
where K is a calibration constant. The critical rotation ratein equation (14) is the only free parameter in B97. The valuesof the parameters used in this model are listed in table 2.
B97 can be made equivalent to our model by neglect-ing the Ω2R2 term in equation (6), assuming m = 1/2 and
assuming that B ∝ Ω/R2 rather than B ∝ Ro−1. We thusobtain that dJ/dt = (2/3)(K2
1/K2)vescΩ3(B2R4/Ω2
) and as
a result K = (2/3)(K21/K2)(BR4
/Ω2vesc). Assuming Ω =
2.67 × 10⁻⁶ and B = 1 G, and using K = 2.7 × 1047 cgs, B97implies K2
1/K2 ≈ 5 and K1 ≈ 0.503.
3.3.2 The GB15 Model
Gallet & Bouvier (2013, 2015) develop an angular momen-tum evolution model for 0.5, 0.8 and 1.0 M stars. Theyadopt Matt et al. (2012)’s prescriptions for the wind brak-ing law and following their work choose K2 = 0.0506 andm = 0.22 as the input parameters in equation 6. The meanmagnetic field and mass loss relations used in their modelare adopted from Cranmer & Saar (2011) with slight mod-ifications. They are a function of stellar density, effectivetemperature, and angular velocity. As shown in Table 2, forangular velocities between 1.5 and 4 times that of the Sun,they find relatively steep dependences on Rossby number,i.e., Ro−2.6 for the magnetic field strength and Ro−1.58 for themass loss rate. They also use a prescription that smoothlyjoins the non-saturated and saturated magnetic regimes.
In addition, GB15 fit several other parameters. Thevalue of K1 is allowed to change as a function of mass.The value of the core-envelope mixing timescale (our τmix)changes both as a function of stellar mass and initial ro-tation rate. Thus, for 3 mass bins and 2 rotation rates, 9additional parameters must be found in addition to K1, K2,a, d, critical spin rate and disk lifetime τdisk. As a result, K1varies between 1.7 for 1 M stars to 8.5 for 0.5 M stars. Thevalue of τmix range for 10 Myr for fast-rotating 1 M stars to500 Myr for slow-rotating 0.5 M stars.
3.3.3 The J15 Model
J15 construct a model to describe rotation and wind proper-ties of low-mass main-sequence stars. Like GB15 they adoptMatt et al. (2012)’s prescriptions for the wind braking lawand choose K2 = 0.0506 and m = 0.22. The mean mag-netic field used in their study is adopted from Vidotto et al.(2014). They derive the mass loss rates by fitting their ro-tational evolution model to the observations by assumingthat, in the unsaturated regime, the mass loss rate per unitsurface area of a star has power-law dependences on its massand rotation rate. Their model works with six parameterssummarised in table 2. An important point to note about theJ15 model is that it does not assume a decoupling of internallayers of stars but considers that they rotate as solid bodies.Since the model is limited to stars older than 100 Myr, theconsequence of this assumption is that they do not considerthe pre-main-sequence phase.
3.3.4 Comparison of Models
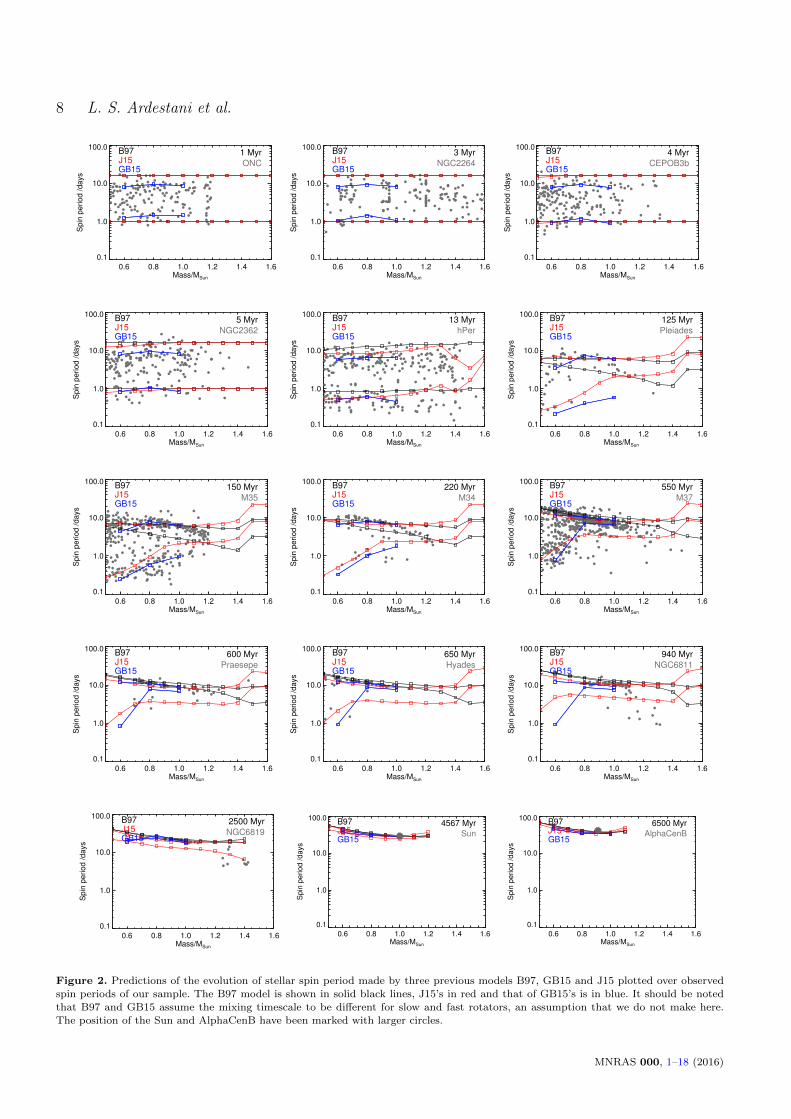
Fig. 2 shows predictions of the evolution of stellar spin pe-riod made by the above models versus stellar mass. Thesehave been plotted over observations of the rotation periodsof the clusters and field stars of our sample at different ages(Tables 1 & 4). The two lines for each model represent thetrend of the slow and fast rotators. All three models fit-ted 90 percent of the stars to estimate their parameters and
MNRAS 000, 1–18 (2016)

Spin-Orbit Evolution of Stars and Exoplanets 7
Table 2. Model parameters.
Model Magnetic field Mass loss Saturation Interior mixing m K1 Ref
B97 B ∝ Ω/R2 None Ω > 15Ω None 0.5 0.503 1
GB15 B ∝ Ro−2.6? ÛM ∝ Ro−1.58? Ω > 15Ω τmix = 10 to 500 Myr 0.22 1.7 to 8.5 2
J15 B ∝ Ro−1.32 ÛM ∝ R2Ω1.33M−3.36 Ω > 15Ω None 0.2177 6.76 3
This work B ∝ Ro−1.2 ÛM ∝ Ro−1.3 Ro > 0.09 τmix = 150 Myr 0.2177 6.34 4
References: (1) Bouvier et al. (1997); (2) Gallet & Bouvier (2015); (3) Johnstone et al. (2015); (4) This work.? : This is an approximate relation for 1.5 ≤ Ω/Ω ≤ 4.
thus 10 percent of the stars rotating the fastest are not in-cluded in their fit. The stars first rapidly spin up due tothe contraction during the PMS stage. But after enteringthe main-sequence at about 30 to 40 Myr, magnetic brakingstarts to slow the stars down.
Looking at fig. 2, the three models provide a fair fit tothe ensemble of clusters that have been observed. Globally,the models do reproduce the observed spin down of starswith age and some of the observed trends in terms of mass.However, for the case of B97 we can see that, starting fromtwo initial spin periods that cleanly encompass the observa-tions at 1 Myr for the ONC, the situation deteriorates withmore stars being outside this envelope, particularly for M35at 150 Myr and for M37 at 550 Myr. B97 tends to explainthe slow rotators in M37 and older clusters but not the lessnumerous fast rotators. Because of the early slow down ofthe fast rotators, this parameterisation creates poor fits tomany of the stars in Pleiades at 125 Myr as well as M35 at150 Myr.
GB15 obtains a quite good fit for the evolution of low-mass stars at the expense of using many free parameters. Itis also important to stress that these fair fits are obtainedby assuming a dependence of mixing timescale on rotationrate. However, this is a hypothesis that we view as unnec-essary at this point and that we choose not to adopt. TheJ15 parameterisation (which assumes solid-body rotation)is more successful, including for the Pleiades. It generallyexplains the spin rates for about 90 percent of the observedstars. However, it also leaves out at least 10 percent of thefast rotators in M35 and M37.
Furthermore, these parameterisations are valid for starswith an outer convective zone but generally fail to reproducethe fast-spinning F-dwarfs beyond the Kraft break (Kraft1967), as seen for M37, NGC6811 and NGC6819. This isnot surprising because they were not specifically designedfor that purpose, but it calls for a model that would workfor a wider range of stars.
4 PARAMETER CALIBRATIONS
In this section we describe our method to calibrate our modelparameters. We adopt the approach of trying to fit nearlyall stars seen in clusters rather than focusing on a limitedfraction which has usually been done in previous studies. Inthis way, we hope that the parameterisation can be used toidentify more reliably outliers or stars which have been spunup by their exoplanet (e.g., Poppenhaeger & Wolk 2014;Guillot et al. 2014). Also, using this approach, we are looking
Table 3. Description of all the parameters introduced throughoutthis study.
Parameter Usage
K1 Calibration to the Sun
K2 Accounting for rapid rotatorsa B0 ∝ (Ωτc )ad ÛM ∝ (Ωτc )dτmix Timescale of angular momentum transfer
between radiative and convective zones
τdisk Timescale of keeping stellar rotationconstant due to the presence of the disk
Romcrit Discerning between critical and
sub-critical regimes
RoMcrit Suppression of magnetic field at old ages
at the evolution of single clusters instead of individual massbins.
Considering the collection of equations introduced inthe previous sections and the assumptions made so far, weare left with 8 free parameters which are listed in Table 3.Two of the parameters we do not vary. First, we do notcalibrate RoM
crit because we are mainly focusing on clusters
and stars at younger ages whereas RoMcrit mostly affects older
stars. We adopt RoMcrit = Ro. Secondly, the K2 parameter is
constant because it has generally a small effect. Therefore,we are left with 6 parameters to vary.
Because of the large number of parameters and the in-homogeneous data to be used, we proceed as follows. Westart from the parameters that, from initial tests, are shownto have higher effects on the evolution of angular momen-tum. We choose to fit individual clusters by eye and find oneoptimal solution per parameter.
In the next subsections, we present the results of eachparameter search around our preferred values for the otherparameters. For simplicity we present these results only forthe cluster(s) which led to our choice.
4.1 Calibration to the Sun: K1 and K2
We use the ensemble of relations defined by equations (7),(9), (11) & (13) to calculate the evolution of our Sun andconstrain K1 as a function of the other parameters of themodel. K1 is adjusted so that the model correctly reproducesthe Sun’s rotation period at its current age.
We adopt an initial rotation period of 8 d as typical ofthe rotation of T-Tauri stars (e.g. Irwin & Bouvier 2009b).The corresponding initial CESAM model has been evolved
MNRAS 000, 1–18 (2016)
8 L. S. Ardestani et al.
0.6 0.8 1.0 1.2 1.4 1.6Mass/MSun
0.1
1.0
10.0
100.0
Spin
period /days
1 Myr
ONC
B97J15GB15
0.6 0.8 1.0 1.2 1.4 1.6Mass/MSun
0.1
1.0
10.0
100.0
Spin
period /days
3 Myr
NGC2264
B97J15GB15
0.6 0.8 1.0 1.2 1.4 1.6Mass/MSun
0.1
1.0
10.0
100.0
Spin
period /days
4 Myr
CEPOB3b
B97J15GB15
0.6 0.8 1.0 1.2 1.4 1.6Mass/MSun
0.1
1.0
10.0
100.0
Spin
period /days
5 Myr
NGC2362
B97J15GB15
0.6 0.8 1.0 1.2 1.4 1.6Mass/MSun
0.1
1.0
10.0
100.0
Spin
period /days
13 Myr
hPer
B97J15GB15
0.6 0.8 1.0 1.2 1.4 1.6Mass/MSun
0.1
1.0
10.0
100.0
Spin
period /days
125 Myr
Pleiades
B97J15GB15
0.6 0.8 1.0 1.2 1.4 1.6Mass/MSun
0.1
1.0
10.0
100.0
Spin
period /days
150 Myr
M35
B97J15GB15
0.6 0.8 1.0 1.2 1.4 1.6Mass/MSun
0.1
1.0
10.0
100.0
Spin
period /days
220 Myr
M34
B97J15GB15
0.6 0.8 1.0 1.2 1.4 1.6Mass/MSun
0.1
1.0
10.0
100.0
Spin
period /days
550 Myr
M37
B97J15GB15
0.6 0.8 1.0 1.2 1.4 1.6Mass/MSun
0.1
1.0
10.0
100.0
Spin
period /days
600 Myr
Praesepe
B97J15GB15
0.6 0.8 1.0 1.2 1.4 1.6Mass/MSun
0.1
1.0
10.0
100.0
Spin
period /days
650 Myr
Hyades
B97J15GB15
0.6 0.8 1.0 1.2 1.4 1.6Mass/MSun
0.1
1.0
10.0
100.0
Spin
period /days
940 Myr
NGC6811
B97J15GB15
0.6 0.8 1.0 1.2 1.4 1.6Mass/MSun
0.1
1.0
10.0
100.0
Spin
period /days
2500 Myr
NGC6819
B97J15GB15
0.6 0.8 1.0 1.2 1.4 1.6Mass/MSun
0.1
1.0
10.0
100.0
Spin
period /days
4567 Myr
Sun
B97J15GB15
0.6 0.8 1.0 1.2 1.4 1.6Mass/MSun
0.1
1.0
10.0
100.0
Spin
period /days
6500 Myr
AlphaCenB
B97J15GB15
Figure 2. Predictions of the evolution of stellar spin period made by three previous models B97, GB15 and J15 plotted over observedspin periods of our sample. The B97 model is shown in solid black lines, J15’s in red and that of GB15’s is in blue. It should be notedthat B97 and GB15 assume the mixing timescale to be different for slow and fast rotators, an assumption that we do not make here.The position of the Sun and AlphaCenB have been marked with larger circles.
MNRAS 000, 1–18 (2016)

Spin-Orbit Evolution of Stars and Exoplanets 9
1 10 100 1000 10000Age [Myr]
1
10
100
Spin
period /days
B97
GB15
J15
This work
3000 3750 4500 5250 6000Age [Myr]
22
24
26
28
30
32
Sp
in p
erio
d /
da
ys
Figure 3. Evolution of the spin period of the Sun with age inmillion years for different models, as labelled (see Table 2 for de-
tails). The inset shows the plot in linear scale. The circle indicates
the present state of the Sun.
from an initially extended state for 1 Myr. At that point, itis a fully convective pre-main-sequence star with a radius of2.2 R.
Fig. 3 shows the resulting spin evolution of the Sun fromvarious sources in the literature and for our preferred model.The details of the parameters of each model are presented inTable 2. For K2, following the results obtained by Matt et al.(2012), we adopt a value of 0.0506 and, as described earlierbecause of the small effect it has on the overall evolution ofangular momentum, we choose not to vary this parameter.
By construction (through an optimization of the pa-rameter K1), all parameterisations reproduce the solar ro-tation but the evolution histories differ. In the pre-main-sequence evolution phase, the spin period is independent ofthe parameterisation: the spin-up is controlled by the stellarcontraction. The evolutionary tracks begin to deviate fromeach other after 30 Myr around the beginning of the main-sequence. The J15 parameterisation produces the strongestbraking for solar-mass stars younger than the Sun. In thisphase, the GB15 parameterisation yields spin periods whichcan be shorter by up to a factor 2. The parameterisationthat we present here results in a spin period which can bealmost one order of magnitude smaller than J15 around anage of 200 Myr. For older stars, the trends are inverted, withGB15 producing the slowest spinning stars and J15 predict-ing slightly faster rotation speeds. However, our parameter-isation yields still faster rotation speeds because of the as-sumption of the suppression of magnetic braking when theRossby number exceeds that of the Sun. This yields a non-smooth curve for our model in fig.3.
4.2 Disk lock parameter: τdisk
It was shown in section 2.5 that the disk lock effect and thevalue of the parameter controlling it in the model τdisk isvery important in terms of specifying the initial content ofangular momentum in stars. Because magnetic braking has
0.6 0.8 1.0 1.2 1.4 1.6Mass/MSun
0.1
1.0
10.0
100.0
Spin
period /days
13 MyrhPer
t diskfast=1 , t disk
slow=4 Ma
t diskfast=1 , t disk
slow=5 Ma
t diskfast=1 , t disk
slow=6 Ma
t diskfast=2 , t disk
slow=4 Ma
t diskfast=2 , t disk
slow=5 Ma
t diskfast=2 , t disk
slow=6 Ma
Figure 4. Models of different τdisk on top of the spin period profileof the hPer cluster as a function of stellar mass. The numbers in
legends represent the value of τdisk in fast and slow rotators branch
respectively.
a timescale of at least 10 Myr, τdisk is fully decoupled fromthe other parameters and may be determined independently.
In addition, it was also highlighted in 2.5 that the fastestrotating stars at, say, 5 Myr are those which lose their disksrapidly. As a result we should expect the fastest rotators tohave a τdisk ≈ 1 to 2 Myr. Therefore, following Haisch et al.(2001), we started by adopting a disk lifetime of 6 Myr, corre-sponding to the mean overall disk lifetime observed in youngclusters and then tested different values in its proximity tothe slow rotator branch. In addition, for the fast rotators wetested values close to 1 Myr. Bertout et al. (2007b) suggestedthat there is a dependence between τdisk and stellar mass.However, our calculations of spin rates in young clusters donot enable us to distinguish between the Bertout et al. rela-tion and one with a value of τdisk that is independent of stel-lar mass. As a result we simply assume a constant timescalefor all masses but acknowledge that for small mass fast ro-tators, there may be a slight tendency for an even smallerτdisk.
Based on fig. 4 we have adopted a value of τdisk = 1 Myrand 6 Myr for best fit to the fast and slow rotators, respec-tively.
4.3 Magnetic field and mass loss parameters:Rom
crit, a and d
According to equations (9) and (11), the magnetic field ofthe star and its mass loss are controlled by three parametersin our model, a which describes the dependence of the mag-netic field to the star’s Rossby number, d which plays thesame role for mass loss and Rom
crit which determines when themagnetic field saturates and magnetic braking is weakened.
In the non-saturated regime our model predicts thatthe stars have an angular momentum decay rate of dJ/dt ∝Ro−d(1−2m)−4am. This shows a and d are degenerate. In ad-dition, because of the calibration of our models to the solarspin rate, constant K1 depends on Rom
crit which therefore alsomakes Rom
crit degenerate with a and d.
MNRAS 000, 1–18 (2016)

10 L. S. Ardestani et al.
In order to explore the extent of this degeneracy weused the results of See et al. (2017) and Folsom et al. (2016)who provide predictions on the dependency of mass loss andmagnetic field strength on Rossby number using ZeemanDoppler Imaging. It should be stressed that the estimatesobtained for a & d parameters by See et al. (2017) and Fol-som et al. (2016) have been found by adopting a value ofRom
crit = 0.1. This shows that the Romcrit parameter is also
degenerate. Hence, we vary this parameter alongside a & d.
On this basis, we choose to test values of 0.8 < a <
1.8, 0.7 < d < 1.7 and 0.05 < Romcrit < 0.2 to explore the
degeneracy between these parameters and look for cases thatcould provide fair fits to our clusters. In appendix B we showhow Rom
crit, a & d affect the models against the stars in theM35 and M37 clusters.
In fig. 5 we explore the degeneracy between parametersRom
crit, a & d. It should be noted that since none of the casesin the Rom
crit > 0.12 limit were successful, we do not includethem in fig. 5. In each panel we have tested different valuesof the a parameter versus d and for different Rom
crit values.The plots show whether or not a certain set of parametersfits our sample at two different ages; 150 Myr and 550 Myr.These two ages have been chosen because they containedthe most stars among our clusters and in all cases if a modelprovided a good fit for these two, it was also successful atthe other ages.The red and black colours show the results ofthe tests at 150 Myr and 550 Myr respectively.
The three symbols represent how well a model couldexplain the rotation profile of a cluster. Circles represent fitsthat were fair, i.e. covered most of the stars in a cluster. Forexample, in fig. B1 the Ro = 0.06 curve represents a fair fitfor the 150 Myr cluster. Diamonds show a good fit, i.e. Themajority of the stars in a cluster are situated between thetwo fastest and slowest rotating envelopes while the curvesare not far away from the stars either. For instance, in fig. B1the Ro = 0.07 is considered as a good fit while although theRo = 0.12 curve covers more stars, it is located far away fromthe envelope and thus not regarded as a good fit. Finally,crosses show tests which were ruled out.
Fig. B1 to B3 show that the slope at 550 Myr is notsteep enough to explain both low-mass fast rotators and thelack of massive fast rotators. Hence, none of the models wereaccepted as good fits at 550 Myr. The models which createdfair fits at both (and thus all) ages are shown with two con-centric black and red circles. We find that only in 6 out of576 cases we can find a successful fit. This also gives anacceptable limit for the range of each parameter.
Fig. 6 compares these successful models at 150 Myr and550 Myr. The degeneracy between the three parameters a, dand Rom
crit is apparent. We point out that, for the 150 Myr-old cluster, our envelope for fast rotating stars is slightlybelow the cloud of points. On the other hand, at 550 Myr,we cannot explain a few fast rotating stars below 0.6 Mand our braking model seems to be slightly too weak for fastrotating stars above 0.8 M. On the other hand, our modelis quite successful at explaining most of the slow rotatingstars at both ages (and, as we will see afterwards, for olderclusters). Overall, while our solutions appear to be capturingthe dominant features of the spin–mass–age relation, we stillhave problems for fast rotating stars. This indicates thateither the observations are incomplete or more probably thatmagnetic braking is more complex than assumed here.
Since all the successful models are extremely close toone another, we cannot select one over the others based onthese spin–mass–age relations. We therefore choose our pre-ferred model based on the proximity of the parameters towhat has been found in the literature. These parameters area = 1.2, d = 1.3 & Rom
crit = 0.09. We adopt them for the restof the paper.
4.4 Decoupling of internal layers: τmix
The timescale over which angular momentum is transferredbetween the inner core and the outer convective zone, themixing timescale τmix, is a free parameter that we adjustto fit observations at this stage. Several previous studieshave included a decoupling timescale in their models andfound it to be of order of a few 10 Myr. J15 have focusedon ages above 100 Myr and found that they were able tofit their sample without assuming core-envelope decoupling.We also performed a series of tests to check whether wecould indeed describe observations without τmix. In order todo this, we repeated our tests in section 4.3. However, ourresults showed that a major defect of such models is thatthey are generally unsuccessful at reproducing a good fit toboth young and old clusters with the same parameters. Wecould not find a set of parameters that described all agessuccessfully and thus infer that core-envelope decoupling isa necessary component of our model.
GB15 on the other hand, assume τmix to depend onmass and initial rotation simultaneously. They argue thatthe reason for adopting a different mixing timescale for theslow and fast rotators, is that angular momentum mixingmay depend on the width of the tachocline (between theradiative core and the convective zone) which is influencedby shear. We acknowledge that this is a possibility, but itintroduces yet another source of freedom to the model.
Fig. 7 shows the result that we get after adoptingGB15’s τmix. It also shows that we were able to fit our sam-ple using a constant τmix = 150 Myr for all masses and ro-tation regimes. We did not attempt to fit all possible com-binations of τmix(M) but instead tried fixed τmix and foundthat τmix150 Myr improved the fit in the sense that it couldexplain more stars in the low-mass fast rotators branch atyoung and intermediate ages. However, we are also getting alarger range of spin periods at old ages. This indicates thatthe solution is more complex and beyond our model.
Finally, we tested how different orders of magnitude ofour adopted τmix would fit observations (fig. 7). An interest-ing point in the behaviour of the mixing timescale parameteris how either lower or higher values generally predict slowerrotation rates.
5 RESULTS: CONFRONTING THE MODELWITH OBSERVATIONS
Based on the investigations performed in the previous sec-tions we are now at a stage where we can provide a modelwith our preferred set of parameters (see Table 2) for pre-dicting the rotational evolution of stars vs. their mass.
MNRAS 000, 1–18 (2016)

Spin-Orbit Evolution of Stars and Exoplanets 11
Romin=0.05
0.5 1.0 1.5 2.0d
0.5
1.0
1.5
2.0
a
Romin=0.06
0.5 1.0 1.5 2.0d
0.5
1.0
1.5
2.0
a
Romin=0.07
0.5 1.0 1.5 2.0d
0.5
1.0
1.5
2.0
a
Romin=0.08
0.5 1.0 1.5 2.0d
0.5
1.0
1.5
2.0
a
Romin=0.09
0.5 1.0 1.5 2.0d
0.5
1.0
1.5
2.0
aRomin=0.1
0.5 1.0 1.5 2.0d
0.5
1.0
1.5
2.0
a
Romin=0.11
0.5 1.0 1.5 2.0d
0.5
1.0
1.5
2.0
a
Romin=0.12
0.5 1.0 1.5 2.0d
0.5
1.0
1.5
2.0
a
150 Myr550 Myr
Figure 5. Exploring the degeneracy between parameters controlling magnetic field and mass loss a, Romcrit and d. We test values of
0.8 < a < 1.8, 0.7 < d < 1.7 and 0.05 < Romcrit < 0.2. Since none of the cases with Rom
crit > 0.12 create a good fit, we do not include them in
this figure. The red and black colours show the results of the tests at 150 Myr and 550 Myr respectively. Circles represent fits that werefair while diamonds show a good fit to a cluster and crosses are for tests which were ruled out. The 6 concentric black and red circles
show cases which were successful at both ages.
0.6 0.8 1.0 1.2 1.4 1.6Mass/MSun
0.1
1.0
10.0
100.0
Spin
per
iod/
days
M35a=1.2 d=0.7 Romin=0.06a=1.0 d=1.1 Romin=0.06a=1.2 d=0.9 Romin=0.07a=1.0 d=1.3 Romin=0.07a=1.2 d=1.3 Romin=0.09a=1.8 d=0.7 Romin=0.11
150 Myr
Ro=1.11Ro=0.11
0.6 0.8 1.0 1.2 1.4 1.6Mass/MSun
0.1
1.0
10.0
100.0
Spin
per
iod/
days
M37a=1.2 d=0.7 Romin=0.06a=1.0 d=1.1 Romin=0.06a=1.2 d=0.9 Romin=0.07a=1.0 d=1.3 Romin=0.07a=1.2 d=1.3 Romin=0.09a=1.8 d=0.7 Romin=0.11
550 Myr
Ro=1.11Ro=0.11
Figure 6. An overlap of the 6 successful models shown by two concentric circles in figure 5 at two different ages; 150 Myr and 550 Myr.
MNRAS 000, 1–18 (2016)

12 L. S. Ardestani et al.
0.6 0.8 1.0 1.2 1.4 1.6Mass/MSun
0.1
1.0
10.0
100.0
Spin
per
iod/
days
M37taumix=1500 Myrtaumix=150 Myrtaumix=15 Myrtaumix GB15
550 Myr
Ro=1.11Ro=0.09
0.6 0.8 1.0 1.2 1.4 1.6Mass/MSun
0.1
1.0
10.0
100.0
Spin
per
iod/
days
NGC6811taumix=1500 Myrtaumix=150 Myrtaumix=15 Myrtaumix GB15
940 Myr
Ro=1.11Ro=0.09
Figure 7. Test of different τmix in comparison with τmix in GB15 at two different ages 550 Myr and 940 Myr
5.1 Comparison to Cluster Observations
Fig. 8 summarises the spin period evolution of fast and slowrotators as a function of mass and at different ages. The twosolid black lines represent the slow (upper curve) and fast(lower curve) rotator population envelopes. The dotted redlines represent models with intermediate initial spin periodsof 8.0, 4.0 & 2.0 days. Our models provide a good overall fitto the observational constraints.
As previously discussed in 4.2, the spin rates of the outerconvective zones of the stars are assumed to be held constantduring the first 1 Myr for solar-mass fast rotators and 6 Myrfor solar-mass slow rotators. We have also assumed a lin-ear variation of τdisk between these two for the intermediatemodels in fig. 8.
After the disk disappears, stars spin up due to theirPMS contraction until they approach the main-sequence andmagnetic braking begins to be important. As a result, rota-tion periods which are uniformly distributed between about1 and 16 days in the ONC at 1 Myr start decreasing at 5 Myrin NGC2362, in particular for fast rotators which supposedlylost their disk early and began their spin-up. At 13 Myr thehigh-mass stars have spun up significantly due to pre-main-sequence contraction. There are a few outliers with a ≈ 10days spin period and a mass of 1.4M, but these could easilybe explained by a 0.1M or so error on the mass determina-tion. After entering the main-sequence, at the age of about30 Myr, stars spin down through magnetic braking. Fig. 8shows that after about 100 Myr slow rotators appear to con-verge towards a relatively well-defined sequence whereas fastrotators remain scattered relatively significantly. The en-velopes for the fast and slow rotators appear to globallycapture the evolution of these populations. We see that forthe M37 cluster, we slightly underestimate the spread inrotation rates. The difference, however, is small. Johnstoneet al. (2015) also report a similar issue in their predictionsfor this cluster.
We acknowledge that between 600 Myr and 940 Myr,our model seems to predict a slightly too fast envelope forfast rotators. At older ages, up to 2.5 Gyr, the slow rota-tors branch of our model reproduces the observations well.However, there are very few fast rotators. This raises thequestion of whether our envelope for fast rotators is correct.
In fact, as shown in fig. 2, the B97 and GB15 parameterisa-tions tend to have a much faster convergence so that, afterabout 500 Myr, the initial conditions have been lost. It is notclear, however, if the observations require that. The clusterswhich have been observed at these relatively old ages containsomewhat fewer stars and it seems plausible that the absenceof these fast rotating stars is due to the fact that they arerarer than the slow-rotating ones. In addition, we can seethat the Hyades does possess a number of low-mass, fastrotating stars which are not explained by the B97 and G15parameterisations. We hence believe that our parameterisa-tion provides a plausible conservative estimate for rapidlyrotating stars.
Furthermore, our model also captures the essence of theKraft break the fact that F-type stars, above about 1.2 M,rotate much more rapidly than G-type stars. This was notthe case of the B97, G15 and J15 parameterisations (seefig. 2). The agreement between model and observations isnot as good for these massive stars as for the lower-massstars however.
Finally, we point out that the increase in spin periodsseen in the NGC6819 cluster is due to stars leaving the main-sequence. Because they expand, conservation of angular mo-mentum requires that their spin rate decreases.
5.2 Bimodality in Rotation Rates
It has long been known that in most of the intermediate-ageclusters such as M35 & M37, many of the stars lie on oneof two principal sequences, identified as C and I by Barnes(2003). These sequences are not necessarily clearly definedwith a significant number of stars found in between them.
The I-sequence consists of relatively slow rotators. Withincreasing age, the I-sequence becomes more tightly de-fined, and moves to longer periods. Stars on the C-sequenceare rapid rotators. In young clusters ,t 6 150 Myr, the C-sequence has members that span the mass range of solar-like stars. In older clusters the C-sequence fades away, start-ing with the higher-mass stars. By the age of the Hyades(600 Myr) it seems as if the only remaining fast rotators arelow-mass stars. However, as discussed previously, this maybe an artefact from the relatively limited number of starsassociated with these old clusters.
MNRAS 000, 1–18 (2016)

Spin-Orbit Evolution of Stars and Exoplanets 13
0.6 0.8 1.0 1.2 1.4 1.6Mass/MSun
0.1
1.0
10.0
100.0
Spin
period/d
ays
ONC
Preferred Model
1 Myr
Ro=0.09
0.6 0.8 1.0 1.2 1.4 1.6Mass/MSun
0.1
1.0
10.0
100.0
Spin
period/d
ays
NGC2264
Preferred Model
3 Myr
Ro=0.09
0.6 0.8 1.0 1.2 1.4 1.6Mass/MSun
0.1
1.0
10.0
100.0
Spin
period/d
ays
CEPOB3b
Preferred Model
4 Myr
Ro=0.09
0.6 0.8 1.0 1.2 1.4 1.6Mass/MSun
0.1
1.0
10.0
100.0
Spin
period/d
ays
NGC2362
Preferred Model
5 Myr
Ro=0.09
0.6 0.8 1.0 1.2 1.4 1.6Mass/MSun
0.1
1.0
10.0
100.0
Spin
period/d
ays
hPer
Preferred Model
13 Myr
Ro=1.11
Ro=0.09
0.6 0.8 1.0 1.2 1.4 1.6Mass/MSun
0.1
1.0
10.0
100.0
Spin
period/d
ays
Pleiades
Preferred Model
125 Myr
Ro=1.11
Ro=0.09
0.6 0.8 1.0 1.2 1.4 1.6Mass/MSun
0.1
1.0
10.0
100.0
Spin
period/d
ays
M35
Preferred Model
150 Myr
Ro=1.11
Ro=0.09
0.6 0.8 1.0 1.2 1.4 1.6Mass/MSun
0.1
1.0
10.0
100.0
Spin
period/d
ays
M34
Preferred Model
220 Myr
Ro=1.11
Ro=0.09
0.6 0.8 1.0 1.2 1.4 1.6Mass/MSun
0.1
1.0
10.0
100.0
Spin
period/d
ays
M37
Preferred Model
550 Myr
Ro=1.11
Ro=0.09
0.6 0.8 1.0 1.2 1.4 1.6Mass/MSun
0.1
1.0
10.0
100.0
Spin
period/d
ays
Praesepe
Preferred Model
600 Myr
Ro=1.11
Ro=0.09
0.6 0.8 1.0 1.2 1.4 1.6Mass/MSun
0.1
1.0
10.0
100.0
Spin
period/d
ays
Hyades
Preferred Model
650 Myr
Ro=1.11
Ro=0.09
0.6 0.8 1.0 1.2 1.4 1.6Mass/MSun
0.1
1.0
10.0
100.0
Spin
period/d
ays
NGC6811
Preferred Model
940 Myr
Ro=1.11
Ro=0.09
0.6 0.8 1.0 1.2 1.4 1.6Mass/MSun
0.1
1.0
10.0
100.0
Spin
period/d
ays
NGC6819
Preferred Model
2500 Myr
Ro=1.11
Ro=0.09
Figure 8. Evolution of spin period vs. stellar mass predicted by our preferred model on top of observations of individual clusters at
different ages. The two lines represent the slow and fast rotators trend with initial spin periods of 16.0 and 1.0 d respectively. The set
of parameters used for this model are listed in Table 2. The two dashed lines show the critical Rossby numbers first for weakeningthe magnetic braking beyond Rom
crit = 0.09 and then practically stopping breaking at RoMcrit = Ro according to van Saders et al. (2016)
prescription. The red dotted lines correspond to models with intermediate initial periods compared to those of the fast and slow rotatorbranches. From top down, they have initial spin periods of 8.0, 4.0 and 2.0 d respectively. The position of the Sun and AlphaCenB havebeen marked with a larger circle.
MNRAS 000, 1–18 (2016)

14 L. S. Ardestani et al.
Our model reproduces this feature qualitatively. Thisis because slow rotators with Ro > Rom
crit have an angu-
lar momentum decay rate dJ/dt ∝ Ω(1−2m)d+4ma+1 = Ω2.60
whereas for fast rotators with Ro ≤ Romcrit, dJ/dt ∝ Ω (as-
suming K2vesc > ΩR). Extremely fast rotators, characterisedby K2vesc < ΩR, are found on the PMS and for spin periodsshorter than about a day. For these, the magnetic brakingis even weaker, dJ/dt ∝ Ω1−2m = Ω0.56.
Thus, the stronger dependence of magnetic braking onΩ for slow rotators leads to a faster convergence towardsa relatively well-defined relation. On the other hand, theweaker dependence on Ω for fast rotators with already max-imal field strength implies that the scatter in spin rates isconserved for longer. We can see, however, by focusing onthe intermediate initial spin rates (red curves) in fig. 8 thatalthough our model captures the broad behaviour of thesepopulations, it fails to reproduce the fact that the slow ro-tators appear to rapidly outnumber the fast rotators. Thisprobably requires a different physics from that assumed here(see e.g., Brown 2014).
5.3 Application to individual field stars
Our model parameters have been calculated based on clusterobservations and a calibration to the Sun. We now turn tothe comparison of our model predictions to those observedon individual field stars, listed in Table 4. Most of thosewere obtained by an analysis of Kepler observations com-bining photometrically determined spin periods to precisedetermination of age, mass and metallicity from astroseis-mic modelling (van Saders et al. 2016). The ensemble spans arange of age between about 1 and more than 10 Gyr, massesbetween 0.8 and 1.3 M and [Fe/H] between −0.25 and +0.4.It is thus well suited for our purposes.
In order to compare observations and models, we pro-ceed as follows. For each star, we calculate a nominal modelfor the stellar age, mass and metallicity and an initial spinperiod of 4 d (taken as the geometrical mean of the val-ues observed in the ONC). We also calculate models forages, masses and metallicities which differ by ±1σ aroundthe observational values, and models for the nominal stel-lar parameters but initial spin periods of 1 and 16 d, re-spectively. We note the difference between the spin peri-ods thus obtained and those of the nominal model δPage,δPmass, δP[Fe/H] and δPPini respectively. We then calculateour model uncertainties from a quadratic mean, δPmodel =(δP2
age + δP2mass + δP2
[Fe/H] + δP2Pini)
1/2. The model generates
asymmetries so negative and positive uncertainties are cal-culated separately. We then compare the observed and mod-elled values within uncertainties. A model is successful forone star if the observed and modelled values overlap. It isunsuccessful otherwise.
Following the approach taken by van Saders et al.(2016), two kinds of model are calculated. A standard onewith a magnetic braking that continues unhindered at largeRossby numbers (slow spin rates) and one that is stalledfor Ro > Ro. As shown in Table 4, the former model issuccessful for 13/24 stars (excluding the Sun, which is usedfor the calibration). It fails mostly for old, slowly spinningstars. The latter model that we adopted is successful for21/24 stars, which thus points to a tapering of magnetic
braking for slowly spinning stars, in line with the results ofvan Saders et al. (2016).
The three cases that still present a mismatch with ourpreferred model are:
• KIC10454113: This midlife, solar-metallicity, F star(with an estimated Teff ≈ 6400 K based on our model cal-culations) is rotating much more slowly (Pspin ≈ 15 days)than expected from our models which predict spin periodsbetween about 2 and 8 d. The difference is significant and tobe compared to our results for the NGC6819 cluster whichalso showed that two stars were rotating more slowly thanour predictions. At this point, we do not know how to ex-plain, on one hand, the fast rotators in NGC6811 (0.94 Gyr)and, on the other hand, KIC10454113 and the slow rotatorsin NGC6819 (2.5 Gyr).• KIC11244118: Another star that our model has diffi-
culty explaining is this 6.4 Gyr F star, with a metallicity of(+0.35) which is rotating faster (Pspin ∼ 23 days) than ourmodel predictions (30 to 41 days). We notice that this staris characterised by Ro > RoM
crit.• 55Cnc: This is a binary system consisting of a G-type
star (55 Cancri A), known to host at least five planets, anda smaller red dwarf (55 Cancri B). The main star spins in30 to 48 days, faster than the model prediction of 56 to 65days, even when accounting for the suppression of magneticbraking after Ro > RoM
crit.
The engulfment of a hot Jupiter (e.g. Poppenhaeger &Wolk 2014; Guillot et al. 2014) could be invoked to explainthe anomalously fast rotation of KIC11244118 and 55Cnc.However, given that the list is limited to only 24 stars andgiven that hot Jupiters are quite rare, this is highly unlikely.For KIC10454113, the fact that the inferred spin period istwo to three times longer than the model predictions is evenmore puzzling. We are therefore not able to explain the spinrates of these stars and recommend further studies, in par-ticular to confirm their characteristics.
The special case of αCen A & B illustrates the impor-tance of a precise characterization of the targets. These twostars are known for their proximity to the Sun and in thecase of αCen B for the possible presence of an Earth-massplanet in a short orbit that has recently been invalidated(Rajpaul et al. 2016). Delorme et al. (2011) indicate, fromastroseismic constraints, an age of 6.5 ± 3 Gyr which yieldsa spin period clearly in excess of the observations for bothstars. However, the detailed study of Bazot et al. (2012) onαCen A yields a younger age of 5.0 ± 5 Gyr. With this age,our preferred model reproduces the observed spin periods ofboth components.
6 CONCLUSION
We have presented a parametric semi-empirical model forthe magnetic braking of stars with masses between 0.5 and1.6 M and from pre-main-sequence to the end of their main-sequence lifetime. The parameters prescribe the stellar massloss rate and magnetic field amplitude as a function of thephysical characteristics of the star obtained from a stellarevolution model and of its spin rate. In the spirit of previ-ous studies (B97, GB15), we also assume that the spin ofthe outer convective layer of stars is maintained constant
MNRAS 000, 1–18 (2016)

Spin-Orbit Evolution of Stars and Exoplanets 15
Table 4. Statistical properties of the distributions of rotation rates in individual field stars used in this study. The observed stellar spinperiod P? is compared to that calculated assuming RoM
crit = ∞ or assuming RoMcrit = Ro (our preferred model).
Star age [Ma] M? [M] [Fe/H] P? [days] Ref.
observed RoMcrit = ∞ RoM
crit = Ro
KIC10644253 1070 ± 250 1.13 ± 0.05 0.12 ± 0.09 10.91 ± 0.87 7.1+3.3−3.0 3 7.1+3.3
−3.0 3 1
KIC9139151 1710 ± 190 1.14 ± 0.03 0.11 ± 0.09 11.00 ± 2.20 9.3+3.6−3.2 3 9.3+3.6
−3.2 3 1
KIC10454113 2030 ± 290 1.19 ± 0.04 −0.06 ± 0.09 14.60 ± 1.10 5.2+3.1−2.5 7 5.2+2.4
−3.1 7 1
KIC3427720 2230 ± 170 1.13 ± 0.04 −0.03 ± 0.09 13.90 ± 2.10 10.1+3.9−3.6 3 10.1+3.9
−3.6 3 1
KIC5184732 4170 ± 400 1.27 ± 0.04 0.38 ± 0.09 19.80 ± 2.40 22.0+4.2−3.7 3 20.9+4.1
−3.4 3 1
KIC10963065 4360 ± 460 1.09 ± 0.02 −0.20 ± 0.10 12.40 ± 1.20 13.5+4.4−4.4 3 9.3+4.1
−3.4 3 1
AlphaCenA 4400 ± 300 1.10 ± 0.02 0.20 ± 0.02 22.00 ± 3.00 26.0+2.8−2.9 3 25.8+1.5
−3.2 3 3
Sun 4567 ± 1 1.00 ± 0.00 0.00 ± 0.00 27.20 ± 1.00 27.2+2.1−2.2 3 27.0+0.5
−2.0 3 2
KIC8006161 5040 ± 170 1.04 ± 0.02 0.34 ± 0.09 29.80 ± 3.10 35.2+3.5−3.8 3 35.2+3.5
−3.8 3 1
KIC6196457 5510 ± 710 1.23 ± 0.04 0.17 ± 0.11 16.40 ± 1.20 25.8+9.7−25.8 3 18.9+5.1
−18.9 3 1
KIC11401755 5850 ± 930 1.03 ± 0.05 −0.20 ± 0.06 17.20 ± 1.40 23.2+7.1−6.2 3 16.2+6.4
−5.7 3 1
70OphA 6200 ± 1000 0.89 ± 0.02 0.04 ± 0.02 39.80 ± 1.00 42.7+5.7−5.5 3 42.7+4.4
−6.3 3 3
KIC6116048 6230 ± 370 1.01 ± 0.03 −0.24 ± 0.09 17.30 ± 2.00 26.2+3.0−5.3 3 18.6+2.5
−5.3 3 1
KIC6521045 6240 ± 370 1.04 ± 0.02 0.02 ± 0.10 25.30 ± 2.80 31.4+4.4−4.2 3 24.0+5.4
−4.7 3 1
KIC10586004 6350 ± 1370 1.16 ± 0.05 0.29 ± 0.10 29.80 ± 1.00 35.2+10.5−7.8 3 27.5+7.9
−5.4 3 1
KIC9955598 6430 ± 470 0.96 ± 0.01 0.08 ± 0.10 34.70 ± 6.30 40.9+4.2−4.2 3 38.6+6.2
−5.4 3 1
KIC11244118 6430 ± 580 1.10 ± 0.05 0.35 ± 0.09 23.20 ± 3.90 38.0+5.2−3.8 7 32.7+8.1
−3.7 7 1
AlphaCenB 6500 ± 300 0.91 ± 0.02 0.23 ± 0.03 41.00 ± 1.80 47.7+4.2−3.0 3 47.7+4.2
−3.0 3 3
16CygB 6820 ± 280 1.06 ± 0.03 0.05 ± 0.02 23.20 ± 7.40 33.3+4.4−2.1 7 23.5+5.8
−1.6 3 1
16CygA 7070 ± 460 1.10 ± 0.03 0.09 ± 0.02 23.80 ± 1.70 36.7+4.2−3.5 7 25.6+3.5
−1.8 3 1
KIC9098294 7280 ± 510 1.00 ± 0.03 −0.13 ± 0.09 19.80 ± 1.30 35.2+5.2−4.8 7 25.1+6.1
−4.8 3 1
KIC8349582 7930 ± 940 1.19 ± 0.04 0.30 ± 0.10 51.00 ± 1.50 49.9+60.6−49.9 3 33.8+43.8
−33.8 3 1
KIC3656476 8130 ± 590 1.17 ± 0.03 0.25 ± 0.09 31.70 ± 3.50 62.2+292.5−24.1 7 39.5+215.8
−12.4 3 1
KIC7871531 9150 ± 470 0.84 ± 0.02 −0.24 ± 0.09 33.70 ± 2.60 50.7+2.9−4.6 7 40.8+2.8
−5.5 3 1
55Cnc 10910 ± 1620 0.91 ± 0.03 0.31 ± 0.04 39.00 ± 9.00 68.5+6.7−6.7 7 59.1+5.5
−3.0 7 4
1 van Saders et al. (2016),2 Based on Carrington’s spin period and the meteoritic datations with approximate uncertainties to account for
differential rotation and a possible zero-age offset, respectively (e.g., Thompson et al. 2003; Bonanno & Frohlich
2015),3 Delorme et al. (2011), except age of AlphaCen A+B from Bazot et al. (2012),4 Maxted et al. (2015)
by their circumstellar disks and that the slowest (fastest)spinning stars are those which had a disk for the longest(shortest). Two critical Rossby numbers define when themagnetic field saturates and stops increasing with increas-ing spin rates (for Ro < Rom
crit) and when the magnetic fieldchanges form, leading to a decrease in angular momentumloss efficiency (for Ro > RoM
crit). Contrary to previous modelswhich parameterised the magnetic field intensity and massloss as a function of the rotation rate, we tie them to thestar’s Rossby number calculated at the base of the outer con-vective zone. This feature enables applying the same modelto a wide variety of stellar types. All models are calibratedto the Sun, in order to reproduce a 27 d spin period after4.5 Gyr of evolution of a solar metallicity 1 M star.
The model parameters were determined from an anal-ysis of the observation of young clusters with ages be-tween 1 Myr and 2.5 Gyr. For non-saturating magnetic fields
Ro ≥ Romcrit = 0.09, we determined that B ∝ Ro−1.2 and
ÛM ∝ Ro−1.3 led to a fair fit of the observations for a widerange of stellar types (M to F). We found that the suppres-sion of magnetic braking in F stars is naturally explained bythe shortening of the convective turnover timescale at thebase of their (small) outer convective zone. We also inves-tigated the degeneracy between the parameters controllingmagnetic field strength and mass loss rate (parameters Rom
crit,a & d). We found that in only 6 out of 576 cases we could finda successful fit. For instance, the following values could allprovide fair fits: Rom
crit = 0.06, a = 1.0, d = 1.1; Romcrit = 0.09,
a = 1.2, d = 1.3; & Romcrit = 0.11, a = 1.8, d = 0.7. Therefore,
our parametric model provides a way to analyse the spinrate of stars and to identify outliers which may have beenspun up or down by external processes.
One of the consequences of our parameterisation is thatthe convergence in spin rates with age is slower than gen-
MNRAS 000, 1–18 (2016)
16 L. S. Ardestani et al.
erally assumed. At the age of the Sun, we predict a spreadof rotation rates of about 10 percent that depends on theangular momentum acquired by stars at the end of the cir-cumstellar disk phase. This spread increases at lower masses.
Following van Saders et al. (2016), we could confirmthat stars of old age and slow rotation rates see their brak-ing suppressed. This is plausibly a consequence of a changein the magnetic field geometry but should be investigatedfurther.
Although our model provides a fair fit to the spin evo-lution of stars between 0.5 M and 1.6 M, we acknowledgethat it does not provide the final answer to the problem.For instance a remaining issue that needs to be addressed isthat our model predicts too many fast rotators at older ageswhich is not in line with observations.
We are providing our model both for fast- and slow-rotating stars as a function of mass and age. Our model isthus a useful basis to analyse and predict stellar spin periods.A more exhaustive exploration of the ensemble of solutionswould be desirable in order to understand and constrain thephysical mechanisms at play. Beyond that, progress on theevolution of the spin rates of stars will require a combina-tion of dedicated studies and observations of spin rates andmagnetic field properties of stars as a function of age, massand metallicity.
Finally, although many of the stars in our sample arelikely to have companions, as we showed in section 3.1 bi-narity does not play a major role for the purposes of thisstudy.
ACKNOWLEDGEMENTS
We thank the anonymous referee for providing useful com-ments on the paper that have helped us to improve theoriginal manuscript. We also thank Colin Johnstone, HabibG. Khosroshahi and Raphael Raynaud for their commentsand help on the paper. We acknowledge support from theCentre for International Scientific Studies and Collaboration(CISSC) and from the Cultural Section of the French Em-bassy through a Gundishapur fellowship, as well as the OCABQR and the IPM School of Astronomy.
REFERENCES
Allain S., 1998, A&A, 333, 629
Baliunas S. L., Nesme-Ribes E., Sokoloff D., Soon W. H., 1996,ApJ, 460, 848
Barnes S. A., 2003, ApJ, 586, 464
Bazot M., Bourguignon S., Christensen-Dalsgaard J., 2012, MN-
RAS, 427, 1847
Bell C. P. M., Naylor T., Mayne N. J., Jeffries R. D., Littlefair
S. P., 2013, MNRAS, 434, 806
Bertout C., Siess L., Cabrit S., 2007a, A&A, 473, L21
Bertout C., Siess L., Cabrit S., 2007b, A&A, 473, L21
Bonanno A., Frohlich H.-E., 2015, A&A, 580, A130
Bouvier J., Forestini M., Allain S., 1997, A&A, 326, 1023
Bouvier J., Matt S. P., Mohanty S., Scholz A., Stassun K. G.,
Zanni C., 2014, Protostars and Planets VI, pp 433–450
Brown T. M., 2014, ApJ, 789, 101
Cieza L. A., et al., 2009, ApJ, 696, L84
Cranmer S. R., Saar S. H., 2011, ApJ, 741, 54
Deheuvels S., et al., 2012, ApJ, 756, 19
Delorme P., Collier Cameron A., Hebb L., Rostron J., Lister T. A.,
Norton A. J., Pollacco D., West R. G., 2011, MNRAS, 413,
2218
Donati J.-F., et al., 2008, in van Belle G., ed., Astronomical Soci-
ety of the Pacific Conference Series Vol. 384, 14th CambridgeWorkshop on Cool Stars, Stellar Systems, and the Sun. p. 156
(arXiv:astro-ph/0702159)
Duquennoy A., Mayor M., 1991, A&A, 248, 485
Folsom C. P., et al., 2016, MNRAS, 457, 580
Gallet F., Bouvier J., 2013, A&A, 556, A36
Gallet F., Bouvier J., 2015, A&A, 577, A98
Girardi L., Grebel E. K., Odenkirchen M., Chiosi C., 2004, A&A,
422, 205
Guillot T., Lin D. N. C., Morel P., Havel M., Parmentier V., 2014,
in EAS Publications Series. pp 327–336 (arXiv:1409.7477),doi:10.1051/eas/1465009
Haisch Jr. K. E., Lada E. A., Lada C. J., 2001, ApJ, 553, L153
Hartman J. D., Bakos G. A., Kovacs G., Noyes R. W., 2010,
MNRAS, 408, 475
Hiremath K. M., 2013, Seismology of the Sun: Inference of Ther-
mal, Dynamic and Magnetic Field Structures of the Interior.
p. 317, doi:10.1007/978-3-642-38167-6 19
Irwin J., Bouvier J., 2009a, in Mamajek E. E., Soderblom D. R.,
Wyse R. F. G., eds, IAU Symposium Vol. 258, The Ages ofStars. pp 363–374, doi:10.1017/S1743921309032025
Irwin J., Bouvier J., 2009b, in Mamajek E. E., Soderblom D. R.,Wyse R. F. G., eds, IAU Symposium Vol. 258, IAU Sympo-
sium. pp 363–374, doi:10.1017/S1743921309032025
Irwin J., Hodgkin S., Aigrain S., Hebb L., Bouvier J., Clarke C.,
Moraux E., Bramich D. M., 2007, MNRAS, 377, 741
Irwin J., Berta Z. K., Burke C. J., Charbonneau D., Nutzman P.,
West A. A., Falco E. E., 2011, ApJ, 727, 56
Johnstone C. P., Gudel M., Brott I., Luftinger T., 2015, A&A,577, A28
Kawaler S. D., 1988, ApJ, 333, 236
Kim Y.-C., Demarque P., 1996, ApJ, 457, 340
Kraft R. P., 1967, ApJ, 150, 551
Landin N. R., Mendes L. T. S., Vaz L. P. R., 2010, A&A, 510,
A46
Leao I. C., et al., 2015, A&A, 582, A85
Littlefair S. P., Naylor T., Mayne N. J., Saunders E. S., Jeffries
R. D., 2010, MNRAS, 403, 545
MacGregor K. B., Brenner M., 1991, ApJ, 376, 204
Matt S., Pudritz R. E., 2008, ApJ, 678, 1109
Matt S. P., MacGregor K. B., Pinsonneault M. H., Greene T. P.,
2012, ApJ, 754, L26
Maxted P. F. L., Serenelli A. M., Southworth J., 2015, A&A, 577,
A90
McQuillan A., Mazeh T., Aigrain S., 2014, ApJS, 211, 24
Meibom S., Mathieu R. D., Stassun K. G., 2009, ApJ, 695, 679
Meibom S., Mathieu R. D., Stassun K. G., Liebesny P., Saar S. H.,
2011, ApJ, 733, 115
Meibom S., Barnes S. A., Platais I., Gilliland R. L., LathamD. W., Mathieu R. D., 2015, Nature, 517, 589
Mestel A. J., 1986, Proceedings of the Royal Society of London
Series A, 405, 49
Moraux E., et al., 2013, A&A, 560, A13
Morel P., Lebreton Y., 2008a, Ap&SS, 316, 61
Morel P., Lebreton Y., 2008b, Ap&SS, 316, 61
Noyes R. W., Weiss N. O., Vaughan A. H., 1984, ApJ, 287, 769
Parker E. N., 1958a, ApJ, 128, 664
Parker E. N., 1958b, ApJ, 128, 664
Pizzolato N., Maggio A., Micela G., Sciortino S., Ventura P., 2003,A&A, 397, 147
Poppenhaeger K., Wolk S. J., 2014, A&A, 565, L1
Rajpaul V., Aigrain S., Roberts S., 2016, MNRAS, 456, L6
Reiners A., Basri G., Browning M., 2009, ApJ, 692, 538
MNRAS 000, 1–18 (2016)

Spin-Orbit Evolution of Stars and Exoplanets 17
Reville V., Brun A. S., Matt S. P., Strugarek A., Pinto R. F.,
2015, ApJ, 798, 116
Ribas I., Guinan E. F., Gudel M., Audard M., 2005, ApJ, 622,
680
Saar S. H., 1996, in Strassmeier K. G., Linsky J. L., eds, IAU
Symposium Vol. 176, Stellar Surface Structure. p. 237
Schatzman E., 1962, Annales d’Astrophysique, 25, 18
See V., et al., 2017, MNRAS, 466, 1542
Skumanich A., 1972, ApJ, 171, 565
Soon W. H., Baliunas S. L., Zhang Q., 1993, ApJ, 414, L33
Thompson M. J., Christensen-Dalsgaard J., Miesch M. S., Toomre
J., 2003, ARA&A, 41, 599
Tout C. A., Pringle J. E., 1992, MNRAS, 256, 269
Venuti L., et al., 2016, preprint, (arXiv:1610.08811)
Vidotto A. A., Jardine M., Opher M., Donati J. F., Gombosi T. I.,2011, MNRAS, 412, 351
Vidotto A. A., et al., 2014, MNRAS, 441, 2361
Wright N. J., Drake J. J., Mamajek E. E., Henry G. W., 2011,ApJ, 743, 48
Zanni C., Ferreira J., 2013, A&A, 550, A99
van Saders J. L., Ceillier T., Metcalfe T. S., Aguirre V. S., Pin-
sonneault M. H., Garcıa R. A., Mathur S., Davies G. R., 2016,Nature, 529, 181
APPENDIX A: ON THE CONVECTIVETURNOVER TIMESCALE
A1 Calculation method
In the present work, we used τc = HP/vconv, the ratio ofthe pressure scale height HP to the convective velocity vconvcalculated with the mixing length approach. We used theCESAM stellar evolution code (Morel & Lebreton 2008a),and these quantities were calculated at half a pressure scaleheight HP over the base of the convective zone.
The definition of τc is based on the idea that dynamoaction should take place at the base of the convective zone(e.g., Kim & Demarque 1996), but where exactly this shouldbe measured is vague. It is thus rather the differential be-haviour, from one star to the next, that is important tocapture. In that sense, the parameter which affects most thevalue of τc is the depth of the convective zone itself. This isobvious in Figure A1, which shows that τc is almost uniquelydefined by the relative mass of the outer convective zone mczand is almost insensitive to stellar mass, metallicity and age(once the dependence on mcz has been removed).
In fact, τc can be well fitted for a wide range of pre-main-sequence and main-sequence evolutions by the follow-ing relation:
Log(τc) = 8.79 − 2|Log(mcz)|0.349 − 0.0194|Log(mcz)|2
−1.62Min [Log(mcz) + 8.55, 0] (A1)
where the value of τc is in seconds and mcz denotes massof the external convective zone divided by the total stellarmass.
A2 Main-sequence approximation
Stars on the pre-main-sequence see their physical propertiesevolve rapidly and as a consequence, τc becomes a strongfunction of age. However, when they get on to the main-sequence, the time dependence becomes much weaker, and,
10-10 10-8 10-6 10-4 10-2 100
Convective mass / Mtot
2
4
6
8
10
12
14
16
Lo
g (
t c)
[s]
central cz
external cz
0.5-0.8 Msun
0.8-1.2 Msun
1.2-1.6 Msun
1.6-2.0 Msun
Figure A1. Convective turnover timescale τc as a function of themass of the convective zone divided by the total stellar mass for
stars of all ages (from the pre-main-sequence to the end of the
main-sequence), metallicities between [Fe/H] = −0.5 and 0.5 andmasses from 0.5 to 2.0 M (as labelled). The top points corre-
spond to cases with a central convective zone, in which case the
turnover timescale is evaluated at half the mass of convective zone(this case is not used in our calculations). The bottom points cor-
respond to the more standard situation of an external convective
zone, in which case τc is evaluation half a pressure scale heightover the base of the convective zone. The dashed curve shows the
fit to the external convective zone case (equation (A1)).
as shown by Figure A2, a simple relation then links τc, stellarmass and stellar radius:
τc ∝ M−1R−1.2.
This relation holds at least up to 1.0 M. For higher stel-lar masses, however, the retreat of the external convectivezone implies that τc drops, which is at the heart of the exis-tence of the Kraft break, i.e., a much weaker magnetic fieldand magnetic braking for F-type stars than G-type stars.
APPENDIX B: EXPLORING THE MAGNETICFIELD AND MASS LOSS PARAMETER SPACE
In this appendix we discuss how the three parameters a, d& Rom
crit affect model predictions. Figures B1 through B3show how various values for Rom
crit, a and d affect the spinperiod evolution models against the stars in the M35 (150Myr) and M37 (550 Myr) clusters.
In figure B1 we have varied Romcrit from 0.05 to 0.12. It
should be noted that since values above Romcrit = 0.12 were
completely unsuccessful at fitting the observations they havebeen removed from plots. Small values of Rom
crit ≈ 0.05 resultin a too fast aggregation of the two rotating regimes, whilebigger values are slightly more successful at reproducing theslow rotators branch. A value of Rom
crit = 0.09 successfullycovers both the fast and slow rotators and seems to createthe best fit to the observations. This is in close agreementwith the usually adopted value of Rom
crit = 0.1 in the litera-ture.
In addition, the results of our tests for the a parameter
MNRAS 000, 1–18 (2016)

18 L. S. Ardestani et al.
0.6 0.8 1.0 1.2 1.4 1.6 1.8 2.0Radius/RSun
5.0
5.5
6.0
6.5
7.0
7.5
Lo
g (
t c M
)/yrs
.MS
un
0.6
0.7
0.8
0.9
1.0
1.1
1.2
Figure A2. Convective turnover timescale divided by stellarmass as a function of the stellar radius on evolutionary tracks
from Landin et al. (2010) for stars with solar composition. Square
symbols correspond to age< 30 Myr, circles are for age ≥ 30 Myr.The numbers are stellar masses in solar units. The dotted line
corresponds to τcM ∝ R−1.2.
are shown in figure B2. The results differ quite significantlyon the choice of a: Small values below 1.2 result in a lowerenvelope that is detached from the cloud of fast-spinningstars. Large values above 1.6 yield results in contradictionwith the existence of low-mass fast spinning stars and alsopredicts a slow rotation envelope that is detached from thecloud of points for small-mass stars. Based on these results,we choose a = 1.2 which is between the two values predictedby Folsom et al. (2016) a = 1.0 and See et al. (2017) whofind a = 1.65.
In figure B2, we also show our two critical Rossby num-bers Rom
crit = 0.09 and RoMcrit = 1.11. We can see in the case of
these two young clusters (and also for other clusters) that fora majority of stars, the relatively slow rotators, are locatedbetween these two lines. The fast rotators are, however, char-acterised by Ro < Rom
crit and are thus in a regime in whichthe magnetic field saturates (i.e., it is not proportional to thespin rate). This feature is crucial to account for the presenceof fast rotating solar-type stars even at relatively old ages.
Finally, figure B3 shows the results of testing parame-ter d. It can be seen that this parameter affects all stellarmasses but has a higher effect on fast rotators. Based onthis figure we choose d = 1.3 which is close to the predictedvalue by See et al. (2017) (d=1.49) and also in agreementwith the theoretical discussion of Tout & Pringle (1992) whopredicted mass loss to be a function of ∼ Ω.
APPENDIX C: MODELS
We provide our rotational evolution models for stellarmasses 0.5 to 1.6M and with five initial rotational peri-ods; 1.0, 2.0, 4.0, 8.0 and 16.0 days in electronic format. Themodels start from zero to 10 Gyr. Each model contains thefollowing parameters:
AGE: age of the star [Myr],H: the total angular momentum [g · cm2/s],
0.6 0.8 1.0 1.2 1.4 1.6Mass/MSun
0.1
1.0
10.0
100.0
Spin
period/d
ays
150 MyrM35
Ro=0.05
Ro=0.06
Ro=0.07
Ro=0.08
Ro=0.09
Ro=0.10
Ro=0.11
Ro=0.12
0.6 0.8 1.0 1.2 1.4 1.6Mass/MSun
0.1
1.0
10.0
100.0S
pin
period /days
550 MyrM37
Ro=0.05
Ro=0.06
Ro=0.07
Ro=0.08
Ro=0.09
Ro=0.10
Ro=0.11
Ro=0.12
Figure B1. Test of various Romcrit parameter values (Ro in the
figure) ranging from 0.05 to 0.12. In these tests a = 1.2 and d = 1.3.Models are plotted on top of spin period observations of the twoM35 and M37 clusters vs. mass. The numbers in legends and
corresponding colours show different values of the critical Rossby
number in distinguishing between the slow and fast rotators.
PSPIN1: rotation period of the primary [days],M1: mass [g],R1: radius [cm],MTI1: moment of inertia [g · cm2/s],TEFF1: effective temperature [K],PSPINDEEP1: period of inner radiative layer [days],XRDEEP1: radius of inner radiative layer [cm],XMEXTCZ1: mass of external convective zone [g],MTIDEEP1: moment of inertia of inner radiative layer
[g · cm2/s],MTICZ1: moment of inertia of convective zone [g ·
cm2/s],BMEAN1: mean magnetic field [G],MDOT1: mass loss rate [g/yr],ROSSBY1: Rossby number,TCONV1: convective turnover timescale [s].
This paper has been typeset from a TEX/LATEX file prepared by
the author.
MNRAS 000, 1–18 (2016)

Spin-Orbit Evolution of Stars and Exoplanets 19
0.6 0.8 1.0 1.2 1.4 1.6Mass/MSun
0.1
1.0
10.0
100.0
Spin
period/d
ays
M35
a=0.8a=1.0a=1.2a=1.4a=1.6a=1.8
150 Myr
Ro=1.11
Ro=0.09
0.6 0.8 1.0 1.2 1.4 1.6Mass/MSun
0.1
1.0
10.0
100.0
Spin
period/d
ays
M37
a=0.8a=1.0a=1.2a=1.4a=1.6a=1.8
550 Myr
Ro=1.11
Ro=0.09
Figure B2. Tests of the effect of magnetic field parameter a on
the spin period of stars as a function of mass against stars in
the two M35 and M37 clusters. Different colours correspond todifferent values of a between 0.8 and 1.8, as labelled. In these
tests Romcrit = 0.09 and d = 1.3.
0.6 0.8 1.0 1.2 1.4 1.6Mass/MSun
0.1
1.0
10.0
100.0
Spin
period/d
ays
M35
d=0.7d=0.9d=1.1d=1.3d=1.5d=1.7
150 Myr
Ro=1.11
Ro=0.09
0.6 0.8 1.0 1.2 1.4 1.6Mass/MSun
0.1
1.0
10.0
100.0S
pin
period/d
ays
M37
d=0.7d=0.9d=1.1d=1.3d=1.5d=1.7
550 Myr
Ro=1.11
Ro=0.09
Figure B3. The effect of changing mass loss parameter; d on the
spin period of stars as a function of mass against stars of M35
and M37. Colours correspond to different values of d between 0.7and 1.7. In these tests a = 1.2 and Rom
crit = 0.09.
MNRAS 000, 1–18 (2016)