stark contrasts - texas law contrasts: the impact of ... despite the existence of stark law,...
TRANSCRIPT

STARK CONTRASTS: THE IMPACT OF PROHIBITING PHYSICIAN SELF-REFERRALS ON THE
PREVALENCE OF OVERTREATMENT IN HEALTH CARE*
BRIAN K. CHEN, J.D., PH.D.
POSTDOCTORAL SCHOLAR IN COMPARATIVE HEALTH POLICY
SHORENSTEIN APARC
STANFORD UNIVERSITY
Abstract Do physicians invest in medical service facilities to profit from the overtreatment of patients? Current
literature only shows that physicians who make referrals to facilities in which they have a financial
interest order more services than physicians without such a financial interest. These studies, however, do
not establish a causal link between self-referrals and overtreatment. Using medical claims data from
Taiwan, we examine the impact of a policy designed to remove physicians’ financial incentives to
overprescribe drugs by prohibiting clinic-pharmacy integration, and find that (1) self-referrals indeed
cause physicians to overtreat patients, and (2) vertical integration also facilitates overtreatment. These
findings have important implications for federal Stark Legislation (42 U.S.C.S. §1395nn), which prohibits
physicians’ referral of Medicare/Medicaid patients to an entity in which they have a “financial
relationship” for certain designated health services. In particular, the third finding calls into question Stark
Law’s implicit assumption that vertically integrated medical providers are unlikely to overtreat patients,
as exemplified by the “bona fide employee” and “in house ancillary services” safe harbor exceptions.
*I am grateful for the many helpful comments and suggestions from Paul Gertler Catherine Wolfram, Steve
Tadelis, John Morgan and the student participants in the Business and Public Policy Student Seminar and at
the Haas School of Business. This study is based in part on data from the National Health Insurance
Research Database provided by the Bureau of National Health Insurance, Department of Health and
managed by National Health Research Institutes. The interpretation and conclusions contained herein do not
represent those of Bureau of National Health Insurance, Department of Health or National Health Research
Institutes.

1
I. Introduction
This paper examines the impact of prohibiting physician ownership of medical service
facilities on the prevalence of overtreatment in health care. Theoretically, it is straightforward to
understand how self-referrals – defined as referring patients to an entity in which the physician
has a financial interest – may lead to overtreatment in a fee-for-service system. On the demand
side, patients may have little incentive to reject treatment when insurance covers most of the cost.
On the supply side, the physician stands to gain financially when paid on a cost-plus basis by
providing more services than necessary (McGuire 2000). However, the empirical literature has
not satisfactorily demonstrated the existence of overtreatment in the context of self-referrals.
Most existing literature compares the prescribing behavior of physician-owners of medical
facilities to that of non-owners, and finds that owners prescribe more services than non-owners.
These cross-sectional comparisons, however, cannot distinguish between overutilization by
physician-owners and underutilization by non-owners. These studies do not establish a causal
link between self-referrals and overtreatment. Furthermore, no study has empirically examined
the impact of anti-self-referral legislation on physician’s propensity to overtreat patients.
To combat the perceived abuses of self-referrals, especially in physician-owned imaging
facilities, Congress passed the Stark Law1 in 1989. The initial legislation prohibited physician
referrals of Medicare and Medicaid patients to clinical laboratories in which the physicians have
a financial interest. Phase II (1993) of the Stark Law extended the prohibition to additional
health services. Phase III (2007) added an attribution rule to disallow physician employees of
group practices from making referrals when the owners of such practices are prohibited from
1 42 U.S.C.S. §1395nn in §1877 of the Social Security Act. Additional regulations can be found at 42 C.F.R.
§411.350 through §411.389

2
doing so. However, Phase III keeps both the “bona fide employee” and “in office ancillary
services” exceptions, which allow physician self-referrals (1) to an employee of a vertically
integrated firm, and (2) for services performed within the physician’s office. Thus, while the
new rules attempt to close loopholes in the federal statute, Stark Law still draws a sharp
distinction between permissible referrals made within a vertically integrated firm, and
impermissible referrals made to outside facilities.
Despite the existence of Stark Law, however, Medicare spending for imaging services
doubled from $7 billion to $14 billion annually between 2000 and 2006 – a 13% per annum
increase. Moreover, two-thirds of such spending occurred in physician office settings in 2006,
up from 60% in 20002. Nevertheless, physician groups continue to oppose legislations such as
the Stark Law. In addition to arguments favoring the freedom to contract and the need to provide
superior care to their patients, physicians point to deficiencies in the existing empirical literature
on self-referrals. They question whether self-referrals cause overtreatment, and whether
legislations such as the Stark Law are well crafted to address this concern. In this paper, we
draw from a physician utility maximization model (McGuire and Pauly 1991) to examine two
questions: (1) Do physician-owners who refer patients to their pharmacies overprescribe drugs?
(2) If so, does this overtreatment occur even when physicians refer patients in-house to a bona
fide employee-pharmacist?
To answer these questions, we exploit a quasi-experiment that occurred in Taiwan between
1997 and 2000. In part because of growing health care, and in particular prescription drug
expenditures3, Taiwan instituted a policy designed to remove power financial incentives for
2 Medicare: Trends in Fees, Utilization, Expenditures for Imaging Services before and after Implementation
of the Deficit Reduction Act of 2005, GAO-08-1102R, September 26, 2008. 3 In 2007, total health expenditures represented 6.3% of Taiwan’s GDP, of which 21% consisted of
prescription drug expenditures.

3
physicians to overprescribe drugs. This policy, known as the “separating policy,” was
implemented on a geographical basis over time, and prohibited physicians from dispensing drugs
from their pharmacies unless they hired an onsite pharmacist. This quasi-experiment makes it
possible to identify the impact of the anti-self-referral policy on several measures of prescription
volume.
Using patient-level microdata, a difference-in-differences methodology, and controlling for
a wide variety of fixed effects (including physician, quarter, disease, and location fixed effects),
we confirm that physicians who refer patients to their own pharmacies overprescribe drugs.
Relative to a control group, physicians at clinics that never hired a pharmacist showed
statistically significant reductions in various measures of prescription volume after the policy –
they reduced drug expenditures by 7.8%, likelihood of prescription by 2.3%, number of drugs
by .13 type, and prescription duration by .16 day. At the same time, these physicians increased
diagnostic test expenditures by 11.5%. On the other hand, physicians at clinics that always had a
pharmacist showed no change in prescribing behavior during the same period when compared to
the control group. The results survive several notable threats to identification, including patient
self-selection, endogeneity in the choice not to hire a pharmacist, and the appropriateness of the
control as the counterfactual.
Using a similar methodology, we find strong evidence that physicians vertically integrate
in order to profit from the overtreatment of patients. We first show that physicians were highly
rational in their choice to integrate – Generally, only clinics with sufficient patient volume to
offset some of the cost of hiring a pharmacist eventually did so. Clinics with an intermediate
level of patient volume prior to the policy change were most likely to hire a pharmacist
subsequently. Clinics with a high patient volume generally already had an onsite pharmacist.

4
Clinics with a sufficiently low past practice volume generally did not hire a pharmacist even
after the policy effective date. The clinics that did not have a pharmacist before the policy but
hired one thereafter, which we call “switchers,” showed (1) a marked drop in prescription
volume after the policy became effective but before they hired a pharmacist, and (2) a rebound in
these same measures after they employed an onsite pharmacist. In fact, if we drop all interim
observations – the post-policy, but pre-pharmacist office visits – switchers demonstrated almost
no statistically significant change in prescribing behavior. These results strongly support the
hypothesis that vertical integration facilitates overtreatment even when physicians refer patients
in house to a “bona fide employee.”
Our work contributes to the literature in several ways. First, it establishes a causal role of
self-referrals in the overtreatment of patients. Virtually all of the empirical work available is
suggestive of the overutilization hypothesis, but none shows causality because of their cross-
sectional research design. Childs and Hunter (1972), for example, show that patients who
receive care at a physician’s office with onsite radiological services are more than twice as likely
to receive imaging services as, and receive 65% more services than patients at an office without
onsite radiological services. Strasser et al (1987) demonstrate that the mere presence of onsite
radiological services is correlated with a 2.4 greater likelihood of physicians’ prescription of
imaging services than centers without onsite radiological facilities. The studies that may have
provided the greatest impetus for the passage of Stark Law (Hillman, et al. 1990; 1995; 1992), as
well as one by the United States General Accountability Office (Aronovitz 1994), all lend further
support to the previous empirical findings. These results have subsequently been confirmed in
the context of physician-owned physical therapy offices (Mitchell and Sass 1995), specialty
hospitals (Mitchell 2005), and more recent examinations of the imaging services sector (Gazelle,

5
et al. 2007; Mitchell 2008). Our work goes beyond cross-sectional comparisons of utilization,
and establishes a causal relationship between self-referrals and overtreatment.
Secondly, no existing studies examine the effect on self-referrals of allowing physicians to
vertically integrate to escape regulatory scrutiny. Stark Law safe harbor exceptions (as well as
antitrust policy) favor vertical integration, permitting single firms to engage in activities that are
prohibited when two or more parties behave similarly in concert. While it is possible that the
government must necessarily draw a bright-line rule in crafting legislation, our study shows that
self-referrals in house to a “bona fide employee” also result in overtreatment.
Our work informs policy in very specific ways. First, policymakers are correct to be
concerned about physicians referring patients to an entity in which they have a financial interest
because of the potential for overtreatment. However, prohibiting existing vertical relationship
may lead physicians to increase the quantity of a related service. Finally, the bright-line “bona
fide employee” or “in office ancillary services” exception may be misguided when the referring
physicians derive profits from the referral of patients to the employee.
The remainder of this paper is set up as follows: In Section II, we outline the major
features of the health care system in Taiwan and the details of the separating policy; in Section
III, we draw upon a physician utility maximization model to provide the theoretical framework
to generate testable hypotheses for our empirical investigation; in Section IV, we describe the
data and methodology that we use to answer our research questions; in Section V, we discuss the
results and findings of our investigation; and in Section VI, we conclude and highlight open
questions for future research.

6
II. Institutional Context
Taiwan’s medical providers, like those in many other East Asian nations, dispense the
drugs that they prescribe to their patients. Hospitals and clinics in Taiwan are reimbursed for
drugs at a standard formulary price, but they procure the drugs from manufacturers at a
negotiated – and often much lower – price. As a result, medical providers in Taiwan stand to
reap handsome profits from the sale of drugs, creating powerful financial incentives for
physicians to overprescribe medication. Anecdotal evidence suggests that this price differential
could make up almost 50% of the income of a large hospital.
To remove the financial motivation to overprescribe drugs, Taiwan implemented a policy
in 1997 to separate physicians’ diagnosing decisions from the incentive to prescribe drugs. As
originally conceived, the policy aimed to prohibit the sale of drugs at all physician-owned
pharmacies. However, the policy met with strong resistance from physician groups, and a
compromise was reached to allow clinics with an onsite pharmacist to continue dispensing drugs
from their pharmacies. Clinics without an onsite pharmacist must “release” their prescriptions to
be filled at an outside pharmacy, unless one of numerous age- or illness-based waivers applied4.
The policy was rolled out on a geographical basis over the course of four years, beginning with
Taipei and Kaohsiung on March 1, 1997. Jurisdictions became subject to the policy as soon as
there was a sufficient number of independent pharmacies in the relevant jurisdictions. See Table
I for a list of the implementation dates for counties, cities, and townships from 1997 to 2000.
Under Taiwan’s National Health Insurance (NHI), physicians are paid on a fee-for-service
basis according to a standardized schedule. Payments made by the NHI represent the bulk of the
4 The exceptions included: patients under the age of 3 or over 65; and patients diagnosed with severe diarrhea; vomiting,
dehydration; headache, backache, joint pain or toothache; vomiting or urinating blood; severe external bleeding; poisoning; severe allergic reaction; highly fluctuating body temperature; breaching difficulty; delirium or fainting; severe eye, ear, breathing, digestive or urinary obstructions; serious psychological problems threatening the safety of the patient and/or others; post-traumatic stress disorder.

7
medical providers’ income, followed by user fees and copayments borne by the patients. In the
context of clinics, the sources of revenue are well-defined. In addition to the user fees and
copayments, physicians at private clinics earn a per-visit consultation fee, fees for diagnostic
tests, a per-prescription fee for the service of dispensing drugs, and proceeds from the sale of
drugs.
For clinics without an onsite pharmacist, two sources of revenues were removed:
proceeds from the sale of the drugs, as well as the drug dispensing service fee (approximately
$.31 USD per prescription)5. To partially offset the loss from these two revenue streams, the
Bureau of National Health Insurance increased the consultation fee for clinics without an onsite
pharmacist by $25 New Taiwan Dollars (NTD) ($.78 USD). To encourage outside pharmacies
to dispense drugs, the drug dispensing service fee originally paid to the physicians was increased
from $10 NTD ($.31 USD) to $20 NTD ($.63) per prescription, and transferred to the outside
pharmacy that fills the prescription.
Clinics without an onsite pharmacist also had to forgo substantial profits from drug sales
because they could no longer apply for reimbursements through a system of simplified claims.
Under this system, clinics with drug-dispensing privileges may be reimbursed at a fixed $100
NTD ($3.13 USD) rate if total drug costs are $100 NTD ($3.13 USD) or less, and if the
prescription is for no longer than three days. Thus, a one-day, $20 NTD ($.63 USD) prescription
would automatically be reimbursed at $100 NTD ($3.13 USD), representing a profit of $80 NTD
($2.50 USD) in addition to any profits from the price differential between the $20 NTD ($.63
USD) formulary price and the actual acquisition cost of the drug.
5 Taiwan’s per capita GDP was $13,130 USD at the official exchange rate in 1997. The exchange rate was approximately $1
USD to $32 NTD.

8
III. Theory and Hypotheses
In the Taiwanese context, prohibiting physician self-referrals eliminated physicians’
financial income from the sale of drugs. Because Taiwanese physicians may also order
diagnostic tests for income, the separating policy can be analyzed according to a physician utility
maximization model in which physicians choose between (1) prescribing drugs, for which the fee
has been removed, and (2) ordering diagnostic tests, for which the fee has not been changed. A
rich body of research in physician-induced demand relies on a physician utility maximization
model that permits physicians to “trade” units of financial income against units of disutility
caused by overtreating patients. (Evans 1974; Fuchs 1978; Gruber and Owings 1996; McGuire
and Pauly 1991). McGuire (2000) summarizes the key features of such a model, which we
reproduce in the following section.
III.A. The McGuire-Pauly Physician Utility Maximization Model
The model, modified along the lines of Gruber and Owings (1996), can be represented by
the following maximization problem:
(1)
The McGuire-Pauly model assumes that the physician’s utility is increasing in income Y
, and decreasing in overtreatment disutility I . The physician’s total income Y
is a function of (1) N, the number of patients she sees; (2) m1 and m2, the profit margins of the
services that she provides for services 1 and 2 respectively; (3) x1 and x2, the quantities of the
respective services provided, and (4) i1 and i2, the level of overtreatment for these services. Note

9
that the quantities x1 and x2 are both functions of, and increasing in and – Intuitively, the
higher the overtreatment, the more quantities of services provided. Solving the utility
maximization problem with respect to and yields the follwoing first order conditions:
(2)
The intuition behind these first order conditions is that the marginal increase in income
due to overtreatment in both services must be equal to the marginal increase in “disutility cost”
from the overtreatment. According to this model, when the fee for service 1 is reduced, but the
fee for service 2 remains unchanged, there are two countervailing forces on the direction of
change for the quantity provided for service 1. On the one hand, the falling fee would tend to
increase supply because of the income effect. On the other hand, there is a substitution effect
that would cause the physician to switch from the less profitable service 1 to the more profitable
service 2. In other words, a reduction in has an ambiguous effect on the sign of change for
the quantity of service 1. The same fee reduction in service 1, however, unambiguously predicts
that the quantity of service 2 would increase. In this particular context, we expect drug
prescriptions (service 1) to fall because no income effect could dominate the substitution effect
when profits are completely eliminated. These theoretical predictions underpin our identification
strategy for the existence of overtreatment from physician self-referrals. We take an observed
increase in service 2 (diagnostic tests) with a simultaneous fall in service 1(prescription drug
volume) to be dispositive of overtreatment.
III.B. Hypothesis Generation
III.B.1. Existence and Extent of Overtreatment with Physician Self-Referrals
We exploit the prohibition against self-referrals as a quasi-experiment to identify the
existence and extent of overtreatment when physicians refer patients to their own pharmacies. In

10
particular, doctors in Taiwan have only two sources of discretionary income per office visit – the
sale of prescription drugs (service 1), and the ordering of diagnostic tests (service 2). We
identify the existence of overtreatment by showing that (1) physicians who no longer profit from
the sale of prescription drugs increase diagnostic tests and reduce drug prescriptions, and that (2)
physicians who continue to sell drugs because they have an onsite pharmacist do not show any
change in either drug-prescribing or test-ordering behavior. We set forth these propositions in
hypotheses 1 to 4, as follows:
Hypothesis 1: Physicians at clinics that do not have an onsite pharmacist before and after
the policy will reduce drug prescribing behavior (relative to a control group) after the
implementation of the separating policy.
Hypothesis 2: Physicians at clinics without an onsite pharmacist before and after the
policy will increase diagnostic tests (relative to a control group) following the implementation of
the separating policy.
Hypothesis 3: Physicians at clinics that always had an onsite pharmacist will not alter
their drug prescribing behavior (relative to a control group) after the implementation of the
separating policy.
Hypothesis 4: Physicians at clinics that always had an onsite pharmacist will not alter
their diagnostic test ordering behavior (relative to a control group) after the implementation of
the separating policy.
In the next section, we investigate whether physicians hire a pharmacist in order to
continue overtreating patients in outpatient prescription drugs.
III.B.2. Vertical Integration and Overtreatment
The behavior of physicians at clinics that did not have an onsite pharmacist before the
separating policy, but eventually hired one after the policy effective (“switchers”), is especially
relevant to whether physicians “vertically integrate” in order to profit from overtreating patients.

11
We identify the relationship between vertical integration and overtreatment by observing the
prescribing behavior of switchers (1) before the policy, (2) after the policy but before hiring a
pharmacist, and (3) after the policy and after hiring a pharmacist. If vertical integration
facilitates overtreatment, we should observe switchers reduce prescriptions after the policy, and
again increase prescribing volume after they hire a pharmacist.
Before doing so, we first examine whether physicians are generally rational in their choice
to “vertically integrate.” Because hiring a pharmacist involves an additional fixed cost to the
physician, we expect that only clinics with sufficient patient volume (and therefore income)
would hire a pharmacist:
Hypothesis 5: Physicians at clinics without a pharmacist before the separating policy, but
with a sufficient level of patient volume, will hire a pharmacist.
The following two hypotheses test whether vertical integration facilitates overtreatment.
Hypothesis 6: Physicians at clinics without a pharmacist before the separating policy, but
subsequently hire a pharmacist, will reduce their prescribing behavior after the separating policy
but before hiring the pharmacist.
Hypothesis 7: Physicians at clinics without a pharmacist before the separating policy, but
subsequently hire a pharmacist, will increase their prescribing behavior after they hire the
pharmacist.
In the next section, we describe the data and methodology that we use to test the seven
hypotheses set forth above.

12
IV. Data and Methodology
IV.A. Data
IV.A.1. Description of the Data Sets
The two collections of data that are relevant to our analysis are provided by Taiwan’s
National Health Research Institute, which maintains an uncensored population of all claims filed
with the National Health Insurance Bureau. The first collection consists of random subsamples
of two relevant databases from the population data from 1997 to 2004: (1) a random6 .2%
subsample of all outpatient visit claims and (2) the details of all outpatient services ordered
during the office visit, including drug names, quantities, and prices. Henceforth we will refer to
this collection of data files as the “random subsample” files. The second data set, which we use
only to perform a robustness check, consists of the entire medical claims history of 200,000
randomly selected individuals between 1997 and 2004. We refer to this second data set as the
“panel data.” In constructing the data sets, we retain only data from clinics, because all hospitals
have pharmacies staffed with onsite pharmacists, and are therefore exempt from the separating
policy.
IV.A.2. Variables and Summary Statistics
Dependent Variables. The dependent variables consist of various measures of prescribing
volume. PRESCRIPTION is an indicator variable that is set to 1 if one or more drugs are
prescribed. DRUG DAY indicates the prescription duration in days, by law capped at 28 days
6 The National Health Research Institute has included the following language to describe the method for
extracting random subsamples from the population: “We use the systematic sampling method to randomly sample a representative database from the entire database. The size of the subset from each month is determined by the ratio of the amount of data in each month to that of the entire year. Then the systematic sampling is performed for each month to randomly choose a representative subset. This sampling database is obtained by combining the subsets from 12 months. The sampling database of CD/DD [Outpatient/Inpatient] was constructed at first then the relative observations in OO/DO [Details of outpatient/inpatient orders] were drawn out accordingly. The sampling database of DD [Inpatient] and CD [Outpatient] was 5% and 0.2% to the entire database respectively.”

13
(with a few exceptions). If more than one drug is prescribed, the prescription duration of the
drug prescribed for the longest period is given. LOGGED DRUG EXPENDITURES is the
natural log of the drug expenditures generated at the visit level. Because the details of
prescriptions are given in the claims form even when they are filled outside, we can reconstruct
drug expenditures by multiplying each drug quantity by its formulary price and summing all the
subtotals thus calculated. ADJUSTED DRUG EXPENDITURES must be calculated because of
the “simplified claims.” The listed $100 NTD ($3.13 USD) reimbursements for such claims do
not represent the true formulary costs of the drugs. We calculate the actual drug expenditures in
the same manner as for prescriptions filled outside the clinic, and call this variable “adjusted
drug expenditures.” NONDRUG ORDERS is an indicator variable that is set to 1 if one or more
diagnostic tests are ordered. LOGGED NONDRUG EXPENDITURES represent the natural log
of the total nondrug (diagnostic) expenditures ordered during the visit.
Independent Variables. The independent variables include the following: EFFECTIVE is
an indicator variable that is equal to the interaction term TREAT × POST. It is set to 1 if the
separating policy is in effect at the time of the office visit. AGE represents the patient’s age in
years, and FEMALE is a dummy variable that is 1 if the patient is female. COUNTY/CITY
dummy variables – each city and county in Taiwan receives a unique dummy variable, and the
dummy for the city of Hsinchu is randomly dropped to avoid perfect collinearity. QUARTER
dummy variables – Each quarter beginning in quarter 1, 1997 to quarter 4, 2000 has a dummy
variable that equals 1 if the office visit falls in that particular quarter. The dummy variable for
quarter 1, 1997 is dropped in all econometric specifications. DISEASE CODE dummy
variables – Of 976,420 office visits, only 7,616 observations lack a primary diagnosis code, and
these observations are dropped. Only 15.2% of the observations have a secondary diagnosis

14
code, and a mere 3.96% also have a tertiary diagnosis code. We therefore construct dummy
variables for each of the top 65 disease codes for the primary diagnosis, and discard the rest. See
Table II for the most common primary diagnosis codes in the data.
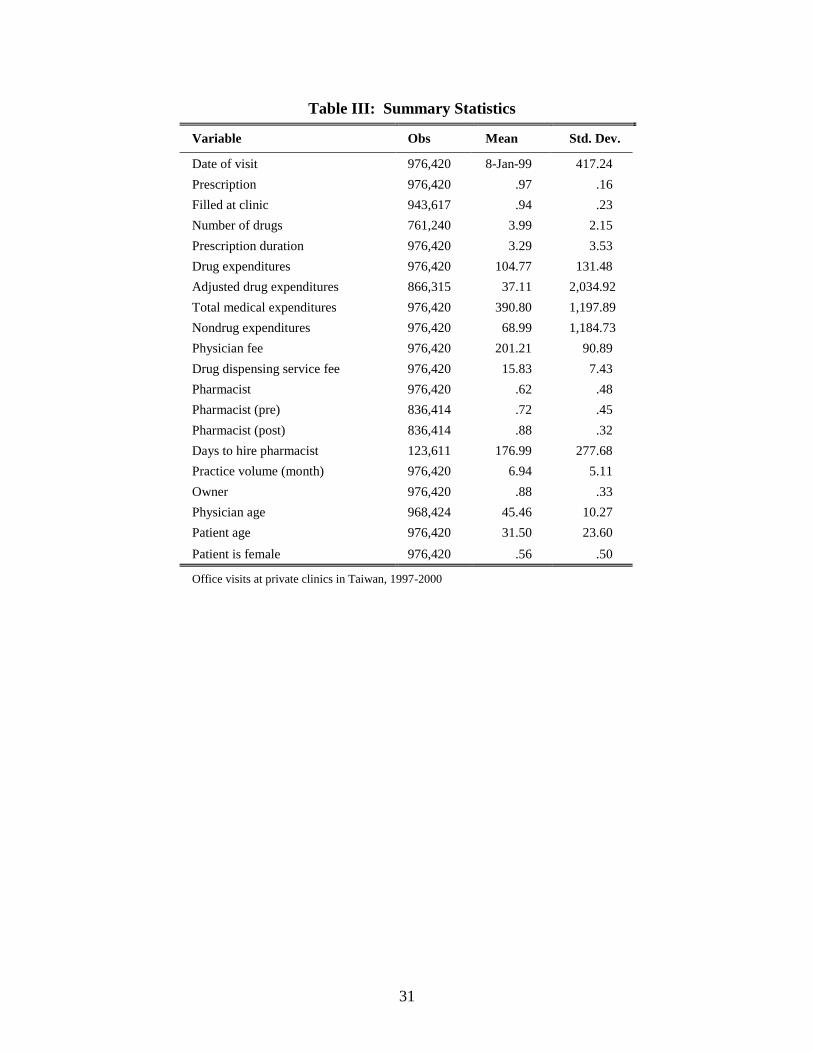
Summary Statistics. In Table III, we include the summary statistics for the outcome and
independent variables, excluding dummy variables for fixed effects, such as disease code,
quarter, and jurisdiction dummies. The entire sample includes 976,420 office visits to clinics in
Taiwan from 1997 to 2000. The average revenue to the physician (total medical expenditures)
per visit during this period was $390 NTD ($12.19 USD), of which $105 NTD ($3.28 USD), or
26.9%, consisted of drug charges, $201NTD ($6.28 USD) (51.5%) represented the average
physician fee, $68 NTD ($2.13 USD) were for nondrug expenditures, and the remaining $16
($.50 USD) were for the service of dispensing drugs. Approximately 97% of all office visits
resulted in a prescription for an average duration of 3.29 days, and of these, 94% of prescriptions
were dispensed at the clinic’s pharmacy. The average prescription comprised of 3.99 different
types of drugs. There were 8,289 clinics in the data, and 3,070 of these always had a pharmacist
onsite. 2,431 clinics never had a pharmacist onsite during the entire study period. The
remaining 674 clinics did not have a pharmacist before the separating policy but hired one
thereafter, on average within six months (176 days) after the implementation date of the
separating policy. Of all the clinics, 1,204 clinics are located in areas not subject to the policy
from 1997-2000 and serve as the control. The remaining 910 clinics are those whose first
appearance in the dataset comes after the effective date of the separating policy.

15
IV.B. Methodology
IV.B.1. Existence and Extent of Overtreatment with Physician Self-Referrals
We use a difference-in-differences model with physician fixed effects to capture the
changes in the outcome variables by comparing the physicians’ prescribing behavior before and
after the separating policy, subtracting changes in the contemporaneous behavior of physicians in
the control group. The data set is divided into three subsets: the set of observations including
clinics that always had an onsite pharmacist; the set with clinics that hired a pharmacist
sometime after the separating policy; and the set of clinics that never had a pharmacist in the
study period. All three subsets include observations from clinics located in areas not yet subject
to the policy (“control clinics”). We run seven separate fixed effects regressions using each of
the subsets for the seven dependent variables pertaining to prescribing behavior. All dependent
variables in dollar amounts are logged to estimate percentage changes.
The econometric model for these regressions is described below. Here, represents one
of the seven outcome variables; is the physician fixed effects; , the vector of city/county
dummies; , the vector of quarter dummies; , the vector of disease code dummies; and is
the error term.
(3)
The primary coefficient of interest is β. The coefficient is meant to reflect changes in the
percentage of visits resulting in a (1) prescription or (2) laboratory/diagnostic test, (3) changes in
days for the prescription length, (4) changes in the number of different types of drugs prescribed,
and percentage changes in the (5) drug, (6) adjusted drug, and (7) nondrug/diagnostic
expenditures. The inclusion of numerous fixed effects will control for unobserved heterogeneity

16
among physicians, quarters of the years, county and city characteristics, and differences in
treatment plans for different diseases. To account for potentially different treatments based on
patient gender and age, we also include these two variables as covariates for all of the
regressions in this econometric model.
IV.B.2. Vertical Integration and Overtreatment
We test whether past practice volume predicts the likelihood of hiring a pharmacist
graphically by running a lowess-smoothed regression of integration status three months after the
policy on total practice volume from the previous year. To verify whether prescription volume
falls for switchers after the policy takes effect (but before they hire a pharmacist), we run model
(3) as described in Section IV.B.1, except that we drop all observations after the switchers hire a
pharmacist. Finally, to confirm whether switchers increase prescribing volume after they hire a
pharmacist, we drop all pre-policy observations for the switchers, and employ a fixed effects
model that is identical in all respects to model (3) but one – instead of having “effective” as the
treatment variable, we use “pharmacist,” which is equal to 1 on and after the date an onsite
pharmacist is hired at a particular clinic. Specifically, we have:
(4)
The coefficient β on PHARMACIST reflects the impact of vertical integration on
physician prescribing behavior. Of course, the PHARMACIST variable is a highly endogenous
choice in this econometric model. Nevertheless, the coefficient estimates on the variable are still
relevant for policy analysis: they represent the direction and magnitude of changes in

17
prescribing behavior of physicians who vertically integrate, perhaps in order to capture the rent
from overtreating patients.
Finally, as a robustness check, we drop all observations from the interim period (that is,
after the policy becomes effective but before the switcher clinics hire a pharmacist) and again
run model (3). The coefficients on EFFECTIVE reflect ultimate changes in the behavior of
switcher clinics between (a) the period before the policy implementation date, and (b) the period
after the clinics hire an onsite pharmacist. Unless there is a fall in prescription behavior after
hiring a pharmacist relative to the pre-policy period, we conclude that physicians vertically
integrate to overprescribe drugs.
V. Results and Discussion
V.A. Extent and Existence of Overtreatment with Physician Self-
Referrals
The results of the regressions are strongly supportive of overtreatment from physician
self-referrals. After the separating policy, physicians at clinics that never hired an onsite
pharmacist (“never clinics”) reduced all measures of prescription volume. Adjusting for the log-
level functional forms of all dependent variables denominated in dollar amounts, these
physicians reduced drug expenditures by 24.4%7, likelihood of prescription by 2.3%, number of
drugs by .13 type, and prescription duration by .16 day (Table IV). In Table V, we show that
even the adjusted drug expenditures fell by 7.8%. This result shows that even accounting for the
financial padding in the simplified claim reimbursements in the pre-policy period, there was a
7

18
real reduction in drug expenditures after the separating policy. Finally, physicians at “never
clinics” increased nondrug (laboratory) expenditures by 11.5%8.
At the same time, physicians at “always” clinics (clinics which employed a pharmacist
before the policy change and continued to have an onsite pharmacist post-policy) made no
statistically significant changes in their prescribing behavior: the coefficients on the “effective”
dummy variable are imprecisely measured 0s in all of the models (Table VI).
The results for the “never” clinics, together with those of the “always” clinics strongly
suggest the existence of overtreatment when physicians make self-referrals: First, the fall in
prescription volume when drug sales are no longer profitable is in itself highly suggestive of
overtreatment. Second, the contemporaneous increase in nondrug expenditures at “never” clinics
following the policy change also suggests overtreatment. Significantly, we find no change in the
drug-prescribing and test-ordering behavior of “always clinics,” which were de facto exempt
from the policy. Taken together, these fact patterns strongly suggest a causal role of self-
referrals in the overtreatment of patients.
V.A.1. Robustness Checks
While fixed effects regressions greatly reduce the omitted variable bias common in cross-
sectional studies, at least three sources of bias remain – patient self-selection, endogeneity in the
choice not to hire a pharmacist, and inappropriate controls in the difference-in-differences
specifications.
Patient Self-Selection. In our econometric model, we control for physician, quarter,
county/city, and disease code fixed effects, in addition to patient age and gender. However, we
do not account for changes in patient composition. If patients with a greater demand for
8

19
prescription drugs switch from clinics with no onsite pharmacists to vertically integrated clinics,
there would be a spurious correlation between a fall in prescribing behavior at “never” clinics
and the separating policy. We address this concern first by noting that the separating policy does
not impose any additional cost on physicians who wish to prescribe drugs to satisfy patient
demand. The policy merely removes the financial incentive on the supply side to overtreat.
Thus, the only difference to the patients who seek medical care at clinics with no onsite
pharmacists is that they must, post-policy, fill their prescription at an outside pharmacy rather
than at the clinic itself. Generally, however, these outside pharmacies tend to be in close
proximity to the clinics.
Using the panel data set, we also examine actual patient behavior before and after the
separating policy becomes effective in their area. Of the 200,000 randomly selected individuals
for whom we possess their entire medical history from 1997 to 2004, 155,343 individuals sought
care at a clinic at least once between January 1, 1997 and December 31, 2000. Of these, very
few patients actually switched from consistently patronizing “never clinics” before the policy to
visiting “always clinics” after the change: Only 347 patients visited a never clinic at least 3
times before the policy change, representing more than 75% of all pre-policy visits to clinics,
and visited an always clinic at least 3 times, or more than 75% of all post-policy visits to clinics.
The extremely small population of patients who switched from mostly “never clinics” before the
policy to mostly “always clinics” after the policy demonstrates that patient self-selection is of
limited concern.
Endogenous Choice Not to Hire a Pharmacist. Another potential problem for our
specification is that a key independent variable may be endogenous. While the fixed effects
model controls for unobservable time-invariant heterogeneity, it remains susceptible to biases

20
created by endogenous variables. Here, we suspect that prescribing behavior (the dependent
variable) is simultaneously determined by a factor that also affects the decision not to hire a
pharmacist. Perhaps physicians who decide not to hire a pharmacist are exactly those who are
least likely to overtreat patients to begin with, so the fall in prescribing volume cannot be
generalized to a larger population of physicians. To address this concern, we use past practice
volume as an instrument to replace the potentially endogenous choice not to hire a pharmacist.
Specifically, we construct a dummy variable based on the inflection point of the lowess-
smoothed regression for hypothesis 4. A past practice volume of 15 or lower in the six months
prior to the policy change9 sets the instrumental variable to 1, and replaces the decision not to
hire a pharmacist.
We first report in Table VII the results of the instrumental variable regression, then justify
our choice of instrument in the subsequent paragraphs. Logged drug expenditures and logged
adjusted drug expenditures fell by 22.5% and 12.7% respectively after the separating policy
became effective. Furthermore, the likelihood of prescription dropped by 1.6%. These results
suggest that the policy would cause a randomly selected physician to reduce prescribing behavior
if subject to a prohibition against self-referrals.
We next justify the validity of our chosen instrument. The appropriateness of a given
instrument hinges on two requirements: A high correlation between the instrument and the
endogenous variable, and an absence of the endogenous component that afflicts the problematic
variable in the first place. The instrument must affect the outcome variable only through its
effect on the endogenous variable. For the first requirement, we note that the t-statistic obtained
from regressing the NEVER dummy on the instrument is 58.64 (with an F-statistic on the
9 A past practice volume of 15 in a 1-in-500 random subsample implies 750 visits in the six months prior to
the policy change.

21
instrument and constant of 3439.2) (Table VIII). The traditional requirement that the F-statistic
be greater than 10 is easily satisfied.
For the second requirement, while we cannot prove conclusively that the instrument is
uncorrelated with the endogenous component of the decision not to hire a pharmacist, we offer
the following suggestive evidence: If a low lagged practice volume is reflective of an
unwillingness to overtreat, physicians with fewer office visits should also have lower measures
of prescribing volume before the policy. In Table IX, we see that the pre-policy prescription
drug averages for the low-volume clinics are not lower than the rest of the non-always clinics.
Physicians at low-volume clinics prescribed an average of $114 NTD ($3.56 USD) of drugs
versus $103 NTD ($3.21 USD) for physicians at clinics with a higher lagged practice volume.
Furthermore, total medical expenditures for the low-volume clinics averaged $418 NTD ($13.06
USD), again greater than $378 NTD ($11.81 USD) for higher-volume clinics.
To determine the quarter-by-quarter pre-policy differences in prescribing behavior
between low-volume physicians and other non-always physicians, we also do the following: We
drop all post-policy observations, and regress the dependent variables on all of the covariates
described in model (3) in Section IV.B.1 (except the EFFECTIVE variable), as well as the full
interaction between the quarter dummies and an indicator for low-volume status. The results in
Table X show that there are no consistent differences between these two groups of physicians in
their pre-policy prescribing behavior. These results, taken along with the assumption that low-
volume physicians could not – rather than chose not to – hire a pharmacist, suggest that the
instrument is less likely to be plagued by the potential endogeneity problem associated with a
deliberate decision not to hire a pharmacist.
22
Appropriateness of the Control Group as the Counterfactual. A third potential challenge
to our results comes from the suitability of the controls. In our regressions, for both the “always”
and “never” clinics, we use observations from clinics located in jurisdictions not subject to the
policy as the control group. We address the concern that the control group may not represent a
suitable counterfactual by investigating whether clinics in the treatment and control groups have
similar pre-period trends. Similar pre-policy trends would give greater support to the claim that
the treatment group’s divergence from the trend is a result of the policy change. Econometrically,
we accomplish this task by first removing all post-policy observations for clinics that are
eventually subject to the separating policy. We then regress the dependent variables on the same
covariates in model (3) (except the EFFECTIVE variable), and the full interaction between the
quarter dummies and a new dummy variable with the value 1 if the clinic eventually becomes
subject to the policy. As we see in Table XI, the essentially zero coefficients on the interaction
terms demonstrate that no systematic pre-period differences exist between the behavior of
physicians in the treatment and control groups.
V.B. Vertical Integration and Overtreatment
Our regression results corroborate that physicians rationally choose to vertically integrate
with pharmacists to capture the rent from overtreatment. First, past practice volume predicts
whether clinics eventually hire a pharmacist after the separating policy takes effect. Figure I
shows that the likelihood of integration rises dramatically when the practice volume in the year
three months before and after the policy effective date reaches 75 (or approximately 37,500 visits
in a random 1 in 500 subsample). Results are substantially similar if we consider the practice
volume for the year beginning six, nine, and twelve months before the separating policy.

23
The pattern of behavior at “switcher” clinics suggests that physicians hire a pharmacist in
order to profit from overtreating patients. Following the policy effective date but before hiring a
pharmacist, physicians at switcher clinics reduced all measures of prescribing behavior: they
decreased drug expenditures by 26.5%, adjusted drug expenditures by 12.3%, likelihood of
prescription by a modest 1.6%, the number of different types of drugs by .14, and prescription
duration by .168 day (Table XII).
When physicians then hire a pharmacist, almost all measures of prescribing behavior
recovered: Drug expenditures increased by 11%, the likelihood of prescription rose by .4%, and
other measures, such as number of drugs and prescription duration, also rebounded, by .11 type
of drugs and .93 day respectively (Table XIII). However, adjusted drug expenditures yielded an
imprecisely measured reduction.
We next look at the ultimate impact of the separating policy on the switchers’ prescribing
behavior by dropping all interim observations from the regressions. By interim, we mean the
post-policy, but pre-pharmacist observations associated with the switchers. The results of these
regressions are presented in Table XIV. When all interim observations are removed, the
separating policy had no measurable effect on the switchers’ prescribing behavior except two:
relative to the pre-policy period, there is a 6.7% reduction in adjusted drug expenditures and
a .069 day shortening of prescription duration after the policy became effective. This result
contrasts with the fact that always clinics did not change any prescribing behavior post policy
(Table V).
A possible explanation for these reductions may be the combined effect of the simplified
claim method of reimbursement and the separating policy. As noted previously, switcher clinics
are intermediate-volume clinics. It is possible that, although they were financially able to hire a

24
pharmacist after the separating policy was implemented, the added cost of the pharmacist’s
salary caused physicians to seek additional revenue sources. Under the simplified claims system,
a prescription under $100 NTD ($3.13 USD), and for no more than three days, is automatically
reimbursed at the standard $100 NTD ($3.13 USD) sum, regardless of the actual formulary cost
of the drugs prescribed. Thus, it is possible that switchers shortened the prescription length to
pocket a greater share of the $100 NTD ($3.13 USD) fixed reimbursement.
Taken as a whole, these results support the claim that vertical integration facilitates the
overtreatment of patients – the absence of integration caused a drop in prescribing behavior, and
“reintegration” led to a rebound in almost all measures of prescription volume. Our results show
that Stark Law’s exclusive concern with physician self-referrals to outside entities, while
creating bright-line safe harbor exceptions for “bona fide employees” and “in office ancillary
services,” may be misguided when self-referrals in house also generate profits to the physicians.
VI. Conclusion and Direction for Future Research
In health care, the combination of numerous factors creates incentives for physicians to
overtreat patients. The theoretical literature is clear that patient-physician informational
asymmetries, generous insurance coverage, together with a fee-for-service compensation system
may lead to an overprovision of services when physicians refer patients to an entity in which
they have a financial interest. The empirical literature, however, has thus far failed to establish a
causal relationship between self-referrals and overtreatment. Most existing studies rely on cross-
sectional comparisons of treatment intensities and volumes between physician-owners of medical
facilities, and non-owners. Our study goes further than the current literature by demonstrating a

25
causal link between self-referrals and overtreatment, and empirically examines the impact of
prohibiting physician self-referrals.
A policy implemented in Taiwan beginning in 1997, which prohibited physicians from
dispensing drugs from their pharmacies (unless they hired an onsite pharmacist), provided a
natural experiment to verify whether self-referrals cause overtreatment. We identify causality by
employing a difference-in-differences model with physician fixed effects that examines (1) the
pre-policy/post-policy behavioral change of physicians who were prohibited from making self
referrals, and (2) the pre-policy/post-policy change of physicians who continued to refer patients
to their own pharmacies. Relative to a control group, physicians who no longer made self-
referrals reduced drug prescription along various measures, and simultaneously increased
nondrug expenditures after the policy took effect. Relative to the control group, physicians who
continued to self-refer patients changed neither their drug-prescribing nor test-ordering behavior.
These empirical findings provide the strongest proof to date that physicians who make self-
referrals overtreat patients. Furthermore, these results are robust to various threats to
identification.
We also show that overtreatment exists when physicians vertically integrate in order to
circumvent application of the Taiwanese policy. Clinics initially without an onsite pharmacist
reduced prescriptions following the separating policy effective date. Upon hiring an onsite
pharmacist, however, the measures of prescription volume generally returned to pre-policy levels.
Moreover, the decision to integrate appeared to be highly rational and based on the clinics’
practice volume – on average, low-volume clinics did not hire a pharmacist, intermediate-volume
clinics hired one sometime after the policy implementation date, and high-volume clinics already
had an onsite pharmacist predating the policy. This result suggests that only clinics with
26
sufficient patient volume to profit from overtreating patients expend the cost of hiring a
pharmacist.
Our empirical findings contribute to the literature in several important ways. First, our
work overcomes the omitted variable bias inherent in cross-sectional studies on physician
referral patterns to physician-owned imaging facilities dating from the 1990s, and confirms the
underlying motivation for anti-self-referral legislations such as the Stark Law. However, Stark
Law’s bright-line safe harbor rules permitting physician self-referrals to a “bona fide employee”
or for “in office ancillary services” create loopholes for overtreatment to exist. The litmus test
should be whether physicians generate additional profits that are based on their referrals, rather
than where they refer their patients.
Moreover, a comprehensive review of substitute or complementary services should be
performed when policymakers adjust or eliminate fees for one among many medical services that
can be offered. Reducing or eliminating the income for one type of service may have a direct
impact on the volume of another service provided. Finally, it is possible that regulations can
interact in unpredictable ways, leading to unintentional consequences. In the specific Taiwanese
context, the interaction of the separating policy and the system of simplified claims may have
caused switchers to reduce prescription duration without lowering prescription drug expenditures.
Indeed, the policy, far from reducing drug expenditures at switcher clinics, may merely have
transferred some of the rent from overtreatment to the pharmacists.
We close by proposing several directions for future research. We confirmed that an anti-
self-referral policy caused a modest reduction in the overprovision of a relatively noninvasive
and highly demanded treatment in Taiwan. However, does patient demand play any part in
policy design? For example, can we expect more pronounced results for policies prohibiting

27
self-referrals for treatments that are profitable to physicians but not in particular demand by
patients? (Leavitt 2005). Can we rely on patients to reject unnecessary services for higher cost
or more invasive segments of medical care, thus reducing the need for regulation in such
segments? These questions are significant as physicians expand investments in other sectors of
health care, such as physician-owned specialty hospitals.

28
References
Aronovitz, L. G., "Referrals to physician-owned imaging facilities warrant HCFA’s scrutiny: General
Accounting Office (GAO) report to the US House of Representatives," Washington, DC: GAO, 5 (1994),
95–92.
Childs, A. W., and E. D. Hunter, "Non-medical factors influencing use of diagnostic x-ray by physicians,"
Med Care, 10 (1972), 323-335.
Evans, R. G., "Supplier-induced demand: some empirical evidence and implications," The Economics of
Health and Medical Care, (1974), 162-173.
Fuchs, V. R., "The supply of surgeons and the demand for operations," Journal of Human Resources, 13
(1978), 35-56.
Gazelle, GS, EF Halpern, HS Ryan, and AC Tramontano, "Utilization of Diagnostic Medical Imaging:
Comparison of Radiologist Referral versus Same-Specialty Referral1," Radiology, 245 (2007), 517.
Gruber, Jonathan, and Maria Owings, "Physician Financial Incentives and Cesarean Section Delivery,"
Rand Journal of Economics, 27 (1996), 99-123.
Hillman, B. J., C. A. Joseph, M. R. Mabry, J. H. Sunshine, S. D. Kennedy, and M. Noether, "Frequency
and costs of diagnostic imaging in office practice--a comparison of self-referring and radiologist-referring
physicians," New England Journal of Medicine, 323 (1990), 1604.
Hillman, B. J., G. T. Olson, R. W. Colbert, and L. B. Bernhardt, "Responses to a payment policy denying
professional charges for diagnostic imaging by nonradiologist physicians," JAMA, 274 (1995), 885-887.
Hillman, B. J., G. T. Olson, P. E. Griffith, J. H. Sunshine, C. A. Joseph, S. D. Kennedy, W. R. Nelson,
and L. B. Bernhardt, "Physicians' utilization and charges for outpatient diagnostic imaging in a Medicare
population," JAMA, 268 (1992), 2050-2054.
Leavitt, M. O., "Study of Physician-owned Specialty Hospitals Required in Section 507 (c)(2) of the
Medicare Prescription Drug, Improvement, and Modernization Act of 2003," (2005).
McGuire, T. G., Physician Agency (2000).
McGuire, T. G., and M. V. Pauly, "Physician response to fee changes with multiple payers," Journal of
Health Economics, 10 (1991), 385-410.
Mitchell, J. M., "Effects of physician-owned limited service hospitals: Evidence from Arizona," Health
Affairs, 24 (2005), 481-490.
Mitchell, J. M., and T. R. Sass, "Physician ownership of ancillary services: Indirect demand inducement
or quality assurance?," Journal of Health Economics, 14 (1995), 263-289.
Mitchell, JM, "Utilization trends for advanced imaging procedures: evidence from individuals with
private insurance coverage in California," Medical Care, 46 (2008), 460.
Strasser, R. P., M. J. Bass, and M. Brennan, "The effect of an on-site radiology facility on radiologic
utilization in family practice," J Fam Pract, 24 (1987), 619-623.

29
List of Tables
Table I: Separating Policy Implementation Dates
Implementation Date Areas Subject to Policy
March 1, 1997 Taipei City, Kaoshiung City
March 10, 1998 Taichung City, Chiayi City, and 11 townships in Chiayi County
April 20, 1998 Keelung City, 8 townships in Miaoli County, 8 townships in Changhwa County,
June 6, 1998
5 townships in Hsinchu County, 5 townships in Yunlin County, 11 townships in Kaohsiung
County
July 6, 1998 9 townships in Taichung County, Pingtung City and 12 townships in Pintgung County
October 5, 1998 1 township in Chiayi County, 1 township in Yunlin County
November 5, 1998 Tainan City, 2 townships in Nantou County, 1 township in Tainan County
December 12, 1998 6 townships in Taipei County,
January 28, 1999 Hsinchu City, Taoyuan City, 6 townships in Taoyuan County
June 21, 1999 Miaoli City, 1 township in Hsinchu County
September 13, 1999 1 township in Changhwa County
February 20, 2000 1 township in Kaohsiung County
April 10, 2000 4 townships in Kaohsiung County
April 24, 2000 1 township in Pingtung County
Areas Not Subject to
Policy as of December
31, 2000
3 townships in Chiayi County, 2 townships in Miaoli County, 4 townships in Changhwa County, 3
townships in Hsinchu County, 2 townships in Yunlin County, 12 townships in Kaohsiung County,
3 townships in Taichung County, 13 townships in Pingtung County, 3 townships in Nantou
County, 7 townships in Tainan County, 11 townships in Taipei County, 3 townships in Taoyuan
County, 11 townships in Yilan County

30
Table II: Most Frequent Primary Diagnosis Codes
Rank Disease Name Frequency % of diagnoses Cumulative %
1 Acute upper respiratory infection 325,069 .3328 .3328 2 Acute bronchitis 85,477 .0875 .4204 3 Conjunctivitis 34,697 .0355 .4559 4 Acute tonsillitis 30,727 .0315 .4873 5 Influenza 28,923 .0296 .5170 6 Carbuncles and furuncles/Cellulitis 22,649 .0232 .5401 7 Chronic pharyngitis/rhinitis/sinusitis 21,288 .0218 .5619 8 Other (epi)dermatological diseases 21,113 .0216 .5836 9 Constipation/Irritable bowel syndrome 19,791 .0203 .6038 10 Acute gastroenteritis/chronic pancreatitis 16,230 .0166 .6204 11 Back pain 15,502 .0159 .6363 12 Chalazion/Eye strain/Refractive error 14,570 .0149 .6512 13 Vulvovaginitis 13,790 .0141 .6653 14 Carpal tunnel syndrome/migraine 11,718 .0120 .6773 15 Abnormal menstruation 11,642 .0119 .6893 16 Hypertension 8,304 .0085 .6978 17 Communicable gastric disease (unclear diagnosis) 8,207 .0084 .7062 18 Acute sinitus 8,146 .0083 .7145 19 Acute pharyngitis 8,099 .0083 .7228 20 Asthma/Chronic bronchitis/Emphysema 7,580 .0078 .7306 21 Osteoporosis 7,211 .0074 .7379 22 Acute corditis/Allergic rhinitis 6,870 .0070 .7450 23 Malaise and fatigue (general symptoms) 6,723 .0069 .7519 24 Joint pain 6,448 .0066 .7585 25 Abdominal pain 6,206 .0064 .7648 26 Acute otitis externa/positional vertigo 6,007 .0062 .7710 27 Sprain 5,255 .0054 .7764 28 Diabetes mellitus(no complication) 5,242 .0054 .7817 29 Cystitis 5,186 .0053 .7870 30 Duodenal/gastric/peptic ulcer 4,981 .0051 .7921 31 Hypertensive heart disease 4,806 .0049 .7971 32 Arthritis/Osteoarthritis 4,568 .0047 .8017 33 Acute laryngitis and tracheitis 4,248 .0043 .8061 34 Tinea pedis/versicolor/Onychomycosis 3,981 .0041 .8102 35 Acute otitis media 3,898 .0040 .8141 36 Pelvic inflammatory disease 3,756 .0038 .8180 37 Cataract 3,743 .0038 .8218 38 Contact dermatitis and other eczema 3,549 .0036 .8255 39 Other acne 3,362 .0034 .8289 40 Supervision of other normal pregnancy 3,181 .0033 .8322 41 Acute laryngitis and tracheitis 3,038 .0031 .8353 42 Other symptoms involving abdomen/pelvis 2,992 .0031 .8383 43 Acute sinitus 2,961 .0030 .8414 44 Hematuria/Irritable bladder 2,795 .0029 .8442 45 Open wound (lower limbs) 2,714 .0028 .8470 46 Menstruation disorder 2,671 .0027 .8497 47 Verruca/Chickenpox/Herpes/Hand foot mouth disease 2,401 .0025 .8522 48 Open wound (upper limbs) 2,311 .0024 .8546 49 Psychosomatic disorder 2,227 .0023 .8568 50 Health checkup/Lab test 1,700 .0017 .8586 51 Oral ulcer 1,626 .0017 .8602 52 Alcoholic liver disease/chronic hepatitis/cirrhosis 1,551 .0016 .8618 53 Other respiratory diseases 1,532 .0016 .8634 54 Gout/Hyperlipoproteinemia/Endocrine diseases 1,440 .0015 .8649 55 Tendinitis 1,406 .0014 .8663 56 Deviated septum 1,389 .0014 .8677 57 Acute gastritis (identified pathogen) 1,378 .0014 .8692 58 Other diseases of skin or subcutaneous tissue 1,366 .0014 .8706 59 Rubella 1,341 .0014 .8719 60 Contact dermatitis and other eczema 1,312 .0013 .8733 61 Acute laryngitis and tracheitis 1,299 .0013 .8746 62 Rheumatoid arthritis 1,197 .0012 .8758 63 Unspecified functional disorder of intestine 1,136 .0012 .8770 64 Open wound (head) 1,111 .0011 .8781 65 Normal child birth 1,091 .0011 .8792
Data: All office visits to clinics in Taiwan except clinics located in jurisdictions with mixed implementation dates, 1997-2000)
Total observations: 976,670
31
Table III: Summary Statistics
Variable Obs Mean Std. Dev.
Date of visit 976,420 8-Jan-99 417.24
Prescription 976,420 .97 .16
Filled at clinic 943,617 .94 .23
Number of drugs 761,240 3.99 2.15
Prescription duration 976,420 3.29 3.53
Drug expenditures 976,420 104.77 131.48
Adjusted drug expenditures 866,315 37.11 2,034.92
Total medical expenditures 976,420 390.80 1,197.89
Nondrug expenditures 976,420 68.99 1,184.73
Physician fee 976,420 201.21 90.89
Drug dispensing service fee 976,420 15.83 7.43
Pharmacist 976,420 .62 .48
Pharmacist (pre) 836,414 .72 .45
Pharmacist (post) 836,414 .88 .32
Days to hire pharmacist 123,611 176.99 277.68
Practice volume (month) 976,420 6.94 5.11
Owner 976,420 .88 .33
Physician age 968,424 45.46 10.27
Patient age 976,420 31.50 23.60
Patient is female 976,420 .56 .50
Office visits at private clinics in Taiwan, 1997-2000

32
Table IV: Never Clinics (Clinics that Never Hired a Pharmacist)
Dependent variables (columns):
Drug
expenditures
(log)
Prescription Number of
drugs
Prescription
duration (days)
Nondrug
expenditures
(log)
Nondrug
Order
Treat × Post -.28 -.023 -.131 -.161 .109 -.01
(.024)*** (.003)*** (.069)* (.036)*** (.041)*** (.008)
Observations 200,405 209,027 155,905 209,027 47,774 96,830
Number of time series panel id 4,111 4,216 3,732 4,216 2,617 2,962
R-squared .18 .23 .15 .47 .28 .1
All models include physician fixed effects, patient age, gender, city/county dummies, quarter dummies, and disease code dummies.
Logged drug expenditures include prescription duration as an additional covariate.
Data: all "never" and control clinics in Taiwan except those located in jurisdictions with mixed implementation dates, January 1, 1997
to December 31, 2000.
Robust standard errors clustered by physician ID in parentheses
* significant at 10%; ** significant at 5%; *** significant at 1%

33
Table V: Adjusted Logged Drug Expenditures (Never and Always Clinics)
Dependent variable: logged drug expenditures,
adjusted
"Never"
clinics
"Always"
clinics
Prescription duration (days) .081 .079
(.002)*** (.001)***
Treat × Post -.081 -.012
(.028)*** (.01)
Observations 206,777 660,463
Number of time series panel id 4,178 6,370
R-squared .22 .2
All models include prescription duration physician fixed effects, patient age, gender, city/county dummies, quarter dummies, and
disease code dummies.
Data: Respectively, "always" and "never" clinics with control in Taiwan except those located in jurisdictions with mixed
implementation dates, January 1, 1997 to December 31, 2000.
Robust standard errors clustered by physician ID in parentheses
* significant at 10%; ** significant at 5%; *** significant at 1%

34
Table VI: Always Clinics (Clinics that Always Had a Pharmacist)
Drug
expenditures
(log)
Prescription Number of
drugs
Prescription
duration (days)
Nondrug
expenditures
(log)
Nondrug
Order
Treat × Post -.001 -.001 -.038 -.008 -.006 -.002
(.003) (.001) (.024) (.014) (.016) (.002)
Observations 657,420 669,886 512,980 669,886 132,260 603,685
Number of time series panel id 6,284 6,320 6,086 6,320 4,485 5,072
R-squared .25 .33 .13 .49 .26 .12
All models include physician fixed effects, patient age, gender, city/county dummies, quarter dummies, and disease code dummies. Logged drug expenditures
include prescription duration as an additional covariate.
Data: all "always" and control clinics in Taiwan except those located in jurisdictions with mixed implementation dates, January 1, 1997 to December 31, 2000.
Robust standard errors clustered by physician ID in parentheses
* significant at 10%; ** significant at 5%; *** significant at 1%

35
Table VII: Instrumental Variable Regression
Clinics with lagged practice volume† of 15 or fewer
Drug
expenditures
(log)
Adjusted
drug
expenditures
(log)
Prescription Number of
drugs
Prescription
duration
(days)
Nondrug
expenditures
(log)
Nondrug
Order
Prescription duration (days) .067 -.018
(.001)*** (.001)***
Treat × Post -.255 -.136 -.016 .263 -.072 .039 .002
(.019)*** (.024)*** (.005)*** (.058)*** (.056) (.043) (.009)
Observations 228,129 212,507 239,639 189,227 239,639 58,868 239,639
Number of Time series panel id 4,951 4,908 5,119 4,646 5,119 3,433 5,119
R-squared .33 .09 .16 .14 .34 .21 .11
All models include physician fixed effects, patient age, gender, city/county dummies, quarter dummies, and disease code dummies. Logged drug expenditures and logged adjusted drug
expenditures include prescription duration as an additional covariate.
Data: Office visits at all specified clinics in Taiwan except those located in jurisdictions with mixed implementation dates, January 1, 1997 to December 31, 2000.
†Lagged practice volume refers to the patient volume during the six months before and after the policy date. In a random sample of 1 in 500 outpatient visits, 15 represents
approximately 7,500 visits during the year.
Robust standard errors clustered by physician ID in parentheses
* significant at 10%; ** significant at 5%; *** significant at 1%

36
Table VIII: Test of Instrument Validity
Never Never
Lagged practice volume <= 15
.507
(58.64)***
Lagged practice volume <= 75 .366
(32.61)***
Observations 8,289 8,289
F-statistic 1,063.32 3439.2
R-squared .11 .29
OLS results obtained by regressing suspected endogenous variable "never" on dummy
variables that are set to 1 if lagged practice volume (six months before and after policy
implementation date) is less than 15 or 75, respectively.
Absolute value of t statistics in parentheses
* significant at 10%; ** significant at 5%; *** significant at 1%

37
Table IX: Test of Instrument Exogeneity (Summary Statistics)
Clinics with lagged
practice volume ≤ 15
Clinics with lagged
practice volume ≤ 75
Variable Obs Mean Obs Mean
Prescription 175,756 .98 194,358 .98
Filled at clinic 170,646 .97 188,593 .98
Number of drugs 128,592 3.90 111,073 3.96
Prescription duration 175,756 3.42 194,358 3.05
Drug expenditures 175,756 114.15 194,358 103.13
Adjusted drug expenditures 156,090 36.98 163,579 38.17
Total medical expenditures 175,756 418.21 194,358 378.83
Nondrug expenditures 175,756 84.38 194,358 54.10
Physician fee 175,756 206.41 194,358 208.47
Drug dispensing service fee 175,756 12.4 194,358 13.13
Pharmacist 175,756 .24 194,358 .36
Pharmacist (pre) 35,711 .15 194,358 .71
Pharmacist (post) 35,711 .21 194,358 .87
Days to hire pharmacist 2,095 322.3 30,585 177.37
Practice volume (month) 175,756 6.05 194,358 4.59
Owner 175,756 .91 194,358 0.93
Physician age 174,878 47.88 192,012 45.92
Patient age 175,756 35.18 194,358 31.80
Patient is female 175,756 .55 194,358 .56

38
Table X: Test of Instrument Exogeneity
Pre-Policy Comparison between Instrumented Clinics† and all Non-Always Clinics
Drug
expenditures
(log)
Prescription Number of
drugs
Prescription
Duration
Nondrug
expenditures
(log)
Nondrug
order
1997 quarter 2 × instrument -.002 -.003 -.027 .034 -.024 -.009
(.007) (.002) (.055) (.040) (.042) (.006)
1997 quarter 3 × instrument -.011 -.001 -.043 .015 -.029 -.012
(.008) (.002) (.060) (.041) (.043) (.008)
1997 quarter 4 × instrument -.024 -.005 -.201 .023 .042 -.004
(.008)*** (.002)** (.062)*** (.043) (.044) (.008)
1998 quarter 1 × instrument -.022 -.004 -.145 .051 .078 -.012
(.009)** (.002) (.071)** (.045) (.048) (.009)
1998 quarter 2 × instrument -.014 -.001 -.102 .088 .122 -.016
(.012) (.003) (.072) (.052)* (.054)** (.010)
1998 quarter 3 × instrument -.018 .005 -.122 .030 .100 -.009
(.015) (.004) (.078) (.066) (.058)* (.012)
1998 quarter 4 × instrument -.015 .009 -.047 .109 .161 -.020
(.018) (.005)* (.081) (.062)* (.064)** (.012)*
1999 quarter 1 × instrument .042 .017 -.083 .139 .067 -.007
(.038) (.009)* (.097) (.095) (.074) (.016)
1999 quarter 2 × instrument -.021 .011 -.259 -.096 .059 .001
(.025) (.010) (.157)* (.196) (.127) (.036)
1999 quarter 3 × instrument .082 .008 -.389 .316 .150 -.041
(.052) (.009) (.187)** (.120)*** (.173) (.046)
1999 quarter 4 × instrument .012 .004 -.155 .443 .197 -.072
(.041) (.009) (.209) (.130)*** (.093)** (.057)
2000 quarter 1 × instrument .050 -.010 -.361 .144 .337 -.088
(.052) (.006)* (.193)* (.153) (.244) (.052)*
2000 quarter 2 × instrument -.083 -.010 -.925 -1.098 .325 .046
(.071) (.006) (.469)** (1.326) (.081)*** (.043)
2000 quarter 3 × instrument .000 .000 .000 .000 .000 .000
(.000) (.000) (.000) (.000) (.000) (.000)
2000 quarter 4 × instrument .000 .000 .000 .000 .000 .000
(.000) (.000) (.000) (.000) (.000) (.000)
Observations 224,559 234,101 162,620 234,101 58,262 234,101
Number of panel_id 4,614 4,707 3,861 4,707 3,047 4,707
R-squared .36 .21 .15 .35 .23 .11
†Instrumented clinics refer to all clinics (except always clinics) located in jurisdictions eventually subject to the separating policy
with a lagged practice volume of 15 or fewer during the six months before and after the policy.
All models include physician fixed effects, patient age, gender, city/county dummies, quarter dummies, and disease code dummies.
Logged drug expenditures include prescription duration as an additional covariate.
Data: all pre-policy observations of clinics in Taiwan except always clinics and clinics located in jurisdictions with mixed
implementation dates, January 1, 1997 to December 31.
Robust standard errors clustered by physician ID in parentheses
* significant at 10%; ** significant at 5%; *** significant at 1%

39
Table XI: Test of Appropriateness of Control
Pre-Policy Comparison between Treatment Clinics† and Control Clinics
Drug
expenditures
(log)
Prescription Number of
drugs
Prescription
duration
Nondrug
expenditures
(log)
Nondrug
order
1997 quarter 2 × treatment .004 .001 .013 .030 .048 -.001
(.005) (.002) (.043) (.031) (.032) (.005)
1997 quarter 3 × treatment .007 .001 .045 .016 .005 -.000
(.006) (.002) (.049) (.035) (.033) (.006)
1997 quarter 4 × treatment .015 .003 .138 .023 -.002 -.001
(.006)*** (.002)* (.051)*** (.037) (.034) (.007)
1998 quarter 1 × treatment .003 .001 .146 -.010 -.024 .003
(.006) (.002) (.059)** (.038) (.036) (.008)
1998 quarter 2 × treatment .002 .003 .094 -.040 -.058 .006
(.007) (.002) (.058) (.043) (.041) (.008)
1998 quarter 3 × treatment .014 -.002 .093 -.063 -.038 .011
(.008)* (.002) (.063) (.050) (.043) (.009)
1998 quarter 4 × treatment -.000 -.004 .119 -.097 -.052 .011
(.008) (.002)* (.065)* (.049)** (.044) (.009)
1999 quarter 1 × treatment -.013 -.003 .160 -.006 .005 -.001
(.010) (.003) (.069)** (.054) (.046) (.010)
1999 quarter 2 × treatment .006 -.004 .150 -.006 -.020 .016
(.013) (.006) (.089)* (.077) (.090) (.015)
1999 quarter 3 × treatment .000 .000 .219 -.111 -.189 .025
(.014) (.004) (.098)** (.090) (.109)* (.016)
1999 quarter 4 × treatment -.003 -.007 .234 -.178 -.091 .045
(.015) (.005) (.100)** (.073)** (.093) (.016)***
2000 quarter 1 × treatment .000 .005 .218 .059 -.051 .029
(.018) (.004) (.099)** (.113) (.098) (.018)
2000 quarter 2 × treatment .049 .019 .465 .354 -.012 .041
(.032) (.011)* (.172)*** (.276) (.282) (.029)
2000 quarter 3 × treatment .000 .000 .000 .000 .000 .000
(.000) (.000) (.000) (.000) (.000) (.000)
2000 quarter 4 × treatment .000 .000 .000 .000 .000 .000
(.000) (.000) (.000) (.000) (.000) (.000)
Observations 464,918 482,067 307,953 482,067 111,915 482,067
Number of panel_id 8,504 8,638 7,386 8,638 5,901 8,638
R-squared .34 .23 .14 .31 .22 .11
†Treatment clinics are those situated in jurisdictions that eventually become subject to the separating policy during the study
period.
Coefficients are meant to capture pre-policy differences in prescribing behavior between treated clinics and control clinics.
All models include physician fixed effects, patient age, gender, city/county dummies, quarter dummies, and disease code
dummies. Logged drug expenditures include prescription duration as an additional covariate.
Robust standard errors clustered by physician ID in parentheses
* significant at 10%; ** significant at 5%; *** significant at 1%

40
Table XII: Switchers (Comparison between Pre-Policy and Post-Policy/ Pre-Integration Observations)
Drug expenditures
(log)
Adjusted drug
expenditures
(log)
Prescription Number of
drugs
Prescription
duration (days)
Nondrug
expenditures
(log)
Nondrug
Order
Treat × Post -.308 -.131 -.016 -.144 -.168 .074 -.027
(.035)*** (.042)*** (.004)*** (.074)* (.062)*** (.056) (.014)*
Observations 184,022 167,603 190,086 143,759 190,086 46,763 190,086
Number of time series panel id 2,560 2,533 2,600 2,443 2,600 1,812 2,600
R-squared .35 .08 .21 .15 .38 .24 .12
All models include physician fixed effects, patient age, gender, city/county dummies, quarter dummies, and disease code dummies. Logged drug
expenditures include prescription duration as an additional covariate.
Data: all switchers (all pre-policy observations, and all post-policy observations before clinics hired a pharmacist) and control clinics in Taiwan except
those located in jurisdictions with mixed implementation dates, January 1, 1997 to December 31, 2000.
Robust standard errors clustered by physician ID in parentheses
* significant at 10%; ** significant at 5%; *** significant at 1%

41
Table XIII: Switchers (Comparison between Interim Period and Post-Pharmacist Period)
Drug
expenditures
(log)
Adjusted drug
expenditures
(log)
Prescription Number of
drugs
Prescription
duration (days)
Nondrug
expenditures
(log)
Nondrug
Order
After hiring pharmacist .110 -.016 .004 .107 .093 -.046 .014
(.015)*** (.024) (.002)* (.053)** (.036)*** (.041) (.008)*
Observations 229,634 215,870 237,782 203,150 237,782 56,650 237,782
Number of time series panel id 3,442 3,428 3,487 3,390 3,487 2,548 3,487
R-squared .36 .08 .17 .14 .39 .23 .12
All models include physician fixed effects, patient age, gender, city/county dummies, quarter dummies, and disease code dummies. Logged drug expenditures include prescription
duration as an additional covariate.
Data: all switchers (all post-policy observations) and control clinics in Taiwan except those located in jurisdictions with mixed implementation dates, January 1, 1997 to December
31, 2000.
Robust standard errors clustered by physician ID in parentheses
* significant at 10%; ** significant at 5%; *** significant at 1%

42
Table XIV: Switchers ( Interim Observations Dropped)
Drug
expenditures
(log)
Adjusted drug
expenditures
(log)
Prescription Number of
drugs
Prescription
duration (days)
Nondrug
expenditures
(log)
Nondrug
Order
Treat × Post .006 -.069 -.001 .041 -.069 -.032 .004
(.007) (.025)*** (.002) (0.046) (.037)* (.041) (.007)
Observations 255,899 237,433 264,487 214,112 264,487 62,780 264,487
Number of time series panel id 3,440 3,425 3,479 3,365 3,479 2,558 3,479
R-squared .38 .09 .2 .14 .37 .23 .12
All models include physician fixed effects, patient age, gender, city/county dummies, quarter dummies, and disease code dummies. Logged drug expenditures include
prescription duration as an additional covariate.
Data: all switchers (except "interim" observations, meaning office visits after the effective date and before clinic hired a pharmacist) and control clinics in Taiwan except
those located in jurisdictions with mixed implementation dates, January 1, 1997 to December 31, 2000.
Robust standard errors clustered by physician ID in parentheses
* significant at 10%; ** significant at 5%; *** significant at 1%

43
List of Figures
Figure I: Likelihood of Integration Based on Past Practice Volume