star sea nov2013 alex read oil &...
TRANSCRIPT

Case Studies from the Oil & Gas Industry: Down hole to Flow Assurance &
Separation Alex Read

! CFD in Oil & Gas Industry Drivers ! Application & validation examples: from down hole to flow assurance &
separation
! All about me: – Degrees in Engineering, CFD and Business from University of Leeds, UK &
Rice University, Houston, USA – 12+ years at CD-adapco – Engineer à Customer Support for Northern EU à Regional lead for Southern
US/LATAM à O&G Industry Lead – Works closely with many of the world’s leading O&G companies
Overview

Change in economic reserves to deep-water,
HPHT & unconventionals, …
Technology & simulation à innovation and
understanding of new challenges
Industry Drivers
Improvements in modeling capabilities,
experience & confidence
Simulating systems: multi-physics, -fidelity, complex geometries,
HPC
Capital/risk intensive Technology & simulation à minimize & quantify
risks, maximize durability

! Upstream – Down hole tools – Completions – Subsea – Flow Assurance – Offshore – Separation – Gas dispersion/explosions
! Midstream – Flow conditioning/metering
! Downstream – Refining
Application Areas

! Gravel pack: coarse gravel used to filter sand from the wellstream
! Challenge: understand the packing process & distribution
Gravel packing: DEM

Slurry flow in pipe
d=90 µm, vf=0.19, D=103mm, V=3 m/s
d=165 µm, vf=0.189, D=51.5mm, V=4.17 m/s
Uniform solid volume fraction (vf) and slurry velocity (V) g
L=10m
V
1m
D
Measurement plane
d=270 µm, vf=0.2, D=51.5mm V=5.4 m/s
d=165 µm, vf=0.0918 D=51.5mm V=3.78 m/s
d=480 µm, vf=0.203, D=51.5mm V=3.41 m/s
d=165 µm, vf=0.273, D=495mm V=3.46 m/s

Erosion

Subsea: Flow Induced Vibration
9
§ Challenge: Production restricted due to fatigue concerns on subsea manifolds & jumpers
§ Solution: STAR-CCM+ was used to predict the fatigue life, allowing an increase in production rate. Different designs were evaluated producing a 2X increase in fatigue life and a 3X reduction in erosion.
§ Impact: The increased production rate over the life of the well meant the ROI for the simulation was several hundred million dollars.
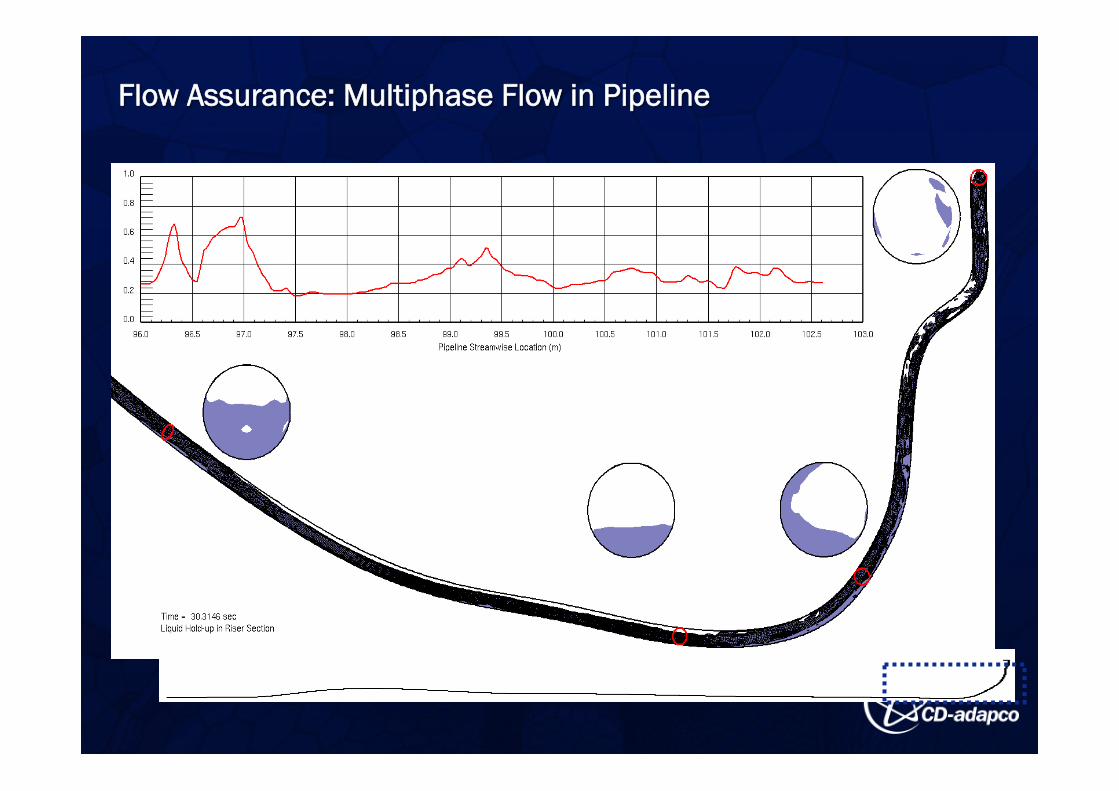
Flow Assurance: Multiphase Flow in Pipeline

STAR-OLGA coupling (TMF, Cranfield)
Mass flux, velocity and
density of each
phase
Pressure and temperature
Flow direction
Model the long pipe using OLGA with slug tracking
Model pipe elbow using STAR-CCM+

Slug flow pass an elbow (TMF, Cranfield)
Gas volume fraction Pressure on the outer part
Note the passing of liquid slug in “blue”.
Note the increase in pressure as liquid slug passes.

Slug flow pass an elbow (TMF, Cranfield)
Coupling model Experiment
Slug frequency (Hz) 0.5 0.5
Slug velocity (m/s) slug front: 2.8 to 3.6
slug tail: 3.0 to 3.5 3.6
Peak force on bend (N) 44 to 54 40 to 60
Maximum force on bend (N) 54 60

4 inch riser
55 m pipeline
10.5 m
Riser top
Riser base
Riser DP = Pbase - Ptop
Severe slugging in riser (TMF, Cranfield)
50 100 150 200 250 300 3500
0.2
0.4
0.6
0.8
1
Flow time t, s
Ris
er D
P, b
ar
ExperimentStar-CD-1Star-CD-2STAR-CCM+ STAR-CCM+

Flow Assurance: Pigging
Stratified gas-liquid flow Dispersed solid-liquid flow

Slug catcher: STAR-CCM+/OLGA
§ Challenge: Assess performance of slug catcher using STAR-CCM+
§ Solution: OLGA used to simulate upstream pipeline system to predict slugging event. OLGA coupled to STAR-CCM+ for detailed transient VOF simulation to predict slug catcher performance for 2 hour slug event
§ Impact: Coupled solution provides ability to perform system-wide simulation ensuring high fidelity of inlet conditions at vessel and high-fidelity 3D simulation of slug catcher with STAR-CCM+

Page 17
Eulerian-Eulerian results: Velocity magnitude through inlet diffuser
Separation
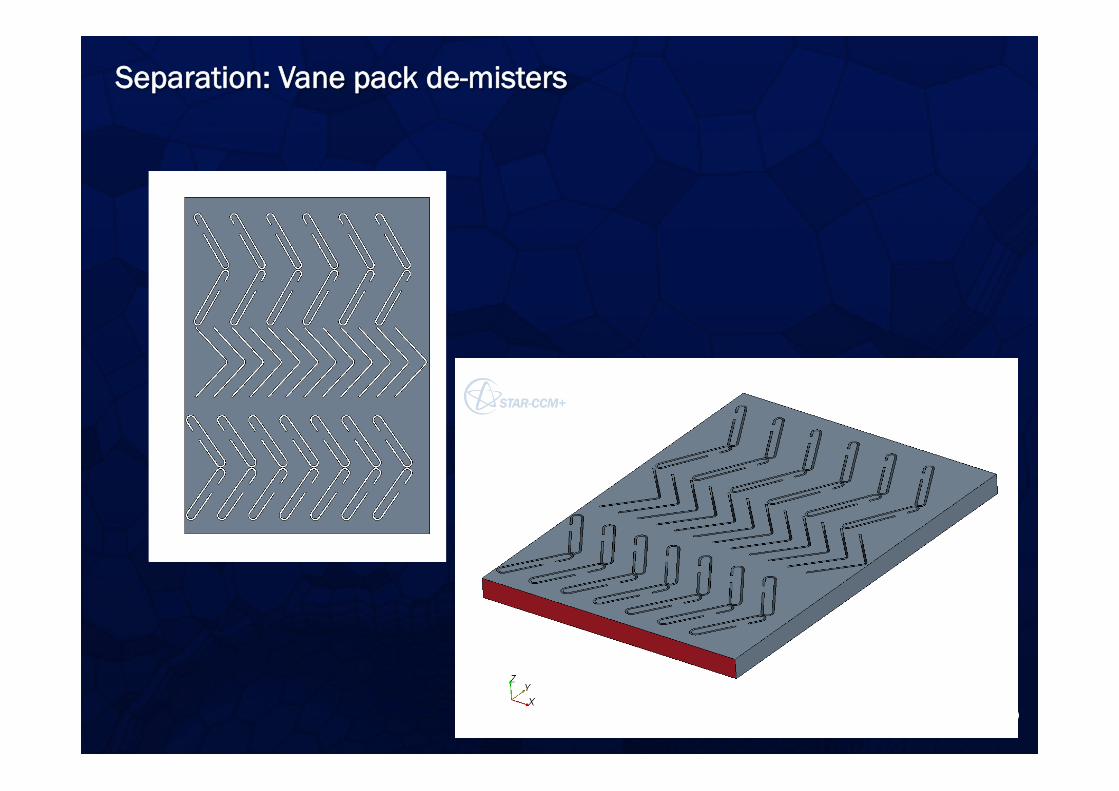
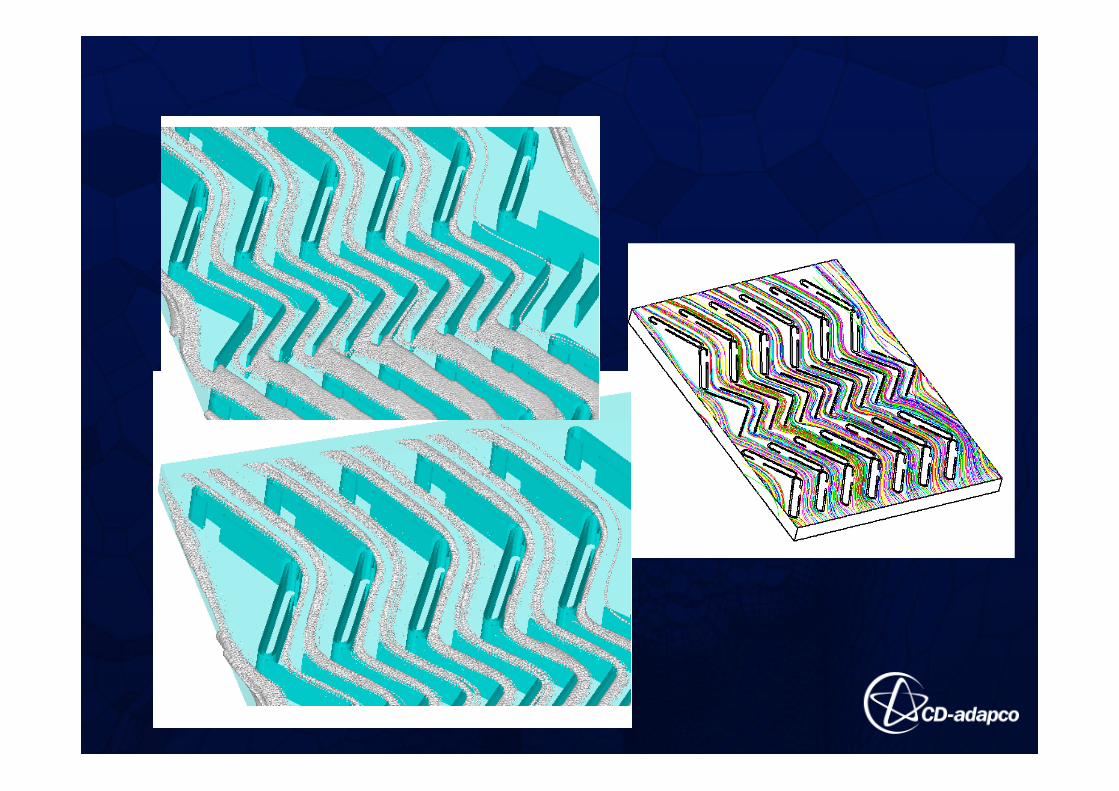
Separation: Vane pack de-misters
August 2008

• Droplets trapped by vane pack (126 mmscfd, K=0.195)
150 microns 50 microns 5 microns

0
20
40
60
80
100
0 20 40 60 80 100 120 140
% m
ass
of d
ropl
ets
rem
oved
Droplet size (micron)
Efficiency of Vane Pack at 57 bar
Design (K = 0.32)
126 MMSCFD (K = 0.195)
105 MMSCFD (K = 0.161)
94 MMSCFD (K = 0.146)

22
Separation: Flare knock out drum
§ Impact: • Improved flare combustion • Avoided damage to flare tip • Reduced risk (of flaming rain)
§ Solution: Through STAR-CCM+, CD-adapco Consulting Services identified cause of carry-over, quantified and suggested options to improve design
§ Challenge: Reduce liquid oil carried over to flare from drum
Before
After
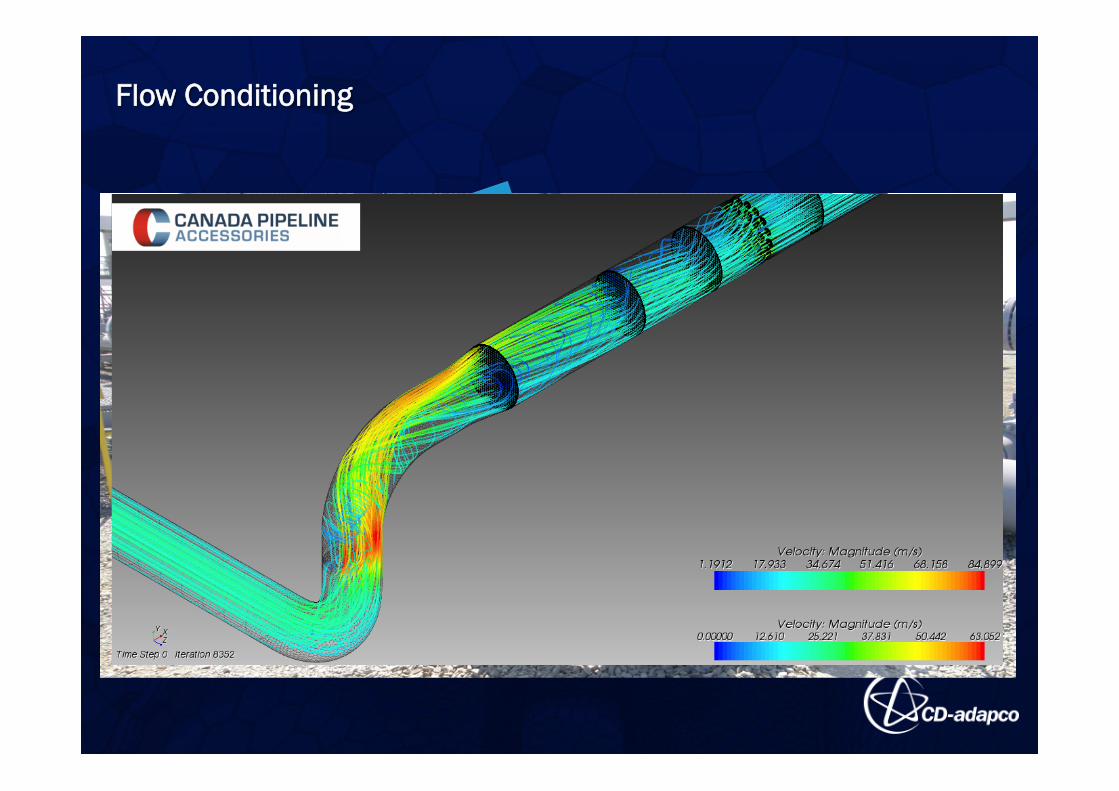
Flow Conditioning
Ultrasonic Meter

! Industry changes increased use of simulation
! Examples / experience in wide variety applications
! Simulating Systems multi-physics/fidelity simulations
Conclusions

Questions?
Thank You!