staphylococcus aureus (gisa) and heterogeneous gisa accepted · such as the modified etest method...
TRANSCRIPT

Evaluation of a New Etest Vancomycin + Teicoplanin Strip for Detection of
Glycopeptide Intermediate Staphylococcus aureus (GISA) and heterogeneous GISA
Anne Yusof1*, Anette Engelhardt1, Åsa Karlsson1, Lina Bylund1, Pamela Vidh1, Karen
Mills1, Mandy Wootton2 and Timothy R. Walsh2
1)AB BIODISK, Dalvägen 10, 169 56, Solna, Sweden
2)Department of Medical Microbiology, Medical School, Cardiff University, Cardiff CF14
4XN, UK
* Corresponding Author.
Anne Yusof
AB BIODISK,
Dalvägen 10, 169 56, Solna,
Sweden
Tel: +46 (0) 8 730 0760
Fax: +46 (0) 8 838 158
Email:
ACCEPTED
Copyright © 2008, American Society for Microbiology and/or the Listed Authors/Institutions. All Rights Reserved.J. Clin. Microbiol. doi:10.1128/JCM.00265-08 JCM Accepts, published online ahead of print on 2 July 2008
on March 27, 2020 by guest
http://jcm.asm
.org/D
ownloaded from

2
Glycopeptide intermediate Staphylococcus aureus (GISA) and, in particular
heterogeneous GISA (hGISA) are difficult to detect by standard MIC methods and thus
an accurate detection method for clinical practice and surveillances is needed. Two
prototype Etest strips designed for hGISA/GISA resistance detection (GRD) were
evaluated using a worldwide collection of hGISA/GISA strains covering the five major
clonal lineages. 150 strains comprising 15 GISA and 60 hGISA (defined by population
analysis profiles – area under curve (PAP-AUC)), 70 glycopeptide susceptible S. aureus
(GSSA), and 5 S. aureus ATCC® reference strains were tested. Standardised Etest VA
MIC testing, the modified Etest macromethod (E-M) with VA and teicoplanin (TP)
strips tested with a heavier inoculum using brain heart infusion agar(BHI), and two
glycopeptide screening agar plates (6µg/ml VA/BHI and 5µg/ml/MHA) were tested in
parallel to the two new Etest GRD strips: VA 32- 0.5/ TP 32-0.5 µg/ml double-sided
gradient (E-VA/TP), with one prototype overlaid with a nutrient (E-VA/TP+S) to
enhance growth of hGISA. Etest GRD strips were tested with a standard 0.5 McFarland
inoculum using Mueller Hinton agar ± 5% blood (MHA, MHB) and read at 18-24 and
48h. Interpretive cut-offs used for the new Etest GRD strips at 24 and 48h were: GISA:
TP or VA ≥8 and standard VA MIC ≥6; hGISA: TP or VA ≥8 and standard VA MIC
≤4. Results on MHB at 48 h showed that E-VA/TP+S had high specificity (94%) and
sensitivity (95%) in comparison to PAP-AUC, and was able to detect all GISA (n=15)
and 98% of hGISA (n=60) strains. In contrast, the glycopeptide screening plates
preformed poorly for hGISA. The new Etest GRD strip (E-VA/TP+S), utilising
standard media and inoculums, comprises a simple and acceptable tool for detection of
hGISA/GISA for clinical and epidemiologic purposes.
ACCEPTED
on March 27, 2020 by guest
http://jcm.asm
.org/D
ownloaded from

3
INTRODUCTION
The first reports of glycopeptide intermediate Staphylococcus aureus (GISA) raised some
complex and challenging questions with respect to their clinical significance and methods for
the detection of these phenotypes and definition of this “resistance” are issues that still
remain today (10, 23). Additionally, a heterogeneous form of the resistance is frequently seen
(hGISA) where only a small proportion of the population (approx. 10-6) express the resistant
phenotype creating even further detection dilemmas (10). Just as it took over 10 years for
hMRSA to be simply considered the same phenotype (and genotype) as MRSA, so may the
case prove to be for hGISA (4).
hGISA and GISA has been the subject of many recent reviews covering their mechanism of
resistance, clinical relevance, treatment challenges, and detection methods (3, 7, 9, 15, 19, 20,
22, 23). It now appears that both hGISA and GISA have common structural and clinical
features, inuring many researchers that they almost identical and should be reported as such
(12). Generally speaking, both hGISA and GISA possess thickened cell walls, are associated
with prolonged glycopeptide therapy and low glycopeptide serum concentrations, and often
share a number of genetic expression markers e.g. atl, mrpB (8, 15, 18, 27, 28, 30). More
importantly, there exist an increasing number of studies alluding to the clinical significance
of hGISA and its association with vancomycin failures (5, 13, 14, 27).
The current differentiation of hGISA from GISA, appear to imply that GISA possess a
homogenously vancomycin (VA) resistant population in contrast to hGISA. However,
population studies of strains with reduced susceptibility to VA (MIC 2-16 µg/ml) show that
this is indeed not the case and that GISA strains often present with a non-homogeneous or
heterogeneous VA kill curve . The obvious difference seen between hGISA and GISA is that
the GISA isolates more often produce enough of the sub-population expressing the
ACCEPTED
on March 27, 2020 by guest
http://jcm.asm
.org/D
ownloaded from
4
intermediate level of “resistance” such that these cells will now grow on VA at 4µg/ml when
tested with standard inoculum equivalent to 0.5 McFarland standard. Accordingly, there is
much debate over whether the current CLSI VA intermediate breakpoint of 4-8 µg/ml is
appropriate for detecting all hGISA/GISA phenotypes. A recent study where VA MICs for 20
GISA, 157 h-GISA and 106 non-GISA were determined indicated that the current
intermediate breakpoint of 4 should be reduced to 2 µg/ml to better identify the hGISA/GISA
strains (31). This notion is further supported by the CDC which have revised their S. aureus
/VA algorithm accommodating VISA stains not expressing high-levels of VA resistance
(http://www.cdc.gov/ncidod/dhqp/ar-visavrsa-algo.html). This initiative was adopted by the
CLSI in 2005 and amendments made to Table 2C, M2 and M7 (http://www.clsi.org).
Since their advent nearly ten years ago, there have been many methods advocated for
detecting hGISA/GISA (6). Automated methods have been modified to try and detect high-
level VA-resistant S. aureus (VRSA, MIC >32 µg/ml); however, these methods struggle to
detect GISA and are inappropriate for detecting hGISA (1, 2). As disk diffusion testing was
quickly recognised as unsuitable (16) other methods have been proposed such as
glycopeptide screening plates (6) and various population studies (11, 29). Other techniques
such as the modified Etest method (macromethod) have also been introduced but it requires
non-standard media (Brain Heart Infusion) and 2.0 McFarland inoculum i.e. variations that
beyond standard susceptibility testing praxis (26). Accordingly, we investigated a new Etest
GRD strip (E-VA/TP), one with a growth nutrient and one without. The GRD strip uses a
standard inoculum and agar and herein we test it against an international collection of
hGISA/GISA/non-GISA comprising different MLST profiles and established genetic
lineages (17).
ACCEPTED
on March 27, 2020 by guest
http://jcm.asm
.org/D
ownloaded from

5
MATERIALS AND METHODS
Strains. The following reference organisms were used: S. aureus ATCC: 29213 and 25923
(non-MRSA), 43300 (MRSA), 700698 (Mu3 - hGISA), and 700699 (Mu50 - GISA) were
tested in quintuplicate. The clinically derived test strains comprised the following: 15 GISA,
60 hGISA (defined by a positive PAP-AUC) and 70 GSSA. These isolates comprised an
international collection of unique strains (different clones) comprising all five major MRSA
endemic clonal lineages (17).
Media and antibiotics. Brain-Heart Infusion (BHI) and Mueller-Hinton agar was obtained
from BBL (Becton and Dickinson, Cockeysville, MD). Vancomycin (VA) and teicoplanin
(TP) antibiotic powders were obtained from Fagron (Barsbuttel, Germany) and Molcan Corp
(Richmond Hill, Canada), respectively.
Etest macromethod. The Etest macromethod (E-M) was performed as described by Walsh
et al. (26). A suspension of colonies from an overnight culture on blood plate was prepared in
MH broth and the turbidity adjusted to 2.0 McFarland after which 200 µl of the suspension
was pipetted and evenly streaked out on the surface of a 90-mm BHI agar plate. The Etest
standard procedure for MIC testing of VA was performed using an inoculum suspension in
0.9% saline (0.5 McFarland) that was streaked onto Mueller Hinton agar plates (BBL). After
drying the plates for approx. 10 minutes, Etest strips (AB BIODISK, Solna, Sweden) for VA
(0.016 to 256 µg/ml) and TP (0.016 to 256 µg/ml) were applied to the BHI plate and VA to
the MH plate. Agar plates were incubated at 35 o C for 18-24 and 48h and read by two
different laboratory technicians.
ACCEPTED
on March 27, 2020 by guest
http://jcm.asm
.org/D
ownloaded from
6
Etest GRD strip. The two new Etest prototype strips evaluated were: VA 32- 0.5/ TP 32-0.5
µg/ml double-sided gradient (E-VA/TP), with one prototype with a nutrient incorporated into
the strip (E-VA/TP+S) to enhance the growth of hGISA. Both strips were tested with
standard inoculum (0.5 McFarland) using Mueller-Hinton agar agar (BBL) ± 5% blood and
read at 18-24 and 48h. The endpoints read from the Etest GRD strips should not be regarded
as true MIC values but rather as modified results with interpretive cut-offs defined for the
phenotypic detection of glycopeptide resistance phenotypes in S. aureus. Preliminary
interpretive cut-offs used for the Etest GRD prototype strips read at 24 and 48h were: GISA:
E-M values of TP or VA ≥8 and standard VA MIC ≥6; hGISA: E-M values of TP or VA ≥8
and standard VA MIC ≤4.
Vancomycin screening plate. The VA (6 µg/ml) BHI screening plate (21, 24, 26)
recommended by the CDC (http://www.cdc.gov) was used. All plates were spot-inoculated
with 10 µl of an inoculum suspension prepared with growth from an overnight blood agar
plate, with a turbidity equivalent to 0.5 McFarland. Plates were incubated for 48h and growth
was reported after both 24 and 48h.
Teicoplanin screening plate. The TP (5 µg/ml) Mueller-Hinton agar screening plate
recommended by the CA-SFM (http://www.sfm.asso.fr) was used. All plates were spot-
inoculated with 10 µl of an inoculum suspension prepared with growth from an overnight
blood agar plate, with a turbidity equivalent to 2 McFarland. Plates were incubated for 48h
and growth was reported after both 24 and 48h.
Population analysis profile – area under the curve (PAP-AUC). The method described by
Wootton et al. was used (29). After 24 h incubation in tryptone soya broth (Oxoid,
Basingstoke, Hampshire, UK), an undiluted culture and dilutions of 1/10-8 and 1/10-5 were
inoculated using a spiral plater (Don Whitley, Shipley, UK) onto BHI agar (Oxoid) plates
ACCEPTED
on March 27, 2020 by guest
http://jcm.asm
.org/D
ownloaded from

7
containing 0.5, 1, 2.5, 4, and 8 µg/ml of VA. Colonies were counted after 48h incubation.
The number of CFU/ml was plotted against VA concentration by using GraphPad Prism
software (San Diego, CA, USA). The area underneath the curve was plotted for each test
strain and compared with the curves for Mu3, Mu50 and S. aureus ATCC control strains. A
ratio was then calculated by dividing the AUC of the test strain by the AUC of Mu3. The
isolates used herein had their PAP-AUC calculated prior to commencement of the study;
however, a random sample (# 50 isolates) was chosen to ensure the PAP-AUC value i.e. the
hGISA/GISA phenotype had been maintained.
Statistical analysis. The performance of each method in detecting hGISA/GISA was
evaluated by comparison with the PAP-AUC ratio. Each method was assessed for its
specificity and sensitivity in discriminating hGISA/GISA from GSSA as previously
described (26). The specificity is based on the number of correct negative results i.e. the true
number of GSSA strains that were correctly identified. The sensitivity is based on the number
of hGISA/GISA that was correctly identified.
ACCEPTED
on March 27, 2020 by guest
http://jcm.asm
.org/D
ownloaded from

8
RESULTS
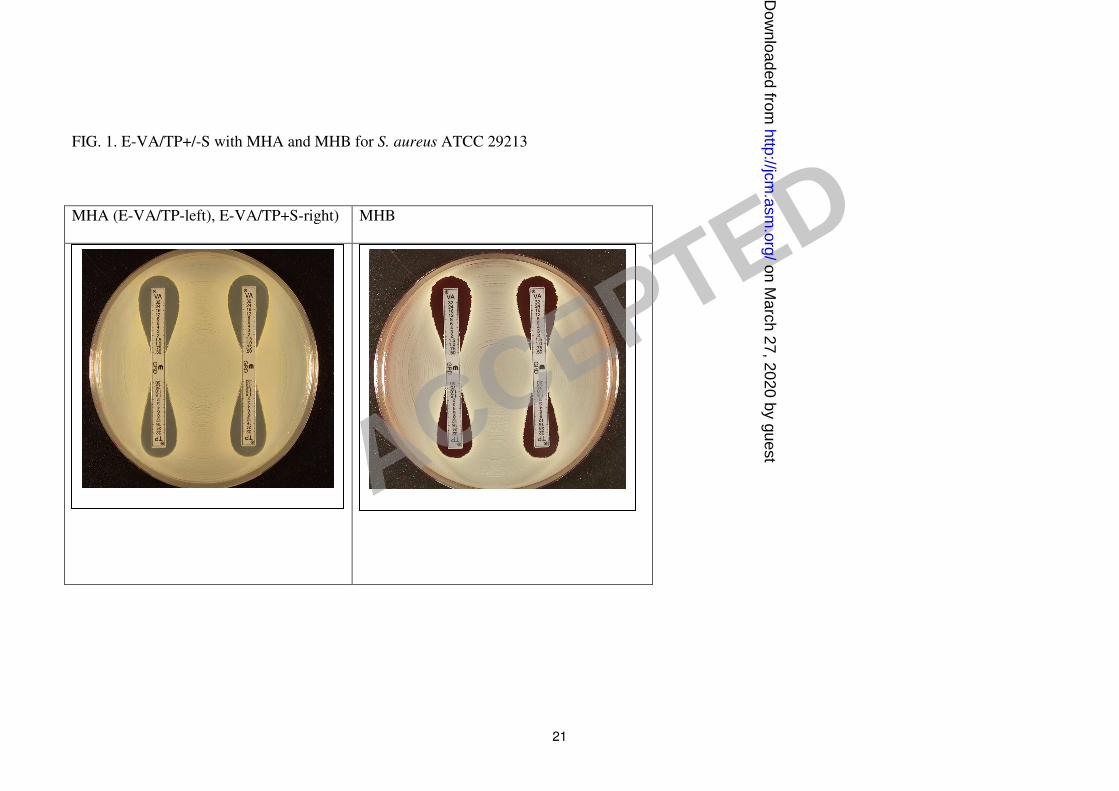
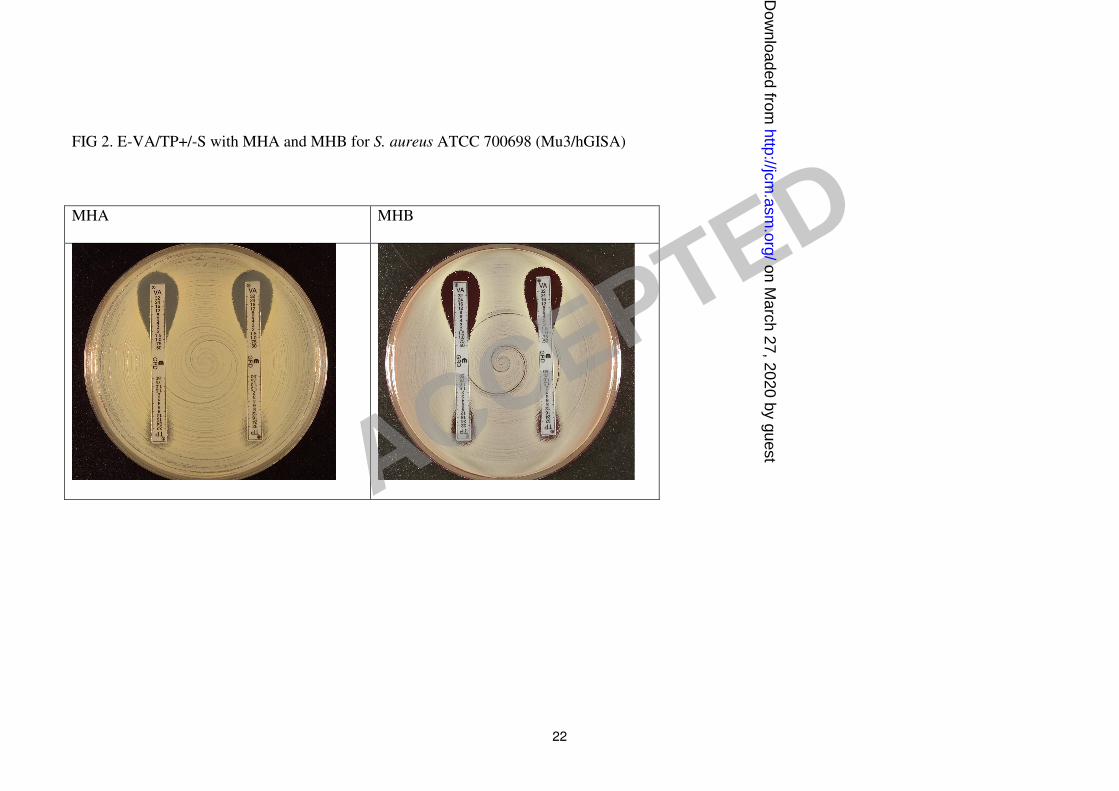
Figures 1-3 show examples of results with the new Etest VA/TP+S strips for S. aureus
ATCC 29213, ATCC 700698 (Mu3) and ATCC 700699 (Mu50), respectively. Table 1 shows
the MIC ranges for each of the methods. Typically, the GRD values for the negative control
GSSA strain S. aureus ATCC 29213 for VA and TP varies between 0.5 -1 µg/ml on both
Mueller-Hinton agar and Mueller-Hinton agar plus blood. For hGISA and GISA the MIC
ranges were higher after 48hrs and the resistance enhanced by the presence of both the blood
and growth supplement (Table 1). S. aureus ATCC 700698 (Mu3) gave low VA values and
discernibly high TP values (≥ 32 µg/ml) and small colony variants (SCVs) were clearly
visible within the TP inhibition ellipses on Mueller-Hinton agar and Mueller-Hinton agar
plus blood. S. aureus ATCC 700699 (Mu50) gave high VA values (12 µg/ml) compared to
Mu3, with SCVs clearly visible in the VA inhibition ellipse, particularly on Mueller-Hinton
agar plus blood. Predictably, the Mu50 GISA phenotype had very high TP value (>32 µg/ml)
and almost no inhibition ellipse.
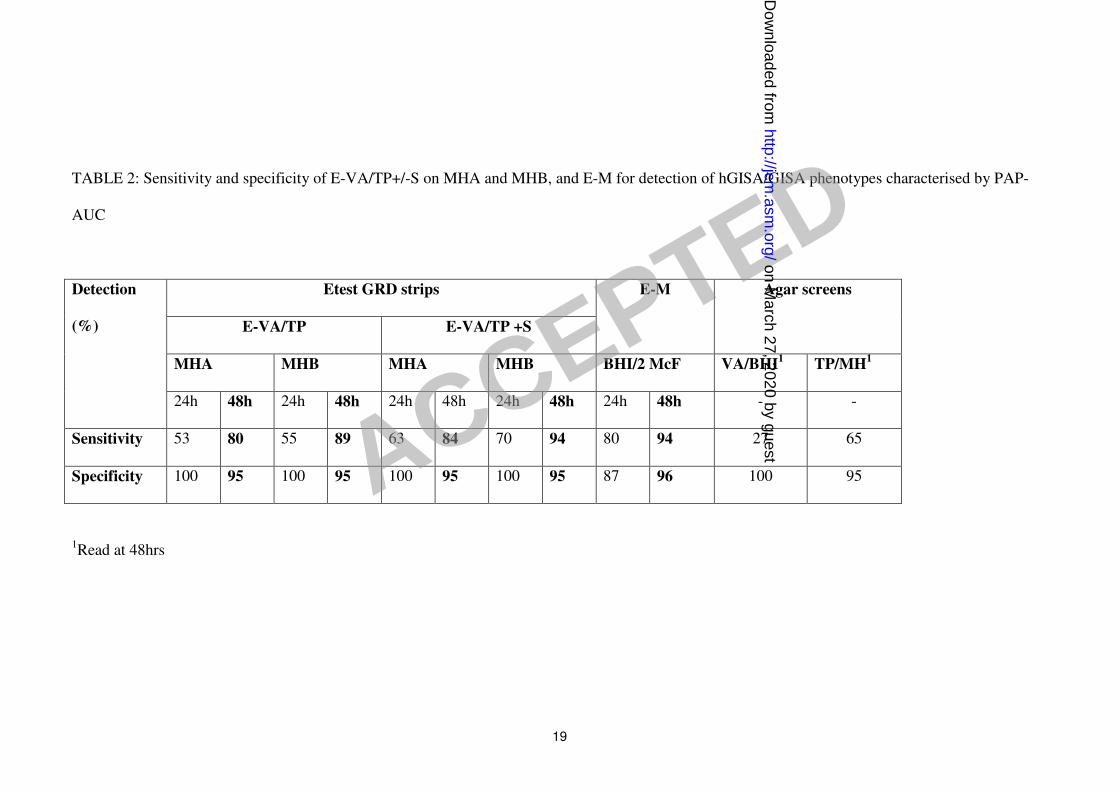
Table 2 compares the sensitivity and specificity of the Etest GRD strips (E-VA/TP +/- S)
with the E-M for the 150 PAP-AUC phenotypically characterised strains. For the detection of
hGISA/GISA, the E-VA/TP + S strip tested on Mueller-Hinton agar plus blood and read at
48h had the highest sensitivity (94%), and was comparable to the E-M. The addition of 5%
blood to Mueller-Hinton agar increased the 48h detection sensitivity for E-VA/TP and E-
VA/TP+S, from 80 to 89%, and 84 to 94%, respectively. The sensitivity for 24h reading was
appreciably lower than for 48h, confirming the need for extended incubation to optimise the
detection of glycopeptide resistance. After 48h incubation, all methods gave a specificity of
95-96%.
ACCEPTED
on March 27, 2020 by guest
http://jcm.asm
.org/D
ownloaded from

9
The vanocmycin screening plate, VA/BHI, missed most hGISA/GISA strains (overall
sensitivity of 27% - Table 2) with 12% sensitivity for hGISA and 87% sensitivity. The CA-
SFM screening plate (TP/ Mueller-Hinton agar) was better than VA/BHI with an overall
sensitivity of 65% and a specificity of 95%. However, whilst it was able to detect most GISA
strains (93% sensitivity) it only had a sensitivity of 58% for hGISA strains.
All strains were independently tested in triplicate under blind conditions to examine the
robustness of each method. Table 3 summarises the reproducibility of the Etest GRD strips
(E-VA/TP +/- S) and E-M to the two agar screening plates. For the GISA strains (n=15), both
the E-VA/TP, E-VA-TP+S strips and E-M had 100% reproducibility compared to the agar
screens VA/BHI and TP/ Mueller-Hinton agar that had 87 and 93%, respectively. The
screening plates were unreliable for the detection of hGISA (n=60) with VA/BHI and
TP/Mueller-Hinton agar giving poor reproducibilities of 12% and 58%, respectively. The
best performance for the repeated detection of hGISA was found with the E-VA/TP+S strip
on Mueller-Hinton agar plus blood which had a reproducibility of 98% at 48h. The addition
of blood to Mueller-Hinton agar proved very effective in increasing the reproducibility of
hGISA detection from 81 to 95%, and 89 to 98%, for E-VA/TP and EVA/TP+S strips,
respectively (Table 3).
ACCEPTED
on March 27, 2020 by guest
http://jcm.asm
.org/D
ownloaded from
10
DISCUSSION
The increasing debate over the clinical significance of GISA, and in particular h-GISA, has
been compounded by the difficulty in detecting them. The clinical failure attributable to
glycopeptide use may in part be due to their physical chemical properties, high protein
binding, and potentially insufficient drug levels at the infection site due to poor
pharmacokinetics properties of the drug and difficulties in optimising the dose and dosing
regimen relative to concentration-related toxicity of the drugs (25). However, despite sub-
therapeutic drug levels, it is now known that staphylococci can respond to the presence of the
low levels of glycopeptide which can subsequently select for low-level resistance. This type
of heterogeneous and variable resistance in staphylococci which is expressed at varying
frequencies within the population is not detectable by either disk diffusion (16, 27) or
automated susceptibility testing systems (8, 24) – a phenomenon recognised by numerous
expert groups including the CDC (http://www.cdc.gov/ncidod/dhqp/ar-visavrsa.html), CLSI
(,http://www.CLSI.org) BSAC (http://www.bsac.org.uk) and CA-SFM
(http://www.sfm.asso.fr). To address the limitations of disk diffusion and automated systems,
agar screening plates have been developed as simple alternatives to screen for hGISA/GISA
strains, since populations analysis profile methods are highly specialised and unsuitable for
use in clinical laboratories. The PAP-AUC used as the reference method in this study, whilst
labour intensive, is sensitive. The VA/BHI plate, initially developed for vancomycin
resistance screen in Enterococci, is commercially available and widely used in the US.
However, this study and various others have clearly shown that this method is poor in
detecting hGISA and occasional will fail to detect GISA strains. TP, a more sensitive marker
for the detection of hGISA/GISA is not available as a commercial reagent in the US, thus,
precluding the TP/ Mueller-Hinton agar plate as a viable option for screening of
hGISA/GISA.
ACCEPTED
on March 27, 2020 by guest
http://jcm.asm
.org/D
ownloaded from

11
The E-M was first introduced as a potential screening method for detecting hGISA/GISA and
thereafter further investigated in a controlled study (26). The new Etest GRD strip with
double sided VA and TP concentration gradients across 7 dilutions (E-VA/TP) was designed
to be used with normal media and at a standard inoculum, circumventing some of the
perceived problems that arose with the macro-method. GISA and hGISA strain are
notoriously slow growing and their standard feature is the thickened cell wall and their
pleomorphic appearance – often involving SCVs. Accordingly, in order to detect all SCVs a
growth supplement has been added which enhances their growth and thus their detection..
The two prototypes E-VA/TP and E-VA/TP+S) were thus examined using the standard
inoculum of 0.5 McFarland and on two different agar plates (Mueller-Hinton agar +/- blood)
that are readily available in the clinical laboratory. The sensitivity at 48h is greater t
han that at 24h (Table 2) as the SCVs are larger enough to be seen with the naked eye and are
visible as a light growth within the Etest ellipse (Fig. 1-3). Given that vanocmycin is often
used for an extended period (some cases report hGISA being treated for a period of 18
weeks), we feel that the 48h incubation period for improved sensitivity is appropriate will not
overtly affect the clinical outcome (27). Results for E-VA/TP+S read at 18-24h incubation, if
positive for hGISA/GISA can be reported as such, although negative results should be
confirmed after 48h incubation since sensitivity was highest at 48h, detecting all GISA
(n=15) and 98% of hGISA (n=60) strains on Mueller-Hinton agar plus blood.
Clinicians and laboratories alike are becoming increasingly aware that patients on long term
vancomycin therapy and cases of recurrent MRSA bacteremia (5, 12) may signal the
presence and potential spread of hGISA/GISA strains. The extent of the problem is still
unknown as laboratories are not equipped with appropriate and sensitive test methods that
can reliably detect these phenotypes in their clinical routines. Herein, we have presented a
new method – the Etest GRD strip with vancomycin and teicoplanin - that performs as well
ACCEPTED
on March 27, 2020 by guest
http://jcm.asm
.org/D
ownloaded from
12
as the E-M and the reference PAP-AUC assay, but with the simplicity of a standard routine
diagnostic test which can be used daily for clinical and epidemiological purposes.
ACCEPTED
on March 27, 2020 by guest
http://jcm.asm
.org/D
ownloaded from
13
REFERENCES
1. 2004. Vancomycin-resistant Staphylococcus aureus--New York, 2004. MMWR Morb
Mortal Wkly Rep 53:322-3.
2. 2002. Vancomycin-resistant Staphylococcus aureus--Pennsylvania, 2002. MMWR
Morb Mortal Wkly Rep 51:902.
3. Appelbaum, P. C. 2006. The emergence of vancomycin-intermediate and
vancomycin-resistant Staphylococcus aureus. Clin. Microbiol. Infect. 12 Suppl 1:16-
23.
4. Berger-Bachi, B. 2002. Resistance mechanisms of gram-positive bacteria. Int. J.
Med. Microbiol. 292:27-35.
5. Charles, P. G., P. B. Ward, P. D. Johnson, B. P. Howden, and M. L. Grayson.
2004. Clinical features associated with bacteremia due to heterogeneous vancomycin-
intermediate Staphylococcus aureus. Clin. Infect. Dis. 38:448-51.
6. Cosgrove, S. E., K. C. Carroll, and T. M. Perl. 2004. Staphylococcus aureus with
reduced susceptibility to vancomycin. Clin. Infect. Dis. 39:539-45.
7. Fridkin, S. K. 2001. Vancomycin-intermediate and -resistant Staphylococcus aureus:
what the infectious disease specialist needs to know. Clin. Infect. Dis. 32:108-15.
8. Fridkin, S. K., J. Hageman, L. K. McDougal, J. Mohammed, W. R. Jarvis, T. M.
Perl, and F. C. Tenover. 2003. Epidemiological and microbiological characterization
of infections caused by Staphylococcus aureus with reduced susceptibility to
vancomycin, United States, 1997-2001. Clin. Infect. Dis. 36:429-39.
9. Hiramatsu, K. 2001. Vancomycin-resistant Staphylococcus aureus: a new model of
antibiotic resistance. Lancet Infect. Dis. 1:147-55.
10. Hiramatsu, K., L. Cui, M. Kuroda, and T. Ito. 2001. The emergence and evolution
of methicillin-resistant Staphylococcus aureus. Trends Microbiol. 9:486-93.
ACCEPTED
on March 27, 2020 by guest
http://jcm.asm
.org/D
ownloaded from

14
11. Hiramatsu, K., H. Hanaki, T. Ino, K. Yabuta, T. Oguri, and F. C. Tenover. 1997.
Methicillin-resistant Staphylococcus aureus clinical strain with reduced vancomycin
susceptibility. J. Antimicrob. Chemother. 40:135-6.
12. Howden, B. P. 2005. Recognition and management of infections caused by
vancomycin-intermediate Staphylococcus aureus (VISA) and heterogenous VISA
(hVISA). Intern. Med. J. 35 Suppl 2:S136-40.
13. Howden, B. P., P. G. Charles, P. D. Johnson, P. B. Ward, and M. L. Grayson.
2005. Improved outcomes with linezolid for methicillin-resistant Staphylococcus
aureus infections: better drug or reduced vancomycin susceptibility? Antimicrob.
Agents Chemother. 49:4816; author reply 4816-7.
14. Howden, B. P., P. D. Johnson, P. G. Charles, and M. L. Grayson. 2004. Failure of
vancomycin for treatment of methicillin-resistant Staphylococcus aureus infections.
Clin. Infect. Dis. 39:1544; author reply 1544-5.
15. Howden, B. P., P. B. Ward, P. D. Johnson, P. G. Charles, and M. L. Grayson.
2005. Low-level vancomycin resistance in Staphylococcus aureus--an Australian
perspective. Eur. J. Clin. Microbiol. Infec.t Dis. 24:100-8.
16. Howe, R. A., K. E. Bowker, T. R. Walsh, T. G. Feest, and A. P. MacGowan.
1998. Vancomycin-resistant Staphylococcus aureus. Lancet 351:602.
17. Howe, R. A., A. Monk, M. Wootton, T. R. Walsh, and M. C. Enright. 2004.
Vancomycin susceptibility within methicillin-resistant Staphylococcus aureus
lineages. Emerg. Infect. Dis. 10:855-7.
18. Howe, R. A., M. Wootton, T. R. Walsh, P. M. Bennett, and A. P. Macgowan.
2000. Heterogeneous resistance to vancomycin in Staphylococcus aureus. J.
Antimicrob. Chemother. 45:130-2.
19. Pfeltz, R. F., and B. J. Wilkinson. 2004. The escalating challenge of vancomycin
resistance in Staphylococcus aureus. Curr. Drug Targets Infect. Disord. 4:273-94.
ACCEPTED
on March 27, 2020 by guest
http://jcm.asm
.org/D
ownloaded from
15
20. Tenover, F. C. 1999. Implications of vancomycin-resistant Staphylococcus aureus. J.
Hosp. Infect. 43 Suppl:S3-7.
21. Tenover, F. C., J. W. Biddle, and M. V. Lancaster. 2001. Increasing resistance to
vancomycin and other glycopeptides in Staphylococcus aureus. Emerg. Infect. Dis.
7:327-32.
22. Tenover, F. C., M. V. Lancaster, B. C. Hill, C. D. Steward, S. A. Stocker, G. A.
Hancock, C. M. O'Hara, S. K. McAllister, N. C. Clark, and K. Hiramatsu. 1998.
Characterization of staphylococci with reduced susceptibilities to vancomycin and
other glycopeptides. J. Clin. Microbiol. 36:1020-7.
23. Tenover, F. C., and L. C. McDonald. 2005. Vancomycin-resistant staphylococci
and enterococci: epidemiology and control. Curr. Opin. Infect. Dis. 18:300-5.
24. Tenover, F. C., M. J. Mohammed, J. Stelling, T. O'Brien, and R. Williams. 2001.
Ability of laboratories to detect emerging antimicrobial resistance: proficiency testing
and quality control results from the World Health Organization's external quality
assurance system for antimicrobial susceptibility testing. J. Clin. Microbiol. 39:241-
50.
25. Turnidge, J., and M. L. Grayson. 1993. Optimum treatment of staphylococcal
infections. Drugs 45:353-66.
26. Walsh, T. R., A. Bolmstrom, A. Qwarnstrom, P. Ho, M. Wootton, R. A. Howe, A.
P. MacGowan, and D. Diekema. 2001. Evaluation of current methods for detection
of staphylococci with reduced susceptibility to glycopeptides. J. Clin. Microbiol.
39:2439-44.
27. Walsh, T. R., and R. A. Howe. 2002. The prevalence and mechanisms of
vancomycin resistance in Staphylococcus aureus. Annu. Rev. Microbiol. 56:657-75.
28. Wootton, M., P. M. Bennett, A. P. MacGowan, and T. R. Walsh. 2005. Reduced
expression of the atl autolysin gene and susceptibility to autolysis in clinical
ACCEPTED
on March 27, 2020 by guest
http://jcm.asm
.org/D
ownloaded from

16
heterogeneous glycopeptide-intermediate Staphylococcus aureus (hGISA) and GISA
strains. J. Antimicrob. Chemother. 56:944-7.
29. Wootton, M., R. A. Howe, R. Hillman, T. R. Walsh, P. M. Bennett, and A. P.
MacGowan. 2001. A modified population analysis profile (PAP) method to detect
hetero-resistance to vancomycin in Staphylococcus aureus in a UK hospital. J.
Antimicrob. Chemother. 47:399-403.
30. Wootton, M., A. P. Macgowan, and T. R. Walsh. 2005. Expression of tcaA and
mprF and glycopeptide resistance in clinical glycopeptide-intermediate
Staphylococcus aureus (GISA) and hetero-resistant GISA strains. Biochim. Biophys.
Acta. 1726:326-7.
31. Wootton, M., T. R. Walsh, and A. P. MacGowan. 2005. Evidence for reduction in
breakpoints used to determine vancomycin susceptibility in Staphylococcus aureus.
Antimicrob. Agents Chemother. 49:3982-3.
ACCEPTED
on March 27, 2020 by guest
http://jcm.asm
.org/D
ownloaded from

17
Table 1. MIC ranges for GRD Etest and standard MICs compared with the Etest macro-method and PAP-AUC
GRD MHA1 GRD MHB2 GRD + S MHA3 GRD + S MHB4 Etest Macro-method
V T V T V T V T V5 T5
Phenotypes
24 48 24 48 24 48 24 48 24 48 24 48 24 48 24 48 24 48 24 48
PAP-
AUC
V-
MIC6
T-
MIC7
MSSA 0.5-
0.75
0.75-
1.5
0.5-
1.0
0.5-
2.0
0.5-
0.75
0.75-
1.5
0.5-
1.0
0.75-
1.5
0.5-
1.5
0.5-
2.0
0.75-
1.0
0.75-
2.0
0.5-
0.75
0.75-
1.5
0.75-
1.5
1.0-
3
2-3 2-4 1.5-
3
2-6 0.32-
0.84
0.25-
1
1-2
MRSA 0.5-
0.75
0.75-
1.0
0.5-
1.0
1.5-
2
0.75-
1.0
1.0-
1.5
0.5-
1.0
0.75-
1.5
0.5-
0.75
0.5-
1.0
0.5-
1.0
0.5-
2.0
0.5-
1.0
0.75-
1.5
0.75-
1.5
1.0-
3.0
1.5-
3
1.5-
3
2-4 1.5-
4
0.48-
0.86
0.5-
1
1.5-2
hGISA 0.75-
1.0
1-4 1-8 2-
32
0.75-
2
0.75-
12
1.5-
32
2-32 0.75-
2
1-8 2-12 4-24 1-8 2-16 2-32 6-
32
3-
12
3-
12
1.5-
12
12-
32
0.91-
1.25
1.5-
6
1-
12
GISA 6-12 6-12 32-
>32
>32 6-12 12-
16
16-
32
32-
>32
8-12 24-
32
16-
32
32-
>32
8-
16
16-
24
16-
>32
>32 4-
16
8-
32
12-
24
16-
32
1.08-
1.55
4-8 4-16
ACCEPTED on March 27, 2020 by guest
http://jcm.asm
.org/D
ownloaded from

18
1 GRD with Muller Hinton Agar
2 GRD with Muller Hinton Agar plus 5% blood
3 GRD plus supplements with Muller Hinton Agar
4 GRD plus supplements with Muller Hinton Agar plus 5% blood
5 V: vancomycin; T: teicoplanin
6&7 MIC were read at 18hr
ACCEPTED on March 27, 2020 by guest
http://jcm.asm
.org/D
ownloaded from
19
TABLE 2: Sensitivity and specificity of E-VA/TP+/-S on MHA and MHB, and E-M for detection of hGISA/GISA phenotypes characterised by PAP-
AUC
Etest GRD strips
E-VA/TP E-VA/TP +S
E-M Agar screens
MHA MHB MHA MHB BHI/2 McF VA/BHI1 TP/MH
1
Detection
(%)
24h 48h 24h 48h 24h 48h 24h 48h 24h 48h - -
Sensitivity 53 80 55 89 63 84 70 94 80 94 27 65
Specificity 100 95 100 95 100 95 100 95 87 96 100 95
1Read at 48hrs
ACCEPTED on March 27, 2020 by guest
http://jcm.asm
.org/D
ownloaded from

20
TABLE 3: Reproducibility of Etest GRD, E-M and agar screening for detection of hGISA/GISA/GSSA
Etest GRD (48h)
E-VA/TP E-VA/TP+S
E-M Agar screen
% Correct
phenotype
MH MHB MH MHB BHI/2McF VA/BHI TP/MH
GISA (15x3) 100 100 100 100 100 87 93
hGISA (60x3) 81 95 89 98 92 12 58
5 ATCC (25x3) 100 100 100 100 100 80 100
ACCEPTED on M
arch 27, 2020 by guesthttp://jcm
.asm.org/
Dow
nloaded from
21
FIG. 1. E-VA/TP+/-S with MHA and MHB for S. aureus ATCC 29213
MHA (E-VA/TP-left), E-VA/TP+S-right) MHB
ACCEPTED on March 27, 2020 by guest
http://jcm.asm
.org/D
ownloaded from
22
FIG 2. E-VA/TP+/-S with MHA and MHB for S. aureus ATCC 700698 (Mu3/hGISA)
MHA MHB
ACCEPTED on March 27, 2020 by guest
http://jcm.asm
.org/D
ownloaded from

23
FIG. 3. E-VA/TP+/-S with MHA and MHB for S. aureus ATCC 700699 (Mu50/GISA)
MHA MHB
ACCEPTED on March 27, 2020 by guest
http://jcm.asm
.org/D
ownloaded from