stanlib collective investments · tali collective investments abridged annual report 2017 2 4 5 8...
TRANSCRIPT

1STANLIB Collective Investments Abridged Annual Report 2017
STANLIBCollective InvestmentsAbridged Annual Report 2017

2STANLIB Collective Investments Abridged Annual Report 2017
4
5
8
11
13
15
About STANLIB
STANLIB class review
Chairman’s report
Trustee’s report
Shari’ah compliance
Financial Statements

Multi-specialist investmentbacked by 1 230* years of collective investment experience.
*As at 31 December 2017
stanlib.com

4STANLIB Collective Investments Abridged Annual Report 2017
About STANLIBSTANLIB connects multiple investment specialists across a broad range of asset classes to enable them to make better-informed decisions for the benefit of our customers. Succeeding in today’s interconnected, fast-changing world requires multi-specialist investment professionals who share deep insights to make the connections that count.
We manage and administer over R608 billion (USD 49 billion as at 31 December 2017), for over 500 000 retail and institutional clients throughout the world.
How we investAt STANLIB, we recognise that we live in a world that’s increasingly volatile and understanding the connections leading to the volatility is crucial. From markets and currencies to economies and politics, everything today affects investment decisions and our client outcomes. Managing investments in the best way possible for our clients in this complex, connected world – the real world – depends on being able to see and understand the bigger, inter-connected picture. Having the resources to access multiple viewpoints allows us to make investment decisions with conviction.
We are in a unique position to uncover deeper insights in this increasingly volatile world, enabling our customers to benefit from investments that count.
A leading investment businessAs Africa’s largest asset manager, we have a network of investment experts across the continent, with on the ground presence in eight countries.
Our connections extend to business partners in North America, United Kingdom, Europe, Middle East and Asia. Our access to a broad range of different perspectives allows us to help our customers, both individuals and institutions, achieve their financial goals.
4STANLIB Collective Investments Abridged Annual Report 2017
“We live in a world that’s fast-paced and increasingly connected. From markets and currencies to economies and politics, everything affects everything else. In this complex world, successful investing depends on being able to see and understand the bigger, inter-connected picture.”
- Derrick Msibi
South Africa
Namibia
Lesotho
Kenya
Swaziland
Uganda
Botswana
Ghana

5STANLIB Collective Investments Abridged Annual Report 2017
Asset class reviewEquityIn preparing this outlook piece it really struck home what an interesting and rewarding year 2017 provided for equity investors. The JSE All Share Index delivered 20.95% for 2017 despite the decimation of the share price of global mass-market household goods retailer Steinhoff (-91.7%). This, after the company admitted to unquantified accounting irregularities followed by the resignation of the CEO and CFO.
We find it somewhat difficult to provide a succinct outlook for the full calendar year ahead as the speed of change in the global economies, together with some expectation around key political outcomes in South Africa, remain important catalysts in the short- to medium-term.
The positive environment that characterised 2017 should extend into 2018 as the global economy continues to expand. Political risk remains elevated but should on balance subside in the latter half of 2018.
Factors in South Africa are actually changing for the better and the inauguration of Cyril Ramaphosa as the fourth president of South Africa had a remarkable impact on the country and on general confidence across the board.
The JSE Shareholder Weighted All Share Index returned 21.4% and the STANLIB Equity Fund delivered 14.5% for 2017.
Within the SA component of the fund, detractors to performance during the year were being underweight Naspers, Pioneer Foods and Famous Brands. Positive contributors to performance were an overweight position in Kumba Iron Ore and an underweight positions in Vodacom, Mediclinic and Woolworths.
Global equities performed well in 2017, supported in particular by robust economic indicators and strong corporate results. The MSCI All Country World Index rose 24.6% in dollar terms amid encouraging news on the global economy, earnings, oil prices and tax reform in the US. The fund’s international component delivered 19% in local currency. Or 30% in dollars if we add back the 10% appreciation of the rand in 2017. Share selection within the international component of the fund contributed to returns, led by picks in financials and technology.
The fund has a 4% exposure to African equities. 2017 was a good year for the rest of Africa, as the fund’s Africa exposure returned 18.5% in dollars. Primary contributors to performance were the overweight position in Egypt and Kenya. Nigeria and Uganda were the only detractors.
We continue with an underweight position in healthcare and an overweight position in the resources sectors going into 2018. The healthcare call is premised on fundamental reasons as we continue to see very little or any growth in the top line drivers of the sector.
Resources have been buoyed by global synchronised growth and the continued drive by the Chinese to close their own inefficient production units. The SA resources companies we are invested in are benefiting from the commodity price recovery we highlighted in our outlook statement last year. We remain bullish on Anglo American, Sasol and BHP Billiton, and have a new overweight position in paper shares.
The fund retains its significant exposure to Naspers as the underlying drivers of its largest
investment Tencent remain intact. We are also factoring in further operational improvement in the e-commerce and e-tailing subsidiaries of the group.
The change in political sentiment brings tailwinds for financials, so we are overweight Sanlam, Old Mutual and FirstRand.
With various scenarios in play globally and particularly in SA it is potentially going to be quite an interesting year for equity investors. We expect investment opportunities for active, discerning investors to increase in 2018. For us this means the continued focus on quality growth shares that have continued to reward investors over the past number of years.
STANLIB’S EQUITY CAPABILITIESWe focus on long-term fundamentals to identify companies whose
earnings growth potential has been under estimated by the market. Our portfolios are informed by our equity research, macro outlook
and share selection process.
Herman van VelzeHead of Equity24 years of experience
Offshore exposure
Risk profileBenchmark
STANLIB Equity Fund
25%AggressiveFTSE/JSE Shareholders
Weighted All Share IndexN/A
N/ASTANLIB SA Equity Fund
0%AggressiveFTSE/JSE Shareholders
Weighted All Share Index
Performance fees
Franchise sizeInvestment professionals
+190 10 R42 bn
Years of collective experience

6STANLIB Collective Investments Abridged Annual Report 2017
Listed PropertyThe South African political landscape remained uncertain leading up to the ANC elective conference in December 2017. A clear sign of the uncertainty was evident in the SA 10-year bond yield reaching a high of 9.5% before the elective conference and subsequently declining to below 9% following the election of President Cyril Ramaphosa.
Prior to the elective conference, the relationship between SA listed property and 10-year SA government bond yields decoupled because investors preferred rand hedge property stocks. Since then, SA Listed Property returned to the long-term norm of being more positively correlated with SA bonds yields.
The office sector in SA continued to experience weakness with consolidation into P-grade offices from B and C-grade office space. Rental levels remained depressed in all office sub sectors given excess supply in key nodes such as Sandton and Rosebank in Gauteng. The office sector recorded its highest vacancy level in 2017 at 11.2% according to South African Property Owners Association (SAPOA).
The retail sector has traditionally outperformedthe office and industrial sectors, however, anaemic economic growth in SA, weak consumer confidence and high unemployment have all driven polarisation in the retail sector where consumers traded down to value items. This played into the hands of community centres which tend to offer non-discretionary items. Warehousing and logistics proved to be the most resilient in a tough economic environment.
The STANLIB Property Income Fund underperformed the benchmark by 0.76% over 12 months, delivering 16.39% versus the benchmark return of 17.15%. Over the past quarter, the top contributors to fund performance were the overweight positions in MAS Real Estate and Sirius Real Estate. The top detractors were the underweight position in Greenbay and the overweight position in SA Corporate Real Estate Fund. Both MAS and Sirius offer offshore exposure and they operate in markets where economic growth is buoyant and property fundamentals are strong, namely Romania for MAS and purely Germany for Sirius. Both companies have on the ground management teams who have a good track record of delivering value to shareholders. We increased our overweight positions in both companies at the beginning of 2017 before they experienced significant investor appetite.
Over the next 12 months, we anticipate 7% distribution growth for the sector’s dividend paying companies. We continue to expect some companies with significant offshore exposure to declare double-digit distribution growth in rands, over the next 12 months.
We remain well-positioned for this eventuality and have increasingly positioned our SA property exposure towards SA property companies with defensive SA property portfolios and defensive offshore portfolios. The SAPY currently offers a forward yield of 7.2%, which is below the 10-year bond yield (8.6%). Listed property however provides the benefit of a growing income stream in
comparison to cash and bonds. Over the next 12 months, we expect listed property to deliver a total annualised return of 12%, on the assumption that bond yields are 9%.
Keillen NdlovuHead of Listed Property13 years of experience
STANLIB’S LISTED PROPERTY CAPABILITIESAs one of the leading listed property managers in the country, we
have a unique product offering across all property markets bothdomestically and globally with R30.9 billion assets
under management as at 31 December 2017.
Offshore exposure
Risk profileBenchmark
STANLIB Property Income Fund
0%. Indirect exposure through
underlying holdings
AggressiveFTSE/JSE SA Listed
Property Index (SAPY)
STANLIB Global Property Fund
100%AggressiveS&P Developed
REIT Index
Performance fees
N/A
N/A
Franchise sizeInvestment professionals
Years of collective experience
+30 5 R30.9 bn
7STANLIB Collective Investments Abridged Annual Report 2017
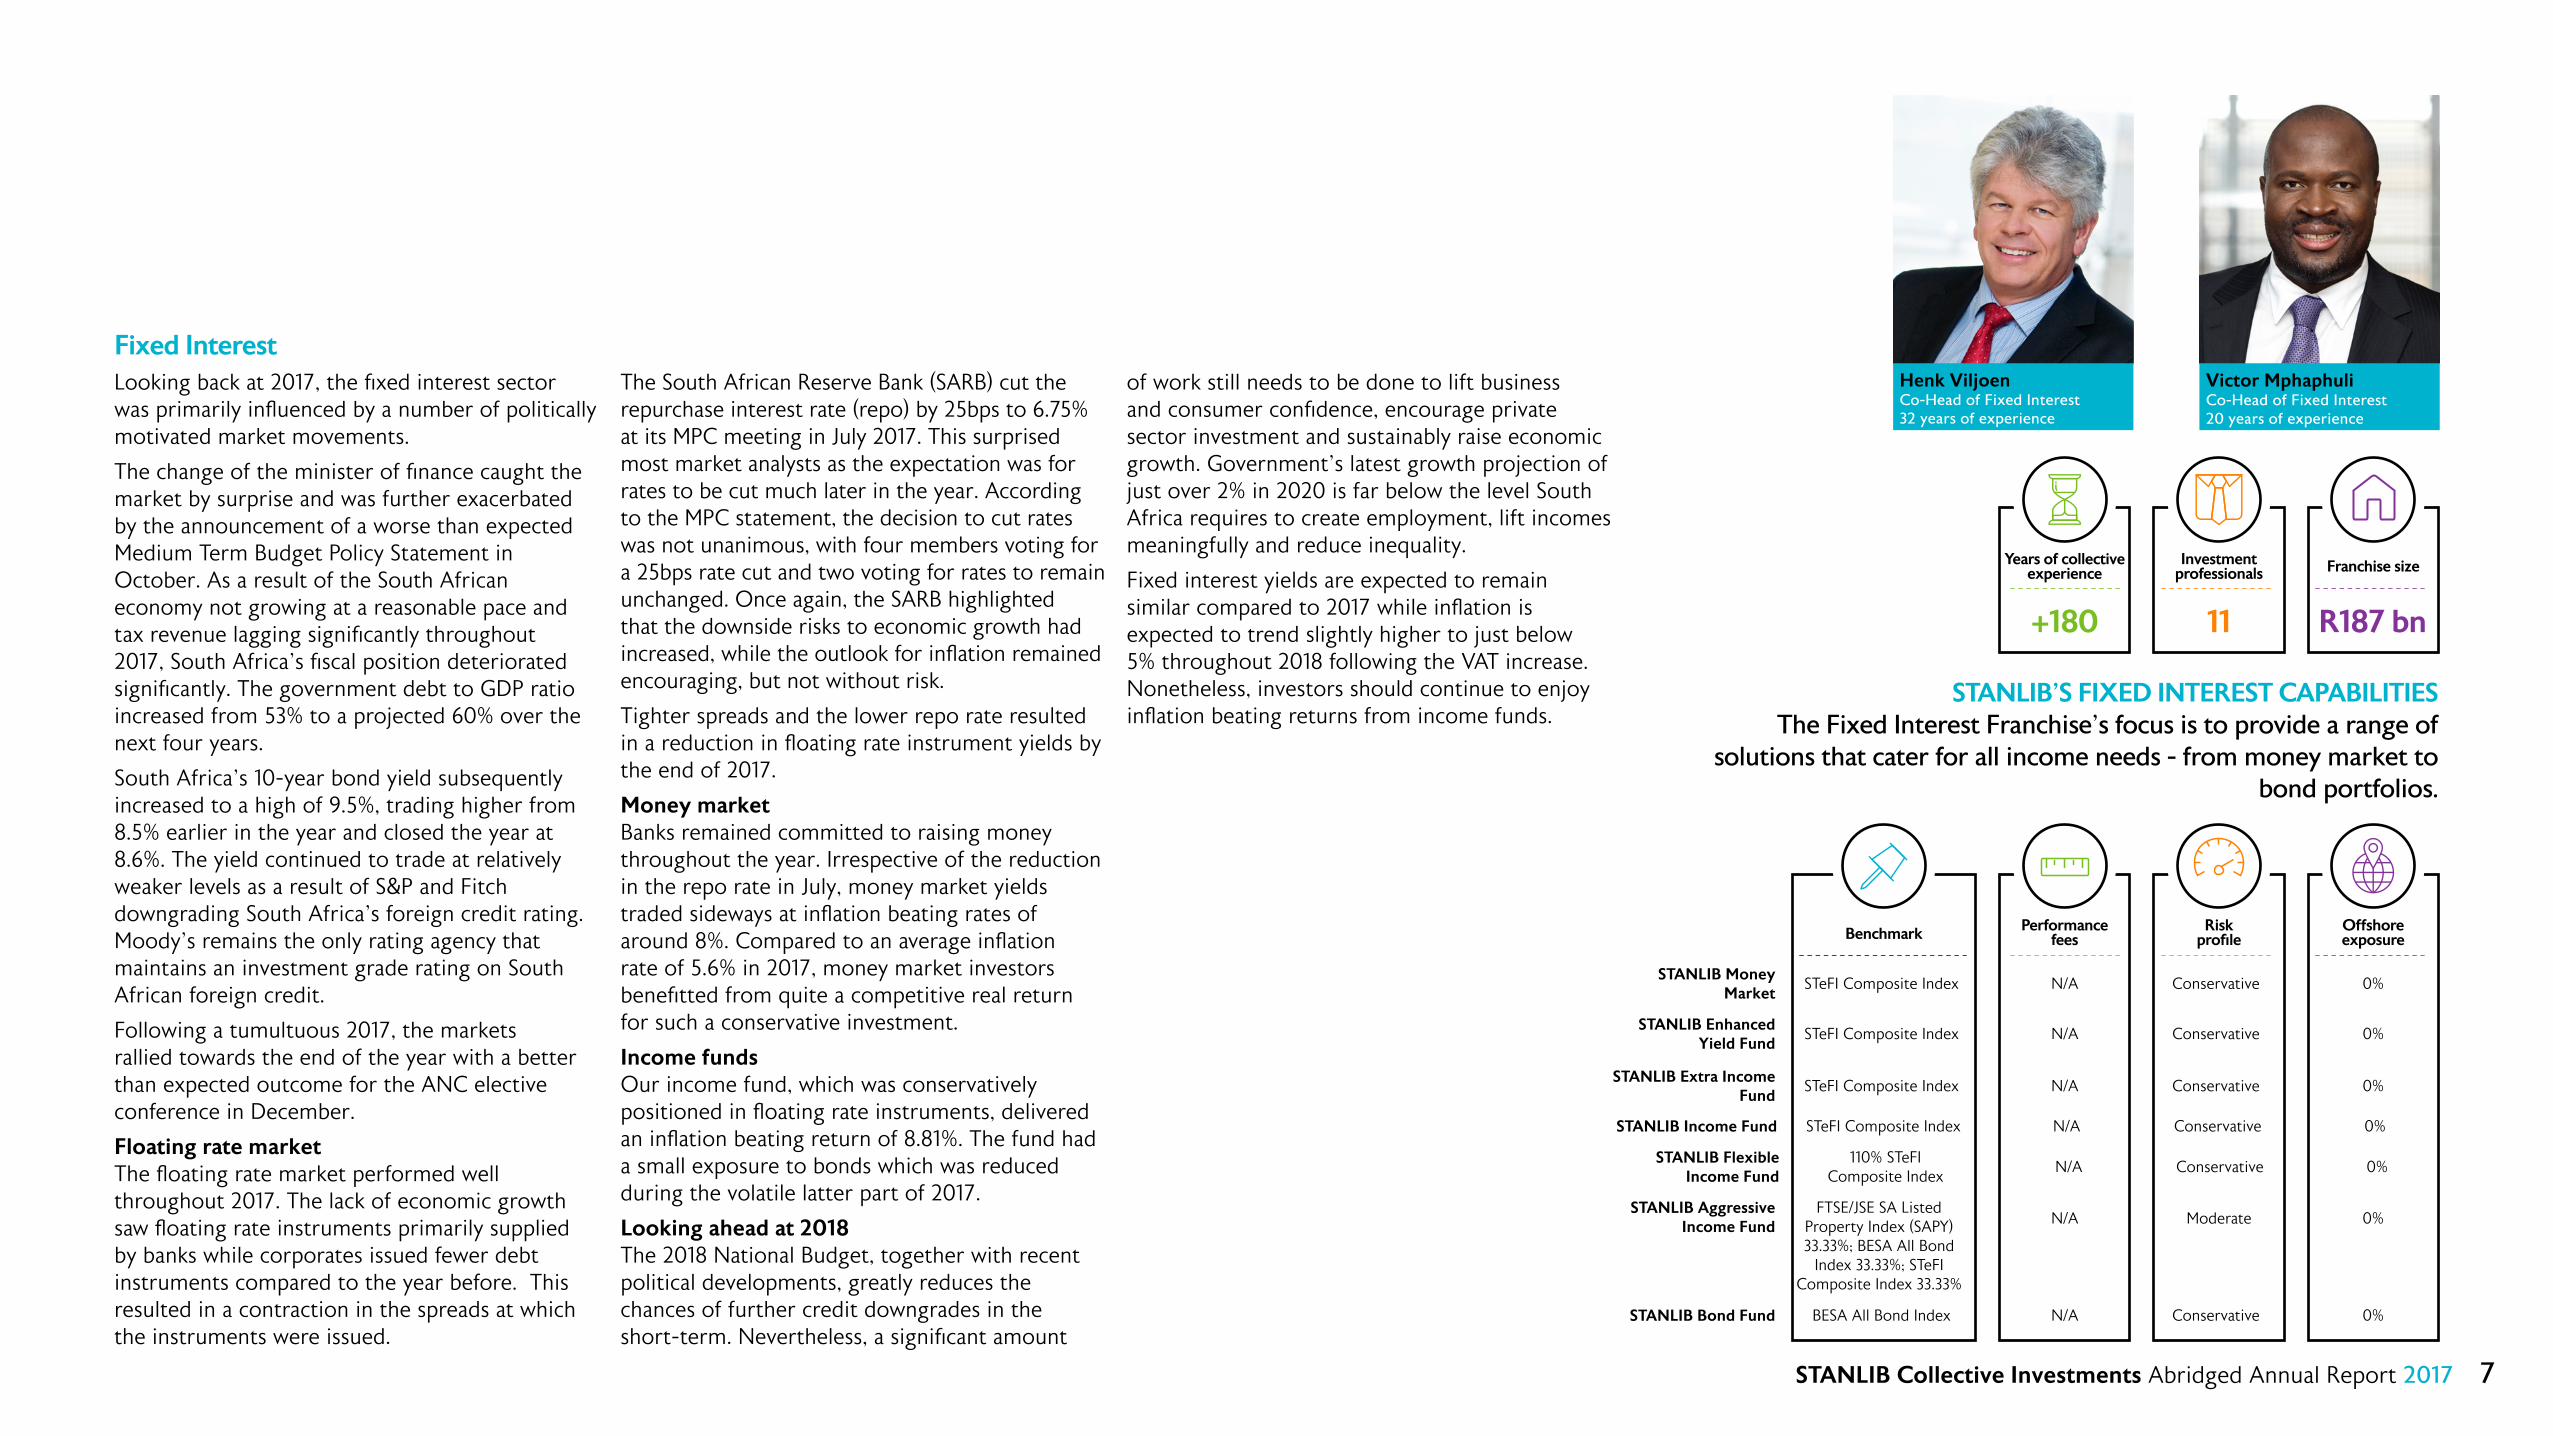
Fixed InterestLooking back at 2017, the fixed interest sector was primarily influenced by a number of politically motivated market movements.
The change of the minister of finance caught the market by surprise and was further exacerbated by the announcement of a worse than expected Medium Term Budget Policy Statement in October. As a result of the South African economy not growing at a reasonable pace and tax revenue lagging significantly throughout 2017, South Africa’s fiscal position deteriorated significantly. The government debt to GDP ratio increased from 53% to a projected 60% over the next four years.
South Africa’s 10-year bond yield subsequently increased to a high of 9.5%, trading higher from 8.5% earlier in the year and closed the year at 8.6%. The yield continued to trade at relatively weaker levels as a result of S&P and Fitch downgrading South Africa’s foreign credit rating. Moody’s remains the only rating agency that maintains an investment grade rating on South African foreign credit.
Following a tumultuous 2017, the markets rallied towards the end of the year with a better than expected outcome for the ANC elective conference in December.
Floating rate marketThe floating rate market performed well throughout 2017. The lack of economic growth saw floating rate instruments primarily supplied by banks while corporates issued fewer debt instruments compared to the year before. This resulted in a contraction in the spreads at which the instruments were issued.
The South African Reserve Bank (SARB) cut the repurchase interest rate (repo) by 25bps to 6.75% at its MPC meeting in July 2017. This surprised most market analysts as the expectation was for rates to be cut much later in the year. According to the MPC statement, the decision to cut rates was not unanimous, with four members voting for a 25bps rate cut and two voting for rates to remain unchanged. Once again, the SARB highlighted that the downside risks to economic growth had increased, while the outlook for inflation remained encouraging, but not without risk.
Tighter spreads and the lower repo rate resulted in a reduction in floating rate instrument yields by the end of 2017.
Money marketBanks remained committed to raising money throughout the year. Irrespective of the reduction in the repo rate in July, money market yields traded sideways at inflation beating rates of around 8%. Compared to an average inflation rate of 5.6% in 2017, money market investors benefitted from quite a competitive real return for such a conservative investment.
Income fundsOur income fund, which was conservatively positioned in floating rate instruments, delivered an inflation beating return of 8.81%. The fund had a small exposure to bonds which was reduced during the volatile latter part of 2017.
Looking ahead at 2018The 2018 National Budget, together with recent political developments, greatly reduces the chances of further credit downgrades in the short-term. Nevertheless, a significant amount
of work still needs to be done to lift business and consumer confidence, encourage private sector investment and sustainably raise economic growth. Government’s latest growth projection of just over 2% in 2020 is far below the level South Africa requires to create employment, lift incomes meaningfully and reduce inequality.
Fixed interest yields are expected to remain similar compared to 2017 while inflation is expected to trend slightly higher to just below 5% throughout 2018 following the VAT increase. Nonetheless, investors should continue to enjoy inflation beating returns from income funds.
Victor MphaphuliCo-Head of Fixed Interest20 years of experience
Henk ViljoenCo-Head of Fixed Interest32 years of experience
STANLIB’S FIXED INTEREST CAPABILITIESThe Fixed Interest Franchise’s focus is to provide a range of
solutions that cater for all income needs - from money market to bond portfolios.
Offshore exposure
Risk profileBenchmark Performance
fees
STANLIB Aggressive Income Fund 0%Moderate
FTSE/JSE SA Listed Property Index (SAPY) 33.33%; BESA All Bond
Index 33.33%; STeFI Composite Index 33.33%
N/A
STANLIB Flexible Income Fund
0%Conservative110% STeFI
Composite IndexN/A
STANLIB Bond Fund 0%BESA All Bond Index ConservativeN/A
STANLIB Income Fund 0%ConservativeSTeFI Composite Index N/A
STANLIB Money Market
0%ConservativeSTeFI Composite Index N/A
STANLIB Extra Income Fund
0%ConservativeSTeFI Composite Index N/A
STANLIB Enhanced Yield Fund
0%ConservativeSTeFI Composite Index N/A
Franchise sizeInvestment professionals
Years of collective experience
+180 11 R187 bn

8STANLIB Collective Investments Abridged Annual Report 2017
Abridged Annual Report 2017
Chairman’s Report

9STANLIB Collective Investments Abridged Annual Report 2017
Chairman’s Report
Investment landscapeA number of key events unfolded in 2017. South Africa was downgraded by all major credit rating agencies leaving Moody’s as the only agency maintaining an investment grade credit rating on SA sovereign credit. In addition, the South African government fiscal position came under significant pressure throughout the year while economic growth remained subdued.
Irrespective of a tumultuous end to 2017, the JSE All Share Index continued to deliver strong returns, ending December with gains of 20.95%. The All Bond
Index returned 10.22% over the same period. Global markets also performed strongly with the MSCI World Index delivering 10.6% over 12 months at the end of December 2017.
With this relentless pace of change, investors need to work hard to stay up-to-date. While the effects of some developments are easy to determine - good or bad, buy or sell – most issues are more nuanced. Knowing what it all means can make the difference between growth and loss. To help investors read the signs and make the right decisions, STANLIB created the Knowledge Centre, which tracks our latest thinking: knowledgecentre.stanlib.com.
Changes to STANLIB team structureAcross STANLIB, there has been a series of changes aimed at strengthening our proposition to clients.
In September, the Equity team took over responsibility for managing the equity portion of the Multi-Asset portfolios, a move which is in line with global best practice. This revised approach to Equity follows our multi-specialist philosophy of investing, which allows specialists in different asset classes and across industries, geographies, and markets to connect and offer deeper investment insights to clients. This allows the Multi-Asset team to focus on their core strength, which is asset allocation, while leveraging the Equity team’s stock picking expertise.
Improved STANLIB PropositionsSTANLIB Index Investments launched a suite of global index tracking funds in March 2018, each tracking
STANLIB Collective Investments
a respected international index. Approved by the Financial Services Board, these rand-denominated funds include the first passive product that covers global bonds and the US info tech space. And the first unit trust in South Africa tracking the S&P 500 Index. STANLIB is now the first passives provider in South Africa to offer a full suite of offshore building blocks to create global balanced portfolios.
In Q1 2018, STANLIB Multi-Manager launched a diversified alternatives proposition. The Multi-Manager alternatives team, which currently runs an R8 billion portfolio for Liberty that invests in a variety of non-traditional assets, plans to grow the capability by making it available to other STANLIB clients as a self-standing solution. The new third-party offering will allow qualified investors a single point of access to a variety of attractive investments that have typically been reserved for only the largest and most sophisticated investors.
STANLIB Credit Alternatives is a new capability launching this coming year to offer institutional clients access to alternative credit and debt instruments across the capital structure. The 12-strong team brings significant depth of expertise, which benefits clients looking to generate outperformance from non-traditional assets.
We continue to work hard to bring new capabilities to market for the benefit of our retail and institutional clients. Alongside strong capabilities is a focus on attracting and retaining the best talent in the market. Over the coming months we will
announce significant new roles in our business that we believe will put STANLIB upfront among the best asset managers in the country.
Update on African Bank side pocket closureSince the African Bank (ABIL) instruments became tradable on 4 April 2016, our goal has been to dispose of the assets held in retention funds (also known as side pockets) and return the proceeds to investors as soon as possible. On 23 February 2018, all remaining money held in ABIL Retention Funds was returned to investors via their original investment account.
Throughout this process, we have worked closely with the South African Reserve Bank (SARB) and African Bank’s curator to help get our clients the best possible outcome. To minimise the impact on clients, we did not charge management fees on the retention funds and we covered all the operating costs related to these funds over the three years.
More importantly, the successful implementation of the SARB plan enabled the launch of a new bank, saved thousands of jobs and ensured that we returned clients’ investments with interest.
We thank our investors for their patience as we managed this process carefully with the curator.
Fund performanceWhile we are comfortable with the performance of our fixed interest, property and offshore range of funds, we are working on improving the performance of our equity and multi-asset funds.

10STANLIB Collective Investments Abridged Annual Report 2017
Five of our core funds performed well with net positive inflows. Nine of our top 10 retail funds, which hold over 70% of our retail assets under management, were ranked 3 and above by Morningstar as at 31 December 2017.
Fund performance remains a key focus to improve our offering for clients and we have already started seeing positive results from the changes we are putting in place.
Fund optimisationIn response to investor needs and a broader industry trend away from small bespoke funds to broader asset allocation funds better suited to financial advisers’ advice process, we announced plans to simplify our fund offering towards the end of 2017. We proposed amalgamating several funds and amending some of the investment policies under the STANLIB Collective Investment Scheme.
The benefits of this process are clear. By removing duplication of funds with similar objectives and mandates, we can provide a cleaner and simpler investment offering. By lowering fixed costs and the total expense ratio (TER) of funds, we can improve returns for clients. And by promoting a more focused approach to our investment management and streamlining our operations, we can achieve better client service.
The required voting is now complete and we have begun planning the closure of the source funds and amalgamating unitholders’ investments with the target funds.
David MunroChairman
Looking aheadAt STANLIB, 2018 is the year we focus entirely on getting the basics right: servicing our customers, improving investment performance and building a winning culture. At the same time, we are putting the building blocks in place to become part of a universal financial services organisation alongside Standard Bank and Liberty that allows us to offer our clients the entire spectrum of financial solutions.
The leadership team and our teams of dedicated employees are working tirelessly on our goal of becoming a leading investment business delivering growth, predictable outcomes and financial well-being for our investors and creating opportunities that build the real economies in which we operate.
I look forward to us working together in 2018 to make STANLIB the preferred destination for asset flows destined for South Africa and other markets we serve.
Chairman’s Report

11STANLIB Collective Investments Abridged Annual Report 2017
Abridged Annual Report 2017
Trustee’s Report
12STANLIB Collective Investments Abridged Annual Report 2017

13STANLIB Collective Investments Abridged Annual Report 2017
Abridged Annual Report 2017
Shari’ah Compliance

14STANLIB Collective Investments Abridged Annual Report 2017
STANLIB Shari’ah Equity Fund Certificate of Shari’ah Compliance
To the unit holders of the STANLIB Shari’ah Equity Fund.
We, the Shari’ah Supervisory Board of the STANLIB Shari’ah Equity Fund, have conducted a review to form an opinion as to whether the STANLIB Shari’ah Equity Fund has complied with the Shari'ah rules and principles, and also with specific rulings and guidelines issued by us.
Our responsibility is to conduct a Shari’ah review of the Fund and to express an opinion whether its activities are in line with Islamic rulings and principles.
We are of the opinion that the investments and activities of the fund are in line with the Shari’ah guidelines as set out by the board.
Date: 16 February 2018
Sheikh Faizal Ahmad Manjoo (Member)
Mufti Ahmed Suliman (Member)
Suhail Mohamed (Member)
17 Melrose Boulevard, Melrose Arch, 2196. P O Box 202, Melrose Arch, 2076 T +27 (0)11 448 6000 F 086 727 7505/+27 (0)11 448 6666 E [email protected]: D T V Msibi (CEO), A P Cunningham*, M W Hlahla, D C Munro, J H Sutcliffe* (* British) Secretary: J M ParrattRegistration: STANLIB Collective Investments (RF) (Pty) Ltd Reg. No. 1969/003468/07. Liberty is a member of Association for Savings and Investment of South Africa.The Manager is a member of the Liberty group of companies. stanlib.com
STANLIB Multi-Manager Shari’ah Balanced Fund of FundsCertificate of Shari’ah Compliance
To the unit holders of the STANLIB Multi-Manager Shari’ah Balanced Fund of Funds.
We, the Shari’ah Supervisory Board of the STANLIB Multi-Manager Shari’ah Balanced Fund of Funds, have conducted a review to form an opinion as to whether the STANLIB Multi-Manager Shari’ah Balanced Fund of Funds has complied with the Shari'ah rules and principles, and also with specific rulings and guidelines issued by us.
Our responsibility is to conduct a Shari’ah review of the Fund and to express an opinion whether its activities are in line with Islamic rulings and principles.
We are of the opinion that the investments and activities of the fund are in line with the Shari’ah guidelines as set out by the board.
Date: 12 February 2018
Suhail Mohamed (Member)
Mufti Ahmed Suliman (Member)
Sheikh Faizal Ahmad Manjoo (Member)

15STANLIB Collective Investments Abridged Annual Report 2017
Abridged Annual Report 2017
Financial Statements

16STANLIB Collective Investments Abridged Annual Report 2017
STANLIB Top 40 ETF
STANLIB SWIX 40 ETF
STANLIB Property ETF
STANLIB Index Fund
Central Fundisa Fund
STANLIB Income Fund
STANLIB ALSI 40 Fund
STANLIB ConservativeFund of Fund
ETF40T ETFS40 ETFPRO F0474D FUNDSA LUINC LULAT SLCOFF
2017 2016 2017 2016 2017 2016 2017 2016 2017 2016 2017 2016 2017 2016 2017 2016
R‘000
Income statement for the year ended 31 December 2017
Distributable income for the year 17 319 16 912 48 377 48 292 7 179 5 064 12 478 12 813 24 138 20 562 2 075 037 1 738 264 27 956 31 112 66 105 63 698
Undistributed income at beginning of year (38) (61) (43) (128) (7) (8) 9 7 32 22 1 437 1 430 168 51 (88) 71
Amount available for distribution 17 281 16 851 48 334 48 164 7 172 5 056 12 487 12 820 24 170 20 584 2 076 474 1 739 694 28 124 31 163 66 017 63 769
Income distribution (17 113) (16 889) (47 500) (48 207) (7 185) (5 063) (12 464) (12 811) (24 122) (20 552) (2 075 074)
(1 738 257) (27 964) (30 995) (65 898) (63 857)
Undistributed income at end of year 168 (38) 834 (43) (13) (7) 23 9 48 32 1 400 1 437 160 168 119 (88)
Balance sheet 31 December 2017
Assets
Investments at market value 740 755 619 310 2 106 910 1 759 832 171 365 88 062 500 755 453 362 296 308 256 503 27 236 452 21 307 943 1 046 286 966 489 1 127 538 1 046 354
Current assets 723 2 115 1 688 6 758 338 1 817 14 791 12 470 1 414 1 377 384 578 668 148 22 142 15 466 2 313 10 628
Total assets 741 478 621 425 2 108 598 1 766 590 171 703 89 878 515 546 465 832 297 722 257 881 27 621 030 21 976 091 1 068 428 981 955 1 129 851 1 056 982
Liabilities
Current Liabilities 840 2 813 2 312 10 577 143 1 255 6 281 3 556 12 463 10 780 566 629 788 959 4 464 4 482 33 051 33 207
Total Liabilities 840 2 813 2 312 10 577 143 1 255 6 281 3 556 12 463 10 780 566 629 788 959 4 464 4 482 33 051 33 207
Net assets attributable to unit holders at end of year 740 638 618 612 2 106 286 1 756 014 171 560 88 623 509 265 462 277 285 259 247 101 27 054 401 21 187 132 1 063 964 977 473 1 096 800 1 023 775
17STANLIB Collective Investments Abridged Annual Report 2017
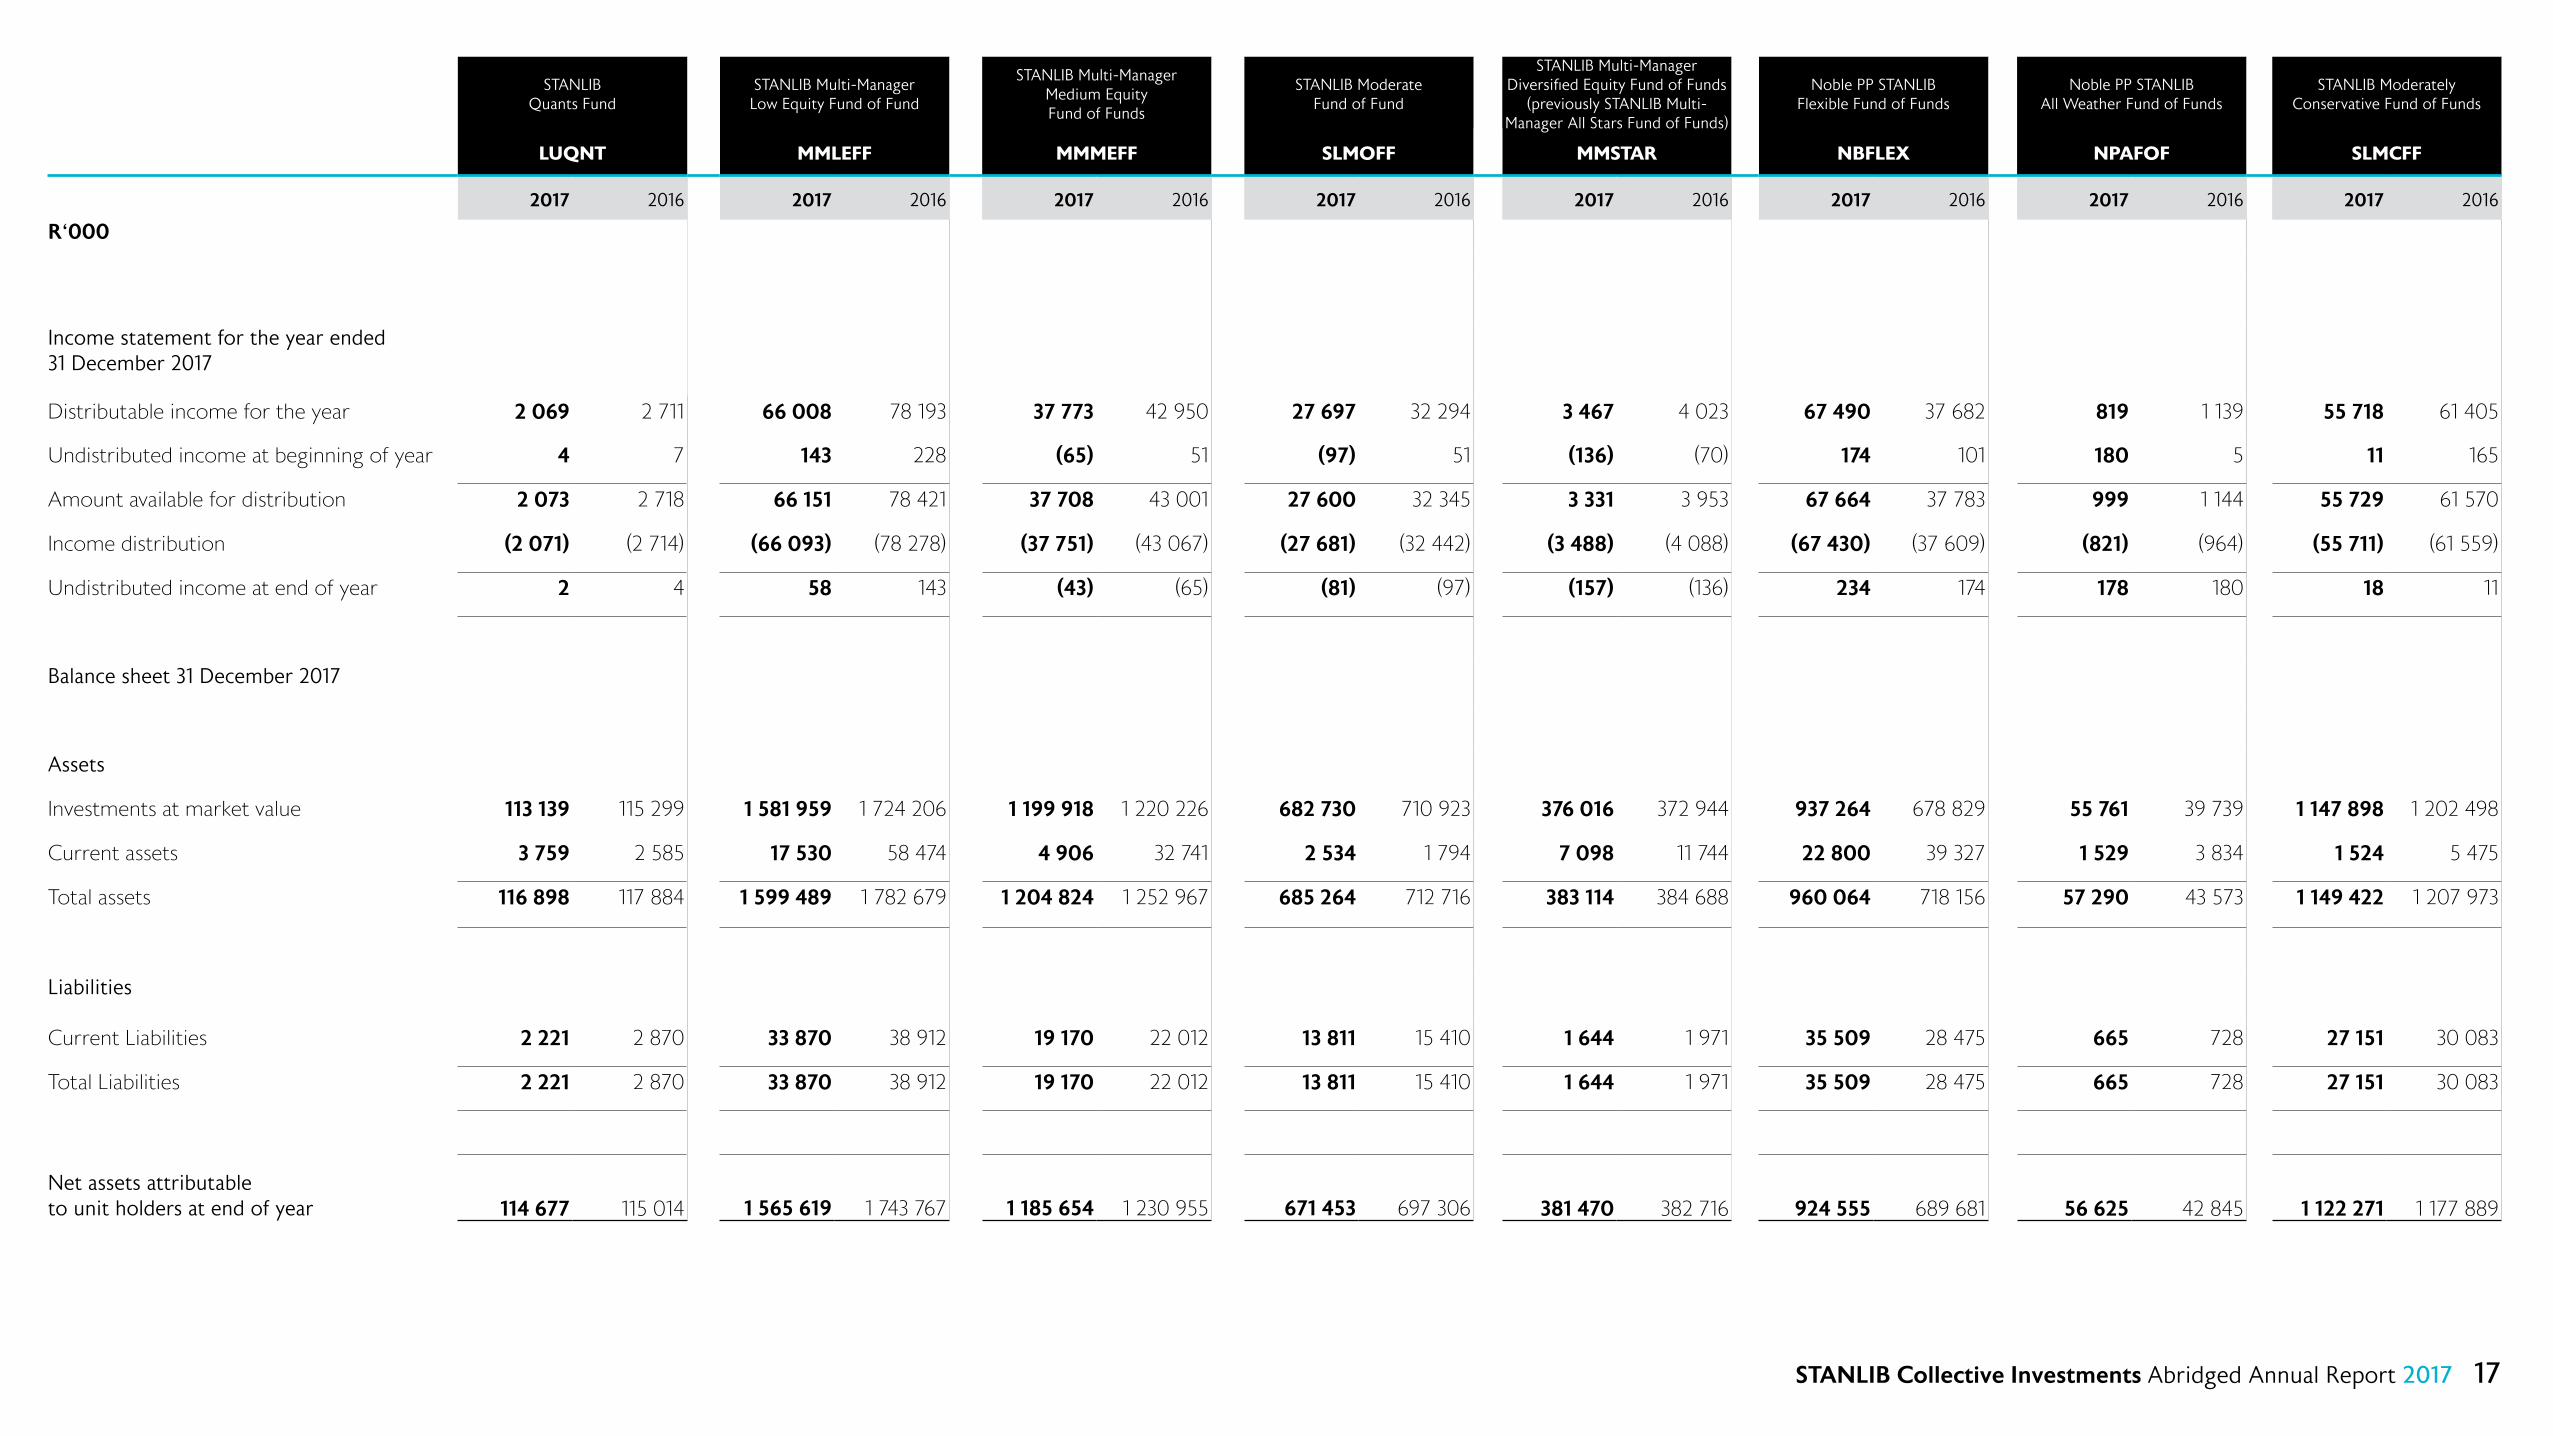
STANLIB Quants Fund
STANLIB Multi-ManagerLow Equity Fund of Fund
STANLIB Multi-Manager Medium EquityFund of Funds
STANLIB ModerateFund of Fund
STANLIB Multi-Manager Diversified Equity Fund of Funds
(previously STANLIB Multi-Manager All Stars Fund of Funds)
Noble PP STANLIBFlexible Fund of Funds
Noble PP STANLIB All Weather Fund of Funds
STANLIB Moderately Conservative Fund of Funds
LUQNT MMLEFF MMMEFF SLMOFF MMSTAR NBFLEX NPAFOF SLMCFF
2017 2016 2017 2016 2017 2016 2017 2016 2017 2016 2017 2016 2017 2016 2017 2016
R‘000
Income statement for the year ended 31 December 2017
Distributable income for the year 2 069 2 711 66 008 78 193 37 773 42 950 27 697 32 294 3 467 4 023 67 490 37 682 819 1 139 55 718 61 405
Undistributed income at beginning of year 4 7 143 228 (65) 51 (97) 51 (136) (70) 174 101 180 5 11 165
Amount available for distribution 2 073 2 718 66 151 78 421 37 708 43 001 27 600 32 345 3 331 3 953 67 664 37 783 999 1 144 55 729 61 570
Income distribution (2 071) (2 714) (66 093) (78 278) (37 751) (43 067) (27 681) (32 442) (3 488) (4 088) (67 430) (37 609) (821) (964) (55 711) (61 559)
Undistributed income at end of year 2 4 58 143 (43) (65) (81) (97) (157) (136) 234 174 178 180 18 11
Balance sheet 31 December 2017
Assets
Investments at market value 113 139 115 299 1 581 959 1 724 206 1 199 918 1 220 226 682 730 710 923 376 016 372 944 937 264 678 829 55 761 39 739 1 147 898 1 202 498
Current assets 3 759 2 585 17 530 58 474 4 906 32 741 2 534 1 794 7 098 11 744 22 800 39 327 1 529 3 834 1 524 5 475
Total assets 116 898 117 884 1 599 489 1 782 679 1 204 824 1 252 967 685 264 712 716 383 114 384 688 960 064 718 156 57 290 43 573 1 149 422 1 207 973
Liabilities
Current Liabilities 2 221 2 870 33 870 38 912 19 170 22 012 13 811 15 410 1 644 1 971 35 509 28 475 665 728 27 151 30 083
Total Liabilities 2 221 2 870 33 870 38 912 19 170 22 012 13 811 15 410 1 644 1 971 35 509 28 475 665 728 27 151 30 083
Net assets attributable to unit holders at end of year 114 677 115 014 1 565 619 1 743 767 1 185 654 1 230 955 671 453 697 306 381 470 382 716 924 555 689 681 56 625 42 845 1 122 271 1 177 889

18STANLIB Collective Investments Abridged Annual Report 2017
Noble PP STANLIBBalanced Fund of Funds
Noble PP STANLIBStrategic Fund of Funds
Nobel PP STANLIBWealth Creator Fund
of FundsSTANLIB Extra Income Fund
STANLIB InflationLinked Bond Fund
STANLIB European Equity Feeder Fund
STANLIB Aggressive Income Fund
STANLIB AggressiveFund of Funds
NPBFOF NPSFOF NPWFOF S0164I SILBND S0172I SLAINF SLAGFF
2017 2016 2017 2016 2017 2016 2017 2016 2017 2016 2017 2016 2017 2016 2017 2016
R‘000
Income statement for the year ended 31 December 2017
Distributable income for the year 31 655 29 585 36 970 23 758 9 668 11 260 634 810 567 864 53 020 56 750 3 334 4 422 159 591 151 256 1 620 2 209
Undistributed income at beginning of year 23 154 (98) 18 27 51 (954) (168) 468 261 (12 414) (16 632) 564 440 17 14
Amount available for distribution 31 678 29 739 36 872 23 776 9 695 11 311 633 856 567 696 53 488 57 011 (9 080) (12 210) 160 155 151 696 1 637 2 223
Income distribution (31 718) (29 716) (36 891) (23 874) (9 691) (11 284) (633 848) (568 650) (53 183) (56 544) (38) (205) (159 740) (151 132) (1 626) (2 206)
Undistributed income at end of year (40) 23 (19) (98) 4 27 8 (954) 305 468 (9 118) (12 414) 415 564 11 17
Balance sheet 31 December 2017
Assets
Investments at market value 819 914 946 069 657 336 701 925 327 670 345 645 7 854 762 6 266 655 1 174 763 1 789 174 522 216 413 272 2 187 591 2 138 347 84 182 80 288
Current assets 21 423 1 497 5 525 15 290 29 784 17 768 205 148 284 777 32 738 13 869 14 276 4 203 29 922 29 242 1 066 1 911
Total assets 841 337 947 567 662 861 717 215 357 454 363 413 8 059 910 6 551 432 1 207 501 1 803 043 536 492 417 474 2 217 513 2 167 590 85 248 82 198
Liabilities
Current Liabilities 17 772 14 689 4 014 4 360 5 376 6 889 55 222 48 796 10 537 14 408 543 713 41 342 38 343 819 897
Total Liabilities 17 772 14 689 4 014 4 360 5 376 6 889 55 222 48 796 10 537 14 408 543 713 41 342 38 343 819 897
Net assets attributable to unit holders at end of year 823 565 932 877 658 847 712 855 352 078 356 524 8 004 688 6 502 636 1 196 964 1 788 635 535 949 416 762 2 176 171 2 129 247 84 429 81 302

19STANLIB Collective Investments Abridged Annual Report 2017
Standard Bank Institutional Money Market Fund
STANLIB InflationPlus 5% Fund
STANLIB Global Emerging Market Property Feeder
Fund
STANLIB Enhanced Yield Fund (Previously STANLIB
Cash Plus Fund)
STANLIB Euro CurrencyFund of Funds
STANLIB Global BondFeeder Fund
STANLIB Global Balanced Cautious Feeder Fund
STANLIB Global Balanced Feeder Fund Previously
(STANLIB International Balanced Fund of Funds)
S0200I S2001I SGEMPF SLCASH SLECFF S2007I S2008I S2009I
2017 2016 2017 2016 2017 2016 2017 2016 2017 2016 2017 2016 2017 2016 2017 2016
R‘000
Income statement for the year ended 31 December 2017
Distributable income for the year 1 462 708 1 192 571 26 116 40 317 32 534 295 941 256 764 278 235 761 1 756 3 677 5 320 4 007 4 919
Undistributed income at beginning of year - - 192 198 (862) (1 396) 295 226 (523) (758) (847) (1 124) (16 159) (20 981) (22 829) (27 748)
Amount available for distribution 1 462 708 1 192 571 26 308 40 515 (830) (862) 296 236 256 990 (245) (523) (86) 632 (12 482) (15 661) (18 822) (22 829)
Income distribution (1 462 708) (1 192 571) (26 297) (40 323) - - (296 112) (256 694) - - (777) (1 479) - (497) - -
Undistributed income at end of year - - 11 192 (830) (862) 124 295 (245) (523) (863) (847) (12 482) (16 159) (18 822) (22 829)
Balance sheet 31 December 2017
Assets
Investments at market value 15 600 671 12 963 215 282 331 836 076 52 927 63 953 3 491 786 3 154 200 42 065 38 982 631 736 622 399 254 414 351 765 690 843 711 693
Current assets 1 248 569 2 285 356 14 798 76 260 6 886 1 338 193 988 222 866 1 496 1 216 18 512 14 137 10 108 3 331 16 666 723
Total assets 16 849 240 15 248 571 297 129 912 337 59 813 65 291 3 685 774 3 377 066 43 561 40 198 650 248 636 537 264 522 355 096 707 509 712 416
Liabilities
Current Liabilities 121 795 109 228 6 323 17 936 47 101 23 881 23 318 47 43 486 939 261 929 628 800
Total Liabilities 121 795 109 228 6 323 17 936 47 101 23 881 23 318 47 43 486 939 261 929 628 800
Net assets attributable to unit holders at end of year 16 727 445 15 139 343 290 806 894 400 59 766 65 190 3 661 893 3 353 749 43 514 40 155 649 762 635 597 264 261 354 167 706 881 711 616
20STANLIB Collective Investments Abridged Annual Report 2017
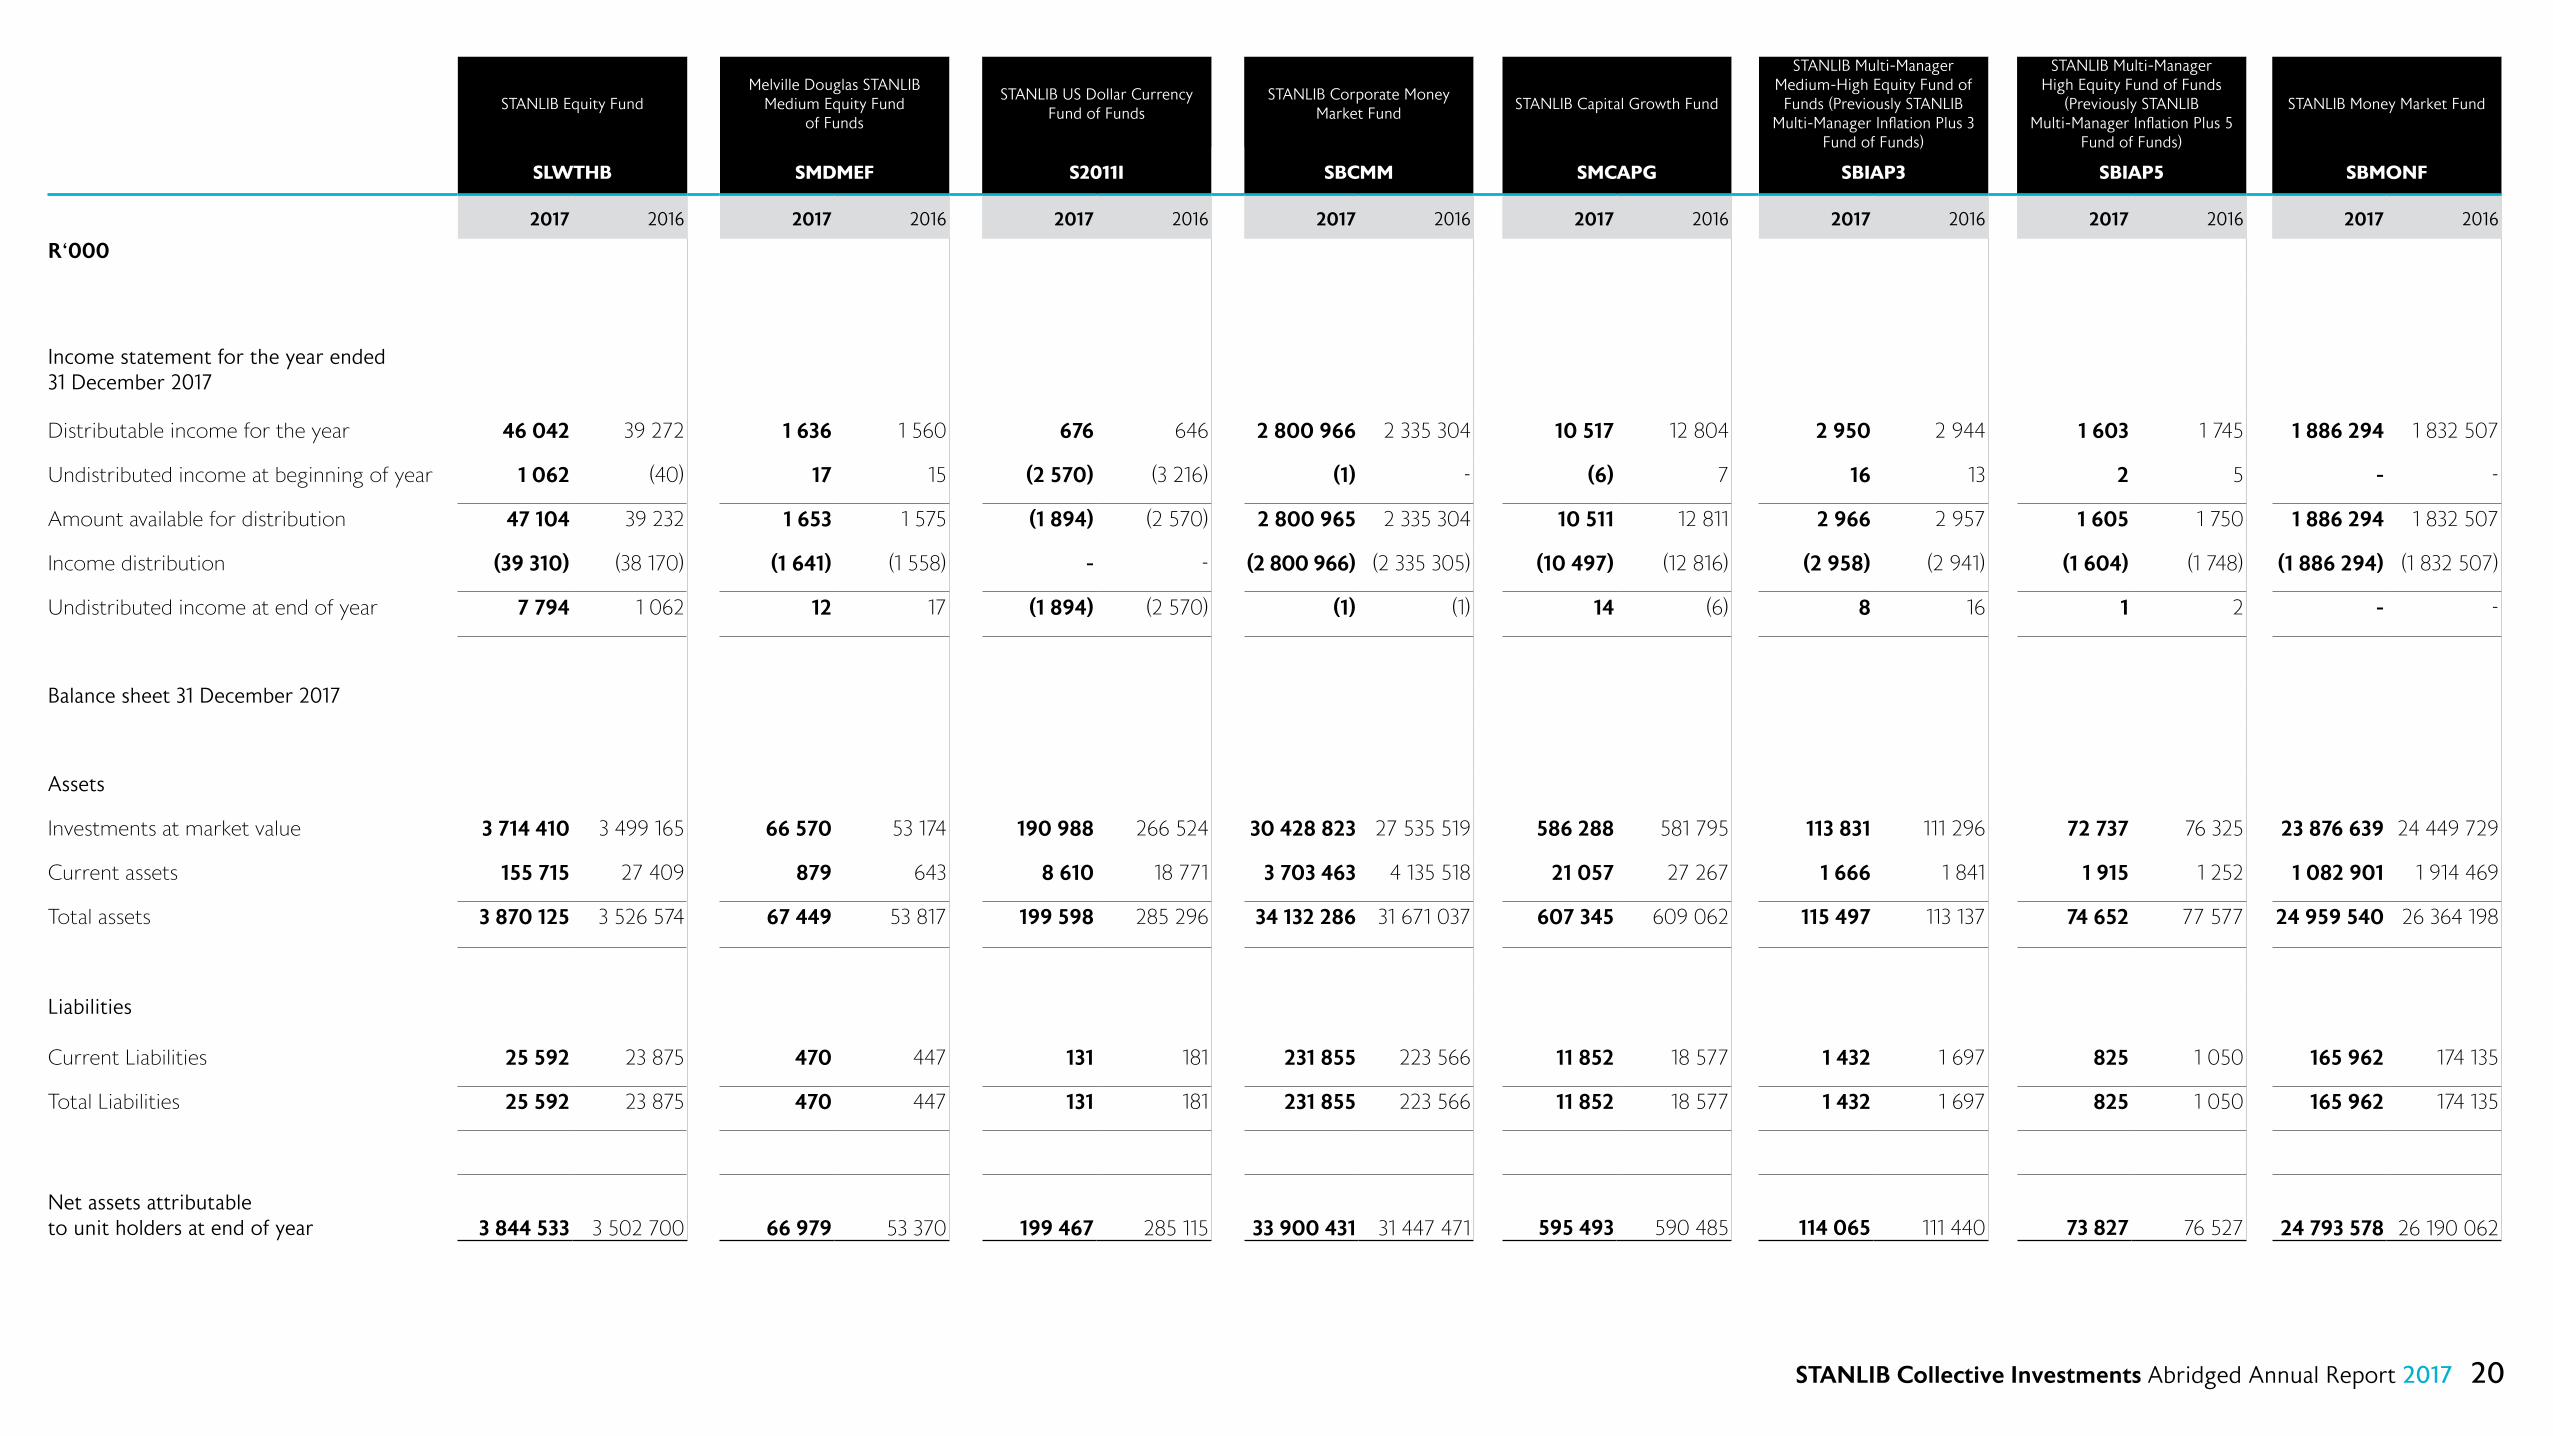
STANLIB Equity FundMelville Douglas STANLIB
Medium Equity Fund of Funds
STANLIB US Dollar CurrencyFund of Funds
STANLIB Corporate Money Market Fund
STANLIB Capital Growth Fund
STANLIB Multi-Manager Medium-High Equity Fund of
Funds (Previously STANLIB Multi-Manager Inflation Plus 3
Fund of Funds)
STANLIB Multi-Manager High Equity Fund of Funds
(Previously STANLIB Multi-Manager Inflation Plus 5
Fund of Funds)
STANLIB Money Market Fund
SLWTHB SMDMEF S2011I SBCMM SMCAPG SBIAP3 SBIAP5 SBMONF
2017 2016 2017 2016 2017 2016 2017 2016 2017 2016 2017 2016 2017 2016 2017 2016
R‘000
Income statement for the year ended 31 December 2017
Distributable income for the year 46 042 39 272 1 636 1 560 676 646 2 800 966 2 335 304 10 517 12 804 2 950 2 944 1 603 1 745 1 886 294 1 832 507
Undistributed income at beginning of year 1 062 (40) 17 15 (2 570) (3 216) (1) - (6) 7 16 13 2 5 - -
Amount available for distribution 47 104 39 232 1 653 1 575 (1 894) (2 570) 2 800 965 2 335 304 10 511 12 811 2 966 2 957 1 605 1 750 1 886 294 1 832 507
Income distribution (39 310) (38 170) (1 641) (1 558) - - (2 800 966) (2 335 305) (10 497) (12 816) (2 958) (2 941) (1 604) (1 748) (1 886 294) (1 832 507)
Undistributed income at end of year 7 794 1 062 12 17 (1 894) (2 570) (1) (1) 14 (6) 8 16 1 2 - -
Balance sheet 31 December 2017
Assets
Investments at market value 3 714 410 3 499 165 66 570 53 174 190 988 266 524 30 428 823 27 535 519 586 288 581 795 113 831 111 296 72 737 76 325 23 876 639 24 449 729
Current assets 155 715 27 409 879 643 8 610 18 771 3 703 463 4 135 518 21 057 27 267 1 666 1 841 1 915 1 252 1 082 901 1 914 469
Total assets 3 870 125 3 526 574 67 449 53 817 199 598 285 296 34 132 286 31 671 037 607 345 609 062 115 497 113 137 74 652 77 577 24 959 540 26 364 198
Liabilities
Current Liabilities 25 592 23 875 470 447 131 181 231 855 223 566 11 852 18 577 1 432 1 697 825 1 050 165 962 174 135
Total Liabilities 25 592 23 875 470 447 131 181 231 855 223 566 11 852 18 577 1 432 1 697 825 1 050 165 962 174 135
Net assets attributable to unit holders at end of year 3 844 533 3 502 700 66 979 53 370 199 467 285 115 33 900 431 31 447 471 595 493 590 485 114 065 111 440 73 827 76 527 24 793 578 26 190 062

21STANLIB Collective Investments Abridged Annual Report 2017
STANLIB Multi-Manager Property Fund
STANLIB PropertyIncome Fund
STANLIB Multi-Manager Absolute Income Fund
STANLIB BalancedCautious Fund
STANLIB Africa IncomeFund
Standard Bank FundisaFund
STANLIB InflationPlus 3% Fund
STANLIB Moderately Aggressive Fund of Funds
SBMPFZ SBPIF SMMAIF SLBALC STBAIF SLFUNS SLINFB SLMAFF
2017 2016 2017 2016 2017 2016 2017 2016 2017 2016 2017 2016 2017 2016 2017 2016
R‘000
Income statement for the year ended 31 December 2017
Distributable income for the year 192 787 203 327 376 419 381 180 73 697 76 698 289 960 394 860 9 395 9 655 14 108 11 186 41 600 41 033 5 634 6 615
Undistributed income at beginning of year 92 114 555 289 151 217 2 901 2 246 27 15 15 14 345 223 29 27
Amount available for distribution 192 879 203 441 376 974 381 469 73 848 76 915 292 861 397 106 9 422 9 670 14 123 11 200 41 945 41 256 5 663 6 642
Income distribution (192 791) (203 349) (376 592) (380 914) (73 766) (76 765) (290 444) (394 205) (9 394) (9 643) (14 110) (11 186) (41 626) (40 912) (5 635) (6 613)
Undistributed income at end of year 88 92 382 555 82 151 2 417 2 901 28 27 13 15 319 345 28 29
Balance sheet 31 December 2017
Assets
Investments at market value 3 427 671 3 490 926 8 168 748 7 286 190 851 286 950 426 6 852 446 9 177 216 160 414 223 924 188 768 163 157 679 439 691 865 194 108 189 984
Current assets 100 164 31 233 30 306 10 598 42 748 52 788 444 617 258 967 16 293 36 181 820 4 890 70 737 36 053 4 135 2 631
Total assets 3 527 835 3 522 159 8 199 054 7 296 787 894 034 1 003 214 7 297 063 9 436 183 176 707 260 105 189 588 168 047 750 176 727 918 198 243 192 616
Liabilities
Current Liabilities 98 781 45 496 82 282 88 845 25 279 19 758 68 250 143 635 2 423 7 419 7 553 6 466 21 047 23 059 2 800 3 000
Total Liabilities 98 781 45 496 82 282 88 845 25 279 19 758 68 250 143 635 2 423 7 419 7 553 6 466 21 047 23 059 2 800 3 000
Net assets attributable to unit holders at end of year 3 429 054 3 476 663 8 116 772 7 207 943 868 755 983 456 7 228 813 9 292 548 174 284 252 686 182 035 161 581 729 129 704 859 195 443 189 616

22STANLIB Collective Investments Abridged Annual Report 2017
STANLIB Value Fund STANLIB Balanced FundSTANLIB MedicalInvestment Fund
STANLIB Multi-ManagerBond Fund
STANLIB Africa PropertyFund
Melville Douglas STANLIB High Alpha Fund
STANLIB Financials FundSTANLIB Multi-Manager Defensive Balanced Fund
SMVALF SMSTAB SLMEDF SMMBND STDPRP SMDAEF SMFINF SMMDBF
2017 2016 2017 2016 2017 2016 2017 2016 2017 2016 2017 2016 2017 2016 2017 2016
R‘000
Income statement for the year ended 31 December 2017
Distributable income for the year 16 959 29 179 146 041 215 917 30 699 26 142 366 607 388 250 3 237 6 801 943 988 3 258 3 410 116 495 72 235
Undistributed income at beginning of year 15 30 115 150 10 52 435 357 41 61 13 7 3 4 1 054 686
Amount available for distribution 16 974 29 209 146 156 216 067 30 709 26 194 367 042 388 607 3 278 6 862 956 995 3 261 3 414 117 549 72 921
Income distribution (16 975) (29 194) (145 983) (215 952) (30 648) (26 184) (366 462) (388 172) (3 278) (6 820) (949) (982) (3 259) (3 411) (116 593) (71 867)
Undistributed income at end of year (1) 15 173 115 61 10 580 435 0 41 7 13 2 3 956 1 054
Balance sheet 31 December 2017
Assets
Investments at market value 787 249 936 033 5 554 826 6 244 249 444 926 439 324 4 277 127 4 429 166 66 065 310 118 66 582 65 112 105 150 99 137 2 446 725 2 028 253
Current assets 9 480 11 767 253 194 249 788 67 442 61 162 234 418 227 774 20 422 15 439 1 518 1 509 5 556 4 860 177 030 508 559
Total assets 796 729 947 801 5 808 020 6 494 036 512 368 500 487 4 511 545 4 656 939 86 487 325 558 68 100 66 621 110 706 103 997 2 623 755 2 536 812
Liabilities
Current Liabilities 17 429 30 277 73 809 249 735 7 748 7 672 426 978 432 985 1 472 3 276 610 635 3 415 3 542 23 760 34 711
Total Liabilities 17 429 30 277 73 809 249 735 7 748 7 672 426 978 432 985 1 472 3 276 610 635 3 415 3 542 23 760 34 711
Net assets attributable to unit holders at end of year 779 300 917 523 5 734 211 6 244 301 504 620 492 815 4 084 567 4 223 955 85 015 322 282 67 490 65 986 107 291 100 455 2 599 995 2 502 101

23STANLIB Collective Investments Abridged Annual Report 2017
STANLIB Industrial FundSTANLIB Global Property
Feeder FundSTANLIB Multi-Manager
Enhanced Yield FundSTANLIB Multi-Manager
Balanced FundSTANLIB Resources Fund
STANLIB Balanced Trustees Fund of Funds
Melville Douglas STANLIB Dynamic Strategy Fund
STANLIB Flexible Income Fund
SMINDF SMINTP SMMEYF SMMBAF SMRESF STBTFF STDMDS STFIF
2017 2016 2017 2016 2017 2016 2017 2016 2017 2016 2017 2016 2017 2016 2017 2016
R‘000
Income statement for the year ended 31 December 2017
Distributable income for the year 11 538 14 128 8 721 3 509 141 093 189 269 151 652 145 640 12 511 3 451 24 442 32 114 4 600 3 346 101 298 72 800
Undistributed income at beginning of year 5 10 (62 386) (65 895) 31 173 (73) 275 (34) (13) (245) (113) (2) - 298 201
Amount available for distribution 11 543 14 138 (53 665) (62 386) 141 124 189 442 151 579 145 915 12 477 3 438 24 197 32 001 4 598 3 346 101 596 73 001
Income distribution (11 543) (14 133) 0 0 (141 101) (189 411) (151 616) (145 989) (12 463) (3 472) (24 438) (32 246) (4 597) (3 349) (101 187) (72 702)
Undistributed income at end of year 0 5 (53 665) (62 386) 23 31 (37) (73) 14 (34) (241) (245) 1 (2) 409 298
Balance sheet 31 December 2017
Assets
Investments at market value 926 547 949 616 2 199 594 2 722 943 1 569 586 1 800 814 4 820 859 4 664 769 506 224 527 202 537 909 562 152 176 546 123 037 1 566 659 953 783
Current assets 10 121 3 866 37 230 22 937 49 734 43 211 195 042 200 858 44 515 23 223 3 203 1 513 7 451 3 558 27 821 42 411
Total assets 936 668 953 482 2 236 824 2 745 880 1 619 320 1 844 026 5 015 901 4 865 628 550 739 550 425 541 112 563 666 183 997 126 596 1 594 480 996 195
Liabilities
Current Liabilities 12 490 15 206 1 444 1 846 8 526 10 794 86 977 113 055 9 213 2 680 136 208 6 964 966 31 422 42 558
Total Liabilities 12 490 15 206 1 444 1 846 8 526 10 794 86 977 113 055 9 213 2 680 136 208 6 964 966 31 422 42 558
Net assets attributable to unit holders at end of year 924 178 938 276 2 235 380 2 744 034 1 610 794 1 833 232 4 928 924 4 752 573 541 526 547 745 540 976 563 457 177 033 125 629 1 563 058 953 637

24STANLIB Collective Investments Abridged Annual Report 2017
STANLIB SA Equity Fund
Melville Douglas STANLIB Bond Fund
STANLIB Shari’ah Equity Fund
STANLIB Prudential Bond Fund STANLIB Bond FundSTANLIB Multi-Manager Flexible Property Fund
STANLIB Absolute Plus Fund Previously (STANLIB
Dynamic Return Fund)
STANLIB Multi-Manager Global Equity Feeder
Fund
SMPROS SMDMBF SLSHAR SMCORB SMBOND SLMMFP SLDRRF SLMIFF
2017 2016 2017 2016 2017 2016 2017 2016 2017 2016 2017 2016 2017 2016 2017 2016
R‘000
Income statement for the year ended 31 December 2017
Distributable income for the year 38 684 38 094 115 959 81 974 9 881 11 657 181 886 196 406 299 257 309 820 89 732 87 807 205 640 110 317 7 803 10 619
Undistributed income at beginning of year 43 56 302 95 36 41 300 199 124 116 249 225 442 365 (27 457) (38 076)
Amount available for distribution 38 727 38 150 116 261 82 069 9 917 11 698 182 186 196 605 299 381 309 936 89 981 88 032 206 082 110 682 (19 654) (27 457)
Income distribution (38 701) (38 107) (115 948) (81 767) (9 858) (11 662) (182 005) (196 306) (299 248) (309 812) (89 812) (87 783) (205 078) (110 240) - -
Undistributed income at end of year 26 43 313 302 59 36 181 300 133 124 169 249 1 004 442 (19 654) (27 457)
Balance sheet 31 December 2017
Assets
Investments at market value 1 919 095 1 864 684 1 351 701 1 150 446 425 399 458 858 1 951 900 2 184 159 3 304 312 3 453 918 1 574 178 1 480 450 4 357 492 1 723 437 895 403 823 320
Current assets 70 680 51 662 70 959 89 837 35 688 13 276 70 554 114 688 260 437 135 589 23 941 63 031 303 671 117 411 17 551 4 952
Total assets 1 989 775 1 916 346 1 422 660 1 240 283 461 087 472 134 2 022 454 2 298 847 3 564 749 3 589 508 1 598 119 1 543 481 4 661 163 1 840 849 912 954 828 272
Liabilities
Current Liabilities 24 116 21 324 29 754 25 846 5 006 4 602 91 319 106 387 77 322 87 963 20 631 19 944 137 338 55 096 513 653
Total Liabilities 24 116 21 324 29 754 25 846 5 006 4 602 91 319 106 387 77 322 87 963 20 631 19 944 137 338 55 096 513 653
Net assets attributable to unit holders at end of year 1 965 659 1 895 022 1 392 906 1 214 437 456 081 467 531 1 931 135 2 192 459 3 487 427 3 501 544 1 577 488 1 523 537 4 523 825 1 785 752 912 441 827 619

25STANLIB Collective Investments Abridged Annual Report 2017
STANLIB Multi-Manager Real Return Fund (Previously STANLIB
Multi-Manager Real Return Feeder Fund
STANLIB Global Equity Feeder Fund
STANLIB Institutional Property Fund
STANLIB Multi-Manager Equity Fund
STANLIB Africa Equity Fund
STANLIB ALBI (Non-TR) Index Tracker Fund
STANLIB Multi-Manager Shariah Balanced Fund of Fund
STANLIB Capped Property Index Tracker Fund
SLMMRP SMIEFF SMISTP SMMEQT STDAFR STAITF SMMSBF SCPITF
2017 2016 2017 2016 2017 2016 2017 2016 2017 2016 2017 2016 2017 2016 2017 2016
R‘000
Income statement for the year ended 31 December 2017
Distributable income for the year 40 479 46 029 28 720 15 438 416 553 287 870 250 874 575 234 3 379 3 312 10 310 10 262 3 268 1 121 3 758 3 822
Undistributed income at beginning of year 81 133 (91 197) (104 371) 336 331 (7) 200 (2 772) (6 084) (2) 1 131 46 (14) 7
Amount available for distribution 40 560 46 162 (62 477) (88 933) 416 889 288 201 250 867 575 434 607 (2 772) 10 308 10 263 3 399 1 167 3 744 3 829
Income distribution (40 493) (46 081) (691) (2 264) (416 511) (287 865) (250 833) (575 441) - - (10 304) (10 266) (3 218) (1 036) (3 758) (3 842)
Undistributed income at end of year 67 81 (63 168) (91 197) 378 336 34 (7) 607 (2 772) 4 (2) 181 131 (14) (14)
Balance sheet 31 December 2017
Assets
Investments at market value 1 120 253 1 164 271 2 847 806 2 450 524 8 000 809 5 596 401 9 298 940 9 559 704 64 179 83 057 123 342 135 413 416 921 158 519 84 116 74 437
Current assets 28 930 70 011 142 851 86 282 291 449 30 701 522 238 155 283 1 735 12 469 3 506 3 994 2 421 1 398 94 910
Total assets 1 149 183 1 234 283 2 990 657 2 536 806 8 292 258 5 627 103 9 821 178 9 714 987 65 914 95 526 126 848 139 408 419 342 159 916 84 210 75 347
Liabilities
Current Liabilities 21 452 23 724 2 182 5 059 200 448 78 131 270 312 409 645 170 358 2 683 2 961 2 362 859 879 737
Total Liabilities 21 452 23 724 2 182 5 059 200 448 78 131 270 312 409 645 170 358 2 683 2 961 2 362 859 879 737
Net assets attributable to unit holders at end of year 1 127 731 1 210 559 2 988 475 2 531 747 8 091 810 5 548 971 9 550 866 9 305 342 65 744 95 167 124 165 136 447 416 980 159 057 83 331 74 610

26STANLIB Collective Investments Abridged Annual Report 2017
STANLIB Inflation Linked Bond Index Tracker Fund
Melville Douglas STANLIB Global Equity Feeder Fund
Standard STANLIB GoalAdvancer Fund of Funds
Standard STANLIB GoalBuilder Fund of Funds
Standard STANLIB GoalConserver Fund
of Funds
Standard STANLIB GoalDefender Fund
of Funds
Standard STANLIB GoalConserver Passive Fund
of Funds
Standard STANLIB GoalAdvancer Passive Fund
of Funds
SILBIT SMDGFF STGAFF STGBFF STGCFF STGDFF STGNFF STGPFF
2017 2016 2017 2016 2017 2016 2017 2016 2017 2016 2017 2016 2017 2016 2017 2016
R‘000
Income statement for the year ended 31 December 2017
Distributable income for the year 4 612 1 035 401 6 1 032 35 7 334 40 17 800 13 16 803 71 166 38 124 27
Undistributed income at beginning of year (0) - 0 (6) (2) (36) (4) (42) 4 2 4 2 2 1 0 1
Amount available for distribution 4 612 1 035 401 0 1 030 (1) 7 330 (2) 17 804 15 16 807 73 168 39 124 28
Income distribution (4 597) (1 035) - - (954) (1) (7 176) (2) (17 612) (11) (16 665) (69) (167) (37) (124) (28)
Undistributed income at end of year 15 (0) 401 0 76 (2) 154 (4) 192 4 142 4 1 2 0 0
Balance sheet 31 December 2017
Assets
Investments at market value 459 188 52 926 13 725 1 030 120 772 14 143 446 103 31 276 693 695 34 579 508 703 18 908 4 380 3 950 6 775 5 896
Current assets 5 228 811 1 206 29 42 124 1 726 980 4 068 460 2 690 1 028 21 60 32 64
Total assets 464 416 53 736 14 931 1 059 120 814 14 267 447 829 32 256 697 763 35 039 511 393 19 936 4 401 4 010 6 807 5 960
Liabilities
Current Liabilities 4 153 396 10 (0) 1 089 23 6 341 40 13 993 51 7 940 92 98 44 91 37
Total Liabilities 4 153 396 10 (0) 1 089 23 6 341 40 13 993 51 7 940 92 98 44 91 37
Net assets attributable to unit holders at end of year 460 263 53 340 14 921 1 060 119 725 14 244 441 488 32 216 683 770 34 988 503 453 19 845 4 303 3 965 6 716 5 923

27STANLIB Collective Investments Abridged Annual Report 2017
Standard STANLIB GoalBuilder Passive Fund
of Funds
Standard STANLIB GoalAccelerator Fund
of Funds
Standard STANLIB Equity Fund
Standard STANLIB Property Fund
Standard STANLIB Bond Fund
Standard STANLIB Yield Plus Fund
STANLIB Low Equity Balanced Passive Fund
of Funds
STANLIB High Equity Balanced Passive Fund
of Funds
STGSFF STGZFF STSEFD STSPRF STSBNF STSYPF SLEBFF SHEBFF
2017 2016 2017 2016 2017 2016 2017 2016 2017 2016 2017 2016 2017 2016 2017 2016
R‘000
Income statement for the year ended 31 December 2017
Distributable income for the year 153 35 44 47 8 417 70 6 899 154 26 767 2 109 29 551 1 352 1 480 354 1 605 951
Undistributed income at beginning of year 3 1 (1) (47) (2) - 6 3 18 9 18 9 4 2 34 17
Amount available for distribution 156 36 43 (0) 8 415 70 6 905 157 26 785 2 118 29 569 1 361 1 484 356 1 639 968
Income distribution (155) (34) (20) (0) (8 390) (72) (6 885) (151) (26 772) (2 100) (29 561) (1 342) (1 471) (352) (1 612) (934)
Undistributed income at end of year 1 3 23 (1) 25 (2) 20 6 13 18 8 18 13 4 27 34
Balance sheet 31 December 2017
Assets
Investments at market value 5 595 4 948 52 348 13 121 414 937 36 266 208 360 16 822 488 132 104 391 686 545 75 669 47 761 18 669 66 602 59 275
Current assets 21 49 251 27 18 019 4 703 7 469 2 452 29 912 7 700 5 091 5 903 786 935 2 967 1 023
Total assets 5 616 4 997 52 599 13 147 432 956 40 968 215 829 19 274 518 044 112 090 691 636 81 572 48 547 19 604 69 569 60 297
Liabilities
Current Liabilities 97 45 91 22 11 232 982 2 256 183 25 867 4 685 14 357 439 403 171 289 234
Total Liabilities 97 45 91 22 11 232 982 2 256 183 25 867 4 685 14 357 439 403 171 289 234
Net assets attributable to unit holders at end of year 5 519 4 952 52 508 13 125 421 724 39 986 213 573 19 091 492 177 107 406 677 279 81 133 48 144 19 433 69 280 60 064
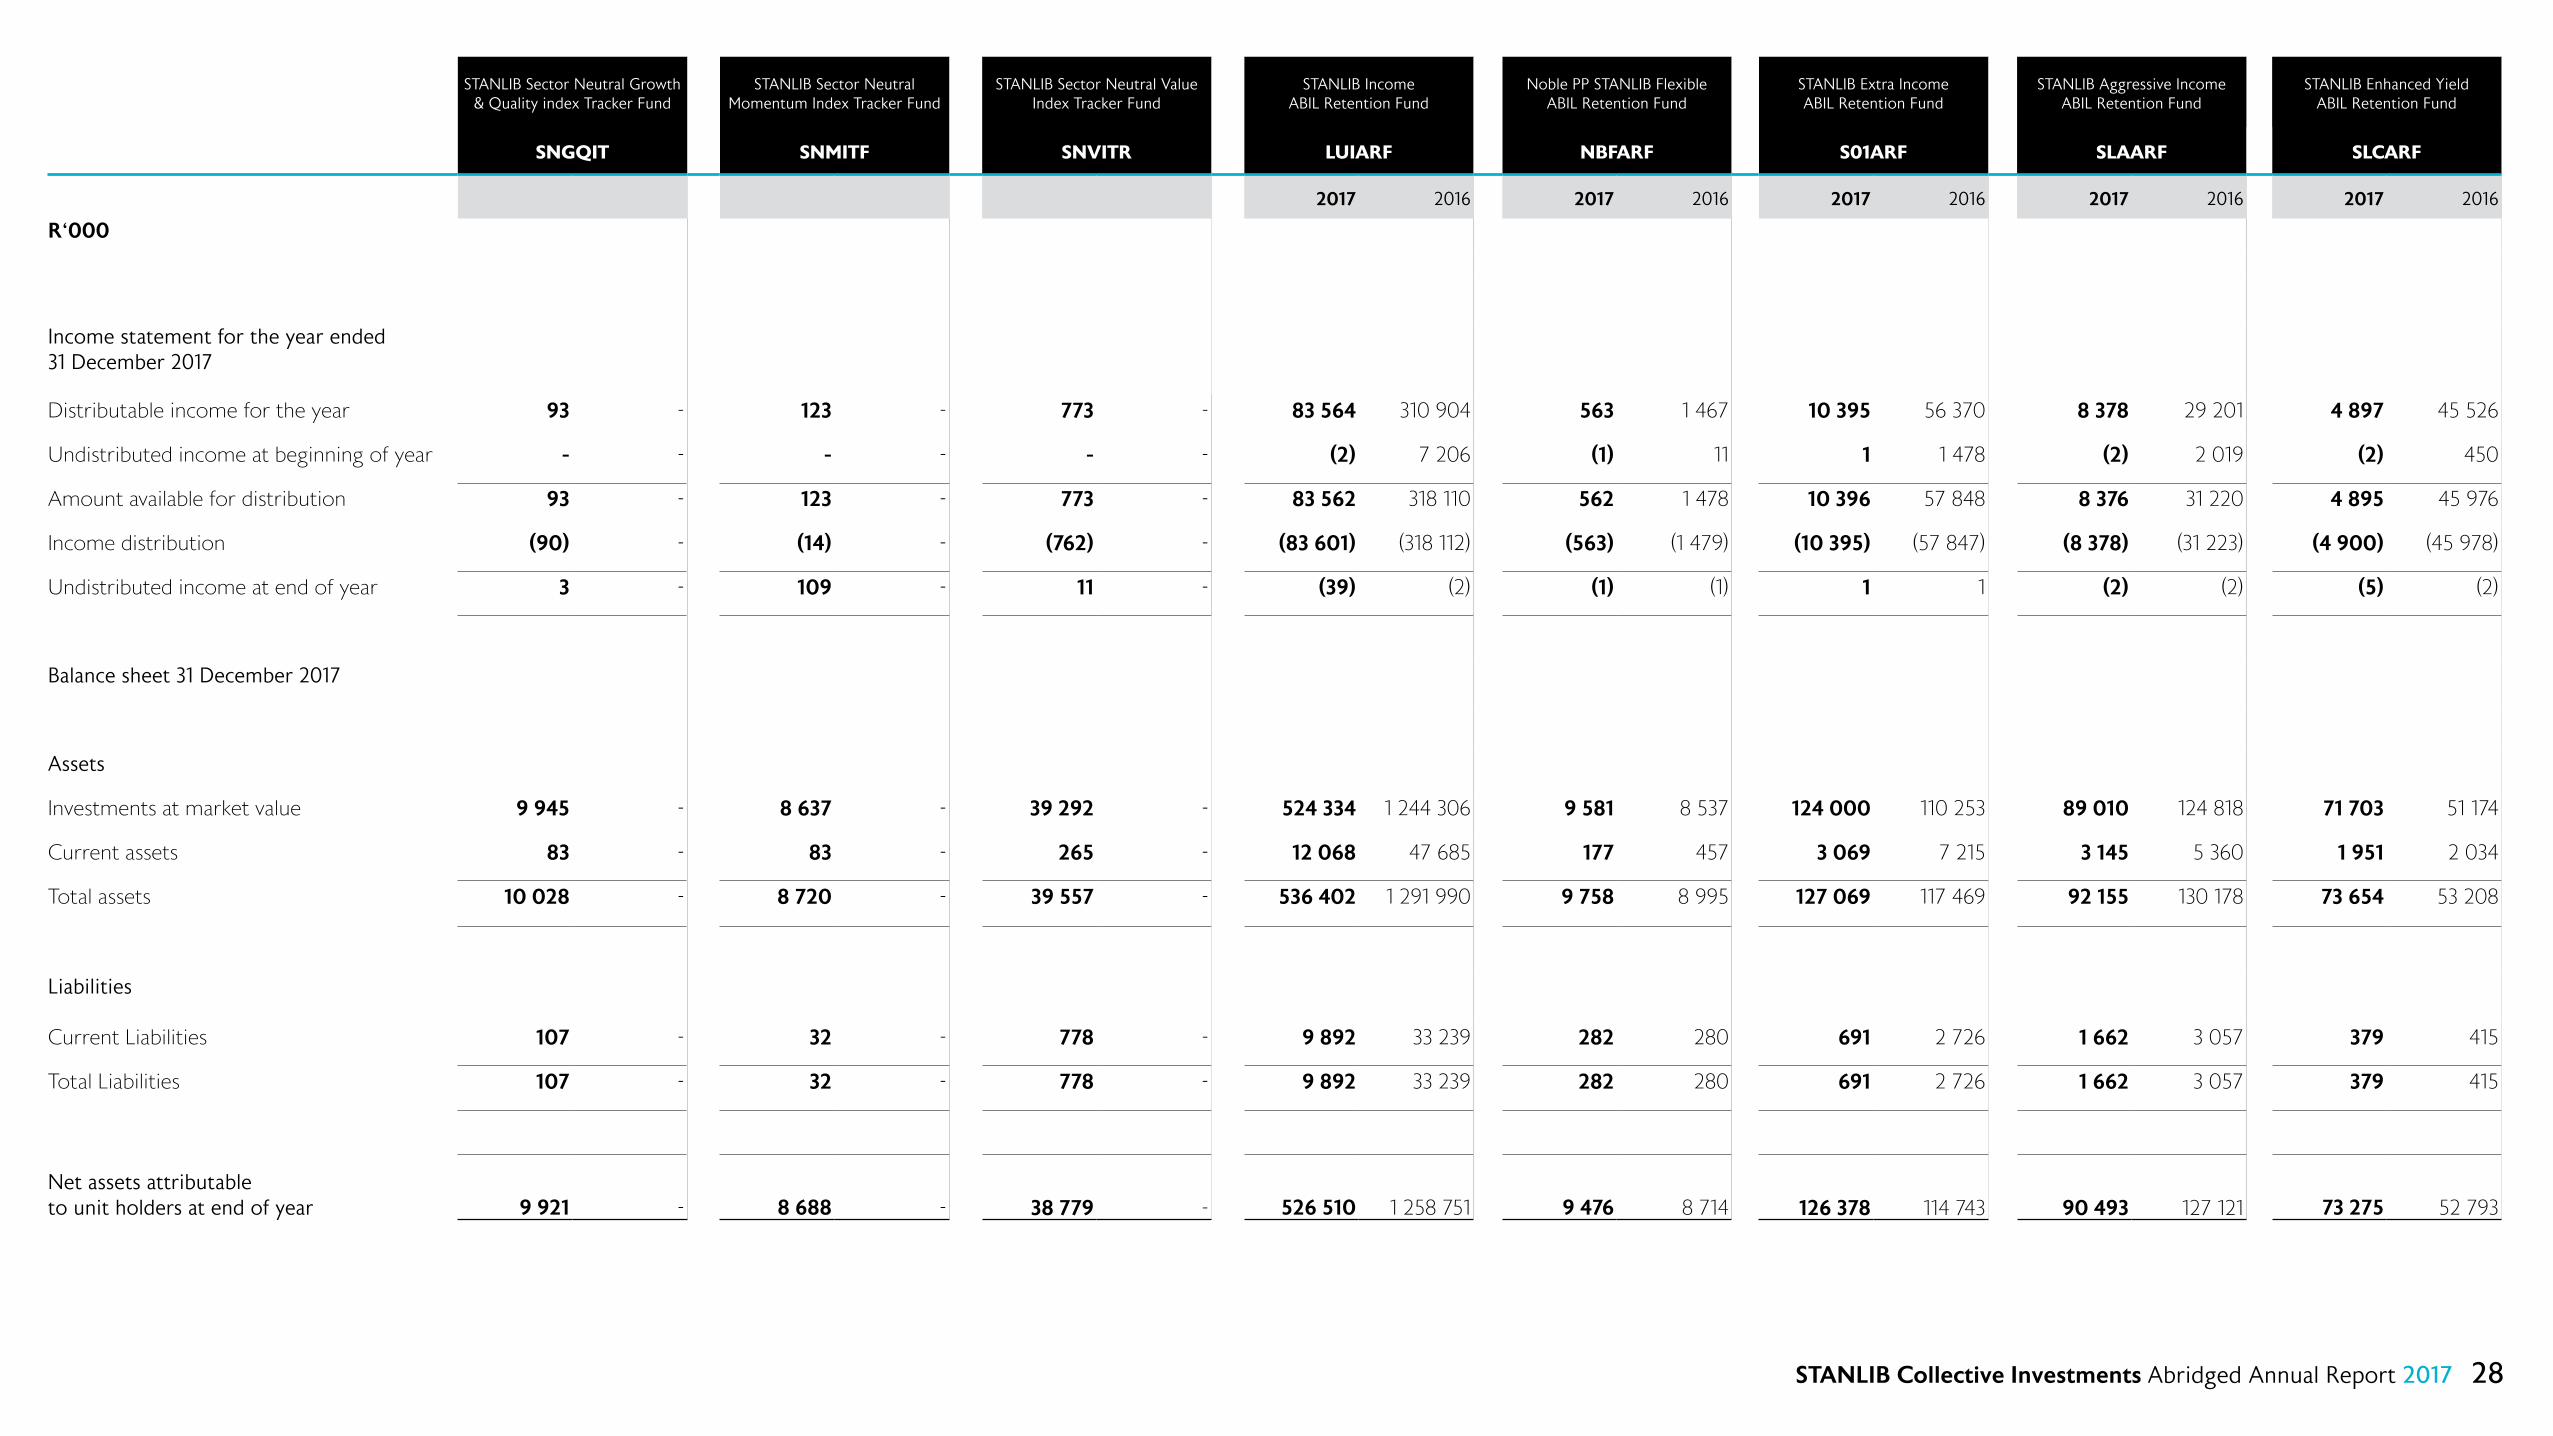
28STANLIB Collective Investments Abridged Annual Report 2017
STANLIB Sector Neutral Growth & Quality index Tracker Fund
STANLIB Sector Neutral Momentum Index Tracker Fund
STANLIB Sector Neutral Value Index Tracker Fund
STANLIB Income ABIL Retention Fund
Noble PP STANLIB Flexible ABIL Retention Fund
STANLIB Extra Income ABIL Retention Fund
STANLIB Aggressive Income ABIL Retention Fund
STANLIB Enhanced Yield ABIL Retention Fund
SNGQIT SNMITF SNVITR LUIARF NBFARF S01ARF SLAARF SLCARF
2017 2016 2017 2016 2017 2016 2017 2016 2017 2016
R‘000
Income statement for the year ended 31 December 2017
Distributable income for the year 93 - 123 - 773 - 83 564 310 904 563 1 467 10 395 56 370 8 378 29 201 4 897 45 526
Undistributed income at beginning of year - - - - - - (2) 7 206 (1) 11 1 1 478 (2) 2 019 (2) 450
Amount available for distribution 93 - 123 - 773 - 83 562 318 110 562 1 478 10 396 57 848 8 376 31 220 4 895 45 976
Income distribution (90) - (14) - (762) - (83 601) (318 112) (563) (1 479) (10 395) (57 847) (8 378) (31 223) (4 900) (45 978)
Undistributed income at end of year 3 - 109 - 11 - (39) (2) (1) (1) 1 1 (2) (2) (5) (2)
Balance sheet 31 December 2017
Assets
Investments at market value 9 945 - 8 637 - 39 292 - 524 334 1 244 306 9 581 8 537 124 000 110 253 89 010 124 818 71 703 51 174
Current assets 83 - 83 - 265 - 12 068 47 685 177 457 3 069 7 215 3 145 5 360 1 951 2 034
Total assets 10 028 - 8 720 - 39 557 - 536 402 1 291 990 9 758 8 995 127 069 117 469 92 155 130 178 73 654 53 208
Liabilities
Current Liabilities 107 - 32 - 778 - 9 892 33 239 282 280 691 2 726 1 662 3 057 379 415
Total Liabilities 107 - 32 - 778 - 9 892 33 239 282 280 691 2 726 1 662 3 057 379 415
Net assets attributable to unit holders at end of year 9 921 - 8 688 - 38 779 - 526 510 1 258 751 9 476 8 714 126 378 114 743 90 493 127 121 73 275 52 793

29STANLIB Collective Investments Abridged Annual Report 2017
STANLIB Multi-Manager Flexible Property ABIL Retention Fund
STANLIB Multi-Manager Balanced ABIL Retention Fund
STANLIB Multi-Manager Absolute Income ABIL Retention Fund
STANLIB Bond ABIL Retention Fund
STANLIB Prudential Bond ABIL Retention Fund
STANLIB Flexible Income ABIL Retention Fund
SLMARF SMAARF SMMARF SMBARF SMCARF STFARF
2017 2016 2017 2016 2017 2016 2017 2016 2017 2016 2017 2016
R‘000
Income statement for the year ended 31 December 2017
Distributable income for the year 1 410 5 463 52 94 496 2 373 1 163 2 391 2 679 6 164 8 131 25 005
Undistributed income at beginning of year 0 45 (1) 12 (0) 303 1 (347) (2) 313 1 180
Amount available for distribution 1 410 5 508 51 106 496 2 676 1 164 2 044 2 677 6 477 8 132 25 185
Income distribution (1 410) (5 507) (52) (107) (496) (2 676) (1 163) (2 043) (2 680) (6 479) (8 129) (25 184)
Undistributed income at end of year 0 0 (1) (1) 0 0 1 1 (3) (2) 3 1
Balance sheet 31 December 2017
Assets
Investments at market value 22 286 26 988 958 838 4 297 10 495 24 837 21 576 67 431 57 835 93 490 109 582
Current assets 202 1 211 21 42 99 584 255 823 2 131 1 809 3 269 2 626
Total assets 22 488 28 199 979 880 4 396 11 080 25 092 22 399 69 562 59 645 96 759 112 208
Liabilities
Current Liabilities 291 529 20 28 78 242 192 290 1 350 1 315 1 801 2 624
Total Liabilities 291 529 20 28 78 242 192 290 1 350 1 315 1 801 2 624
Net assets attributable to unit holders at end of year 22 197 27 670 959 852 4 318 10 838 24 900 22 109 68 212 58 329 94 958 109 584

30STANLIB Collective Investments Abridged Annual Report 2017
Disclaimer
Collective investment schemes in securities are generally medium to long-term investments. The value of participatory interests may go down as well as up and past performance is not necessarily a guide to the future. An investment in the participations of a collective investment scheme in securities is not the same as a deposit with a banking institution. Participatory interest prices are calculated on a net asset value basis, which is the total value of all assets in the Fund including any income accrual and less any permissible deductions from the Fund divided by the number of participatory interests in issue. Permissible deductions include brokerage, UST, auditor’s fees, bank charges, trustee/custodian fees and the service charge levied by STANLIB Collective Investments (RF) Limited (“the Manager”). Where exit fees are applicable, participatory interests are redeemed at the net asset value where after the exit fee is deducted and the balance is paid to the investor. A Portfolio of a collective investment scheme in securities may borrow up to 10% of the market value of the Fund to bridge insufficient liquidity as a result of the redemption of participatory interests, and may also engage in scrip lending.
Where different classes of participatory interests apply to certain Portfolios, they would be subject to different fees and charges. A schedule of fees and charges and maximum commissions is available on request from the Manager. Commission and incentives may be paid and if so, would be included in the overall costs. The exposure limit to a single security in this Portfolio can be greater than is permitted for other Portfolios in terms of the Collective Investment Schemes Control Act, 2002 (“the Act”). Details are available from the Manager. A Fund of Funds Portfolio only invests in other collective investment schemes, which levy their own charges, which could result in a higher fee structure for these portfolios. A Feeder Fund Portfolio only invests in the participatory interests of a single Portfolio of a collective investment scheme apart from assets in liquid form. The Manager reserves the right to close certain Portfolios from time to time in order to manage them more efficiently. More details are available from the Manager. Forward pricing is used.
Fluctuations or movements in exchange rates may cause the value of underlying international investments to go up or down. The Manager undertakes to repurchase participatory interests at the price calculated according to the requirements of the Collective Investment Schemes Control Act, 2002, and on the terms and conditions of the relevant Deeds. Payment will be made within 14 days of receipt of a valid repurchase form. Any capital gain realized on the disposal of a participatory interest in a collective investment scheme is subject to Capital Gains Tax (CGT).The Manager is obliged to report on the weighted average cost method for CGT purposes. All portfolios are valued on a daily basis at 15h00 except for Fund of Funds which are valued at 24h00. For Non-Money Market funds, investments and repurchases will receive the price of the same day if a complete instruction is received prior to 15h00. The Fund Charges document (including the Performance Fee Frequently Asked Questions) is available on www.stanlib.com (“Investment for Individuals” section).
Liberty is a member of the Association of Savings and Investment of South Africa. The Manager is a member of the Liberty group of companies.Contact Details of Trustees: Societe Generale Bank, 2nd Floor, 160 Jan Smuts Ave, Rosebank, 2196. Telephone 011 448 8400Standard Chartered Bank, 4 Sandown Valley Crescent, Sandton, 2196. Telephone 011 291 8042.STANLIB Collective Investments (RF) Proprietary Limited (Reg. No. 1969/003468/07)
Compliance number: HX1847

31STANLIB Collective Investments Abridged Annual Report 2017
17 Melrose Boulevard Melrose Arch 2196PO Box 203 Melrose Arch 2076T 0860 123 003 (SA only)T +27 (0)11 448 6000E [email protected] stanlib.comGPS coordinates S 26.13433°, E 028.06800° W