standing up in multiple sclerosis (sums study)
TRANSCRIPT

1
Statistical Analysis Plan
Standing Up in Multiple Sclerosis
(SUMS Study)
A multi-centre randomised controlled trial to assess the effectiveness and cost
effectiveness of a home-based self-management standing frame programme
plus usual care versus usual care in people with progressive multiple
sclerosis (MS) who have severely impaired balance and mobility
ISRCTN30081
REC Reference: 163803

2
Contents ADMINISTRATIVE INFORMATION ...................................................................................... 4
ABBREVIATIONS ................................................................................................................. 5
1. INTRODUCTION ........................................................................................................... 6
1.1. Background and Rationale for the Trial ................................................................... 6
1.2. Purpose of statistical analysis plan ......................................................................... 6
2. TRIAL OBJECTIVES AND OUTCOME MEASURES ..................................................... 6
2.1. Primary Objective.................................................................................................... 6
2.2. Primary Outcome Measure ..................................................................................... 6
2.3. Secondary Objectives ............................................................................................. 7
2.4. Secondary Outcome Measures ............................................................................... 7
3. TRIAL DESIGN .............................................................................................................. 7
3.1. General Design ....................................................................................................... 7
3.2. Blinding ................................................................................................................... 8
3.3. Analysis Populations ............................................................................................... 8
3.4. Inclusion and Exclusion Criteria .............................................................................. 8
4. STATISTICAL PRINCIPLES .......................................................................................... 9
4.1. Randomisation, Stratification and Allocation Concealment ...................................... 9
4.2. Sample Size Calculation ......................................................................................... 9
4.3. Statistical Significance Levels ............................................................................... 10
4.4. Compliance and Protocol Violations ...................................................................... 10
4.4.1. Compliance with Allocated Treatment ............................................................ 10
4.4.2. Other Protocol Deviations .............................................................................. 11
4.5. Interim Analysis .................................................................................................... 11
4.6. Collection of Outcome Measures .......................................................................... 11
4.7. Time points of Statistical Analysis ......................................................................... 11
4.8. Data Sources and Data Quality ............................................................................. 12
4.9. Missing Data ......................................................................................................... 12
4.9.1. Missing Primary Outcome Data...................................................................... 12
4.9.2. Other missing data ......................................................................................... 12
5. STUDY POPULATION ................................................................................................. 13
5.1. Participants who discontinue, withdraw or are lost to follow-up ............................. 13
5.2. Baseline characteristics and demographics .......................................................... 13
6. STATISTICAL ANALYSES .......................................................................................... 14
6.1. Outcome Variables ............................................................................................... 14

3
6.2. General Considerations ........................................................................................ 14
6.3. Adjustments .......................................................................................................... 15
6.4. Primary Analysis of the Primary Outcome ............................................................. 15
6.5. Interpretation of primary analysis results ............................................................... 15
6.6. Secondary analyses of the primary outcome ......................................................... 16
6.6.1. Sensitivity Analysis ........................................................................................ 16
6.6.2. Repeated Measures Modelling ...................................................................... 16
6.7. Further Exploratory Analysis ................................................................................. 16
6.7.1. Sub-scores .................................................................................................... 16
6.7.2. Interactions .................................................................................................... 16
6.7.3. Intervention Intensity ...................................................................................... 17
6.8. Analysis of Secondary Outcomes ......................................................................... 17
6.8.1. Secondary measurements: ............................................................................ 17
6.9. Safety Data ........................................................................................................... 18
6.10. Statistical Software ............................................................................................ 19
REFERENCES ................................................................................................................... 20
APPENDIX: Examples of Figures and Tables for the Primary Publication Reporting the
Results of SUMS ................................................................................................................. 21
Figure 1: CONSORT Flow Diagram of participants through SUMS. ............................. 22
Figure 2: Example table – demographic data ............................................................... 23
*Stratification Factor ..................................................................................................... 23
Figure 3: Example Table – baseline data ..................................................................... 24
Figure 4: Primary outcome analysis ............................................................................. 25
Figure 5: Secondary analysis of the Primary Outcome utilising repeated measures ..... 25
Figure 6: Secondary outcome analysis – knee extensor strength and goniometry ....... 26
(note a similar table will be completed for the week 20 outcomes) ............................... 26
Figure 7: Secondary outcome analysis – respiratory capacity, reach in sitting and MSIS
score (note a similar table will be completed for the week 20 outcomes) ..................... 27
Figure 8: Secondary outcome analysis – Spasm Frequency, bowel and bladder control
(note a similar table will be completed for the week 20 outcomes) ............................... 28
Figure 9: Safety data – reporting of AEs and SAEs ...................................................... 29
4
ADMINISTRATIVE INFORMATION
Title of Trial Standing Up in Multiple Sclerosis
(SUMS Study)
A multi-centre randomised controlled trial to assess the
effectiveness and cost effectiveness of a home-based self-
management standing frame programme plus usual care versus
usual care in people with progressive multiple sclerosis (MS) who
have severely impaired balance and mobility
Trial registration number
ISRCTN30081
Protocol Version Version 4.0 : 13.7.16
SAP Version 1.0: 17.01.2018
SAP Revisions Any revisions to the SAP after sign-off will be documented here, including a brief justification and timing of revision in relation to unblinding of data
Name Signature Date
Statistical Analysis Plan Authored by:
Trial Statistician: Siobhan Creanor
17/01/2018
Ben Jones
17/01/2018
Approved by:
Chief Investigator: Prof Jennifer Freeman
17/01/2018
Independent Statistician: Prof Paul Ewings
24/01/2018

5
ABBREVIATIONS
AE Adverse Event
AMCA Amended Motor Club Assessment
ANCOVA Analysis of Covariance
BWCS Bowel Control Scale
BLCS Bladder Control Scale
CACE Complier Average Causal Effect
EDSS Expanded Disability Status Score
ITT Intention To Treat
MS Multiple Sclerosis
MSIS Multiple Sclerosis Impact Scale
SAE Serious Adverse Event
SD Standard Deviation
SUMS Standing Up in Multiple Sclerosis

6
1. INTRODUCTION
1.1. Background and Rationale for the Trial
The full background and rationale for the SUMS trial is detailed in the SUMS study
protocol[1]. In summary, the SUMS study will assess whether the provision of a home-based
standing programme using an Oswestry Standing Frame will improve motor function, and
thus aid in the alleviation of mobility-related MS symptoms, in patients with progressive MS.
All participants will be provided with standard care, and half of the participants will
additionally participate in the home-based standing frame programme.
1.2. Purpose of statistical analysis plan
The study protocol includes an outline of the statistical methods to be employed in the
analysis of the trial data. The purpose of the Statistical Analysis Plan is to provide full details
of the planned statistical methods to be used in the primary report of the trial results, and has
been produced in line with the 2017 CONSORT Extension for Non-pharmacological Trials[2]
and the ICH E9 Guidelines[3].
2. TRIAL OBJECTIVES AND OUTCOME MEASURES
The objective of the SUMS study is to assess the clinical and cost effectiveness of a home-
based standing frame programme for people who are severely impaired by MS. If
demonstrated to be effective and cost effective, the evidence can be used to develop
recommendations for a health service delivery model which could be implemented across
the United Kingdom.
2.1. Primary Objective
To assess in patients with progressive multiple sclerosis, whether the implementation of a
standing programme using a standing frame alongside standard care will improve motor
function compared to standard care alone.
2.2. Primary Outcome Measure
The primary outcome measure is motor function, measured using the Amended Motor Club
Assessment (AMCA)[4]. This rates motor impairment of the lower limb and trunk and key
functional movements such as sit-to stand and standing balance. It was developed
specifically for people with MS and has demonstrated validity, reliability and
responsiveness[4-6].
The primary endpoint will be AMCA scores at week 36; in order to improve the accuracy of
the estimated effect size, baseline AMCA measures will be controlled for in the analyses.

7
2.3. Secondary Objectives
To understand the experience of the standing programme from the perspective of
both the participant and the carer
To measure the effects of the standing programme on physical impairments
To measure the effects of the standing programme on key clinical outcomes
To measure the effects of the standing programme on an individual’s quality of life
To determine adherence to the programme
To record and monitor adverse events
To understand the experience of the standing programme from the perspective of
both the participant and the carer
Establish the cost effectiveness of the standing frame programme
2.4. Secondary Outcome Measures
Knee extensor strength using a portable hand-held dynamometer
Length of hip flexors, hamstrings and ankle plantar-flexors using manual goniometry
Spasm frequency using the Penn Spasm Frequency Scale
Respiratory capacity using a hand-held spirometer to record forced expiratory volume
at 1 second
Bowel and bladder control using the self-report Bladder and Bowel Control Scales
Sitting balance using the Single Item Modified Functional Reach in sitting
Falls frequency through a binary yes/no daily response questionnaire
Self reported, 29-item MS impact scale (MSIS-29)
EuroQol EQ-5D-5L
Pre-formatted diary to be completed by the participant or carer to measure
compliance with the standing programme and, where appropriate, reasons for non-
compliance
Daily participant diary to record adverse events
Audio diaries for 10 participants and 10 carers
3. TRIAL DESIGN
3.1. General Design
A blinded outcome, individually-randomised, controlled, multi-centre superiority trial in
patients with progressive multiple sclerosis.
Patients diagnosed with either primary or secondary progressive MS according to
McDonald’s criteria[7] will be drawn from two geographical regions; Devon/Cornwall and
East Anglia. Participants will be randomised using random sized permuted blocks, on a 1:1
basis, to either the control group, and receive standard care, or the intervention group where
they will receive standard care as well as participating in the standing programme for 20
weeks. Participants will be followed up for a further 16 weeks after completion of the
programme, for a total of 36 weeks.

8
3.2. Blinding
Due to the nature of the intervention, it will not be possible to blind participants. However, the
assessment of participants and the primary statistical analysis of the results will be
undertaken in a blinded manner.
3.3. Analysis Populations
Primary analysis of the primary outcome will be based on the intention-to-treat (ITT) principle;
participants will be analysed as randomised, regardless of their compliance with the trial
protocol or lack of participation/completion if allocated to the intervention group. ITT is
generally accepted to be the gold standard approach and provides a conservative estimate
of the intervention effect. The ITT population will include all participants with associated
primary outcome data, excluding only patients who were deemed ineligible following
randomisation, those who withdrew from the trial and were unwilling for their previously
collected data to be utilised or those who failed to provide baseline and week 36
measurements (i.e. there will be no imputation of missing baseline and/or week 36 scores for
the primary analysis).
Due to the home-based nature of the trial, it is possible that there will be a number of
deviations from the trial protocol. In this statistical analysis plan, deviations are considered to
be either non-compliance with the intervention (see section 4.4.1) or non-adherence to other
elements of the protocol, for example assessments completed outside the pre-specified
windows. As such, it may be of interest to consider alternative populations for analysis, in
order to investigate the robustness of the conclusions of the primary analyses.
One alternative is a per protocol analysis, although this approach could introduce bias into
the trial through excluding participants after randomisation and thus jeopardising the group
comparability achieved through randomisation. As an alternative, a complier-average causal
effect (CACE) analysis may be undertaken, which would provide an unbiased estimate of the
intervention effect, based on those who complied with their allocated group’s protocol.
The CACE analysis will be used for the purposes of a sensitivity analysis, and as it is a less
conservative approach than ITT, will likely result in a larger difference between the groups.
Following discussions with the Trial Steering Committee, it is planned to undertake a CACE
analysis if ≥20% of intervention participants are categorised as non-compliers (see section
4.4.1 for detailed definition of a complier). It is likely that a one-sided CACE will be
appropriate, but if there are any participants in the control group who access a standing
frame independently from the trial, a two-sided CACE will be undertaken.
3.4. Inclusion and Exclusion Criteria
The study population will comprise individuals diagnosed with primary or secondary
progressive MS according to McDonald’s criteria[7], and will be:
over 18 years of age
be willing and able to consent and participate
score 6.5 – 8.0 on the Expanded Disability Status Scale (EDSS)
be able to get into a standing frame independently or with assistance from a carer,
and have agreement from the carer should they be required
be willing and able to accommodate the Oswestry Standing Frame in their home

9
be willing and able to travel to local assessment centres for blinded outcomes
assessment
Participants will be excluded if they:
have had any recent changes in disease modifying therapies. More specifically, they
will be excluded if they have ever received Campath, have ceased Nataluzimab
within the past six months, or are within 3 months of ceasing any other MS modifying
drug
have relapsed/received steroid treatment within the last month
are currently, or during the past 6 months have undertaken a regular standing frame
programme for longer than a week
have a history of osteoporotic-related fractures
4. STATISTICAL PRINCIPLES
4.1. Randomisation, Stratification and Allocation Concealment
Randomisation will be achieved using an allocation sequence computer-generated by the
Peninsula Clinical Trials Unit. Randomisation will take place after baseline assessment,
when the blinded assessor will input participant details directly into the randomisation
website. This will generate an e-mail confirming allocation to the regional study co-ordinators,
the study administrator and the treating therapist, but not to the blinded assessors.
Participants will be stratified according to their region (South West or East Anglia) and, as
their scope for improvement may be affected by their current disability severity, to their
baseline Expanded Disability Status Scale (EDSS) category. This stratification will be
achieved by categorising participants into two groups; those with an EDSS score of ≤7.0 or
≥7.5 (the eligibility criteria for the trial is a baseline EDSS score of 6.5-8.0). EDSS scores are
scaled in steps of 0.5.
The randomisation will occur on a 1:1 basis using random sized permuted blocks.
4.2. Sample Size Calculation
The primary outcome is the AMCA at 36 weeks follow-up. This is based on data from
Hendrie’s[8] MS standing pilot study where AMCA improved by a mean of 9.6 following use
of the standing frame (SDs 10.6 at baseline and 13.3 at follow-up; correlation between
baseline and follow-up AMCA scores 0.82).
The primary analysis will utilise analysis of covariance (ANCOVA), comparing AMCA scores
at week 36 between allocated groups, adjusting for baseline AMCA score. The target
between-group difference to be detected is 9.0 points, which is both plausible and
considered clinically relevant. The estimates of final SD and baseline/follow-up correlation
for AMCA are subject to uncertainty and thus the sample size calculations used conservative
80% confidence limits for both parameters, namely 20 for the SD and 0.55 for the correlation.
To detect a between-group difference of nine points, with 80% power at the 5% significance
level, requires 55 participants per group. Allowing for up to 20% loss to follow-up, the target
sample size is 69 participants per group, rounded to a total of 140 participants.
10
4.3. Statistical Significance Levels
All applicable statistical tests will be two-sided and at the 5% significance level, unless
otherwise specified, with two-sided 95% confidence intervals presented whenever possible.
As there is a single primary endpoint, and the secondary endpoints are to be used only in
providing additional supportive exploratory information, there will be no adjustments for
multiple testing.
4.4. Compliance and Protocol Violations
4.4.1. Compliance with Allocated Treatment
Each participant will be randomised to either the intervention group or to the control group,
and those allocated to the intervention group will be provided with a standing frame and
programme. It may, however, be possible that participants allocated to the control group will
purchase their own standing frames. In line with the intention to treat principle, in the primary
analyses, participants will be analysed in accordance with their randomly allocated group.
The trial protocol specifies that participants allocated to the intervention group should stand
three times a week for 30 minutes over 16 weeks of the 20 week intervention period. The
intervention period duration of 20 weeks factors in up to four weeks for individuals to become
re-accustomed to an upright position and achieve the desired intensity of standing whilst
also allowing for time when the participant is unable to use the frame (illness, holidays, etc).
Following detailed discussions, it was agreed that compliance should be considered in terms
of total standing time over 16 weeks, leading to a minimum standing time of 1440 minutes if
the protocol is strictly followed. Based on a minimum 80% compliance level, the minimum
total standing time required over the 16 weeks is 1152 minutes. Therefore, in the
intervention group, a complier will be defined as a participant who has stood for a mean of at
least 72 minutes per week over 16 weeks within the 20 week intervention period. In the
control group, a complier will be defined as somebody who does not use a standing frame
during the study period.
The number and proportions of participants categorised as non-compliers will be
summarised for each group separately and overall, alongside the details of the non-
compliance.
Analyses will be undertaken by considering a complier as a participant allocated to the
intervention group who (during the 20 week intervention period) (i) stood for at least 1152
minutes over their best 16 weeks; (ii) stood for at least 1152 minutes over their worst 16
weeks; (iii) stood for at least 1152 minutes over weeks 5-20.
Further analyses will similarly explore compliance over the full 36 week trial period, again
allowing four weeks for acclimatisation, holiday or illness. Assuming that ideally participants
in the intervention group continued to stand for a minimum of 30 minutes, three times per
week over 32 weeks, this equates to a total standing time of 2880 minutes. Based on a
minimum 80% compliance level, the minimum total standing time over 32 weeks will
therefore be 2304 minutes.
A CACE analysis may be undertaken for the purposes of a sensitivity analysis, to allow the
estimation of the intervention effect, having accounted for participants categorised as non-
compliers as defined above (see sections 3.3 and 6.6.1).

11
4.4.2. Other Protocol Deviations
As well as non-compliance with the protocol as outlined above, there could be other protocol
deviations, for example if follow-up assessments took place outside the pre-specified ±2
week window. The numbers and proportions of participants with protocol deviations will be
summarised by allocated group with details of type of deviation provided. No formal
statistical testing will be undertaken.
In addition, it is possible that participants may be administered drugs during the trial period
which would have excluded them from participating in the trial. Such participants will be
analysed as randomised, in line with the principle of intention to treat.
Any reported protocol deviations will be documented and reported to the Chief Investigator
and Sponsor.
4.5. Interim Analysis
There is no planned interim analysis for this trial. If, for any reason, the Trial Steering
Committee (TSC) requests an interim analysis of the data, they will seek to appoint a
statistician independent of the trial team to undertake such work, in order to retain the
blinding of the trial statistician.
4.6. Collection of Outcome Measures
Outcome measures will be collected from participants at baseline, at 20 weeks post-baseline
(coinciding with the end of the intervention programme for those allocated to the intervention
group) and again at 36 weeks during three blinded assessments.
Pre-intervention
Inte
rve
ntio
n P
erio
d
Post-intervention
Baseline 20 weeks 36 weeks
AMCA Score x x x
Knee extensor strength x x x
Length of hip flexors, hamstrings and plantarflexors
x x x
Spasms frequency x x x
Respiratory capacity x x x
Bladder function x x x
Bowel Function x x x
Sitting balance x x x
Falls Frequency Daily Diary Daily Diary
Health related quality of life x x x
Adherence/Compliance Throughout Throughout
Audio Diary Throughout Throughout
4.7. Time points of Statistical Analysis
The statistical analysis, with the exception of any interim analysis, will be undertaken after
the final data at the 36 week follow-up has been collected for each participant and the
database locked.

12
4.8. Data Sources and Data Quality
The data will come from information entered onto Case Report Forms (CRFs) completed at
baseline, 20 weeks and 36 weeks. +/-2 weeks tolerance will be allowed for collection of
outcome measures, after which point a protocol deviation will be recorded. In addition,
participants will complete a daily dairy with a yes/no response to whether they have fallen
each day. A pre-formatted diary will also be completed by participants to collect information
on compliance with the intervention and to record adverse events. Ten participants will also
be asked to complete audio diaries detailing their experience of the intervention. Data,
excluding diary data and interview transcriptions, will be double-entered and discrepancies
checked by the SUMS study administrator and the research therapists and stored securely
on a PenCTU database.
4.9. Missing Data
4.9.1. Missing Primary Outcome Data
As baseline data will be obtained prior to the commencement of the study it is unlikely that
any significant amount of information will be missing. However, if this is the case, it will not
be possible to include the participant in the primary analysis. Such participants will be
included in both the analysis of secondary outcomes and the secondary analysis of the
primary outcome where appropriate.
It is, however, possible that there may be some missing data by the time the trial concludes.
This could be because a participant has dropped out of the study, or did not attend the final
follow-up assessment. If a participant has dropped out of the study before the end of the trial
period and has not provided a week 36 measurement, it will not be possible to include them
in the primary analysis. However, if they miss their 20 week assessment but attend the 36
week assessment then they will be analysed as randomised, as they will have provided the
data necessary for the primary outcome comparison.
The intention is to use complete case data for the primary analysis, on an intention-to-treat
basis, so any participants who do not provide baseline and 36-week AMCA data will be
excluded from the primary analysis. As the sample size calculation allowed for up to 20%
loss to follow-up, the analysis should be sufficiently powered, although there is a risk of bias
if there is differential loss to follow-up between the intervention and control groups. Any
imputed datasets will be used for the purpose of sensitivity analyses (see section 6.6.1
below).
4.9.2. Other missing data
Other missing demographic data such as sex and age will be queried following data entry,
although it is not expected that there will be a considerable amount of such missing data.
Analyses of secondary outcomes will be based on complete case data only.

13
5. STUDY POPULATION Data from the screening process through to the completion of the trial will be recorded and
presented in a CONSORT-style flow diagram. In particular, the following data will be
provided:
Number of participants screened for eligibility
Number of participants ineligible*
Number of participants eligible and asked to participate
Number of participants who declined to participate*
Number of participants consented to participate
Number of participants withdrawn prior to randomisation*
Number of participants randomised to each allocated group
Number of participants who did not receive their allocated treatment*
Number of participants who did receive their allocated treatment
Number of participants who did not complete their allocated treatment*
Number of participants who completed their allocated treatment
Number of participants who completed the 36 week follow-up
Number of participants lost to follow-up*
Number of participants analysed
*Reasons will be provided where available
5.1. Participants who discontinue, withdraw or are lost to follow-up
It is possible that participants may withdraw consent part way through the trial, or their
treatment may be discontinued due to medical reasons. It is unlikely that a participant will
discontinue on medical grounds if allocated to the control group, but for reasons such as
extreme fatigue or injury, some may not be able to complete the standing frame programme.
Participants who discontinue will be categorised into one of the following:
Continue to consent for follow-up and data collection
Consent to use pre-collected data only
Withdrawn consent to use any data
Reasons for withdrawal or loss to follow-up will be summarised in the CONSORT diagram
where possible, at each stage of the process (withdrawal prior to randomisation, participants
who did not receive their allocated treatment, non-completion of treatment, lost to follow-up).
Participants who withdraw from the study, or whose treatment is discontinued on medical
grounds, will not be replaced although their available data will be used unless they have
specifically requested for it to be removed from the database.
5.2. Baseline characteristics and demographics
Baseline characteristics, collected prior to randomisation, will be cross-tabulated according
to allocated group to check for balance between groups and provide an overview of the
study population. The variables will include age, sex, walking aid use, type of MS, AMCA
score, dynamometer of knee extensors, goniometry of passive range of motion, spasms
frequency, respiratory capacity, bladder and bowel function, sitting balance, fall frequency
and health related quality of life.

14
Summary statistics for continuous measures will be reported as means, standard deviations
and ranges where the distribution appears normal, and as medians, inter-quartile ranges and
ranges if the distribution is skewed. Categorical data will be summarised by frequencies and
percentages. Formal statistical analysis of randomised groups at baseline is not good
practice[9, 10] and thus will not be performed; relative balance between allocated groups is
expected. Any considerable imbalance will be noted, assessed for clinical relevance and,
where appropriate, additional adjustments will be made in secondary sensitivity analyses[3]
[11].
6. STATISTICAL ANALYSES
6.1. Outcome Variables
AMCA Score: (primary outcome) will be measured at baseline, end of intervention period
(week 20), and at 36 week follow-up. Week 36 AMCA scores will be compared between
allocated groups in order to test for a significant difference between the week 36 AMCA
scores, with adjustment made for baseline AMCA scores.
Knee extensor strength, length of hip flexors, hamstrings and ankle plantarflexors,
frequency of spasms, respiratory capacity, bladder function, bowel function and
sitting balance (secondary outcomes): will be measured at baseline, at the end of treatment
(week 20) and at 36 weeks follow-up. 36 week follow-up scores be will compared between
allocated groups, with adjustment made for baseline scores.
Fall frequency: will be collected via the use of a daily yes/no questionnaire, recorded in a
diary by participants. The proportion of fallers at the end of treatment (week 20) and at 36
weeks follow-up will be compared between allocated groups, where a faller is defined as
somebody who has fallen at least twice.
Compliance with the Intervention: A pre-formatted daily diary will be completed by
participant (or their carer) to record compliance with the intervention. Data will be
summarised to assess whether participants allocated to the intervention group stood for the
minimum required time. The data will be used to assess whether a sufficient level of
compliance was achieved. Exploratory analysis will be undertaken of the potential effect of
total standing time, mean standing time per week and frequency of standing on the primary
outcome (see section 6.7.3).
6.2. General Considerations
Wherever possible, analyses will be presented with 95% confidence intervals and all
reported p-values will be two-sided, unless otherwise stated. For continuous outcomes,
summary information will be presented in the form of means (including mean difference
between follow-up and baseline where appropriate) alongside standard deviations and
ranges for outcomes that are normally distributed. For ordinal outcomes and non-normally
distributed continuous outcomes, summary information will be presented in the form of
medians, inter-quartile ranges and ranges.

15
6.3. Adjustments
Analyses of the outcomes will be adjusted for stratification variables, region (South West or
East Anglia) and EDSS category at baseline (≤7.0 or ≥7.5), and baseline measure, where
available. Data will be pooled across recruitment centres.
6.4. Primary Analysis of the Primary Outcome
The Amended Motor Club Assessment (AMCA) comprises a series of physical tests
designed to assess motor function for participants with MS. The series of examinations to be
conducted within this trial includes 14 lower limb activities and 16 functional activities. Each
lower limb assessment returns a score based on scale of movement, ranging from 0-2, with
a higher value representing better movement. In the case where an exercise was not tested,
a score of 0 will be allocated. For the functional activities, a score between 0-3 will be
assigned to each examination, with higher values representing better function. As for lower
limb movement examinations, if an activity is not tested a score of 0 will be allocated
(correspondence with Lorraine De Souza, developer of the AMCA measure - see appendix
B). A participant’s AMCA score is the total of each of the individual scores and can range
from 0-76, with a lower score indicating a higher degree of motor and functional deficit.
Descriptive summary statistics (e.g. means and standard deviations) will be presented for
the primary outcome of AMCA scores at each of the three time points by allocated group.
The primary analysis will compare the difference between AMCA scores at 36 weeks (the
primary endpoint) and baseline between the two allocated groups using ANCOVA, including
the stratification variables (region and baseline EDSS category) and baseline AMCA as
covariates. Utilising the baseline AMCA levels will increase the precision of the estimated
intervention effect at 36 weeks. The assumptions underpinning the ANCOVA model will be
visually assessed, with suitable transformation of AMCA scores undertaken as necessary if
the ANCOVA model assumptions are not met. If there is a suggestion of violation of the
model assumptions and no suitable transformation can be identified, bootstrapped
confidence intervals for the between-group differences in change in AMCA scores will be
produced.
Unadjusted analyses will also be presented for completeness. Both adjusted and unadjusted
between-group comparisons will be presented with 95% confidence intervals.
6.5. Interpretation of primary analysis results
The primary analysis will test the following null and alternative hypotheses:
H0: There is no difference between the change in AMCA score from baseline to week 36
follow-up assessment between the two treatment groups.
H1: There is a difference between the change in AMCA score from baseline to week 36
follow-up assessment between the two treatment groups.
If the results of the primary adjusted analyses suggest that there is sufficient evidence to
reject the null hypothesis, it will be concluded that the standing frame programme is different
to the standard treatment currently available in improving motor function in participants with
progressive multiple sclerosis.

16
6.6. Secondary analyses of the primary outcome
6.6.1. Sensitivity Analysis
As described above, the primary analysis will use complete cases of the data, meaning only
participants who have provided both baseline and week 36 data will be included. As outlined
in sections 3.3 and 4.4.1 above, a CACE-based sensitivity analysis will be undertaken to
allow the estimation of the intervention effect having accounted for participants categorised
as non-compliers as defined in section 4.4.1, if more than 20% of participants allocated to
the intervention group, and who complete the 36 week follow-up, are categorised as non-
compliers.
To assess the robustness of the conclusions of the primary analysis of the primary outcome
to missing outcome data, consideration will also be given to undertaking a sensitivity
analysis after imputing missing data, if there is evidence of differential loss to follow-up
between allocated groups of ≥10% and/or ≥10% of participants followed-up are missing
primary outcome data. If either threshold is met, an imputed data set, including participants
with missing data, will be used for the purposes of a sensitivity analysis. It is anticipated that
multiple imputation will be used to impute the missing AMCA scores, based on the
assumption of missing at random, with this assumption assessed by examining reasons for
missingness (where available). Both adjusted and unadjusted analyses of the imputed data
will be conducted, with mean differences and corresponding 95% confidence intervals
presented.
6.6.2. Repeated Measures Modelling
To make further, maximal use, of the repeated measures data structure, a generalised linear
model will be then be fitted to the AMCA scores across the three time points, with the model
including allocated group and the two stratification variables. This model will also include the
interaction between time point and allocated group, to examine for evidence of different
between-group differences at the two follow-up time points. The advantage of this approach
is that a missing measurement will not result in the participant’s remaining data being
removed from the analysis (but rather just their data at that time point) and it will allow for
exploration of the potential interaction between time point and allocated group.
6.7. Further Exploratory Analysis
6.7.1. Sub-scores
It is of interest to consider the effects of the standing frame programme on the AMCA scores
of each of the two sub-domains of the measure: lower limb movement and functional
activities. This will be achieved by simply calculating an AMCA total sub-score for each
assessment; one comprising the sum of the lower limb scores and the other the sum of the
functional activities scores. Analysis of each of these outcomes will be conducted as
described above for the AMCA total score; via utilisation of ANCOVA, with adjustment for
EDSS score, region of recruitment and the appropriate baseline measurement for the AMCA
sub-score of interest.
6.7.2. Interactions
Exploratory analyses of the following possible interactions will be undertaken to assess
whether the effect of the intervention on AMCA score at 36 weeks is modified by baseline
EDSS score. This subgroup analysis will be performed by adding the interaction term

17
between allocated group and the subgroup variable into the model. As the study is not
powered for this interaction analysis, the results will be treated with caution; given the
exploratory nature of these investigations, the emphasis will be on the interpretation of the
corresponding confidence intervals for such sub-groups.
6.7.3. Intervention Intensity
Exploratory analysis will be conducted to assess the potential relationship between the
intensity of the intervention and the primary outcome in participants in the intervention group.
In particular, the relationship between the AMCA score at 36 weeks and (a) the mean
number of minutes stood per week and (b) the frequency and/or average number of standing
sessions, will be summarised and modelled if appropriate using a general linear model, if
normality assumptions are satisfied, both unadjusted and adjusted for the two stratification
variables. If the modelling assumptions are not met, non-linear regression models will be
explored. Levels of compliance will be explored by considering the average standing time
not just over the 20 week intervention period, but over the full 36 week duration of the trial.
6.8. Analysis of Secondary Outcomes
Secondary analyses will involve considering the changes between baseline and (a) week 36
and (b) week 20 for each of the secondary outcome measurements.
6.8.1. Secondary measurements:
Knee Extensors: three repeated measurements taken per knee at each assessment. The
mean of the six measurements will be calculated to provide a single measure per
participant*.
Manual goniometry of passive range of motion: six individual measurements taken at
each assessment; length of each hip flexor, hamstring and ankle plantar-flexor. The mean of
each pair of measurements will be calculated and analysed*.
Penn Spasms frequency scale: recorded over one week, either the mode or the median of
the seven scores will be computed for each participant at each time point.
Forced Expiratory Volume: three attempts performed at each time point, with the best of
the three to be used for analysis, as specified in the SUMS protocol[1] and in line with similar
research[12, 13].
Modified functional reach in sitting: three measurements provided per assessment. Average of final two measurements to be used for analysis, as per the Modified functional reach guidelines[14].
Bladder Control Scale: Total score, obtained based on a four item questionnaire, ranging
from 0-22 at each time point, with higher scores indicating greater bladder control
problems[15].
Bowel Control Scale: Total score, obtained based on a five item questionnaire, ranging
from 0-26 at each time point, with higher scores indicating greater bowel control
problems[15].
Falls frequency: Measured via the use of a daily yes/no question, self-reported via the daily
diaries.
18
Multiple sclerosis impact scale (MSIS-29): Based on a 29-item questionnaire at each
assessment, questions 1-20 inclusive are transformed to a 0-100 scale representing physical
impact score; questions 21-29 are transformed in the same manner and represent
psychological impact score, with a higher score representing a higher degree of disability
[16, 17]. Each of the impact scores will be analysed separately.
*The decision was made to conduct bilateral averaging, in line with other similar work[18]
and following correspondence with an author and others in the field.
As with the primary analysis, continuous secondary outcomes will be analysed using
ANCOVA with adjustment for the stratification variables (EDSS score and region) as well as
baseline measurement where available. The distribution of each of these secondary
outcomes and the model assumptions will be examined visually and, where necessary,
appropriate transformations will be sought. In any cases where transformations of the
outcome are unsuccessful in satisfying the normality assumption, alternative methods of
analysis will be considered and explored. This may include non-linear regression modelling if
appropriate. Otherwise, a non-parametric approach will be adopted in the form of a Mann-
Whitney test used to test for between-group differences.
Analyses will also be undertaken to compare the change in week 20 AMCA score from
baseline between the two allocated groups, following the same approach as detailed above.
The adjusted mean difference between the two groups will be presented alongside 95%
confidence intervals and p-values. In addition, unadjusted analyses will be presented with 95%
confidence intervals for the mean difference and p-values.
To facilitate analysis of the available falls frequency data, participants need to be classified
as a “faller” or “non-faller”. A participant will be defined as a faller at the 20 week time point
as someone who has self-reported falling on two or more days between time of
randomisation and week 20 follow-up. A participant will be defined as a faller at the 36 week
time point as someone who has self-reported as a participant who has fallen on two or more
days between time of randomisation and the week 36 assessment. The proportions of fallers
will be compared between allocated groups through the use of binary logistic regression
modelling with adjustment for the two stratification factors, with unadjusted analyses also
presented. Participants will also be classified and compared over the post-intervention
period between week 20 and week 36. In addition to comparing the proportions of fallers
between allocated groups, the falls rates per person-year will also be calculated[19, 20].
6.9. Safety Data
The adverse event risks of taking part in the study have been assessed to be low[1].
However, use of the standing frame can cause fatigue, pain/discomfort, spasms, a
hypotensive episode or musculoskeletal injury to the carer. Numbers and percentages of
adverse events and serious adverse events will be cross-tabulated for each type,
categorised by severity and relatedness to trial treatment. For each participant, only the
maximum severity experienced of each type of AE will be displayed. No formal statistical
analysis will be conducted, but AEs and SAEs will be closely monitored and assessed for
clinical significance throughout the process.
Serious Adverse Events (SAEs) will be recorded and each site will notify the trial co-
ordinator and the project Chief Investigator at the University of Plymouth immediately of any

19
SAEs, who will then notify the project sponsor and local R&D department within one working
day.
6.10. Statistical Software
The statistical analyses will be undertaken using StataSE version, supplemented where
required by packages such as R.

20
REFERENCES 1. Freeman, J.A., et al., Standing up in multiple sclerosis (SUMS): protocol for a multi-
centre randomised controlled trial evaluating the clinical and cost effectiveness of a home-based self-management standing frame programme in people with progressive multiple sclerosis. Bmc Neurology, 2016. 16.
2. Boutron, I., et al., CONSORT Statement for Randomized Trials of Nonpharmacologic Treatments: A 2017 Update and a CONSORT Extension for Nonpharmacologic Trial Abstracts. Annals of internal medicine, 2017. 167(1): p. 40-47.
3. ICH Harmonised Tripartite Guideline: Statistical Principles for Clinical Trials E9. 1998. 4. De Souza, L.H. and A. Ashburn, Assessment of motor function in people with
multiple sclerosis. Physiotherapy research international : the journal for researchers and clinicians in physical therapy, 1996. 1(2): p. 98-111.
5. Davis, C., Physiotherapy or Self-Selected Exercise in Multiple Sclerosis, A Comparative Evaluation of Community-based Interventions. PhD Thesis, University of Nottingham, 2008.
6. Craig, J., et al., A randomised controlled trial comparing rehabilitation against standard therapy in multiple sclerosis patients receiving intravenous steroid treatment. Journal of neurology, neurosurgery, and psychiatry, 2003. 74(9): p. 1225-30.
7. Polman, C.H., et al., Diagnostic criteria for multiple sclerosis: 2010 revisions to the McDonald criteria. Annals of neurology, 2011. 69(2): p. 292-302.
8. Hendrie, W.A., M.J. Watson, and M.A. McArthur, A pilot mixed methods investigation of the use of Oswestry standing frames in the homes of nine people with severe multiple sclerosis. Disability and rehabilitation, 2015. 37(13): p. 1178-85.
9. Moher, D., et al., CONSORT 2010 Explanation and Elaboration: Updated guidelines for reporting parallel group randomised trials. Journal of clinical epidemiology, 2010. 63(8): p. e1-37.
10. Senn, S., Testing for baseline balance in clinical trials. Statistics in medicine, 1994. 13(17): p. 1715-26.
11. Points to Consider on Adjustment for Baseline Covariates. 2003, The European Agency for the Evaluation of Medicinal Products.
12. Gosselink, R., et al., Respiratory muscle weakness and respiratory muscle training in severely disabled multiple sclerosis patients. Arch Phys Med Rehabil, 2000. 81(6): p. 747-51.
13. Buyse, B., et al., Respiratory dysfunction in multiple sclerosis: a prospective analysis of 60 patients. Eur Respir J, 1997. 10(1): p. 139-45.
14. Rehabilitation Measures Database. Functional Reach Test and Modified Functional Reach Instructions.
15. National Multiple Sclerosis Society. Multiple Sclerosis Quality of Life Inventory: A User’s Manual.
16. Hobart, J., et al., The Multiple Sclerosis Impact Scale (MSIS-29): a new patient-based outcome measure. Brain, 2001. 124(Pt 5): p. 962-73.
17. Hobart, J. and S. Cano, Improving the evaluation of therapeutic interventions in multiple sclerosis: the role of new psychometric methods. Health Technol Assess, 2009. 13(12): p. iii, ix-x, 1-177.
18. Broekmans, T., et al., Effects of long-term resistance training and simultaneous electro-stimulation on muscle strength and functional mobility in multiple sclerosis. Multiple sclerosis (Houndmills, Basingstoke, England), 2011. 17(4): p. 468-77.
19. Ibrahim, M., et al., ERIC Notebook: Calculating Person-Time, in 2000, Epidemiologic Research & Information Centre: Durham, North Carolina.
20. Gunn, H., et al., Frequency, characteristics, and consequences of falls in multiple sclerosis: findings from a cohort study. Archives of physical medicine and rehabilitation, 2014. 95(3): p. 538-45.

21
APPENDIX A: Examples of Figures and Tables for the Primary
Publication Reporting the Results of SUMS

22
Figure 1: CONSORT Flow Diagram of participants through SUMS.
Potential participants identified (n=)
Potential participants contacted to
screen for eligibility (n=)
Final screening and consent (n=)
Patients ineligible (n=) Patients Declined (n=)
(reasons)
Participants randomised (n=)
Patients ineligible (n=)
(reasons)
Standard Care alone (n=) Standing Programme (n=)
Received Standard Care
(n=)
Undertook Standing
Programme (n=)
Did not receive standard
care alone (n=) (reasons)
Did not participate in
standing programme (n=)
(reasons)
Completed 20 week
assessment (n=)
Did not complete 20
week assessment (n=)
(reasons)
Completed 20 week
assessment (n=)
Did not complete 20
week assessment (n=)
(reasons)
Completed 36 week
follow-up (n=)
Lost to follow-up (n=)
(reasons)
Completed 36 week
follow-up (n=)
Lost to follow-up (n=)
(reasons)
Analysed (n=) Analysed (n=)
Baseline Assessment (n=)
23
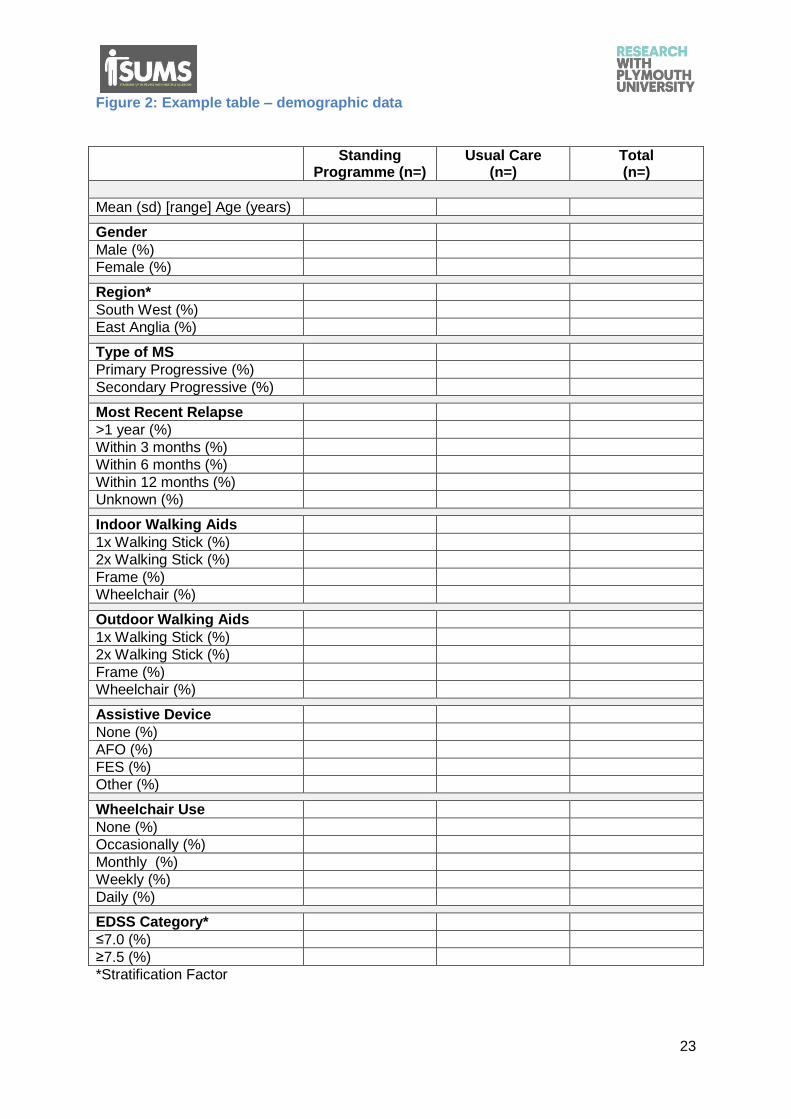
Figure 2: Example table – demographic data
Standing Programme (n=)
Usual Care (n=)
Total (n=)
Mean (sd) [range] Age (years)
Gender
Male (%)
Female (%)
Region*
South West (%)
East Anglia (%)
Type of MS
Primary Progressive (%)
Secondary Progressive (%)
Most Recent Relapse
>1 year (%)
Within 3 months (%)
Within 6 months (%)
Within 12 months (%)
Unknown (%)
Indoor Walking Aids
1x Walking Stick (%)
2x Walking Stick (%)
Frame (%)
Wheelchair (%)
Outdoor Walking Aids
1x Walking Stick (%)
2x Walking Stick (%)
Frame (%)
Wheelchair (%)
Assistive Device
None (%)
AFO (%)
FES (%)
Other (%)
Wheelchair Use
None (%)
Occasionally (%)
Monthly (%)
Weekly (%)
Daily (%)
EDSS Category*
≤7.0 (%)
≥7.5 (%)
*Stratification Factor

24
Figure 3: Example Table – baseline data
Standing Programme (n=)
Usual Care (n=)
Total (n=)
Mean (sd) [range] AMCA Score*
Knee Extensor Strength
Mean (sd) [range]
Goniometry
Mean (sd) [range] hip
Mean (sd) [range] hamstring
Mean (sd) [range] ankle
Median (IQR) [range] Spasm Frequency
Mean (sd) [range] respiratory capacity
Median (IQR) [range] Bowel Control
Median (IQR) [range] Bladder Control
Mean (sd) [range] reach in sitting
Falls frequency
Mean (sd) [range] MSIS Physical Impact Score
Mean (sd) [range] MSIS Pschological Impact Score
*Primary Outcome

25
Figure 4: Primary outcome analysis
Standing Programme
(n=)
Usual Care (n=)
Adjusted Analysis1 Unadjusted Analysis
Mean Between-Group Difference (95% CI)
p-value Mean Between-Group Difference (95% CI)
p-value
Prim
ary
An
aly
sis
Mean (sd) [range] difference in AMCA at baseline vs week 36
Se
nsitiv
ity A
naly
sis
1
Mean (sd) [range] difference in lower limb AMCA at baseline vs 36 weeks
Mean (sd) [range] difference in functional activities AMCA at baseline vs 36 weeks
1 Adjusted for stratification factors region and EDSS score (≤7.0 or ≥7.5)
Figure 5: Secondary analysis of the Primary Outcome utilising repeated measures
(TBC)

26
Figure 6: Secondary outcome analysis – knee extensor strength and goniometry
(note a similar table will be completed for the week 20 outcomes)
Standing Programme
(n=)
Usual Care (n=)
Adjusted Analysis1 Unadjusted Analysis
Mean Between-Group Difference (95% CI)
p-value Mean Between-Group Difference (95% CI)
p-value
Kn
ee
Exte
nsor Mean (sd)
[range] difference in knee extensor at baseline vs week 36
Len
gth
of
hip
fle
xors
, h
am
str
ings a
nd a
nkle
pla
nta
r-fle
xors
Mean (sd) [range] difference in hip flexor at baseline vs 36 weeks
Mean (sd) [range] difference in ankle plantar-flexor at baseline vs 36 weeks
Mean (sd) [range] difference in hamstring at baseline vs 36 weeks
1 Adjusted for stratification factors region and EDSS score (≤7.0 or ≥7.5)

27
Figure 7: Secondary outcome analysis – respiratory capacity, reach in sitting and
MSIS score (note a similar table will be completed for the week 20 outcomes)
Standing
Programme (n=)
Usual Care (n=)
Adjusted Analysis1 Unadjusted Analysis
Mean Difference (95% CI)
p-value Mean Difference (95% CI)
p-value
Mean (sd) [range] difference in respiratory capacity at baseline vs week 36
Mean (sd) [range] difference in sitting reach at baseline vs week 36
Mean (sd) [range] difference in MSIS physical score at baseline vs week 36
Mean (sd) [range] difference in MSIS psychological score at baseline vs week 36
1 Adjusted for stratification factors region and EDSS score (≤7.0 or ≥7.5)

28
Figure 8: Secondary outcome analysis – Spasm Frequency, bowel and bladder control
(note a similar table will be completed for the week 20 outcomes)
Standing
Programme (n=)
Usual Care (n=)
Adjusted Analysis1 Unadjusted Analysis
Mean Difference (95% CI)
p-value Mean Difference (95% CI)
p-value
Median (IQR) [range] difference in average spasm frequency at baseline vs week 36
Bo
we
l co
ntr
ol sca
le
Mean (sd) [range] difference in bowel control score at baseline vs 36 weeks
Median (sd) [range] difference in bowel control score at baseline vs 36 weeks
Bla
dd
er
co
ntr
ol sca
le
Mean (sd) [range] difference in bowel control score at baseline vs 36 weeks
Median (sd) [range] difference in bowel control score at baseline vs 36 weeks
1 Adjusted for stratification factors region and EDSS score (≤7.0 or ≥7.5)

29
Figure 9: Safety data – reporting of AEs and SAEs
Adverse Event Serious Adverse Event
Related to trial
Unrelated to trial
Total Related to trial
Unrelated to trial
Total
Mild (%)
Moderate (%)
Severe (%)

30
APPENDIX B: Correspondence with Lorraine De Souza regarding
the allocation of a score of 0 to participants who could not attempt
AMCA exercises.
Hi Lorraine,
Hope all is well with you.
I hope you don't mind me picking your brains, but Jenny and I are using the AMCA in our
standing frame study and we were wondering how you dealt with any measures from a
research point of view which were marked as 'X' (i.e.not tested). Did you score them as '0'
for the analyses?
Hope you have a lovely Christmas and a very happy and healthy 2018.
Very best wishes,
Wendy
Wendy Hendrie PhD MSc MCSP FACPIN
Specialist physiotherapist in MS
MS Centre
Alkmaar Way
Norwich
NR6 6BB
Dear Wendy
Yes we scored as zero if testing was futile. That is that it would be impossible for the
participant to attempt.
Hope this helps.
Have a great Christmas and a very Happy New year
Best wishes
Lorraine
Professor Lorraine H. De Souza BSc, MSc, Grad Dip Phys, PhD, FCSP, FRSA
Professor of Rehabilitation
University Ambassador for Equality and Diversity