standards of excellence (soes) -...
TRANSCRIPT

Standards of Excellence (SOEs)
May 2011
Amy K. Cheatham, Ph.D., P.E.
On behalf of Andrew R. Kissell, P.E.
Atlantic

2
Why SOE?
• Standard, representative, and qualitative compliance summary– Covers all environmental compliance media, sustainment, EMS– Easily communicated for all 73 Navy installations– Involves all levels of management: relationship builder– Less of a data call, more of an analysis/summary– Leading vs. lagging indicator; qualitative vs. quantitative
• Manage improvement- “You can only manage what you measure”– Comparative analysis– Identifies systemic issues: process improvement, business process, policy– Focus on the red: resource support (funds, tech support, billets, training)– Reaching for excellence, not just minimum standards– Easy to “raise the bar” or expand criteria and media– Will tie into EMS, EMS Web and ListBuilder (internal & external audits)

3
How is the metric applied?
• Incorporate existing data and data calls– Self-assessments, SNC, EMS, NOV/NON, Annual Report to Congress, etc.– Same level of detail or slightly more granularity; selected sampling– More representative compliance info: all media, legal requirements, some policy
• Compliance + effectiveness = S.O.E.– Not more $$, more efficient use of $$– Out of compliance = Red– In need of attention to avoid non-compliance = Yellow– Compliant = Green– 6-10 key compliance criteria per media
• Quarterly updates– Submitted by EIPD and reviewed by regional media managers– Rolled up by region to NAVFAC Atlantic Program Manager for comparative analysis– POA&Ms and explanations for all Reds and Yellows– (Once fully implemented) Briefed to all levels: PWO, ICO, FEC (C.O., OPS and BL),
NAVFAC, CNIC, CNO

4
NAVY SOE Quarterly Beta Test Summary
Media / Category Rating
FEC InstallationsAir
EmissionsDrinking
WaterWaste water
Storm water
HW Mgmt & Services
Solid/ Medical Waste &
Recycling
TSCAOHS Spill
Preparedness & Response
Sustain-ability
Petroleum Storage Tanks
EMS
EURAFSWA NS Rota Y G G G R R G G G R Incomplete
EURAFSWA NSA Souda Bay R R R R R G G G Y G Y
Midlant NS Norfolk G G G G G G Incomplete G G G Incomplete
Midwest NS Great Lakes G G R G G Y G R G G Incomplete
Midwest NSA Crane R G G G G G G G G G Y
Northwest NAS Whidbey Island G G G G G G G G G G Incomplete
Northwest NS Everett R G G G G G Y G G G Incomplete
Far East CFA Yokosuka R Y G G G Y Y R Y R Incomplete
Southwest NB Ventura County G G G G G G G G R G Incomplete
Southwest WNS Seal Beach G G G G R G G G G G Incomplete
Washington NSF Dahlgren Y G G G G G G G G G Incomplete

5
Sample LANT SOE Quarterly Progress Report (NOTIONAL DATA)

6
Modifications from Beta Test Results
• Completed:– Add policy questions to every media– Add sustainability questions (LEED, LID, P2, EISA, EO 13423)– Improved media questions:
» Clarified, changed scoring criteria, added permit update status– Add comment field for use by all management levels– Add root cause coding column
• On-going:– Fix automated scoring functions, create macros for trends and POAMs– Address concerns over data calls/workload– Avoid FITREP reaction/whitewash/cover-up– Standardize guidelines for use/designation of ratings

7
What’s Next (Short-term)?
• Deploy SOEs– Retrain: Original training: SEP/ OCT 09; refresher TBD– Use Beta Test results to debug criteria and scoring– Replace QPDC metric with SOEs for quarterly scoring: CNIC EPM
contractor currently reviewing SOEs
• Integrate EQA, EMS, IG inspections, and SOE reporting

8
What’s Next (Long-term)?
• Report SOEs horizontally and vertically as Navy compliance metric to CNIC installations/regions/HQ and NAVFAC PWDs/FECs/HQ
• Correlate expenditure by media, evaluate systemic issues, improve compliance processes, re-allocate resources
• Expand to include all EV product lines: ER, NEPA, N/C resources

9
Summary
• SOEs are proving to be an effective tool for:– Communicating deficiencies to upper management– Justifying resource requirements– Focusing and involving management efforts– Improving the installation EMS through the identification of trends
• Most importantly, the implementation of SOEs is assisting with thetransition from reactive to proactive in compliance management.
Questions?

10
Back-up Slides

11
What are the Current Metrics?
• EMS Conformance:– Green: On schedule for deadline; – Yellow: Must do more to meet; – Red: Needs significant action
• SNC: ~5 nationally: EPA OTIS/ECHO; NOVweb• NOVs: ~35 Navy-wide, mostly administrative; NOVweb• Execution (OAB): awarding projects according to schedule
– Low-ball, <50% of client funds go to contracted “projects”– e-Projects status: post award software use
• Annual report to Congress– Not all compliance media, focus on inventories, quantities
• Quarterly Performance Data Call (QPDCs) – General in nature, designed to limit spending
Primarily lagging metrics, output not outcome, reactive vice proactive. None designed to manage compliance at any level. Of little value at FEC or installation level, “cumbersome” data-call.

12
Sample LANT SOE Quarterly Summary Report (NOTIONAL DATA)
Media / Category Rating Future Categories
FEC Installations UICAir
EmissionsDrinking
WaterWaste water
Storm water
HW Mgmt & Services
Solid/ Medical Waste &
Recycling
TSCA
OHS Spill Preparedn
ess & Response
Sustain-ability
Petroleum Storage Tanks
EMSEncroach-
ment
Natural/ Cultural
ResourcesER,N
NAVFAC EURAFSWA NSA Naples IT N62588 G G G G G G G G G G G
NAVFAC EURAFSWA NS Rota SP N62863 G G G G R G G G G G G
NAVFAC EURAFSWA NAS Sigonella IT N62995 G G G G G G G G G R G
NAVFAC EURAFSWA NSA Souda Bay GR N66691 G G G G G Y G G G G G
NAVFAC EURAFSWA JMF St. Mawgan UK N32897 G G G G G G G G G G Y
NAVFAC EURAFSWA NSA Bahrain N63005 G G G G G G G G G G Y
NAVFAC Midlant NAS Brunswick N60087 G G G G G G G G G Y Y
NAVFAC Midlant NWS Earle N69213 G G R G G G G G G G G
NAVFAC Midlant NAES Lakehurst N61012 G G G G G G G G G G Y
NAVFAC Midlant NAB Little Creek N61414B G G G G G G G R G G Y
NAVFAC Midlant NSA Mechanicsburg N32414 G G G G G G G G G G Y
NAVFAC Midlant SB New London N00129 G G Y G G G G G G G Y
NAVFAC Midlant NS Newport N32411 G G G G G G G G R G G
NAVFAC Midlant NS Norfolk N62688 G G G G G R G G G G Y
NAVFAC Midlant NAS Oceana N60191 G G G G G G G G G G G
NAVFAC Midlant NSU Saratoga Springs N68317 G G G G G G G G G G G
NAVFAC Midlant WPNSTA Yorktown N69212 G G G R G G G G G G G
NAVFAC Midwest NSA Crane N61018 G G G G G G G Y G G G
NAVFAC Midwest NS Great Lakes N00128 G G G G G G G G G G G

13
Sample LANT SOE FEC Summary Report (NOTIONAL DATA)
14
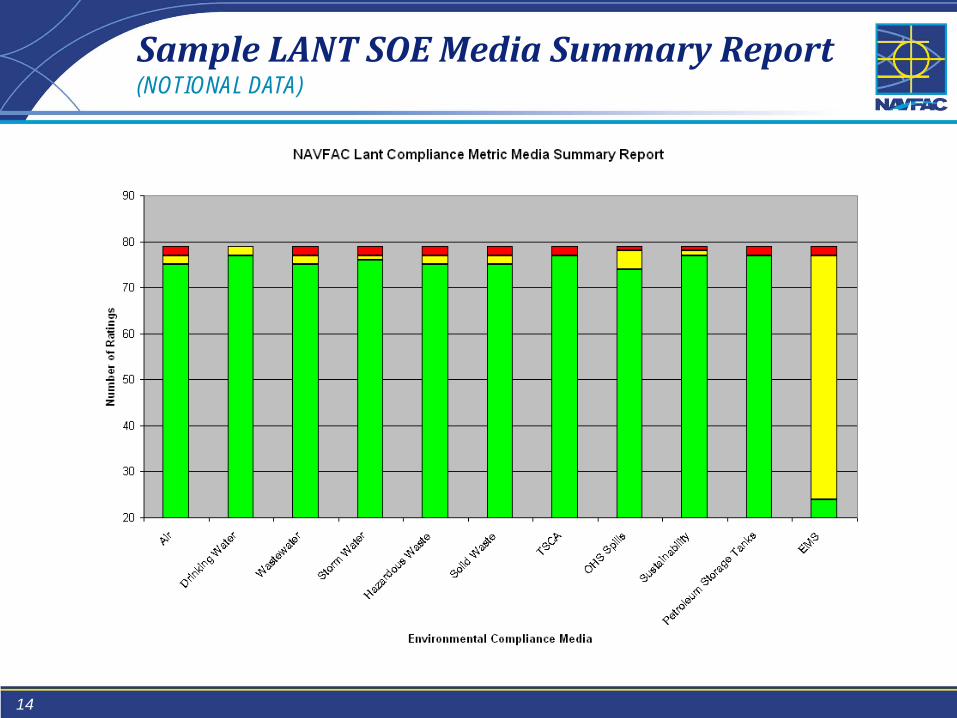
Sample LANT SOE Media Summary Report (NOTIONAL DATA)

15
Houston, We Have a Problem
• Don’t know our compliance status • No way to meaningfully compare media or installations (qualitative vs. quantitative)• No leading indicators• No granularity to the installation level• Anecdotal examples, but little data to support the need for additional resources • Haven’t conducted external compliance audits since 2001. Began again this FY

16
Annual Report to Congress
1. Success stories C,C, P, EMS-narrative2. Toxic Release Inventory: (CNO)3. EMS + green procurement- (DoD)4. Natural Resources-similar to SoEs5. Cultural Resources- “ “6. Air- emissions and permits: quantitative not qualitative (NFESC)7. Wastewater/Water: quantitative not qualitative (NFESC)8. Compliance Enforcement-NOV/NONs9. Regulatory inspections by media (regulation) by region10. Significant Non-Compliance (SNC) (EPA OTIS and ECHO
databases) 11. Perchlorate sampling (ER,N primarily)12. Solid Waste/Recycling- quantitative not qualitative (NFESC)13. Hazardous Waste and UST- quantitative not qualitative (NFESC)• POL/AST/SPCR- not reported• TOSCA - not reported• Sustainment (Energy/ LEED, Stormwater/ LID, etc.)- not reported

17
Quarterly Performance Data Call (CPLs)
• Criteria:1. % of Level 1-5 projects completed2. % of permits current, monitored3. % regulatory reports on time, action taken on findings4. % of solid waste recycling5. % of regulated waste disposal6. % of plans (except NEPA) updated7. % NEPA docs on time8. % of training requirements met9. % Environmental staff development10. % IAP inspections conducted11. % corrective actions initiated12. % Facilities projects reviewed
• Level 3 target- 2 funded too high, 4 too low

18
Beta Test
• Draft criteria developed by MFTs/WGs AUG 2008• Used select installations in all regions (SE unavailable)
– NSF Indian Head, – NSF Dahlgren, – CFA Yokosuka, – NSWC Crane, – NSA MidSouth
Memphis,
– NAVSTA Harbortown, – NAVSTA Great Lakes, – NAVSTA Everett, – NAS Whidbey Island, – NB Ventura,
– Seal Beach, – NS Rota, – NSA Souda Bay, – NAS Sigonella, – JAX, etc.
• Scored bases and evaluated criteria; briefed BLCs, HQ• Goal was:
– Representative questions, leading indicators, qualitative in nature
– Resource focus, honest & accurate assessment– Management improvement– Ready for full deployment– Replace less useful data calls (CPLs)