standardization of the catch per unit … daff, department of agriculture, forestry and fisheries,...
TRANSCRIPT

SCRS/2017/138 Collect. Vol. Sci. Pap. ICCAT, 74(3): 1295-1305 (2017)
STANDARDIZATION OF THE CATCH PER UNIT EFFORT FOR SWORDFISH
(XIPHIAS GLADIUS) FOR THE SOUTH AFRICAN LONGLINE FISHERY
Denham Parker1, Henning Winker1, Wendy West1 and Sven E. Kerwath1
SUMMARY
Swordfish, Xiphias gladius is a target species in the South African pelagic longline fleet operat-
ing along the west and east coast of South Africa. A standardization of the swordfish CPUE of
the South African longline fleet for the time series 2004-2015 was carried out with a General-
ized Additive Mixed Model (GAMM) with a Tweedie distributed error. Explanatory variables of
the final model included year, month, geographic position (Lat, Long) and a targeting factor
with two levels, derived by clustering of PCA scores of the root-root transformed, normalized
catch composition. Vessel was included as a random effect. Swordfish CPUE had a definitive
seasonal trend, with catch rates higher in winter and lower in summer. The standardised CPUE
analysis indicates a consistently declining trend over the period 2004-2012, followed by a nota-
ble increase between 2012 and the final assessment year 2015.
RÉSUMÉ
L’espadon (Xiphias gladius) est une espèce ciblée par la flottille palangrière pélagique
d’Afrique du Sud opérant le long de la côte occidentale et orientale de l’Afrique du Sud. Une
standardisation de la CPUE d’espadon de la flottille de palangriers sud-africains a été réalisée
pour la série temporelle 2004-2015 à l'aide d'un modèle mixte additif généralisé (GAMM) avec
une erreur de distribution Tweedie. Les variables explicatives du modèle final incluaient
l’année, le mois, la position géographique (latitude-longitude) et un facteur de ciblage à deux
niveaux, obtenus en regroupant les scores PCA transformés en racine quatrième de la composi-
tion de la capture standardisée. Le navire a été inclus comme effet aléatoire. La CPUE de
l’espadon avait une tendance saisonnière irréfutable, les taux de capture étant plus élevés en
hiver et plus faibles en été. L’analyse de la CPUE standardisée indique une tendance à la bais-
se constante sur la période 2004-2012, suivie d’une augmentation notable entre 2012 et 2015,
dernière année de l’évaluation.
RESUMEN
El pez espada, Xiphias gladius, es una especie objetivo en la flota de palangre pelágico de Su-
dáfrica que opera en la costa este y oeste de Sudáfrica. Se llevó a cabo una estandarización de
la CPUE del pez espada de la flota de palangre sudafricana para la serie temporal de 2004-
2015 utilizando un modelo mixto aditivo generalizado (GAMM) con un error de distribución
Tweedie. Las variables explicativas del modelo final incluían año, mes, posición geográfica (la-
titud y longitud) y un factor de especie objetivo con dos niveles, derivado agrupando clasifica-
ciones PCA transformadas mediante raíz cuarta de la composición de la captura normalizada.
El buque se incluyó como efecto aleatorio. La CPUE del pez espada tenía una tendencia esta-
cional definitiva, con tasas de captura más elevadas en invierno y menos elevadas en verano.
El análisis de la CPUE estandarizada indica una tendencia constantemente descendente duran-
te el periodo 2004-2012, seguida de un notable aumento entre 2012 y el último año de la eva-
luación, 2015.
KEYWORDS
Swordfish, catchability, gear selectivity, long lining, random processes
1 DAFF, Department of Agriculture, Forestry and Fisheries, Private Bag X2, Rogge Bay 8012, South Africa. Email:
1295
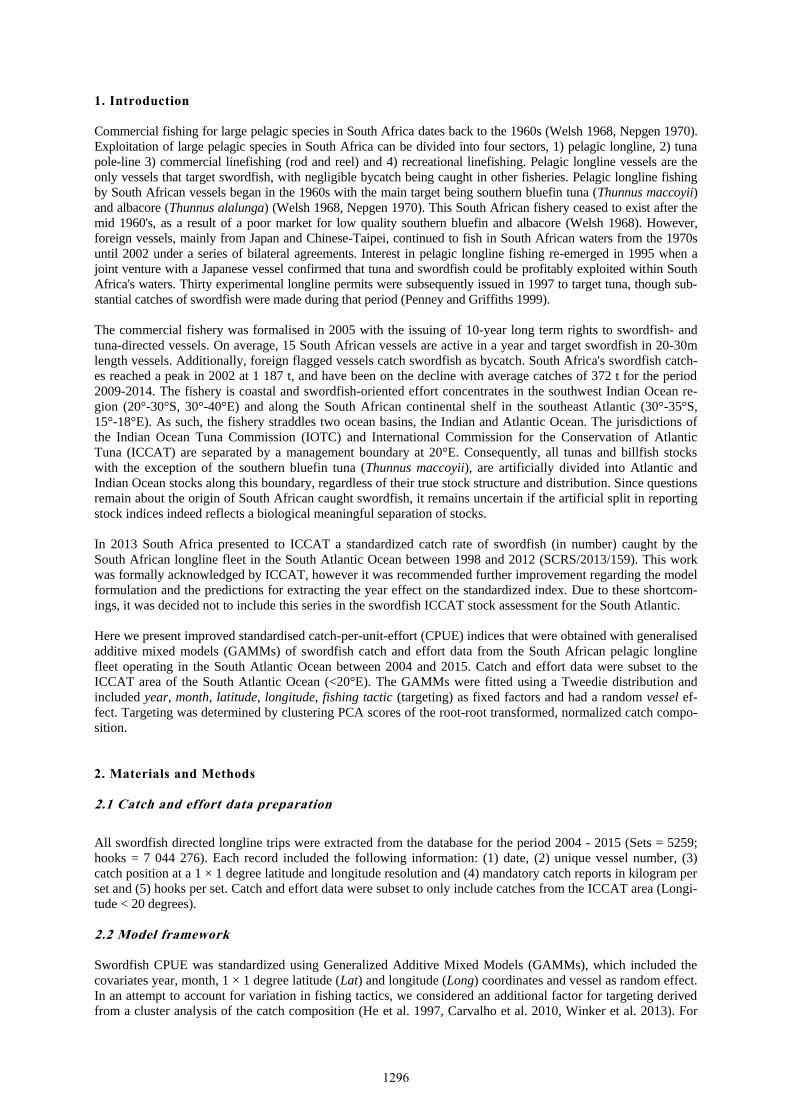
1. Introduction
Commercial fishing for large pelagic species in South Africa dates back to the 1960s (Welsh 1968, Nepgen 1970).
Exploitation of large pelagic species in South Africa can be divided into four sectors, 1) pelagic longline, 2) tuna
pole-line 3) commercial linefishing (rod and reel) and 4) recreational linefishing. Pelagic longline vessels are the
only vessels that target swordfish, with negligible bycatch being caught in other fisheries. Pelagic longline fishing
by South African vessels began in the 1960s with the main target being southern bluefin tuna (Thunnus maccoyii)
and albacore (Thunnus alalunga) (Welsh 1968, Nepgen 1970). This South African fishery ceased to exist after the
mid 1960's, as a result of a poor market for low quality southern bluefin and albacore (Welsh 1968). However,
foreign vessels, mainly from Japan and Chinese-Taipei, continued to fish in South African waters from the 1970s
until 2002 under a series of bilateral agreements. Interest in pelagic longline fishing re-emerged in 1995 when a
joint venture with a Japanese vessel confirmed that tuna and swordfish could be profitably exploited within South
Africa's waters. Thirty experimental longline permits were subsequently issued in 1997 to target tuna, though sub-
stantial catches of swordfish were made during that period (Penney and Griffiths 1999).
The commercial fishery was formalised in 2005 with the issuing of 10-year long term rights to swordfish- and
tuna-directed vessels. On average, 15 South African vessels are active in a year and target swordfish in 20-30m
length vessels. Additionally, foreign flagged vessels catch swordfish as bycatch. South Africa's swordfish catch-
es reached a peak in 2002 at 1 187 t, and have been on the decline with average catches of 372 t for the period
2009-2014. The fishery is coastal and swordfish-oriented effort concentrates in the southwest Indian Ocean re-
gion (20°-30°S, 30°-40°E) and along the South African continental shelf in the southeast Atlantic (30°-35°S,
15°-18°E). As such, the fishery straddles two ocean basins, the Indian and Atlantic Ocean. The jurisdictions of
the Indian Ocean Tuna Commission (IOTC) and International Commission for the Conservation of Atlantic
Tuna (ICCAT) are separated by a management boundary at 20°E. Consequently, all tunas and billfish stocks
with the exception of the southern bluefin tuna (Thunnus maccoyii), are artificially divided into Atlantic and
Indian Ocean stocks along this boundary, regardless of their true stock structure and distribution. Since questions
remain about the origin of South African caught swordfish, it remains uncertain if the artificial split in reporting
stock indices indeed reflects a biological meaningful separation of stocks.
In 2013 South Africa presented to ICCAT a standardized catch rate of swordfish (in number) caught by the
South African longline fleet in the South Atlantic Ocean between 1998 and 2012 (SCRS/2013/159). This work
was formally acknowledged by ICCAT, however it was recommended further improvement regarding the model
formulation and the predictions for extracting the year effect on the standardized index. Due to these shortcom-
ings, it was decided not to include this series in the swordfish ICCAT stock assessment for the South Atlantic.
Here we present improved standardised catch-per-unit-effort (CPUE) indices that were obtained with generalised
additive mixed models (GAMMs) of swordfish catch and effort data from the South African pelagic longline
fleet operating in the South Atlantic Ocean between 2004 and 2015. Catch and effort data were subset to the
ICCAT area of the South Atlantic Ocean (<20°E). The GAMMs were fitted using a Tweedie distribution and
included year, month, latitude, longitude, fishing tactic (targeting) as fixed factors and had a random vessel ef-
fect. Targeting was determined by clustering PCA scores of the root-root transformed, normalized catch compo-
sition.
2. Materials and Methods
2.1 Catch and effort data preparation
All swordfish directed longline trips were extracted from the database for the period 2004 - 2015 (Sets = 5259;
hooks = 7 044 276). Each record included the following information: (1) date, (2) unique vessel number, (3)
catch position at a 1 × 1 degree latitude and longitude resolution and (4) mandatory catch reports in kilogram per
set and (5) hooks per set. Catch and effort data were subset to only include catches from the ICCAT area (Longi-
tude < 20 degrees).
2.2 Model framework
Swordfish CPUE was standardized using Generalized Additive Mixed Models (GAMMs), which included the
covariates year, month, 1 × 1 degree latitude (Lat) and longitude (Long) coordinates and vessel as random effect.
In an attempt to account for variation in fishing tactics, we considered an additional factor for targeting derived
from a cluster analysis of the catch composition (He et al. 1997, Carvalho et al. 2010, Winker et al. 2013). For
1296

the clustering analysis, all CPUE was modelled as catch in metric tons per species per vessel per day. All of the
following analysis was conducted within the statistical environment R. The R package 'cluster' was used to per-
form the CLARA analysis, while all GAMMs were fitted using the 'mgcv' and 'nlme' libraries described in Wood
(2006).
Clustering of the catch composition data was conducted by applying a non-hierarchical clustering technique
known as CLARA (Struyf et al. 1997) to the catch composition matrix. To obtain the input data matrix for
CLARA, we transformed the CPUEi,j matrix of record i and species j into its Principal Components (PCs) using
Principal Component Analysis (PCA). For this purpose, the data matrix comprising the CPUEi,j records for all
reported species was extracted from the dataset. The CPUE records were normalized into relative proportions by
weight to eliminate the influence of catch volume, fourth-root transformed and PCA-transformed. Subsequently,
the identified cluster for each catch composition record was aligned with the original dataset and treated as cate-
gorical variable (FT) in the model (Winker et al. 2013). To select the number of meaningful clusters we followed
the PCA-based approach outlined and simulation-tested in Winker et al. (2014). This approach is based on the
selection of non-trivial PCs through non-graphical solutions for Catell's Scree test in association with the Kaiser-
Guttman rule (Eigenvalue > 1), called Optimal Coordinate test, which is available in the R package 'nFactors'
(Raiche and Magis 2010). The optimal number of clusters considered is then taken as the number of retained PCs
plus one (Winker et al. 2014). The results suggest that only the first PC is non-trivial (Figure 3) and correspond-
ingly two clusters were selected as optimal for the CLARA clustering.
The CPUE records were fitted by assuming a Tweedie error distribution (Tascheri et al. 2010, Winker et al.
2014). The Tweedie distribution belongs to the family of exponential dispersion models and is characterized by a
two-parameter power mean-variance function of the form 𝑉𝑎𝑟(𝑌) = 𝜙𝜇𝑝, where 𝜙 is the dispersion parameter,
𝜇 is the mean and p is the power parameter (Dunn and Smyth 2005). Here, we considered the case of 1 < p < 2,
which represents the special case of a Poisson (p = 1) and gamma (p = 2) mixed distribution with an added mass
at 0. This makes it possible to accommodate high frequencies of zeros in combination with right-skewed contin-
uous numbers in a natural way when modelling CPUE data (Winker et al. 2014, Ono et al. 2015). As it is not
possible to estimate the optimal power parameter p internally within GAMMs, p was optimized by iteratively
maximizing the profile log-likelihood of the GAMM for 1 < p < 2 (Figure 5). This resulted in a power parameter
p = 1.3 with an associated dispersion parameter of 𝜙 = 5 for the full GAMM. The full GAMM evaluated for
swordfish CPUE was:
𝐶𝑃𝑈𝐸𝑖 = 𝑒𝑥𝑝(𝛽0 + 𝑌𝑒𝑎𝑟 + 𝑠1(𝑀𝑜𝑛𝑡ℎ) + 𝑠2(𝐿𝑜𝑛𝑔, 𝐿𝑎𝑡) + 𝐹𝑇 + 𝛼𝑉)
where s1() denotes cyclic cubic smoothing function for Month, s2() a thin plate smoothing function for the two-
dimensional covariate of Lat and Long, FT is the vector of cluster numbers treated as categorical variable for
“Fishing Tactics”, and 𝛼𝑣 is the random effect for Vessel v (Helser et al. 2004). The inclusion of individual Ves-
sels as random effects term provides an efficient way to combine CPUE recorded from various vessels (n = 28)
into a single, continuous CPUE time-series, despite discontinuity of individual vessels over the time-series
(Helser et al. 2004). The main reason for treating vessel as a random effect was because of concerns that multiple
CPUE records produced by the same vessel may violate the assumption of independence caused by variations in
fishing power and skipper skills and behaviour, which can result in overestimated precision and significance
levels of the predicted CPUE trends if not accounted for (Thorson and Minto 2015). The significance of the
random-effects structure of the GAMM was supported by both Akaike's Information Criterion (AIC) and the
more conservative Bayesian Information Criterion (BIC). Sequential F-tests were used to determine the covari-
ates that contributed significantly (p < 0.001) to the deviance explained.
Annual CPUE was standardized by fixing all covariates other than Year and Lat and Long to a vector of stand-
ardized values 𝑋0. The choices made were that Month was fixed to July (Month = 7), representative of the high
catch month and FT was fixed to the fishing tactic the produced highest average catch rates (FT = 2). The ex-
pected yearly mean CPUEy and standard-error of the expected log(CPUEy) for the vector of standardized covari-
ates 𝑋0 was then calculated as the average across all Lat-Long combinations (here forth grid cells) a, such that:
𝐸[𝐶𝑃𝑈𝐸𝑦(𝑋0𝑇 �̂�)] =
1
𝐴∑𝑒
𝐴
𝑎
𝑥𝑝(𝜇𝑦,𝑎 )
and
�̂�𝑦 (𝑋0𝑇 �̂�) = √
1
𝐴∑�̂�𝑦
2𝐴
𝑎
,𝑎
1297

where 𝜇𝑦,𝑎 is the standardized, model-predicted 𝑙𝑜𝑔(𝐶𝑃𝑈𝐸𝑦,𝑎 ) for Year y and Lat and Long for grid cell a,
�̂�𝑦 ,𝑎 is the estimated model standard error associated with 𝑙𝑜𝑔(𝐶𝑃𝑈𝐸𝑦,𝑎 ), A is the total number of grid cells
and T denotes the matrix in which X is transposed.
3. Results and Discussion
The analysis of deviance for the step-wise regression procedure showed that all of the covariates considered
were highly significant (p < 0.001) and the inclusion of all considered fixed effects were supported by both the
AIC and BIC (Table 1). The inclusion of the effect of targeting other species, particularly sharks (Figure 4),
contributed to the greatest improvement in the deviance explained by the model, followed by Month (Table 1).
Swordfish CPUE was negligible when vessels were targeting sharks using fishing tactic 1 (Figure 8b). The
inclusion of targeting, and the justifiable use of the Tweedie distribution (Figures 4 & 7) have improved the
model and our confidence in the swordfish CPUE time-series. However, further analyses could be considered.
The amendment of the catch return forms to include the target per catch day, sea surface temperature, use of live
bait and hours fished should further improve the standardization of the CPUE data in this fishery in the future.
Previous attempts to classify 'catchability' of vessels within the fleet include using vessel type as a categorical
variable or using a subset of vessels from each class as indicator vessels. This information was challenging to
obtain, and neither of these attempts significantly improved the model's explanatory power. As such, including
vessel as a random effect was deemed the most appropriate solution. Given the notable variation among vessels
(Figure 6), it is unsurprising that the inclusion of the random vessel effect produced the most parsimonious error
model.
Nominal and standardized CPUE (together with CVs, 95% C.I.) for South Atlantic swordfish caught by domestic
South African long-line vessels (< 20 longitude) are presented in Table 2. Swordfish CPUE had a definitive
seasonal trend, with higher catch rates in winter and lower in summer. The nominal and standardised CPUE
time-series trends were similar, but the magnitude of annual estimates differed. The highest standardised CPUE
rates of approximately 400kg/1000 hooks observed in the first year (2004). Thereafter consistent decline in
CPUE was observed reaching less than 250kg/1000 hooks in 2012. Standardised CPUE increased notably after
2012, and the most recent estimate (2015) was approximately 300kg/1000 hooks. Overall, the analyses presented
here indicate that the CPUE for the South African swordfish fishery is seemingly stable given an initial decline
for the period 2004 - 2012. This analysis represents a considerable improvement in the methodology and data
quality from that produced in 2013.
1298
Literature cited
Carvalho, F.C., Murie, D. J., Hazin, F. H., Hazin, H. G., Leite-Mourato, B., Travassos, P., and Burgess, G. H. et
al. 2010. Catch rates and size composition of blue sharks (Prionace glauca) caught by the Brazilian pe-
lagic longline fleet in the southwestern Atlantic Ocean. Aquatic Living Resources, 23: 373–385.
Dunn, P. K., and Smyth, G. K. 2005. Series evaluation of Tweedie exponential dispersion model densities. Sta-
tistics and Computing, 15: 267–280.
He, X., Bigelow, K. A., and Boggs, C. H. 1997. Cluster analysis of longline sets and fishing strategies within the
Hawaii-based fishery. Fisheries Research, 31: 147–158.
Helser, T., Punt, A. E., and Methot, R. D. 2004. A generalized linear mixed model analysis of a multi-vessel
fishery resource survey. Fisheries Research, 70: 251–264.
Nepgen, C. 1970. Exploratory fishing for tuna off the South African west coast. Investigational report (South
Africa. Division of Sea Fisheries).
Ono, K., Punt, A. E., and Hilborn, R. 2015. Think outside the grids: An objective approach to define spatial
strata for catch and effort analysis. Fisheries Research, 170: 89–101.
Penney, A., and Griffiths, M. 1999. A first description of the developing South African longline fishery. Coll.
Vol. Sci. Pap., 49: 162–173.
Raiche, G., Magis, D., 2010. nFactors: Parallel Analysis and Non Graphical Solutions to the Cattell Scree Test.
R Package Version 2.3.3.
Struyf, A., Hubert, M., and Rousseeuw, P. J. 1997. Integrating robust clustering techniques in S-PLUS. Compu-
tational Statistics & Data Analysis, 26: 17–37.
Tascheri, R., Saavedra-Nievas, J. C., and Roa-Ureta, R. 2010. Statistical models to standardize catch rates in the
multi-species trawl fishery for Patagonian grenadier (Macruronus magellanicus) off Southern Chile.
Fisheries Research, 105: 200–214.
Thorson, J. T., and Minto, C. 2015. Mixed effects: a unifying framework for statistical modelling in fisheries
biology. ICES Journal of Marine Science, 72: 602–614.
Welsh, J. 1968. A new approach to research on tuna in South African waters. Fisheries Bulletin of South Africa,
5: 32–34.
Winker, H., Kerwath, S. E., and Attwood, C. G. 2013. Comparison of two approaches to standardize catch-per-
unit-effort for targeting behaviour in a multispecies hand-line fishery. Fisheries Research, 139: 118–131.
Winker, H., Kerwath, S. E., and Attwood, C. G. 2014. Proof of concept for a novel procedure to standardize
multispecies catch and effort data. Fisheries Research, 155: 149–159.
1299

Table 1. Model statistics for all fixed effects included in the final GAMM, summarising the degrees of freedom
(df), AIC values, BIC values, residual deviance (Res. dev.), changes in the residual deviance (Δ Dev.), the per-
centage of the total reduction in deviance explained by each factor (% explained), and corresponding p-values
when a F-test was applied to test for significance.
Model df AIC BIC Res. Dev. Δ Dev. % ex-
plained P(χ2)
Null 2 60905.6 60918.7 227144.0 0 0.0
+ Year 13 60533.3 60618.6 216567.2 -10576.8 8.8 < 0.001
+ Month 18 59289.1 59407.9 184134.7 -32432.5 26.9 < 0.001
+ s(Lat,Long) 26 59050.4 59219.8 177808.5 -6326.2 5.3 < 0.001
+ FT 28 55838.0 56020.1 106568.4 -71240.1 59.1 < 0.001
Total variation explained (%): 53.1%
Table 2. Nominal and standardized CPUE for South Atlantic swordfish caught by South African domestic long-
line vessels off the South African coast (< 20 longitude), including CVs and 95% C.I.s for the standardized
CPUE produced by the final GAMM.
Year Nominal Standardized CV lower CI upper CI
2004 280.83 401.03 0.080 343.11 468.72
2005 250.49 381.00 0.078 326.81 444.18
2006 205.91 304.35 0.075 262.60 352.74
2007 227.92 328.67 0.072 285.15 378.84
2008 193.89 268.19 0.078 230.17 312.48
2009 169.73 254.11 0.073 220.27 293.16
2010 189.81 284.75 0.076 245.23 330.64
2011 124.68 226.25 0.079 193.63 264.36
2012 127.85 212.39 0.088 178.65 252.50
2013 193.94 289.20 0.075 249.44 335.30
2014 134.75 273.62 0.075 236.05 317.17
2015 189.23 304.24 0.072 263.94 350.69
1300

Figure 1. Annual effort for the combined South African longline fleets. Longline sets that did not encounter a
swordfish are the smallest circles, and the circle diameter increases proportional to the weight of swordfish
caught per set. The black line indicates the ICCAT/IOTC boundary.
Figure 2. Annual effort for the South African swordfish directed longline fleet. Longline sets that did not en-
counter a swordfish are the smallest circles, and the circle diameter increases proportional to the weight of
swordfish caught per set. The black line indicates the ICCAT/IOTC boundary.
1301

Figure 3. A non-graphical solution to the Scree test to determine the optimal number of clusters in the multivari-
ate analysis to assess the influence of fishing tactic on CPUE estimation.
Figure 4. A graphical representation of the two clusters that characterise the different fishing tactics projected
over the first two Principal Components (PCs), where only PC1 was determined to be non-trivial. FT 1: Cluster
one dominated is by shark (blue and shortfin mako) catches. FT 2: Cluster two is dominated by swordfish and
tuna catches.
1302

Figure 5. Log-likelihood profile for over the grid of power parameters values (1 < p < 2) of the Tweedie distri-
bution. The vertical dashed line denote the optimized p used in the final standardization GAMM.
Figure 6. Random effects coeffients (dots) illustrating the deviation from the mean of zero across the 28 vessels
retained for the analysis. Dashed lines denote the 95% confidence interval of the mean µv.
1303
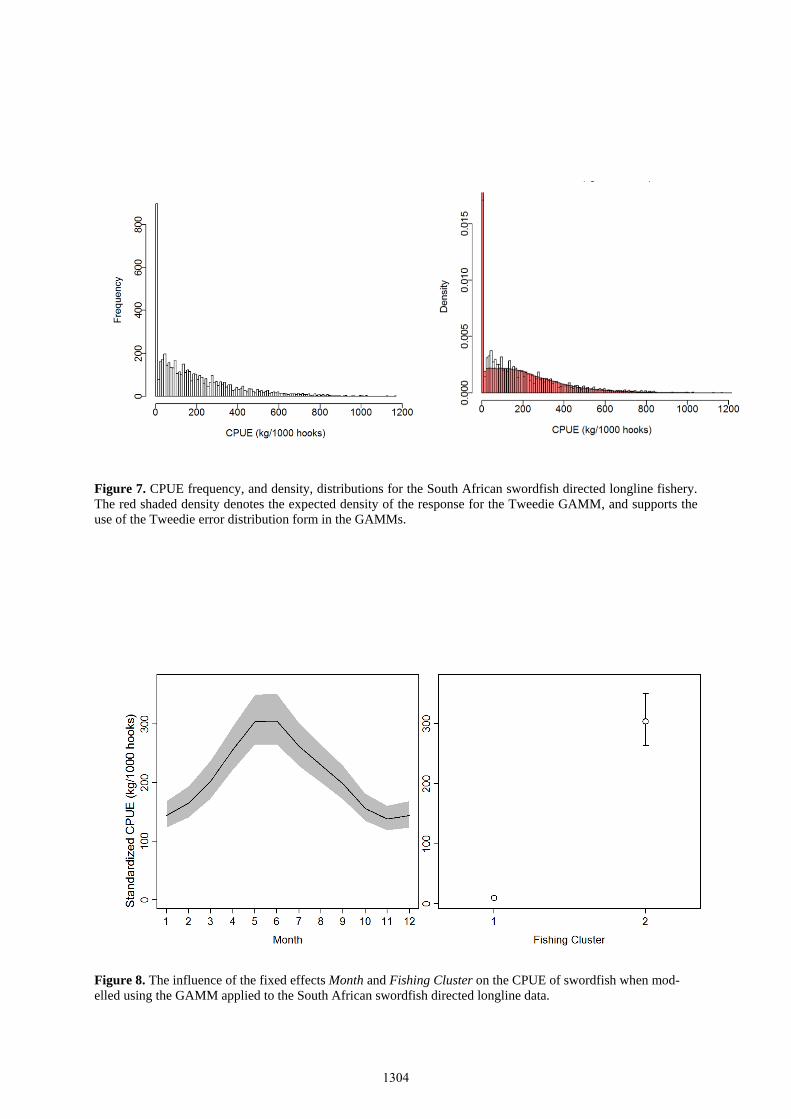
Figure 7. CPUE frequency, and density, distributions for the South African swordfish directed longline fishery.
The red shaded density denotes the expected density of the response for the Tweedie GAMM, and supports the
use of the Tweedie error distribution form in the GAMMs.
Figure 8. The influence of the fixed effects Month and Fishing Cluster on the CPUE of swordfish when mod-
elled using the GAMM applied to the South African swordfish directed longline data.
1304

Figure 9. The final standardized CPUE for the swordfish directed longline fishery of South Africa for the time
period 2004 to 2015 (upper panel), with 95% confidence intervals denoted by grey shaded areas. A comparison
of nominal and the various standardized CPUE models is provided in the lower panel.
1305