standardised expanded nutrition survey final report
TRANSCRIPT
Standardised Expanded Nutrition
Survey
FINAL REPORT
Makpandu Refugee Settlement
Yambio
South Sudan
Surveys conducted: 7-10 October 2019
2
TABLE OF CONTENTS ACRONYMS AND ABBREVIATIONS .............................................................................................. 3
ACKNOWLEDGMENTS...................................................................................................................... 4
EXECUTIVE SUMMARY ..................................................................................................................... 5
INTRODUCTION ............................................................................................................................... 13
BACKGROUND ................................................................................................................................. 13
Food Security ................................................................................................................................... 13
Health situation ............................................................................................................................... 14
Nutrition Situation .......................................................................................................................... 14
WASH Situation………………………………………………………………………………………………………... 16 SURVEY OBJECTIVES ...................................................................................................................... 16
METHODOLOGY .............................................................................................................................. 17
Sampling population and sample size .......................................................................................... 17
Survey procedure and questionnaire administration ................................................................. 17
Case definitions and calculations .................................................................................................. 20
Classification of public health problems and targets ................................................................. 23
Training, coordination and supervision ........................................................................................ 24
Data collection,entry and analysis ................................................................................................ 24
RESULTS FROM MAKPANDU ....................................................................................................... 26
LIMITATIONS..................................................................................................................................... 38
DISCUSSION ...................................................................................................................................... 39
RECOMMENDATIONS .................................................................................................................... 43
APPENDIX 1 - NAMES OF CONTRIBUTORS ............................................................................ 45
APPENDIX 2 - SUMMARY OF OVERALL QUALITY OF ANTHROPOMETRIC DATA ..... 46
APPENDIX 3 - SURVEY QUESTIONNAIRES .............................................................................. 47
APPENDIX 4 - EVENTS CALENDER ............................................................................................. 58
APPENDIX 5 - MAKPANDU REFUGEE CAMP LOCATION IN SOUTH SUDAN............... 60

3
ACRONYMS AND ABBREVIATIONS
CMAM Community Management of Acute Malnutrition CSB Corn-Soya Blend ENA Emergency Nutrition Assessment EPI Expanded Programme on Immunization Epi Info Name of CDC software for epidemiological investigations GAM Global Acute Malnutrition GFR General Food Ration GFD General Food Distribution HAZ Height-for-Age z-score HDDS Household Diversity Score HH Household irHIS Integrated Refugee Health Information System IYCF Infant and Young Child Feeding KCAL Kilocalorie MAM Moderate Acute Malnutrition MOH Ministry of Health MUAC Middle Upper Arm circumference OTP Out-patient Therapeutic Programme PLW Pregnant and Lactating Women ProGres UNHCR registration database for refugees SAM Severe Acute Malnutrition SC Stabilization Centre SD Standard Deviation SFP Supplementary Feeding Programme SMART Standardised Monitoring & Assessment of Relief & Transitions SSP South Sudanese Pound TFP Therapeutic Feeding Programme UNHCR United Nations High Commissioner for Refugees UNICEF United Nations Children’s Funds WASH Water Sanitation and Hygiene WAZ Weight-for-Age z-score WFH Weight-for-height WHZ Weight-for-Height z-score WFP World Food Programme WHO World Health Organization WVI World Vision International

4
ACKNOWLEDGMENTS
Gratefully acknowledge the important contributions made by so many that made this survey possible.
Firstly, acknowledge UNHCR Juba and Yambio offices, UNHCR Public Health Unit for leading and coordinating the planning, training and field work, the UNHCR Senior Management for general guidance and oversight.
Secondly sincere appreciation is extended to World Vision for planning the field level logistics and for providing staff during the entire duration of the exercise. WFP for co-facilitating the training and the data collection support supervision. CRA for facilitating access to the refugee camp. Special thanks go to Terry Theuri (UNHCR Nutrition and Food security officer) who coordinated the survey; to WVI health and nutrition team including Godfrey Otobi, Chan Gatluak and Dora Wani, Walter Arnold Ochan for survey team operations and supervision support; to Merlyn Chapfunga (WFP nutritionist) who assisted with training, survey supervision and data quality check; to Sebit Mustafa Sebit ( UNHCR Senior Public Health Associate for working on the irHIS health data consolidation; to Dr Gebrewold Petros Yohannes for guidance and review of the report; and to Naser Mohmand ( UNHCR Senior Regional Nutrition and Food security Officer for technical review of the SENS terms of reference and report.
Finally, sincerely thank the refugee population who gave up their time to participate and allowed us to measure their children and, most importantly, to the children themselves. A complete list of key individuals involved can be found at Appendix 1.

5
EXECUTIVE SUMMARY
UNHCR and WVI carried out a nutrition survey in Makpandu from 7 to 10 October 2019. The overall
aim of this survey was to assess the general nutrition and health status of refugee population and
formulate workable recommendations for appropriate nutritional and public health interventions.
The survey was based on the UNHCR Standardized Expanded Nutrition Survey (SENS) guidelines for
refugee populations (version 2, 2013) http://sens.unhcr.org/. Four SENS modules including i.
anthropometric and health, ii. Anaemia, iii. IYCF, and iv. Food Security were carried out. 2019 was
the first-time modules ii, iii and iv were carried out thus the data from these modules will be used as
the baseline.
A cross-sectional survey was conducted using simple random sampling. Households were physically
labelled with unique numbers per block. To reduce non-response rate and ensure results were
representative of people living in the settlement at the time of the survey, empty households1, as
verified through neighbours were not be labelled and thus not be included in the sampling frame. A
random household sample was drawn from the actual number of physically verified household before
the survey.
A total of six survey teams composed of four members each (one team leader, one haemoglobin
measurer, one anthropometric measurer/translator and one anthropometric/haemoglobin
measurement assistant) were included in each survey. A standardised training lasting four days was
provided followed which included a standardisation test. Data collection lasted four days.
The survey teams were supported by a team of 2 supervisors and 2 coordinators who roved between
the teams during the data collection.
Mobile phone questionnaires using Open Data Kit (ODK) android software for all the modules was
used for data collection. Data validation was carried out on a daily by the survey coordinator which
allowed for daily feedback to the survey teams. Data analysis was carried out using ENA for SMART
July 9th, 2015 version for anthropometric indices and Epi info version 7.2.3.1 for all the other data.
The nutrition situation in Makpandu settlement will continue to require attention in 2020. The GAM
prevalence in Makpandu settlement was found to be [3.6% (3.3-4.0 95% C.I.)] which falls under low
prevalence. The proportion of children that had Middle Upper Arm Circumfrence (MUAC) (< 125 mm
and/or oedema) was 5.2% (4.7 - 5.7 95% C.I.). Analysis of the proportion of children that were found
malnourished based on both Weight for Height Zscores (WHZ) and MUAC was 9.5% (24/252). In
2018 the Global Acute Malnutrition (GAM) prevalence was 5.3%; MUAC < 125 mm and/or oedema
was 3.5% and proportion of children that were found malnourished based on both WHZ and MUAC
was 5.8%. Looking at the proportion of children found malnourished based on both criteria the
proportion of malnourished children although not statistically significant (p>0.05) indicates a likely
deteriorating situation in 2019 compared to 2018.
The prevalence of global stunting of 32.1 (28.9 - 35.5) falls under very high category based on the
WHO/UNICEF 2008 categorisation. This increased compared to 21.1% in 2018. This should however
be interpreted with caution due to the age estimation limitation. 31% of the children 6-59 months
did not have a reliable age documentation.
1 An empty household will be considered an abandoned and excluded from the nutrition survey if no one was present in that tent for the last one month.
6
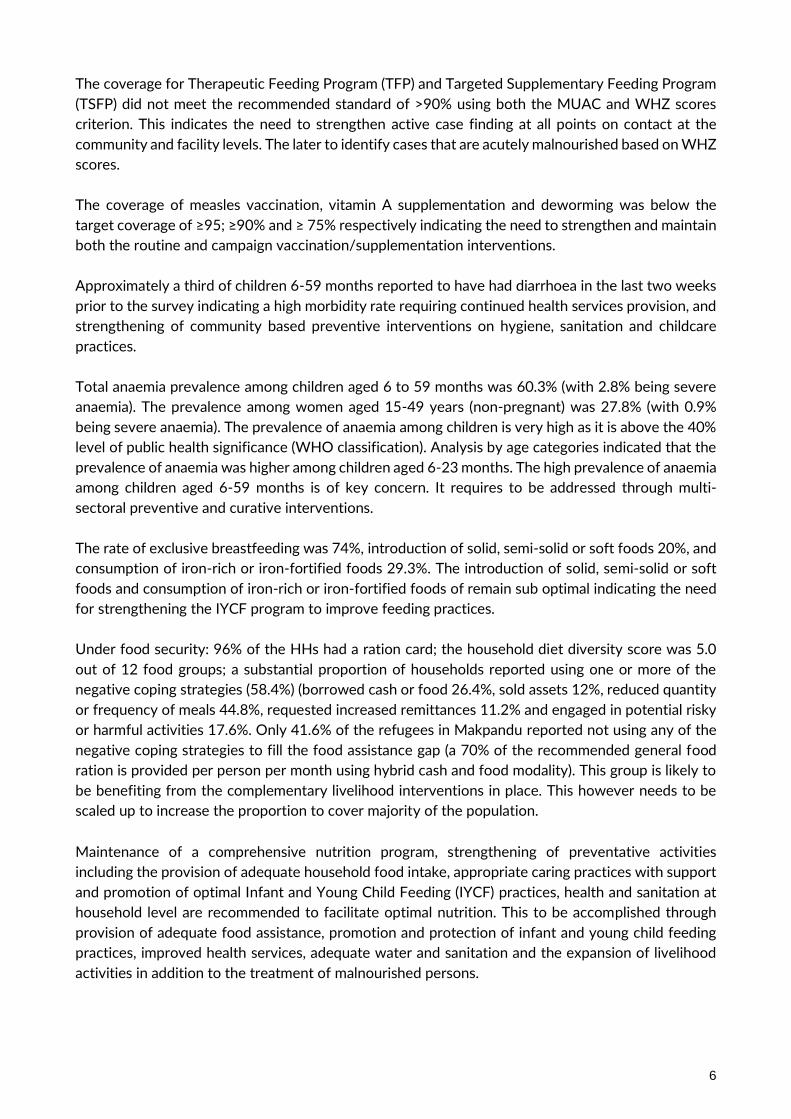
The coverage for Therapeutic Feeding Program (TFP) and Targeted Supplementary Feeding Program
(TSFP) did not meet the recommended standard of >90% using both the MUAC and WHZ scores
criterion. This indicates the need to strengthen active case finding at all points on contact at the
community and facility levels. The later to identify cases that are acutely malnourished based on WHZ
scores.
The coverage of measles vaccination, vitamin A supplementation and deworming was below the
target coverage of ≥95; ≥90% and ≥ 75% respectively indicating the need to strengthen and maintain
both the routine and campaign vaccination/supplementation interventions.
Approximately a third of children 6-59 months reported to have had diarrhoea in the last two weeks
prior to the survey indicating a high morbidity rate requiring continued health services provision, and
strengthening of community based preventive interventions on hygiene, sanitation and childcare
practices.
Total anaemia prevalence among children aged 6 to 59 months was 60.3% (with 2.8% being severe
anaemia). The prevalence among women aged 15-49 years (non-pregnant) was 27.8% (with 0.9%
being severe anaemia). The prevalence of anaemia among children is very high as it is above the 40%
level of public health significance (WHO classification). Analysis by age categories indicated that the
prevalence of anaemia was higher among children aged 6-23 months. The high prevalence of anaemia
among children aged 6-59 months is of key concern. It requires to be addressed through multi-
sectoral preventive and curative interventions.
The rate of exclusive breastfeeding was 74%, introduction of solid, semi-solid or soft foods 20%, and
consumption of iron-rich or iron-fortified foods 29.3%. The introduction of solid, semi-solid or soft
foods and consumption of iron-rich or iron-fortified foods of remain sub optimal indicating the need
for strengthening the IYCF program to improve feeding practices.
Under food security: 96% of the HHs had a ration card; the household diet diversity score was 5.0
out of 12 food groups; a substantial proportion of households reported using one or more of the
negative coping strategies (58.4%) (borrowed cash or food 26.4%, sold assets 12%, reduced quantity
or frequency of meals 44.8%, requested increased remittances 11.2% and engaged in potential risky
or harmful activities 17.6%. Only 41.6% of the refugees in Makpandu reported not using any of the
negative coping strategies to fill the food assistance gap (a 70% of the recommended general food
ration is provided per person per month using hybrid cash and food modality). This group is likely to
be benefiting from the complementary livelihood interventions in place. This however needs to be
scaled up to increase the proportion to cover majority of the population.
Maintenance of a comprehensive nutrition program, strengthening of preventative activities
including the provision of adequate household food intake, appropriate caring practices with support
and promotion of optimal Infant and Young Child Feeding (IYCF) practices, health and sanitation at
household level are recommended to facilitate optimal nutrition. This to be accomplished through
provision of adequate food assistance, promotion and protection of infant and young child feeding
practices, improved health services, adequate water and sanitation and the expansion of livelihood
activities in addition to the treatment of malnourished persons.

7
The summary results are as below
Table 1: Summary of results
Makpandu
Classification of public health
significance / target (where applicable)
Children (6-59 months)
% 95%CI)
No. of children surveyed 252
Acute Malnutrition (N=248)
Global Acute Malnutrition (GAM) (n=9) 3.6
(3.3-4.0)
Critical if ≥ 15%
Moderate Acute Malnutrition (MAM) (n=8) 3.2
(2.9 – 3.6)
Severe Acute Malnutrition (SAM) (n=1) 0.4
(0.4 – 0.4)
Oedema (n=0) 0.0
Stunting (N=246)
Total Stunting (n=79) 32.1 (28.9-35.5)
Critical if ≥ 40%
Severe Stunting (n=22) 8.9 (8.1-9.9)
Mid Upper Arm Circumference (MUAC) (N=252)
Prevalence of MUAC <125mm or oedema (n=13) 5.2 (4.7-5.7)
Prevalence of MUAC < 125 mm and >= 115 mm, no oedema (n=9)
3.6 (3.2-3.9)
Prevalence of MUAC < 115mm and/or oedema (n=4) 1.6
(1.4-1.8)
Anaemia (6-59 months) (N=249)
Total Anaemia (Hb <11 g/dl) (n=152) 60.3
(54.0-66.4) High if ≥ 40%
Mild (Hb 10-10.9) (n=66) 26.2
(20.9-32.1)
Moderate (Hb 7-9.9) (n=79) 31.4
(25.7-37.5)
Severe (Hb<7.0) (n=7) 2.8
(1.1-5.6)
Anaemia (6-23 months) (N=101)
Total Anaemia (Hb <11 g/dl) (n=68) 68.7
(58.6-77.6)
Mild (Hb 10-10.9) (n=26) 26.3
(17.9-36.1)
Moderate (Hb 7-9.9) (n=40) 40.4
(30.7-50.7)
Severe (Hb<7.0) (n=2) 2.0
(0.3-7.1)
Programme coverage (6-59 months)
OutpatientTherapeutic Program (OTP) (based on all admission criteria WHZ and MUAC) (n=0/3)
0
Target of ≥ 90%
Targeted Supplementary Feeding Program (TSFP) (based on all admission criteria WHZ and MUAC) (n=1/16)
6.3
(0.2-30.2)
Target of ≥ 90%
Measles vaccination with card (9-59 months) (n=69/237) 29.1
(23.4-35.4)
Measles vaccination with card or recall (9-59 months) 89.9

8
Makpandu
Classification of public health
significance / target (where applicable)
(n=213/237) (85.3-93.4)
Vitamin A supplementation coverage with card, within past 6 months (6-59 months) (n=5/252)
2.0
(0.7-4.6)
Target of ≥ 95%
Vitamin A supplementation coverage with card or recall, within past 6 months (6-59 months) (n=184/252)
73.0 (67.1-78.4)
Deworming coverage within the past 6 months (12-59 months) (n=99/211)
46.9%
Morbidity (N=252)
Diarrhoea in past 2 weeks 34.5
(28.7-40.8)
Infant and young child feeding
Timely initiation of breastfeeding (n=98/126) 77.8 (69.5-84.7)
Exclusive Breastfeeding under 6 months (n=20/27) 74.1
(53.7-88.9)
Continued breastfeeding at 1 year(n=15/18) 83.3 (58.6-96.4
Continued breastfeeding at 2 years (n=1/27) 3.7 (0.1-19.0)
Introduction of solid, semi-solid or soft foods (n=3/15) 20
(4.3-48.1)
Consumption of iron-rich or iron-fortified foods (n=29/99) 29.3 (20.6-39.3)
Bottle feeding (n=1/126) 0.8 (0.0-4.3)
Women 15-49 years (N=115)
Anaemia (non-pregnant)
Total, Anaemia (Hb <12.0 g/dl) (n=32/115) 27.8
(19.9-37.0) High if ≥ 40%
Mild (Hb 11.0-11.9) (n=20) 17.4
(11.0-25.6)
Moderate (Hb 8.0-10.9) (n=11) 9.6
(4.9-16.5)
Severe (Hb<8.0) (n=1) 0.9
(0-4.8)
Programme enrolment pregnant women (N=23)
Pregnant women currently enrolled in the ANC (n=15/23) 65.2
(42.7-83.6)
Pregnant women currently receiving Iron-folic acid pills (n=15/23) 65.2
(42.7-83.6)
Food security (N=125) % (95% CI)
Proportion of HH with a ration card (n=120) 96
Average Household Diet Diversity Score (HDDS)
5.0
Proportion of households not consuming any vegetables, fruits, meat, eggs, fish/seafood, and milk/milk products (n=7)
5.6 (2.3-11.2)
Proportion of households consuming either a plant or animal source of vitamin A (n=103)
82.4 (74.6-88.6)
Proportion of households consuming organ meat/flesh meat, or fish/seafood (n=20)
16 (10.1-23.6)
Proportion of households reporting using the following coping strategies over the past month*:

9
Makpandu
Classification of public health
significance / target (where applicable)
Borrowed cash, food or other items with or without interest (n=33/125)
26.4 (18.9-35.0)
Sold any assets that would not have normally sold (furniture, seed stocks, tools, other NFI, livestock etc.) (n=15/125)
12 (6.9-19.0)
Requested increased remittances or gifts as compared to normal (n=14/125)
11.2 (6.3-18.0)
Reduced the quantity and/or frequency of meals and snacks (n=56/125)
44.8 (35.9-54.0)
Begged (n=0/125) 0
Engaged in potentially risky or harmful activities (n=22/125) 17.6
(11.4-25.4)
Proportion of households reporting using none of the coping strategies over the past month (n=52/125)
41.6 (32.9-50.8)
* The total is over 100% as households used several negative coping strategies. Interpretation of results:
WHO prevalence thresholds for wasting in children aged 6-59 months (low weight-for-height) Previous prevalence ranges
Label New prevalence ranges 2018
Label
- - <2.5 Very low <5% Acceptable 2.5 - < 5 Low 5 – 9% Poor 5 - <10 Medium 10 – 14% Serious 10 - <15 High >15% Critical ≥ 15 Very high
WHO prevalence thresholds for stunting in children aged 6-59 months (low height-for-age)
Previous prevalence ranges
Label New prevalence ranges 2018
Label
- - <2.5 Very low <20% Acceptable 2.5 - < 10 Low 20 – 30% Poor 10 - < 20 Medium 30 – 39% Serious 20 - < 30 High >40% Critical ≥ 30 Very high
WHO classification of public health significance for the prevalence of Anamia (children 6-59-month-old and non-pregnant Women 15-49 years old)2 Prevalence % High Medium Low Anaemia ≥40 20-39 5-19
Source: WHO (2000)
• The GAM prevalence in Makpandu settlement was found to be [3.6% (3.3-4.0 95% C.I.)] which
falls under low prevalence. The proportion of children that had MUAC (< 125 mm and/or
oedema) was 5.2% (4.7 - 5.7 95% C.I.). Analysis of the proportion of children that were found
malnourished based on both WHZ and MUAC was 9.5% (24/252). In 2018 the GAM
prevalence was 5.3%; MUAC < 125 mm and/or oedema was 3.5% and proportion of children
that were found malnourished based on both WHZ and MUAC was 5.8%. Looking at the
proportion of children found malnourished based on both criteria the proportion of
malnourished children although not statistically significant (p>0.05) indicates a likely
deteriorating situation in 2019 compared to 2018.

10
• The prevalence of global stunting of 32.1 (28.9 - 35.5) falls under very high category. This
increased compared to 21.1% in 2018. This should however be interpreted with caution due
to the age estimation limitation. 31% of the children 6-59 months did not have a reliable age
documentation.
• The enrolment coverage for TFP and TSFP did not meet the recommended standard of >90%
using both the MUAC and WHZ scores criterion. In addition to this most of the cases
identified with acute malnutrition based on the WHZ scores did not meet the MUAC cut off
<125mm and vice versa. MUAC is the tool used for community screening to identify
malnourished children. This indicates the need to strengthen case finding at all points on
contact at the community and facility levels. The later to identify cases that are acutely
malnourished based on WHZ scores.
• The coverage of measles vaccination, vitamin A supplementation and deworming was below
the target coverage of ≥95; ≥90% and ≥ 75% respectively indicating the need to strengthen
and maintain both the routine and campaign vaccination/supplementation interventions.
• Approximately a third of children 6-59 months reported to have had diarrhoea in the last two
weeks prior to the survey indicating a high morbidity rate requiring continued health services
provision, and strengthening of community based preventive interventions on hygiene,
sanitation and childcare practices.
• Total anaemia prevalence in children 6 to 59 months was 60.3% (with 2.8% being severe
anaemia). The prevalence among women aged 15-49 years (non-pregnant) was 27.8% (with
0.9% being severe anaemia). The prevalence of anaemia among children is very high as it is
above the 40% level of public health significance (WHO classification). Analysis by age
categories indicated that the prevalence of anaemia was higher among children aged 6-23
months. The high prevalence of anaemia among children aged 6-59 months is of key concern.
It requires to be addressed through multi-sectoral preventive and curative interventions.
• The rate of exclusive breastfeeding was 74%, introduction of solid, semi-solid or soft foods
20%, and consumption of iron-rich or iron-fortified foods 29.3%. The introduction of solid,
semi-solid or soft foods and consumption of iron-rich or iron-fortified foods are sub optimal
indicating the need to strengthen the IYCF program to improve feeding practices.
• Under food security: 96% of the HHs had a ration card; the household diet diversity score
was 5.0 out of 12 food groups; a substantial proportion of households reported using one or
more of the negative coping strategies (58.4%) (borrowed cash or food 26.4%, sold assets
12%, reduced quantity or frequency of meals 44.8%, requested increased remittances 11.2%
and engaged in potential risky or harmful activities 17.6%. Only 41.6% of the refugees in
Makpandu reported not using any of the negative coping strategies to fill the food assistance
gap (a 70% of the recommended general food ration is provided per person per month using
hybrid cash and food modality). This group is likely to be benefiting from the complementary
livelihood interventions in place. This however needs to be scaled up to increase the
proportion to cover majority of the population.

11
Recommendations and priorities
Nutrition related
▪ Maintain a comprehensive Community based Management of Acute Malnutrition (CMAM)
program providing both therapeutic and supplementary feeding programs to facilitate the
rehabilitation of identified acute malnourished children, pregnant and lactating women, people
living with HIV/AIDS, and TB patients on treatment. This to include active case finding and
community mobilization. (UNHCR, UNICEF, WFP and WVI)
▪ Active case finding and referral of all identified children aged 6-59 months children with a MUAC
less than 125mm for management of acute malnutrition through community outreach follow up
at household level (WVI).
▪ Conduct a two-step MUAC and WHZ scores (for children with MUAC at risk) screening monthly
at all the health facility contact points including the EPI, triage and BSFP sites to ensure both high
MUAC and WHZ score coverage (WVI).
▪ Maintain blanket supplementary feeding programme for children 6-23 months, pregnant and
lactating women using a fortified blended food or lipid-based supplement to prevent malnutrition
and to cover the nutrient gap these vulnerable groups face considering their predominant grain
based general food diet (UNHCR, WFP and WVI).
▪ Continue strengthening the capacity of the nutrition program, in terms of provision of adequate
staff and training to ensure quality provision of both curative and preventative components
(UNHCR, WFP, UNICEF and WVI).
▪ Awareness creation, protection and promotion of appropriate IYCF practices (using the UNHCR
multisectoral framework for action in refugee situations approach) to further improve
breastfeeding practices and to strengthen complementary feeding practices (UNHCR, UNICEF
and WVI)
▪ Expand and strengthen the prevention of malnutrition components including community
outreach information, education and communication and diverse diet utilization aspects to stop
malnutrition from occurring in the first place. (UNHCR, UNICEF, WFP and WVI).
▪ Conduct quarterly mass MUAC screening to monitor the evolution of the nutrition situation in
Makpandu settlement. This to target children aged 6-59 months and PLWs (WVI)
▪ Prioritise implementation of the refugee micronutrient reduction strategy to curb the high
anaemia prevalence (WVI)
▪ Ensure regular monitoring and supervision, quarterly joint monitoring and yearly program
performance evaluations in Makpandu to assess performance progress and formulate
recommendations for any identified gaps. (UNHCR, WFP, UNICEF and WVI)
▪ Undertake a follow up annual nutrition survey to analyze trends and facilitate program impact
evaluation. (UNHCR, WVI, WFP and UNICEF)
12
Food security related
▪ Provision of food assistance providing the minimum dietary requirements (2100kcal/person/day).
(UNHCR, WVI and WFP).
▪ Continue the routine joint monthly food basket monitoring on site and ensure Makpandu
inclusion in the country post distribution monitoring at the household level (UNHCR, WVI and
WFP).
▪ Expand the coverage of sustainable food security and livelihood solutions in Makpandu
settlement to complement the provided food assistance (UNHCR, WFP and WVI).
Health related
▪ Maintain and strengthen the provision of comprehensive primary health care programme for
refugees and host populations in Makpandu. (UNHCR and WVI)
▪ UNICEF, WVI and UNHCR to ensure that Expanded Programme on Immunization (EPI), Vitamin
A supplementation and de-worming campaigns and routine programmes are strengthened to
increase coverage to acceptable standards.
▪ Adequate clean water provision to be maintained in 2019. In addition to this, hygiene promotion
and latrine coverage strengthening to reduce the diarrhoea caseload to be ensured. (UNHCR and
WVI)
13
INTRODUCTION
This report presents the results of nutrition survey conducted in Makpandu settlement. The survey
was carried out from 7 to 10 October 2019.
This report is divided into the following sections:
• Background: This section sets out background information related to the health, nutrition, food
security and Water Sanitation and Hygiene promotion (WASH) situation for Makpandu
settlement;
• Methodology;
• Results: presents the findings of four SENS modules including i. anthropometric and health, ii.
Anaemia, iii. IYCF, and iv. Food Security;
• Discussion; and
• Recommendations.
Background
Makpandu refugee settlement has an estimated refugee population of 50382 who are mainly from
DRC and CAR, and a few from Sudan and Eritrea.
Key partners in terms of the provision of the health, nutrition and food security services include
UNHCR, WFP, UNICEF and World Vision International (WVI). UNHCR is mainly involved in
coordinating services offered to the refugees through the partners. WFP’s main role is to ensure that
the refugee’s food security is adequately addressed through the provision of the general food
assistance once per month. In addition to this, WFP supports the supplementary feeding program
targeting vulnerable groups. UNICEF in collaboration with UNHCR provides support to the
management of severe acute malnutrition and IYCF programmes. WVI implements the health,
nutrition and food security programme.
Food Security
Refugees in the Makpandu settlement are mainly dependent on the WFP provided food assistance
and have limited access to additional sources of food/income. From January to October 2019 the
provided ration consisted of 350g maize in kind/per person/day and cash ranging between SSP 1150
to SSP 1250 (depending on food basket market rate) for pulses, oil and salt. In October 2019 the
cereals were provided at 83.3g/ per person per day. Since May 2018, refugees in Makpandu receive
a combination of cash and food – known as the hybrid basket. Under this modality, refugees still
receive the 70% equivalent of the general food ration. 100% cereal was provided in kind while pulses,
vegetable oil and salt were provided in 100 cash. The cash component also includes milling assistance.
Galaxy International is the financial service provider contracted to carry out the cash-component of
the GFD, while the WVI remains responsible for the food distribution. The food assistance pipeline
was stable most year but faced cereal provision challenges from October 2019. The cereal provision
in October only covered 17% of the required cereal ration.
See breakdown below showing the monthly ration provision.
2 UNHCR ProGres September 2019 population

14
Table 2: General food ration provision by month – Makpandu refugee settlement, Yambio, 2019
Ration
provided at
the
distribution
in g/p/d Standard Jan Feb Mar Apr May Jun Jul Aug Sep Oct
Cereal 500g 350 350 350 350 350 350 350 350 350 83.3
Cash in SSP
for Pulses,
oil, salt &
milling 1170 1150 1250 1250 1250 1250 1250 1250 1250 1250
% of
standard
met 70 70 70 70 70
70
70
70
70
28
Health situation
Makpandu refugee settlement has one Primary Health Care Centre (PHCC).
The overall crude mortality rate for Makpandu settlement from the UNHCR Integrated Refugee
Health Information System (iRHIS) from January to October 2019 was 0.03/10000/day while under-
five mortality rate was 0.1/10000/day which was below the emergency threshold of <0.75 and <2
respectively. This indicates a stable population.
The main causes of illness in 2019 were malaria, respiratory tract infections, watery diarrhoea, skin
disease, intestinal worms and chronic diseases. This was the same pattern in 2018.
Figure 1: Under-five proportional morbidity from January to October 2019; Makpandu, Yambio
settlement (UNHCR irHIS)
Nutrition Situation
Health data from Makpandu refugee settlement traditionally reported low malnutrition cases. In 2016
however the MUAC screening data at the health facilities indicated a rising trend in the second half
of the year. This prompted the need for further investigation. Results from a Mass MUAC screening
carried out at the end of the year showed a proportion of 7.2% children 6-59 months were acute
44.0%
21.0%
11.0%
7.0%
5.0% 7.0%5.0%
Malaria
RTI
Acute Waterly Diarrhoea
Skin disease
Intestinal worms
chronic disease
Others
15
malnourished (had a MUAC <12.5cm) indicating a poor nutrition status. Following this a
comprehensive nutrition program was set up to prevent malnutrition and rehabilitate all identified
malnourished cases. This has been in place from 2017 through to 2019.
Nutrition services and activities in the settlement at the time of the survey included:
• Targeted Supplementary Feeding Programmes (TSFP) for moderately acute malnourished
children aged 6-59 months using Plumpy’Sup or Corn Soya Blend Plus (CSB++).
• Outpatient and inpatient therapeutic feeding programmes for severely acute malnourished
children.
• Blanket Supplementary Feeding Program (BSFP) targeting children 6 to 23 months and
Pregnant and Lactating Women (PLW). Both children and PLW receive 200g/person/day of
CSB++.
• Basic infant and young child feeding support and promotion programme. At the facility level
this is integrated into the primary health care components i.e. Ante Natal Care (ANC), Post-
Natal Care (PNC) Maternity and Nutrition. At the community level, community structures are
used and include Community Health Promoters (CHPs
• Community outreach MUAC screening referral and follow up.
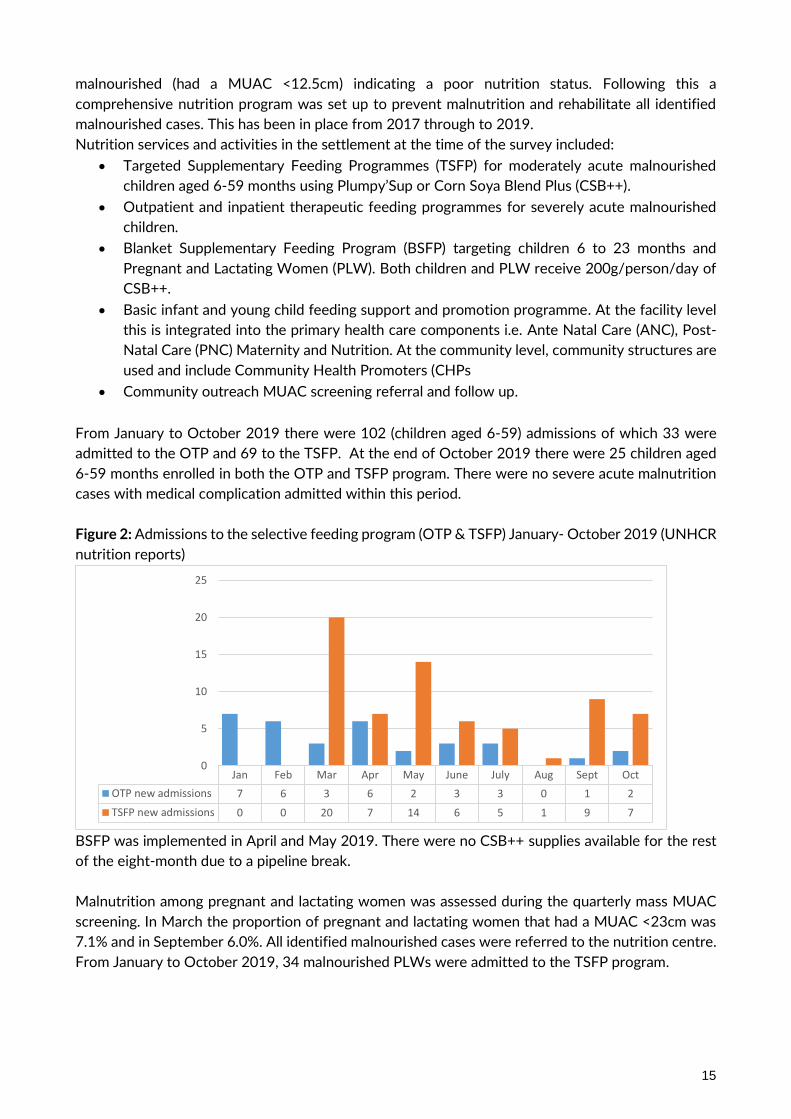
From January to October 2019 there were 102 (children aged 6-59) admissions of which 33 were
admitted to the OTP and 69 to the TSFP. At the end of October 2019 there were 25 children aged
6-59 months enrolled in both the OTP and TSFP program. There were no severe acute malnutrition
cases with medical complication admitted within this period.
Figure 2: Admissions to the selective feeding program (OTP & TSFP) January- October 2019 (UNHCR
nutrition reports)
BSFP was implemented in April and May 2019. There were no CSB++ supplies available for the rest
of the eight-month due to a pipeline break.
Malnutrition among pregnant and lactating women was assessed during the quarterly mass MUAC
screening. In March the proportion of pregnant and lactating women that had a MUAC <23cm was
7.1% and in September 6.0%. All identified malnourished cases were referred to the nutrition centre.
From January to October 2019, 34 malnourished PLWs were admitted to the TSFP program.
Jan Feb Mar Apr May June July Aug Sept Oct
OTP new admissions 7 6 3 6 2 3 3 0 1 2
TSFP new admissions 0 0 20 7 14 6 5 1 9 7
0
5
10
15
20
25

16
WASH situation
Access to water in Makpandu in 2019 was maintained through 13 water points (11 boreholes fitted
with India Mark II pumps and 2 submersible pumps fixed with an 8,000- and 10000-liters capacity
elevated water tank. Routine water quality management (testing and chlorination of boreholes) and
their maintenance was also carried out regularly. An average of 19.2 liters per person per day was
available in 20193 which meets the minimum SPHERE standard but is lower than the UNHCR
standard of ≥20 liters per person per day. The population in Makpandu will continue to require the
water to be maintained within the minimum standards.
As of end of October 2019, Makpandu settlement had 431 functional sanitation facilities (416
household pit latrines serving 1,798 households. In addition to this there were 15 public/institutional
Ventilated Improved Pit (VIP) latrines (5 at Makpandu primary school, 3 at Makpandu secondary
school, 2 at the health facility, 1 at the proposed teacher's quarter, and 1 at the child friendly space,
1 at Makpandu market, 1 at the food distribution centre and 1 at WVI team house). The overall
average number of persons per hygiene promoter ratio was 507 in Makpandu. This number needs to
be maintained to ensure there is no open defecation in Makpandu settlement and to reduce the
disease burden.
SURVEY OBJECTIVES
Specific primary objectives of the survey
a. To measure the prevalence of acute malnutrition among children 6-59 months
b. To measure the prevalence of stunting among children 6-59 months
c. To determine the coverage of measles vaccination among children 9-59 months
d. To determine the coverage of vitamin A supplementation in the last six months among
children 6-59 months
e. To determine the coverage of de-worming in the last six months among children 12-
59 months
f. To determine the two-week period prevalence of diarrhoea among children 6-59
months
g. To measure the prevalence of anaemia among children 6-59 months and women of
reproductive aged 15-49 years (non-pregnant)
h. To investigate IYCF practices among children 0-23 months
i. To determine the coverage of ration cards and the duration the GFD ration lasts for
recipient households
j. To determine the extent to which negative coping strategies are used by households
k. To assess household dietary diversity
l. To establish recommendations on actions to be taken to address the situation
Secondary objectives:
a. To determine the coverage of targeted supplementary and therapeutic feeding
programmes for children 6-59 months
b. To determine enrolment into Antenatal Care clinic and coverage of iron-folic acid
supplementation in pregnant women
3 Water monitoring report_Makpandu WASH report

17
METHODOLOGY
Survey population and sample size
The sample size was calculated using the Emergency Nutrition Assessment (ENA) for Standardized
Monitoring and Assessment of Relief and Transitions (SMART) software version July 9th, 2015
following UNHCR SENS guidelines version 2 (2013) http://sens.unhcr.org/. The GAM prevalence
estimate was based on the likely scenario using the 2018 nutrition survey results. The higher
confidence interval was used for the estimated prevalence. The total population and percentage of
under-5 was derived from the UNHCR ProGres data. The average household size was based on
UNHCR ProGres and household listing data. A non-response rate of 10% was used in both camps as
household listing was carried out right before the survey data collection.
Table 3: Sample size calculation: Anthropometry in Makpandu settlement
Makpandu
Estimated prevalence (%) 16.9
± Desire precision (%) (UNHCR SENS guidelines) 4
Average household size (ProGres) 6.2
<5 population (%) (ProGres) 17.8
Nonresponse households (%) 10
Total camp population (ProGres) 50384
Households to be included for Anthropometry and Health
module (ENA for SMART)5
266 (Approximately 238 children)
As the population of children under five, was less than 10,000, a correction factor was used while
calcuating the sample size in ENA for SMART. The sample size for anthropometry and health was
used for the IYCF and child anaemia. Half the sample size of anthropometry (every other household)
was used as the sample size for women anaemia and food security modules. This translated to 133
households for the women anaemia and food security module.
Sampling procedure and questionnaire administration
Selecting households and individuals
A cross-sectional survey was conducted using simple random sampling. Households were physically
labelled with unique numbers per block using the survey household definition. To reduce non-
response rate and ensure results were representative of people living in the settlement at the time of
the survey, empty households6, as verified through neighbours were not be labelled and thus not be
included in the sampling frame. Following the listing and sample size calculation a random household
sample was drawn from the actual number of physically verified household before the survey.
4 UNHCR ProGres data September 2019 5 Since the U5 population is <10,000 in all camps, the sample size calculation needs to be corrected to account for small population size. 6 An empty household will be considered an abandoned and excluded from the nutrition survey if no one was present in
that tent for the last one month.

18
All the eligible household members were included in the survey; that is all children 6 to 59 months /
(0-23 months for IYCF) and women 15 to 49 years in a sampled household. The interview was
conducted in most cases with the mother in the household or in her absence with an adult member
of the household who was knowledgeable with the everyday running of the household. The survey
defined a household as the number of people who regularly stay together and eat from the same pot.
266 of the listed households of the 529 listed were surveyed. Each team was allocated a number of
households. Block locations and boundaries was discussed during the training to ensure all teams
knew where to go.
If a child was absent, the teams were instructed to revisit the household one more time. If they were
unsuccessful after this, the child was recorded as absent and they were not replaced with another
child. If the household refused to participate then it was considered a refusal and the household was
not replaced with another. If a selected child was living with a disability or a physical deformity
preventing certain anthropometric measurements the child was still included in the assessment of
the other indicators. If it was determined that a selected household did not have any eligible children,
the questionnaire was not administered, and the team moved to the next household.
Questionnaires
Mobile phone questionnaires using Open Data Kit (ODK) android software was used for data
collection. See Appendix 3.
The questionnaires were prepared in English language. Following the survey training, revisions were
adapted. The questionnaires were translated to the local dialect via the enumerators where necessary
during data collection. The translation was practiced during training.
Four module questionnaires from SENS were designed to provide information on the relevant
indicators of the different target groups as indicated in the survey objectives. The four-module
questionnaire covered the following areas and the following measurements:
Children 6-59 months- This included questions and measurements of children aged 6-59 months.
Information was collected on anthropometric status, oedema, and enrolment in selective feeding
programmes, immunisation (measles), vitamin A supplementation and morbidity from diarrhoea in
past two weeks before the survey and haemoglobin status.
Infant 0-23 months- This included question on infant and young child feeding for children aged 0- 23
months.
Women 15-49 years- This included questions and measurements of women aged 15 – 49 years.
Information was collected on women’s pregnancy status, coverage of iron-folic acid pills and ANC
attendance for pregnant women, and haemoglobin status for non-pregnant women.
Food Security- This included questions on access and use of the GFD ration, negative coping
mechanisms used by household members and household dietary diversity.

19
Measurement methods
Household-level indicators
Food security: The questionnaire used was from UNHCR’s Standardized Expanded Nutrition Survey
(SENS) Guidelines for Refugee Populations Version 2 (2013).
Individual-level indicators
Sex of children: gender was recorded as male or female.
Birth date or age in months for children 0-59 months: the exact date of birth (day, month, and year) was
recorded from either an EPI card, child health card or birth notification if available. If no reliable proof
of age was available, age was estimated in months using a local event calendar and recorded in
months on the phone. If the child’s age could not be determined by using a local events calendar or
by probing, the child’s length/height was used for inclusion; the child had to measure between 65 cm
and 110 cm.
Age of women 15-49 years: Reported age was recorded in years.
Weight of children 6-59 months: measurements were taken to the closest 100 grams using an electronic
scale (SECA scale). All children were weighed without clothes. The double-weighing technique was
used to weigh young children unable to stand on their own or unable to understand instructions not
to move while on the scale.
Height/Length of children 6-59 months: children’s height or length was taken to the closest millimetre
using a wooden height board (Shorr Productions). Height was used to decide on whether a child
should be measured lying down (length) or standing up (height). Children less than 87cm were
measured lying down, while those greater than or equal to 87cm were measured standing up.
Oedema in children 6-59 months: bilateral oedema was assessed by applying gentle thumb pressure on
to the tops of both feet of the child for a period of three seconds and thereafter observing for the
presence or absence of an indent.
MUAC of children 6-59 months: MUAC was measured at the mid-point of the left upper arm between
the elbow and the shoulder and taken to the closest millimetre using a standard tape. MUAC was
recorded in millimetres.
Child enrolment in selective feeding programme for children 6-59 months: selective feeding programme
coverage was assessed for the outpatient therapeutic programme and for the supplementary feeding
programme. This was verified by card or by showing images of the products given at the different
programs
Measles vaccination in children 6-59 months: measles vaccination was assessed by checking for the
measles vaccine on the EPI card if available or by asking the caregiver to recall if no EPI card was
available. For ease of data collection, results were recorded on all children but were only analysed for
children aged 9-59 months

20
Vitamin A supplementation in last 6 months in children 6-59 months: whether the child received a vitamin A
capsule over the past six months was recorded from the EPI card or health card if available or by
asking the caregiver to recall if no card is available. A vitamin A capsule image was shown to the
caregiver when asked to recall.
Deworming in last 6 months in children 12-59 months: whether the child received a deworming tablet over
the past six months was recorded by asking the caregiver to recall if information was not available on
the EPI card. A deworming tablet sample was shown to the caregiver when asked to recall.
Haemoglobin concentration in children 6-59 months and women 15-49 years: Hb concentration was taken
from a capillary blood sample from the fingertip and recorded to the closest gram per decilitre by
using the portable HemoCue Hb 301 Analyser (HemoCue, Sweden). If severe anaemia was detected,
the child or the woman was referred for treatment immediately.
Diarrhoea in last 2 weeks in children 6-59 months: an episode of diarrhoea is defined as three loose stools
or more in 24 hours. Caregivers were asked if their child had suffered episodes of diarrhoea in the
past two weeks prior to the survey.
ANC enrolment and iron and folic acid pills coverage: if the surveyed woman was pregnant, it was assessed
whether she was enrolled in the ANC programme and was receiving iron-folic acid pills. An iron-folic
acid pill image was shown to the pregnant woman when asked to recall.
Infant and young child feeding practices in children 0-23 months: infant and young child feeding practices
was assessed based on UNHCR Standardized Expanded Nutrition Survey (SENS) Guidelines for
Refugee Populations version 2 (2013).
Referrals: Children aged 6-59 months were referred to health centre/post for treatment when MUAC
was < 12.5 cm, WHZ <-2 or oedema was present.
Case definitions and calculations
Malnutrition in children 6-59 months: Acute malnutrition was defined using weight-for-height index
values or the presence of oedema and classified as show in the table below. Main results are reported
after analysis using the WHO 2006 Growth Standards.
Table 4: Definitions of acute malnutrition using weight-for-height and/or oedema in children 6–59
months
Categories of acute malnutrition Z-scores (WHO Growth Standards
2006)
Bilateral
oedema
Global acute malnutrition < -2 z-scores Yes/No
Moderate acute malnutrition < -2 z-scores and ≥ -3 z-scores No
Severe acute malnutrition > -3 z-scores Yes
< -3 z-scores Yes/No
Stunting, also known as chronic malnutrition, was defined using height-for-age index values and was
classified as severe or moderate based on the cut-offs shown below. Main results are reported
according to the WHO Growth Standards 2006.

21
Table 5: Definitions of stunting using height-for-age in children 6–59 months
Categories of stunting Z-scores (WHO Growth Standards 2006)
Stunting <-2 z-scores
Moderate stunting <-2 z-score and >=-3 z-score
Severe stunting <-3 z-scores
Underweight was defined using the weight-for-age index values and was classified as severe or
moderate based on the following cut-offs. Main results are reported according to the WHO Growth
Standards 2006.
Table 6: Definitions of underweight using weight-for-age in children 6–59 months
Categories of underweight Z-scores (WHO Growth Standards 2006)
Underweight <-2 z-scores
Moderate underweight <-2 z-scores and >=-3 z-scores
Severe underweight <-3 z-scores
Mid Upper Arm Circumference (MUAC) values were used to define malnutrition according to the
following cut-offs in children 6-59 months:
Table 7: MUAC malnutrition cut-offs in children 6-59 months
Categories of MUAC values
<125 mm
≥ 115 mm and <125 mm
< 115 mm
Child enrolment in selective feeding programme for children 6-59 months: Feeding programme coverage is
estimated during the nutrition survey using the direct method as follows (reference: Emergency
Nutrition Assessment: Guidelines for field workers. (Save the Children 2004):
Coverage of SFP programme (%) =
100 x
No. of surveyed children with MAM according to SFP criteria who reported being registered in SFP
No. of surveyed children with MAM according to SFP admission criteria
Coverage of TFP programme (%) =
100 x
No. of surveyed children with SAM according to TFP criteria who reported being registered in TFP
No. of surveyed children with SAM according to TFP admission criteria
Infant and young child feeding practices in children 0-23 months: Infant and young child feeding
practices were assessed based on the UNHCR SENS IYCF module (Version 2 (2013) that is based on
WHO recommendations (WHO, 2007 as follows):
Timely initiation of breastfeeding in children aged 0-23 months:
Proportion of children 0-23 months who were put to the breast within one hour of birth
Children 0-23 months who were put to the breast within one hour of birth

22
Children 0-23 months of age
Exclusive breastfeeding under 6 months:
Proportion of infants 0–5 months of age who are fed exclusively with breast milk: (including
expressed breast milk or from a wet nurse, ORS, drops or syrups (vitamins, breastfeeding minerals,
medicines)
Infants 0–5 months of age who received only breast milk during the previous day
Infants 0–5 months of age
Continued breastfeeding at 1 year:
Proportion of children 12–15 months of age who are fed breast milk
Children 12–15 months of age who received breast milk during the previous day
Children 12–15 months of age
Introduction of solid, semi-solid or soft foods:
Proportion of infants 6–8 months of age who receive solid, semi-solid or soft foods
Infants 6–8 months of age who received solid, semi-solid or soft foods during the previous day
Infants 6–8 months of age
Children ever breastfed:
Proportion of children born in the last 24 months who were ever breastfed
Children born in the last 24 months who were ever breastfed
Children born in the last 24 months
Continued breastfeeding at 2 years:
Proportion of children 20–23 months of age who are fed breast milk
Children 20–23 months of age who received breast milk during the previous day
Children 20–23 months of age
Consumption of iron rich or iron fortified foods in children aged 6-23 months
Proportion of children 6–23 months of age who receive an iron-rich or iron-fortified food that is
specially designed for infants and young children, or that is fortified in the home.
Children 6–23 months of age who received an iron-rich food or a food that was specially
designed for infants and young children and was fortified with iron, or a food that was
fortified in the home with a product that included iron during the previous day
Children 6–23 months of age
Bottle feeding:
Proportion of children 0-23 months of age who are fed with a bottle
Children 0–23 months of age who were fed with a bottle during the previous day
Children 0–23 months of age
Anaemia in children 6-59 months and women of reproductive age: Anaemia is classified according to the
following cut-offs in children 6-59 months and non-pregnant women of reproductive age. Anaemia
cut-offs for pregnant women should be adjusted depending on the stage of pregnancy (gestational
age). Pregnant women are not included in routine UNHCR nutrition surveys for the assessment of
anaemia due sample size issues (usually a small number of pregnant women is found) as well as the
23
difficulties in assessing gestational age in pregnant women.
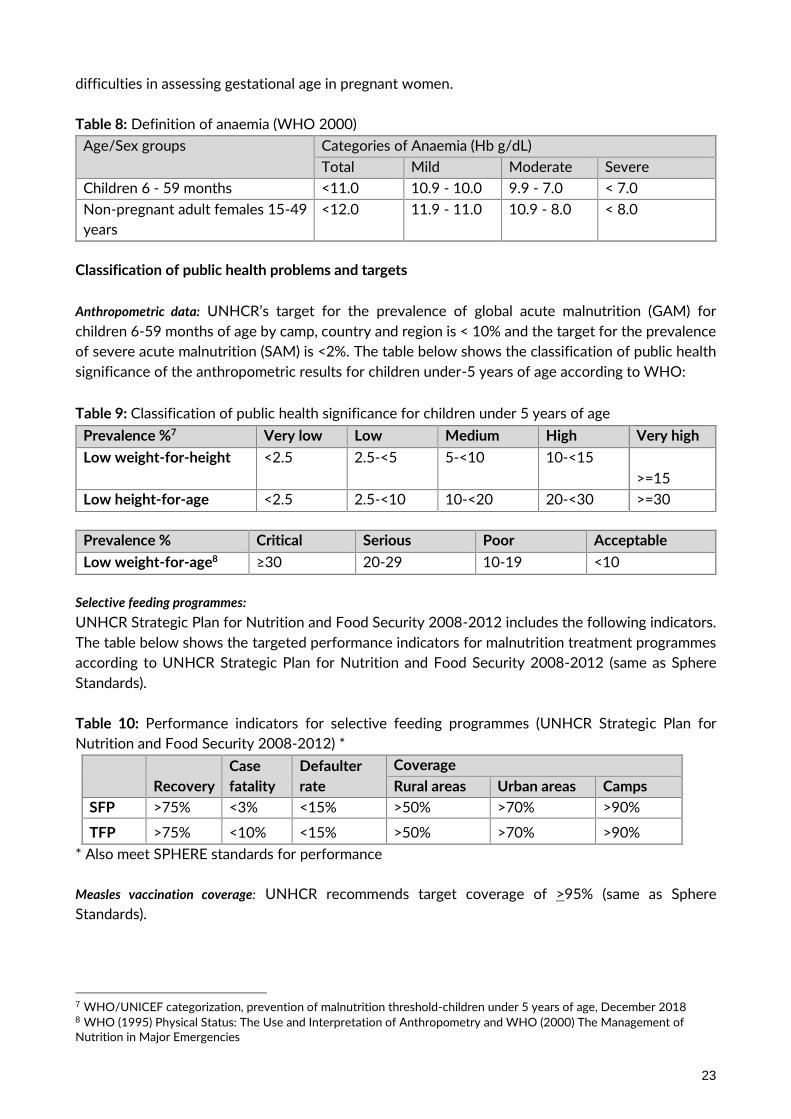
Table 8: Definition of anaemia (WHO 2000)
Age/Sex groups Categories of Anaemia (Hb g/dL)
Total Mild Moderate Severe
Children 6 - 59 months <11.0 10.9 - 10.0 9.9 - 7.0 < 7.0
Non-pregnant adult females 15-49
years
<12.0 11.9 - 11.0 10.9 - 8.0 < 8.0
Classification of public health problems and targets
Anthropometric data: UNHCR’s target for the prevalence of global acute malnutrition (GAM) for
children 6-59 months of age by camp, country and region is < 10% and the target for the prevalence
of severe acute malnutrition (SAM) is <2%. The table below shows the classification of public health
significance of the anthropometric results for children under-5 years of age according to WHO:
Table 9: Classification of public health significance for children under 5 years of age
Prevalence %7 Very low Low Medium High Very high
Low weight-for-height <2.5 2.5-<5 5-<10 10-<15
>=15
Low height-for-age <2.5 2.5-<10 10-<20 20-<30 >=30
Prevalence % Critical Serious Poor Acceptable
Low weight-for-age8 ≥30 20-29 10-19 <10
Selective feeding programmes:
UNHCR Strategic Plan for Nutrition and Food Security 2008-2012 includes the following indicators.
The table below shows the targeted performance indicators for malnutrition treatment programmes
according to UNHCR Strategic Plan for Nutrition and Food Security 2008-2012 (same as Sphere
Standards).
Table 10: Performance indicators for selective feeding programmes (UNHCR Strategic Plan for
Nutrition and Food Security 2008-2012) *
Recovery
Case
fatality
Defaulter
rate
Coverage
Rural areas Urban areas Camps
SFP >75% <3% <15% >50% >70% >90%
TFP >75% <10% <15% >50% >70% >90%
* Also meet SPHERE standards for performance
Measles vaccination coverage: UNHCR recommends target coverage of >95% (same as Sphere
Standards).
7 WHO/UNICEF categorization, prevention of malnutrition threshold-children under 5 years of age, December 2018 8 WHO (1995) Physical Status: The Use and Interpretation of Anthropometry and WHO (2000) The Management of Nutrition in Major Emergencies
24
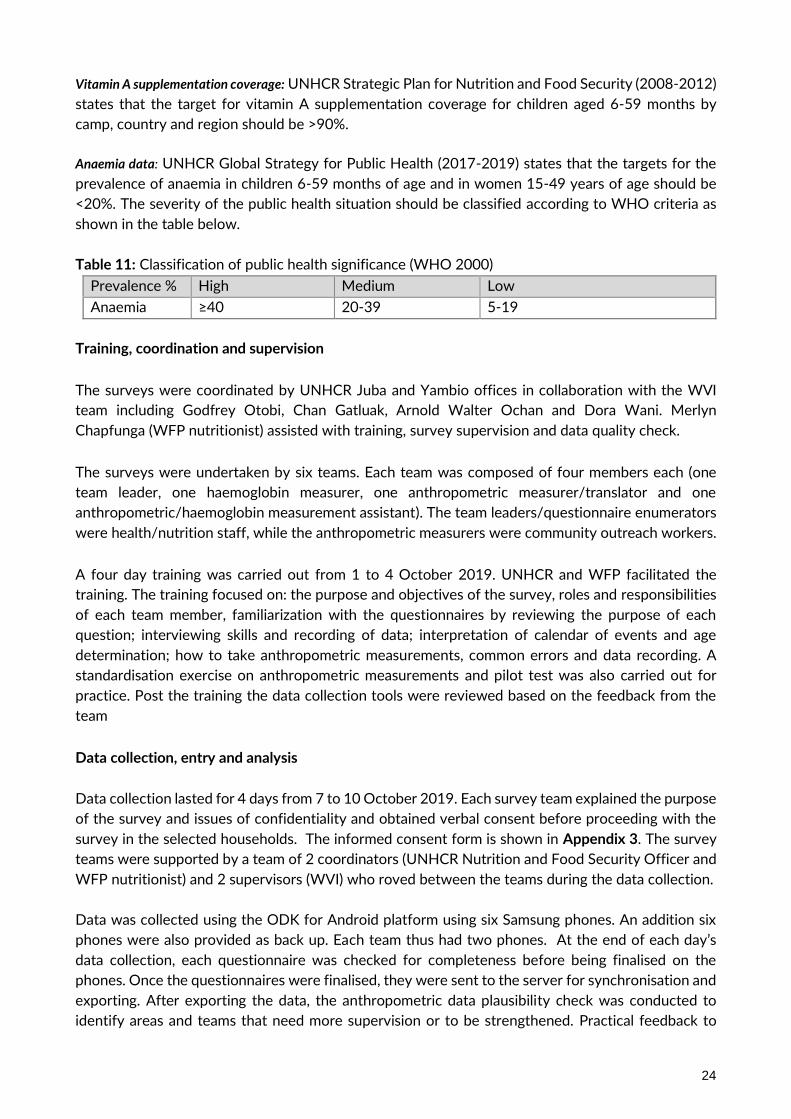
Vitamin A supplementation coverage: UNHCR Strategic Plan for Nutrition and Food Security (2008-2012)
states that the target for vitamin A supplementation coverage for children aged 6-59 months by
camp, country and region should be >90%.
Anaemia data: UNHCR Global Strategy for Public Health (2017-2019) states that the targets for the
prevalence of anaemia in children 6-59 months of age and in women 15-49 years of age should be
<20%. The severity of the public health situation should be classified according to WHO criteria as
shown in the table below.
Table 11: Classification of public health significance (WHO 2000)
Prevalence % High Medium Low
Anaemia ≥40 20-39 5-19
Training, coordination and supervision
The surveys were coordinated by UNHCR Juba and Yambio offices in collaboration with the WVI
team including Godfrey Otobi, Chan Gatluak, Arnold Walter Ochan and Dora Wani. Merlyn
Chapfunga (WFP nutritionist) assisted with training, survey supervision and data quality check.
The surveys were undertaken by six teams. Each team was composed of four members each (one
team leader, one haemoglobin measurer, one anthropometric measurer/translator and one
anthropometric/haemoglobin measurement assistant). The team leaders/questionnaire enumerators
were health/nutrition staff, while the anthropometric measurers were community outreach workers.
A four day training was carried out from 1 to 4 October 2019. UNHCR and WFP facilitated the
training. The training focused on: the purpose and objectives of the survey, roles and responsibilities
of each team member, familiarization with the questionnaires by reviewing the purpose of each
question; interviewing skills and recording of data; interpretation of calendar of events and age
determination; how to take anthropometric measurements, common errors and data recording. A
standardisation exercise on anthropometric measurements and pilot test was also carried out for
practice. Post the training the data collection tools were reviewed based on the feedback from the
team
Data collection, entry and analysis
Data collection lasted for 4 days from 7 to 10 October 2019. Each survey team explained the purpose
of the survey and issues of confidentiality and obtained verbal consent before proceeding with the
survey in the selected households. The informed consent form is shown in Appendix 3. The survey
teams were supported by a team of 2 coordinators (UNHCR Nutrition and Food Security Officer and
WFP nutritionist) and 2 supervisors (WVI) who roved between the teams during the data collection.
Data was collected using the ODK for Android platform using six Samsung phones. An addition six
phones were also provided as back up. Each team thus had two phones. At the end of each day’s
data collection, each questionnaire was checked for completeness before being finalised on the
phones. Once the questionnaires were finalised, they were sent to the server for synchronisation and
exporting. After exporting the data, the anthropometric data plausibility check was conducted to
identify areas and teams that need more supervision or to be strengthened. Practical feedback to

25
ensure accuracy and thoroughness in gaps identified was provided each morning. The final SMART
plausibility report with a summary of the key quality criteria is shown in Appendix 2.
The ODK exports data in csv format, for cleaning and analysis the data was saved in Microsoft Excel
2007 format. The nutritional indices were cleaned using flexible cleaning criteria from the observed
mean (also known as SMART flags in the ENA for SMART software), rather than the reference mean
(also known as WHO flags in the ENA for SMART software). This flexible cleaning approach is
recommended in the UNHCR SENS Guidelines (Version 2, 2013) in accordance with SMART
recommendations. For the weight-for-height index, a cleaning window of +/- 3 SD value contained
in the SMART for ENA software was used.
Anthropometry indices were analysed using the ENA for SMART July 9, 2015 version. Epi Info version
7 was used to analyse all the other data.

26
RESULTS FROM MAKPANDU
CHILDREN 6-59 MONTHS INDICATORS, Makpandu settlement, Yambio, South Sudan (October 2019)
Table 12 shows the total number of children who were sampled.
Table 12: Actual number of children captured during the survey Makpandu settlement versus target, (October 2019)
Target group
Target
population
Subjects measured/interviewed during the survey
% of the target covered
Children 6-59 months 238 252 >100%
The targeted number of the children to be surveyed was within the recommended standard of >80%.
Anthropometric results (based on WHO Growth Standards 2006)
The coverage of age documentation was 69% (children having an exact birth date). As this does not include all children, stunting and the underweight data should be interpreted with caution. Of note is that this proportion increased compared to that in 2018 when the coverage was 44%.
Table 13: Distribution of age and sex of sample-Makpandu settlement, Yambio, South Sudan (October 2019)
Boys Girls Total Ratio
AGE (mo) no. % no. % no. % Boy: girl
6-17 31 48.4 33 51.6 64 25.4 0.9
18-29 37 56.1 29 43.9 66 26.2 1.3
30-41 23 48.9 24 51.1 47 18.7 1.0
42-53 33 68.8 15 31.3 48 19.0 2.2
54-59 12 44.4 15 55.6 27 10.7 0.8
Total 136 54.0 116 46.0 252 100.0 1.2
The overall sex ratio was 1.2 (sex ratio should be between 0.8-1.2), which confirms that both sexes were equally distributed.
Table 14: Prevalence of acute malnutrition based on weight-for-height z-scores (and/or oedema) and
by sex- Makpandu settlement, Yambio, South Sudan (October 2019)
All
n = 247
Boys
n = 134
Girls
n = 113
Prevalence of global malnutrition
(<-2 z-score and/or oedema)
(9) 3.6 %
(3.3 - 4.0 95%
C.I.)
(6) 4.5 %
(2.1 - 9.4 95%
C.I.)
(3) 2.7 %
(2.1 - 3.3 95%
C.I.)
Prevalence of moderate malnutrition
(<-2 z-score and >=-3 z-score, no
oedema)
(8) 3.2 %
(2.9 - 3.6 95%
C.I.)
(6) 4.5 %
(2.1 - 9.4 95%
C.I.)
(2) 1.8 %
(1.4 - 2.2 95%
C.I.)
Prevalence of severe malnutrition
(<-3 z-score and/or oedema)
(1) 0.4 %
(0.4 - 0.4 95%
C.I.)
(0) 0.0 %
(0.0 - 2.8 95%
C.I.)
(1) 0.9 %
(0.7 - 1.1 95%
C.I.)
The prevalence of oedema is 0 %. Data excludes SMART flags
There was no significant difference between boys and girls in the prevalence of acute malnutrition
(p>0.05).

27
Table 15: Prevalence of acute malnutrition by age, based on weight-for-height z-scores Makpandu
settlement, Yambio, South Sudan (October 2019)
Severe wasting
(<-3 z-score)
Moderate wasting
(>= -3 and
<-2 z-score)
Normal
(> = -2 z score)
Oedema
Age (mo.) Total no. No. % No. % No. % No. %
6-17 62 0 0.0 2 3.2 60 96.8 0 0.0
18-29 65 0 0.0 3 4.6 62 95.4 0 0.0
30-41 45 0 0.0 1 2.2 44 97.8 0 0.0
42-53 48 0 0.0 0 0.0 48 100.0 0 0.0
54-59 27 1 3.7 2 7.4 24 88.9 0 0.0
Total 247 1 0.4 8 3.2 238 96.4 0 0.0
Children aged 54-59 months were the most affected by acute malnutrition.
Figure 3 : Trends in the prevalence of global and severe acute malnutrition based on WHO growth
standards in children aged 6-59 months from 2017-2019 – Makpandu settlement, Yambio, South
Sudan (October 2019).
Figure 4: Prevalence of wasting by age in children 6-59 months- Makpandu settlement, Yambio, South Sudan (October 2019)
3.35.3
3.6
0.0 0.9 0.4
Oct-17 Oct-18 Oct-19
Pre
val
en
ce (%
)
Date of Survey
GAM (WHOStandards)
SAM (WHOStandards)
3.24.6
2.2
0.0
7.40.0
0.0
0.0
0.0
0.0
0
3
5
8
10
6-17m 18-29m 30-41m 42-53m 54-59m
PR
EV
AL
EN
CE
(%)
AGE GROUP (MONTHS)
Severe wasting
Moderate wasting

28
Children in the age groups 54-59 and 18-29 months tend to be the most affected by wasting as compared to the other age groups.
Table 16: Distribution of severe acute malnutrition and oedema based on weight-for-height z-scores- Makpandu settlement, Yambio, South Sudan (October 2019)
<-3 z-score* >=-3 z-score
Oedema present Marasmic kwashiorkor No. 0
(0.0 %)
Kwashiorkor No. 0
(0.0 %)
Oedema absent Marasmic No. 6
(2.4 %)
Not severely malnourished No. 246 (97.6 %)
*Includes Flags
Figure 5: Distribution of weight-for-height z-scores (based on WHO Growth Standards; the reference population is shown in green) of survey population compared to reference population-Makpandu settlement, Yambio, South Sudan (October 2019)
The figure shows that malnutrition is not generalized in the population as the weight-for-height z-score distribution is mostly not shifted to the left. However, there are some cases of malnutrition that need to be addressed. MUAC was used in the community for screening, referral and admission to therapeutic and supplementary feeding programmes.
29
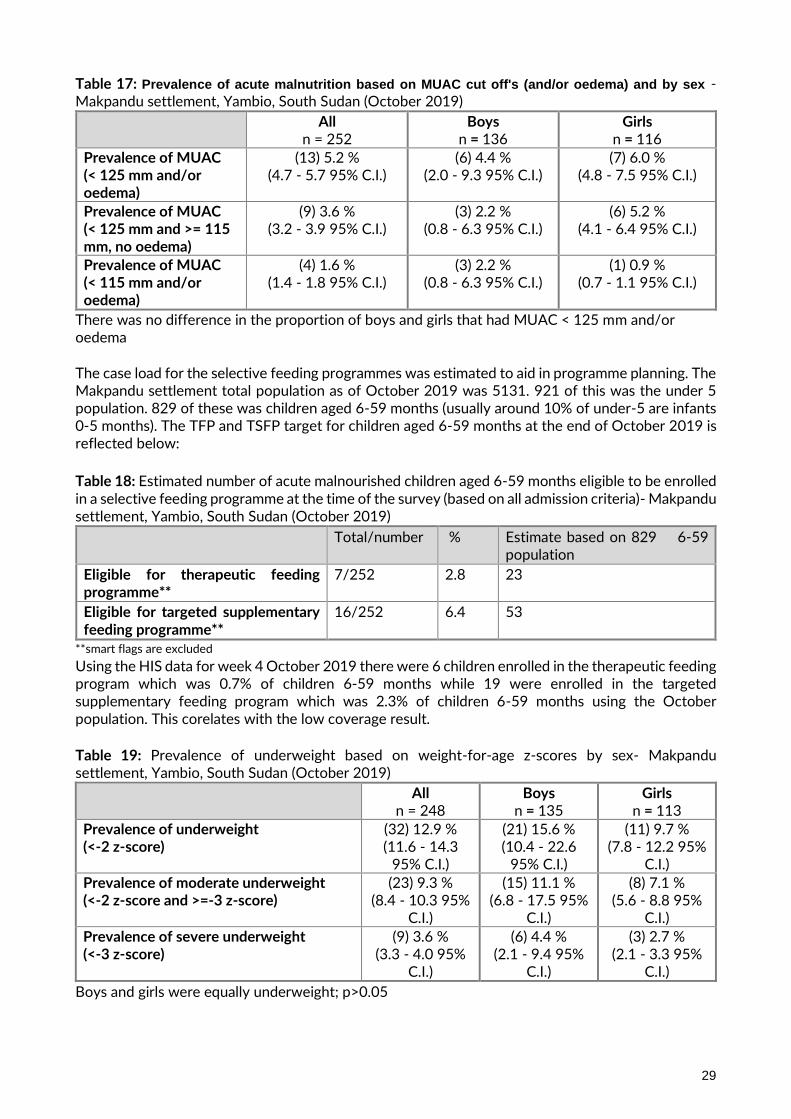
Table 17: Prevalence of acute malnutrition based on MUAC cut off's (and/or oedema) and by sex - Makpandu settlement, Yambio, South Sudan (October 2019)
All n = 252
Boys n = 136
Girls n = 116
Prevalence of MUAC (< 125 mm and/or oedema)
(13) 5.2 % (4.7 - 5.7 95% C.I.)
(6) 4.4 % (2.0 - 9.3 95% C.I.)
(7) 6.0 % (4.8 - 7.5 95% C.I.)
Prevalence of MUAC (< 125 mm and >= 115 mm, no oedema)
(9) 3.6 % (3.2 - 3.9 95% C.I.)
(3) 2.2 % (0.8 - 6.3 95% C.I.)
(6) 5.2 % (4.1 - 6.4 95% C.I.)
Prevalence of MUAC (< 115 mm and/or oedema)
(4) 1.6 % (1.4 - 1.8 95% C.I.)
(3) 2.2 % (0.8 - 6.3 95% C.I.)
(1) 0.9 % (0.7 - 1.1 95% C.I.)
There was no difference in the proportion of boys and girls that had MUAC < 125 mm and/or oedema The case load for the selective feeding programmes was estimated to aid in programme planning. The Makpandu settlement total population as of October 2019 was 5131. 921 of this was the under 5 population. 829 of these was children aged 6-59 months (usually around 10% of under-5 are infants 0-5 months). The TFP and TSFP target for children aged 6-59 months at the end of October 2019 is reflected below:
Table 18: Estimated number of acute malnourished children aged 6-59 months eligible to be enrolled in a selective feeding programme at the time of the survey (based on all admission criteria)- Makpandu settlement, Yambio, South Sudan (October 2019)
Total/number % Estimate based on 829 6-59 population
Eligible for therapeutic feeding programme**
7/252 2.8 23
Eligible for targeted supplementary feeding programme**
16/252 6.4 53
**smart flags are excluded
Using the HIS data for week 4 October 2019 there were 6 children enrolled in the therapeutic feeding program which was 0.7% of children 6-59 months while 19 were enrolled in the targeted supplementary feeding program which was 2.3% of children 6-59 months using the October population. This corelates with the low coverage result. Table 19: Prevalence of underweight based on weight-for-age z-scores by sex- Makpandu settlement, Yambio, South Sudan (October 2019)
All n = 248
Boys n = 135
Girls n = 113
Prevalence of underweight (<-2 z-score)
(32) 12.9 % (11.6 - 14.3
95% C.I.)
(21) 15.6 % (10.4 - 22.6
95% C.I.)
(11) 9.7 % (7.8 - 12.2 95%
C.I.)
Prevalence of moderate underweight (<-2 z-score and >=-3 z-score)
(23) 9.3 % (8.4 - 10.3 95%
C.I.)
(15) 11.1 % (6.8 - 17.5 95%
C.I.)
(8) 7.1 % (5.6 - 8.8 95%
C.I.)
Prevalence of severe underweight (<-3 z-score)
(9) 3.6 % (3.3 - 4.0 95%
C.I.)
(6) 4.4 % (2.1 - 9.4 95%
C.I.)
(3) 2.7 % (2.1 - 3.3 95%
C.I.)
Boys and girls were equally underweight; p>0.05
30
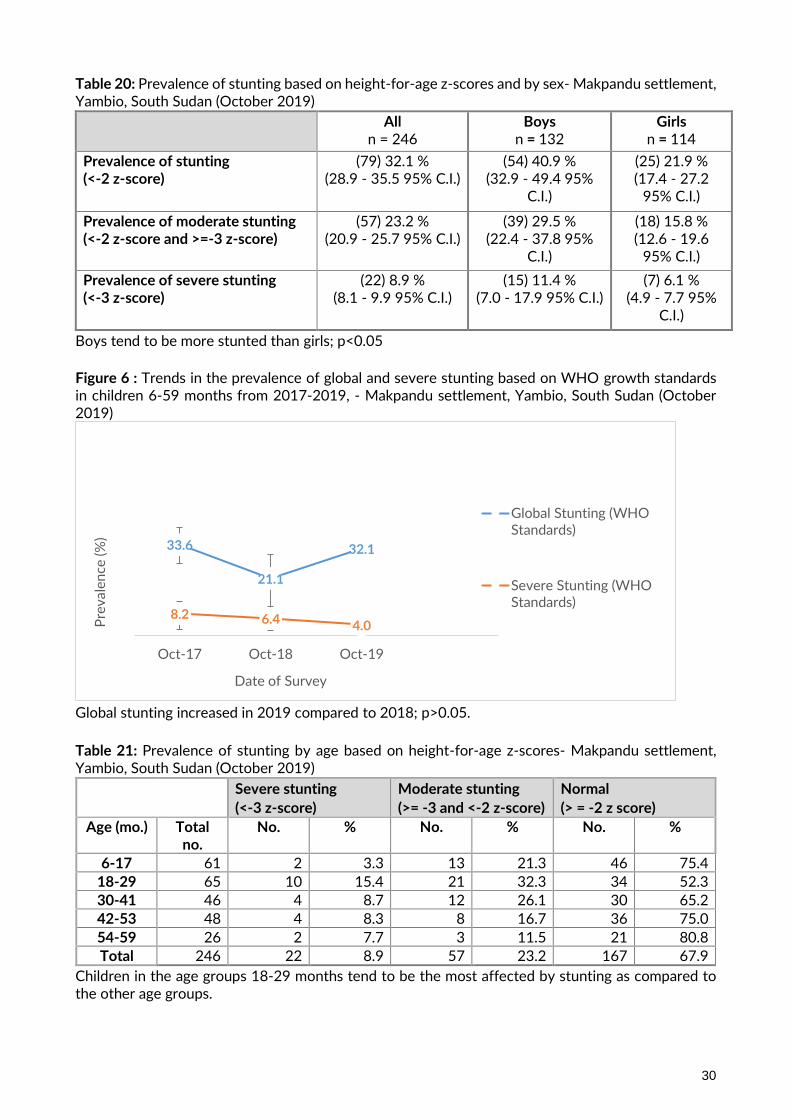
Table 20: Prevalence of stunting based on height-for-age z-scores and by sex- Makpandu settlement, Yambio, South Sudan (October 2019)
All n = 246
Boys n = 132
Girls n = 114
Prevalence of stunting (<-2 z-score)
(79) 32.1 % (28.9 - 35.5 95% C.I.)
(54) 40.9 % (32.9 - 49.4 95%
C.I.)
(25) 21.9 % (17.4 - 27.2
95% C.I.)
Prevalence of moderate stunting (<-2 z-score and >=-3 z-score)
(57) 23.2 % (20.9 - 25.7 95% C.I.)
(39) 29.5 % (22.4 - 37.8 95%
C.I.)
(18) 15.8 % (12.6 - 19.6
95% C.I.)
Prevalence of severe stunting (<-3 z-score)
(22) 8.9 % (8.1 - 9.9 95% C.I.)
(15) 11.4 % (7.0 - 17.9 95% C.I.)
(7) 6.1 % (4.9 - 7.7 95%
C.I.)
Boys tend to be more stunted than girls; p<0.05
Figure 6 : Trends in the prevalence of global and severe stunting based on WHO growth standards in children 6-59 months from 2017-2019, - Makpandu settlement, Yambio, South Sudan (October 2019)
Global stunting increased in 2019 compared to 2018; p>0.05.
Table 21: Prevalence of stunting by age based on height-for-age z-scores- Makpandu settlement, Yambio, South Sudan (October 2019)
Severe stunting
(<-3 z-score)
Moderate stunting
(>= -3 and <-2 z-score)
Normal
(> = -2 z score)
Age (mo.) Total no.
No. % No. % No. %
6-17 61 2 3.3 13 21.3 46 75.4
18-29 65 10 15.4 21 32.3 34 52.3
30-41 46 4 8.7 12 26.1 30 65.2
42-53 48 4 8.3 8 16.7 36 75.0
54-59 26 2 7.7 3 11.5 21 80.8
Total 246 22 8.9 57 23.2 167 67.9
Children in the age groups 18-29 months tend to be the most affected by stunting as compared to the other age groups.
33.6
21.1
32.1
8.2 6.4 4.0
Oct-17 Oct-18 Oct-19
Pre
val
en
ce (%
)
Date of Survey
Global Stunting (WHOStandards)
Severe Stunting (WHOStandards)
31
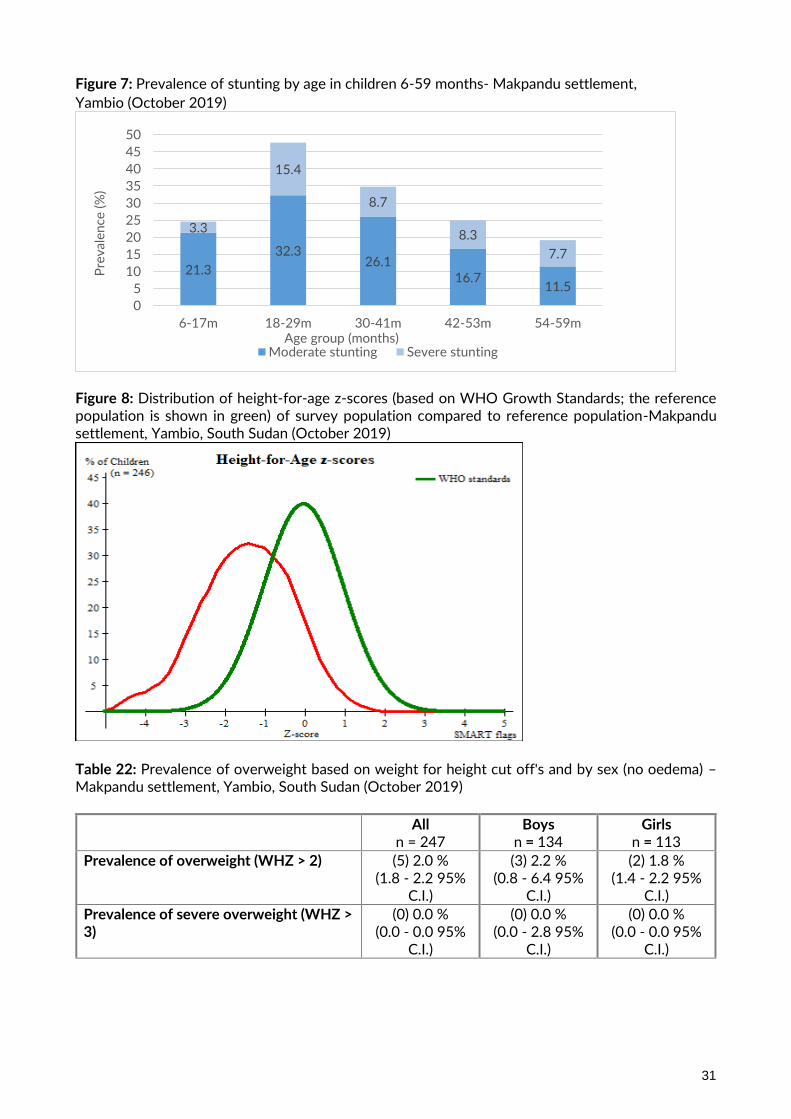
Figure 7: Prevalence of stunting by age in children 6-59 months- Makpandu settlement,
Yambio (October 2019)
Figure 8: Distribution of height-for-age z-scores (based on WHO Growth Standards; the reference population is shown in green) of survey population compared to reference population-Makpandu settlement, Yambio, South Sudan (October 2019)
Table 22: Prevalence of overweight based on weight for height cut off's and by sex (no oedema) – Makpandu settlement, Yambio, South Sudan (October 2019)
All n = 247
Boys n = 134
Girls n = 113
Prevalence of overweight (WHZ > 2) (5) 2.0 % (1.8 - 2.2 95%
C.I.)
(3) 2.2 % (0.8 - 6.4 95%
C.I.)
(2) 1.8 % (1.4 - 2.2 95%
C.I.)
Prevalence of severe overweight (WHZ > 3)
(0) 0.0 % (0.0 - 0.0 95%
C.I.)
(0) 0.0 % (0.0 - 2.8 95%
C.I.)
(0) 0.0 % (0.0 - 0.0 95%
C.I.)
21.3
32.326.1
16.711.5
3.3
15.4
8.7
8.3
7.7
0
5
10
15
20
25
30
35
40
45
50
6-17m 18-29m 30-41m 42-53m 54-59m
Pre
val
en
ce (
%)
Age group (months)Moderate stunting Severe stunting
32
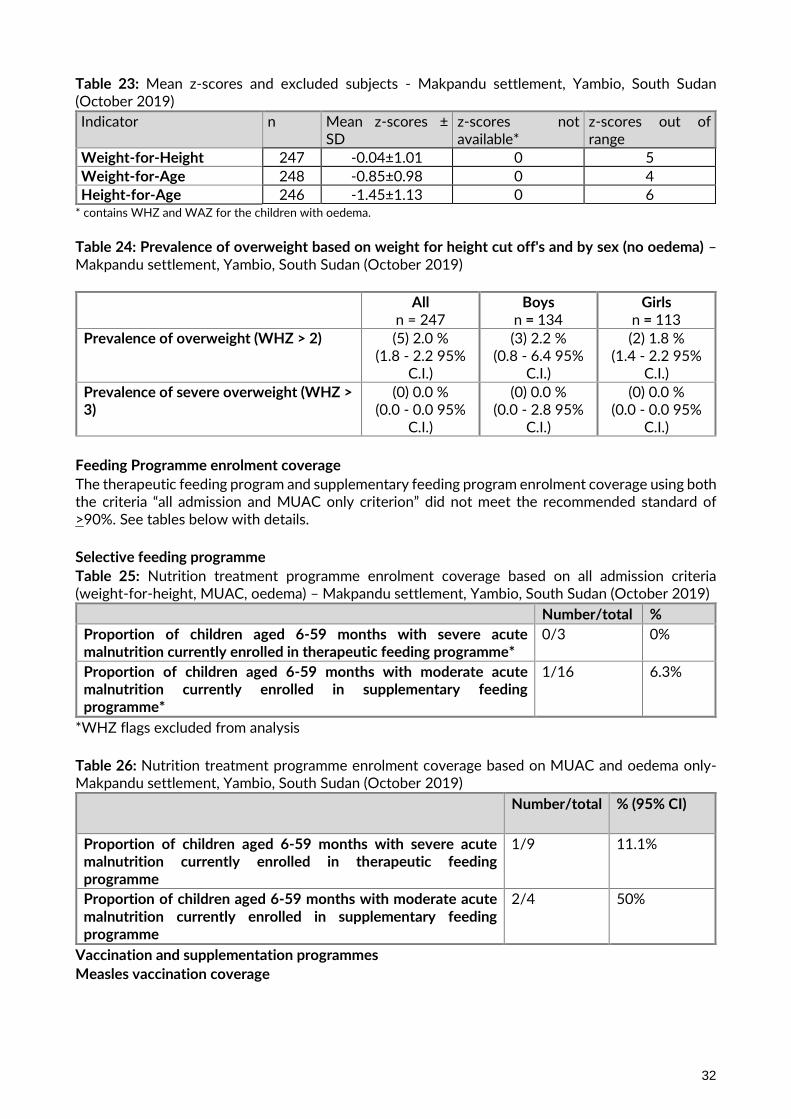
Table 23: Mean z-scores and excluded subjects - Makpandu settlement, Yambio, South Sudan (October 2019)
Indicator
n Mean z-scores ± SD
z-scores not available*
z-scores out of range
Weight-for-Height 247 -0.04±1.01 0 5
Weight-for-Age 248 -0.85±0.98 0 4
Height-for-Age 246 -1.45±1.13 0 6 * contains WHZ and WAZ for the children with oedema.
Table 24: Prevalence of overweight based on weight for height cut off's and by sex (no oedema) – Makpandu settlement, Yambio, South Sudan (October 2019)
All n = 247
Boys n = 134
Girls n = 113
Prevalence of overweight (WHZ > 2) (5) 2.0 % (1.8 - 2.2 95%
C.I.)
(3) 2.2 % (0.8 - 6.4 95%
C.I.)
(2) 1.8 % (1.4 - 2.2 95%
C.I.)
Prevalence of severe overweight (WHZ > 3)
(0) 0.0 % (0.0 - 0.0 95%
C.I.)
(0) 0.0 % (0.0 - 2.8 95%
C.I.)
(0) 0.0 % (0.0 - 0.0 95%
C.I.)
Feeding Programme enrolment coverage
The therapeutic feeding program and supplementary feeding program enrolment coverage using both the criteria “all admission and MUAC only criterion” did not meet the recommended standard of >90%. See tables below with details.
Selective feeding programme
Table 25: Nutrition treatment programme enrolment coverage based on all admission criteria (weight-for-height, MUAC, oedema) – Makpandu settlement, Yambio, South Sudan (October 2019)
Number/total %
Proportion of children aged 6-59 months with severe acute malnutrition currently enrolled in therapeutic feeding programme*
0/3 0%
Proportion of children aged 6-59 months with moderate acute malnutrition currently enrolled in supplementary feeding programme*
1/16 6.3%
*WHZ flags excluded from analysis
Table 26: Nutrition treatment programme enrolment coverage based on MUAC and oedema only- Makpandu settlement, Yambio, South Sudan (October 2019)
Number/total % (95% CI)
Proportion of children aged 6-59 months with severe acute malnutrition currently enrolled in therapeutic feeding programme
1/9 11.1%
Proportion of children aged 6-59 months with moderate acute malnutrition currently enrolled in supplementary feeding programme
2/4 50%
Vaccination and supplementation programmes
Measles vaccination coverage
33
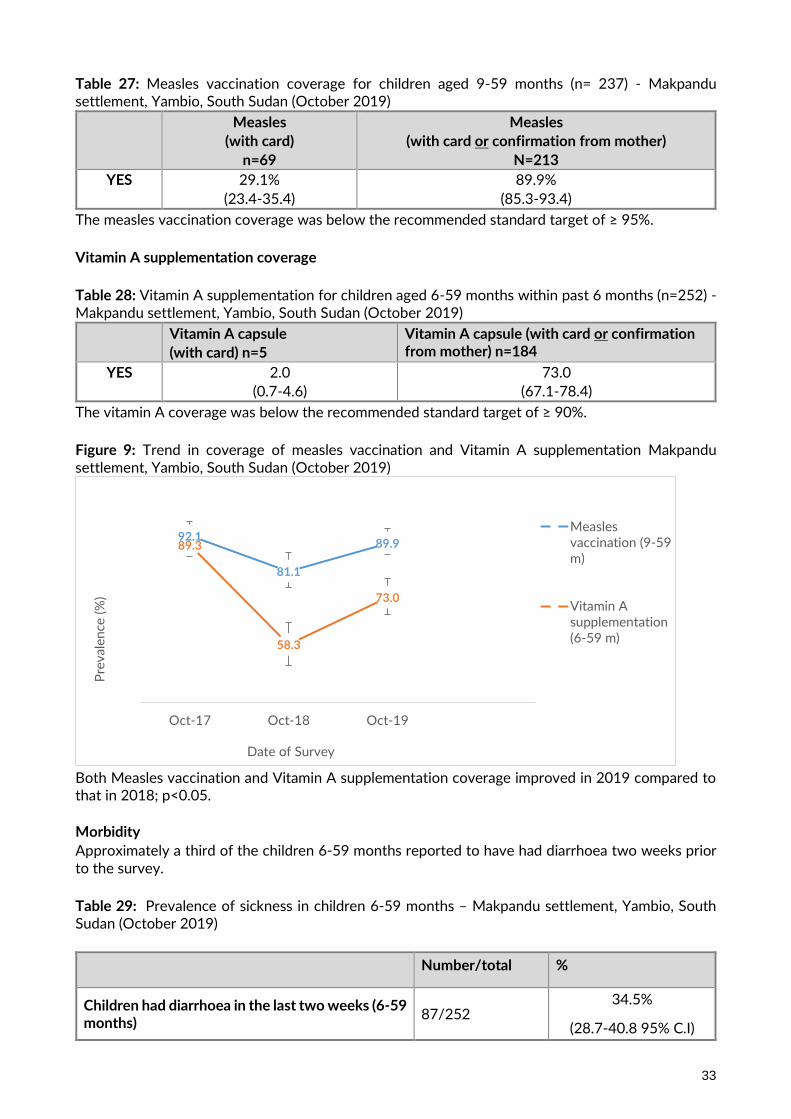
Table 27: Measles vaccination coverage for children aged 9-59 months (n= 237) - Makpandu settlement, Yambio, South Sudan (October 2019)
Measles
(with card)
n=69
Measles
(with card or confirmation from mother)
N=213
YES 29.1%
(23.4-35.4)
89.9%
(85.3-93.4)
The measles vaccination coverage was below the recommended standard target of ≥ 95%.
Vitamin A supplementation coverage
Table 28: Vitamin A supplementation for children aged 6-59 months within past 6 months (n=252) - Makpandu settlement, Yambio, South Sudan (October 2019)
Vitamin A capsule
(with card) n=5
Vitamin A capsule (with card or confirmation from mother) n=184
YES 2.0
(0.7-4.6)
73.0
(67.1-78.4)
The vitamin A coverage was below the recommended standard target of ≥ 90%.
Figure 9: Trend in coverage of measles vaccination and Vitamin A supplementation Makpandu settlement, Yambio, South Sudan (October 2019)
Both Measles vaccination and Vitamin A supplementation coverage improved in 2019 compared to that in 2018; p<0.05. Morbidity
Approximately a third of the children 6-59 months reported to have had diarrhoea two weeks prior to the survey.
Table 29: Prevalence of sickness in children 6-59 months – Makpandu settlement, Yambio, South Sudan (October 2019)
Number/total %
Children had diarrhoea in the last two weeks (6-59 months)
87/252 34.5%
(28.7-40.8 95% C.I)
92.1
81.1
89.989.3
58.3
73.0
Oct-17 Oct-18 Oct-19
Pre
val
en
ce (
%)
Date of Survey
Measlesvaccination (9-59m)
Vitamin Asupplementation(6-59 m)

34
Deworming
46.9% of children 12-59 months received a deworming tablet in last 6 months prior to the survey. This is below the recommended standard of ≥75%.
Table 30 : Deworming coverage
Number/total %
Children received a deworming tablet in the last six months (12-59 months)
99/211
46.9%
Anaemia Results Children 6 – 59 months The total anaemia prevalence among children 6 to 59 months was 60.3% indicating a problem of high public health significance. Children 6-23 tend to be more affected. Table 31 : Prevalence of Total Anaemia, Anaemia Categories, and Mean Haemoglobin Concentration in Children 6-59 Months of Age and By Age Group – Makpandu settlement, Yambio, South Sudan (October 2019)
6-59 months n = 252
6-23 months n=99
24-59 months n=153
Total Anaemia (Hb<11.0 g/dL) (152) 60.3 (54.0-66.4 95% CI)
(68) 68.7% (58.6-77.695%
CI)
(84) 54.9% (46.7-63.095%
CI)
Mild Anaemia (Hb 10.0-10.9 g/dL) (66) 26.2 (20.9-32.195% CI)
(26) 26.3% (17.9-36.195%
CI)
(40) 26.2% (19.4-33.9)
Moderate Anaemia (7.0-9.9 g/dL) (79) 31.4 (25.7-37.5 95% CI)
(40) 40.4% (30.7-50.795%
CI)
(39) 25.5% 18.8-33.295%
CI)
Severe Anaemia (<7.0 g/dL) (7) 2.8 (1.1-5.6 95% CI)
(2) 2.0% (0.3-7.1 95% CI)
(5) 3.3% (1.1-7.595%
CI)
Mean Hb, g/dL (95% CI) [range]
10.2 g/dL
10.2g/dL
10.7 g/dL
Table 32 : Prevalence of Moderate and Severe Anaemia in Children 6-59 Months of Age and By Age Group – Makpandu settlement, Yambio, South Sudan (October 2019)
6-59 months n = 252
6-23 months n=99
24-59 months n=153
Moderate and Severe Anaemia (Hb<10.0 g/dL)
(86) 34.1% (28.3-40.3 95% CI)
(42) 42.4% (32.6-52.8 95% CI)
(44) 28.8% (21.7-36.6 95% CI)

35
IYCF: Children 0-23 months
Table 33 : Prevalence of Infant and Young Child Feeding Practices Indicators – Makpandu settlement, Yambio, South Sudan (October 2019)
Indicator Age range Number/ total
Prevalence (%)
Timely initiation of breastfeeding 0-23 months 98/126 77.8 (69.5-84.7)
Exclusive breastfeeding under 6 months 0-5 months 20/27 74.1 (53.7-88.9)
Continued breastfeeding at 1 year 12-15 months 15/18 83.3 (58.6-96.4
Continued breastfeeding at 2 years 20-23 months 1/27 3.7 (0.1-19.0)
Introduction of solid, semi-solid or soft foods 6-8 months 3/15 20 (4.3-48.1)
Consumption of iron-rich or iron-fortified foods
6-23 months 29/99 29.3 (20.6-39.3)
Bottle feeding 0-23 months 1/126 0.8 (0.0-4.3)
Prevalence of intake Infant formula Table 34 : Infant Formula Intake in Children Aged 0-23 Months – Makpandu settlement, Yambio, South Sudan (October 2019)
Number/total % (95% CI)
Proportion of children aged 0-23 months who receive infant formula (fortified or non-fortified)
3/126 2.4 (0.5-6.8)
Fortified blended foods
Table 35 : CSB++ Intake in Children Aged 6-23 Months – Makpandu settlement, Yambio, South Sudan (October 2019)
Number/total % (95% CI)
Proportion of children aged 6-23 months who receive CSB++
0/98 0
The BSFP program did not have supplies during the survey month.
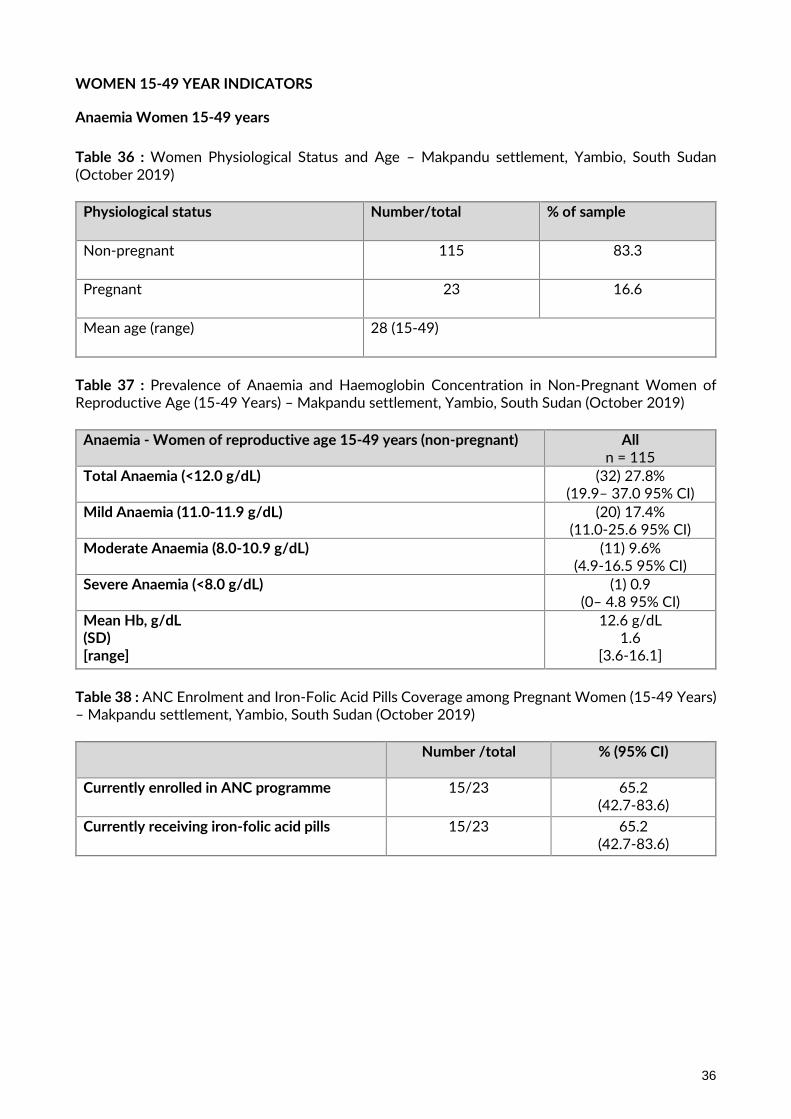
36
WOMEN 15-49 YEAR INDICATORS
Anaemia Women 15-49 years
Table 36 : Women Physiological Status and Age – Makpandu settlement, Yambio, South Sudan (October 2019)
Physiological status Number/total % of sample
Non-pregnant 115 83.3
Pregnant 23 16.6
Mean age (range) 28 (15-49)
Table 37 : Prevalence of Anaemia and Haemoglobin Concentration in Non-Pregnant Women of Reproductive Age (15-49 Years) – Makpandu settlement, Yambio, South Sudan (October 2019)
Anaemia - Women of reproductive age 15-49 years (non-pregnant)
All n = 115
Total Anaemia (<12.0 g/dL) (32) 27.8% (19.9– 37.0 95% CI)
Mild Anaemia (11.0-11.9 g/dL) (20) 17.4% (11.0-25.6 95% CI)
Moderate Anaemia (8.0-10.9 g/dL) (11) 9.6% (4.9-16.5 95% CI)
Severe Anaemia (<8.0 g/dL) (1) 0.9 (0– 4.8 95% CI)
Mean Hb, g/dL (SD) [range]
12.6 g/dL 1.6
[3.6-16.1]
Table 38 : ANC Enrolment and Iron-Folic Acid Pills Coverage among Pregnant Women (15-49 Years) – Makpandu settlement, Yambio, South Sudan (October 2019)
Number /total
% (95% CI)
Currently enrolled in ANC programme 15/23 65.2 (42.7-83.6)
Currently receiving iron-folic acid pills 15/23 65.2 (42.7-83.6)

37
FOOD SECURITY INDICATORS
Access to food assistance Table 39: Ration card coverage– Makpandu settlement, Yambio, South Sudan (October 2019)
Number/total
% (95% CI)
Proportion of households with a ration card 120/125 96%
Five households did not have ration cards. They reported to have recently arrived in the settlement and had not been registered yet. Negative household coping strategies The refugees in Makpandu settlement, like the rest of the locations in South Sudan, receive a reduced food ration at a 70% scale. Table 40: Coping strategies used by the surveyed population over the past month – Makpandu settlement, Yambio, South Sudan (October 2019)
Number/total % (95% CI)
Proportion of households reporting using the following coping strategies over the past month*:
Borrowed cash, food or other items with or without interest 33/125 26.4 (18.9-35.0)
Sold any assets that would not have normally sold (furniture, seed stocks, tools, other NFI, livestock etc.)
15/125 12 (6.9-19.0)
Requested increased remittances or gifts as compared to normal
14/125 11.2 (6.3-18.0)
Reduced the quantity and/or frequency of meals and snacks
56/125 44.8 (35.9-54.0)
Begged 0/125 0
Engaged in potentially risky or harmful activities 22/125 17.6 (11.4-25.4)
Proportion of households reporting using none of the coping strategies over the past month
52/125 41.6 (32.9-50.8)
* The total was over 100% as households used several negative coping strategies. Only 41.6% of households were not under significant stress to meet their needs as indicated by the proportion of household using none of the negative coping strategies over the past month prior to the survey. Household dietary diversity The last general food distribution ended 13 days prior to the start of the survey data collection. The survey was carried out during the beginning of the harvest season. This is thus the likely best scenario. Table 41: AVERAGE HDDS*
Mean
(Standard deviation or 95% CI)

38
Average HDDS
5.0 (1.8)
Figure 10: Proportion of households consuming different food groups within last 24 hours – Makpandu settlement, Yambio, South Sudan (October 2019)
Table 42: Consumption of micronutrient rich foods by households – Makpandu settlement, Yambio, South Sudan (October 2019)
Number/total
% (95% CI)
Proportion of households not consuming any vegetables, fruits, meat, eggs, fish/seafood, and milk/milk products
7/125 5.6 (2.3-11.2)
Proportion of households consuming either a plant or animal source of vitamin A
103/125 82.4 (74.6-88.6)
Proportion of households consuming organ meat/flesh meat, or fish/seafood (food sources of haem iron)
20/125 16 (10.1-23.6)
The low proportions of households consuming food groups containing iron above is indicative of an inadequate diet that is likely to be contributing to the micronutrient deficiencies
LIMITATIONS
• The age documentation coverage was 69%. Although an event calendar was used by the surveyors to ascertain age, stunting results need to be interpreted with caution because z-scores for height-for-age require accurate ages to within two weeks9
9 (CDC/WFP: A manual: Measuring and Interpreting Mortality and Malnutrition, 2005).
57.7 52.8
89.6
24.8
122.4 5.6
63.2
3.2
79.0
30.4
78.4
0
10
20
30
40
50
60
70
80
90
100
Pro
po
rtio
n o
f h
ou
seh
old
s (%
)
Food groups
39
DISCUSSION
Nutritional status of young children and mortality
The GAM prevalence in Makpandu settlement was found to be [3.6% (3.3-4.0 95% C.I.)] which falls
under low prevalence. The proportion of children that had MUAC (< 125 mm and/or oedema) was
5.2% (4.7 - 5.7 95% C.I.). Analysis of the proportion of children that were found malnourished based
on both WHZ and MUAC was 9.5% (24/252). In 2018 the GAM prevalence was 5.3%; MUAC < 125
mm and/or oedema was 3.5% and proportion of children that were found malnourished based on
both WHZ and MUAC was 5.8%. Looking at the proportion of children found malnourished based on
both criteria the proportion of malnourished children although not statistically significant indicates a
likely deteriorating situation in 2019 compared to 2018. In 2019 the CMAM program continued.
Therapeutic supplies were adequate throughout the year. Blanket supplementary feeding supplies
were available for 2/10 months from January to October 2019 thus an eight-month pipeline shortage
was experienced. A key concern from the survey analysis is that programme enrolment coverage was
very low based on both MUAC and WHZ scores. This will require attention in 2020. Efforts to further
reduce the acute malnourished caseload need to continue in 2020.
Stunting refers to a deficit in height relative to age due to a long-term process of linear growth
retardation. The prevalence of global stunting was 32.1% (28.9-35.5). This is categorized as very high
according to WHO/UNICEF 2018 classification. This should however be interpreted with caution
due to the age estimation limitation. 31% of the children 6-59 months did not have a reliable age
documentation. Boys tend to be more stunted than girls. Reason for this to be investigated. Global
stunting increased in 2019 compared to 2018; p<0.05. ‘Stunting is a well-established risk marker of
poor child development. Stunting before the age of 2 years predicts poorer cognitive and educational
outcomes in later childhood and adolescence. Factors that contribute to stunted growth and
development include poor maternal health and nutrition, inadequate infant and young child feeding
practices, and infection.’10 Action across multiple areas is necessary to reduce the stunting levels. This
to include promotion of infant and young child feeding practices, ensuring adequate water and
sanitation, infection control and maternal health and nutrition support.
Morbidity and Health seeking behaviour
The interactions of nutrition and infection are cyclic with each exacerbating the other. Approximately
a third (34.5%) of children 6-59 months reported to have had diarrhoea in the last two weeks prior
to the survey indicating a high morbidity rate. This proportion remained the same as in 2018.
Interventions to prevent diarrhoea, including safe drinking-water, use of improved sanitation and
hand washing with soap need to be strengthened and maintained. To reduce the morbidity caseload
further there is need to strengthen the current health service provision. Top causes of morbidities
(malaria, respiratory tract infections, skin infections and intestinal worms) should also be given special
attention.
10
WHA Global Nutrition Targets 2025: Stunting policy brief

40
Programme coverage children 6 – 59 months
Selective feeding programme
The enrolment coverage of targeted supplementary feeding program and therapeutic feeding
program was low and did not meet the recommended standard of >90%. Strengthening of active
case screening at the community recommended. 10/13 (76.9%) of the children that were
malnourished based on MUAC did not meet the WHZ score admission criteria. 11/14 (78.6%)
malnourished children malnourished based on WHZ score did not meet the MUAC admission criteria.
This indicates the need to continue ensuring a mixed criterion for admission using MUAC or WHZ
scores to capture the children missed by either MUAC or the WHZ scores admission criteria. In
addition to this to improve coverage a two-stage monthly screening to be carried out during BSFP
for children 6-23 months at risk (12.5 -13.5cm) and for all children 24-59 months at risk (12.5 -
16.0cm) presenting at the health facility. Any child found to meet the admission criteria using the
WHZ scores to be enrolled into the appropriate program.
Measles vaccination and vitamin A supplementation
The coverage of measles vaccination and vitamin A supplementation was 89.9% and 73.0%
respectively. Although the coverage for both measles vaccination and Vitamin A supplementation
improved in 2019 compared to that in 2018, the proportion remained below the target coverage of
≥95% and ≥90% respectively. This indicates the need to continue strengthening both the routine and
campaign vaccination/supplementation interventions. As these results were based on both card and
recall there is also need to improve the coverage of cards for reliability and monitoring.
Anaemia in Young Children and Women
Total anaemia prevalence in children 6 to 59 months was 60.3% (with 2.8% being severe anaemia).
The prevalence of anaemia among children is very high as it is above the 40% level of public health
significance (WHO classification). Analysis by age categories indicated that the prevalence of anaemia
was higher among children aged 6-23 months. Although anaemia prevalence was high, 26.2% of the
children were mildly anaemic. The prevalence of moderate and severe anaemia among children 6 to
59 was 34.1%. If only moderate and severe anaemia is considered, the anaemia prevalence is of
medium public health concern. Total anaemia prevalence among non-pregnant women 15-49 years
(non-pregnant) was 27.8% (with 0.9% being severe anaemia). According to the WHO classification
the women anaemia prevalence is of medium public health significance. This was the first-time
anaemia prevalence was assessed in the settlement thus the data will be used as the baseline.
Anaemia impairs the development and learning of children and impairs the health and quality of life
in adults, especially women in the reproductive age group. It also increases the risk of adverse
maternal and neonatal outcomes11 and worsens clinical outcomes especially when it occurs as a
comorbidity12
The anaemia prevalence is likely to be attributed to several factors. This include i) inadequate macro
and micronutrients; ii) inappropriate feeding practices; iii) disease burden requiring continuous
attention; iv) maternal health and nutrition. A 70% ration was provided on a monthly basis in
Makpandu. This does not meet the 100% (2100 kilocalories) recommended standard. The HDDS
indicated that only 16% of the households consumed food sources rich in iron. Only 29.3% of children
6-23 months reported to have not consumed iron rich foods the day before the survey. The
11 WHO anaemia global targets brief 12 Iron deficiency revisted, M.D Capellini, K.M.Musallam and A.T.Taher 2019; https://doi.org/10.1111/joim.13004

41
proportion of children 6 to 8 months that were introduced to solid and semi-solid foods in a timely
fashion was 20% which is low. Approximately a third of the children surveyed had diarrhoea in the
last two weeks prior to the survey indicating a substantial disease burden. From the third quarter
Mass MUAC screening 6% of the PLWs in Makpandu were found to have a MUAC <23cm. A
multisectoral approach to anaemia prevention and control will be required in 2020. This to address
nutritional, health and other underlying causes. The health and nutrition facility-based capacity for
anaemia prevention and treatment, community screening and referral, scaling up of livelihood options
that complement the existing food assistance options and information, education and communication
on diet diversity and appropriate utilisation to be prioritised in 2020 and beyond.
IYCF Indicators
This was the first survey that assessed the IYCF indicators hence the data will be used as the baseline.
From the survey results the proportion of children aged 0-23 months that had timely initiation of
breast milk within the first hour of delivery was 77.8%. Early initiation (within one hour of birth) of
exclusive breastfeeding significantly reduces the risk of neonatal mortality. Infants for whom
initiation of breastfeeding is delayed to more than 24 hours after birth are 2.4 times more likely to
die during their first month of life. The rate of exclusive breast feeding for the first six months of life
was 74.1%. The risk of neonatal death is increased approximately fourfold if milk-based fluids or
solids are provided to breastfed neonates. Breastmilk alone (exclusive) satisfies the nutritional and
fluid requirements of an infant for the first complete six months of life in all settings and climates.13
Continued breastfeeding at 1 year was 83.3% and up to two years was 3.7%. The results indicate
considerable uptake of breastfeeding messages up to one year. This should be continued to increase
the proportion further. Efforts to improve continuation of breastfeeding into the second year should
be put in place in 2020.
The proportion of children aged 6 to 8 months that were introduced to solid and semi-solid foods in
a timely fashion was 20%. This is very low. After six months, adequate and appropriate infant
complementary foods become necessary to complement breastmilk in order to meet the energy and
other nutrient requirements of the infant (timely complementary feeding). There is need to ensure
that IYCF messaging that addresses this important component of complementary feeding are coupled
with viable camp level solutions. The message dissemination to be coupled by livelihood options that
support diet diversity.
0.8% of the surveyed children aged 0-23 months were bottle fed. Efforts to discourage this should
be continued. Bottle feeding is associated with increased diarrhoeal disease due to the contamination
likelihood of the bottle and nipple. It is therefore necessary to support all women to achieve early
initiation and exclusive breastfeeding for the first six completed months and the continuation of
breastfeeding into the second year of life to provide the best chance of survival for infants and young
children14 2.4% of the surveyed children aged 0-23 months received infant formula. Infant formula
is a nonhuman milk product formulated from animal milk or vegetable protein (soy) and adapted to
the physiological characteristics of infants. Infant and young child feeding practices directly affect
the nutritional status of children under two years of age and, ultimately, impact child survival.
Protecting, and improving on, appropriate infant and young child feeding practices in children aged
0-23 months is therefore critical to improved nutrition, health and development of children15.
13 UNHCR SENS guidelines for refugee populations, Version 2 (2013)
14 Operation Guidance on IFE, section 5.2.8, v2.1, Feb 2007 15 WHO, Indicators for Assessing Infant and Young Child Feeding Practices, WHO 2010
42
Some of the IYCF results should be interpreted with caution as the sample is small to draw meaningful
conclusions. These findings, however, give an idea of the status of infant and young feeding practices
among the surveyed population.
Food security related
Food insecurity is one of the causes of undernutrition as it directly affects the nutritional status of an
individual. It is a direct cause of malnutrition in terms of dietary intake and an underlying cause in
terms of access to and utilisation of food. Improving overall food security remains critical to improved
nutrition, health and long-term development of children and other household members. Majority of
the refugees in Makpandu had access to food assistance as indicated by the coverage of ration cards
(96%). Food assistance continued to be provided at a 70% ration scale. A hybrid cash and food were
provided with the grain being provided in kind and the rest of the commodities in cash. Milling
assistance to facilitate better grain utilization was also provided. From January to September, there
was no pipeline break in 2019. October though experienced grain supply inadequacies.
The general food assistance does not meet all the food need required. Complementary livelihood
options remain limited. To fill the gap in food assistance over half of the refugee households reported
using negative coping strategies (58.4%). Only 41.6% reported to have used none of the survey listed
coping strategies indicating the proportion likely to have benefited from livelihood programs’ support.
Advocacy to fill the food assistance gap to be continued.

43
RECOMMENDATIONS AND PRIORITIES
Nutrition related
▪ Maintain a comprehensive Community based Management of Acute Malnutrition (CMAM)
program providing both therapeutic and supplementary feeding programs to facilitate the
rehabilitation of identified acute malnourished children, pregnant and lactating women, people
living with HIV/AIDS, and TB patients on treatment. This to include active case finding and
community mobilization. (UNHCR, UNICEF, WFP and WVI)
▪ Active case finding and referral of all identified children aged 6-59 months children with a MUAC
less than 125mm for management of acute malnutrition through community outreach follow up
at household level (WVI).
▪ Conduct a two-step MUAC and WHZ scores (for children with MUAC at risk) screening monthly
at all the health facility contact points including the EPI, triage and BSFP sites to ensure both high
MUAC and WHZ score coverage (WVI).
▪ Maintain blanket supplementary feeding programme for children 6-23 months, pregnant and
lactating women using a fortified blended food or lipid-based supplement to prevent malnutrition
and to cover the nutrient gap these vulnerable groups face considering their predominant grain
based general food diet (UNHCR, WFP and WVI).
▪ Continue strengthening the capacity of the nutrition program, in terms of provision of adequate
staff and training to ensure quality provision of both curative and preventative components
(UNHCR, WFP, UNICEF and WVI).
▪ Awareness creation, protection and promotion of appropriate IYCF practices (using the
multisectoral framework for action in refugee situations approach) to further improve
breastfeeding practices and to strengthen complementary feeding practices (UNHCR, UNICEF
and WVI)
▪ Expand and strengthen the prevention of malnutrition components including community
outreach information, education and communication and diverse diet utilization aspects to stop
malnutrition from occurring in the first place. (UNHCR, UNICEF, WFP and WVI).
▪ Conduct quarterly mass MUAC screening to monitor the evolution of the nutrition situation in
Makpandu settlement. This to target children aged 6-59 months and PLWs (WVI)
▪ Prioritise implementation of the refugee micronutrient reduction strategy to curb the high
anaemia prevalence (WVI)
▪ Ensure regular monitoring and supervision, quarterly joint monitoring and yearly program
performance evaluations in Makpandu to assess performance progress and formulate
recommendations for any identified gaps. (UNHCR, WFP, UNICEF and WVI)
44
▪ Undertake a follow up annual nutrition survey to analyse trends and facilitate program impact
evaluation. (UNHCR, WVI, WFP and UNICEF)
Food security related
▪ Provision of food assistance providing the minimum dietary requirements (2100kcal/person/day).
(UNHCR, WVI and WFP).
▪ Continue the routine joint monthly food basket monitoring on site and ensure Makpandu
inclusion in the country post distribution monitoring at the household level (UNHCR, WVI and
WFP).
▪ Expand the coverage of sustainable food security and livelihood solutions in Makpandu
settlement to complement the provided food assistance (UNHCR, WFP and WVI).
Health related
▪ Maintain and strengthen the provision of comprehensive primary health care programme for
refugees and host populations in Makpandu. (UNHCR and WVI)
▪ UNICEF, WVI and UNHCR to ensure that Expanded Programme on Immunization (EPI) and
Vitamin A supplementation campaigns and routine programmes are strengthened to increase
coverage to acceptable standards.
▪ Adequate clean water provision to be maintained in 2019. In addition to this, hygiene promotion
and latrine coverage strengthening to reduce the diarrhoea caseload to be ensured. (UNHCR and
WVI)

45
APPENDICES Appendix 1: Names of contributors
S/No Name in full Sex Title Organisation 1 Khatab Alamin M Team leader WVI 2 Charles James Khamis M Team leader WVI 3 Micheal Jean Marie M Team leader WVI 4 Foibe Ngbadurezere F Team leader WVI 5 Laurent Nyelepamba M Team leader WVI
6 Hanan Faida F Team leader WVI 7 Nalayenga Alphonsine F Anthropometric
measurer WVI
8 Dijas Nusran M Anthropometric measurer
WVI
9 Kumba Bruno Stephen M Anthropometric measurer
WVI
10 Moses Edward Bira M Anthropometric measurer
WVI
11 Wilson Idie Samuel M Anthropometric measurer
WVI
12 Dominic Paite M Anthropometric measurer
WVI
13 Bazigbayo Sak Desire M Hemoglobin Measurer WVI 14 Suzy Emmanuel F Hemoglobin Measurer WVI 15 Sentina Martin F Hemoglobin Measurer WVI
16 Bakoyogo Fidele Wenepay M Hemoglobin Measurer WVI 17 Simon Ngbazege M Hemoglobin Measurer WVI 18 Celestino Juma M Haemoglobin Measurer WVI 19 Joyce Arkanjelo Nangbata F Anthropometric/Hb
Assistant WVI
20 Ezekiel Kuwa M Anthropometric/Hb Assistant
WVI
21 Augustin Yingayinga M Anthropometric/Hb Assistant
WVI
22 Moberenga Jean M Anthropometric/Hb Assistant
WVI
23 Kaka Ismail F Anthropometric/Hb Assistant
WVI
24 Jackson John M Anthropometric/Hb Assistant
WVI
25 Ochan Walter Arnold M Supervisor WVI 26 Dora Arkadio Wani F Supervisor WVI 27 Chan Gatluak M Supervisor 28
Samuel Paul Survey operations
support UNHCR Yambio
29 Jackline Lollis
Survey operations support
UNHCR Yambio
30 Merlyn Chapfunga
Training and data collection supervision
WFP
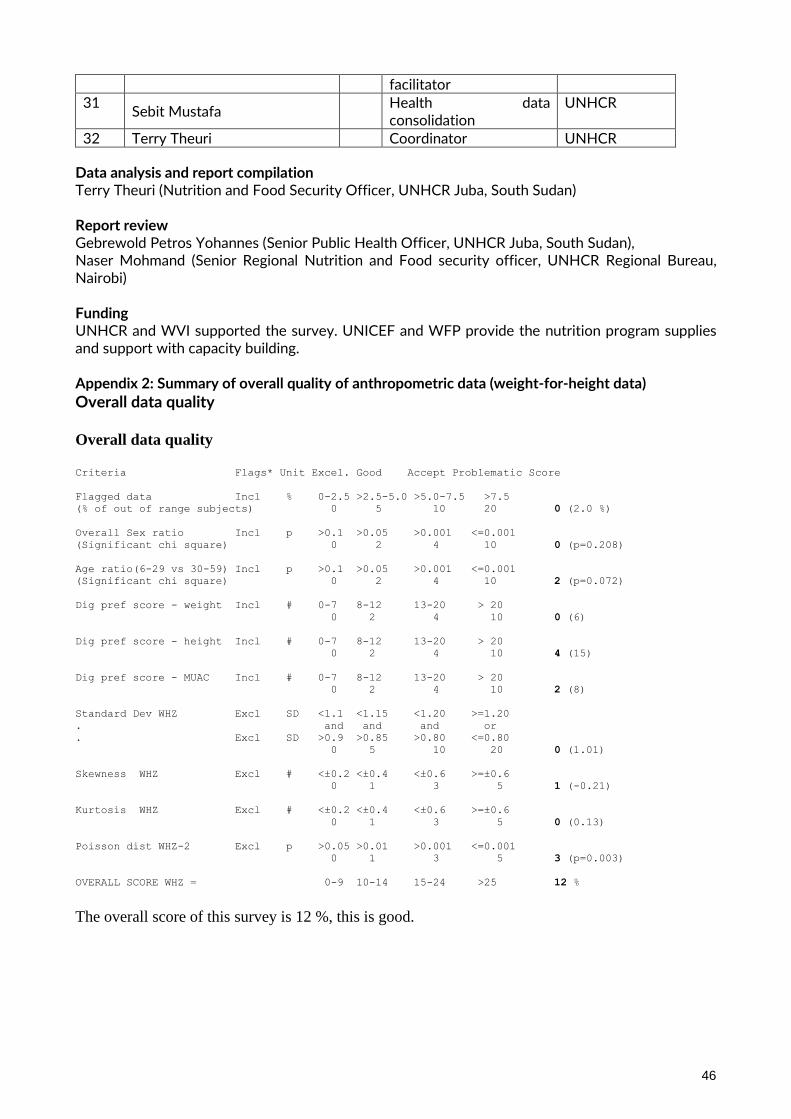
46
facilitator 31
Sebit Mustafa Health data
consolidation UNHCR
32 Terry Theuri Coordinator UNHCR
Data analysis and report compilation Terry Theuri (Nutrition and Food Security Officer, UNHCR Juba, South Sudan) Report review Gebrewold Petros Yohannes (Senior Public Health Officer, UNHCR Juba, South Sudan), Naser Mohmand (Senior Regional Nutrition and Food security officer, UNHCR Regional Bureau, Nairobi) Funding UNHCR and WVI supported the survey. UNICEF and WFP provide the nutrition program supplies and support with capacity building. Appendix 2: Summary of overall quality of anthropometric data (weight-for-height data)
Overall data quality Overall data quality
Criteria Flags* Unit Excel. Good Accept Problematic Score
Flagged data Incl % 0-2.5 >2.5-5.0 >5.0-7.5 >7.5
(% of out of range subjects) 0 5 10 20 0 (2.0 %)
Overall Sex ratio Incl p >0.1 >0.05 >0.001 <=0.001
(Significant chi square) 0 2 4 10 0 (p=0.208)
Age ratio(6-29 vs 30-59) Incl p >0.1 >0.05 >0.001 <=0.001
(Significant chi square) 0 2 4 10 2 (p=0.072)
Dig pref score - weight Incl # 0-7 8-12 13-20 > 20
0 2 4 10 0 (6)
Dig pref score - height Incl # 0-7 8-12 13-20 > 20
0 2 4 10 4 (15)
Dig pref score - MUAC Incl # 0-7 8-12 13-20 > 20
0 2 4 10 2 (8)
Standard Dev WHZ Excl SD <1.1 <1.15 <1.20 >=1.20
. and and and or
. Excl SD >0.9 >0.85 >0.80 <=0.80
0 5 10 20 0 (1.01)
Skewness WHZ Excl # <±0.2 <±0.4 <±0.6 >=±0.6
0 1 3 5 1 (-0.21)
Kurtosis WHZ Excl # <±0.2 <±0.4 <±0.6 >=±0.6
0 1 3 5 0 (0.13)
Poisson dist WHZ-2 Excl p >0.05 >0.01 >0.001 <=0.001
0 1 3 5 3 (p=0.003)
OVERALL SCORE WHZ = 0-9 10-14 15-24 >25 12 %
The overall score of this survey is 12 %, this is good.

47
Appendix 3 : Nutrition Survey Questionnaires October 2019
Greeting and Reading of Rights THIS STATEMENT IS TO BE READ TO THE HEAD OF THE HOUSEHOLD OR, IF THEY ARE ABSENT, ANOTHER ADULT MEMBER OF THE HOUSE BEFORE THE INTERVIEW. DEFINE A HOUSEHOLD AS A GROUP OF PEOPLE WHO LIVE TOGETHER AND ROUTINELY EAT OUT OF SAME POT. DEFINE HEAD OF HOUSEHOLD AS MEMBER OF THE FAMILY WHO MANAGES THE FAMILY RESOURCES AND IS THE FINAL DECISION MAKER IN THE HOUSE.
Hello, my name is _____________ and I work with [organization/institution]. We would like to invite your household to participate in a survey that is looking at the nutrition and health status of people living in this camp. UNHCR and WVI are working in the nutrition and health sectors are sponsoring this nutrition survey Taking part in this survey is totally your choice. You can decide to not participate or stop taking part at any time and for any reason. If you stop being in this survey it will not have any negative effects on how you or your household is treated or what aid you receive. If you agree to participate, I will ask you some questions about your family. We will then measure the arm circumference, weight and height of children who are older than 6 months up to 5 years. Before we start to ask you, any questions or take any measurements, we will ask you to give your verbal consent. Be assured that any information that you will provide will be kept strictly confidential. You can ask me any questions that you have about this survey before you decide whether to participate. Thank you

48
Questionnaire for Children 6-59 months (every HH)
THIS QUESTIONNAIRE IS TO BE ADMINISTERED TO ALL CARETAKERS OF A CHILD THAT LIVES WITH THEM AND IS BETWEEN 6-59 MONTHS OF AGE Date (dd/mm/yyyy) Team Number Block
|___|___|/|___|___|/|___|___||___|___| |___| |___|___|
CH1 CH2 CH3 CH4 CH5 CH6 CH7 CH8 CH9 CH10 CH11 CH12 CH13 CH14 CH15 CH16 CH17
HH ID Consent
given
1=Yes
2=No
3=Absent
Sex
(M/F)
Birth date*
dd/mm/yyyy
Age**
in
months
Oedema***
(Y/N)
MUAC
(CM)
Weight
(KG)
100g
Height
(CM)
0.1cm
Is child
enrolled in
nutrition
program?
(Gigude re i
kerimoru
kuba kpaku
yo?)
1=TSFP
2=OTP/SC
3=None
Is child
enrolled
in BSFP
program?
1=Yes
2=No
Has the
child been
vaccinated
against
Measles?
(Yafunga
mangbere
nga ga
banungba
fugude?)
1=Yes
card
2=Yes
recall
3=No or
don’t
know
Has the
child
received
Vitamin A in
past 6
months?
(Yafunga
Vitamin A
Fu gude nidu
ni zamba
ha?)
(show
capsule)
1=Yes card
2=Yes
recall
3=No or
don’t know
Has the
child
received
deworming
tablet in
past 6
months?
(Yafunga
dawa agbiro
(Show
deworming
tablet)
1=Yes
2=No
3=Unknown
Has [name]
had diarrhea
in the last
two weeks,
including
today? #
(Kaza vuseyo
mangingo
gude dagba
gu poso susi
ue kusayo?)
1=Yes
2=No
3=Unknown
HB
(g/dl)
/ /
*Record from EPI/health card/age documentation if available. Leave blank if no valid age documentation. **Estimate using event calendar and recall if age documentation not available. ***C9 & C10: Refer to the clinic for
malnutrition is not already enrolled in TSFP/OTP/SC if Oedema =Y or MUAC <12.5cm; #Diarrhoea: 3 or more loose stools within 24hrs

49
Questionnaire for WOMEN 15-49 YEARS (every other HH) This questionnaire is to be administered to all women aged between 15 and 49 years IN THE SELECTED HH
Date (dd/mm/yyyy) Camp Team Number Block Number
|___|___|/|___|___|/|___|___||___|___| |___|___| |___|___|
W1 W2 W3 W4 W5 W6 W7 W8* W9
HH
Woman ID
Consent given 1=yes 2=no 3=absent
Age (years)
Are you pregnant? (Yamo mona vuse?) 1=yes 2=no (GO TO WM 8) 8=DK (GO WM 8)
Are you currently enrolled in the ANC? (Yakenga rimoro gu ba anavuseyo?) 1=yes
2=no (If no, STOP)
Are you currently receiving iron-folate tablets? (SHOW PILL) (Mona dia gu dawa du ni zamba. Ha na ye na kure fu boro?) 1=yes (STOP NOW) 2= no (STOP NOW) 8=DK (STOP NOW)
Hb (g/dL)
(Only for non-pregnant women)
Woman referred for anaemia 1=yes 2=no
*W8: Refer to the clinic for anaemia if HB is <8.0 g/dl

50
IYCF Questionnaire (1 questionnaire per child 0 -23 months)
Date (dd/mm/yyyy) Team Number
Block Number HH Number
|___|___|/|___|___|/2019 |___|___|
|___|___|
|___|___|
No
QUESTION ANSWER CODES
SECTION IF1
IF1 Sex Male ……….………………….………………... 1
Female……………………………………………2
|___|
IF2
Birthdate
RECORD FROM AGE
DOCUMENTATION.
LEAVE BLANK IF NO VALID AGE
DOCUMENTATION
Day/Month/Year……………………….
|___|___| /|___|___| / |___|___||___|___|
IF3
Child’s age in months
IF AGE DOCUMENTATION NOT
AVAILABLE, ESTIMATE USING
EVENT CALENDAR. IF AGE
DOCUMENTATION AVAILABLE,
RECORD THE AGE IN MONTHS
FROM THE DATE OF BIRTH
|___|___|
IF4
Has [NAME] ever been breastfed?
(Nyamo _____ naaha mai?)
Yes ………………………………………….….. 1
No …………………………………………..…….2
DK ………………………………………….……8
|___|
IF ANSWER IS 2
or 8 GO TO IF7
IF5
How long after birth did you first put
[NAME] to the breast?
(Siadi regbo wai fuo vungu mo mai
_____ ti ha mai?
Less than one hour …….……………....1
(Mbat fu sa sa?)
Between 1 and 23 hours ………..…...2
(Bangbanda sa sa na sa bauru na biata?
|___|

51
More than 24 hours
…………………......3
(Ti fuo sa baura na biama?
DK..........................................................8
IF6
Was [NAME] breastfed yesterday
during the day or at night?
(Nyamo _____ aha mai gba uru singa
yuru?
Yes ………………………………………..………1
No ……………………………………..………….2
DK ………………………………………..………8
|___|
SECTION IF2
IF7
Now I would like to ask you about liquids that [NAME] may have had yesterday during the day
and at night. I am interested in whether your child had the item even if it was combined with
other foods.
Yesterday, during the day or at night, did [NAME] receive any of the following?
ASK ABOUT EVERY LIQUID. IF ITEM WAS GIVEN,
CIRCLE ‘1’. IF ITEM WAS NOT GIVEN, CIRCLE ‘2’. IF
CAREGIVER DOESN’T KNOW, CIRCLE ‘8’. EVERY LINE
MUST HAVE A CODE.
7A Plain water: (Kungbo Ime)
1=Yes 2=No 8=DK
7A………….………1 2 8
7B. Infant formula: for example, Nan 1, nan 2, s26.
(Sis sia agua rigo du tipa rukutu agude) 7B…………………1 2 8
7C. Milk such as tinned, powdered, or fresh animal milk:
for example (Niddo).
(Gudu ni ngugoho, ga kopo na ime mamu anyaa)
7C…………………1 2 8
7D. Juice or juice drinks e.g. mango, apple juice bought
in shops.
(Nzinziri ime zukuzuku ahee dutipa mbira ha)
7D……………….1 2 8
7E. Clear broth (Girigiri ime riahe watadu suruba) 7E……………….…1 2 8
7F. Sour milk or yogurt for example (Kakai ime mamu se) 7F…………….……1 2 8
7G. Thin porridge for example: (Zangbazanga dingbo) 7G……………….…1 2 8

52
7H. Tea or coffee with milk (Siai , Buni) 7H…………………1 2 8
7I. Any other water-based: for example sodas, other
sweet drinks, herbal infusion, gripe water, clear tea with
no milk, black coffee, ritual
(Gukura mbirimbiri ime duwa soda watadu mbira nzinziri
ahee wa lemon)
7I…………………1 2 8
IF8
Yesterday, during the day or at night, did [NAME] eat
solid or semi-solid (soft, mushy) food?
(Gbaradu uru watadu yuru, nyamu ____ ari ndandai riahe
singa ruru ngburahaa)
Yes ………………..…1
No ....................... 2
DK …………………..8
|___|
SECTION IF3
IF9
Did [NAME] drink anything from a bottle with a nipple
yesterday during the day or at night?
(Nyama_____ ambiringahe gba ti ngba gizaza uru watadu
yuru?
Yes …………………1
No ……………….….2
DK …………………8
|___|
SECTION IF4
IF10
Is child aged 6-23 months?
REFER TO QF2
Yes ………………….1
No …………….…….2
|___|
IF ANSWER IS 2
STOP NOW
IF11
Now I would like to ask you about some particular foods [NAME] may eat. I am interested in
whether your child had the item even if it was combined with other foods. Yesterday, during the
day or at night, did [NAME] consume any of the following?
ASK ABOUT EVERY ITEM. IF ITEM WAS GIVEN, CIRCLE ‘1’. IF ITEM WAS NOT GIVEN, CIRCLE
‘2’. IF CAREGIVER DOESN’T KNOW, CIRCLE ‘8’. EVERY LINE MUST HAVE A CODE.
Yes No DK
IF12
11A. Flesh foods for example: beef, goat, lamb, mutton,
pork, rabbit, chicken, duck, liver, kidney, heart.
(Iwaapasio:
Wagabagara,meme,kandoro,mukuru,ndakuto,kondo,baata,
endee, wiri mbia nya, na bagandu)
11A………………..1 2 8

53
11C. FBF++ : for example CSB++
(Ngungo/Ndigbo ga abaramu ba fu ngua yo yafu he fu
rukutu agude)
11C………………1 2 8
11D. RUTF : for example Plumpy’Nut® (SHOW
SACHET
(Kpaku abaramu du na sisihe ni zamba)
11D………………1 2 8
11E. RUSF: for example Plumpy’Sup® (SHOW SACHET) 11E………………1 2 8
11G. Infant formula: for example NAN 1, nan 2, s26).
(Sia sia agua rigo du tipa rukutu agude) 11G……...………1 2 8
11H. List any iron fortified solid, semi-solid or soft foods
designed specifically for infants and young children
available in the local setting that are different than
distributed commodities.
(Mo gedi gu kura unga ariahe watadu rurungbura ha nga gu
na fu ome du waga kopo ga ndukuro fu rukutu agude nga
guya fungaha dagba agu arigo reya)
11H……………….1 2 8
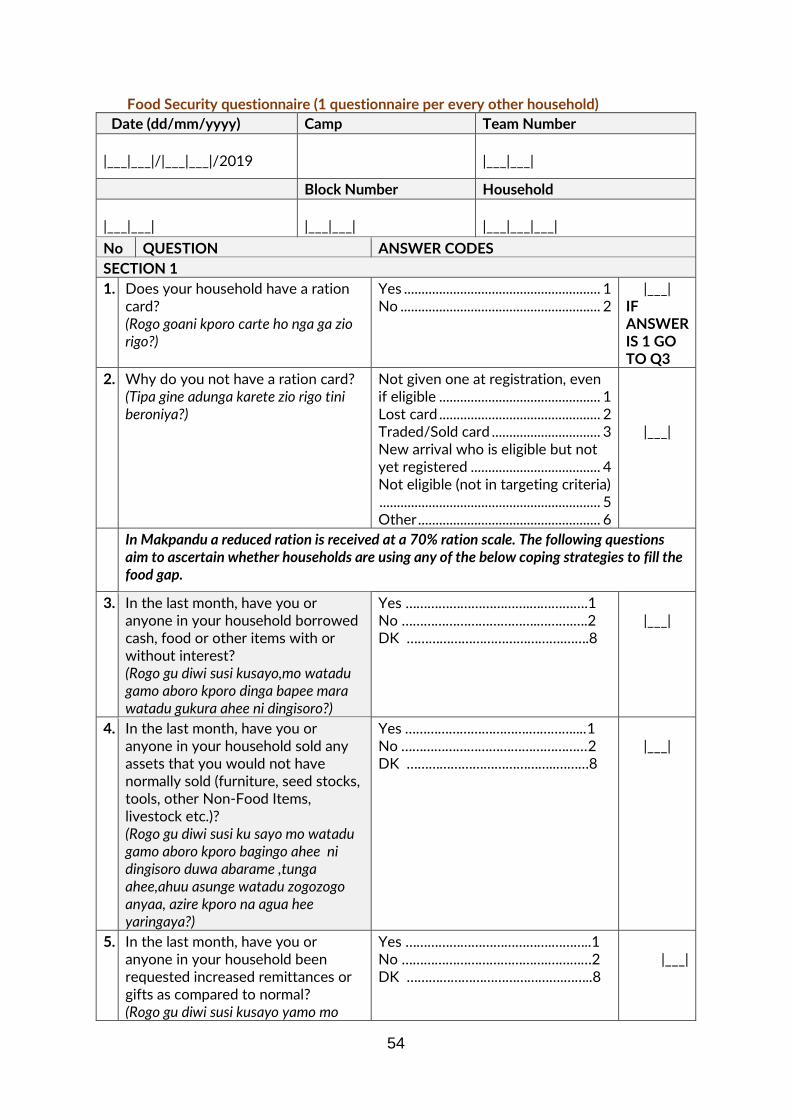
54
Food Security questionnaire (1 questionnaire per every other household)
Date (dd/mm/yyyy) Camp Team Number
|___|___|/|___|___|/2019
|___|___|
Block Number Household
|___|___|
|___|___|
|___|___|___|
No QUESTION ANSWER CODES
SECTION 1
1. Does your household have a ration card? (Rogo goani kporo carte ho nga ga zio rigo?)
Yes ........................................................ 1 No ......................................................... 2
|___| IF ANSWER IS 1 GO TO Q3
2. Why do you not have a ration card? (Tipa gine adunga karete zio rigo tini beroniya?)
Not given one at registration, even if eligible .............................................. 1 Lost card .............................................. 2 Traded/Sold card ............................... 3 New arrival who is eligible but not yet registered ..................................... 4 Not eligible (not in targeting criteria) ............................................................... 5 Other .................................................... 6
|___|
In Makpandu a reduced ration is received at a 70% ration scale. The following questions aim to ascertain whether households are using any of the below coping strategies to fill the food gap.
3. In the last month, have you or anyone in your household borrowed cash, food or other items with or without interest? (Rogo gu diwi susi kusayo,mo watadu gamo aboro kporo dinga bapee mara watadu gukura ahee ni dingisoro?)
Yes …………………………….…………….1 No ……………………………….……….….2 DK …………………………………….…….8
|___|
4. In the last month, have you or anyone in your household sold any assets that you would not have normally sold (furniture, seed stocks, tools, other Non-Food Items, livestock etc.)? (Rogo gu diwi susi ku sayo mo watadu gamo aboro kporo bagingo ahee ni dingisoro duwa abarame ,tunga ahee,ahuu asunge watadu zogozogo anyaa, azire kporo na agua hee yaringaya?)
Yes …………………………….…………....1 No ……………………………………………2 DK …………………………………..………8
|___|
5. In the last month, have you or anyone in your household been requested increased remittances or gifts as compared to normal? (Rogo gu diwi susi kusayo yamo mo
Yes ………………………………….………..1 No ………………………………….…………2 DK …………………………………….……..8
|___|
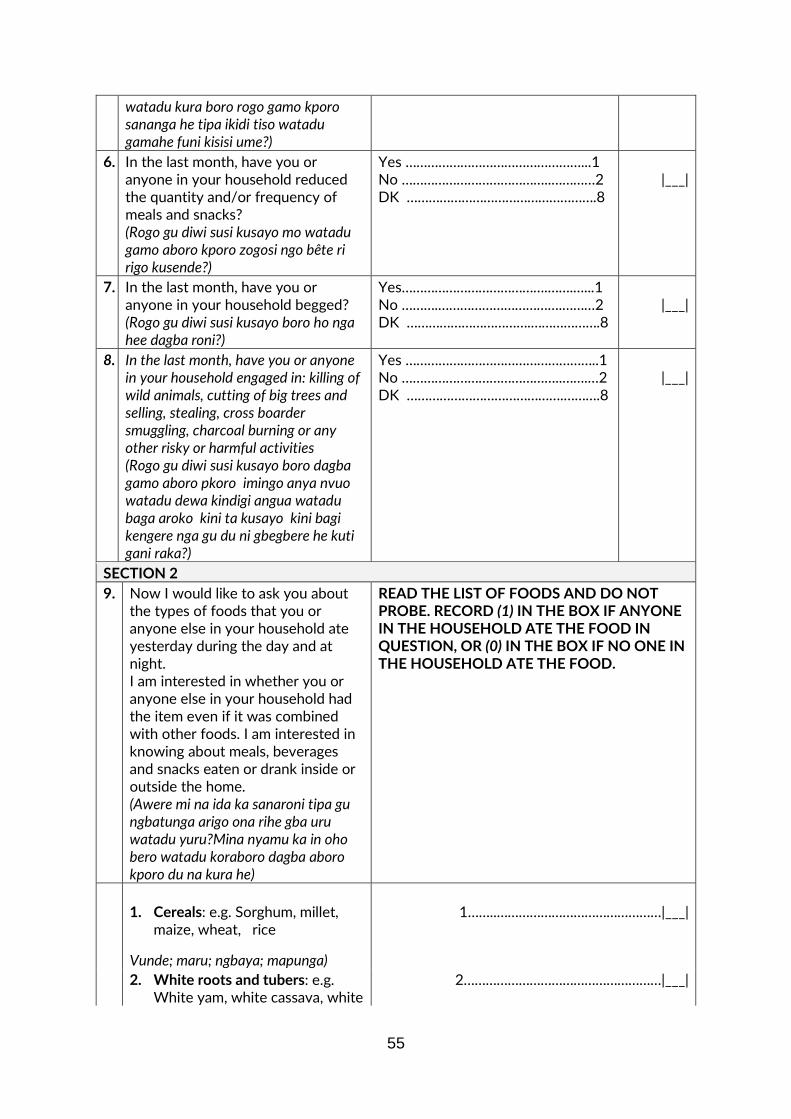
55
watadu kura boro rogo gamo kporo sananga he tipa ikidi tiso watadu gamahe funi kisisi ume?)
6. In the last month, have you or anyone in your household reduced the quantity and/or frequency of meals and snacks? (Rogo gu diwi susi kusayo mo watadu gamo aboro kporo zogosi ngo bête ri rigo kusende?)
Yes …………………………………………...1 No …………………………………..…………2 DK …………………………………………….8
|___|
7. In the last month, have you or anyone in your household begged? (Rogo gu diwi susi kusayo boro ho nga hee dagba roni?)
Yes………………………………….…….…...1 No ……….…………………………….………2 DK …………………………….……………….8
|___|
8. In the last month, have you or anyone in your household engaged in: killing of wild animals, cutting of big trees and selling, stealing, cross boarder smuggling, charcoal burning or any other risky or harmful activities (Rogo gu diwi susi kusayo boro dagba gamo aboro pkoro imingo anya nvuo watadu dewa kindigi angua watadu baga aroko kini ta kusayo kini bagi kengere nga gu du ni gbegbere he kuti gani raka?)
Yes ……………………………………………..1 No ……………………………………..…….…2 DK …………………………………….……….8
|___|
SECTION 2
9. Now I would like to ask you about the types of foods that you or anyone else in your household ate yesterday during the day and at night. I am interested in whether you or anyone else in your household had the item even if it was combined with other foods. I am interested in knowing about meals, beverages and snacks eaten or drank inside or outside the home. (Awere mi na ida ka sanaroni tipa gu ngbatunga arigo ona rihe gba uru watadu yuru?Mina nyamu ka in oho bero watadu koraboro dagba aboro kporo du na kura he)
READ THE LIST OF FOODS AND DO NOT PROBE. RECORD (1) IN THE BOX IF ANYONE IN THE HOUSEHOLD ATE THE FOOD IN QUESTION, OR (0) IN THE BOX IF NO ONE IN THE HOUSEHOLD ATE THE FOOD.
1. Cereals: e.g. Sorghum, millet,
maize, wheat, rice
Vunde; maru; ngbaya; mapunga)
1……..………………………………………|___|
2. White roots and tubers: e.g. White yam, white cassava, white
2………………………………………………|___|

56
sweet potato or other foods made from roots
Pusi gbara, pusi gbanda; pusi abangbe
3A. Vitamin A rich vegetables and tubers: e.g. pumpkin, orange sweet potato, tomato and carrot Boko, zamba abangbe, komondoro, carrot
3A……………………………………………|___|
3B. Dark green leafy vegetables: cassava leaves, pumpkin leaves, bean leaves; sweet potato leaves amaranthus; kale, spinach. kpe gadia; kpe siro; Kpe abapu; kpe abangbe; kpe pende; sukumawiki; spinach
3B……………………………………………|___|
3C. Other vegetables: cabbage, green pepper, onion, eggplant Cabbage; shata, basala, aswuati
3C…..….……………………………………|___|
4A. Vitamin A rich fruits or juice from these fruits: Pineapple, Orange, mango; pawpaw or their juice Ananasi; ramuni; manga ; paipai
4A……………………………………………|___|
4B. Other fruits: Any other fruits such as banana, lemon, avocado, water melon including wild fruits and 100% fruit juice made from these.
Buu; ka kai ramuni; aruka, batiko; na agu akora ha
4B……………………………………………|___|
5A. Organ meat: Kidney; heart; liver; intestines Kibida; endenya; lwo pasio;
5A………….…………………………………|___|
5B. Flesh meats: goat, beef, lamb, pork, rabbit, chicken, duck, doves (pasio meme, pasio pasio bambata wiri kandoro; pasio mukuru; pasión ndakuto, pasio kondo, pasio bachate, pasio mbipo)
5B…………………………………………….|___|
6. Eggs: Chicken eggs; duck eggs; dove eggs (Para kondo; para bata; para mbipo)
6………………………………………………|___|
7. Fish: fresh and dry fish Iwoatio; uguatio
7……………………….………………………|___|
9. Legumes, nuts and seeds: beans, yellow split peas,
8………………………………………………|___|

57
groundnuts and sim sim ; soya beans
Akonde; abapu; ades; awande; sere; asoya;
10. Milk and milk products: Any milk including infant formula, cow milk; or other milk products (powder milk)
Ime mamu bagara; ngungo ime mamu bagara
9………………………………………………|___|
11. Oils and fats : Palm oil, sim sim
oil, white ant oil, ground nut oil,
lulu oil
Nzeme mbiro; nzeme sere, nzeme age;
nzeme awande, kpakari; nzeme zawa
10……………………………………………|___|
12. Sweets: sugar, honey,
sweetened soda or sweetened
juice drinks, sugary foods.
Sukara; zeme anyege; nzinziri soda; biscuit; cake
11……………………………………………|___|
13. Spices, condiments, beverages:
Any spices (black pepper; roiko,
salt; ginger; garlic), condiments
(tomato paste), coffee, tea,
alcoholic beverages.
(Fir fir, Roiko, tikpo; tangawizi; pusi
basara; salsa; buna; chai; buda)
12……………….……….…………………|___I

58
Appendix 4: Events Calendar
Dark grey areas are for children not eligible for 6-59 months surveys.
Seasons Religious Holidays Other Events Months / Years Age in months
Height Range
Harvest of Sorghum/Maize/Rice October 2019 0
Harvest of groundnuts & Beans September 2019 1
Second planting season August 2019 2
Crop Weeding continues July 2019 3
Weeding of crops /Rice planting World refugee day (20 June) June 2019 4
Start of rice planting May 2019 5
Planting season/ Mango season April 2019 6
Land preparation Women’s day celebration March 2019 7 65-70
cm February 2019 8
Renovation/Building of houses CPA & New year celebrations January 2019 9
71-76 cm
Christmas (25 Dec) World Aids day celebration December 2018 10
Post harvest 16 days of activism November 2018 11
Harvest of Sorghum/maize October 2018 12
Harvest of groundnuts & beans September 2018 13
Second planting season August 2018 14
77-80 cm
Crop Weeding continues July 2018 15
Weeding of crops/ Rice planting World refugee day (20 June) June 2018 16
Start of rice planting May 2018 17
Planting season/ Mango season April 2018 18
Land preparation Women’s day celebration March 2018 19
February 2018 20
Renovation/Building of houses CPA & New year celebrations January 2018 21
81-86 cm
Christmas (25 Dec) World Aids day celebration December 2017 22
Post harvest 16 days of activism November 2017 23
Harvest of Sorghum/maize October 2017 24
Harvest of groundnuts & beans September 2017 25
Second planting season August 2017 26
87-90 cm
Crop Weeding continues July 2017 27
Weeding of crops/ Rice planting World refugee day (20 June) June 2017 28
Start of rice planting May 2017 29
Planting season/ Mango season April 2017 30
Land preparation Women’s day celebration March 2017 31
February 2017 32
Renovation/Building of houses CPA & New year celebrations January 2017 33
Christmas (25 Dec) World Aids day celebration December 2016 34
Post harvest 16 days of activism November 2016 35
Harvest of Sorghum/maize October 2016 36
Harvest of groundnuts & beans September 2016 37
Second planting season August 2016 38
91-99 cm
Crop Weeding continues July 2016 39
Weeding of crops/ Rice planting World refugee day (20 June) June 2016 40
Start of rice planting May 2016 41
Planting season/ Mango season April 2016 42
Land preparation Women’s day celebration March 2016 43
February 2016 44
Renovation/Building of houses CPA & New year celebrations January 2016 45
Christmas (25 Dec) World Aids day celebration December 2015 46
Post harvest 16 days of activism November 2015 47
Harvest of Sorghum/maize October 2015 48
Harvest of groundnuts & beans September 2015 49
Second planting season August 2015 50 100-110
cm Crop Weeding continues July 2015 51
Weeding of crops/ Rice planting World refugee day (20 June) June 2015 52
Start of rice planting May 2015 53
Planting season/Mango season April 2015 54
Land preparation Women’s day celebration March 2015 55
February 2015 56
Renovation/Building of houses CPA & New year celebrations January 2015 57
Christmas (25 Dec) World Aids day celebration December 2014 58
Post harvest 16 days of activism November 2014 59
Harvest of Sorghum/maize October 2014 60

59
How to Use a Local Events Calendar
Survey inclusion and exclusion criteria
Survey inclusion criteria: these are the cut-off birth dates for children to be eligible to participate in the 6-59 months sample.
• Included in the survey are all children born between November 2014 and April 2019.
Survey exclusion criteria: all children born as of these dates are excluded from the sample (i.e. they are over 59 months or under 6):
• Excluded from the survey are all children born before November 2014 and April 2019.
When to use the events calendar?
• The events calendar is a tool that helps determine the approximate age of children who have no reliable administrative documents (birth certificate, child’s health notebook, etc.)
• It includes all different events that occurred during the 60 months that preceded the survey and serves as a reference and check-list for surveyors and surveyed populations.
How to use the events calendar
• Use a line of questions phrased as follows: “<name> was he/she born before or after <event>?”
• Choose the events in the most appropriate column of the calendar to reduce the range at each question.
• The child’s mother usually knows either the age of the child in years, or the birth date (but without any official corroboration. In both cases, it is necessary to refine the age estimation by using the events calendar.
1. When the mother knows the age in years, convert the age in months using the calendar and ask her questions relating to the
events that occurred around the child’s birth. Specify with the mother:
• On the calendar, whether a particular even occurred about the time the child was born (e.g. end of Ramadan); ask the mother whether the birth occurred before or after this event;
• Ask her the season in which the child was born; rain, warm or cold season, etc.
• This information will allow you to estimate the child’s age in a more reliable and accurate way. 2. When the mother knows the child’s birth date, but has no official document to prove it:
• Locate the birth date on the calendar;
• Ask the mother questions on events that occurred around the child’s birth (religious holiday, celebration, season, etc.) in order to estimate the age in actual months.
3. When the mother knows neither the age nor the birth date, the events listed in the calendar will help her remember the
circumstances of her child’s birth and to estimate the age in months:
• Ask the mother, or the person who cares for the child, if she remembers the period or an event that surrounded the birth of the child;
• According to her answer, ask further questions to locate the month and year of the birth. 4. When it is impossible to get any reliable indication from the mother, look for a child of similar stature in the neighbourhood:
• Determine the age of the other child;
• Estimate the age difference between both children using the calendar;
• Deduce the age of the surveyed child.
To determine the age of a child, the surveyor must enter on the questionnaire either the date of birth or the age in months, but not both. If the child has a health notebook or an official identity document that indicates his/her birth date; write down the birth date on the questionnaire.
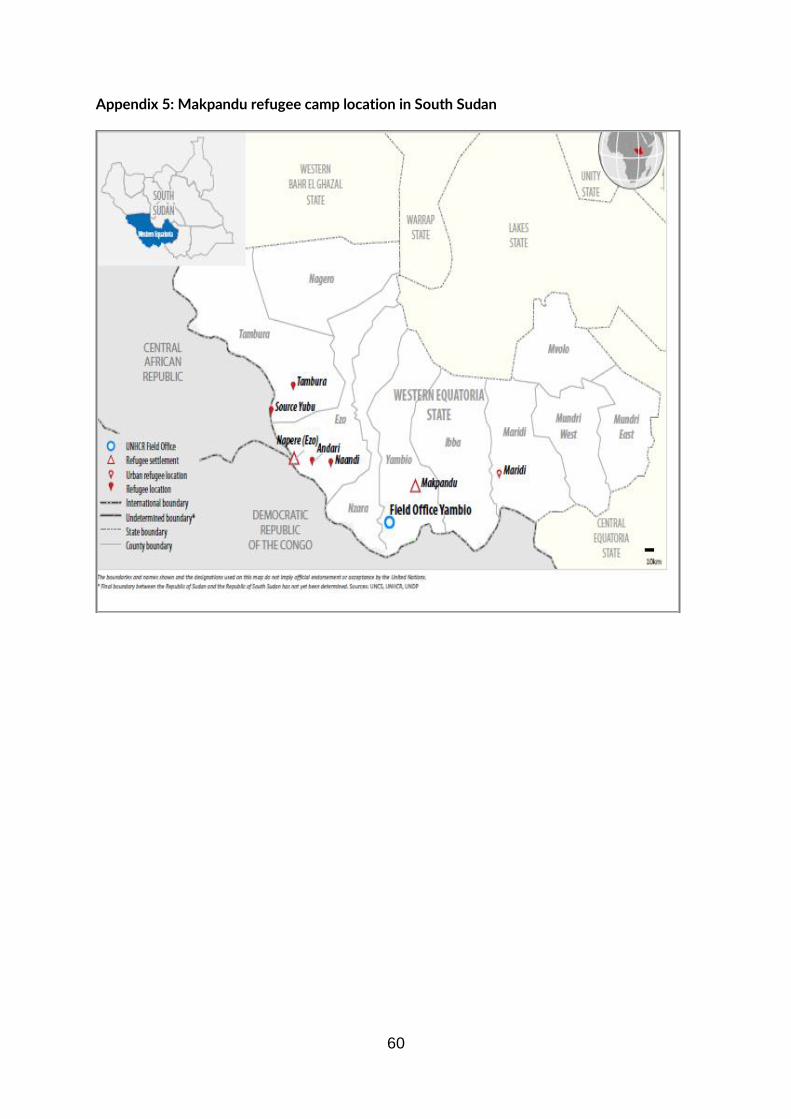
60
Appendix 5: Makpandu refugee camp location in South Sudan