standard operation procedures for near-road no2
TRANSCRIPT

Standard Operation Procedures for Near-Road NO2
In Use By
Polk County Air Quality Ambient Air Monitoring Personnel
For Calendar Year 2015
Revised: February 25, 2015
Section: 3 Revision: 4
PREPARED BY _________________________________________ ______ Polk County Air Quality Air Pollution Monitoring Specialist Date SIGNATURES/APPROVALS _________________________________________ ______ Polk County Air Quality Assurance Officer Date
Section 3: Near-Road NO2 Revised: February 25, 2015
Revision Number: 4 POLK COUNTY AIR QUALITY DIVISION STANDARD OPERATING PROCEDURE MANUAL FOR THERMO SCIENTIFIC TRACE LEVEL NO-NO2-NOX MONITORING Table of Contents Page # 3.1 Purpose…………………………………………..………………………………………………………………... 3 3.2 Scope ………………………….…………………………………………………………………………………... 3 3.3 References……………………………………….………………………………………………………………… 3 3.4 Introductions……………………….…………………………………………………………………………….. 3 3.5 Health and Safety Warning/Precautions………………………………………………………………………... 4 3.6 Sampler Setup………………………………………….……………..…………………………………………... 5
3.6.1 Site Selection………………………………………………………………………………………...... 5 3.6.1.1 The Monitoring Station…………………………………………………………………... 5 3.6.1.2 Probe Placement………………………………………………………………………….. 5
3.6.2 Inspecting New Equipment…………………………………………………………………………... 6 3.6.3 Equipment Installation……………………………………………………………………………….. 6 3.6.4 Programming TL-42i…………………………………………………………………………………. 7 3.6.4.1 Range and Units………………………………………………………………………….. 8 3.6.4.2 Averaging Time…………………………………………………………………………… 8 3.6.4.3 Temperature Compensation……………………………………………………………. 8 3.6.4.4 Pressure Compensation…………………………………………………………………. 8 3.6.4.5 Baud Rate…………………………………………………………………………………. 9 3.6.4.6 Clock Set………………………………………………………………………………….. 9 3.6.4.7 Auto Mode………………………………………………………………………………… 9
3.7 Standards……………………………………………………………………………………………………….. 9 3.8 Calibrations…………………………………………………………………………………………………….. 10 3.8.1 Calibration Procedures for the TL-42i using the 146i Calibrator………………………………… 11 3.8.1.1 Pre-Calibration…………………………………………………………………………… 11 3.8.1.2 Calibration of NO/NOX………………………………………………………………….. 11 3.8.1.3 Calibration of NO2……………………………………………………………………….. 13 3.8.2 Converter Efficiency…………………………………………………………………………………. 14 3.9 Quality Control………………………………………………………………………………………………… 14 3.9.1 Station Inspection…………………………………………………………………………………….. 14 3.9.2 Station Log Book……………………………………………………………………………………… 15 3.9.3 Bi-Weekly Zero, Precision and Span Checks………………………………………………………. 15
3.9.4 Data Acquisition and Telemetry…………………………………………………………………...... 16 3.10 Equipment, Maintenance and Trouble Isolation…………………………………………………………….. 16 3.10.1 Preventative Maintenance……………………………………………………………………………. 16 3.10.1.1 Analyzer Leak Check…………………………………………………………………… 16 3.10.1.2 Sample Line Leak Check……………………………………………………………....... 17 3.10.1.3 Particulate Filter Changes……………………………………………………………….. 17 3.10.1.4 Cleaning the Fan Filters………………………………………………………………….. 17 3.10.1.5 Cleaning PMT Cooler Fins………………………………………………………………. 17 3.10.1.6 Replacing the Sample Lines……………………………………………………………… 18 3.10.2 Trouble Isolation……………………………………………………………………………………… 18 3.10.3 Environmental Control for Monitoring Equipment………………………………………………... 18 3.11 Quality Assurance……………………………………………………………………………………………… 18 3.11.1 Direct Comparison Audit…………………………………………………………………………….. 18 3.11.2 Performance Evaluation Audit………………………………………………………………………. 19 3.12 Data Quality Assessment………………………………………………………………………………………. 20 3.12.1 Precision……………………………………………………………………………………………….. 20 3.12.2 Accuracy………………………………………………………………………………………………. 20 3.12.3 Data Completeness……………………………………………………………………………………. 20 3.13 Procedures for Bi-Weekly Checks……………………………………………………………………………. 20 3.13.1 Maintenance Mode for Agilaire Model 8832 Data Loggers……………………………………….. 21 3.13.2 Remote Mode………………………………………………………………………………………….. 21 3.13.3 Maintenance and Diagnostics Check………………………………………………………………... 21 3.13.4 Bi-Weekly Zero, Precision and Span Checks………………………………………………………. 22 3.13.4.1 Zero Air Check……………………………………………………………………………. 22
1
Section 3: Near-Road NO2 Revised: February 25, 2015
Revision Number: 4 3.13.4.2 Span Check (NO/NOX)………………………………………………………………....... 23 3.13.4.3 Precision Check (NO/NOX)……………………………………………………………… 23 3.13.4.4 Zero/Precision/Span Checks (NO2)……………………………………………………… 24 3.13.4.5 Converter Efficiency Check……………………………………………………………… 25 3.13.5 Invalidate Data and Recalibrate…………………………………………………………………….. 25 FIGURES Figure 3-1 Thermo Scientific TL-42i NO-NO2-NOX Analyzer…………………………………………………… 7 Figure 3-2 Gas Phase Titration System…..…………………………………………………………….……………. 11 Figure 3-3 Agilaire Model 8832 Data Logger……………………………………………..…………….…………… 21 TABLES Table 3-1 Diagnostic Checks……………………………………………………………………………….…………. 22 Table 3-2 Measurement Quality Objectives………………………………………………………………………… 27 Appendix A-Forms and Field Sheets…………………………………………………………………………………. 30
2
Section 3: Near-Road NO2 Revised: February 25, 2015
Revision Number: 4 3.0 STANDARD OPERATING PROCEDURE FOR NEAR-ROAD NO2 3.1 Purpose To establish a standard operating procedure (SOP) manual for the Polk County Air Quality Division personnel concerning the setup, operation, bi-weekly zero/precision/span checks, calibrations, audits and maintenance of near-road NO2 monitoring maintained and operated by Polk County staff. This SOP is intended for individuals responsible for collecting ambient air monitoring data supported by the Polk County Air Quality Division. 3.2 Scope These procedures are to be used by Polk County Air Quality Division personnel. The objective of this SOP is to familiarize the station operator with procedures used for near-road microscale NO2 monitoring. The accuracy of the data obtained from any instrument depends upon the instrument’s performance and the operator’s skill. It is important that the station operator become familiar with both this SOP as well as the manufacturer’s instruction manual in order to achieve a high level of data quality. This SOP is to be used as an outline and is not intended to replace the equipment manufacturer’s manual or procedures. This SOP describes the proper procedures for the setup, operation, weekly zero/precision/span checks, calibrations, audits and maintenance of Thermo Fisher Scientific’s Trace Level 42i analyzers operated by Polk County Air Quality personnel.
3.3 References
3.3.1 Thermo Scientific, Model 42i Trace Level, Chemiluminescence NO-NO2-NOx Analyzer,
Instruction Manual. Part Number 102855-00, December 20, 2007. 3.3.2 Thermo Scientific, Model 146i, Dynamic Gas Calibrator, Instruction Manual. Part Number
102482-00, January 30, 2008. 3.3.3 EPA Quality Assurance Guidance Document 2.3, Reference Method for the Determination
of Nitrogen Dioxide in the Atmosphere (Chemiluminescence), February, 2002, Draft. 3.3.4 EPA-600/4-75-003 December 1975, Technical Assistance Document for the
Chemiluminescence Measurement of Nitrogen Dioxide. 3.3.5 EPA-600/R-12/531 May, 2012, EPA Traceability Protocol for Assay and Certification of
Gaseous Calibration Standards. 3.3.6 EPA-454/B-13-003, May 2013. Quality Assurance Handbook for Air Pollution
Measurement Systems, Volume II. Ambient Air Quality Monitoring Program. 3.3.7 40 Code of Federal Regulations (CFR) Part 50, Appendix F, Measurement Principle and
Calibration Procedure for the Measurement of NOX in the Atmosphere. 3.3.8 40 Code of Federal Regulations (CFR) Part 58, Appendix A, Quality Assurance
Requirements for State and Local Air Monitoring Stations (Slams). 3.3.9 40 Code of Federal Regulations (CFR) Part 58, Appendix D, Network Design for State and
Local Air Monitoring Stations (SLAMS), National Air Monitoring Stations (NAMS), and Photochemical Assessement Monitoring Stations (PAMS).
3.3.10 40 Code of Federal Regulations (CFR) Part 58, Appendix E, Probe and Monitoring Path Siting Criteria for Ambient Air Quality Monitoring.
3.3.11 EPA-454/B-12-002, June 2012, Near-Road NO2 Monitoring Technical Assistance Document. By: Nealson Watkins and Dr. Richard Baldauf.
3.4 Introduction In February of 2010, the EPA revised the minimum monitoring requirements for the nitrogen dioxide (NO2) monitoring network in support of a new 1-hour NO2 national Ambient Air Quality Standards (NAAQS) (75 FR 6474, Feb. 9, 2010). In support of that standard, state and local agencies with a CBSA greater than 500,000 are
3
Section 3: Near-Road NO2 Revised: February 25, 2015
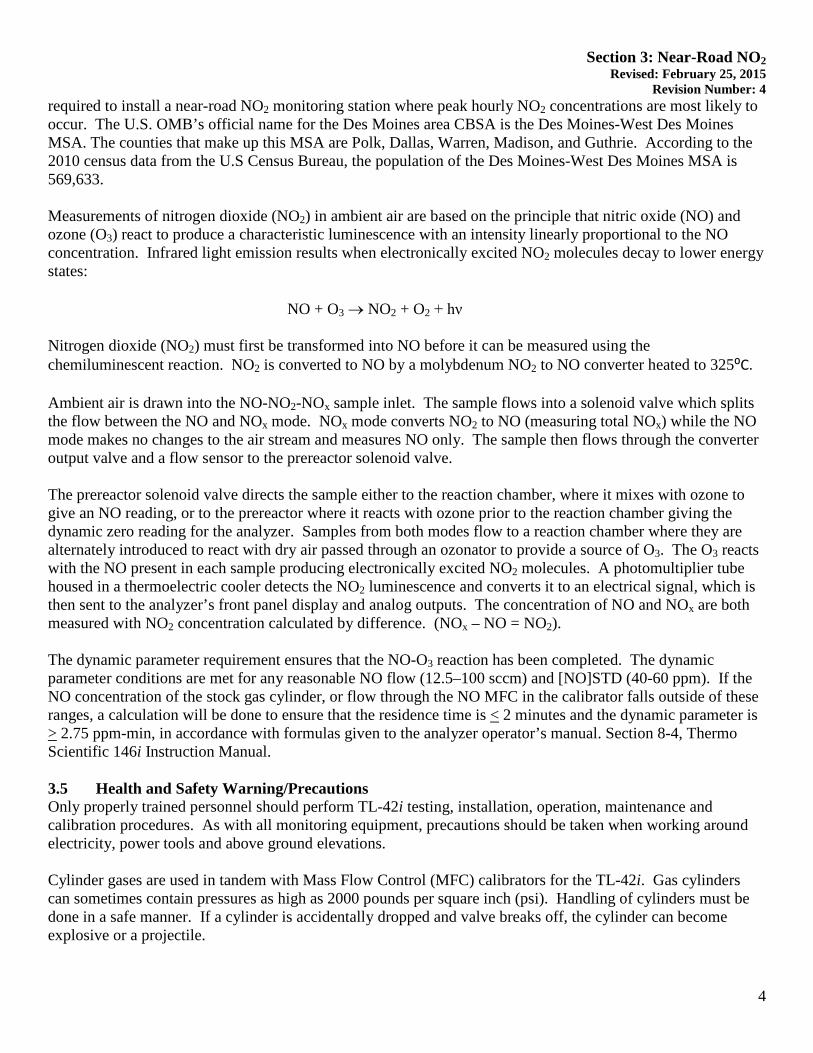
Revision Number: 4 required to install a near-road NO2 monitoring station where peak hourly NO2 concentrations are most likely to occur. The U.S. OMB’s official name for the Des Moines area CBSA is the Des Moines-West Des Moines MSA. The counties that make up this MSA are Polk, Dallas, Warren, Madison, and Guthrie. According to the 2010 census data from the U.S Census Bureau, the population of the Des Moines-West Des Moines MSA is 569,633. Measurements of nitrogen dioxide (NO2) in ambient air are based on the principle that nitric oxide (NO) and ozone (O3) react to produce a characteristic luminescence with an intensity linearly proportional to the NO concentration. Infrared light emission results when electronically excited NO2 molecules decay to lower energy states:
NO + O3 → NO2 + O2 + hν
Nitrogen dioxide (NO2) must first be transformed into NO before it can be measured using the chemiluminescent reaction. NO2 is converted to NO by a molybdenum NO2 to NO converter heated to 325⁰C. Ambient air is drawn into the NO-NO2-NOx sample inlet. The sample flows into a solenoid valve which splits the flow between the NO and NOx mode. NOx mode converts NO2 to NO (measuring total NOx) while the NO mode makes no changes to the air stream and measures NO only. The sample then flows through the converter output valve and a flow sensor to the prereactor solenoid valve. The prereactor solenoid valve directs the sample either to the reaction chamber, where it mixes with ozone to give an NO reading, or to the prereactor where it reacts with ozone prior to the reaction chamber giving the dynamic zero reading for the analyzer. Samples from both modes flow to a reaction chamber where they are alternately introduced to react with dry air passed through an ozonator to provide a source of O3. The O3 reacts with the NO present in each sample producing electronically excited NO2 molecules. A photomultiplier tube housed in a thermoelectric cooler detects the NO2 luminescence and converts it to an electrical signal, which is then sent to the analyzer’s front panel display and analog outputs. The concentration of NO and NOx are both measured with NO2 concentration calculated by difference. (NOx – NO = NO2). The dynamic parameter requirement ensures that the NO-O3 reaction has been completed. The dynamic parameter conditions are met for any reasonable NO flow (12.5–100 sccm) and [NO]STD (40-60 ppm). If the NO concentration of the stock gas cylinder, or flow through the NO MFC in the calibrator falls outside of these ranges, a calculation will be done to ensure that the residence time is < 2 minutes and the dynamic parameter is > 2.75 ppm-min, in accordance with formulas given to the analyzer operator’s manual. Section 8-4, Thermo Scientific 146i Instruction Manual. 3.5 Health and Safety Warning/Precautions Only properly trained personnel should perform TL-42i testing, installation, operation, maintenance and calibration procedures. As with all monitoring equipment, precautions should be taken when working around electricity, power tools and above ground elevations. Cylinder gases are used in tandem with Mass Flow Control (MFC) calibrators for the TL-42i. Gas cylinders can sometimes contain pressures as high as 2000 pounds per square inch (psi). Handling of cylinders must be done in a safe manner. If a cylinder is accidentally dropped and valve breaks off, the cylinder can become explosive or a projectile.
4
Section 3: Near-Road NO2 Revised: February 25, 2015
Revision Number: 4 Transportation of cylinders is regulated by the Department of Transportation (DOT). It is strongly recommended that all agencies contact the DOT or Highway Patrol to learn the most recent regulations concerning transport of cylinders. It is possible to blend other compounds with CO cylinder gas. In this case, it is recommended that MSDS for all compounds be made available to all staff that use and handle the cylinders or permeation tubes. 3.6 Sampler Setup
3.6.1 Site Selection The purpose of a near-road NO2 monitoring station is to characterize the maximum expected hourly NO2 concentration due to mobile source emissions on major roadways. Therefore, the most important spatial scale for near-road NO2 monitoring station is microscale. Microscale represents areas in close proximity to major roadways or point and area sources, and extending up to approximately 100 meters. Near-road NO2 monitoring stations are required to be within 50 meters of target road segments For more detailed information concerning site selection for near-road NO2 monitoring, refer to the 40 Code of Federal Regulations (CFR), Part 58, Appendix D, or the Quality Assurance Handbook for Air Pollution Measurement Systems, Volume II, Section 6.2, entitled "Monitoring Site Location."
3.6.1.1 The Monitoring Station The structure housing the near-road NO2 monitoring equipment is a shelter designed specifically for air monitoring purposes. A clean, dry, secure and temperature controlled space is required so that the sampling equipment can operate properly.
Careful thought and planning is required in locating a monitoring station. The individual responsible for the installation must consider:
● Proximity to the nearest power source. A 120 VAC source is required for the operation of the NO-NO2-NOx monitoring equipment.
● The space where the equipment is housed must maintain a temperature range of 15-35 degrees Celsius. This usually requires the need for an air conditioner and a heater controlled by a thermostat.
● The accessibility of the equipment to the operator. The operator must be able to safely access the equipment during regular business hours.
● The security of the equipment. Monitoring instruments are expensive. They must be placed in a location where security can be assured.
● Contracts for rental of space or power. Contracts need to be signed with the owner of the property where the instruments are located.
● Telephone lines for data transmission to a central computer. A four-wire, dedicated 1200 baud (minimum) telephone data line is needed to access the Polk County Air Quality telemetry.
● Local building codes. In most cases, the contractor installing the power, structure, concrete, etc. know the local building codes.
● Dirty, dusty areas must be avoided.
3.6.1.2 Probe Placement Once the location of the station has been identified, the individual responsible for the installation must be familiar with the criteria for locating the probe. The location of the sample probe is critical and individuals performing the installation must follow these specific guidelines:
5
Section 3: Near-Road NO2 Revised: February 25, 2015
Revision Number: 4 • The inlet probe must be located between 2-7 meters above ground level. • The monitor probe shall be as near as practicable to the outside nearest edge of
the traffic lanes of the target road segment; but shall not be located at a distance greater than 50 meters in the horizontal, from the outside nearest edge of the traffic lanes of the target road segment.
• The monitor probe shall have an unobstructed air flow, where no obstacles exist at or above the height of the monitor probe, between the monitor probe and the outside nearest edge of the traffic lanes of the target road segment.
● Trees can provide surfaces for NO2 adsorption or reactions and obstruct wind flow. To reduce this possible interference, the inlet probe must be at least 10 meters from the drip line of the trees.
● No trees or shrubs should be located between the probe and the roadway under investigation.
For more detailed information concerning site selection for near-road NO2 monitoring, refer to the 40 Code of Federal Regulations (CFR), Part 58, Appendix E, or the Quality Assurance Handbook for Air Pollution Measurement Systems, Volume II.
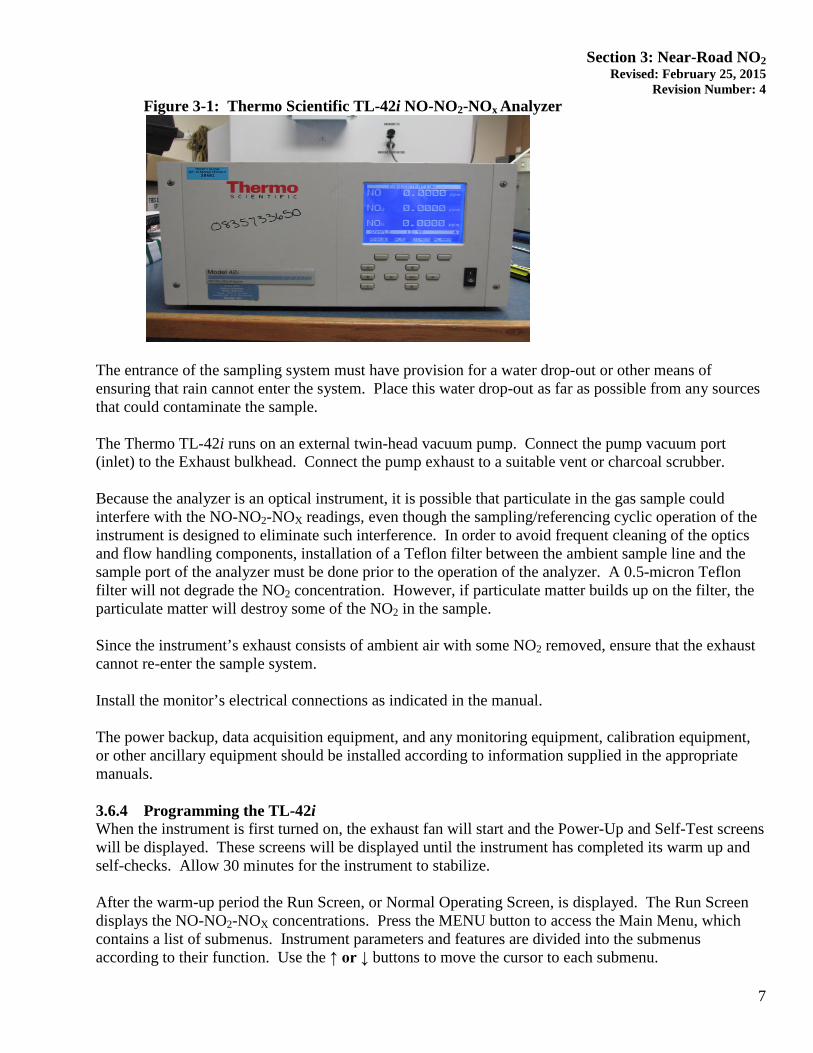
3.6.2 Inspecting New Equipment When shipment of the monitor is received, verify that the package contents are complete as ordered. Inspect the instrument for external physical damage due to shipping, such as scratched or dented panel surfaces and broken knobs or connectors. Remove the instrument cover and all interior foam packing and save (in case future shipments of the instrumentation are needed). Make note of how the foam packing was installed. Inspect the interior of the instrument for damage, such as broken components or loose circuit boards. Make sure that all of the circuit boards are completely secured. Loose boards could short out the motherboard. If no damage is evident, the monitor is ready for calibration, installation and operation. If any damage due to shipping is observed contact Thermo Scientific at 1-866-282-0430 for instructions on how to proceed. If it is discovered that the instrument was damaged during shipping and it becomes necessary to return it to the manufacturer, repack it in the same way it was delivered. 3.6.3 Equipment Installation Polk County Air Quality Division will use the Thermo Scientific Model 42i Trace Level (TL-42i) Chemiluminescence NO-NO2-NOx Analyzer displayed in Figure 3-1 for sampling nitrogen dioxide. Installation of the TL-42i consists of connecting the sample tubing to the sample gas inlet fitting and connecting the primary power and the data logger device. An external pump must also be plumbed to the instrument. The sampler inlet line connection should be made with ¼ -inch outer diameter Teflon tubing.
6
Section 3: Near-Road NO2 Revised: February 25, 2015
Revision Number: 4 Figure 3-1: Thermo Scientific TL-42i NO-NO2-NOx Analyzer
The entrance of the sampling system must have provision for a water drop-out or other means of ensuring that rain cannot enter the system. Place this water drop-out as far as possible from any sources that could contaminate the sample. The Thermo TL-42i runs on an external twin-head vacuum pump. Connect the pump vacuum port (inlet) to the Exhaust bulkhead. Connect the pump exhaust to a suitable vent or charcoal scrubber. Because the analyzer is an optical instrument, it is possible that particulate in the gas sample could interfere with the NO-NO2-NOX readings, even though the sampling/referencing cyclic operation of the instrument is designed to eliminate such interference. In order to avoid frequent cleaning of the optics and flow handling components, installation of a Teflon filter between the ambient sample line and the sample port of the analyzer must be done prior to the operation of the analyzer. A 0.5-micron Teflon filter will not degrade the NO2 concentration. However, if particulate matter builds up on the filter, the particulate matter will destroy some of the NO2 in the sample. Since the instrument’s exhaust consists of ambient air with some NO2 removed, ensure that the exhaust cannot re-enter the sample system. Install the monitor’s electrical connections as indicated in the manual. The power backup, data acquisition equipment, and any monitoring equipment, calibration equipment, or other ancillary equipment should be installed according to information supplied in the appropriate manuals. 3.6.4 Programming the TL-42i When the instrument is first turned on, the exhaust fan will start and the Power-Up and Self-Test screens will be displayed. These screens will be displayed until the instrument has completed its warm up and self-checks. Allow 30 minutes for the instrument to stabilize. After the warm-up period the Run Screen, or Normal Operating Screen, is displayed. The Run Screen displays the NO-NO2-NOX concentrations. Press the MENU button to access the Main Menu, which contains a list of submenus. Instrument parameters and features are divided into the submenus according to their function. Use the ↑ or ↓ buttons to move the cursor to each submenu.
7
Section 3: Near-Road NO2 Revised: February 25, 2015
Revision Number: 4
3.6.4.1 Range and Units The Range menu defines the concentration range of the analog outputs. Polk County Air Quality Department will use the “Single Range Mode” option with the selected range of 0 – 500 ppb for the analyzer. To set the range for the instrument, press the MENU button to access the Main Menu. Press the ↓ button until the cursor is on “NO Range.” Press ENTER to display the NO Range Menu, and select RANGE. Use the ↑ or ↓ buttons to scroll through the preset ranges. Select “500” and press ENTER. Press MENU to return to the Range Menu. Repeat procedures to set NO2 Range and NOX Range. The Gas Units Screen defines how the NO-NO2-NOX concentration reading is expressed. From the Range Menu, select GAS UNITS to display the Gas Units screen. Use the ↓ button to select “PPB” and press ENTER. Press MENU twice to return to the Run Screen. 3.6.4.2 Averaging Time The averaging time defines a time period (1 to 300 seconds) during which NO-NO2-NOX measurements are taken. The average concentration of the readings is calculated for that time period. The Polk County Air Quality Department will use the default setting of 10 seconds as the averaging time for the collection of data. An averaging time of 300 seconds will be used during calibrations, audits, and zero/precision/span checks. From the Main Menu, use the ↓ button to scroll to AVERAGING TIME and press ENTER. From the Averaging Time Screen, use the ↑ or ↓ buttons to scroll through the preset ranges. Press ENTER to select the desired averaging time. Press RUN to return to the Run Screen. 3.6.4.3 Temperature Compensation Temperature compensation corrects for any changes to the instrument’s output signal due to variations in internal instrument temperature. When the temperature compensation is off, the first line of the display shows the factory standard temperature of 30ºC. The Polk County Air Quality Department will run the TL-42i with the temperature compensation set to ON. From the Main Menu, use the ↓ button to scroll to INSTRUMENT CONTROLS and press ENTER. From the Instrument Controls Screen, use the ↓ button to scroll to TEMPERATURE COMPENSATION, and press ENTER. Press ENTER to toggle the temperature compensation on or off. Press RUN to return to the Run Screen. 3.6.4.4 Pressure Compensation Pressure compensation corrects for any changes to the instrument’s output signal due to variation in the reaction chamber pressure. When the pressure compensation is off, the first line display shows the factory standard pressure of 300 mmHg. Polk County Air Quality Department will run the TL-42i with the pressure compensation set to ON, so the first line of the display represents the current pressure in the reaction chamber with an acceptable range of 200-450 mmHG. The displayed pressure is measured in pre-reactor mode. From the Main Menu, use the ↓ button to scroll to INSTRUMENT CONTROLS and press ENTER. From the Instrument Controls Screen, use the ↓ button to scroll to PRESSURE COMPENSATION, and press ENTER. Press ENTER to toggle the pressure compensation on or off. Press RUN to return to the Run Screen.
8
Section 3: Near-Road NO2 Revised: February 25, 2015
Revision Number: 4 3.6.4.5 Baud Rate The Baud Rate Screen is used to set the RS-232 interface baud rate. The Polk County Air Quality Department will use a baud rate of 9600. From the Main Menu, use the ↓ button to scroll to INSTRUMENT CONTROLS and press ENTER. From the Instrument Controls Screen, use the ↓ button to scroll to COMMUNICATION SETTINGS and press ENTER. From the Communication Settings Screen, use the ↓ button to scroll to BAUD RATE, and press ENTER. Use the ↑ or ↓ buttons to scroll through the preset rates. Press ENTER to select the desired baud rate. Press RUN to return to the Run Screen. 3.6.4.6 Clock Set To set the correct time and date on the instrument, press MENU to return to the Main Menu. Use the ↓ button to scroll to INSTRUMENT CONTROLS and press ENTER. Use the ↓ buttons to scroll to DATE/TIME and press ENTER. The date and time should be set to the data logger time. Use the → button to select: year, month, day, hour, minutes, or seconds. Use the ↑ or ↓ buttons to increase/decrease the desired value. Set the appropriate date and time and press ENTER. Press RUN to return to the Run Screen. The instrument is now set with the appropriate time, date, full scale range and units. NOTE: The clock should be checked at each site visit and adjusted if off from the data logger by more than 1 minute. 3.6.4.7 Auto Mode The Auto/Manual Mode screen allows selection of the automatic mode (NO/NOX), NO Mode (manual NO), or NOX mode (manual NOX). Polk County Air Quality will always run the TL-42i in Auto Mode. The auto cycle mode switches the mode solenoid valves automatically on a 10 second cycle so that NO, NO2, and NOX concentrations are determined. To set the TL-42i to Auto Mode, press MENU to return to the Main Menu. Use the ↓ button to scroll to INSTRUMENT CONTROLS and press ENTER. Use the ↓ buttons to scroll to AUTO/MANUAL MODE and press ENTER. Use the ↓ buttons to scroll to NO/NOX MODE and press ENTER. NOTE: It is recommended that you allow the TL-42i to warm up for 24-hours before you attempt checks or calibration.
3.7 Standards A cylinder containing 20 to 40 ppm NO in N2 with less than 1.0 ppm NO2 is used as the concentration standard. The cylinder must be traceable to a National Institute of Standards and Technology (NIST) NO in N2 Standard Reference Material or NO2 Standard Reference Material. Procedures for certifying the NO cylinder (working standard) against a NIST traceable NO or NO2 standard and for determining the amount of NO2 impurity are given in EPA Publication NO. EPA-006/4-75-003, “Technical Assistance Document for the Chemiluminescence Measurement of Nitrogen Dioxide.” In addition, the procedure for the certification of a NO working standard against a NIST traceable NO standard and determination of the amount of NO2 impurity in the working standard is reproduced here. The cylinder should be recertified on a regular basis as determined by the local quality control program.
9
Section 3: Near-Road NO2 Revised: February 25, 2015
Revision Number: 4 The gas certification process is quite rigorous. However, it is still possible to receive a cylinder gas out of specification. Polk County Air Quality will verify that a new cylinder gas is within specification before it is put into use. Immediately prior to removing an old cylinder, perform a zero/precision/ span check, making sure that relevant criteria are met. Change to the new cylinder, and update the Thermo 146i with the new stock gas concentration. Adjust the 146i to produce a target concentration equivalent to the precision level last used with the old cylinder. If the instrument reading is within 4% of the expected value, proceed to calibrate the analyzer with the new stock cylinder. If it is not within 4%, investigate and resolve the disparity prior to using the new cylinder. Operators will be required to replace the NO cylinder when the cylinder pressure drops below 200 PSI. This will involve removing the regulator on the depleted cylinder and installing the regulator on a replacement cylinder. Precautions must be taken to remove “dead” pockets of contaminants which are created within the regulator whenever it is removed from the cylinder. This problem can be minimized by carefully evacuating the regulator (also known as purging) after it is connected to the cylinder. Air trapped in the regulator can result in the NO converting to NO2 within the regulator resulting in errors during calibration. Better results will be achieved by alternately pressurizing and depressurizing the regulator once it has been attached to the cylinder. Contamination with even a small amount of moisture from back diffusion can cause the NO concentration to become unstable. The lower the cylinder concentration, the more susceptible it is to any contamination from “abuse” in the field. The best way to ensure low concentration cylinders are not contaminated by back diffusion is to make sure whenever the cylinder valve is open, there is gas flow out of the cylinder. If this procedure is always applied, it is impossible for any air or other contaminants to enter the cylinder, and the practice of repeated vacuum purging of regulators is not necessary. Polk County addresses this issue by:
• The cylinder utilized is only used for this site and is not removed until expiration of the certificate.
• The gas dilution system is fixed at this site and is not used at any other site so is not moved unless for maintenance or re-certification.
• The regulator will continuously be kept pressurized with cylinder gas.
3.8 Calibrations The Thermo Scientific Model TL-42i NO-NO2-NOx monitor is calibrated whenever the following occurs: installation of a new monitor, instrument repair, when a zero/precision/span check fail to meet acceptance criteria limits, after 6 months has expired since the last calibration, or more frequently at the field operator’s discretion. The Purpose of the calibration is to determine the NO, NO2 and NOx relationship between the analyzer and the true NO and NO2 concentrations. This procedure involves the gas phase titration (GPT) of a NO standard with O3 to produce NO2. This method is based upon the rapid gas phase reaction between NO and O3 to produce stoichiometric quantities of NO2.
NO + O3 → NO2 + O2
10
Section 3: Near-Road NO2 Revised: February 25, 2015
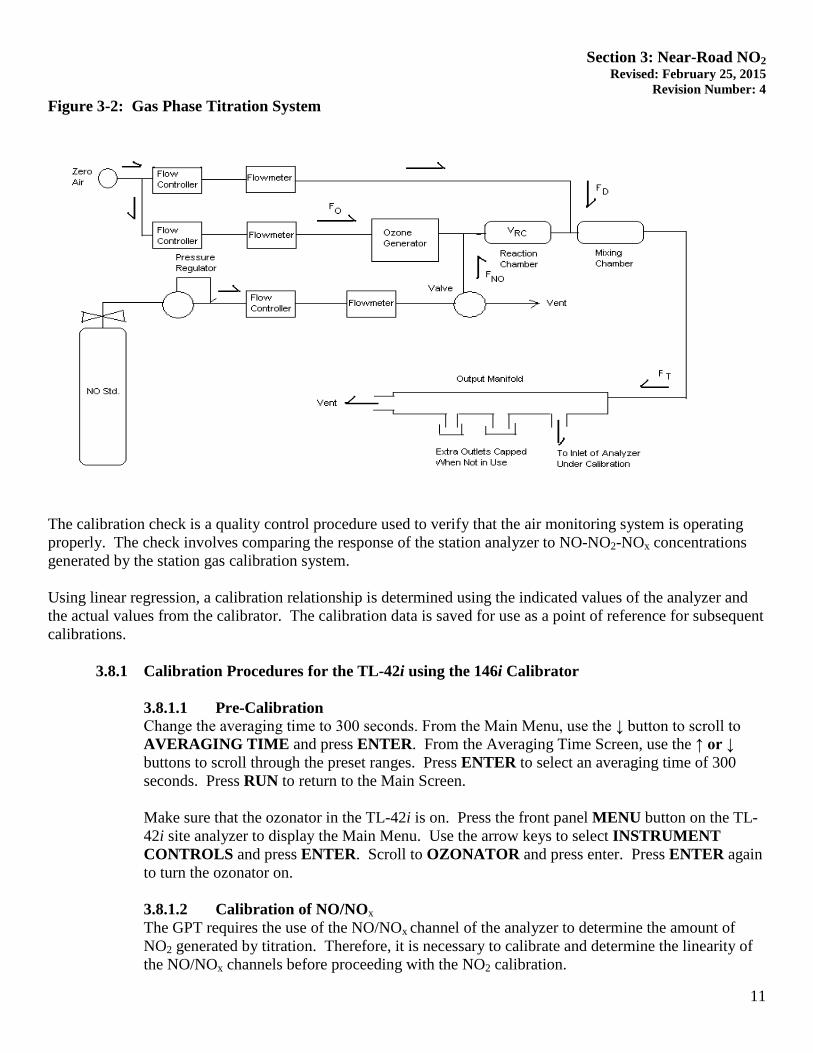
Revision Number: 4 Figure 3-2: Gas Phase Titration System
The calibration check is a quality control procedure used to verify that the air monitoring system is operating properly. The check involves comparing the response of the station analyzer to NO-NO2-NOx concentrations generated by the station gas calibration system. Using linear regression, a calibration relationship is determined using the indicated values of the analyzer and the actual values from the calibrator. The calibration data is saved for use as a point of reference for subsequent calibrations.
3.8.1 Calibration Procedures for the TL-42i using the 146i Calibrator
3.8.1.1 Pre-Calibration Change the averaging time to 300 seconds. From the Main Menu, use the ↓ button to scroll to AVERAGING TIME and press ENTER. From the Averaging Time Screen, use the ↑ or ↓ buttons to scroll through the preset ranges. Press ENTER to select an averaging time of 300 seconds. Press RUN to return to the Main Screen.
Make sure that the ozonator in the TL-42i is on. Press the front panel MENU button on the TL-42i site analyzer to display the Main Menu. Use the arrow keys to select INSTRUMENT CONTROLS and press ENTER. Scroll to OZONATOR and press enter. Press ENTER again to turn the ozonator on. 3.8.1.2 Calibration of NO/NOx The GPT requires the use of the NO/NOx channel of the analyzer to determine the amount of NO2 generated by titration. Therefore, it is necessary to calibrate and determine the linearity of the NO/NOx channels before proceeding with the NO2 calibration.
11
Section 3: Near-Road NO2 Revised: February 25, 2015
Revision Number: 4 On the Main Screen (or Standby Screen) of the 146i Calibrator, press the MENU button to access the Main Menu Screen. Scroll to OPERATION and press ENTER. Use the ← and → buttons to select desired GAS and press ENTER. Use the ↓ button to scroll down to SPAN. Use the ← and → buttons to scroll to ZERO and press ENTER to put the 146i Calibrator in zero air mode. Allow the analyzer to sample zero gas for a minimum of 15 minutes until stable readings are obtained on the NO, NO2, and NOX channels. Press the front panel MENU button on the TL-42i site analyzer to display the Main Menu. Use the arrow keys to select CALIBRATION and press ENTER to display the Calibration Menu. Select CALIBRATE NO BACKGROUND and press ENTER. Press ENTER to set the NO reading to zero. Press the MENU button to return to the Calibration Menu. Select CALIBRATE NOX BACKGROUND and press ENTER. Press ENTER to set the NOX reading to zero. Press the MENU button to return to the Calibration Menu. Select CALIBRATE PREREACTOR ZERO and press ENTER. Press ENTER to set the prereactor reading to zero. Press the MENU button to return to the Calibration Menu. Adjust the flow rate from the NO standard to generate an NO concentration of approximately 80% the upper range limit (URL) of 500 ppb (i.e. 400 ppb). Allow the site analyzer to stabilize for a minimum of 15 minutes and record all data logger readings from the NO, NO2, and NOX channels. Press the front panel MENU button on the TL-42i site analyzer to display the Main Menu. Use the arrow keys to select CALIBRATION and press ENTER. Scroll to CALIBRATE NO COEFFICIENT and press ENTER. Use the ← and → buttons to move the cursor left and right. Use the ↓ or ↑ buttons to increment and decrement the digit to the expected NO concentration and press ENTER. Repeat to calibrate the NOX concentration. NOTE: The NO, NOX, and Prereactor Background coefficients should be less that 15 ppb. The NO and NOX span coefficients should always fall between 0.900 and 1.100, and the NO2 span coefficient should be between 0.960 and 1.100. If outside that range, refer to Thermo Scientific’s Instruction Manual Chaper 7 “Servicing” procedures for PMT Voltage Adjustment. After the zero and 80% URL points have been set, determine at least 4 approximately evenly spaced points between zero and the 80% URL without further adjustment to the analyzer. SPAN 1 - 5 have been programmed for calibrations. SPAN 2 is set to 300 ppb, SPAN 3 is set to 200 ppb, SPAN 4 is set to 100 ppb, and SPAN 5 is set to 50 ppb. Allow the site analyzer to stabilize for a minimum of 15 minutes at each SPAN Point and record all data logger readings from the NO, NO2, and NOX channels.
12
Section 3: Near-Road NO2 Revised: February 25, 2015
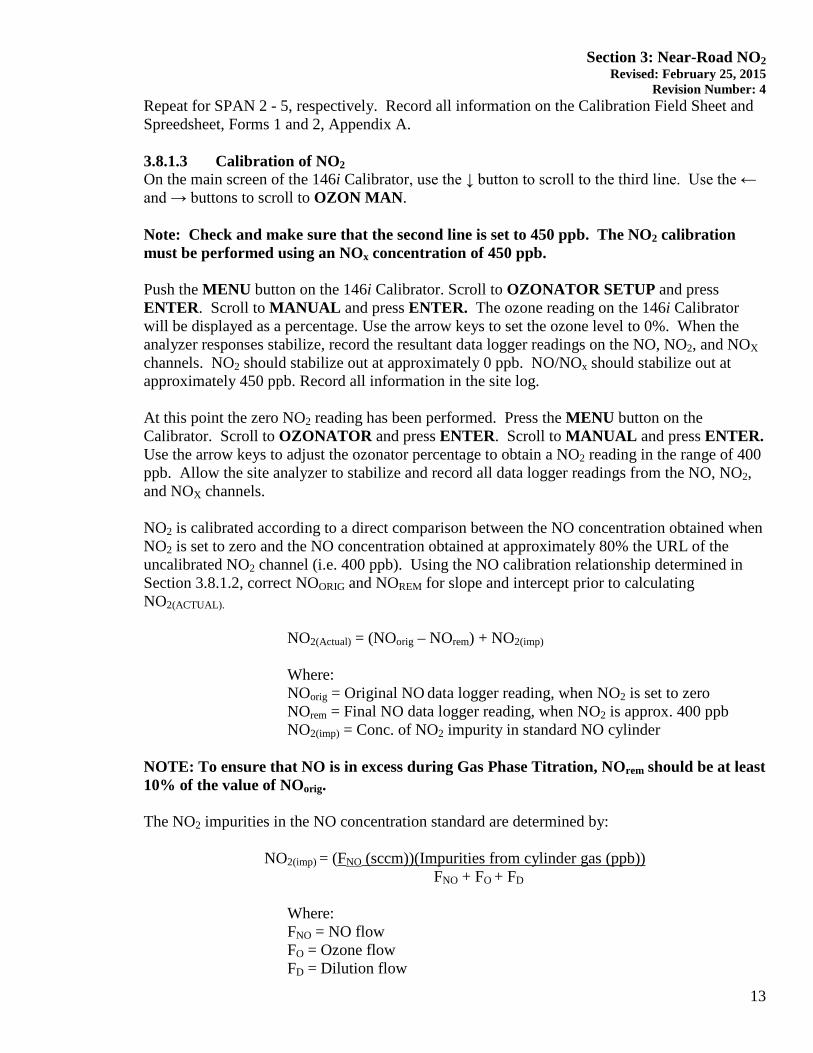
Revision Number: 4 Repeat for SPAN 2 - 5, respectively. Record all information on the Calibration Field Sheet and Spreedsheet, Forms 1 and 2, Appendix A. 3.8.1.3 Calibration of NO2 On the main screen of the 146i Calibrator, use the ↓ button to scroll to the third line. Use the ← and → buttons to scroll to OZON MAN. Note: Check and make sure that the second line is set to 450 ppb. The NO2 calibration must be performed using an NOx concentration of 450 ppb. Push the MENU button on the 146i Calibrator. Scroll to OZONATOR SETUP and press ENTER. Scroll to MANUAL and press ENTER. The ozone reading on the 146i Calibrator will be displayed as a percentage. Use the arrow keys to set the ozone level to 0%. When the analyzer responses stabilize, record the resultant data logger readings on the NO, NO2, and NOX channels. NO2 should stabilize out at approximately 0 ppb. NO/NOx should stabilize out at approximately 450 ppb. Record all information in the site log.
At this point the zero NO2 reading has been performed. Press the MENU button on the Calibrator. Scroll to OZONATOR and press ENTER. Scroll to MANUAL and press ENTER. Use the arrow keys to adjust the ozonator percentage to obtain a NO2 reading in the range of 400 ppb. Allow the site analyzer to stabilize and record all data logger readings from the NO, NO2, and NOX channels. NO2 is calibrated according to a direct comparison between the NO concentration obtained when NO2 is set to zero and the NO concentration obtained at approximately 80% the URL of the uncalibrated NO2 channel (i.e. 400 ppb). Using the NO calibration relationship determined in Section 3.8.1.2, correct NOORIG and NOREM for slope and intercept prior to calculating NO2(ACTUAL).
NO2(Actual) = (NOorig – NOrem) + NO2(imp) Where: NOorig = Original NO data logger reading, when NO2 is set to zero NOrem = Final NO data logger reading, when NO2 is approx. 400 ppb NO2(imp) = Conc. of NO2 impurity in standard NO cylinder
NOTE: To ensure that NO is in excess during Gas Phase Titration, NOrem should be at least 10% of the value of NOorig. The NO2 impurities in the NO concentration standard are determined by:
NO2(imp) = (FNO (sccm))(Impurities from cylinder gas (ppb)) FNO + FO + FD
Where: FNO = NO flow
FO = Ozone flow FD = Dilution flow
13
Section 3: Near-Road NO2 Revised: February 25, 2015
Revision Number: 4
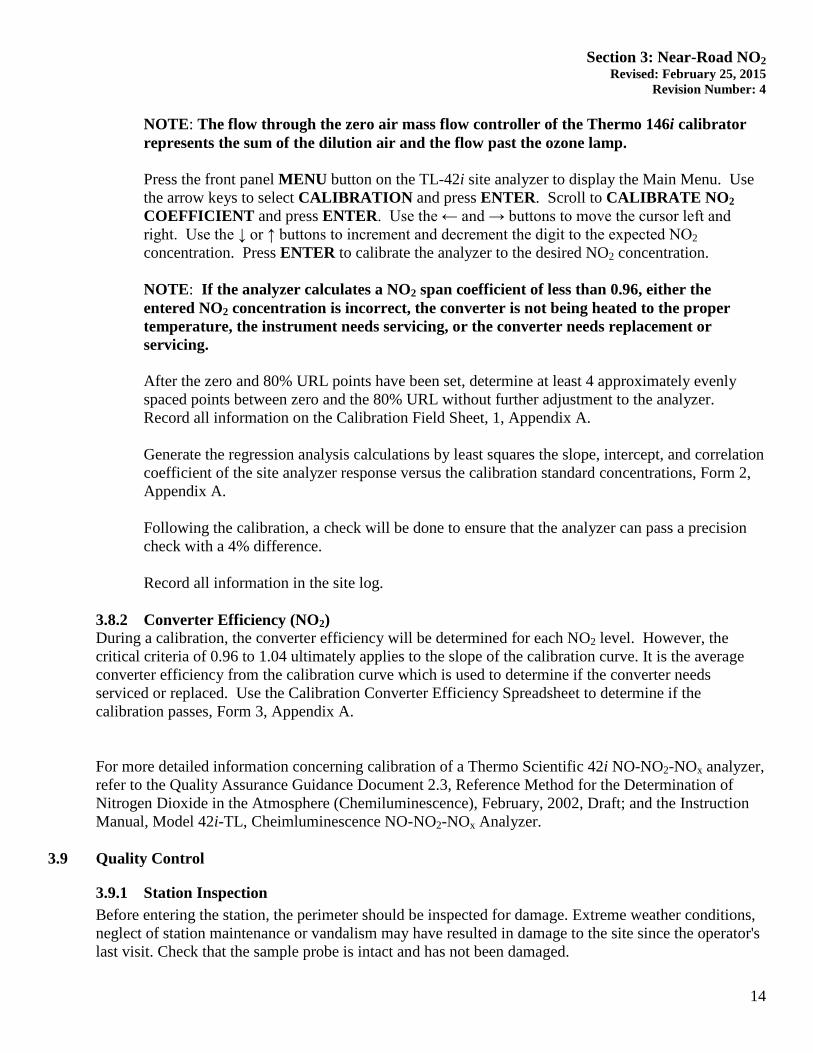
NOTE: The flow through the zero air mass flow controller of the Thermo 146i calibrator represents the sum of the dilution air and the flow past the ozone lamp. Press the front panel MENU button on the TL-42i site analyzer to display the Main Menu. Use the arrow keys to select CALIBRATION and press ENTER. Scroll to CALIBRATE NO2 COEFFICIENT and press ENTER. Use the ← and → buttons to move the cursor left and right. Use the ↓ or ↑ buttons to increment and decrement the digit to the expected NO2 concentration. Press ENTER to calibrate the analyzer to the desired NO2 concentration. NOTE: If the analyzer calculates a NO2 span coefficient of less than 0.96, either the entered NO2 concentration is incorrect, the converter is not being heated to the proper temperature, the instrument needs servicing, or the converter needs replacement or servicing. After the zero and 80% URL points have been set, determine at least 4 approximately evenly spaced points between zero and the 80% URL without further adjustment to the analyzer. Record all information on the Calibration Field Sheet, 1, Appendix A. Generate the regression analysis calculations by least squares the slope, intercept, and correlation coefficient of the site analyzer response versus the calibration standard concentrations, Form 2, Appendix A. Following the calibration, a check will be done to ensure that the analyzer can pass a precision check with a 4% difference.
Record all information in the site log.
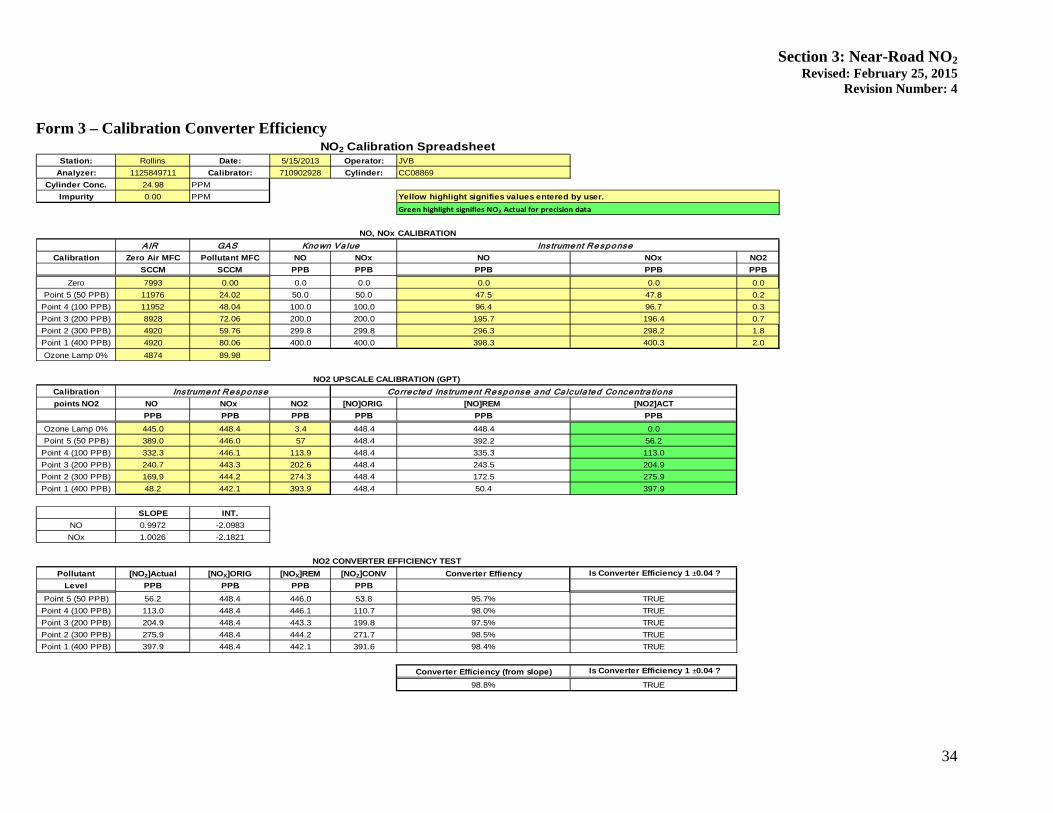
3.8.2 Converter Efficiency (NO2) During a calibration, the converter efficiency will be determined for each NO2 level. However, the critical criteria of 0.96 to 1.04 ultimately applies to the slope of the calibration curve. It is the average converter efficiency from the calibration curve which is used to determine if the converter needs serviced or replaced. Use the Calibration Converter Efficiency Spreadsheet to determine if the calibration passes, Form 3, Appendix A. For more detailed information concerning calibration of a Thermo Scientific 42i NO-NO2-NOx analyzer, refer to the Quality Assurance Guidance Document 2.3, Reference Method for the Determination of Nitrogen Dioxide in the Atmosphere (Chemiluminescence), February, 2002, Draft; and the Instruction Manual, Model 42i-TL, Cheimluminescence NO-NO2-NOx Analyzer.
3.9 Quality Control
3.9.1 Station Inspection Before entering the station, the perimeter should be inspected for damage. Extreme weather conditions, neglect of station maintenance or vandalism may have resulted in damage to the site since the operator's last visit. Check that the sample probe is intact and has not been damaged.
14
Section 3: Near-Road NO2 Revised: February 25, 2015
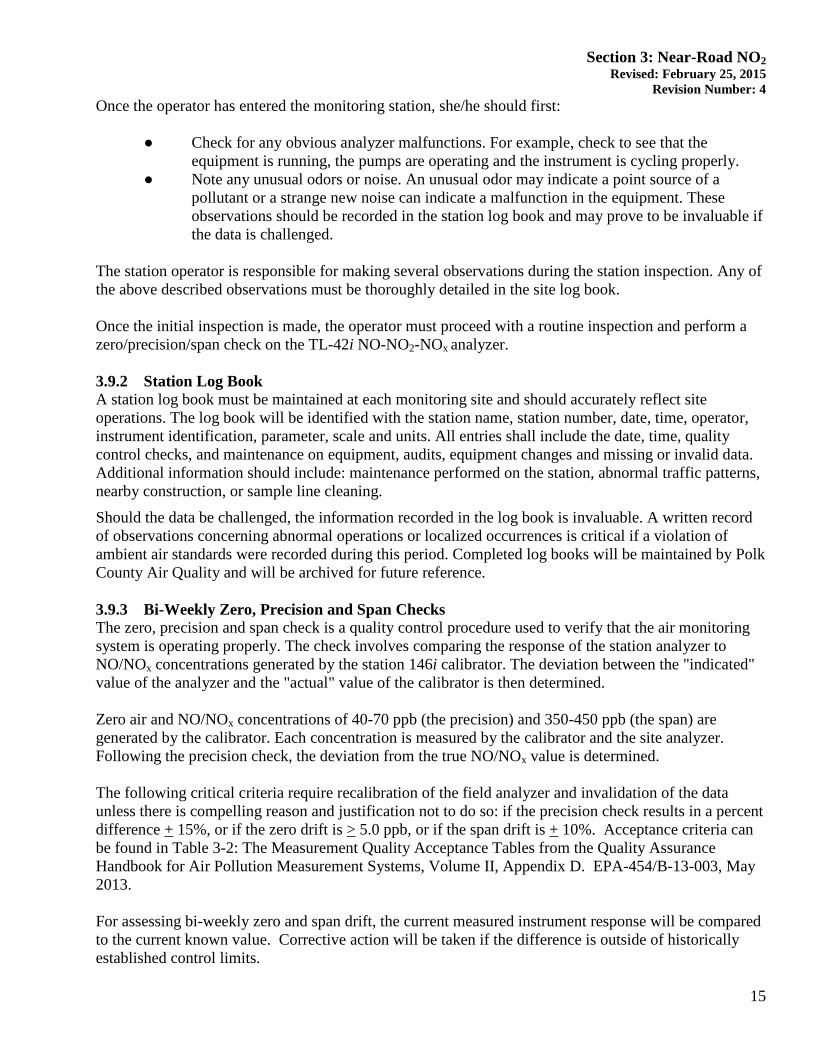
Revision Number: 4 Once the operator has entered the monitoring station, she/he should first:
● Check for any obvious analyzer malfunctions. For example, check to see that the equipment is running, the pumps are operating and the instrument is cycling properly.
● Note any unusual odors or noise. An unusual odor may indicate a point source of a pollutant or a strange new noise can indicate a malfunction in the equipment. These observations should be recorded in the station log book and may prove to be invaluable if the data is challenged.
The station operator is responsible for making several observations during the station inspection. Any of the above described observations must be thoroughly detailed in the site log book. Once the initial inspection is made, the operator must proceed with a routine inspection and perform a zero/precision/span check on the TL-42i NO-NO2-NOx analyzer.
3.9.2 Station Log Book A station log book must be maintained at each monitoring site and should accurately reflect site operations. The log book will be identified with the station name, station number, date, time, operator, instrument identification, parameter, scale and units. All entries shall include the date, time, quality control checks, and maintenance on equipment, audits, equipment changes and missing or invalid data. Additional information should include: maintenance performed on the station, abnormal traffic patterns, nearby construction, or sample line cleaning.
Should the data be challenged, the information recorded in the log book is invaluable. A written record of observations concerning abnormal operations or localized occurrences is critical if a violation of ambient air standards were recorded during this period. Completed log books will be maintained by Polk County Air Quality and will be archived for future reference.
3.9.3 Bi-Weekly Zero, Precision and Span Checks The zero, precision and span check is a quality control procedure used to verify that the air monitoring system is operating properly. The check involves comparing the response of the station analyzer to NO/NOx concentrations generated by the station 146i calibrator. The deviation between the "indicated" value of the analyzer and the "actual" value of the calibrator is then determined. Zero air and NO/NOx concentrations of 40-70 ppb (the precision) and 350-450 ppb (the span) are generated by the calibrator. Each concentration is measured by the calibrator and the site analyzer. Following the precision check, the deviation from the true NO/NOx value is determined. The following critical criteria require recalibration of the field analyzer and invalidation of the data unless there is compelling reason and justification not to do so: if the precision check results in a percent difference + 15%, or if the zero drift is > 5.0 ppb, or if the span drift is + 10%. Acceptance criteria can be found in Table 3-2: The Measurement Quality Acceptance Tables from the Quality Assurance Handbook for Air Pollution Measurement Systems, Volume II, Appendix D. EPA-454/B-13-003, May 2013. For assessing bi-weekly zero and span drift, the current measured instrument response will be compared to the current known value. Corrective action will be taken if the difference is outside of historically established control limits.
15
Section 3: Near-Road NO2 Revised: February 25, 2015
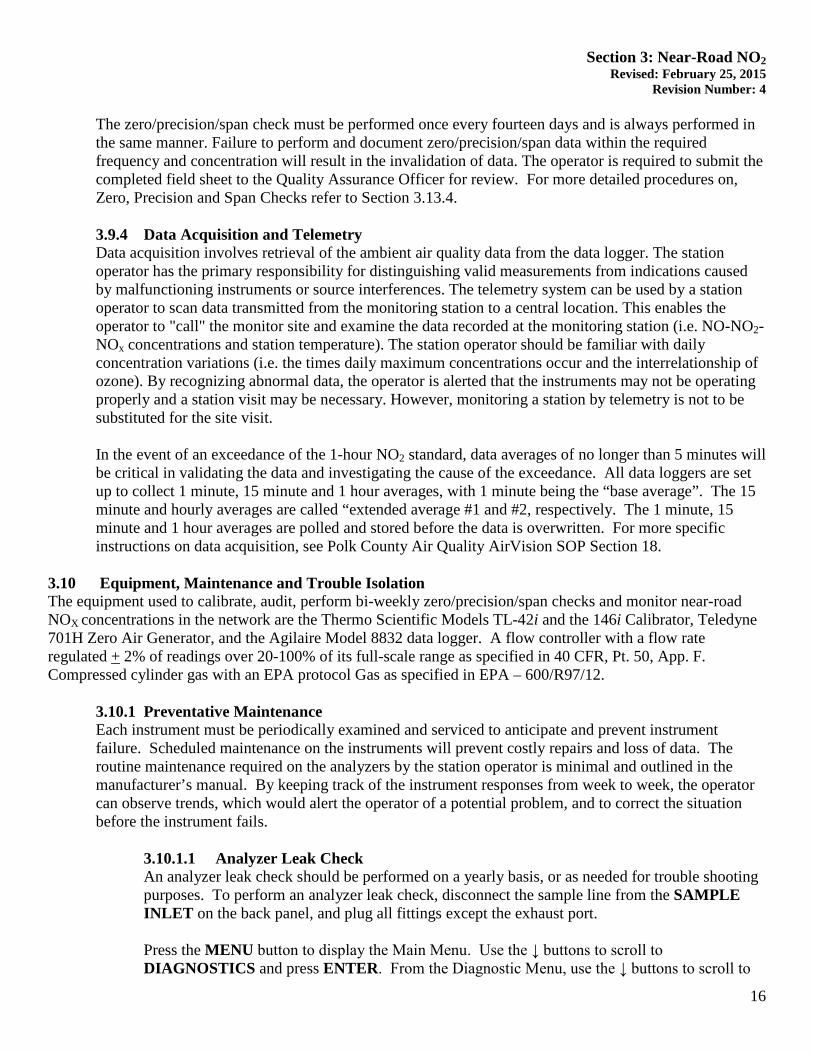
Revision Number: 4 The zero/precision/span check must be performed once every fourteen days and is always performed in the same manner. Failure to perform and document zero/precision/span data within the required frequency and concentration will result in the invalidation of data. The operator is required to submit the completed field sheet to the Quality Assurance Officer for review. For more detailed procedures on, Zero, Precision and Span Checks refer to Section 3.13.4. 3.9.4 Data Acquisition and Telemetry Data acquisition involves retrieval of the ambient air quality data from the data logger. The station operator has the primary responsibility for distinguishing valid measurements from indications caused by malfunctioning instruments or source interferences. The telemetry system can be used by a station operator to scan data transmitted from the monitoring station to a central location. This enables the operator to "call" the monitor site and examine the data recorded at the monitoring station (i.e. NO-NO2-NOx concentrations and station temperature). The station operator should be familiar with daily concentration variations (i.e. the times daily maximum concentrations occur and the interrelationship of ozone). By recognizing abnormal data, the operator is alerted that the instruments may not be operating properly and a station visit may be necessary. However, monitoring a station by telemetry is not to be substituted for the site visit. In the event of an exceedance of the 1-hour NO2 standard, data averages of no longer than 5 minutes will be critical in validating the data and investigating the cause of the exceedance. All data loggers are set up to collect 1 minute, 15 minute and 1 hour averages, with 1 minute being the “base average”. The 15 minute and hourly averages are called “extended average #1 and #2, respectively. The 1 minute, 15 minute and 1 hour averages are polled and stored before the data is overwritten. For more specific instructions on data acquisition, see Polk County Air Quality AirVision SOP Section 18.
3.10 Equipment, Maintenance and Trouble Isolation The equipment used to calibrate, audit, perform bi-weekly zero/precision/span checks and monitor near-road NOX concentrations in the network are the Thermo Scientific Models TL-42i and the 146i Calibrator, Teledyne 701H Zero Air Generator, and the Agilaire Model 8832 data logger. A flow controller with a flow rate regulated + 2% of readings over 20-100% of its full-scale range as specified in 40 CFR, Pt. 50, App. F. Compressed cylinder gas with an EPA protocol Gas as specified in EPA – 600/R97/12.
3.10.1 Preventative Maintenance Each instrument must be periodically examined and serviced to anticipate and prevent instrument failure. Scheduled maintenance on the instruments will prevent costly repairs and loss of data. The routine maintenance required on the analyzers by the station operator is minimal and outlined in the manufacturer’s manual. By keeping track of the instrument responses from week to week, the operator can observe trends, which would alert the operator of a potential problem, and to correct the situation before the instrument fails.
3.10.1.1 Analyzer Leak Check An analyzer leak check should be performed on a yearly basis, or as needed for trouble shooting purposes. To perform an analyzer leak check, disconnect the sample line from the SAMPLE INLET on the back panel, and plug all fittings except the exhaust port. Press the MENU button to display the Main Menu. Use the ↓ buttons to scroll to DIAGNOSTICS and press ENTER. From the Diagnostic Menu, use the ↓ buttons to scroll to
16
Section 3: Near-Road NO2 Revised: February 25, 2015
Revision Number: 4 SAMPLE FLOW and press ENTER. The flow reading should slowly drop to zero. Press the MENU button to return to the Diagnostics Menu. Use the ↓ buttons to scroll to PRESSURE and press ENTER. The pressure reading should drop below 250 mmHg. If the flow and pressure do not drop to their desired limits, there is a leak in the analyzer. Check to see that all fittings are tight, and none of the lines are cracked or broken. 3.10.1.2 Sample Line Leak Check A sample line leak check should be performed on a yearly basis, and anytime new sample line is installed. Unscrew the sample line from the back of the analyzer, and connect the sample line to the vacuum pressure gauge. The sample line must be capped off on the top side of the roof before proceeding. Turn vacuum pump on and wait for the pump to remove all air from the sample line. The vacuum gauge will indicate a steady reading of approximately 21 inches of Hg vacuum when the lines have been evacuated. The vacuum reading must be at least 15 inches of Hg for the leak check to take place. Close the valve that is located between the vacuum gauge and the pump. Once the valve is closed record the reading from the gauge and start a timer. Shut the pump off and wait 1 minute. Record the reading from the vacuum gauge. The acceptable leak rate for the sample lines is 0.5 inches of Hg for the 1 minute check. If the leak check fails, make sure all lines are connected securely to the vacuum gauge and the line is capped off above the roof, and repeat the check. If a second leak check fails, look for the leak and/or replace sample line if needed.
3.10.1.3 Particulate Filter Changes A 0.5 micron Teflon filter housed in a Teflon filter holder is located on the outside of the analyzer and is connected to the sample line. The filter should be checked every two weeks and changed when noticeably dirty. Slow response of the analyzer during the zero/precision/span check is an indication of a dirty filter or contaminants in the sample line. To replace the used filter, loosen the two halves of the filter holder and replace the dirty filter with a new filter. Following a filter change, perform a high span check (400 ppb) for at least half an hour. This is to "condition" the new filter and serves as a check to see if there any leaks in the reassembled filter holder. 3.10.1.4 Cleaning the Fan Filters Under normal use, the fan filters on the rear panel should be cleaned every six months. If the instrument is operated in excessively dirty surroundings, it may be necessary to clean the fan filters more frequently. 3.10.1.5 Cleaning the PMT Cooler Fins The Photomultiplier tube (PMT) cooler fins should be inspected and cleaned once every six months. This assures optimal performance of the cooler.
17
Section 3: Near-Road NO2 Revised: February 25, 2015
Revision Number: 4 Using clean pressurized air, blow off the cooler fins. Make sure that any particulate accumulation between the fins has been removed. If necessary, employ a small brush to remove residual particulate accumulation. 3.10.1.6 Replacing the Sample Lines It is the operator’s responsibility to maintain the sample lines. The sample lines must be replaced if the operator suspects a loss in NO-NO2-NOx concentrations due to contamination in the line, or every two years.
3.10.2 Trouble Isolation The instruments in Polk County Air Quality’s air monitoring network are very reliable. However, after a period of continuous use problems may occur. Leaks in the system, built up dirt and U.V. lamp failure are typical. After time, the operator should be able to quickly distinguish the symptoms and causes of equipment failure. It is suggested that each station operator consult the Model TL-42i, Chemiluminescence NO-NO2-NOx Analyzer Instruction Manual and compile personal notes on troubleshooting as they gain experience with the instrument. The operator is encouraged to contact Thermo Scientific technical support at 1-866-282-0430 when attempting any repairs. 3.10.3 Environmental Control for Monitoring Equipment Instrument vibration should be reduced as much as possible. Use shock-absorbing feet for the monitor. Any pumps must be fitted with rubber feet to reduce vibration. All pumps connected to the analyzer should be connected using tubing that will prevent the transfer of vibrations back to the instrument and/or the instrument rack. All instruments should be shielded from natural or artificial light. Ensure constant voltage to surge protection devices and equipment. Regulate the housing temperature between 20-30°C. Hourly temperature readings are collected by the polling computer during daily polling. Polk County will make every effort to operate the monitor in the 20-30°C range. Data will be investigated to determine the validity of the data for hourly concentrations where the shelter temperatures fall outside the range of (20-30°C). Data collected during temperatures outside of this range may be subject to invalidation, in accordance with the May 2013 Redbook’s guidelines for operational criteria.
3.11 Quality Assurance The audit schedule for SLAMS monitoring, is that each analyzer must be audited at least once per year. Polk County should audit 25 percent of their analyzers per quarter as specified in Section 3.2.2 of 40 CFR Part 58 Appendix A. However, it is Polk County Air Quality Division’s policy to audit the near-road NO2 analyzer once per quarter.
3.11.1 Direct Comparison Audit Once during each calendar quarter, the designated Quality Assurance Officer utilizing the procedures and calculations specified in 40 CFR 58, Appendix A, "Quality Assurance Requirements for State and Local Air Monitoring Stations (SLAMS)," the near-road NO2 analyzer will be audited using a direct comparison.
18
Section 3: Near-Road NO2 Revised: February 25, 2015
Revision Number: 4 An audit is an independent assessment of the accuracy of data generated by an ambient air analyzer. Independence is achieved by having the audit performed by an operator other than the one conducting the routine field measurements and by using audit standards, reference materials, and equipment different from those routinely used in monitoring. Proper implementation of an auditing program will ensure the integrity of the data and assess the accuracy of the data. An audit consists of challenging the TL-42i continuous analyzer with known concentrations of NO-NO2-NOX within the measurement range of the analyzer. The 146i Multi-Gas Calibrators can be programmed to generate the desired NO-NO2-NOX audit concentrations, see Polk County Air Quality SOP Section 26. Generate at least three of the following CFR consecutive audit concentrations: 310-600 ppb, 110-300 ppb, 6-100 ppb, 3-5 ppb, and 0.02-2 ppb. The audit levels selected should represent 80 percent of the ambient concentrations measured by the analyzer. Allow each audit concentration to stabilize for a minimum of 15 minutes and record all data logger readings from the NO, NO2, and NOX channels. Both the audit calibrator and site analyzer readings should be taken only after a stable response is exhibited by both instruments. The results are recorded on the Quarterly Audit Sheet, Form 4, Appendix A. The NO2 Converter Efficiency should also be determined during an audit. Use the Audit Converter Efficiency Spreadsheet to determine if it passes, Form 5, Appendix A. During each audit, the converter efficiency must be determined for each audit level. However, the critical criteria of 0.96 to 1.04 ultimately applies to the slope of the curve. It is the average converter efficiency from the curve which is used to determine if the converter needs serviced or replaced. The audit fails if any of the following acceptance criteria are not met:
• The percent difference is outside ±15% for EPA Memo levels 3-10, and CFR levels of an equivalent concentration range.
• For EPA memo levels 1 and 2, and CFR levels of an equivalent concentration range; the acceptance criteria is ± 1.5 ppb, or ±15%, whichever is less stringent.
If there is no reason to believe the results are incorrect or not representative of the analyzers performance, the cause for the audit failure must be investigated and corrected. An investigation initiated by audit results that are outside the above limits may require the invalidation of data. Record all information in the site log. NOTE: For more detailed information concerning audit performances for NO-NO2-NOX monitoring, refer to the “Quality Assurance Handbook for Air Pollution Measurement Systems, Volume II” or 40 CFR 58. 3.11.2 Performance Evaluation Audit Agency staff may be sent an audit device, such as for the National Performance Evaluation Program (NPEP). The agency staff does not know the NO-NO2-NOx concentrations produced by the audit equipment. Responses of the on-site analyzer are then compared against those of the generator and a linear regression is calculated. The Polk County Air Quality Department will participate in the USEPA performance audit program for NO-NO2-NOx and in all other EPA audit programs, which may arise in the future. According to the May 2013 Redbook, the audit fails if any of the following acceptance criteria are not met:
19
Section 3: Near-Road NO2 Revised: February 25, 2015
Revision Number: 4 • The percent difference is outside ±15% for EPA Memo levels 3-10, and CFR levels of an equivalent
concentration range. • For EPA memo levels 1 and 2, and CFR levels of an equivalent concentration range; the acceptance
criteria is ± 1.5 ppb, or ±15%, whichever is less stringent.
A review of the monitoring system shall be conducted if the results are above this, which may result with the invalidation of data. These blind audits will indicate any deficiency in the monitoring system in respect to precision and accuracy, calibrations and maintenance.
3.12 Data Quality Assessment For each calendar quarter and year, Polk County Air Quality will prepare precision, accuracy and data completeness reports for the Iowa Department of Natural Resources (IDNR) and EPA-Region 7 in accordance with the current Letter of Agreement (LOA).
3.12.1 Precision Precision is defined as the measure of agreement among individual measurements of the same property taken under the same conditions. Precision is assessed from checks that are performed at least once every two weeks (see Section 3.13). Calculations to assess precision are given below and should be used to assess precision on a quarterly basis. The goal for acceptable measurement uncertainty is defined for precision, as an upper 90 percent confidence limit for the coefficient of variation (CV) of 15%; and for bias as an upper 95 percent confidence limit for the absolute bias of 15%. Precision data will be evaluated and reported employing the frequencies, procedures and calculations in 40 CFR Part 58, Appendix A, "Quality Assurance Requirements for State and Local Air Monitoring Stations (SLAMS)".
3.12.2 Accuracy The Polk County Air Quality Program participates in the USEPA performance audit program for NO2 and in all other EPA audit programs, which may arise in the future. Using results from the performance audits and the calculations specified in 40 CFR 58, Appendix A, "Quality Assurance Requirements for State and Local Air Monitoring Stations". The accuracy will be evaluated and reported. 3.12.3 Data Completeness The completeness of the data will be determined for each monitoring instrument and expressed as a percentage. Percent valid data will be a gauge of the amount of valid data obtained from the monitoring instrument, compared to the amount expected under ideal conditions (24 hours per day, 365 days per year). Exceptions will be made for analyzers with a seasonal sampling period, which were not installed at the beginning, or which were discontinued prior to the end of any reporting period for calculation purposes.
3.13 Procedures for Bi-Weekly Verifications New station operators will be provided with on-site training by an experienced operator before they operate a station on their own. The following procedures are intended to assist the operator in performing and documenting monitoring procedures. Monitoring personnel must become familiar with the Operating and Maintenance Manuals for Thermo Scientific Model 42i-TL, Chemiluminescence NO-NO2-NOx Analyzer, Instruction Manual, and Model 146i, Dynamic Gas Calibration System, Instruction Manual.
20
Section 3: Near-Road NO2 Revised: February 25, 2015
Revision Number: 4
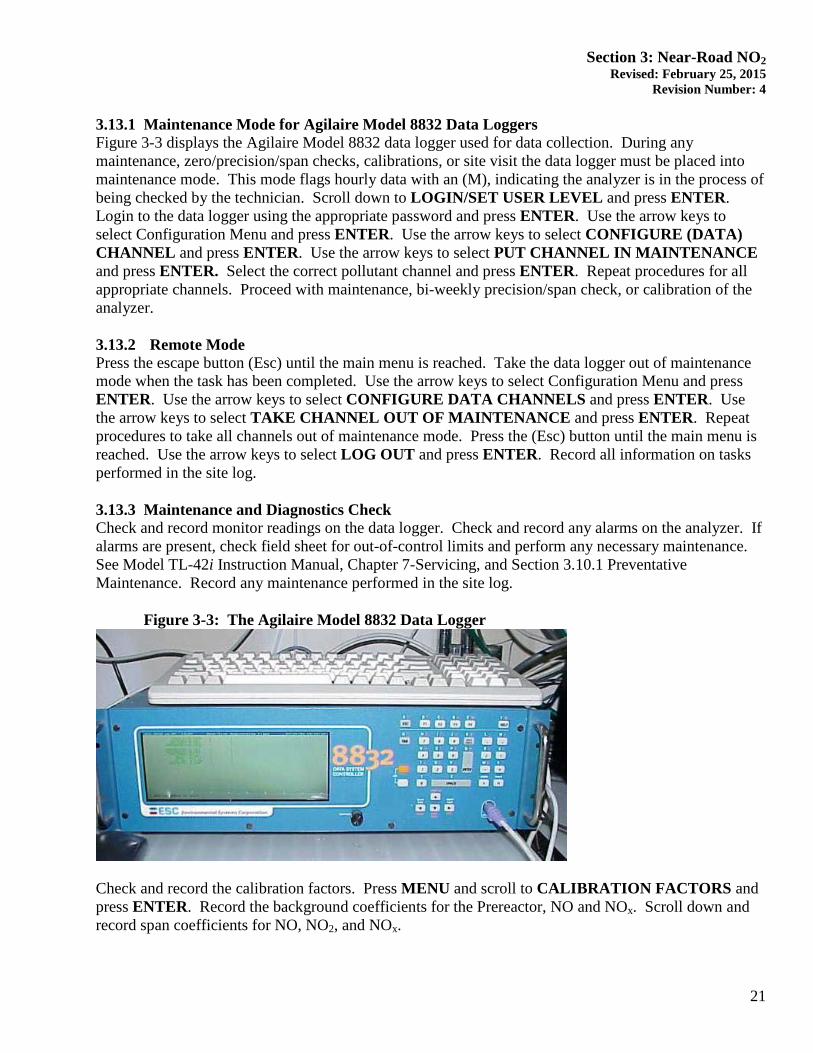
3.13.1 Maintenance Mode for Agilaire Model 8832 Data Loggers Figure 3-3 displays the Agilaire Model 8832 data logger used for data collection. During any maintenance, zero/precision/span checks, calibrations, or site visit the data logger must be placed into maintenance mode. This mode flags hourly data with an (M), indicating the analyzer is in the process of being checked by the technician. Scroll down to LOGIN/SET USER LEVEL and press ENTER. Login to the data logger using the appropriate password and press ENTER. Use the arrow keys to select Configuration Menu and press ENTER. Use the arrow keys to select CONFIGURE (DATA) CHANNEL and press ENTER. Use the arrow keys to select PUT CHANNEL IN MAINTENANCE and press ENTER. Select the correct pollutant channel and press ENTER. Repeat procedures for all appropriate channels. Proceed with maintenance, bi-weekly precision/span check, or calibration of the analyzer.
3.13.2 Remote Mode Press the escape button (Esc) until the main menu is reached. Take the data logger out of maintenance mode when the task has been completed. Use the arrow keys to select Configuration Menu and press ENTER. Use the arrow keys to select CONFIGURE DATA CHANNELS and press ENTER. Use the arrow keys to select TAKE CHANNEL OUT OF MAINTENANCE and press ENTER. Repeat procedures to take all channels out of maintenance mode. Press the (Esc) button until the main menu is reached. Use the arrow keys to select LOG OUT and press ENTER. Record all information on tasks performed in the site log.
3.13.3 Maintenance and Diagnostics Check Check and record monitor readings on the data logger. Check and record any alarms on the analyzer. If alarms are present, check field sheet for out-of-control limits and perform any necessary maintenance. See Model TL-42i Instruction Manual, Chapter 7-Servicing, and Section 3.10.1 Preventative Maintenance. Record any maintenance performed in the site log.
Figure 3-3: The Agilaire Model 8832 Data Logger
Check and record the calibration factors. Press MENU and scroll to CALIBRATION FACTORS and press ENTER. Record the background coefficients for the Prereactor, NO and NOx. Scroll down and record span coefficients for NO, NO2, and NOx.
21
Section 3: Near-Road NO2 Revised: February 25, 2015
Revision Number: 4 Check the Teflon particulate filter and change as needed. If particulate matter builds up on the filter, the particulate matter will destroy some of the NO2 in the sample. Write down any maintenance that was performed on the instrument or additional comments that may affect the air monitoring system. Examples include:
● replacement of UV lamps, pumps or tubing ● repairs or maintenance made to or around the shelter ● abnormal localized occurrences nearby ● suggestions for improvements to the system ● supplies that are needed ● checks or audits that were performed
Table 3-1 Diagnostic Checks
Check Explanation
Voltages The DC power supply voltages
Temperatures The internal instrument and chamber temperatures
Pressure The reaction chamber pressure
Flow The sample flow rate
3.13.4 Bi-Weekly Zero, Precision and Span Checks
3.13.4.1 Zero Air Check The zero air must be free of contaminants that could cause a detectable response on the TL-42i analyzer. Polk County Air Quality Division uses the Teledyne 701H air generator with charcoal, Purafil®, and hydrocarbon scrubbers for the source of zero air. For more information on zero air scrubbers, see Polk County Air Quality SOP Section 25 for instructions for the Zero Air Module Model 701/701H. The external zero air generator is connected to the zero air port on the back of the 146i Calibrator. The 146i Calibrator vent port is connected to the TL-42i site analyzer’s sample port. On the Main Screen (or Standby Screen) of the 146i Calibrator, press the MENU button to access the Main Menu Screen. Scroll to OPERATION and press ENTER. Use the ← and → buttons to select desired GAS and press ENTER. Use the ↓ button to scroll down to SPAN. Use the ← and → buttons to scroll to ZERO and press ENTER to put the 146i Calibrator in zero air mode. Allow the site analyzer to stabilize for a minimum of 15 minutes and record all data logger readings from the NO, NO2, and NOX channels on the Verification Field Sheet, Form 6, Appendix A.
22
Section 3: Near-Road NO2 Revised: February 25, 2015
Revision Number: 4 Polk County Air Quality uses the Agilaire Model 8832 data loggers for data recording. The values indicated on the data logger are the values that are being transmitted to, and recorded by the central computer. Therefore, it is important that the data logger readings are recorded on the field sheet.
Determine the analyzer zero drift by comparing the collected zero concentration to the actual Calibrator concentration. Refer to Section 3.9.3 for acceptable control limits.
Zero Drift = MC - 146C
Where:
=MC datalogger concentration, ppb =146C Calibrator concentration, ppb
3.13.4.2 Span Check (NO/NOx) At this point the zero air readings have been recorded, perform the span check. On the Main Screen (or Standby Screen) of the 146i Calibrator, press the MENU button to access the Main Menu Screen. Scroll to OPERATION and press ENTER. Use the ↓ button to scroll down to SPAN. Use the ← and → buttons to scroll to SPAN 1 and press ENTER. SPAN 1 has been programmed to produce the span level of 90% the upper range limit of the instrument (or 450 ppb NO/NOx). Perform the span check using a cylinder containing 25+2 ppm NO in N2 with less than 1 ppm NO2. Begin turning the flow regulator on from the cylinder. Next, turn on the flow adjustment valve to produce sufficient flow. The flow can be read on the 146i Calibrator display screen by accessing the DIAGNOSTICS FLOW screen. This screen reports the actual gas and zero-air flows and the corresponding target flows. Allow the TL-42i site analyzer to stabilize for a minimum of 15 minutes and record the resultant data logger readings from the NO, NO2, and NOX channels on the Zero/Precision/Span Field Sheet. Determine the analyzer span drift by comparing the collected span concentration to the actual Calibrator concentration. Refer to Section 3.9.3 for acceptable control limits.
Span Drift 100146
146 ×−
=C
CCM
Where: =MC datalogger concentration, ppb =146C Calibrator concentration, ppb
3.13.4.3 Precision Check (NO/NOx ) At this point the span readings have been recorded, perform the precision level check. Use the ← and → buttons to scroll to SPAN 5 and press ENTER. SPAN 5 has been programmed to produce the precision level approximately 50 ppb NO/NOx. Allow the TL-42i site analyzer to stabilize for a minimum of 15 minutes and record the resultant data logger readings from the NO, NO2, and NOX channels on the Zero/Precision/Span Field Sheet.
23
Section 3: Near-Road NO2 Revised: February 25, 2015
Revision Number: 4 Using the following equation to determine the percent difference between the datalogger and the calibrator:
100%146
146 ×−
=C
CCDifference M
Where: =MC datalogger concentration, ppb =146C Calibrator concentration, ppb
Acceptance criteria can be found in Table 3-2: The Measurement Quality Acceptance Tables from the Quality Assurance Handbook for Air Pollution Measurement Systems, Volume II, Appendix D. EPA-454/B-13-003, May 2013. If a calibration is necessary, it must be performed after the precision and span checks are finished.
3.13.4.4 Zero/Precision/Span Checks (NO2) At this point the precision and span readings for NO/NOx have been recorded, perform the Zero/Precision/Span Checks for NO2. On the Main Screen (or Standby Screen) of the 146i Calibrator, press the MENU button to access the Main Menu Screen. Scroll to OPERATION and press ENTER. Use the ↓ button to scroll to the third line. Use the ← and → buttons to scroll to OZON MAN. NOTE: Check and make sure that the second line is set to SPAN 1 which is programmed to obtain and NOX concentration of 450 ppb. All NO2 checks must be performed using the same settings as the span check for NO/NOx. Push the MENU button on the 146i Calibrator. Scroll to OZONATOR and press ENTER. Scroll to MANUAL and press ENTER. The ozone reading on the 146i Calibrator will be displayed as a percentage. Use the arrow keys to set the ozone level to 0%. Allow the TL-42i site analyzer to stabilize for a minimum of 15 minutes and record the resultant data logger readings from the NO, NO2, and NOX channels on the Zero/Precision/Span Field Sheet. NO2 should stabilize around 0 ppb. NO/NOX channels should stabilize around 450 ppb. At this point, the zero NO2 reading has been performed. Press the MENU button on the 146i Calibrator. Scroll to OZONATOR and press ENTER. Scroll to MANUAL and press ENTER. Use the arrow keys to adjust the ozonator percentage to obtain a NO2 reading of approximately 400 ppb. Allow the TL-42i site analyzer to stabilize for a minimum of 15 minutes, then record the resultant data logger readings from the NO, NO2, and NOX channels on the Zero/Precision/Span Field Sheet. Use the arrow keys to adjust the ozonator percentage to obtain a NO2 reading of approximately 50 ppb. Allow the TL-42i site analyzer to stabilize, then record the resultant data logger readings from the NO, NO2, and NOX channels on the Zero/Precision/Span Field Sheet. Using the NO Verification relationship determined in Section 3.13.4.1-3.13.4.3, correct NOORIG and NOREM for slope and intercept prior to calculating NO2(ACTUAL). The NO2ACTUAL readings are then determined by using the formula:
24
Section 3: Near-Road NO2 Revised: February 25, 2015
Revision Number: 4
NO2Actual = (NOORIG – NOREM) + FNO * NO2imp FT
Where: NOorig = Original NO data logger reading NOrem = NO data logger reading, after addition of O3 FNO = NO flow rate (sccm) as determined by the pollutant MFC NO2imp = Conc. of NO2 impurity in standard NO cylinder FT = Total actual flow put out by the calibrator, sccm
After determining the actual NO2 readings for the precision check, calculate the percent difference using the formula:
% Difference = NO2 (Indicated) – NO2 (Actual) x 100 NO2 (Actual)
Where: NO2 (Indicated) = data logger concentration, ppb
Turn off the gas from the cylinder containing 25+2 NO in N2 with less than 1 ppm NO2 Log all site visits into the logbook (every detail of the visit must be logged). Refer to Section 3.13.2 to log out from the data logger. 3.13.4.5 Converter Efficiency Check During each bi-weekly verification, the converter efficiency must be determined for the NO2 precision and Span values. However, the critical criteria of 0.96 to 1.04 ultimately applies to the slope of the verification curve. It is the average converter efficiency from the verification curve which is used to determine if the converter needs serviced or replaced. Use the Bi-Weekly Converter Efficiency Spreadsheet to determine if the verification passes, Form 7, Appendix A. NOTE: If a problem is recognized while performing maintenance, diagnostic, zero air, weekly precision or span checks which has or could affect data, a corrective action form is to be filled out describing the problem identified and the action taken to correct the problem, Form 8, Appendix A. All forms and documentation must be submitted to the Quality Assurance Officer.
3.13.5 Investigate and Recalibrate Analyzer The following critical criteria require recalibration of the field analyzer and invalidation of the data unless there is compelling reason and justification not to do so: if the precision check results in a percent difference + 15%, or if the zero drift is >5.0 ppb, or if the span drift is + 10%. See Section 3.8 for calibration procedures. NOTE: In order to minimize data loss, Polk County personal will recalibrate the instrument when the results of bi-weekly checks reach exceed recalibration thresholds, unless there is compelling reason and justification not to do so. Recalibration criteria refer to thresholds that typically require recalibrating the analyzer, but do not require the invalidation of data. Recalibration
25

Section 3: Near-Road NO2 Revised: February 25, 2015
Revision Number: 4 criteria should be set to levels that are as tight as practically possible, and based on historical performance data. They may change after reviewing typical differences from control charts.
26
Section 3: Near-Road NO2 Revised: February 25, 2015
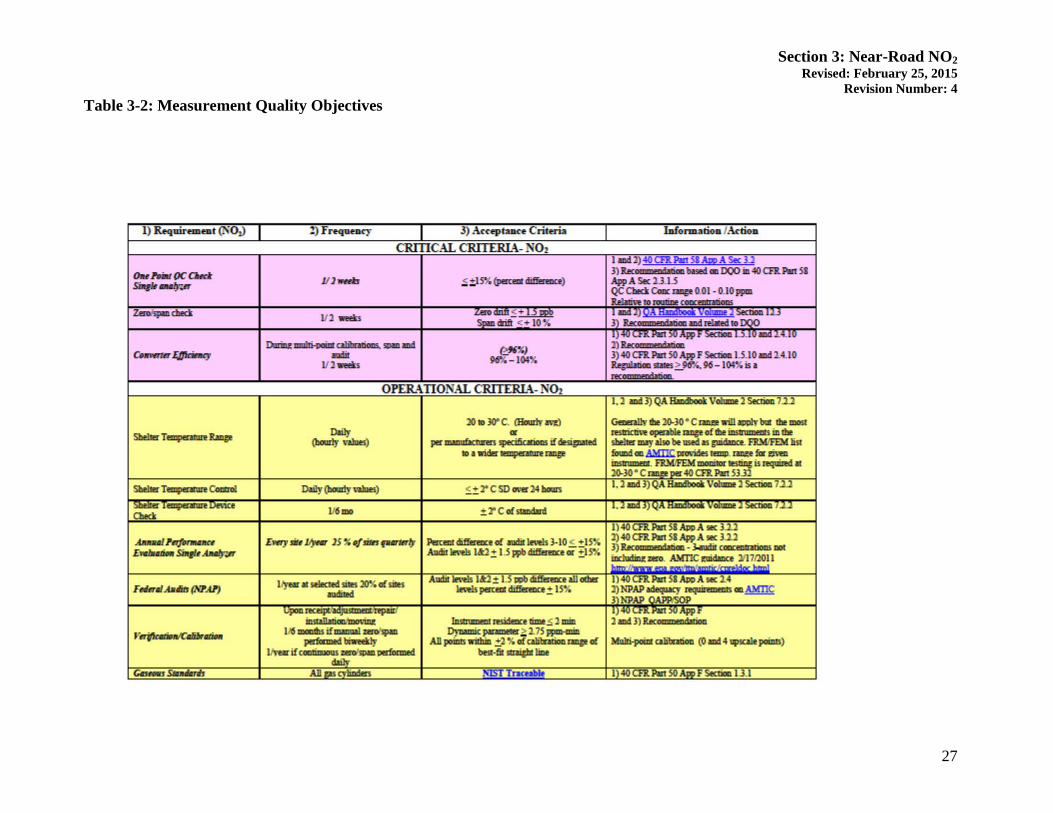
Revision Number: 4 Table 3-2: Measurement Quality Objectives
27
Section 3: Near-Road NO2 Revised: February 25, 2015
Revision Number: 4
28
Section 3: Near-Road NO2 Revised: February 25, 2015
Revision Number: 4
29
Section 3: Near-Road NO2 Revised: February 25, 2015
Revision Number: 4
APPENDIX A – Forms and Field Sheets
Form 1……………………………………………….Calibration Field Sheet Form 2……………………………………………….Calibration Linear Regression Form 3……………………………………………….Calibration Converter Efficiency Form 4……………………………………………….Audit Field Sheet Form 5……………………………………………….Audit Converter Efficiency Form 6……………………………………………….Verification Field Sheet Form 7……………………………………………….Verification Converter Efficiency Form 8……………………………………………….Corrective Action Form
30
Section 3: Near-Road NO2 Revised: February 25, 2015
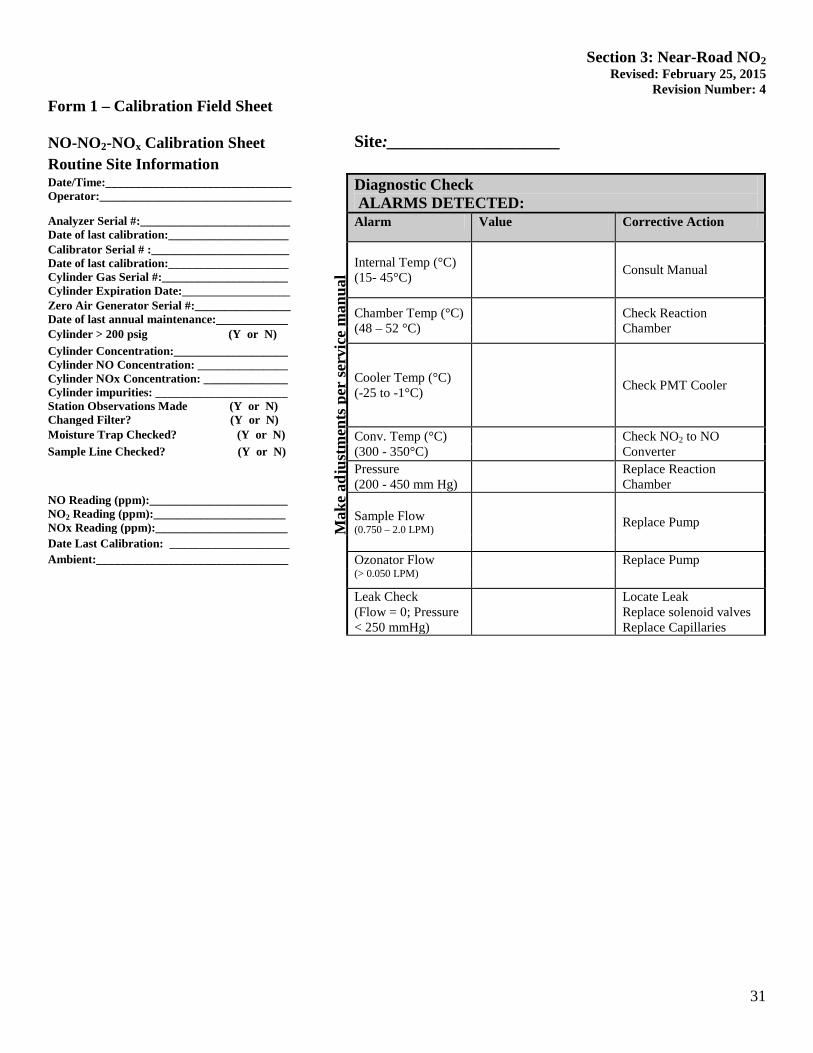
Revision Number: 4 Form 1 – Calibration Field Sheet NO-NO2-NOx Calibration Sheet
Site:____________________
Routine Site Information Date/Time:_______________________________ Operator:________________________________
M
ake
adju
stm
ents
per
serv
ice
man
ual
Diagnostic Check ALARMS DETECTED:
Analyzer Serial #:_________________________ Date of last calibration:____________________
Alarm Value Corrective Action
Calibrator Serial # :_______________________ Date of last calibration:____________________ Cylinder Gas Serial #:_____________________ Cylinder Expiration Date:__________________
Internal Temp (°C) (15- 45°C) Consult Manual
Zero Air Generator Serial #:________________ Date of last annual maintenance:____________ Chamber Temp (°C)
(48 – 52 °C) Check Reaction Chamber Cylinder > 200 psig (Y or N)
Cylinder Concentration:___________________ Cylinder NO Concentration: _______________ Cylinder NOx Concentration: ______________ Cylinder impurities: ______________________ Station Observations Made (Y or N) Changed Filter? (Y or N)
Cooler Temp (°C) (-25 to -1°C) Check PMT Cooler
Moisture Trap Checked? (Y or N) Conv. Temp (°C) (300 - 350°C) Check NO2 to NO
Converter Sample Line Checked? (Y or N) Pressure
(200 - 450 mm Hg) Replace Reaction
Chamber NO Reading (ppm):_______________________ NO2 Reading (ppm):______________________ NOx Reading (ppm):______________________
Sample Flow (0.750 – 2.0 LPM) Replace Pump
Date Last Calibration: ____________________ Ambient:________________________________ Ozonator Flow
(> 0.050 LPM) Replace Pump
Leak Check
(Flow = 0; Pressure < 250 mmHg)
Locate Leak Replace solenoid valves Replace Capillaries
31
Section 3: Near-Road NO2 Revised: February 25, 2015
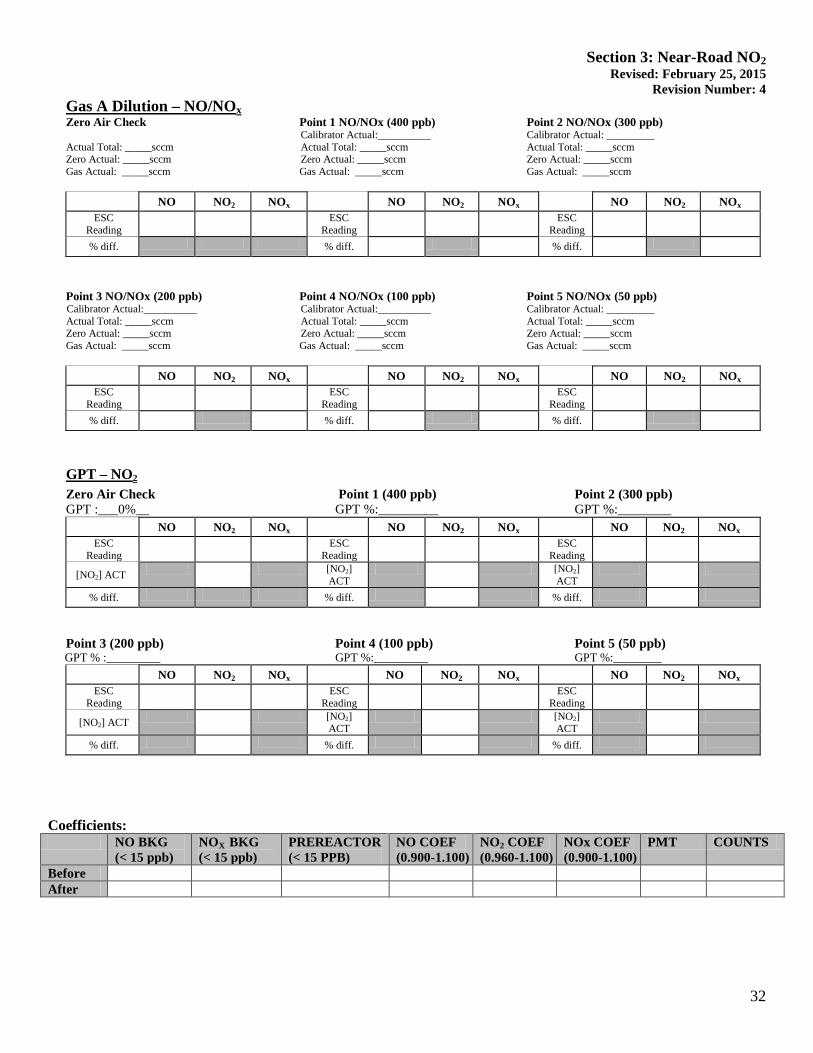
Revision Number: 4 Gas A Dilution – NO/NOx Zero Air Check Point 1 NO/NOx (400 ppb) Point 2 NO/NOx (300 ppb)
Calibrator Actual:__________ Calibrator Actual: _________ Actual Total: _____sccm Actual Total: _____sccm Actual Total: _____sccm
Zero Actual: _____sccm Zero Actual: _____sccm Zero Actual: _____sccm Gas Actual: _____sccm Gas Actual: _____sccm Gas Actual: _____sccm
NO NO2 NOx NO NO2 NOx NO NO2 NOx
ESC Reading
ESC Reading
ESC Reading
% diff. % diff. % diff.
Point 3 NO/NOx (200 ppb) Point 4 NO/NOx (100 ppb) Point 5 NO/NOx (50 ppb)
Calibrator Actual:__________ Calibrator Actual:__________ Calibrator Actual: _________ Actual Total: _____sccm Actual Total: _____sccm Actual Total: _____sccm
Zero Actual: _____sccm Zero Actual: _____sccm Zero Actual: _____sccm Gas Actual: _____sccm Gas Actual: _____sccm Gas Actual: _____sccm
NO NO2 NOx NO NO2 NOx NO NO2 NOx
ESC Reading
ESC Reading
ESC Reading
% diff. % diff. % diff.
GPT – NO2
Zero Air Check Point 1 (400 ppb) Point 2 (300 ppb) GPT :___0%__ GPT %:_________ GPT %:________
NO NO2 NOx NO NO2 NOx NO NO2 NOx ESC
Reading ESC
Reading ESC
Reading
[NO2] ACT [NO2] ACT
[NO2] ACT
% diff. % diff. % diff.
Point 3 (200 ppb) Point 4 (100 ppb) Point 5 (50 ppb) GPT % :_________ GPT %:_________ GPT %:________
NO NO2 NOx NO NO2 NOx NO NO2 NOx ESC
Reading ESC
Reading ESC
Reading
[NO2] ACT [NO2] ACT
[NO2] ACT
% diff. % diff. % diff.
Coefficients: NO BKG
(< 15 ppb) NOX BKG (< 15 ppb)
PREREACTOR (< 15 PPB)
NO COEF (0.900-1.100)
NO2 COEF (0.960-1.100)
NOx COEF (0.900-1.100)
PMT COUNTS
Before After
32
Section 3: Near-Road NO2 Revised: February 25, 2015
Revision Number: 4
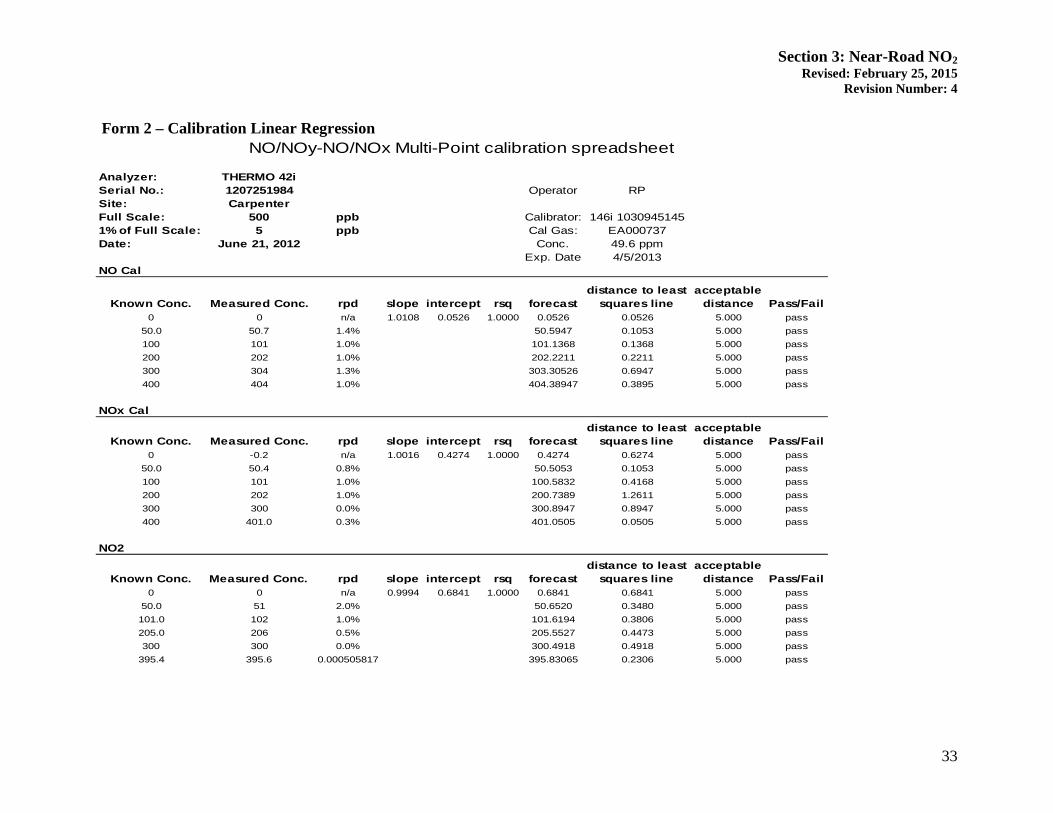
Form 2 – Calibration Linear Regression NO/NOy-NO/NOx Multi-Point calibration spreadsheet
Analyzer: THERMO 42iSerial No.: 1207251984 Operator RPSite: CarpenterFull Scale: 500 ppb Calibrator: 146i 10309451451% of Full Scale: 5 ppb Cal Gas: EA000737Date: June 21, 2012 Conc. 49.6 ppm
Exp. Date 4/5/2013NO Cal
Known Conc. Measured Conc. rpd slope intercept rsq forecastdistance to least
squares lineacceptable
distance Pass/Fail0 0 n/a 1.0108 0.0526 1.0000 0.0526 0.0526 5.000 pass
50.0 50.7 1.4% 50.5947 0.1053 5.000 pass100 101 1.0% 101.1368 0.1368 5.000 pass200 202 1.0% 202.2211 0.2211 5.000 pass300 304 1.3% 303.30526 0.6947 5.000 pass400 404 1.0% 404.38947 0.3895 5.000 pass
NOx Cal
Known Conc. Measured Conc. rpd slope intercept rsq forecastdistance to least
squares lineacceptable
distance Pass/Fail0 -0.2 n/a 1.0016 0.4274 1.0000 0.4274 0.6274 5.000 pass
50.0 50.4 0.8% 50.5053 0.1053 5.000 pass100 101 1.0% 100.5832 0.4168 5.000 pass200 202 1.0% 200.7389 1.2611 5.000 pass300 300 0.0% 300.8947 0.8947 5.000 pass400 401.0 0.3% 401.0505 0.0505 5.000 pass
NO2
Known Conc. Measured Conc. rpd slope intercept rsq forecastdistance to least
squares lineacceptable
distance Pass/Fail0 0 n/a 0.9994 0.6841 1.0000 0.6841 0.6841 5.000 pass
50.0 51 2.0% 50.6520 0.3480 5.000 pass101.0 102 1.0% 101.6194 0.3806 5.000 pass205.0 206 0.5% 205.5527 0.4473 5.000 pass300 300 0.0% 300.4918 0.4918 5.000 pass
395.4 395.6 0.000505817 395.83065 0.2306 5.000 pass
33
Section 3: Near-Road NO2 Revised: February 25, 2015
Revision Number: 4
Form 3 – Calibration Converter Efficiency
Station: Rollins Date: 5/15/2013 Operator: JVBAnalyzer: 1125849711 Calibrator: 710902928 Cylinder: CC08869
Cylinder Conc. 24.98 PPMImpurity 0.00 PPM
AIR GASCalibration Zero Air MFC Pollutant MFC NO NOx NO NOx NO2
SCCM SCCM PPB PPB PPB PPB PPBZero 7993 0.00 0.0 0.0 0.0 0.0 0.0
Point 5 (50 PPB) 11976 24.02 50.0 50.0 47.5 47.8 0.2Point 4 (100 PPB) 11952 48.04 100.0 100.0 96.4 96.7 0.3Point 3 (200 PPB) 8928 72.06 200.0 200.0 195.7 196.4 0.7Point 2 (300 PPB) 4920 59.76 299.8 299.8 296.3 298.2 1.8Point 1 (400 PPB) 4920 80.06 400.0 400.0 398.3 400.3 2.0Ozone Lamp 0% 4874 89.98
Calibrationpoints NO2 NO NOx NO2 [NO]ORIG [NO]REM [NO2]ACT
PPB PPB PPB PPB PPB PPBOzone Lamp 0% 445.0 448.4 3.4 448.4 448.4 0.0Point 5 (50 PPB) 389.0 446.0 57 448.4 392.2 56.2
Point 4 (100 PPB) 332.3 446.1 113.9 448.4 335.3 113.0Point 3 (200 PPB) 240.7 443.3 202.6 448.4 243.5 204.9Point 2 (300 PPB) 169.9 444.2 274.3 448.4 172.5 275.9Point 1 (400 PPB) 48.2 442.1 393.9 448.4 50.4 397.9
SLOPE INT.NO 0.9972 -2.0983NOx 1.0026 -2.1821
Pollutant [NO2]Actual [NOX]ORIG [NOX]REM [NO2]CONV Converter Effiency Is Converter Efficiency 1 ±0.04 ?Level PPB PPB PPB PPB
Point 5 (50 PPB) 56.2 448.4 446.0 53.8 95.7% TRUEPoint 4 (100 PPB) 113.0 448.4 446.1 110.7 98.0% TRUEPoint 3 (200 PPB) 204.9 448.4 443.3 199.8 97.5% TRUEPoint 2 (300 PPB) 275.9 448.4 444.2 271.7 98.5% TRUEPoint 1 (400 PPB) 397.9 448.4 442.1 391.6 98.4% TRUE
Converter Efficiency (from slope) Is Converter Efficiency 1 ±0.04 ?
98.8% TRUE
NO2 Calibration Spreadsheet
NO, NOx CALIBRATION
NO2 UPSCALE CALIBRATION (GPT)
Green highlight signifies NO2 Actual for precision data
Yellow highlight signifies values entered by user.
NO2 CONVERTER EFFICIENCY TEST
Co rre cte d Ins trume nt Re sp o nse a nd Ca lcula te d Co nce ntra tio ns
Ins trume nt Re sp o nse
Instrume nt Re sp o nse
Kno wn Va lue
34
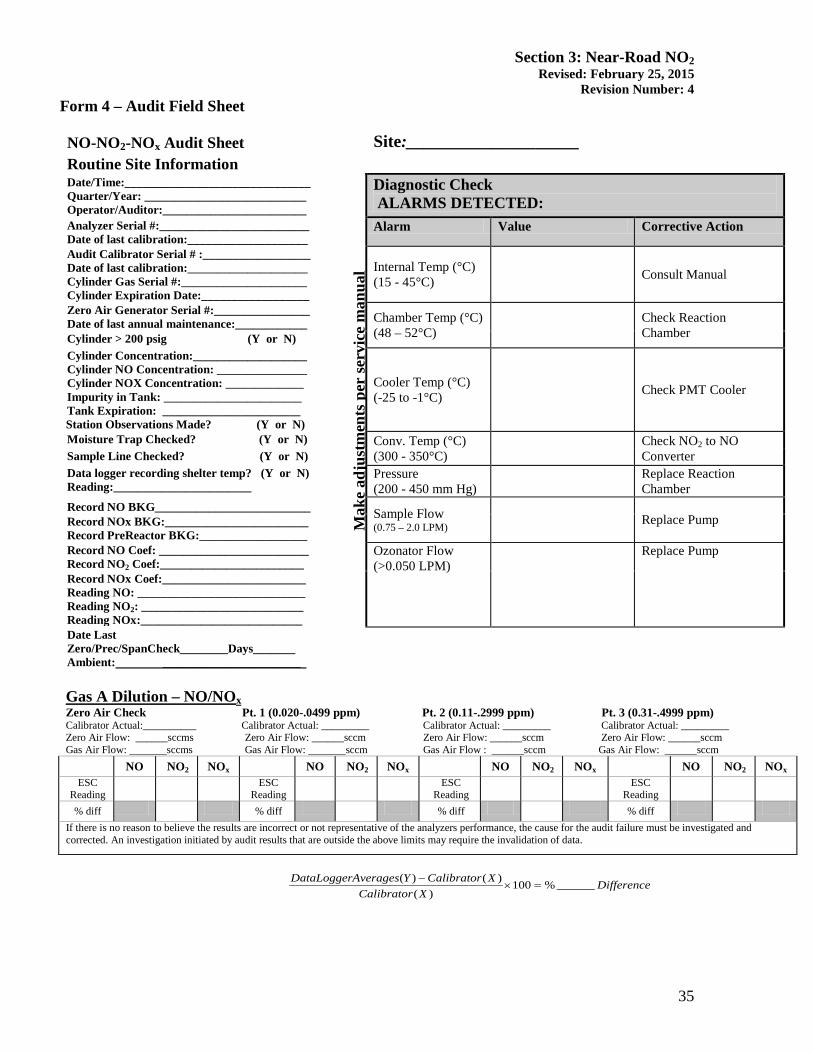
Section 3: Near-Road NO2 Revised: February 25, 2015
Revision Number: 4 Form 4 – Audit Field Sheet NO-NO2-NOx Audit Sheet
Site:____________________
Routine Site Information Date/Time:_______________________________ Quarter/Year: ___________________________ Operator/Auditor:________________________
M
ake
adju
stm
ents
per
serv
ice
man
ual
Diagnostic Check ALARMS DETECTED:
Analyzer Serial #:_________________________ Date of last calibration:____________________
Alarm Value Corrective Action
Audit Calibrator Serial # :__________________ Date of last calibration:____________________ Cylinder Gas Serial #:_____________________ Cylinder Expiration Date:__________________
Internal Temp (°C) (15 - 45°C) Consult Manual
Zero Air Generator Serial #:________________ Date of last annual maintenance:____________ Chamber Temp (°C)
(48 – 52°C) Check Reaction Chamber Cylinder > 200 psig (Y or N)
Cylinder Concentration:___________________ Cylinder NO Concentration: _______________ Cylinder NOX Concentration: _____________ Impurity in Tank: _______________________ Tank Expiration: _______________________
Station Observations Made? (Y or N)
Cooler Temp (°C) (-25 to -1°C) Check PMT Cooler
Moisture Trap Checked? (Y or N) Conv. Temp (°C) (300 - 350°C) Check NO2 to NO
Converter Sample Line Checked? (Y or N) Data logger recording shelter temp? (Y or N) Reading:_______________________
Pressure (200 - 450 mm Hg)
Replace Reaction Chamber
Record NO BKG__________________________ Sample Flow (0.75 – 2.0 LPM) Replace Pump Record NOx BKG:________________________
Record PreReactor BKG:__________________ Record NO Coef: _________________________ Record NO2 Coef:________________________
Ozonator Flow (>0.050 LPM)
Replace Pump
Record NOx Coef:________________________ Reading NO: ____________________________ Reading NO2: ___________________________ Reading NOx:___________________________ Date Last Zero/Prec/SpanCheck________Days_______ Ambient: _______________________ Gas A Dilution – NO/NOx Zero Air Check Pt. 1 (0.020-.0499 ppm) Pt. 2 (0.11-.2999 ppm) Pt. 3 (0.31-.4999 ppm) Calibrator Actual:__________ Calibrator Actual: _________ Calibrator Actual: _________ Calibrator Actual: _________ Zero Air Flow: ______sccms Zero Air Flow: ______sccm Zero Air Flow: ______sccm Zero Air Flow: ______sccm Gas Air Flow: _______sccms Gas Air Flow: _______sccm Gas Air Flow : ______sccm Gas Air Flow: ______sccm
NO NO2 NOx NO NO2 NOx NO NO2 NOx NO NO2 NOx ESC
Reading ESC
Reading ESC
Reading ESC
Reading
% diff % diff % diff % diff If there is no reason to believe the results are incorrect or not representative of the analyzers performance, the cause for the audit failure must be investigated and corrected. An investigation initiated by audit results that are outside the above limits may require the invalidation of data.
DifferenceXCalibrator
XCalibratorYAveragesDataLogger ______%100)(
)()(=×
−
35
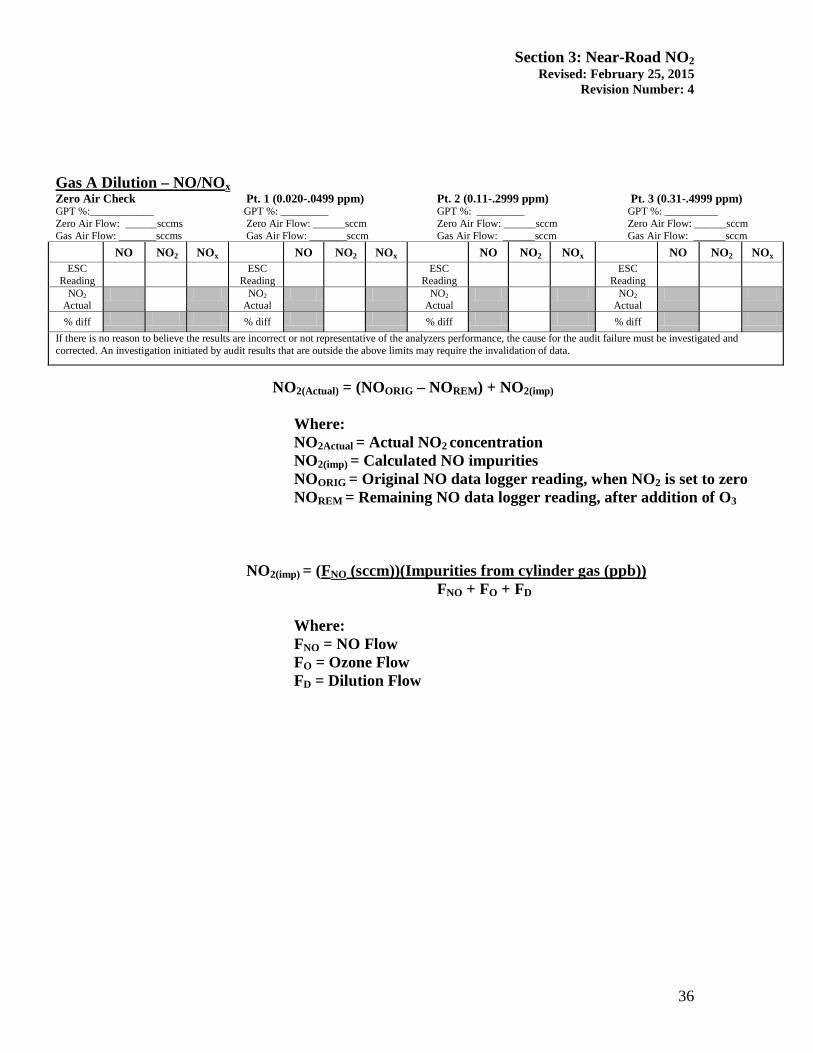
Section 3: Near-Road NO2 Revised: February 25, 2015
Revision Number: 4
Gas A Dilution – NO/NOx Zero Air Check Pt. 1 (0.020-.0499 ppm) Pt. 2 (0.11-.2999 ppm) Pt. 3 (0.31-.4999 ppm) GPT %:____________ GPT %: _________ GPT %: _________ GPT %: __________ Zero Air Flow: ______sccms Zero Air Flow: ______sccm Zero Air Flow: ______sccm Zero Air Flow: ______sccm Gas Air Flow: _______sccms Gas Air Flow: _______sccm Gas Air Flow: ______sccm Gas Air Flow: ______sccm
NO NO2 NOx NO NO2 NOx NO NO2 NOx NO NO2 NOx ESC
Reading ESC
Reading ESC
Reading ESC
Reading
NO2 Actual
NO2 Actual
NO2 Actual
NO2 Actual
% diff % diff % diff % diff If there is no reason to believe the results are incorrect or not representative of the analyzers performance, the cause for the audit failure must be investigated and corrected. An investigation initiated by audit results that are outside the above limits may require the invalidation of data.
NO2(Actual) = (NOORIG – NOREM) + NO2(imp)
Where:
NO2Actual = Actual NO2 concentration NO2(imp) = Calculated NO impurities
NOORIG = Original NO data logger reading, when NO2 is set to zero NOREM = Remaining NO data logger reading, after addition of O3
NO2(imp) = (FNO (sccm))(Impurities from cylinder gas (ppb))
FNO + FO + FD Where: FNO = NO Flow FO = Ozone Flow FD = Dilution Flow
36
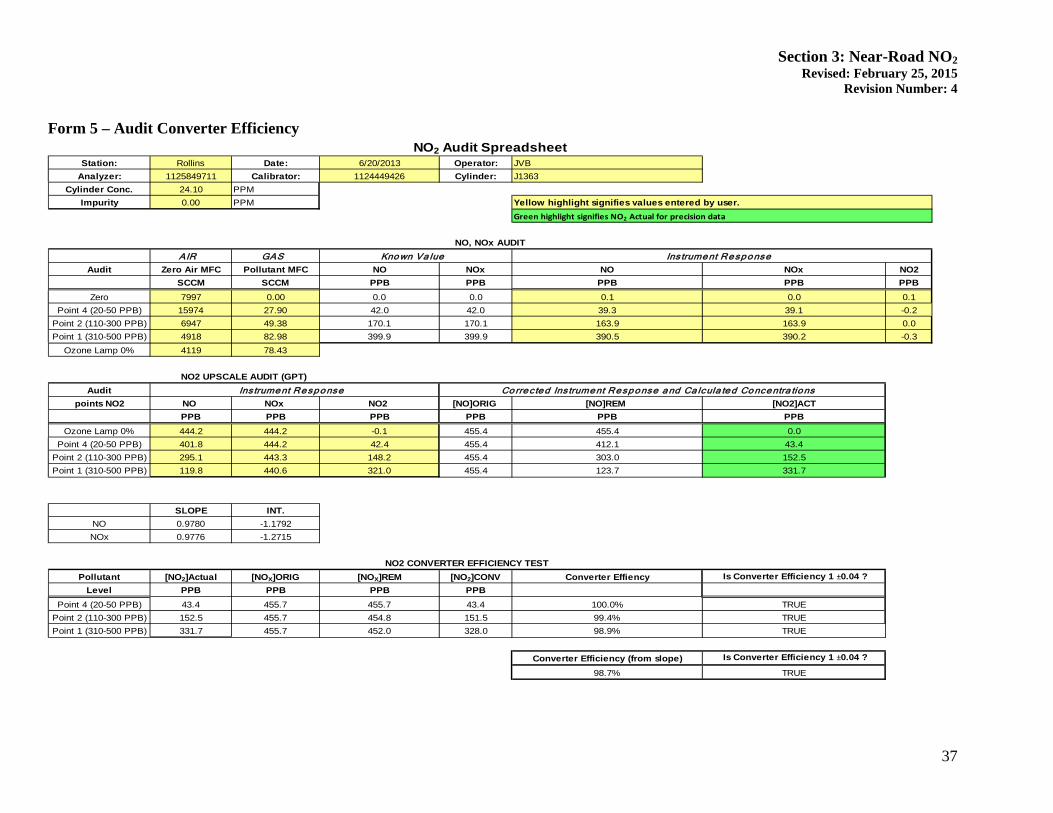
Section 3: Near-Road NO2 Revised: February 25, 2015
Revision Number: 4
Form 5 – Audit Converter Efficiency
Station: Rollins Date: 6/20/2013 Operator: JVBAnalyzer: 1125849711 Calibrator: 1124449426 Cylinder: J1363
Cylinder Conc. 24.10 PPMImpurity 0.00 PPM
AIR GASAudit Zero Air MFC Pollutant MFC NO NOx NO NOx NO2
SCCM SCCM PPB PPB PPB PPB PPBZero 7997 0.00 0.0 0.0 0.1 0.0 0.1
Point 4 (20-50 PPB) 15974 27.90 42.0 42.0 39.3 39.1 -0.2Point 2 (110-300 PPB) 6947 49.38 170.1 170.1 163.9 163.9 0.0Point 1 (310-500 PPB) 4918 82.98 399.9 399.9 390.5 390.2 -0.3
Ozone Lamp 0% 4119 78.43
Auditpoints NO2 NO NOx NO2 [NO]ORIG [NO]REM [NO2]ACT
PPB PPB PPB PPB PPB PPBOzone Lamp 0% 444.2 444.2 -0.1 455.4 455.4 0.0
Point 4 (20-50 PPB) 401.8 444.2 42.4 455.4 412.1 43.4Point 2 (110-300 PPB) 295.1 443.3 148.2 455.4 303.0 152.5Point 1 (310-500 PPB) 119.8 440.6 321.0 455.4 123.7 331.7
SLOPE INT.NO 0.9780 -1.1792NOx 0.9776 -1.2715
Pollutant [NO2]Actual [NOX]ORIG [NOX]REM [NO2]CONV Converter Effiency Is Converter Efficiency 1 ±0.04 ?Level PPB PPB PPB PPB
Point 4 (20-50 PPB) 43.4 455.7 455.7 43.4 100.0% TRUEPoint 2 (110-300 PPB) 152.5 455.7 454.8 151.5 99.4% TRUEPoint 1 (310-500 PPB) 331.7 455.7 452.0 328.0 98.9% TRUE
Converter Efficiency (from slope) Is Converter Efficiency 1 ±0.04 ?
98.7% TRUE
NO2 Audit Spreadsheet
NO, NOx AUDIT
Green highlight signifies NO2 Actual for precision data
Yellow highlight signifies values entered by user.
NO2 CONVERTER EFFICIENCY TEST
Co rre cte d Ins trume nt Re sp o nse a nd Ca lcula te d Co nce ntra tio ns
Ins trume nt Re sp o nse
NO2 UPSCALE AUDIT (GPT)Ins trume nt Re sp o nse
Kno wn Va lue
37
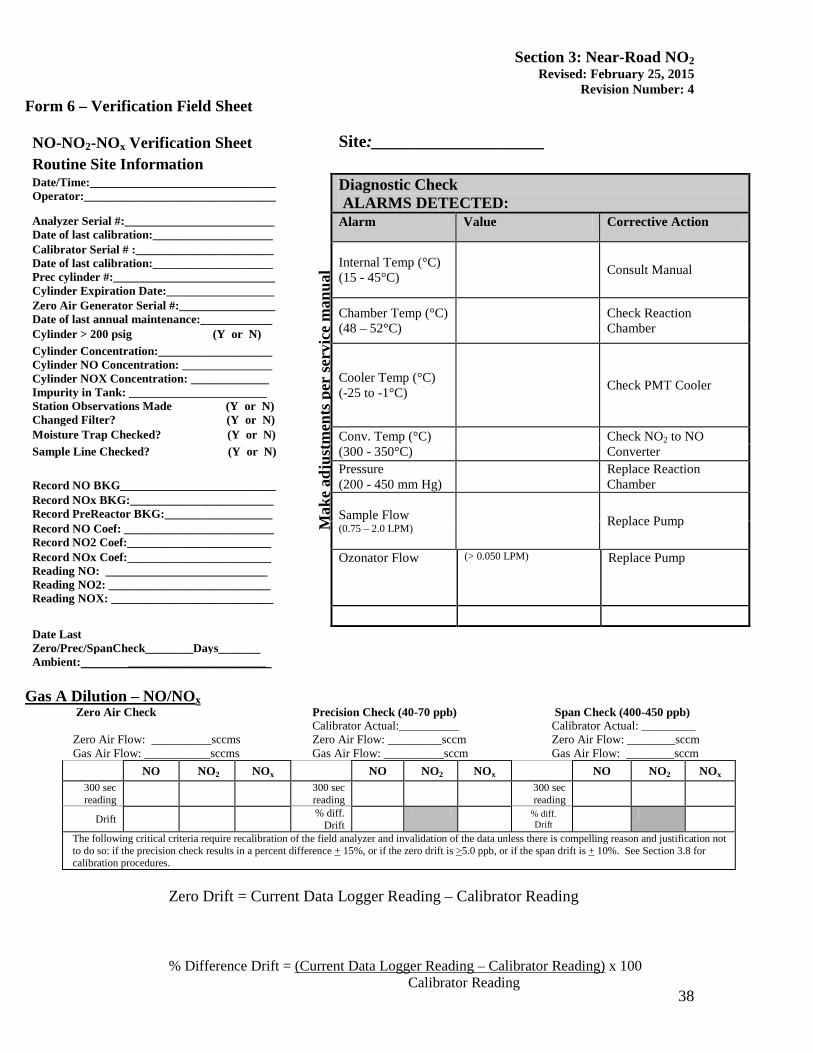
Section 3: Near-Road NO2 Revised: February 25, 2015
Revision Number: 4 Form 6 – Verification Field Sheet NO-NO2-NOx Verification Sheet
Site:____________________
Routine Site Information Date/Time:_______________________________ Operator:________________________________
M
ake
adju
stm
ents
per
serv
ice
man
ual
Diagnostic Check ALARMS DETECTED:
Analyzer Serial #:_________________________ Date of last calibration:____________________
Alarm Value Corrective Action
Calibrator Serial # :_______________________ Date of last calibration:____________________ Prec cylinder #:___________________________ Cylinder Expiration Date:__________________
Internal Temp (°C) (15 - 45°C) Consult Manual
Zero Air Generator Serial #:________________ Date of last annual maintenance:____________ Chamber Temp (°C)
(48 – 52°C) Check Reaction Chamber Cylinder > 200 psig (Y or N)
Cylinder Concentration:___________________ Cylinder NO Concentration: _______________ Cylinder NOX Concentration: _____________ Impurity in Tank: _______________________ Station Observations Made (Y or N) Changed Filter? (Y or N)
Cooler Temp (°C) (-25 to -1°C) Check PMT Cooler
Moisture Trap Checked? (Y or N) Conv. Temp (°C) (300 - 350°C) Check NO2 to NO
Converter Sample Line Checked? (Y or N)
Record NO BKG__________________________ Pressure (200 - 450 mm Hg)
Replace Reaction Chamber
Record NOx BKG:________________________ Record PreReactor BKG:__________________ Sample Flow
(0.75 – 2.0 LPM) Replace Pump Record NO Coef: _________________________ Record NO2 Coef:________________________ Record NOx Coef:________________________ Reading NO: ___________________________ Reading NO2: ___________________________ Reading NOX: ___________________________
Ozonator Flow (> 0.050 LPM) Replace Pump
Date Last Zero/Prec/SpanCheck________Days_______ Ambient: _______________________
Gas A Dilution – NO/NOx Zero Air Check Precision Check (40-70 ppb) Span Check (400-450 ppb)
Calibrator Actual:__________ Calibrator Actual: _________ Zero Air Flow: __________sccms Zero Air Flow: _________sccm Zero Air Flow: ________sccm Gas Air Flow: ___________sccms Gas Air Flow: __________sccm Gas Air Flow: ________sccm NO NO2 NOx NO NO2 NOx NO NO2 NOx
300 sec reading
300 sec reading
300 sec reading
Drift % diff. Drift
% diff. Drift
The following critical criteria require recalibration of the field analyzer and invalidation of the data unless there is compelling reason and justification not to do so: if the precision check results in a percent difference + 15%, or if the zero drift is >5.0 ppb, or if the span drift is + 10%. See Section 3.8 for calibration procedures.
Zero Drift = Current Data Logger Reading – Calibrator Reading
% Difference Drift = (Current Data Logger Reading – Calibrator Reading) x 100
Calibrator Reading
38
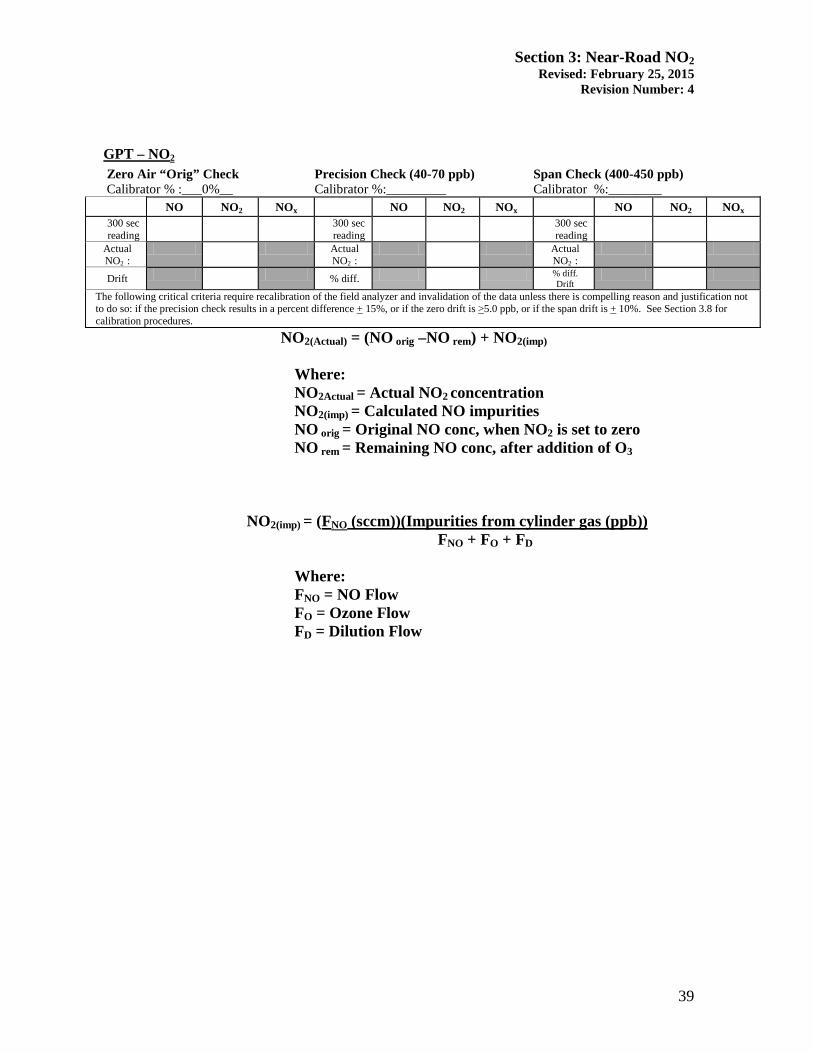
Section 3: Near-Road NO2 Revised: February 25, 2015
Revision Number: 4
GPT – NO2
Zero Air “Orig” Check Precision Check (40-70 ppb) Span Check (400-450 ppb) Calibrator % :___0%__ Calibrator %:_________ Calibrator %:________
NO NO2 NOx NO NO2 NOx NO NO2 NOx 300 sec reading
300 sec reading
300 sec reading
Actual NO2 :
Actual NO2 :
Actual NO2 :
Drift % diff. % diff. Drift
The following critical criteria require recalibration of the field analyzer and invalidation of the data unless there is compelling reason and justification not to do so: if the precision check results in a percent difference + 15%, or if the zero drift is >5.0 ppb, or if the span drift is + 10%. See Section 3.8 for calibration procedures.
NO2(Actual) = (NO orig –NO rem) + NO2(imp)
Where: NO2Actual = Actual NO2 concentration NO2(imp) = Calculated NO impurities
NO orig = Original NO conc, when NO2 is set to zero NO rem = Remaining NO conc, after addition of O3
NO2(imp) = (FNO (sccm))(Impurities from cylinder gas (ppb))
FNO + FO + FD Where: FNO = NO Flow
FO = Ozone Flow FD = Dilution Flow
39
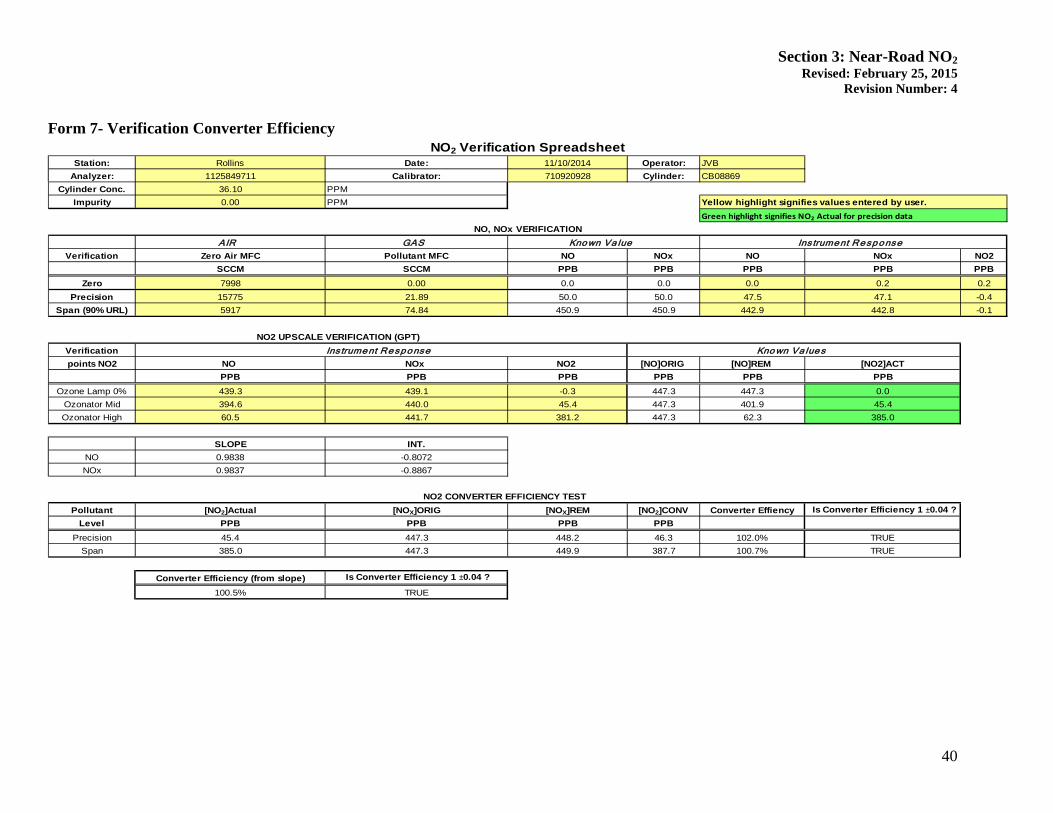
Section 3: Near-Road NO2 Revised: February 25, 2015
Revision Number: 4
Form 7- Verification Converter Efficiency
Station: Rollins Date: 11/10/2014 Operator: JVBAnalyzer: 1125849711 Calibrator: 710920928 Cylinder: CB08869
Cylinder Conc. 36.10 PPMImpurity 0.00 PPM
AIR GASVerification Zero Air MFC Pollutant MFC NO NOx NO NOx NO2
SCCM SCCM PPB PPB PPB PPB PPBZero 7998 0.00 0.0 0.0 0.0 0.2 0.2
Precision 15775 21.89 50.0 50.0 47.5 47.1 -0.4Span (90% URL) 5917 74.84 450.9 450.9 442.9 442.8 -0.1
Verificationpoints NO2 NO NOx NO2 [NO]ORIG [NO]REM [NO2]ACT
PPB PPB PPB PPB PPB PPBOzone Lamp 0% 439.3 439.1 -0.3 447.3 447.3 0.0
Ozonator Mid 394.6 440.0 45.4 447.3 401.9 45.4Ozonator High 60.5 441.7 381.2 447.3 62.3 385.0
SLOPE INT.NO 0.9838 -0.8072NOx 0.9837 -0.8867
Pollutant [NO2]Actual [NOX]ORIG [NOX]REM [NO2]CONV Converter Effiency Is Converter Efficiency 1 ±0.04 ?Level PPB PPB PPB PPB
Precision 45.4 447.3 448.2 46.3 102.0% TRUESpan 385.0 447.3 449.9 387.7 100.7% TRUE
Converter Efficiency (from slope) Is Converter Efficiency 1 ±0.04 ?
100.5% TRUE
NO2 CONVERTER EFFICIENCY TEST
Kno wn Va lue s
Ins trume nt Re sp o nse
NO2 UPSCALE VERIFICATION (GPT)Ins trume nt Re sp o nse
NO2 Verification Spreadsheet
NO, NOx VERIFICATIONKno wn Va lue
Yellow highlight signifies values entered by user.Green highlight signifies NO2 Actual for precision data
40

Section 3: Near-Road NO2 Revised: February 25, 2015
Revision Number: 4
Form 8 – Corrective Action Form
Polk County Air Quality - Corrective Action Form
To: Polk County Air Quality (position) From: Copies of completed form to: AQ Supervisor, File Urgency: Emergency (immediate action needed) Urgent (24 Hr.) Routine (7 days) Next scheduled visit Information only Problem Identification: Site: System: Date: Description of Problem: Recommended Action: Signature of Initiator: Date: Problem Resolution: Date of Corrective Action: Summary of Corrective Action: Result of Corrective Action: Signature of resolver: Date: Signature of QA Officer: ___________________________________ Date: _____________________
41