standard eurobarometer 40 - public opinion in the european...
TRANSCRIPT

EUROPEAN COMMISSION

The EUROBAROMETER No.40 survey was undertaken between 13th October and 9th November 1993, that is, around the time of the entry into force of the European Union (EU) Treaty.
HIGHLIGHTS
*
*
*
4t
*
- *
*
For the fifth time in a row, support for the European Union falls. Public support for the European Community is now back to where it was in the mid-eighties. General support for European integration, however, remains at a high 7 3 O h .
The European Community is still much in the news, but significantly less so than a year before, during the heat of the Maastricht debate. After sterling left the ERM and the French referendum in 1992, the perceived information deficit grew - almost three-quarters of EU citizens continue to feel uninformed about the EC, up from two-thirds in 1992.
In all countries except the United Kingdom, there was majority support among those who expressed an opinion for the Maastricht Treaty a t the time it came into force.
Absolute majorities from 9 countries favour a single currency for the Union by 1999. By contrast there are absolute majorities against the idea in Germany, Denmark and the United Kingdom (and opposition continues to grow in the latter two).
Absolute majorities everywhere back a role for the European Union in foreign policy towards non-EU countries and a common security/defence policy as an aim (exception: Denmark). However, there has been a significant shift over the past six months away from the Union jointly taking decisions on security/defence issues in favour of one's national government solely dealing with them.
Absolute majorities of EU citizens are gloomy about the unemployment situation in their country, both for 1993 and 1994. They are on balance marginally more positive than negative about their own individual job prospects.
Most perceive national governments to be primarily responsible for providing information about the European Union to its citizens. European institutions (the Commission and European Parliament combined) come next, with schools/universities also popular.
Most EU citizens do feel they have some kind of European identity. At the national level, the "our country-only" are in a majority solely in the UK while Danes and Irish are divided about their European identity.

-11- .
NOTE I
EUROBAROMETER public opinion surveys ("standard EUROBAROMETER surveys") have been conducted on behalf of the Directorate-General, Information, Communication, Culture, Audiovisual of the European Commission each Spring and Autumn since Autumn 1973 ("EB" No. O). They have included Greece since Autumn 1980, Portugal and Spain since Autumn 1985 and the former German Democratic Republic from Autumn 1990 onwards.
.
An identical set of questions was asked of representative samples of the population aged fifteen years and over in each Member State. The regular sample in standard EUROBAROMETER surveys is 1000 people per country except Luxembourg (500) and the United Kingdom (1000 in Great Britain and 300 in Northern Ireland). In order to monitor the integration of the five new Länder into unified Germany and the European Community, 2000 persons have been sampled in Germany since EUROBAROMETER 34: 1000 in East Germany and 1000 in West Germany.
Until EUROBAROMETER No 31, surveys were carried out by national institutes belonging to "European Omnibus Surveys" (EOS). "Faits et Opinions", Paris was responsible for finalisation of questionnaires (working with the Commission's "Surveys, Research, Analyses" Unit), international coordination and the initial statistical processing of the data. The EB surveys from No. 32 onwards have been carried out by national institutes associated with the "INRA (EUROPE) European Coordination Mice".
All institutes involved were selected by tender. They are all members of the "European Society for Opinion and Marketing Research" (ESOMAR) and comply with its standards.
The figures given for the European Union as a whole, which are shown in this document, are weighted on the basis of the adult population in each country. In certain cases, the total percentage in a table does not always add up exactly to 100%, but a number very close to it (e.g. 99 or 101)' because of rounding. When questions allow for several responses, percentages also often add up to more than 100% as well. Percentages shown in the graphics may display a difference of 1% compared to the tables because of the way previously-rounded percentages are added.
In accordance with normal practice for this type of survey, the European Commission disclaims all responsibility for questions, results and commentaries. This report, which was drawn up by the "Surveys, Research, Analyses" Unit of the Directorate-General, Information, Communication, Culture, Audiovisual is an internal working document of the European Commission.
Some of the results presented here have already been distributed by the publication of an Early Release (7th December 1993). The sections and paragraphs of this report which have already been published are annotated in the margin by the sign @. - Detailed tables on series of trend variables, some of which go back to 1962, were formerly published as Appendix B or Volume II of the EUROBAROMETER report twice a year. Nowadays, a more detailed version is published under separate covers annually, carrying in addition a series of short- and medium-term trends. The first volume of the new "EUROBAROMETER TRENDS" came out in March 1991.

. III .
TABLE OF CONTENTS MAIN REPORT
EDITORIAL: 20 YEARS OF THE EUROBAROMETER PAGE 1 - . 1 . THEEUROPEANUNIONTODAY . . . . . . . . . . . . . . . . . . . . . . 1
Have priorities changed compared to twenty years ago ? . . . . . . . . . 1 1.2 Expectations for 1994 . . . . . . . . . . . . . . . . . . . . . . . . . . . . . . . 3
The democratic deficit . . . . . . . . . . . . . . . . . . . . . . . . . . . . . . 10 1.4 Public support for European integration . . . . . . . . . . . . . . . . . . . 12
Image of the Commission . . . . . . . . . . . . . . . . . . . . . . . . . . . . 30 1.6 The Belgian Presidency . . . . . . . . . . . . . . . . . . . . . . . . . . . . 32
1.1
1.3
1.5
2 . COMMUNICATING THE EUROPEAN UNION TO PEOPLE . . . . . 35 2.1 Awareness of the EU and its institutions . . . . . . . . . . . . . . . . . . . 35 2.2 Interest in learning more . . . . . . . . . . . . . . . . . . . . . . . . . . . . 38 2.3 Where to get more information ? . . . . . . . . . . . . . . . . . . . . . . . 42 2.4 Who should provide the information ? . . . . . . . . . . . . . . . . . . . . 44 2.5 New possible ways of communicating . . . . . . . . . . . . . . . . . . . . 46 2.6 Trends in media use . . . . . . . . . . . . . . . . . . . . . . . . . . . . . . . 48
3 . EUROPEAN POLICY AREAS . . . . . . . . . . . . . . . . . . . . . . . . 53 3.1 -Awareness of key EC issues . . . . . . . . . . . . . . . . . . . . . . . . . . 53 3.2 Maastricht . . . . . . . . . . . . . . . . . . . . . . . . . . . . . . . . . . . . . . 54 3.3 Subsidiarity: national and EC policy areas . . . . . . . . . . . . . . . . . . 60 3.4 The Single European Market . . . . . . . . . . . . . . . . . . . . . . . . . 65 3.5 The EU's role in the world . . . . . . . . . . . . . . . . . . . . . . . . . . . 69
4 . INITIATIVES FOR THE EUROPEAN UNION JOB MARKET . . . . 71 4.1 Problems and solutions to unemployment . . . . . . . . . . . . . . . . . . 71
4.3 "Flexi-time" . . . . . . . . . . . . . . . . . . . . . . . . . . . . . . . . . . . . 76 4.4 Vocational training . . . . . . . . . . . . . . . . . . . . . . . . . . . . . . . 77 4.5 The future of employment . . . . . . . . . . . . . . . . . . . . . . . . . . . 79
. 4.2 Job-sharing . . . . . . . . . . . . . . . . . . . . . . . . . . . . . . . . . . . :.75
.
5 . OTHER DIMENSIONS OF EUROPE . . . . . . . . . . . . . . . . . . . . . 81
5.2 Nationality identity. European identity . . . . . . . . . . . . . . . . . . . . 83 5.3 Views on the European Court of Justice . . . . . . . . . . . . . . . . . . 83
5.1 Poverty and social exclusion . . . . . . . . . . . . . . . . . . . . . . . . . . 82

- IV -
I
TABLE OF CONTENTS ANNEXES
PAGE
DETAILS ON FIELDWORK AND SAMPLING . . . . . . . . . . . . ~2
Standard EUROBAROMETER survey No. 40 October-November 1993, by INRA (EUROPE) . . . . . . . . . . . . . . . . . . . . . . . . . . . . . . . . . . . . . . . . A2
Flash EUROBAROMETER survey No. 19 and No. 20, September 1993, by EOS Gallup Europe . . . . . . . . . . . . . . . . . . . . . . . . . . . . . . . . . . . . . . . A6
Central and Eastern EUROBAROMETER survey No. 4, November 1993, . . . . . . . . . . . . . . . . . . . . . . . . . . . . . . . . . . . . . . . . . . . A9
LIST OF GRAPHICS. . . . . . . . . . . . . . . . . . . . . . . . . . . . . . . . . . . ~ 1 2
LIST OF TABLES . . . . . . . . . . . . . . . . . . . . . . . . . . . . . . . . . . . . . AU
TABLES . . . . . . . . . . . . . . . . . . . . . . . . . . . . . . . . . . . . . . . . . . . . . A20
SURVEYS ON ATTITUDES OF EUROPEANS . . . . . . . . . . . . . ~ 7 6
TECHNICAL SPECIFICATIONS FOR SOCIO- DEMOGRAPHIC AND SOCIO-POLITICAL VARIABLES . . . A87
.
-V-
The European Union is a well- oiled machine lacking charisma to attract popular support.
Vaclav Havel, 1994 European Parliament
- EDITORIAL:
TWENTY YEARS OF EUROBAROMETER
Publishing ("standard") EUROBAROMETER ("full") report no 40, we start celebrating the 20th anniversary of regular European Commission public opinion polling. It was in Spring 1974 that the first of the regular twice-yearly EUROBAROMETER surveys took off the ground under the direction of Jacques- Ren4 RABIER'.
1. The European Community After 40 Years
Following the famous declaration by Robert Schuman of 9 May 1950 and subse- quent negotiations and ratifications, the European Community "of The Six" was established by the Treaty of Paris (18 April 1951), which came into force on 23 July 1952. A t the time, it was "just" a "European Community for Coal and Steel'. Right after this consciously modest beginning2, a next step was under-taken once again initiated by the government of France: the elaboration of the treaties for a "European Defence Community" and a "European Political Community" among the same six countries. The government of all six had signed the treaty, five had ratified it, when - on August 24, 1954 - the French parliament turned it down.
All who remember those days, or who read the respective newspapers today, will hardly be able to avoid smiling ironically. There are people who called it "THE crisis
of Europe" when the Treaty of Maastricht failed by some 23,000 Danish votes to jump its first hurdle on 2 June 1992, less than four months after it had been
5 For a short professional and intellectual biography of Jacques-Ren6 RABIER see the
"Preface" and "Bibliography of Jacques-Ren6 Rabier", pp. xiv-xvi and 385-387, in Karlheinz Reif and Ronald Inglehart, eds., Eurobarometer: The Dynamics of European Public Opinion - Essays in Honour of Jacques-Ren6 Rabier, Basingstoke and London: Macmillan, 1991.
' After the English as well as the Scandinavians had insisted on their belief into having and wanting to retain "full sovereignty", the foundation of the Council of Europe (May 1949) did not lead to the creation of the United States of Europe. This had been the hope of many participants of the "Congress of The Hague" organised in May 1,948 by the European Movement, although it did not figure in the final document.

- VI -
signed. Yes, it was a crisis. But there had been many before; and there will be more to come.
The Maastricht "Treaty on European Union" (of 7 February 1992) needed just twenty months to pass the last ("Karlsruhe") hurdle before it came into force.
But during the forty years between the start of the ECSC and the entering into- force of the "Treaty on European Union", the Community had become much deeper and larger than those deceived by the light-weight nature of the "Council of Europe" would have ever dared to dream. t
2. The European Union in the Future
It is true: neither enlargement negotiations, nor serious steps to contain violence in former Yugoslavia, nor the in-depth debate about competitiveness, growth and employment in Europe had won real momentum before the Treaty on European Union had come into force. The European Monetary System had undergone two serious shocks. The discussion about options for the future of Europe had become more lively in many countries. In summer 1991, months before the Maastricht meeting of the European Council, the overall EC average of Europe's support by public opinion began a fall which had started - in some EC member states - in 1987 or 1988 already with the Single European Market legislation beginning to take shape. This drop in public support for 'Europe' accelerated as soon as "Maastricht" had taken place. Now, straight after the Maastricht Treaty came into force, things have begun to move again:
Today, the Commission's White Paper is making its way through discussions in governmental institutions, interest groups, specialists' symposia and the media. The European Monetary Institute in Frankfurt has started to work. And optimistic headlines on the economy/business pages of the press slowly become more numerous ...
Today, four EFTA candidate countries have successfully finished their negotiations with the Commission and Council. As soon as the Council reaches its decision on how to define its own rules afresh, it will be up to their parliaments and peoples, as well as to the national parliaments of the Twelve and t o the European, Parliament, t o decide whether those countries will become members ...
Today, prospects for peace in former Yugoslavia look better than they have for' many months ... Another Inter-Governmental Conference is called for 1 996 to decide about institut- ional reforms in the light of experience with the Maastricht Treaty, northern and alpine enlargement and "Europe Agreements" with six countries of Central and
- VII -
Eastern Europe3. As of 1996, the question of when to start the single currency phase of EMU will be on the table: 1997? later? 1999? even later?.
It is not difficult to predict that serious controversies will come about with each major new step ahead. And that some will label each of them, in turn, "THE Crisis of Europe", again. But confidence in the European Union's capacity to widen and deepen was hardly ever more justified than today. Since the foundation of the European Community in 1951 /52, those who have chosen not to join the crowd, have not prevented the crowd from moving ahead4. Those who will chose'not to join the crowd in the future will not prevent the crowd from moving on.
-
3. 1947-1 974-1 993: Twenty (and Forty-Seven) Years of Public Opinion About European Integration
The first cross-national opinion poll on European unification was carried out in September 1947 about the idea of forming a "United States of E ~ r o p e " ~ . Majori- ties of the French and Dutch publics were in favour, while most Norwegians and Swedes hesitated. A pilot survey in Great Britain had shown that most of the English could not attribute any meaning to the question and, consequently, declared they could not take a stand ...
During the build-up years from 1952 to 1962, (diffuse) support for European unification in (West) Germany wavered between 69% and 82%. In the year 1962, when President DE GAULLE had slammed the door to the English, German support was 77% (today West German support is 74%). Corresponding figures for France are between 45% and 67% (1952 - 1957), 1962: 70% (today 73%). In Italy 1952-1 957 support varied between 55% and 66%, 1962: 67% (today 84%). In Great Britain 1952-1957 figures vary from 58% to 78%, in 1962, after the General's message, it was 47% (today 59%).
In May 1991, this author had presented the view that "twelve years later the European Community will have welcomed twelve new member states and that within 24 years 24 countries will add to the now twelve" to a trilateral meeting of European, American and Japanese pollsters organised in Venice by the European Society for Opinion and Market Research (ESOMAR). Many faces in the audience betrayed scepticism.
And yet, less than two years later, the European Economic Space counts 17 member states; and another 6 countries of Central and Eastern Europe are associated with the Community through "Europe Agreements" which are geared for those countries' foreseen possible future Union membership. Three other European countries have applications for membership pending.
9
In that respect, the French Assembly's decision of 24 August 1954 necessitated, indeed, the biggest detour ever: the extension of the West European Union and West Germany's separate membership of NATO in 1955. A t the beginning of 1994, the French government is among the most active in convincing NATO that it should take a more rigorous stand in Bosnia ...
See Jacques-Ren6 RABIER, "L'opinion publique et l'intégration de l'Europe dans les annees '50", pp. 561-584 in Enrico SERRA, ed., The Relaunching of Europe and the Treaty of Rome, Bruxelles: Bruylant/Milano: GiuffrtdParis: L.G.D.J./Baden-Baden: Nomos, 1989.

- VIII -
In 1970, Leon N. LINDBERG and Stuart A. SCHEINGOLD presented a theoretical framework for interpreting public opinion research results about European integration and the European Community'. Respectable majorities in the six member states (with a tendency to further continuous growth) declared they were in favour of the European Community (or "Common Market"), while little public debate and or relevant overt opposition had become visible after DE GAULLE'S slamming the door for the English in 1962 and his imposing - by one year of . practicing the "policy of the empty chair" - the "Luxembourg compromise" upon the five fellow member state governments in 1965/66.
LINDBERG and SCHEINGOLD labelled the nature of public opinion support for "Europe" a "permissive consensusn: support was widespread but not at all necessarily deeply rooted. European integration was left to the elites. On the backdrop of peace, protection from Leninist-Stalinist Bolshevism, and economic growth, most citizens had adopted an attitude of benevolent disinterest for European integration'.
This changed with the entry of Denmark, Ireland and the UK. Referendums were held in 1972 for the first two, and in 1975 for the latter. But soon afterwards, the Irish joined the "old six" in favouring the Community. The British took their time, but approval kept growing, slowly, but steadily - in the good tradition of that country. Only among the Danes did scepticism reign not only longer but in an obviously more deeply rooted way.
Overall, the LINDBERG and SCHEINGOLD "permissive consensus" paradigm applied: as soon (or as long) as no relevant political actor and/or no important societal force opposed European integration, majorities of the public were for it but did not really care. The first oil price shock of 1973 had not really pushed elites into much European progressive adventures. The December 1 974 "summit" decisions to hold direct elections to the European Parliament and t o create a regularly-meeting European Council of the Heads of (the French) State and (all member states') Governments may have briefly excited the political classes and, thus, become visible in opinion poll results. But it did not change the rules of the game.
The second oil price shock had obvious consequences for the climate of public opinion about "Europe": support deteriorated on average throughout the EC and the period of "euro-scepticism" began to characterise the public mood. In March/April ' 1981 , public support for the European Community had reached its nadir. As soon as - not the least through the political victories of economic Reaganism and * Thatcherism - governments in Western Europe, including the socialist government
' See their Europe's Would-Be Polity. Patterns of Change in the European Community, Engelwood Cliffs: Prentice Hall, 1970.
This was nicely confirmed by the climate of French President POMPIDOU'S 1972 referendum on whether or not the four new candidates for EC membership (Denmark, Ireland, Norway and the UK) were welcome to the French: the majority was safe but turnout was very low ...

- IX -
of France as of 1983/84, had adapted their general policy orientations to the new situation', overall economic recovery took place and public support for European integration recovered with it. The ground for initiatives for more of it were laid: the 1 979-established European Monetary System worked satisfactorily, and the "SPINELLI-initiative" of the directly elected European Parliament was followed by the Lord COCKFIELD/European Commission White Paper on Completing the Single European Market, translated into the Single European Act by an Inter-Governmental Conference in 1985, which came into force in 1987. Public opinion about Europe and the Community was taking good shape, again. Overall, the maxima of the 1970s were left behind; and this definitely so after the arrival of Spain and Portugal.
But few remembered that LINDBERG and SCHEINGOLD, in 1970 already, had formulated some caveats: the domination of practical steps towards more European integration by elites and a "permissive consensus'' of the public were said to be at risk, as soon as ...
'I... enhanced salience would be more likely to manifest itself in spillback situations (. . .) If the perceived gains of integration were threatened, (. . .) supportive elites and mass publics (would) be mobilized to assume a more active role. (...) If the Community were to broaden its scope or increase its institutional capacities markedly, (...) there (would) be reason to suspect that the level of support or its relationship to the political process would be significantly altered (pp. 274ff ., esp. p. 277)
On June 2nd, 1992, 23,000 Danes too many on the "NEJ" side of the first "Maastricht" referendum had ascertained that, for some weeks and months, "Europe" was taken as seriously as it permanently had merited to be taken since quite some years. On June 3rd, 1992, the political classes in several EC member countries declared "THE crisis of Europe" open.
Readers of EUROBAROMETER reports had known better. On average throughout the Community, public support had started to fall before the Maastricht meeting of the European Council, i.e. during the summer of 1991 : the (free delivery to your home TV screen) spectacle of the Gulf war was over; news from Eastern Europe began to become bad news; the recession had started to become really felt everywhere. And the "magic date" of opening a real ("Single European") common market had become seriously close ... 9
But readers of EUROBAROMETER reports, by that time, had already known for several years that, in some important big member states, a decline of public support for the Community had begun much earlier: in 1988189 in Italy, in 1986187 in France, for example. The "once more much more Europe for you" as which the "Treaty on European Union" had been presented and perceived, and the
i.e. making the public accept higher unemployment rates without seriously putting their remaining in power at risk.
-x-
Danish wake up call were nothing but multipliers and accelerators of an effect which had been triggered off by the Single European Act: significantly "more Europe" than ever before. The very marked "broadening of its scope and increase of its institutional capacities" LINDBERG and SCHEINGOLD had warned to necessitate more than a simply "permissive" consensus: a "significant alteration of the political process''. Democracy perhaps . . . 9
4. Public Opinion in the Future
Chances for a simple return to the "permissive consensusn of the past are slim. As EUROBAROMETERs No 37 and No 38 have shown: those who associate the Single European Market with fear (rather than with hope) give economic reasons in the South. they give political, and not just economic, reasons "why" in the centrally located; and political reasons only in the northern member states of the European Union of The Twelve. And EUROBAROMETER No 39 has shown: those who associate the Single European Market with fear (rather than with hope) have below average objective knowledge and information about the European Community. They hardly differentiate between the "Single Market" and the "Maastricht-Treaty " or the "European Community". Their fear is, thus, a general, diffuse fear of "more Europe". It is their fears that nourish the discourse of political elites who are against Europe (or against more of it). It is them who constitute the potential that is electorally mobilizable by such "anti-European" political leaders. There appears to be few alternatives to an active, democratic, consensus about the futuro of European integration and the European Union - except for a consciously accept8d crisis of its fundamental popular legitimacy.'0
And t w o other well experienced observers of United Europe, Joseph KEOHANE and ST- HOFFMANN, had warned of "'domestic backlashes' or 'revolts' against the economic hardsWs I*. single market might impose on certain sectors, professions or regions", especially on the burbrog of a "democratic deficit'' and the "paradox of an elaborate process of multinational b.rg.rr*q coexisting with an obstinately national process of political life and elections" in their 'Conclu8-m Community Politics and Institutional Change", pp. 276-298 of William WALLACE (ed I . lho Dynamics of European Integration, London: Pinter, 1990. Cf. also Richard SINNOT. PdaCJ i Culture, Public Opinion and the Internationalisation of Governance, Dublin: University C d w (CEEPA); and Karlheinz REIF, "Wahlen, Wähler und Demokratie in der EG. Die drei Dimensionen Oer demokratischen Defizits", pp. 43-53, in Aus Politik und Zeitgeschichte, no B19/1992, or Karlhem REIF, "Ein Ende des 'Permissive Consensus'? Zum Wandel europapolitischer Einstellungen in Ow öffentlichen Meinung der EG-Mitgliedstaaten: zu-Stimmungstrends in EG-Europa", pp. 23-40. in Rudolf HRBEK (ed.), Der Vertrag von Maastricht in der wissenschaftlichen Kontroverse, Beden Baden: Nomos, 1993.
'O See Karlheinz REIF, "Das Demokratiedefizit der EG und die Chancen zu seiner Verringerung', pp. 37-62, in Politische Bildung, no. 3, 1993, (Stuttgart: Klett).
- XI -
5. The EUROBAROMETER After Twenty Years
Public opinion concerning the idea of Western European integration had started to be measured a long time before the "EUROBAROMETER" was founded". But regular twice-yearly poils in all member states of the European Community12 began to be carried out - under the name of EUROBAROMETER - in Spring 1974 under the direction of Jacques-René RABIER.
During the almost 13 years he had been responsible for- the instrument he had created, the EUROBAROMETER had lived through an experience of remarkable growth and success. It had become a well known "brand name" for applied cross- national opinion polling within the institutions of the Community Commission and Parliament above all, but also among the Brussels press corps and thousands of subscribers throughout not only the Community but all over the world: school teachers and government ministers, university researchers and regional journalists, bankers and trade union activists ... EUROBAROMETER had experienced an enlargement from EC9 to EC 10 on the' arrival of Greece in 1981, as well as an enlargement from EC1 O to EC1 2 on the arrival of Portugal and Spain in 1986.
Simultaneously, EUROBAROMETER surveys lived through a kind of enlargement of their own. Beginning with a study of "European women and men" in Spring 1975 on behalf of the Directorate General for Social Affairs of the Commission, an ever increasing number of "special Eurobarometers'' started to become regular practice. Today, their number has come close to 100: ca. 5 per year, on average.. .
Beginning with Eurobarometer survey No 27, Jacques-René RABIER handed over the direction of the instrument to the present author. During the first months of common experience on the second floor of the Berlaymont, another innovstron concerning Commission monitoring of citizens' attitudes and opinions with respect to "Europe" took place: Flash EUROBAROMETER N o l was carried out on the oc - casion of the 30th anniversary of the Treaty of Rome, under the forward looking title of "Europe 2000". Since N02, most Flash EUROBAROMETERs have been carried out by telephone. Today, we are working on the questionnaire of -Flash EUROBAROMETER" No 27 ...
9
After polling for the Commission in the U.S.A. (1 973, 1987, 19901, EUROBARO- METER began to become active elsewhere outside the European Community. In January 1990, one of the first telephone polls in Greater Moscow carried out for c
'' See Richard L. MERRITT and Donald J. PUCHALA, eds.,Western European Perspectivn on International Affairs, 1968; and LINDBERG/SCHEINGOLD (1 9701, op.cir..
-.
As of 1952, U.S.I.A., the United States (external) Information Agency, had started to poll Britain, Germany, France and Italy on matters of European integration; cf. MERRIT and PUCHALA (1 9681, op.cit..

- XII -
a Western client13 contained some questions on behalf of EUROBAROMETER. In May 1990, we polled the German Democratic Republic. (Since the unification of Germany in Autumn 1990, standard EUROBAROMETER surveys are based on 1,000 interviews in West Germany and an additional 1,000 interviews in East Germany.) Also in Autumn 1990, "CENTRAL AND EASTERN EUROBAROMETER" No 1 was in the field in the (then) three "Visegrad" countries and in Bulgaria. CEEB2, carried out in Autumn 1991, covered 1 O countries; CEEB3, one year later, surveyed 18 countries and asked pilot study questions in another two (Croatia and Serbia). CEEB4, fielded in November 1 993, with an additional post-electoral poll in Russia after 1 2 December 1993, was presented to the press in Brussels and in the capitals of 16 countries simultaneously, a short time ago. Japan and Israel were surveyed for EUROBAROMETER in 1991 and 1992, re~pect ively '~.
=
By now, the EUROBAROMETER data base15 contains the data of some 782,000 interviews carried out in the Twelve as well as of ca. 65,000 interviews done outside of the EU countries16. The EUROBAROMETER has conducted surveys on behalf of the Commission in more than 50 countries to date.
6. Eurobarometers in the Future
When "Maastricht" and the member state governments' tactics during ratification rendered manifest the latent crisis of public support for European integration and the European Community (documented in standard EUROBAROMETER reports since 1988), blame was, as usual, put on the European Commission.
l 3 Professors DUCH and GIBSON of the Department of Political Science at the University of Houston, Texas.
l4 "Autonomous (standard) EUROBAROMETERS" were established in Norway in 1991 and in Finland in 1992 with the consent of (and in close technical co-operation with) the Commission - without any political or financial responsibility of the Commission, however.
South/South-East Asian as well as Latin American EUROBAROMETER surveys are being prepared for 1994.
l5 Established, and currently hosted, by the "Zentrum für Europäische Umfrageanalysen und Studien (ZEUS)", at MZES (Mannheimer Zentrum für Europäische Sozialforschung), Universität Mannheim.
=
The data of each EUROBAROMETER survey are made available, sometimes under an embargo of up to two years, to university social science data archives in Europe (currently the Zentralarchiv für empirische Sozialforschung, ZA, an der Universität zu Köln) and the U.S.A. (currently the data archives of the Inter-University Consortium for Political and Social Research, ICPSR, at the Institute for Political Studies of the University of Michigan in Ann Arbor, Michigan). They are available to any professional interested in using them for teaching or research. Numerous books and articles based on EUROBAROMETER data secondary analyses have been published.
- XIII -
1 'amorce d'un gouvernement européen, as President DELORS had called the Com- mission in 1988, launched several rounds of drawing up a balance sheet and rethin king its information and communication strategy. Something was wrong in the state of Europe, and maybe least so in Denmark ... . 17
One of the results of this self-examination was the resolution to take public opinion 'more seriously into account and to increase significantly the scope and frequency of Commission opinion polling. EUROBAROMETER,'once more, will be reinforcing and differentiating its "tool box" of instruments as of 1994. Two important new types of surveys are being created and put on the rails:
1) The "MONTHLY MONITOR EB", and
2) The "TOP DECISION-MAKERS' EB".
'Standard EUROBAROMETERs", "Flash EBs" (including special target group polls), and 'CENTRAL AND EASTERN EUROBAROMETERs" will continue - adapted, however, in their specific tasks profile and mode of publication, to the existence of the two new major instruments".
Independent of the "Survey Research (EUROBAROMETER)" Unit, directed by the present author and expanded as described above, DGX "Information, Communi- cation, Culture and Audiovisual" of the Commission has created a new unit, "Suivi de l'opinion publique", directed by Anna MELICH, Deputy Head of the EUROBAROMETER Unit from 1988 to 1994". This new unit will organise quantitative monitoring of news in the mass media about the European Union, its institutions and policies. It will also prepare analysis of their results as well as "socio-political analyses" of survey research data, and of Commission Offices' Political Reports. It will provide the Member of the Commission responsible for information and communication with concise material for hidher monthly report to the Commission on "The State of Public Opinion in the Member States".
" See Karlheinz REIF,"The European Union and the Danes", paper presented to Pilar DEL CASTILLO and Hermann SCHMITT, directors, workshop on Democratic Representation and the Legitimacy of Government in the EC, European Consortium for Political Research (ECPR), 22nd annual Joint Sessions of Workshops, Madrid, 17-22 April 1994.
k
The present (standard) EUROBAROMETER report is the last one in its traditional format. In the future, standard EUROBAROMETER reports will primarily consist of graphics and tables, preceded by an editorial which highlights the main results of its core topic and basic evolution of trends. Graphics and tables will present breakdowns of answers not only by member state but - more often than to date - by socio-demographic, socio-political, regional and cultural categories. EUROBAROMETER TRENDS will continue to be published once per year.
k
19'For publications by Anna MELICH see, e.g., her "The nature of regional and national identity in present day Catalonia: Problems of measuring multiple identities", in European Journal of Political Research, vol. 14, 1986; her Identit4 nationale et média contemporains, Lausanne: Loisirs et Pbdagogie, 1990; or her Les valeurs des Suisses (dt: Die Werte der Schweizer), Bern, etc.: Lang, 1991.

- 1 -
EUROBAROMETER 40
1. THE EUROPEAN UNION TODAY1
1.1 Have priorities changed compared to twenty years ago?
"Prospects for economic and monetary union dim as economic recession bites" '. This is a headline that could have come from today's newspapers. Yet curiously, it would also have been appropriate for the situation facing the former Common Market twenty years ago, when the EUROBAROMETER fast began its regular six-monthly survey of citizens' opinions about Europe-and its future.
Except when specifically mentioned, the data contained in this report comes from standard EUROBAROMETER No. 40 conducted 13th October-9th November 1993 by INRA (Europe). For more technical details, see the Annexes.
' The basis of much of this brief analysis is "The Oxford Companion to Politics of the World". Oxford University Press. 1993.
- 2 -
EUROBAROMETER 40
In Spring 1974, Western Europe was in an economic recession which was considered at that time as the severest since the 1930's. Oil prices doubled, bringing high inflation and the misery of what was seen as large-scale unemployment around that time. At the beginning of 1973, the "Six" Members of the Community had become "Nine", with the adhesion of - Denmark, Ireland and the United Kingdom. Some thought that their entry would herald a process that would lead to economic and monetary union. Instead, deteriorating economic conditions brought about a greater divergence in rates of growth and levels of inflation between Member States. Now, in Autumn 1993, the "Twelve" are trying to bring EMU about again, this time with the power of global financial markets, another economic recession and other factors pitted against their detemination.
Yet politically Spring 1974 was far away from the realities of Autumn 1993. Then. the world was still in the grips of the Cold War, and Europe was the most significant from frontline. The United States was withdrawing from its bloody Vietnam debacle amidu the turmoil of its domestic Watergate scandal. The Helsinki negotiations strove to recogniv the post-World War II frontiers of Eastern Europe, to further human rights in the East, to build economic cooperation and reduce as much as possible the risk of war.
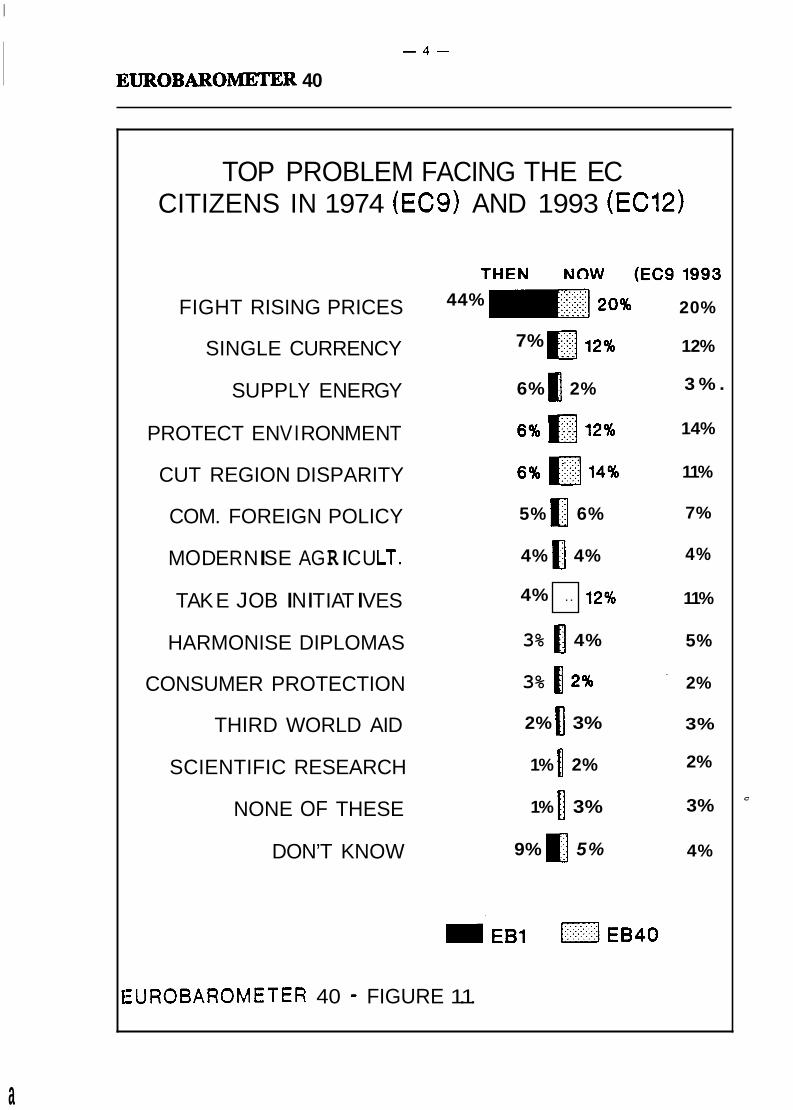
Yet, despite the political turmoil abroad, it was inflation that EC citizens from thc Nin considered the biggest priority for the European Community to tackle at that time (Table I , Figure 1.1). In Spring 1974, the very first EUROBAROMETER revealed that 44% of EC citizens of the Nine felt a common fight against rising prices is "the most imporunt (problem) at the present time". It was the top issue in all Members States, ranging from 56% of the Irish and 55% of the British to 34% of the Dutch and 35% of Italians.
Far behind lay the other issues - replacing the currencies of all member countries. inciding the (NATIONAL) currency, with a single European currency (7%); implemenutm of a common policy on energy supplies (6%); reducing the differences between developad regm and less developed regions of the member countries (6%); achieving a common poky fa protecting nature and fighting pollution (6%); and 5 % for achieving a common foreign polsy in discussions with the United States and Russia.
All other issues were considered top priority by very few, given the ovcrwhcJmmng importance of fighting inflation - in brief: modernising agriculture (4%). initvung coordinated employment policy and job training (4%), harmonisation of (diplomas and otha) qualifications (3 %), protecting consumers against fraudulent selling and advertising (3 % ), Third World aid (2%), and scientific research (1%).

- 3 -
EUROBAROMETER 40
In Spring 1993, fears of inflation are not as prevalent, but it is again the top issue that citizens of the new European Union (EU)' wish the Twelve to solve together - now a fifth of EU citizens (20%) say rising prices concern them most. Inflation still comes ahead of all other problems in Belgium (26%), Ireland (24%), France, Portugal (both 22%) and the United Kingdom (21%). In Germany, this issue (22%) is considered of equal importance with environmental protection (22%). Nevertheless, it now has less than half (20%) its original potency of 20 years' ago (44%) at the EU-level.
The next highest issue nowadays is reducing differences between the regions of the Member States by helping less developed regions, chosen by 14% of the citizens of the Twelve (and 11% of the original EC9 among them). This is the top priority for many people from most southem countries of the Union: Spain (23%), Greece (2196, equally with combatting inflation - 22%), Italy (20%, equally with achieving a single currency, 21 %). The largest number of East Germans also reckon - unlike their westem compatriots - that reducing regional disparities is most important (24%).
Third comes the environment, along with employmentljob training and the single currency (aU 12% at the EU12 level). Environment is the keyissue-~ong--Danes.~33~~-~d the Dutch (28%). Luxembourgers are divided between the environment and a single currency (both 14%). No other issue gains top consideration from more than 7% of EU citizens as a whole.
1.2 Expectations for 1994
EUROBAROMETER traditionally asks a series of "End of Year" questions in its Autumn survey aimed at catching the mood of EU citizens concerning their feelings about the past as well as about the forthcoming twelve months.
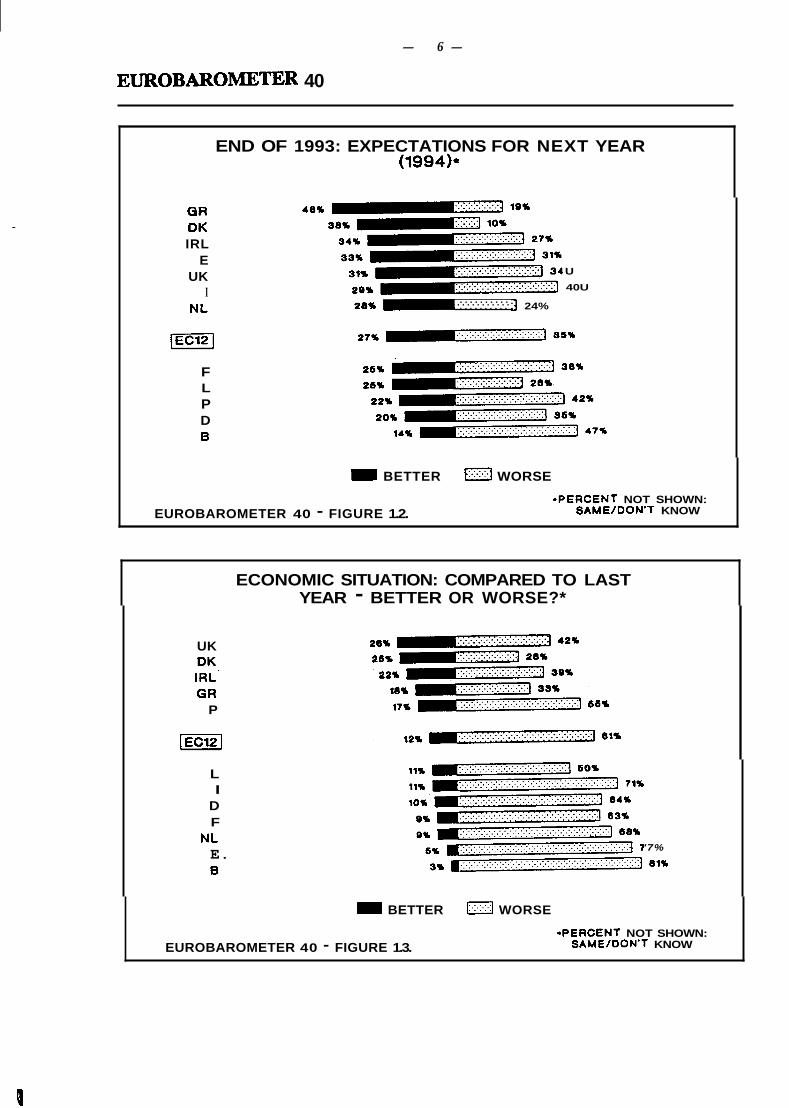
EU citizens were asked whether they feel 1994 would be better or worse for them than 1993 ("able 2). Their results almost mirror how they saw 1993 compared to 1992 last year (latter results in brackets). More say next year will be worse: 35% (35%) - than better: 27% (28%) - while 30% (29%) say spontaneously it will be the same.
The European Union (EU) was bom on 1st November 1993, v i d l l y at the end of the standard EUROBAROMETER No. 40 fieldwork period. Thus the questionnaire still used 'European Community (EC)'. As this is a transition period, both terms are used in the report.
I
- 4 -
EUROBAROMETER 40
TOP PROBLEM FACING THE EC CITIZENS IN 1974 (EC9) AND 1993 (EC12)
FIGHT RISING PRICES
SINGLE CURRENCY
SU P P LY EN E RGY
PROTECT EN VI RON M EN T
CUT REGION DISPARITY
COM. FOREIGN POLICY
M O D E R N I S E AG R I C U LT.
TAK E J OB I N I TI AT I VES
HARMONISE DIPLOMAS
CONSUMER PROTECTION
THIRD WORLD AID
SCIENTIFIC RESEARCH
NONE OF THESE
DON’T KNOW
44% =-I 20% . . . . .
7% u 12% . . .
6% I] 2%
6% 10 ... 12%
6% 0 14%
5% u 6%
4% 0 4%
4% .. 12%
3% 1 2 %
2% 0 3%
1% 0 2%
1% 0 3%
9% I] 5%
3% Q 4%
20%
12%
3 % .
14%
11%
7%
4%
11%
5%
2%
3%
2%
3%
4%
=UROBAROMETER - 40 - FIGURE 1.1.
c
a

- 5 -
EUROBAROMETER 40
Despite this apparent continuity of pessimism, there are some prominent movements at the country level. Above all, the recent change of Government in Greece after its 10th October 1993 General Election (just before fieldwork started) may have been a contributory factor in a big swing: from being the most pessimistic people about 1993 (26% "better"; 17% "same"; 50% "worse") last year, they have now become the most optimistic among the EU12 about 1994 (48:20: 19). Optimism also increases substantially in Spain (+ 12 "better"). But for Belgium (+ 19 "worse"), Portugal (+ 14) and France (+lo), a much more pessimistic atmosphere prevails compared to last time (Figure 1.2).
This time, optimism is also more prevalent than pessimism in Denmark (38% "better", 47% "same", 10% "worse") and Ireland to a lesser degree (34:32:27). Spaniards (33:27:31), the Dutch (28:44:24), British (31:29:34) and Luxembourgers (25:44:26) think on balance the situation will largely remain unchanged. Relative majorities everywhere else say things will be worse in 1994, especially Belgians this time (14:30:47).
One does not have to look much further than the economic situation in the European Union to see why people are generally pessimistic. 61% of EU citizens as a whole say that the economic situation in their country got worse over the past twelve months. Only 12% say it got better. For 24%, it stayed the same (Figure 1.3, Table 3) '.
A few more people than in 1992 see the next twelve months more optimistically - but still the negative mood prevails. 40% see the respective economic situation getting worse, while only 24% expect an improvement. 30% see the situation not to change (Table 4).
Despite having the only GDP growth in the whole European Union in 1993, most British still seem unconvinced about the reality of their economic recovery. -A quarter (26%) say the economic situation got better while 42% say it got worse. Neither are many very enthusiastic about the forthcoming twelve months (32% "better", 34% "same", 29% "worse"). Nevertheless they are the most optimistic among the EU12 concerning their country's economic performance in the past year along with Danes (25:45:28) and, apart from Greeks (42:30:18 - the only ones really expecting an economic take-off in 1994), the relatively most often optimistic about the future along with the Irish (32:34:29), Italians (32:27:35) and Danes 31:40:25). Most down in the dumps about their country's economic performance are Belgians, both for the past (81 % "worse") and the future (66% "worse"). Nevertheless people in all countries are at least more optimistic about the next year than they are about the past twelve months.
,
.
Occasionally, due to munding, combined totals of positive and negative, as well as trends/shifts, may differ by one percent from non-aggregate figures. Thus marginal differencm of not more than one percentage point may occasionally exist between the percentages shown in the graphics, text and tables.
4
- 6 -
EUROBAROME'I'ER 40
END OF 1993: EXPECTATIONS FOR NEXT YEAR (1994)*
GR DK IRL
E UK
I
U
40U ........... ........... NL 28% 9 . . . . . . . . . . .I 24%
[EC121
F L P D 8
BETTER 0 WORSE
-PERCENT NOT SHOWN: EUROBAROMETER 40 - FIGURE 1.2. SAME/DON'T KNOW
ECONOMIC SITUATION: COMPARED TO LAST YEAR - BETTER OR WORSE?*
UK OK
GR P
IRL'
IËë51 L I
D F
NL E. 8
'7%
81%
= BETTER 0 WORSE
œPERCENT NOT SHOWN: SAME/DON'T KNOW EUROBAROMETER 40 - FIGURE 1.3.
P

- 7 -
EUROBAROMETER 40
Overall the biggest negative change in fortune over the past year is seen in Portugal. From results showing the best perceived economic performance in the European Community in 1992 (a rather neutral 33:38:27), they slump to fifth place in 1993 with perceived negative growth (17:24:55) - there is not much greater optimism for 1994 (21:23:46). .
The pain of the EU's collective economic decline has not hit everybody's wallet to the same degree. Thus, half of all EU citizens questioned say that the financial situation of their household in fact stayed the same in 1993, while a third (34%) say it got worse and only a sixth that it got better (15%) (Table 5). Almost have expect no change for 1994 (23% "better"; 49% "same"; 24% "worse") (Table 6).
During the past twelve months, the only people who report improvements in their personal financial situation are many East Germans (40:41:19). Greeks are the most numerous to anticipate improvement from 1993 (18:56:24) to the following year (40:32:20).
The latest Central and Eastern EUROBAROMETER No.4 ' offers an additionally insight into another part of Europe concerning this question. Only most Albanians (60%) say their household finances got better in the twelve months preceding November 1993, when the fieldwork for this survey was undertaken. Everywhere else in Central and Eastem Europe, most people say their finances got worse (Table 7).
Taking people's opinions in PHARE recipient countries as a whole, 56% say their household finances got worse, 29% that they stayed the same, and only 13% that they got better. The weighted average result for people's views in PHARE countries is almost the same as for the Former Yugoslav Republic of Macedonia (56:30:12). In the Euro-CIS, fewer remain unaffected ("21% stayed the same"), while more got richer (17%) and poorer (63%).
Looking forward to the next twelve months, the perceived situation seems marginally more optimistic. As many in PHARE countries think that their household finances will stay the same (30%) as fall (32%), although those believing household finances will improve are not quite as many (26%). In Euro-CIS countries overall, people think household finances will decline (37%) rather than stay the same (23%) or get better (17%) in 1994. In the Former Yugoslav Republic of Macedonia, people are more likely to say their finances will stay the same (39%) rather than increase (29%) or decrease (25%) (Table 8). ,
' Central and Eastem EUROBAROMETER No. 4 was conducted in 16countries during November 1993. A report containing the results will be published in February 1994. PHARE-assisted comtries are Albania, Bulgaria, the Czech Republic, Estonia, Hungary, Latvia, Lithuania, Poland, Romania, Slovakia and Slovenia. "Euro-CIS" is Armenia, Belarus, Russia West of the Uds and Ukraine for the purposes of this survey. The Former Yugoslav Republic of Macedonia was also surveyed.

- 8 -
EUROBAROMETER 40
Turning back now to the state of public opinion in the European Union, in addition to the above traditional "End of Year" results, the EUROBAROMETER asked further questions on the problem many EU citizens consider the most pressing facing the Union today : unemployment.
The European Commission spent much of the period of the Belgium Presidency working on a White Paper proposing masures to stimulate "growth, competitiveness and employment" E
throughout the Union. Such is the importance of this topic that the standard EUROBAROMETER report No. 40 devotes Chapter 4 exclusively to this subject.
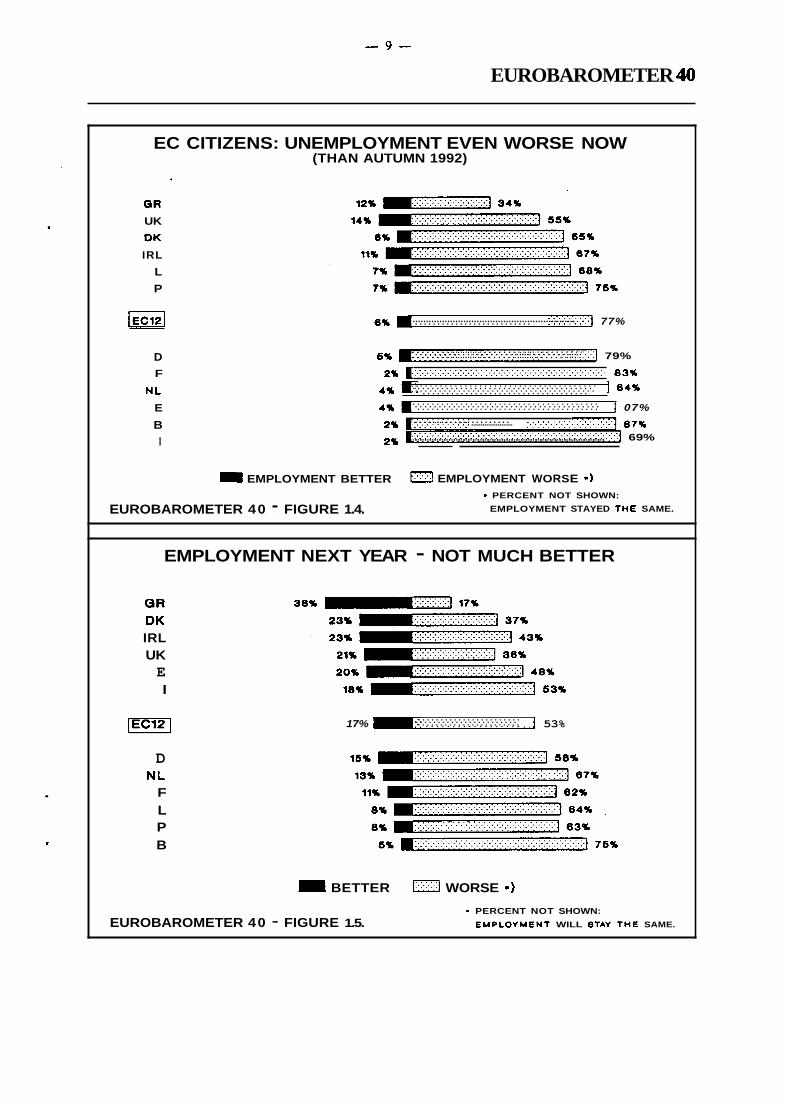
As part of this current series of questions, the EUROBAROMETER asked whether EU citizens feel the employment situation in their own country over the past twelve months got better, stayed the same, or became worse. An overwhelming 77% say it got worse, while only 16% say it stayed the same and merely 6% that it got better (Figure 1.4, Table 9).
Particularly revealing is the fact that most EU citizens do expect employment prospects to get even worse in 1994. 53% say they will deteriorate, 27% stay the same and only 17% reckon the situation will improve (Figure 1.5, Table 10).
Only in Greece do almost half its nationals express the feeling that the employment situation remained unaltered in 1993, although more say it had got worse than better (12% "better"; 48% "same"; 34% "worse"). For 1994, they are the only ones to be as numerous feeling matters may largely improve (38:39:17) rather than decline.
Everywhere else, absolute majorities say the employment situation got worse in 1993, from almost nine-out-of-ten Italians (89%), Belgians and Spaniards (both 87%) to 55% of the British. Absolute majorities in seven countries (B,D,F,I,L,NL,P) expect the situation to get worse in 1994. The results are almost as bad as in Ireland (23% "better", 29% "worse", 43% "same") and Spain (20:26:48). In the United Kingdom (21:40:36) and Denmark (23:38:37), almost as many say the situation will stay the same as say it will-get worse.
A number of people see their own individual job situation in not such bleak terms. If one just takes those EU Citizens who are in active employment or unemployed, exactly half (50%) say their job situation did not change in 1993. 25 % say it got worse, while 19% say, it got better. 5% report they have not been in work during the last year or longer (Table 11).
Only Danes (24% "better", 61% "same", 12% "worse") and Luxembourgers (27:52:17) are rather more often positive than negative about their own job situation in 1993. The result is balanced in the Netherlands (24:49:24) and the United Kingdom 28:44:25) and worse than better elsew here.
i
- 9 -
EUROBAROMETER 40
EC CITIZENS: UNEMPLOYMENT EVEN WORSE NOW (THAN AUTUMN 1992)
QR UK
OK
IRL
L P
6% ............................................................. 1EC1PI .......................... . . . . . . . . I 77%
D F
NL E
B
. . . . . . . . . . . . . . . . . . . . . . . . . . . . . . . . . . . . . . . . . . . . . . . . . . . . . . . . . . . . . . . . . . . . . . . . . . . . . . . . . . . . . . . . . . . . . . . . . . . . . . . . . . . I,] 79% 6w
.......................................................................... 63%
. . . . . . . . . . . . . . . . . . . . . . . . . . . . . . . . . . . . . 4+ . . . . . . . . . . . . . . . . . . . . . . . . . . . . . . . . . . . . . . . . . . . . . . . . . . . . . . . . . . . . . . . . . . . . . . . . . D.. . . . . . . . . . . . . . . . . . . . . . . . . . . . . . . . . . . . . . . J 84% . . . . . . . . . . . . . . . . . . . . . . . . . . . . . . . . . . . . . . . . . . . . . . . . . . . . . . . . . . . . . . . . . . . . . . . . . . . . . . . . . . . . . . . . . . . . . . . . . . . . . . . . . . . . . . . . . . . . 1 07% ....................... ;.:.;.:.:.:.:.:.: ...................... ......................
22 ,j ................................................................................ . . . . . . . . . . . . . . . . . . . . . . . . . . . . . . . . . . . . . . . . 69% I
EMPLOYMENT BETTER n EMPLOYMENT WORSE 9) - PERCENT NOT SHOWN:
EUROBAROMETER 40 - FIGURE 1.4. EMPLOYMENT STAYED THE SAME.
GR DK IRL UK E I
EMPLOYMENT NEXT YEAR - NOT MUCH BETTER
[EC12)
D NL
F L P B
. . . . . . . . . . . . . . . . . . . . . . . . . . . . . . . . . . . . . . . . . . . . . . . . . . . . . . . . . . . . . . . . . . . . . 17% -.. . . . . . . . . . . . . . . . . . . . , , j 53%
= BETTER WORSE *)
EUROBAROMETER 40 - FIGURE 1.5. PERCENT NOT SHOWN:
EMPLOVMENT WILL BTAY TnE SAME.

- 10 -
EUROBAROMETER 40
In the next twelve months - and contrary to their views on the overall employment situation - those on the job market are marginally more hopem (27%) than desperate (16%) about their own job prospects, although half (50%) once again see no likelihood of change (Table 12).
Although around half of citizens in all countries reckon their personal situation will not change next year, everywhere there are more positive than negative signs except in France (25:43:24) and Portugal (20:47:20) where people are divided on the subject and where on balance more people remain still pessimistic (15:52:21).
-
Ygiumy i
1.3 The democratic deficit
Ever since the debate over the Maastricht Treaty began some two years ago, man outcry has provoked concerns about a "democratic deficit" within the European C Some have termed this concem an "information deficit" as many citizens try to where their politicians' "construction of Europe" is taking them to.
In the standard EUROBAROMETER No. 38 report, we noted that - for the firs since 1976, when the question was first asked continuously - there were more they were dissatisfied than satisfied with the way democracy works in their gap between those satisfied and dissatisfied then worsened six months later. largely stable compared to last time at still 54% dissatisfied and only 43% 1.6, Table 13).
Conceming satisfaction with democracy at the EU level, there are as dissatisfied (both 44%) with the way democracy works in the European Un six months, there has been an improvement in some people's views ( "dissatisfied") on the issue (Table 14).
This means, in fact, that there are less people dissatisfied with EU democracy
A recent detailed document produced by the EUROBAROMETER6 on this shows that views about whether democracy works or not at the coincide in the majority of cases. Nevertheless, there are some among them that people living in Mediterranean countries to express dissatisfaction with their own country's
their own country's democracy.
the smaller member countries of the Community are more numerous to be satisfied functioning of EU democracy.
I 'Democratic deficits ? Satisfaction and dissatisfaction with the way democracy wo& at Mem and EC levels" (EB dossier 3914 update).
State t I

- 1 1 -
EUROBAROMETER 40
60%
55%
50%
45%
40%
35%
SAT I S F I ED W I T H DEM OCR ACY IN ONE'S COUNTRY? 1976 - 1993 -EC12
EB # 0 6 o8 i o 12 i 4 16 18 20 22 24 26 28 30 32 34 36 38 40 YEAR 76 77 78 79 80 81 82 83 84 85 86 87 88 89 90 91 92 93
SATISFIED -8- NOT SATISFIED
EUROBAROMETER 40 - FIGURE 1.6.

- 12 -
EUROBAROMETER 40
The biggest rise in satisfaction with national democracy this time occufs in France (+5) and the most significant drop in Greece (4), where 53,196 of those who voted did not choose for the winning PASOK on election day. Both these countries have recently experienced changes of government through General Elections, which often lead to an increase in overall :
satisfaction levels. Nevertheless, changes of view are not sufficient to overturn majorities dissatisfied with democracy in either countries.
The only country experiencing a (minor) fall in their citizens' satisfaction democracy is Ireland (-3 "satisfied"). Maximum increases in satisfaction registered in France (+7) and Greece (+5) , again showing the close relati the two questions.
It should be exciting to watch what happens next time, as Italian politics stalemate of almost half a century. Will this lead to Italians being much their democracy - or will continued very high dissatisfaction levels i situation help pull the country apart ?
(8 1.4 Public support for European integration
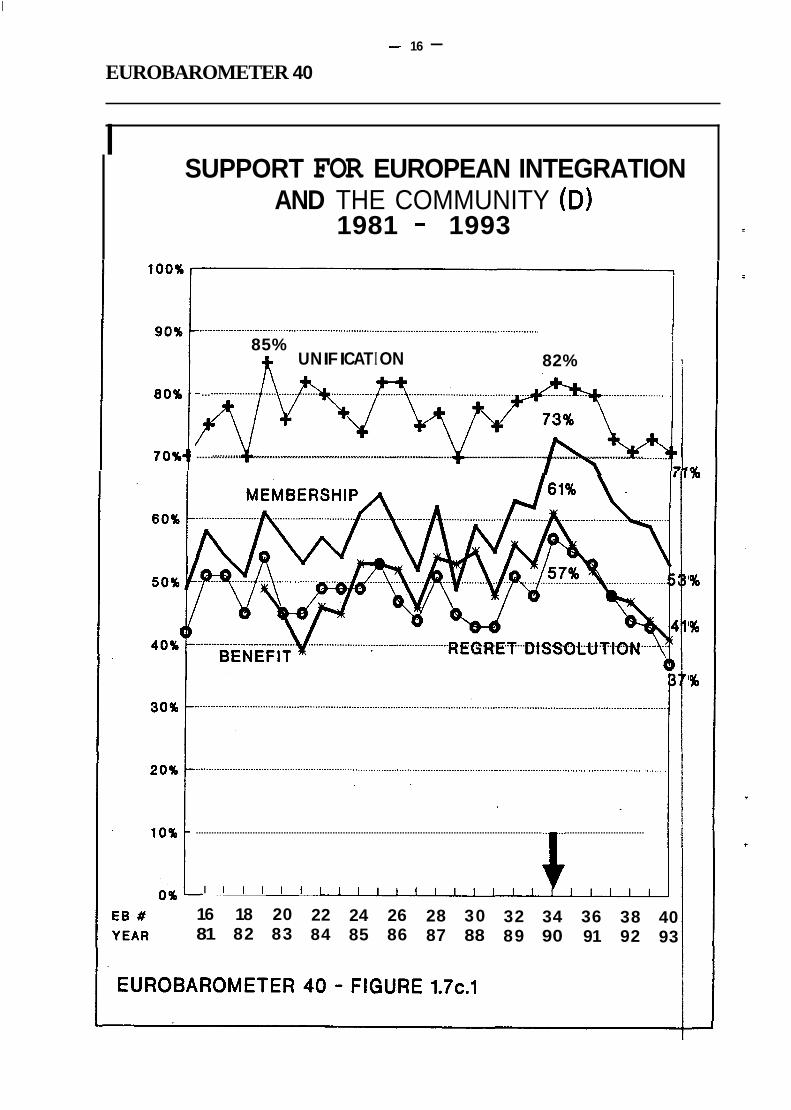
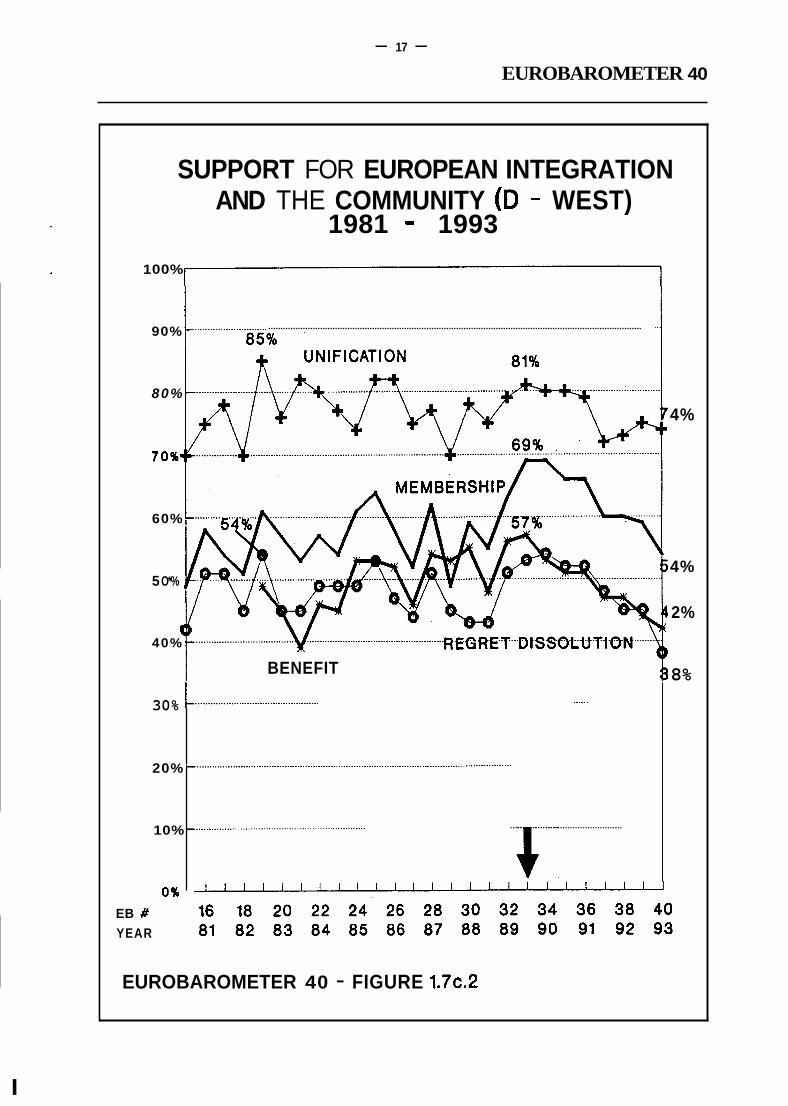
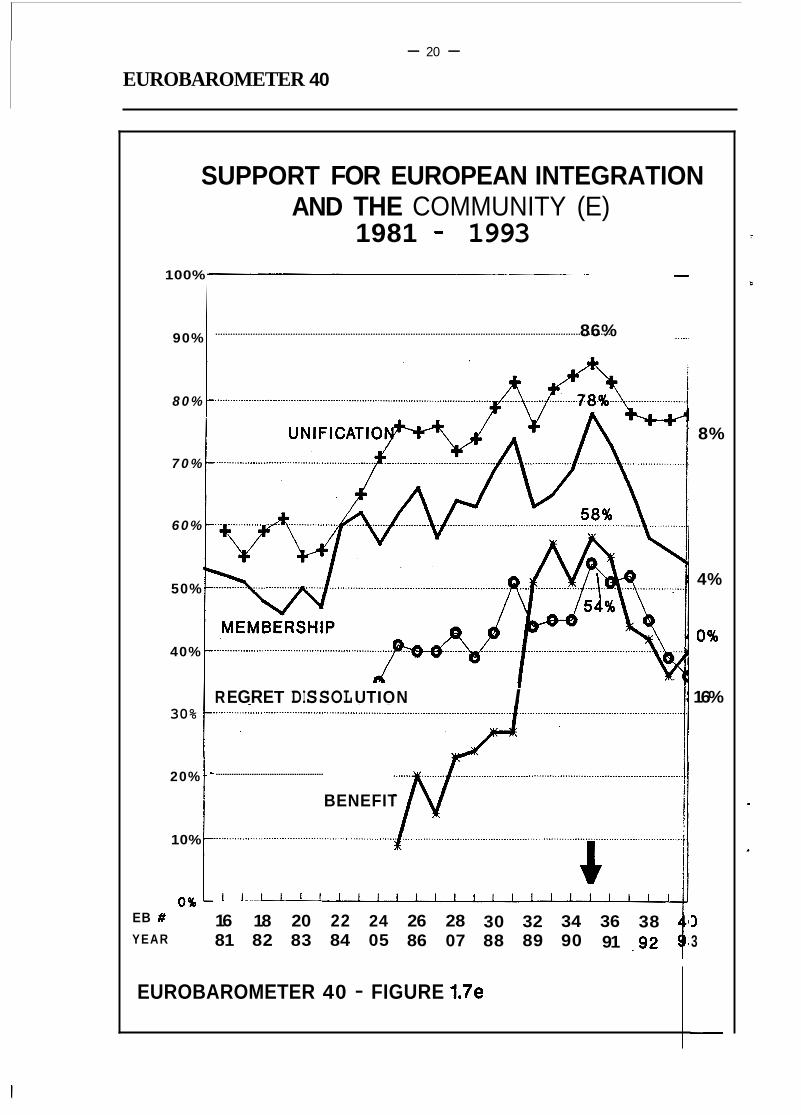
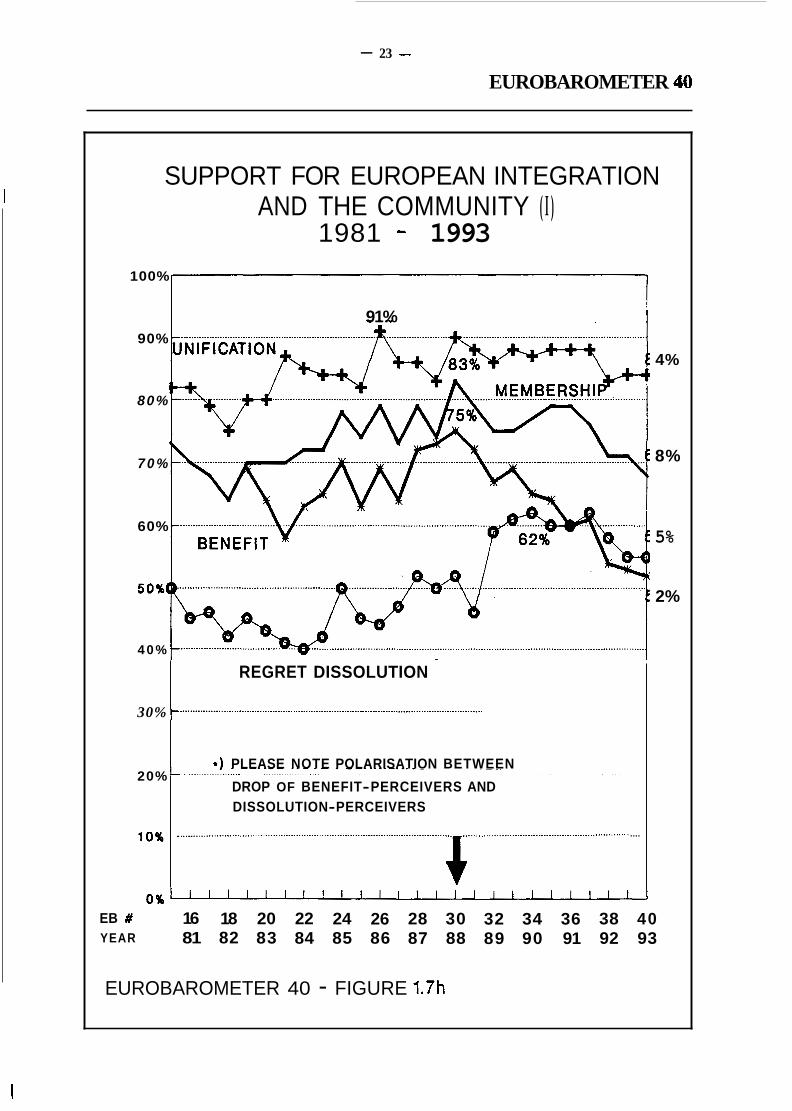
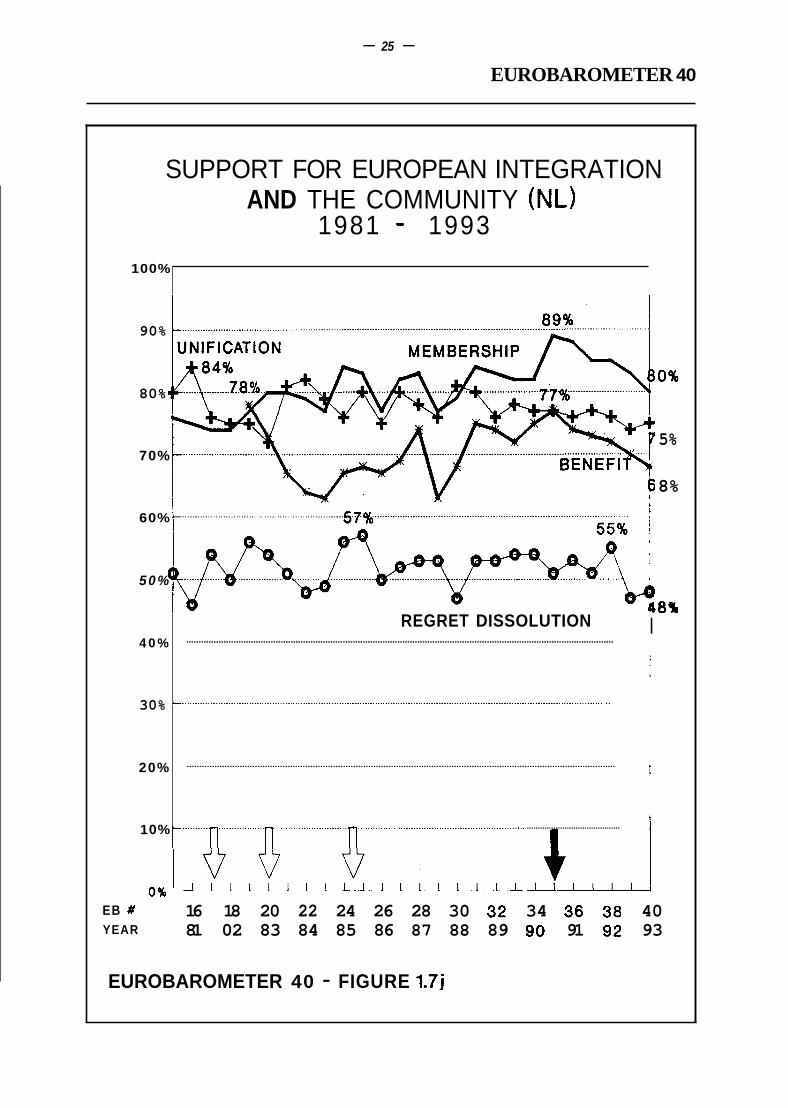
In the standard EUROBAROMETER report No. 38, our regular reade Editorial gave a detailed explanation of the erosion of the traditional " towards Europe and the chief reasons why the drive towards European now. Once again, for the fifth time in a row, the EUROBAROMETER stan of support for the European Union have generally fallen. Levels of public Union are now back to where they were in the mid-eighties westem European unification in general shows continuing consoli level (73%) (Figure 1.7, a-1, Table 15). Otherwise:
* 57% now think EC membership is a good thing for their co six months ago; 13 % say it is a bad thing while 25 96 say " "don't know" (Figure 1.7, a-1, Table 16).
45% bëlieve their country has on balance benefited fro points; 35% say it has not benefited, 20% "don't know" (Table 17).
40% would be very sorry if the EC was scrapped, percentage (40%) now say they would be indifferent "don't know" (Table 18).
*
*
Drops are particularly serious this time in Belgium (especially perceived benefits membership -lo), Germany, Portugal and the United Kingdom.
I

- 13 -
EUROBAROMETER 40
SUPPORT FOR EUROPEAN INTEGRATION AND THE COMMUNITY -EC12
1981 - 1993
......................
10% ...................... .................................................................................................................................................... c EC10 EC12 EC12+
EB # 16 18 20 22 24 26 28 30 32 34 36 38 40 YEAR 81 82 83 84 85 86 87 88 89 90 - 91 92 93
0% 1 1 1 1 1 1 1 1 1 1 ' 1 1 1 1 1 1 ' 1 ' 1 1 1 '
EUROBAROMETER 40 - FIGURE 1.7.
I

- 14 - EUROBAROMETER 40
100%
90%
80%
70%
60%
50%
40%
30%
20%
10%
0% EB # Y EAR
SUPPORT FOR EUROPEAN INTEGRATION AND THE COMMUNITY (B)
1981 - 1993
- ............................................................................................................. 8'6'%' ....................................................
UN IF I CATI ON
REGRET DISSOLUTIO
...................................................................................................................................
I I I I I I I I I JI I I JI I I
16 18 20 22 24 26 28 30 32 34 36 38 40 81 82 83 84 85 86 87 88 89 90 91 92 93
EUROBAROMETER 40 - FIGURE 1.7a

- 15 -
EUROBAROMETER 40
SUPPORT FOR EUROPEAN INTEGRATION AND THE COMMUNITY (DK)
1981 - 1993 100%
90%
80%
7 0 %
60%
50% 8
40%
MEMBE
30%
I
20%
10%
0% EB # YEAR
e
16 18 20 22 24 26 28 30 32 34 36 38 40 81 82 83 84 85 86 87 88 89 90 91 92 93
5%
i l %
8%
2%
EUROBAROMETER 40 - FIGURE 1.7b
- 16 - EUROBAROMETER 40
I SUPPORT FOR EUROPEAN INTEGRATION
AND THE COMMUNITY (D) 1981 - 1993
85% j, U N I F I CAT I ON 82%
_ ................................................................................................................................................... q h f i h ...............................................................................................................................................................
7
.............................................................................................................................................................................. 4 I I I I I I ~ l l l l l l l l l l l r l l l l l
16 18 20 22 24 26 28 30 32 34 36 38 40 81 82 83 84 85 86 87 88 89 90 91 92 93
%
%
%
%
- 17 - EUROBAROMETER 40
100%
90%
80%
70%1
60%
5 O*%
I 40%
30%
20%
10%
SUPPORT FOR EUROPEAN INTEGRATION AND THE COMMUNITY (D - WEST)
1981 - 1993
.......................................................................................................................................................
BENEFIT
.............................................
+ .
4%
4%
2%
8%
0%
EB #
YEAR
EUROBAROMETER 40 - FIGURE 1.7c.2
I

- 18 - EUROBAROMETER 40
100%
90%
80%
70%
60%
50%
40%
30%
20%
10%
0% EB # .
Y EAR
SUPPORT FOR EUROPEAN INTEGRATION AND THE COMMUNITY (D - OST)
1981 - 1993
. ........................................................................................ .................................................. 8.8%. ............................
MEM 87%- UN I FICATIC
BENEFIT 78%
REGRET DISSOLUTION
............................................................................................................................................................................. ?\
................................................................................................................................................................................
4 1 1 1 1 1 1 1 1 1 1 1 1 1 1 1 1 1 1 1 1 l 1 1 1
16 18 20 22 24 26 28 30 32 34 36 38 4 81 82 83 84 85 86 87 88 8 9 90 91 92 9
EUROBAROMETER 40 - FIGURE 1.7c.3
I
1%
2%
5%
!%
.

- 19 -
EUROBAROMETER 40
SUPPORT FOR EUROPEAN INTEGRATION AND THE COMMUNITY (GR)
1981 - 1993 100%
90%
80%
70%
60%1
50%
40%
30%1
20%
10%
0 % EB # YEAR
- ........................................................................................................
U NI FI CATI ON .....................
- ...........................................
.................................. .....................................................
.................................................................................................................................................................. I
....................................................................................................................................................................................
0 s- 16 18 20 22 24 26 28 30 32 34 36 38 40 81 82 83 84 85 86 87 88 89 90 91 92 93
EUROBAROMETER 40 - FIGURE 1.7d
- 20 - EUROBAROMETER 40
100%
90%
8 0 %
7 0 %
60%
50%
40%
30%
20%
10%
0% EB #
YEAR
SUPPORT FOR EUROPEAN INTEGRATION AND THE COMMUNITY (E)
1981 - 1993
86% ..............................................................................................................................................................
R EGRET DISSOL U TIO N I
- ................................................
BENEFIT
_.
1 1 1 1 1 1 1 1 1 1 1 1 1 1 1 1 ' ' ' 1 1 ' 1 1
16 18 20 22 24 26 28 30 32 34 36 38 81 82 83 84 05 86 07 88 89 90 91 .92
EUROBAROMETER 40 - FIGURE 1.7e
8%
4%
0%
16%
3 3
-

- 21 -
30%
20%
10%
0%
EUROBAROMETER 40
- .....................................................................................................................................................................................
- ....................................................................................................................................................................................
- .....................................................................................................................................................................................
. ' I I I ' ' I I I jf,, I I -
SUPPORT FOR EUROPEAN INTEGRATION AND THE COMMUNITY (F)
1981 - 1993
........................................................................... ............................................................................................ I 8.6'%'
EUROBAROMETER 40 - FIGURE 1.7f

- 22 -
EUROBAROMETER 40 \
SUPPORT FOR EUROPEAN INTEGRATION AND THE COMMUNITY (IRL)
1981 - 1993 . 100%
90%
80%
7 0 %
60%.
50%
40%
I
30%
20%
10%
0% EB # YEAR
84%
/ :GRET DISSOLUTION -.MÇMBERSH{p..-
EUROBAROMETER 40 - FIGURE 1-79
- 23 - EUROBAROMETER 40
100%
90%
. 80%
7 0 %
60%
50%1
4 0 %
30%
20%
10%
0 % EB # YEAR
SUPPORT FOR EUROPEAN INTEGRATION AND THE COMMUNITY ( I )
1981 - 1993
91%
REGRET DISSOLUTION
e ) PLEASE NOTE POLARISATION BETWEEN
DROP OF BENEFIT-PERCEIVERS AND DISSOLUTION-PERCEIVERS
........................................................................................................... .................................................................. - ....
t 16 18 20 22 24 26 28 30 32 34 36 38 40 81 82 83 84 85 86 87 88 89 90 91 92 93
4%
8%
5%
2%
EUROBAROMETER 40 - FIGURE 1.7h

- 24 -
EUROBAROMETER 40
SUPPORT FOR EUROPEAN INTEGRATION AND THE COMMUNITY (L)
1981 - 1993
BENEFIT
....................................................................................... REGRE.~...D.I.S.SO.L.U.IION
...................................................................................................................................................................
16 18 20 22 24 26 28 30 32 34 36 38 01 82 83 04 85 86 87 88 89 90 91 92
2% 0%
9%
16%
o 3
-
- 25 -
EUROBAROMETER 40
100%
90%
80%
70%
60%
5 0 %
4 0 %
30%
20%
10%
0% EB #
YEAR
SUPPORT FOR EUROPEAN INTEGRATION AND THE COMMUNITY (NL)
1981 - 1993
0%
5%
8% I
I REGRET DISSOLUTION ............................................................................................................................................................................
.......................................................................................................................................................................... 1
I .......................................... ,
4 I l l l r l l l l l l l r l l l l r l l l l l l 1
16 18 20 22 24 26 28 30 32 34 36 38 40 81 02 83 84 85 86 87 88 89 90 91 92 93
EUROBAROMETER 40 - FIGURE 1.7j

- 26 -
EUROBAROMETER 40
100%
90%
80%
7 0 %
60%
50%
40%
30%
20%
10%
0% EB # YEAR
SUPPORT FOR EUROPEAN INTEGRATION AND THE COMMUNITY (P)
1981 - 1993
................................................................
............ -...- ...................................
... ........-.........._......
EGRET DISSOLUTION
MEMBERSHIP
............................................................................................................................................................................... + 1 1 1 1 1 1 1 1 1 1 1 1 1 1 1 1 1 1 1 1 1 1 1 1
16 18 20 22 24 26 28 30 32 34 36 38 4
81 82 83 84 85 86 87 88 89 90 91 92 !
EUROBAROMETER 40 - FIGURE 1.7k
4%
9%
9%
6%

- 27 -
EUROBAROMETER 40
100%
90%
80%
70%
60%
50%
40%
30%
20%'
10%
SUPPORT FOR EUROPEAN INTEGRATION AND THE COMMUNITY (UK)
1981 - 1993
UN IF I CATI ON
.....
74%
MEMBERSHIP
. ....... .... ... ....... . ... . .. ..... .... .... . .................... ............................ . ...... ................... ......... . . ....... . . . ... ............ ... ... .. ... ....... 8 + 0 %
EB # YEAR
EUROBAROMETER 40 - FIGURE 1.71
16 18 20 22 24 26 28 30 32 34 36 38 40 81 82 83 84 85 86 87 08 89 90 91 92 93
9%
3%
3%
5%

- 28 -
EUROBAROMETER 40
Perceived benefits of EC membership are now at their lowest level since the question was first asked 10 years ago. Since Autumn 1989, "net" benefit (positive replies minus negative replies) dropped -26 points, from 36 points then to 10 points now, on EU average. Except for the special case of East Germany (-73 points, from an enormous high just after the East German revolution), drops are most dramatic in Belgium (-33, France (-33, Spain (-28), West Germany (-26), the United Kingdom (-25) and Italy (-27). Falls are also expe in The Netherlands (-13), Luxembourg and Portugal (both -8), while minor rises &i
this period in Greece (+4), Ireland (+7) and an extraordinary +19 in Denmark (
1.8).
It is noticeable that the biggest doubts concerning benefits are being expressed bl citizens of large countries. Today there are 33% of British who say their coun benefited from EC membership, but 49% who say the contrary. In France and Ger as well as in Spain - there are as many negative answers as positive ones.
For some time, evidence suggests that support for the Community is very much affec the general economic climate, often unpopular maures forced upon Govemmeni perceptions of it by EU citizens (Figure 1.9). This time, Belgium perhaps provides t example.
Nevertheless, there are notable exceptions.
Last year, it was the Danes; six months ago the British; this time the Greeks bL negative trend in the EU's image, a significant change which provides the forthcoming EU Presidency with a foundation of popular interest and support among its own citi
The increase in the percentage of Greeks saying they would be very sorry if the EU \I
be scrapped (+ 12) is one of the highest seen. Together with Denmark, Luxembourg, : and The Netherlands, Greece is one of the few countries where support for the EU to have generally held up rather than fallen during these difficult years.
By the help of a picture with seven little men moving at various speeds or not at all, interviewed indicated how fast they see "European unification, the European Comn progressing currently and how fast they would like it to progress. Latest results rf relative saturation point has been reached: even though, on average, people still want 1 to proceed faster than they see it now advancing, the gap between perceived and progress is the smallest to date (Table 19). On balance, a notable part of the public a to prefer that recent steps taken to further European integration (the Single Market, the Treaty) should be "digested" before embarking on new major projects.
aced i
- over :igure
"Y Y has lany -
ed by 9 and E best
k the keek :ns.
:re to eland eems
eople inity"
a xope :sired Pears Jnion

- 29 -
EUROBAROMETER 40
COUNTRY'S "NET' BENEFIT FROM EC (IN 1989 AND 1993) - % 'BENEFITED' MINUS % 'NOT BENEFITED"
70%
60%.
50%
40%
30%
20%
10%
0%
-10%-
. .
I . I - 20%- I I I I I 1 I I l I I I I
QR IRL NL L P DK I B EC D D- E F D UK 12 (W) (0) .
AUTUMN 1989 = AUTUMN 1993 -) E A 8 1 OERMANY AND QERMANY SINCE AUTUMN 1000
EUROBAROMETER 40 - FIGURE O 1.8.
CHANGE IN EMPLOYMENT (MIO) AND EC-MEMBERSHIP SUPPORT % -EC12
(ANNUAL AVERAGE FOR 'MEMBERSHIP')
7 3 MIO. 80% '
- 2 MIO.
- 1 MIO.
- - 1 MIO.
EC9 EC10 EC12
40% 1 1 ' 1 1 1 1 1 1 1 1 1 1 1 1 1 1 1 1 1 1 1 ' 1 1 1 1 1 1 '
EB #O0 02 04 06 08 10 12 14 16 10 20 22 24 26 28 30 3 2 34 36 38 40 YEAR73 74 7 5 76 77 78 79 80 81 82 83 84 86 86 87 88 89 90 91 92 93
-MEMBERSHIP EMPLOYMENT
EUROBAROMETER 40 - FIGURE 1.9.

- 30 -
EUROBAROMETER 40
In all countries, there are more people wanting progress to be faster than it actually is. Nevertheless, this sentiment is at its weakest in Denmark (0.2 more "desired" than perceived "current" speed), Germany (0.4), Luxembourg (0.5), Ireland and the United Kingdom (both 0.7) (Figure 1.10).
People were asked whether they are for or against the formation of a European Union with a European Government responsible to the European Parliament. 47% are in favour of this idea, with 27% against (Table 20). Although support has generally eroded from a high
=
fewer Belgians support (-8) and more Luxembourgers oppose (+ lo), the idea since of 59 % in Spring 1991, it remains largely stable over the past six months. Only signifi
Most support for the idea is expressed by Southerners - Italians (66%), followed by Gr (59%), Spaniards (57%) and Portuguese (53 96) - as well as Belgians (53%). Clear major are against only in two countries - the United Kingdom (23 % for; 49% against) and Denr (1 9: 69).
1.5 Image of the Commission
The number of people who say they have "recently" heard or read about the E u q Commission (47%) remains virtually unchanged since six months ago (46%)7 (Table Those most likely to have read or heard about the Commission are Luxembourgers (6t whose small country hosts a number of European Union institutions. Least news is h about it in Italy (40%).
There has been a minimal improvement in the European Commission's media image an those who have heard or read about it recently (+ 1 "generally favourable"; -3 "gam unfavourable"). Now, 35% see it as generally favourable, while 25% say it is unfavoun 33% say "neither" spontaneously while 7% "don't bow" (Table 21).
The European Commission has by far its best image in those small countries which pcro to benefit a great deal from EU grants - Greece (58% "generally favourable"), Irri; Portugal (both 51 %) and Italy (50%). Everywhere the image is more positive than ncgm or at least neutral - except in France (26% "generally favourable": 29% "genCr
unfavourable") and the United Kingdom (34:39). Greatest improvements in the Commiwl image Seem to have occurred in Greece (+7 "generally favourable") and the United King1 (+9), while there are significant falls in Spain (-10) and Ireland (-8).
' Awareness levels of other European Union institutions are presented in Chapter 2.1.

- 31 -
EUROBAROMETER 40
THE 'EURO - DYNAMOMETER' (EC12 AVERAGE ON 7-POINT SCALE - TREND)
0 0 0 O O O
1 2 3 4 5 6 7 EUROPE'S PROGRESS:
PERCEIVED CURRENT SPEED, DESIRED SPEED 7
6
5
4
3
2
1
O
2.1
5.5 n ... . . . . . . . . . . . . . . . . . . . . . . . . . . . . .
2.0
5.4 n .... . . . . . . . . . . . . . .
1.1
5 c_
1.1
4.9
1.6
5.1
0.8
4.4
1986 1987 1990 1992 1993 1993 OCT OCT OCT MAR M AY OCT
= CURRENT 0 DESIRED 1 STAND S T I L L 7 = A S FAST AS POSSIBLE
EUROBAROMETER 40 - FIGURE 1.10.

- 32 - EUROBAROMETER 40
1.6 The Belgian Presidency
Since Autumn 1986, a question has been asked in every EUROBAROMETER about the awareness and image of the Council Presidency in the country holding the Presidency at that time. In Autumn 1993, 62% of Belgians say they have recently read in the newspapers or heard on the radio or television something about the Belgium Presidency (Figure 1.1 1,
I
22).
Awareness levels for Belgium this time are about average compared to other countries their periods of Presidency, although rather on the low side if one takes into amui smaller EU countries generally generate more awareness of their Presidencies amoni own people than big countries. Nevertheless current results are significantly highe awareness levels during the last Belgian Presidency (5 1 %).
Irrespective of whether they have heard anythmg or not, people were asked if they fe important or not that Belgium is President of the Council of Ministers of the Eui Community at this time. 61 96 see it to be very/important while 36% say it is not veq important.
The importance attached to the Presidency by Belgians is not very high compared tc countries, but it is definitely an increase over last time (56% "very/important"). Ii Belgians this time join the Dutch as being the least numerous in considering their Pres important (both 36% not very/at all important). Once again, domestic problems in B such as discord over the Government's social pact and the ensuing strikes may havc instrumental in such a relatively low result a good half way through their Presidency
:able
1ring . that their than
I it is 'Pean at all
other fact, lency gium been

- 33 - EUROBAROMETER 40
.
~~
AWARENESS AND IMPORTANCE OF THE EC PRESIDENCY
AWAR E N ESS I M PORTAN C E
L 1991 (EB 35)82%
DK 1993 (EB 39)82%
P 1992 (EB 37) 81%
NL 1991 (EB 36) 81%
DK 1987 (EB 28) 79Y04
GR 1988 (EB 30) 74%
E 1989 (EB 31) 72%
IRL 1990 (EB 33) 70%
+ B 1993 (EB 40) 62%
D 1988 (EB 29)
I 1990 (EB 34)
UK 1992 (EB 38)
0 B 1987 (EB 27)
F 1989 (EB 32)
UK 1986 (EB 26)
EUROBAROMETER 40 - FIGURE 1.11.

- 34 -
EUROBAROMETER 40
r'
i

- 35 -
EUROBAROMETER 40
I
2. COMMUNICATINGTHEEUROPEANUNION TO PEOPLE
2.1 Awareness of the EU and its institutions
A revolution is taking place in the way the European Commission communicates with EU citizens. The Maastricht debate revealed that the European Union has become too remote from them. The Commission is now stressing its “openne~s” to make it easier for ordinary people to find out what it is doing. Users will regularly evaluate the effectiveness of EC information products. There is going to be more coordination of information activity both within the European Commission and between all European institutions. More resources are being made available for EC offices, the European Commission’s presence in all Member Stata. And public opinion polling will take a more important place in the new arrangement. Every month, the EC’s Commissioners now devote an hour of their weekly meeting to debate
new arrangement pulls no punches. According to Commissioner Pinheiro, who is the driving force behind the reforms, there will be no “propaganda” : “the whole truth will be told”.
the latest state of public opinion and take it into account for their plans and decisions. The

I
- 36 - I EUROBAROMETER 40
Yet how aware are citizens about the European Union and its institutions anyway? In EUROBAROMETER No. 40, two-thirds (66%) at the EU-level say they heard or read about the European Community "recently" (Figure 2.1, Table 23). The noise of Maastricht as it effects the European Union is st i l l high but clearly more subdued now - there is a fall of 15 L
points in overall EC awareness level since one year earlier,' when the question was last asked. In fact, awareness levels have returned to roughly what they were just before the first Danish referendum in June 1992. Yet the feeling of uninformedness about the European Union - - which'increased during the debate - remains higher (Figure 2.2).
With their constitutional court case still fresh in their minds; Germans are most like1 heard mention of the European Community (77%), including very high numbers Germans (82%). Least likely to have read or heard about it are the British (52% the greatest fall in awareness has occurred since a year ago (-27). The silence of th Euro-sceptics after their rout in the House of Commons motion of anfidenu Maastricht in July 1993 may have somewhat reduced media interest in the subject o overall in that country.
The most visible institution in this survey is the European Parliament (57%), followc European Commission (47%), the European Court (40%) being virtually equal with E Council (39%) (Figure 2.1, Table 24). These relatively low figures for the European are surprising, given the fact that fieldwork occurred just before and during the European "summit" in Brussels.
The European Parliament has'the highest profile in all countries with the exce Luxembourg, where the European Commission has marginally more exposure (6t Parliament (63%), and Denmark, where all four institutions are level (58%-61%).
In general, issues being dealt with by the European Union have a higher public profi 74% *'recently" aware) than institutions themselves (39%-57%), or even often when to the overall subject of the European Community itself (66%) (see Chapter 3.1 i details). The media - and people taking note of what they say - are clearly more ii in what the EU is achieving based on issues than talking about its institutions. The E Parliament (57% awareness) is the exception in this regard.
10 have
where British tied to the EU
pf East
I by the iropean Zouncil ktober
tion of 7.) than
: (51 %- . comes Ir more erested rropean
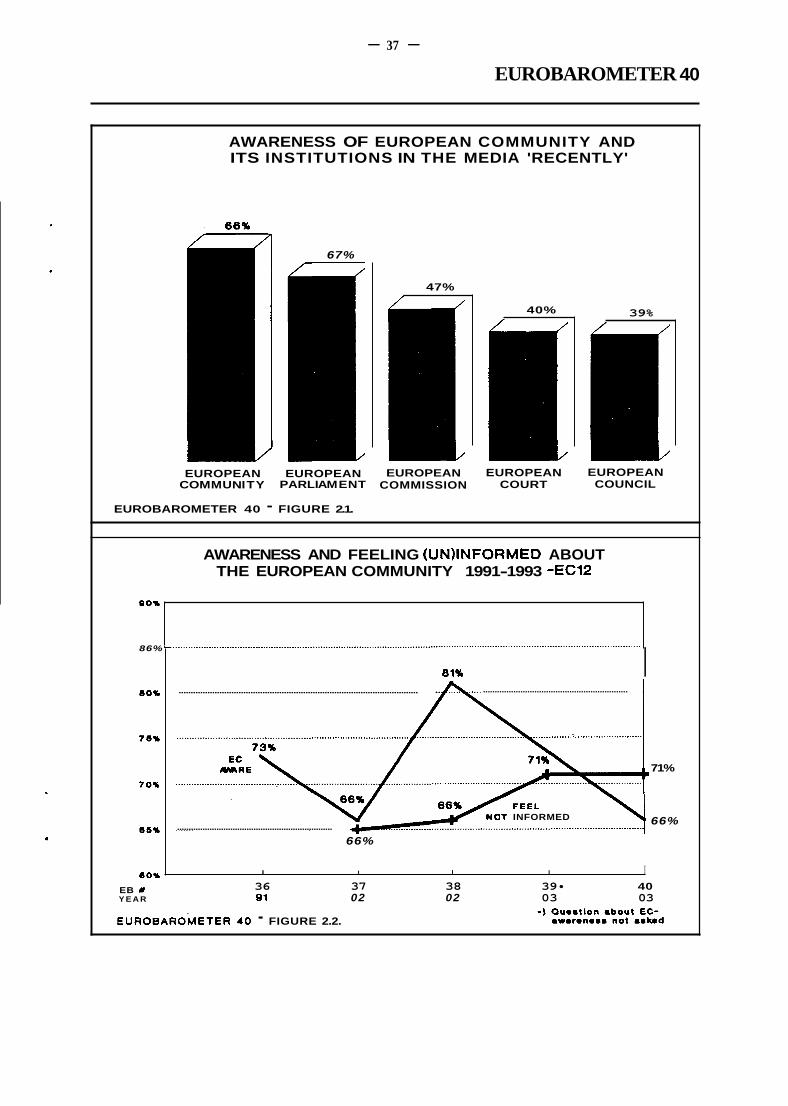
- 37 -
EUROBAROMETER 40
AWARENESS OF EUROPEAN COMMUNITY AND ITS INSTITUTIONS IN THE MEDIA 'RECENTLY'
67%
47%
40%
EUROPEAN EUROPEAN COM MU N ITY PARLI AM ENT
EUROBAROMETER 40 - FIGURE 2.1.
EUROPEAN COMMISSION
39%
EUROPEAN COURT
EUROPEAN COUNCIL
eon
86%
8 0 1
76n
70%
86%
(IOU
EB # Y E A R
AWARENESS AND FEELING (UN)INFORMED ABOUT THE EUROPEAN COMMUNITY 1991-1993 -EC12
81% I .............................................................. ....................................................................................................
71%
66% f INFORMED ...................................................................
66%
I I l I I 36 37 38 39 40 o1 02 02 03 03
EUROBAROMETER 40 - FIGURE 2.2.

- 38 - EUROBAROMETER 40
2.2 Interest in learning more
Apart from most Danes (68% "intemted") and Greeks (5496), the majority of people everywhere else are not very or not at all interested in the subject of "European politics, that is to say, matters related to the European Community". Least interested are Germans (33% "a great deal/to some extent interested"; 66% "not muchlat all interested") and Belgians (37:62). Overall 42% show some interest and 57% do not show much (Figure 2.3, Table 25).
Since six months ago, interest has increased the most in France, Greece and Lux +6 "a great deal/to some extent interested") while it has lost ground in Germ
This question has been asked occasionally since 1989 (EUROBAROMETER after the European Elections (SummedAutumn 1989). This is the only time people said they were interested (54%) than not (44%) in the subject. The debate seems not to have particularly kindled greater long-term interest issue of European Community politics from a mqjority of its citizens.
Nevertheless, the "information deficit" is being felt in another way - n citizens feel greater interest but because they feel less well informed.
71 % of people at the EU-level say they feel "not very/at all well informed" European Community, its policies, its institutions". informed" (Figure 2.4, Table 26). On the first two occasions the question the level of perceived uninformedness was nearly two-to-one (Spring 65: In 1993, the gap increased to nearly three-to-one (both times 71:27) (
The effect of the advent of the Single Market and the Maastricht debate has highlight to Eu citizens how little they knew about matters which were be intrude into their daily lives. The dawning of this new awareness created the "i deficit" which had always been there but had never been felt during the period o "permissive consensus".
Luxembourgers (42% "very/quite well informed), Danes (41 %) and the most numerously informed. Those who feel the least informed people from southern countries - Spaniards (75% "not very/at all i (76%), Italians (77%) and Greeks (78%) - as well as the British (76%).
Only 27% feel "
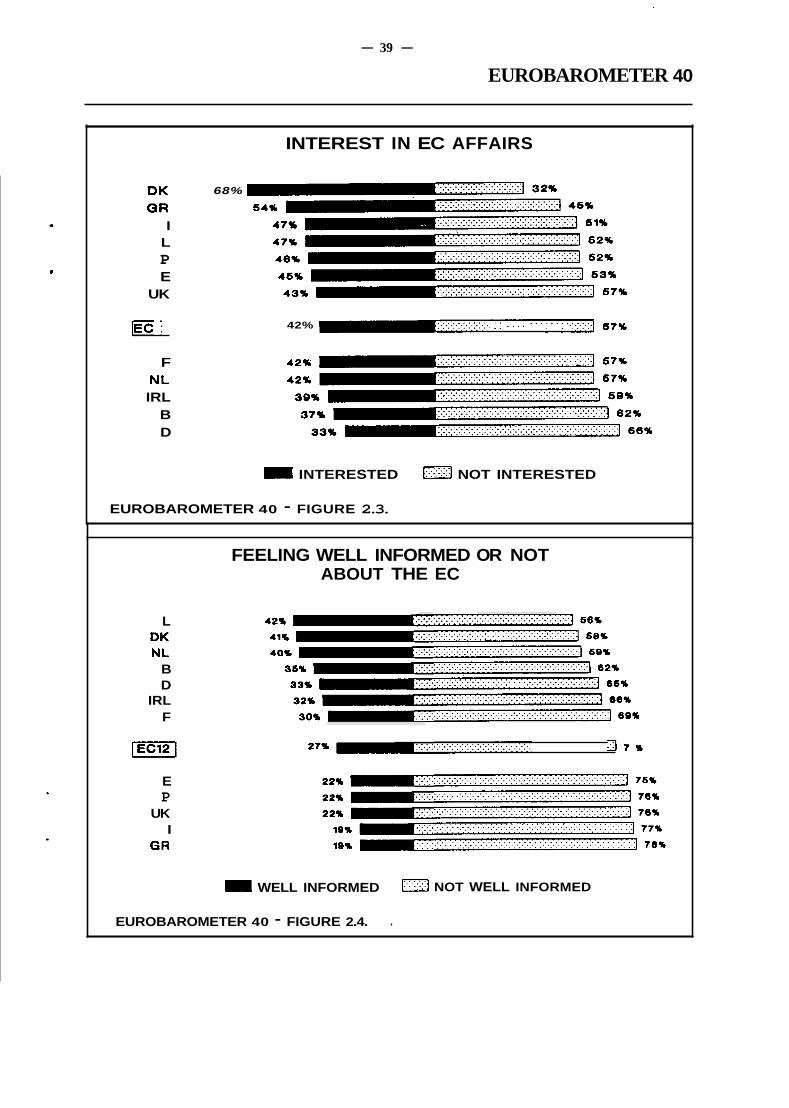
- 39 -
EUROBAROMETER 40
INTEREST IN EC AFFAIRS
DK OR
I L P E
UK
68%
. . . . . . . . . . . . . . . . . . . . . . . . . . . . . J 67n 42% '- . . . . . . . . . . . . . . . . . . . . . . . . . . . . . . . . . . . . . . . . . . . . ~ Ë E z J
F NL IRL
B D
= INTERESTED 0 NOT INTERESTED
EUROBAROMETER 40 - FIGURE 2.3.
L DK NL
B D
IRL F
E P
UK I
GR
FEELING WELL INFORMED OR NOT ABOUT THE EC
. . . . . . . . . . . . . . . . . . . . . . . . . . . . . . . . . . . . . . . . . . . . . . . . . . . . . . . . . . . . . . . 27n ~D . . . . . . . . . . . . . . . . . . . . . . . . . . . . . . . . . . "1 nn
= WELL INFORMED 0 NOT WELL INFORMED
EUROBAROMETER 40 - FIGURE 2.4. .

- 40 -
EUROBAROMETER 40
Many Southerners declare they "really need to know a lot more about the European Community" - Greeks (38% "lot more"), Portuguese (37%) and Italians (30%). At the other end of the scale, half of all Luxembourgers (50%) say they need no more information. At the EU average, about a quarter (23 96) say they would "need a lot more", 38 % "would like some more" and 28% "are happy with what they know". 11 % "don't know" (Figure 2.5, Table 27).
The profile of those that want more information are, in order of respective "average" results: (Table 28) students, self-employed, 15-24 year olds, opinion-leaders, those positive about Europe and those with higher education. News media usage, gender and income level seems to play little or no role
Those who perceive themselves as not well informed are twice as likely to want " information (27%) as those who feel well informed (14%) (Figure 2.6, Table 28). more difficult to interest those who are simply not interested in the issue of Eu in the first place. Here, substantially less of those not interested in European like "a lot more" or "some more" information (19% +30%) than those in place (28% +51%). And it is among the "not interested" that we find mo in favour of the EC/EU.
Nevertheless, a lot can be done starting with the 23% of people thirst information - representing some 62 million citizens of 15 years or mo Union.
Those who request "a lot more" or "some more" information were as which kinds of information they consider "very important" or not "v (Figure 2.7, Table 29) :
* 86% "very important" versus 12% "not very important" mation to simply help me understand better how the Eu what it does".
80 % versus 18 % to have " more specific information helping me as a citizen form my personal opinion on various European Community affairs or
70% versus 27% to have "more specific information helping me as a
53% versus 42% to have "more specific information helping me in
*
*
*
Full explanations of these definitions can be found in the h e x e s under "Technical specifi socio-demographic and socio-political voriables uscd in cross-tabulations".
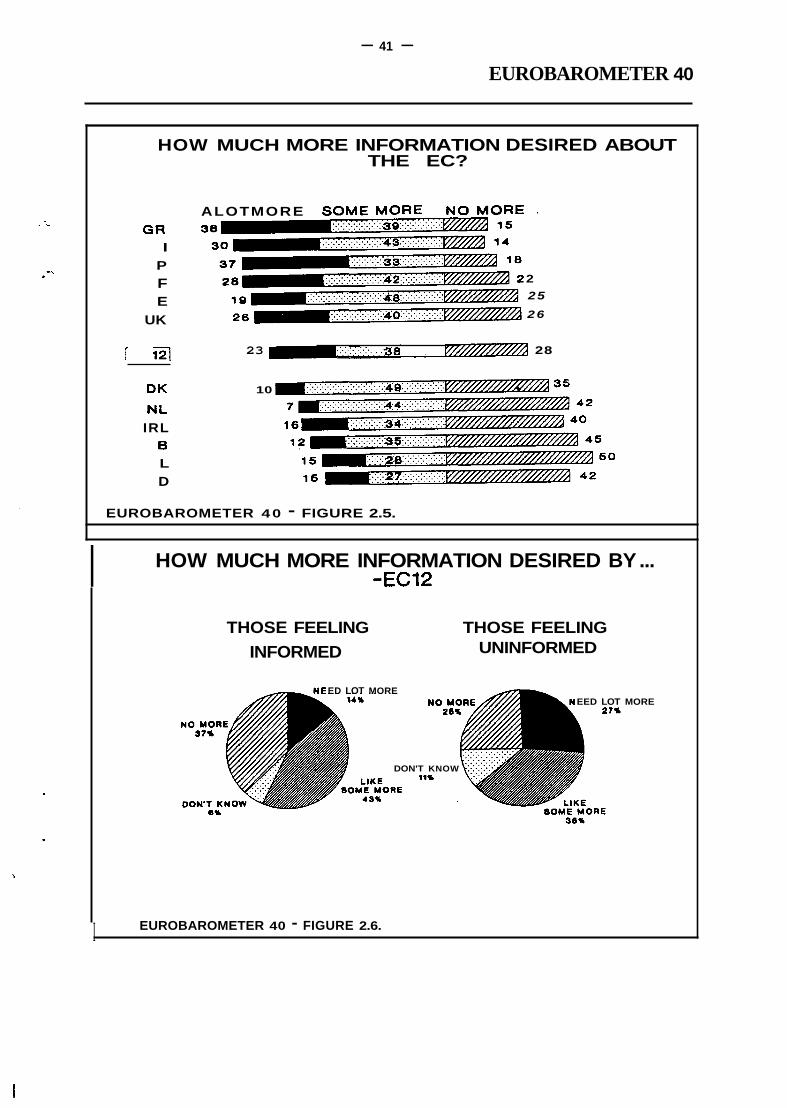
- 41 - EUROBAROMETER 40
HOW MUCH MORE INFORMATION DESIRED ABOUT THE EC?
ALOTMORE SOMEMORE NOMORE *
G R I
P F E
UK
2 25
26
lECIPl 23 9 3 8 28
DK 10
NL IRL
B L D
EUROBAROMETER 40 - FIGURE 2.5.
HOW MUCH MORE INFORMATION DESIRED BY ... I -EC12
THOSE FEELING THOSE FEELING UNINFORMED INFORMED
ED LOT MORE EED LOT MORE
DON'T KNOW
6U
I EUROBAROMETER 40 - FIGURE 2.6.
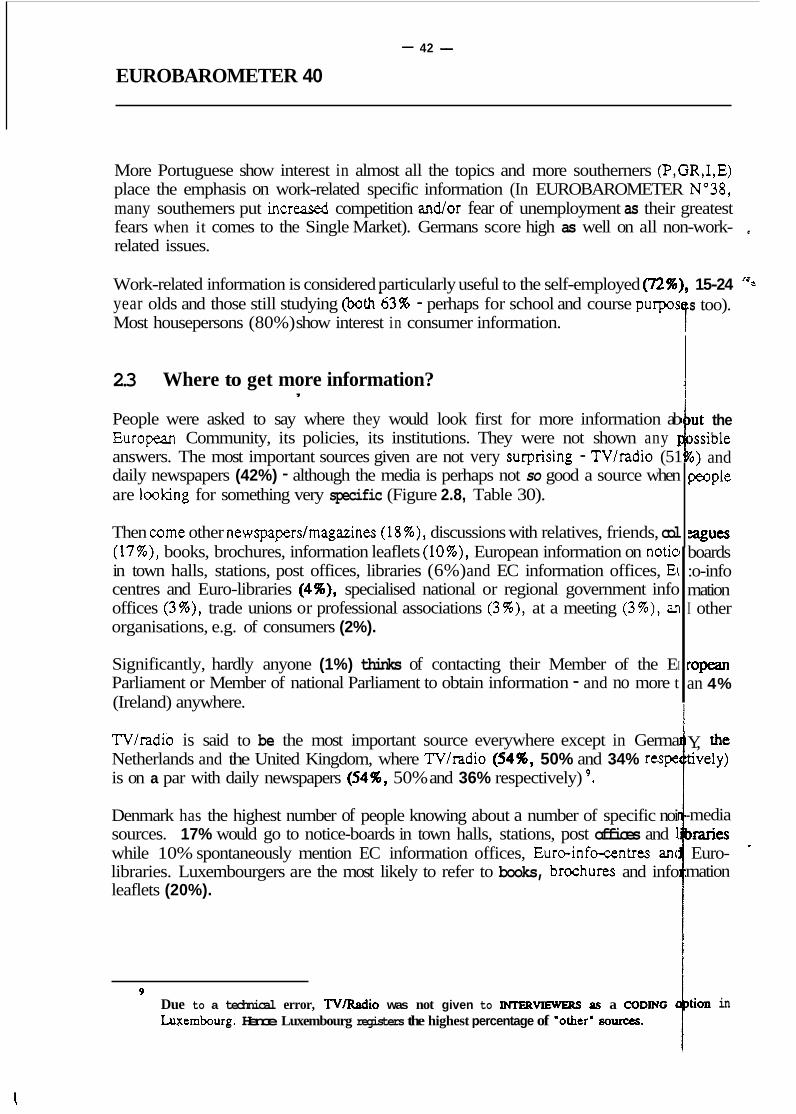
- 42 -
EUROBAROMETER 40
More Portuguese show interest in almost all the topics and more southerners (P,GR,I,E) place the emphasis on work-related specific information (In EUROBAROMETER N"38, many southemers put i n c d competition andor fear of unemployment as their greatest fears when it comes to the Single Market). Germans score high as well on all non-work- related issues.
Work-related information is considered particularly useful to the self-employed (72%), 15-24 year olds and those still studying (both6396 - perhaps for school and course purpos Most housepersons (80%) show interest in consumer information.
2.3 Where to get more information? ,
People were asked to say where they would look first for more information ab European Community, its policies, its institutions. They were not shown any I answers. The most important sources given are not very surprising - TV/radio (51 daily newspapers (42%) - although the media is perhaps not so good a source when are looking for something very specific (Figure 2.8, Table 30).
Then come other newspaperdmagazines (18%), discussions with relatives, friends, col (17%), books, brochures, information leaflets (lo%), European information on notia in town halls, stations, post offices, libraries (6%) and EC information offices, Ei centres and Euro-libraries (4%), specialised national or regional government info offices (3%), trade unions or professional associations (3%), at a meeting (3%), an organisations, e.g. of consumers (2%).
Significantly, hardly anyone (1%) thinks of contacting their Member of the EI Parliament or Member of national Parliament to obtain information - and no more t (Ireland) anywhere.
TV/radio is said to be the most important source everywhere except in Germa Netherlands and the United Kingdom, where TV/radio (5496, 50% and 34% respe is on a par with daily newspapers (5496, 50% and 36% respectively) '. Denmark has the highest number of people knowing about a number of specific noi sources. 17% would go to notice-boards in town halls, stations, post offices and 1 while 10% spontaneously mention EC information offices, Euro-info-centres anc libraries. Luxembourgers are the most likely to refer to books, brochures and info leaflets (20%).
' Due to a technical error, TV/Radio was not given to INTERVIEWERS as a CODING 4
kernbourg. Hence Luxembourg registers the highest percentage of Iother' sources.
s too).
but the mible 6 ) and people
EagUeS boards :o-info mation I other
ropean an 4%
Y, the tively)
-media braries Euro- *
mation
>tion in
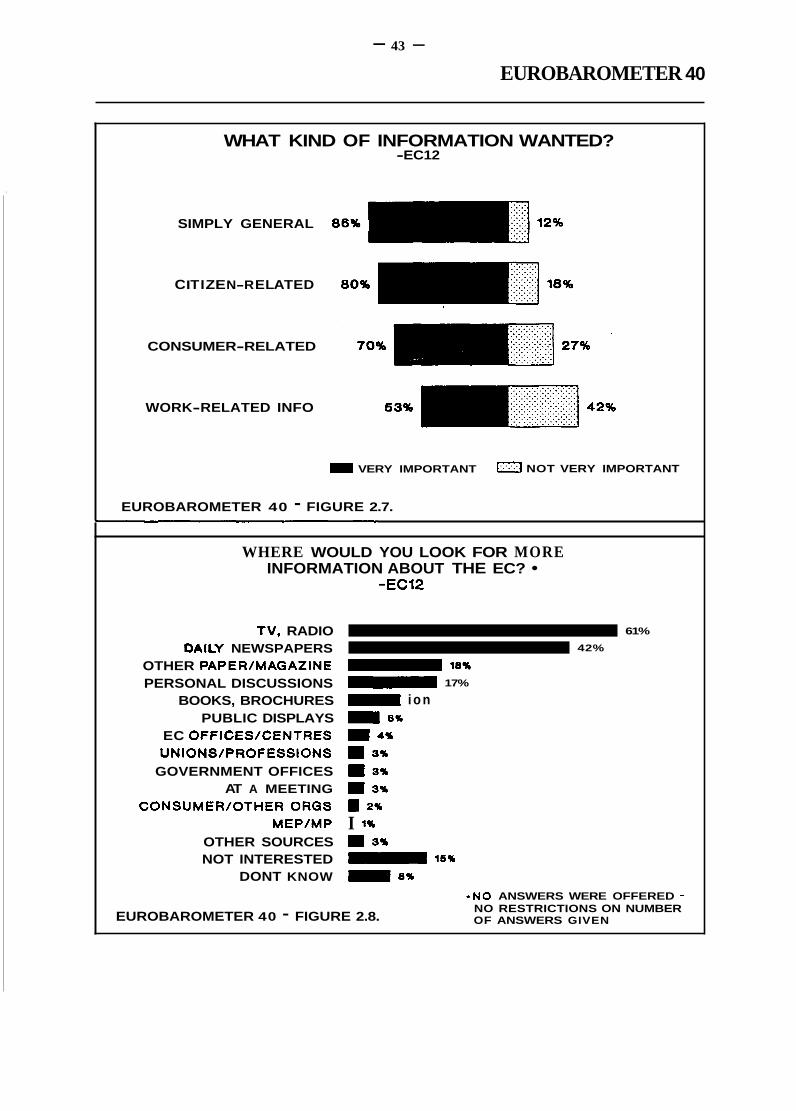
- 43 - EUROBAROMETER 40
WHAT KIND OF INFORMATION WANTED? -EC12
SIMPLY GENERAL
C I TI ZE N-R E LAT E D
CONSUMER-RELATED
WORK-RELATED INFO
= VERY IMPORTANT 0 NOT VERY IMPORTANT
EUROBAROMETER 40 - FIGURE 2.7.
WHERE WOULD YOU LOOK FOR MORE INFORMATION ABOUT THE EC?
TV, RADIO DAILY NEWSPAPERS
OTHER PAPEWMAGAZINE PERSONAL DISCUSSIONS
BOOKS, BROCHURES PUBLIC DISPLAYS
EC OFFICES/CENTRES UNIONS/PROFESSIONS
GOVERNMENT OFFICES AT A MEETING
CONSUMER/OTHER OROS MEPIMP
OTHER SOURCES NOT INTERESTED
DONT KNOW
-EC12
61%
42% - 18% - i o n = 6%
œ 4%
m 3% m 3% m 3% I 2%
I 1%
m 3% - 16%
œ 8%
- 17%
*NO ANSWERS WERE OFFERED - NO RESTRICTIONS ON NUMBER OF ANSWERS GIVEN EUROBAROMETER 40 - FIGURE 2.8.

- 44 -
EUROBAROMETER 40
One in five in France (21 %) and the United Kingdom (22%) say they are not interested and would never look for such information, the highest "total rejection" rates in the Union.
EU citizens were asked whether they know of any institutions and organisations which have specialised departments offering detailed information about the European Community or about specific EC issues. 82% say they have never heard of such services. 15% say they have heard of them but could not say which, while just 2% could give a specific answer (whether it was correct or remains to be analysed) (Figure 2.9, Table 31).
Danes once again prove themselves by far the most well-informed. 41 % say they have heard of such a service and 13% of the whole sample could name their source. The next ighest result is in Luxembourg where a quarter (26%) know about such information servi s, yet
The most ill-informed about such services Seem to be the British (87% not heard), b t they have by no means the lowest result in naming the source specifically (4%). That p 'de of place goes to 1% of Spaniards, Italians and Portuguese, among the thirstiest fo more
only half as many as the Danes could name their source (6%).
information but, it seems, largely unable to find it satisfactorily.. . . .
d i
I
2.4 Who should provide the information ?
Apart from the omnipresent media, providing information about the European Union be the business of a lot of organisations, both governmental and non-governmental, fr m the local to the European level. Where do EU citizens feel the main responsibility of inf rming
Over half of EU citizens (54%) thinks that job lies primarily with national gove ments (54%). This is the preferred source for most people in all countries, ranging from 4% of Danes and 73 % of Greeks to 41 % of both Belgians and Germans (Figure 2.10, Tab 32).
Schools and universities come next (30%), the second choice of people in all mun s too, although the result is tied with the European Commission in Denmark, Spain, France d the
them lies ? (Multiple answers were permitted from a list of options.)
United Kingdom. lo
The European Commission comes third (24 W), closely followed by local autho the European Parliament (21 %) and regional authorities (20%). 7% say it shoul the list, media would cover it sufficiently. 10% don't know. If the European result is added to that of the European Parliament, "European institutions" com
The European Commission is seeking more cooperation with national gove information field. This result provides strong support for such an approach.
i l
l
lo Exceptio~lly, the Portuguese choose regional authorities next (39%). followed by local (34%), clearly expressing a desire to keep communication on the issue primarily within of their own country.

- 45 -
EUROBAROMETER 40
~~~~ ~
AWARENESS OF SPECIALISED AGENCIES GIVING EC INFORMATION
YES - CAN'T RECALL WHICH YES - SPECIFIC ANSWER
. . . . . . rxez-1- . . . 17%
EUROBAROMETER 40 - FIGURE 2.9.
WHO SHOULD PROVIDE EC INFORMATION?
NATIONAL GOVERNMENT
SCHOOLS/UNIVERSITIES
EUROPEAN COMMISSION
LOCAL AUTHORITIES
EUROPEAN PARLIAMENT
REGIONAL AUTHORITIES
NONE OF THE ABOVE
DONT KNOW
-EC12
,- 54% - 30% 24% - 22%
21%
20%
m '%
10%
EUROBAROMETER 40 - FIGURE 2.10.

- 46 - EUROBAROMETER 40
2.5 New possible ways of communicating
Two possible ways of communicating messages and information directly from institutions to people (as opposed to indirectly via media and other redisseminators) were tested on the EU's general public.
The first is the idea of a telephone "hotline" which would provide information about "European Community issues, policies and regulations". "Hotlines" are occasionally used to inform people about the European Union, such as in Belgium during the time of its Presidency in 1993, and in Sweden in the current run-up to its probable 1994 referendum on joining the European Union if negotiations succeed.
The application of this initiative everywhere within the Union has the backing of citizens who find it a "good idea". 28% find it "not a good" idea while 13% " (Figure 2.11, Table 33).
Almost three-quarters of information-starved Portuguese (74%) and Greeks ( good idea. Only many among the more knowledgable Danes are lukew idea"; 45% "not good idea").
But would they use it themselves ? Well, apparently many would, ranging from an half of all Greeks and Portuguese (49% - but, for the Portuguese, only half that if it wasn't for free) to around a quarter of Danes (27%) and Dutch (25% third (37%) say they would dial - and a fifth (20%) would do so even if it say they would not use it even if they think it a good idea.
Obviously, good intention is often far from practice and the results of thi treated with a certain amount of caution. Nevertheless, there seems the telephone number(s) are made well known.
Tax-payer financed television advertising about the European Union is al EU citizens might find helpful in fulfilling some of their information needs. This many forms, from a simple indication of hotline telephone numbers, for instance blown public service style explanations of certain key issues, obviou interesting and stimulating way. Television advertising of European U occasionally already - witness the animated logo on the "European Y and Health" at the workplace which a p p e d recently on the Euronews chann occasional full-blown campaign such as the one on the Single Market " 1992" unde the UK Department of Trade and Industry.
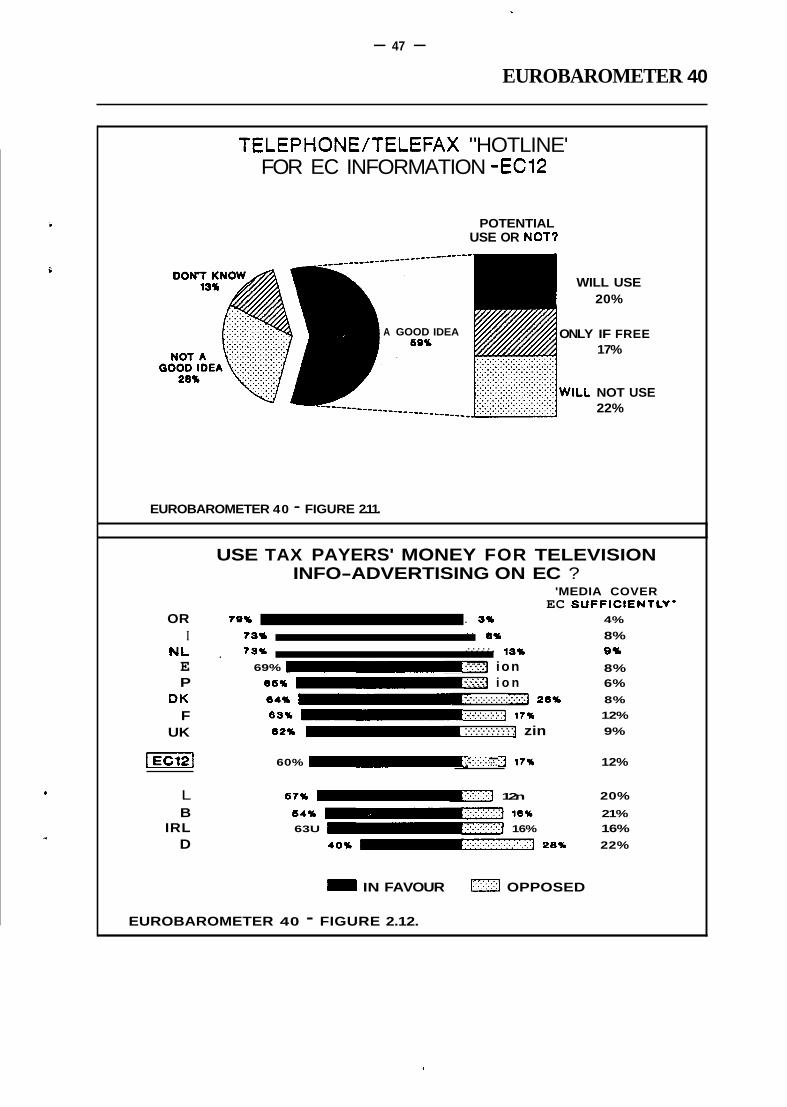
- 47 -
EUROBAROMETER 40
TELEPHONE/TELEFAX "HOTLINE' FOR EC INFORMATION -EC12
POTENTIAL USE OR NOT?
WILL USE 20%
ONLY IF FREE 17%
A GOOD IDEA
WILL NOT USE 22% ------______
EUROBAROMETER 40 - FIGURE 2.11.
USE TAX PAYERS' MONEY FOR TELEVISION INFO-ADVERTISING ON EC ?
'MEDIA COVER EC SUFFICIENTLV'
OR 702 . 3n 4%
7an 6% 8% 0% 73n . . . . . 132
8% NL .
. . . . . . . . . .. I
.... . . . . E 69% - . . . . i ion . . . . P 66n - . ' . .... i o n 6%
DK tun !v.. . . . . . . . 7 zon 8%
63n I-, : : : : : : : : I i ~ n 12%
822 -, . . . . . . . . . . j zin
. . . . . . . . . . . . . . . . . . . . . . . . ....... . . . . . . . . . . ......... 9%
F UK
. . . . . . . IEC12I 60% 1-b'. . . . . . . . . ..'.'.', '. .I 17U 12%
L 6 7 1 J-f 12n 20%
B 64% - ien 21%
D don -1 262 22% IRL 63U - y j 16% 16%
= IN FAVOUR [ml OPPOSED
EUROBAROMETER 40 - FIGURE 2.12.
- 48 - EUROBAROMETER 40
60% of EU citizens support public authorities buying time on television to give information about the European Community, its institutions, policies and regulations. 17% are opposed. 12% say spontaneously that there is no need to buy airtime because the media covers EU Issues sufficiently. 11 % "don't know" (Figure 2.12, Table 34). Again, we see this as an indicator for the suspicion of the "orientation gap" being bigger than the "information deficit" Y such, in many cases.
5
Those who most support the idea are southerners - the majority of Greeks (79%), Italians c13%), Spaniards (69%) and Portuguese (65%) - as well as the Dutch (73%). Absolute m;ljoritie~ are in favour of the idea everywhere except Germany, where the 40% supporting the proposed initiative are outnumbered by the combination of those who oppose (28% and those who say spontaneously that the media cover the issue sufficiently (22%). The atter snument is also expressed by significant percentages of Belgians (21% "media cov I rage sufficient") and Luxembourgers (20%).
~
i 2.6 Trends in media use i
i The EUROBAROMETER has tracked news media usage in the European Community on for over thirteen years - and regularly since Spring 1991. With the topic 'information deficit" hot on the Union's agenda, it is time to look at its citizens' ove media usage to know the nature of their chief information consumption on the Union and other topics as well as to see how it is - or is not - changing.
Of the three media measured - television, daiiy newspapers and radio - only consu television news has shown a significant increase in everyday use at the EU level. 6096 of EC citizens said they watched the news on television everyday. By Sprin had reached 69%, where it has roughly stayed (70% in Autumn 1993) (Figure 2.13).
The use of radio as a source of news appears to be declining gradually. In 1980,4 citizens said they listened to radio news everyday and this dropped to 42% in Aut This very gradual decline has led to newspapers marginally overtaking radio since 1991 as a more important source of information about what is going on (44% "eve usage).
Germans are the most frequent news consumers in the European Union (hence views of many of them that television advertising about the EU is superfluous). (and indeed 72% of East Germans) are defined by the EUROBAROMETER users (consume news from each of l'V/radio/daily papers every day or week)ll, almost double the average number of high media users for the a whole (37%). Danes are aimost as high (61%). Southern EU Spain (21 %), Italy (21 %) and Greece (25 %) and including smallest percentage of high media users (Figure 2.14).
Full explanations of these definitions can be found in the Annexes under "Technical specificati0 sociodemographic and socio-political variables used in cross-tabulations" .
for t

- 49 -
EUROBAROMETER 40
.
80%
70%
60%
60%
40%
30% EB*
NEWS ON MASS MEDIA 1980 - 1993 96 *EVERYDAY USERS -EC12
....................................................................................................................................................................................
70% ..................................... ..T.V .........
............................. R.A.DI.0 .............................................................................................................
1 19 26 31 35 36 37 38 39 40 YEAR 80 83 86 89 81 81 92 92 93 93
EUROBAROMETER 40 - FIGURE 2.13.
NEWS O N MASS MEDIA 1993 FREOUENCY O F USE INDEX
Dto) 0
D(W) DK
L IRL NL UK
6
p l F
OR I
E P
O 20 40 60 80 1 O 0 FREOUENCY OF USE = +++ Egg# ++ g3g -- = ---
v. LOW V. HlQH HIGH LOW
EUROBAROMETER 40 - FIGURE 2.14. SEE ANNEXES FOR DEFINITIONS

- 50 -
I The supremacy of television news is almost universal (Table 35). It is watched the most in Italy (81 % "everyday"), the Netherlands and the United Kingdom (both 78%) and the least in France (57%). Only in Denmark is radio news more popular (71 % radio "everyday"; 66% television "everyday") while in Luxembourg television news is on a par with radio (both 67%). Throughout the European Union, 70% watch television news "everyday".
Then come daily newspapers (44%), narrowly ahead of radio (42%). Along with Denmark and Luxembourg, radio is more important than daily newspapers in Belgium, Greece, Spain, France, Ireland and Portugal. Daily papers beat radio news in everyday usage in Germany, Italy, the Netherlands and the United Kingdom.
It is noticeable how dependent southemers are on television news for their in Although more than half their populations watch television news everyday, less in almost all cases listen to radio news and read daily papers everyday (only Spaniards when it comes to the radio: 36%). The French are also in little better sh daily papers; 37% radio news). As daily papers are undoubtedly the most d of current affairs among the three media, the fact that only 15% of Portugu daily paper readers must be a major contributory factor to the EU informa country.
Spring 1991 was the first time media use pattems were tracked in bo Germany. Everyday usage of radio, television and newspapers for news ha higher in East Germany than in the West, particularly when it comes to ne Everyday usage of all media is currently 8-10% higher in the East than the West. their own, East Germans are the highest consumers of daily papers Union (70%), the third highest when it comes to radio news (64%) and news (75%).
There was a rise in the numbers watching television news everyday at the Community level between 1980 (60%) and 1983 (68%). Despite this, there was an drop in everyday Danish usage from 71 % to 60%. Denmark went then from ha highest number of everyday television newswatchers to having the it is on a par with Belgium, Spain and Luxembourg (6547% "everyday"), with only (57%) and Portugal (60%) lower. Radio listenership in France has also shown a decline. In 1980,63% said they listened to radio news everyday, whil did. In 1986 the respective figures were 50% and 22%; and now 37% and 19%.
Biggest mass media news consumers are opinion-leaders (53 %), high and those who finished their studies later (46%). They are more like1 group (41 %) and be male (41 %) rather than female (34%). Studen users (27%) (Table 36).
2
5
- _
J
w

- 51 -
EUROBAROMETER 40
I Throughout, opinion-leaders are above-average cmsumers of television news (79 % versus 70% EU average), daily papers (59% versus 44% EU average) and radio (55% versus 42% EU average).
If a brief socio-demographic analysis is made by the three separate media, some differences emerge flable 37) :
Television news-watchers are much more likely to be the old (55+ age group: 83%) than the young (15-24 age group: 55 % , including students at 53 96) and the less- (76 %) rather than
more narrow between men (72%) and women (68%) when it comes to television watching.
Everyday daily newspaper readers are more likely to be male (50%) than female (40%), older rather than younger (40+ age group: 52 96 ; 15-24 age group: 28 %, including only 24 % of students); more (53%) rather than less educated (41 %) and have a high (54%) rather than low income (36%).
The differences between everyday radio listeners are less striking: Slightly more males (45 %) than females (40%), older (40+ age group: 46%, versus 15-24 year olds: 35%, including 31 % of students), high (51 %) rather than low (39%) income earners and more (49%) rather than less educated (40%).
6 well-educated (69%). There is little difference when it comes to income levels. The gap is

- 52 -
EUROBAROMETER 40
c
. ,I
'9
1
i i
I
i
t
i
- 53 -
EUROBAROMETER 40
3. EUROPEAN POLICY AREAS
3.1 Awareness of key EU issues
The European Union continued to be a major media issue during the second half of 1993 Not only was the European Community finally transformed on 1st November inlo th European Union after Germany’s long-running constitutional court battle had finally bœm resolved, leading quickly to the end of the ratification process of the Maastricht Treary. Negotiations leading to a General Agreement on Tariffs and Trade (GAlT) stalled as Ou European Union and the United States remained deadlocked on key questions until dmœt the final deadline. The Common Agricultural Policy (CAP) is by far the most sigruficrnt element of the European Union’s budget. It’s reform caused much controversy with intcnw lobbying against it by farmers from certain European Union member countries, vexing European politicians greatly. The failure to solve the crisis facing former Yugcnlanr continued to be a heavy burden on the collective conscience of the European Union. Less dramatic, but no less significant, has been the gradual impact of the Single Market on thc lives of ordinary European Union citizens since its arrival at the beginning of 1993.
.
’
- 54 -
EUROBAROMETER 40 .
At the time of the fieldwork for EUROBAROMETER No. 40 (October 1993), the most significant issue in the media as obsemed by the EU general public is still the Maastricht Treaty (Figure 3.1, Table 38). Three quarters (7496) of EU citizens say they have heard or read about it recently. This issue is the most prominent one in the Netherlands (90%), Belgium (82%) the United Kingdom (81%), Ireland (79%) and Greece (74%).
'
At the EU level, the Single Market (68%) is next, followed by the EC's peace e: former Yugoslavia (a%), GATI' (52%) and CAP reform (51%). In each case mc half the EU's citizens say they have heard or read about it.
The most significant issue in France at that time is GATT (86%). For many Dana Luxembourgers (85%) and Italians (68%), it is the war in former Yugoslavii Portuguese reckon it is the Single Market. Germans are split between the Single (77%) and Maastricht (76%) - similarly Spaniards between Maastricht (66%) and thl former Y ugoslavia (65 %) . If one averages out the results for all five issues, the people who seem to hear or 3
most about what is going on in the European Union are Danes (77%), followed clc the Dutch (76%), French (75%) and Luxembourgers (73%). Those apparently least i appear to be southerners - Italians (51 %), Spaniards (55%) and Greeks (56%) - neve still more than half seem aware of the issues on average.
8 3.2 Maastricht
As has been seen, Maastricht continued to hit the headlines right until the end ratification process. What is the final scorecard of those for or against the Treaty?
If those undecided are excluded, at the end of the day majorities in al l countries but favourable towards the Treaty. The only exception is the United Kingdom (39% f< against). More than three-quarters of those giving an opinion support the TreaQ Netherlands, Greece (both 86%), Italy (83%), Spain (78%), Belgium and Ireland (boi (Table 39). Overall, 64% are for, 36% against the Treaty.
On this measure, two out of the three countries that held referenda - France and Dc as well as the United Kingdom, where the subject of holding a referenda was hotly but rejected - have the greatest percentage of people expressing an opinion rejec Treaty. After having voted for the Treaty with a large majority in their referendum quarters of Irish citizens holding an opinion continue to support "Maastricht".
If one takes the "undecideds" into account, the picture inevitably becomes less clear 3.2). 39% are for the Treaty, 22% against and 39% do not know. There are i
majorities in favour only in the Netherlands (61%), Greece (55%) and, signi1 Denmark (52% where those "undecided" are by far the fewest at 9%).
c orts in .e than
:88 %) , Most
wlarket war in
ad the
tentive theless
d y by
of the
me are ; 61% in the
I 75%)
imark, ebated . ng the three-
Figure ls0lUte
9
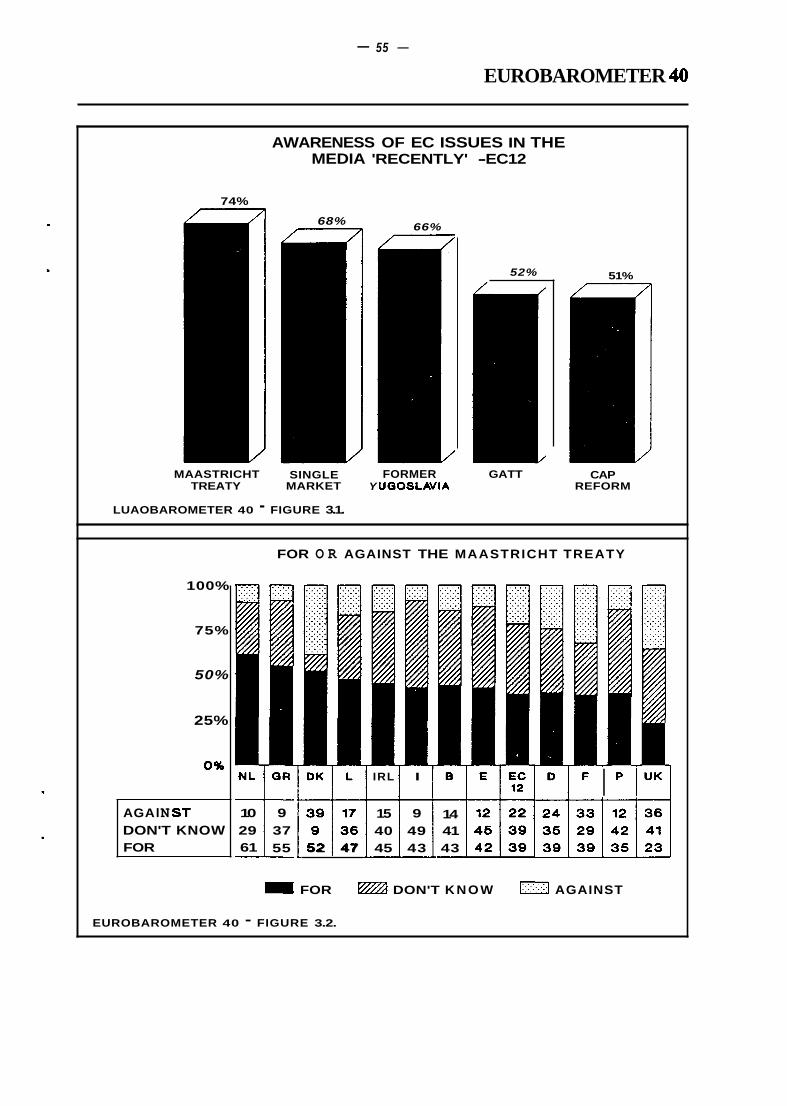
- 55 -
EUROBAROMETER 40
AWARENESS OF EC ISSUES IN THE MEDIA 'RECENTLY' -EC12
74%
68% I
MAASTRICHT TREATY
SINGLE MARKET
LUAOBAROMETER 40 - FIGURE 3.1.
66%
52% 51%
FORMER GATT Y UGOSLAVIA
CAP REFORM
100%
75%
50%
25%
0%
AG Al N ST DON'T KNOW FOR
NL
10 29 61 -
FOR O R AGAINST THE MAASTRICHT TREATY
GR
- 9
37 55 -
~1~ 52 47
IRL
15 40 45 -
I
9 49 43 -
8
14 41 43 -
I l u u
= FOR @ DON'T KNOW 0 AGAINST
EUROBAROMETER 40 - FIGURE 3.2.

- 56 -
EUROBAROMETER 40
Those undecided are the most numerous. in a number of southern countries: Italy (49%), Spain (45%) and Portugal (41%). With the very notable exception of Denmark (9%), nowhere else are there less than 29% undecided.
It is again in southern countries that there is the least opposition to Maastricht - Greece, Italy (both 9%), Spain and Portugal (both 12%) - as well as The Netherlands (10%). - Looking now at some of the key issues of the Treaty which are in the process of being implemented by the European Union, we find broad support for many of the provisions of "Maastricht", namely (Figure 3.3, Table 40) :
* By 77% in favour to 14% against, that EC member states should work towards a common defence policy. Seven out of ten'* are in favour everywhere*except neutrality-minded Ireland (still two-to-one in favour) and Denmark, where divided on the issue (47% for; 48 96 against).
I
* By 71% to 1896, that any citizen of another EC country who COUNTRY) should have the right to vote in European elections.
By 69% to 17%, that the Member States of the European one common foreign policy towards countries outside
should have the support of a -ority in the they should resign. Absolute majorities of
By 66% to 1096, that the President and the
majorities of at least two-to-one endorse this (Figure 3.4).
*
(Union). Absolute majorities are in favour everywhere.
*
everywhere.
* By 64% to 2496, that there should be a European Monetary Union ith a
inflation. People are more than two-to-one in favour in most countries. On1 in the European Central Bank pursuing a policy of monetary stabity, that is
United Kingdom are less than half in favour (45 96 for: 41 % against) F- !
l2 The level of Irish support for common defence depends very much on how the question is Question-wording reminding the Irish of their 'neutrality' often produces a more negative, response. Most also prefer ~ t i o ~ l governmnts to handle security and jointly at the European Union level (see Chapter 3.3).

- 57 - EUROBAROMETER 40
COMMON DEFENCE
VOTE EP ELECTIONS
COMMON FORGN POLICY
COMMSSN NEEDS EP-MAJ
CENTRAL BANK
CANDID. EP ELECTIONS
EUROPEAN GOVERNMENT
SUBSIDIARITY
SINGLE CURRENCY
VOTE LOCAL ELECTIONS
EP EQUAL RIGHTS
CANDID. LOCAL ELECS.
FOR O R AGAINST: -EC12
= FOR AGAINST
EUROBARSMETER 40 - FIGURE 3.3.
FOR OR AGAINST: EU NON-NATIONALS VOTE AT EP ELECTIONS
NL 83% -u .', 12%
I 78% 1- 1 0%
IRL 76% 1-7 7%
F 73% ~- 1 21%
IËEq 71% 1- ] 18%
E 70% 11%
6 70% -;_._.'..'...I 20%
UK 69% 1- 1 222
P 65% ~-- 1 16%
D 66% i- 21%
DK 64% q j 32% GR 602 ~- . J 26%
L 67% i-. , . . . . . , _ . .j 26%
= FOR n AGAINST
EUROBAROMETER 40 - FIGURE 3.4.

- 58 -
EUROBAROMETER 40
* By 61% to 25%, that any citizen of another EC country who resides in (OUR COUNTRY) should have the right to be a candidate in European elections. This is supported by absolute majorities from all countries, although opposition from a sizeable minority exists in France (50% for; 42% against) and Denmark (54% for; 41% against).
J
* By 56% to 16%, that the European Community should have a Eu1 Government responsible to the European Parliament and to the Eu1 Council of Heads of national government. Majorities are at least two-to support everywhere with the exception of Denmark, where a relative major against (34% for; 47% against) (cf. supra, page 30, for similar question reference to the European Council).
* By 56% to 21%, that the Euro+ Community should be responsible OI matters that cannot be effectively handled by national, regional and governments. This principle of subsidiarity has two-to-one support every1 Danes are substantially more supportive (73% for:16% against) of this than from any other country.
* By 5 1 % to 38%, that there should be a European Monetary Union with one currency replacing by 1999 the (NATIONAL -CY) and all other LU currencies of the Member States of the European Community. This is thc intensely debated in the media of some Member States that divides the EU present time - nine countries have absolute majorities in favour while in the ren three (Germany, the United Kingdom and Denmark) have absolute majorities i it (Figure 3.5).
* By 47% to 40%, that any citizen of another EC country who resider ia COUNTRY) should have the right to vote in local elections. Absolute majont in favour in Ireland, the Netherlands, Spain, Portugal and Italy. In F m Germany, people are divided. Majorities are against in Greece, Denmark, the 1
Kingdom, Luxembourg and Belgium.
By 45% to 20%, that, in matters of EC legislation, taxation and expenditui European Parliament should have equal rights with the Council of Ministm crucial constitutional question receives a high "don't know" rate of 35% b "taxation" is mentioned". Now majorities are in favour everywhere Denmark, which is divided on the issue (33% for; 36% against).
*
l3 In earlier surveys with "legislation" only mentioned, a majority was in favour. Cf. EB 38 difference of results when each version of the question was asked at different moments interview.

- 59 -
EUROBAROMETER 40
QR ' IRL
L
B
E
P
F
NL
SINGLE EUROPEAN CURRENCY
. . . . . . . I 80% - ...... . :::.1 19%
D UK DK
. . . . . . . . . . . . . . . . . . . . . . . . . . . . . . . . . 3896 51% 1- . . . . . . . . . . . . . . . . . . _ _ . . . . . . . . . . . . . I
. . . . . . . . . . . . . . . . . . . . . . . . . . . . . . . . . . 168% 32% - . . . . . . . . . . . . . . . . .
27% m... . . . . . . . . . . . . . . . . . . . . . . . . . . . . . . . . . .
26% 0 . . . . . . . . . . . .
. . . . . . . . . . . . . . . . . . . . . . . . . . . . . . . . . . . . . . . . . . . . . j 63% . . . . . . . . . . . . . . . . . . . . . . . . 1 6 9 % . . . . . . . . . . . . . . . . . . . . . . . . . .
= FOR 0 AGAINST
EUROBAROMETER 40 - FIQURE 3.5. I
"NET APPROVAL" OF SINGLE EUROPEAN CURRENCY - DK, D, UK, EC12
30% "'t 1
- 20% - -30%
- 4 o u - -40%
-
- 40%
- 30%
1- EC12 20% -
- 10%
0%
- -10%
- - 20%
-30%
I I I I I -60% I ' - 5 0 % EB# 36 35 36 37 38 39 40
YEAR 90 91 91 92 92 93 93
EUROBAROMETER 40 - FIGURE 3.6.

- 60 -
EUROBAROMETER 40
* and finally REJECTED by 47% "against" to 39% "in favour", that any citizen of another EC country who resides in (OUR COUXWRY) should have the right to be a candidate in local elections. This proposal only finds favour among a majority of people in three countries - Ireland, Spain and Italy. The Dutch are divided (47% for; 46% against) while majorities everywhere else are against, especially most Danes (63% against)14, Luxembourgers and French (both 62%).
The single currency has been a growing problem for the EU over the past three Although as a whole, a majority of EU citizens have always backed the idea of i currency by 1999, the size of the majority has slowly been reduced. Although then time when there were majorities supporting an EU-wide single currency in Ge Denmark and the United Kingdom (especially Spring 1991), doubts have been getting there (Figure 3.6). By contrast strong support for it does exist in all other countries
By no means do all countries in the European Union have to subscribe to Monetary for it to happen (the United Kingdom and Denmark have an opt-out clause): neverth is inconceivable at present that this process can happen without full German gove backing ", which cannot easily happen without backing from its own public. The d to establish the headquarters of the new European Monetary Institute in Frankfurt ha just after the end of fieldwork for EUROBAROMETER No. 40. The impact of this d on German confidence in the single currency - if any - remains to be measured in surveys.
3.3 Subsidiarity: national and EC policy areas
As we have just seen, there is substantial support in principle for subsidiarity - that de making should take place at the level of the Union "...only if and in so far as the obj of the proposed action cannot be sufficiently achieved by the Member States a therefore by reason of Scale or effect of the proposed action, be better achieved Community" (Maastricht Treaty, Article 3B).
In this area, the EUROBAROMETER has for some time measured EU public prefere a number of key policy areas to be handled by either at the EU or governmental leve public has clear preferences in this regard, as can be seen by the following results I 3.7, Table 41) :
l4 Althoughnon-Danish citizens residing in the country for a defined period of years .enjoy this ril many years already - whether they originate from other EU Member States or from elsewhe
lS The German government will need the approvd of Parliament before the country can join currency.
:
,ears * ìingle N ~ I S a lany 9
'eater
Jnion ess it ment ision ened ision uture
sion- :tiva
I the can
e for The
igure
SinCe
single
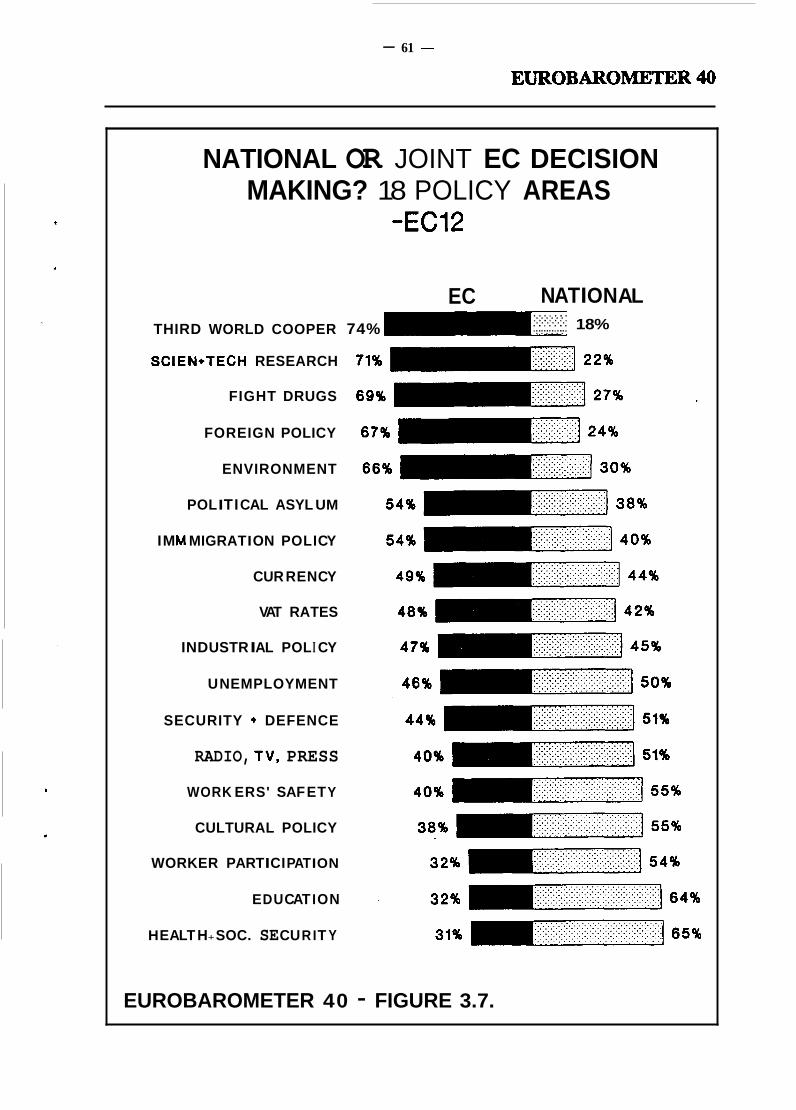
- 61 -
EUROBAROMETER40
NATIONAL OR JOINT EC DECISION MAKING? 18 POLICY AREAS
-EC12
NAT I ON AL . . . . . . . . . . . . . . . . . . . . . . . . . . . . . . . . .
EC . . . . . . . . . . . . . 18% THIRD WORLD COOPER 74% . . . . . .
SCIEN+TECH RESEARCH
FIGHT DRUGS
FOREIGN POLICY
ENVIRONMENT
POL I TI CAL ASYL UM
IM M MIGRAT I ON PO LI CY
CUR REN CY
VAT RATES
IND U STR I AL POL I CY
UN EMPLOYMENT
SECURITY + DEFENCE
RADIO, TV, PRESS
WORK ERS' SAF ET Y
CULTURAL POLICY
WORKER PART I CI PAT I ON
E D U CAT I O N
H E ALT H + SOC. SE CU RI T Y
EUROBAROMETER 40 - FIGURE 3.7.

- 62 - EUROBAROMETER 40
MOST WANT "HE EUROPEAN UNION TO MAKE DECISIONS IN THE FOLLOWING AREAS:
Tbe frrst percentage relates to areas seen as the responsibility of the Union, the second tbe percentage who believe the issue should be handled by national governments:
'
e
e
9
e
9
*
4
COOPERATION WlTH DEVEIDPING COUNTRIES, Third World, by 74% to 18%. Absolute majorities are in favour of Union action everywhere, from 79% of I*ans, French and Dutch to 56% of Greeks. i
SCIENTIFIC AND TEcHNOLoGICAL RESEARCH, by 71% to 22%, from a high of of French, Luxembourgers and Dutch to 65 % of Germans, including 73 % of D
THE FIGHT AGAINS DRUGS, by 69% to 2796, from 77% of Dutch Spaniards.
FOREIGN POLICY TOWARDS COUNTRES OUTSIDE THE EUROPEAN C to 24 % , with absolute majorities in favour everywhere, but only a narro in favour in Greece (47 96 EU; 43 % national). Greece is increasingly many EU Member States conaming the issue of recognising the F Republic of Macedonia, a factor which may strengthen a more national attitude on foreign policy issues towards non-EU countries (such as al Cyprus and Turkey) among its citizens than is the case in many other
PROTECTION OF THE ENVIRONMENT, by 66% to 30%, with absol favour everywhere, from 82 % of Dutch to 5 1% of the Irish.
RILES FOR POLITICAL ASYLUM, by 54 % to 38 % , with most Danes ( (4054) preferring that this matter be handled by national govemme being divided on the matteP.
IMMIGRATION POLICY, by 54% to 4096, with most Danes (3858 (4051) and British (3450) believing it should be in the governments and both the Greeks and Irish divided on the subject.
CURRENCY, by 49% to 4496, with results not very dissimilar to those discussed - majorities in favour of the EU handling the issue this time countries, with Danes and Portuguese divided, most Germans unhappy (42. most British resolutely against (25:70) the EU dealing with it. This question refer to a single currency replacing national currencies by 1999 much soften opposition to the EU handling the issue in Denmark at any rate.
out of intergovemmental cooperation in "atters of legal and domestic, in particular police l6 ~n interesting d t , not very diffeteat fiom earlier muveys. in view of the h t , tbnt D-

- 63 -
EUROBAROMETER 40
* RATES OF VAT (Value Added Tax), by 48% to 42% with majorities from four countries preferring to give the job to national governments - Denmark (43:52), Greece (30:57), Luxembourg (4153) and Portugal (3151).
. * INDUS- POLICY, by a narrow 47% to 45% with most people from seven countries (B,GR,F,IRL,I,L,NL) backing the EU’s role and the remainder the national governments’ (DK,D,EP,UK). Most East Germans back the EU’ role (51:43) while West German results exactly mirror the East German view but in favour of national governments (4351).
MOST WANT NATIONAL DECISION-MAKING IN THE FOLLOWING AREAS:
The first percentage relates to areas seen as the responsibiiity of national governments, the second the percentage who believe the issue should be handled by the European Union:
*
*
*
*
w
*
DEALING WITH UNEMPLOYMENT, by 50% to 4696. Majorities for either national or EU decision-making are relatively narrow in most countries, perhaps allowing for joint action in this field, as indeed ís the case given the recent Europen Commission White Paper produced on the subject. The British are more committed to national govemments dealing with the issue (63:32).
SECURITY AND DEFENCE17, by 51% to 44%. A large majonty of the Dutch (24:73) by contrast support the EU’s role, followed less resolutely by many Belgians (42:53), Germans (4252) and Italians (45:49). Neutrality-minded Irish are most for security and defence remaining the responsibility of national govemments (71:21).
BASIC RULES FOR BROADCASTING AND PRESS, by 51% to 40%. Apart from moSt Luxembourgers favouring the EU’s role (3652) and indecisive results in Italy and Germany, majorities everywhere support the national government’s role.
HEALTH AND SAFETY OF WORKERS, by 5596 to 40%. Italy is the only country where a majority seek the EU’s involvement (4054). The Irish and Dutch are divided: everywhere else most support the role of national governments.
CULTURAL POLICY, by 55% to 38%. Apart from Italians who are divided on the issue, absolute majorities elsewhere wish to keep this issue in the hands of national govemments. This is particularly significant given the fact that the Maastricht Treaty has for the first time given the EU a major say in cultural policy.
l7 Many interviewed may understand ‘Security’ to concem domestic police matters. The item will mention only ”Defence‘, in half of the sample of the next Standard EUROBAROMEITR Sulvey.

- 64 - EUROBAROMETER 40
* PARTICIPATION OF WORKERS’ REPWENTATIVES ON COMPANY BOARDS OF DIRECTORS, by 54% to 32%. Majonties are for national governments dealing with the issue everywhere except Ireland, whose people are divided on the subject.
EDUCATION by 64% to 32%. Absolute majonties everywhere are for national governments doing the job, apart from Italy whose people are divided on the issue.
c *
HEALTH AND socm WELFARE, by 65% to 31%. Everywhere, absolute majo ‘ties back national governments in this area. f
*
The more international and/or distant the issue is from the daily concerns of the the-street, the more likely citizens at the EU-level are to attribute it to Unio making. Conversely, the more domestic andor personally-involving the issue, th want national govemments “closer to home” to deal with it.
Overall, Italians are the people who would give most responsibility to the Unio as against only two for national governments (two issues are tied). At the o most Danes would like national governments to hang onto 12 issues and only g Union (one tied) while most British would give 13 to national governments Union (none tied).
The two biggest changes that took place compared to six months ago is th want national governments to deal with the fight against drugs (+lo) and secu defence (+9). Moves on security and defence in favour of national governments biggest in Spain (+14), Greece (+13), Portugal and the United Kingdom (both + the field of drugs control, the move towards national govemments (bearhg in high levels of support for EU action in this field) is substantial in alm especially Spain (+ 19). Overall, compared to six months ago, the EU has lo to national govemments by an average of just over 2% over the 18 issues surveys.
Curious results are obtained when we look at support for a common defence poli y in general, which remains very positive and largely stable at the EU-level (Chapter 3.2) and the fact that there is a swing taking place away from the EU in favour of na onal governments being responsible for security and defence. This can be explained b the general desire of EU citizens to see a common defence policy work in principle but, wi all evidence of former Yugoslavia (and previously the Gulf war) to the contrary, the undo bted reality perceived is that national decision-making outside the Union (perhaps withi the framework of the North Atlantic Alliance) is the only way forward for now until EU de ence
.
and security arrangements are seen to work effectively on the world stage. i

- 65 - EUROBAROMETER 40
3.4 Single European Market
The Single Market came into force on 1st January 1993. But the matter by no means ends there. Certain provisions have still to come into force at Community and others at national level. Many citizens have yet to sample its benefits personally. And there is the matter of
b policing the Single Market to ensure "fair play" so that it works properly.
The European Commission in December 1993 set out its plans to extend the Single Market further, including creating a definitive Value Added Tax system, protection for intellectual property, elimination of double-taxation for companies trading in several EU member states and improvements for cross-border shopping. There will also be a major boost when the European Economic Area opens the doors of the Single Market to many EFTA countries, creating a market of 370 million consumers on 1st January 1994.
Nerves have steadied somewhat within the European Union conceming the Single Market. Readers of the EUROBAROMETER will recall that it was the Single Market and not Maastricht which originally provoked the fall in overall public support for the European Community. Since bottoming-out a year ago, there has been a marginal recovery in EU citizens' feelings of hope about the Single Market (see Figure 3.8).
Now 54% at the EU-level say they are hopeful about the Single Market while 35% say they are fearful. 11 % say they are neither hopeful nor fearful (Table 42). This is a three point improvement in those saying they are hopeful since a year ago, coupled with a two point decline in those fearful over the same period.
Absolute majorities continue to be hopeful in all EU countries with the notable exception of France. Beset with worries about the effects of free trade on many of their produce, the French are divided between those hopeful (44%) and fearful (46%) about the Single Market.
At Member State level, the results for the above question correlate quite closely with the extent to which EU citizens feel the Single Market is advantageous or not for their own country. In this respect, 44% at the EU-level say it brings advantages, while 29% say it does not (Figure 3.9, Table 43).
People from the smaller countries of the European Union - Greece, Ireland, the Netherlands, Denmark and Portugal - are the most likely to be hopeful and see advantages from the Single Market. Most Italians are also as likely to see advantages as many people from those smaller countries. This time, Germans are close to being divided (38% advantages; 34% disadvantages) on the issue while more French than not fear there are disadvantages (33:39).
I
There has not been any significant movement at the EU-level on the advantages issue since six months' ago. Greeks have grown to appreciate advantages the most (+8). Hope have risen the most in West Germany (+ 8) and Luxembourg (+7) while falling the furthest in Italy (-8).
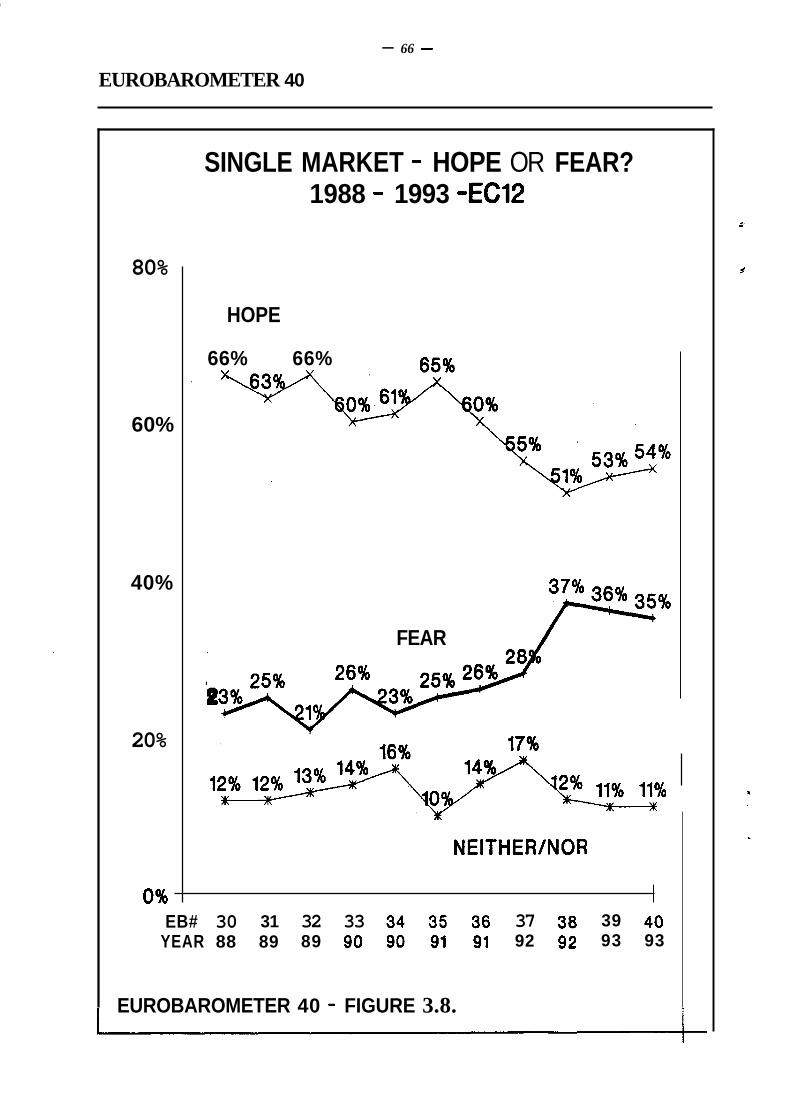
, I
- 66 -
EUROBAROMETER 40
80%
60%
40%
20%
0%
SINGLE MARKET - HOPE OR FEAR? 1988 - 1993 -EC12
HOPE
66% 66%
FEAR / 43% ,<
NEITHER/NOR
EB# 30 31 32 33 34 35 36 37 38 39 40 YEAR 88 89 89 90 90 91 91 92 92 93 93
EUROBAROMETER 40 - FIGURE 3.8.

- 67 -
EUROBAROMETER 40
A special study undertaken within the framework of EUROBAROMETER No. 40 18, gives us additional insight into one of the most important aspects of the Single Market when it comes to the benefits that should accrue personally to EU citizens - the freedom of movement of people across former borders within the EU. t
* A representative sample of the citizens of four EU Member States - Belgium, both parts of Germany, France and the Netherlands - were asked to give their opinion on the following question:
"Since the completion of the Single European Market at the beginning of 1993, people crossing intemal EC borders, that is borders between Member States, are not checked as much as before. In the future, these controls are to disappear completely. Which of the following two opinions comes closest to your own ? - "Most of all, I am happy that people can travel without restrictions throughout the European Community" OR "Most of all, I am worried that crime ram will rise in (OUR COUNTRY) because border controls have been removed " .
On weighted average, more than half of these EU citizens fear an increase in crime (54%) rather than see benefits of restriction-free travel (41%) in these countries. More see problems rather than benefits in these respects in all four countries, including both parts of Germany. The most concerned are East Germans (65:32) and the Dutch (64:33), while the relatively least concemed are the French (49% "crime": 44% "happy") (Table 44).
*
A third of all EU citizens (33%) say they visited another EU country in 1993 (Table 45). 90% of Luxembourgers say they went to another EU country last year. Benelux citizens travelled the most, followed by around half of all Danes and Germans. By contrast, less than a quarter of southerners did. At the opposite extreme, merely 7% of Greeks, whose country has no land frontier with another EU country, say that they travelled to another EU country in 1993.
The most popular place to go is France (12%), followed by Spain (8%) and Germany (7%).
France is the favourite for many Belgians, Germans, Spaniards, Italians and the British. Spain is the prime attraction for many French and Portuguese. The Irish largely went to the United Kingdom while Luxembourgers and the Dutch travelled mainly to Belgium.
I The least travelled spots for EU citizens are Ireland (1 %), Portugal and Denmark (both 2%).
Asked on behalf of SII association of national police research institutes in Gennaay and The Netherlands

- 68 -
EUROBAROMETER 40
~~~ ~ ~
THE SINGLE MARKET ADVANTAGEOUS FOR OWN COUNTRY?
O R IRL
I OK
P . NL
B E L
44% - : : : : : : . : : : : : : : : : : I . . . . . . . . . . . . . . . . . 20% IEc121
UK D F
. . . . . . . . . . . . . . . . . . . . . . . . . . . . . . . . . . . . . . . J 33% 412 1- . . . . . . . . . . . . . . . . . . .
382 1- . . . . . . . . . . . . . . . . . . . J 342 . . . . . . . . . . . . . . . . . . . . . . . . . . . . . . . . . . . . . . . . . . . . . . . . . . . . . . . . . . . .
33% - _:_:.:.;.:_,.,_~ .,.,, ~.:.:.:.~.~.:.:.:.~.;.: ; 38%
= ADVANTAGES 0 DISADVANTAGES
EUROBAROMETER 40 - FIGURE 3.9.
GREATER EC RESPONSIBILITY FOR RESOLVING CONFLICTS IN THE WORLD
. . . . . . I 60% . . . 8% . . . . . . . . . . . NL 77% \\!~ . . . . . 13%
77u 1- . . . . . . 1 14%
E n n !U ... 1 0 %
. . . . . . ...... L
. . . . . . .
. . . . . . 72% !-I.'.' . . . . . . ..... ..I 14%
DK
m FOR n AGAINST
EUROBAROMETER 40 - FIGURE 3.10. =hource EB 39 queetton for external pari

- 69 -
EUROBAROMETER 40
Of the third of EU citizens who travelled, two thirds reports that they have not been checked at the border ('Table 46). 9% say they have been checked at the French border and 8% at the Spanish (however the fact that these two countries were the most popular destinations should be borne in mind as part of reason for their prominence in this respect). i
The largest numbers of checks seem to be of Italians at the French border (23% of all travelling Italians) and Irish getting into the United Kingdom (23% again, including the security problems, no doubt, of crossing from the Republic into Northern Ireland). Also 19% of all travelling Danes were checked at the German borderlg and 18% of all travelling Muguese at the Spanish frontier.
A Telephone Flash carried out in September 1993 2o gives us more clues about EU citizens' rtutudes towards the issue of free movement. Two-thirds of EU citizens (66%) say that they b o w that any citizen of any Member State of the European Community has the right to muve and settle freely anywhere within the Community ('Table 47). Awareness of this issue sams highest in Italy (78%) and West Germany (76%).
Asked whether Europe could really be united as long as European citizens have not been granted freedom of movement, 70% of EU citizens agree it could not really be united, while 22% disagree (Table 48). Absolute majorities agree in all countries, ranging from 77% of the Dutch and Luxembourgers to 56% of Danes.
Thus many EU citizens often appreciate the symbolism and see the necessity of free movement of people within the Union. Quite a few are however cautious about the impact that this and other Single Market measures will have on their country and quality of life.
3.5 The EU's role in the world
Number two of the three main pillars of the new Union is security and defence. As we have Seen above, most EU citizens want the Union to succeed in having a common defence policy but many feel it should be primarily a national government responsibility until the European Union has proven itself capable of acting together.
l9 Denmark is not a "Schengen country"
2o The technical specifications of Flash No. 19, conducted by EOS-GALLUP Europe during the period 8th-20th September 1993 on behalf of Directorate-General XV for Internal Market and Financial Services, can be found in the h e x e s . Only main urban areas were surveyed in Greece, Spain, Portugal and Ireland : results in these countries are not directly comparable. East Germany and Northem Ireland were not surveyed.

- 70 -
EUROBAROMETER 40
Previously, in EUROBAROMETER No. 39 of Spring 1993, Citizens were asked whether the European Community as a whole should take a greater share of responsibility for resolving conflicts around the world. The answer is an overwhelming "YES".
Faced with former Yugoslavia, Somalia and the uncertainties of events in the former Soviet Union, 72% of EU citizens say the Union should take a greater share of the burden, while only 14% say it should not (Figure 3.10, Table 49).
Chief supporters of greater EU responsibility in global crisis-solving are most Italians (80 %), Dutch and Luxembourgers (both 77%). Only among Danes do we find a substantial number of doubters (34%) who nevertheless do not-outnumber the absolute majority of su] (52%) in that country for the idea.
orters
- 71 -
EUROBAROMETER 40
4. INITIATIVES FOR THE EU JOB MARKET** 4.1 Problems and solutions to unemployment
What is EU citizens' greatest concem today? Asked about the most important problem facing the European Community in a September 1993 Telephone Flash poll n, 67% at the EU level stressed the burden of "unemployment", by far the highest result (Figure 4.1, Table 50).
Much further down the list come "nationalism", "instability of European currency" (both 10%) and "inflation/rising prices" (9%), the other options available.
*' Normally this Chapter discusses EU citizns' attitudes towards the European Parliament. The European Parliament's DGIII, having asked twice as many questions in EB39 than usual, did not ask any questions this time.
All results in Chapter 4 relate to Flash No. 20 conducted by EOS-GALLUP Europe during the period 31st August-16th September 1993 on behalf of the Directorate-Genexal V for Employment, Industrial Relations and Social Affairs. East Germany was surveyed face-to-face. Only main urban areas were surveyed in Greece, Spain, Portugal and Ireland results in these countries are not directly comparable.

- 72 -
EUROBAROMETER 40
Commenting on this result, Mr. Padraig Flynn, Commissioner for Social Affairs, said it highlights "the level of Europe's popular concern with unemployment and also underlines the need for new programmes and policies to get the unemployed off the dole and to keep the employed at work". (See also the European Commission's Green Paper on European Social 3
Policy initiated by Mr. Flynn).
President Delors and the European Commission have also made big efforts on this very issue throughout the period of the Belgian Presidency in the second half of 1993. Unemployment in the European Community reached 10.7% in October 1993 and is expected t have increased from 14.1 million to over 16 million by the end of 1993. A recent report by the OECD foresees 22 million unemployed in the European Union by the year 1995. P I
The resulting European Commission's White Paper on the European Unio ("Growth, Competitiveness and Employment") was given a very favourable December European Council, despite the UK Government having some di A big 120 billion ECU investment programme is proposed over six years in the transportation, energy and telecommunications. The aim is to create 15 mill cut the EU unemployment rate in half. Soon after the summit, the Commission five year 800 million ECU vocational trainhg programme to help try to i currently very bleak unemployment situation.
According to this Flash EUROBAROMETER survey No. 20, unemployme the top problem facing the Union in all countries, from France @O%), Ireland and Italy (both 75%) to Greece (4196), the only country where almost as profound (33%). Fears of nationalism are most keen Netherlands (19%) and Germany (15%).
Readers may wonder why the answer to this Flash question is in a quite different the EUROBAROMETER result shown at the start of this report - the m for the twelve member countries of the Europeax~ Community to resol and regional development come ahead of "coordinating the social policy of the States in the fields of employment and job training". The answer probably lies highly emotive and direct word "unemployment". People want actio we have seen, very high percentages of EU citizens consider the "employment si have much deteriorated in their country over the past year and believe that pros much better for 1994 (see Chapter 1.2). The current feeling by most citizens governments (at least in October 1993, before the White Paper was completed) placed to deal with the matter may have rather reduced support for an "coordination" role (see Chapter 3.3).

- 73 - EUROBAROMETER 40
Many EU citizens recognise the current poor economic situation is the major cause of unemployment in the European Community (34%) (Figure 4.2, Table 51). However just as many blame (3496) the "inadequate pokies of governments". 10% say there is a lack of solidarity among EC Countries while only 9% say wages are excessively high. Very few place primary and direct blame on the Single Market (3 %) or the European Community (2 %) for such woes.
Inadequate policies of national governments is the main reason given in Italy (54%), Spain (52%), Ireland (42%) and Portugal (37%). Everywhere else, the poor economic situation comes first, although only narrowly in Germany (36% versus 32% "inadequate government policies").
.
Greatest worries about excessive wage levels are expressed in the Netherlands (19%). The European Single Market is blamed as the chief culprit by a maximum of 6% anywhere (Portugal) while the European Community stands accused only by a maximum of 5% anywhere (Denmark and Luxembourg).
EU citizens were asked what their first priority would be for combatting unemployment. The results show Cable 52 & 53) :
89% versus 7% IN FAVOUR of stimulating the economy - unsurprisingly supported everywhere, from 93 % of Belgians to 73 % of Danes and Luxembourgers;
83% versus 12% IN FAVOUR of improving education and vocational training, backed by all, from 96% of Portuguese to 74% of Germans;
67% versus 6% in favour of REDUCING rather than increasing taxes, supported again by majorities everywhere;
63 96 versus 27% AGAINST REDUCING unemployment benefits, with absolute majorities against reductions except the Netherlands (48:48) and Italy (44:43) where people are divided;
60% versus 18% in favour of INCREASING rather than reducing cooperation between the governments of the countries of the European Community, backed by absolute majorities everywhere;
35% versus 13% in favour of REDUCING rather than increasing weekly working hours, with relative majority support everywhere except Germany (25% "increase"; 21% "reduce");

- 74 -
EUROBAROMETER 40
MOST IMPORTANT PROBLEM FACING EUROPEAN COMMUNITY -EC12*
87%
9% /
U NEM P LOY ME NT NATI ON ALISM UN STAB LE IN F LATI ON CURRENCIES
EUROBAROMETER 4 0 - FIGURE 4.1. -1 aource: flash E
PERCEIVED MAJOR CAUSE OF UNEMPLOYMENT -EC12*
POOR ECONOMIC SIT U AT I ON
INADEQUATE NATIONAL
QOVT. POLICIES
LACK OF EC -1 i o n SOL I DAR IT Y
HUQE LEVELS - 9%
E XC ESS I VE
SINGLE MARKET = 3% EUROPEAN COMMUNITY 2%
EUROBAROMETER 40 - FIGURE 4.2. -) source: flash EE
20
-
%
K
D -

- 75 -
EUROBAROMETER 40
.
*
4.2
Split 35 % versus 35 % between increasing and reducing the free movement of workers between the countries of the Eurogean Community, a significant result where relative majorities are found for INCREASING FREE M o m E N T in four countries: Germany (48:24), Ireland (47:26), the Netherlands (439) and Italy (42:37) and relative majorities for DECREASING FREE MOVEMENT in eight: Spain (36:29), Luxembourg (37:27), the United Kingdom (37:32), Denmark (39:28), Greece (41:25), France (41:22), Belgium (49:28) and Portugal (50:21).
Job-sharing
Some people say if fewer hours were worked each week, there would be more free time. more work available, and new jobs could therefore be created. People were asked whether, irrespective of their situation at work, they would be personally prepared to work fewer hours.
An absolute majority say they would be prepared to work fewer hours (55%) while a quancr (27%) rejected the notion out of hand (Table 54). 12% say it would depend on the salary earned. There is an outright "yes" to the idea everywhere except Spain (41%), Greccc (45%), Germany (47%) and Luxembourg (48%), where acceptance is more qualified. Absolute majorities of managers (61 % "yes"; 6% "depends on salary"; 33% "definitely no'). the unemployed (61: 14:20), salaried employees (59: 15:24), manual workers (52: 15:30) and the self-employed (50:9:39) also initially appreciate the idea.
Of the two-thirds (67%) at the EU level who say they would accept to work less or who say it would depend on their earnings, 30% say they would work less even if they are not pad for the hours not worked, 37% only if they are paid for the hours not worked but at a kmer rate, while 27% spontaneously say they would only agree to the idea if their earnings stay the same.
The results by occupation (or temporary lack of it) are not that different: managers (38% 'if
not paid"; 38% "lower rate"; 20% "same wage as before"), the unemployed (36:39:20) thc self-employed (33:34:27), salaried employees (32:35:29) and manual workers (30:34:3 1
_c
This means, in fact, that 45% of EU citizens overall would accept some form of pay cut for less hours worked, including a maority of the unemployed (56%), exactly half of all managers and salaried employees (both 50%), with less backing from manual worken (43%) and the self-employed (40%).
The scheme therefore has a good chance of success in many work-places among salaricd white collar workers in particular.

- 76 -
EUROBAROMETER 40
4.3 "Flexi-time"
Some people prefer fixed working hours; they prefer to start and finish their work at the - I same time each day. On the other hand, others prefer "flexible" working time; those prefer to know that they have a certain number of hours to work each week but that they can spread them over the week, within certain limits, more or less as they choose; where possible they * lik to be able to choose each day the working time that suits them best.
EU citizens, by 56% to 36%, prefer the idea of flexible time over fixed working flable 55). 2% say spontaneously that it would depend if earnings were effected wh would not give an answer. The British are the most keen on-flexible working Mowed by the French (63%) and Italians (6O%).-Nevertheless fixed hours are prefei majorities of Greeks, Spaniards (both 54%) and Portuguese (52%). "Flexi-time" is a choice of most managers (75% "flexible"; 1% "depends on salary"; 23% "fixed u houn"), salaried employees (64: 1:32), the unemployed (58:4:34), self-employed (S8:4:33) and manual workers (52:2:43).
All those who did not prefer working fixed hours were asked whether they would slightly lower earnings in exchange for "flexible" working time. 43% say "definitel: 39% say "yes" while a further 15% spontaneously respond that it would depend on the earned (Table 56).
Absolute majorities of those previously supporting "flexi-time" in the United Ki (5896), Ireland (55%), the Netherlands (53%) and Denmark (51%) reject the idea would lose money in the scheme. An absolute majority continue to back it in Italy I
Everywhere else the response is more mixed. If one adds the supporters of the idea tc who gave a qualified yes ("depending on earnings"), most Luxembourgers (65%), Spí (63%), Germans (a%), French (57%), Belgians (54%) and Greeks (53%) conti support the idea. Salaried employees (33 96 "yes"; 14% "depends; 5 1% "definitely nc manual workers (32:16:50) largely do not go along with the idea, while both ma (41: 13:45), the self-employed (46: 13:39) and particularly the unemployed (49: 16:: more receptive.
Thus only 30% of EU citizens overall back "flexi-time" without wage cuts. Lei commitment to the idea from managers (41%), the unemployed (40%), the self-em (37!36), salaried employees (31 %) and manual workers (26%) also show that individl solutions are one strategy that needs serious examination in order to make use of potential.
Thus flexi-time is supported by majorities who like the idea of deciding for themselve they should work, even if many do not accept being penalised financially for the priv
hours le 5 % 71 %), *ed by so the irking mple
iccept not", dary
gdom F they 54%). those liards lue to ') and lagers I) are
:Is of
alised - uch a
%
1loyed
when lege.
- 77 -
EUROBAROMETER 40
Those who originally said they would prefer working fixed hours were asked whether they would accept flexible working time if their employer offered a slight increase in their earnings.
-Of the 36% who back working fixed hours, just over half (54%) would change their minds and accept the offer of "flexi-time" based on a slight increase in wages per hour. A quarter (24%) would refuse. An eighth (13%) would see how much more money they would get to accept the deal. 9% say "don't know" (Table 57).
-
Absolute majorities of those originally backing fmed hours from all countries would accept the deal outright, except in Greece where more would base their decision on waiting to see how much more money is on the table (37%) than accepting (27%) or refusing outright (24%). Most managers (68%), self-employed (al%), manual workers (55%), salaried employees (54%) and unemployed (53%) EU-wide would accept the new deal outright.
l 4.4 Vocational training
Vocational training is considered an essential element in fighting unemployment, improving the skills of the work-force and as a long tem investment for a country's economy. Yet how many people have followed one or more vocational training courses over the past five years (Table 58) :
I * . . . "organised as part of your work". Ovedl 22% EU-wide say they did, including 46% of managers, 44% of salaried employees, 29% of the self-employed, 26% of manual workers and 19% of the currently unemployed. I
* . . . "organised as part of a public employment programme". Overall 8% say they did, including 22% of the currently unemployed, 15% of both managers and salaried employees, 8% of manual workers and 5% of the self-employed.
I * ... "organised by a college or university". Overall 13% say they did, including 26% of managers, 21% of salaried employees, 15% of the self-employed, 12% of the currently unemployed and 6% of manual workers. I '
* . . . . "cost free (evening courses, correspondence courses.. .) which you decided yourself to undertake". Overall 11% say they did, including 19% of salaried employees, 16% of managers, 12% of the currently unemployed and 11 % of both the self-employed and manual workers.
- 78 - EUROBAROMETER 40
* . . . "which you paid for and which you decided yourself to undertake". Overall 13 % say they did, including 24% of the self-employed, 22% of managers, 20% of salaried employees, 19% of the unemployed and 12% of manual workers.
... or "read one or more books to supplement your training". Overall, a more significant 36% say they did, including 65% of managers, 56% of salaried employees, 53% of the self-employed, 36% of manual workers and 34% of the
t :
*
currently unemployed. f Greeks, Portuguese and, to a lesser degree, Spaniards benefit the least from all schemes except when it comes to public employment programmes, where all three
* participation levels are about average for the Union as a whole.
The most intensely trained seem to be the Dutch, 53% of whom read a training b of whom attended a paid course, 30% a training course organised by a universi of whom attended vocational training as part of their work. Danes attended the courses (23 %) during the past five years. 18% of East Germans attended public programme vocational training courses.
Fear of losing work is very prevalent. Almost half of all m a n d workers (4 self-employed (46%) are womed about being made to stop work. The fear among many salaried employees (40%) but to a lesser degree among managers ( 4.3, Table 59).
If one takes the combined views of all currently employed people plus th chief household income earner in paid work, the greatest fear of unemployment by far in Spain (85 %), followed by East Germany (59%), Portugal (47%) and Fran (Indeed, Spain suffered the largest increase in unemployment for the year 1993, from 19% to a staggering 22% of its workforce). Least womes are Netherlands (18%), Luxembourg (20%) and Greece (28%). In the Un 42% express fear of unemployment, despite the fact that this is the European Union which is beginning to see a gradual fall in its level of not in proportion with its economic growth recovery). Overall 45 % of plus those reliant on another income eamer express fear of ceasing work. t
Despite the perceived harshness of the economic climate, there is not a great deal of in vocational training improving the situation much. If we take the views of the of people as above, 63% believe a better vocational training would not make in giving them a much better chance of continuing to work. 16% say it slightly better chance, while 18% are convinced they would have a much such experience. Thus a third thinks it would help (Table 60).

- 79 -
EUROBAROMETER 40
Those most convinced of the usefulness of vocational training among this group of people come from Spain (37% "much better chance"), Greece (22%) and Portugal (20%). 30% of the currently unemployed also feel they would stand a much better chance, but large majorities of those already employed reject its usefulness (60-71 % "no difference").
4.5 The future of employment
Would people be ready to pay more tax if they were sure that this extra tax was to be devoted to creating new jobs ?
Despite 67% previously favouring tax reductions as a way of combatting unemployment (see Chapter 4. l), 57% of EU citizens say they would nevertheless be ready to pay more taxes if they were sure that the extra tax revenue would be devoted specifically in such a way. 28 % .would not, while 11 % reject the idea spontaneously, giving the reason that they do not earn enough money to help out in this way. 4% say "don't know" (Figure 4.4, Table 61).
Most likely to accept the idea are the British (71%), followed by Spaniards (63%), Luxembourgers (62%) and the French (61 %). The Irish hesitate (47% "yes"; 8% "no, don't earn enough"; 40% "no") along with many Germans (46:11:36), while many Greeks on balance would not (27:30:34 - many East Germans, systematically lower paid anyway than their West German fellow citizens, are also sticky on the subject 29:23:36).
Only 11% think unemployment can be eliiinated by the Year 2000; 28% say it may take a longer time; but 54% think that we will never see the last of it (Table 62). Most pessimistic about it's future demise are Danes (77%), the Dutch (75%) and Irish (73%). Most hopeful are Italians (19% "yes"; 34% "sometime"; 37% "never"), followed by the French (12:35:46) and Greeks (8:26:48).

- 80 -
EUROBAROMETER 40
WORRIED ABOUT BEING MADE TO STOP WORK -EC12'
M A N AO ERS 32%
EUROBAROMETER 40 - FIGURE 4.3. *)aourte: Flash EB 21
READJNESS TO PAY MORE TAX TO CREATE NEW JOBS'
'Don3 enotag
UK 71% .. .. ais I
E L
F NL
Fl I
OK P
B IRL
D
OR
sms . . . . . . . . . . . . . . . . #?I -1 . . . . . . . . . . . . . . . .
=YES D N 0
EUROBAROMETER 40 - FIGURE 4.4. *hource: Flash EB 20
e W
U
8
**
Y
?
n w
99
aC

- 81 -
EUROBAROMETER 40
5. OTHER DIMENSIONS OF EUROPE Within the framework of the 40th wave of the standard EUROBAROMETER (Autumn 1993), several special studies were carried out on behalf of various specialised ~ I C C ) of the European Commission and an extemal partner.
The main studies this time are about opinions and attitudes towards poverty and yKI1) exclusion, crime and police cooperation, the European Monetary System, and the Europan Court of Justice.
Detailed reports on the results of these questions commissioned by specialised services of the Commission will be presented at a later stage (see Annexes for the current and expected Iin of such studies). By way of illustration, some questions of general interest can, however, already be subject to a preliminary analysis and are presented here.
- 82 -'
EUROBAROMETER 40
i-
lat a
t into
care
3r it;
mum
5.1 Poverty and social exclusion 23
Poverty and social exclusion is always a hot, often national or local topic in the news. In time of economic recession, people's rights to get help are under pressure from shrinking governmental budgets, yet help has never been more needed.
Some people think that it i s necessary to guarantee certain rights to all ss that everyon live with dignity (Figure 5.1, Table 63). Large majorities agree that:
*
*
*
*
*
*
*
*
*
*
*
*
*
By 96% to 3%, everyone must have the right to suitable accommodation reasonable cost;
By 95 % to 3 % , compulsory, free education should give everyone the means to fi society;
By 94% to 4%, everyone must be able to be cared for, without the cost oi preventing it;
By 92% to 4%, everyone should have the right to job training;
By 89% to 6%, shelter should be guaranteed to the homeless;
By 87% to 9%, the right to work should be guaranteed;
By 85% to 7%, access to courts should be free for those without means to pay i
By 85 % to 9%, even if they are not able to pay, everyone should have the mini of water, gas, electricity;
By 84% to lo%, to avoid putting children into care, all families should be hel€ bring up their children themselves;
By 82% to 11 % , everyone should have access to cultural activities;
By 82% to 1256, the right to vote should be really guaranteed to all;
By 80% to 1296, everyone should have the right to actively participate in group associations;
By 73% to 16%, tenants who have difficulties in paying the rent, should be prot against eviction without rehousing;
23 Part of a major EUROBAROMETER No. 40 survey on behalf of European Commission Direcl General V for Employment, Industrial Relations and Social Affairs.

- 83 -
EUROBAROMETER 40
It is unsurprising to note that absolute majorities support these propositions in all countries - the social conscience and consciousness of the welfare state - distinguishing Europe from the USA as well as from Japan - continues to survive !
5.2 National identity, European identity
Has the apparent rise of nationalism in Europe had an effect on how European people feel thy arc ? The answer is, actually, not much different since this particular question was asked Lut, one and a half years ago, in Spring 1992.
EU citizens were asked whether they see themselves in the near future as (NATIONALITY) only, (NATIONALITY) and European, European and' (NATIONALITY) or European only.
At the EU-level, 40% say they-see themselves as (NATIONALITY) only, while 45% feel (NATIONALITY) and European. Relatively few reckon they are European and (NATIONALITY) (7%) or just European (4%). 4% "don't know" (Table 64). Since the time the question was last asked, there has only been a slight change, with marginally more saying they are ( NATIONALITY) only (+2) at the expense of those who feel (NATIONALITY) and European (-3) at the EU level.
Most frequently countries have absolute majorities of people saying they feel European in some way (NATIONALITY) and European, PLUS European and (NATIONALITY), PLUS European only) - 56% versus 40% (NATIONALITY) only (Figure 5.2).
Most European are Italians (70%), followed by the French, Belgians (both 65%), Luxembourgers (63%) and Dutch (59%). The Irish (50:48) and Danes (5050) are divided between the two, while only most British see themselves as "nationality only" (59%) rather than in addition feeling European in any way (37%)".
Since Spring 1992, "nationality only" feelings have grown particularly in Luxembourg (+9), East Germany (+5 , where people are also divided between (nationality) only (49%) and some form of Europeanness (48%)) and the United Kingdom (+5) . The most significant decline is in Belgium (-3, while feeling (nationality) and European mainly gains (+4).
5.3 Views on the European Court of Justice
In EUROBAROMETER No. 38, a set of questions were asked about the European Court of Justicez. This has been followed ' u p by another short series of questions in EUROBAROMETER No. 40, one year later.
Scottish and Welsh are significantly more often "also European" as compared to the English. 24
Asked on behalf of Professor James Gibson from the University of Houston. 25

- 84 -
EUROBAROMETER 40
FOR OR AGAINST GUARANTEEING CERTAIN RIGHTS FOR ALL -EC12
SU I TA B. ACCO M O DAT I ON
FREE EDUCATION
CARE - WHATEVER COST
JOB TRAINING
SHELTER FOR HOMELESS
WORK QUARANTEED
FREEACCESS TO COURTS
W T E R, 0 AS, E LE CT R C I T Y
CH I LD-I N-FAM I LY HE LP
CULT UR AL ACT I VIT I ES
RIGHT TO VOTE
GROUP ACTIVITIES
DI SAL LOW EV I CT I ONS
96% - 3%
96% 3%
04% - 4%
04% 1- 4%
89% ~- 6%
87% -1 9 w 86% - 7%
85% 1- 9%
84% ~- 10%
82% 1- 11%
82% -1 12%
80% - 12%
73% 1-1 16%
= FOR AGAINST
EUROBAROMETER 40 - FIGURE 6.1.
-
NATIONAL AND EUROPEAN IDENTITY: DO YOU SEE YOURSELF IN THE NEAR FUTURE AS ...
I F
. . . . . . . . . . . . . . . . . . . . . . . . . . . . . . . . . . . . . . . . . . . . . . . . . . . . . . . . . . . . . . . . . . . . . . . . 2eu I O U
a2u P ........................ 06U . . . . . . . . . . . . . . . . . . . . . . . . . ~ ~ _ _ _ _ _ _ _ _ _ _ ~ ~ ......................... ........................ 32U B 06% . . . . . . . . . . . . . . . . . . . . . . . . . . . L
NL
. . . . . . . . . . . . . . . . . . . . . . . ...'.- 3alb 03s m@&zI . . . . . . . . . . . . . . . . . . . . . . . . . . . . . . . . . , . . . , . . . . . . . . . . . . . . . . . . . . . . . . /--q 40U . . . . . . . . . . . . . . . . . . . . . . 60U
. . . . . . . . . . . . . . . . . . . . . . . . . . . . . . . . . . . . . . . . . 40U m 60U
O R E D P
DK IRL UK
. . . . . . . . . . . . . . . . . . . . . . . . . . . . . . . . . . . . . . . . . . . . . . . . . . . . . . . . . . . . ,,u- 41U . . . . . . . . . . . . . . . . . . 66U . . . . . . . . . . . . . . . . . 381 . . . . . . . . . . . . ~.-
~~
43% .................... . . . . . . . . . . . . . . . . . . . .
37% m: . . . . . . . . . . . . . : : : : : : : : : : : : : v - m 60%
n (Nationality)+ EUROPEAN EBB8 EUROPEAN+ (Nationality
D EUROPEAN only (Nationality) only
EUROBAROMETER 40 - FIGURE 5.2.
E

- 85 - EUROBAROMETER 40
The European Court of Justice is in charge of hearing cases about the law of the European Community. It decides on the proper interpretation of Community law and whether European Community law or national law prevails. On that basis, EU citizens were asked to agree or disagree with the following propositions (Figure 5.3, Table 65) : '
"The European Court of Justice can usually be trusted to make decisions that are right for the Community as a whole". 49% of EU citizens agree, while 11 % disagree. 20% axe undecided and a further 20% "don't know". Most people in all countries feel a basic trust for the institution - this is particularly true of Danes (72%) and the Dutch (70 %)(Figure 5.4).
"If the European Court of Justice started making a lot of decisions that most people disagree with, it might be better to do away with the Court altogether". An absolute majority of EU citizens agree with this view, by 54% to 17%. 18% are undecided, while 12% "don't know". In all countries more people agree rather than disagree with the idea of abolishing the European Court of Justice if it were to rule in too controversial a way, from 62 % of Spaniards to 45 % of Italians and 43 % of Belgians. While greatest opposition to the idea comes from the Dutch (33%), they nevertheless still have a strong relative majority in favour of doing away with the Court under the circumstances indicated.
"The' right of the European Court of Justice to decide certain types of controversial issues should be reduced". EU citizens are more in favour (37%) than against (22%), with 21 % undecided and 20% saying "don't know". Because of high "abstentions", the view that the Court's powers should be diminished in certain cases is only felt convincingly in Denmark (54%) and Spain (49%). The balance of views are for the proposal everywhere except Luxembourg (24: 30).
"The various laws of the European Community give the European Court of Justice too much power". Most EU citizens are undecided (25 %) or say they "don't know" (31 %) - presumably because they are not familiar with such matters. The minority with an opinion are 26% for the proposal versus 18% against.
Thus, on balance, the view of many EU citizens is that the European Court of Justice can generally be trusted to take the "right" decisions for the Community as a whole, but it's overall legitimacy in the eyes of citizens is not very solid.

- 86 - EUROBAROMETER 40
EUROPEAN COURT OF JUSTICE -EC12
MAKE RlQHT DECISIONS
IF TOO CONTROVERSIAL
RESTRICT ITS CONTRO-
VERSIAL JUDQEMENTS
IT IS TOO POWERFUL
= AQREE DISAQRI
EUROBAROMETER 40 - FIGURE 6.3.
EUROPEAN COURT O F JUSTICE - USUAL TRUSTED TO MAKE RIGHT DECISIONS
DK 72Y , . j 122 NL 7 0 2 8 Y
IRL U K G R
I
(EC127
L ' F
P D E B
48% --J 9 2
48% --i 10%
47% u 3Y
44Y --i 12Y
4 6 2 1 - 0 13%
43Y 6U
= AGREE 0 DISAGREE
EUROBAROMETER 40 - FIGURE 5.4.

ANNEXES

A 2
STANDARD EUROBAROMETER 40 - EUROBAROMETRE STANDARD 40
CO-OPERATING AGENCIES AND RESEARCH EXECUTIVES / INSTITUTS ET CHARGES D'ETUDES
INRA (EUROPE) - European Coordination Office SAlNV Jean QUATRES002 - Dominique VANCRAEYNEST
Avenue R. Vandendriessche, 18
BELGIUM Tel. + +I32121772 44 44 - Fax. + +132/2/772 40 79
B -1 150 BRUSSELS
MARKETING UNIT 430, Avenue Louise E-1 050 BRUXELLES
GFK DANMARK Toldbodgade, 1 OB '
DK-1 253 COPENHAGEN K.
MS Pascale BERNARD tel. + +I32 2 648 80 10 + +I32 2 648 34 O8 fax.
BELGIQUE
DANMARK
DEUTSCHLAND
ELLAS
ITALIA
Mr Erik CHRISTIANSEN a tel. + +I45 33 93 17 40 + +I45 33 13 07 40 fax.
SAMPLE INSTITUT Papenkamp, 2-6 D-23879 MÖLLN
Ms Doris SIEBER tel. . + +I49 4542 801 O fax. + +I49 4542 801 201
KEME lppodamou Street, 24 GR-1 1635 ATHENA
Ms Fotini PANOUTSOU tel. + +I30 1 701 80 82 fax. + +I30 1 701 78 37
PRAGMA Via Salaria, 298a 1-001 99 ROMA
Ms Maria-Adelaïde SANTILLI tel. + +I39 6 884 80 57 + +I39 6 854 O0 38 fax.
ESPAÑA CIME1 Alberto Aguilera, 7-5 O
E-2801 5 MADRID
Ms Carmen MOZO
Ms Isabelle CREBASSA
Mr Roger JUPP
Mr Louis MEVIS
Mr Martin JONKER
tel. fax.
+ +I34 2 594 47 93 + +I34 2 594 52 23
FRANCE TMO Consultants 22. rue du 4 Septembre F-75002 PARIS
tel. + +I33 1 44 94 40 O0 fax. + +I33 1 44 94 40 O 1
IRELAND LANSDOWNE Market Research 12,Hatch Street IRL-DUBLIN 2
tel. + +I353 1 667 34 83 fax. + +I353 1 661 34 79
LUXEMBOURG ILRES 6, rue du March6 aux Herbes GD-1 728 LUXEMBOURG
tel. fax.
+ +I352 47 50 21 + +I352 46 26 20
NEDERLAND NIPO "Westerdokhuis" Barentszplein, 7 NL-1 O1 3 NJ AMSTERDAM
tel. + +I31 20 551 66 O1 fax. + +I31 20 638 63 74
PORTUGAL NORMA Av. Infante Santo 70-1 a l l P-1300 LISBOA
Mr Lopes DA SILVA
Mr Chris KAY
tel.+ +I351 1 796 76 0418 fax. + +I351 1 797 39 48
GREAT BRITAIN NOP Corporate and Financial Evelyn House 62, Oxford Street UK-LONDON W1 N 9LD
tel. + +I44 71 631 O0 40 fax. + +I44 71 631 O1 17
,
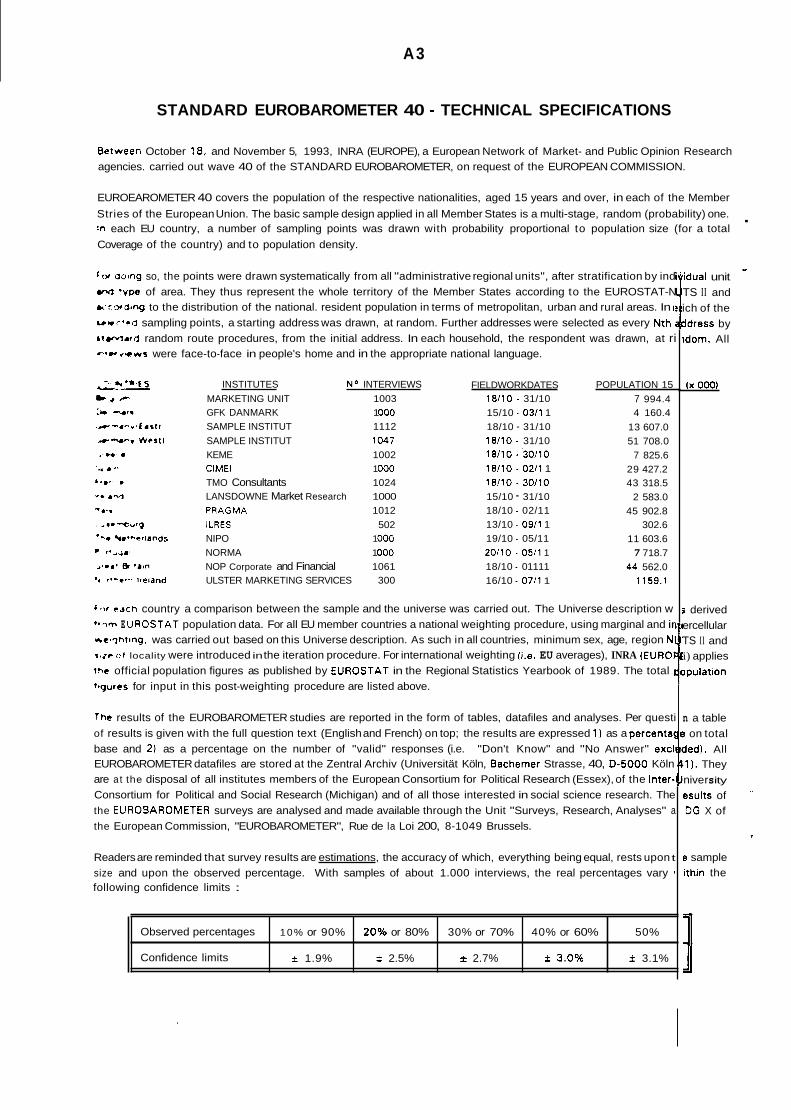
A3
Observed percentages
Confidence limits
STANDARD EUROBAROMETER 40 - TECHNICAL SPECIFICATIONS
10% or 90% 20% or 80% 30% or 70% 40% or 60% 50%
f 1.9% f 2.5% f 2.7% f 3.Ooh f 3.1%
&tween October 18. and November 5, 1993, INRA (EUROPE), a European Network of Market- and Public Opinion Research agencies. carried out wave 40 of the STANDARD EUROBAROMETER, on request of the EUROPEAN COMMISSION.
EUROEAROMETER 40 covers the population of the respective nationalities, aged 15 years and over, in each of the Member Stries of the European Union. The basic sample design applied in all Member States is a multi-stage, random (probability) one. in each EU country, a number of sampling points was drawn with probability proportional to population size (for a total Coverage of the country) and to population density.
.
g r w dolng so, the points were drawn systematically from all "administrative regional units", after stratification by ind y10 "e of area. They thus represent the whole territory of the Member States according to the EUROSTAT-N &rwd+ng to the distribution of the national. resident population in terms of metropolitan, urban and rural areas. In a u r r ' r d sampling points, a starting address was drawn, at random. Further addresses were selected as every Nth niv l lard random route procedures, from the initial address. In each household, the respondent was drawn, at ri --e- W-VVS were face-to-face in people's home and in the appropriate national language.
INSTITUTES No INTERVIEWS MARKETING UNIT 1003 GFK DANMARK 1 O00 SAMPLE INSTITUT 1112 SAMPLE INSTITUT 1047 KEME 1002 CIMEI 1 O00 TMO Consultants 1024 LANSDOWNE Market Research 1000 PRAGMA 1012 ILRES 502 NIPO 1 O00 NORMA 1 O00 NOP Corporate and Financial 1061 ULSTER MARKETING SERVICES 300
FIELDWORKDATES 18/10 - 31/10 15/10 - 0311 1 18/10 - 31/10 18/10 - 31/10 18/10 -'30/10 18/10 - 0211 1 18110 - 30/10 15/10 - 31/10 18/10 - 02/11 13/10 - 0911 1 19/10 - 05/11 20/10 - 0511 1 18/10 - 01111 16/10 - 0711 1
POPULATION 15 7 994.4 4 160.4
13 607.0 51 708.0
7 825.6 29 427.2 43 318.5
2 583.0 45 902.8
302.6 11 603.6 7 718.7
44 562.0 1159.1
& W rach country a comparison between the sample and the universe was carried out. The Universe description w E UROSTAT population data. For all EU member countries a national weighting procedure, using marginal and ir
*e>7hring. was carried out based on this Universe description. As such in all countries, minimum sex, age, region NI r u e 0 1 locality were introduced in the iteration procedure. For international weighting (i.e. EU averages), INRA (EUROI rhe official population figures as published by EUROSTAT in the Regional Statistics Yearbook of 1989. The total 1 'qures for input in this post-weighting procedure are listed above.
The results of the EUROBAROMETER studies are reported in the form of tables, datafiles and analyses. Per questi of results is given with the full question text (English and French) on top; the results are expressed 1) as a percenta! base and 2 ) as a percentage on the number of "valid" responses (i.e. "Don't Know" and "No Answer" excl EUROBAROMETER datafiles are stored at the Zentral Archiv (Universität Köln, Bachemer Strasse, 40, 0-5000 Köln are a t the disposal of all institutes members of the European Consortium for Political Research (Essex), of the Inter- Consortium for Political and Social Research (Michigan) and of all those interested in social science research. The the EUROEAROMETER surveys are analysed and made available through the Unit "Surveys, Research, Analyses" a the European Commission, "EUROBAROMETER", Rue de la Loi 200, 8-1049 Brussels.
Readers are reminded that survey results are estimations, the accuracy of which, everything being equal, rests upon t size and upon the observed percentage. With samples of about 1.000 interviews, the real percentages vary 1
following confidence limits :
- !¡dual unit TS I I and ich of the $dress by Idom. All
(x 000)
j derived ercellular TS I I and i) applies lpulation
n a table ? on total dad). All .1 l . They nive r s ity
esults of i
DG X of
e sample ithin the

A4
Intervalle de confiance f 1.9%
EUROBAROMETRE STANDARD 40 - SPECIFICATIONS TECHNIQUES
f 2.5% f 2.7% f 3.0% f 3 .1%
Entre octobre 18, et Novembre 5 1993, INRA (EUROPE), un reseau europeen d'agences d'etudes de marche et d'opinion publique, a realise la vague 40 de I'EUROBAROMETRE STANDARD, B la demande de la COMMISSION EUROPEENNE.
L'EUROBAROMETRE 40 couvre la population nationale, de 15 ans et plus, dans chaque Etat membre de l'Union Europbenne. Le principe d'echantillonnage applique dans tous les Etats membres est une selection aleatoire (probabiliste) B multiples phases. Dans chaque pays UE, divers points de chute ont ete tires avec une probabilite proportionnelle B la taille de la population (afin de couvrir la totalite du pays) et 8 la densite de la population.
Pour ce, ces points de chute ont etb tires systbmatiquement dans chacune des "unites regionales administratives", apres avoir Øt6 stratifies par unite individuelle et par type de region. Ils representent ainsi l'ensemble du territoire des Etats membres, selon les EUROSTAT-NUTS II et selon la distribution de la population residente nationale en termes de regions mbtropolitaines, urbaines et rurales. Dans chacun des points de chute s6lectionnbs. une adresse de depart a ett5 selectionnee albatoirement. D'autres adresses ont ensuite et6 s6lectionnbes. comme chaque adresse N, par des procedures de "random route" B partir de l'adresse initiale. Dans'chaque mbnage, le repondant a etb tire akatoirement. Toutes les interviews ont etb realisees en face B face chez les repondants et dans la langue nationale appropriee.
PAYS Belgique Danmark Allemagne(Est) Allemagne(0uest) Grece Espagne France Irlande Italie Luxembourg Les Pays Bas Portugal Grande Bretagne Irlande du Nord
- INSTITUTS No INTERVIEWS MARKETING UNIT 1003 GFK DANMARK lo00 SAMPLE INSTITUT 1112 SAMPLE INSTITUT 1047 KEME 1002 CIMEI lo00 TMO Consultants 1024 LANSDOWNE Market Research 1 WO PRAGMA 1012 ILRES 502 NIPO 1 O00 NORMA lo00 NOP Corporate and Financial 1061 ULSTER MARKETING SERVICES 300
DATES DE TERRAIN 18/10 - 31110 15/10 - 0 3 n i 18/10 - 31/10 18/10 - 31/10 18/10 - 30110 18/10 - 02/11 18110 - 30110 15/10 - 31/10 18/10 - 0211 1 13/10 - 09/11 19/10 - 05/1 1 Zoll0 - 0511 1 18/10 - 0 1 / 1 1 16/10 - O711 1
POPULATION1 5 + (xOOOt 7 994.4 4 160.4
13 607.0 51 708.0
7 825.6 29 427.2 43 318.5
2 583.0 45 902.8
302.6 1 1 603.6
7 718.7 44 562.0
1159.1
Dans chaque pays, I'bchantillon a et6 compare B l'univers. La description de l'univers se base sur les donnees de population EUROSTAT. Pour tous les Etats membres UE, une procedure de ponderation nationale a etb realisee (utilisant des ponderations marginales et crois6es), sur base de cette description de l'univers. Dans tous les pays, au moins le sexe, I'Bge, les regions NUTS II et la taille de I'agglombration ont etb introduits dans la procedure d'itbration. Pour la ponderation internationale (i.e. les moyennes UE). INRA (EUROPE) recourt aux chiffres officiels de population, publies par EUROSTAT dans l'Annuaire 1989 des Statistiques Regionales. Les chiffres complets de la population, introduits dans cette procedure de post-ponderation, sont indiques ci-dessus.
Les resultats des etudes EUROBAROMETRE sont analyses et sont presentes sous forme de tableaux, de fichiers de donnees et d'analyses. Pour chaque question, un tableau de resultats est fourni, accompagne de la question complete (en anglais et en français) en tête de page; ces resultats sont exprimes 1) en pourcentage calcule sur la base totale et 2 ) en pourcentage calcule sur le nombre de reponses "valables" (i.e. "Ne sait pas" et "Sans rbponses" exclus). Tous les fichiers de donnees de I'EUROBAROMETRE sont deposes au Zentralarchiv (Universität Köln, Bachemer Strasse 40, D-5000 Köln 41 1. Ils sont B la disposition de tous les instituts membres du "European Consortium for Political Research" (Essex), du " Inter-University Consortium for Political and Social Research" (Michigan) et de toute personne interessee par la recherche en sciences sociales. Les resultats des enquêtes EUROBAROMETRE sont analyses par l'unite "Sondages, Recherches, Analyses" de la DG X de la Commission Europbenne, "EUROBAROMETRE", Rue de la Loi 200,B-1049 Bruxelles ; ils peuvent être obtenus B cette adresse.
II importe de rappeler aux lecteurs que les resultats d'un sondage sont des estimations dont l'exactitude, toutes choses egales par ailleurs, depend de la taille de 1'6chantillon et du pourcentage observe. Pour des Bchantillons d'environ 1 .O00 interviews, le pourcentage reel oscille dans les intervalles de confiance suivants :
~~~ II Pourcentage observe I 10% or 90% I 20% or 80% I 30% or 70% I 40% or 60% 1 50% II

A5
ADMINISTRATIVE REGIONAL UNITS / UNITES ADMINISTRATIVES REGIONALES
BELGIQUE Hainaut Limburg Namur Flandre Orientale Flandre Occidentale Liège Luxembourg Brabant Flamand Antwerpen Bruxelles Brabant Wallon
DANMARK Hovedstadsomradet Sjaelland, Lolland-Falster Bornholm Fyn Jylland
DEUTSCHLAND Schleswig Holstein Hamburg RB Braunsweig RB Hannover RB Lüneburg RB Weser-EMS Bremen Dü s s e I d o r f Köln
.Münster Detmold Arnsberg Darmstadt Giessen Kassel Koblenz Trier Rheinhessen-Pfalz Saarland Nordwurnemberg-Stuttgart Nordbaden-Karlsruhe Südbaden-Freiburg Südwurttemberg-Tübingen Oberbayern Niederbayern Oberpfalz Oberfranken Mittelfranken Unterfranken Schwaben Berlin-West Berlin-Ost Rostock Schwerin Neubrandenburg Potsdam Frankfurt-Oder Cottbus Magdeburg Halle,Erfurt Gera,Suhl Dresden,Leipzig Chemnitz
ELLAS Kentriki kai Dytiki Makedonia Thessalia Anatoliki Makedonia Thraki Anatoliki Sterea kai Nisia Peloponnisos & Dytiki Sterea lpeiros Kriti Nisia Anatolikou Aigaiou
ESPAGNE Andalucia Aragon Asturias Baleares Canarias Cantabria Castilla-La Mancha Castilla-Leon Cataluna Extremadura Galicia Madrid Murcia Navarra Pais Valenciano Pais Vasco La Rioja
FRANCE Ile de France Champagne-Ardennes Picardie Haute Normandie Centre Basse Normandie Bourgogne NordlPas-de-Calais Lorraine Alsace Franche-Comte Pays de la Loire Bretagne Poitou-Charentes Aquitaine Midi-Pyrénées Limousin Rhône-Alpes Auvergne Languedoc-Roussillon Provence-Alpes Côte d'Azur Corse
ITALIA Valle d' AostalPiemonte Liguria Lombardia Milano Trentino Veneto Friuli,Venezia,Giulia Emilia Toscana Marche Umbria Lazio Molise e Abbruzzi Campania Puglie Basilicata Calabria Sicilia Sardegna
IRELAND Dublin Rest of Leinster Munster ConnaughtlUlster
LUXEMBOURG Centre Sud Nord Est
NEDERLAND Gröningen Friesland Drente Overijssel Gelderland Utrecht Noord-Holland Zuid-Holland Zeeland Noord-Brabant Limburg Flevoland
PORTUGAL Norte Centro Lisboa e Vale do Tejo Alentejo Algarve . Azores Madeira
UNITED KINGDOM Cleveland, Durham Cumbria Northumberland Tyne & Wear Humberside North Yorkshire South Yorkshire West Yorkshire Derbyshire, Nottinghamshire Leicesters hire, Northamptonshire Lincolnshire East Anglia Bedfordshire Hertfordshire Berkshire Buckinghamshire Oxfordshire Surrey Eastwest Sussex Essex Greater London Hampshire,lsle of Wigh Kent Avon, Gloucestershire Wiltshire Cornwal1,Devon Dorset,Somerset Hereford, & Worcester Warwickshire Shropshire, Staffordshii West Midlands (county1 Cheshire Greater Manchester Lancashire Merseyside Clwyd, Dyfed Gwynedd, Powys Gwent M-S-W Glamorgan Borders, Central, Fife, Lothian, Tayside Dumfries, Galloway Strathclyde Highlands, Islands Grampians NORTHERN IRELAND
c

BELGIQUE
DANMARK
DEUTSCHLAND
ELLAS
ESPANA
FRANCE
IRELAND
ITALIA
LUXEMBOURG
NEDERLAND
PORTUGAL
UNITED KINGDOM
A6
FLASH 19/20
CO-OPERATING AGENCIES AND RESEARCH EXECUTIVES INSTITUTS ET CHARGES D’ETUDES
Nicole JAMAR - EOS GALLUP EUROPE PrØ Delcourt, 34
BELGIUM Tel: + +/32/10/68 96 14 - Fax: + +/32/10/68 96 15
B - 1325 CHAUMONT-GISTOUX
DIMARSO N.V. 78, Boulevard Lambermont 6-1 030 BRUXELLES
GALLUP MARKEDANALYSE Marina Park-Sundkrosgade 1 O DK-21 O0 COPENHAGEN
EMNID-INSTITUT GmbH Bodelschwingstrasse 23-25 D-4800 BIELEFELD 1
ÌCAP HELLAS S 64, Queen Sophia Avenue GR-1 1528 ATHENS
INTERGALLUP P-Hermosilla 23 E-28001 MADRID
C.S.A. 8, rue d’Un% F-75002 PARIS
IRISH MARKETING SURVEYS 19-20 Upper Pembroke Street IRL-DUBLIN 2
PRAGMA Via Salaria.298la 1-00199 ROMA
ILRES S.A. 6, Rue du March&-aux-Herbes GO-1 728 LUXEMBOURG
NIPO B.V. Westerdokhuis, Barentzplein 7 NL-101 3 AMSTERDAM
NORMA - S.A. Av. Infante Santo 70-1 a l l P-1300 LISBOA
SOCIAL SURVEYS (GALLUP POLL) 307 Finchley Road, LONDON NW3 GEI-UK
Luc SCHULPEN tel. fax.
Rolf RANDRUP tel. fax.
Gunter BIERBAUM tel. fax.
Tilemachos DIB tel. fax.
Jaime MIQUEL ADRADA tel. Victoria MIQUEL
Roland CAYROL Stephane ROZES
Charles COYLE
Clara MARIOTTI
Louis MEVIS Charles MARGUE
Arnold WEIJTLAND
Armando HENRIQUES Susan CATITA
Bob WYBROW
fax.
tel. fax.
tel. fax.
tel. fax.
tel. fax.
tel. fax.
tel. fax.
tel. fax.
+ + I 3 2 2 2 1 5 1 9 3 0 + +I32 2 216 13 96
+ +I4539 27 27 27 + +I4521 182466
+ +I49 5212 600 10 + +M 5212 600 155
+ + I 3 0 1 7 2 4 9 6 5 7 + + D O 1723 11 62
+ + I34 1431 9 3 3 6 + +I34 1576 40 05
+ +I33 1401 30 290 + + 133 1402 89 O34
++ I35317611 96 + +I35 3176 O8 777
+ +I39 6841 35 57 + + 139 6854 O0 38
+ +I35 2475 0 2 1 + +I35 2462 62 O
+ +I31 2052 38 444 + +I31 2062 64 375
+ +I35 1179 67 604 ++I35 117973948
+ +I44 71 79 40 461 + +I44 7143 10 252

A7
FLASH 19 - SPECIFICATIONS TECHNIQUES
Entre le 8 et le 20 septembre 1993. EOS Gallup Europe, un reseau europeen d'agences d'etudes de marché et d'opinion publique, a réalise le FLASH 19 9 la demande de la COMMISSION EUROPEENNE par les douze Instituts dont la liste suit:
- PAYS INSTITUTS No INTERVIEWS DATES DE TERRAIN POPULATION1 5+(xOOO)
Belgium Denmark Germany Greece Spain France Ireland Italy Luxemburg The Netherla Portugal Great Britain
DIMARSO-BRUXELLES GALLUP-KOBENHAVN EMNID-BIELEFELD ICAP-ATHENS INTERGALLUP-MADRID GALLUP-PARIS IRISH MKTG-DUBLIN DOXA-MILANO ILRES-LUXEMBOURG
NORMA-LISBOA GALLUP-LONDON
nds NIPO-AMSTERDAM
500 509
500 503 499 500 504 500 502 501 501
484
16/09 - 20109 10109 - 14/09 10109 - 16/09
1 OIO9 - 17/09 09/09 - 10109 10109 - 15/09 14109 - 15/09 13/09 - 16/09
09/09 - 14/09
o m 9 - 13/09
09/09 - 18/09
13/09 - 18109
7 994.4 4 160.4
13 607.0
29 427.2 43 318.5
45 902.8 302.6
11 603.6
44 562.0
7 825.6
2 5a3.0
7 718.7
Chaque Bchantillon est nationalement reprhsentatif de la population continentale agBe de 15 ans et plus, avec les restrictions suil
ALLEMAGNE ESPAGNE GRECE GRAND-BRETAGNE IRELAND : I'agglomCration de Dublin PORTUGAL
: population des "Länder Ouest' : les 5 grandes agglomCrations urbaines : les 5 grandes agglomBrations urbaines : l'Irlande du Nord exclue
: les 4 grandes agglombrations urbaines
FLASH 20 - TECHNICAL SPECIFICATIONS
Between 31 st August and 16th September 1993, EOS Gallup Europe, a coordinating agency of European Marketing a
Opinion institutes, carried out FLASH 20 at the request of the EUROPEAN COMMISSION, with the assistance of the institutes:
COUNTRY INSTITUTES No INTERVIEWS FIELDWORK DATES POPULATION1 5 + Q
Belgium Denmark Germany Greece Spain France Ir e I and Italy Luxemburg The Netherlands Portugal Great Britain
DIMARSO-BRUXELLES GALLUP-KOBENHAVN EMNID-BIELEFELD ICAP- ATHENS INTERGALLUP-MADRID GALLU--PARIS IRISH MKTG-DUBLIN DOXA-MILANO ILRES-LUXEMBOURG NIPO-AMSTERDAM NORMA-LISBOA GALLUP-LONDON
541 509
1 O 0 0 500 504 503 502 500 501 503 502 502
11109 - 15/09 10109 - 14/09 31/08 - 13/09 o m 9 - 13/09
03/09 - o a m 09/09 - 15/09 02/09 - 03/09
10109 - 09/09 * 13/09 07/09 - 16/09 06/09 - 09/09 07/09 - 12/09
7 994.4 4 160.4
13 607.0
29 427.2 7 825.6
43 318.5 2 5a3.0
45 902.8
7 716.7
302.6 11 603.6
44 562.0
Each survey is nationally representative of the population in each country aged 15 and over, with the following exceptions:
GERMANY GREECE : 5 main urban areas GREAT BRITAIN ' Northern Ireland not included. IRELAND . Dublin area PORTUGAL ' 4 main urban areas SPAIN 5 main urban areas
all "Länder", but eastern face-to-face interviews
ites :
id Public illowing
a
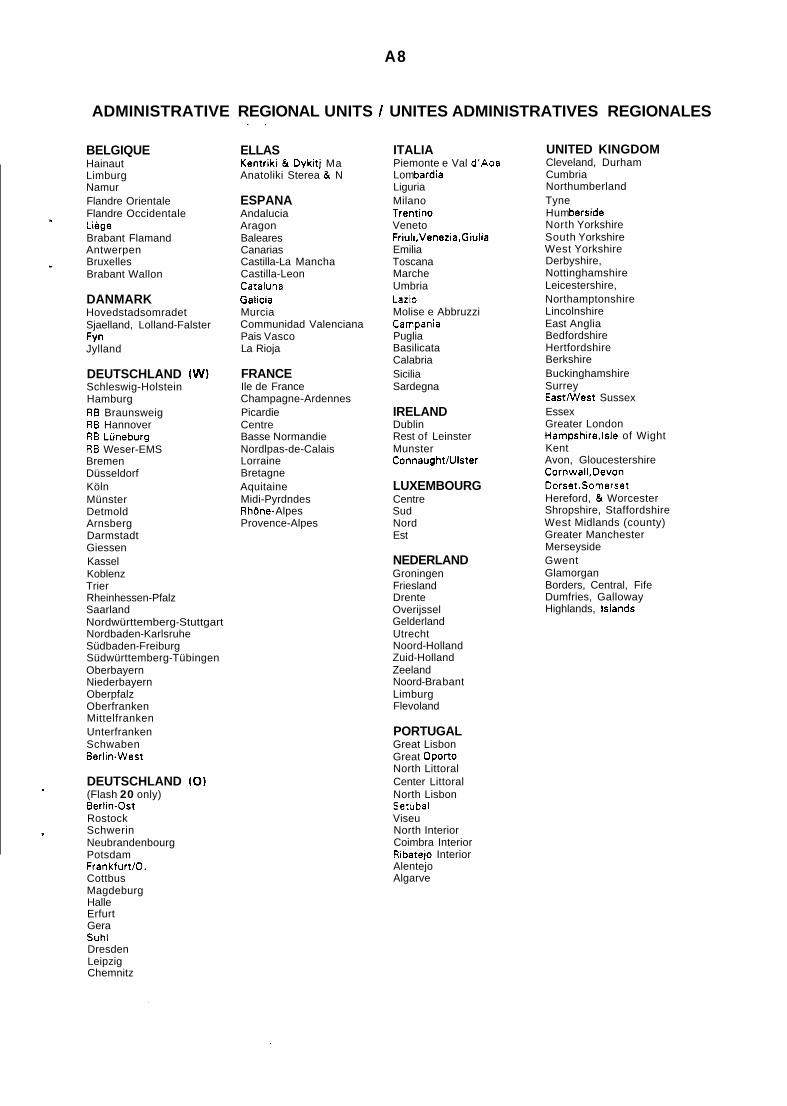
A8
ADMINISTRATIVE REGIONAL UNITS / UNITES ADMINISTRATIVES REGIONALES
BELGIQUE Hainaut Limburg Namur Flandre Orientale Flandre Occidentale Liege Brabant Flamand Antwerpen Bruxelles Brabant Wallon
DANMARK Hovedstadsomradet Sjaelland, Lolland-Falster Fyn Jylland
DEUTSCHLAND (W) Schleswig-Holstein Hamburg RB Braunsweig RB Hannover RB Lüneburg RB Weser-EMS Bremen Düsseldorf Köln Münster Detmold Arnsberg Darmstadt Giessen Kassel Koblenz Trier Rheinhessen-Pfalz Saarland Nordwürttemberg-Stuttgart Nordbaden-Karlsruhe Südbaden-Freiburg Südwürttemberg-Tübingen Oberbayern Niederbayern Oberpfalz Oberfranken Mittelfranken Unterfranken Schwaben Berlin-West
DEUTSCHLAND (O) (Flash 20 only) Berlin-Ost Rostock Schwerin Neubrandenbourg Potsdam Frankfurtlo. Cottbus Magdeburg Halle Erfurt Gera Suhl Dresden Leipzig Chemnitz
ELLAS Kentriki & Dykitj Ma Anatoliki Sterea & N
ESPANA Andalucia Aragon Baleares Canarias Castilla-La Mancha Castilla-Leon Cataluna Galicia Murcia Communidad Valenciana Pais Vasco La Rioja
FRANCE Ile de France Champagne-Ardennes Picardie Centre Basse Normandie Nordlpas-de-Calais Lorraine Bretagne Aquitaine Midi-Pyrdndes R hdne- Alpes Provence-Alpes
ITALIA Piemonte e Val d'Aoa Lom bardia Liguria Milano Trentino Veneto Friuli,Venezia,Giulia Emilia Toscana Marche Umbria Lazio Molise e Abbruzzi Campania Puglia Basilicata Calabria Sicilia Sardegna
IRELAND Dublin Rest of Leinster Munster ConnaughtlUlster
LUXEMBOURG Centre Sud Nord Est
NEDERLAND Groningen Friesland Drente Overijssel Gelderland Utrecht Noord-Holland Zuid-Holland Zeeland Noord-Bra bant Limburg Flevoland
PORTUGAL Great Lisbon Great Oporto North Littoral Center Littoral North Lisbon Setubal Viseu North Interior Coimbra Interior Ribatejo Interior Alentejo Algarve
UNITED KINGDOM Cleveland, Durham Cumbria Northumberland Tyne Hum berside North Yorkshire South Yorkshire West Yorkshire Derbyshire, Nottinghamshire Leicestershire, Northamptonshire Lincolnshire East Anglia Bedfordshire Hertfordshire Berkshire Buckinghamshire Surrey EastMlest Sussex Essex Greater London Hampshire,lsle of Wight Kent Avon, Gloucestershire Cornwal1,Devon Dorset,Somerset Hereford, & Worcester Shropshire, Staffordshire West Midlands (county) Greater Manchester Merseyside Gwent Glamorgan Borders, Central, Fife Dumfries, Galloway Highlands, Islands

A 9
CENTRAL AND EASTERN EUROBAROMETER No. 4 TECHNICAL SPECIFICATIONS / SPECIFICATIONS TECHNIQUES
CO-OPERATING AGENCIES AND RESEARCH EXECUTIVES INSTITUTS ET CHARGES D'ETUDES
Overall Co-ordination: DGX.B-SRA (EUROBAROMETER) Statistical Data Processing: GALLUP UK
Regional coordination: ROMIR for Belarus, European Russia and Armenia
AlSA undertook fieldwork in Czech Republic and Slovakia BBSS for Albania, Bulgaria, FYROM, Romania and Ukraine
Spiro DEDE tellfax. + +135542-28456 BRITALB Bul. Desmoret eb Kombit Nr. Tirana - ALBANIA
tel: + +178852-594648 fax: + +178852-550358
Department of Sociology Yerevan State University Yerevan - ARMENIA
Ludmila ARUTUNIAN
NOVAK 2201 13 Minsk Belinskij sti, 16/39 P.O. Box 157, Minsk - BELARUS
A. VARDOMATSKII tel: + + I701 72-683902 fax: + +I701 72-629266
Balkan British Social Surveys 6 AI. Jendov str. Sofia 1 13 - BULGARIA
AlSA Strasinska 31 1 O0 O0 Praha 1 O - CZECH REPUBLIC
Kancho STOICHEV tel. + +13592-7383701710' fax. + t13592-7398181717
37 20
31 85
201
I2 02
29 13 1
7.
?
Marek BOGUSZAK tel. + +1422-781-31591101 fax. + +1422-781-4311
Saar Poll Ltd Box 3336 EE0090 Tallin - ESTONIA
Andrus SAAR tel. + + 13722-43873514381 fax. + + 3722-31 24861423
MODUS Mazsa ter 2-6 1107 Budapest - HUNGARY
Latvian Facts P.O.BOX 248, Brivibas lela 86 Riga - LATVIA
Baltic Surveys, 47, Didlaukio Str., Vilnius 2057 - LITHUANIA
EmÖke LENGYEL tel. + +1361-1574773 tellfax. + +1361-1572445
Aigars FREIMANIS tel. + +13712-9348608 fax. + +I371 2-2749361 129
Rasa ALISHAUSKIENE tel. + + 13702-7627901762f fax. + + 13702-762681 1652
" BRI MA" V. Vlahovic 19/21 Skopje - FYROM
Pentor Ul. Flory 9m4 00-586 Warszawa - POLAND
SCOP 7325 1 Calea Mosilor 241 BI. 47, Sc. 1, Et. 1.. Apt. 3 Sector 2, Bucuresti 7000 - ROMANIA
ROMIR 2nd Brestskay U;, B.29a. Room 21 1 123056 MOSCOW - RUSSIA
Elida MEDAROVSKA Georgi KIMOV
tellfax. + +I3891 -223-625
Jacek DOHNALIK tel. + + 14822-4981 20 1498 fax. + + I48224981 51 149:
Andrei MOUSHATESCU tel.+ +1401-6198047 fax. + + 1401 -61 54345
Elena BASHKIROVA Andrei SUKOLOV
tel. + +17095-2519801173: fax. + + 17095-8827098
GRAL Marketing Dunajska 291IV 61 O00 Ljubljana - SLOVENIA
SOCIS 12, Shelkovychanaya Str. Kiev - UKRAINE
Rudi TAVCAR Janez DAMJAN
tel.+ +138661-311167 tellfax. + +138661-1323151
Tanya KOSHECHKINA tel. + +17044-291-5388 fax. + + 70441291 -6302

A10
CEEB 4 - TECHNICAL SPECIFICATIONS
Between 1st November and 5th December 1993 the institutes listed above conducted the fourth wave of the Central and Eartern EUROBAROMETER with the help of the European Commission. Directorate General X for Information, Communication, Cdwe. Audiovisual, "Surveys, Research, Analyses, (EUROBAROMETER)" Unit. In total 16,716 citizens aged 15 years and over w e e interviewed face-to-face in their private residences in Central and Eastern Europe as a whole. The survey was fully namnally-representative.
A r with Central and Eastern EUROBAROMETER No. 2 and No. 3, each institute adopted a multi-stage random probability tampie design. There were slight variations in each country's sample design to take account of its individual characteristics a d OoOulation structure. In each of the 16 countries surveyed, . t t natmonal boundaries.
INSTITUTES
BRITALB Yerevan Univ. NOVAK BESS AlSA Saar Poll BRIMA Skopje MODUS Latvian Facts Baltic Surveys Pentor SCOP ROMIR AlSA Gral Marketing SOCIS
No INTERVIEWS
1 .O54 1 .o00 1.143 1.198 81 7
1 .Ol 1 1 .O97 972 992
1 .o20 1 .O04 1.176 1.377 684
1 .O00 1.171
TolAl 16.716
interviews were conducted throughout every region within
FIELDWORK DATES POPULATION1 5 + (~000)
25 November - 5 December 2 November - 25 November 6 November - 27 November 5 November - 13 November 4 November - 23 November 4 November - 1 1 November 15 November - 23 November 5 November - 14 November 17 November - 27 November 1 O November - 17 November 13 November - 18 November 13 November - 25 November 1 November - 14 November 5 November - 18 November 25 November - 29 November 17 November - 5 December
1st November - 5th December
2.242 2.300 7.815 6.800 8.138 1.222 1.354 8.374 2.096 2.842 28.239 17.730 88.772 3.960 1.562 40.343
.'.+vrr! possible, the results for each country were post-weighted by a matrix of highest level of education completed within a j ? and also according to the regional distribution of the country's adult population. Where information was not available for rr)trcaiqon within age, the results were weighted by each factor separately, and also by region.
b\,cqntlng by an interlocking matrix of age and education was possible in: Armenia, Belarus, Czech Republic, Estonia, Hungary, L,thuanla. Poland, European Russia, Slovakia and Slovenia. The overall results for Central and Eastern Europe as a whole were w*c@qhted according to each country's 15 + population. The data for each country's population by age, education and region was provided by participating national institutes.
CEEB4 - SPECIFICATIONS TECHNIQUES
Entre le 1 er novembre et le 5 dkembre 1993, les instituts repris ci-dessus ont realise la q u a t r i h e vague de I'EUROBAROMETRE d'Europe centrale et de l'Est avec la participation de l'Unité "Recherches, Sondages, Analyses" de la Direction Générale X pour l'Information, la Communication, la Culture et l'Audiovisuel de la Commission EuropBenne. En tout. ce sont ainsi 16.71 6 citoyens de l'ensemble de l'Europe centrale et de l'Est et âges d'au moins 15 ans, qui ont et6 interrogks en "face-&face" B leur domicile priv&. L'Btude est pleinement representative sur le plan national.
Comme lors des EUROBAROMETRES d'Europe centrale et de l'Est NO 2 et 3, tous les instituts ont adopte un mode d'echantillonnage par selection aleatoire A phases multiples. Le mode d'6chantillonnage a quelque peu varie selon les pays pour tenir compte des caracteristiques locales et de la structure de la population. Dans chacun des 16 pays btudibs, dek interrogatoires ont eté realises dans toutes les regions situées B I'intbrieur des frontieres nationales.
Partout oÙ cela a 616 possible, les resultats de chaque pays ont ete ponderes par la suite grâce B une matrice reprenant le plus haut degre de scolarite acheve en fonction de I'âge ainsi qu'en tenant compte de la distribution regionale de la population adulte du pays. LB où manquaient les donnees de scolarite en fonction de I'âge, les resultats ont etb ponderes pour chaque facteur pris separ&ment ainsi que par région.
II a &té possible de ponderer grâce B une matrice liant I'âge et la scolarite en: Armhie. Bidorussie, Estonie, Hongrie, Lituanie, Pologne, Russie europbenne, Slovaquie, Slovénie et TchBquie. Les resultats globaux de l'ensemble de l'Europe centrale et de l'Est ont 616 ponderes en fonction de la taille de la population âgee de plus de 15 ans de chacun des pays. Pour chaque pays. les donnees decrivant la population selon I'âge, l'instruction et la region d'habitation ont etb fournies par les instituts nation,aux participants.

A l 1
Albania Tirana Northern Central Southern
Czech Republic Prague Central Bohemia Southern Bohemia Western Bohemia Northern Bohemia Eastern Bohemia Southern Moravia Northern Moravia
Latvia Riga Vldzeme Zemg ale Kurzeme Latg ale
European Russia Northern Northern-Western Central Volgo-Vjats ky Central (Black Earth) Along Volga North Caucasian Urals
CEEB 4 - ADMINISTRATIVE REGIONAL UNITS / UNITES ADMINISTRATIVES REGIONALES
Armenia Ararat Sevan Central Shirak Lory Yerevan North-Eastern Vai Zangezur
Estonia North-Western North-Eastern South-Eastern South-Western Western
Lithuania Zemaitija Aukstaitija Suval kija Dzuki'ja Pietrycui Lietuva
Slovakia Bratislava Central Slovakia Eastern Slovakia West Slovakia
Belarus Brest Vitebsk Gomel Grodno Minsk (city) Minsk (district) Mogiljev
FYROM Skops ki Pelagoniski Ohrid Polostaski Bregalnicki Kumanovs ki Povardarski
Poland Central Eastern Little Poland'Southern Silesia Western Pomerania Great Poland
Slovenia Gorenjska Primors ka Osrednja Slovenija Koroska in Savinjska Dolenjska in Posavje Stajerska in Prekmurje
Bulgaria Varna Razgrad Mihailovgrad lovetch Sofia (city) Sofia (district) Plovdiv Bourgas Haskovo
Hungary Central Northern Hung Northern Great Southern Greal Southern Tran: Northern Trans
Romania Oltenia Muntenia Dobrogea Moldova Transilvania Crisana-Maram Banat Bucuresti
U kraine Kiev Northern Central North-Eastern North-Western Eastern Western South Western South Krym
'Y Yain 'lain lanubia anubia
res,

A l 2
LIST OF GRAPHICS / LISTE DES GRAPHIQUES
Fig u re Tit I e/Ti t re Page
1.1
1.2
1.3
1.4
1.5
1.6
TOP PROBLEM FACING THE EC CITIZENS IN 1974 (EC91 AND 1993 (EC12)/ Problème majeur pour les citoyens CE -1974 (CE91 et 1993 (CE12) . . . . . 4
END OF 1993 : EXPECTATIONS FOR NEXT YEAR (1994) / Fin 1993: Attentes pour l'année prochaine (1 994) . . . . . . . . . . . . . . . . . . . . . . . . . . . . . . . 6
ECONOMIC SITUATION : COMPARED TO LAST YEAR - BETTER OR WORSE ? / Situation économique: comparée à l'année dernière - meilleure ou moins bonne ? . . . . . . . . . . . . . . . . . . . . . . . . . . . . . . . . . . . . . . . . . . . . . . . . . . . . 6
EC CITIZENS: UNEMPLOYMENT EVEN WORSE NOW (THAN AUTUMN 1992) / Citoyens CE : Chômage encore pire maintenant (qu'en automne 1992) . . . . . . . . . . . . . . . . . . . . . . . . . . . . . . . . . . . . . . . . . . . . . . . 9
EMPLOYMENT NEXT YEAR - NOT MUCH BETTER / Emploi l'année prochaine - pas beaucoup mieux . . . . . . . . . . . . . . . . . . . . . . . . . . . . . . . . . . . . . . 9
SATISFIED WITH DEMOCRACY IN ONE'S COUNTRY? 1976-1993 EC12 / 11 Satisfait de la démocratie dans son pays ? 1976-1993 CE12 . . . . . . . . .
1.7 a-I SUPPORT FOR EUROPEAN INTEGRATION AND THE COMMUNITY 1981 1993/ Soutien à l'intégration européenne e t à la Communauté . . . . . . . . . . . 13-27
1.8
1.9
1.10
1.11
2.1
COUNTRY'S NET BENEFIT FROM EC (IN 1989 AND 1993) - % "BENEFITED" MINUS % "NOT BENEFITED"/ Bénéfice net de la CE pour le pays (en 1989 et 1993) - % "a bénéficié" moins % "n'a pas bénéficié" . . . . . . . . . . . . . . 29
CHANGE IN EMPLOYMENT (MIO) AND EC-MEMBERSHIP SUPPORT % - EC12 (ANNUAL AVERAGE FOR "MEMBERSHIP") / Evolution de l'emploi (MIO) et du soutien à l'appartenance CE YO - CE12 (moyenne annuelle pour "l'appartenance") . . . . . . . . . . . . . . . . . . . . . . . . . . . . . . . . . . . . . . . 29
THE "EURO-DYNAMOMETER" (EC1 2 AVERAGE ON 7-POINT SCALE -TREND) - EUROPE'S PROGRESS: PERCEIVED CURRENT SPEED, DESIRED SPEED/ L'"Eure-
Dynamomètre" (moyenne CE12 sur une échelle de 7 points -trend) -La progression de l'Europe: vitesse actuelle percue, vitesse souhaitée . . . . . 31
AWARENESS AND IMPORTANCE OF THE EC PRESIDENCY/ Notoriété e t importance de la présidence CE . . . . . . . . . . . . . . . . . . . . . . . . . . . . . 33
AWARENESS OF EUROPEAN COMMUNITY AND ITS INSTITUTIONS IN THE MEDIA "RECENTLY"/ Notoriété "récente" de la Communauté européenne et de ses institutions dans les médias . . . . . . . . . . . . . . . . . . . . . . . . . . . . . 37

2.2
2.3
2.4
i. 5
2.6
2.7
2.8
2.9
2.10
2.1 1
2.1 2
2.13
2.14
3.1
3.2
3.3
Al 3
AWARENESS AND FEELING (UN)INFORMED ABOUT THE EUROPEAN COMMUNITY (1991-1993) - EC12 / Notoriété et sentiment d'être ou non informé sur la Communauté européenne (1991-1993) . CE12 . . . . . . . . 37
INTEREST IN EC AFFAIRS / Intérêt pour les affaires CE . . . . . . . . . . . . . 39
FEELING WELL INFORMED OR NOT ABOUT THE EC / Sentiment d'être ou non I bien informé sur la CE . . . . . . . . . . . . . . . . . . . . . . . . . . . . . . . . . . . 39
* HOW MUCH MORE INFORMATION DESIRED ABOUT THE EC ? / Informations - supplémentaires sur la CE - Quel souhait ? . . . . . . . . . . . . . . . . . . . . . 41
HOW MUCH MORE INFORMATION DESIRED BY .... EC12 / lnfor ations 41
WHAT KIND OF INFORMATION WANTED ? - EC12 / Type d'infor ations souhaitées ? CE12 . . . . . . . . . . . . . . . . . . . . . . . . . . . . . . . . . . . . . t 43
WHERE WOULD YOU LOOK FOR MORE INFORMATION ABOUT TH E C ? - EC1 2 / Où chercheriez-vous des info. supplémentaires sur la CE ? . . . . 43
AWARENESS OF SPECIALISED AGENCIES GIVING EC INFORMATION / torieté . . . . . . . . . . . 45
WHO SHOULD PROVIDE EC INFORMATION? - EC12 / Qui devrait fo rnir des
.1" supplémentaires . Souhaitée par .... CE1 2 . . . . . . . . . . . . . . . . . . . i I . .
des agences spécialisées fournissant des info. sur la CE
info. sur la CE? . CE12 . . . . . . . . . . . . . . . . . . . . . . . . . . . . . . . . . . . 45
rouge" (télephone/téléfax) pour des informations CE . CE12 . . . . . . . . .
Utiliser l'argent du contribuable pour informer sur la CE par la TV?
TELEPHONE/TELEFAX "HOTLINE" FOR EC INFORMATION - EC1 2 "Ligne 47
EC ? / 47
nouvelles" sur les médias en 1993 . index de fréquence 49
NEWS ON MASS MEDIA 1980-1993 - % "EVERYDAY USERS" - EC1 / % de "consommateurs quotidiens" de "nouvelles" sur les médias ( 1 980 1993) - CE12 . . . . . . . . . . . . . . . . . . . . . . . . . . . . . . . . . . . . . . . . . . . . . . . . 49
NEWS ON MASS MEDIA 1993 FREQUENCY OF USE INDEX/ "Consom ation de
AWARENESS OF EC ISSUES IN THE MEDIA "RECENTLY" - EC12 I
USE TAX PAYERS' MONEY FOR TELEVISION INFO-ADVERTISING O . . . .
i .i :
. . . . . . . . . . .
'~
"récente" des questions CE dans les médias 55
FOR OR AGAINST Maastricht . . . . .
FOR OR AGAINST:
THE MAASTRICHT TREATY / Pour ou contre le raité de . . . . . . . . . . . . . . . . . . . . . . . . . . . . . . . . . . . . . Î 55
- EC12 / Pour ou contre: - CE12/ . . . . . . . . . . 1 . . . 57 i

A14
3.4
3.5
3.6 L
i 3.7
~
3.8
3.9
3.10
4.1
4.2
4.3
I 4.4
5.1
5.2
~' 5.3
~
5.4
FOR OR AGAINST: EU N.ON-NATIONALS VOTE AT EP ELECTIONS / Pour ou contre: vote des citoyens UE non-nationaux aux élections PE . . . . . . . . . 57
SINGLE EUROPEAN CURRENCY / Monnaie Unique Européenne . . . . . . . 59
"NET APPROVAL" OF SINGLE EUROPEAN CURRENCY -DK, D, UK, EC12/ "Approbation nette" de la Monnaie Unique Européenne . . . . . . . . . . . . 59
NATIONAL OR JOINT EC DECISION MAKING? 18 POLICY AREAS - EC12/ Législations nationales ou CE? 18 domaines politiques - CE1 2 . . . . . . . . 61
SINGLE MARKET - HOPE OR FEAR ? (1988-1993) - EC12 / Marché Unique - Espoir ou crainte? (1988-1993) - CE12 . . . . . . . . . . . . . . . . . . . . . . . . 66
THE SINGLE MARKET ADVANTAGEOUS FOR OWN COUNTRY ? / Marché Unique: avantageux pour son pays? . . . . . . . . . . . . . . . . . . . . . . . . . . 68
GREATER EC RESPONSIBILITY FOR RESOLVING CONFLICTS IN THE WORLD / Plus grande responsabilité CE pour résoudre les conflits dans le monde . . 68
MOST IMPORTANT PROBLEM FACING EUROPEAN COMMUNITY - EC12 / Problème le plus important pour la Communauté européenne-CE12 . . . . . 74
PERCEIVED MAJOR CAUSE OF UNEMPLOYMENT - EC12 / Chômage: principale cause percue - CE1 2 . . . . . . . . . . . . . . . . . . . . . . . . . . . . . . . . . . . . 74
WORRIED ABOUT BEING MADE TO STOP WORK - EC1 2 / Soucis de perdre son emploi CE12 . . . . . . . . . . . . . . . . . . . . . . . . . . . . . . . . . . . . . . . . . . 80
READINESS TO PAY MORE TAX TO CREATE NEW JOBS / Prêt a payer plus d'impôts pour créer de nouveaux emplois? . . . . . . . . . . . . . . . . . . . . . 80
FOR OR AGAINST GUARANTEEING CERTAIN RIGHTS FOR ALL - EC12 / Pour ou contre la garantie de certains droits pour tous - CE1 2 . . . . . . . . . . . . 84
NATIONAL AND EUROPEAN IDENTITY: DO YOU SEE YOURSELF IN THE NEAR FUTURE AS ... / Identité nationale et européenne: Vous voyez-vous dans un avenir proche ... . . . . . . . . . . . . . . . . . . . . . . . . . . . . . . . . . . . . . . . 84
EUROPEAN COURT OF JUSTICE - EC12 / Cour européenne de Justice CE1 8 6
EUROPEAN COURT OF JUSTICE - USUALLY TRUSTED TO MAKE RIGHT DECISIONS/ Cour européenne de Justice - Habituellement percue comme prenant des décisions justes . . . . . . . . . . . . . . . . . . . . . . . . . . . . . . . . . . . . . 86
A l 5
LIST. OF ,TABLES 1 LISTE DES TABLEAUX
Table/Tableau 1 : MOST IMPORTANT EC PROBLEMS IN 1974 AND 1993 / Les problèmes les plus importants de la CE en 1974 et 1993 (%, by Country/ par pays) . . . . . . . . . . . . . . . . . . . . . . . . . . . . . . . . . . . . . . . . . . . . . . . . . . . . . . . . A20
TablelTableau 2 : NEXT YEAR : BETTER OR WORSE ? / L'année prochaine : meilleurei ou moins bonne ? (%, by country/par pays) . . . . . . . . . . . . . . . . . . . . . . . . . A23
s Table/Tableau 3 : PERCEIVED CHANGES IN COUNTRY'S ECONOMIC SITUATION -PAST 12 MONTHS / Evaluation des changements de la situation économique du pays - 12 derniers mois (%, by country/par pays) . . . . . . . . . . . . . . . . . . . . . . . . . . . . A23
Table/Tableau 4 : ANTICIPATED CHANGES IN COUNTRY'S ECONOMIC SITUATION - NEXT 12 MONTHS / Evaluation des changements de la situation economique d pays - 12 prochains mois (%, by country/par pays) . . . . . . . . . . . . . . . . . . . . . . . A24
TabWTableau 5 : PERCEIVED CHANGES IN FINANCIAL SITUATION O OWN HOUSEHOLD - PAST 12 MONTHS / Changements percus dans la situation fina cière de
A24
Table/Tableau 6 : ANTICIPATED CHANGES IN FINANCIAL SITUATION F OWN HOUSEHOLD - NEXT 12 MONTHS / Evaluation des changements de la situati n finan- cière de son ménage - 12 prochains mois (%, by country/ par pays) . . . . . . . A25
OWN HOUSEHOLD IN CENTRAL AND EASTERN EUROPE - PAST 12 MONTHS / Chan ements percus dans la situation financière de son ménage en Europe Centrale et de I Est - 12
TablelTableau 7 : PERCEIVED CHANGES IN FINANCIAL SITUATION
son ménage - 12 derniers mois (%, by country/par pays) . . . . . . . . . . . . . . .
. . . . . . . . . . . . . . . . . . . . . . . . . . derniers po i s (%, by country/par pays) I - I A25
Table/Tableau 8 : ANTICIPATED CHANGES IN FINANCIAL SITUATION HOUSEHOLD IN CENTRAL AND EASTERN EUROPE - NEXT 12 MONTHS /Eval changements de la situation financière de son ménage en Europe Centrale et 12 prochains mois (%, by country/par pays) . . . . . . . . . . . . . . . . . . . . .
Table/Tableau 9 : PERCEIVED CHANGES IN COUNTRY'S EMPLOYMENT SI PAST 12 MONTHS / Changements percus dans la situation de l'emploi dans derniers mois (%, by country/par pays) . . . . . . . . . . . . . . . . . . . . . . . .
Table/Tableau 1 O : ANTICIPATED CHANGES IN COUNTRY'S EMPLOYMENT - NEXT 12 MONTHS / Evaluation des changements de la situation de I'emp 12 prochains mois (%, by country/par pays) . . . . . . . . . . . . . . . . . . .
Table/Tableau 11 : PERCEIVED CHANGES IN OWN JOB SITUATION MONTHS / Changements percus dans sa propre situation professionnelle - mois (%, by country/par pays, all actives + unemployed/tous les a chômeurs) . . . . . . . . . . . . . . . . . . . . . . . . . . . . . . . . . . . . . . . . . . .

i
Table/Tableau 12: ANTICIPATED CHANGES IN OWN JOB SITUATION - NEXT 12 MONTHS / Evaluation des changements de sa propre situation professionnelle - 12 prochains mois (%, by country/par pays, all actives + unemployed/ tous les actifs i- les chômeurs) . . . . . . . . . . . . . . . . . . . . . . . . . . . . . . . . . . . . . . . . . . . . . . . . A28
Table/Tableau 13 : SATISFACTION WITH DEMOCRACY IN OWN COUNTRY / Satisfaction à I'égard de la démocratie dans són pays (%, by country/ par pays) . . . . . . . . . . . . . . . . . . . . . . . . . . . . . . . . . . . . . . . . . . . . . . . . . . . . . . . . . A28
Table/Tableau 14 : SATISFACTION WITH DEMOCRACY IN THE EC / La satisfaction à I'égard de la démocratie dans la CE (%, by country/par pays) . . . . . . . . . . . . A 2 9
Table/Tableau 15 : SUPPORT FOR UNIFICATION OF WESTERN EUROPE / Appui B A29 l'unification de l'Europe occidentale (%, by country/par pays) . . . . . . . . . . . . .
l'able/Tableau 16 : EC MEMBERSHIP: "GOOD THING" / Appartenance à la CE: "une bonne chose" (%, by country/par pays) . . . . . . . . . . . . . . . . . . . . . . . . . . . . A 3 0
Table/Tableau 17 : HAS ONE'S COUNTRY BENEFITED FROM EC MEMBERSHIP ? / Son pays a-t-il bénéficié de son appartenance à la CE (%, by country/par pays) . . . A30
Table/Tableau 1 8 : ATTITUDE IF EUROPEAN COMMUNITY HAD BEEN SCRAPPED / L'attitude en cas d'abandon de la Communauté Européenne ? (%, by country ' par pays) . . . . . . . . . . . . . . . . . . . . . . . . . . . . . . . . . . . . . . . . . . . . . . . . . . . A31
Table/Tableau 19 : "EURO-DYNAMOMETER" / L'"Eure-Dynamomètre" (%, by countryl parpays) . . . . . . . . . . . . . . . . . . . . . . . . . . . . . . . . . . . . . . . . . . . . . . . . . A32
Table/Tableau 20 : FORA EUROPEAN GOVERNMENT RESPONSIBLE TO THE EUROPEAN PARLIAMENT / Pour un gouvernement européen responsable devant le Parlement
A33 Européen (%, by country/par pays) . . . . . . . . . . . . . . . . . . . . . . . . . . . . . . .
Table/Tableau 21 : IMPRESSION OF THE EUROPEAN COMMISSION / L'impression SUI
la Commission Européenne (% of those who have heard RECENTLY of the European Commission, by country / % de ceux qui ont entendu RECEMMENT quelque chose au sujet de la Commission Européenne, par pays) . . . . . . . . . . . . . . . . . . . . . . . A33
Table/Tableau 22 : AWARENESS AND IMPORTANCE OF COUNCIL PRESIDENCY I Notoriété et importance de la présidence du Conseil (YO, 1986-1993) . . . . . . . A34
Table/Tableau 23 : AWARENESS OF EUROPEAN COMMUNITY / La notorikt6 do Is Communauté Européenne (%, by country/par pays)l . . . . . . . . . . . . . . . . . . . A35
Table/Tableau 24 : AWARENESS OF EUROPEAN INSTITUTIONS / La notorikte des institutions européennes (%, by country/par pays) . . . . . . . . . . . . . . . . . . . . A35
Table/Tableau 2 5 : INTEREST IN EUROPEAN POLITICS / Intérêt pour la politique A 3 6 européenne (%, by country/ par pays) . . . . . . . . . . . . . . . . . . . . . . . . . . . . .

A l 7
Table/Tableau 26 : FEELING INFORMED ABOUT THE EUROPEAN COMMUNITY ' Sentiment d'être informé sur la Communauté Européenne (% , by country / par pays) . . . . . . . . . . . . . . . . . . . . . . . . . . . . . . . . . . . . . . . . . . . . . . . . . . . A36
Table/Tableau 27 : NEED FOR EC INFORMATION I Besoin d'informations sur la CE (YO, by country / par pays) . . . . . . . . . . . . . . . . . . . . . . . . . . . . . . . . . . . . . . . . A37
c
Table/Tableau 28 : NEED FOR EC INFORMATION I Besoin d'informations sur la CE (%, EC 12 + , by socio-demographic and socio-political variabledpar variables socio- demographiques et socio-politiques) . . . . . . . . . . . . . . . . . . . . . . . . . . . . . . A38
fable Tableau 29 : TYPEGOF EC INFORMATION REQUIRED ? I Quel type d'info sur Irr CE est demandé ? (YO, only those who said they needed a lot or son mformation/ Uniquement posé à ceux qui disent avoir besoin d'un peu ou br d'mformation, by country/par pays) . . . . . . . . . . . . . . . . . . . . . . . . . . . . .
Table Tableau 30 : EC INFORMATION SOURCES I Sources d'information sur la bv country/par pays) . . . . . . . . . . . . . . . . . . . . . . . . . . . . . . . . . . . . . .
Tabie Tableau 31 : AWARENESS OF INFORMATION SERVICES ABOUT THE Notorititti des services d'information sur la CE (YO, by country/par pays) . . . .
Table Tableau 3 2 : WHO SHOULD PROVIDE INFORMATION ABOUT THE EC devrait fournir des informations sur la CE ? (YO, by country/par pays) . . . . . . .
TablerTableau 33 : EC "HOT LINE" : A GOOD IDEA ? / "Téléphone rouge" C bonne idée ? (YO, by country/par pays)
TablejTableau 34 : BUYING TIME ON TELEVISION / Achat de temps d'antennr country/par pays) . . . . . . . . . . . . . . . . . . . . . . . . . . . . . . . . . . . . . . . . .
. . . . . . . . . . . . . . . . . . . . . . . . . .
Table/Tableau 35 : MEDIA USE / Recours aux médias (% , by country/ par pa . . . . . . . . . . . . . . . . . . . . . . . . . . . . . . . . . . . . . . . . . . . . . . . . . . . . . .
Table/Tableau 36 : MEDIA USE / Recours aux médias (YO, EC12+/CE12+, b demographic and socio-political variables/ par variables socio-démographiques r po I it iques) . . . . . . . . . . . . . . . . . . . . . . . . . . . . . . . . . . . . . . . . . . . . . .
Table/Tableau 37 : MEDIA USE / Recours aux médias (YO, EC1 2 + /CE1 2 +, b demographic and socio-political variables/ par variables socio-démographiques r politiques) . . . . . . . . . . . . . . . . . . . . . . . . . . . . . . . . . . . . . . . . . . . . . .
européennes (YO, by country/par pays)
(%, by country/par pays) . . . . . . . . . . . . . . . . . . . . . . . . . . . . . . . . . . . .
Table/Tableau 38 : AWARENESS OF EUROPEAN POLICIES I La notoriété des pc . . . . . . . . . . . . . . . . . . . . . . . . . .
Table/Tableau 39 : MAASTRICHT: FOR OR AGAINST ? I Maastricht: pour ou
mation : more lucoup . A39
:E (Yo, . A40
E C ? I . A41
? I Qui . A42
: : une . A43
(%, & . A43
S) . A44
socio- socio- . A45 - socio- . socio- . A46
litiques . A49
:ontre? . A50

A l 8
Table/Tableau 40 : OPINION ON MAASTRICHT PROPOSALS / Opinion à I'égard des propositions de Maastricht (%, by country/par pays) . . . . . . . . . . . . . . . . . . . A51
Table/Tableau 41 : NATIONAL OR JOINT COMMUNITY DECISION MAKING ? / Décisions nationales ou en commun au sein de la Communauté? (YO, by country/par pays) . A53
Table/Tableau 42 : THE SINGLE EUROPEAN MARKET OF 1992 : HOPE OR FEAR ? / Le Grand Marché Européen de 1992 : espoir ou crainte? (YO, by country/par pays) . A55
Table/Tableau 43 : SINGLE EUROPEAN MARKET ADVANTAGEOUS OR NOT TO OWN COUNTRY ? / Le Marché Unique: avantage ou désavantage pour son propre pays ? (Yo,
3
by country/par pays) . . . . . . . . . . . . . . . . . . . . . . . . . . . . . . . . . . . . . . . . . A55
Table/Tableau 44 : SINGLE MARKET BORDER CONTROL / Contrôles aux frontières à l'intérieur du Marché Unique (YO, by country, only for Belgium, Germany, France, the Netherlands/ par pays, uniquement la Belgique, l'Allemagne, la France et les Pays- Bas) . . . . . . . . . . . . . . . . . . . . . . . . . . . . . . . . . . . . . . . . . . . . . . . . . . . . A56
Table/Tableau 45 : EC COUNTRIES VISITED IN 1993 / Pays de la CE visités en 1993 (%, by country/par pays) . . . . . . . . . . . . . . . . . . . . . . . . . . . . . . . . . . . . . . A57
Table/Tableau 46 : EC BORDER-CHECKS OR NOT ? / Contrôles effectués aux frontières de la CE (YO, by country/par pays, only those who travelled/uniquement ceux qui ont voyagé) . . . . . . . . . . . . . . . . . . . . . . . . . . . . . . . . . . . . . . . . . . . . . . . . . . A58
Table/Tableau 47 : CAN CITIZENS MOVE AND SETTLE FREELY WITHIN EC TODAY ? / Les citoyens peuvent-ils aujourd'hui circuler et s'établir librement dans la CE ? (%, by country/par pays) . . . . . . . . . . . . . . . . . . . . . . . . . . . . . . . . . . . . . . . . . . . A58
Table/Tableau 48 : NO UNITED EUROPE WITHOUT FREE MOVEMENT OF CITIZENS ? / Pas de véritable Europe unie sans libre circulation des citoyens ? (YO, by country/par pays) . . . . . . . . . . . . . . . . . . . . . . . . . . . . . . . . . . . . . . . . . . . . . . . . . . . A59
Table/Tableau 49 : GREATER EC RESPONSIBILITY IN SOLVING WORLD CONFLICTS ? / Plus de responsabilités pour la CE pour résoudre les conflits dans le monde ? (%, by country/par pays) . . . . . . . . . . . . . . . . . . . . . . . . . . . . . . . . . . . . . . . . . . . A59
. important pour la CE (%, by country/par pays) . . . . . . . . . . . . . . . . . . . . . . . A60 Table/Tableau 50 : MOST IMPORTANT PROBLEM FACING THE EC / Le problème le plus
TabJe/Tableau 51 : MAJOR CAUSE OF EC UNEMPLOYMENT / La principale cause du chômage dans la CE (YO, by country/par pays) . . . . . . . . . . . . . . . . . . . . . . . . A60
Table/Tableau 52 : PRIORITY TO FIGHT UNEMPLOYMENT / La priorité pour lutter contre le chômage (%, by country/par pays) . . . . . . . . . . . . . . . . . . . . . . . . . . . . . A61

A l 9
Table/Tableau 53 : PRIORIN TO FIGHT UNEMPLOYMENT / La priorité pour lutter contre te chômage (%, by country/par pays) . . . . . . . . . . . . . . . . . . . . . . . . . . . . . A62
Table/Tableau 54 : SUPPORT FOR JOB-SHARING / Soutien au partage du travail (%, by country and by occupation/par pays et par profession) . . . . . . . . . . . . . . . . . A63
Table/Tableau 55 : FIXED OR FLEXIBLE WORKING TIME PREFERED 1 / Préférence poul' des horaires fixes ou flexibles ? (%, by country and by occupation/par pays et par profession) . . . . . . . . . . . . . . . . . . . . . . . . . . . . . . . . . . . . . . . . . . . . . . . A65
Table/Tableau 56 : LESS SALARY FOR CHOOSING YOUR OWN FLEXITIME ? / Moins de salaire afin de choisir son propre horaire flexible ? (YO, by country and by occupation/par pays et par profession) . . . . . . . . . . . . . . . . . . . . . . . . . . . . . . . . . . . . . . . A66
Table/Tableau 57 : MORE SALARY FOR IMPOSED FLEXITIME ? / Plus de salairi horaire flexible imposé ? (%, by country/par pays) . . . . . . . . . . . . . . . . . .
Table/Tableau 58 : VOCATIONAL TRAINING DURING THE LAST 5 YEARS / FO professionnelles ces cinq dernières années (%, by country and by occupation/ et par profession) . . . . . . . . . . . . . . . . . . . . . . . . . . . . . . . . . . . . . . . .
Table/Tableau 59 : FEAR OF UNEMPLOYMENT / Crainte de perte d'emploi (% by country and by occupation/ par pays e t par profession, only those working ( on others working / uniquement ceux qui travaillent et ceux qui dépendent d'a travaillent) . . . . . . . . . . . . . . . . . . . . . . . . . . . . . . . . . . . . . . . . . . . . . .
Table/Tableau 60 : VOCATIONAL TRAINING / Formation professionnelle (YO EC country and by occupation/ par pays et par profession, only those working or ri others working / uniquement ceux qui travaillent et ceux qui dépendent d'ai travaillent) . . . . . . . . . . . . . . . . . . . . . . . . . . . . . . . . . . . . . . . . . . . . .
Table/Tableau 61 : INCRE~ASE TAX TO CREATE JOBS / Plus d'impôts pour nouveaux emplois (%, by country/par pays) . . . . . . . . . . . . . . . . . . . . . . . .
Table/Tableau 62 : UNEMPLOYMENT ELIMINATED BY YEAR 2000 ? / Le éliminé d'ici l'an 2000 ? (YO, by country/par pays) . . . . . . . . . . . . . . . . . . .
Table/Tableau 63 : THE RIGHT TO LIVE WITH D I G N I N / Le droit de vivre dignei by country/par pays) . . . . . . . . . . . . . . . . . . . . . . . . . . . . . . . . . . . . . . .
Table/Tableau 64 : NATIONAL IDENTITY, EUROPEAN IDENTITY / Identité n identité européenne (YO, by country/par pays) . . . . . . . . . . . . . . . . . . . . . .
Table/Tableau 65 : TRUST IN EUROPEAN COURT DECISIONS / La confiance décisions de la Cour de Justice Européenne (%, by country/par pays) . . . . .
pour un , . A67
mations lar pays . . A68
ic12+, v relying tres qui . . A69
2+, by lying on tres qui . . A70
:réer de . A70
iômage . A71
lent (%, . . A71 :
Itionale, , . A73
jans les . A74

A20
Table/Tableau 1 : MOST IMPORTANT EC PRO- N 1974 AND 1993 I Les problèmes les p lus importants de l a CE en 1974 e t 1993 ( X , by country/par pays)
QUESTION EB40: The twelve menber countr ies o f the European Comnuni t y are together t r y i n g t o solve a ce r t a i n nunber of cannon problems. Here i s a l i s t of some o f them. Could you please t e l l me which one o f these problems, you th ink, i s the most important a t the present time. A n d which i s the next most important problem ? / Les douze pays “ b r e s de l a Comrunauté Européenne essayent de résoudre ensemble un ce r t a i n nombre de problknes comnuns. En vo i c i quelques uns. Pouvez-vous me d i r e lequel de ces problèmes est actuellement Le p lus inpor tant ? E t lequel v ien t en second l i e u ?
QUESTION EB1: l h e n ine countr ies of the EEC - The Comon Market - are together deal ing u i t h a nunber o f shared problems. Here i s a l i s t o f them. Could you please t e l l me which one o f these problems i s the most important a t the present t ime ? And which i s the next most important problem ? / Les neuf pays “ b r e s de l a Comnunauté
i Européenne (Marche C m n ) s’efforcent de résoudre en c m n un cer ta in nombre de problknes. En v o i c i une l i s t e . Pourriez-vous me d i r e lequel de ces problèmes vous senble actuellement Le p lus important ? E t en second l i e u ?
2
Replacing the currencies o f a l l “ b r countries, inc luding the (NATIONAL CURRENCY), u i t h a s ing le European currency / Créer une monnaie européenne unique qui remplacerait toutes les monnaies des pays “ b r e s , y canpris (MONNAIE NATIONALE) (CURRENCY)
Reducing the dif ferences between regions of the “ber states by help ing less developed regions / Réduire l es écarts en t re les régions des pays “ b r e s en aidant les régions les moins développées (CUT REGIONAL DISPARITIES)
EB1: Reducing the d i f ference between developed regions and less developed regions of the menber countr ies
A c m n f i g h t against r i s i n g pr ices / Lu t te r en c o ” contre l a hausse des p r i x (FIGHT INFLATION)
Coordinating the socia l po l i c i es of the “ber countr ies i n the f i e l d s o f enp lopent and j ob t r a i n i ng / Coordonner les po l i t i ques sociales des pays “ b r e s en matière d’emploi e t de formation professionnel l e des t rava i 1 leurs (JOB INITIATIVES)
Achieving a c m n po l i c y on energy supplies / Réal iser une po l i t i que comnunede l‘approvisionnement en énergie (ENERGY) EB1 : Implementation of... / id.
Modernising European agr icu l tu re by encouraging the most productive farms and prov id ing r e t r a i n i ng f o r people uho leave agr icu l tu re / Moderniser l ‘ ag r i cu l tu re europ4enne en encourageant les exp lo i ta t ions les p lus productives tou t en assurant l e reclassement des agr icu l teurs qui qu i t t en t ce secteur (AGRICULTURE)
Achieving a c m n po l i c y f o r ass is t ing s c i e n t i f i c research / Réaliser une p o l i t i q u e comune d‘aide a l a recherche sc i en t i f i que (SCIENTIFIC RESEARCH) EB1 : In t roduc t ion o f a comon po l i c y ... / id.
Achieving a c m n po l i c y f o r protect ing nature and f i gh t i ng p o l l u t i o n / Réal iser une p o l i t i q u e c o ” e de p ro tec t ion de l a nature e t de l u t t e contre l a po l l u t i on (ENVIRONMENT) EB1 : In t roduc t ion o f a cannon po l i c y ... / id.
Achieving a cannon po l i c y on a i d t o underdeveloped countr ies / Réaliser une p o l i t i q u e comnune d’aide aux pays sous-développés (AID THIRD WORLD) EB1 : In t roduc t ion o f a comon po l i c y ... / id.
Protect ing consuners against fraudulent s e l l i n g and misleading adver t is ing / Protéger les c o n s m t e u r s contre les fraudes comnerciales e t l a pub1 i c i t é mensongère (CONSUMER PROTECTION)
Get t ing Europe t o speak with one voice in discussions wi th the Americans and the Russians / A r r i ve r ce que L‘Europe pa r l e d’une seule voix dans les discussions avec les Américains e t les Russes (USA & RUSSIA DIALOGUE) EB1 : Achieving a comon fo re ign po l i c y i n discussions with the Uni ted States and Russia / id.
Achieving a t ru ly equivalent nunber of years of education and qua l i f i ca t ions so tha t young people can study in any country i n the European C m n i t y / Réal iser une vér i tab le équivalence des années d‘enseignement e t des diplômes pour que les jeunes puissent étudier dans n’importe quel pays de l a cumnunauté Européenne (HARMONISE alJAL1 FICATIONS ) EB1 : To introduce the same educational standards and qua l i f i ca t ions so that young people can go t o school i n any o f the countr ies of the Cannon Market.
None of these problems / Aucun de ces problèmes

A21
T a b l e / T a b l e a u 1 : M o s t important p r o b l e m / L e problème l e plus inportant
1st c o l m : EB40 result 2nd co lum: C h a n g e f r o m EB1
CURRENCY
REGIONAL D I S P A R I T I E S
F IGHT I N F L A T I O N
JOB I N I T I A T I V E S
ENERGY
AGRICULTURE
S C I E N T I F I C RESEARCH
ENVIRONMENT
A I D THIRD WORLD
CONSUMER PROTECTION
JSA & RUSSIA DIALOGUE
HARMONISE Q U A L I F I C A T I O N S
NONE
Ion ' t know
lère colonne: R e s u l t a t EB40 2 e c o 1 : V a r i a t i o n d e p u i s EB1
WRRENCY
REGIONAL D I S P A R I T I E S
FIGHT I N F L A T I O N
JOB I N I T I A T I V E S
ENERGY
4GRICULTURE
S C I E N T I F I C RESEARCH
ENVIRONMENT
41D THIRD UORLD
:ONSUMER PROTECTION
JSA 8 RUSSIA DIALOGUE
HARMONISE Q U A L I F I C A T I O N S
VONE
Ye sa i t pas
TOTAL
B
17 +9
7 +3
26 -21
18 +15
1 -5
1 -1
2 +2
8 +3
1 -1
4 +1
5 +2
3 -1
3 +2
6 -6
102
I R L
14 +12
13 +8
24 -32
21 +16
2 -2
4 -2
1 +1
5 +2
3 -1
1 -4
3 +1
4 -4
O 0
5 +4
100 '
DK
11 +8
7 +2
4 -1
13 -29
3 -6
6 +4
1 0
33 +22
2 +2
1 -1
7 +3
3 +2
4 +3
5 -13
1 O0
I
21 +10
20 +8
17 -18
10 +6
3 -2
5 -7
1 +I
8 +6
3 +1
2 0
5 -2
3 +1
1 +l
3 -3
102
* N o t ava i lab le in 1974/ P a s disponible en 1974
D
UEST EAST
8 + l i 8 * I 9 *
1 r---- -----
I I 24 10 - 5 13
22 -24 ' 22 i 19 I 8 + 5 ' 8 9 . I I
I I
3 - 2 ; 3 I 2
4 + l ; 4 I 4
r o i 2 1 1
1 0 1 1 I 2
2 o i 2 I 3
3 -3; 3 ' 2
3 +2; 2 I 2
23 +20; 22 ' 18 I I
I I I
5 + 2 ' 5 I 3
6 -5
99
L
14 o 5 -1
12 -25
10 +4
6 0
5 +2
1 0
14 +8
2 0
2 +1
6 -3
12 +a 3 +2
10 +4 - 102
5
1 O0 - NL
9 +5
7 +1
12 -22
8 +3
1 ' -9
6 +3
2 +l
28 +17
6 +3
3 +1
9 +6
4 +2
1 -1
4 -12 - 1 O0 -
3
101
P
13 * 20
22
8
1
7
2
5
3
2
1
5
1
9
99 -
- GR
14 * 21
22
8
O
6
1
8
1
O
3
4
1
10
99
UK
4 +1
7 +3
21 -34
11 +9
4 -2
4 -2
2 +1
14 +10
6 +4
2 -2
6 +l
9 +5
3 +3
7 +1
1 O0
- E
10 ' 23
20
19
1
5
1
3
3
2
1
2
3
7
1 O0
- - EC O
F
15 +2
9 +4
22 -18
16 +9
2 -3
3 0
4 +2
6 *1
2 - 1
2 - 1
13 *2
6 *t 2 *2
z a - 02 -
I C 72

A22
L
24 +3
12 +1
19 -34
17 +8
9 -4
i o +4
4 o 28 +12
4 -2
6 -2
12 -8
22 +10
4 o 14 +8
187
T a b l e / T a b l e a u 1 : F i r s t and second most important problem combined/ Premiers e t deuxièmes problèmes les plus importants combinés
NL
15 +9
14 +3
22 -22
15 +12
6 -15
14 +a 4 + 2
44 +16
14 +7
10 O
16 +a 13 +6
2 - 3
4 -12
193
1st column: EB40 resul t 2nd co lmn: C h a n g e from EB1
CURRENCY
REGIONAL D I S P A R I T I E S
FIGHT I N F L A T I O N
JOB I N I T I A T I V E S
ENERGY
AGRICULTURE
S C I E N T I F I C RESEARCH
ENVIRONMENT
A I D THIRD WORLD
CONSUMER PROTECTION
USA 8 RUSSIA DIALOGUE
HARMONISE Q U A L I F I C A T I O N S
NONE
Don't k n o w
TOTAL
l è r e colonne: R e s u l t a t EB40 2 e c o l : V a r i a t i o n depuis EB1
CURRENCY
REGIONAL D I S P A R I T I E S
FIGHT I N F L A T I O N
JOB I N I T I A T I V E S
ENERGY
4GRICULTURE
S C I E N T I F I C RESEARCH
ENVIRONMENT
9JD THIRD WORLD
LONSUMER PROTECTION
JSA 8 RUSSIA DIALOGUE
HARMONISE Q U A L I F I C A T I O N S
UONE
Ye s a i t pas
TOTAL
B.
24 +5
15 +e 40 -2 i
30 +23
3 -16
6 +1
5 +3
19 +2
5 -1
12 - 2
10 +1
10 c 4 +i
10 - 2
193
I R L
20 +15
23 + i a 41 -30
32 +17
6 - 4
9 -a 3 +1
15 +5
10 o 8 - a 7 +3
13 -11
1 0
8 +7
196
DK
15 +10
15 +7
11 -45
22 + i a 9 -15
123 +7
4 +2
53 +2a
9 +7
6 -6
15 +6
10 +6
6 +3
8 -10
195
r ~
34 +18
33 +11
31 -18
18 +10
7 -9
10 -18
5 +3
19 +9
7 +2
5 -5
9 -4
12 +6
1 0
5 -1
196
r---- D
WEST I EAST 1 ----- I
* I 16 I ' 35 I I 34 I ' 21 I I I 11 I ' 4 I I 34 I I I 10 I ' 4 I ' 6 I ' 4
' 6
' 6
4
194
- - -
P - 18
37
3a
17
5
15
5
13
9
8
4
10
1
12
192
- - -
1
GR
20
32
38
13
3
13
3
22
6
3
9
12
2
13
1 89
UK ~
7 +1
11 +2
33 -35
22 +I5
10 -4
8 -6
7 +2
29 +14
12 +6
7 -8
12 +2
17 +5
6 +4
11 +5
I92
- E
17
36
34
34
3
11
2
12
10
6
3
9
6
12
196 - EC o
1
19 * I
20 *o
32 -26
20 *11
7 -10
9 - 2
6 *2
a * l l
8 *Z 8 -6
13 * I
12 *5
4 *z 6 - 3 -
192 -
F
23 +1
19 +5
33 -21
26 +11
3 -11
9 *2
8 *1
18 *3
7 - 1
8 - 3
24 *2
11 d
1 *z 1 *l -
197
FC 12
- O
* N o t a v a i l a b l e i n 1974/ P a s disponible en 1974
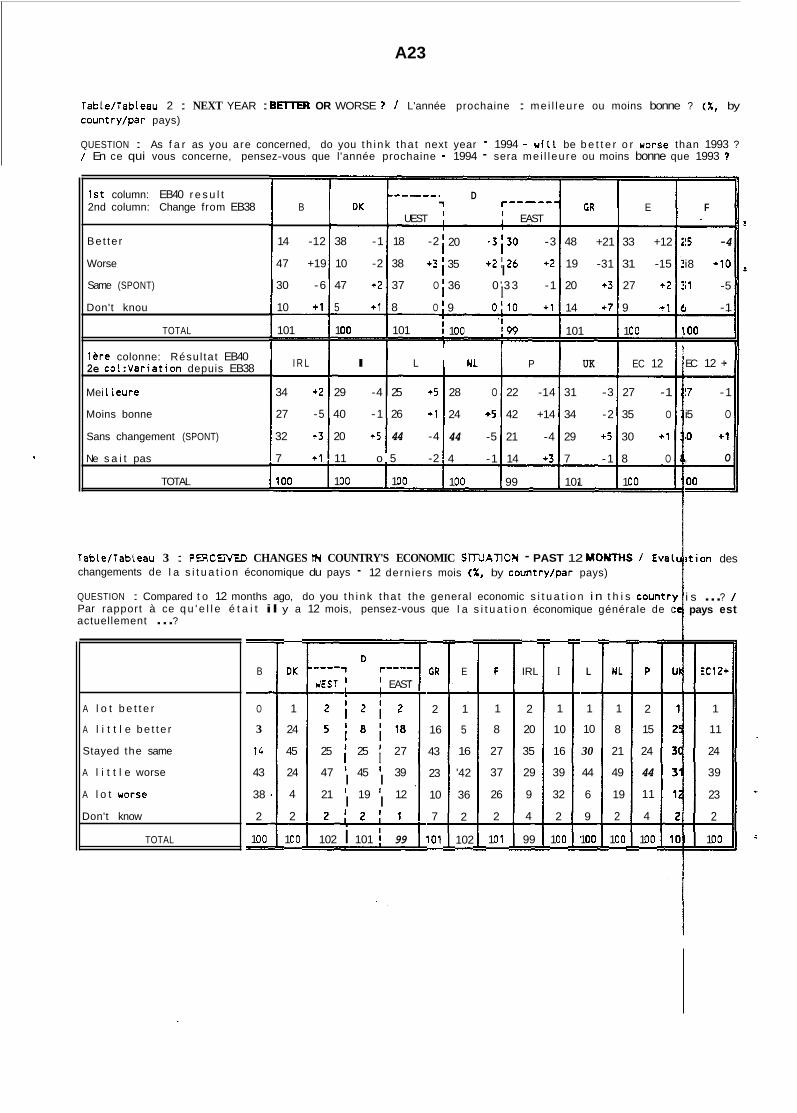
A23
Table/Tableau 2 : NEXT YEAR : 8€ITER OR WORSE 1 1 L'année prochaine : mei l l eu re ou moins bonne ? ( X , by country/par pays)
QUESTION : As f a r as you are concerned, do you t h i n k tha t next year - 1994 - u i l 1 be b e t t e r o r uorse than 1993 ? / En ce qui vous concerne, pensez-vous que l'année prochaine - 1994 - sera me i l l eu re ou moins bonne que 1993 7
I s t column: EB40 r e s u l t DK
------'
UEST 2nd column: Change from EB38 B
Be t te r 14 -12 38 -1 18 -2
Worse 47 +19 10 -2 38 +3
Same (SPONT) 30 -6 47 +2 37 O
Don't knou 10 +1 5 +1 8 O
TOTAL 101 1 O0 101
I R L I L l e r e colonne: Résul ta t EB40 2e co1:Variat ion depuis EB38
Mei 1 l eu re 34 +2 29 -4 25 +5
Moins bonne 27 -5 40 -1 26 +1
Sans changement (SPONT) 32 +3 20 +5 44 -4
Ne s a i t pas 7 +1 11 o 5 -2
TOTAL 1 O0 1 O0 1 O0
D GR E r------
I EAST 1
20 -3130 -3 48 +21 33 +12
35 +2'26 +2 19 -31 31 -15
0 '33 -1 20 +3 27 +2 36
9 O l l 0 +1 14 +7 9 +1
1 O0 '99 101 1 O0
I I
k l
' NL P UK EC 12
28 O 22 -14 31 -3 27 -1
24 +!i 42 +14 34 -2 35 O
44 -5 21 -4 29 +5 30 + l '
4 -1 14 +3 7 -1 8 O
1 O0 99 101 1 O0
Table/Tableau 3 : PWCENED CHANGES IN COUNTRY'S ECONOMIC SITUATION - PAST 12 M o l y M S / Eve1 changements de l a s i t u a t i o n économique du pays - 12 dern iers mois ( X , by country/par pays)
QUESTION : Compared t o 12 months ago, do you t h i n k tha t the general economic s i t u a t i o n i n t h i s countr] Par rapport à ce q u ' e l l e é t a i t il y a 12 mois, pensez-vous que l a s i t u a t i o n économique générale de c actuellement ... ?
A l o t b e t t e r
A l i t t l e b e t t e r
Stayed the same
A l i t t l e worse
A l o t uorse
Don't know
TOTAL
- - B - O
3
14
43
38 '
2
1 O0
- - -
- - DK
- 1
24
45
24
4
2
1 O0
- - -
UEST ; EAST I I
2 ; 2 ; 2
5 ; 8 ; 1 8
25 i 25 ' 27 I 47 I 45 I 39 I I
I I 21 I 19 ' 12
2 ; 2 : 1
102 i 101 i 99
- - GR
- 2
16
43
23
10
7
101
- - -
- - E
1
5
16
'42
36
2
102
- - -
1
8
27
37
26
2
1 o1
- - -
- - IRL
2
20
35
29
9
4
99
- -
- - I -
1
10
16
39
32
2
1 O0
- - -
- - L - 1
10
30
44
6
9
1 O0
- - NL
- 1
8
21
49
19
2
1 O0
- - -
- - P
- 2
15
24
44
11
4
1 O0
- - -
F
!5 -4
i8 +10
I1 -5
I -1
O0
EC 12 +
!7 -1
i5 O
;o +1
, O
O0 - i t i o n des
i s ... ? / pays est
EC12+
1
11
24
39
23
2
1 O0
- - -

A24
t rble/Tableau 4 : ANTICIPATED CHANGES N COUNTRY'S ECONOMIC SrruATKm - NDCT 12 M& / Evaluat ion des -ts de l a s i t u a t i o n économique du pays - 12 prochains mois ( X , by country/par pays)
US1101 : A n d over the next 12 months, how do you th ink the general economic s i t u a t i o n i n t h i s country w i l l be ..., W l d you say i t u i l 1 ... ? / E t dans les 12 prochains mois, pensez-vous que l a s i t u a t i o n économique g é d r a l e 6 ce plys va devenir ... ?
0t.n œ i l l w r e
m 0.u œi 1 l eu re
- - OK -
2
29
40
23
2
4
1 O0
- - -
O 1 r----
WEST ; { EAST
---- I I
2 ; 2 ; 2
39 i 37 i 28
3 1 4 1 5
100 I 101 i 101
12 i 14 i 22
31 i 32 i 36
13 i 12 i 8
I
14 27
11
101 101
28
6
100 101
- - UK
- 2
30
34
21
8
6
1 o1
- - -
- - EC12+ -
2
22
30
29
11
6
1 O0
- - -
T m I o / T . b i e ~ 5 : PERCOVED CHANGESNFWANClALSlTtØATION O F O W HOUSEHOU)-PASTl211110NTHS/ Changements
cUST:O : Carpered t o 12 months ago, do you t h i n k the f inanc ia l s i t u a t i o n o f your household, now i s .... ? / Par r.ggor? h ce q u ' e l l e é t a i t il y a 12 mois, pensez-vous que ta s i t u a t i o n f i n a n c i i r e de vo t re &nage es t actuellement
ama Ir s i t u a t i o n f i nanc ie re de son &nage - 12 dern iers mois ( X , by country/par pays)
*
A . l o t fæt te r
A l i t t l e b e t t e r
S t a d t h e same
A L i t t l e worse
A l o t dorse
O o n ' t know
II TOTAL
f

Bien me i l leu re
Un peu me i l leu re
Inchangée
Un peu moins bonne
b i en moins bonne
Ne s a i t pas
TOTAL
39
24
1
32
24
2
1 O0 99 1 O0
A25
- -
DK
- 5
28
55
9
1
3
101
- - -
- - GR
- 3
37
32
10
10
9
101 - I
- -
F
- *3
17
45
20
11
5
101
- -
-
I RL
- 2
23
53
13
3
7
101
- -
-
I
- 2
21
52
17
3
7
102
- - -
-
L
- 2
25
59
8
1
5
1 O0
- - -
- -
NL
- 3
19
52
20
3
3
I O0
- - -
- -
P
- 2
18
38
27
4 .
11
1 O0
- - -
- -
UK
- 4
22
-
B
- 2
12
43
27
10
8
102
- - -
D 1 r----- -
3 ' 3 ' 2 , I I
---- I I
WEST I I EAST
i l9 i 30 53 i 52 47
I 21 I 20 ' 14
I I
3
20
49
19
5
5
101
- -
3 ' 3 ' 2 I I '
3 : 3 ; 4
99 I 100 I 99 I
Table/Tableau 7 : PERCEIVED CHANGES IN FWANciAL SITUATION OFOWN HWSMOU) I CENTRALANDEASTER PAST12MONTHS / Changements perçus dans l a s i t ua t i on f inancière de son ménage en Europe Centrale e t 12 dern iers mois ( X , by country/par pays)
QUESTION : Compared t o 12 months ago, do you th ink that the f i nanc i a l s i t u a t i o n of your household, has rapport à ce qu ' e l l e é t a i t il y a 12 mois, pensez-vous que l a s i t u a t i o n f inanc iè re de vo t r e m
NROPE- ! L'Est -
.? / Par rage es t
actuellement ... ?
CEEB 4 r esu l t s
Got a l o t be t t e r
Got a l i t t l e be t t e r
Stayed the same
Got a l i t t l e worse
Got a l o t uorse
Don't know
TOTAL
CEEB 4 r esu l t s
EST HUN LAT
1
14
30
29
25
1
1 O0
UKR
1
3
12
28
55
1
- - -
HARE
2
11
29
34
22
2
1 O0
!O-CIS
- - - - 3
12
21
27
35
1
2 1
21 7
1 o1 1 O0
L I T I FYH* POL I ROM I RUS
3 1
11 11
26 39
Un peu me i l leu re
Inchangée
Un peu moins bonne
Bien moins bonne
Ne s a i t pas
TOTAL
* FYH : Former Yugoslav Republic of Macedonia/ Ex-république Yougoslave de Macédonie SLV : Slovakia/ Slovaquie ; SLO : Slovenia/ Slovénie
32 29 25
31 I 44 I 26 31 I 35
23 4 I :" 27
1
29 1 13
o l 1
100 I 100 100 1 100 1 O0

A26
~
Get a l o t be t t e r
Get a L i t t l e be t t e r
Stayed the same
Get a l i t t l e worse
Get a l o t worse'
Don't knou
TOTAL
CEEB 4 r esu l t s
Table/Tableau 8 : ANTICIPATED CHANGES IN FNANClAL SITUATION OF OWN HOUSEHOLD IN CENTRAL AND EASTERN NROPE-NDCT12MONlHS / Evaluation des changements de l a s i t ua t i on f inancière de son ménage en Europe Centrale e t de L'Est - 12 prochains mois ( X , by country/par pays)
QUESTION : And over the next 12 months, do you expect the f inanc ia l s i t ua t i on o f your household w i l t ... ? / E t dans les 12 prochains mois, pensez-vous que l a s i t ua t i on f inancière de votre ménage va devenir ... ?
14
45
21
6
4
11
101
LIT ~
B ien mei l leure
Un peu me i l leu re
Inchangée
Un peu moins bonne
0 i en mo i ns bonne
Me s a i t pas
TOTAL
1 ; 10
1 O0
PHARE
2
24
30
23
9
11
99
EURO-CIS
3
15
23
15
21
23 ~
1 O0
* FYM : Former Yugoslav Republic of Macedonia/ Ex-république Yougoslave de Mac&onie SLV : Slovakia/ Slovaquie ; SLO : Slovenia/ Slovénie
Table/Tableau 9 : PERCEIVED CHANGES EN COUNTRY'S EMPLOYMENT SITUATION -PAST 12MONTHS /Changements perçus dans l a s i t u a t i o n de l 'emploi dans l e pays - 12 derniers mois ( X , by country/par pays)
QUESTION : Compared t o 12 months ago, do you th ink the employment s i t ua t i on i n t h i s country nou i s .... ? / Par rapport a ce qu 'e l le e t a i t il y a 12 mois, pensez-vous que l a s i t ua t i on de l 'emploi dans ce pays est actuellement
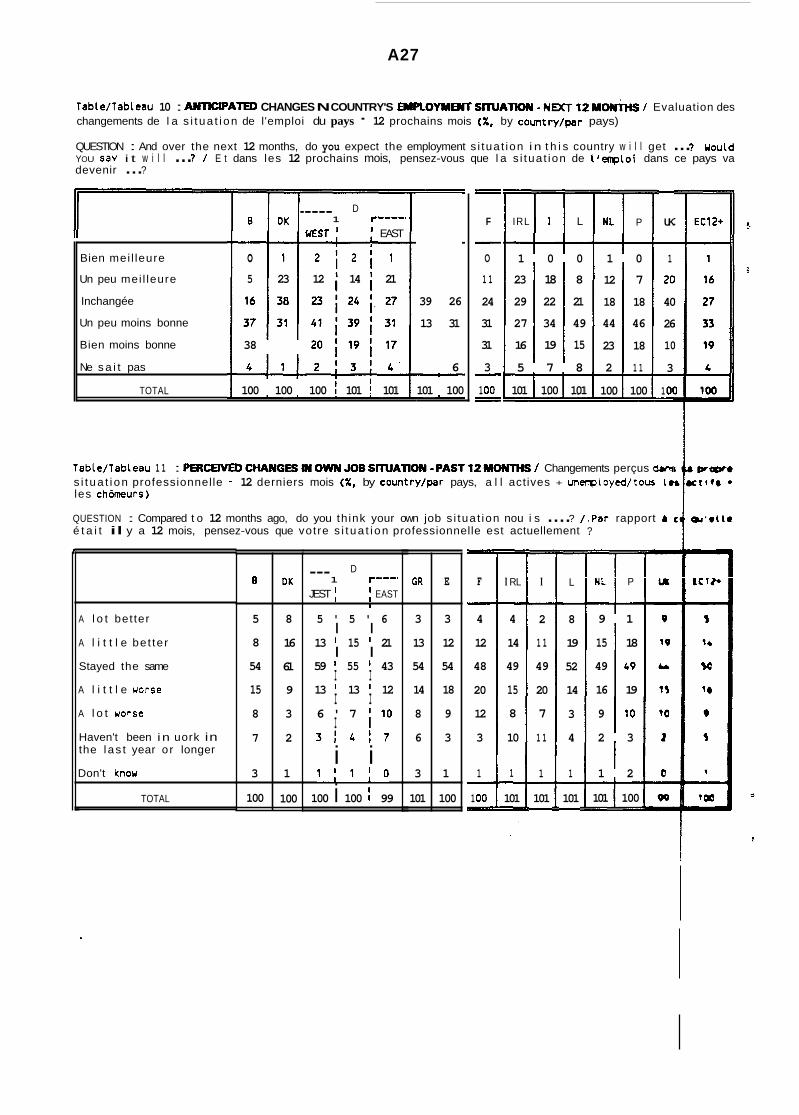
A27
Table/Tableau 10 : ANTlCIPAIED CHANGES N COUNTRY'S EMPLOYMaCT SITUATION -NDCT 12U0rvms / Evaluation des changements de l a s i t ua t i on de l'emploi du pays - 12 prochains mois ( X , by country/par pays)
QUESTION : And over the next 12 months, do you expect the employment s i tua t ion i n t h i s country w i l l get ... ? Uould YOU sav i t w i l l ... 7 / E t dans les 12 prochains mois, pensez-vous que l a s i tua t ion de l 'enploi dans ce pays va
r
A l o t bet ter
A l i t t l e be t te r
Stayed the same
A l i t t l e worse
A l o t uorse
Haven't been in uork in the l as t year or longer
Don't know
TOTAL .
devenir ... ?
R==p-
B
5 8
8
54
15
8 3
7 2
3 1
100
Bien mei l leure
Un peu mei l leure
Inchangée
Un peu moins bonne
Bien moins bonne
Ne s a i t pas
TOTAL
DK
16
61
9
100
D 1 r----- -----
m r : EAST B DK
I I
o 1 2 ; 2 ; 1
5 23 12 i 14 i 21
GR
13
54
14
3 1
101
38
100 100 100 1 101 I 101
E
3 3
12
54
18
8 9
6 3
100
39 26
13 31
6
101 100
- - F - O
1 1
24
31
31
3
1 O0
- =
IRL 1 L
1 0 0
23 18 8
29 22 21
27 34 49
16 19 15
5 7 8
101 100 101
NL P
1 0
12 7
18 18
44 46
23 18
2 1 1
100 100
- - UK
- 1
20
40
26
10
3
1 O(
- 3
Table/Tableau 1 1 : PERCOVEDCHANGESRYOWNJOBSrrUATlON-PAST12M~/ Changements perçus dua s i t ua t i on professionnelle - 12 derniers mois ( X , by country/par pays, a l l actives + unenployed/tws t. les chômeurs)
QUESTION : Compared t o 12 months ago, do you th ink your own job s i tua t ion nou i s .... ? /,Par rapport & I
é t a i t il y a 12 mois, pensez-vous que votre s i t ua t i on professionnelle est actuellement ?
D 1 r - - - a
JEST f EAST
5 ' 5 ' 6 I I
13 ' 15 ' 21 I I
59 ' 55 ' 43 I I 13 ' 13 ' 12 I I 6 ' 7 il0 I 3 1 4 1 7
1 : 1 ; 0
--- I
i i 100 i 100 99
- - F - 4
12
48
20
12
3
1
1 O0
- - -
I RL - 4
14
49
15
8
10
1
101 - -
I
7
2
1 1
49
20
7
1 1
1
101 - - -
L - 8
19
52
14
3
4
1
101 - - -
NL P
9 1
15 18
49 49
16 19
9 10
2 3
1 2
101 100

A28
Bien meilleure
Un peu meilleure
Inchangée
Un peu moins bonne
Bien moins bonne
N'aura pas d'activité professionnelle dans les 12 mois prochains
Ne sait pas
TOTAL
Table/Tableau 12: ANTICIPATED CHANGES N OWN JOB SlTuATKMl -NEXT 12MOWTHS / Evaluation des changements de sa propre situation professionnelle - 12 prochains mois ( X I by country/par pays, all actives + unenployed/ tous les actifs + les chômeurs)
QUESTION : And over the next 12 months, do you expect that your own job situation will get ... ? / Et dans les 12 prochains mois, pensez-vous que votre situation professionnelle va devenir ... ?
D DK ------ 1 r------ GR UEST I I EAST
I I
19 - 2 7 +1'6 Oi3 o 5 -1 I
/I
E F
6 -1 4 +1
- - B - 5
10
52
13
8
4
8
1 O0
- - -
49 Oi45 Oi30 -3
32 - 1 i36 Oi52 +7
1 1 +2i12 +2'14 I 2 -112 -112 -1
1 o1 Il01 ' 101 I
L NL P
15 +5 8 - 1 3 O
58 -3 59 O 48 -3
19 -2 24 -1 34 +3
3 O 6 +1 1 1 -1
6 +1 3 +1 4 O
101 1 O0 1 O0
- - DK - 6
19
64
6
1
3
2
101 - - -
34 +4
41 +3
-2 1 8 -9
2 +1
1 O0
UK
6 -1
42 O
32 +1
14 -3
6 +1
1 O0
101 Il00
EC 12 EC 12 +
i5 o 5 a 38 +1 38 +1
34 o 35 +1
19 -2 19 -2
4 +1 3 a 1 O0 1 O0
34 O
39 +2
18 O
4
42 +4
35 -1
1.5 -5
o 4 +1
- - [RL - 2
21
52
9
4
7
6
101
- - -
- EClZ+ - 5
22
50
12
4
3
5
101 - -
- I - 3
24
46
13
4
4
' f - 101 -
- L - 4
21
57
11
2
4
2"
101 - -
- NL - 6
22
49
15
4
2
'#2
1 O0
- -
- P - 1
19
47
15
5
2
12
101 - -
- UK - 7
22
50
11
5
5
O
1 O0
- -
- - E -
2
23
51
11
3
2
8
1 O0
- -
- - GR - 6
28
40
7
2
4
13
1 O0
- -
D 1 r----
UEST I EAST ----
5
20
43
16
8
2
5 '
5 ' 5 ' 4 I I
I I
20 i 22 I 26
59 i 56 I 47
9 ' 9 ' 7 I I ' I I
2 ' 3 ' 6 .
2 1 3 1 5
3 ; 3 : 4
I I I
ì ì 100 i 101 i 99
Table/Tableau 13 : SATISFACTION WITH DEMOCRACY N O W COUNTRY / Satisfaction B 1'6gard de la démocratie dans son pays ( X , by country/par pays)
QUESTION : On the whole, are you very satisfied, fairly satisfied, not very satisfied or not at all satisfied with the uay democracy works in (OUR COUNTRY) ? Uould you say you are ... ? / Dans l'ensemble, ètes-vous très satisfait, plutôt satisfait, plutôt pas satisfait ou pas du tout satisfait du fonctionnement de la démocratie dans (NOTRE PAYS) ? Diriez-vous que vous ètes.. . ?
1st colum: EB40 result 2nd colum: Change from EB39 B
Very satisfied
Fairly satisfied
Not very satisfied
Not at all satisfied
Don't know
5 +1
64 -1
31 -1
17 +3
6 O
59 ' - 1
19 +5
3 - 1
1 O
TOTAL 101
I
1 o1
I RL lare colonne: Résultat EB40 Ze co1:Variation depuis EB39
Très satisfait
Plutôt satisfait
Plutôt pas satisfait
Pas du tout satisfait
Ne sait pas
TOTAL
10 -5
50 +3
22 +1
13 +Z
5 -1
1 O0
1 O
12 +1
40 +2
45 -4
3 +2
101

A29
1 O0
NL
2 +1
48 o 37 O
9 +3
4 -4
1 O0
Table/Tableau 14 : SATISFACTION WITH DEMOCRACY N THE EC / l a CE ( X , by country/par pays) .
La sa t i s f ac t i on à l 'égard de l a démocratie dans
I 100
P
4 +1
54 +3
27 +5
5 -3
10 -6
1 O0
QUESTION : On the uhole, are you very sa t i s f ied , f a i r l y sa t i s f ied , not very s a t i s f i e d o r not a t a l l s a t i s f i e d u i t h the way democracy works i n the European Conmunity ? Would you say you are... ? / Dans l'ensemble, êtes-vous t r ès s a t i s f a i t , p l u t ô t s a t i s f a i t , p l u t ô t pas s a t i s f a i t ou pas du tou t s a t i s f a i t du fonctionnement de La démocratie dans l a Comnunauté Européenne ? Dir iez-vous que vous êtes... ?
~ 1st coturn: EB40 r e s u l t 12nd colurn: Change from EB39
D
WEST EAST 1 r-----' -----
I 1
3 o ; 3 o ; 1 o 46 +5 ' 44 + 4 ' 36 O I I
GR E F B . DK ~~ ~~
Very s a t i s f i e d
F a i r l y s a t i s f i e d
Not very s a t i s f i e d
Not a t a l l s a t i s f i e d
Don't knou
2 0 1 .. ri
-3
~
-2
ie
5 +1
38 +3
36 O
6 -4
14 -1
99
EC 12
9 +1
41 +4
28 +2
7 -4
14 -4
99
3 -1
46 +1
36 O
13 +1
2 -1
1 O0
I
2 -1
49 +1
30 O
10 +1
8 -2
99
I R L
36 -1
8 -2
6 -3 - 99
L
TOTAL
l è r e colonne: Resultat EB40 Ze co1:Variation depuis EB39
Tres s a t i s f a i t
P l u t ô t s a t i s f a i t
P l u t ô t pas s a t i s f a i t
Pas du tou t s a t i s f a i t
Ne s a i t pas
UK
2 +1
32 +1
38 -1
12 -3
16 +2
5 +1
55 o 28 +4
6 +3
5 -10
2 0
40 +4
27 - 5
9 -6
22 +7
1 O0
3 0
42 +4
34 -1
9 -3
12 o 1 O0
7 -4
52 +1
17 +3
5 -2
18 +2
99 1 TOTAL 99 1 O0
Table/Tableau 15 : SUPPORTMR UNIFICATION OF WESTERN EUROPE/ A p p u i a l ' u n i f i c a t i o n de L'Europe oc iden ta le ( X , by country/par pays)
QUESTION : In general, are you f o r o r against e f f o r t s being made t o unify Western Europe? Are you .... ? / D'une façon générale, etes-vous pour ou contre Les e f f o r t s qui sont f a i t s pour u n i f i e r L'Europe occidentale? tes-vous f
I . . . .?
1st coturn: EB40 r e s u l t 1 19B -1 1 ~
o
2nd column: Change from EB39
For - very much
For - t o some extent 54 -4 38 -3
24 -3 ; 23 - 2 ; 16 -3
49 +1 i 48 0; 45 -4
. 13 - 2 ; 15 0 ; 23 +4
8 +3i 8 +3' 11 +4 I
49 +8
36 -2
4 -3
3 - 2
32 +3
46 -2
7 -1
3 0
Against - t o some extent
Against - very much
15 +2
3 +1 I 19 O
16 +2
6 0 ! 6 0 : s - 2 9 O 1 3 O I I
100 i 100 ! 100 101 101
Don't know 8 + 1 3 0
TOTAL 99. 1 O0
I RL I l e r e colonne: Résultat EB40 Ze co1:Variation depuis EB39
Très pour I 30 -1 I 37 +5 30 +4 22 +3 44 +1 17 -2 27 +1
LO -10 53 -2 30 -5 ' 42 -1 47 -1
17 +3 11 -5 9 +2 18 -1 12 -1
6 +1 7 +2 3 O 12 +1 6 +1
7 +1 7 +? 14 +2 11 +2 9 +1
1 O0 1 O0 1 O0 1 O0 101
P lu tô t pour
P l u tô t contre
45 o 1 8 +1
47 -4
6 0

r).
A30
1st colurm: EB40 resu l t 2nd colunn: Change from EB39
A good th ing
A bad th ing
Neither good nor bad
Don't know
TOTAL
l è r e colonne: Résultat EB40 Ze co1:Variation depuis EB39
Une bonne chose
Une mauvaise chose
Une chose n i bonne n i mauvaise
Ne s a i t Das
Table/Tableau 16 : EC MEMBERSHIP 'GOOD THNG' ? / Appartenance à l a CE: 8"e bonne choseIl ? ( X , by country/par pays)
QUESTION : Generally speaking, do you th ink that (OUR CWNTRY'S) membership o f the European Comnunity i s .... ? / D'une façon générale, pensez-vous que l e f a i t pour (NOTRE PAYS) de f a i r e p a r t i e de l a Comnunauté Européenne est . . . .?
B
59 -5
9 +2
26 +3
6 0
1 O0
I RL
73 -2
8 +1
15 +2
4 -1
L NL
72 -4 80 -3
6 +1 5 +2
20 +3 12 +1
3 0 3 0 4 0
TOTAL I 100
P
59 -5
12 +1
26 +2
DK
D
UEST 1 EAST 1 r------ ------
1 I
42 -2 ; 41 - 3 ; 38 -6
39 +1' 39 +1 I 42 +4 I I 19 +2! 19 +2! 19 +1
I I
I I
100 I 99 ! 99
58 -3
22 +5
17 -3
2 0
99
I
GR
79 +7
9 -9
12 +1
1 O0
68 -3
7 +1
18 +2
6 -1
Don't know
TOTAL
99
23 +3 10 O
99 101
I RL l è r e colonne: Résultat EB40 2e co l : Var ia t ion depuis EB39
101 I 100 I 101
I
GR I E
L
-3 26 +1
NL P UK
100 I 100
80 -2
13 +2
F
52 -2
23 -2
55 -1
14 +1
26 -1
5 +1
1 O0
EC 12 +
Ne s a i t pas
TOTAL
57 -3
13 +1
25 +2
5 0
7 O 25 +2
1 O0 1 O0
1 O0
Table/Tableau 17 : HAS ONE'S COUNTRY BENEFITED FROM EC MEMBERSHIP ? / Son pays a - t - i 1 bénéf i c ié de son appartenance à la CE ? ( X , by country/par pays)
QUESTION : Taking everything i n t o consideration, would you say that (OUR COUNTRY) has on balance benef i ted or not from being a " ber of the European Cmnunity? / Tout b ien considéré, estimez-vous que (NOTRE PAYS) a M n e f i c i e ou non de son appartenance a l a Comnunauté Européenne ?
I 1
Bénéficié
Pas bénéf i c ié
101 1 O0 1 O0 1 O0
E I F q - E
21 .+2 z$ 20 +3 20 +3
101 1 O0

A31
j. -
EC 12 +
40 -2
40 +2
11 o 9 0
1 O0
lable/Tableau 18 : Al l l lUDE IF EUROPEAN COMMUNITY SCRAPPED / L 'at t i tude en cas d'abandon de la Comnunaute LuropCenne ( X , by country/par p y s )
QltSllON : I f you were t o l d tomorrow that the European Conmunity had been scrapped, would you be very sorry about i t , i nd i f fe rent o r very relieved? / S i L'on annonçait demain que l a Connunaute Europ6enne est a b a n d o d , eorancriez-vous de grands regrets, de l ' ind i f fé rence (cela vous sera i t egal) ou un v i f soulagement?
r 1st colum: E640 resu l t 2nd colum: Change from E639
V.- sorry
I Indi f ferent
I
v w v rel ieved
3m't tnOv
' w o cotome: Resultat E640 Zo t a r : v r r i s t i o n depuis E639
30 regrets
>e i ' *m i f fC rence
s W O soulagement
H r.'t Das
TOTAL
6
35 -2
53 +3
6 +1
7 -1
101
I RL
52 -4 . ..
35' +2
5 ' o 8 +1
1 O0
D
UEST i EAST
I
GR 1 r------ ------ DK 1 I
42 O 38 - 7 ' 37 -6; 32 -5 62 +12
29 -3 38 +5 ; 40 +5; 47 +3 24 -11
22 +4 11 +2 i 12 +i?; 13 +4 3 -2
7 -1 13 + I I 12 O f 8 -3 11 +1
I
1
1 O0 100 101 i 100 1 O0
I L NL P UK
55 O 56 -2 48 +1 36 -5 25 -3
31 +1 32 +4 ' 37 -1 50 +7 50 +5
3 - 2 5 o 5 o 9 + 2 2 2 - 2
10 O 8 -1 11 +2 5 -4 3 O
99 101 101 1 O0 1 O0
E
36 -3
46 -1
7 -1
11 +4
1 O0
EC 12
40 -2
39 +1
ii a 9 a - 99

Table/Tableau 19 : 'NRO-DYNAMOMETW' / L8t1Euro-Dyna"&tret1 ( X , by country/par pays)
PUESTION In your opinion, how i s the European C m n i t y , the European u n i f i c a t i o n advancing nowadays ? Please look a t these people (SHOW CARD). Nol i s standing s t i l l , No 7 i s running as f as t as possible. Choose the one which best corresponds w i th your opin ion of the European Comnunity, European un i f i ca t ion . And which corresponds best t o what you would l i ke? / A vo t re avis, coment avance actuellement l a Comnunauté EuroNenne, l ' u n i f i c a t i o n de L'Europe ? Veui l lez regarder ces personnages (MONTRER CARTE). Le Nol ne bouge pas, l e N O 7 court aussi v i t e que possible. Choisissez ce l u i qui correspond l e mieux à votre opinion de l a C m n a u t é Européenne, l ' u n i f i c a t i o n de L'Europe. E t quel es t l e personnage qui correspond Le mieux a ce que vous souhaiter iez ?
AT UHAT SPEED I S EUROPE ADVANCING AT PRESENT?/A PUELLE VITESSE PROGRESSE ACTUELLEMENT L'EUROPE?
Slowly (codes 1-3)
A t mediun paceccode 4 )
Puick ly (code 5-71
Don't know
TOTAL
Mean/Moyenne ( * ) 1993 A u t m
Mean/Moyenne (*1 1993 Spri ng
Mean/Moyenne (*I 1992
Mean/Moyenne (*I 1990
Mean/Moyenne (*) 1987
AT UHAT SPEED SHOULD I T BE ADVANCING ? / A QUELLE VITESSE DEVRAIT-ELLE PROGRESSER ?
Lentement (codes 1 - 3 )
Moyennement (code 4 )
Rapidement (codes 5-71
Ne s a i t pas
TOTAL
MeanIMoyenne 1993 Autun,
Mean/Moyenne (*) 1993 Spri ng
Mean/Moyenne (*I 1992
Mean/Moyenne (*1 1990
Mean/Moyenne (*I 1987
DIFFERENCE (**I 199311
DIFFERENCE (**) 1993 I
DIFFERENCE (**I 1992
DIFFERENCE (**I 1990
DIFFERENCE (**) 1987 (*) Catcutat id actor
100 I 101
3.4 3.4 1 101 1 100 j 101 i 103
3.6 I 3.5 I 3.4 4.2 I I
3.5 4.1 3.5 13.5 I 3.5 3.9 I I
3.8 4.1 3.7 I 3.7 3.8 4.1
8 DK
16 40
22 18
51 38
12 5
101 101
4.5 3.6
4.9 4.2
5.0 3.8
4.8 4.3
5.2 4.2
ng t o the
E
- 48
24
15
14
101
3.7
- -
- 3.7 - 3.7
4.0
3.7
- - - -
32 33 i 37 5 11
19 i 18 i 15 9 11
44 i 44 41 68 62
5 1 5 1 6 1 9 1 6
100 100 99 101 100
3.9 3.9 ! 3.8 5.2 4.9
I I 1
I I
~ I 7- -
4.9 I 4.8 ! 4.6 5.7 5.4 I I I I
4.4 I 4.4 I 4.5 5.9 5.2
4.7 I 4.8 I 5.1 5.6 5.3 I I
I I
5.0 I - I - 5.5 5.6 I I
0.3 ! 0.4 ! 0.4 1.0 1.2
2.0 I - i - 12.0 11.9 -ecentages of answers correSD
1.2 0.7 1.3 0.5 0.9
2.0 1.1 1.3 1.2 1.3
1.2 0.9 1.9 1.2 1.2 BE- 1.3 0.8 1.7 0.6 0.5
1.9 I 1.2 I 2.7 I 2.6 I 2.C f i g t o e a c h o f the seven poi
P UK EC12+
14 25 20
11 16 15
56 41 53
20 17 12
101 99 112
5.0 4.3 4.4
5.5 4.6 5.1
5.6 4.7 5.0
n t s on the scat' "don't knows" excluded/ Calculé selon les pourcentages de réponses correspondant a chacun des sept codes de l 'échel le . Non rCponses exclues.
(**I Absolute value/ Valeur absolue

A33
1st colunn: EB40 r e s u l t 2nd col”: Change from EB39
Table/Tableau 20 : FOR A EUROPEAN GOVDWMENT RESPONSIBLE TO THE EUROPEAlY PARIJAMBYT ? / Pour un gouvernement européen responsable devant l e Parlement E.uropéen ? ( X , by country/par pays)
QUESTION : Are you f o r o r against the formation of a European Union wi th a European goverment responsible t o the European Parliament ? / Etes-vous pour ou contre l a formation d’une Union Européenne avec un Gouvernement Européen responsable devant l e Parlement Européen ?
O GR E F 1 r------ B OK ------
EAST VEST I I I
For
Against
Don’t knou
TOTAL
l e r e colonne: Résul tat EB40 Ze co1:Variation depuis EB39
Pour
Contre
Ne s a i t pas
TOTAL
53 -8 19 -2 43 -1 i 42 -1 39 -2 59 -4 57 +1
18 +2 69 O 26 O ; 27 O ; 32 +2 14 +2 16 -3
29 +5 11 +2 32 +1 f 31 +2f 29 O 28 +2 27 +2 I
1 O0 99 101 i 100 I 100 101 1 O0
I RL I L NL P UK EC 12
42 -4 66 -3 49 - 5 49 +2 53 -2 23 -2 47 -2
20 + I 10 +2 30 +10 29 -4 23 +6 49 -4 27 O
37 +3 24 +1 21 -5 22 +2 24 -4 28 +6 26 +2
99 1 O0 1 O0 1 O0 1 O0 1 O0 1 O0
Table/Tableau 21 : IMPRESSION OF THE EUROPEAN COMMISSION / L’impression sur l a Comnission Europé those uho have heard RECENTLY of the European Comnission, by country / X de ceux qui ont entendu RÉCEHME chose au su je t de l a Comnission Européenne, par pays)*
QUESTION : Has uhat you read o r heard given you a general ly favourable or unfavourable impression o f t h Comnission ? / Est-ce que ce la vous a donné p l u t ô t une bonne impression ou p l u t ô t une mauvaise inpres Comnission Européenne ?
-1
127 o 27 +2 -
101 -
I s t column: EE40 r e s u l t 2nd column: Change from E OK
31 O
31 -3
32 +3
6 O
1 O0
Generally favourable
Generally unfavourable
Neither favourable nor unfavourable (SPONT)
D GR 1 r------ ------
EAST WEST I I
32 +2; 32 + l i 32 -1 58 +7
26 - 9 i 25 -7; 23 + I 9 -5
35 +5 i 36 +4 ’ 40 O 29 -4
7 + I I 7 + l i 5 O 5 +1 I I I
I
I I 100 I 100 ! 100 101
Don‘t knou
1 l i r e colonne: Résultat EB1 co1:Variat ion depuis EB39
P lu tô t bonne
P lu tô t mauvaise
N i bonne, ni mauvaise (SPI
Ne s a i t pas
TOTAL
L NL P UK
39 o 15 -3
39 o
.7 +3 - 1 O0 - I RL
50 +5
12 -1
30 -2
7 -3
99
51 -8
18 +4
25 +2
6 +1 - 1 O0
28 -4 30 -4 51 -4 34 +9
27 +4 32 -6 12 +2 39 -13
41 +1 28 +10 30 -1 21 +2
4 -1 10 O 7 +2 6 +1
1 O0 1 O0 1 O0 1 O0
27 -10
+2
1 O0
49 -1
28 -1
22 +1
99
I C 12 +
- -
nne ( X of T quelque
European i o n de La
F
26 a 29 -¿
39 - 2
6 +3 - I O0 - - EC 12 +
35 +1
25 -3
33 +1
7 +1
I O0 -

A34
B DK D 1-6 7-12 1-6 1987 1987 1988
51 79 55
37 18 32
13 3 14
101 100 101
15 25 14
41 36 43
24 24 23
6 8
14 7 13
100 100 101
Table/Tableau 22 : AWARWESSANDIMPORTAWCEOFCOUNCIL PRESlDwCY / Notor ié té e t importance de La pr is idence du Conseil ( X , 1986-1993)(*)
QUESTION : In the European C m n i t y , each Member State, i n turn, becomes the President of the Counci l o f M in is te rs f o r s i x months. Just non, i t ' s the turn of BELGIUM. Have you recent ly read i n the newspapers or heard on rad io o r t e l ev i s i on anything about the Presidency OF BELGIUM ? / Dans l a Comnunauté Européenne, chaque Etat membre est, à son tour, l e Président du Conseil des Min is t res pendant s i x mois. A l 'heure actuel le, c 'est l e tour de l a BELGIQUE. Avez-vous récemnent l u dans les journaux ou entendu à l a radio ou a l a t e l ev i s i on quelque chose au su je t de l a présidence de l a Belgique ? (AWARENESS OF PRESIDENCY)
QUESTION : Uhether you have heard about i t or not, do you th ink i t i s important or not tha t BELGIUM i s President o f the Council o f Min is ters of the European Comnunity a t t h i s time ? Would you say i t is . ..? / Pue vous ayez ou non entendu pa r l e r de quelque chose à ce sujet, pensez-vous que c'est ou non inpor tant que LA BELGIQUE s o i t en ce - m e n t Président du Conseil des Min is t res de l a Commauté Européenne ? Dir iez-vous que c'est ... ? (IMPORTANCE OF PRESIDENCY)
GR E 7-12 1-6 1988 1989
74 72
19 20
7 7
100 99
44 21
29 57
15 6
8 4 2
8 14
100 100
AWARENESS OF PRESIDENCY Yes/ Oui
No/ Non
DK/ NSP
TOTAL
IMPORTANCE OF PRESIDENCY Very important/ Très imp.
1 mpor t ant /
Not very impor tan t / Pas t rès import ant
Not a t a l l important/ Pas imp., dL tout
DK / NSP
TOTAL
- - UK
7-12 1986 -
22
72
3
1 O0 - -
22
37
25
8
9
1 O0
- - -
- - F
7-12 1989
43
49
8
1 O0 - -
15
49
21
4
11
1 O0
- - -
- - I RL 1-6 1990 -
70
24
7
101
- -
35
40
11
5
9
1 O0
- - -
- - I
7-12 1990 -
54
39
7
1 O0 - -
25
48
14
3
11
101
- - -
- - L 1-6 1991 -
'82
16
2
1 O0 - -
36
39
14
3
8
1 O0
-
- - NL
7-12 1991 -
81
18
2
101
- -
13
44
30
6
7
1 O0
- - -
- - P
1-6 1992 -
81
14
6
101
- -
39
46
5
2
9
101
- - -
- - UK
7-12 1992 -
52
45
3
1 O0 - -
29
35
1 .
7
1
101
7
- -
- - DK 1-6
1993 -
82
17
1
1 O0 - -
31
43
18
6
2
1 O0
- -
- - B
7-12 1 993 -
62
37
1
1 O0 - -
16
45
28
8
3
1 O0 - - -
(*I This question i s asked only t o the c i t i zens of the country holding the Presidency a t the t ime of the EUROBAROMETER survey / Cette question est posée exclusivement aux ci toyens du pays qui assure l a présidence au " en t du sondage EUROBAROMETRE.

A35
., 1st colum: E640 resu l t O
1 r------ 2nd colum: Change from E638 B OK ------ Y es 73 -6 72 -16 76 -8; 77 -7; 82 -.4 66 -16 62 -13 66 -15
GR E 1 EC 12+ EAST UEST I 1
I I
24 +4 27 +17 21 +9; 20 +9' 14 +4 ',I +16 36 +12 31 +15 I No
Don't knou 3 -2 1 -1 3 -2: 3 -2: 4 o 3 +1 2 +1 2 -1 I
I TOTAL 1 O0 1 O0 100 I 100 I 100 101 1 O0 99
F I RL I L NL P UK EC 12 + l è re colonne: Resultat E640 2e co1:Variation depuis E638
Ou i 70 -13 68 -6 62 -18 73 -12 71 -16 71 -13 52 -27 66 -15
Non 28 +13 31 +7 35 +17 23 +l? 29 +17 26 +12 47 +28 31 +15
Ne s a i t pas 2 o 2 - 1 3 + 1 4 o 1 o 4 + 2 1 - 1 2 - 1
TOTAL 1 O0 101 1 O0 1 O0 1 o1 101 1 O0 99
Table/Tableau 23 : AWARWESSOFNROPEANCOMMU" / La notoriétC de l a Commaute Europt5enne ( X , by "try/ par pays)
QUESTION : Have you recent ly heard or read something about the European Conmunity (the EC) or the European Economic Comnunity ( the EEC), i t s pol ic ies, i t s i ns t i t u t i ons ? / Avez-vous recemnent entendu ou lu quelque chose au sujet de l a Comnunaute Européenne ( l a CE) ou de l a Comnunaute Economique Européenne (CEE), ses pol i t iques, ses i ns t i t u t i ons ?
i
Table/Tableau 24 : AWARENESS OF EUROPEAN WSTITuTK)NS / La notor iété des i ns t i t u t i ons européevles country/ par pays)
QUESTION : Have you recent ly heard or read about ... ? / Avez-vous récemnent entendu ou lu quelque ?
( X , by
ctose sur ... - l he European Comnission i n Brussels, that i s the Comnission o f the European Comnrnity / La C m i s s i a i
à Bruxelles, qui est l a Comnission de l a Comnunauté Européenne (COMMISSION) Européenne
X AWARE/ X entendu ou l u
COMH I SS I ON
COUNCIL
EP
CWRT
D
WEST EAST EClZ+ . B OK ---- 1 r--- - GR E F IRL I L NL P
1
54 58 47 I 48 I 51 51 39 50 55 40 66 57 53
48 58 39 I 39 I 37 48 41 40 46 36 53 53 45
58 60 56 I 58 64 57 55 54 58 55 63 64 63
35 61 49 i 49 i 49 42 29 29 54 29 48 43 40
I I
I I
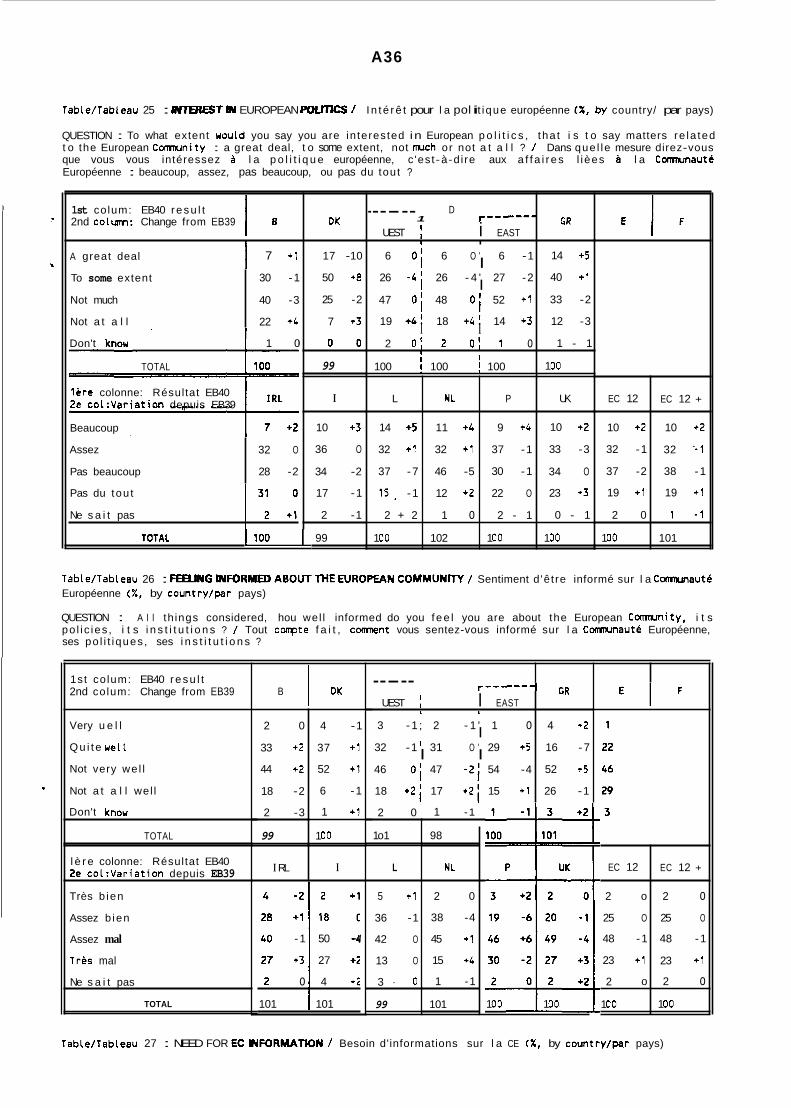
A36
D
UEST I i EAST
6 O ; 6 O ' 6 -1
26 -4; 26 - 4 ' 27 -2
47 O ; 48 O ; 52 +1
19 + I ' 18 +4' 14 +3
1 r------ ------ I I
I I
I I 2 0 : 2 0 ! 1 o
I
100 100 i 100
L NL P
14 +5 11 +4 9 +4
32 +1 32 +1 37 -1
37 -7 46 -5 30 -1
15. -1 12 +2 22 O
2 + 2 1 o 2 - 1
1 O0 102 1 O0
Table/Tableau 25 : INTEREST H EUROPEAN pouTlCs / I n t é rê t pour l a pol i t ique européenne ( X , by country/ par pays)
QUESTION : To what extent would you say you are in terested in European p o l i t i c s , tha t i s t o say matters re la ted t o the European Comnunity : a great deal, t o some extent, not ruch or not a t a l l ? / Dans que l le mesure direz-vous que vous vous intéressez à l a p o l i t i q u e européenne, c 'est-à-d i re aux a f f a i r es l i èes à l a Conmunaut6 Européenne : beaucoup, assez, pas beaucoup, ou pas du tout ?
GR
14 +5
40 +1
33 -2
12 -3
1 - 1
1 O0
UK
10 +2
33 -3
34 O
23 +3
0 - 1
1 O0
To some extent
Not much
Not a t a l l
30 -1
40 -3
22 +4
EC 12
10 +2
32 -1
37 -2
19 +1
2 0
1 O0
EC 12 +
10 +2
32 --1
38 -1
19 +1
1 - 1
101
r-----J ----- UEST I I EAST
I I
3 - 1 ; 2 - 1 ' 1 o I I I 32 -1 ' 31 O ' 29 +5
46 01 47 -21 54 -4
18 + 2 i 17 + 2 i 15 +1
GR
4 +2
16 -7
52 +5
26 -1
EC 12
2
25 O
48 -1
23 +1
2
1 O0
EC 12 +
o 2 o 25 O
48 -1
23 +1
o 2 o 1 O0
E l F 1st colum: EB40 resu l t 2nd colurm: Change from EB39 DK
I 7 +1 A great deal 17 -10
50 +8
25 -2
7 +3
O 0
99
I
Don't know 1 0
TOTAL
l e r e colonne: Résultat EB40 2e co1:Variation depuis EB39
Beaucoup 10 +3
36 O
34 -2
17 -1
2 -1
99
Assez
Pas beaucoup
32 O
28 -2
Pas du tou t
Ne s a i t pas 'i +: Table/Tableau 26 : FEELING IFORMED ABOUTTHENROPEAN COMMUNrrY / Sentiment d 'ê t re informé sur l a Comunaut6 Européenne (%, by country/par pays)
QUESTION : A l l th ings considered, hou wel l informed do you f ee l you are about the European Comrrrnity, i t s po l i c ies , i t s i n s t i t u t i o n s ? / Tout conpte f a i t , tomnent vous sentez-vous informé sur l a Comnunauté Européenne, ses po l i t i ques , ses i n s t i t u t i o n s ?
1st co lum: EB40 resu l t 2nd colum: Change from EB39 B I DK E l F Very u e l l
Qu i t e u e l l
Not very we l l
Not a t a l l wel l
Don't knau
4 -1
37 +1
52 +1
6 -1
1 +1
2 0
33 +2
44 +2
18 -2
2 -3
99
I RL
1 -1 2 0
1 o1
L
~~
TOTAL
l è r e colonne: Résultat EB40 Ze co1:Variation depuis EB39
Très b ien
Assez b ien
Assez mal
Très mal
Ne s a i t pas
TOTAL
98
NL
1 O0
I
2; 1: 1 f 8
+3 27
101 101
-1 50 -4
o 4 +2
2 0
38 -4
45 +1
15 +4
1 -1
101
5 +1
36 -1
42 O
13 O
3 - O
99 1 O0 1 O0
Table/fableau 27 : NEED FOR H: NFORMATION / Besoin d'informations sur l a CE (%, by country/par pays)

A37
TabLe/TabLeau 27 : NEEDFORECNFORMATION / Besoin d' informations sur La CE ( X , by country/par pays)
QUESTION : Which o f the fo l low ing statements comes closest t o your opin ion ? / Parmi l e s proposi t ions suivantes, que l l e es t c e l l e qui es t Le p lus proche de vo t re opinion ?
- 1 r e a l l y need t o know a Lot more about the European Comnunity / J 'a i reellement besoin d'en savoi r beaucoup p lus sur La Comnunauté Européenne (LOT MORE)
I would l i k e t o have some more in format ion about the European C o " i t y / J'aimerais avo i r quelques in format ion supplémentaires sur La Cc i "au té Européenne (SOME MORE)
- As f a r as I am concerned I am happy u i t h what I already know / En ce qui me concerne, j e su is s a t i s f a i t de ce que j e connais déjà (ENOUGH)
-
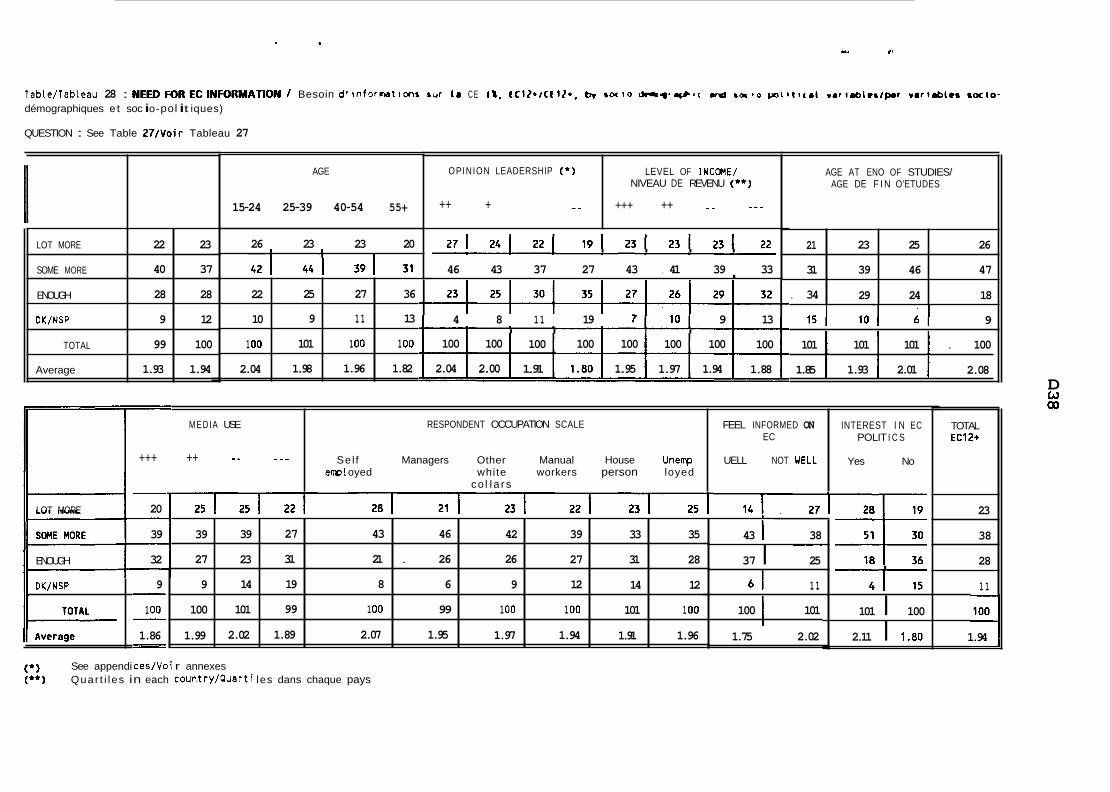
OPINION LEADERSHIP ( * I
+ ++ - _
LEVEL OF INCOWE/ NIVEAU DE REVENU (**I
_ - _ +++ ++ _ _
LOT MORE
SOME MORE
ENOUGH
DK/NSP
TOTAL
Average
22 23
40 37
28 28
9 12
99 100
1.93 1.94
21
31
. 34
23 25 26
39 46 47
29 24 18 22
10
1 O0
2.04
25 27 36
9 11 13
101 1 O0 1 O0
1.98 1.96 1.82
39
27
9
100
1.99
39 27 43 46 42 39 33 35
23 31 21 . 26 26 27 31 28
14 19 8 6 9 12 14 12
101 99 1 O0 99 1 O0 1 O0 101 1 O0
2.02 1.89 2.07 1.95 1.97 1.94 1.91 1.96
Table/Tableau 28 : NEEDFORECINFORMATION / Besoin d' informations suc I& CE ( X , 1 C 1 2 * i C 1 1 2 * , u w 1 0 r k * , 3 1 c rd w n t O ~ i i c i ~ a c r . ~ i a b l e ~ / p . r rar iables socio- démographiques e t soc i o- pol i t iques)
QUESTION : See Table 27/Voir Tableau 27
AGE AT ENO OF STUDIES/ AGE DE F I N O'ETUDES
AGE
15-24 25-39 40-54 55+
26 23 23 20 I m I I I I I
46 43 37 27 43 , 41 39 33 I
1 5 ) 101 6 ) 9 4 8 11 19 9 13 1 I I r I I I
101 I 101 I 101 I . 100
2.08 1.85 1.93 2.01
100 100 100 100 100 100 100 100
2.04 2.00 1.91 1.80 1.95 1.97 1.94 1.88 D w 00
MEDIA USE
-. - - - +++ ++
RESPONDENT OCCUPATION SCALE FEEL INFORMED ON EC
INTEREST I N EC POLIT I C S
Yes No
TOTAL EC12+
Sel f Managers Other Manual House Unemp enpl oyed white workers person loyed
co l l a r s
UELL NOT UELL
- 20 23 LOT MORE
ENOUGH
I
39 43 1 - 38 38
32
9
1 O0
1.86
- - - - -
~~ ~
37 I 25 28 I
61 11 1 1 II DK/NSP
100 I 101 101 I 100 Il- 2.11 I 1.80 1.94 1.75 2.02
(*) (**I
See appendi ces/Voi r annexes Quar t i l es in each country/Quarti les dans chaque pays

A39
NL
81
16
4 1
101
43
43
14
100
69
27
100
79
18
4 1
101
Table/Tableau 29 : TYPEOF EC tNF0RMATK)N REQUIRED ? / Quel type d' information sur l a CE es t demandé ? ( X , on ly those who sa id they needed a l o t or some more information/ Uniquement posé a ceux qui d isent avo i r besoin d'un peu ou beaucoup d ' in format icn, by country/par pays)
QUESTION : You sa i d you would l i k e t o know more about the European Comnunity. Here i s a l i s t o f d i f f e r e n t kinds of in format ion which people might want t o get about the European Comnunity. For each o f the fo l low ing please t e l l me whether i t i s very important o r not very important f o r you t o have ... ? / Vous m'avez d i t que vous aimeriez en savoi r p lus sur l a Comnunauté Européenne. Voic i une l i s t e de d i f f é r e n t s types d ' in format ion que cer ta ins pourra ient souhaiter recevoir sur l a Comnunauté Européenne. Pour chacun d 'entre eux, voudriez-vous me d i r e s ' i l
- ... general in format ion t o simply he lp me understand be t t e r how the European C u " i t y works and uhat i t
est pour vous t r è s important ou pas t r ès important d'avoir ... ? 5
does / des informations générales qui m'aident simplement à mieux comprendre c m n t fonct ionne l a Comnunaute , Européenne e t ce qu ' e l l e f a i t (GENERAL INFORMATION)
- ... more spec i f i c in format ion help ing me in my work / des informations p lus spécif iques qui m'aident dans ma v i e professionnel t e (WORK-RELATED INFORMATION)
P UK
91 89
8 9
3
100 101
72 38
26 57
3 5
101 100
87 69
11 29
4 2 3
100 101
96 76
3 21
3
100 100
- ... more spec i f i c in format ion help ing me as a consuner / des informations p lus spécif iques qui m'ait consomnateur (CONSUMER INFORMATION)
... more spec i f i c in format ion help ing me as a c i t i z e n t o be t t e r form my personal opin ion on variou! Comnuni tyaf fa i rs o r p o l i c i e s / des informations p lus spécif iques qui m'aident cunne citoyen, pour mieu une opin ion personnel le sur les diverses a c t i v i t é s ou po l i t i ques de l a Comnunaute Européenne INFORMATION)
-
GENERAL INFORMATION
Very important
Not very important
Don't know
TOTAL
UORK-RELATED INFORMATION
Très important
Pas t r è s important
Ne s a i t pas
TOTAL
CONSUMER INFORMATION
Very important
Not very important
Don't knou
TOTAL
C I T I Z E N INFORMATION
Tres important
Pas t r ès important
Ne s a i t pas
TOTAL
f iq; 100 100 100
It COmne
iuropean ne f a i r e [CITIZEN
- EC12+
86
12
2
1 O0 - 53
42
5
1 O0
- -
70
27
3
1 O0 - 80
18
3
101

A40
Table/Tableau 30 : EC INFORmTION SOURCES / Sources d' information sur l a CE ( X , by c'ountry/par pays)
QUESTION : When you are looking f o r more information about the European Camunity ( the EC), i t s po l i c ies , i t s i n s t i t u t i ons , where do you look f i r s t ? / Quand vous devez obteni r des informations supp lben ta i res sur l a Comnunauté Européenne, ses pol i t iques, e t ses i ns t i t u t i ons oÙ al lez-vous d'abord les chercher ?
A t a meeting/Réunions
Discussion w i th re lat ives, fr iends, colleagues/ Discussions en fami l le , entre amis e t collègues
Da i 1 y newspapers/ Journaux quotidiens
Other newspapers, magari nes/ Magaz i nes, pé r i d i q u e s
Books, brochures, information l ea f l e t s / Livres, brochures, f iches d' informat i on
European in format ion on not ice boards i n town hal ls , s tat ions, post of f ices, l i b r a r i e s / Panneaux d ' in format ion européenne dans les bibliothèques, mairies, gares, postes
EC-information o f f i ces , Euro- info-centers, Euro- l ibraries/Bureaux d' information de l a CE, Guichets Européens, Euro- b i b l i othèques
Specialised nat ional o r regional g o v e r m n t information o f f i ces / Agences d' informations spécialisées des administrat ions nationales DU régionales
Trade Unions or prof. ass./Ass. prof . ou syndi ca les
Other consuner organisations/ Autres organisat ions (consomnateurs ... ) TV, rad io
Contact a "ber o f EP o r a member o f nat ional parliament/ En contactant un " b r e du PE ou un " b r e du parlement nat i ona 1
Others/Autres
Never look f o r such information, not interested/Ne cherche jamais ce type d'informations, pas intéresse (SPON)
Don't know/Ne s a i t pas
3
16
33
23
12
4
4
2
4
2
43
2
1
10
1 1 - -
- - OK
2 -
16
37
23
16
17
10
2
5
2
50
2
4
10
9 - -
O
WEST ! rËÄ;;' 1 ---- 6 ; 5 ;
l . I I
20 I 19
53 I 54 i I I
18 I 19 i I
52 I 54 I I
1 1 1 ;
I I I
I I I
I I I
i ì 3 3
I I I I
14 I 13 1 I I
I l
3
17
59
21
18
5
6
4
2
2
62
O
3
10
3
22
36
20
9
4
1
2
3
2
52
1
4
21
3 -
- - IRL
1 -
7
42
12
10
3
3
2
1
2
52
4
3
16
7 - -
- - NL
2 -
8
50
14
13
10
3
3
1
1
50
1
9
12
6 - -
- - P
3 -
32
28
18
6
3
3
3
2
1
59
1
1
5
10 =
- - UK
1 -
7
36
9
6
8
2
1
O
1
34
1
5
22
12 - -
- - EC124
3 -
17
42
18
10
6
4
3
3
2
51
1
3
15
8 - Mult i p l e choice-percentages add up t o more than 100/ La somne des X à choix n u l t i p l e est supérieur à 100
Due t o a technical error , TV/radio was omi t ted as an answer opt ion i n Luxenbourg/DÛ à une erreur technique, l a categorie TV/radio n'a pas é té présentee au Luxenbourg cunne réponse possible.
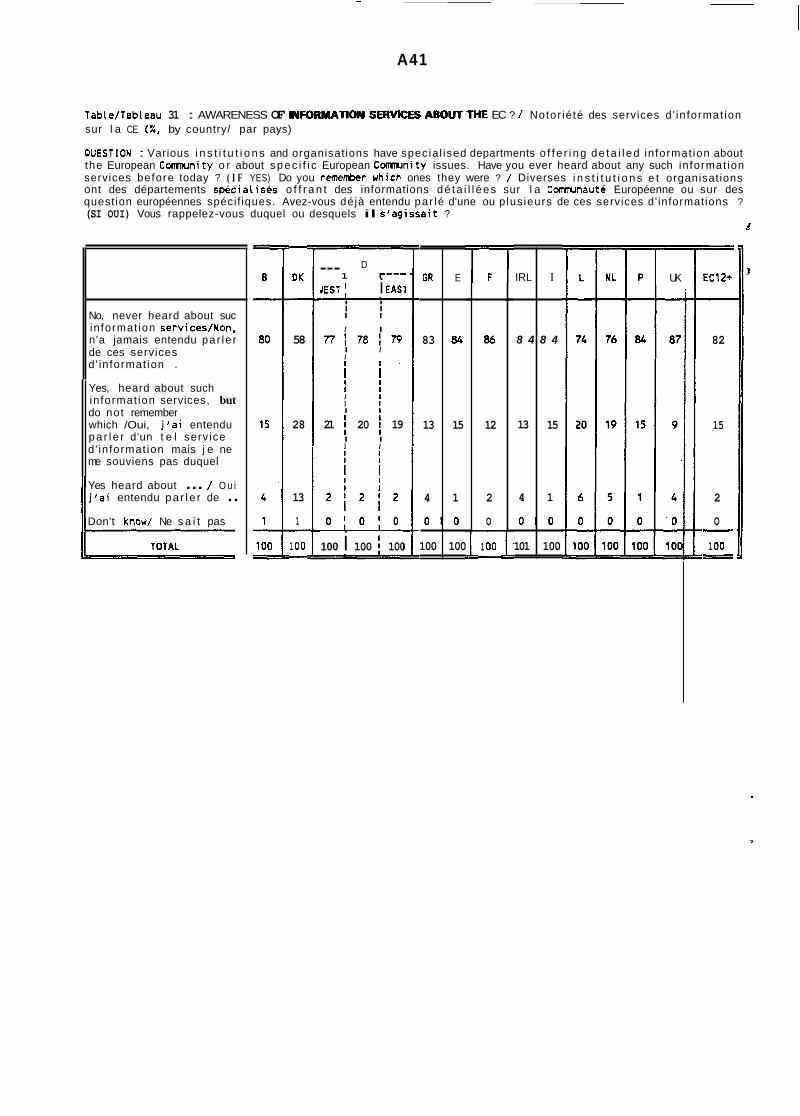
I
GR
83
13
4 1
O 0
100
A41
E
84
15
100
Table/Tableau 31 : AWARENESS OF INFORMATION SERVICES ABOUTTHE EC ? / Notor ié té des services d ' in format ion sur l a CE ( X , by country/ par pays)
QUESTION : Various i n s t i t u t i o n s and organisat ions have specia l ised departments o f f e r i ng de ta i l ed in format ion about the European Comnunity o r about spec i f i c European C m n i t y issues. Have you ever heard about any such in format ion services before today ? ( I F YES) Do you remember uhich ones they were ? / Diverses i n s t i t u t i o n s e t organisat ions ont des départements sp6cia l isés o f f r a n t des informations dé ta i l l ées sur l a Comnunauté Européenne ou sur des question européennes spécif iques. Avez-vous déjà entendu par lé d'une ou p lus ieurs de ces services d' informations ? (SI OUI) Vous rappelez-vous duquel ou desquels il s'agissai t ?
IRL
13
4 1
101
No, never heard about suc in format ion services/Non, n'a jamais entendu par le r de ces services d ' in format ion .
Yes, heard about such in format ion services, but do not remember which /Oui, j ' a i entendu pa r l e r d'un t e l serv ice d ' in format ion mais j e ne me souviens pas duquel
Yes heard about ... / O u i j ' a i entendu pa r l e r de .. Don't knou/ Ne s a i t pas
I
8 4 8 4
15
O 0
100
- - DK
-
58
28
13
1
1 O0 - - -
D 1 r---
dEST i i EAS1
--- I I I I I I
I I
I I I
7 7 1 7 8 1 7 9
I ' i l I I I I
21 i 20 i 19 I I I I
0 : o ; o
100 i 100 i 100
86
12
2
O
1 O0 - - -
UK
- - EC12+
82
15
2
O
1 O0 - - -
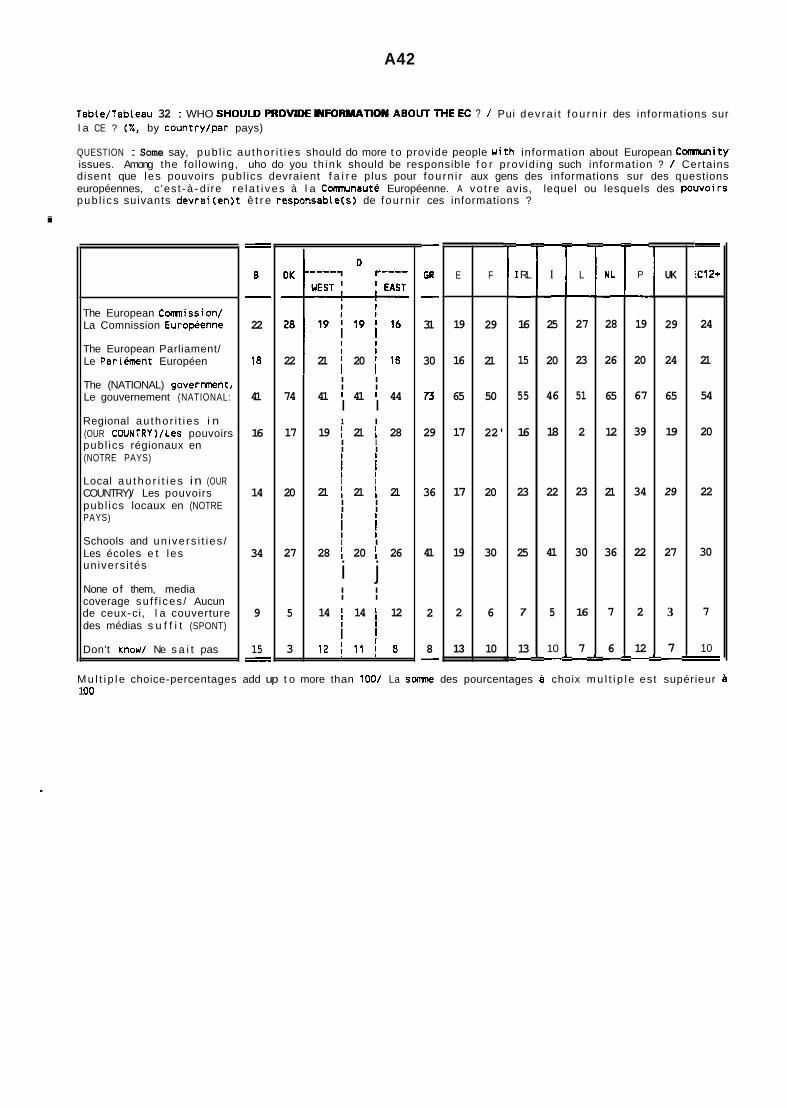
A42
19
16
65
17
17
19
13
Table/Tableau 32 : WHO SHOULD PROVlDEINFORMATlON ABOUTTHEEC ? / Pui devra i t f ou rn i r des informations sur l a CE ? ( X , by country/par pays)
QUESTION : Some say, pub l i c au thor i t i es should do more t o provide people w i th information about European C o m u n i t ) ' issues. Among the fol lowing, uho do you th ink should be responsible f o r prov id ing such information ? / Certains disent que les pouvoirs publ ics devraient f a i r e plus pour fourn i r aux gens des informations sur des questions européennes, c 'est-à-d i re r e l a t i ves à l a Comnunaute Européenne. A vo t re avis, lequel ou lesquels des pouvoirs pub l i cs suivants devrai(en)t ê t r e responsable(s) de fourn i r ces informations ?
E F
29
21
50
22'
20
30
2 6
10
i
74
17
20
27
5
3
The European Comnission/ La Comnission Europkenne
The European Parliament/ Le Parlément Européen
The (NATIONAL) govermenti Le gouvernement (NATIONAL:
Regional au thor i t i es i n (OUR CWNTRY)/Les pouvoirs publ ics régionaux en (NOTRE PAYS)
Local au tho r i t i e s in (OUR COUNTRY)/ Les pouvoirs publ ics locaux en (NOTRE PAYS)
Schools and un ivers i t ies / Les écoles e t les univers i tés
None of them, media coverage su f f i ces / Aucun de ceux-ci, l a couverture des médias s u f f i t (SPONT)
Don't know/ Ne s a i t pas
I I I I
41 I 41 I 44 I I 1 I
I I I I
19 I 21 I 28
j j
i j
i j
I I
I I I I
21 ; 21 ; 21
I I 28 i 20 I 26
I I I I
14 I 14 i 12
i i 1 2 1 1 1 j B
- - B
- 22
18
41
16
14
34
9
15 - -
22 I 21 ; 20 ; 16
- - GR
- 31
30
73
29
36
41
2
8 - -
- - I RL
- 16
15
55
16
23
25
7
13 - -
- - I
- 25
20
46
18
22
41
5
10 - -
- - L
- 27
23
51
2
23
30
16
7 - -
- - NL
- 28
26
65
12
21
36
7
6 - -
- - P
- 19
20
67
39
34
22
2
12 - -
UK
29
24
65
19
29
27
3
7 - -
- - ic12+
24
21
54
20
22
30
7
10 - - Mult i p l e choice-percentages add up t o more than 100/ La somne des pourcentages à choix mu l t i p l e est supérieur a 1 O0
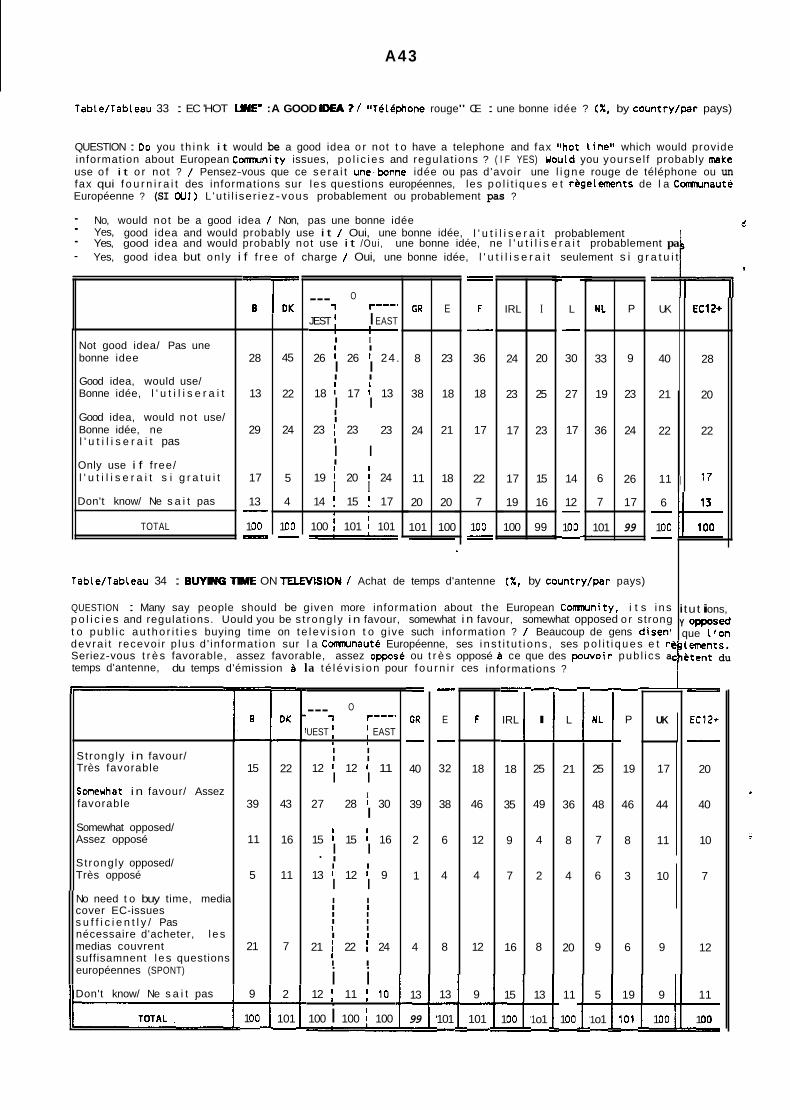
A43
GR
8
38
24
11
20
101
Table/Tableau 33 : EC 'HOT UNEr :A GOOD IDEA 'I / Véléphone rouge" CE : une bonne idée ? ( X , by country/par pays)
E
23
18
21
18
20
100 -
QUESTION : Do you t h i nk i t would be a good idea o r not t o have a telephone and fax "hot l i ne " which would provide information about European Comnunity issues, po l i c i es and regulat ions ? ( I F YES) Uould you yoursel f probably make use o f i t o r not ? / Pensez-vous que ce se ra i t une.bonne idée ou pas d'avoir une l i gne rouge de téléphone ou un fax qui f o u r n i r a i t des informations sur les questions européennes, les po l i t i ques e t règelements de l a Comnunauté Européenne ? (SI OUI) L 'u t i l i se r iez- vous probablement ou probablement pas ?
- No, would not be a good idea / Non, pas une bonne idée - Yes, good idea and would probably use i t / Oui, une bonne idée, l ' u t i l i s e r a i t probablement - Yes, good idea and would probably not use i t /Oui, une bonne idée, ne l ' u t i l i s e r a i t probablement pa - Yes, good idea but on ly i f f r ee of charge / Oui, une bonne idée, l ' u t i l i s e r a i t seulement s i g r a t u i t
IRL
24
23
17
17
19
100
I
20
25
23
15
16
99
NL
33
19
36
6
7
101
P
9
23
24
26
17
99
UK ECl2+
28
20
22
I 17
- - F
- 36
18
17
22
7
- L
- 30
27
17
14
12
1 O0
- - -
O 1 r - - - a
JEST I EAST
--- I I Not good idea/ Pas une
bonne idee
Good idea, would use/ Bonne idée, l ' u t i l i s e r a i t
Good idea, would not use/ Bonne idée, ne l ' u t i l i s e r a i t pas
Only use i f f ree/ l ' u t i l i s e r a i t s i g r a t u i t
Don't know/ Ne s a i t pas
TOTAL
40
21
22
11
6
1 O0
- - -
I I 26 26 I 24.
I I 28
13
29
17
13
1 O0
- - -
45
22
24
5
4
I I
18 i 17 i 13 I I I I
I 23 I 23 23
I I
I I
I
19 i 20 I 24
14 15 17
1 O0 7 - 100 i 101 i 101 - 1 O0 - -
Table/Tableau 34 : BUYING TIME ON TELEVISION / Achat de temps d'antenne ( X , by country/par pays)
QUESTION : Many say people should be given more information about the European Comnunity, i t s i n s p o l i c i e s and regulat ions. Uould you be s t rong ly i n favour, somewhat i n favour, somewhat opposed o r strong t o pub l i c au tho r i t i e s buying time on t e l ev i s i on t o g ive such information ? / Beaucoup de gens diseni devra i t recevoi r p lus d ' in format ion sur l a Comnunauté Européenne, ses i ns t i t u t i ons , ses po l i t i ques e t rs Seriez-vous t r è s favorable, assez favorable, assez oppos6 ou t r è s opposé a ce que des p o w o i r pub l i cs a temps d'antenne, du temps d'émission à la t é l év i s i on pour f ou rn i r ces informations ?
i tut i ons,
que l ' on 3 1 ements. ?ètent du
Y opposed
- - E
- 32
38
6
4
8
13
101
- - -
=
IRL
- 18
35
9
7
16
15
1 O0
- =
- - I
- 25
49
4
2
8
13
1 o1
- - -
- - L
- 21
36
8
4
20
11
1 O0 - -
- - NL - 25
48
7
6
9
5
1 o1 - - -
- - P
19
46
8
3
6
19
101
- - -
- - EC12+
- 20
40
10
7
12
11
1 O0
- - -
=
GR
- 40
39
2
1
4
13
99 - -
O 7 r---
UEST EAST
--- I I
I I I I
12 I 12 I 11 I I
B -
DK
- F UK
Strongly i n favour/ Très favorable
Somewhat i n favour/ Assez favorable
Somewhat opposed/ Assez opposé
Strongly opposed/ Très opposé
No need t o buy time, media cover EC-issues s u f f i c i e n t l y / Pas nécessaire d'acheter, l e s medias couvrent suffisamnent l e s questions européennes (SPONT)
Don't know/ Ne s a i t pas
15 22 18
46
12
4
12
9
101
- - -
17
44
11
10
9
9
I 28 I 30
I 39 43 27
15 I 15 I 16 I I
I I
' I I I
13 I 12 1 9
11 16
5 11
I I I I I I I I 1 I I I
21 i 22 I 24 I I
i i 12 ; 11 10.
100 i 100 I 100 - 21 7
9
1 O0
- - -
2
101
- - - 1 O0

A44
,
TabLe/TabLeau 35 : MEDIAUSE/ Recours aux medias ( X , by country/par pays)
QUESTION : About how of ten do you... ? / Tous Les conbiens a peu près.. . ?
- uatch the news on te lev is ion ? / regardez vous les &nissions d'information à La t6LCvision ? - read the neus i n d a i l y papers ? / Lisez-vous Les nouvelles dans Les journaux quotidients ?. - Listen t o the neus on the radio ? / kouter-vous les émissions.d'information b La radio ?
NEWS - DAILY PAPERS/ ACTUALITE - JOURNAUX
everyday/ tous les jours
several times a week/ plusieurs f o i s par semaine
once o r twice a week/ 1 ou 2 f o i s par semaine
Less often/ moins souvent
B
- 36
18
15
15
I (Inever/ jamais
Don't know/ Ne s a i t pas
TOTAL
1
101
-
RADIO NEUS/ INFORMATIONS A LA RADIO
everyday/ tous Les jours
several times a week/ plusieurs f o i s par semaine
once or twice a week/ 1 ou 2 f o i s par semaine
Less often/ . m i n s souvent
never/ jamais
Don't knou/ Ne s a i t pas
TOTAL
63 62 ' 64 I 70 24 26 31
13 17 17 i 17 16 12 17
1 1 7 i 7 i 6 15 14 20
10 8 I 7 i 4 19 17 16
I I
i i ì i i i
3 5 ' 5 ' 2 26 29 17 I I
o 1 ; ' ; ' o 1 o 100 100 i 101 i 100 100 99 101
B OK
51 71
15 10
10 5
14 9
10 I,
1 0
101 99
O 1 r----
WEST : : EAST
54 I 56 I 64
20 I 20 I 19
1 1 I 10 I 6
----- I I
I I
i i i i i i
I I I 1 1 ; 1 ; 1
101 i 101 i 102
1 1 10 I 9
4 ' 4 ' 3
GR E F
33 36 37
18 11 17
11 10 11
17 17 16
21 25 19
1 1 0
101 100 100
UK
- 78
12
7
2
EC124 -
70
18
6

A45
I&ic/Tableau 36 : MEDIA USE / Recours aux media ( X , EC12+/CE12+, by socio-demographic and socio-political war i ables/par var i ables soci o-dhgraph iques et soci o-pol it iques)
R E S T I O N : See Table 35/ Voir Tableau 35
I OPINION LEADERSHIP (*) LEVEL OF INCOHE/ NIVEAU DE REVENU (**I
I
TOTAL I I I
EC12+
37
( 0 ) See appendices/Voir annexes Ouartiles in each country/Puartiles dans chaque pays

A46
I
Table/Tableau 37 : MEDIA USE / Recours aux media ( X , EC12+/CE12+, by socio-demographic and soc i o - po l i t i ca l variables/par var iables socio-démographiques e t soc io-pol i t iques)
QUESTION : See Table 35/Voir Tableau 35
76
13
TELEVISION NEUS
71 69 53
19 19 27
Everyday
Several times a ueek
Once or twice a ueek
Less o f t en
Never
DK
TOTAL
SEXCE)
72 68
17 19
6 7
3 4
2 2
O O
1 O0 1 O0
M F
11 8 5 3
~~
AGE
5
15-24 25-39 40-54 55+
qqq? 6 6 11
7'
2
O
101
3 3 2
2 1 2
O O O
1 O0 99 1 O0
Tous les jours
Plusieurs f o i s par sema i ne
Une ou deux f o i s par semaine
Moins souvent
Jamais
Ne s a i t pas
TOTAL
++ + - _ ++ + - - EC12+ high/ 1 ou/ high/ 1 ou/ é 1 evé f a i b l e éleve f a i b l e
79 73 68 63 72 70 72 70 70
. 15 19 19 17 19 20 17 17 18
3 5 8 9 5 6 5 6 6
2 2 4 6 3 3 4 4 4
2 1 2 3 2 1 2 3 2
O O O 1 O O O O O
101 1 O0 101 99 101 1 O0 1 O0 1 O0 1 O0
fi 100 100 1 O0 1 O0
I I I ACTUALITES - TELEVISION
OPINION LEADERSHIP (*I LEVEL OF INCOME/ NIVEAU DE REVENU (**)
TOTAL

A47
PUESfION : See Table 35/Voir Tableau 35
15-24 25-39 40-54 55+ -16 16-19 20+ s
Less often 1 1 15 17 14 11 10 14 11 9 19
Never 1 1 17 14 10 12 18 22 9 7 I 14
OK 1 O 1 O O 1 1 O 1 1
TOTAL 102 101 101 99 1 O0 102 100 101 1 O0 99
ACTUALITE - OPINION LEADERSHIP (*) LEVEL OF INCOME/ JOURNAUX NIVEAU DE REVENU (**)
Moins sowent 7 12 14 15 9 12 14 14
Jamais 6 0 14 28 8 10 13 21 14
Ne sait pas O o O 1 O O O 1 I 1
TOTAL 99 1 O0 1 O0 1 O0 1 O0 99 1 O0 1 o1 1 o1 I
(*I See appendices/Voir annexes (**) Quartiles i n each country/Quartiles dans chaque pays
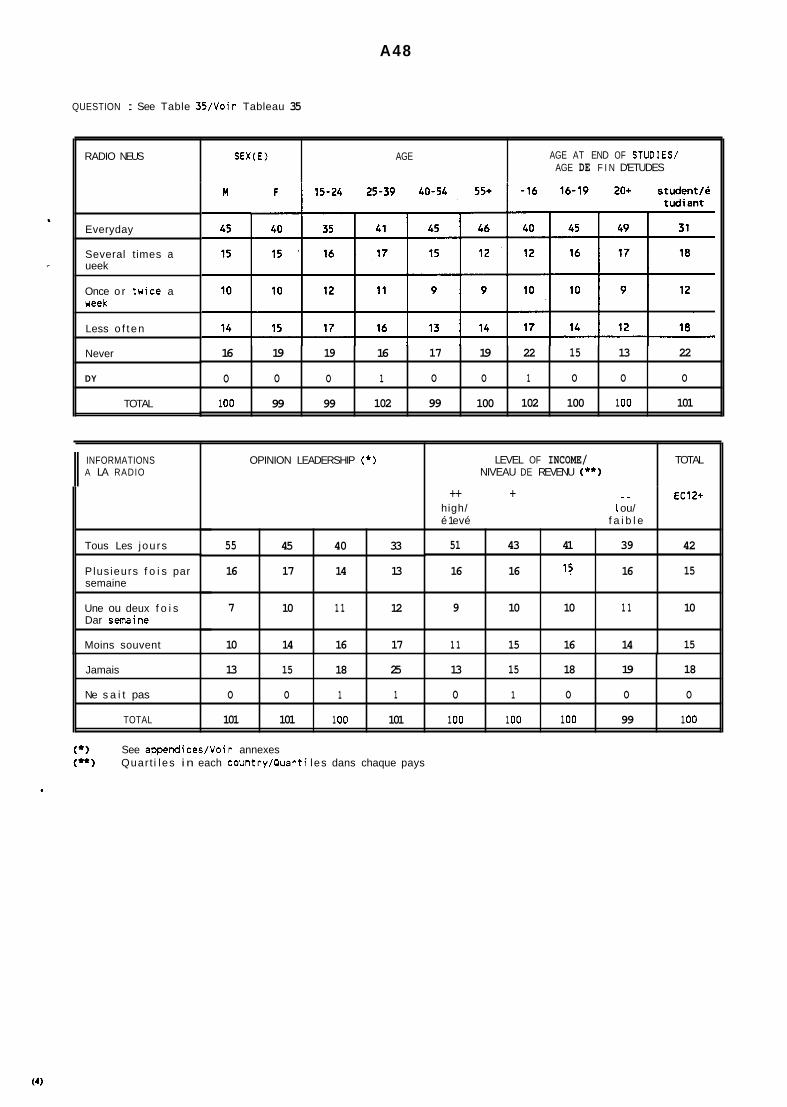
A48
RADIO NEUS SEX(E) AGE
QUESTION : See Table 35/Voir Tableau 35
AGE AT END OF STUDIES/ AGE DE F I N D'ETUDES
16
O
1 O0
Everyday
Several t imes a ueek
19 19 16 17 19 22 15 13 22
O O 1 O O 1 O O O
99 99 102 99 100 102 100 1 O0 101
Once o r twice a ueek
Tous Les jou rs
i P lus ieurs f o i s par semaine
Less o f t e n
++ + - - high/ 1 ou/ é 1 evé f a i b l e
51 43 41 39
16 16 15 16
9 10 10 1 1
1 1 15 16 14
Never
EC12+
42
15
10
15
DY
55
16
7
10
TOTAL
45 40 33
17 14 13
10 1 1 12
14 16 17
Jamais
Ne s a i t pas
TOTAL
INFORMATIONS A LA RADIO II
13 15 18 25 13 15 18 19 18
O O 1 1 O 1 O O O
101 101 1 O0 101 1 O0 1 O0 1 O0 99 1 O0
Une ou deux f o i s Dar semaine
Moins souvent
OPINION LEADERSHIP (*I LEVEL OF INCOME/ NIVEAU DE REVENU (**I
TOTAL
(*I See appendices/Voir annexes (**) Quart i l es i n each country/Quart i l es dans chaque pays
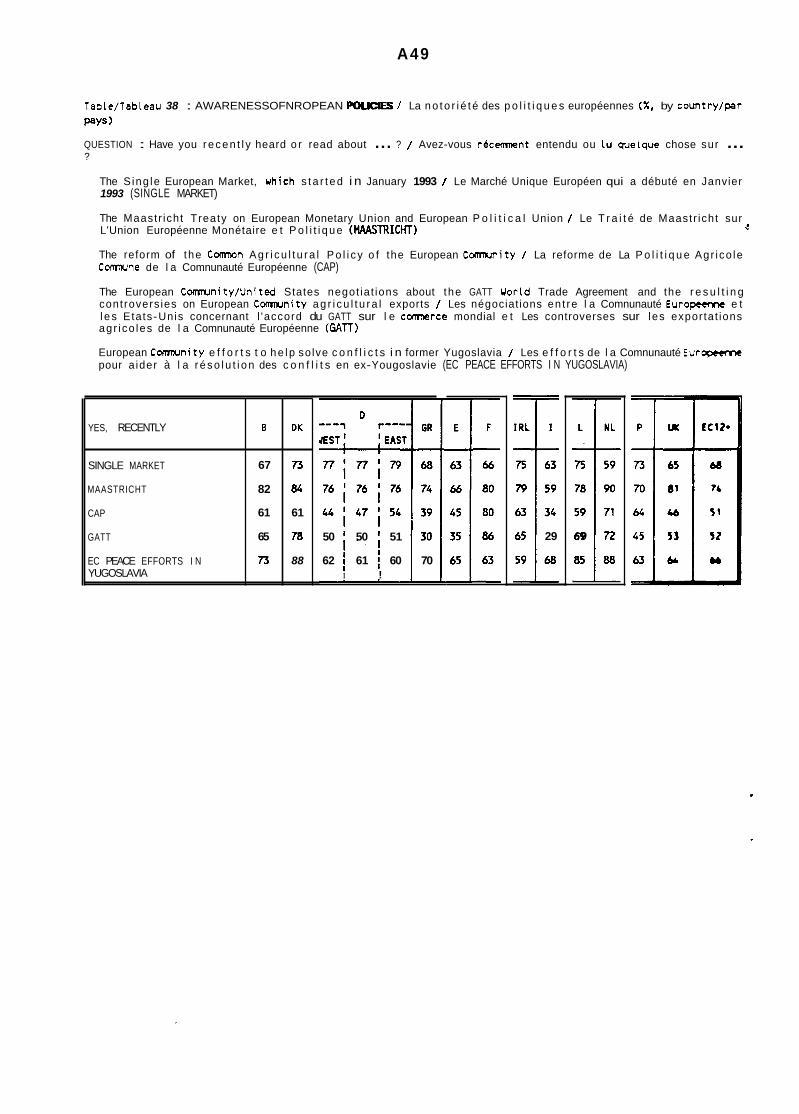
A49
YES, RECENTLY
SINGLE MARKET
MAASTRICHT
CAP
GATT
EC PEACE EFFORTS I N YUGOSLAVIA
Table/Tableau 38 : AWARENESSOFNROPEAN POUClES / La n o t o r i é t é des p o l i t i q u e s européennes ( X , by country/par Pays 1
B DK
67 73
82 84
61 61
65 78
73 88
? QUESTION : Have you r e c e n t l y heard o r read about ... ? / Avez-vous récemnent entendu ou Lu quelque chose sur ...
The S ing le European Market, uhich s t a r t e d i n January 1993 / Le Marché Unique Européen qui a débuté en Janvier 1993 (SINGLE MARKET)
The Maastr icht Treaty on European Monetary Union and European P o l i t i c a l Union / Le T r a i t é de Maastr icht sur L'Union Européenne Monétaire e t P o l i t i q u e (MAASTRICHT) d
The reform of the C m n A g r i c u l t u r a l P o l i c y o f the European Comnunity / La reforme de La P o l i t i q u e Agr i co le Comnune de l a Comnunauté Européenne (CAP)
The European Comnunity/United States negot ia t ions about the GATT World Trade Agreement and the r e s u l t i n g controvers ies on European Comnunity a g r i c u l t u r a l exports / Les négociat ions en t re l a Comnunauté EuropCcmc e t l e s Etats-Unis concernant l 'accord du GATT sur l e cmnerce mondial e t Les controverses sur les expor tat ions agr i co les de l a Comnunauté Européenne (GATT)
European C m n i t y e f f o r t s t o h e l p so lve c o n f l i c t s i n former Yugoslavia / Les e f f o r t s de l a Comnunauté Europtcmc pour a ider à l a r é s o l u t i o n des c o n f l i t s en ex-Yougoslavie (EC PEACE EFFORTS I N YUGOSLAVIA)
50 ' 50 i 51 30
62 61 I 60 70 I !
' I
29
f 69 72

A50
DK
57 -8
43 +7
1 O0
Table/Tableau 39 : MAASTRICHT: FOR OR AGAINST? / Maastricht: pour ou contre ? ( X , by country/par pays)
QUESTION : I f the re uere a referendun (Denmark, Ireland, France: @@another referendun1l) on whether o r no t t o agree t o the Maastr icht Treaty ( D e m r k and UK: laas reexamined a t the Edinburgh S m i t @ I ) , uould you vote f o r or against ? / S ' i l y a v a i t un référendun (au Danemark, en I r lande e t en France: Ilun autre referendun") sur l ' accep ta t ion ou non du T r a i t é de Maastr icht (au Danemark e t au Royaune Uni: come réexaminé au S m t d'Edinbourg88), voter iez-vous pour ou contre ?
. D GR 1 r------ ------
WEST f I EAST I 1
62 +1 i 62 +1 i 61 +3 86 +13
38 - 1 : 38 - 1 39 - 3 14 -13 I
I 100 i 100 ! 100 1 O0
I I
1st colurn: E640 resu l t * 2nd co lum: Change E B 3 V
l è r e colonne: Resul ta t EB40* Ze col: V a r i a t i o n depuis EB3V
Pour
contre
TOTAL
IRL
75 -4
25 +4
1 O0
I s t colurm: EB40 r e s u l t 2nd column: Change E639
For
Against
B
43 - 4
14 -2
l a r e colonne: Résul ta t EB40 2e co l : V a r i a t i o n depuis EB39
I IRL
DK
52 -2
39 +8
10 -5
Pour
GR 1 r------ L-----
WEST f EAST I I
39 - 3 ; 39 - 2 ; 37 - 2 55 +10
24 - 2 ; 24 - 3 ' 24 -4 9 - 7 I 37 + 5 ! 37 +5 ! 39 +5 37 - 2
I
1 45 -17
Don't knou
TOTAL
Contre
Ne s a i t pas 40 +19
44 +7
101
TOTAL I 100
17 +21 27 -41 . 1 4 -61 26 -71 61 +6 I 1 I I
1 O0 I 100 I 100 I 100 I 100
D
4;- O j ; ; 7 2 1 ;; :; +I 23 -6
+1 -3 - 4 - 5 36 +1
49 - 1 36 +1 29 +l 52 +2 41 +5
101 I 100 I 100 1 9 9 I 100
I /
36 - 1
1 O0 lod
E
42 *5
12 - 5
45 o 99 - EC 12
39 - 2
22 -2
39 0s
1 100 -
- 8
w 2 22 2
n .1
* Excludes IlDontt knoull/ IlNe s a i t pas" non inc lus
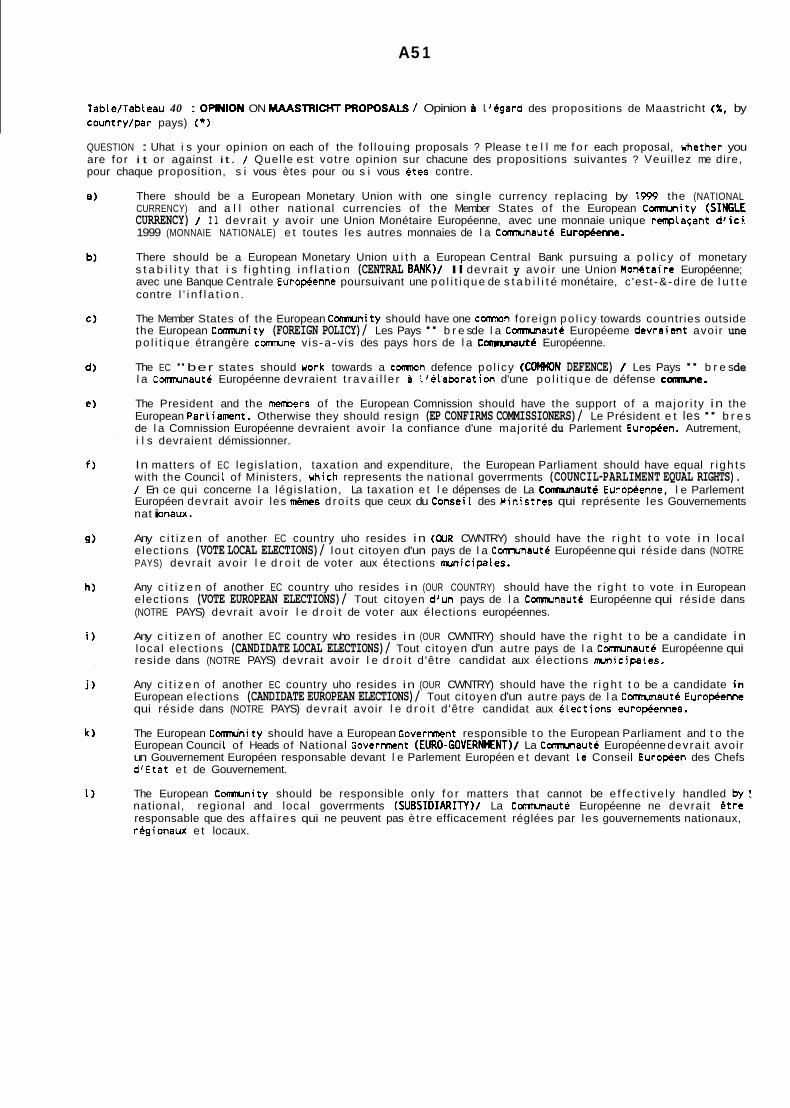
A5 1
Table/Tableau 40 : OPMON ON MAASTRICMPROWSALS / Opinion a ('égard des propositions de Maastricht ( X , by country/par pays) (*)
QUESTION : Uhat i s your opinion on each of the fo l louing proposals ? Please t e l l me f o r each proposal, uhether you are fo r i t or against i t . / Quel le est votre opinion sur chacune des propositions suivantes ? Veuil lez me dire, pour chaque proposition, s i vous ètes pour ou s i vous etes contre.
There should be a European Monetary Union with one s ingle currency replacing by 1999 the (NATIONAL CURRENCY) and a l l other national currencies of the Member States o f the European Conmunity (SINGLE CURRENCY) / I l devrai t y avoir une Union Monétaire Européenne, avec une monnaie unique renplaçant d'ic5 1999 (MONNAIE NATIONALE) e t toutes les autres monnaies de l a Comnunauté Europ&nne.
There should be a European Monetary Union u i t h a European Central Bank pursuing a po l i cy o f monetary s t a b i l i t y that i s f i gh t i ng i n f l a t i o n (CENTRAL BANK)/ Il devrai t y avoir une Union Mon6taire Européenne; avec une Banque Centrale Europienne poursuivant une po l i t i que de s t a b i l i t é monétaire, c 'est-&-dire de l u t t e contre l ' i n f l a t i o n .
The Member States of the European Comnunity should have one comnon foreign po l i cy towards countries outside the European Comnunity (FOREIGN POLICY)/ Les Pays " b r e s de l a Conmunauté Européeme devraient avoir une po l i t i que étrangère c m n e v is-a-v is des pays hors de l a Comnnauté Européenne.
The EC "ber states should work towards a comnon defence po l icy (COMMON DEFENCE) / Les Pays " b r e s de l a C m n a u t é Européenne devraient t r ava i l l e r P l 'élaboration d'une po l i t i que de défense c a " .
The President and the menbers of the European Comnission should have the support o f a major i ty in the European Parliament. Otherwise they should resign (EP CONFIRMS COMMISSIONERS)/ Le Président e t les " b r e s de l a Comnission Européenne devraient avoir l a confiance d'une major i té du Parlement EuroHen. Autrement, i l s devraient démissionner.
In matters o f EC legis lat ion, taxation and expenditure, the European Parliament should have equal r i gh t s with the Counci 1 of Ministers, uhich represents the national goverrments (COUNCIL-PARLIMENT EQUAL RIGHTS). / En ce qui concerne l a légis lat ion, La taxation e t l e dépenses de La Comnrneuté Euroenne, l e Parlement Européen devrai t avoir les " e s dro i t s que ceux du Consei 1 des Ministres qui représente les Gouvernements nat i onaux.
Any c i t i z e n of another EC country uho resides in (WR CWNTRY) should have the r i g h t t o vote in local e lect ions (VOTE LOCAL ELECTIONS)/ l ou t citoyen d'un pays de l a Comnunauté Européenne qui réside dans (NOTRE PAYS) devrai t avoir l e d r o i t de voter aux étections municipales.
Any c i t i z e n of another EC country uho resides i n (OUR COUNTRY) should have the r i g h t t o vote in European elect ions (VOTE EUROPEAN ELECTIONS)/ Tout citoyen d'un pays de l a Comnrnauté Européenne qui réside dans (NOTRE PAYS) devrai t avoir l e d r o i t de voter aux élections européennes.
Any c i t i z e n of another EC country who resides i n (OUR CWNTRY) should have the r i g h t t o be a candidate in local e lect ions (CANDIDATE LOCAL ELECTIONS)/ Tout citoyen d'un autre pays de l a Comrunaut6 Européenne qui reside dans (NOTRE PAYS) devrai t avoir l e d r o i t d'être candidat aux élections m i c i p a l e s .
Any c i t i z e n of another EC country uho resides in (OUR CWNTRY) should have the r i g h t t o be a candidate in European elections (CANDIDATE EUROPEAN ELECTIONS)/ Tout citoyen d'un autre pays de l a Comnareuté Euro- qui réside dans (NOTRE PAYS) devrai t avoir l e d r o i t d'être candidat aux élections europeennes.
The European C m n i t y should have a European Goverment responsible t o the European Parliament and t o the European Counci 1 of Heads of National Goverment (EURO-GOVERNMENT)/ La Conmunauta Européenne devra i t avoir un Gouvernement Européen responsable devant l e Parlement Européen e t devant l e Conseil Europeen des Chefs d'Etat e t de Gouvernement.
The European Comnunity should be responsible only f o r matters that cannot be e f fec t i ve l y handled by: national, regional and local goverrments (SUBSIDIARIPI)/ La Comunauté Européenne ne devrai t ê t re responsable que des a f fa i res qui ne peuvent pas è t re efficacement réglées par les gouvernements nationaux, rigionaux e t locaux.
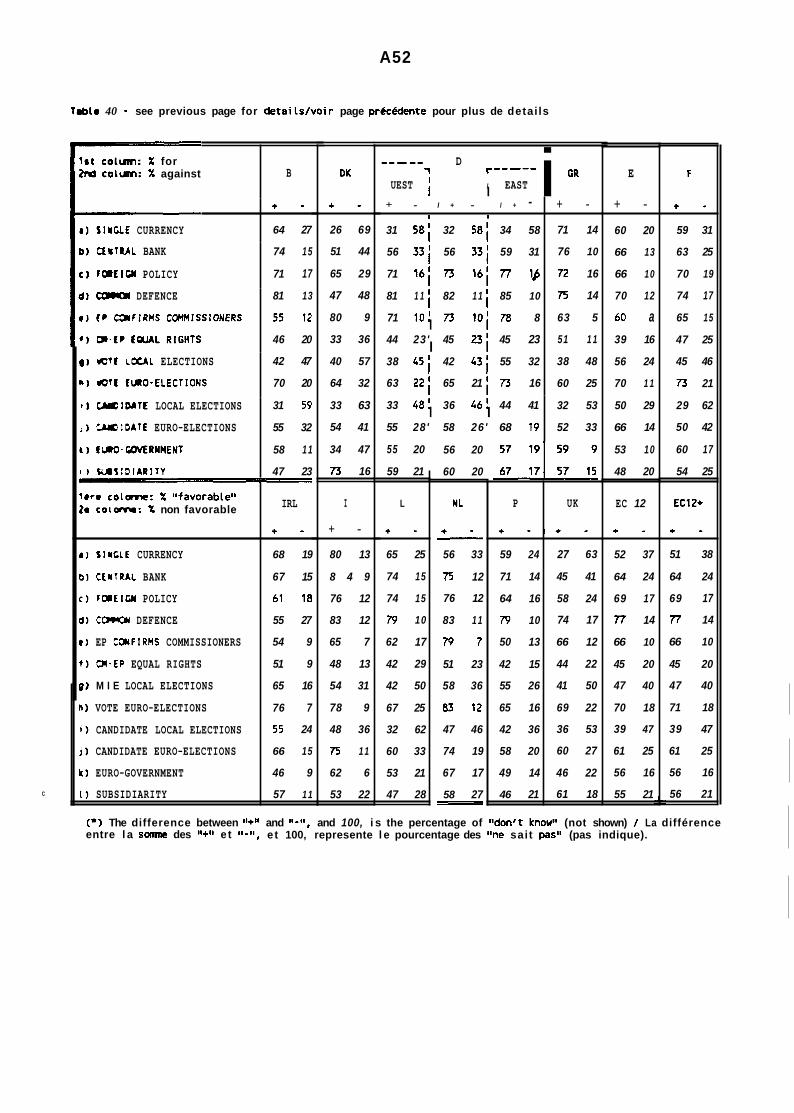
C
+ - I + - I + - 31 5 8 ; 32 5 8 ; 34 58
56 3 3 ; 56 3 3 ; 59 31
71 16; 73 1 6 ; 77 l@
81 1 1 i 82 1 1 85 10
71 10 ' 73 10; 78 8
44 23' 45 2 3 ; 45 23
38 4 5 ; 42 4 3 ; 55 32
63 2 2 ; 65 21 i 73 16
1 I
I I
A52
Trbto 40 - see previous page for details/voir page préc6dente pour plus de detai ls
+ -
71 14
76 10
72 16
75 14
63 5
51 1 1
38 48
60 25
Ist coturn: X for znd cotum: X against
a ) SINGLE CURRENCY
B
+ -
64 27
d) DEFENCE
r j W tQlflRMS COWISSIONERS
b) Q N T U L BANK
e ) l œ E I U l POLICY
81 13
55 12
46 20
74 1 5
71 17
33 48 ' 36 46 ' 44 41
55 28' 58 26 ' 68 19 I I 32 53
52 33
) I 1-L ELECTIONS
I b ) * T t fUO-ELECTIONS
1 ) CYCIDAIE LOCAL ELECTIONS
;) 0 0 1 D A l E EURO-ELECTIONS
I t U l q . m R N W E N T
I 1 W S I D I A R I T Y
42 47
70 20
31 59
55 32
58 1 1
47 23
P
+ - + -
59 24
71 14
64 16
79 10
50 13
42 15
55 26
65 16
42 36
58 20
49 14
46 21
DK
+ -
UK
27 63
45 41
58 24
74 17
66 12
44 22
41 50
69 22
36 53
60 27
46 22
61 18
26 69
51 44
65 29
47 48
80 9
33 36
40 57
64 32
33 63
54 41
34 47
73 16
I
+ -
lere c o l a n e : X olfavorableII Za coiamo: X non favorable
a ) IIUCLE CURRENCY
b) CEUTRAL BANK
c ) rmt1GN POLICY
O ) towoy DEFENCE
r ) EP C3NFIRMS COMMISSIONERS
1 ) W - E P EQUAL RIGHTS
0) M I E LOCAL ELECTIONS
h ) VOTE EURO-ELECTIONS
i ) CANDIDATE LOCAL ELECTIONS
j ) CANDIDATE EURO-ELECTIONS
Ir) EURO-GOVERNMENT
0 SUBSIDIARITY
80 13
8 4 9
76 12
83 12
65 7
48 13
54 31
78 9
48 36
75 1 1
62 6
53 22
IRL
+ -
68 19
67 15
61 i a 55 27
54 9
51 9
65 16
76 7
55 24
66 15
46 9
57 1 1
i GR D 1 r----- -----
I EAST I UEST i
55 20
59 21
L
+ -
65 25
74 15
74 15
79 10
62 17
42 29
42 50
67 25
32 62
60 33
53 21
47 28
56 20
60 20
NL
+ - - 56 33
75 12
76 12
83 1 1
7 9 7
51 23
58 36
83 12
47 46
74 19
67 17
58 27 -
E
+ -
60 20
66 13
66 10
70 12
60 a 39 16
56 24
70 1 1
50 29
66 14
53 10
48 20
EC 12
+ -
52 37
64 24
69 17
77 14
66 10
45 20
47 40
70 18
39 47
61 25
56 16
55 21
F
+ -
59 31
63 25
70 19
74 17
65 15
47 25
45 46
73 21
29 62
50 42
60 17
54 25
EC12+
+ -
51 38
64 24
69 17
77 14
66 10
45 20
47 40
71 18
39 47
61 25
56 16
56 21
(*I The difference between 41+11 and 11-11, and 100, i s the percentage of Ildon't knowo1 (not shown) / La différence entre l a somne des 11+11 e t e t 100, represente l e pourcentage des "ne sait paso1 (pas indique).
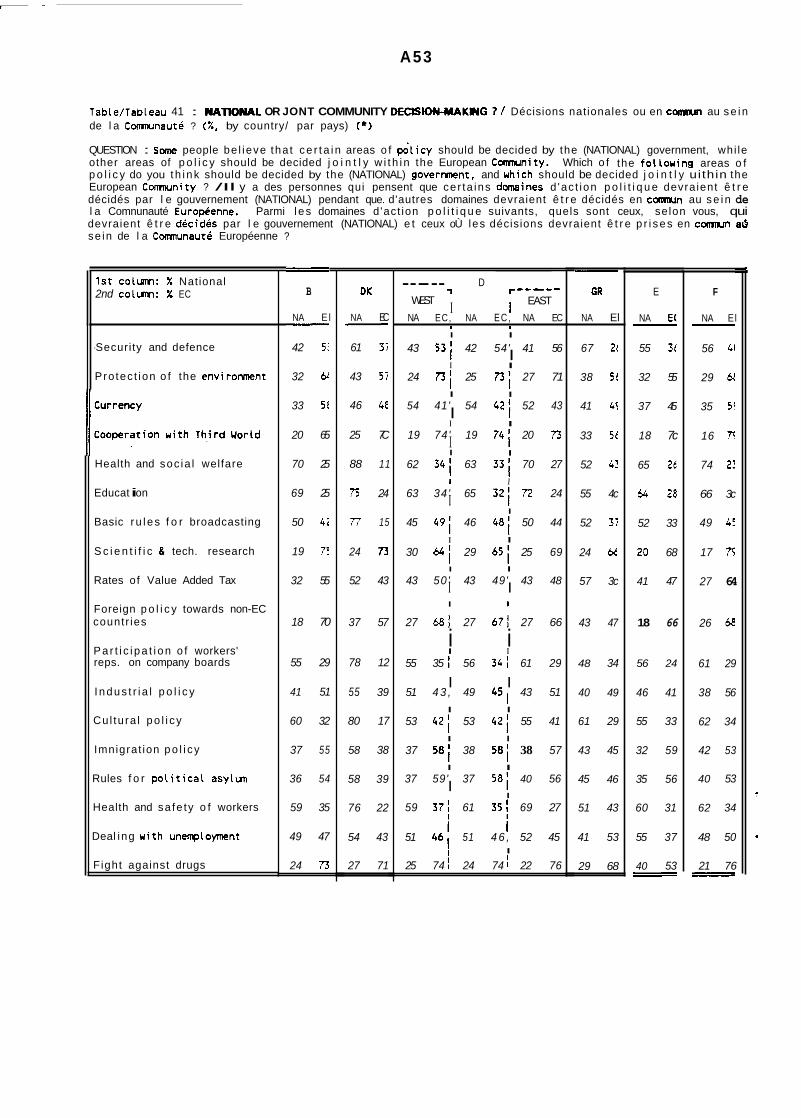
A53
Table/Tableau 41 : NATIONAL OR JONT COMMUNITY DECtSlOKMAKNG 1 / Décisions nationales ou en c ~ r r m n au se i n de l a Comnunauté ? (%, by country/ par pays) (*I
QUESTION : sotne people be l ieve tha t ce r t a i n areas o f pd l i c y should be decided by the (NATIONAL) government, whi le other areas of p o l i c y should be decided j o i n t l y w i t h i n the European C m n i t y . Which o f the f o l l o u i n g areas o f p o l i c y do you t h i nk should be decided by the (NATIONAL) goverment, and uhich should be decided j o i n t l y uithin the European Comnunity ? /Il y a des personnes qui pensent que cer ta ins domaines d 'ac t ion p o l i t i q u e devra ient ê t r e décidés par l e gouvernement (NATIONAL) pendant que. d'autres domaines devraient ê t r e décidés en c o " au se i n de l a Comnunauté Europkenne. Parmi l e s domaines d 'act ion p o l i t i q u e suivants, quels sont ceux, se lon vous, qui devraient ê t r e decidés par l e gouvernement (NATIONAL) e t ceux oÙ les décisions devraient ê t r e p r i ses en cannun a& se in de l a C m n a u t é Européenne ?
1st colurm: X National 2nd colurn: 'x EC
-Securi ty and defence
Pro tec t ion o f the envirorment
Health and soc ia l welfare
Educat i on
Basic r u l es f o r broadcasting
S c i e n t i f i c & tech. research
Rates of Value Added Tax
Foreign p o l i c y towards non-EC countr ies
Pa r t i c i pa t i on o f workers' reps. on company boards
I ndus t r i a l p o l i c y
Cu l tu ra l po l i c y
Imnigrat ion po l i c y
Rules f o r p o t i t i c a l asylun
Health and sa fe ty o f workers
Deal ing u i t h unenployment
F ight against drugs
- B
NA E l
42 5:
32 61
33 5t
20 65
70 25
69 25
50 4i
19 75
32 55
-
18 70
55 29
41 51
60 32
37 55
36 54
59 35
49 47
24 73
DK
NA EC
61 37
43 57
46 4e
25 7C
88 11
75 24
77 15
24 73
52 43
-
37 57
78 12
55 39
80 17
58 38
58 39
76 22
54 43
27 71
~ -~
D '1 r-----
NA EC, NA EC , NA EC
43 5 3 ; 42 54' 41 56
24 73i 25 73 ; 27 71
54 41' 54 4 2 ; 52 43
19 74' 19 7 4 i 20 73
62 341 63 3 3 ; 70 27
63 34 ' 65 3 2 ; 72 24
45 4 9 ; 46 48; 50 44
30 64; 29 6 5 ; 25 69
43 50 ' 43 49' 43 48
----- EAST I 1 WEST
I I
I I
I I I
I I
I
I I I
I I
I I
I I
I I
I I
I I I l
27 681 27 671 27 66
i I
i I
55 35 56 341 61 29
51 4 3 , 49 451 43 51
53 4 2 ; 53 4 2 ; 55 41
I I
I I
I I
37 5 8 ; 38 5 8 ; 38 57
ì l
I I
37 59' 37 58; 40 56
59 37: 61 35 j 69 27
51 461 51 4 6 , 52 45
25 74 i 24 74 1 22 76
I I
I
- GR
NA El
67 2(
38 5t
41 41
33 51
52 4!
55 4c
52 37
24 6t
57 3c
43 47
48 34
40 49
61 29
43 45
45 46
51 43
41 53
29 68
E
NA E(
55 3t
32 55
37 45
18 7c
65 26
-
64 28
52 33
20 68
41 47
18 66
56 24
46 41
55 33
32 59
35 56
60 31
55 37
40 53 =
F
NA El
56 41
29 61
35 5!
16 77
74 2:
66 3c
49 45
17 75
27 64
-
26 68
61 29
38 56
62 34
42 53
40 53
62 34
48 50
21 76 -

A54
Table 41 (continued) / Tableau 41 ( su i te )
i
l è r e colonne: X National Ze colonne: X EC
Sécuri t é e t défense
Pro tec t ion de l'environnement
Monna i e
Coopération avec Les P.V.D.
Sant6 e t s é c u r i t é soc ia le
Enseignement
Regles de base radio/TV/presse
Recherche s c i e n t i f i q u e e t technologique
Taux de TVA
P o l i t i q u e étrangère à L'égard des pays non-CE
P a r t i c i p a t i o n des repr. des t r a v a i l l e u r s à l a d i r e c t i o n des entrepr ises
P o l i t i q u e i n d u s t r i e l l e
Pol i t ique c u l tu re1 Le
Pol i t ique d' imnigrat ion
Règles en mat ière d 'asy le =ol i t ique
Santé 8 s é c u r i t é des t r a v a i l l e u r s
La l u t t e contre l e chômage
La l u t t e contre l a drogue
- IRL
NA EC
71 21
43 51
36 54
18 74
66 30
69 26
-
52 37
16 74
42 46
27 62
40 39
37 53
64 28
48 46
41 47
49 47
48 47
37 59
I
NA EC
45 45
32 63
22 7c
12 7s
53 4c
47 40
-
43 44
15 76
32 53
14 74
47 35
35 55
44 47
22 65
20 65
40 54
37 57
26 68
=
- L
NA EC
30 61
29 65
28 63
16 74
68 28
58 36
-
36 52
13 79
53 41
16 75
55 31
39 45
57 32
51 4C
45 40
66 28
52 43
31 62 -
- - NL
NA E[
24 I!
16 82
40 52
16 75
62 37
64 3i
-
54 42
16 fs
27 61
17 7i
54 34
33 6[
61 31
37 55
35 62
50 48
50 48
21 77
P
NA EC
54 36
34 56
41 42
21 63
52 39
59 33
-
52 32
21 67
51 31
27 56
61 25
46 42
55 34
36 49
38 45
57 34
41 52
28 65 -
UK
NA E[
63 3d
33 64
70 25
21 7i
69 2E
7a 2c
63 3C
28 6t
63 25
31 62
49 34
59 34
58 35
60 34
54 4c
53 44
63 32
31 65 -
EC 12
NA EC
51 44
30 66
44 49
18 74
64 31
64 32
51 40
22 71
41 49
24 67
54 32
45 47
55 37
40 54
38 54
55 40
50 46
28 69
EC12+
NA EC
51 44
30 66
44 45
18 74
64 31
64 32
51 40
22 71
42 40
24 67
54 32
45 47
55 38
40 54
38 54
55 40
50 46
27 69
' (*) The d i f fe rence between 11+11 and en t re l a somne des 11+11 e t des ll-@( e t 100 représente Le pourcentage des Ilne s a i t pasIl (pés indiqué)
and 100 i s the percentage of "don't know" (not shown) / La d i f fé rence
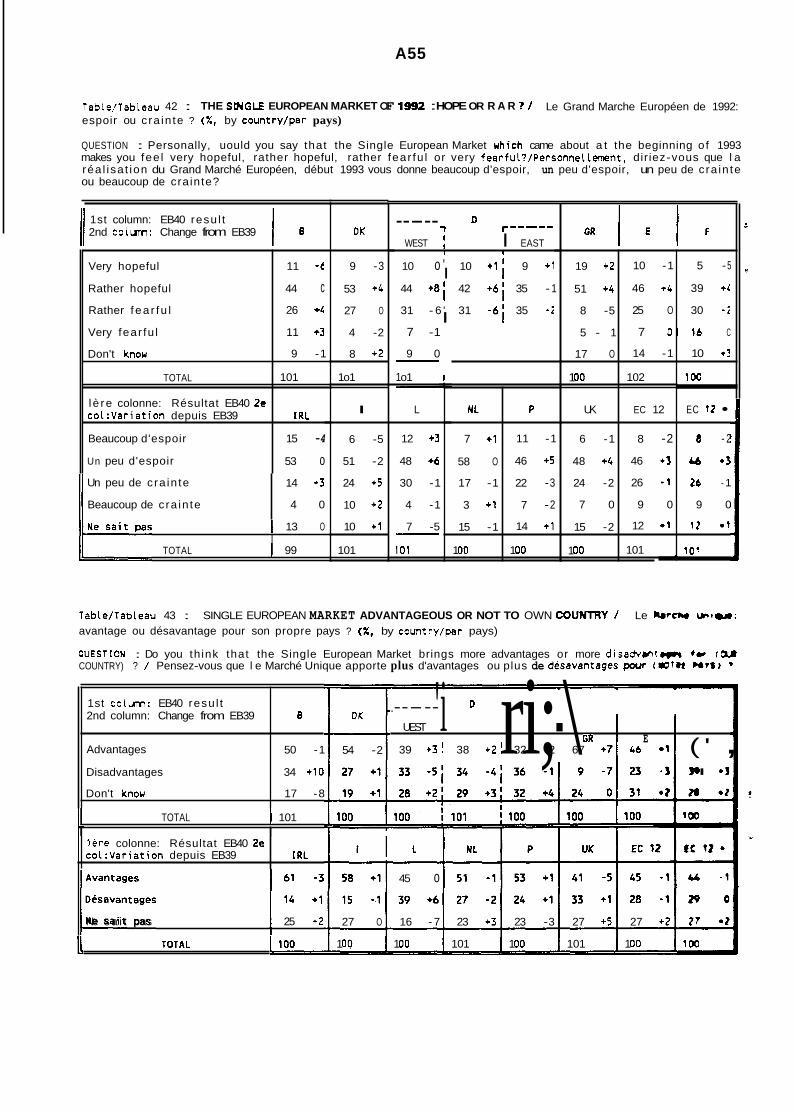
A55
Very hopeful
Rather hopeful
Rather f ea r fu l
Very fear fu l
Don't knou
TOTAL
l è re colonne: Résultat EB40 Ze co1:Variation depuis EB39
Beaucoup d'espoir
Un peu d'espoir
Table/Tableau 42 : espoir ou c ra in te ? ( X , by country/par pays)
THE SWGLE EUROPEAN MARKET OF 1992 : HOPE OR R A R 1 / Le Grand Marche Européen de 1992:
11 - c 44 c 26 +4
11 +3
9 -1
101
IRL
15 -4
53 o
QUESTION : Personally, uould you say that the Single European Market uhich came about a t the beginning o f 1993 makes you fee l very hopeful, rather hopeful, rather fear fu l or very fearful?/Personnellement, dir iez-vous que l a réa l isa t ion du Grand Marché Européen, début 1993 vous donne beaucoup d'espoir, un peu d'espoir, un peu de c ra in te
19 +2
51 +4
8 -5
5 - 1
17 O
1 O0
UK
6 -1
48 +4
24 -2
15 -2
1 O0
ou beaucoup de crainte?
10 -1 5 - 5
46 +4 39 +C
25 O 30 -i
7 O 1 6 C
14 -1 10 *J
102 100
EC 12 EC 12
8 -2 8 - 2
46 *3 U -J
26 - 1 26 - 1
7 0 9 0 9 0
12 01 12 * l
101 ?O? L
1st column: EB40 resu l t 2nd colum: Change from EB39 Il
NL
7 +1
58 O
17 -1
3 +1
15 -1
1 O0
P
11 -1
46 +5
22 -3
7 -2
14 +1
1 O0
Un peu de c ra in te
Beaucoup de c ra in te
1st colum: EB40 resu l t 2nd column: Change from EB39
Advantages
Disadvantages
Don't knou
14 +3
4 0
B
50 -1
34 +10
17 -8
I 13 O I
l è r e colonne: Résultat EB40 Ze co1:Variation depuis EB39
TOTAL I 99
IRL
DK
9 -3
53 +4
27 O
4 -2
8 +2
1 o1
I
6 -5
51 -2
24 +5
10 +2
10 +1
101
D 1 r----- -----
WEST I I EAST I I
10 o ' 10 +1; 9 +1 I 44 +8i 42 + 6 i 35 - 1
31 - 6 ' 31 -6; 35 -i I 7 -1
9 0 - 1 o1 -
L
12 +3
48 +6
30 -1
4 -1
7 -5 - 101
G R l E I F
Table/Tableau 43 : SINGLE EUROPEAN MARKET ADVANTAGEOUS OR NOT TO OWN COUNTRY / Le Mrcm w ~ u : avantage ou désavantage pour son propre pays ? ( X I by country/par pays)
9UESTION : Do you th ink that the Single European Market brings more advantages or more disadvantaam (Q. COUNTRY) ? / Pensez-vous que l e Marché Unique apporte plus d'avantages ou plus de desavantages parr ( W W -?Sl *
t TOTAL I 101 I
Avantages
/1_1.1.nages 1 c Ne s a i t pas 25 +2
DK
54 -2
.----- ri;-\ GR 1 E 1 (I
' , 39 +3' 38 +2' 32 -2 67 +I 46
UEST 'i
I I ' 45 o
27 O 16 -7 23 +3 23 -3 27 +5 27 +2 27 -2
1 O0 1 O0 101 1 O0 101 1 O0 loo

A56
Table/Tableau 44 : SNGEMARKETBORDER CONTROL/ Contrôles aux f ron t ie res a l ' i n t a r i eu r du Marché Unique ( X , by'country on ly f o r Belgiun, Germany, France, Netherlands/ par pays uniquement l a Bel,gique, L'Allemagne, l a France, les Pays-Bas)
QUESTION : Since the completion of the Single European Market a t the beginning o f 1993, people crossing in te rna l EC borders, t ha t i s borders between Member States, are not checked as much as before. In the future, these con t ro ls are t o disappear completely. Which of the fo l lowing two opinions comes closest t o your own ? / Depuis La mise en place du Marché Unique au debut de 1993, il y a moins de contröles aux f ron t ie res internes de l a CamnunautC Européenne, c 'est a d i r e aux f ron t ie res entre Etats Membres. Dans l e futur, ces contrôles devraient complètement d isparaî t re. A ce propos, que l le est parmi ces deux opinions c e l l e qui correspond l e mieux a l a vô t re ?
- Most o f a l l , I am happy tha t people can t r ave l without r es t r i c t i ons throughout the European Comnunity / Avant tout, j e me ré j ou i s que les gens puissent voyager sans obstacle à t ravers L'Europe (HAPPY TO TRAVEL WITHOUT
.
~ - RESTRICTIONS)
- Most o f a l l , I am worried tha t crime rates w i l l r i s e i n (OUR COUNTRY) because border con t ro ls have been removed / Avant tout, j e su is inquiet que l a d i spa r i t i on en (NOTRE PAYS) des contrôles aux f ron t iè res internes n'augmente l a c r im ina l i t e (FEAR MORE CRIME)
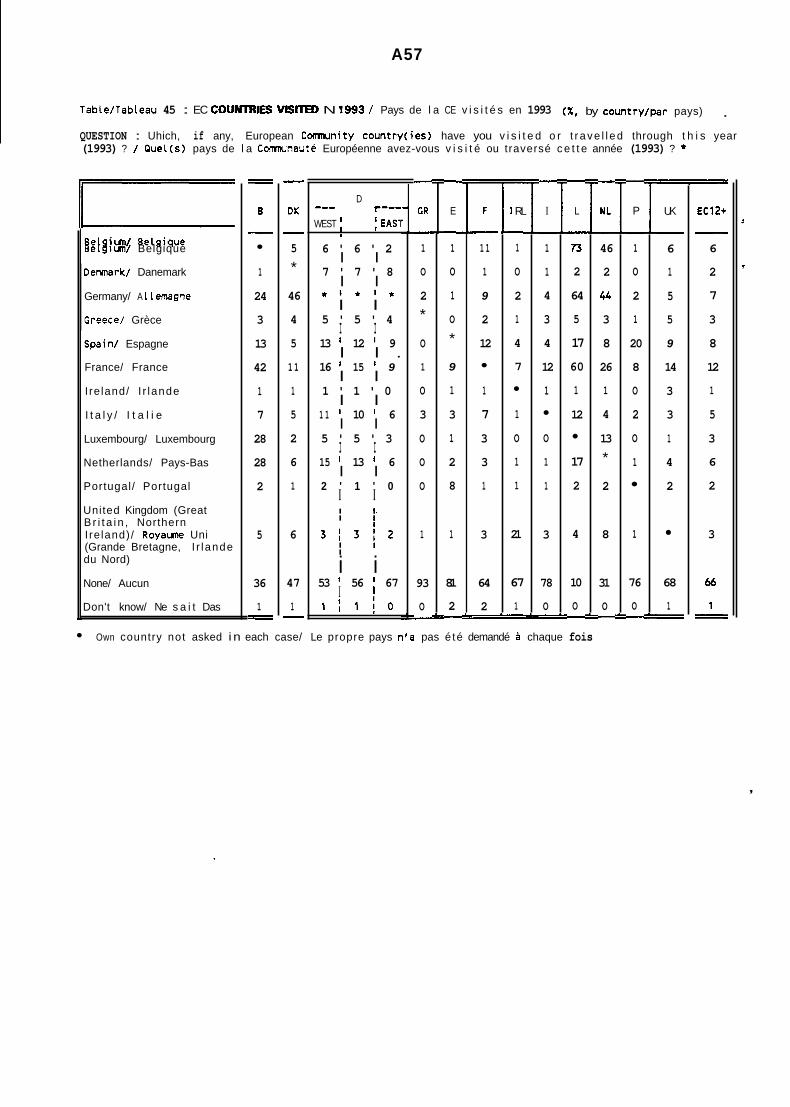
A57
Table/Tableau 45 : EC COUNTRIES VlSmD N 1993 / Pays de l a CE v i s i t é s en 1993
QUESTION : Uhich, if any, European C m n i t y country( ies1 have you v i s i t e d o r t r ave l l ed through t h i s year (1993) ? / QuelCs) pays de l a Comnunauté Européenne avez-vous v i s i t é ou traversé c e t t e année (1993) ? *
( X , by country/par pays) .
/I 7 Belgiun/ Belgique
Oermark/ Danemark
Germany/ A 1 1 emagne
Greece/ Grèce
Ispain/ Espagne
France/ France
I re land/ I r lande
I t a l y / I t a l i e
Luxembourg/ Luxembourg
Netherlands/ Pays-Bas
Portugal/ Portugal
United Kingdom (Great B r i t a i n , Northern I re land) / Royaune Uni (Grande Bretagne, I r lande du Nord)
None/ Aucun
Don't know/ Ne s a i t Das
I
- - B - 1
24
3
13
42
1
7
28
28
2
5
36
1 - -
- - DK
- 5
*
46
4
5
11
1
5
2
6
1
6
47
1 - -
D r---
WEST EAS1
--- I
6 ' 6 ' 2
7 ' 7 ' 8
* I * ' *
I I
I I I I
5 ' 5 ' 4 I I 13 ' 12 ' 9
I I . 16 ' 15 ' 9
I I 1 ' 1 ' 0
I I
I I 5 ' 5 ' 3 I I
I I 2 ' 1 ' 0 I I
I (. 3 1 3 1 2
1 1 ' 10 ' 6
15 ' 13 ' 6
I
1
I l I
i i 1 l r j o
53 ' 56 I 67 I
- - GR
- 1
O
2
*
O
1
O
3
O
O
O
1
93
O -
- - E
- 1
O
1
O
*
9
1
3
1
2
8
1
81
2 - -
F
- 1 1
1
9
2
12
1
7
3
3
1
3
64
2 -
1 RL
- 1
O
2
1
4
7
1
O
1
1
21
67
1 -
- - I
- 1
1
4
3
4
12
1
O
1
1
3
78
O -
- - L
- 73
2
64
5
17
60
1
12
17
2
4
10
O - -
- - NL
- 46
2
44
3
8
26
1
4
13
*
2
8
31
O - -
- - P
- 1
O
2
1
20
8
O
2
O
1
1
76
O - -
UK
- 6
1
5
5
9
14
3
3
1
4
2
68
1 - -
EC12+ - 6
2
7
3
8
12
1
5
3
6
2
3
Own country not asked i n each case/ Le propre pays n'a pas é té demandé à chaque fois
,

A50
,
Table/Tableau 46 : ECBORDWCHECKS ORNOT?/ Contröles effectués aux f ron t i i r es de l a CE ( X , by country/par pays, only those uho travelLed/uniquement ceux qui ont voyag6)
QUESTION : Uere you checked, by ei ther the pol ice or the customs, uhen crossing the border i n t o any o f these countries ? ( I F YES) Uhich ones ?/ A l 'entree de quel(s) pays avez-vous été contrölé B l a f ron t ie re par l a pol ice ou l a douane ?
3e 1 g i un/ Belg i que
)ermark/ Danemark
Germany/ Allemagne
:reece/ Grece
Spain/ Espagne
France/ France
Ireland/ Ir iande
I t a l y / I t a l i e
Luxembourg/ Luxembourg
rhe Netherlands/ Pays-Bas
Dor tuga l/ Portugal
Jnited Kingdom (Great 3r i ta in, Northern Ireland)/ Royaune Uni (Grande Bretagne, Ir lande j u Nord)
Uot checked/ N'a pas été :ont r o 1 é
Ion't know/ Ne s a i t pas
4
1
4
2
4
5
O
2
1
2
1
4
76
5 - -
- - DK -
1
8
19
3
4
4
O
3
O
1
1
6
59
7 - -
lEST { EAST I
1 ' 1 I
5 ' 7 I
4 ; 6
6 ' 5 I
10 ' 7 I
6 6 ' 5 I I
1 ' 1 ' 0 I l
7 ' 6 ' 3 I I
1 ' 1 ' 1 I I
3 ' 2 ' 1 I I
1 ' 1 ' 1 I I I I
I I
3 1 3 1 3 I I I I
i i 63 ! 64 ! 69
i i -2 ' 2 j 2 I
- GR
- 5
O
12
8
O
2
O
7
1
O
O
5
62
2 - -
- E -
1
1
2
1
7
14
' 1
5
O
2
9
5
67
3 - -
=
F
- 3
1
6
3
7
4
1
6
1
2
1
5
68
O - -
- - I RL
- 1
1
3
1
4
5
2
1
O
O
O
23
64
2 - -
- - I
- O
1
6
5
8
23
O
5
O
1
1
9
52
3 - -
- L - 4
1
3
1
4
4
1
2
1
2
1
2
81
3 - -
æ
NL
- 2
1
5
3
4
4
O
2
O
1
1
7
74
3 - -
- P
- 1
O
3
1
18
11
O
2
O
1
1
2
72
O - -
4
1
3
5
7
11
2
4
1
3
2
10
59
2 - -
- - EC12+ -
2
2
5
4
8
9
1
5
1
2
2
6
64
2 - -
Table/Tableau 47 : CANcrmeYS MOVEANDS€ITLE~EELYWITHHECTODAY? / Ces citoyens peuvent- i ls aujourd'hui c i rcu ler e t s 'é tab l i r librement dans l a CE ? ( X , by country/par pays)
PUESTION : Do you th ink that today any c i t i zen of any menber state of the European Comnunity has the r i g h t t o move and s e t t l e f ree ly anyuhere w i th in the Comrunity 7 / Pensez-vous que Les citoyens de tous les pays " b r e s de l a Comnunauté Européenne peuvent aujourd'hui c i rcu ler e t s 'établ i r librement partout dans l a Conmunauté ?
This question uas not asked i n East Germany/ Cette question n'a pas até posee en Allemagne de L'Est
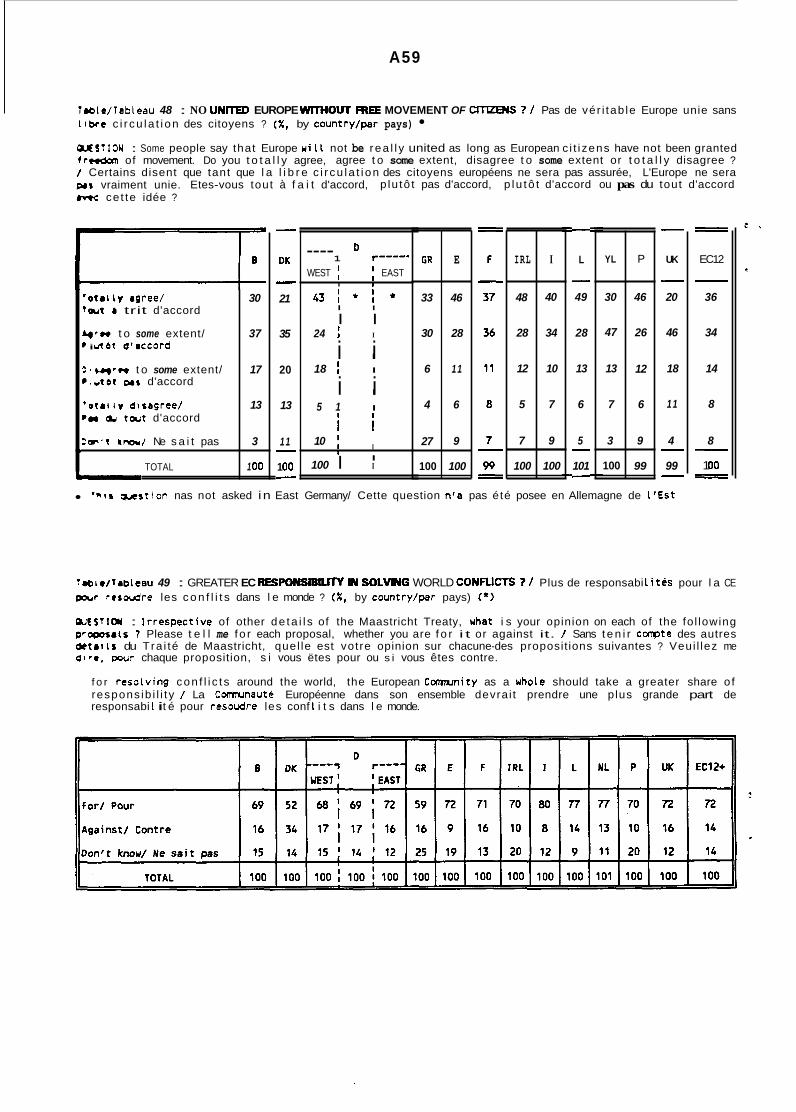
A59
GR
33
30
6
27
100
T&le/Tableau 48 : NO UNITED EUROPE M O U T AlEE MOVEMENT OF Crmws 1 / Pas de vér i tab le Europe unie sans Libre c i r cu la t i on des citoyens ? ( X , by country/par pays)
W E S T I O N : Some people say that Europe n i l 1 not be rea l l y united as long as European c i t i zens have not been granted f r e d a n of movement. Do you t o t a l l y agree, agree t o some extent, disagree t o some extent or t o t a l l y disagree ? f Certains disent que tant que l a l i b r e c i r cu la t i on des citoyens européens ne sera pas assurée, L'Europe ne sera p.r vraiment unie. Etes-vous tout à f a i t d'accord, p lu tô t pas d'accord, p lu tô t d'accord ou pas du tout d'accord .rw cet te idée ?
E
46
28
1 1
4 6
9
100
IRL
48
28
12
100
- - DK - 21
35
20
13
1 1
1 O0
- - -
I
40
34
10
5 7
7 9
100
D
WEST i EAST 1 r---- ---- I I
4 3 ; ' ; ' I I
YL
30
47
13
100
I I 24 i I
P
46
26
12
7 6
3 9
99
i i I
i i I
18 I
5 1 I
10 ; 100 I I
ì i I I
I
'oiail~ agree/ 30 T o u i b trit d'accord
4.w t o some extent/ 37 @ i d o i e ' u c o r d
:.yrt* t o some extent/ 17 @.uror ms d'accord
' o f a i i v disagree/ 13 p œ 6 imt d'accord
:W*T C m / Ne s a i t pas 3 1
TOTAL 1 O0
- - L
- 49
28
13
6
5
101
- - -
- - UK
- 20
46
18
11
4
99
- - -
- - EC12
- 36
34
14
8
8
1 O0
- =
* * I S o r s t i o n nas not asked in East Germany/ Cette question n'a pas été posee en Allemagne de L'Est
~mbtofTab1cau 49 : GREATER EC RESPONSlBUrrY H SOLVNG WORLD CONFLICTS I / Plus de responsabi l i t e s pour l a CE mr resad re les c o n f l i t s dans l e monde ? ( X , by country/par pays) (*)
& E S T I O U : lrrespect ive of other de ta i l s of the Maastricht Treaty, uhat i s your opinion on each of the fo l lowing ~romraLs 7 Please t e l l me f o r each proposal, whether you are f o r i t or against it. / Sans t e n i r conpte des autres 0 ) ta iLs du Tra i té de Maastricht, quel le est votre opinion sur chacune-des proposit ions suivantes ? Veui l lez me arro, pour chaque proposition, s i vous ëtes pour ou s i vous êtes contre.
f o r resolv ing con f l i c t s around the world, the European Comrrrnity as a nhole should take a greater share o f respons ib i l i t y / La Comnunauté Européenne dans son ensemble devrai t prendre une plus grande part de responsabi 1 i t é pour resoudre les conf 1 i t s dans l e monde.

A60
Table/Tableau 50 : MOST IMPORTANT PROBLBYI FACHO THE EC / Le probt+ l e plus important pour la CE ( X , by country/par pays)
PUESTION : In your opinion, uhich of the fo l louing problems current ly facing the European Comnunity is the m s t important ? / Parmi ceux que j e vais vous c i te r , quels est selon vous, l e problème l e plus important auquel La Comnunauté Européenne do i t f a i r e face a l'heure actuelle ?
- - GR
- 33
7
41
9
10
I O0
- - -
- - L - 10
9
65
13
3
1 O0
- -
- - EC12+ - 9
10
67
10
4
1 O0
- -
I D B I UK -
10
11
67
11
1
1 O0
- =
1 1 11 I I
1 1 I 16 1 I
13 1 12
i
In f la t ion , hausse des p r i x 10 In f la t ion , r i s i n g prices/ I II 9
13
5
6
80
6
'2
99
- -
I n s t a b i l i t y European curr./ I n s t a b i l i t é monnaies europ6ennes II 8
71
10
5
1 O0
-
51 i 53 i 57. 16 i 15 I 10
1 0 : 9 ! 6 I
I
99 : 101 I 101
Nationalism/Nationalisme
Donft knou/ Ne s a i t pas
Table/Tableau 51 : W O R CAUSE OF EC UNEMPLOYMENT / La pr incipale cause du chômage dans l a CE ( X , by country/par pays)
QUESTION : In your opinion, uhich of the fol lowing i s the major cause of unemployment in the European Conmunity ? / Parmi ce l les que j e vais vous c i te r , quelle est, selon vous, l a pr incipale cause du chûnage dans l e Comnunauté . . Européenne ?
- - GR
- 55
1
23
6
1
2
12
1 O0
- - -
- - DK
- 30
15
15
18
2
5
15
1 O0
- - -
- - E
- 23
7
52
9
1
1
8
101 - - -
- - F
- 40
4
18
19
5
2
13
- - I RL
- 32
7
42
1 1
2
1
5
1 O0
- - -
- - I
- 21
8
54
8
1
1
7
1 O0
- - -
- - L
- 33
9
19
16
5
5
12
99
- - -
- - NL
- 39
19
18
1 1
4
3
6
1 O0
- - -
- - P - 29
7
37
10
6
3
8
1 OD
- - -
=
EC12+ - 34
9
34
10
3
2
8
1 O0
- - -
D
VEST : I EAST 1 r---- ---- I I
I I
UK - 46
7
29
8
2
3
5
Poor economic situation, recessiod La récession
Excessively high uages/ Les sala i res t rop élevés
Inadequate po l ic ies of governments/ Mauvaise pol gouvernement
Lack of so l i da r i t y EC countries/ Manque so l i da r i t é pays CE
The European Single Market/ Le Marché Unique européen
The European Connunity/ L Comnunaute Européenne
Don't know/ Ne s a i t pas
TOTAL
I I 34 I 36 I 42
I ' I I I
15 I 13 I 5 I I I I I I
I I 31 1 32 i 35
I I 5 1 5 1 5
I I
I I I I I I I I
3 1 3 1 4
i i 1 1 1 1 2
i i l 0 ! 9 ! 7
99 I 99 I 100 I - 101 - - 1 O0 - -
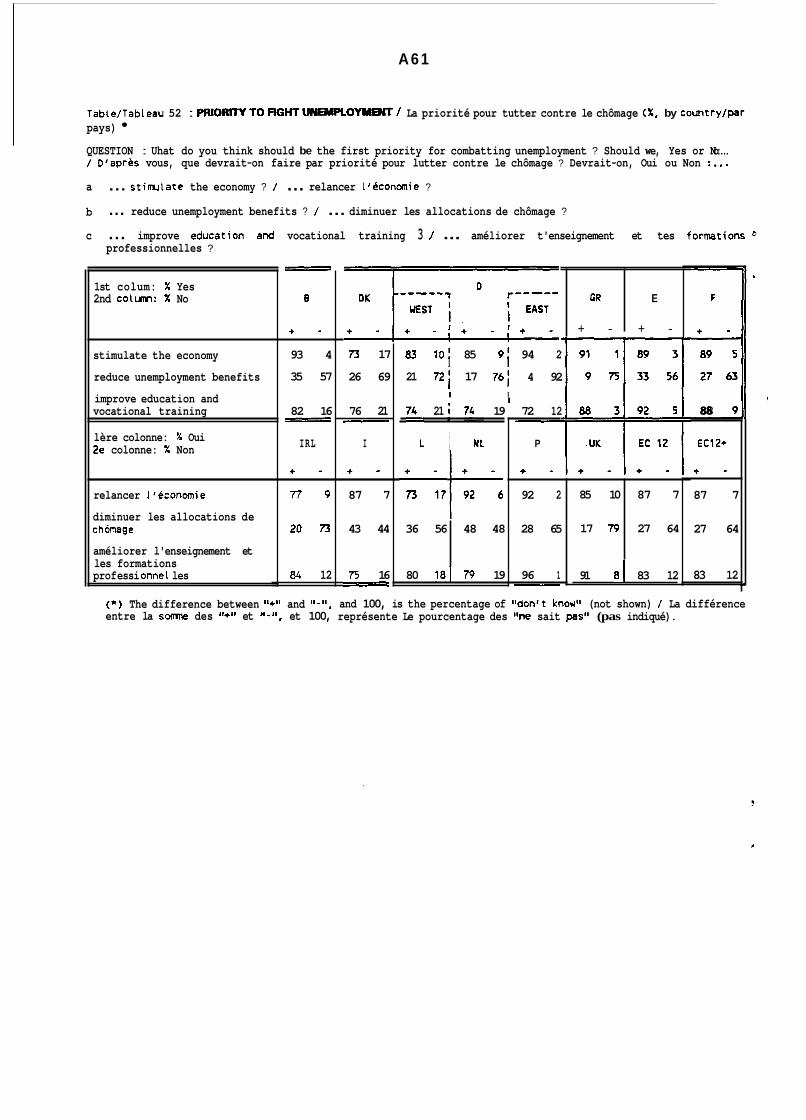
A61
27 63
7' 88
EC12+
+ -
87 7
27 64
83 12 L
Table/Tableau 52 : PRlORrrVTOflGHTU"PLOYMeYT/ La priorité pour tutter contre le chômage ( X , by country/par pays)
!
QUESTION : Uhat do you think should be the first priority for combatting unemployment ? Should we, Yes or No:... / D'après vous, que devrait-on faire par priorité pour lutter contre le chômage ? Devrait-on, Oui ou Non :... a ... stimrlate the economy ? / ... relancer l'économie ?
b
c ... improve education and vocational training 3 / ... améliorer t'enseignement et tes formations t
... reduce unemployment benefits ? / ... diminuer les allocations de chômage ?
GR
+ - + -
professionnelles ?
1st colum: X Yes 2nd colunn: X No E
stimulate the economy
reduce unemployment benefits
improve education and vocational training
lère colonne: X Oui Ze colonne: X Non
85 10
17 79
relancer L'économie
diminuer les allocations de chómage
améliorer l'enseignement et les formations prof essi onnel les
87 7
27 64
B
+ -
36 56
93 4
35 57
82 16 - IRL
+ -
48 48
7 7 9
20 73
84 12
DK
+ -
73 17
26 69
76 21 - I
+ -
87 7
43 44
7'5 16 -
83 10' 85 91 94 2
21 72 ; 17 76; 4 92 I
I I I
74L 21 7:, 19
80 181 79 19
72 12 - P
+ - ~
92 2
28 65
96 1 - 91 81 83 12
(*) The difference between 11+11 and and 100, is the percentage of "don't know" (not shown) / La différence entre la somne des J1+J1 et ll-J1, et 100, représente Le pourcentage des Ilne sait pas" (pas indiqué).

A62
I E F
+ - + -
29 36 22 41
11 38 5 49
4 74 3 67
.
Table/Tableau 53 : PRlORITYTOROHTUNEMPLOYMBYT/ La p r i o r i t é pour l u t t e r contre l e chômage ( X , by country/par pays)
QUESTION : Uhat do you th ink should be the f i r s t p r i o r i t y f o r combatting unenployment ? Should we, Yes o r No:... / D'après vous, que devra i t -on f a i r e par p r i o r i t é pour l u t t e r contre l e chômage ? Devrait-on, O u i ou Non :... d- 1 ... reduce the f r ee movement o f workers between the countr ies o f the European C m n i t y ? / ... diminuer
l a l i b r e c i r c u l a t i o n des t r ava i l l eu r s au se in des Pays de l a C m n a u t é Européenne ?
I F NO OR DON'T KNOW TO D - 1 ... increase the f ree movement of workers betueen the countr ies o f the European Community ? / SI NON W NE S A I T PAS A D-1 ... augmenter l a l i b r e c i r cu l a t i on des t r ava i l l eu r s au se in des Pays de l a C o " a u t é Européenne ?
... reduce weekly working hours ? / ... diminuer l e nombre d'heures de t r a v a i l par semaine ?
I F NO OR DON'T KNOW TO E - 1 ... increase weekly working hours ? / SI NON UJ NE S A I T PAS A E - 1 ... augmenter l e nombre d'heures de t r a v a i l par semaine ?
, d-2
* e-1
e-2
f -1 ... reduce taxes ? / ... diminuer les inpôts ?
f -2
9'1
I F NO OR DON'T KNOW TO F - 1 ... increase taxes ? / SI N0N.W NE S A I T PAS A F - 1 ... augmenter les i-ts ?
... reduce cooperation between the g o v e r m n t s of the countr ies o f the European Comnunity ? / ... diminuer l a coopération entre les gouvernements des Pays de l a Comnunauté Européenne ?
9-2 I F NO OR DON'T KNOW TO G-1 ... increase cooperation between the g o v e r m n t s o f the countr ies o f the European Comnunity ? / S I NON OU NE S A I T PAS A G - 1 ... augmenter l a cooperation entre les gouvernements des Pays de l a Comnunauté Européenne ?
1st co lum: X saying increase (d2, c2, f2, 92)
2nd colum: X saying reduce (d l , c l , fl, g l )
f ree movement of workers i n EC
weekly working hours
taxes
cooperation between EC g o v e r m n t s
l e r e colonne: X disant augmenter (d2, c2, f2, 92)
2e colonne: X disant diminuer (dl, c l , fl, g l )
l i b r e c i r c u l a t i o n des t r ava i l l eu r s au se in de l a CE
l e nombre d'heures de t r a v a i l par semaine
les impôts
coopération entre l es gouvernements de l a CE
B
+ - I
28 49
10 41
2 76
58 26
IRL
+ -
47 26
9 45
2 8 6
70 17
OK
+ -
28 39
13 40
4 65
52 23
I
+ -
42 37
13 40
1 8 3
65 13
D 1 r----- ------
I EAST I WEST I I + - i + - i + - - 52 22; 48 24' 33 30
30 17' 25 21' 9 36
5 66; 4 6 5 ; 2 54
I I I
I I
59 161 58 14 - L
+ -
27 37
13 24
4 52
71 9
NL
+ -
43 34
20 33
3 70
75 14
GR
+ -
25 41
8 36
1 71
52 101 58 151 53 181 54 21
I
(*I The d i f fe rence between and and 100, i s the percentage o f THOSE NOT AGREEING TO EITHER STATEMENT as wel l as those saying "don't know" (not shown) / La d i f férence entre l a somne des 11+1) e t e t 100, représente l e pourcentage de ceux qui ne sont d'accord avec aucune proposi t ion e t ceux qui d isent "ne s a i t pas" (pas indiqué).
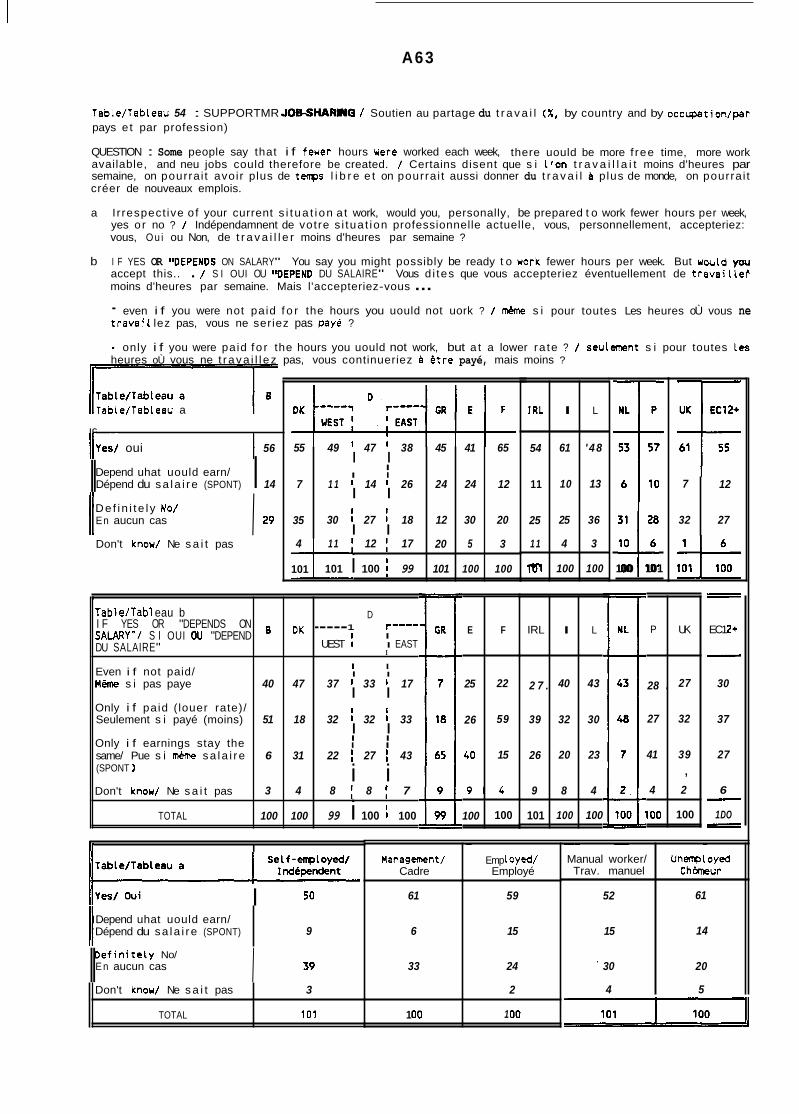
A63
I R 1
54
11
25
1 1
lul
Table/Tableau 54 : SUPPORTMR JOMHARNG / Soutien au partage du t r a v a i l ( X , by country and by occupation/par pays e t par profession)
QUESTION : Some people say that i f fewer hours nere worked each week, there uould be more f ree time, more work available, and neu jobs could therefore be created. / Certains disent que s i l ' on t r a v a i l l a i t moins d'heures par semaine, on pourrai t avoir plus de tenps l i b r e e t on pourrai t aussi donner du t r a v a i l B plus de monde, on pourrai t créer de nouveaux emplois.
a I r respect ive o f your current s i t ua t i on a t work, would you, personally, be prepared t o work fewer hours per week, yes or no ? / Indépendamnent de votre s i tua t ion professionnelle actuelle, vous, personnellement, accepteriez: vous, O u i ou Non, de t r a v a i l l e r moins d'heures par semaine ?
I F YES OR llDEPENDS ON SALARY" You say you might possibly be ready t o work fewer hours per week. But uwld you accept this.. . / S I OUI OU I@OEPEND DU SALAIRE" Vous d i tes que vous accepteriez éventuellement de t rava i l l ee moins d'heures par semaine. Mais l'accepteriez-vous ... - even i f you were not paid f o r the hours you uould not uork ? / mhe s i pour toutes Les heures oÙ vous ne t rava i L lez pas, vous ne seriez pas paye ?
- only i f you were paid f o r the hours you uould not work, but a t a lower ra te ? / seulement s i pour toutes les heures oÙ vous ne t rava i l l ez pas, vous continueriez B êt re payé, mais moins ?
b
I L
61 ' 4 8
10 13
25 36
4 3
100 100
- Table/Tableau a
7
35
IC
I I
I I
I I
I I I
1 1 I 14 1 26 24 24 12
30 I 27 18 12 30 20
I l i s / oui 55 49 I 47 38
4 1 1 12 : 17
101 101 i 100 i 99
I 56 45 41 65
20 5 3
101 100 100
Dépend du sa la i re (SPONT) I 14 Depend uhat uould earn/ II 7
32 Def in i t e l y No/ En aucun cas II
12
27 I 29
25
26
40
100
Don't know/ Ne s a i t pas
E F
22
59
15
9 4
100
IRL
2 7 .
39
26
101
I L
40 43
32 30
20 23
9 8 4
100 100
Il I
P
28 .
27
41
100
50 I
UK
27
32
39 ,
4 2
100
Depend uhat uould earn/ Dépend du sa la i re (SPONT) II
I
Table/Tabl eau b I F YES OR "DEPENDS ON
DU SALAIRE" SALARY"/ S I OUI otl "DEPEND
Even i f not paid/ Même s i pas paye
Only i f paid ( louer rate)/ Seulement s i payé (moins)
same/ Pue s i mhe sa la i re (SPONT 1
Don't knou/ Ne s a i t pas
Only i f earnings stay the
TOTAL
9
D 1 r--- DK -----
UEST I EAST
I I
I
I
I I
40 47 37 I 33 I 17
51 18 32 I 32 I 33
6 31 22 I 27 I 43
3 4 8 : 8 7
I I
I I I I I I
i i 99 i 100 I 100 100 100
Def in i t e l y No/ E n aucun cas II
~~ ~
Manual worker/ Trav. manuel
52
15
' 30
4 I 39
~
Unenployed Chômeur
61
14
20
5 Don't knou/ Ne s a i t pas
TOTAL
Management/ Cadre
3
101
61
6
33
1 O0
-
Emp 1 eyed/ Employé
59
15
24
2
1 O0
-r
::i: 100 101
f - - EC1 2+
- 30
37
27
6
1 DO
- -
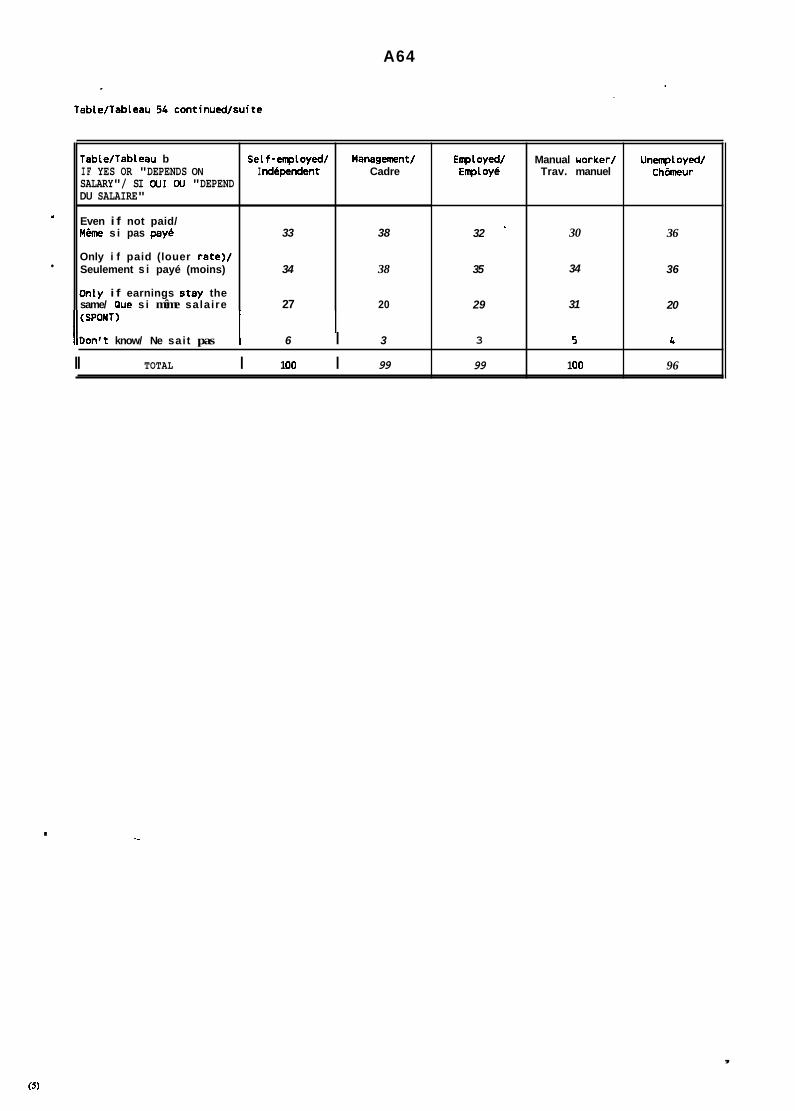
A64
*
Table/Tableau b Self-enployed/ Hanagement/ I F YES OR "DEPENDS ON I dépendent Cadre SALARY"/ SI WI W "DEPEND DU SALAIRE"
Even i f not paid/ Même s i pas paye 33 38
Only i f paid (louer rate)/ Seulement s i payé (moins) 34 38
only i f earnings stay the same/ Pue s i même salaire 27 20 SPONT)
IlDontt know/ Ne sait pas I 6 I 3
II TOTAL I 1 O0 I 99
Enployed/ Enp 1 oye
32 *
35
29
3
99
Manual uorker/ Trav. manuel
30
34
31
5
1 O0
U n q 1 oyed/ Chinneur
36
36
20
L
96
.
,

A65
Table/Tableau 55 : FlXED OR R W B L E WORKlG TlMEPReERED? / Préférence pour des hora i res f i x e s ou f l e x i b l e s ? (X, by country and by occupation/par pays e t par profession)
QUESTION : Some people p re fe r f i x e d uorking hours; they p re fe r t o s t a r t and f i n i s h t h e i r work a t the same times each day. On the other hand, others p re fe r ' f l e x i b l e ' working time; they p re fe r t o knou tha t they have a ce r t a i n nunber o f hours t o work each week but tha t they can spread them over the week more o r less as they choose; where possib le they l i k e t o be able t o choose each day the uorking time tha t w i t s them best. I r respec t i ve of your current s i t u a t i o n a t work, uhat would you, personally, p re fe r :.../ Certaines personnes préfèrent avo i r des hora i res f ixes: e l l e s préfèrent comnencer e t terminer leur t r a v a i l aux " e s heures tous l es jours. D'autres personnes, au contra i re, préfèrent avo i r des hora i res souples, ' f l ex ib les ' : e l l e s préfèrent savoi r qu 'e l les on t , tan t d'heures de t r a v a i l a f a i r e par semaine, mais qu 'e l les peuvent r é p a r t i r ces heures sur leur semaine un peu' c o m e l l e s l e souhaitent; e l l e s préfèrent donc pouvoir cho i s i r chaque jour, dans cer ta ines l im i tes , l ' ho ra i r e de t r a v a i l qui leu r convient mieux. Indépendamnt de vo t re s i t u a t i o n profess ionnel le actuel le , vous, personnellement, que préférez-vous: ...
II ~~
Fixed uorking hours/ Des hora i res f i x e s
F 1 ex i bl e uork i ng time/ Des hora i res souples
Depends i f a f f e c t s earnings/ Dépend de mon sa l a i r e (SPONT)
Don't knou/ Ne s a i t pas
1 TOTAL
Fixed uorking hours/ Des hora i res f i x e s
F lex ib le uork ing time/ Des hora i res souples
Depends i f a f f ec t s earnings/ Dépend de mon sa l a i r e (SPONT)
Don't knou/ Ne s a i t pas
- - 0
- 42
54
O
3
- DK
- 38
57
1
4
1 O0
- - -
- 34
54
3
D
UEST I EAST 1 r----- CR E F IRL ----
I I ' I
34 I 35 54 54 33 31 I
I
I I
52 I 46 20 40 63 59
I
4 1 7 1 9 3 1 4
9 ! 1 0 : 1 3 8 3 4 5
100 i 100 i 101 101 100 101 99
i
Sel f -employed/ I ndépendent
33
58
Management!
23
75
32
64
99 100 99 I I
I
- 31
60
2
7
1 O0
- 7 -
L NL
41 44
55 54
1
2 2
99 100
P UK EC12+
52 27 36
43 71 56
2 1 2
4 1 5
101 100 99
2 4
3 4 ~~
100 I 100

A66
l rb le /1obleau 56 : L E S S S A l A R Y H ) R C H O O S N G Y O U R O W N ~ E ? / Moins de sa l a i r e a f i n de cho i s i r son propre h o r o ~ r e f l e x i b l e ? ( X , by country and by occupatio/par pays e t par profession)
b I r KULD NOT PREFER FIXED WORKING HOURS : In exchange f o r t h i s ' f l e x i b l e ' working time, which uould a l low you t o choose, w i t h i n ce r t a i n l im i t s , the working time that you prefer each day, would you or would you not accept s l i g h t l y Lower earnings ? / SI NE PREFERE PAS LES HORAIRES FIXES : En échange de ces hora i res ' f l e x i b l es ' , qu i *QU. p e n e t t r a i e n t donc de cho i s i r chaque jour, dans certaines l im i tes , l ' ho ra i re qui vous convient l e mieux, uceoter iez-vous Oui ou Non une légère baisse de votre sa l a i r e ?
I f U u l O NOT PREFER FIXED r l l . C I l t C U R S / II I PREFERE PAS LES I(*Al@fS F I X E S
B
'081 &i 45
~1 rha t would HW M de l a baisse 9 (YCI')
3 + a - * t * l v not/ w , am u m cas 44
:o T r . a l re s a i t pas 1
TOTAL 99
: I a i 3 rol PREFER FIXED Self-employed/ : 8 C M s / I ndépendent
Il U€ W l r E P E PAS LES a A : @ € I F I X E S
ves/ í L 1 46
I - 13
39
> o n a t krum/ Ne s a i t pas I 2
TOTAL I 100
Management! Employed/ Cadre Employé
Manual uorker/ Unemployed/ Chheur Trav. manuel
41 33
13 14
45 51
O 1
32 49
16 16
50 31
2 3
99 I 9 9 I l 0 0 1 99
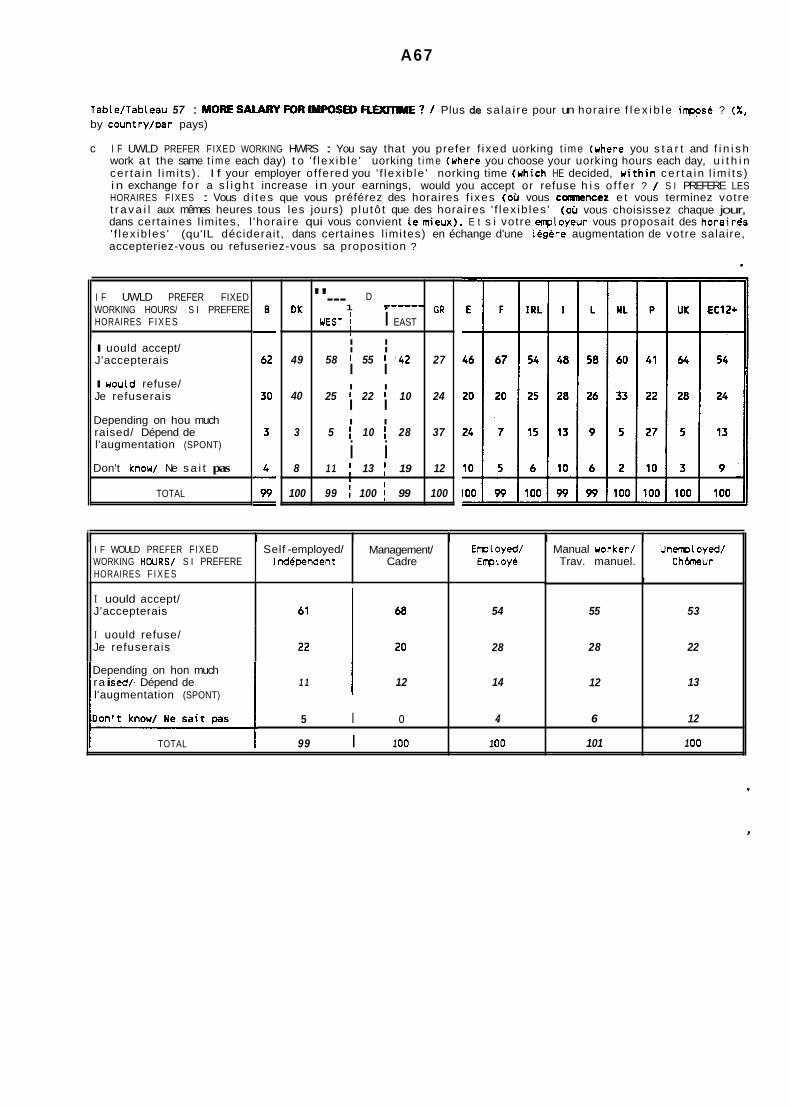
A67
DK
49
40
3
8
100
Table/Tableau 57 : MORESAIARYFORIMPOSED -E? / Plus de sa la i re pour un horaire f l e x i b l e inppse ? ( X , by country/par pays)
c I F UWLD PREFER FIXED WORKING HWRS : You say that you prefer f i xed uorking t ime (uhere you s t a r t and f i n i s h work a t the same t i m e each day) t o ' f lex ib le ' uorking t i m e (where you choose your uorking hours each day, u i t h i n cer ta in l im i ts ) . I f your employer of fered you ' f lex ib le ' norking time (uhich HE decided, w i th in ce r ta in l im i t s ) i n exchange f o r a s l i g h t increase in your earnings, would you accept or refuse h i s o f f e r ? / S I PREFERE LES HORAIRES FIXES : Vous d i t es que vous préférez des horaires f i xes (oÙ vous comnence2 e t vous terminez votre t r a v a i l aux mêmes heures tous les jours) p lu tô t que des horaires ' f lex ib les ' (oÙ vous choisissez chaque jour, dans certaines l imites, l 'horai re qui vous convient lemieux). E t s i votre enployeur vous proposait des horairas ' f lex ib les ' (qu'IL déciderait, dans certaines l imi tes) en échange d'une legare augmentation de votre salaire, accepteriez-vous ou refuseriez-vous sa proposit ion ?
D
UEST i i EAST GR 1 r----- "---
I I I I I
58 I 55 I .42 27 I I
I I I I
25 I 22 I 10 24
I I 5 i 10 I 28 37
1 1 I 13 19 12
100
i i 99 I 100 i 99
I
I F UWLD PREFER FIXED WORKING HOURS/ S I PREFERE HORAIRES F IXES
I uould accept/ J'accepterais
I would refuse/ Je refuserais
Depending on hou much raised/ Dépend de l'augmentation (SPONT)
Don't know/ Ne s a i t pas
TOTAL
I F WOULD PREFER FIXED WORKING HWRS/ S I PREFERE HORAIRES F I X E S
Self -employed/ Management/ Ewl eyed/ Independent Cadre Employé
Ir I I 1 I I Manual worker/
Trav. manuel. Unemployed/
C h h u r
I uould accept/ J'accepterais
I uould refuse/ Je refuserais
Depending on hon much ra i sed/. Dépend de l'augmentation (SPONT)
TOTAL
1 1 I 12
5 I o
99 I 1 O0
54
28
14
4
1 O0
I
55
28
12
6
101
53
22
13
12
1 O0

A68
AS PART OF MY UORK
PUBLIC EMPLOY. PROGRAMME
COLLEGES, UN IVERSIT IES
FREE COURSES
Table/Tableau 58 : VOcATKmAL TRANNG DURNGTHElAST5YEARS/ Formations professionnelles ces c inq dernières années ( X , by country/par pays)
QUESTION : During the las t f i v e years d i d you, yes or no :... ? / Au cours des cinq dernières années, avez-vous, Oui ou Non :... ?
24 75
6 94
19 81
13 87
a) ... f o l l o u one or more vocational t ra in ing courses organised as part of your uork ? / ... su iv i une (ou plusieurs) formation(s) professionnelle(s) organisée(s1 dans l e cadre de votre t rava i l ? (As PART OF MY WORK)
b) ... f o l l o u one or more vocational t ra in ing courses organised as part of a publ ic employment p r o g r a m ? / ... su iv i une (ou plusieurs) formation(s) professionnelle(s) organisée(s) dans l e cadre d'un p r o g r a m publ ic d'emploi ? (PUBLIC EMPLOYMENT PROGRAMME)
- E) ... fo l l ou one or more vocational t ra in ing courses organised by a college or univers i ty ? / ... suiv i une (ou plusieurs) formation(s) professionnelte(s) organisée(s) par une école ou une univers i té ? (COLLEGES. UNIVERSITIES)
d) ... fo l l ou one or more cost f ree vocational t ra in ing courses (evening courses, correspondence courses, ... ) uhich you decided yourself t o undertake ? / ... suiv i une (ou plusieurs) formation(s) professionnelle(s) gratuite(s) (des cours du soir, des cours par correspondance, ...I auxquels vous avez décidé vous-"e de vous i nsc r i r e ? (FREE COURSES)
e) ... f o l l o u one or more vocational t ra in ing courses which you paid f o r and uhich you decided yourself t o undertake ? / ... su iv i une (ou plusieurs) formation(s) professionnelle(s) payante(s1 (des cours du soir, des cours par correspondance, ... ) auxquels vous avez decidé vous-"e de vous i nsc r i r e ? (PAID COURSES)
f ) ... read one or more books t o supplement your t ra in ing ? / ... lu un (ou plusieurs) l i v re t s ) pour cunpléter votre formation professionnelle ? (BOOKS)
14 86
7 93
10 90
39 61
I
19 81 30 70
19 80 18 82
11 88 34 66
41 58 53 46
+ : yes/ oui - : no/ non
7 91
3 95
5 93
21 78
I + -
15 85
11 89
16 84
32 68
PAID COURSES I 12 87
BWKS I 38 62
+ : important - : pas important
AS PART OF MY UORK
PUBLIC EMPLOY. PROGRAMME
COLLEGES, UN IVERSIT IES
FREE COURSES
PAID COURSES
BWKS
F
+ -
23 76
7 92
16 84
11 88
9 91
38 62
DK
+ -
33 67
8 92
16 84
23 77
20 80
49 50 - . . I RL
+ -
13 86
6 93
11 87
6 92
19 79
31 67
D 1 r-----* -----
' EAST I
WEST I I * 21 7 5 ' 23 73' 33 65
9 88' 11 86' 18 79
10 87' 10 87' 10 89
16 81 I 16 81' 16 83
18 79' 16 81; 11 87
I I
I I I l I I I I
39 5s; 42 561 51 47
5 95
8 92 13 87
79 21 78
EC12+
+ -
22 76
8 91
13 86
11 88
13 85
36 63
EC 12 +
+ -
22 76
8 91
13 86
11 88
13 85
36 63 - (*I The difference betueen
entre l a sanne des 11+11 e t and 11-11, and 100, i s the percentage of lldon't knout1 (not shom) / 'La dif férence
e t 100, représente l e pourcentage des "ne s a i t pas" (pas indiqué).
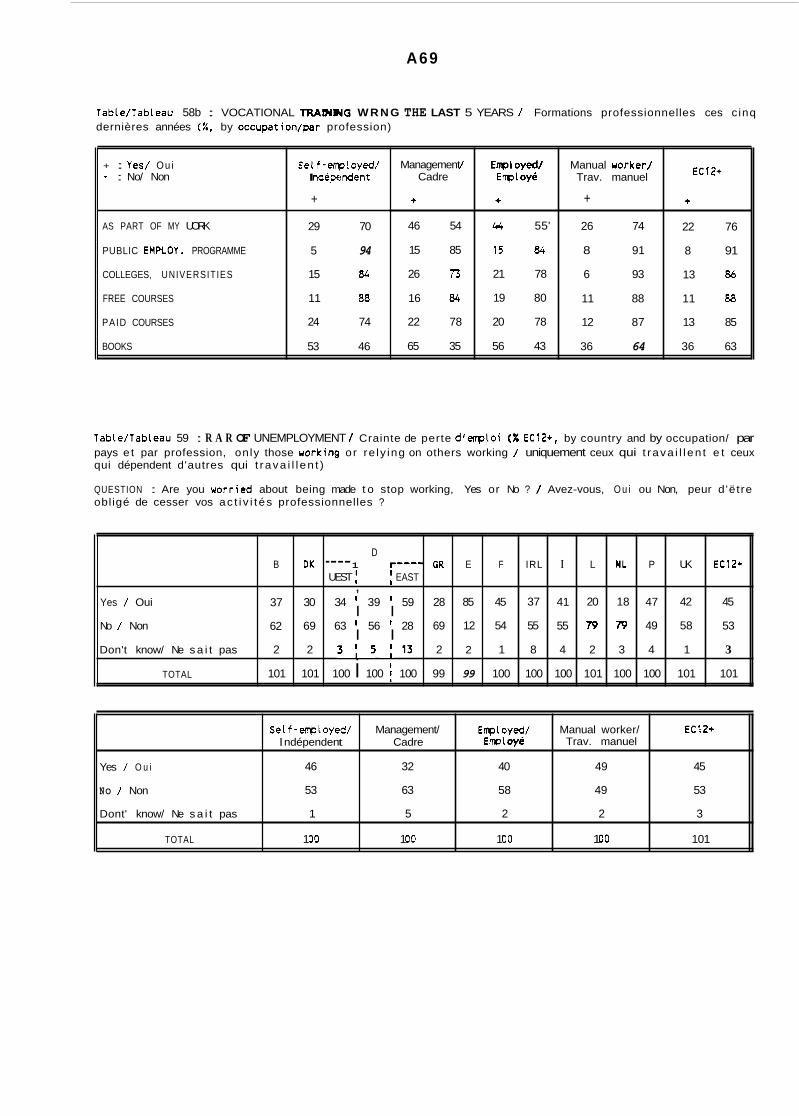
A69
+ : Yes/ Ou i - : No/ Non
AS PART OF MY UORK
PUBLIC EMPCOY. PROGRAMME
COLLEGES, UNIVERSITIES
FREE COURSES
PAID COURSES
BOOKS
Table/Tableau 58b : VOCATIONAL TRAINING W R N G THE LAST 5 YEARS / Formations professionnelles ces c inq dernières années ( X , by occupation/par profession)
Self-enployed/ I ndépendent
+
29 70
5 94
15 84
11 88
24 74
53 46
Yes / Oui
No / Non
Don't know/ Ne s a i t pas
TOTAL
Management / Cadre
+
D
UEST : EAST B DK ---- 1 r--- GR E F IRL I L NL P UK EC12+
, 37 30 34 39 I 59 28 85 45 37 41 20 18 47 42 45
62 69 63 I 56 I 28 69 12 54 55 55 79 79 49 58 53 I I
I I 2 2 3 : 5 ! 1 3 2 2 1 8 4 2 3 4 1 3
101 101 100 i 100 i 100 99 99 100 100 100 101 100 100 101 101
46 54
15 85
26 73
16 84
22 78
65 35
Yes / O u i
NO / Non
Dont' know/ Ne s a i t pas
TOTAL
Enpl oyed/ Empl Oyé
+
ECl2+ Self-employed/ Management/ Enployed/ Manual worker/ Empl Oyé Trav. manuel I ndépenden t Cadre
46 32 40 49 45
53 63 58 49 53
1 5 2 2 3
1 O0 1 O0 1 O0 1 O0 101
44 55'
15 84
21 78
19 80
20 78
56 43
Manual worker/ Trav. manuel
+
26 74
8 91
6 93
11 88
12 87
36 64
EC12+
+
22 76
8 91
13 86
11 88
13 85
36 63
Table/Tableau 59 : R A R OF UNEMPLOYMENT I Crainte de perte d'emploi ( X EC12+, by country and by occupation/ par pays e t par profession, only those norking or re ly ing on others working / uniquement ceux qui t rava i l l en t e t ceux qui dépendent d'autres qui t rava i l l en t )
QUESTION : Are you worried about being made t o stop working, Yes or No ? / Avez-vous, O u i ou Non, peur d 'ëtre obl igé de cesser vos ac t i v i t és professionnelles ?

A70
Vocational t r a i n i ng / Formation profess ionnel le
Table/Tableau 60 : VOCATIONAL TRAIYNG / Formation professionnel le ( X EC12+, by country and by occupation/ par pays e t par profession, on ly those working o r r e l y i ng on others working / uniquement ceux qui t r a v a i l l e n t e t ceux qui dépendent d'autres qui t r a v a i l l e n t )
PUESTION : Do you t h i nk tha t i f you had a be t te r vocational t r a i n i ng you uould have a much be t t e r chance o f continuing t o uork, a s l i g h t l y be t te r chance o f continuing t o uork, o r tha t i t uould not make any d i f ference ? / D'après vous, s i vous aviez une mei l leure formation professionnel le, vous auriez beaucoup p lus de chances de continuer vos a c t i v i t é s professionnelles, vous auriez un peu p lus de de chances de continuer vos a c t i v i t é s professionnel les, ou cela ne changerait r i e n ?
Self-employed/ Management/ Independent Cadre
.
17
14
66
3
.
13
13
71
3
Vacat i ona1 t r a i n i ng / Formation professionnel Le
Much be t t e r chance/ Beaucoup p lus de chances
S l i g h t l y be t t e r chance/ Un peu p lus de chances
No d i f ference/ Cela ne changerait r i e n
Don't b o n / Ne s a i t pas
TOTAL
1 O0 1 O0
Much be t te r chance/ Beaucoup p lus de chances Il 21
S l i g h t l y be t t e r chance/ Un peu p lus de chances Il
11
19
No di f ference/ Cela ne changerait r i e n
IDon't knon/ Ne s a i t pas 1 1 y ' TOTAL 99 1 O0
Enployed/ Manual uorker/ Employé I Trav. manuel
Unenpl oyed/ Chômeur
30
22
45
3
1 OD
Table/Tableeu 61 : INCREASETAXTOCREATEJOBS/ PLUS d'impôts pour créer de nouveaux emplois ( X , by country/par Pays)
PUESTION : Would you be ready t o pay more tax i f you uere sure that t h i s ex t ra tax nas t o be devoted t o c rea t ing . neu jobs ? / Accepteriez-vous, oui ou non, de payer p lus d'impôts s i vous é t i e z sûrce) que ces impôts supplémentaires seront consacrés à l a créat ion de nouveaux enplois ?
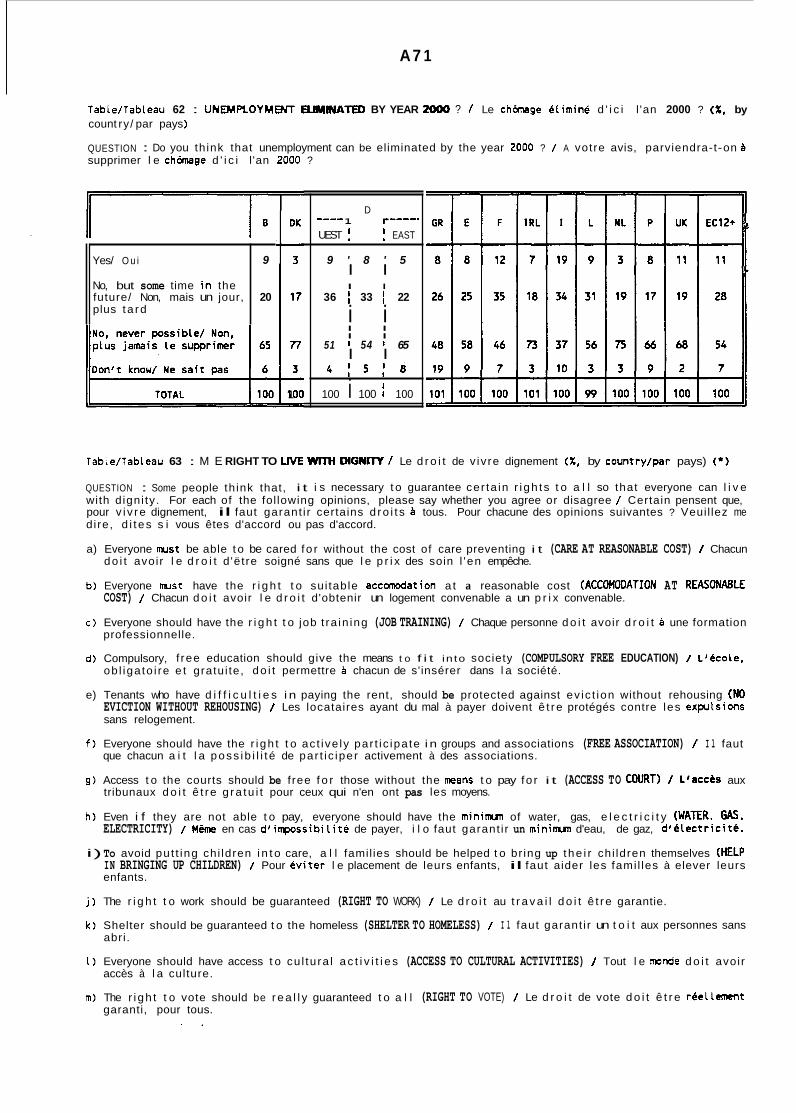
A7 1
Yes/ O u i
No, but some time i n the future/ Non, mais un jour, plus t a rd
Table/Tableau 62 : UNEMPLOYMaYT ELIMINATED BY YEAR zoo0 ? / Le c h h g e él imin6 d ' i c i l 'an 2000 ? ( X , by count ry/ par pays )
QUESTION : Do you th ink that unemployment can be eliminated by the year ZOO0 ? / A votre avis, parviendra-t-on B supprimer l e chhage d ' i c i l 'an 2000 ?
9
20 ; 1 O0 -
D
UEST EAST 1 r----- ---e
9 ' 8 ' 5 I I I I
36 I 33 I 22
i i I I I I
51 I 54 I 65 I I
4 : s : t i
100 i 100 100
Table/Tableau 63 : M E RIGHT TO UM WITH DIG" / Le d r o i t de v iv re dignement ( X , by country/par pays) (*)
QUESTION : Some people th ink that, i t i s necessary t o guarantee cer ta in r i gh ts t o a l l so that everyone can l i v e with d igni ty. For each of the fol lowing opinions, please say whether you agree or disagree / Certain pensent que, pour v i v re dignement, il faut garant i r certains d ro i t s à tous. Pour chacune des opinions suivantes ? Veuil lez me d i re, d i t es s i vous êtes d'accord ou pas d'accord.
a) Everyone rus t be able t o be cared fo r without the cost of care preventing i t (CARE AT REASONABLE COST) / Chacun
b) Everyone must have the r i g h t t o sui table accomodation a t a reasonable cost (ACCOMODATION AT RW0NAH-E
c ) Everyone should have the r i g h t t o job t ra in ing (JOB TRAINING) / Chaque personne d o i t avoir d r o i t à une formation
do i t avoir l e d r o i t d 'ëtre soigné sans que l e p r i x des soin l 'en empêche.
COST) / Chacun d o i t avoir l e d r o i t d'obtenir un logement convenable a un p r i x convenable.
professionnelle.
d) Compulsory, f ree education should give the means t o f i t in to society (COMPULSORY FREE EDUCATION) / L'Ccole, ob l iga to i re e t gratui te, do i t permettre i chacun de s'insérer dans l a société.
e) Tenants who have d i f f i c u l t i e s i n paying the rent, should be protected against ev ic t ion without rehousing (NO EVICTION WITHOUT REHOUSING) / Les locataires ayant du mal à payer doivent ê t re protégés contre les exputsions sans relogement.
f ) Everyone should have the r i gh t t o ac t ive ly par t ic ipa te i n groups and associations (FREE ASSOCIATION) / I l faut
g) Access t o the courts should be f ree f o r those without the means t o pay fo r i t (ACCESS TO COURT) / L ' B C C ~ S aux tribunaux d o i t ê t re g ra tu i t pour ceux qui n'en ont pas les moyens.
h) Even i f they are not able t o pay, everyone should have the minimm of water, gas, e l e c t r i c i t y (HAIER. w. ELECTRICITY) / Même en cas d ' inposs ib i l i té de payer, i l o faut garant i r un minimm d'eau, de gaz, d 'é lec t r ic i tk .
i) To avoid put t ing chi ldren i n t o care, a l l famil ies should be helped t o br ing up t he i r chi ldren themselves (HELP IN BRINGING UP CHILDREN) / Pour év i te r l e placement de leurs enfants, il faut aider les fami l les à elever leurs enfants.
que chacun a i t l a poss ib i l i t é de par t ic iper activement à des associations.
j ) The r i g h t t o work should be guaranteed (RIGHT TO WORK) / Le d r o i t au t r a v a i l d o i t ê t re garantie.
k ) Shelter should be guaranteed t o the homeless (SHELTER TO HOMELESS) / I l faut garant i r un t o i t aux personnes sans
1 ) Everyone should have access t o cu l tu ra l a c t i v i t i e s (ACCESS TO CULTURAL ACTIVITIES) / Tout l e monde d o i t avoir
m) The r i gh t t o vote should be r e a l l y guaranteed t o a l l (RIGHT TO VOTE) / Le d r o i t de vote d o i t ê t r e réellement
abri.
accès à l a culture.
garanti, pour tous. . .

A72
Table 63 - see previous page fo r de ta i ls /vo i r page preCMente pour plus de deta i ls - DK
+ -
- B
+ -
- E
+ -
1st colum: X f o r 2nd colum: X against F
+ -
GR
+ -
96 3
9 4 4
94 5
73 22
59 33
92 6
86 1 1
90 7
56 68
57 35
92 5
83 13 - I
+ -
98
98
97
98
95
87
90
94
97
97
98
92
O
O
O
1
3
6
3
2
2
1
O
3
98 1
98 1
96 i
97 i
77 12
8 4 5
95 2
90 5
90 5
98 1
96 2
91 5 - EC 12
+ -
9 9 1
9 9 1
96 !
97 i
79 11
72 1E
9 3 4
V1 6
b P
- 3
o ( 3
01 6 - EC120
o -
a) CARE AT REASONABLE COST
b) ACCOMODATION AT REASONABLE COST
C l JOB T R A I N I N G '
d) COMPULSORY FREE EDUCATION
e) NO E V I C T I O N U I T H W T REHWSING
f ) FREE ASSOCIATION
h) ACCESS TO COURT
i ) WATER, GAS, ELECTRICITY
j ) HELP I N BRINGING UP CHILDREN
k ) RIGHT TO WORK
1) SHELTER TO HOMELESS
1) ACCESS TO CULTURAL A C T I V I T I E S
m) RIGHT TO VOTE
l a re colonne: X llfavorablell Ze colonne: X non favorable
98 2
96 3
94 4
90 8
66 22
69 18
8 6 8
8 8 7
8 4 9
89 6
89 6
79 12
I RL
+ -
82 1 1
81 13
92 10
71 19
- L
+ -
91 9
72 18
- - NL
+ -
91 5
76 15
- - P
+ -
- UK
+ -
a) CARE AT REASONABLE COST
b) ACCOMWATION AT REASONABLE COST
c ) JOB TRAINING
d) COMPULSORY FREE EDUCATION
e) NO E V I C T I O N U I T H W T REHWSING
f ) FREE ASSOCIATION
9) ACCESS TO COURT
96
97
97
95
82
90
89
91
90
90
97
84
2
1
2
3
7
6
5
5
5
6
2
8
~
96 3
96 3
89 6
94 3
70 17
73 12
7 3 7
87 7
84 10
95 4
89 6
8 3 8
81 17
~
95 3
90 5 97 2
98 1
71 18
9 5 2
87 9
8 8 9
90 7
93 3
9 5 4
85 10
72 19
96 3
97 2
96 3
97 2
8 8 7
81 12
93 4
92 5
92 6
97 2
97 2
96 2 79 13 -
92 5
94 4
94 4
95 2
68 19
8 8 8
8 8 6
87 7
80 13
74 19
85 9
78 14
94 2 -
91 7
95 3
92 5
72 15
60 28
79 14
93 5
83 1 1
72 16
78 13
78 1 1
72 21
74 18 -
94 4
96 3
9 4 4
9 5 3
73 11
80 13
85 ?
8 6 8
84 10
87 9
89 6
82 1 1
93 3
h) WATER GAS ELECTRICITY
i) HELP I N BRINGING UP CHILDREN
j ) RIGHT TO WORK
k) SHELTER HOMELESS
1 ) ACCESS TO CULTURAL ACT I V 1 TES
m) RIGHT TO VOTE 65 25
(*I The difference between 11+(1 and 11-11, and 100, i s the percentage of Indon't know11 (not shom) / La dftf6r-e entre l a somne des e t 11-11, e t 100, represente l e pourcentage des Ilne s a i t pasIl (pas indique).

A73
Trble/Tableau 64 : NATIONAL IDENITY. EUROPUW / Identit6 nationale: identité européenne ( X I by cnntry/par pays)
QIESTION : In the near future do you see yourself as... ? / Dans un avenir proche, vous voyez-vous.. . ? I I
' 1st c o l m : EB40 result 2- colum: Change from EB37 B
32 -5
52 +4
9 o 4 +l
3 -2
1 O0
IRL
48 -4
43 +5
5 o 2 o 3 O
101
(UTIOWALITY) only
(UTIOUALITY) and European
fdrooein and (NATIONALITY)
f&Ͼ* only
>m'T k n o Y
TOTAL
D
WEST f EAST GR 1 r------ DK I-----
I
50 +2 41 +1 i 43 + 2 i 49 +5 41 +3
43 -3 44 +1 i 43 0 ; 38 -4 52 -3
4 o 8 -2' 8 - 1 ; 7 -1 4 o 3 + 2 4 o ; 4
+ l ; 3 +1 o -2 I
1 o 3 - 1 : 3 - 1 ; 3 - 1 3 +1 I I
101 100 I 101 ' 100 1 O0
I L NL P UK
26 +2 36 +9 40 -2 41 +3 59 +5
55 -2 50 -3 49 +4 47 -7 29 -6
1 1 +4 9 -1 9 +2 4 +1 5 +l
4 -1 4 -2 1 -2 2 +1 3 - 1
4 - 3 1 - 3 2 O 6 + 2 4 + 1
100 1 O0 101 1 O0 1 O0
'OV c o i a n c : Résultat E640 I+ roi:urrietion depuis EB37
( U : OUAL I TE ) uni quement .ea':3u~lT~) et Européen .
I dm et (NATIONALITE)
f e r m miquement
*e t a ' t Das
TOTAL
E l F
1 O0 I 100
101 I 100
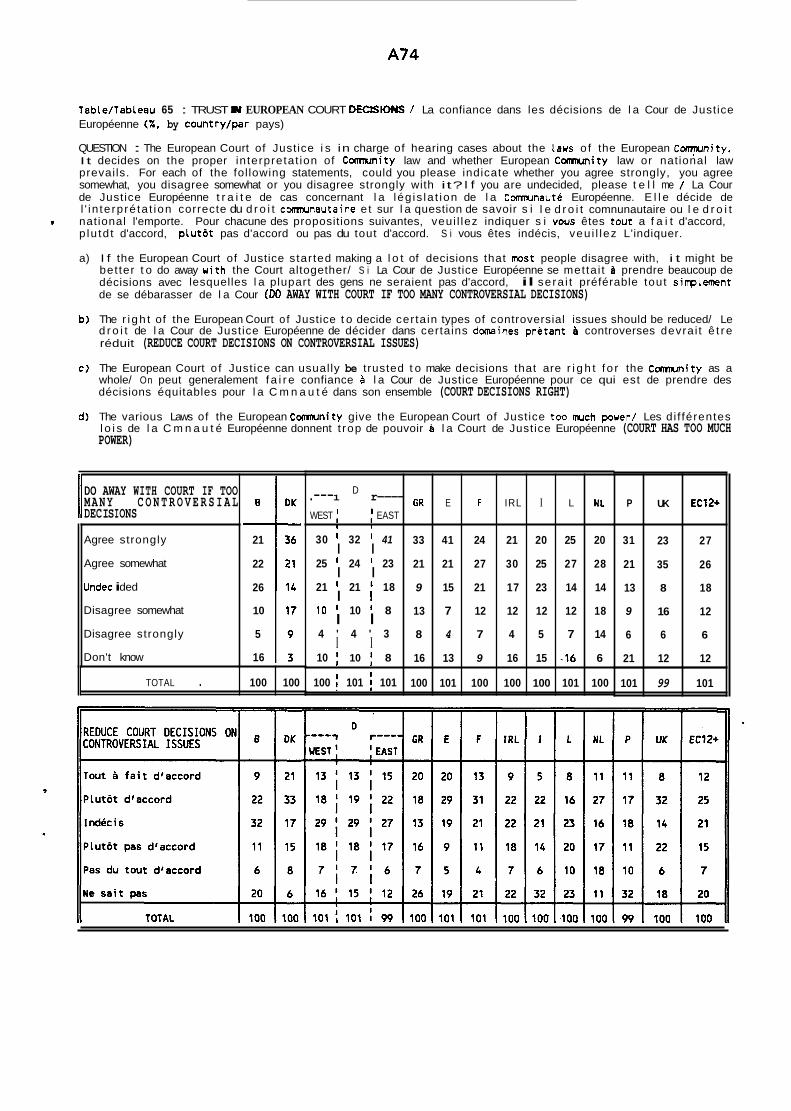
A74
D
WEST ; ; EAST
30 I 32 I 41
25 I 24 I 23
21 21 i 18
10 10 ' 8
4 ' 4 ' 3
10 I 10 I 8
1 r---- .--- I I
I I
I I
I
I l
I I
100 1 101 i 101
Table/Tableau 65 : TRUST W EUROPEAN COURT DECISIONS / La confiance dans les décisions de l a Cour de Justice Européenne ( X , by country/par pays)
QUESTION : The European Court of Justice i s in charge of hearing cases about the laws of the European C-nity. I t decides on the proper interpretat ion of C m n i t y law and whether European Comnunity law or national law prevails. For each of the fol lowing statements, could you please indicate whether you agree strongly, you agree somewhat, you disagree somewhat or you disagree strongly with it? I f you are undecided, please t e l l me / La Cour de Justice Européenne t r a i t e de cas concernant l a lég is la t ion de l a Comnunauté Européenne. E l l e décide de l ' in te rpré ta t ion correcte du d r o i t comnunautaire e t sur l a question de savoir s i l e d r o i t comnunautaire ou l e d r o i t national l'emporte. Pour chacune des propositions suivantes, veui l lez indiquer s i vous êtes tout a f a i t d'accord, p lu td t d'accord, p lu td t pas d'accord ou pas du tout d'accord. S i vous êtes indécis, veu i l lez L'indiquer.
a) I f the European Court of Justice star ted making a l o t of decisions that most people disagree with, i t might be bet ter t o do away with the Court altogether/ S i La Cour de Justice Européenne se metta i t a prendre beaucoup de décisions avec lesquelles l a plupart des gens ne seraient pas d'accord, il sera i t préférable tout sinplement de se débarasser de l a Cour (DO AWAY WITH COURT IF TOO MANY CONTROVERSIAL DECISIONS)
b) The r i gh t of the European Court o f Justice t o decide certa in types of controversial issues should be reduced/ Le d r o i t de l a Cour de Justice Européenne de décider dans certains domaines pretant & controverses devrai t ê t re réduit (REDUCE COURT DECISIONS ON CONTROVERSIAL ISSUES)
c) The European Court o f Justice can usually be trusted t o make decisions that are r i g h t f o r the Cumunity as a whole/ On peut generalement f a i r e confiance à l a Cour de Justice Européenne pour ce qui est de prendre des décisions équitables pour l a C m n a u t é dans son ensemble (COURT DECISIONS RIGHT)
d) The various Laws of the European C m n i t y give the European Court of Justice too mch power/ Les di f férentes l o i s de l a C m n a u t é Européenne donnent t rop de pouvoir 8 l a Court de Justice Européenne (COURT HAS TOO MUCH POWER)
I
GR E F IRL I L NL
33 41 24 21 20 25 20
21 21 27 30 25 27 28
9 15 21 17 23 14 14
13 7 12 12 12 12 18
8 4 7 4 5 7 14
16 13 9 16 15 ,16 6
100 101 100 100 100 101 100
DO AWAY WITH COURT IF TOO MANY C O N T R O V E R S I A L Il DEC IS I ONS P
31
21
13
9
21
101
Agree strongly
Agree somewhat
Undec i ded
Disagree somewhat
Disagree strongly
Don't know
UK EC12+
23 27
35 26
18 8
16 12
6 6 6
12 12
99 101
B
- 21
22
26
10
5
16
TOTAL . 100 100

A75
Table 65 see previous page/ Tableau 65 voir page précédente
COURT DECISIONS RIGHT
Agree strongly
Agree someuhat
Undec i ded
Disagree someuhat
Disagree strongly
Don't know
TOTAL
COURT HAS TOO MUCH POWER ~ ~~ ~
Tout à f a i t d'accord
Plutôt d'accord
Indécis
Plutôt pas d'accord
Pas du tout d'accord
Ne sa i t pas
TOTAL
14
29
28
4
1
23
99 - - - - -
B
- 4
9
37
10
5
35
1 O0
- - -
- - OK - 29
42
12
9
3
4
99 - - - - - OK
- 17
22
25
18
9
9
I O0
- - -
O 1 r--- ---
JEST : EAST
15 I 15 I 18
30 I 31 I 34
29 I 28 I 25
I 1
I I
I I
I I 9 ' 9 ; r o I 4 ; 4 ; 4
100 i 100 101
13 I 13 10
O 1 r---
AES1 : EAST
--- I I
10 I 10 I 12 I I 18 I 17 I 17 I I 33 I 32 I 29
I I 15 15 I 15
I I 5 ' 5 ' 5 I I 20 22 23
I
101 I 101 I 101
- - CR
- 24
26
12
4
3
30
99 - - -
GR
- 16
16
15
8
5
41
101 - - -
- - E
- 16
28
19
8
3
26
1 O0
- - - -
E
- 9
16
21
8
5
42
1 o1 - - -
- - F
- 13
35
22
7
3
20
1 O0
- - - - F - 7
17
26
12
4
34
1 O0
- - -
- - I RL
- 15
39
15
5
2
25
101 - - -
I RL
- 5
16
22
17
6
35
101 - - -
- - I
- 15
33
15
4
2
30
99 - - - -
I
- 5
15
25
12
3
41
101 - - -
- _I
L
- 12
36
13
7
2
30
1 O0
- - - - L
- 5
13
20
16
7
39
I O0
- - -
- _I
NL
- 35
36
12
4
1
12
1 O0
- - - NL
- 7
17
24
13
12
28
101 - - -
- - P
- 23
24
19
3
1
32
102 - - - - P
- 10
16
21
9
5
38
99 - - -
10
42
12
14
4
19
101 - - - - - UK
- 10
26
15
22
5
23
101 - 7 -
c
?
~
20
101
- - EC12+ - 9
18
25
14
5
31
102 - -
c

A76
c
(3)
(4)
RECHERCHES SUR LES ATTITUDES DES EUROPEENS / SURVEYS ON ATTITUDES OF THE EUROPEANS
"LES EUROPEENS ET L'UNIFICATION DE L'EUROPE" / **EUROPEANS AND EUROPEAN UNIFICATION" (FR/EN) Sondage de février-mars 1970 / Survey carried out in February-March 1970 Rapport juin 1972 / Report June 1972 - 240 p.
*'L'OPINION DES EUROPEENS SUR LES ASPECTS REGIONAUX ET AGRICOLES DU MARCHE COMMUN. L'UNIFICATION POLITIQUE DE L'EUROPE ET L'INFORMATION DU PUBLIC" (FR) Sondage de juillet 1971 / Survey carried out in July 1971. Rapport décembre 1971 / Report December 1971 - 64 p.
'*SATISFACTION ET INSATISFACTION QUANT AUX CONDITIONS DE VIE DANS LES PAYS DE LA COMMUNAUTE EUROPEENNE" (FR) Sondage de septembre 1973 / Survey carried out in September 1973. Rapport juin 1974 / Report June 1974 - 120 p.
"L'EUROPE VUE PAR LES EUROPEENS" (FR) Sondage de septembre 1973 / Survey carried out in September 1973. Rapport août 1974 / Report August 1974 - 48 p.
"EUROBAROMETRE" / "EUROBAROMETER" (Disponible dans toutes les langues communautaires / Available in all Community languages). Sondage semestriel dont les résultats sont publiés depuis juin 1974. / Half- yearly survey published as from June 1974.
"FEMMES ET HOMMES D'EUROPE"/ "EUROPEAN MEN AND WOMEN" (FR/EN/DE) Sondage de mai 1975 / Survey carried out in May 1975 Rapport décembre 1975 / Report December 1975 - 21 5 p.
"LE CONSOMMATEUR EUROPEEN"/ **EUROPEAN CONSUMER** (FR/EN) Sondage d'octobre 1975 / Survey carried out in October 1975 Rapport mai 1976 / Report May 1976 - 175 p.
"LA PERCEPTION DE LA MISERE EN EUROPE** / "THE PERCEPTION OF POVERTY IN EUROPE** (FR/EN/DE/NL/DA) Sondage de mai-juin 1976 / Survey carried out in May-June 1976. Rapport mars 1977 /Report March 1977 - 144 p. - 2O bdition (FR) septembre 1981.
"LA SCIENCE ET L'OPINION PUBLIQUE EUROPEENNE" / "SCIENCE AND EUROPEAN PUBLIC OPINION" (EN/DE/IT/NL) (FR épuisé) Sondage d'avril-mai 1977 / Survey carried out in April-May 1977. Rapport octobre 1977 / Report October 1977 - 98 p.

A77
(1 1)
(1 2)
(1 6)
"LES ATTITUDES DE LA POPULATION ACTIVE A L'EGARD DES PERSPECTIVES DE LA RETRAITE" / "THE ATTITUDES OF THE WORKING POPULATION TO RETIREMENT" (FR/EN/DE/IT/NL) Sondage d'octobre-novembre 1977 / Survey carried out in October- November 1977. Rapport mai 1978 / Report May 1978 - 52 p.
"LES ATTITUDES DU PUBLIC EUROPEEN FACE AU DEVELOPPEMENT SCIENTIFIQUE ET TECHNIQUE" / "THE EUROPEAN PUBLIC'S ATTITUDES TO SCIENTIFIC AND TECHNICAL DEVELOPMENT" (FR/DE) (EN épuisé) Sondage d'octobre 1978 / Survey carried out in October 1978. Rapport février 1979 / Report February 1979 - 67 p.
"FEMMES ET HOMMES D'EUROPE EN 1978" / "EUROPEAN MEN AND WOMEN IN 1978" (FR/EN/DE/IT/NL) Sondage d'octobre-novembre 1977 / Survey carried out in October- November 1977. Rapport février 1979 / Report February 1979 - 248 p.
"CHOMAGE ET RECHERCHE D'UN EMPLOI: attitudes et opinions des publics européens" (FR) Sondage de mai-juin 1978 / Survey carried out in May-June 1978. Rapport septembre 1979 / Report September 1979 - 74 p.
"LES EUROPEENS ET LEURS ENFANTS" / "THE EUROPEANS AND THEIR C H I LD REN '' ( F R /E N / D E / N L/D A/ IT) Sondage d'avril 1979 / Survey carried out in April 1979. Rapport octobre 1979 / Report October 1979 - 102 p.
"LES FEMMES SALARIEES EN EUROPE: comment elles perçoivent kr discriminations dans le travail" / "EUROPEAN WOMEN IN PAJ0 EMPLOYMENT: their perception of discrimination at work' (FR/E N/DE/NL/IT/DA/G R) Sondage de juin-juillet 1980 / Survey carried out in June-July 1980 Rapport décembre 1980 / Report December 1980 - 72 p.
"LES EUROPEENS ET LEUR REGION: étude exploratoire sur la perception dor disparités socio-économiques" I EUROPEANS AND THEIR REGION: pb(K
perception of the socio-èconomic disparities: an exploratory study' (FR/EN/DE/NL/IT/DA) Sondage d'avril-mai 1980 / Survey carried out in April-May 1980. Rapport décembre 1980 / Report December 1980 - 62 p.
"L'OPINION EUROPEENNE ET LES QUESTIONS ENERGETIQUES" / 'THE EUROPEAN PUBLIC OPINION AND THE ENERGY PROBLEM" (FR/EN) Sondage de mars-avril 1982 / Survey carried out in March-April 1982. Rapport octobre 1982 / Report October 1982 - 79 p.

A78
(18) "LES JEUNES EUROPEENS : étude exploratoire des jeunes âges de 15 24 ans dans les pays de la Communauté Européenne" / "THE YOUNG EUROPEANS: Exploratory study on young people aged between 15 and 24 years in the countries of the European Community** (FR/EN/DE/NL/IT/DA/GR) Sondage de mars-avril 1982 / Survey carried out in March-April 1982. Rapport décembre 1982 / Report December 1982 - 139 p.
"LE PARLEMENT EUROPEEN ET L'ELECTION DE 1984" (FR) Sondage de mars-avril 1983 / Survey carried out in March-April 1983. Rapport août 1983 / Report August 1983 - 105 p.
I (20) "LES EUROPEENS ET LEUR ENVIRONNEMENT" / "EUROPEANS AND THEIR
ENVIRONMENT" (FR/EN/NL/IT/DA/DE) Sondage d'octobre 1982 / Survey carried out in October 1982. Rapport novembre 1983 / Report November 1983 - 64 p.
(21) "LES EUROPEENS ET L'AIDE AU DEVELOPPEMENT" / **EUROPEANS AND AID TO DEVELOPMENT" (FR/EN) Sondage de septembre-octobre 1983 / Survey carried out in September- October 1983. Rapport mai 1984 / Report May 1984 - 134 p.
(22) "FEMMES ET HOMMES D'EUROPE EN 1983" / "EUROPEAN WOMEN AND MEN IN 1983" (FR/EN + résumés disponibles dans les autres langues communautaires/ FR/EN + summaries available in other languages of the Community). Sondage de mars-avril 1983 / Survey carried out in March-April 1983. Rapport juin 1984 / Report June 1984 - 186 p.
(23) "LES FEMMES SALARIEES EN EUROPE - 1984" / "EUROPEAN WOMEN IN PAID EMPLOYMENT" (EN) Sondage de janvier-février 1984 / Survey carried out in January-February 1984. Rapport décembre 1984 / Report December 1984 - 1 18 p.
(24) "LE PUBLIC EUROPEEN ET L'INFORMATION DES CONSOMMATEURS : c COMPARAISONS 1975-1 985" (FR)
Mars 1985 / March 1985 - 18 p. Rapport mars 1985 / Report March 1985
(25) **L'OPINION EUROPEENNE ET LES QUESTIONS ENERGETIQUES EN 1984'1 "THE EUROPEAN PUBLIC OPINION AND THE ENERGY PROBLEM IN 1984' (FR/EN/DE) Sondage d'octobre 1984 / Survey carried out in October 1984. Rapport juillet 1985 / Report July 1985 - 99 p.

A79
"L'OPINION DES SALARIES EUROPEENS SUR LA FLEXlBlLlTE DANS LES CONDITIONS DE TRAVAIL" (FR) Sondage de mars-avril 1985 / Survey carried out in March-April 1985. Rapport juillet 1985 / Report July 1985 - 47 p.
"ENQUETE AUPRES DES TRAVAILLEURS SALARIES SUR LA FLEXlBlLlTE DANS LES CONDITIONS DE TRAVAIL" / "EMPLOYEE SURVEY ON LABOUR s MARKET FLEXIBILITY" (FR) (Economie européenne / European Economy nr. 27) Rapport octobre 1985 / Report October 1985 - 12 p.
"LE PUBLIC EUROPEEN ET L'ECU" / "EUROPEANS AND ECU" (FR/EN/DE/NL) Enquête faite dans sept pays de ia Communauté Européenne à l'initiative d'un groupe de banques. / Survey carried out in seven EC countries on behalf of a group of banks. Sondage de mars-avril 1985 / Survey carried out in March-April 1985. Rapport novembre 1985 / Report November 1985 - 43 p.
"LES EUROPEENS ET LES VACANCES" / "EUROPEANS AND THEIR HOLIDAYS" (FRIENIDEIITIDAIESIGR) Sondage de mars-avril 1986 / Survey carried out in March-April 1986. Rapport mars 1987 / Report March 1987 - 104 p.
"EUROPE 2000" (Disponible dans toutes les langues communautaires / Available in all Community languages). Sondage de déc. 1986-janv. 1987 / Survey carried out in Dec. 1986-Jan. 1987 Edition spéciale de I'Eurobaromètre pour le 30ème anniversaire du Traité de Rome, mars 1987 / Special Edition of the Eurobarometer for the 30th Anniversary of the Treaty of Rome, March 1987 - 58 p.
"LES EUROPEENS ET LEUR ENVIRONNEMENT EN 1986" I "EUROPEANS AND THEIR ENVIRONMENT IN 1986" (Disponible dans toutes les langues communautaires / Available in all Community languages). Sondage de mars-avril 1986 / Survey carried out in March-April 1986 Rapport mars 1987 / Report March 1987 - 107 p. 9
"LES EUROPEENS ET LA SECURITE ROUTIERE" / "EUROPEANS AND ROAD SAFETY" (FR/EN) Sondage . d'octobre-novembre 1986 / Survey carried out in October- November 1986. Rapport mars 1988 / Report March 1988 - 98 p.

A80
(32)
(34)
(35)
(361
138)
"L'OPINION EUROPEENNE ET LES QUESTIONS ENERGETIQUES EN 1986" / "EUROPEAN PUBLIC OPINION AND THE ENERGY PROBLEM IN 1986" (EN/FR + résumés disponibles en DE/ES/NL/DA/PO / FR/EN + summaries availa ble in D E/E S/N L/DA/PO/IT) Sondage d'octobre-novembre 1986 / Survey carried out in October- November 1986. Rapport janvier 7 988 / Report January 1988 - 163 p.
"LES EUROPEENS ET LA PREVENTION DU CANCER : une étude sur les attitudes et comportements du public." / "EUROPEANS AND CANCER PREVENTION : a study of attitudes and behaviour of the public" (FR/EN)
'
Sondage de mars-avril 1987 / Survey carried out in March-April 1987. Rapport juin 1988 / Report June 1'988 - 88 p.
"LES EUROPEENS, LEUR AGRICULTURE ET LA POLITIQUE AGRICOLE COMMUNE" / "EUROPEANS, AGRICULTURE AND THE COMMON AGRICULTURAL POLICY". (Disponible dans toutes les langues communautaires / Availaible in all Community languages). Sondage de mars-avril 1987 / Survey carried out in March-April 1987. Edition spéciale de I'Eurobaromètre - Février 1988 / Special edition of the Eurobarometer -February 1988 - 60 p.
"HOMMES ET FEMMES D'EUROPE 1987. Evolution des opinions et des attitudes." / "MEN AND WOMEN IN EUROPE 1987. The evolution of opinions and attitudes." (FR/EN) Sondage de mars-avril 1987 / Survey carried out in March-April 1987. Supplément n 0 2 6 de "Femmes d'Europe'' / Supplement nr. 26 of "Women of Europe". - 64 p.
"L'OPINION EUROPEENNE ET LES QUESTIONS ENERGETIQUES EN 1987" / "EUROPEAN PUBLIC OPINION AND THE ENERGY PROBLEM IN 1987". (FR/E N) Sondage d'octobre-novembre 1987 / Survey carried out in Oclober- November 1987. Rapport mai 1988 / Report May 1988 - 174 p.
"LES EUROPEENS ET L'AIDE AU DEVELOPPEMENT EN 1987" / "EUROPEANS AND DEVELOPMENT AID IN 1987". (FR/EN) Sondage d'octobre-novembre 1987 / Survey carried out in October- November 1987. Rapport mars 1988 / Report March 1988 - 70 p.
"LES JEUNES EUROPEENS EN 1987" / "THE YOUNG EUROPEANS IN 1987". (FR/EN) Sondage d'octobre-novembre 1987 / Survey carried out in October- November 1987. Rapport mars 1989 / Report March 1989 - 208 p.

A81
(39) "LES EUROPEENS ET LEUR ENVIRONNEMENT EN 1988" / "EUROPEANS AND THEIR ENVIRONMENT IN 1988." (FR) Sondage de mars-avril 1988 / Survey carried out in March-April 1988. Rapport octobre 1988 / Report October 1988 - 77 p.
(40) "LES EUROPEENS ET LA PREVENTION DU CANCER : consommation alimentaire, tabagisme, dépistage des cancers féminins". I "EUROPEANS AND THE PREVENTION OF CANCER : food consumption, smoking, screening for women's cancers". (FR/EN) Sondage de mars-avril 1988 / Survey carried out in March-April 1988. Rapport décembre 1988 / Report December 1988 - 71 p.
(41 1 "RACISME ET XENOPHOBIE. Droits de l'homme et immigration dans la Communauté européenne" / "RACISM AND XENOPHOBIA. Human rights and immigration in the European Community" (Disponible dans toutes les langues communautaires / Available in all Community languages) Sondage d'octobre-novembre 1988 / Survey carried out in October- November 1988. Rapport novembre 1989 / Report November 1989 - 120 p.
(42) "LES EUROPEENS ET LA PREVENTION DU CANCER : la notoriété du Programme et du Code européen" I "EUROPEANS AND THE PREVENTION OF CANCER : awareness of the Programme and the European Code" (FR/EN). Sondage d'octobre-novembre 1988 / Survey carried out in October- November 1988. Rapport juin 1989 / Report June 1989 - 85 p.
(43) "LES EUROPEENS, LA SCIENCE ET LA TECHNOLOGIE / "EUROPEANS, SCIENCE AND TECHNOLOGY" Sondage mars-avril 1989 / Survey carried out in March-April 1989. Rapport non disponible / Report not available. Article disponible en EN / Article available in EN ("Europeans, Science and Technology" by J.R. Durant, J.D. Miller, J.F. Tchernia, W. van Deelen. A paper presented to the 1991 annual meeting of the American Association for the Advancement of Science in Washington, D.C. 15 February 1991, 22 p.). .
- . (44) "LES EUROPEENS ET LA PREVENTION DU CANCER : comportements liés au
risque de cancer" / "EUROPEANS AND CANCER PREVENTION : behaviour linked with cancer" (FR) Sondage mars-avril 1989 / Survey carried out in March-April 1989 Rapport décembre 1989 / Report December 1989 - 79 p.
x
(45) "LES EUROPEENS ET LA PAUVRETE" / "EUROPEANS AND POVERTY" (FR/EN) Sondage juin-juillet 1989 / Survey carried out in June-July 1989 Rapport mars 1990 / Report March 1990 - 1 1 O p.

A82
(47 3
I
"LES EUROPEENS ET LES QUESTIONS ENERGETIQUES EN 1989" / "EUROPEANS AND THE ENERGY PROBLEM IN 1989" (FR/EN/DE) Sondage juin-juillet 1989 / Survey carried out in June-July 1989 Rapport novembre 1989 / Report November 1989 - 11 1 p.
"LES EUROPEENS ET LES ELECTIONS EUROPEENNES 1989" / "EUROPEANS AND THE 1989 EUROPEAN ELECTIONS" Sondages oct.-nov. 1988, mars-avril 1989 e t juin-juillet 1989/Surveys carried out in Oct.-Nov. 1988, in March-April 1989 and in June-July 1989 Diverses publications 1989 ff. du Groupe Transnational d'Etudes sur les Elections Européennes/Various publications 1 989 ff. of the Transnational European Election Study GrouplCoordination: Hermann SCHMITT, Zentrum für Europäische Umfrageanalysen und Studien (ZEUS), Universität Mannheim, Fed. Rep. of Germany.
"LA FAMILLE ET LE DESIR D'ENFANTS" / "THE FAMILY AND THE DESIRE FOR CHILDREN" (EN/DE) (FR épuisé) Sondage octobre-novembre 1 989 / Survey carried out in October-November 1989 Rapport août 1990 / Report August 1990 - 11 9 p.
"L'OPINION PUBLIQUE DANS LA COMMUNAUTE EUROPEENNE A PROPOS
ABOUT THE UNITED NATIONS" (EN) Sondage octobre-novembre 1 989/Survey carried out in October-November 1989 Publié au printemps 1990 par l'ONU / Published in Spring 1990 by the UN
DES NATIONS-UNIES" / "PUBLIC OPINION IN THE EUROPEAN COMMUNITY
"LES JEUNES EUROPEENS EN 1990" / "THE YOUNG EUROPEANS IN 1990" (FR/EN)Sondage octobre-novembre 1 990 / Survey carried out in October- November 1990 Rapport mai 1991 / Report May 1991 - 191 p.
"FAMILLE ET EMPLOI DANS L'EUROPE DES DOUZE" / "FAMILY AND EMPLOYMENT WITHIN THE TWELVE" (FR/EN) Sondage octobre-novembre 1 990/Survey caried out in' October-November 1990 Rapport décembre 1991 /Report December 1991 - 174 p.
"FIRST EUROPEAN SURVEY ON THE WORK ENVIRONMENT 1991-1992" (EN) Sondage mars-avril 1991 /Survey carried out in March-April 1991 Published in 1992 by the European Foundation for the Improvement of Living and Working Conditions - 229 p.

I \
(53)
(55)
(56)
(57)
(58)
(59)
A83
"LA REPRESENTATION DES INTERETS DANS QUATRE PAYS DE LA CE" / "INTEREST REPRESENTATION IN FOUR EC COUNTRIES" Sondage octobre-novembre 1 990 / Survey carried out October-November 1990 Publié en 1 9 9 1 par le Wissenschaf tszentrum Berl in für Sozialwissenschaften/Published in 1 99 1 by the Wissenschaftszentrum Berlin für Sozialwissenschaften (WZB) f
"ESOMAR HARMONISED DEMOGRAPHICS FOR EUROPEAN SURVEY 8 RESEARCH" (EN) Survey carried out October-November 1990.Published 1 991 by the European Society for Opinion and Market Research (ESOMAR).
"LA COMMUNAUTE EUROPEENNE ET L'ALLEMAGNE UNIE EN AUTOMNE 1990" / "THE EUROPEAN COMMUNITY AND UNITED GERMANY IN AUTUMN 1990" (DE) Rapport spécial sur les résultats du sondage Eurobaromètre No.34, octobre 1990 / Special report on the results of the October 1990 Eurobarometer survey No. 34. Rapport en février 1991 / Report February 1991 - 41 p.
"L'OPINION EUROPEENNE ET LES QUESTIONS ENERGETIQUES EN 1991' / "THE EUROPEAN PUBLIC OPINION AND THE ENERGY PROBLEM IN 1991 (FR/EN) Sondage mars 1991 / Survey carried out in March 1991. Rapport novembre 1991 / Report November 1991 - 85 p.
"LES EUROPEENS ET LA SANTE ET LA SECURTIE AU TRAVAIL' / "EUROPEANS AND HEALTH AND S A F E N AT WORK" (EN/FR). Sondage avril-mai 1991 / Survey carried out in April-May 1991 Rapport publié en 1992 / Report published in 1992 - 140 p.
"CONSUMER BEHAVIOUR IN THE INTERNAL MARKET" (EN) Survey carried out in April 1991 Report July 1991 - 1 6 p.
"EUROPEAN ATTITUDES TOWARDS URBAN TRAFFIC PROBLEMS AND PUBLIC TRANSPORT" (EN)
Rapport juillet 1991 / Report July 1991 - 72 p.
'
Sondage avril 1991 / Survey carried out in April 1991 I
"L'OPINION DES EUROPEENS CONCERNANT LA BIOTECHNOLOGIE EN 1991" / "OPINIONS OF EUROPEANS ON BIOTECHNOLOGY IN 1991' (EN/FR) Sondage mars-avril 1991 / Survey carried out in March-April 1991 Rapport juillet 1991 / Report July 1991 - 76 p. A book on this topic is also available: Durant, John ed., "Biotechnology in Public: A review of recent research". Science Museum for the European F.ederation of Biotechnology. London 1 992.

A04
"LA COMMUNAUTE EUROPEENNE ET L'ALLEMAGNE UNIE AU PRINTEMPS 1991 ** / "THE EUROPEAN COMMUNITY AND UNITED GERMANY IN SPRING 1991 " (DE/FR/EN) Rapport spécial sur les résultats du sondage Eurobaromètre No 35, mars 1991 / Special report on the results of the March 1991 Eurobarometer survey No 35 Rapport avril 1991 / Report April 1991 - 17 p.
"LES POLITIQUES REGIONALES DANS L'OPINION PUBLIQUE" / "REGIONAL POLICY IN THE PUBLIC OPINION" Sondage octobre-novembre 1991 / Survey carried out in October-November 1991 Etudes de Développement Régional, N03, CCE Bruxelles 1992
"LA FACON DONT LES EUROPEENS PERCOIVENT LE TIERS-MONDE EN 91" I "THE WAY EUROPEANS PERCEIVE THE THIRD WORLD IN 1991" (FR/EN) Sondage octobre-novembre 1 99 1 / Survey carried out October-November 1991 Rapport paru en mai 1993 / Report May 1993
"LA COMMUNAUTE EUROPEENE ET L'ALLEMAGNE UNIE EN AUTOMNE 1991" / "THE EUROPEAN COMMUNITY AND UNITED GERMANY IN AUTUMN 1991 " (DE/FR/EN) Rapport spécial sur les résultats du sondage Eurobaromètre N036, octobre- novembre 1991 / Special report on the results of the October-November 1991 Eurobarometer survey No 36. Rapport décembre 1991 / Report December 1991 - 20 p.
"LES EUROPEENS ET L'ENVIRONNEMENT EN 1992"/ "THE EUROPEANS AND THE- ENVIRONMENT IN 1992" (FR/EN) Sondage mars-avril 1992 / Survey carried out in March-April 1992 Rapport novembre 1992 / Report November 1992 - 1 18p. (Brochures disponibles en FR/EN / Brochures available in FR/EN)
"SEMAINE EUROPEENNE DE PREVENTION DE LA TOXICOMANIE" / "EUROPEAN WEEK FOR DRUG ABUSE PREVENTION" (FR/EN) Sondage mars-avril 1992 / Survey carried out in March-April 1992 Rapport novembre 1992 / Report November 1992
"LA SECURITE SOCIALE" / "SOCIAL SECURITY" Sondage mars-avril 1992 / Survey carried out in March-April 1992
"LES ATTITUDES FACE AU VIEILLISSEMENT" / "AGE AND ATTITUDES" (FR/EN) Sondage mars-avril 1992 / Survey carried out in March-April 1992 Rapport janvier 1993 / Report January 1993 -36 p.
.

(73)
(74
(75
(76)
(77)
(78)
A85
"LA COMMUNAUTE EUROPEENE ET L'ALLEMAGNE UNIE AU PRINTEMPS
1992" (FR/EN/DE) Rapport spécial sur les résultats du sondage Eurobaromètre No.37, mars 1 9 9 2 / Special report on the results of the March 1992 Eurobarometer survey No.37
i 99zi1/ "THE EUROPEAN COMMUNITY AND UNITED GERMANY IN SPRING
Rapport mai 1992 / Report May 1992 -23 p. e
"LA COMMUNAUTE EUROPEENE ET L'ALLEMAGNE UNIE EN AUTOMNE 3
1992" / "THE EUROPEAN COMMUNITY AND UNITED GERMANY IN AUTUMN 1992" (DE/FR/EN) Rapport spécial sur les résultats du sondage Eurobaromètre No 38, septembre-octobre 1992 / Special report on the results of the Eurobarometer survey N o 38 Rapport février 1993 / Report February 1993
"LE TABAGISME INVOLONTAIRE OU LA POLLUTION DES NON-FUME PAR LES FUMEURS" (FR/EN) Sondage septembre-octobre 1992 / Survey carried out in September-October 1 992 Rapport mars 1993 / Report March 1993
JRS
"LES EUROPEENS ET LA COUR EUROPEENNE DE JUSTICE EN 1992"/"EUROPEANS AND THE EUROPEAN COURT OF JUSTICE IN 1992" Sondage septembre-octobre 1992 / Survey carried out in September-October 1 992
"LA SECURITE DES PRODUITS"/ "PRODUCT SAFETY" Sondage septembre-octobre 1992 / Survey carried out in September-October 1 992
"LE MARCHE UNIQUE DES CONSOMMATEURS" / "THE CONSUMER'S SINGLE MARKET" Sondage novembre 1992 / Survey carried out in November 1992
"EUROPEANS, SCIENCE AND TECHNOLOGY" (EN)
Rapport juin 1993 / Report June 1993
"LES EUROPEENS ET LA FAMILLE" / "EUROPEANS AND THE FAMILY" (FR/EN) Sondage mars-avril 1993 / Survey carried out in March-April 1993 Rapport décembre 1993 / Report December 1993
Sondage novembre 1992 / Survey carried out in November 1992 2
9
"LES EUROPEENS ET LA SANTE ET LA SECURITE AU TRAVAIL" "EUROPEANS AND HEALTH AND SAFETY AT WORK" (FR/EN) Sondage mars-avril 1993 / Survey carried out in March-April 1993

A86
"L'OPINION EUROPEENNE ET LES QUESTIONS ENERGETIQUES EN 1993"/ "PUBLIC OPINION IN THE EUROPEAN COMMUNITY ON ENERGY IN 1993" (FR/EN) Sondage avril 1993 / Survey carried out in April 1993 Rapport septembre 1993 / Report September 1993
"BIOTECHNOLOGIE ET GENIE GENETIQUE: CE QU'EN PENSENT LES EUROPEENS EN 1993" / "BIOTECHNOLOGY AND GENETIC ENGINEERING: WHAT EUROPEANS THINK ABOUT IT IN 1993" (FR/EN) Sondage avril 1993 / Survey carried out in April 1993 Rapport octobre 1993 / Report October 1993
"THE CONSUMERS'S INTERNAL MARKET" / LE MARCHE UNIQUE DES CONSOMMATEURS" Sondage avril 1993 / Survey carried out in April 1993
"EXCLUSION SOCIALE" / "SOCIAL EXCLUSION" Sondage octobre-novembre 1 993 / Survey carried out in October-November 1993

A87
TECHNICAL SPECIFICATIONS FOR SOCIO-DEMOGRAPHIC AND SOCIO-POLITICAL VARIABLES USED IN CROSSTABULATIONS
SOCIO-PROFESSIONAL STATUS
Roughly half of our representative sample of the EC public is without paid work. i Answers t o the question "What is your occupation ?" show the following distribution:
OCCUPATION OF THE PERSON INTERVIEWED (n = 12.800) (weighted percentage for EC 12+ - EB40)
Self - employed
t
( : j Farmer . . . . . . . . . . . . . . . . :...........................2% ( 2 ) Fishermen . . . . . . . . . . . . . . . . . . . . . . . . . . . . . . . . . . . . . . . .O% i 3, Professional (lawyer, medical practitioner,accountant, etc.) . . . . . . . 2% 131 Owners of shops or companies, craftsmen, self-employed persons . . 4% t5r Business proprietors, owner (full or partner) of a company . . . . . . . . 1 %
Employed
Employed professional (employed lawyer, practitioner, accountant) . 1 % General management, director or top management . . . . . . . . . . . . . 1 YO Middle management, other management . . . . . . . . . . . . . . . . . . . . 7% Employed position, working mainly at a desk . . . . . . . . . . . . . . . . . 7% Employed position, not at a desk but travelling (salesmen, driver) . . . 3% Employed position, not at a desk, but in a service job (hospital, restaurant,police, firemen, ... ) . . . . . . . . . . . . . . . . . . . . . . . . . . . 6% Supervisors . . . . . . . . . . . . . . . . . . . . . . . . . . . . . . . . . . . . . . . 1 % Skilled manual workers . . . . . . . . . . . . . . . . . . . . . . . . . . . . . . . . 8% Other (unskilled) manual workers, servants . . . . . . . . . . . . . . . . . . 5%
Non-active
( 1 5 ) Responsible for'ordinary shopping and looking after the home, or without any
(1 6) Student 11% current occupation, not working . . . . . . . . . . . . . . . . . . . . . . . . . 14%
(1 7) Unemployed or temporarily not working . . . . . . . . . . . . . . . . . . . . 6%
(1 8) Retired or unable to work through illness 20% r
. . . . . . . . . . . . . . . . . . . . . . . . . . . . . . . . . . . . . . . . . 5
. . . . . . . . . . . . . . . . . . .
Basing cross-analyses on "occupation" would exclude half of our respondents from analysis. An alternative, also used in past EUROBAROMETER reports, is t o base analyses on a (non-marxist) concept of "objective social class" using the occupation of the "person who contributes most t o the household income" as reference. In order to classify as many respondents as possible with respect to their socio-professional setting, a new classification was created : the "SOCIO-PROFESSIONAL-STATUS".
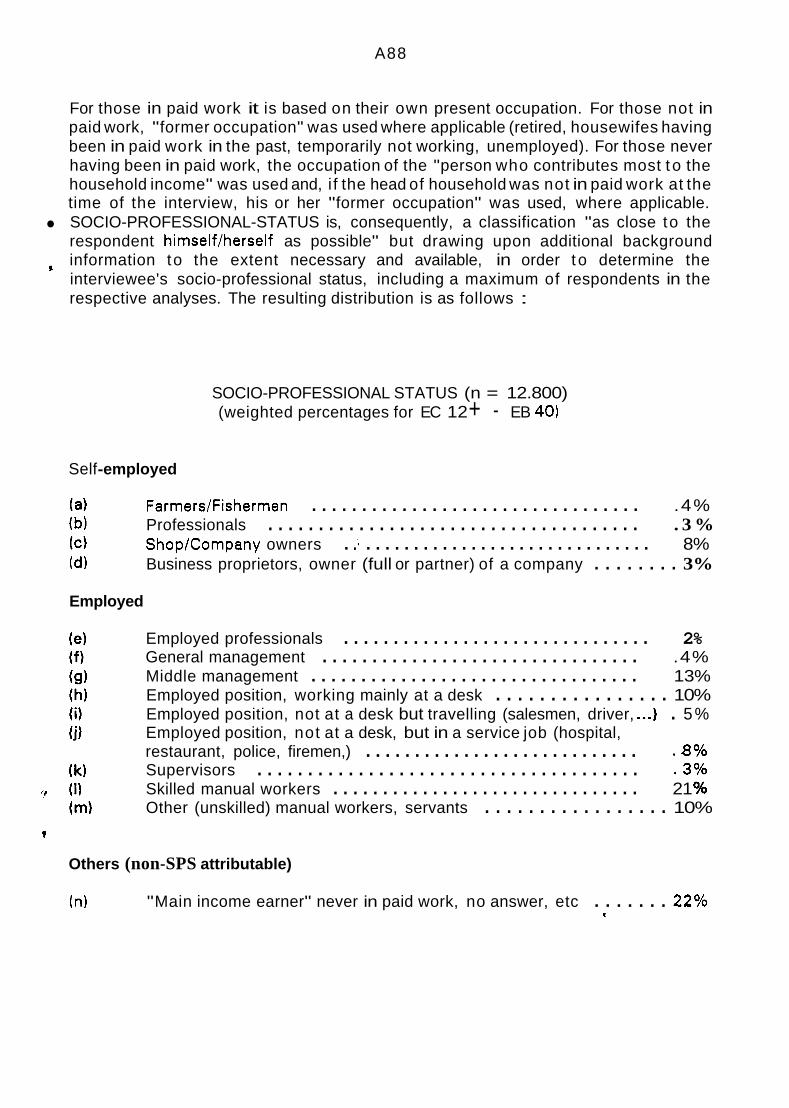
A88
For those in paid work it is based on their own present occupation. For those not in paid work, "former occupation" was used where applicable (retired, housewifes having been in paid work in the past, temporarily not working, unemployed). For those never having been in paid work, the occupation of the "person who contributes most t o the household income" was used and, i f the head of household was not in paid work at the time of the interview, his or her "former occupation" was used, where applicable. SOCIO-PROFESSIONAL-STATUS is, consequently, a classification "as close to the respondent himself/herself as possible" but drawing upon additional background information to the extent necessary and available, in order t o determine the interviewee's socio-professional status, including a maximum of respondents in the respective analyses. The resulting distribution is as follows :
I.
SOCIO-PROFESSIONAL STATUS (n = 12.800) (weighted percentages for EC 12 + - EB 40)
Self -employed
(a) FarmerdFishermen . . . . . . . . . . . . . . . . . . . . . . . . . . . . . . . . . .4%
( C l Shop/Company owners . .: . . . . . . . . . . . . . . . . . . . . . . . . . . . . . . 8% (d) Business proprietors, owner (full or partner) of a company . . . . . . . . 3%
(b) Professionals . . . . . . . . . . . . . . . . . . . . . . . . . . . . . . . . . . . . . . 3 %
Employed
Employed professionals . . . . . . . . . . . . . . . . . . . . . . . . . . . . . . . 2% General management . . . . . . . . . . . . . . . . . . . . . . . . . . . . . . . . .4% Middle management . . . . . . . . . . . . . . . . . . . . . . . . . . . . . . . . . 13% Employed position, working mainly at a desk . . . . . . . . . . . . . . . . 10% Employed position, not at a desk but travelling (salesmen, driver, . . . I . 5% Employed position, not at a desk, but in a service job (hospital, restaurant, police, firemen,) . . . . . . . . . . . . . . . . . . . . . . . . . . . . .8%
Skilled manual workers . . . . . . . . . . . . . . . . . . . . . . . . . . . . . . . 21 % Other (unskilled) manual workers, servants . . . . . . . . . . . . . . . . . 10%
Supervisors . . . . . . . . . . . . . . . . . . . . . . . . . . . . . . . . . . . . . . .3Oh
Others (non-SPS attributable)
(n) "Main income earner" never in paid work, no answer, etc . . . . . . . 2 2 O h e
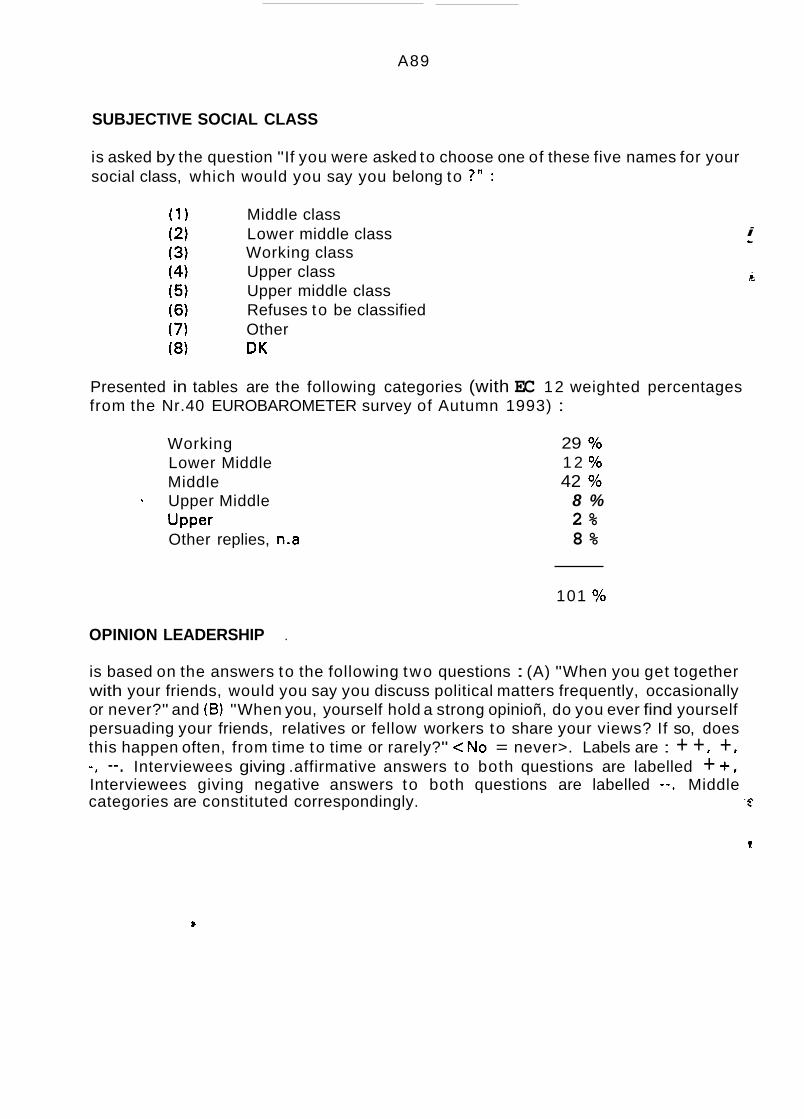
A89
SUBJECTIVE SOCIAL CLASS
is asked by the question "If you were asked to choose one of these five names for your social class, which would you say you belong to ?" :
Middle class Lower middle class Working class Upper class Upper middle class Refuses to be classified Other DK
Presented in tables are the following categories (with EC 12 weighted percentages from the Nr.40 EUROBAROMETER survey of Autumn 1993) :
i L-
n
Working Lower Middle Middle
b Upper Middle Upper Other replies, n.a
29 % 1 2 % 42 %
8 % 2 % 8 %
101 %
OPINION LEADERSHIP .
is based on the answers to the following two questions : (A) "When you get together with your friends, would you say you discuss political matters frequently, occasionally or never?" and (B) "When you, yourself hold a strong opinioñ, do you ever find yourself persuading your friends, relatives or fellow workers to share your views? If so, does this happen often, from time to time or rarely?" <No = never>. Labels are : + + r + r -, --. Interviewees giving .affirmative answers to both questions are labelled + +, Interviewees giving negative answers to both questions are labelled --. Middle
, - categories are constituted correspondingly. c
t
8

A90
EUROPEAN PARLIAMENTARY PARTY PREFERENCE
is based upon the question "If there were a General Election tomorrow (say if contact under 18 : and you had a vote), which party would you support ?" in each country in the wording usually used for this topic. Answers are grouped according t o the affiliation of the representatives of the respective party t o a group in the European Parliament. If a party is not represented in the Eu,ropean Parliament at the t ime the survey is carried out but had been represented before, it's supporters are grouped with the EP group their party had been affiliated with. Supporters of pahies represented in the European Parliament but their Members of the European Parliament not being affiliated t o any group are labelled N.I. Supporters of parties not represented in the European Parliament are labelled "other". Labels are presented in the order in which they figure in the "List of Members" of the European Parliament of October 1989. Abbreviations in tables are also taken from this publication :
f
S PPE LDR V GU€ RDE DR CG ARC NI
Socialist Group Group of the European People's Party (Christian Democratic Group) Liberal and Democratic Reformist Group Green Group Group for the European Unitarian Left Group of the European Renewal and Democratic Alliance Group Technical of the Right Left Un ity Rainbow Group Non-attached
Weighted EC - average proportion of persons not indicating a party choice ("would not vote", "spoil one's ballot", "do not answer" or "don't know") is 35 YO. Consequently among those who do reply, loyal and regular supporters of the respective parties tend to be over represented.
MEDIA USE
is based upon answers t o the following question : "About h o w often do you ...
......... watch the news on television ? read the news in the daily papers ? listen t o news broadcasts on the radio ?
.........
......... a
Everyday, several times a week, once or twice a week, less often, never ?" 9
+ + + .........
+ + News on TV/ radio/ papers every day or several times a
Two media everyday or several times a week; the third
One of the three media everyday or several times a week;
week
medium, not more than once or twice a week
the t w o others, not more than once or twice a week The three media no more than once or twice a week
......... -- ......... _-- .........

A9 1
L e f t
TYPOLOGY OF EUROPEAN ATTITUDES
1 2 3 4 5 6 7 8 9 10 R i g h t
is based upon answers to the following questions :
(1) Generally speaking, do you think that (your country's) membership of the European Community is : good thing; Bad thing; Neither good nor bad ? ( = MEM BE RSH I P)
In general, are you for or against efforts being made to unify Western Europe ? For, very much; for, to some extent; against, to some extent; against, very much 8
( = UNIFICATION)
e U
(2)
Positive attitudes = Membership: "good" + Unification: "for, very much"
"for, to some extent"
Ambivalent attitudes = Membership: "neither good nor bad" "bad" No answer
"for, to some extent" + Unification: "for, very much"
or Membership: " good '* "neither good nor bad" No answer "against, to some extent" "against, very much"
+ Unification:
or , Membership: No answer + Unification: No answer
Negative attitudes = Membership: "bad" + Unification: "against, to some extent"
"against, very much"
SELF-PLACEMENT ON THE LEFT-RIGHT-SCALE
is based upon answers to the question "In political matters, people talk of the "left" and the "right". How would you place your views on this scale ? (Show card (Do not .E; prompt). The 1 O Boxes of the card are numbered. Ring choice. If contact hesitates, ask him to try again) 5
In this report, those who reply are grouped in tertiles of the one third of respondents placing themselves most left, the one third most right, and the centre third, for each country. The usual weighting according to each country's population aged 15 and more is applied.

A92
EUROPEAN SOCIAL GRADE (ESOMAR 7-POINT SCALE)
is based on the recommendation of the European Society for Opinion and Marketing Research (ESOMAR) to harmonise the measurement of social grade across borders. This approach uses three different types of input variables (Occupation of the Main Income Earner, Education level of the Main Income Earner and Household purchase power operationalized as ownership of selected Durables). The combination of these input variables results in a new social grade classification with, as categories, (upper to lower) A, B, Cr D, E l , E2, E3.
6
3
InDut variable 1 : OccuDation of the Main Income Earner is based on a classification into 16 groups (E. 1 to E. 16) of the occupation of the Main Income Earner:
- E. l General management, director or top management/6 empl or + - E.2 Self employed professional - E.3 Employed professional - E.4 General management, director or top management/5 empl or - - E.5 Middle management, other management/6 empl or + - E.6 Middle management, other management/5 empl or - - E.7 Business proprietors, owner (full/partner) of company AND owner of a shop,
craftsmen, other self employed persod6 empl or + - E.8 Employed position, working mainly a t a desk - E.9 Business proprietors, owner (full/partner) of company/5 empl or - - E.10 Student - E.11 Employed position, not at a desk but travelling or in a service job - E.12 Farmer & Fisherman - E. 13 Responsible for ordinary shopping and looking after the home, housewife - E. 1 4 Supervisor & skilled manual worker - E. 1 5 Other (unskilled) manual worker, servant - E. 16 Retired or unable to work through illness, unemployed or temporarily not
working
InDut variable 2: Education level of the Main Income Earner is based on a classification, into 6 groups of education level (adjusting the finishing age of general education in accordance with extra general education or specific apprenticeship and/or professional training):
. -1. up to 1 4 years -2. 15 - 1 6 years -3. 17 - 18 years -4. 19 - 20 years -5. 21 - 24 years -6. 25 years and over

- A93
E l +E4 E2 + E6
Imut variable 3: Household OwnershiD of selected Durables is based on ownership in terms of number of products owned measured) :
(list of products
E3 + E5 E7 + E8 E l 1 E l 4 E l 2 + E6
a colour TV set, a video recorder, a video camera, a radio-clock, a PC/home computer, a still camera, an electric drill, an electric deep fat fryer, 2 or more cars, . a second home or a holiday home/flat,
A A
A A
Combination of input variables :
B B C D D
B C C D D 1
On the basis of all active MIE:
Education: Occupation of MIE:
C C C
17-20
15-1 6
13-
D E l E l E3
C D D D E l E2 E3
D * D D I E2 E2 I E3 E3
4 3 2
On the basis of all non active MIE (E10 + E13 + E16):
1 O
Number of products owned: Education :
21 + A A B C C D A 9 I 17-20 A B B
15-1 6 C C C
1 4 c , C D
D D
I
D D D
E l E l E2
E l E2 E3
E2 E3 E3

A94
RESPONDENT OCCUPATION SCALE
is based on a combination/selection of the current respondent occupation variables:
1. Self employed = Farmer + Fisherman + Professional (lawyer, medical practitioner, accountant, architect, ...I + Owner of a shop, craftsmen, other self employed person + Business proprietors, owner (full or partner) of a company i
2. Managers Y = Employed professional (employed doctor, lawyer, accountant, architect) +
General management, director or top management (managing directors, director general, other director) + Middle management, other management (department head, junior manager, teacher, technician)
3. Other white collars = Employed position, working mainly at a desk + Employed position, not at a desk but travelling (salesmen, driver, ... )
4. Manual Workers = Employed position, not at a desk, but in a service job (hospital, restaurant, police, fireman, *...) + Supervisor + Skilled manual worker + Other (unskilled) manual worker, servant
5. House persons = Responsible for ordinary shopping and looking after the home, or without any current occupation, not working
6. Unemployed = Unemployed or temporarily not working.