standard chartered leading the way in asia, africa …standard chartered annual report and accounts...
TRANSCRIPT

Stand
ard C
hartered A
nnual Report and A
ccounts 2004
ered.com
ds
ingugh
– theandard
of eye
rence.
ct:
35153 StanChart R&A 2004 C copy 8/3/05 10:01 AM Page 1
Annual Report and Accounts 2004
Leading the way in Asia, Africa and the Middle East
DesignRare C
Printedon totawhich post cfrom mbiodegThis do
35153 StanChart R&A 2004 C copy 8/3/05 9:59 AM Page 2
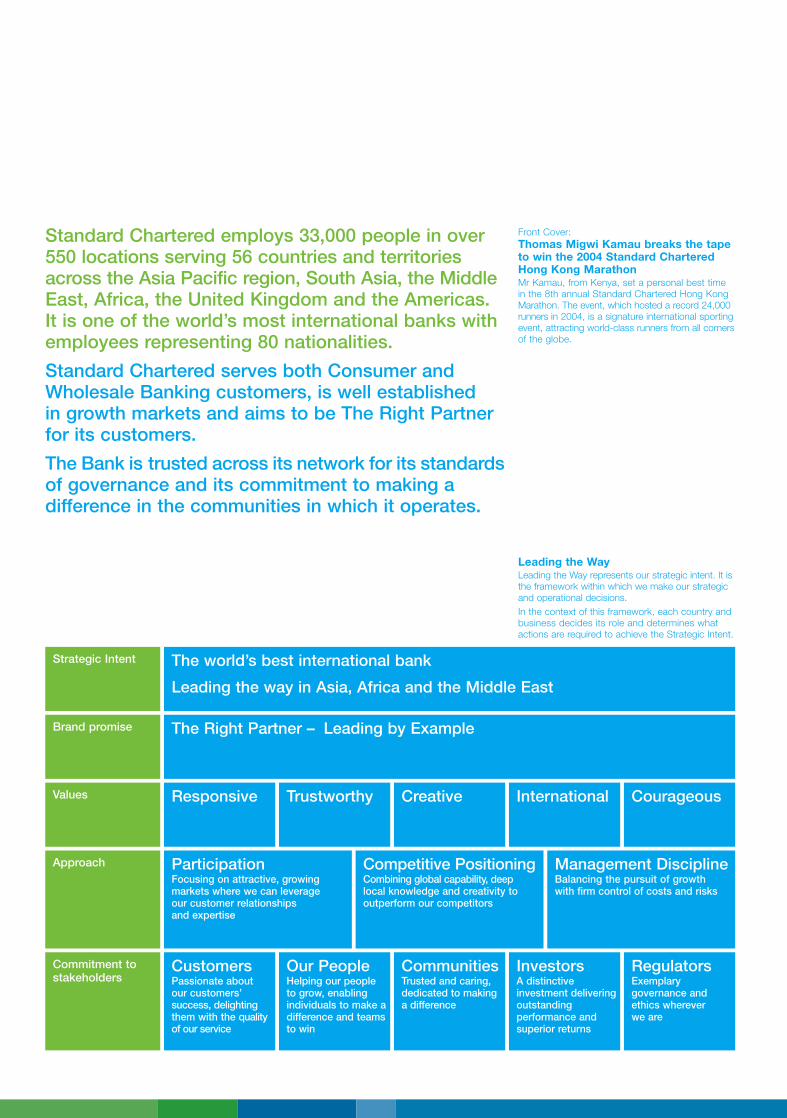
Standard Chartered employs 33,000 people in over 550 locations serving 56 countries and territories across the Asia Pacific region, South Asia, the Middle East, Africa, the United Kingdom and the Americas. It is one of the world’s most international banks with employees representing 80 nationalities.
Standard Chartered serves both Consumer and Wholesale Banking customers, is well established in growth markets and aims to be The Right Partner for its customers.
The Bank is trusted across its network for its standards of governance and its commitment to making a difference in the communities in which it operates.
Front Cover: Thomas Migwi Kamau breaks the tape to win the 2004 Standard Chartered Hong Kong Marathon Mr Kamau, from Kenya, set a personal best time in the 8th annual Standard Chartered Hong Kong Marathon. The event, which hosted a record 24,000 runners in 2004, is a signature international sporting event, attracting world-class runners from all corners of the globe.
Leading the Way Leading the Way represents our strategic intent. It is the framework within which we make our strategic and operational decisions. In the context of this framework, each country and business decides its role and determines what actions are required to achieve the Strategic Intent.
Strategic Intent The world’s best international bank
Leading the way in Asia, Africa and the Middle East
The Right Partner – Leading by ExampleBrand promise
Values Responsive Trustworthy Creative International Courageous
Participation Focusing on attractive, growing markets where we can leverage our customer relationships and expertise
Competitive Positioning Combining global capability, deep local knowledge and creativity to outperform our competitors
Management Discipline Balancing the pursuit of growth with firm control of costs and risks
Approach
Customers Passionate about our customers’ success, delighting them with the quality of our service
Our People Helping our people to grow, enabling individuals to make a difference and teams to win
Communities Trusted and caring, dedicated to making a difference
Investors A distinctive investment delivering outstanding performance and superior returns
Regulators Exemplary governance and ethics wherever we are
Commitment to stakeholders

Strategic Highlights
A very successful year • Profit before tax up 39 per cent.
• Net revenue up 13 per cent to $5.37 billion.
• Normalised Earnings Per Share up 40 per cent.
• Normalised Return on Equity increased to 20.1 per cent.
• Expanded in key markets – China, South Korea, India and Indonesia.
Unless another currency is specified, the word ‘dollar’ or symbol ‘$’ in this document means United States dollar.
1 Strategic Highlights 2 Group at a Glance 4 Chairman’s Statement 6 Group Chief Executive’s Review
18 Our People 20 Our Approach to Corporate Responsibility 26 Financial Review 43 Senior Management 44 Board of Directors 46 Report of the Directors 48 Corporate Governance 54 Directors’ Remuneration Report 68 Directors’ Responsibility Statement 69 Independent Auditor’s Report
70 Consolidated Profit and Loss Account 71 Consolidated Balance Sheet 72 Consolidated Statement of
Total Recognised Gains and Losses 72 Note of Consolidated Historical Cost
Profits and Losses 73 Consolidated Cash Flow Statement 74 Company Balance Sheet 75 Principal Accounting Policies 77 Notes to the Accounts
121 Supplementary Financial Information 125 Principal Group Addresses 127 Shareholder Information
Balance sheet
$71.6 bn Loans and advances to customers
$70.1 bn All other assets
Profit before taxation
$2.16 bn Net revenue
$3,168 m Net interest income
$2,199 m Other revenue
Dividend per share
57.5 cents
Balance sheet Net revenue Profit before taxation Dividend per share $ billion $ million $ million Cents
70.1 2,199 2,158 57.50
04
71.6
52.0060.5
03
59.7
47.0056.054.450.4
00 01
51.9 53.0
1,550
02
57.0
41.92
00
38.11
01
1,2621,089
00 01 02 03 0401 02 03 04 Other assets Other revenue Loans and advances to customers Net interest income
02 03 04
1,381 1,505 1,476 1,772
2,680 2,900 3,063 2,968 3,168
00
1,409
Annual Report and Accounts 2004 Standard Chartered 1

2 Standard Chartered Annual Report and Accounts 2004
Africa
00 01 02 03 04
209 224 195
273
366
159 131 137 170
218
Wholesale Banking Consumer Banking
Middle East and South Asia (MESA)
Asia Hong Kong Standard Chartered’s business in Hong Kong delivered strong profits in 2004 and is well placed to benefit from a revival in the economy. Hong Kong is playing an increasing role as a regional hub for Greater China. We incorporated locally in July 2004 in preparation for the economic growth generated by closer integration with China’s Pearl River Delta region.
Employees Branches/offices
3,984 72 Net Revenue
$1,408 million*
Singapore Standard Chartered continues to deliver in this competitive market, where we have been named Best Retail Bank in Asia Pacific by the Asian Banker Journal for three consecutive years. We continue to invest in sales and service excellence and in our growth businesses – Small and Medium Enterprises (SME), middle market and financial institutions.
Employees Branches/offices
2,481 20 Net Revenue
$513 million 402 403 418
Wholesale Banking Consumer Banking
00 01 02 03 04
200 190 172 158 183
236 250 313 328 330
Wholesale Banking Consumer Banking
Africa continues to be an important region for the Group, benefiting in 2004 from strong commodity prices, a more favourable currency situation and economic stability. Standard Chartered led the way in Africa, winning The Banker magazine’s awards for Best Bank in Ghana, Sierra Leone, Tanzania and Zambia.
Employees Branches/offices
4,707 148 Net Revenue
$584 million
Group at a Glance Standard Chartered is one of the world’s best international banks. In all our markets we are committed to being The Right Partner to our customers, employees and the communities in which we operate.
360 1040 1013
401
954 954 836
01 02 03 0400

Annual Report and Accounts 2004 Standard Chartered 3
00 01 02 03 04
88
128 134 132
147
66 83 92 102
124
Wholesale Banking Consumer Banking
Americas and the United Kingdom
00 01 02 03 04
476
528 510 447
499
258
83 95 78 69
Wholesale Banking Consumer Banking
00 01 02 03 04
86
129 154
177
205
63 96
121 138 172
Wholesale Banking Consumer Banking
00 01 02 03 04
121 98 78 73
95
142 139 156 162 175
Wholesale Banking Consumer Banking
00 01 02 03 04
338 319 287 348
422
179 210 285
333 393
Wholesale Banking Consumer Banking
00 01 02 03 04
141
165 190
243 231
132 190 204 223
258
Wholesale Banking Consumer Banking
Other Asia Pacific 2004 was a transformational year across the Asia Pacific region. The investment in the new national Bohai Bank in China, the purchase of a controlling stake, in a consortium with PT Astra International Tbk, in PT Bank Permata Tbk in Indonesia, and most recently, the acquisition, subject to regulatory approval, of Korea First Bank, give the Bank a strong position across many key growth markets.
Employees Branches/offices
6,077 95 Net Revenue
$815 million†
India Region Standard Chartered reinforced its position as the largest international bank in India and Nepal, adding 10 branches and entering three new cities in India in 2004. The Group underlined its leadership position by transacting the first Real Time Gross Settlement with State Bank of India and the Indian subsidiary of Unilever. Standard Chartered India also supports the Group with a Global Shared Service Centre in Chennai with 3,500 employees.
Employees Branches/offices
8,769 82 Net Revenue
$466 million*
United Arab Emirates The UAE delivered excellent business performance and growth in 2004. Revenue grew 16 per cent, outperforming the market. We won the exclusive banking licence for Dragonmart – the largest Chinese commercial, economic and trade mart outside China, launched Islamic Banking and sponsored the Dubai Marathon.
Employees Branches/offices
1,001 9 Net Revenue
$271 million
Other MESA The MESA region, including Qatar, Bahrain, Pakistan and Bangladesh, delivered another strong financial performance with double-digit revenue growth and robust cost management. Investment in new products, including Corporate Finance, Structured Products, Debt Capital Markets and Islamic Banking is changing the shape of revenue streams.
Employees Branches/offices
2,193 79 Net Revenue
$377 million
In these sophisticated markets, the Bank focuses on serving clients with needs in Asia, Africa and the Middle East. Standard Chartered New York has one of the largest US Dollar Clearing businesses in the USA. In 2004, the Bank was named Best Trade Bank in the UK by Global Finance magazine. The UK is the Head Office location for Group functions, providing governance and regulatory standards across the network.
Employees Branches/offices
1,634 17 Net Revenue
$663 million*
Malaysia Standard Chartered Malaysia recorded strong growth in 2004. In 2005, we will increase penetration into the middle market, SME and consumer finance sectors, grow Islamic Banking and complete preparations for the anticipated liberalisation of the Malaysian financial sector. Malaysia also supports the Group with a Global Shared Service Centre in Kuala Lumpur with 1,000 employees.
Employees Branches/offices
2,476 30 Net Revenue
$270 million
*includes one-off items from corporate activity (see page 26).
†excludes Korea First Bank.
This region also includes our offices in Jersey, the Falkland Islands and Turkey.

Chairman’s Statement I am delighted to be reporting on another successful year for Standard Chartered. We have demonstrated our ability to achieve good revenue growth and continue our strong profit momentum. At the same time, we have achieved a number of significant acquisitions and alliances that will enable us to expand in key markets and products.
Profit before tax up 39 per cent to $2,158 million
Net revenue increased to $5,367 million, up 13 per cent
Normalised Earnings Per Share
In addition, the incorporation of our business in Hong Kong will enable us to take advantage of the Closer Economic Partnership Agreement with China. This will open up further opportunities for us in the Pearl River Delta region.
2004 results Our primary focus is on performance. We have continued to build on our track record.
We have seen improvement in all our key financial metrics. There has been broad based revenue growth in almost all our geographies and our bad debt performance has been excellent. Profit before tax is up 39 per cent, supported by revenue growth of 13 per cent. Our profits have nearly doubled in three years. We have again achieved excellent earnings per share growth of 40 per cent and we have achieved our return on equity goal of 20 per cent, both on a normalised basis.
As a result of 2004’s performance, the Board is recommending a dividend of 57.5 cents.
Positioned for growth We are confident that this broad and balanced growth is sustainable. We are well positioned for growth in the future having achieved a number of strategic goals.
Last year, we acknowledged that there were a number of markets and product sectors where we needed to build a bigger presence.
4
at 125.9 cents, up 40 per cent
Normalised Return on Equity increased to 20.1 per cent
Recommended final dividend per share up 10.6 per cent to 40.44 cents, making 57.5 cents for the year

In 2004, we added a number of acquisitions and alliances complementing our organic growth. Most recently, we entered into an agreement to acquire Korea First Bank for approximately Korean Won (KRW) 3.4 trillion ($3.3 billion), which we have financed with a placing of Standard Chartered PLC ordinary shares for approximately GBP 1.1 billion ($2 billion) together with other funding resources. This acquisition is still subject to regulatory approval. However, it is very clear that this will be a new engine of earnings growth for the Group.
We will be a partner in Bohai Bank, a unique opportunity to start a new national bank in China. Through a consortium with PT Astra International Tbk, we also acquired a controlling interest in PT Bank Permata Tbk, Indonesia’s sixth largest bank.
Completing the transfer of the ANZ project finance team will deepen our Wholesale Banking expertise, while PrimeCredit in Hong Kong gives us access to the consumer banking sub-prime sector.
Each of these will give us competitive advantage in our chosen markets.
Corporate Governance We believe good governance and good performance reinforce each other. In the past year there has been an intensified focus on regulation in the financial services industry and we are working even more closely with our regulators around the world.
I have also placed great importance on reinforcing our Board strength. During 2004, we announced the appointments of three new high-calibre non-executive directors: Jamie Dundas, Oliver Stocken and Val Gooding. Their appointments extend the skills base of the Board and add further to its existing diversity.
We have a Board which provides a good balance of support and challenge to the Group’s senior management.
Jamie Dundas has an outstanding record in areas relevant to Standard Chartered, including experience in Hong Kong and a background in banking.
Former Barclays Group Finance Director, Oliver Stocken is Deputy Chairman of 3i PLC, and has wide experience as a company director.
Val Gooding, chief executive of BUPA and a non-executive director at Compass Group PLC, brings marketing and brand expertise to the Group. She was previously with British Airways, her final role being Director, Asia Pacific.
I would like to thank Lord Stewartby, Sir Ralph Robins and David Moir who retired from the Board in 2004. Lord Stewartby left after 14 years of service to the Group, most recently as non-executive Deputy Chairman, the Senior Independent Director and the Chairman of the Audit and Risk Committee.
Sir Ralph had over 15 years of service on our Board. David was with Standard Chartered for 46 years and made an invaluable contribution, including as Chairman and Director of Standard Chartered Nakornthon Bank in Thailand and Deputy Chairman and Director of Standard Chartered Bank Malaysia Berhad.
I would like to thank them all for the tremendous guidance and support they have given.
Corporate Responsibility 2004 ended on a tragic note for the world when the Asian Tsunami struck. We operate in five of the countries most affected by the Tsunami. Sadly, two of our employees were lost in the Tsunami and a number of our employees have lost family members.
I am proud of the way our employees responded to this crisis. Employees have donated over $450,000. Because of the scale of this disaster, Standard Chartered has made an initial corporate donation of $5 million to relief funds.
We are also making good progress with our Seeing is Believing campaign and so far have achieved 20 per cent of our target of raising funds for one million sight restorations. We are also actively promoting our Living with HIV programme, to raise awareness of HIV/AIDS.
However, corporate responsibility is about more than community support. We have established a Corporate Responsibility and Community Committee, which I chair. This Committee works to align business strategy with the corporate responsibility aspirations of the Group. Our approach to corporate responsibility has become an integral part of our values as a company.
In summary 2004 has been a year of significant progress. We have built on our track record of performance, establishing good growth momentum. We have achieved a number of strategic goals. As a result, we are now a stronger bank with a more diversified earnings base.
Bryan Sanderson, CBE
Chairman 16 February 2005
Annual Report and Accounts 2004 Standard Chartered 5

Group Chief Executive’s Review 2004 has been an excellent year for the Group. We have momentum and scale in our markets and we are delighted with the strategic progress we have made.
Our 2005 priorities
Expand Consumer Banking customer segments and products
Continue Wholesale Banking transformation
Integrate Korea First Bank and deliver growth
Accelerate growth in India and China
Deliver further technology benefits
Embed Outserve into our culture
Over the last three years, we have pursued a focused agenda.
We set ourselves ambitious performance goals and have consistently delivered against them. We have strengthened the infrastructure and technology of the Bank; we have developed a robust risk management capability; we are reinvigorating our brand; we have increased staff engagement and deepened our talent pool. Our organic, broad based growth has given us the shareholder support and confidence to make acquisitions and alliances.
I would like to take this opportunity to thank our employees for their tremendous efforts over the past three years which are turning Standard Chartered into a high performance organisation.
During 2004, we delivered a balanced scorecard of growth and performance. Profit before tax was $2,158 million, a 39 per cent increase from $1,550 million in 2003. Return on equity rose from 15.7 per cent to 20.1 per cent. Cost-income ratio improved to 53.5 per cent. Earnings per share saw an increase from 90.1 cents to 125.9 cents. All these figures are on a normalised basis.
For the first time, both our Wholesale and Consumer Banking businesses produced more than $1 billion each in operating profit before tax.
We are in dynamic markets and at the core of our strategy is organic growth. We will supplement this organic growth with selective acquisitions and alliances that extend our customer or geographic reach or broaden our product range.
Looking to the year ahead, our industry faces a number of challenges: rising sophistication and regionalisation of local banks; new entrants including non-bank financial institutions; margin compression in many of our markets; increasingly demanding regulatory requirements; sophisticated customers demanding more for less; the risk of a major disruption from an unexpected event; and an unrelenting war for talent. Like all international businesses, retaining and attracting the best people in a highly competitive industry is always a challenge. Companies have to invest heavily in recruiting and developing the right talent.
Many of these challenges are not new. What is different today is the pace and intensity of change.
To compete successfully and grow, we need to be able to anticipate and react quickly to changes. We have to accept that different markets are at different stages of development so we need different strategies for them.
We have been disciplined on costs and processes, and innovative on products. We are standardising our technology platforms and we are absolutely focused on customer service. This enables us to be more nimble and able to anticipate and respond to the changing industry environment.
2005 priorities Our strategic intent is to be the world’s best international bank – leading the way in Asia, Africa and the Middle East. Our top priorities for 2005 are set out on this page.
6 Standard Chartered Annual Report and Accounts 2004

Consumer Banking Consumer Banking is a business on the move, getting more innovative every year. It continues to grow its revenue base on the back of both good asset growth outside Hong Kong and an increase in non-interest income from our wealth management business. Consumer Banking also benefited from a faster than anticipated reduction in personal bankruptcies in Hong Kong.
Operating profit increased by 42 per cent and we achieved revenue growth of eight per cent.
There was strong performance in many markets, reflecting our increasingly broadly based geographic and product mix. Our challenge is to invest at the right pace in growing markets and, at the same time, increase productivity and innovation in our more mature markets like Singapore and Hong Kong.
We are seeing returns on our investments in product capability, network expansion and systems. For example, our Consumer Banking business in the Middle East and South Asia (MESA) region enjoyed revenue growth of 23 per cent in 2004, following significant investment in the second half of 2003.
Innovative products have also set us apart from the competition in many of our markets. A good example is Manhattan Card. Manhattan is the first credit card in India and Singapore to have risk-based pricing. It is an example of customer segmentation driving product innovation. With our recent launch in three cities in India, we now have approximately 120,000 cards in issue outside of Hong Kong, and 620,000 in Hong Kong. We will launch Manhattan in three more cities in India in 2005.
7

Group Chief Executive’s Review
What we have achieved We took the first steps in our Outserve customer service initiative in 2004. In a competitive environment where the customer is king, outstanding service will be a key differentiator for us.
Our challenges We have already made progress in improving our customer loyalty scores. However, high service standards need to become part of our daily routine, with processes and technology aligned to support this.
MortgageOne is another example. This business grew over 50 per cent in Hong Kong and accounts for 80 per cent of new mortgage sales in Malaysia.
Innovation in channels is also proving an important contributor to growth and we will continue to offer new and original ideas and approaches across all our markets.
Looking ahead, we will increase customer segmentation to grow key segments such as youth and the international banking sector. We will increase the size of our Small and Medium Enterprises (SME) business. Our Priority Banking offering will be expanded in our key markets and we will be looking at opportunities to extend the reach of our consumer finance business across Asia following our acquisition of PrimeCredit in Hong Kong.
Wholesale Banking In 2004, our Wholesale Banking business enjoyed a year of robust revenue performance. We have executed well on the strategy we laid out a few years ago and delivered on our promises.
Overall operating profit for Wholesale Banking is up by 28 per cent. We have grown revenues by 14 per cent and, significantly, customer revenues by 19 per cent.
Disciplined investments in key sales and control functions have delivered good results across all geographies, products and all four of our customer segments. We have deepened our customer relationships and are now a top three bank to 25 per cent of our customers.
However, there is still room to further improve cross-sell ratios and strengthen our product capabilities. The acquisition of the ANZ project finance portfolio is one example of how we are doing this.
The emergence of China and India as economic powerhouses is changing the dynamics of trade, and new trade corridors are opening, particularly between our markets.
Our acquisition of Sumitomo Mitsui Banking Corporation’s business in India gives us a strong position in the trade corridor between Japan and India, and our network in the Middle East and Africa will also prove important in giving us leverage as trade corridors change.
Ongoing initiatives and integration of our acquisitions will greatly benefit our Wholesale Banking business, adding to the many opportunities we see to continue to grow revenues, which we will do within our usual jaws discipline alongside paced capital growth.
8
Mike DeNoma Group Executive Director, Consumer Banking
Mike Rees Director of Standard Chartered Bank and Chief Executive Officer, Wholesale Bank

Price Solutions direct to customers Our direct selling Price Solutions business now We are passionate about distributes a wide range of Standard Chartered’s consumer banking products in Malaysia, using teams of telesales and field employees as well asour customers’ success. roadshows. In July, we opened Malaysia’s first financial services kiosk in a popular Kuala Lumpur shopping mall. After registering 1,000 enquiries on It is our job to make sure the first day, we are planning to open similar kiosks in other retail centres. From an initial team of 23, selling across the country, we now employ overthey are always happy with 700 people in our Price Solutions team.
the quality of our service, no matter where they are.
Big brands team up for co-branded cards We are the top credit card company in Jordan with 50 per cent of the market. A link-up with mobile phone company Fastlink in 2004 put us in a different league from other banks in the region. Our co-branded card, the country’s first pre-approved credit card, is open to Fastlink’s one million customers – the biggest pool of mobile phone users in Jordan. This gives us unparalleled access to a database of potential customers. This deal was replicated in Thailand with communications company DTAC.
Lions roar approval for Shatin Plaza A pair of Chinese lions, the symbol of luck and prosperity in Hong Kong, blessed the opening of our new flagship branch in Shatin Plaza. Our Priority Banking Centre opened in March and will deal specifically with Standard Chartered’s customers in the region, offering a range of dedicated services. The lions toured the building to bestow good luck on our business.

Group Chief Executive’s Review
Korea First Bank Our recent acquisition of Korea First Bank, subject to regulatory approval, is the biggest in the history of Standard Chartered. We will execute it well and build our presence in Korea, expanding our reach in Asia.
The scale of opportunities in Korea is tremendous. It is the world’s tenth largest economy, Asia’s third largest, and its economy is expected to grow by four per cent in 2005. Korea’s banking sector generates a revenue pool over three times the size of Hong Kong.
Korea First Bank is the seventh largest banking group in Korea by assets, with a market share of approximately six per cent and over three million retail customers. It has one of the lowest levels of non-performing loans in the industry.
We have appointed an experienced integration team in Korea. We are building relations with the regulators, labour unions, the local community and the staff of Korea First Bank. These are important relationships to us.
Retaining key management talent is also very important and we are pleased with the quality of senior management in Korea First Bank.
Full year results for Korea First Bank will be announced in March. We will give more details on our progress with Korea First Bank in our interim report, following completion of this acquisition.
Gareth Bullock
Korea First Bank Consumer Banking Korea First Bank has the country’s fifth largest distribution network. It has over 400 branches located throughout the country and 2,100 ATMs. In a country with 60 per cent internet penetration, it has a user-friendly internet banking platform, and a strong mobile banking business.
An example of one opportunity is our personal loan product, which can be introduced to Korea First Bank.
Our success in personal loans has been due to excellent customer segmentation, good credit quality, driven off credit bureau data and innovative distribution channels.
Matched with our strong credit scoring system and our tested instalment loan product, we have grown personal loans at Standard Chartered Korea into an almost $200 million business, in just one year. Korea First Bank’s own instalment loan business is relatively small and we have built our business from just one branch. We see good potential in distributing this through Korea First Bank’s branch network.
Peter Sands Group Executive Director, Finance and Strategy
What we have achieved Our share price performed well in 2004. Our geographic reach into some of the world’s fastest-growing economies, such as China and India, makes us a distinctive investment proposition.
Our challenges Increasing value for shareholders and growing earnings per share is a top priority for Standard Chartered. We will do this by continuing to grow organically, by making disciplined acquisitions that complement our existing businesses, and by constantly striving to be The Right Partner to our customers, our employees and the communities in which we operate.
Director of Standard Chartered Bank and Group Head, Strategy
10 Standard Chartered Annual Report and Accounts 2004

Growing opportunities in UAE This year we were one of the first global banks to be Investors help us grow granted a commercial banking licence by the Dubai International Financial Centre (DIFC), giving us good opportunities to grow our business in the United our business. Arab Emirates – our fourth largest market. The DIFC provides an on-shore capital market, creating a world-class banking infrastructure in the United Arab We believe our distinctive Emirates. We are proud to support it.
offering delivers outstanding performance and superior returns.
Hong Kong issues sub-debt The issue of subordinated debt by Standard Chartered Bank (Hong Kong) Limited was not only a first for Standard Chartered Hong Kong, but also the first Hong Kong Dollar subordinated debt to be issued in the local market. As such this represents a breakthrough both for Standard Chartered and the local bond market.
A winning start to 2005 Standard Chartered’s acquisition of Korea First Bank is the largest in our history. It was an excellent start to 2005. The acquisition, which is subject to regulatory approval, was partly financed with proceeds from the placing of approximately ten per cent of our issued ordinary share capital. The placement was oversubscribed, testimony to strong support for the Bank. Through this exciting addition to our network, we aim to lead the way in Korea, building on innovative approaches such as the ‘Moving Partner’ bus shown above right, which we use to educate customers about financial products.
Annual Report and Accounts 2004 Standard Chartered 11

Group Chief Executive’s Review
What we have achieved We make a difference to communities through corporate activity and the involvement of employees. We exceeded our initial funding target for Seeing is Believing, and have a new goal – to raise enough money for one million sight restorations over the next three years.
Our challenges We are committed to helping developing countries through our products and services. Empowering underdeveloped communities through business loans, product advice and support will be key business and Corporate Responsibility goals for Standard Chartered in 2005.
Korea First Bank Wholesale Banking Standard Chartered will build a leading Wholesale Banking franchise in Korea by leveraging our international network, product capability and management processes, as well as Korea First Bank’s customer base.
One example of a growth opportunity is fee based income. At Korea First Bank, non-interest income represents less than 25 per cent of total revenues – at Standard Chartered this is over 40 per cent.
Building a trade and cash management business will be a key priority – we can leverage our international network and products to generate new fee income.
In parallel, we will strengthen Korea First Bank’s Global Markets product capability, developing the necessary infrastructure as well as training for staff.
We see good opportunities in foreign exchange and derivatives as well as in debt capital markets.
It is clear there are significant revenue opportunities and the combination of our expertise with that of Korea First Bank will help realise the opportunities we see in the market. We are now even more confident that this acquisition will be earnings per share accretive in 2006.
India and China India and China are our two biggest long-term opportunities. We are well on track in both these markets.
With ten new branches, taking our total network to 75 branches in 27 cities, we are the largest international bank in India. We have focused on growing our distribution network and asset base, as well as broadening revenue streams. As a result, we have strong market share in mortgages, credit cards, wealth management, fixed income and trade finance in India.
We are investing heavily in India because we see the scale of the opportunity. Our focus on growing our customer base and expanding revenue may slow the pace of operating profit growth in the short term, but it will put us in a strong position to benefit in the medium term. There is no doubt that we can build on our position as the leading international bank in India.
In China, our strategy has three strands: organic growth, strategic investments and taking advantage of opportunities in the Pearl River Delta.
12
Tim Miller Director of Standard Chartered Bank and Group Head, Human Resources
Chris Keljik Group Executive Director, Africa, Middle East and South Asia, UK and the Americas

‘I See, Eye Sea’ success Seeing is Believing took centre stage in Hong Kong Working with communities in 2004. We asked thousands of schoolchildren to help create a stunning exhibition called ‘I See, Eye Sea’. The children decorated over 20,000 transparent is a key priority. plastic eye-shapes, which were exhibited in Hong Kong’s largest shopping mall and at several of our branches. Overall, we raised $45,000. Standard Chartered is
trusted within our territories, and we are dedicated to making a difference.
Getting the message across Employees in India boosted awareness of HIV/AIDS through our Living with HIV programme. A major challenge was to reach out to the young population working in Chennai’s buzzing IT sector. We developed a campaign, with the Confederation of Indian Industry, offering training to
Playing to win specially selected champions. It has This year we proved that banking doesn’t always been so successful, we will run similar have to be serious when we sponsored the schemes across other Indian regions. Monopoly World Championships in Japan. The tournament pitted 38 national champions of the game against each other in a two-day battle. Naturally, Standard Chartered was the banker, with one of our employees, Yumiko Suzaki, presiding over the cash register in the final, won by Spain’s Antonio Zafra Fernandez.
Annual Report and Accounts 2004 Standard Chartered 13

Group Chief Executive’s Review
We are growing revenues at over 30 per cent per annum and we have strengthened our network with additional Renminbi (RMB) licences in Xiamen, Beijing and Nanjing. We now have five RMB licences which allow us to conduct RMB business with local corporates in 13 cities.
We have also added a branch licence in Guangzhou. Our ambition is to remain a leading bank in China.
In parallel with this organic growth, we have signed a framework agreement to take a 19.99 per cent stake in Bohai Bank – the first bank with a national licence for many years. This will be the first time that a foreign bank has been allowed to participate and take a management role in the establishment of a national bank.
Bohai Bank will be able to open branches and sell products throughout China and we will be a significant part of this exciting new bank.
When we mention our business in China we have to include Hong Kong, which is now very much a regional hub, integral to developing opportunities in China.
We have seen a good performance in Hong Kong and the outlook for the economy is good. Overall, consumer confidence is being restored. We are seeing inflation for the first time in many years, and unemployment is down. A rise in tourism, with 21 million visitors in 2004, and more than 24 million expected in 2005, will continue to help the economy.
But margin compression is increasing, and loan demand is not growing as fast as the economy. We are focusing on productivity to ensure we have the capacity to grow in a maturing market. We believe that our strategy in Hong Kong will pay off.
Delivering technology benefits Across the industry, the key themes are data centre consolidation, security, service delivery channels for customers, and pressure to reduce telecommunications costs. We will continue our efforts to ensure we can stay ahead of changes in the industry.
Improvements in our technology platform have underpinned much of our ability to grow.
Our Global Shared Service Centres in Chennai and Kuala Lumpur continue to develop scale and efficiencies. We estimate that our Shared Service Centres have generated annual cost savings of $80 million. We have created economies of scale and tighter control has meant our technology production costs are down year-on-year. This has created capacity for increased investment in business applications and infrastructure.
What we have achieved We are industry leaders in our markets in regulatory and governance issues. Our policies ensure we are in line with international regulatory bodies. In 2004 we co-hosted the International Credit Bureau Conference in Seoul alongside the Korean Ministry of Finance.
Our challenges In an environment where there is heightened awareness of regulatory issues, we must continually educate employees at every level about their role, and ensure that they are fully engaged in our Know Your Customer programme.
Kai Nargolwala Group Executive Director, Asia and Chairman, Wholesale Bank
Richard Meddings Group Executive Director, Risk and Compliance
14 Standard Chartered Annual Report and Accounts 2004

Good business means playing by the rules. We work with regulators to ensure Standard Chartered shows exemplary governance in every part of our business.
Building on our success in Asia Standard Chartered celebrated its ongoing partnership with Malaysia at the grand opening of our new corporate office in Kuala Lumpur. Malaysia’s Prime Minister Abdullah Ahmad Badawi officiated at the ceremony. An integral part of the country’s community since 1875, Standard Chartered is one of the leading participants in its banking sector, with 30 branches nationwide and over 2,400 employees.
Standard Chartered first off the mark with Shariah banking This year Standard Chartered became the first international bank to offer Islamic Banking services in Pakistan, working with an independent Shariah Supervisory Committee. Our range of current accounts, auto finance and mortgages is proving popular – next up is a range of corporate banking products for launch in 2005.
Standard Chartered – a catalyst for debate We take pride in confronting the big issues facing world finance and banking, and in 2004 partnered Korea’s Ministry of Finance at a conference focusing on international credit bureau standards. With top speakers, such as Deputy Prime Minister, the Honourable Lee Hun-Jai, over 350 bankers, regulators and credit bureau experts from 40 countries attended this timely event.

Group Chief Executive’s Review
What we have achieved We have a rich pool of talented employees working in many different territories globally. In 2004, we set up our Diversity Council to drive our diversity and inclusion agenda to leverage high performance. We also held our first Women’s Executive Forum last year.
Our challenges We need to ensure that the diversity of our employees is reflected in our most senior management. We are working hard to ensure talented individuals are supported and developed as they train to become the leaders of the future.
The stability and efficiency of our operations have been enhanced. Moving forward, we will continue to emphasise standardising technology as we migrate to a lower cost and modern core banking platform globally.
We have completed our Know Your Customer roll out and we have migrated our platforms to meet changing reporting requirements under International Financial Reporting Standards.
Outserve In line with our brand promise to be The Right Partner, we believe that service will be a differentiator for us in an increasingly competitive banking industry.
To this end, we began a series of internal initiatives in 2004 to build our service culture and processes. We call these initiatives Outserve and we believe it will have a profound impact on our shareholder value.
Outserve comprises four components: the voice of the customer, process improvements, metrics and measurements, change management and communication.
We have taken the best methodologies on Voice of Customer, and developed an improved model tailored to our industry and market needs.
Our service metrics include over 100 indicators to monitor every aspect of the customer experience.
We are managing culture change, and improving the way we communicate about customers.
Our top 220 leaders in the company, including myself, are completing First Hand Days, where we experience somebody else’s job on the front line to understand service issues and remove blockages to improved service.
We are obsessive about our customer service and will use this as a source of distinction because we believe that our Outserve initiative will create revenue, reduce customer attrition and create value.
Outlook We have had a strong performance in 2004 and the revenue momentum into 2005 is good.
Both of our businesses have good growth potential and we have robust controls in place.
We continue to make progress towards our ambitious goals to be a leader in India and China. The smooth integration of Korea First Bank is a high priority.
We will continue to produce strong profit growth for our shareholders in the short term. However, we will also focus on building a long-term sustainable business.
Overall, Standard Chartered is in good health and we are optimistic about the future.
Mervyn Davies, CBE
Group Chief Executive 16 February 2005
16 Standard Chartered Annual Report and Accounts 2004

Our people define Standard Chartered. We are committed to
Greatest Race on Earth Standard Chartered’s sponsorship of The Greatest Race on Earth – four marathons spanning Nairobi, Singapore, Mumbai and Hong Kong – has brought out the best in our people. Fifteen teams of employees entered the gruelling challenge this year along with four individual entrants from Standard Chartered. One employee, Anton ‘Jackie’ Stevens, was invited to run in the Nairobi Marathon for the
helping them grow, enabling Filipino National Team.
individuals to make a difference and teams to win.
Calling to thank customers We take customer service very seriously, and as part of our global drive to Outserve our rivals, we now have service initiatives underway in every country across the network. In Kenya, we started what we call the C – or customer – Drive, whereby each of our employees called ten customers to thank them for their business.
Understanding diversity for enhanced performance Our approach to diversity and inclusion focuses on respecting individual differences to deliver higher performance. As well as establishing the Bank’s Diversity Council in 2004, we invited 50 women from around the world to our first Executive Women’s Forum. Our International Partnership Week (shown right) aimed to improve the way we do business by learning from other cultures.
Annual Report and Accounts 2004 Standard Chartered 17

Our People We are committed to attracting and developing talented people, providing the skills and resources necessary to succeed across our diverse markets, and rewarding them with competitive incentives and opportunities to maximise their potential within the Bank.
Three principles underpin our approach to managing people:
• A focus on talent management to identify, reward and retain talented employees.
• Building a strengths-based focus, providing the skills to develop individuals and teams.
• Driving employee engagement through the development of exceptional managers to identify and build talent.
Human Capital Roadmap Our approach to people management is reflected in our Human Capital Roadmap. There are five areas of focus, each supported by key people processes, which provide a consistent framework for management practices and policies.
How do we attract and retain the best talent? Harnessing our diversity through inclusion Standard Chartered employs over 33,000 people across 56 countries and territories. The workforce comprises 80 nationalities and close to half are female. We want to lead by example in building a multi-talented, diverse and representative workforce and leadership. We recognise there is more we can do to harness the differences individuals bring, enabling them to realise their full potential to deliver high performance and true competitive advantage. In 2004, a Diversity Council was established to provide a strategic, global focus to diversity and inclusion in the Bank.
Outserving our competitors Outserve represents Standard Chartered’s commitment to service excellence as a key competitive differentiator. The above image is taken from one of our Outserve posters featuring two of our Zimbabwean colleagues, in recognition of their innovative approach to delighting customers.
Identifying future leaders Our global graduate recruitment website provides a leading edge method of attracting and recruiting talented graduates. Successful applicants join a two-year International Graduate Programme, which stretches them through on-the-job learning, in-depth business training, ongoing performance coaching, and three international residential workshops.
Helping our people to make a difference We work alongside our employees to help plan their careers through our talent development programme, which includes personal development plans,
mentoring, structured learning and career development moves. For example, in 2004, Wholesale Banking moved 70 talented junior individuals into new roles, either internationally or across business units.
How are we expected to do things here? Creating winning teams through engagement We believe that providing employees with the right working environment encourages the application of their individual talents and discretionary effort. Investing in employee engagement is a key element of building the high-performance culture to drive our business forward.
HOW DO WE ATTRACT AND
RETAIN THE BEST TALENT?
HOW ARE WE EXPECTED TO
DO THINGS HERE?
HOW DO I DEVELOP MY STRENGTHS?
HOW AM I DOING?
DRIVING BUSINESS
PERFORMANCE
HOW AM I RECOGNISED
AND REWARDED?
Human Capital Programme Care Roadmap Launched in Hong Kong in 1997,
Programme Care leads the way in caring for our colleagues, families, communities and ourselves. Partnered with our Corporate Responsibility initiatives, Programme Care involves healthcare seminars, charity events in the local community and lifestyle/shopping discounts to promote work-life balance and community spirit.
18 Standard Chartered Annual Report and Accounts 2004

Num
ber
of b
ranc
hes
scor
ing
abov
em
ean
aver
age
serv
ice
qual
ity60 per cent more likely to deliver above average service quality
average service quality.
Branches with lower engagement
Business value – Hong
Num
ber
of tr
ansa
ctio
nspe
r te
ller
per
day 10%
higher
Business value – Ghana, Consumer Banking Branches with higher employee engagement delivered 10 per cent higher transactions per teller per day.
Kong, Consumer Banking Branches with higher employee engagement were 60 per cent more likely to deliver above
Branches with lower engagement Branches with higher engagement Branches with higher engagement
In 2000, we introduced Q12 – an annual tool to measure employee and team engagement. Teams use the results to discuss and develop action plans, whilst continually monitoring the follow-through. In 2004, across all 56 countries and territories, 97 per cent of employees completed the survey voluntarily – a clear indication of employee commitment to improving individual and team performance. This focus has seen the number of engaged teams treble since 2001, rising 14 per cent in 2004.
Internal research conducted in Hong Kong, India, Kenya and Ghana demonstrates the impact of higher engagement on business performance, with Consumer Banking reporting:
• Greater profit margin growth
• Higher customer satisfaction ratings
• Increased productivity
• Greater employee loyalty
• Lower employee turnover
How do I develop my strengths? Playing to our strengths A strengths-based approach lies at the core of Standard Chartered’s people development philosophy. We encourage managers to identify and develop individuals’ strengths, to help themselves and their teams to deliver sustainable performance.
Leadership and executive development Our leadership model for senior employees involves a range of development and assessment programmes. These include individual leadership plans focusing on personal contributions to our business,
The right fit To further consolidate our strengths-based approach, Consumer Banking has adopted a structured selection tool methodology. For example, pilot research in Thailand in 2004 showed that sales staff recruited using the tools typically exceeded sales targets by 32 per cent.
developing strengths, identifying learning opportunities and mentoring.
Standard Chartered also sponsors executive development programmes with leading academic institutions.
Nurturing our talent Our Organisation Learning function and One Bank curriculum help employees take responsibility for their own personal and professional development and learn consistently across our markets. The number of learning days has almost doubled since 2001.
Graduate Associates During the International Career Development Programme in Malaysia, the Graduate Associates dressed as inspirational people who have led the way through history.
How am I doing? Raising the performance bar Our performance management system provides an objective view of employee performance. This includes not only an assessment of performance against objectives but also how they were accomplished. The Bank’s values form part of the annual objective setting and appraisal process. Half-yearly appraisals and a strong emphasis on managerial coaching skills help maintain focus, expectations and clarity whilst supporting and encouraging development.
How am I recognised and rewarded? Differentiating high performance We are committed to providing compensation and benefits competitively positioned to attract, retain and motivate talented individuals. Consistent with our values, base salaries, bonus and share awards are benchmarked against our key competitors, focusing on high performing employees. Almost 40 per cent of our global workforce participate in our all-employee sharesave scheme. Core benefits such as annual leave, life cover, saving for retirement, sickness and medical benefits are provided across our businesses and geographies.
Service delivery Effective service delivery is the backbone of the Human Resources (HR) function, which aims to deliver efficient, value-added service throughout the Bank.
The Human Resources Shared Service Centre (HR SSC), based in Chennai, India, became operational in 2002. It maintains a centralised employee database and administers a range of services including payroll, retirement benefits and share schemes across the Bank. The HR SSC serves over 27,000 staff in 29 countries, 42 per cent more than in 2003. Year-on-year, the HR SSC delivers higher value services, freeing local HR to provide greater strategic support to the business. For example, our payroll team now process almost 39 per cent of the Bank’s employees, a 30 per cent increase from 2003. Considered an industry benchmark, the HR SSC is continually improving and growing.
Creating a healthy and safe place to work Our approach to ensuring a healthy and safe environment for our employees and customers is about creating the right culture. We focus on providing appropriate training and establishing risk assessment capability for our employees to manage health and safety. The launch of a specially developed system in 2005 will be the cornerstone for supporting superior health and safety performance across the Bank.
Annual Report and Accounts 2004 Standard Chartered 19

Our Approach to Corporate Responsibility Standard Chartered has a strong tradition of supporting the communities in which we operate. We understand we have a direct impact on the environment through our operations and indirectly through our business activity, and we are committed to treating our employees and customers fairly.
Making Corporate Responsibility effective is not only the right thing to do but is good for business. In 2004, we took the decision to introduce a Corporate Responsibility and Community Committee, reporting to the Board and led by our Chairman.
The Committee’s task is to ensure that our Corporate Responsibility aspirations align with our business activities. Our aim is to develop real benefits for our stakeholders, make our brand stand out and help our business grow.
We adopt a proactive approach to understanding the needs of our stakeholders. In 2004 we held the first of a series of Corporate Responsibility forums for analysts and regulators.
In October, the Bank’s Corporate Responsibility goals were shared with the chief executives of all our 56 countries and territories. They have an important leadership role to play in developing and embedding our approach and ensuring that our policies are implemented globally.
This year we also made important changes to the way we manage our health and safety programmes, the social and environmental impacts of our lending decisions and our procurement processes.
We established a Diversity Council and began to refocus our community programmes to ensure that they achieve a measurable, sustainable impact.
Serving our customers We want Standard Chartered to be renowned for excellent customer service across Asia, Africa and the Middle East.
In 2004, we launched our Outserve programme to achieve this goal. Outserve allows us to target areas where we need to improve and measure our performance in each of our markets in a consistent way, compare ourselves with competitors and enhance our processes.
We also want to build strong links with our customers through our community programmes and a number of customers are involved in our Seeing is Believing programme.
Customers trust us to operate according to our values. In 2004, we continued our efforts with initiatives to combat money laundering and to understand the social and environmental risks of our lending activity.
We believe these activities help to make our brand stand out from our competitors. Ultimately they underpin our business and will help us to grow stronger.
Corporate Responsibility Report In May 2005 we will be producing our first Corporate Responsibility Report that will provide more information and data on each of the sections covered in this part of our Annual Report.
Reaching customers in underdeveloped markets To remain competitive, we need to constantly innovate to meet the needs of all our customers. We believe we have an important role to play in reaching customers for whom banking services are underdeveloped.
For example, in Tanzania we have developed a strategy to help fund the credit needy agricultural sector.
We visited over 40 Tanzanian farms in 2004 to assess their financial needs and identified a requirement for $50 million in financing – half in 2004 and the rest in 2005. To raise the money, we created an agricultural deposit account for customers who wanted to support the industry rather than investing in bonds or other products. We are now the leading bank for agriculture in the country.
Working with development organisations We are committed to providing banking services to development organisations and helping them work effectively in our operating territories.
Located in London, but working with a global team of 35, we provide banking services for aid agencies, development institutions and non-governmental organisations.
Asian Tsunami 2004 ended on a tragic note when the Asian Tsunami struck. It impacted some of the markets in which we operate and, whilst our business was largely unaffected, some of our employees were affected, directly or indirectly. We have committed $5 million as an initial contribution to the relief efforts. In Indonesia, we are working with the Indonesian Red Cross (PMI) and other development organisations under the United Nations. In Thailand, we are helping to build a boarding school for 400 children orphaned by the Tsunami. In addition, colleagues around the world have raised over $450,000 to support the victims of the tragedy.
20 Standard Chartered Annual Report and Accounts 2004

One key area of expertise is the efficient transfer of funds and related foreign exchange needed to tackle humanitarian crises. In 2004, Afghanistan has been a focus for the team, where 90 per cent of our business is with development organisations.
Fair treatment of customers We work hard to offer the right products to the right people. We have a diverse customer base in many different markets and we have an obligation to sell our products in a responsible manner. Educating consumers about financial products and planning is a key responsibility.
Pledge cards During Outserve week every
Respond to
all emails w
ithin one
hour
employee made a customer service pledge as part of our goal to be renowned for excellent customer service. The cards act as a reminder to employees of the importance of Outserving our competition.
We trained approximately 800 personal financial consultants in 2004. In 2005 we will launch a people management policy for direct sales employees, including enhanced training in risk management and a learning pack to ensure all legal and regulatory requirements are met consistently.
As financial products and services become more sophisticated and widespread we recognise we have a role to play in educating our customers about better financial planning. A financial literacy scheme we ran in Malaysia is typical of the work we do to educate consumers.
Financial literacy Our Malaysian financial literacy campaign was designed to help consumers understand new products like unit trusts and mortgages as well as general financial planning. We placed a number of articles in three leading newspapers to raise awareness and ran a series of seminars and exhibitions. Open to customers and non-customers alike, the seminars attracted around 1,000 participants.
Living with HIV Standard Chartered’s Living with HIV programme aims to spread understanding of HIV and AIDS to our employees, their families and the communities in which they live. We want to reduce the stigma attached to HIV and AIDS so that more people can learn about prevention and take advantage of testing and treatment. On World AIDS Day, Standard Chartered employees around the world participated in many activities designed to create awareness amongst local communities. Employees in Zimbabwe hung awareness posters and set up information desks in every branch. Our Hong Kong office arranged a bus, which travelled around busy streets sharing information and handing out red ribbons, flyers, and balloons.
Annual Report and Accounts 2004 Standard Chartered 21

Corporate Responsibility
Sustainable lending Our social and environmental risk policy is designed to ensure that these issues are evaluated in all decisions our business managers take. We also need to ensure that our relationship managers have the tools to assess these risks against local and international standards.
During 2004 we completed the training of 420 relationship managers to help them identify these types of risk. We successfully strengthened the role of the Reputational Risk Committee in managing this process and raised awareness throughout Wholesale Banking. In 2005, all our employees will be required to undertake training in reputational risk. We also adjusted our procedures during the year to integrate the Equator Principles – used to assess social and environmental risks in big development projects.
Climate change and the environment Tackling climate change is of growing importance for governments, companies and individuals. With operations in 56 countries and territories, we recognise we have an impact on the environment and a duty to reduce this impact.
Three years ago Standard Chartered established a Global Environment programme, overseen by an environmental
steering group that will now report to the Corporate Responsibility and Community Committee. The steering group makes sure that we manage and reduce our environmental impacts as effectively as possible. We want to make environmental management part of our everyday business life.
Our Global Environmental Management System (GEMS) enables us to measure our environmental impact and understand how efficiently we are using natural resources. GEMS is aimed at buildings with more than 25,000 sq ft of floor space, or where more than 200 people work. Our intention is that the system will cover 70 per cent of employees worldwide by 2006.
We have had some excellent results in countries where GEMS has already taken root. In India GEMS has now been introduced at 10 offices, six more than we initially targeted. In Thailand, our Central Services division in Bangkok achieved ISO14001 certification by BSI Certification (Thailand) during 2004. Further details will be available in our Corporate Responsibility Report.
In 2004 we also launched GEMS-Lite, a scaled down version of GEMS, to help managers and employees in our 500 smaller branches and offices understand the simple things they can do to improve environmental performance.
Anti-Money laundering An important part of our approach to tackling money laundering is our Know Your Customer (KYC) scheme. We encourage and train all our employees to develop a real knowledge of their customers to help us serve them better and to sharpen our processes in tackling fraud and money laundering. In 2004 we introduced a number of new training schemes including Consumer Banking Credit Risk management, enhanced KYC training and both e-learning and classroom courses on anti-money laundering.
Property Currently around 20 per cent of our buildings are wholly owned and we are moving towards occupying freeholds rather than leasing properties. This move will help us control and manage the impact of the Bank’s buildings more closely.
As well as reappraising our property portfolios, we are taking a much more rigorous approach to drawing up specifications for new or refurbished buildings to ensure we use renewable resources and materials, and increase energy efficiency.
We have created a standard specification, called the Global Office Workplace Standard, for all new projects. It is currently being used in projects in London and Kenya and was a central part of the refurbishment of the new headquarters of the Bank in Kuala Lumpur.
Travel Air travel is our single biggest direct environmental impact and for some time we have had a rigorous approval system for business travel.
All air travel is centrally booked and authorised. Whilst we believe that face-to-face meetings are a vital part of building a successful business, limiting air travel with a view to controlling costs is an appropriate approach to reducing the direct environmental impact of such meetings.
Reducing resource use In Chennai, India, at our large Global Shared Service Centre, we cut water consumption by 15 per cent, beating our initial target of 10 per cent. Office paper use was slashed by 30 per cent – three times more than we set out to achieve – by encouraging double-sided printing and recycling paper for use in fax machines.
FTSE4Good We are part of FTSE4Good, the Socially Responsible Investment Index that recognises companies achieving high standards of Corporate Responsibility. FTSE4Good reviews its constituents every six months and Standard Chartered has been a member since its launch in July 2001.
22 Standard Chartered Annual Report and Accounts 2004

We actively encourage employees to use video and phone conferencing as an alternative, and all of our main buildings have excellent facilities for this.
Our supply chain We spend $1 billion each year on goods and services from around 20,000 suppliers. We want to be sure that our suppliers match our own standards in terms of social and environmental standards.
In 2004 we began assessing our suppliers systematically for the first time using the newly created Know Your
Equator Principles We enhanced our long-established social and environmental risk processes by adopting the Equator Principles in 2003. These have been developed following International Finance Corporation guidelines and cover financing projects in industries such as mining and forestry. Under the principles, we will only provide loans to projects that are socially and environmentally responsible.
Supplier scheme. This analysis allows us to build a clearer picture of the companies we buy from, understand more about the way they operate and reveal any activities they are involved in which are out of line with our own standards and practice.
This is not something we can do immediately in every market. We are concentrating initially on our biggest supply markets – Hong Kong, Singapore, the US and the UK, which together account for some 60 per cent of our total procurement. As the new system takes hold, we will roll it out to our other markets.
Home for handicapped children Standard Chartered Jordan constructed a playground specifically designed for handicapped children at a cost of $50,000, opened by His Excellency The Minister of Social Development. This was a high profile project. The playground was built on ground donated by the Kingdom of Jordan. All our employees in Jordan have been involved either in this project or in previous activities involving the Beit Al Amal Home.
Property When we developed plans for a new head office in Kuala Lumpur, Malaysia this year, we included nine sustainable development initiatives. These included installing energy-efficient and time-controlled lighting and access to natural light, as well as an open plan office space to reduce use of materials and cut the need for demolition when we move out. We also sourced the office furniture from companies with credible environmental policies. The building includes a compactor room with sufficient space for sorting waste for recycling.
23

Corporate Responsibility
Tanzanian farm The United Nations Working closely with over 40 farms Global Compactin Tanzania, we created a specialised Standard Chartered adopted the deposit account in 2004, with the United Nations Global Compact in aim of providing much-needed 2001 and actively addresses the financing to the agricultural sector. principles contained in it. We are
members of the United Nations Global Compact UK Forum and spoke at the United Nations Global Compact Policy Dialogue on HIV/AIDS.
In our major centres we ask all our suppliers, however large, to account for their practices in tender and proposal documents.
We have a small procurement team, with permanent representatives in the UK, Hong Kong and Singapore overseen by a Strategic Supply and Vendor Management steering group.
In other markets such as India, Africa and the US, employees working in procurement report to the steering group.
Our procurement decisions are highly commercial and price is naturally important. For each tender undertaken we operate a scoring system to allow us to weigh up other issues in the decision
Seeing is Believing The Greatest Race on Earth, a four city marathon challenge across the marathons we sponsor in Nairobi, Mumbai, Singapore and Hong Kong, is an important fundraising initiative for Seeing is Believing. The gift cards below were designed by children from China whose sight has been restored with the funds raised through Seeing is Believing.
making process. Social, ethical and environmental considerations form an important part of the evaluation criteria.
Working with communities We are proud to have built strong community programmes at Standard Chartered. We know from experience that we can make a big difference internationally, regionally and locally.
We operate in many developing countries, and awareness of the human and economic impacts of poverty and ill health has always shaped our community activity.
We want to use our business skills to extend the benefits of our various programmes to communities, partners and customers.
As well as helping at a grass-roots level, our community programmes offer a chance for our employees to become involved, create partnership opportunities with appropriate development organisations, engage our customers and help grow our business.
Our programmes work at three different levels. Our global programmes – Seeing is Believing and Living with HIV – aim to tackle important issues with maximum sustainable impact across the world.
Our regionally funded programmes – the Community Partnerships for Africa, India and the Middle East and South Asia – provide a further opportunity for our employees to become involved.
Local funding provided for community activity encourages each of our operations to choose issues of particular local significance.
24

Seeing is Believing bands Henry Wanyoike is blind. He is also a Paralympic gold medallist and world track champion. He acts as a goodwill ambassador for Standard Chartered’s Seeing is Believing campaign, running in our Greatest Race on Earth marathons. These wristbands symbolise Henry and his sighted running partner, Joseph – a celebration of a dedicated partnership. The proceeds of the sales of the wristband packs help support Seeing is Believing.
AIESEC In Malaysia we worked with the international student exchange organisation, AIESEC, to train 30 HIV/AIDS Champions, undergraduates who went on to educate a further 3,000 students. The international trainees included students from the Netherlands, USA, Germany, the Czech Republic and India. The programme comprised road shows at leading universities, including the Bank’s Living with HIV materials, interactive sessions, exhibitions, video presentations and the Red Ribbon awareness campaign.
Often, these local programmes grow to become regional and even global programmes, as was the case with both Seeing is Believing and Living with HIV. We think the best community initiatives often emerge at the grass-roots level.
Our focus in 2004 has been to organise a more coherent framework for our programmes so that they deliver sustainable outcomes for communities and for our partners. We are also seeking to align this activity much more closely to our business objectives.
Seeing is Believing Henry Wanyoike woke up on the last day in April 1995 to find he was totally blind. But losing his sight did not mean losing his spirit. Since that day, Henry has established himself as one of Kenya’s leading track athletes and is a Paralympic gold medallist.
Henry is now a roving ambassador for Seeing is Believing, our global fundraising programme to tackle avoidable blindness. 37 million people around the world are thought to be blind, with the majority living in the developing world. Most of them suffer from avoidable or curable blindness.
Seeing is Believing started as a small local community project, but we decided to make it a global programme and set ourselves a target of raising $700,000 by World Sight Day in October 2003. The target was enough to restore the sight of 28,000 people, or one person for every Standard Chartered employee. In the end we raised enough to restore sight to 56,000 people.
We knew we could make the project more ambitious, and on World Sight Day in 2004 we announced a new target. Working with Sight Savers International and our VISION 2020 partners, we aim to raise enough funds for one million sight restorations, working through the principles laid out by VISION 2020. The money will go towards 12 flagship projects in ten countries – Bangladesh, India, Kenya, Pakistan, Thailand, China, Indonesia, Nigeria, Sri Lanka and Vietnam – and will make a real difference to the lives of many people.
This project is overseen by an advisory board with representation from Standard Chartered, the World Health Organisation, Sight Savers International and our VISION 2020 partners.
Living with HIV Living with HIV is an important project for Standard Chartered and, given our markets, is of real commercial significance – the need to maintain a healthy, stable workforce. It is
predominantly an educational project rather than a fundraising exercise, and its aims are to spread understanding of the disease to our employees, their families and the communities in which they live. We want to reduce the stigma attached to the disease so that more people can learn about prevention and take advantage of testing and treatment.
In many of our markets we live with the realities of HIV/AIDS. Africa clearly faces the most acute problems in dealing with the pandemic, but growth rates in infection are also rising steeply in India and China, two of our most important markets.
In 2004 we continued to develop programmes to help educate our employees and support their families and communities. Anonymous testing and treatment is provided to all employees.
We also explored new ways to target 15 to 24 year olds, widely seen as the most vulnerable to the disease and the most likely to benefit from greater awareness. During 2005, we will explore further ways to reach this important age group.
Further information For further information please see our Corporate Responsibility website at: www.standardchartered.com/ourbeliefs or e-mail [email protected]
Annual Report and Accounts 2004 Standard Chartered 25

Financial Review
Group Summary The Group delivered another strong performance in the year ended 31 December 2004 with a record profit before tax of $2,158 million, up 39 per cent on the previous year. Normalised earnings per share has grown by 40 per cent to 125.9 cents. (Refer to note 12 on page 85 for the details of basic and diluted earnings per share).
This performance is the result of broadly based organic growth across both businesses and a significantly improved debt performance. The results have also benefited from several one-off items, described below, which together generated profit of $85 million before tax. Operating profit before tax adjusted to exclude these one-off items increased by 34 per cent compared to 2003.
Prior period figures have been restated, principally to reflect the full adoption of the provisions of Financial Reporting Standard 17 – Retirement Benefits (FRS17). See note 6 on page 78.
The Group has made several acquisitions in 2004. In August, it acquired 100 per cent of Advantage Limited (‘PrimeCredit’), a consumer finance business in Hong Kong, and increased its share in Standard Chartered Bank Nepal Limited from 50 per cent to 75 per cent. In November, the Group entered into a consortium agreement with PT Astra International Tbk to acquire a controlling interest in PT Bank Permata Tbk (‘Permata’), an Indonesian commercial bank. The Group’s effective interest in Permata at 31 December 2004 was 31.55 per cent. It has been accounted for as a joint venture. In December 2004 the Group acquired from ANZ part of its project finance business, a team of specialists and a portfolio of loan commitments amounting to $1.26 billion. Together these acquisitions contributed $8 million to profit before tax in 2004.
Net revenue has grown by 13 per cent in total to $5,367 million compared to 2003. The increase is 11 per cent when adjusted for the one-off items above. Business momentum is strong and revenue has grown at twice the pace of revenue growth a year ago. Revenue from outside Hong Kong and Singapore, our two most mature and competitive markets, now comprise 64 per cent of the Group’s total revenue and grew at 19 per cent over 2003.
Net interest income grew by seven per cent to $3,168 million. A fall in interest margins from 2.8 per cent to 2.7 per cent has been offset by ten per cent growth in average earning assets. Interest spread fell from 2.5 per cent to 2.4 per cent.
Other finance income at $10 million compares with a finance charge of $13 million in 2003, principally as a result of contributions made to the UK and Hong Kong funds.
Net fees and commissions increased by 15 per cent from $1,156 million to $1,334 million. Growth was seen in most markets, driven by wealth management, mortgages and corporate advisory services.
Dealing profits grew by 23 per cent from $525 million to $648 million, largely driven by customer led foreign exchange dealing. In particular, retail foreign exchange performed well.
Other operating income at $207 million compares to $104 million in 2003. The increase reflects the one-off items partly offset by a fall in profits on investment securities as a result of a programme to reduce the risk in the book in 2003.
Total operating expenses increased from $2,643 million to $2,996 million. Of this increase $44 million arose from accelerated goodwill amortisation. The adjusted cost increase, excluding goodwill, and one-off items was 11 per cent, in line with adjusted revenue growth. The normalised cost income ratio has fallen from 53.6 per cent in 2003 to 53.5 per cent in 2004. The Group’s investment programmes over recent years in market expansion, new products, distribution outlets and sales capabilities have been paying back in good revenue growth. This investment continued in 2004 together with increased spend on the Group’s regulatory and control infrastructure.
Provisions for bad and doubtful debts fell from $536 million to $214 million, a reduction of 60 per cent. This includes a $55 million release from the Group’s general provision. This performance is a direct result of significantly strengthened risk management discipline, as well as a favourable credit environment.
One-off items from Corporate Activity In January 2004 the Group sold its investment in BOC Hong Kong (Holdings) Limited realising a net profit of $36 million and in May 2004, it disposed of its investment in KorAm Bank realising a net profit of $95 million. These gains were partially offset by a $23 million premium paid on the repurchase of surplus subordinated debt in India and are reported in other operating income.
26 Standard Chartered Annual Report and Accounts 2004

One-off costs of $18 million were incurred on incorporating the Group’s business in Hong Kong and, at the end of December, the Group agreed to donate $5 million to the Tsunami relief effort.
The effect of these gains and charges, all of which arose from corporate decisions taken at the centre and which are non-recurring in nature, have not been attributed to either Consumer Banking or Wholesale Banking in the business segmental results.
Consumer Banking Consumer Banking has built up strong momentum with operating profit up 42 per cent in 2004 to $1,064 million. The accelerated investment in growth opportunities in 2003 is delivering results. Revenue increased by eight per cent, which is twice the rate that was achieved in 2003, to $2,693 million. This was driven by loan growth of 18 per cent outside Hong Kong and an increased contribution across all product segments, in particular the SME business. Investing for growth has led to a 10 per cent increase in costs when compared to 2003. The specific bad debt charge fell by 43 per cent. The debt charge in Hong Kong fell significantly and charges elsewhere also improved. In addition, $29 million of general provision held against the Consumer portfolio has been released in 2004.
Hong Kong delivered an increase in operating profit of 77 per cent to $462 million. This resulted from a lower debt charge, cost efficiencies and improved mortgage margins, although these showed some decline in the second half. Revenue was flat at $954 million. Improved margins in mortgages and a good performance in wealth management was offset by subdued loan demand across the market. Costs were tightly controlled and, in the fourth quarter, an operational efficiency programme was initiated to reduce back office costs and improve productivity.
In Singapore, operating profit was broadly flat at $180 million in an intensely competitive environment. Although asset growth was strong at 16 per cent and there was good performance in wealth management and the SME business, revenue was offset by contracting margins, particularly in the mortgage business. Cost growth was five per cent, largely supporting product investment.
Operating profit in Malaysia was up 17 per cent to $75 million with strong performance across all products and a lower debt charge. Revenue grew by eight per cent. Continued margin pressure in the mortgage portfolio was more than offset by higher volume. Revenue from wealth management increased significantly, driven by unit trust sales. Costs increased by nine per cent as a result of significant infrastructure investment.
In Other Asia Pacific, operating profit at $97 million was 11 per cent higher than in 2003 with revenue up 18 per cent. Thailand, Taiwan, Indonesia and Korea performed well across a broad range of products. Costs increased by 23 per cent as the Group continued to invest in China and Korea.
In India, strong asset growth and a lower debt charge drove operating profit up by 100 per cent to $78 million, despite contracting margins in both mortgages and deposit accounts. Costs increased by 22 per cent to $153 million as a result of continued investment in enhanced risk management, new products and delivery channels to support rapid business growth.
Operating profit in the United Arab Emirates (UAE) increased by 42 per cent to $64 million with revenue up by 22 per cent, driven by credit cards, personal loans and wealth management. Costs were 11 per cent higher than in 2003, reflecting further investment in infrastructure and product capability. Elsewhere in the Other Middle East and Other South Asia (MESA) region operating profit grew by 38 per cent to $69 million with strong performances in wealth management, cards and personal loans, particularly in Bangladesh, Pakistan and Bahrain.
In Africa, operating profit increased from $7 million to $17 million with revenue up by 28 per cent to $218 million. This was largely a result of strong asset growth as new products were launched in a number of countries, including Nigeria, South Africa and Kenya, together with improved margins in Zimbabwe. Costs have grown by 23 per cent. This was driven by continued investment in South Africa and inflationary pressures.
The Americas, UK and Group Head Office have seen an increase in operating profit of 10 per cent to $22 million, mostly through firm cost control. The re-focused international banking offering has delivered good profit growth, with revenues largely booked in Hong Kong, Singapore and Dubai.
Annual Report and Accounts 2004 Standard Chartered 27

Financial Review
The following tables provide an analysis of operating profit by geographic segment for Consumer Banking:
2004 Asia Pacific MESA
Other Middle East Americas, Consumer
Hong Other & Other UK & Group Banking Kong Singapore Malaysia Asia Pacific India UAE South Asia Africa Head Office Total
$million $million $million $million $million $million $million $million $million $million
Net revenue 954 330 175 393 258 124 172 218 69 2,693 Costs (415) (116) (86) (231) (153) (51) (93) (195) (48) (1,388) Specific (88) (40) (18) (69) (29) (10) (11) (6) – (271) General 11 6 4 3 2 1 1 – 1 29 (Charge) for/release of debts (77) (34) (14) (66) (27) (9) (10) (6) 1 (242) Income from joint venture – – – 1 – – – – – 1
Operating profit 462 180 75 97 78 64 69 17 22 1,064
2003* Asia Pacific MESA
Other Middle East Americas, Consumer
Hong Other & Other UK & Group Banking Kong Singapore Malaysia Asia Pacific India UAE South Asia Africa Head Office Total
$million $million $million $million $million $million $million $million $million $million
Net revenue 954 328 162 333 223 102 138 170 78 2,488 Costs (411) (110) (79) (188) (125) (46) (83) (159) (58) (1,259) Specific charge for debts (282) (40) (19) (58) (59) (11) (5) (4) – (478)
Operating profit 261 178 64 87 39 45 50 7 20 751
*Comparative restated (see note 54 on page 118).
An analysis of Consumer Banking revenue by product is set out below: 2004 2003* Revenue by product $million $million
Cards and Personal Loans 1,117 1,043 Wealth Management/Deposits 891 805 Mortgages and Auto Finance 638 603 Other 47 37
2,693 2,488
*Comparative restated (see note 54 on page 118).
28 Standard Chartered Annual Report and Accounts 2004

Cards and personal loans have delivered increased revenue of seven per cent in a very competitive price environment. Assets have grown by 25 per cent outside of Hong Kong. Hong Kong has returned to profitability despite a seven per cent decline in cards outstandings.
Wealth management revenue has increased by 11 per cent to $891 million with strong demand for investment products, partially offset by compression in deposit margins.
Mortgages and auto finance revenue has grown by six per cent to $638 million driven by new products, increased fee income and, in Hong Kong, improved mortgage margins.
Costs in Consumer Banking have increased by 10 per cent to $1,388 million. This was a direct result of the investment which began in 2003 to expand distribution outlets and launch new products and services in key growth markets.
The specific net charge for debts in Consumer Banking has fallen by 43 per cent to $271 million. The specific net debt charge in Hong Kong fell significantly as bankruptcy losses continued to fall sharply due to the improving economic environment. Other areas showed a stable or improving performance while sustaining strong business growth.
Wholesale Banking. Wholesale Banking delivered a strong broadly based performance across all geographies, products and customer segments. Operating profit was up 28 per cent at $1,190 million. This was achieved on controlled economic capital, through expanding product capabilities and deepening customer relationships. Revenue increased by 14 per cent to $2,566 million. Customer revenues were up by 19 per cent. Costs increased by 12 per cent due to increased investment in product capabilities such as debt capital markets and derivatives, increased spend on infrastructure and controls, and an increase in performance driven compensation. There was a net specific debt release in 2004 of $2 million compared to a charge of $68 million in 2003. This reflected success in changing the risk profile of the business and also a benign credit environment. In addition, a $26 million release was made from the general provision held against the Wholesale portfolio (2003: $10 million).
The following tables provide an analysis of operating profit by geographic segment for Wholesale Banking:
2004 Asia Pacific MESA
Other Middle East Americas, Wholesale
Hong Other & Other UK & Group Banking Kong Singapore Malaysia Asia Pacific India UAE South Asia Africa Head Office Total
$million $million $million $million $million $million $million $million $million $million
Net revenue 418 183 95 422 231 147 205 366 499 2,566 Costs (221) (110) (57) (277) (97) (48) (75) (162) (357) (1,404)
Specific (54) (2) 11 22 3 6 7 (6) 15 2 General 6 3 1 4 2 2 2 – 6 26
(Charge) for/release of debts (48) 1 12 26 5 8 9 (6) 21 28 Amounts written off
fixed asset investments – – – – 2 – – – (3) (1) Income from joint venture – – – 1 – – – – – 1
Operating profit 149 74 50 172 141 107 139 198 160 1,190
2003* Asia Pacific MESA
Other Middle East Americas, Wholesale
Hong Other & Other UK & Group Banking Kong Singapore Malaysia Asia Pacific India UAE South Asia Africa Head Office Total
$million $million $million $million $million $million $million $million $million $million
Net revenue 401 158 73 348 243 132 177 273 447 2,252 Costs (207) (100) (57) (241) (87) (45) (62) (123) (328) (1,250)
Specific (23) 7 21 (41) (1) 9 9 (5) (44) (68) General – – – – – – – – 10 10
(Charge) for/release of debts (23) 7 21 (41) (1) 9 9 (5) (34) (58) Amounts written off
fixed asset investments – – – – (4) – – – (7) (11)
Operating profit 171 65 37 66 151 96 124 145 78 933
*Comparative restated (see note 54 on page 118).
Annual Report and Accounts 2004 Standard Chartered 29
Financial Review
In Hong Kong, net revenue grew by four per cent from $401 million In Africa, revenue at $366 million was 34 per cent higher than in to $418 million. The growth was largely from foreign exchange 2003. High commodity prices and relative economic stability in and derivatives on the back of strong trade flows. Costs were a number of key markets have contributed to this result. The $14 million higher at $221 million with continued investment in contribution from Botswana and Zimbabwe was particularly the front office partially offset by a reduction in technology costs. strong. Costs grew by 32 per cent, mainly due to inflationary
Revenue in Singapore grew by 16 per cent. Strong customer pressure and expansion in Nigeria and South Africa.
revenue, particularly from global markets products, more than The Americas, UK and Group Head Office have seen revenue offset a decline in revenue from asset and liability management. increase by 12 per cent to $499 million. Strong fees and Costs increased by 10 per cent to $110 million mainly due to commissions were partially offset by reduced yield on asset and investment in risk and governance infrastructure. liability management.
In Malaysia, revenue increased from $73 million to $95 million An analysis of Wholesale Banking revenue by product is set with good growth in global markets products facilitated by a out below: wider product mix and advisory services. Costs were held flat 2004 2003*
at $57 million through tight control. Revenue by product $million $million
The Other Asia Pacific region delivered strong results with excellent contributions in all countries and in particular from Korea and Taiwan. Revenue grew by 21 per cent to $422 million.
Trade and Lending 868 815 Global Markets 1,209 1,054 Cash Management and Custody 489 383
This increase was broadly spread across the commercial banking 2,566 2,252 and global markets product range. Costs increased by 15 per *Comparative restated (see note 54 on page 118). cent to $277 million reflecting investment in product capability in the region. Trade and lending revenue has increased by seven per cent to
$868 million. Trade finance, underpinned by strong intra-Asian In India, profit on the sale of investment securities arising as a trade flows, has outstripped lending growth. result of a programme to reduce the risk in the book was significantly lower in 2004. Excluding the effect of this, revenue grew by around 12 per cent. This reflected broad based product growth and a positive contribution from all customer segments. The increase in costs of 11 per cent to $97 million is the result of investment in new businesses, people and infrastructure to capture further growth opportunities.
Global markets revenue has grown strongly at 15 per cent. Investment in new product capability in debt capital markets, asset backed securities, structured trade and derivatives have started to deliver good returns. Revenue from asset and liability management was lower than in 2003 due to the shape of the yield curves, but the decline has stabilised.
In the UAE revenue increased by 11 per cent to $147 million, driven largely by foreign exchange, cash management and structured global markets products. Elsewhere in the MESA region revenue grew by $28 million to $205 million, led by significant cross-selling of global markets products. The increase
Cash management and custody revenue were up by 28 per cent. Cash management grew on the back of higher transaction volumes and an increase of more than 30 per cent in average balances. Custody increased by more than 40 per cent with assets under administration up by more than 50 per cent.
in costs in the region was due to expansion into new markets, Costs in Wholesale Banking increased by 12 per cent. This was investment in new products, infrastructure and continued due to further investment for growth, increased spending on strengthening of risk and governance functions. infrastructure and controls and higher performance driven costs,
largely due to variable compensation.
Wholesale Banking had a net specific debt release of $2 million compared to a $68 million charge in the previous period. Gross provisions were down by 37 per cent and recoveries down by 13 per cent. This has been achieved through continued enhancement of risk management processes and improvement in the risk profile, together with a favourable credit environment. $26 million of general provision was released against the Wholesale portfolio in 2004 (2003: $10 million).
30 Standard Chartered Annual Report and Accounts 2004

Risk Through its risk management structure the Group seeks to manage efficiently the core risks: credit, market, country and liquidity risk arise directly through the Group’s commercial activities whilst business, regulatory, operational and reputational risk are normal consequences of any business undertaking. The key element of risk management philosophy is for the risk functions to operate as an independent control working in partnership with the business units to provide a competitive advantage to the Group.
The basic principles of risk management followed by the Group include:
• ensuring that business activities are controlled on the basis of risk adjusted return;
• managing risk within agreed parameters with risk quantified wherever possible;
• assessing risk at the outset and throughout the time that we continue to be exposed to it;
• abiding by all applicable laws, regulations, and governance standards in every country in which we do business;
• applying high and consistent ethical standards to our relationships with all customers, employees, and other stakeholders; and
• undertaking activities in accordance with fundamental control standards. These controls include the disciplines of planning, monitoring, segregation, authorisation and approval, recording, safeguarding, reconciliation and valuation.
Risk Management Framework Ultimate responsibility for the effective management of risk rests with the Company’s Board of Directors. The Audit and Risk Committee reviews specific risk areas and guides and monitors the activities of the Group Risk Committee and Group Asset and Liability Committee.
All the Executive Directors of Standard Chartered PLC and members of the Standard Chartered Bank Court are members of the Group Risk Committee which is chaired by the Group Executive Director responsible for Risk (‘GED Risk’). This Committee has responsibility for determining the Group standards and policies for risk measurement and management, and also delegating authorities and responsibilities to various sub-committees.
The committee process ensures that standards and policy are cascaded down through the organisation from the Board through the Group Asset and Liability Committee and the Group Risk Committee to the functional, regional and country level committees. Key information is communicated through the country, regional and functional committees to Group, to provide assurance that standards and polices are being followed.
The GED Risk manages an independent risk function which:
• recommends Group standards and policies for risk measurement and management;
• monitors and reports Group risk exposures for country, credit, market and operational risk;
• approves market risk limits and monitors exposure;
• sets country risk limits and monitors exposure;
• chairs credit committee and delegates credit authorities subject to oversight;
• validates risk models; and
• recommends risk appetite and strategy.
Individual Group Executive Directors are accountable for risk management in their businesses and support functions and for countries where they have governance responsibilities. This includes:
• implementing the policies and standards as agreed by the Group Risk Committee across all business activity;
• managing risk in line with appetite levels agreed by the Group Risk Committee; and
• developing and maintaining appropriate risk management infrastructure and systems to facilitate compliance with risk policy.
The GED Risk, together with Group Internal Audit, provides independent assurance that risk is being measured and managed in accordance with the Group’s standards and policies.
Annual Report and Accounts 2004 Standard Chartered 31

Financial Review
Credit Risk Credit risk is the risk that a counterparty will not settle its obligations in accordance with agreed terms.
Credit exposures include individual borrowers and connected groups of counterparties and portfolios, on the banking and trading books.
Clear responsibility for credit risk is delegated from the Board to the Group Risk Committee. Standards and policies for managing credit risk are determined by the Group Risk Committee which also delegates credit authorities through the GED Risk to independent Risk Officers at Group and at the Wholesale Banking and Consumer Banking business levels. Procedures for managing credit risk are determined at the business levels with specific policies and procedures being adapted to different risk environment and business goals. The Risk Officers are located in the businesses to maximise the efficiency of decision-making, but have an independent reporting line into the GED Risk.
Within the Wholesale Banking business, credit analysis includes a review of facility detail, credit grade determination and financial spreading/ratio analysis. The Bank uses a numerical grading system for quantifying the risk associated with a counterparty. The grading is based on a probability of default measure with customers analysed against a range of quantitative and qualitative measures. There is a clear segregation of duties with loan applications being prepared separately from the approval chain. Significant exposures are reviewed and approved centrally through a Group or Regional level Credit Committee. This Committee receives its authority and delegated responsibilities from the Group Risk Committee.
The businesses, working with the Risk Officers, take responsibility for managing pricing for risk, portfolio diversification
and overall asset quality within the requirements of Group standards, policies, and the business strategy.
For Consumer Banking, standard credit application forms are generally used which are processed in central units using manual or automated approval processes as appropriate to the customer, the product or the market. As with Wholesale Banking, origination and approval roles are segregated.
Loan Portfolio Loans and advances to customers have increased by 20 per cent during the year to $71.6 billion. In Consumer Banking growth has resulted from increases in the mortgage book, mainly in Singapore, Malaysia and India. In Wholesale Banking growth was across all regions. This was particularly in trade, syndications and project finance, including the acquisition of the $1.2 billion ANZ project finance portfolio.
Approximately 49 per cent (2003: 53 per cent) of the portfolio relates to Consumer Banking, predominantly retail mortgages. Other Consumer Banking covers credit cards, personal loans and other secured lending.
Approximately half of the Group’s loans and advances are short term in nature and have a maturity of one year or less. The Wholesale Banking portfolio is predominantly short term, with 75 per cent of loans and advances having a maturity of one year or less. In Consumer Banking, 63 per cent of the portfolio is in the mortgage book, traditionally longer term in nature.
The following tables set out by maturity the amount of customer loans net of provisions:
2004 2003* One year One to Over five One year One to Over five
or less five years years Total or less five years years Total $million $million $million $million $million $million $million $million
Consumer Banking Mortgages 1,877 4,156 15,985 22,018 1,917 4,143 14,229 20,289 Other 5,241 3,876 403 9,520 4,874 3,534 553 8,961
Small and medium enterprises 989 440 2,050 3,479 558 217 1,631 2,406
Total 8,107 8,472 18,438 35,017 7,349 7,894 16,413 31,656
Wholesale Banking 27,670 5,145 4,099 36,914 22,209 4,526 1,778 28,513 General Provisions – – – (335) – – – (425)
Net loans and advances to customers 35,777 13,617 22,537 71,596 29,558 12,420 18,191 59,744
*The analysis of net loans and advances to customers for Consumer and Wholesale Banking at 31 December 2003 has been restated to separately disclose small and medium enterprises within Consumer Banking. This has resulted in a transfer of $514 million from the Wholesale Banking portfolio to Consumer Banking. There was no impact on total net loans and advances to customers.
32 Standard Chartered Annual Report and Accounts 2004

The following tables set out an analysis of the Group’s net loans and advances as at 31 December 2004 and 31 December 2003 by the principal category of borrowers, business or industry and/or geographical distribution:
2004 Asia Pacific MESA
Other Middle East Americas,
Hong Other & Other UK & Group Kong Singapore Malaysia Asia Pacific India UAE South Asia Africa Head Office Total
$million $million $million $million $million $million $million $million $million $million
Loans to individuals Mortgages 12,189 5,064 2,422 737 1,194 – 87 63 262 22,018 Other 2,097 651 488 2,622 1,201 819 1,109 431 102 9,520
Small and medium enterprises 731 1,622 578 200 230 13 29 76 – 3,479
Consumer Banking 15,017 7,337 3,488 3,559 2,625 832 1,225 570 364 35,017
Agriculture, forestry and fishing – 26 55 56 15 – 19 171 314 656
Construction 154 27 6 34 105 103 136 46 4 615 Commerce 1,560 804 136 895 262 824 378 353 1,113 6,325 Electricity, gas and water 387 40 71 271 104 – 119 102 300 1,394 Financing, insurance and
business services 1,914 1,608 554 762 415 951 411 47 2,268 8,930 Loans to governments – 306 1,551 – – – 16 7 225 2,105 Mining and quarrying – 65 63 122 1 92 57 95 1,032 1,527 Manufacturing 1,343 423 269 2,512 814 236 1,031 404 2,294 9,326 Commercial real estate 984 721 2 388 – – – 29 2 2,126 Transport, storage
and communication 366 280 128 321 226 56 243 165 1,177 2,962 Other 19 128 51 354 43 38 205 24 86 948
Wholesale Banking 6,727 4,428 2,886 5,715 1,985 2,300 2,615 1,443 8,815 36,914
General provision (335) (335)
Total loans and advances to customers 21,744 11,765 6,374 9,274 4,610 3,132 3,840 2,013 8,844 71,596
Total loans and advances to banks 2,852 2,399 480 3,554 325 535 932 510 7,335 18,922
Under ‘Loans to individuals – Other’, $1,270 million The Wholesale Banking portfolio is well diversified across both (2003: $1,371 million) relates to the cards portfolio in geography and industry, with no concentration in exposure to Hong Kong. The total cards portfolio is $3,586 million sub-industry classification levels in manufacturing, financing, (2003: $3,329 million). insurance and business services, commerce and transport,
storage and communication.
Annual Report and Accounts 2004 Standard Chartered 33

Financial Review
2003* Asia Pacific MESA
Other Middle East Americas,
Hong Other & Other UK & Group Kong Singapore Malaysia Asia Pacific India UAE South Asia Africa Head Office Total
$million $million $million $million $million $million $million $million $million $million
Loans to individuals Mortgages 11,974 4,450 1,951 831 640 – 67 30 346 20,289 Other 2,219 703 660 1,990 999 677 1,127 430 156 8,961
Small and medium enterprises 577 1,162 541 – 126 – – – – 2,406
Consumer Banking 14,770 6,315 3,152 2,821 1,765 677 1,194 460 502 31,656
Agriculture, forestry and fishing 6 2 76 49 12 – 24 144 387 700
Construction 104 9 13 43 34 83 91 19 13 409 Commerce 1,350 848 187 717 30 619 394 398 725 5,268 Electricity, gas and water 327 36 25 240 56 3 69 127 84 967 Financing, insurance and
business services 1,575 883 428 657 194 434 320 116 1,184 5,791 Loans to governments – 61 747 8 – – 13 – 281 1,110 Mining and quarrying – 14 78 35 – 59 59 16 470 731 Manufacturing 1,326 745 214 2,016 943 179 916 283 1,738 8,360 Commercial real estate 873 663 7 250 – – 1 18 3 1,815 Transport, storage
and communication 491 143 38 118 71 30 237 114 1,513 2,755 Other 23 62 44 170 1 26 166 44 71 607
Wholesale Banking 6,075 3,466 1,857 4,303 1,341 1,433 2,290 1,279 6,469 28,513
General provision (425) (425)
Total loans and advances to customers 20,845 9,781 5,009 7,124 3,106 2,110 3,484 1,739 6,546 59,744
Total loans and advances to banks 2,113 1,045 204 2,784 239 605 889 308 5,167 13,354
*The analysis of net loans and advances to customers for Consumer and Wholesale Banking at 31 December 2003 has been restated to separately disclose small and medium enterprises within Consumer Banking. This has resulted in a transfer of $514 million from the Wholesale Banking portfolio to Consumer Banking. There was no impact on total net loans and advances to customers.
Problem Credits exposure reduction, security enhancement, exit of the account or The Group employs a variety of tools to monitor the loan portfolio immediate movement of the account into the control of the and to ensure the timely recognition of problem credits. specialist recovery unit.
In Wholesale Banking, accounts or portfolios are placed on Early In Consumer Banking, an account is considered to be in default Alert when they display signs of weakness. Such accounts and when payment is not received on the due date. Accounts that portfolios are subject to a dedicated process involving senior risk are overdue by more than 30 days (60 days for mortgages) are officers and representatives from the specialist recovery unit, considered delinquent. These are closely monitored and subject which is independent of the business units. Account plans are to a special collections process. re-evaluated and remedial actions are agreed and monitored In general, loans are treated as non-performing when interest or until complete. Remedial actions include, but are not limited to, principal is 90 days or more past due.
34 Standard Chartered Annual Report and Accounts 2004

Consumer Banking Provisions are derived on a formulaic basis depending on the product:
Mortgages: a provision is raised where accounts are 150 days past due based on the difference between the outstanding value of the loan and the forced sale value of the underlying asset.
Credit cards: a charge-off is made for all balances which are 150 days past due or earlier as circumstances dictate. In Hong Kong charge-off is currently at 120 days.
Other unsecured Consumer Banking products are charged off at 150 days past due.
For other secured Consumer Banking products a provision is raised at 90 days past due for the difference between the outstanding value and the forced sale value of the underlying asset. The underlying asset is then re-valued periodically until disposal.
It is current practice to provision and write-off exposure in respect of Hong Kong bankruptcies at the time the customer petitions for bankruptcy.
The Small and Medium Enterprises (SME) portfolio is provisioned on a case by case basis.
The following tables set out the non-performing portfolio in Consumer Banking:
2004 Asia Pacific MESA
Other Middle East Americas,
Hong Other & Other UK & Group Kong Singapore Malaysia Asia Pacific India UAE South Asia Africa Head Office Total
$million $million $million $million $million $million $million $million $million $million
Loans and advances – Gross non-performing 72 146 181 60 42 14 28 24 46 613
Specific provisions for bad and doubtful debts (32) (24) (28) (13) (12) (11) (11) (9) (5) (145)
Interest in suspense (1) (4) (24) (7) (8) (2) (13) (8) (7) (74)
Net non-performing loans and advances 39 118 129 40 22 1 4 7 34 394
Cover ratio 36%
2003 Asia Pacific MESA
Other Middle East Americas,
Hong Other & Other UK & Group Kong Singapore Malaysia Asia Pacific India UAE South Asia Africa Head Office Total
$million $million $million $million $million $million $million $million $million $million
Loans and advances – Gross non-performing 138 115 192 63 43 16 23 18 10 618
Specific provisions for bad and doubtful debts (48) (17) (26) (15) (11) (11) (8) (7) (5) (148)
Interest in suspense (1) (3) (23) (9) (9) (5) (8) (7) (2) (67)
Net non-performing loans and advances 89 95 143 39 23 – 7 4 3 403
Cover ratio 35%
The relatively low Consumer Banking cover ratio reflects the For secured products, provisions reflect the difference between fact that the Group classifies all exposure which is more than the value of the underlying assets and the outstanding loan 90 days past due as non-performing, whilst specific provisions (see details relating to the raising of provisions above). on unsecured lending are only raised at the time of charge-off.
Annual Report and Accounts 2004 Standard Chartered 35

Financial Review
Wholesale Banking Loans are designated as non-performing as soon as payment of interest or principal is 90 days or more overdue or where sufficient weakness is recognised so that full payment of either interest or principal becomes questionable. Where customer accounts are recognised as non-performing or display weakness that may result in non-performing status being assigned, they are passed to the management of a specialist unit which is independent of the main businesses of the Group.
For loans and advances designated as non-performing, interest continues to accrue on the customer’s account but is not included in income.
Where the principal, or a portion thereof, is considered uncollectible and of such little realisable value that it can no longer be included at its full nominal amount on the balance
sheet, a specific provision is raised. In any decision relating to the raising of provisions, the Group attempts to balance economic conditions, local knowledge and experience and the results of independent asset reviews.
Where it is considered that there is no realistic prospect of recovering the principal of an account against which a specific provision has been raised, then that amount will be written off.
The following tables set out the total non-performing portfolio in Wholesale Banking including the portfolio covered by a Loan Management Agreement (LMA) with a Thai Government Agency (see note 19 on page 89). This portfolio amounted to $236 million net of provisions at 31 December 2004 (2003: $660 million). The net non-performing loan portfolio has decreased by $607 million (54 per cent) over 2003.
2004 Asia Pacific MESA
Other Middle East Americas,
Hong Other & Other UK & Group Kong Singapore Malaysia Asia Pacific India UAE South Asia Africa Head Office Total
$million $million $million $million $million $million $million $million $million $million
Loans and advances – Gross non-performing 409 185 117 558 68 49 126 104 674 2,290
Specific provisions for bad and doubtful debts (257) (89) (68) (256) (29) (31) (69) (46) (435) (1,280)
Interest in suspense (92) (56) (35) (54) (26) (13) (55) (42) (127) (500)
Net non-performing loans and advances 60 40 14 248 13 5 2 16 112 510
2003 Asia Pacific MESA
Other Middle East Americas,
Hong Other & Other UK & Group Kong Singapore Malaysia Asia Pacific India UAE South Asia Africa Head Office Total
$million $million $million $million $million $million $million $million $million $million
Loans and advances – Gross non-performing 357 236 194 1,077 86 52 180 116 887 3,185
Specific provisions for bad and doubtful debts (220) (106) (118) (375) (44) (40) (99) (51) (460) (1,513)
Interest in suspense (91) (64) (55) (68) (30) (12) (66) (43) (126) (555)
Net non-performing loans and advances 46 66 21 634 12 – 15 22 301 1,117
36 Standard Chartered Annual Report and Accounts 2004

Wholesale Banking Cover Ratio The following tables show the Wholesale Banking cover ratio. The non-performing loans recorded below under Standard Chartered Nakornthon Bank (SCNB) are excluded from the cover ratio calculation as they are the subject of a Loan Management Agreement (LMA) with a Thai Government Agency. Refer to note 19 on page 89.
At 86 per cent, the Wholesale Banking non-performing portfolio is well covered. The balance uncovered by specific provision and interest in suspense represents the value of collateral held and/or the Group’s estimate of the net value of any work-out strategy.
2004 SCNB Total
Total (LMA) excl LMA $million $million $million
Loans and advances – Gross non-performing 2,290 351 1,939 Specific provisions for bad and doubtful debts (1,280) (115) (1,165) Interest in suspense (500) – (500)
Net non–performing loans and advances 510 236 274
Cover ratio 86%
2003 SCNB Total
Total (LMA) excl LMA $million $million $million
Loans and advances – Gross non-performing 3,185 772 2,413 Specific provisions for bad and doubtful debts (1,513) (112) (1,401) Interest in suspense (555) – (555)
Net non-performing loans and advances 1,117 660 457
Cover ratio 81%
Group The following tables set out the movements in the Group’s total specific provisions against loans and advances:
2004 Asia Pacific MESA
Other Middle East Americas,
Hong Other & Other UK & Group Kong Singapore Malaysia Asia Pacific India UAE South Asia Africa Head Office Total
$million $million $million $million $million $million $million $million $million $million
Provisions held at 1 January 2004 268 123 144 390 55 51 107 58 465 1,661
Exchange translation differences – 3 – 4 2 (3) (1) 2 8 15
Amounts written off (154) (62) (63) (142) (65) (13) (29) (21) (58) (607) Recoveries of amounts
previously written off 29 7 10 12 24 3 4 4 2 95 Other 4 – (2) (42) (1) – (5) – 38 (8) New provisions 207 60 36 95 106 15 28 27 35 609 Recoveries/provisions
no longer required (65) (18) (29) (48) (80) (11) (24) (15) (50) (340) Net charge against/
(credit to) profit 142 42 7 47 26 4 4 12 (15) 269
Provisions held at 31 December 2004 289 113 96 269 41 42 80 55 440 1,425
Annual Report and Accounts 2004 Standard Chartered 37
Financial Review
2003 Asia Pacific MESA
Other Middle East Americas,
Hong Other & Other UK & Group Kong Singapore Malaysia Asia Pacific India UAE South Asia Africa Head Office Total
$million $million $million $million $million $million $million $million $million $million
Provisions held at 1 January 2003 255 159 235 358 60 108 144 53 452 1,824
Exchange translation differences 2 2 – 13 3 – 2 1 10 33
Amounts written off (353) (85) (99) (120) (87) (64) (32) (6) (64) (910) Recoveries of amounts
previously written off 23 14 10 13 18 1 1 1 3 84 Other 36 – – 27 1 4 (4) – 20 84 New provisions 364 72 34 142 142 14 22 24 90 904 Recoveries/provisions
no longer required (59) (39) (36) (43) (82) (12) (26) (15) (46) (358) Net charge against/
(credit to) profit 305 33 (2) 99 60 2 (4) 9 44 546
Provisions held at 31 December 2003 268 123 144 390 55 51 107 58 465 1,661
General Provision The general provision is held to cover the inherent risk of losses, which, although not identified, are known by experience to be present in a loan portfolio and to other material uncertainties where specific provisioning is not appropriate. It is not held to cover losses arising from future events.
The Group sets the general provision with reference to past experience by using both Flow Rate and Expected Loss methodology, as well as taking judgemental factors into account. These factors include, but are not confined to, the economic environment in our core markets, the shape of the portfolio with reference to a range of indicators, and management actions taken to proactively manage the portfolio.
During the year, $39 million of the general provision was applied to cover litigation in India dating back to 1992 and $4 million was added from acquisitions. $55 million has been released from the general provision reflecting the benign economic environment, the significant improvement in the Hong Kong bankruptcy situation and other portfolio indicators. At 31 December 2004, the balance of general provision stood at $335 million, 0.5 per cent of loans and advances to customers (2003: $425 million, 0.7 per cent).
Country Risk Country Risk is the risk that a counterparty is unable to meet its contractual obligations as a result of adverse economic conditions or actions taken by governments in the relevant country.
This covers the risk that:
• the sovereign borrower of a country may be unable or unwilling to fulfil its foreign currency or cross-border contractual obligations; and/or
• a non-sovereign counterparty may be unable to fulfil its contractual obligations as a result of currency shortage due to adverse economic conditions or actions taken by the government of the country.
The Group Risk Committee approves country risk policy and procedures and delegates the setting and management of country limits to the Group Head, Credit and Country Risk.
The businesses and country Chief Executive Officers manage exposures within these set limits and policies. Countries designated as higher risk are subject to increased central monitoring.
The following table, based on the Bank of England Cross Border Reporting Country Exposure (CE) guidelines, shows the Group’s cross border assets including acceptances, where they exceed one per cent of the Group’s total assets.
Cross border assets exclude facilities provided within the Group. They comprise loans and advances, interest bearing deposits with other banks, trade and other bills, acceptances, amounts receivable under finance leases, certificates of deposit and other negotiable paper and investment securities where the counterparty is resident in a country other than that where the cross border asset is recorded. Cross border assets also include exposures to local residents denominated in currencies other than the local currency.
38 Standard Chartered Annual Report and Accounts 2004

2004 2003 Public Public sector Banks Other Total sector Banks Other Total
$million $million $million $million $million $million $million $million
USA 824 745 2,660 4,229 1,436 902 2,149 4,487 Netherlands – 2,639 406 3,045 – 1,729 275 2,004 Hong Kong 4 199 2,719 2,922 14 112 2,301 2,427 Singapore – 325 1,939 2,264 – 160 1,509 1,669 India 74 1,132 867 2,073 60 641 1,052 1,753 Korea 47 1,258 698 2,003 3 1,393 475 1,871 China* 101 686 902 1,689 – – – – France 149 1,243 183 1,575 4 1,529 253 1,786 Germany** – – – – – 1,292 315 1,607
* Less than one per cent of total assets at 31 December 2003.
** Less than one per cent of total assets at 31 December 2004.
Market Risk The Group recognises market risk as the exposure created by potential changes in market prices and rates. The Group is exposed to market risk arising principally from customer driven transactions.
Market Risk is governed by the Group Risk Committee, which agrees policies and levels of risk appetite in terms of Value at Risk (VaR). The Group Market Risk Committee provides market risk oversight and guidance on policy settings. Policies cover the trading book of the Group and also market risks within the non-trading books. Limits by location and portfolio are proposed by the businesses within the terms of agreed policy. Group Market Risk approves the limits within delegated authorities and monitors exposures against these limits.
The average total VaR for trading and non-trading books during the year was $15.8 million (2003: $13.6 million) with a maximum exposure of $19.4 million (2003: $16.0 million).
VaR for interest rate risk in the non-trading books of the Group total $16.7 million at 31 December 2004 (2003: $9.5 million). The increase in VaR reflects the rise in interest rates and positional changes.
The Group has no significant trading exposure to equity or commodity price risk.
The average daily revenue earned from market risk related activities was $3.8 million, compared with $3.5 million during 2003.
Revenue Distribution 66 65
54Group Market Risk complements the VaR measurement by regularly stress testing market risk exposures to highlight potential risk that may arise from extreme market events that are rare but plausible. In addition, VaR models are back tested against actual results to
Num
ber
of
day
s
37
16 12 4 2 14ensure pre-determined levels of accuracy are maintained. 0
Additional limits are placed on specific instruments and currency concentrations where appropriate. Sensitivity measures are used in addition to VaR as risk management tools. Option risks are controlled through revaluation limits on currency and volatility shifts, limits on volatility risk by currency pair and other underlying variables that determine the options’ value.
Value at Risk The Group uses historic simulation to measure VaR on all market risk related activities.
The total VaR for trading and non-trading books combined at 31 December 2004 was $15.4 million (2003: $12.2 million). Interest rate related VaR was $15.6 million (2003: $12.2 million) and foreign exchange related VaR was $3.0 million (2003: $1.3 million). The total VaR of $15.4 million recognises offsets between interest rate and foreign exchange risks. Additional information is given in note 52 on page 116.
–0.5-0 0-1 1-2 2-3 3-4 4-5 5-6 6-7 7-8 8-9 9-10
$ million
Foreign Exchange Exposure The Group’s foreign exchange exposures comprise trading, non-trading and structural foreign currency translation exposures.
Foreign exchange trading exposures are principally derived from customer driven transactions. The average daily revenue from foreign exchange trading businesses during 2004 was $1.6 million (2003: $1.3 million).
Interest Rate Exposure The Group’s interest rate exposures comprise trading exposures and non-trading structural interest rate exposures.
Structural interest rate risk arises from the differing re-pricing characteristics of commercial banking assets and liabilities.
The average daily revenue from interest rate trading businesses during 2004 was $2.2 million (2003: $2.2 million).
Annual Report and Accounts 2004 Standard Chartered 39

Financial Review
Derivatives Derivatives are contracts whose characteristics and value derive from underlying financial instruments, interest and exchange rates or indices. They include futures, forwards, swaps and options transactions in the foreign exchange and interest rate markets. Derivatives are an important risk management tool for banks and their customers because they can be used to manage the risk of price, interest rate and exchange rate movements.
The Group’s derivative transactions are principally in instruments where the mark-to-market values are readily determinable by reference to independent prices and valuation quotes or by using standard industry pricing models.
The Group enters into derivative contracts in the normal course of business to meet customer requirements and to manage its own exposure to fluctuations in interest and exchange rates.
The Group applies a potential future exposure methodology to manage counterparty credit exposure associated with derivative transactions. This is calculated by taking the cost of replacing the contract, where its mark-to-market value is positive together with an estimate for the potential future change in the market value of the contract, reflecting the volatilities that affect it. The credit risk on contracts with a negative mark-to-market value is restricted to the potential future change in their market value. The credit risk on derivatives is therefore usually small relative to their notional principal values. For an analysis of derivative contracts see notes 47 and 48 on pages 112 to 113.
Liquidity Risk The Group defines liquidity risk as the risk that, the bank either does not have sufficient financial resources available to meet all its obligations and commitments as they fall due, or can access them only at excessive cost.
It is the policy of the Group to maintain adequate liquidity at all times, in all geographical locations and for all currencies. Hence the Group is in a position to meet all obligations, to repay depositors, to fulfil commitments to lend and to meet any other commitments made.
Liquidity risk management is governed by the Group Asset and Liability Committee (GALCO). This Committee, chaired by the GED Finance and with authority derived from the Board, is responsible for both statutory and prudential liquidity. These responsibilities are managed through the provision of authorities, policies and procedures that are co-ordinated by the Liquidity Management Committee (LMC) with regional and country Asset and Liability Committees (ALCO).
Due to the diversified nature of the Group’s business, the Group’s policy is that liquidity is more effectively managed locally, in-country. Each Country ALCO is responsible for ensuring that the country is self-sufficient and is able to meet all its obligations to make payments as they fall due. The Country ALCO has primary responsibility for compliance with regulations/Group policy and maintaining a Country Liquidity Crisis Contingency Plan. A substantial portion of the Group’s assets are funded by customer deposits made up of current and savings accounts and other deposits. These customer deposits, which are widely diversified by type and maturity, represent a stable source of funds. Lending is normally funded by liabilities in the same currency.
The Group also maintains significant levels of marketable securities either for compliance with local statutory requirements or as prudential investments of surplus funds.
The GALCO oversees the structural foreign exchange and interest rate exposures that arise within the Group. Policies and terms of reference are set within which Group Corporate Treasury manage these exposures on a day-to-day basis.
Policies and guidelines for the setting and maintenance of capital ratio levels are also delegated by GALCO. Group ratios are monitored centrally by Group Corporate Treasury, while local requirements are monitored by the local ALCO.
Operational Risk Operational risk is the risk of direct or indirect loss due to an event or action resulting from the failure of technology, processes, infrastructure, personnel and other risks having an operational impact. The Group seeks to ensure that key operational risks are managed in a timely and effective manner through a framework of policies, procedures and tools to identify, assess, monitor, control and report such risks.
The Group Operational Risk Committee (GORC) has been established to supervise and direct the management of operational risks across the Group. GORC is also responsible for ensuring adequate and appropriate policies and procedures are in place for the identification, assessment, monitoring, control and reporting of operational risks.
An independent Group operational risk function is responsible for establishing and maintaining the overall operational risk framework, and for monitoring the Group’s key operational risk exposures. This unit is supported by Wholesale Banking and Consumer Banking Operational Risk units. They are responsible for ensuring compliance with policies and procedures in the business, monitoring key operational risk exposures, and the provision of guidance to the respective business areas on operational risk.
Compliance with operational risk policies and procedures is the responsibility of all managers. Every country operates a Country Operational Risk Group (CORG). The CORG has in-country governance responsibility for ensuring that an appropriate and robust risk management framework is in place to monitor and manage operational risk.
40 Standard Chartered Annual Report and Accounts 2004

Business Risk Business risk is the risk of failing to achieve business targets due to inappropriate strategies, inadequate resources or changes in the economic or competitive environment and is managed through the Group’s management processes. Regular reviews of the performance of Group businesses by the Group Management Committee, comprising Group Executive Directors and other senior management are used to assess business risks and agree management action. The reviews include corporate financial performance measures, capital usage, resource utilisation and risk statistics to provide a broad understanding of the current business position.
Compliance and Regulatory Risk Compliance and Regulatory risk includes the risk of non-compliance with regulatory requirements in a country in which the Group operates. The Group Compliance and Regulatory Risk function is responsible for establishing and maintaining an appropriate framework of Group compliance policies and procedures. Compliance with such policies and procedures is the responsibility of all managers.
Legal Risk Legal risk is the risk of unexpected loss, including reputational loss, arising from defective transactions or contracts, claims being made or some other event resulting in a liability or other loss for the Group, failure to protect the title to and ability to control the rights to assets of the Group (including intellectual property rights), changes in the law, or jurisdictional risk.
The Group manages legal risk through the Group Legal Risk Committee, Legal risk policies and procedures, and effective use of its internal and external lawyers.
Reputational Risk Reputational risk is defined as the risk that any action taken by the Group or its employees creates a negative perception in the external market place. This includes the Group’s and/or its customers’ impact on the environment. The Group Risk Committee examines issues that are considered to have reputational repercussions for the Group and issues guidelines or policies as appropriate. It also delegates responsibilities for the management of legal/regulatory and reputational risk to the business through business risk committees. In Wholesale Banking, potential reputational risks resulting from transactions or policies and procedures are reviewed and actioned through the Wholesale Banking Reputational Risk Committee. Consumer Banking’s Product and Reputational Risk Committee provides similar assurance.
Independent Monitoring Group Internal Audit is an independent Group function that reports directly to the Group Chief Executive and the Audit and Risk Committee. Group Internal Audit provides independent confirmation that Group and business standards, policies and procedures are being complied with. Where necessary, corrective action is recommended.
Hedging Policies The Group does not generally hedge the value of its foreign currency denominated investments in subsidiaries and branches. Hedges may be taken where there is a risk of a significant exchange rate movement but, in general, the management believes that the Group’s reserves are sufficient to absorb any foreseeable adverse currency depreciation. The Group also seeks to match its assets denominated in foreign currencies with corresponding liabilities in the same currencies.
The effect of exchange rate movements on the capital risk asset ratio is mitigated by the fact that both the value of these investments and the risk weighted value of assets and contingent liabilities follow substantially the same exchange rate movements.
Capital The Group believes that being well capitalised is important. The Group Asset and Liability Committee targets Tier 1 and Total capital ratios of 7-9 per cent and 12-14 per cent respectively.
Basel II The Group has a centrally managed Basel programme with work streams operating in businesses covering both credit and operational risk. Work is well advanced and the Group expects to be in line to gain compliance with the Basel Accord by 1 January 2007.
There is close alignment between the objectives of Basel II and the Group’s own best practice goals. As a leading international bank, we are concerned by the potential impact of inconsistent implementation of the Basel Accord cross border and regard this as a key industry issue for Regulators to address.
International Financial Reporting Standards (IFRS) From 1 January 2005, the Group will be required by European Directives to report its consolidated financial statements under IFRS, as endorsed by the European Union. Our first published results under IFRS will be the 2005 Interim Report. In May 2005 we intend to present to investors and analysts the impact of IFRS on the Group following the restatement of our 2004 financial statements.
The transition to IFRS represents a significant change in our accounting policies. The principal changes are:
• recording all derivatives and certain debt security assets at fair value on the balance sheet;
• recording additional bad debt charges for time-value discount provisions;
• recording interest on a ‘level yield’ basis;
• recording the cost of share options awarded to employees on a fair value basis;
Annual Report and Accounts 2004 Standard Chartered 41

Financial Review
• ceasing goodwill amortisation;
• dividends proposed but not declared are no longer accrued as a liability;
• grossing up of the balance sheet for items no longer permitted to be netted;
• consolidating certain assets and liabilities previously permitted to be off balance sheet;
• reclassification between liabilities and shareholders’ funds of certain preferred securities and shares; and
• deferred tax effect on IFRS adjustments.
IFRS does not change net cash flows or the underlying economics of our business. However, excluding the potential impact of recording all derivatives on balance sheet at fair value, we expect an increase in shareholders’ funds, particularly from not accruing dividends until declared. The cost of awarding share options to employees is expected to increase.
The accounting rules for fair valuing all derivatives is expected to cause some degree of earnings volatility in the future. Although the Group will aim to minimise this volatility, our priority will be to ensure risk is managed effectively.
Our expectation is that the impact of IFRS on the Group’s regulatory capital will be minimal.
2004 2003* $million $million
Tier 1 capital: Shareholders’ funds 8,435 7,529 Minority interests – equity 111 83 Innovative Tier 1 securities 1,246 1,155 Less: restriction on innovative Tier 1 securities (68) (160) Unconsolidated associated companies 30 13 Less: goodwill capitalised (1,900) (1,986) Add: provision for retirement benefits after tax 110 124
Total Tier 1 capital 7,964 6,758
Tier 2 capital: Qualifying general provision 335 387 Perpetual subordinated debt 1,961 1,914 Other eligible subordinated debt 3,525 2,898 Restricted innovative Tier 1 securities 68 160
Total Tier 2 capital 5,889 5,359
Investments in other banks (33) (742) Other deductions (34) (4)
Total capital 13,786 11,371
Risk weighted assets 71,096 58,371 Risk weighted contingents 21,028 19,791
Total risk weighted assets and contingents 92,124 78,162
Capital ratios: Tier 1 capital 8.6% 8.6%
Total capital 15.0% 14.5%
2004 2003* $million $million
Shareholders’ funds Equity 7,759 6,880 Non-equity 676 649
8,435 7,529
Post-tax return on equity (normalised) 20.1% 15.7%
*Comparative restated (see note 54 on page 118).
42 Standard Chartered Annual Report and Accounts 2004

Senior Management
Standard Chartered Bank The directors of Standard Chartered Bank comprise the Chairman and executive directors of Standard Chartered PLC and the following three senior executives:
Gareth Richard Bullock Timothy John Miller Joined in 1996. He is a director of Standard Chartered Bank and Joined in 2000. He is a director of Standard Chartered Bank Group Head, Strategy. Most recently he was the Group’s Chief and Group Head of Human Resources. He was previously Information Officer and prior to that, CEO Africa. He has held employed as Human Resources Director of GlaxoSmithKline’s other senior positions in the United Kingdom, Europe, Hong worldwide manufacturing operations. Age 47. Kong, China and North East Asia. Age 51.
Alun Michael Guest Rees Joined in 1990. He is a director of Standard Chartered Bank and Chief Executive Officer Wholesale Bank. He has held the positions of Chief Financial Officer of Group Treasury, Regional Treasurer in Singapore and Group Head of Global Markets. Age 48.
Group Management Committee The Group Management Committee as at 16 February 2005 comprises the directors of Standard Chartered Bank, other than Bryan Sanderson, and the following senior manager:
David Edwards Joined in 1999. He is Group Head, Risk and Group Special Assets Management. He has held the positions of Regional General Manager, Middle East and South Asia and Group Head Risk Management. Age 51.
Secretary to the Group Management Committee
Tracy Jayne Clarke Joined in 1985. She is Group Head, Corporate Affairs. She has held a variety of sales and operational positions across the Group and prior to Corporate Affairs she was Head of the Group Chief Executive’s Office. Age 38.
Annual Report and Accounts 2004 Standard Chartered 43

Board of Directors
3111 1349
6. Kaikhushru Shiavax Nargolwala* Appointed to the Board on 7 May 1999. He is Chairman of the Group’s Wholesale Banking business with responsibility for business strategy, performance and development of relationships with the Group’s key corporate and institutional clients globally. He is responsible for corporate governance across the Asia Pacific region and India and from March 2005 he will also be responsible for governance in Afghanistan, Bangladesh and Sri Lanka. He is a non-executive director of Tate & Lyle PLC and is on the Visa International Asia Pacific Regional Board. He joined Standard Chartered in 1998 as Group Head of Sales. He is based in Singapore. Age 54.
14
1. Bryan Kaye Sanderson CBE* Chairman Appointed to the Board on 9 December 2002 and as Chairman on 8 May 2003. He spent most of his career with British Petroleum, rising to become a main board director and Chief Executive of BP Chemicals before he retired in 2000. He is Chairman of BUPA and is a non-executive director of Sunderland PLC. Age 64.
2. Evan Mervyn Davies CBE* Group Chief Executive Appointed to the Board on 16 December 1997 and as Group Chief Executive on 28 November 2001. He joined Standard Chartered in 1993 with responsibility for global account management and prior to joining the Board he was based in Singapore in charge of the Group’s Corporate and Investment banking business. Before his appointment as Group Chief Executive he was executive director with responsibility for Hong Kong, China and North East Asia and for Group-wide Technology and Operations. He is a non-executive director of Tesco PLC and of Tottenham Hotspur plc. Age 52.
3. Michael Bernard DeNoma* Appointed to the Board on 12 May 2000. He is responsible for the Group’s Consumer Banking business worldwide. He joined Standard Chartered in July 1999 with responsibility for Consumer Banking in Asia. He is based in Singapore. Age 48.
44 Standard Chartered Annual Report and Accounts 2004
7
4. Christopher Avedis Keljik* Appointed to the Board on 7 May 1999. He is responsible for governance and performance in Africa, the Middle East and South Asia and has governance responsibility for the United Kingdom and the Americas. He joined Standard Chartered in 1976 and has held a number of senior positions working in London, Hong Kong, New York and Singapore in corporate finance, treasury and general management. He will retire from the Board at the Annual General Meeting on 5 May 2005. Age 56.
5. Richard Henry Meddings* Appointed to the Board on 16 November 2002. He is responsible for Risk, Group Special Asset Management, Legal and Compliance. From March 2005 he will also be responsible for governance in Africa, the Middle East, Pakistan, the United Kingdom, Europe and the Americas. Prior to his appointment, he was Chief Operating Officer, Barclays Private Clients at Barclays PLC. He was Group Finance Director of The Woolwich plc, before it was acquired by Barclays, where his responsibilities also included risk, compliance and treasury. Age 46.
5

7. Peter Alexander Sands* Appointed to the Board on 14 May 2002. He is responsible for Finance, Strategy, Technology and Operations. Prior to his appointment he was a director with worldwide consultants McKinsey & Co. He had been with McKinsey since 1988, where he worked extensively in the banking and technology sectors in a wide range of international markets. Age 43.
8. Sir CK Chow †
Appointed to the Board on 24 February 1997. He is Chief Executive Officer of MTR Corporation Limited of Hong Kong and is non-executive Chairman of Standard Chartered Bank (Hong Kong) Limited. Previously he was Chief Executive Officer of GKN plc and Brambles Industries plc. He is a fellow of the Royal Academy of Engineering, the City and Guilds of London Institute and the Institute of Chemical Engineering. He was formerly a president of the Society of British Aerospace Companies. Age 54.
9. Jamie Frederick Trevor Dundas†
Appointed to the Board on 15 March 2004. He is a non-executive director of J Sainsbury plc and Chairman of Macmillan Cancer Relief. Previously he was Chief Executive Officer of the UK property company MEPC and Finance Director of the Airport Authority Hong Kong. Age 54.
10. Valerie Frances Gooding CBE †
Appointed to the Board on 1 January 2005. She is Chief Executive Officer of BUPA and a non-executive director of Compass Group PLC. She was previously Director, Asia Pacific with British Airways, a non-executive director of BAA and of Cable & Wireless Communications plc and on the Board of the Association of British Insurers. Age 54.
11. Ho KwonPing †
Appointed to the Board on 22 October 1996. He is Chairman of Banyan Tree Holdings Pte Ltd. He is also Chairman of the Wah-Chang Group. In addition, he is Chairman of Singapore Management University, Chairman of MediaCorp and a board director of Singapore Airlines Limited. He is based in Singapore. Age 52.
12. Rudolph Harold Peter Markham†
Appointed to the Board on 19 February 2001. He is Finance Director of Unilever PLC and Unilever N.V. Age 58.
13. Ruth Markland †
Appointed to the Board on 3 November 2003. She was formerly Managing Partner Asia for the international law firm Freshfields Bruckhaus Deringer. Age 52.
14. Hugh Edward Norton †
Appointed to the Board on 7 August 1995. He was formerly a Managing Director of British Petroleum. Age 68.
15. Paul David Skinner †
Appointed to the Board on 3 November 2003. He is chairman of Rio Tinto plc, the global mining company, and was formerly a Group Managing Director of the Royal Dutch/Shell Group of companies and CEO of its global Oil Products business. He is a director of the Tetra Laval Group, the privately owned global foods packaging company, and is also a member of the board of INSEAD, the Euro-Asian business school. Age 60.
16. Oliver Henry James Stocken†
Appointed to the Board on 1 June 2004. He is Deputy Chairman of 3i plc and a non-executive director of Pilkington plc, The Rank Group PLC and GUS plc. Previously he was Group Finance director of Barclays PLC. Age 63.
Audit and Risk Committee Rudy Markham (Chairman) Jamie Dundas Ruth Markland Hugh Norton
Board Nomination Committee Bryan Sanderson (Chairman) Rudy Markham Ruth Markland Hugh Norton
Board Remuneration Committee Hugh Norton (Chairman) Ho KwonPing Ruth Markland Paul Skinner Oliver Stocken
* Director of Standard Chartered Bank. † Independent non-executive director.
8 15 62 1012 16

Report of the Directors
The directors have pleasure in submitting their report and the accounts of the Company and its subsidiaries for the year ended 31 December 2004.
Activities The Company is a holding company co-ordinating the activities of its subsidiary undertakings which are principally engaged in the business of banking and the provision of other financial services.
The Chairman’s Statement on pages 4 and 5 and the Group Chief Executive’s Review on pages 6 to 16 contain a review of the business of the Group during 2004, of recent events and of likely future developments.
Results The results for the year are set out in the consolidated profit and loss account on page 70.
Share Capital During the year 1,272,055 ordinary shares were issued under the Company’s share option schemes at prices from 334 pence to 808.5 pence.
On 14 May 2004, 2,066,122 ordinary shares were issued instead of the 2003 final dividend. On 8 October 2004, 912,977 ordinary shares were issued instead of the 2004 interim dividend.
On 14 January 2005, 117,902,943 new ordinary shares were issued as a result of an institutional placing, at a price of 920 pence per share. These shares were issued to partially fund the acquisition of Korea First Bank. Further details of this issue of ordinary shares and on other matters relating to the Company’s share capital can be found in note 38 to the accounts.
There were no repurchases of the Company’s ordinary shares and no issues or repurchases of the Company’s preference shares during 2004.
Dividends The directors recommend the payment of a final dividend for 2004 of 40.44 cents per ordinary share to be paid on 13 May 2005 to shareholders on the register on 25 February 2005. The 2004 interim dividend of 17.06 cents per ordinary share was paid on 8 October 2004, making a total of 57.50 cents for the year.
The ordinary shareholders will again be offered the choice to receive their cash dividends in sterling, Hong Kong dollars or US dollars. It is also intended that the share dividend alternative to the cash dividend will be offered during 2005.
Substantial Shareholdings As far as the directors are aware there were no shareholders as at 31 December 2004, with an interest in more than ten per cent in the Company’s issued ordinary share capital.
At 16 February 2005, the Company had been notified of the following interests of three per cent or more in its issued ordinary share capital.
Percentage of Number of issued ordinary
Shareholder ordinary shares share capital
Fidelity Investments 81,898,449 6.31 The estate of Tan Sri Khoo Teck Puat 61,663,304 4.75 Goodwood Park Hotel Limited* 64,180,842 4.95 Glen Holdings (Private) Limited* 60,762,549 4.68 The Capital Group Companies Inc 55,370,193 4.27 Legal and General Investment
Management Limited 46,626,612 3.60
* Glen Holdings (Private) Limited is 100 per cent owned by Goodwood Park Hotel Limited, therefore the interest shown for Goodwood Park Hotel Limited includes the number of shares shown for Glen Holdings (Private) Limited.
Loan Capital Details of the loan capital of the Company and its subsidiaries are set out in note 36 to the accounts.
Fixed Assets Details of the fixed assets of the Company are set out in note 22 to the accounts. Details of the fixed assets of the Group are set out in notes 24 and 25 to the accounts.
Directors The directors of the Company at the date of this report are listed on pages 44 and 45.
All of the directors, with the exception of Mr J F T Dundas, Mr O H J Stocken and Miss V F Gooding, held office throughout the year. Mr Dundas was appointed as a non-executive director on 15 March 2004 and was elected by the shareholders at the 2004 Annual General Meeting (AGM). Mr Stocken and Miss Gooding were appointed as non-executive directors on 1 June 2004 and 1 January 2005 respectively and will stand for election at this year’s AGM.
Mr D G Moir, Sir Ralph Robins and Lord Stewartby retired as directors on 11 May 2004.
Sir CK Chow, Mr Ho KwonPing, Mr R H Meddings and Mr K S Nargolwala retire from office by rotation and will offer themselves for re-election at this year’s AGM, in accordance with the Company’s articles of association. Mr C A Keljik will retire from office at this year’s AGM but will not offer himself for re-election.
Mr H E Norton has completed nine years’ service on the Board and will therefore offer himself for re-election at this year’s AGM in accordance with the recommendations of the Combined Code.
Mr Meddings and Mr Nargolwala have service contracts with a notice period of one year. Sir CK Chow, Miss Gooding, Mr Ho, Mr Norton and Mr Stocken are non-executive directors and do not have service contracts.
Directors’ Interests The directors’ beneficial interests in the ordinary shares of the Company as at 31 December 2004 are shown in the Directors’ Remuneration Report on pages 54 to 67.
46 Standard Chartered Annual Report and Accounts 2004

Significant Contracts There were no contracts of significance during the year in which any of the directors were materially interested.
Related Party Transactions Details of transactions with directors and officers and other related parties are set out in note 8 to the accounts.
Employees The Group employs some 33,000 staff in 56 countries and territories. The average number of people employed by the Group in the United Kingdom during the year was 1,177 and their total remuneration for the year was $267 million. Employees in all the territories where the Group operates have the opportunity to participate in the Group’s sharesave schemes. This encourages their contribution to the Group’s performance. Further details of the schemes are given on page 60 and in note 38 to the accounts.
The employment policies of the Group are designed to meet the relevant social, statutory and market conditions and practices in each country where the Group operates. The Group communicates systematically with its employees on a wide range of issues. This is done by briefings to managers who are encouraged to hold subsequent meetings with staff and by circulars, publications and videos.
The Group recognises its social and statutory duty to employ disabled people and has followed a policy in the United Kingdom by providing, wherever possible, the same employment opportunities for disabled people as for others. If employees become disabled every effort is made to ensure their employment continues, with appropriate training where necessary. Further details of the Group’s employees can be found in Our People on pages 18 and 19.
Areas of Operation The Group has over 550 offices, as shown on pages 125 and 126.
Major Customers Taken together, the five largest customers of the Group account for two per cent of the total interest income and other operating income of the Group in the year ended 31 December 2004.
Creditor Payment Policy Operating businesses are responsible for agreeing the terms and conditions with their suppliers in the economies where they conduct business. It is the Group’s policy to pay creditors when the amounts fall due for payment.
Standard Chartered PLC is a holding company and does not trade. Therefore, it is not considered meaningful to give a number of days’ purchases outstanding for the Company at 31 December 2004. For the Group’s operations in the United Kingdom, there were 34 days’ purchases outstanding at 31 December 2004.
Community Investment The Group recognises its responsibility to invest in the communities where it operates and to act as a good corporate
citizen. In 2004, the Group gave $6.3 million to fund the work of non-governmental organisations (of which $1.2 million was given to United Kingdom registered charities, focusing on supporting their work outside the United Kingdom). Further details of community projects can be found on pages 20 to 25.
HIV/AIDS Policy The Group is committed to addressing social, health and human rights issues confronting its employees, their families and the communities in which it operates. The Group recognises that the principal competitive advantage of any business is gained through its employees, and this advantage is only sustainable if they are healthy, skilled and motivated. HIV/AIDS directly and indirectly impacts the Group’s staff and therefore its business.
A policy on HIV/AIDS has been developed by the Group to be adopted across all the countries in which the Group operates and will apply to all staff and their families in a manner consistent with existing medical cover. A copy of the Group’s HIV/AIDS policy is available to shareholders on the Company’s website at: www.standardchartered.com/global/csr/com/com_hiv.html.
Environmental Policy The Group recognises that it should minimise any adverse impact of the conduct of business on the environment. It therefore aims to manage its businesses according to best practice with regard to the use of energy and other resources and by disposing waste responsibly; by encouraging its customers to ensure that their products, processes and businesses do not damage the environment unnecessarily; and by taking environmental considerations into account in business decisions.
A copy of the Group’s environmental report is available to shareholders on the Company’s website at: www.standardchartered.com/ourbeliefs.
Social, Ethical and Environmental (SEE) Responsibilities A report on SEE responsibilities can be found on page 53 and details of the Group’s policies on SEE risk can be found on the Company’s website: www.standardchartered.com/ourbeliefs.
Corporate Governance A report on corporate governance is included on pages 48 to 53.
Auditor A resolution will be proposed at the AGM to reappoint KPMG Audit Plc as the auditor of the Company.
Annual General Meeting The Company’s AGM will be held at 12 noon on Thursday 5 May 2005 at Merchant Taylors’ Hall, 30 Threadneedle Street, London EC2R 8JB.
By order of the Board
D J Brimacombe Group Secretary 16 February 2005
Annual Report and Accounts 2004 Standard Chartered 47

Corporate Governance
The Board of Standard Chartered PLC is responsible for ensuring proper standards of corporate governance are maintained and for accounting to shareholders.
This report has been prepared in accordance with the principles and provisions of the Code of Best Practice in the Combined Code on Corporate Governance issued by the Financial Reporting Council in July 2003 (the ‘Combined Code’). The directors confirm that the Company complies with the principles of the Combined Code except that meeting major shareholders is not currently part of the induction programme for non-executive directors and that evaluation of the performance of the Board and its committees was not carried out during 2004. Explanations of these exceptions are given in the sections on Independent Non-executive Directors and Performance Evalutation, below. Apart from the exceptions mentioned above, the following report explains how the Company applies the principles of the Combined Code.
The Company is a public company, listed on both the London and Hong Kong stock exchanges, and has sufficient share capital in public hands.
The directors confirm that, throughout the financial year, the Company complied with the provisions of Appendix 14 of the Listing Rules of The Stock Exchange of Hong Kong (the ‘HK Listing Rules’).
The directors confirm that Mrs A A Snow is the Company’s qualified accountant for the purposes of Rule 3.24 of the HK Listing Rules.
The directors confirm that the Company has adopted a code of conduct regarding securities transactions by directors on terms no less exacting than required by Appendix 10 of the HK Listing
Rules and that directors of the Company complied with this code of conduct throughout the financial period.
The Board The Board is made up of the Chairman, six executive directors and nine independent non-executive directors and is collectively responsible for the success of the Company. All the directors are subject to election by shareholders at the first Annual General Meeting (AGM) after their appointment and then to re-election at intervals of no more than three years.
The Board meets regularly and has a formal schedule of matters specifically reserved for its decision. These matters include determining and reviewing the strategy of the Company and the Group, overseeing the Group’s compliance with statutory and regulatory obligations, issues relating to the Company’s and the Group’s capital, the Group’s structure and areas of operation, financial reporting, ensuring there is a sound system of internal control and risk management, and appointments to the Board. The Board delegates matters to the executive directors and other senior management.
The Board has approximately eight scheduled meetings each year. Two of these meetings are usually held in countries where the Group operates outside the United Kingdom. The directors use these overseas visits to meet staff, corporate customers, and government and regulatory officials.
The directors are given accurate, timely and clear information so that they can maintain full and effective control over strategic, financial, operational, compliance and governance issues.
The following table shows the number of Board and Committee meetings held during the year and the attendance of individual directors.
Board Board Audit & Risk Remuneration Nomination (Scheduled) (Ad hoc) Committee Committee Committee
Number of meetings in year 8 4 6 6 5
B K Sanderson 8 4 – – 3 E M Davies 8 4 – – – Sir CK Chow 7 3 – – – M B DeNoma 8 4 – – – J F T Dundas* 7 – 4 – – V F Gooding*** – – – – – Ho KwonPing 5 1 – 5 – C A Keljik 8 4 – – – R H P Markham 6 4 6 – 3 R Markland 8 4 6 – 4 R H Meddings 8 3 – – – K S Nargolwala 8 4 – – – H E Norton 7 3 4 6 5 P A Sands 8 4 – – – P D Skinner 8 3 – 4 – O H J Stocken** 4 1 – 1 –
*Appointed to the Board on 15 March 2004.
**Appointed to the Board on 1 June 2004.
***Appointed to the Board on 1 January 2005.
48 Standard Chartered Annual Report and Accounts 2004

The directors have a range of skills and experience and each brings an independent judgement and considerable knowledge to the Board’s discussions. On appointment, each director receives a full, formal, tailored induction covering the Group’s business and operations and also the legal, regulatory and other obligations of a director of a dual listed company. As well as formal induction, directors receive training through a formal and structured programme to continually develop and update their knowledge and capabilities. Where an independent non-executive director is appointed to one of the Board’s standing committees, additional training is given which is relevant to the committee appointment.
The independent non-executive directors appointed during 2004 have completed their induction programmes.
The Company has arranged appropriate insurance cover in respect of legal proceedings and other claims against its directors.
The Board’s executive directors are not allowed more than one non-executive directorship of a FTSE 100 company.
During the year, the Chairman of the Board, Mr B K Sanderson, stepped down as chairman of Sunderland PLC, but remained as a non-executive director, Mr E M Davies was appointed as a non-executive director of Tottenham Hotspur plc and Mr K S Nargolwala was appointed as a non-executive director of Tate & Lyle PLC. Details of the directors’ other directorships can be found on pages 44 to 45.
Chairman and Group Chief Executive The roles and objectives of the Chairman, Mr B K Sanderson, and the Group Chief Executive, Mr E M Davies, are separate and have been approved by the Board.
Independent Non-executive Directors The Board considers that all of the non-executive directors are independent and has received from each of them the annual confirmation of independence required by the HK Listing Rules. The names and biographies of the non-executive directors are set out on page 45. The non-executive directors are appointed for specific terms and are subject to periodic re-appointment in accordance with the Company’s articles of association. The Chairman has regular meetings with the non-executive directors without the executive directors being present.
The proposals for the re-election of non-executive directors who have served on the Board for more than six years are covered in the section on the work of the Board Nomination Committee below.
Mr H E Norton is the Senior Independent Director and can be contacted in writing at the Company’s registered office.
Although not part of their induction programme, the non-executive directors have the opportunity to attend meetings with major shareholders and analysts and they receive, in a timely manner, accurate information reflecting the views of the Company’s institutional shareholders and other stakeholders. Major shareholders are offered the opportunity to meet with the Senior Independent Director to discuss any issues or concerns.
The Board is aware of the other commitments of its non-executive directors and is satisfied that these do not conflict with their duties as directors of the Company.
Changes to the commitments of the non-executive directors are reported to the Board.
The terms and conditions of the non-executive directors’ appointments are available for inspection at the Company’s registered office.
Board Committees During 2003, an external review of the Board committee structure was carried out and in 2004, following this review, the Board appointed a separate Nomination Committee.
The Board now has three standing committees with specific delegated authorities: the Board Nomination Committee, the Board Remuneration Committee and the Audit and Risk Committee. Details of these committees and their members are given below.
The Board Nomination Committee The members of the Board Nomination Committee are:
Mr B K Sanderson (Chairman) Ms R Markland Mr R H P Markham Mr H E Norton
All of the Committee members, with the exception of Mr Sanderson, are independent non-executive directors.
The Committee’s responsibilities include:
• reviewing the structure, size and composition of the Board and making recommendations with regard to any adjustments that the Committee deems necessary to ensure the Board has the optimum balance of skills, knowledge and experience;
• where Board vacancies arise, evaluating the skill, knowledge and experience needed to fill the vacancy, and identifying and nominating suitable candidates to the Board; and
• keeping under review the succession plans for the Group relating to both directors and other senior executives and making consequential recommendations to the Board.
The Committee is also responsible for making recommendations for the appointment of the Group Chairman, Group Chief Executive or any other director. The Group Chairman will not chair any meeting at which the Committee is considering the appointment of a successor to the Group Chairman.
Annual Report and Accounts 2004 Standard Chartered 49

Corporate Governance
Significant changes to the external commitments of the Group Chairman are reported to the Board for its approval.
In the selection process for new directors, the Committee can consult external advisors and an external search consultant was used in the selection process for the three appointments detailed below.
Two independent non-executive directors were appointed during 2004, Mr J F T Dundas and Mr O H J Stocken, and a further independent non-executive director, Miss V F Gooding, was appointed in January 2005. Before recommending these appointments the Committee considered the suitability of the candidates against the skills, knowledge and experience required to produce a balanced board. In addition, the Committee took into account whether the candidates would have an appropriate amount of time to devote to their duties. The Committee considered that the candidates’ respective skills would substantially contribute to the Board and unanimously recommended that the Board consider their appointment.
The Committee considered carefully the cross directorships which the Chairman and Miss Gooding would hold following her appointment to the Board and after detailed deliberation was entirely satisfied that these cross directorships would not impair Miss Gooding’s independence in the conduct of her duties as a director of the Company. The Board fully debated the issue before reaching an informed decision to appoint Miss Gooding. The Chairman did not participate in the meeting of the Nomination Committee held on 2 November 2004 at which Miss Gooding’s appointment and independence were considered. In addition, the Chairman did not participate in the subsequent discussions of the Board regarding her appointment and independence.
The Committee reviewed the performance of the three directors noted below and made recommendations to the Board on their re-election:
Sir CK Chow and Mr Ho KwonPing have served on the Board for more than six years and, at the 2005 AGM, will retire by rotation in accordance with the Company’s articles of association, and stand for re-election. The Committee has carried out a rigorous review of the performance of these two independent non-executive directors and their contribution to the deliberations of the Board during 2004. The Committee, as part of its review, has taken into account the need for progressive refreshing of the Board and it believes that both Sir CK Chow and Mr Ho continue to be committed to the Company and independent in character and judgement. The Committee therefore fully supports the re-election of Sir CK Chow and Mr Ho as independent non-executive directors of the Company.
Mr H E Norton has served on the Board for more than nine years and at the 2005 AGM will offer himself for re-election in accordance with the provisions of the Combined Code. Having carried out a rigorous review of Mr Norton’s performance and contribution to the decisions made by the Board during 2004, the Committee believes Mr Norton continues to be independent in character and judgement. In addition, taking into account the changes to the Board over the previous year, it believes that Mr Norton’s long experience as a director will be invaluable to the Board in its development over the next year. The Committee therefore fully supports the proposal to re-elect Mr Norton as an independent non-executive director for a further year.
The Board Remuneration Committee The members of the Board Remuneration Committee are:
Mr H E Norton (Chairman) Mr P D Skinner Mr Ho KwonPing Mr O H J Stocken Ms R Markland
All of the Committee members are independent non-executive directors. The Committee determines the pay and benefits of the Group Chairman, executive directors and senior management. The remuneration of all directors and senior management is subject to regular monitoring to ensure that levels of remuneration and compensation are appropriate.
A statement of the Company’s remuneration policy for directors and details of the work of the Committee are included in the Directors’ Remuneration Report on pages 54 to 67.
The Audit and Risk Committee The members of the Audit and Risk Committee are:
Mr R H P Markham (Chairman) Ms R Markland Mr J F T Dundas Mr H E Norton
All the members of the Committee are independent non-executive directors. The Committee’s chairman, Mr Markham, is a qualified accountant and has recent and relevant financial experience.
In 2003, the Committee increased the number of meetings it has each year to six. This reflects the importance the Board attaches to the role of the Committee and the amount of work it is required to carry out.
The Committee reviews and monitors the integrity of the Company’s annual and interim financial statements, circulars to shareholders and any formal announcements relating to the Group’s financial performance, including significant financial reporting judgements contained in them. It keeps under review the appropriateness of the Group’s accounting policies and considers changes to them. Ultimate responsibility for the approval of the annual and interim financial statements rests with the Board.
50 Standard Chartered Annual Report and Accounts 2004

At least once a year, the Committee meets with the external auditor and Group Head of Internal Audit without other management being present to discuss matters relating to the auditor’s remit and any issues arising from the audit.
In relation to the Group’s internal audit function the Committee’s responsibilities include:
• monitoring and assessing the role and effectiveness of the Group’s internal audit function and receiving reports from the Group Head of Internal Audit on these matters; and
• considering the appointment, resignation or dismissal of the Group Head of Internal Audit.
In relation to the Group’s external auditor the Committee’s responsibilities include:
• considering and making recommendations to the Board on the appointment, re-appointment, resignation or dismissal of the external auditor;
• approving the terms of engagement, nature and scope of the audit;
• reviewing the findings of the audit including any major issues that arose during the course of the audit; and
• reviewing and monitoring the cost effectiveness of the audit taking into consideration relevant UK professional and regulatory requirements and approving the audit fee.
The Committee reviews the Group’s internal financial controls and the Group’s internal control and risk management systems and reports on these to the Board. Details of the Company’s internal controls and how risk is managed can be found below under the heading ‘Internal Controls’.
Arrangements have been put in place by which the Company’s employees may, in confidence, raise concerns about possible improprieties in matters of financial reporting or other matters. These arrangements are covered in the Company’s ‘Speaking Up’ policy, commonly known as a ‘whistle-blowing policy’. The Audit and Risk Committee is responsible for reviewing these arrangements and for ensuring that any matters of concern are investigated.
Auditor Independence and Objectivity The Company has adopted a policy on the use of non-audit services provided by the Company’s external auditor, KPMG Audit Plc (KPMG). The Committee’s pre-approval is required before the Company uses non-audit services that fall within definitions contained in the policy. The non-audit services of KPMG will only be used where the Company benefits in a cost-effective manner and the auditor maintains the necessary degree of independence and objectivity.
In addition to audit related services, KPMG provided the following types of services:
• taxation advice, including planning and compliance;
• advice and support with due diligence exercises;
• advice on IFRS accounting;
• regulatory reviews and reporting;
• anti-money laundering advice;
• corporate recovery services; and
• risk and compliance advisory services.
Details of the amounts paid to KPMG during the year for audit and non-audit services are set out in note 5 to the accounts.
Terms of Reference The schedule of matters reserved for the Board and the terms of reference for the Board Nomination Committee, the Board Remuneration Committee and the Audit and Risk Committee are available on the Company’s website and available for inspection at the Company’s registered office.
Independent Professional Advice Directors may, in appropriate circumstances, take independent professional advice at the Company’s expense. All of the directors have access to the Company Secretary, who is responsible for ensuring that Board procedures are followed and that applicable laws and regulations are complied with. The appointment and removal of the Company Secretary is a matter for the whole Board.
The Board’s standing committees are able to take independent professional advice or use external consultants, where appropriate, at the Company’s expense.
Performance Evaluation The Board is responsible for ensuring that a rigorous evaluation is carried out of its performance, and that of its committees and individual directors.
During 2003, an independent external consultant carried out an evaluation of the Board’s effectiveness. The results of the evaluation were presented to the Chairman and the Board as a whole at the end of 2003. Due to the substantial number of changes to the Board and its committees during 2004, it was not considered appropriate to undertake an evaluation of Board or committee performance. A full and rigorous evaluation of the Board’s performance and that of its committees and individual directors will be carried out during 2005.
Annual Report and Accounts 2004 Standard Chartered 51

Corporate Governance
Relations with Shareholders The Board recognises the importance of good communications with all shareholders. There is a regular dialogue with institutional shareholders and general presentations are made when the financial results are announced. The AGM is used as an opportunity to communicate with all shareholders.
The Combined Code and the HK Listing Rules require companies to post the notice of the AGM to shareholders at least 20 working days before the date of the meeting. The Company aims to achieve this and will always give shareholders the 21 days’ notice required by the UK Companies Act. Separate resolutions are proposed for each substantially separate issue. The Company displays the proxy voting results on each resolution at the AGM. The notice of AGM is also available on audio cassette and CD.
The Company encourages its shareholders to receive the Company’s corporate documents electronically. The annual and interim financial statements, notice of AGM and dividend circulars are all available electronically. Shareholders are also able to vote electronically on the resolutions being put to the AGM.
Going Concern The Board confirms that it is satisfied that the Group has adequate resources to continue in business for the foreseeable future. For this reason it continues to adopt the going concern basis when preparing the financial statements.
Internal Control The Board is committed to managing risk and to controlling its business and financial activities in a manner which enables it to maximise profitable business opportunities, avoid or reduce risks which can cause loss or reputational damage, ensure compliance with applicable laws and regulations, and enhance resilience to external events. To achieve this, the Board has established a process for the identification, evaluation and management of the risks faced by the Group which operated through the year ended 31 December 2004 and to 16 February 2005, the date the Board approved this annual report and accounts. It should be recognised that such a process can only provide reasonable, not absolute, assurance against material misstatement or loss. This process is reviewed regularly by the Board and meets the requirements of the guidance entitled ‘Internal Control: Guidance for Directors on the Combined Code’ issued by the Institute of Chartered Accountants in England and Wales in 1999. The system of internal control of the Group is also subject to regulatory oversight in the United Kingdom and overseas.
The Financial Review on pages 26 to 42 describes the Group’s risk management structure. The Group’s business is conducted within a developed control framework, underpinned by policy
statements, written procedures and control manuals. This ensures that there are written policies and procedures to identify and manage risk including operational risk, country risk, liquidity risk, regulatory risk, legal risk, reputational risk, market risk and credit risk. The Board has established a management structure that clearly defines roles, responsibilities and reporting lines. Delegated authorities are documented and communicated. Executive risk committees regularly review the Group’s risk profile.
The performance of the Group’s businesses is reported regularly to senior line management and the Board. Performance trends and forecasts, as well as actual performance against budgets and prior periods, are closely monitored. Financial information is prepared using appropriate accounting policies, which are applied consistently. Operational procedures and controls have been established to facilitate complete, accurate and timely processing of transactions and the safeguarding of assets. These controls include appropriate segregation of duties, the regular reconciliation of accounts, and the valuation of assets and positions.
The effectiveness of the Group’s internal control system is reviewed regularly by the Board, its committees, Group management, and Group Internal Audit. Group Internal Audit monitors compliance with policies and standards and the effectiveness of internal control structures across the Group. The work of Group Internal Audit is focused on the areas of greatest risk as determined by a risk assessment approach. Group Internal Audit reports regularly to the Audit and Risk Committee, the Chairman and to the Group Chief Executive. The findings of all adverse audits are reported to the Group Chief Executive and immediate corrective action is required.
The Audit and Risk Committee has reviewed the effectiveness of the Group’s system of internal control during the year ended 31 December 2004 and reported to the Board. The review was supported by an annual business self-certification process, which was managed by Group Internal Audit. The Committee has also reviewed the recommendations for provisions against bad or doubtful loans and other credit exposures.
During the year ended 31 December 2004, Standard Chartered Bank entered into a Written Agreement with the Federal Reserve Bank of New York and the New York State Banking Department to address deficiencies relating to compliance with applicable federal and state laws, rules and regulations governing anti-money laundering. Significant remediation is underway and is being closely monitored by the Board. In February 2004, the Financial Services Agency (FSA) of Japan issued Standard Chartered Bank with a Business Improvement Order (BIO) relating to Know Your Customer and Suspicious Activity Reporting. Standard Chartered Bank has communicated to the FSA of Japan that all BIO related actions are complete.
52 Standard Chartered Annual Report and Accounts 2004

Group Code of Conduct The Board has approved a Group Code of Conduct relating to the lawful and ethical conduct of business. These requirements are linked to the Group’s five core values. The Group Code of Conduct has been communicated to all employees. All employees are expected to observe high standards of integrity and fair dealing in relation to customers, staff, and regulators in the communities in which the Group operates.
Corporate Responsibility and Community Committee In February 2005, the Board established a Corporate Responsibility and Community Committee, to help align business strategy with the Group’s corporate responsibility aspirations.
The Corporate Responsibility and Community Committee with the Group Chairman, Mr B K Sanderson, as its chairman, will deal with matters relating to the environment, diversity and inclusion, sponsorship, community and social investment and other corporate responsibility and community matters as it or the Board deem necessary.
Social, Ethical and Environmental Responsibilities Standard Chartered complies with the guidelines issued by the Association of British Insurers on socially responsible investment and reporting on social, ethical and environmental (SEE) matters and is committed to the communities and environments in which it operates. The Board is responsible for ensuring that high standards of responsible business are maintained and that an effective control framework is in place. Standard Chartered has established and maintains policies and procedures in relation to SEE related risks. Details of these policies can be found on the Company’s website: www.standardchartered.com/ourbeliefs. Through the Group’s risk management structure and control framework, the Board receives regular and adequate information to identify and assess significant risks and opportunities arising from SEE matters. Formal training arrangements are in place for key SEE issues, including arrangements for directors.
Designated policy owners monitor risks in their area. They also work with line management to assist them in designing procedures to ensure compliance with these requirements. In every country, the Country Management Committee (Manco) supported by the Country Operational Risk Group (CORG) is responsible for ensuring there are risk management frameworks in place to monitor, manage and report SEE risk. The Country Chief Executives chair both the Mancos and CORGs.
Compliance with these policies and procedures is the responsibility of all managers. In assessing, incentivising and rewarding performance, guidance to managers was published during 2002. This explicitly states that account should be taken of adherence to all relevant Group policies, including those associated with SEE risk. Significant exceptions and emerging risks are escalated to senior management through clearly documented internal reporting procedures such as Manco. Group Internal Audit monitors compliance with policies and standards and effectiveness of the Group’s internal control structures through its programme of business audits and annual ‘Turnbull Review’.
Key areas of risk are those associated with customers’ social issues and any impact they may have on the natural environment. The Board recognises its responsibility to manage these risks and that failure to manage them adequately would have an adverse impact on the Group’s business. These risks are implicitly recognised in reaching lending decisions explicitly identified in the Group’s lending policies. During 2003, the Group adopted the Equator Principles that set procedures, based on the International Finance Corporation guidelines, for recognising the environmental and social impacts and risks associated with project finance. The Principles have been embedded in our project finance lending policy and procedures.
The Group continues to review and, where appropriate, strengthen its money laundering prevention policies, procedures and training.
The Board is not aware of any material exceptions to its policies.
Annual Report and Accounts 2004 Standard Chartered 53

Directors’ Remuneration Report
This report has been prepared by the Board Remuneration Committee and has been approved by the Board as a whole.
The report is structured into the following sections:
• background information on the Board Remuneration Committee’s (the Committee) members and advisors;
• the remuneration policy of the Group, executive directors and other employees;
• outline of the remuneration arrangements for executive directors and non-executive directors;
• more detailed information on the Group’s share plans;
• tabular information on directors’ emoluments, pension arrangements and share awards; and
• tabular information on highest paid individuals.
Background information on the Committee Committee Membership The Committee is made up exclusively of independent non-executive directors. The members of the Committee are Mr H E Norton (Committee Chairman), Mr Ho KwonPing, Mr P D Skinner (appointed 11 May 2004), Mr O H J Stocken (appointed 1 November 2004) and Ms R Markland (appointed 1 January 2005). Lord Stewartby and Sir Ralph Robins served as members of the Committee until 11 May 2004.
Role of the Committee The Committee meets at least five times a year. Details of attendance at meetings by Committee members is shown on page 48.
The Committee has specific terms of reference. It considers and recommends to the Board the Group’s remuneration policy and agrees the individual remuneration packages of the Group Chairman, Group Chief Executive and all other executive directors. The Committee also reviews and approves the remuneration of other highly paid senior management of the Group.
No directors are involved in determining their own remuneration.
Advisors to the Board Remuneration Committee During the year, the Committee appointed Kepler Associates as independent advisors to the Committee. Kepler advise the Committee, as and when required, on a range of executive compensation related issues. Kepler do not provide any other advice/services to the Group.
In addition, the Committee received advice from the Group Head of Human Resources (Mr T J Miller) and the Senior Reward Manager (Mr N A Cuthbertson). Their advice draws on formal remuneration survey data provided by McLagan Partners and Towers Perrin. Towers Perrin also provided advice to the Group on executive compensation issues and, together with Clifford Chance LLP, on the design and operation of the Group’s share plans. Clifford
Chance LLP also advise on issues relating to executive directors’ contracts. In addition to the above advice, Towers Perrin also provides retirement, benefit and welfare consulting services to the Group in North America and other jurisdictions.
Data required for the analysis of comparative Total Shareholder Return (for the Group’s Performance Share Plan and for the comparator performance graph disclosed in this report) is provided by Thomson Financial.
Remuneration Policy Group The success of the Group depends upon the performance and commitment of talented employees. The Group’s remuneration policy is, and will continue to be, to:
• support a strong performance-oriented culture and ensure that individual rewards and incentives relate directly to the performance of the individual, the operations and functions in which they work or for which they are responsible, the Group as a whole and the interests of shareholders; and
• maintain competitive awards that reflect the international nature of the Group and enable it to attract and retain talented executives of the highest quality internationally. Many of the Group’s employees bring international experience and expertise to the Group and the Group recognises that it recruits from an international marketplace.
The Committee continually reviews the remuneration policy against significant regulatory developments, market practice and shareholder expectations.
Executive Directors Target remuneration levels for the executive directors are set with reference to the median of the FTSE 30 and the Group’s international competitors. These two groupings have business characteristics similar to the Group such as international scope of operations, complexity and size (both in financial terms and with regard to numbers of employees).
Although target remuneration levels are aligned to the market median, excellent performance by both the Group and by the individual executive director is rewarded with higher bonus levels and share awards, taking potential total compensation to the upper quartile or higher of the Group’s key international competitors.
As the table below demonstrates, each executive director’s target remuneration is structured to give the heaviest weighting to performance-related elements.
Base salary 35% Cash bonus 30% Share options/awards* 35%
* Includes the element of the annual bonus deferred in shares and an expected value of target share awards.
54 Standard Chartered Annual Report and Accounts 2004

Summary of recent changes in the approach to executive compensation Variable compensation structure Since the end of 2003, the Committee has implemented a series of changes designed to provide a better mix of performance related compensation, while keeping the overall value of incentives awarded to executives for on-target performance broadly unchanged.
• Increased the target level for annual bonuses.
• Introduced an automatic deferral in shares of one-third of any bonus.
• Placed greater reliance on performance shares compared to executive share options.
Share plans • Implementation of a new sliding scale performance condition
under the option scheme from 2004.
• Removal of the retesting for all options grants since the beginning of 2004.
Directors’ contracts • Implementation of new contracts which removed notice
periods in excess of 12 months and included a payment in lieu of notice (PILON) clause with mitigation and instalment provisions.
Shareholding guidelines • Introduction of new Group shareholding guidelines, which
shareholders approved in 2003.
• Core benefits are provided to all employees worldwide based on local regulations and competitive practice. These will normally include retirement benefits, medical insurance, life assurance and annual leave.
• All employees are eligible to receive an award under one or more of the Group’s discretionary share schemes depending on performance and potential. The Group is actively looking to increase the level of equity participation enabling more employees to share in the Group’s success, rewarding and retaining talent throughout the Group at all levels. In 2003, over 700 employees received a discretionary share award for the first time. In 2004, a further 1,250 were added to this total.
• The Group is keen that an element of each employee’s total compensation is performance related. The proportion of this variable compensation (which might be delivered through bonus and share awards) increases the more senior the executive is. In addition, as the chart below shows, the balance of shares as opposed to cash also increases with seniority. The chart also shows the typical level of target variable compensation for senior executives/management (the Group’s bands 1-4) expressed as a percentage of base salary.
Breakdown of target variable compensation between cash and shares
200
150
as %
of
bas
e
100
Other Employees Although the focus of this report is principally on executive directors, the Committee considers the remuneration policy in the context of all employees across the Group.
Potential total compensation is set at upper quartile or higher for excellent individual and business performance. Base salaries of employees are determined in a similar way as for executive directors. The Group’s approach is to ensure that total target compensation is benchmarked to the median of the relevant market in which the individual is employed. In addition,
• All employees are eligible to receive a discretionary bonus dependent upon performance and their contractual position.
• All employees are eligible to participate in the Group’s all employee sharesave schemes.
50
0 Group Band 1 Band 2 Band 3 Band 4
Executive Directors
Band of executive
Delivered in shares (based on Delivered as cash expected value and as % of base) bonus (as % of base)
Although the above principles apply Group wide, there is some variation in how compensation is delivered. The Group employs more than 33,000 employees worldwide in 56 countries and territories. There are differing local market conditions which means compensation is often structured in different ways (for example, base salaries are not always the only element of core compensation).
Annual Report and Accounts 2004 Standard Chartered 55

Directors’ Remuneration Report
Remuneration arrangements for executive and non-executive directors Executive Directors Base Salaries The Group policy is that base salary levels are set with reference to the median of the FTSE 30 and the Group’s key international competitors. Salary levels are reviewed annually by the Committee taking account of the latest available market data as well as the performance of the individual executive.
Any increases in annual base salary are effective from 1 April of the relevant year. The average salary increase for executive directors in 2004 (effective 1 April 2004) was nine per cent. The annual base salary levels of executive directors as at 31 December 2004 were as follows:
B K Sanderson $587,000 (£320,000) E M Davies $1,375,000 (£750,000) M B DeNoma $761,000 (£415,000) C A Keljik $761,000 (£415,000) R H Meddings $761,000 (£415,000) K S Nargolwala $761,000 (£415,000) P A Sands $871,000 (£475,000)
Annual Performance Bonus Key Features Executive directors are eligible to receive a discretionary annual bonus. The target and maximum award levels for executive directors remain at 125 per cent and 200 per cent of base salary. Two-thirds of any bonus payment is payable immediately in cash. The balance is contributed to an employee benefit trust so that the trustee can acquire shares in the Company, which are then held for up to one year before being released to the executive. The deferred element is forfeited if the executive leaves voluntarily during that period. From 2005 onwards, dividends will be accrued on any shares held in the trust during the vesting period and delivered in the form of a share dividend.
Determining Award Levels Annual bonus awards are made wholly on the basis of Group and individual performance.
The Committee assesses Group performance by considering a number of quantitative and qualitative measures, including earnings per share; revenue growth; costs and cost control; bad debts; pre-tax profits; risk management; cost to income ratio and customer service. When determining award levels, the Committee ensures that bonuses are consistent with the overall performance. It also compares the financial performance of the Group with the anticipated financial performance (as provided by broker forecasts) of its key international competitors.
Individual performance is appraised taking account not only of the results achieved by the individual but also their support of the Group’s values and contribution to the collective leadership of the Group. This principle is also applied throughout the organisation.
Each executive director has written objectives which are presented to the Committee at the start of the financial year and then assessed at the year end.
The importance of individual performance as a determinant of the level of awards is reflected in the variation of actual bonus award levels made to executive directors in recent years.
Min award Max award Max award made level Target award permitted
(as multiple of (as multiple of (as multiple of (as multiple of base salary) base salary) base salary) base salary)
2004 156% 200% 125% 200% 2003 83% 162% 125% 200%
Long Term Incentives In order to align the interests of executive directors with those of shareholders, the executive directors are eligible to participate in two of the Group’s share incentive schemes, the 2001 Performance Share Plan (PSP) and the 2000 Executive Share Option Scheme (2000 scheme). In 2003/2004 the Committee undertook a review of its long term incentive arrangements for executive directors and concluded that increased flexibility was required in the way in which the Group can reward executive directors and its most senior executives. One aspect of the proposals was to place greater emphasis on performance shares rather than share options while maintaining the overall value of awards. Shareholders approved a proposal to increase the maximum level of awards under the PSP from 100 per cent to 200 per cent of base salary. Target levels under the 2000 scheme fell from 300 per cent to 100 per cent but increased under the PSP from 75 per cent to 100 per cent.
Both the above schemes are designed to provide competitive long-term incentives, which are only exercisable upon the achievement of stretching performance criteria. The significance of such programmes as a percentage of executive directors’ total potential remuneration is one of the strongest indicators of the Group’s commitment to paying for demonstrable performance. Awards under these schemes are entirely discretionary and are based on individual directors’ performance.
As shown in the table below, there is considerable variation in the levels of share awards made to executive directors, illustrating the importance the Group places on individual performance. A performance test is therefore effectively applied both at the time of award and upon vesting. The table shows the face value of the awards made in 2004 (2003 awards are in brackets).
Max grant Min award Max award Target permitted in 2004 (as in 2004 (as award under rules
multiple multiple (as multiple (as multiple Name of plan of salary of salary of salary) of salary)
Executive Share Option Scheme 65% 200% 100% 600%
(2003: 200%) (2003: 400%)
Performance Share Plan 100% 200% 100% 200%
(2003: 75%) (2003: 100%)
56 Standard Chartered Annual Report and Accounts 2004

Executive directors are not generally eligible to participate in the 1997 Restricted Share Scheme. However, upon recruitment to the Group, awards may be made on an exceptional basis, for example, to newly appointed executive directors to compensate such directors for share awards forfeited on leaving their previous employer.
Retirement Benefits All of the executive directors, except the Chairman, are eligible for retirement benefits. The Group policy is to provide a retirement benefit equivalent to two-thirds of base salary for those who have completed at least 20 years’ service with the Group at retirement. The retirement benefits are provided through a combination of approved and/or unapproved defined benefit and cash structures depending upon when the executive director joined the Group and his geographical location. Executive directors are given the opportunity to waive a proportion of any potential bonus to enhance their unfunded unapproved retirement benefits. Any amounts waived in respect of 2004 are shown on page 63 and the additional pension benefits have been calculated by the Group’s actuary using the assumptions adopted for FRS17 reporting.
The defined benefit plans comprise a combination of the Standard Chartered Pension Fund, an approved non-contributory scheme, and an unapproved unfunded retirement benefit scheme. The unapproved unfunded retirement benefit scheme provides that part of the benefit which cannot be delivered through the approved plan. In other respects the terms of the unapproved scheme are designed to mirror the provisions of the Standard Chartered Pension Fund. For example, both have a normal retirement age of 60 and a spouse’s pension of 60 per cent of the member’s pension on death after retirement. On the death in service of an executive director, pension benefits are available to a spouse and dependent children and a lump sum is payable.
Base salary is the only element of remuneration which is pensionable. Retirement benefits are not designed to be performance-related.
The Group’s current pension arrangements are being reviewed in the light of the government’s proposals on pension simplification. However, as yet no decisions have been made regarding what, if any, changes will be made to the Group’s pension arrangements.
Executive Directors’ Contracts of Employment The Group policy is for all executive directors to receive and be required to give 12 months’ notice. In 2003 the executive directors’ contracts were amended to remove the extended 24-month notice period which applied following a change of control of the Company. Mr B K Sanderson’s contract did not contain such a provision and, therefore, no such change was made to his contract. The Committee continues to monitor the appropriateness of its policy on directors’ contracts in the light of market practice and guidelines on corporate governance to ensure that the Group continues to attract and retain executive directors of the highest quality with commensurate experience.
The dates of the executive directors’ contracts of employment are as follows: Mr B K Sanderson – 28 November 2002; Mr M B DeNoma and Mr K S Nargolwala – 11 December 2003; Mr R H Meddings – 12 December 2003; Mr C A Keljik – 16 December 2003; Mr E M Davies and Mr P A Sands – 31 December 2003.
All executive directors have contracts subject to 12 months’ rolling notice. With the exception of Mr B K Sanderson, whose contract expires on 14 October 2008, these terminate automatically at the first annual general meeting following the executive director’s 60th birthday. The provisions of the contracts are summarised below:
Executive Directors (except Mr B K Sanderson) The contracts contain payment in lieu of notice (PILON) provisions which can be exercised at the Group’s discretion. The PILON would comprise an amount equal to 12 months’ base salary, pension contributions/entitlement and certain benefits and allowances (such as life assurance and car allowance). The amount of any bonus payable as part of a PILON is determined by the Committee taking into consideration individual and Group performance. Any payment under the PILON would be paid in quarterly instalments and be subject to mitigation.
There are special provisions which apply in the event that the company terminates the executive’s contract in the 12 months following a change of control without giving notice. These provide that, if the executive’s contract is terminated by the Group (other than where summary dismissal is appropriate or the executive serves out notice), the Group will pay in four equal instalments an amount equal to 12 months’ base salary, pension contributions/ entitlement and certain benefits and allowances. The amount of bonus payable in respect of the 12 months following the date of termination is the executive’s target bonus. The amount of bonus payable in respect of the performance period which the executive director worked prior to termination will be decided by the Committee taking into consideration individual and Group performance, unless such a period is less than six months, in which case a pro rata target bonus is payable.
Mr B K Sanderson The contract contains clauses specifying payments in the event of early termination by the Group (other than where summary dismissal is appropriate). In such circumstances the contract provides for payment that would take account of his base salary and certain allowances, but excludes non-cash benefits and performance related bonus for the relevant period of notice.
During the year, the Committee reviewed the existing compensation arrangements for the Chairman. In 2004, he received a base salary and participated in the Group's annual bonus plan and discretionary share plans. Following the review, the arrangements have been restructured, with effect from 1 January 2005, in the light of current considerations of best practice. The new arrangement comprises a base salary of £375,000 and an award
Annual Report and Accounts 2004 Standard Chartered 57

Directors’ Remuneration Report
of shares equal in value, based on the share price at the end of 2004. This arrangement will remain unchanged for two years, after which it will again be reviewed against prevailing market practice for roles of this type.
Non-executive Directors Non-executive Directors of Standard Chartered PLC The fees of the non-executive directors are determined by the executive directors only and are non-pensionable. Non-executive directors’ fees are reviewed at least every two years and, as with executive directors’ remuneration, reflect the international nature of the roles which they perform. Basic annual fees and committee
Audit and Risk $18,328 (£10,000) $64,148 (£35,000) Nomination $5,499 (£3,000) N/A N/A* Remuneration $18,328 (£10,000) $45,820 (£25,000)
* B K Sanderson is chairman of the Nomination Committee. As Group Chairman, he does not receive any fees in his capacity as a member of the Nomination Committee.
Further detail on non-executive directors’ remuneration is set out on page 62.
Details of Non-executive Directorships held by the Chairman and Executive Directors Certain directors have been released from their duties to serve as non-executive directors of other companies. Full details of directorships are contained on page 44. Details of non-executive fees are shown below:
Performance Graph The graph below shows the Group’s total shareholder return performance on a cumulative basis over the last five years alongside the total shareholder return of the FTSE 100 and of the comparator group used for the Group’s Performance Share Plan. The FTSE 100 provides a broad comparator group against which the Group’s shareholders may measure their relative returns. The Company is a constituent member of the FTSE 100 Index and the London Stock Exchange is the principal exchange for the Company’s shares.
Total Shareholder Return Performance Graph
fees are set to be competitive against the Group’s international comparator group. The non-executive directors’ fees were reviewed in April 2004. Increases in fee levels, particularly for involvement in committees, reflect, in part, the growing regulatory and governance responsibilities resulting in an increase in the time commitment required by non-executive directors.
Current basic annual fees are $100,804 (£55,000) with additional fees for ordinary membership or chairmanship of a Board committee as follows:
Committee Ordinary membership Chairmanship
70
90
110
FTSE 100 Median of comparator group
Per
cent
age
chan
ge in
TS
R o
ver
the
five
year
per
iod
100
130 Standard Chartered
Data provided by Thomson Financial 50 Jan-00 Jan-01 Jan-02 Jan-03 Jan-04 Jan-05
More Detailed Information on the Group’s Share Plans 2001 Performance Share Plan (the Plan) Outline of the Plan The Plan is designed to be an intrinsic part of total remuneration for the Group’s executive directors and for a small number of the Group’s most senior executives. It is an internationally competitive long-term incentive plan that focuses executives on meeting and exceeding the long-term performance targets of the Group. The performance criteria which need to be met are listed below. Awards of nil price options to acquire shares are granted to the director and will normally be exercised between three and ten years after the date of grant if the individual is still employed by the Group. There is provision for earlier exercise in certain limited circumstances.
Name Organisation Current annual fees
B K Sanderson BUPA (non-executive chairman)
Enterprise LSE Limited
Sunderland Arc Limited
Sunderland PLC
$329,904 (£180,000)*
No fees received
No fees received
No fees received
E M Davies Tesco PLC
Tottenham Hotspur plc
$109,971 (£60,000)* inclusive of any committee fees
No fees payable
K S Nargolwala Tate & Lyle PLC
VISA International (member of the Asia Pacific Board)
$69,646 (£38,000)*
No fees payable
Performance Conditions The Committee will set appropriate performance conditions each time that awards are made under the Plan.
The performance conditions which need to be met before any award can be exercised under the Plan are summarised below, together with the reason for their selection:
Measure Relative Total Shareholder Return (TSR)
Earnings per Share (EPS)
Explanation for use
Measuring the year-on-year growth in share price plus dividends paid to shareholders during that period, relative TSR is recognised as one
An EPS performance condition is used as this is recognised as providing an
* Indicates fees are retained by the director. of the best indicators of whether appropriate measure a shareholder has achieved a of the Group’s good return on investing in the underlying financial Group relative to a basket of performance companies or a single index
58 Standard Chartered Annual Report and Accounts 2004

The Plan operates as follows: The first half of the award is dependent upon the Group’s TSR compared to that of a comparator group at the end of a three-year period. The Comparator Group comprises: ABN AMRO Holding Bank NV HSBC Holdings
Bank of America JP Morgan Chase Bank of East Asia Lloyds TSB Barclays Overseas Chinese Citigroup Banking Corporation
DBS Group Royal Bank of Scotland
Deutsche Bank United Overseas Bank
HBOS Standard Chartered
The following table shows the percentage of award which will normally be exercisable at the end of the relevant three-year performance period, depending on the ranking achieved in the Comparator Group: Ranking in list of TSR Performance relative Percentage of award of to Comparator Group companies exercisable
9th–15th Nil 8th 20.0 7th 27.5 6th 35.0 5th 42.5 1st–4th 50.0
The other half of the award will be subject to an earnings per share (EPS) growth target applied over the same three-year period.
The following table shows the percentage of award which will normally be exercisable at the end of the relevant three-year performance period, depending on the EPS performance: Increase in EPS Percentage of award (over performance period) exercisable
Less than 15% Nil 15% 20.0 30% or greater 50.0
The proportion of the award which may be exercised for EPS growth between 15 per cent and 30 per cent will be calculated on a straight-line basis.
The Committee is responsible for approving the grant and exercise of all awards made to executive directors under the Plan. The Committee may amend the performance conditions which apply to any award if the amended condition would provide a more appropriate measure of performance as long as the amended condition would be no less demanding to satisfy.
The Committee recently reviewed whether the performance conditions on the awards granted in 2002 were satisfied at the end of the December 2004. The Committee determined that 92.5 per cent of the shares subject to each award has now vested (EPS component 50 per cent and TSR component 42.5 per cent). For awards granted in 2004, normalised EPS of 89.6 cents was used as a base EPS figure.
2000 Executive Share Option Scheme Outline The 2000 Executive Share Option Scheme (2000 scheme) is designed to be an intrinsic part of the Group’s executive directors’ and senior managers’ total remuneration. The 2000 scheme is designed to be internationally competitive and focus executive directors and their senior management teams on delivering long-term performance. An EPS performance criterion needs to be met before options can be exercised.
Executive share options to purchase ordinary shares in the Company are exercisable after the third, but before the tenth, anniversary of the date of grant. The exercise price per share is the share price at the date of grant and options can normally only be exercised if a performance condition is satisfied.
The 2000 scheme was introduced in 2000 to replace the Group’s existing executive share option schemes.
Performance Conditions The EPS performance condition is used as it is recognised as providing an appropriate measure of the Group’s underlying financial performance.
In 2004, the Committee introduced a new sliding scale EPS target without any retest for all grants made from January 2004 onwards. A sliding scale rather than an ‘all or nothing’ performance condition encourages the right behaviour in terms of improving EPS rather than focusing on one single EPS target. The revised condition mirrors the EPS target used under the 2001 Performance Share Plan and is set out below.
Increase in EPS Percentage of award (over performance period) exercisable
Less than 15% Nil 15% 40.0 30% or greater 100.0
The proportion of the award which may be exercised for EPS growth between 15 per cent and 30 per cent will be calculated on a straight-line basis.
Options awarded under the 2000 scheme between May 2001 and December 2003 may be exercised if the Group’s EPS has increased by at least eight per cent per year for three years (i.e. at least 24 per cent over three years). Re-testing may be carried out in the fourth and fifth year after grant, but if the performance conditions have not been met at the end of the fifth year all options lapse automatically.
The Committee recently reviewed whether the performance conditions on the awards granted in 2000 and 2002 under the 2000 scheme were satisfied at the end of December 2004. The Committee determined that 100 per cent of the shares subject to award granted in both 2000 and 2002 had now vested. For options granted in 2004, normalised EPS of 89.6 cents was used as the base EPS figure.
Annual Report and Accounts 2004 Standard Chartered 59

Directors’ Remuneration Report
1997 Restricted Share Scheme The Group operates a discretionary Restricted Share Scheme for high performing and high potential staff at any level of the organisation whom the Group wish to motivate and retain. Except upon appointment when an executive director may be granted an award of restricted shares, the Restricted Share Scheme is not applicable to executive directors, as it has no performance conditions attached to it. Fifty per cent of the award vests two years after the date of grant and the balance after three years. Along with the all employee sharesave schemes detailed below, the Restricted Share Scheme plays an important part in the Group’s ambition to increase employee share ownership at all levels across its operations internationally.
The value of shares awarded in any year to any individual may not exceed two times their base salary.
All Employee Sharesave Schemes The Group believes strongly in encouraging employee share ownership at all levels in the organisation. It seeks to engage employees in the performance of the Group, align their interests more closely with those of shareholders and offer them an opportunity for long-term savings and a share in the Group’s financial success which they help to create. The Group has operated a UK sharesave scheme since 1984 in which all UK-based employees are eligible to participate. In 1996 the International Sharesave Scheme was launched and made available to all employees based outside the UK.
Under the UK and the International Sharesave Schemes, employees have the choice of opening a three-year or a five-year savings contract. Within a period of six months after the third or fifth anniversary, employees may purchase ordinary shares in the Company. The price at which they may purchase shares is at a discount of up to 20 per cent on the share price at the date of invitation. Currently 36 per cent of employees globally participate in the Group’s all employee sharesave schemes. There are no performance conditions attached to options granted under the all employee sharesave schemes.
In some countries in which the Group operates it is not possible to operate sharesave schemes, typically because of securities law, regulatory or other similar issues. In these countries the Group offers an equivalent cash-based scheme to its employees.
1997 Supplemental Share Option Scheme (closed) No awards have been made under this scheme since February 2000 and it is anticipated that no future grants will be made under it except in exceptional circumstances. To be eligible for a grant under this scheme, participants had to retain a personal holding of at least 10,000 shares, purchased at their own expense. Options can only be exercised up to the fifth anniversary of the grant date if, during the performance period:
• the share price over 20 consecutive days exceeds the share price at the date of grant by at least 50 per cent plus RPI; and
• EPS increases by at least 25 per cent plus RPI.
Both conditions must be satisfied within five years of the date of grant. In the event of a change of control, the Committee may deem the EPS target to have been met.
1994 Executive Share Option Scheme (closed) No awards have been made under this scheme since August 1999 as the scheme was replaced by the 2000 Executive Share Option Scheme. Executive share options to purchase ordinary shares in the Company are exercisable after the third, but before the tenth anniversary of the date of grant. The exercise price is the share price at the date of grant and options can only be exercised if EPS increases by at least 15 per cent over three consecutive years.
Shareholding Guidelines The Group operates a shareholding guideline policy which aims to align the interests of executives with shareholders by ensuring that they build up a significant equity stake in the Company. The key aspects of the guidelines, as outlined to shareholders at the Annual General Meeting in May 2003, are as follows:
• There is a single shareholding target for employees at specific levels.
• The current guideline levels are as follows:
Group CEO at least 100,000 shares
Chairman/Other Group Executive Directors at least 60,000 shares
Directors of Standard Chartered Bank at least 40,000 shares
Other senior management at least 10–15,000 shares
• Executives will be expected to retain any shares acquired on the exercise of awards granted under the 2000 Executive Share Option Scheme, the 2001 Performance Share Plan and the deferred bonus plan until such time as the shareholding guideline is satisfied. However, executives may sell sufficient shares to pay for any tax and exercise price (if any).
• The Committee annually reviews the progress made by executives in terms of meeting their guideline targets. It will also continue to review the guideline levels to ensure they remain challenging and appropriate.
60 Standard Chartered Annual Report and Accounts 2004
Miscellaneous Long Term Incentive-related Matters Employee Benefit Trusts The Group has two employee benefit trusts which are administered by an independent trustee and which hold ordinary shares to meet various obligations under the Group’s incentive plans. One trust (the 2004 trust) is used in conjunction with the 2004 deferred bonus plan. The other trust (the 1995 trust) holds shares to satisfy the exercise of awards under the Group’s various share plans. The respective holdings of the trusts are as follows:
31 December 2004 31 December 2003
1995 trust 12,128,841 9,513,386 2004 trust 178,926 Nil
As each executive director is within the class of beneficiary of these trusts, they are deemed, for the purposes of the Companies Act 1985, to have an interest in the shares held in the trusts.
Dilution Limits The Group’s existing share plans contain various limits which govern the amount of awards that may be granted and also the amount of shares which may be issued to satisfy any subsequent exercise of awards. These limits, which are monitored, are in line with those stated in the Association of British Insurers’ corporate guidelines. Under the terms of the Group’s listing on the Hong Kong Stock Exchange, there is an additional limit which provides that awards under any plan cannot be granted (whether to be satisfied through the issue of new shares or market purchased shares) which would cause the total number of shares under option (all schemes) to exceed ten per cent of share capital at that time.
The Group’s current policy is that discretionary share awards be satisfied with shares that have been purchased in the market.
Vesting Provisions on a Change of Control The rules of the 2000 scheme do not provide for automatic vesting. If there is a change of control, the Committee may ‘at its discretion, and acting fairly and reasonably’, determine the extent to which awards vest in full, in part or not at all.
Similarly, the rules of the 2001 Performance Share Plan do not provide for automatic vesting. The rules also provide that the number of shares subject to the award be pro-rated, based on the length of the shortened performance period. However, in common with the 2000 scheme, the Committee may ‘at its discretion, and acting fairly and reasonably’, determine the extent to which awards vest having regard for the performance of the Group in the period since the date of grant.
International Accounting Standards During the year the Group has assessed the potential impact of the new International Accounting Standards Board’s reporting standard on accounting for share-based plans (IFRS2) and has considered the implications of this for its share plan. IFRS2 will for the first time result in an accounting charge for granting market value options.
The Group has already reduced the reliance on options at director and senior executive level in favour of performance shares (see above). Among the reasons for this switch were: the existing option schemes were often not viewed by recipients as motivational or offering the clearest links between performance and reward; and performance and restricted shares make a more efficient use of shareholder capital.
These factors are valid in relation to the grant of share awards below senior executive level. As a result of these factors, in addition to the potential accounting costs, it is the Group’s intention to extend the shift from executive share options to restricted and performance shares throughout the Group this year.
General The middle market price of an ordinary share at the close of business on 31 December 2004 was 968.50 pence. The share price range during 2004 was 833.50 pence to 1035.50 pence per share (based on closing middle market prices). Full details of the directors’ shares and options can be found in the Company’s register of directors’ interests.
The foreign exchange rates used in this directors’ remuneration report are based on the average rates throughout the relevant financial year. The rates are £1:$1.8328 (2004) and £1:$1.6351 (2003).
Annual Report and Accounts 2004 Standard Chartered 61

Directors’ Remuneration Report
Audited information Remuneration of Directors 2004 2003 2004(e) 2003(e)
Expected Expected Salary/ Cash Deferred(c) Salary/ Cash Deferred(c) value of value of
fees bonus bonus Benefits(d) Total fees bonus bonus Benefits(d) Total shares shares Directors Notes $000 $000 $000 $000 $000 $000 $000 $000 $000 $000 $000 $000
B K Sanderson (a) 577 458 458 2 1,495 344 – 409 – 753 290 623 E M Davies (b) 1,369 1,669 907 68 4,013 1,078 1,009 572 82 2,741 1,382 1,010 M B DeNoma 731 890 439 504 2,564 633 621 311 511 2,076 693 640 C A Keljik 754 829 408 28 2,019 646 545 273 25 1,489 586 387 R H Meddings (b) 731 801 423 35 1,990 572 445 245 28 1,290 513 356 K S Nargolwala (b) 731 438 439 483 2,091 633 234 311 584 1,762 693 454 P A Sands 859 1,105 544 51 2,559 736 681 341 43 1,801 868 648
Sub total 5,752 6,190 3,618 1,171 16,731 4,642 3,535 2,462 1,273 11,912 5,025 4,118
Sir CK Chow (i) 176 – – – 176 74 – – – 74 – – J F T Dundas (f) (h) 91 – – – 91 – – – – – – – Ho KwonPing (g) 114 – – – 114 88 – – – 88 – – R H P Markham (a) (h) 148 – – – 148 88 – – – 88 – – R Markland (a) (g) (h) 117 – – – 117 12 – – – 12 – – H E Norton (a) (g) (h) 160 – – – 160 113 – – – 113 – – P D Skinner (g) 108 – – – 108 12 – – – 12 – – O H J Stocken (f) (g) 62 – – – 62 – – – – – – – D G Moir (i) (j) 99 – – – 99 237 – – – 237 – – Sir Ralph Robins (j) 44 – – – 44 103 – – – 103 – – Lord Stewartby (j) 82 – – – 82 231 – – – 231 – –
Sub total 1,201 – – – 1,201 958 – – – 958 – –
Total 6,953 6,190 3,618 1,171 17,932 5,600 3,535 2,462 1,273 12,870 5,025 4,118
Notes (a) Member of the Board Nomination Committee with effect from 1 March 2004.
(b) The cash bonus amounts shown here for 2004 are net of any amounts waived to provide additional pension benefits. See page 63 for further details.
(c) The amounts shown in the deferred bonus column represent the amount of bonus that will be paid to an employee benefit trust to acquire shares in the Company of an equivalent value.
(d) The benefits column includes amounts relating to car allowances and medical and life insurance benefits. The expatriate directors, Mr DeNoma and Mr Nargolwala, carry out their duties overseas and have their remuneration adjusted to take local living costs into account. This adjustment is to put them in a position, after taxation differentials, where they are no worse off as a result of carrying out their duties overseas. The benefits column for the expatriate directors includes additional benefits, such as allowances for working overseas, the provision of accommodation or education of children, granted to directors working overseas. For Mr DeNoma and Mr Nargolwala, these allowances and benefits amounted to $503,508 (2003: $510,940) and $483,192 (2003: $583,608), respectively.
(e) The value of share awards is an expected value of any discretionary share awards granted during the course of the financial year. The values are based on, in the case of options, an adjusted black scholes value, and in the case of performance shares, an initial value adjusted for factors such as performance conditions, risk of forfeiture and lack of dividends.
(f) Mr Dundas and Mr Stocken were appointed as non-executive directors on 15 March 2004 and 1 June 2004 respectively.
(g) Member of the Board Remuneration Committee. Mr Skinner, Mr Stocken and Ms Markland were appointed as members of this committee with effect from 11 May 2004, 1 November 2004 and 1 January 2005 respectively.
(h) Member of the Board Audit and Risk Committee. Mr Dundas was appointed a member of this committee with effect from 1 June 2004.
(i) Further details on the fees for non-executive directors are shown on page 58. Sir CK Chow was appointed Chairman of Standard Chartered Bank (Hong Kong) Limited on 28 June 2004. He receives an all inclusive fee for his Hong Kong and Standard Chartered PLC Board duties of HK$2,000,000 ($257,000) per annum. Mr Moir received a fee of $66,510 in 2004 (2003: $163,510) for advisory services. This amount is shown in the table above.
(j) Mr Moir, Sir Ralph Robins and Lord Stewartby retired as non-executive directors on 11 May 2004.
(k) Relevant exchange rates are shown on page 61.
62 Standard Chartered Annual Report and Accounts 2004

Audited Information continued Retirement Benefits of Executive Directors 2004 2003
Defined Defined Defined Defined Defined Defined Defined Defined contribution benefit benefit benefit contribution benefit benefit benefit
plans: plans: plans: plans: plans: plans: plans: plans:
increase in transfer value increase in transfer value accrued total of total accrued total of total
contribution pension accrued accrued contribution pension accrued accrued during during pension at pension during during pension at pension
the year the year year end at year end the year the year year end at year end Directors $000 $000 $000 $000 $000 $000 $000 $000
E M Davies – 64 188 3,657 27 51 107 1,956 M B DeNoma 201 – – – 173 – – – C A Keljik – 29 557 10,058 – 30 456 8,162 R H Meddings – 30 94 1,602 53 22 55 762 K S Nargolwala – 48 96 1,918 – 41 41 818 P A Sands – 29 59 1,313 70 26 26 551
Total 201 200 994 18,548 323 170 685 12,249
Additional information on defined benefit plan arrangements. Increase in total transfer
value of total accrued Increase in accrued Increase in total transfer pension during 2004
pension during 2004 value of total accrued (excluding transfers in Current pension arising (excluding inflation allowance) pension during 2004 and 2004 bonus waived) 2004 bonus waiver from 2004 bonus waiver
Directors $000 $000 $000 $000 $000
E M Davies 68 1,465 1,259 173 10 C A Keljik 46 908 908 – – R H Meddings 32 748 670 58 3 K S Nargolwala 50 1,001 545 452 23 P A Sands 30 695 695 – –
Notes (a) The ages of the executive directors are shown on pages 44 and 45.
(b) Mr DeNoma only receives salary supplements. All other executive directors participate in the defined benefit plans.
(c) Members of the Standard Chartered Pension Fund may retire early but on a reduced pension equivalent in value to the alternative deferred pension. Guaranteed pension increases of four per cent per annum (or the increase in the RPI if lower) (subject to the ‘Guaranteed Pension Increase Allowance’ rule) are given in respect of pension for service up to 5 April 1997 and increases of five per cent per annum (or the increase in the RPI if lower) are granted for service from 6 April 1997.
(d) The increase in accrued pension during the year is the difference between the accrued pension at the end of 2003 increased by an allowance for inflation of 3.4 per cent (2003: 2.5 per cent) and the accrued pension at the end of 2004. The total accrued pension at year end includes benefits arising from transfer payments received in respect of service with previous employers.
(e) The transfer values in respect of the unapproved unfunded retirement benefit scheme in which Mr Davies, Mr Meddings, Mr Nargolwala and Mr Sands participate have been calculated using the Group’s FRS17 methodology and assumptions.
(f) The second table shows both the increase in accrued pensions during 2004 without any allowance for inflation, and the increase in the transfer value in respect of the total accrued pensions between the end of 2003 and the end of 2004 for members of the defined benefit plans. The third column shows the increase in transfer value for benefits other than those arising from any bonus sacrifices on transfer payments received from either the Group’s defined contribution arrangements or a pension scheme of a previous employer.
(g) Executive directors are given the opportunity to waive a proportion of any potential bonus to enhance their unfunded unapproved retirement benefits. Any amounts waived in respect of 2004 are shown above.
(h) Amounts paid by the Group, in addition to pension fund payments under the pension plans, to former directors or their dependants in respect of retirement benefits amounted to $307,199 (2003: $264,921). There were no other retirement benefits paid to former directors. None of these amounts first became payable after 31 March 1997.
Annual Report and Accounts 2004 Standard Chartered 63

Directors’ Remuneration Report
Audited Information continued Directors’ Interests in Ordinary Shares
At At 1 January 2004† 31 December 2004
Directors Total interests Personal interests Family interests Other interests (d) Total interests
B K Sanderson 53,221 63,989 11,159 26,469 101,617 E M Davies 60,490 87,482 – 37,056 124,538 Sir CK Chow 8,664 15,664 – – 15,664 M B DeNoma 10,455 33,056 – 20,116 53,172 J F T Dundas* – 2,100 – – 2,100 Ho KwonPing 2,299 2,375 – – 2,375 C A Keljik 123,930 81,078 65,453 17,646 164,177 R H P Markham 2,160 2,232 – – 2,232 R Markland 2,000 2,019 – – 2,019 R H Meddings 2,000 2,066 – 15,881 17,947 K S Nargolwala 70,897 96,801 – 20,116 116,917 H E Norton 4,000 4,000 – – 4,000 P A Sands 2,111 2,181 – 22,057 24,238 P D Skinner 3,000 3,029 – – 3,029 O H J Stocken* 5,000 5,000 – – 5,000
*Mr Dundas and Mr Stocken were appointed to the Board on 15 March 2004 and 1 June 2004 respectively.
†or at date of appointment, if later.
Notes (a) The beneficial interests of directors and their families in the ordinary shares of the Company are set out above. The directors do
not have any non-beneficial interests in the Company’s shares.
(b) No director had an interest in the Company’s preference shares or loan stock, nor the shares or loan stocks of any subsidiary or associated undertaking of the Group.
(c) No director had any corporate interests in the company’s ordinary shares.
(d) The shares shown in this column are shares awarded under the 2004 Deferred Bonus Plan. Under this plan shares are awarded instead of all or part of a director’s annual cash bonus. The shares are held in trust and automatically vest one year after the date of purchase; no exercise is necessary.
Subsequent pages contain information on shareholding, share options and share awards.
64 Standard Chartered Annual Report and Accounts 2004

Audited Information continued Long Term Incentives Weighted
At At average 1 January 31 December exercise price Period of
Director Scheme 2004 Granted Exercised Lapsed 2004† (pence) exercise
B K Sanderson 2000 Scheme 121,211 20,844 (b) – – 142,055 770.82 2006-2014
Sharesave 2,472 – – – 2,472 641 2008-2009
E M Davies 2000 Scheme 999,463 138,963 (b) – – 1,138,426 773 2005-2014
Sharesave 2,957 – – – 2,957 559.5 2007-2008
Supplemental Scheme 79,049 – – 52,217 26,832 820 2005
1994 Scheme 132,848 – – – 132,848 754.02 2005-2009
M B DeNoma 2000 Scheme 536,958 85,515 (b) – – 622,473 797.62 2005-2014
Sharesave 2,397 – – – 2,397 704 2005
Supplemental Scheme 36,585 – – – 36,585 820 2005
1994 Scheme 33,783 – – – 33,783 888 2005-2009
C A Keljik 2000 Scheme 461,099 74,826 (b) – – 535,925 814.48 2005-2014
Sharesave 1,439 – – – 1,439 641 2006-2007
Supplemental Scheme 72,023 – – 24,706 47,317 820 2005
1994 Scheme 117,098 – – – 117,098 767.01 2005-2009
R H Meddings 2000 Scheme 237,332 65,473 (b) – – 302,805 780.20 2005-2014
Sharesave 1,439 – – – 1,439 641 2006-2007
D G Moir Supplemental Scheme 61,300 – – 51,544 9,756 820 2005
K S Nargolwala 2000 Scheme 495,304 85,515 (b) – – 580,819 813.50 2005-2014
Supplemental Scheme 91,093 – – 36,215 54,878 820 2005
1994 Scheme 99,063 – – – 99,063 757.1 2005-2009
P A Sands 2000 Scheme 404,375 96,205 (b) – – 500,580 809.06 2005-2014
Sharesave 2,957 – – – 2,957 559.5 2007-2008 †or date of resignation
Executive Share Option Scheme Notes: (a) Executive directors’ base salaries for the purposes of determining number of shares subject to discretionary awards granted
during 2004 are as follows:
B K Sanderson $549,840 (£300,000) E M Davies $1,191,320 (£650,000) M B DeNoma $733,120 (£400,000) C A Keljik $733,120 (£400,000) R H Meddings $641,480 (£350,000) K S Nargolwala $733,120 (£400,000) P A Sands $824,760 (£450,000)
(b) Market value on date of award (4 March 2004) was 935.5p.
Annual Report and Accounts 2004 Standard Chartered 65

Directors’ Remuneration Report
Audited Information continued Options where market price Options where market price greater than exercise price lower than exercise price
At 31 December Weighted exercise Expiry At 31 December Weighted exercise Expiry Director Type of Scheme† 2004‡ price (pence) date 2004‡ price (pence) date
B K Sanderson Executive Schemes 142,055 770.82 2014 – – – Sharesave Scheme 2,472 641 2009 – – –
E M Davies Executive Schemes 1,298,106 772.02 2014 – – – Sharesave Scheme 2,957 559.5 2008 – – –
M B DeNoma Executive Schemes 692,841 803.21 2014 – – – Sharesave Scheme 2,397 704 2005 – – –
C A Keljik Executive Schemes 700,340 806.91 2014 – – – Sharesave Scheme 1,439 641 2007 – – –
R H Meddings Executive Schemes 302,805 780.20 2014 – – – Sharesave Scheme 1,439 641 2007 – – –
D G Moir Executive Schemes 9,756 820 2005 – – – K S Nargolwala Executive Schemes 734,760 806.38 2014 – – – P A Sands Executive Schemes 500,580 809.06 2014 – – –
Sharesave Scheme 2,957 559.5 2008 – – – †‘Executive Schemes’ includes the 1994 Executive Share Option Scheme, the Supplemental Share Option Scheme and the 2000 Executive Share Option Scheme. ‡or date of resignation if earlier.
As at 1 January As at 31 December Period of Director Scheme 2004 Granted(a) Exercised Lapsed 2004 vesting
B K Sanderson Restricted Share Scheme 40,404 – – – 40,404 2005-2006 Performance Share Plan – 32,068 (b) – – 32,068 2005-2006
E M Davies Performance Share Plan 34,500 – 23,992 (d) 10,508 – – Performance Share Plan 83,010 – – – 83,010 2005 Performance Share Plan 86,893 – – – 86,893 2006 Performance Share Plan – 69,481 (b) – – 69,481 2007 Performance Share Plan – 70,575 (c) – – 70,575 2007
M B DeNoma Performance Share Plan 32,500 – 22,601 (d) 9,899 – – Performance Share Plan 30,713 – – – 30,713 2005 Performance Share Plan 55,032 – – – 55,032 2006 Performance Share Plan – 42,757 (b) – – 42,757 2007 Performance Share Plan – 21,715 (c) – – 21,715 2007
C A Keljik Performance Share Plan 32,500 – 22,601 (d) 9,899 – – Performance Share Plan 38,392 – – – 38,392 2005 Performance Share Plan 41,274 – – – 41,274 2006 Performance Share Plan – 42,757 (b) – – 42,757 2007 Performance Share Plan – 10,857 (c) – – 10,857 2007
R H Meddings Performance Share Plan 38,015 – – – 38,015 2006 Performance Share Plan – 37,413 (b) – – 37,413 2007 Performance Share Plan – 9,500 (c) – – 9,500 2007 Restricted Share Scheme 45,319 – – – 45,319 2005
K S Nargolwala Performance Share Plan 37,250 – 25,904 (d) 11,346 – – Performance Share Plan 51,189 – – – 51,189 2005 Performance Share Plan 55,032 – – – 55,032 2006 Performance Share Plan – 42,757 (b) – – 42,757 2007 Performance Share Plan – 21,715 (c) – – 21,715 2007
P A Sands Performance Share Plan 52,216 – – – 52,216 2005 Performance Share Plan 65,170 – – – 65,170 2006 Performance Share Plan – 48,102 (b) – – 48,102 2007 Performance Share Plan – 36,644 (c) – – 36,644 2007 Restricted Share Scheme 52,216 – – – 52,216 2005
66 Standard Chartered Annual Report and Accounts 2004

Audited Information continued Awards notes (a) Executive directors’ base salaries for the purposes of determining number of shares subject to awards at the date of grant are set
out in the notes on page 65.
(b) Market value on date of award (4 March 2004) was 935.5p.
(c) Market value on date of award (9 June 2004) was 921p.
(d) Market value on date of exercise (14 June 2004) was 898p.
Remuneration of Five Highest Paid Individuals In addition to its responsibilities for the remuneration of executive directors, the Committee ensures that the remuneration policy of the Group is consistently applied for other senior executives. Specifically the Committee ratifies appointments of key senior executives and approves any significant remuneration packages.
Following the Company’s listing on the Hong Kong Stock Exchange it is necessary to disclose certain information relating to the five highest paid employees in the Group. Set out below are details for five individuals (two of whom are not executive directors) whose emoluments (excluding bonuses or commissions linked to profits generated by the individual or collectively by the individuals) were the highest in the year ending 31 December 2004:
Components of remuneration $’000
Basic salaries, allowances and benefits in kind 7,083 Pension contributions 320 Bonuses paid or receivable 7,240 Payments made on appointment – Compensation for loss of office
– contractual 150 – other 950
Total 15,743
Total (HK$’000) 122,613
Their emoluments are within the following bands:
HK$ (approx. $ equivalent) Number of employees
HK$20,000,001 – HK$20,500,000 ($2,567,856 – $2,632,052) 1
HK$21,500,001 – HK$22,000,000 ($2,760,445 – $2,824,641) 1
HK$23,000,001 – HK$23,500,000 ($2,953,034 – $3,017,230) 1
HK$24,000,001 – HK$24,500,000 ($3,081,427 – $3,145,623) 1
HK$33,000,001 – HK$33,500,000 ($4,236,962 – $4,301,158) 1
By order of the Board
D J Brimacombe Group Secretary 16 February 2005
Annual Report and Accounts 2004 Standard Chartered 67

Directors’ Responsibility Statement
The following statement, which should be read in conjunction with the statement of respective responsibilities of directors and auditors below, is made to distinguish the responsibilities of the directors for the financial statements from those of the auditors.
The directors are required by the Companies Act 1985 to prepare financial statements that give a true and fair view of the state of affairs of the Company and the Group as at the end of the financial year and of the profit or loss for the financial year. The financial statements must be prepared on a going concern basis unless it is inappropriate to presume that the Company and Group will continue in their business.
The directors have responsibility for ensuring that the Company keeps accounting records which disclose with reasonable accuracy the financial position of the Company and which enable them to ensure that the financial statements comply with the Companies Act 1985.
The directors also have a general responsibility for taking such steps as are reasonably open to them to safeguard the assets of the Group and to prevent and detect fraud and other irregularities.
The directors consider that, in preparing the financial statements on pages 70 to 120 inclusive, they have used appropriate accounting policies, consistently applied and supported by reasonable and prudent judgements and estimates, and that all applicable accounting standards have been followed.
68 Standard Chartered Annual Report and Accounts 2004

Independent Auditor’s Report to the members of Standard Chartered PLC
We have audited the financial statements on pages 70 to 120. We have also audited the information in the directors’ remuneration report that is described as having been audited.
This report is made solely to the Company’s members, as a body, in accordance with section 235 of the Companies Act 1985. Our audit work has been undertaken so that we might state to the Company’s members those matters we are required to state to them in an auditor’s report and for no other purpose. To the fullest extent permitted by law, we do not accept or assume responsibility to anyone other than the Company and the Company’s members as a body, for our audit work, for this report, or for the opinions we have formed.
Respective responsibilities of directors and auditors The directors are responsible for preparing the Annual Report and the directors’ remuneration report. As described on page 68, this includes responsibility for preparing the financial statements in accordance with applicable United Kingdom law and accounting standards. Our responsibilities, as independent auditors, are established in the United Kingdom by statute, the Auditing Practices Board, the Listing Rules of the Financial Services Authority, and by our profession’s ethical guidance.
We report to you our opinion as to whether the financial statements give a true and fair view and whether the financial statements and the part of the directors’ remuneration report to be audited have been properly prepared in accordance with the Companies Act 1985. We also report to you if, in our opinion, the directors’ report is not consistent with the financial statements, if the Company has not kept proper accounting records, if we have not received all the information and explanations we require for our audit, or if information specified by law or the Listing Rules regarding directors’ remuneration and transactions with the Group is not disclosed.
We review whether the corporate governance statement on pages 48 to 53 reflects the Company’s compliance with the nine provisions of the 2003 FRC Code specified for our review by the Listing Rules, and we report if it does not. We are not required to consider whether the Board’s statements on internal control cover all risks and controls, or form an opinion on the effectiveness of the Group’s corporate governance procedures of its risk and control procedures.
We read the other information contained in the Annual Report, including the corporate governance statement and the unaudited
part of the directors’ remuneration report, and consider whether it is consistent with the audited financial statements. We consider the implications for our report if we become aware of any apparent misstatements or material inconsistencies with the financial statements.
Basis of audit opinion We conducted our audit in accordance with Auditing Standards issued by the Auditing Practices Board. An audit includes examination, on a test basis, of evidence relevant to the amounts and disclosures in the financial statements and the part of the directors’ remuneration report to be audited. It also includes an assessment of the significant estimates and judgements made by the directors in the preparation of the financial statements, and of whether the accounting policies are appropriate to the Group’s circumstances, consistently applied and adequately disclosed. We planned and performed our audit so as to obtain all the information and explanations which we considered necessary in order to provide us with sufficient evidence to give reasonable assurance that the financial statements and the part of the directors’ remuneration report to be audited are free from material misstatement, whether caused by fraud or other irregularity or error. In forming our opinion we also evaluated the overall adequacy of the presentation of information in the financial statements and the part of the directors’ remuneration report to be audited.
Opinion In our opinion: • the financial statements give a true and fair view of the state
of affairs of the Company and the Group as at 31 December 2004 and of the profit of the Group for the year then ended; and
• the financial statements and the part of the directors’ remuneration report to be audited have been properly prepared in accordance with the Companies Act 1985.
KPMG Audit Plc Chartered Accountants Registered Auditor London, 16 February 2005
Annual Report and Accounts 2004 Standard Chartered 69

Consolidated Profit and Loss Account for the year ended 31 December 2004
Notes
Before acquisitions
$million Acquisitions**
$million
2004
$million
2003*
$million
Interest receivable Interest payable
1
2
5,208 (2,062)
24 (2)
5,232 (2,064)
4,790 (1,822)
Net interest income Other finance income/(charge) Fees and commissions receivable Fees and commissions payable Dealing profits Other operating income
6
3
4
3,146 10
1,617 (283) 647 206
2,187
22 – – – 1 1 2
3,168 10
1,617 (283) 648 207
2,189
2,968 (13)
1,318 (162) 525 104
1,785
Net revenue Administrative expenses:
Staff Premises Other
Depreciation and amortisation Total operating expenses
5
5
5
7
5,343
(1,529) (319) (716) (418)
(2,982)
24
(5) (2) (5) (2)
(14)
5,367
(1,534) (321) (721) (420)
(2,996)
4,740
(1,332) (290) (640) (381)
(2,643)
Operating profit before provisions Provisions for bad and doubtful debts Amounts written off fixed
asset investments
17
2,361 (210)
(1)
10 (4)
–
2,371 (214)
(1)
2,097 (536)
(11)
Operating profit Income from joint venture
2,150 –
6 2
2,156 2
1,550 –
Profit on ordinary activities before taxation
Taxation 9
2,150 (635)
8 (2)
2,158 (637)
1,550 (497)
Profit after taxation Minority interests
1,515 (42)
6 –
1,521 (42)
1,053 (29)
Profit for the year attributable to shareholders
Dividends on non-equity preference shares
Dividends on ordinary equity shares 10
11
1,473
(58) (725)
6
– –
1,479
(58) (725)
1,024
(55) (611)
Retained profit 690 6 696 358
Normalised earnings per ordinary share 12 125.9c 90.1c
Basic earnings per ordinary share 12 121.2c 82.0c
Diluted earnings per ordinary share 12 119.3c 81.0c
Dividend per ordinary share 11 57.5c 52.0c
*Comparative restated (see note 54 on page 118).
**Refer to note 23 on page 93 to 94.
The results are all from continuing operations.
70 Standard Chartered Annual Report and Accounts 2004

Consolidated Balance Sheet at 31 December 2004
2004 2003* Notes $million $million
Assets Cash and balances at central banks 2,079 1,835 Cheques in course of collection 190 147 Treasury bills and other eligible bills 13 4,425 5,689 Loans and advances to banks 14 18,922 13,354 Loans and advances to customers 15 71,596 59,744 Debt securities and other fixed income securities 20 28,295 23,141 Equity shares and other variable yield securities 21 253 359 Interest in joint venture – share of gross assets 1,179 –
– share of gross liabilities (992) – – share of net assets 187 –
Intangible fixed assets 24 1,900 1,986 Tangible fixed assets 25 844 884 Other assets 27, 33 11,729 11,996 Prepayments and accrued income 1,268 1,067
Total assets 141,688 120,202
Liabilities Deposits by banks 28 15,813 10,924 Customer accounts 29 84,572 73,767 Debt securities in issue 30 7,378 6,062 Other liabilities 32 16,361 13,984 Accruals and deferred income 1,262 1,181 Provisions for liabilities and charges 34 59 46 Pension and post retirement liabilities (net of deferred tax) 35 120 128 Subordinated liabilities: Undated loan capital 36 1,588 1,568
Dated loan capital (including convertible bonds) 36 5,144 4,399 Minority interests: Equity 37 111 83
Non equity 37 845 531 Called up share capital 38, 39 967 939 Share premium account 39 2,835 2,813 Capital reserve 39 5 5 Capital redemption reserve 39 11 11 Premises revaluation reserve 39 (5) (2) Own shares held in ESOP Trusts 39 (8) (60) Profit and loss account 39 4,630 3,823 Shareholders’ funds (including non-equity interests) 39 8,435 7,529
Total liabilities and shareholders’ funds 141,688 120,202
Memorandum items Contingent liabilities:
Acceptances and endorsements 46 976 716 Guarantees and irrevocable letters of credit 46 15,942 12,350 Other contingent liabilities 46 3,139 4,802
20,057 17,868
Commitments: Cancellable 46 25,933 26,589 Non-cancellable 46 21,021 14,568
46,954 41,157
* Comparative restated (see note 54 on page 118).
These accounts were approved by the Board of Directors on 16 February 2005 and signed on its behalf by: B K Sanderson E M Davies P A Sands Chairman Group Chief Executive Group Executive Director
Annual Report and Accounts 2004 Standard Chartered 71

Consolidated Statement of Total Recognised Gains and Losses for the year ended 31 December 2004
2004 2003* Notes $million $million
Profit for the year attributable to shareholders 1,479 1,024 Exchange translation differences 93 69 Actuarial loss on retirement benefits 6 (5) (65) Deferred tax on acturial gain on retirement benefits 6 1 20
1,568 1,048
Prior year adjustments** (186)
Total recognised gains and losses since the last annual report 1,382
*Comparative restated (see note 54 on page 118).
**Including comparative actuarial gains/losses in prior periods.
Note of Consolidated Historical Cost Profits and Losses for the year ended 31 December 2004
There is no material difference between the results as reported and the results that would have been reported on a historical cost basis. Accordingly, no note of historical cost profits and losses has been included.
72 Standard Chartered Annual Report and Accounts 2004

Consolidated Cash Flow Statement for the year ended 31 December 2004
2004 2003* Notes $million $million
Net cash inflow from operating activities 41 2,503 3,748
Returns on investment and servicing of finance Interest paid on subordinated loan capital (338) (298) Dividends paid to minority shareholders of subsidiary undertakings (17) (22) Dividends paid on preference shares (58) (55)
Net cash outflow from returns on investments and servicing of finance (413) (375)
Taxation UK taxes paid (33) (161) Overseas taxes paid (540) (353)
Total taxes paid (573) (514)
Capital expenditure and financial investment Purchases of tangible fixed assets (240) (156) Acquisitions of treasury bills held for investment purposes (9,396) (12,604) Acquisitions of debt securities held for investment purposes (75,353) (49,247) Acquisitions of equity shares held for investment purposes (121) (194) Disposals of tangible fixed assets 51 14 Disposals and maturities of treasury bills held for investment purposes 10,778 12,632 Disposals and maturities of debt securities held for investment purposes 71,482 49,498 Disposals of equity shares held for investment purposes 356 13
Net cash outflow from capital expenditure and financial investment (2,443) (44)
Net cash (outflow)/inflow before equity dividends paid and financing (926) 2,815
Net cash outflow from the purchase of interests in subsidiary undertakings and joint venture 23 (333) –
Net cash inflow/(outflow) from disposal of interests in subsidiary and associated undertakings and the business of a branch 6 (95)
Net cash outflow from acquisition and disposals (327) (95)
Equity dividends paid to members of the Company (587) (531)
Financing Gross proceeds from issue of ordinary shares – Repurchase of preference share capital – (20) Gross proceeds from issue of preferred securities 499 – Repayment of subordinated liabilities (25) –
Net cash inflow/(outflow) from financing 474 (17)
(Decrease)/increase in cash in the year (1,366) 2,172
*Comparative restated (see note 54 on page 118).
Annual Report and Accounts 2004 Standard Chartered 73
3

Company Balance Sheet at 31 December 2004
2004 2003* Notes $million $million
Fixed assets Investments in subsidiary undertakings 22 10,240 9,287
Current assets Amounts owed by subsidiary undertakings 631 137 Taxation 126 118
757 255
Creditors: amounts due within one year Proposed dividend 524 429 Amounts owed to subsidiary undertakings 442 – Other creditors, including taxation 8 16
974 445
Net current liabilities (217) (190)
Total assets less current liabilities 10,023 9,097 Creditors: amounts due after more than one year Undated subordinated loan capital 36 1,588 1,568
8,435 7,529
Capital and reserves Called up share capital 38, 40 967 939 Share premium account 40 2,835 2,813 Capital reserve 40 5 5 Capital redemption reserve 40 11 11 Revaluation reserve 40 4,408 3,476 Profit and loss account 40 209 285
Shareholders’ funds (including non-equity interests) 8,435 7,529
*Comparative restated (see note 54 on page 118)
These accounts were approved by the Board of Directors on 16 February 2005 and signed on its behalf by:
B K Sanderson E M Davies P A Sands Chairman Group Chief Executive Group Executive Director
74 Standard Chartered Annual Report and Accounts 2004
Principal Accounting Policies
Accounting Convention The accounts of the Company and of the Group have been prepared under the historical cost convention, modified by the revaluation of certain fixed assets and dealing positions. The following accounting policies have been consistently applied.
FRS17 and UITF17 (revised) have been adopted during 2004 and prior year comparatives have been restated accordingly. Please refer to note 54 for further details.
Group Accounts The consolidated accounts of the Group comprise the accounts of the Company and its subsidiary undertakings for the year ended 31 December 2004 and are drawn up in accordance with the special provisions of Part VII Chapter II of the UK Companies Act 1985 (the Act) relating to banking groups, Schedule 9 to the Act, applicable Accounting Standards, the British Bankers’ Association’s Statements of Recommended Accounting Practice (SORPs) and the SORP ‘Accouting issues in the asset finance and leasing industry’ issued by the Finance and Leasing Asset Association.
Company Accounts The Company accounts are drawn up in accordance with section 228 of, and Schedule 4 to, the Act and applicable Accounting Standards. As permitted by section 230 of the Act, the Company’s profit and loss account has not been included in these financial statements.
Bad and Doubtful Debts Provisions for bad and doubtful debts are held in respect of loans and advances, including cross border exposures. The provisions comprise two elements – specific and general.
Provisions against loans and advances are based on an appraisal of the loan portfolio. Specific provisions are made where the repayment of identified loans is in doubt and reflect an estimate of the amount of loss expected. The general provision is for the inherent risk of losses which, although they have not been separately identified, are known from experience to be present in any loan portfolio and to other material uncertainties where specific provisioning is not appropriate. The amount of the general provision reflects past experience and judgements about current conditions in particular locations or business sectors.
Provisions are made against cross border exposures where a country may experience or has experienced external liquidity problems and doubts exist as to whether full recovery will be achieved.
Provisions are applied to write off advances, in part or in whole, when they are considered wholly or partly irrecoverable.
Interest on loans and advances is accrued to income until such time as reasonable doubt exists about its collectability; thereafter, and until all or part of the loan is written off, interest continues to accrue on customers’ accounts, but is not included in income. Such suspended interest is deducted from loans and advances on the balance sheet.
Debt Securities, Equity Shares and Treasury Bills Securities, including equity shares and treasury bills, which are intended for use on a continuing basis in the Group’s activities are classified as investment securities. They include portfolios of securities held in countries where the Group is required to maintain a stock of liquid assets. Investment securities are stated at cost less any provision for permanent diminution in value. The cost of dated investment securities is adjusted to reflect the amortisation or accretion of premiums and discounts on acquisition on a straight-line basis over the residual period to maturity. The amortisation and accretion of premiums and discounts are included in interest income.
Securities other than investment securities are classified as dealing securities and are held at market value. Where the market value of such securities is higher than cost, the original cost is not disclosed as its determination is not practicable.
Deferred Taxation In accordance with Financial Reporting Standard 19 – Deferred Tax, deferred taxation is provided in full on timing differences at the rates of taxation anticipated to apply when the differences crystallise, subject to the recoverability of deferred tax assets arising from the inclusion of income and expenditure in taxation computations in periods different from those in which they are included in the financial statements.
Equipment Leased to Customers and Instalment Credit Agreements Assets leased to customers under agreements which transfer substantially all the risks and rewards associated with ownership, other than legal title, are classified as finance leases. The balance sheet amount represents total minimum lease payments receivable less unearned income. Income from finance leases is recognised in the profit and loss account in proportion to the funds invested. Fixed rate instalment credit agreements are treated in a similar manner to finance leases.
Lease agreements other than finance leases are classified as operating leases. Operating leases are included in loans and advances but are treated as fixed assets and depreciated over the shorter of the lease term and the estimated useful life of the asset. The profits arising from operating leases are recognised in the profit and loss account on a straight-line basis over the duration of each lease.
Income arising from the residual interest in instalment credit agreements which have been sold is credited to the profit and loss account as it accrues. Expenses incurred in generating this income are deferred and amortised over the duration of the income flow and in proportion to it.
Foreign Currencies Assets and liabilities in foreign currencies are expressed in US dollar terms at rates of exchange ruling on the balance sheet date. Profits and losses earned in foreign currencies are expressed in US dollar terms at the average exchange rate of each currency against US dollar during the year. Exchange
Annual Report and Accounts 2004 Standard Chartered 75

Principal Accounting Policies
differences arising from the balance sheet period end rate and the profit and loss average rate are taken to reserves. Gains or losses arising from positions taken to hedge such profits and losses are included in the profit and loss account.
Translation differences arising from the application of closing rates of exchange to opening net assets of foreign operations denominated in foreign currencies are taken directly to reserves.
Exchange differences arising on the translation of opening net monetary assets and results of operations in areas experiencing hyper-inflation are included in the profit and loss account. Non-monetary assets in these areas are not retranslated.
All other exchange differences arising from normal trading activities, and on branch profit and dividend remittances to the United Kingdom, are included in the profit and loss account.
Investments in Subsidiary Undertakings Investments in subsidiary undertakings are stated in the balance sheet of the Company at the Company’s share of their attributable net assets, together with any long-term loans provided by the Company to the subsidiary undertakings.
Joint Ventures Interests in joint ventures are stated at the Group’s share of gross assets including attributable goodwill, less its share of gross liabilities.
Off-Balance Sheet Financial Instruments Off-balance sheet financial instruments are valued with reference to market prices and the resultant profit or loss is included in the profit and loss account, except where the position in the instrument has been designated as a hedge when the profit or loss resulting from marking them to market is dealt with in the same way as the accounting treatment applied to the position hedged.
Trading positions are valued at market rates, and non-trading positions are valued on the same basis as the items being hedged. Netting occurs where transactions with the same counterparty meet the following requirements. The balances must be determinable and in freely convertible currencies, the Standard Chartered entity can insist on net settlement, and this ability is beyond doubt.
Retirement Benefits The Group has adopted ‘FRS17 – Retirement Benefits’ in full from 1 January 2004. In prior years, the Group complied with the transitional requirements of this standard. In accordance with FRS17, the operating and financing costs of defined benefit pension and post-retirement schemes are recognised separately in the profit and loss account. Service costs are systematically spread over the service lives of the employees and financing costs are recognised in the period in which they arise. Financing costs include the interest cost and the expected return on assets (calculated using the market value of assets). The costs of past service benefit enhancements, settlements and curtailments are also recognised in the period in which they arise. The difference between actual and expected returns on assets during the year, including changes in actuarial assumptions, are recognised in the Statement of Total Recognised Gains and Losses. For defined
contribution schemes, contributions are charged to the profit and loss account when payable.
Sale and Repurchase Agreements These are arrangements under which assets are sold by one party to another on terms that provide for the seller to repurchase the assets in certain circumstances at a later date.
Where the substance of the transaction is that of a secured loan, the sale and any apparent profit will not be recorded as such in the books of the seller, but the proceeds of sale will be recorded as a deposit.
Swaps and Sales of Assets Assets acquired through debt exchange transactions are included in the accounts in the same line as the original underlying asset at the directors’ assessment of their fair value. Where the asset represents exposure to a country which is experiencing payment difficulties, it is stated at its principal amount and any provision required to reduce the exposure to its fair value is included with other provisions of a like nature.
Profits and losses on sales of assets are calculated by reference to their net carrying amount, whether at historical cost (less any provisions made) or at a valuation, at the time of disposal.
Tangible Fixed Assets Freehold and long leasehold premises (premises with unexpired lease terms of 50 years or more) are included in the accounts at their historical cost or at the amount of any subsequent valuation. Leasehold premises with no long-term premium value are not revalued.
Land is not depreciated. Freehold premises are amortised on a straight-line basis over their estimated residual lives. Leasehold premises are amortised over the remaining term of each lease on a straight-line basis.
Equipment, including fixed plant in buildings, computers and capitalised software development expenditure, is stated at cost and is depreciated on a straight-line basis over its expected economic life, which is six years on a weighted average basis.
Intangible Fixed Assets Any purchased goodwill is capitalised and amortised to nil, on a straight-line basis, over its estimated useful life. The amortisation period of capitalised goodwill is up to 20 years, being the period over which the Group expects to derive economic benefit from the assets. Purchased goodwill arising on consolidation in respect of acquisitions before 1 January 1998 was written off through reserves in the year of acquisition and has not been restated. Any goodwill previously written off through reserves is charged through the profit and loss account in the year of disposal.
Fees and Commissions Fees or commissions which represent a payment for a service provided in setting up a transaction, are credited to the profit and loss account once they are receivable.
Fees or commissions which in substance amount to an additional interest charge, are recognised over the life of the underlying transaction on a level yield basis.
76 Standard Chartered Annual Report and Accounts 2004

Notes to the Accounts
1. Interest Receivable 2004 2003
$million $million
Balances at central banks 3 3 Treasury bills and other eligible bills 254 222 Loans and advances to banks 488 373 Loans and advances to customers 3,550 3,341 Listed debt securities 364 417 Unlisted debt securities 573 434
5,232 4,790
2. Interest Payable 2004 2003
$million $million
Deposits by banks 385 390 Customer accounts:
Current and demand accounts 147 105 Savings deposits 68 68 Time deposits 980 832
Debt securities in issue 120 133 Subordinated loan capital:
Wholly repayable within five years 82 37 Other 282 257
2,064 1,822
3. Dealing Profits 2004
$million 2003
$million
Income from foreign exchange dealing Profits less losses on dealing securities Other dealing profits
494 20
134
396 12
117
648 525
4. Other Operating Income 2004 2003
$million $million
Other operating income includes: Profits less losses on disposal of investment securities 164 62 Premium paid on repurchase of India subordinated debt (23) – Dividend income 11 14
Annual Report and Accounts 2004 Standard Chartered 77

Notes to the Accounts
5. Administrative Expenses 2004 2003*
$million $million
Staff costs: Wages and salaries 1,196 999 Social security costs 32 25 Other pension costs (note 6) 92 84 Other staff costs 214 224
1,534 1,332
Premises and equipment expenses: Rental of premises 150 150 Other premises and equipment costs 159 125 Rental of computers and equipment 12 15
321 290
Other expenses (see below) 721 640
Total administrative expenses 2,576 2,262
*Comparative restated (see note 54 on page 118).
Other expenses include $7.1 million (2003: $6.0 million*) in respect of auditor’s remuneration for the Group of which $0.4 million (2003: $0.4 million) relates to the Company. The auditors of the Company, KPMG Audit Plc and their associated firms, also received $5.9 million (2003: $3.7 million*) in respect of non-audit services provided to the Group’s UK subsidiaries. Details of non-audit services are reflected below.
2004 2003* $million $million
Non-audit fees paid to KPMG Audit Plc and its associated firms: Regulatory reviews 1.7 1.4 Accounting reviews/advisory 0.3 – Capital raising activities 0.2 – Assistance with business acquisitions and disposals 1.1 0.1 Tax advisory 1.2 0.9 Other assistance 1.4 1.3
Total 5.9 3.7
*Comparative restated to present on a consistent basis.
6. Retirement Benefits The total charge for benefits under the Group’s retirement benefit schemes was $82 million (2003: $97 million), of which $45 million (2003: $38 million) was for defined benefit pension schemes, $46 million (2003: $44 million) was for defined contribution pension schemes and $1 million (2003: $2 million) was for post-retirement benefits other than pensions. The finance income was $10 million (2003: charge of $13 million). These have been assessed under the accounting standard, Financial Reporting Standard 17 – Retirement Benefits (FRS17).
The total charge for defined benefit pension schemes under FRS17 is made up of a charge against operating profit of $45 million (2003: $38 million) plus a credit to investment income
of $10 million (2003: charge of $13 million). The total loss recognised in the Statement of Total Recognised Gains and Losses before tax is $5 million (2003: $65 million).
UK Fund The financial position of the Group’s principal retirement benefit scheme, the Standard Chartered Pension Fund (the ‘Fund’) (a defined benefit scheme), is assessed in the light of the advice of an independent qualified actuary. The most recent actuarial assessment of the Fund for the purpose of funding was performed as at 31 December 2002 by T. Cunningham, Fellow of the Institute of Actuaries, of Lane, Clark and Peacock Actuaries, using the projected unit method. The assumptions having the most significant effect on the outcome of this valuation were:
78 Standard Chartered Annual Report and Accounts 2004

6. Retirement Benefits continued
Return from investments held for pensioners 5.0 per cent per annum Return from investments held for non-pensioners before retirement 6.4 per cent per annum Return from investments held for non-pensioners after retirement 5.2 per cent per annum General increase in salaries 4.8 per cent per annum
Increase in pensions: In deferment (where applicable) 2.3 per cent per annum In payment* (pre April 1997 service) 2.3 per cent per annum In payment (post April 1997 service) 2.3 per cent per annum
*Applies to discretionary increases and some guaranteed increases.
Applying these assumptions, at the valuation date the market value of the assets of the Fund ($1,197 million) was sufficient to cover 97 per cent of the benefits that had accrued to members (84 per cent including the allowance for discretionary benefit increases). The Group paid an additional contribution of $114 million into the Fund on 30 December 2003 to improve the financial position of the Fund. No further additional contributions were paid during 2004 and none are currently expected to be required until 1 January 2009.
Contributions payable to the Fund during 2004 totalled $14 million (2003: $139 million) and regular contributions were set at 22.5 per cent of pensionable salary for all United Kingdom (UK) and seconded staff and 38.4 per cent of pensionable salary for international staff. Due to the closure of the Fund to new entrants, the current service cost will increase as the members approach retirement.
Pension costs for the purpose of these accounts were assessed using the same method, but the assumptions were different in several respects.
With effect from 1 July 1998 the Fund was closed to new entrants and new employees have subsequently been offered membership of a defined contribution scheme.
Overseas Pension Schemes The principal overseas defined benefit pension schemes operated by the Group are in Hong Kong, India, Jersey, Kenya and the United States. For the transitional reporting under FRS17 in previous years only these countries were included. As part of the full introduction of FRS17 the reporting has been extended to include all defined benefit schemes operated by the Group.
The disclosures required under FRS17 have been calculated by qualified independent actuaries based on the most recent full actuarial valuations updated, where necessary, to 31 December 2004. (The effective date of the full valuations ranges between 31 December 2002 and 31 December 2004.)
Separate figures are disclosed for the UK Fund, Overseas Defined Benefit, Post-retirement Medical and Other Unfunded Schemes.
The financial assumptions used at 31 December 2004 were:
Funded Defined Benefit Schemes
UK Fund Overseas Schemes1
2004 2003 2002 2004 2003 2002 % % % % % %
Price inflation 2.80 2.80 2.30 2.00-4.50 2.00-3.50 1.50-3.50 Salary increases 5.30 5.30 4.80 4.00-5.00 4.80-7.00 4.00-7.00 Pension increases 2.40 2.40 2.30 0.00-2.40 0.00-2.40 2.25-3.00 Discount rate 5.40 5.50 5.70 4.00-12.00 5.00-8.00 5.00-12.00 Post-retirement
medical trend rate N/A N/A N/A N/A N/A N/A
Pension increases for the UK Fund range from 2.2 per cent to 2.6 per cent. The average has been stated. Deferred pension increases for the UK Fund are assumed to be 2.8 per cent.
1 The range of assumptions shown is for the main overseas schemes in Hong Kong, India, Jersey, Kenya and the United States. These comprise 89 per cent of the total schemes.
Annual Report and Accounts 2004 Standard Chartered 79

Notes to the Accounts
6. Retirement Benefits continued Unfunded Schemes
Post-retirement Medical1 Other
2004 2003 2002 2004 2003 2002 % % % % % %
Price inflation 2.70 2.50 1.75 2.00-6.00 2.50-3.50 1.75-3.50 Salary increases 4.00 4.00 4.00 4.00-8.00 4.00-5.30 4.00-7.00 Pension increases N/A N/A N/A 0.00-2.40 0.00-2.40 0.00-2.30 Discount rate 6.20 6.25 6.75 3.00-10.00 5.50-7.00 5.70-8.50 Post-retirement
medical rate 9% in 2004 10% in 2003 10% in 2002 N/A N/A N/A reducing by 1% reducing by 1% reducing by 1%
per annum to 5% per annum to 5% per annum to 5% in 2008 in 2008 in 2007
1These values only cover the Post-retirement Medical plan in the United States. There are no other Post-retirement Medical schemes.
The assets and liabilities of the schemes, attributable to defined benefit members, at 31 December 2004 were: Funded Defined Benefit Schemes Unfunded Schemes
UK Fund Overseas Schemes Post-retirement Medical Other
Expected Expected1 Expected Expected return on Value return on Value return on Value return on Value
At 31 December 2004 assets % $million assets % $million assets % $million assets % $million
Equities 8.40 649 7.00-12.00 161 N/A N/A N/A N/A Bonds 4.76-5.40 916 4.76-12.00 126 N/A N/A N/A N/A Property 6.50 – 6.50-12.00 6 N/A N/A N/A N/A Others 4.60 31 1.75-4.90 24 N/A N/A N/A N/A
Total market value of assets 1,596 317 N/A N/A Present value of the
schemes’ liabilities (1,679) (334) (11) (45)
Deficit* (83) (17) (11) (45) Related deferred tax asset 25 5 3 13
Net pension liability (58) (12) (8) (32) 1The range of assumptions shown is for the main Overseas Schemes in Hong Kong, India, Jersey, Kenya and the United States.
*No scheme contains a surplus that is non-recoverable.
Funded Defined Benefit Schemes Unfunded Schemes
UK Fund Overseas Schemes Post-retirement Medical Other
Expected Expected Expected Expected return on Value return on Value return on Value return on Value
At 31 December 2003 assets % $million assets % $million assets % $million assets % $million
Equities 8.60 543 7.00-9.50 131 N/A N/A N/A N/A Bonds 4.80-5.50 813 5.50-8.00 93 N/A N/A N/A N/A Property 6.70 1 6.70-8.00 4 N/A N/A N/A N/A Others 4.90 73 2.50-8.00 7 N/A N/A N/A N/A
Total market value of assets 1,430 235 N/A N/A Present value of the
schemes’ liabilities (1,509) (282) (12) (35)
Deficit* (79) (47) (12) (35) Related deferred tax asset 24 13 4 8
Net pension liability (55) (34) (8) (27)
*No scheme contains a surplus that is non-recoverable.
80 Standard Chartered Annual Report and Accounts 2004

6. Retirement Benefits continued Funded Defined Benefit Schemes Unfunded Schemes
UK Fund Overseas Schemes Post-retirement Medical Other
At 31 December 2002
Expected return on assets %
Value $million
Expected return on assets %
Value $million
Expected return on assets %
Value $million
Expected return on assets %
Value $million
Equities Bonds Property Others
8.30 4.50 6.40 4.60
237 855
1 35
7.00-12.00 5.25-12.00 7.00-12.00 1.75-12.00
98 83
2 5
N/A N/A N/A N/A
N/A N/A N/A N/A
N/A N/A N/A N/A
N/A N/A N/A N/A
Total market value of assets Present value of the schemes’ liabilities
1,128 (1,235)
188 (268)
N/A (14)
N/A (17)
Deficit* Related deferred tax asset
(107) 32
(80) 23
(14) 4
(17) 2
Net pension liability (75) (57) (10) (15)
*No scheme contains a surplus that is non-recoverable.
The pension expense for defined benefit schemes on the FRS17 basis was:
Funded Defined Benefit Schemes Unfunded Schemes
Post-Overseas retirement
UK Fund Schemes Medical Other Total Year ending 31 December 2004 $million $million $million $million $million
Current service cost 15 24 – 8 47 Past service cost 1 1 – 1 3 Gain on settlement and curtailments – (5) – – (5)
Total charge to operating profit 16 20 – 9 45
Expected return on pension scheme assets (91) (29) – – (120) Interest on pension scheme liabilities 84 23 1 2 110
Charge to investment income (7) (6) 1 2 (10)
Total charge to profit before deduction of tax 9 14 1 11 35
Gain on assets* (20) (2) – – (22) Experience gain on liabilities – (1) (1) – (2) Loss/(gain) on change of assumptions 23 7 – (1) 29
Total loss/(gain) recognised in Statement of Total Recognised Gains and Losses before tax 3 4 (1) (1) 5
Deferred taxation (1) – – – (1)
Total loss/(gain) after tax 2 4 (1) (1) 4
*In excess of expected return.
Annual Report and Accounts 2004 Standard Chartered 81

Notes to the Accounts
6. Retirement Benefits continued Funded Defined Benefit Schemes Unfunded Schemes
Post-Overseas retirement
UK Fund Schemes Medical Other Total Year ending 31 December 2003 $million $million $million $million $million
Current service cost 11 22 – 4 37 Past service cost (2) – – 8 6 Gain on settlement and curtailments – (5) – – (5)
Total charge to operating profit 9 17 – 12 38
Expected return on pension scheme assets (59) (14) – – (73) Interest on pension scheme liabilities 69 15 1 1 86
Charge to investment income 10 1 1 1 13
Total charge to profit before deduction of tax 19 18 1 13 51
Gain on assets* (42) (25) – – (67) Experience loss/(gain) on liabilities 15 (5) (3) 2 9 Loss on change of assumptions 109 10 1 3 123
Total loss/(gain)recognised in Statement of Total Recognised Gains and Losses before tax 82 (20) (2) 5 65
Deferred taxation (25) 6 1 (2) (20)
Total loss/(gain) after tax 57 (14) (1) 3 45
*In excess of expected return.
Movement in the pension schemes and post–retirement medical deficit during the year comprise: Funded Defined Benefit Schemes Unfunded Schemes
Post-Overseas retirement
UK Fund Schemes Medical Other Total $million $million $million $million $million
Deficit at 1 January 2004 (79) (47) (12) (35) (173) Contributions 14 49 1 1 65 Current service cost (15) (24) – (8) (47) Past service cost (1) (1) – (1) (3) Settlement/curtailment costs – 5 – – 5 Other finance income/(charge) 7 6 (1) (2) 10 Actuarial (loss)/gain (3) (4) 1 1 (5) Exchange rate adjustment (6) (1) – (1) (8)
Deficit at 31 December 2004 (83) (17) (11) (45) (156)
Funded Defined Benefit Schemes Unfunded Schemes
Post-Overseas retirement
UK Fund Schemes Medical Other Total $million $million $million $million $million
Deficit at 1 January 2003 (107) (80)* (14) (17)* (218)* Contributions 139 33 1 1 174 Current service cost (11) (22) – (4) (37) Past service cost 2 – – (8) (6) Settlement/curtailment costs – 5 – – 5 Other finance income/(charge) (10) (1) (1) (1) (13) Actuarial (loss)/gain (82) 20 2 (5) (65) Exchange rate adjustment (10) (2) – (1) (13)
Deficit at 31 December 2003 (79) (47) (12) (35) (173)
*These numbers have been restated to include a number of smaller arrangements excluded on grounds of materiality from last year’s transitional reporting under FRS17.
82 Standard Chartered Annual Report and Accounts 2004

6. Retirement Benefits continued The history of experience gains and losses for the financial year is as follows:
2004 2003 2002
(Gain)/loss on scheme assets: Amount ($million) (22) (67) 99 % of scheme assets at end of year 1.15% 4.02% 7.52%
Experience (gain)/loss on scheme liabilities: Amount ($million) (2) 9 (29) % of scheme liabilities at end of year 0.10% 0.49% 1.91%
Total actuarial loss recognised in statement of total recognised gains and losses: Amount ($million) 5 65 154 % of scheme liabilities at end of year 0.24% 3.56% 10.12%
7. Depreciation and Amortisation 2004
$million 2003
$million
Goodwill Premises Equipment
181 40
199
134 43
204
420 381
8. Directors and Officers Directors’ emoluments Details of directors’ pay and benefits and interests in shares are disclosed in the directors’ remuneration report on pages 54 to 67.
Transactions with directors, officers and others As at 31 December 2004, the total amounts to be disclosed under the Companies Act 1985 (the Act) and the Listing Rules of the Stock Exchange of Hong Kong about loans to directors and officers were as follows:
2004 2003 Number $000 Number $000
Directors – – 3 21 Officers* 7 2,396 12 6,373
*For this disclosure, the term ‘directors’ means the directors of Standard Chartered PLC and the directors of Standard Chartered Bank and the term ‘officers’ means the company secretary and band 1 senior management.
On 27 August 2004, Standard Chartered Links (HK) Limited, a wholly owned subsidiary of Standard Chartered PLC, completed the acquisition of the entire issued share capital of Advantage Limited from Goland Investment Limited, Winsgreat Limited (a wholly owned subsidiary of Sun Hung Kai Properties Limited (‘SHK’)) and Warshall Holdings Limited.
Mr Raymond Kwok, one of the directors of Standard Chartered Bank (Hong Kong) Limited (a wholly owned subsidiary of Standard Chartered PLC), is deemed to be interested (within the meaning of the Hong Kong Securities and Futures Ordinance) in 44.96 per cent of the shares in SHK, which in turn owns all the shares in Winsgreat Limited. Accordingly, Winsgreat is an associate of Mr Kwok and the acquisition of Winsgreat’s shares in Advantage Limited is a connected transaction for Standard Chartered PLC.
Further details of the transaction can be found in note 23 to the accounts.
There were no other transactions, arrangements or agreements outstanding for any director, connected person or officer of the Company which have to be disclosed under the Act, the rules of the UK Listing Authority or the Listing Rules of the Stock Exchange of Hong Kong.
Annual Report and Accounts 2004 Standard Chartered 83

Notes to the Accounts
9. Taxation 2004 2003*
$million $million
Analysis of taxation charge in the period The charge for taxation based upon the profits for the period comprises: United Kingdom corporation tax at 30 per cent (2003: 30 per cent): Current tax on income for the year 407 353 Adjustments in respect of prior periods 17 (34) Double taxation relief (357) (286) Foreign tax: Current tax on income for the period 559 491 Adjustments in respect of prior periods (14) (26)
Total current tax 612 498 Deferred tax:
Origination/reversal of timing differences – current year 38 7 Adjustments in respect of prior periods (13) (8)
25 (1)
Tax on profits on ordinary activities 637 497
Effective tax rate 29.5% 32.1%
*Comparative restated (see note 54 on page 118).
Overseas taxation includes taxation on Hong Kong profits of $122 million (2003: $134 million) provided at a rate of 17.5 per cent (2003: 17.5 per cent) on the profits assessable in Hong Kong. The Group’s total deferred tax asset is $322 million at 31 December 2004, (2003: $339 million). $276 million (2003: $290 million) is disclosed in other assets. The balance of $46 million in December 2004 (2003: $49 million) represents the deferred tax on pension liabilities, so is offset against the pension liabilities amount included in other liabilities.
The current taxation charge for the year is lower than the standard rate of corporation tax in the United Kingdom, 30 per cent. The differences are explained below: 2004 2003*
$million $million
Current tax reconciliation: Profit on ordinary activities before taxation 2,158 1,550
Current tax at 30 per cent (2003: 30 per cent) 648 465 Effects of: Goodwill amortisation not deductible for tax purposes 54 39 (Lower)/higher taxes on overseas earnings (12) 60 One-off adjustments on incorporation of Hong Kong branch (25) – Non-allowable depreciation 6 6 Adjustments to tax charge in respect of previous periods 3 (59) Capital gains against which losses have been applied (36) – Other items (26) (13)
Total current taxation charge 612 498
*Comparative restated (see note 54 on page 118).
10. Dividends on Non-equity Preference Shares 2004 2003
$million $million
Non-cumulative irredeemable preference shares: 73/8 per cent preference shares of £1 each 14 12 81/4 per cent preference shares of £1 each 15 13 Non-cumulative redeemable preference shares: 8.9 per cent preference shares of $5 each 29 30
58 55
84 Standard Chartered Annual Report and Accounts 2004

11. Dividends on Ordinary Equity Shares 2004 2003 Cents Cents
per share $million per share $million
Interim 17.06 201 15.51 182 Final 40.44 524 36.49 429
57.50 725 52.00 611
The 2004 final dividend of 40.44 cents per share will be paid in either sterling, Hong Kong dollars or US dollars on 13 May 2005 to shareholders on the UK register of members at the close of business on 25 February 2005 and to shareholders on the Hong Kong branch register of members at the opening of business in Hong Kong (9.00am Hong Kong time) on 25 February 2005. It is intended that shareholders will be able to elect to receive shares credited as fully paid instead of all or part of the final dividend. Details of the dividend will be sent to shareholders on or around 14 March 2005.
12. Earnings per Ordinary Share
Profit $million
Average number of
shares (‘000)
2004
Amount per share
Profit $million
Average number of
shares (‘000)
2003*
Amount per share
Basic earnings per ordinary share Profit attributable to ordinary shareholders 1,421 1,172,921 969 1,167,333 Premium and costs paid on repurchase
of preference shares – – (12) –
Basic earnings per ordinary share 1,421 1,172,921 121.2c 957 1,167,333 82.0c Effect of dilutive potential ordinary shares Convertible bonds 23 34,488 21 34,488 Options – 3,444 – 6,161
Diluted earnings per ordinary share 1,444 1,210,853 119.3c 978 1,207,982 81.0c
*Comparative restated (see note 54 on page 118).
Normalised earnings per ordinary share The Group measures earnings per share on a normalised basis. This differs from earnings defined in Financial Reporting Standard 14. The following table shows the calculation of normalised earnings per share, i.e. based on the Group’s results excluding amortisation of goodwill, profits/losses of a capital nature and profits/losses on repurchase of preference share capital.
2004 2003* $million $million
Profit attributable to ordinary shareholders, as above 1,421 957 Amortisation of goodwill 181 134 Premium and costs paid on repurchase of preference shares – 12 Profit on sale of shares in – KorAm (95) –
– Bank of China (36) – Premium and costs paid on repurchase of subordinated debt 23 – Costs of Hong Kong incorporation 18 – Tsunami donation 5 –
(85) – Profits less losses on disposal of investment securities (33) (62) Profit on sale of tangible fixed assets (4) – Profit on disposal of subsidiary undertakings (4) – Amounts written off fixed asset investments 1 11
Normalised earnings 1,477 1,052
Normalised earnings per ordinary share 125.9c 90.1c
* Comparative restated (see note 54 on page 118).
Annual Report and Accounts 2004 Standard Chartered 85

Notes to the Accounts
13. Treasury Bills and Other Eligible Bills 2004 2003
$million $million
Dealing securities 236 156 Investment securities 4,189 5,533
Total treasury bills and other eligible bills 4,425 5,689
The estimated market value of treasury bills and similar securities held for investment purposes amounted to $4,188 million (2003: $5,541 million).
Treasury bills and other eligible bills include $nil (2003: $86 million) of bills sold subject to sale and repurchase transactions.
The change in the book amount of treasury bills and similar securities held for investment purposes comprised: Amortisation
Historical of discounts/ Book cost premiums amount
$million $million $million
At 1 January 2004 5,485 48 5,533 Exchange translation differences 17 3 20 Acquisitions 9,396 – 9,396 Maturities and disposals (10,775) (3) (10,778) Amortisation of discounts and premiums – 18 18
At 31 December 2004 4,123 66 4,189
At 31 December 2004, unamortised discounts on treasury bills and similar securities held for investment purposes amounted to $1 million (2003: $11 million) and there were $1 million unamortised premiums (2003: $1 million).
14. Loans and Advances to Banks 2004 2003
$million $million
Repayable on demand 2,272 3,826 With a residual maturity of:
Three months or less 9,031 4,950 Between three months and one year 4,445 3,350 Between one and five years 2,563 705 Over five years 675 592
18,986 13,423 Provisions for bad and doubtful debts (note 17) (52) (59) Interest in suspense (note 18) (12) (10)
18,922 13,354
Loans and advances to banks include balances with central banks and other regulatory authorities amounting to $1,806 million (2003: $1,361 million) which are required by local statute and regulation.
86 Standard Chartered Annual Report and Accounts 2004

15. Loans and Advances to Customers 2004 2003
$million $million
Repayable on demand 7,384 7,181 With a residual maturity of:
Three months or less 20,616 16,321 Between three months and one year 9,713 8,308 Between one and five years 13,617 12,429 Over five years 22,536 18,144
73,866 62,383 Specific provisions for bad and doubtful debts (note 17) (1,373) (1,602) General provisions (note 17) (335) (425) Interest in suspense (note 18) (562) (612)
71,596 59,744
There are loans of $4 million (2003: $4 million) which are subordinated to the claims of other parties.
The Group’s exposure to credit risk is concentrated in Hong Kong and the Asia Pacific region. The Group is affected by the general economic conditions in the territories in which it operates. The Group sets limits on the exposure to any counterparty, and credit risk is spread over a variety of different personal and commercial customers. The Group has outstanding residential mortgage loans to Hong Kong residents of approximately $12.2 billion (2003: $12.0 billion).
The following table shows loans and advances to customers by each principal category of borrower’s business or industry:
2004 2003* One year One to five Over five
or less years years Total Total $million $million $million $million $million
Consumer Banking: Mortgages 1,877 4,156 15,985 22,018 20,289 Other 5,241 3,876 403 9,520 8,961 Small and medium enterprises 989 440 2,050 3,479 2,406
Consumer Banking 8,107 8,472 18,438 35,017 31,656
Agriculture, forestry and fishing 568 80 8 656 700 Construction 531 62 22 615 409 Commerce 5,760 492 73 6,325 5,268 Electricity, gas and water 751 233 410 1,394 967 Financing, insurance and business services 6,776 1,153 1,001 8,930 5,742 Loans to governments 1,819 127 159 2,105 1,110 Mining and quarrying 929 358 240 1,527 731 Manufacturing 7,197 1,100 1,029 9,326 8,360 Commercial real estate 1,441 674 11 2,126 1,864 Transport, storage and communication 1,406 683 873 2,962 2,755 Other 492 183 273 948 607
Wholesale Banking 27,670 5,145 4,099 36,914 28,513
General provision (335) (425)
71,596 59,744
*The analysis of net loans and advances to customers for Consumer and Wholesale Banking at 31 December 2003 has been restated to separately disclose small and medium enterprises within Consumer Banking. This has resulted in a transfer of $514 million from the Wholesale Banking portfolio to Consumer Banking. There was no impact on total net loans and advances to customers.
Annual Report and Accounts 2004 Standard Chartered 87

Notes to the Accounts
16. Assets Leased to Customers 2004 2003 $million $million
Finance leases 181 270 Instalment credit agreements 1,052 867
1,233 1,137
Assets leased to customers are included in loans and advances to customers.
The cost of assets acquired during the year for leasing to customers under finance leases and instalment credit agreements amounted to $111 million (2003: $146 million).
The aggregate amounts of leasing income receivable, including capital repayments, under finance leases amounted to $189 million (2003: $203 million).
17. Provisions for Bad and Doubtful Debts Specific $million
2004 General $million
Specific $million
2003 General $million
Provisions held at 1 January 1,661 425 1,824 468 Exchange translation differences 15 – 33 – Amount utilised – (39) – (33) Amounts written off (607) – (910) – Recoveries of amounts previously written off 95 – 84 – Other (8) 4 84 – New provisions 609 – 904 – Recoveries/provisions no longer required (340) (55) (358) (10) Net charge against profit 269 (55) 546 (10)
Provisions held at 31 December 1,425 335 1,661 425
The following table shows specific provisions by each principal category of borrower’s business or industry:
2004 2003 $million $million
Loans to individuals: Mortgages 61 85 Other 67 56 Small and medium enterprises 17 7
Consumer Banking 145 148
Agriculture, forestry and fishing 39 22 Construction 40 47 Commerce 386 469 Electricity, gas and water 11 17 Financing, insurance and business services 101 78 Loans to governments 44 – Mining and quarrying 34 24 Manufacturing 435 618 Commercial real estate 3 23 Transport, storage and communication 49 62 Other 86 94
Wholesale Banking 1,228 1,454
Provisions for bad and doubtful debts against loans and advances to customers (note 15) 1,373 1,602 Provisions for bad and doubtful debts against loans and advances to banks (note 14) 52 59
Total provisions for bad and doubtful debts 1,425 1,661
88 Standard Chartered Annual Report and Accounts 2004

18. Interest in Suspense 2004 2003
$million $million
At 1 January 725 853 Exchange translation differences 17 (4) Withheld from profit 61 135 Amounts written off (195) (259) Other 6 –
At 31 December 614 725
Total interest in suspense relating to: Loans and advances to customers (note 15) 562 612 Loans and advances to banks (note 14) 12 10 Prepayments and accrued income 40 103
614 725
19. Non-performing Loans SCNB (LMA)
$million Other
$million
2004 Total
$million SCNB (LMA)
$million Other
$million
2003 Total
$million
Loans and advances on which interest is suspended Specific provisions for bad and doubtful debts Interest in suspense
351 (115)
–
2,552 (1,310)
(574)
2,903 (1,425)
(574)
772 (112)
–
3,031 (1,549)
(622)
3,803 (1,661)
(622)
236 668 904 660 860 1,520
The Group acquired Standard Chartered Nakornthon Bank (SCNB) (formerly Nakornthon Bank) in September 1999. Under the terms of the acquisition, non-performing loans (NPLs) of THB38.75 billion ($998 million) were subject to a Loan Management Agreement (LMA) with the Financial Institutions Development Fund (FIDF), a Thai Government agency. Under the LMA, the FIDF has guaranteed the recovery of a principal amount of the NPLs of THB23 billion ($592 million). The LMA also provides, inter alia, for loss sharing arrangements whereby the FIDF will bear up to 85 per cent of losses in excess of the
guaranteed amount. The guarantee from FIDF is being progressively settled with the final settlement expected in early 2005. The carrying cost of the NPLs is reimbursable by the FIDF to SCNB every half year for a period of five years from the date of acquisition.
Excluding the SCNB non-performing loan portfolio, subject to the LMA, specific provisions and interest in suspense together cover 74 per cent (2003: 72 per cent) of total non-performing lending to customers.
2004 2003 Customers Banks Total Customers Banks Total
$million $million $million $million $million $million
Gross loans and advances on which interest is suspended 58 2 60 104 – 104 Gross loans and advances on which provisions have been raised 2,726 117 2,843 3,535 164 3,699
Total gross loans and advances on which interest is suspended 2,784 119 2,903 3,639 164 3,803
Income suspended in the period amounted to $117 million (2003: $206 million). Income recognised in the period was $56 million (2003: $71 million).
Annual Report and Accounts 2004 Standard Chartered 89

Notes to the Accounts
20. Debt Securities and Other Fixed Income Securities 2004 Book amount Book amount Book amount Valuation
Investment Dealing Total debt Investment securities securities securities securities
$million $million $million $million
Issued by public bodies: Government securities 8,206 1,719 9,925 8,231 Other public sector securities 1,263 – 1,263 1,256
9,469 1,719 11,188 9,487
Issued by banks: Certificates of deposit 6,076 82 6,158 6,068 Other debt securities 6,269 777 7,046 6,285
12,345 859 13,204 12,353
Issued by other issuers: Other debt securities 2,895 1,008 3,903 2,900
2,895 1,008 3,903 2,900
Total debt securities 24,709 3,586 28,295 24,740
Of which: Listed on a recognised UK exchange 5,651 – 5,651 5,671 Listed elsewhere 6,700 1,505 8,205 6,723 Unlisted 12,358 2,081 14,439 12,346
24,709 3,586 28,295 24,740
Book amount investment securities: One year or less 14,627 One to five years 8,107 More than five years 1,975
24,709
90 Standard Chartered Annual Report and Accounts 2004

20. Debt Securities and Other Fixed Income Securities continued 2003 Book amount Book amount Book amount Valuation
Investment Dealing Total debt Investment securities securities securities securities
$million $million $million $million
Issued by public bodies: Government securities 7,496 819 8,315 7,570 Other public sector securities 476 – 476 478
7,972 819 8,791 8,048
Issued by banks: Certificates of deposit 4,086 65 4,151 4,072 Other debt securities 5,215 353 5,568 5,212
9,301 418 9,719 9,284
Issued by other issuers: Bills discountable with recognised markets – 17 17 – Other debt securities 3,528 1,086 4,614 3,489
3,528 1,103 4,631 3,489
Total debt securities 20,801 2,340 23,141 20,821
Of which: Listed on a recognised UK exchange 5,855 – 5,855 5,846 Listed elsewhere 5,298 957 6,255 5,301 Unlisted 9,648 1,383 11,031 9,674
20,801 2,340 23,141 20,821
Book amount investment securities: One year or less 10,993 One to five years 8,445 More than five years 1,363
20,801
Debt securities include $1,068 million (2003: $559 million) of securities sold subject to sale and repurchase transactions, and $114 million (2003: $698 million) which are subordinated to the claims of other parties.
The valuation of listed investments is at market value and of unlisted investments at directors’ estimate.
The change in the book amount of debt securities held for investment purposes comprised: Amortisation
Historical of discounts/ Book cost premiums amount
$million $million $million
At 1 January 2004 20,791 10 20,801 Exchange translation differences (35) 19 (16) Acquisitions 75,353 – 75,353 Maturities and disposals (71,499) 47 (71,452) Amortisation of discounts and premiums – 23 23
At 31 December 2004 24,610 99 24,709
At 31 December 2004, unamortised premiums on debt securities held for investment purposes amounted to $135 million (2003: $163 million) and unamortised discounts amounted to $356 million (2003: $366 million).
Annual Report and Accounts 2004 Standard Chartered 91

Notes to the Accounts
21. Equity Shares and Other Variable Yield Securities Book amount
Investment securities
$million
2004 Valuation
Investment securities
$million
Book amount Investment
securities $million
2003 Valuation
Investment securities
$million
Listed on a recognised UK exchange Listed elsewhere
– 88
– 107
1 261
1 353
Unlisted 165 188 97 97
253 295 359 451
One year or less One to five years More than five years Undated
10 35
1 207
10 35
1 249
14 40
– 305
14 44
– 393
253 295 359 451
The valuation of listed securities is at market value and of unlisted securities at directors’ estimate.
Income from listed equity shares amounted to $4 million (2003: $5 million) and income from unlisted equity shares amounted to $7 million (2003: $9 million).
The change in the book amount of equity shares held for investment purposes comprised: Historical
cost $million
Provisions $million
Book amount $million
At 1 January 2004 398 (39) 359 Exchange translation differences 2 (1) 1 Acquisitions 121 – 121 Disposals (207) (7) (214) Other (13) (1) (14)
At 31 December 2004 301 (48) 253
22. Investments in Subsidiary Undertakings Historical Revaluation cost reserve Loans Total*
$million $million $million $million
At 1 January 2004 previously published 4,243 3,662 1,568 9,473 Prior year adjustment (note 54) – (186) – (186)
At 1 January 2004 restated 4,243 3,476 1,568 9,287 Exchange translation differences 2 – 20 22 Increase in net assets of subsidiary undertakings – 932 – 932 Disposals (1) – – (1)
At 31 December 2004 4,244 4,408 1,588 10,240
*Comparative restated (see note 54 on page 118).
92 Standard Chartered Annual Report and Accounts 2004

22. Investments in Subsidiary Undertakings continued At 31 December 2004, the principal subsidiary undertakings, all indirectly held and principally engaged in the business of banking and provision of other financial services, were as follows:
Group interest in Country and place of incorporation or registration Main areas of operation ordinary share capital
Standard Chartered Bank, England and Wales United Kingdom, Middle East, 100% South Asia, Asia Pacific, Americas and, through Group companies, Africa
Standard Chartered Bank Malaysia Berhad, Malaysia Malaysia 100%
Standard Chartered Bank (Hong Kong) Limited, Hong Kong Hong Kong 100%
Standard Chartered Nakornthon Bank Public Company Limited,Thailand Thailand 75%
Standard Chartered Capital Management (Jersey) LLC, United States United States 100%
Standard Chartered Receivables (UK) Limited, England and Wales United Kingdom 100%
Standard Chartered Financial Investments Limited, England and Wales United Kingdom 100%
Standard Chartered Debt Trading Limited, England and Wales United Kingdom 100%
Details of all Group companies will be filed with the next annual return of the Company.
23. Business Acquisitions Summary of the cash flow effects of acquisitions of subsidiary undertakings, joint ventures and businesses
Book value Fair value at date of Fair value at date of
acquisition adjustments Revaluations acquisition $million $million $million $million
Tangible fixed assets 12 (1) – 11 Loans and advances to banks and customers 1,518 – – 1,518 Treasury bills and other eligible bills 131 – – 131 Equity shares (18) – – (18) Interests in joint ventures 192 – – 192 Cash and balances at central banks 26 – – 26 Other assets 90 (8) – 82
Total assets 1,951 (9) – 1,942
Deposits by banks and customer accounts 940 – – 940 Other liabilities 754 – – 754
Total liabilities 1,694 – – 1,694
Net assets Minority interests Goodwill
248 (8) 93
333
Consisting of: Cash Acquisition costs
328 5
333
Annual Report and Accounts 2004 Standard Chartered 93

Notes to the Accounts
23. Business Acquisitions continued Total
$million
Post acquisition profit after taxation 6
Cash flow effects of acquisitions: Net cash outflow from operating activities 2
2
Purchase of interests in subsidiary undertakings: Cash and acquisition costs 333 Cash acquired (26)
307
Fair value adjustments for consistent accounting policies principally relate to alignment of policies on depreciation of tangible fixed assets and measurement of credit risk.
Acquisitions in the table above include the additional 25 per cent stake in Standard Chartered Bank Nepal Limited, 100 per cent ownership of Advantage Limited, the 31.555 per cent stake in PT Bank Permata Tbk, and the ANZ Project Finance business (excluding Australia and Non-Japan Asia).
The effective date of acquisition of the additional 25 per cent stake in Standard Chartered Bank Nepal Limited was 19 August 2004. The acquisition has been accounted for using the acquisition method. Purchased goodwill is being amortised over 10 years. The post-acquisition profit after taxation and minority interests was $1 million.
The effective date of acquisition of Advantage Limited (‘Advantage’) was 27 August 2004. It has been accounted for using the acquisition method. Purchased goodwill is being amortised over 10 years. The post acquisition profit after taxation of Advantage was $4 million.
The total consideration payable for the shares in Advantage was HKD 980 million, calculated as a multiple of the audited net book
24. Intangible Fixed Assets
value of Advantage as at 30 June 2004, adjusted to reflect the current market value of certain properties and any shortfall in the net assets of an associated company (‘Consideration’). A deposit of HKD 100 million was paid by Standard Chartered Links (Hong Kong) Limited on signing of the Agreement on 28 June 2004. An amount equal to 90 per cent of the Consideration (less the deposit) was paid in cash on completion of the Agreement with the balance payable on 31 December 2005. The consideration will be fully funded from the Group’s internal resources.
The effective date of acquisition of PT Bank Permata Tbk was 10 December 2004. It has been accounted for using the acquisition method. Purchased goodwill is being amortised over 20 years. The acquisition is being equity accounted as a joint venture. The Group's share of post acquisition profits after amortisation of goodwill and taxation was $2 million.
The effective date of acquisition of the ANZ Project Finance business (excluding Australia and Non-Japan Asia) was 10 December 2004. It has been accounted for using the acquisition method. Purchased goodwill is being amortised over 10 years. The post-acquisition loss after taxation was $1 million, including integration expenses of $2 million and amortisation of goodwill.
Goodwill $million
Cost At 1 January 2004 2,500 Movements during the year 95
At 31 December 2004 2,595
Provisions for amortisation At 1 January 2004 514 Amortisation charged in the year 181
At 31 December 2004 695
Net book value at 31 December 2004 1,900
Net book value at 31 December 2003 1,986
94 Standard Chartered Annual Report and Accounts 2004

24. Intangible Fixed Assets continued
Purchased goodwill in respect of acquisitions post 1 January 1998 is being amortised on a straight-line basis over a period of between 10 and 20 years. Prior to 1998 purchased goodwill was written off through reserves in the year of acquisition. Movements during the year related to the acquisition of PrimeCredit, Standard Chartered Bank Nepal Limited and the ANZ Project Finance business.
25. Tangible Fixed Assets Premises Equipment Total
$million $million $million
Cost or valuation At 1 January 2004 605 894 1,499 Exchange translation differences 7 13 20 Additions 131 109 240 Disposals and fully depreciated assets written off (67) (182) (249) Other 9 1 10
At 31 December 2004 685 835 1,520
Depreciation Accumulated at 1 January 2004 129 486 615 Exchange translation differences 2 9 11 Charge for the year 40 199 239 Attributable to assets sold or written off (21) (177) (198) Other 2 5 7 Impairment 2 – 2
Accumulated at 31 December 2004 154 522 676
Net book value at 31 December 2004 531 313 844
Net book value at 31 December 2003 476 408 884
2004 2003 $million $million
Premises – analysis of net book value Freehold 140 153 Long leasehold 75 75 Short leasehold 316 248
531 476
Premises – cost or valuation At cost 289 197 At valuations made: 1999 13 13 2002 383 395
685 605
On the historical cost basis, the book amount of premises amounted to: Cost 731 660 Accumulated depreciation (179) (166)
Net book value 552 494
Valuations were carried out on an open market existing use basis by the directors based upon the advice of independent qualified professional valuers. The net book value of premises occupied by the Group for its own activities at 31 December 2004 was $454 million (2003: $476 million). Cost or valuation of premises subject to depreciation at 31 December 2004 was $595 million (2003: $499 million).
Annual Report and Accounts 2004 Standard Chartered 95

Notes to the Accounts
26. Future Rental Commitments Under Operating Leases The Group’s future annual rental commitments under operating leases are as follows: 2004 2003
Premises Equipment Premises Equipment $million $million $million $million
Annual rental on operating leases expiring: Within one year 14 1 10 6 Between one and five years 27 1 35 4 Five years or more 19 – 26 –
60 2 71 10
The majority of leases relating to premises are subject to rent reviews.
27. Other Assets 2004 2003*
$million $million
Mark-to-market adjustments arising on foreign exchange and interest rate contracts 7,318 7,778 Hong Kong SAR Government certificates of indebtedness (note 32 and note 43) 2,532 2,249 Assets awaiting sale 4 1 Deferred taxation (note 33) 276 290 Other 1,599 1,678
11,729 11,996 *Comparative restated (see note 54 on page 118).
The Hong Kong SAR Government certificates of indebtedness are subordinated to the claims of other parties.
28. Deposits by Banks 2004 2003
$million $million
Repayable on demand 2,588 3,894 With agreed maturity dates or periods of notice, by residual maturity:
Three months or less 8,963 5,057 Between three months and one year 2,268 1,502 Between one and five years 1,994 446 Over five years – 25
15,813 10,924
The deposits by banks over five years at 31 December 2003 are on a fixed rate charge. $6 million is charged at 3 per cent and $19 million at 5.56 per cent.
96 Standard Chartered Annual Report and Accounts 2004

29. Customer Accounts 2004 2003
$million $million
Repayable on demand 36,862 31,619 With agreed maturity dates or periods of notice, by residual maturity:
Three months or less 40,842 35,789 Between three months and one year 5,626 5,615 Between one and five years 1,204 742 Over five years 38 2
84,572 73,767
30. Debt Securities in Issue 2004 2003 Certificates Certificates
of deposit of Other debt of deposit of Other debt $100,000 securities $100,000 securities
or more in issue Total or more in issue Total $million $million $million $million $million $million
By residual maturity: Three months or less 1,707 1,834 3,541 1,711 612 2,323 Between three and six months 701 206 907 487 52 539 Between six months and one year 637 475 1,112 1,030 59 1,089 Between one and five years 1,013 724 1,737 1,552 459 2,011 Over five years 21 60 81 13 87 100
4,079 3,299 7,378 4,793 1,269 6,062
Annual Report and Accounts 2004 Standard Chartered 97

Notes to the Accounts
31. Structure of Deposits The following table sets out the structure of the Group’s deposits by principal geographic regions where it operates at 31 December 2004 and 31 December 2003:
2004 2003 $million $million
Deposits by banks (note 28) 15,813 10,924 Customer accounts (note 29) 84,572 73,767 Debt securities in issue (note 30) 7,378 6,062
107,763 90,753
2004 Asia Pacific MESA
Other Middle Americas, Hong Other East & Other UK & Group Kong Singapore Malaysia Asia Pacific India UAE South Asia Africa Head Office Total
$million $million $million $million $million $million $million $million $million $million
Non-interest bearing current and demand accounts 3,602 2,040 989 1,228 1,224 1,114 1,146 1,159 16 12,518
Interest bearing current and demand accounts 15,300 2,329 130 2,831 2 661 429 1,603 3,920 27,205
Savings deposits 24 528 437 1,715 970 249 1,350 512 9 5,794 Time deposits 13,155 9,847 3,423 6,189 3,441 2,529 1,657 679 10,410 51,330 Other deposits 2 50 569 894 2 187 215 69 1,550 3,538
Total 32,083 14,794 5,548 12,857 5,639 4,740 4,797 4,022 15,905 100,385
Deposits by banks (note 28) 1,204 3,150 813 3,361 1,109 1,007 355 110 4,704 15,813 Customer accounts (note 29) 30,879 11,644 4,735 9,496 4,530 3,733 4,442 3,912 11,201 84,572
32,083 14,794 5,548 12,857 5,639 4,740 4,797 4,022 15,905 100,385 Debt securities in
issue (note 30) 1,508 758 401 1,063 387 – – 1 3,260 7,378
Total 33,591 15,552 5,949 13,920 6,026 4,740 4,797 4,023 19,165 107,763
2003 Asia Pacific MESA
Other Middle Americas, Hong Other East & Other UK & Group Kong Singapore Malaysia Asia Pacific India UAE South Asia Africa Head Office Total
$million $million $million $million $million $million $million $million $million $million
Non-interest bearing current and demand accounts 2,997 1,814 781 944 1,049 775 920 867 433 10,580
Interest bearing current and demand accounts 14,294 1,538 94 1,906 3 599 325 991 3,863 23,613
Savings deposits 22 492 453 978 786 214 1,080 520 4 4,549 Time deposits 12,671 7,751 2,833 4,993 2,987 2,108 1,480 749 8,105 43,677 Other deposits 16 45 593 803 230 169 246 150 20 2,272
Total 30,000 11,640 4,754 9,624 5,055 3,865 4,051 3,277 12,425 84,691
Deposits by banks (note 28) 1,097 921 733 1,725 1,234 955 305 160 3,794 10,924 Customer accounts (note 29) 28,903 10,719 4,021 7,899 3,821 2,910 3,746 3,117 8,631 73,767
30,000 11,640 4,754 9,624 5,055 3,865 4,051 3,277 12,425 84,691 Debt securities in
issue (note 30) 2,068 346 351 783 87 – – 1 2,426 6,062
Total 32,068 11,986 5,105 10,407 5,142 3,865 4,051 3,278 14,851 90,753
98 Standard Chartered Annual Report and Accounts 2004

32. Other Liabilities 2004 2003*
$million $million
Mark-to-market adjustments arising on foreign exchange and interest rate contracts 7,077 7,792 Notes in circulation (note 27 and note 43) 2,532 2,249 Short positions in treasury bills 2 73 Short positions in debt securities 751 461 Current taxation 295 225 Proposed dividend 532 439 Other liabilities 5,172 2,745
16,361 13,984
*Comparative restated (see note 54 on page 118).
Short positions in treasury bills and short positions in debt securities are stated at market value.
33. Deferred Taxation 2004 2003
$million $million
Deferred taxation comprises: Accelerated tax depreciation (7) 14 Provisions for bad debts (144) (180) Tax losses carried forward (5) (19) Premises revaluation (5) (1) Unrealised foreign tax (21) (8) Pension (46) (48) Other timing differences (94) (97)
(322) (339)
Changes in deferred taxation balances during the year comprised: At 1 January (339) (236) Exchange translation differences (14) (21) Origination/reversal of timing differences 25 (1) Credit to profit (1) – Impact of FRS17 restatement (note 54) – (68) Other 7 (13)
At 31 December (322) (339)
$276 million (2003: $290 million) of the net deferred tax asset is included in other assets (note 27), the balance of $46 million (2003: $49 million) is included in pension and post-retirement net of deferred tax (see note 6).
2004 2003 $million $million
No account has been taken of the following potential deferred taxation assets/(liabilities): Tax losses carried forward 4 26 Provisions for bad debts 20 20 Other 35 10 Unrelieved foreign tax 178 143 Premises revaluation (16) (16)
No provision is made for any tax liability which might arise on the disposal of subsidiary undertakings at the amounts stated in these accounts, other than in respect of disposals which are intended in the foreseeable future. As it is expected that substantially all such assets will be retained by the Group, it is considered that no useful purpose would be served by attempting to quantify the unprovided potential liability.
Annual Report and Accounts 2004 Standard Chartered 99

Notes to the Accounts
34. Provisions for Liabilities and Charges Provision for contingent
liabilities and commitments
$million
Other provisions
$million Total
$million
At 1 January 2004 Exchange translation differences Charge against profit Provisions utilised Other
41 4 – – 7
5 –
14 (6) (6)
46 4
14 (6) 1
At 31 December 2004 52 7 59
35. Pension and Post Retirement Liabilities (net of deferred tax) 2004
$million
At 1 January 2004 (74) Prior year adjustment (see note 54) 202
128 Exchange translation differences 9 Change against profit 82 Provision utilised (110) Other 11
At 31 December 2004 120
Included in Pension and Post Retirement Liabilities is $10 million (2003: $4 million) relating to defined contribution plans.
100 Standard Chartered Annual Report and Accounts 2004

36. Subordinated Loan Capital 2004 2003*
$million $million
Undated – Company Primary Capital Floating Rate Notes: $400 million 400 400 $300 million (Series 2) 300 300 $400 million (Series 3) 400 400 $200 million (Series 4) 200 200 £150 million 288 268
Undated subordinated loan capital – Group 1,588 1,568
Dated – Subsidiary undertakings £30 million Floating Rate Notes 2009 57 53 £300 million 6.75 per cent Notes 2009 517 480 €600 million 5.375 per cent Notes 2009 730 676 $25 million Floating Rate Notes 2004/2009 – 25 BWP 75 million Floating Rate Notes 2012 18 17 $325 million Floating Rate Notes 2005/2010 313 312 €575 million 4.5 per cent Notes 2010 771 714 $700 million 8.0 per cent subordinated Notes 2031 620 621 €500 million 8.16 per cent non-cumulative Trust Preferred Securities 2010 674 624 £300 million 8.103 per cent Step-Up Callable Perpetual Trust Preferred Securities 572 531 £200 million Step-Up Notes 2022 373 346 $350 million 4.375 per cent Notes 2014 (Floating rate from 2009) 350 – HKD 500 million 3.5 per cent Notes 2014 (Floating rate from 2009) 64 – HKD 670 million Floating Rate Notes 2014 85 –
Dated subordinated loan capital – Group 5,144 4,399
Dated subordinated loan capital – Repayable: Within one year 1,084 25 Between one and two years – 1,026 Between two and five years 1,805 – Over five years 2,255 3,348
Dated subordinated loan capital – Group 5,144 4,399
Total subordinated liabilities 6,732 5,967
*Comparative restated (see note 54 on page 118).
All dated and undated loan capital described above is unsecured, unguaranteed and subordinated to the claims of other creditors including, without limitation, customer deposits and deposits by banks.
On 17 March 2000, the Group issued at par €575 million of 4.5 per cent Subordinated Guaranteed Convertible Bonds via a Jersey incorporated subsidiary, Standard Chartered Finance (Jersey) Ltd. The bondholders have the right to convert each bond (denominated in units of €1,000 face value) into one fully paid €1,000 Preference Share in Standard Chartered Finance (Jersey) Ltd at any time on or after 26 April 2000. These will be exchanged immediately for ordinary shares in Standard Chartered PLC at a price of 1,018.70 pence per ordinary share (the ‘exchange price’, which is subject to adjustment as set out in the offering circular). Unless previously redeemed, purchased and cancelled
or converted, bonds will be redeemed on 30 March 2010, although they may be redeemed at Standard Chartered’s option after 15 April 2005. They may be redeemed earlier if 85 per cent of the bonds have been converted.
On 11 May 2001, the Group issued Tier 1 Capital £300 million of 8.103 per cent Step-Up Callable Perpetual Trust Preferred Securities. These are redeemable at the option of Standard Chartered Bank (‘the Bank’) on 11 May 2016 or on any coupon payment date thereafter. Dividends are set at a rate of 8.103 per cent per annum until 2016. Thereafter they will be reset every five years as the aggregate of 4.275 per cent and the five year benchmark gilt-rate. The preferred securities may, at the Bank’s option, be either exchanged or their terms varied so that they become Upper Tier 2 securities, upon the occurrence of certain tax or regulatory events.
Annual Report and Accounts 2004 Standard Chartered 101

Notes to the Accounts
36. Subordinated Loan Capital continued On 22 March 2000, the Group issued Tier 1 Capital €500 million of 8.16 per cent Non-cumulative Trust Preferred Securities in Standard Chartered Capital Trust LLP, a Delaware statutory business trust, representing a corresponding amount of 8.16 per cent Non-cumulative Partnership Preferred Securities of Standard Chartered Capital LLP, a Delaware limited partnership in which Standard Chartered Bank (‘the Bank’) is the general partner. The securities may be redeemed at the option of the Bank in its capacity as general partner of the Partnership in whole or (in certain circumstances) in part on 23 March 2010 or in whole or in part on any dividend payment date thereafter. Dividends are fixed at 8.16 per cent for ten years and at Euribor plus 3.8 per cent thereafter. The securities will be exchanged for preference shares in Standard Chartered PLC in the event that they have not been redeemed by 2045, the Bank’s or Group’s total capital ratio is less than the regulatory minimum or the Partnership is liquidated. The holders of the securities will have the right, subject to the Partnership’s right of redemption, to exchange their securities for the cash proceeds of a sale of ordinary shares of Standard Chartered PLC on 23 March 2010.
On 30 October 2000, the Group issued £200 million Undated Subordinated Step-Up Notes. These are redeemable at the option of the Bank at par on 31 January 2022. The coupon is 7.75 per cent fixed until 31 January 2022, when the rate will be re-fixed.
The Group policy is to manage its capital actively. During 2002 the Group bought back a portion of its subordinated debt issues on the open market. The amounts stated are net of the repurchases.
On 3 December 2004, the Group issued $350 million notes at 99.938 per cent. Interest is payable on the notes at 4.375 per cent Fixed Rate to, but excluding, 4 December 2009 and at Floating Rate thereafter. All of the notes may be redeemed by the Group on any interest payment date from and including 4 December 2009.
There is not an option to redeem anything less than 100 per cent of the notes. The notes will mature on 3 December 2014.
On 3 December 2004, the Group issued HKD 670 million Floating Rate Notes at par. Interest is payable at HIBOR plus 37 basis points up until 4 December 2009, when the rate increases to HIBOR plus 87 basis points. All of the Notes may be redeemed by the Group on the interest payment date on 4 December 2009. There is not an option to redeem anything less than 100 per cent of the notes. The notes will mature on 3 December 2014.
On 3 December 2004, the Group issued HKD 500 million notes at 99.886 per cent. Interest is payable on the notes at 3.50 per cent Fixed Rate to, but excluding, the interest payment date on 4 December 2009 and at Floating Rate thereafter. All of the notes may be redeemed by the Group on the interest payment date falling in December 2009. There is not an option to redeem anything less than 100 per cent of the notes. The notes will mature on 3 December 2014.
$25 million Floating Rate Notes 2004/2009 were redeemed in July 2004.
On 3 February 2005, the Group issued €750 million subordinated Lower Tier II notes (‘Euro Notes’) at an issue price of 99.43 per cent and $500 million subordinated Lower Tier II notes (‘Dollar Notes’) at an issue price of 99.86 per cent. Interest is payable annually on the Euro Notes at a fixed rate of 3.625 per cent until 3 February 2012 when variable rate interest of 3 month Euribor plus 87 basis points will be paid. The Euro Notes will mature on 3 February 2017. The Euro Notes are callable on 3 February 2012 and at each subsequent interest date. Interest is payable quarterly on the Dollar Notes at a variable rate of US$ Libor plus 30 basis points until 4 February 2010 when the rate will increase to Libor plus 80 basis points. The Dollar Notes will mature on 3 February 2015. The Dollar Notes are callable on 4 February 2010 and at each subsequent interest date.
37. Minority Interests The change in minority shareholders’ interests in subsidiary undertakings comprised: Equity Non equity Total
$million $million $million
At 1 January 2004 83 531 614 Exchange translation differences 1 10 11 Additions – 294 294 Retained profits 15 10 25 Other 12 – 12
At 31 December 2004 111 845 956
Non equity minority interests include third party investments in the Global Liquidity Fund.
102 Standard Chartered Annual Report and Accounts 2004

38. Called-up Share Capital Authorised The authorised share capital of the Company at 31 December 2004 was $5,137 million (2003: $4,971 million) made up of 2,632 million ordinary shares of $0.50 each, 500 million non-cumulative irredeemable preference shares of £1 each, 300 million non-cumulative redeemable preference shares of $5 each and one million non-cumulative preference shares of €1,000 each.
Preference Preference Ordinary shares shares of $5 each shares of £1 each of $0.50 each Number of shares Number of shares Number of shares Total
(‘000) (‘000) (‘000) $million
Allotted, called-up and fully paid At 1 January 2004 331 195,285 1,174,818 939 Exchange translation differences – – – 26 Issued instead of dividends – – 2,979 1 Issued under employee share option schemes – – 1,272 1
At 31 December 2004 331 195,285 1,179,069 967
On 14 May 2004, 2,066,122 ordinary shares were issued instead of the 2003 final dividend. On 8 October 2004, 912,977 ordinary shares were issued instead of the 2004 interim dividend.
At the AGM in May 2004 the shareholders authorised the Company to buy back up to 117,487,333 of the Company’s ordinary shares. This was approximately ten per cent of the issued ordinary share capital as at 23 February 2004. In addition, the shareholders authorised the Company to buy back up to all of the Company’s issued preference share capital. Neither the Company nor any of its subsidiaries bought, sold or redeemed any securities of the Company listed on The Stock Exchange of Hong Kong Limited during 2004.
During 2003, the Company repurchased 9,486 8.9 per cent non-cumulative redeemable preference shares of $5 each at prices between $1,112.50 and $1,140.52. The total premium paid on the repurchase was $10.7 million. The repurchased shares were cancelled leaving 331,388 $5 preference shares in issue.
During 2003, the Company repurchased 3,965,000 73/8 per cent non-cumulative irredeemable preference shares of £1 each at prices between £1.12875 and £1.13. The total premium paid on the repurchase was $0.9 million. The repurchased shares were cancelled leaving 96,035,000 73/8 per cent preference shares in issue.
During 2003, the Company repurchased 750,000 81/4 per cent non-cumulative irredeemable preference shares of £1 each at £1.22875. The total premium paid on the repurchase was $0.3 million. The repurchased shares were cancelled leaving 99,250,000 81/4 per cent preference shares in issue.
On 10 January 2005, the Company placed 117,902,943 new ordinary shares of $0.50 each at a price of 920 pence per share representing approximately 9.99 per cent of the Company’s existing issued ordinary share capital. The placees (comprising more than six in number) were professional and institutional investors, independent of and not connected with the Company and its subsidiaries and their respective associates. The shares were issued on 14 January 2005 raising net proceeds of approximately GBP 1,071 million ($2.1 billion), a net price per share of 908.5 pence. The market price of the Company’s
ordinary shares at close of business in London on 10 January 2005 was 928.5 pence. The shares that were issued had an aggregate nominal amount of $58,981,471.50.
The purpose of the share issue was to aid the funding of the purchase of the entire share capital of Korea First Bank for approximately KRW 3.4 trillion ($3.3 billion) in cash.
Subject to certain conditions, all or part of the 8.9 per cent non-cumulative preference shares of $5 each may be redeemed at the option of the issuer at dividend payment dates on or after October 2006.
The £1 and $5 preference shares carry the right to repayment of capital in the event of a winding up of the Company. They do not carry a right to vote at general meetings unless a dividend is unpaid or a resolution is proposed at the meeting to vary their rights.
Up to 117,481,806 ordinary shares of $0.50 each, being part of the authorised share capital, may be issued under the employee share schemes.
1984 and 1994 Executive Share Option Schemes As at 1 January 2004, there were options outstanding over 3,765,364 ordinary shares under the schemes. During the year options over 343,010 ordinary shares lapsed and options over 1,169,405 ordinary shares were exercised at various prices from 256 pence to 888 pence. There were no options granted under these schemes during the year.
As at 31 December 2004, there were options outstanding over 2,252,949 ordinary shares which may be exercised on various dates up to 2009 under the rules of the schemes.
Supplemental Executive Share Option Scheme As at 1 January 2004, there were options outstanding over 833,946 ordinary shares under the scheme. During the year 454,127 options over ordinary shares lapsed and there were no exercises.
The exercise of these options will be linked to performance criteria.
As at 31 December 2004, there were options outstanding over 379,819 ordinary shares, which may be exercised on various dates up to 2005 under the scheme rules.
Annual Report and Accounts 2004 Standard Chartered 103

Notes to the Accounts
38. Called-up Share Capital continued 1997 Restricted Share Scheme As at 1 January 2004, there were awards outstanding over 5,562,480 ordinary shares. During the year, awards over 1,491,198 ordinary shares were exercised and awards over 278,383 ordinary shares lapsed.
The following awards were made: Date award made Number of shares awarded Exercise period
4 March 2004 14 September 2004
1,362,674 240,447
2006–2011 2006–2011
As at 31 December 2004, there were awards outstanding over 5,396,020 ordinary shares.
2000 Executive Share Option Scheme As at 1 January 2004 there were options outstanding over 27,866,978 ordinary shares under the scheme. During the year options over 381,612 ordinary shares lapsed and 2,896,821 ordinary share options were exercised at various prices from 690.5 pence to 935.5 pence.
The following options were granted under the scheme: Number of Date option granted Option price per share shares under option Exercise period
4 March 2004 935.5p 5,888,950 2007–2014 14 September 2004 958.0p 230,476 2007–2014
The exercise of options granted during the year will be linked to performance criteria.
As at 31 December 2004, there were options outstanding over 30,707,971 ordinary shares which may be exercised at various dates up to 2014 under the rules of the scheme.
2001 Performance Share Plan At 1 January 2004 there were awards outstanding over 2,633,754 ordinary shares.
The following awards were granted under the Plan: Date award granted Number of shares under award Exercise period
4 March 2004 829,014 2007–2014 9 June 2004 171,011 2007–2014
The awards granted under the 2001 performance share plan are nil cost options. The exercise of awards granted during the year will be linked to performance criteria. During the year awards over 294,420 ordinary shares were exercised and awards over 272,402 ordinary shares lapsed.
At 31 December 2004 there were awards outstanding over 3,066,957 ordinary shares.
Savings Related Share Option Schemes UK Schemes At 1 January 2004, there were options outstanding over 1,532,663 ordinary shares under this scheme. During the year, options were exercised over 271,013 ordinary shares at prices from 334 pence to 723 pence and 146,220 options lapsed. The following options were granted under the scheme: Number of Date option granted Option price per share shares under option Exercise period
14 September 2004 743p 265,550 2007–2010
At 31 December 2004, there were options outstanding over 1,380,980 ordinary shares, which may be exercised at various dates up to 2010 under the rules of the scheme.
International Schemes At 1 January 2004, there were 8,021,530 options outstanding under the scheme. During the year, 935,139 options lapsed. Options were exercised over 980,720 ordinary shares at prices from 334 pence to 723 pence and the following options were granted under the scheme: Number of Date option granted Option price per share shares under option Exercise period
14 September 2004 743p 2,167,399 2007–2010
At 31 December 2004, there were options outstanding over 8,273,070 ordinary shares which may be exercised on various dates upto 2010 under the rules of the scheme.
104 Standard Chartered Annual Report and Accounts 2004

39. Shareholders’ Funds 2004 2003* Share Capital Premises Profit Total Total
Share premium Capital redemption revaluation and loss shareholders’ shareholders’ capital account reserve reserve reserve account funds funds
$million $million $million $million $million $million $million $million
At 1 January as previously published 939 2,813 5 11 (2) 4,009 7,775 7,327 Prior year adjustment (note 54) – – – – – (186) (186) (149)
At 1 January restated 939 2,813 5 11 (2) 3,823 7,589 7,178 Exchange translation differences 26 – – – – 67 93 69 Shares issued, net of expenses 2 15 – – – 52 69 49 Repurchase of preference shares – – – – – – – (20) Actuarial loss on retirement benefits – – – – – (4) (4) (45) Realised on disposal of property – – – – (3) 3 – – Retained profit for the year – – – – – 696 696 358 Capitalised on exercise of share options – 7 – – – (7) – –
At 31 December before deduction of own shares 967 2,835 5 11 (5) 4,630 8,443 7,589 Own shares held in ESOP Trusts – – – – – (8) (8) (60)
At 31 December after deduction of own shares 967 2,835 5 11 (5) 4,622 8,435 7,529
Equity interests 7,759 6,880 Non-equity interests 676 649
At 31 December 8,435 7,529
*Comparative restated (see note 54 on page 118).
The cumulative amount of premiums on the acquisition of subsidiary and associated undertakings written off against Group reserves since 1973 is $27 million (2003: $27 million). This excludes amounts in respect of businesses sold.
A substantial part of the Group’s reserves are held in overseas subsidiary undertakings and branches principally to support local operations or to comply with local regulations. The maintenance of local regulatory capital ratios could potentially restrict the amount of reserves which can be remitted. In addition, if these overseas reserves were to be remitted, further unprovided taxation liabilities might arise.
Bedell Cristin Trustees Limited is the trustee of both the 1995 Employees’ Share Ownership Plan Trust (‘the 1995 trust’), which is an employee benefit trust used in conjunction with some of the Group’s employee share schemes, and the Standard Chartered 2004 Employee Benefit Trust (‘the 2004 trust’) which is an employee benefit trust used in conjunction with the Group’s deferred bonus plan. The trustee has agreed to satisfy a number of awards made under the employee share schemes and the deferred bonus plan through the relevant employee benefit trusts. As part of these arrangements Group companies fund, from time to time, the trusts to enable the trustee to acquire shares to satisfy these awards.
The 1995 trust has acquired, at market value, 12,127,841 (2003: 9,513,386) Standard Chartered PLC shares which are
held in a pool for the benefit of participants under the Group’s Restricted Share Scheme, Performance Share Plan and Executive Share Option Schemes. The purchase of these shares has been fully funded by the Group.
At 31 December 2004, the 1995 trust held 12,127,841 (2003: 9,513,386) shares, of which 11,854,754 (2003: 4,733,884) have vested unconditionally. The balance of 273,087 (2003: 4,779,502) shares have been included in the Group balance sheet, as a deduction in shareholders’ funds at a cost of $5 million (2003: $60 million). The market value of the unvested shares at 31 December 2004 was $5 million (2003: $79 million). 273,087 (4,585,901) shares have been conditionally gifted to employees.
The 2004 trust has acquired, at market value, 178,926 (2003: nil) Standard Chartered PLC shares which are held in a pool for the benefit of participants under the Group’s deferred bonus plan. The purchase of these shares has been fully funded by the Group.
At 31 December 2004, the 2004 trust held 178,926 (2003: nil) shares, all of which were unvested. These shares have been included in the Group balance sheet, as a deduction in shareholders’ funds, at cost of $3 million (2003: nil). The market value of the unvested shares at 31 December was $3 million. The shares are used to satisfy awards under the Group’s deferred bonus plan.
Annual Report and Accounts 2004 Standard Chartered 105

Notes to the Accounts
40. Company Share Capital and Reserves 2004 2003* Share Capital Profit Total Total
Share premium Capital redemption Revaluation and loss shareholders’ shareholders’ capital account reserve reserve reserve account funds funds
$million $million $million $million $million $million $million $million
At 1 January 939 2,813 5 11 3,662 285 7,715 7,270 Prior year adjustment (note 54) – – – – (186) – (186) (149)
939 2,813 5 11 3,476 285 7,529 7,121 Exchange translation differences 26 – – – – (2) 24 33 Shares issued, net of expenses 2 15 – – – 52 69 49 Repurchase of preference shares – – – – – – – (20) Increase in net assets
of subsidiary undertakings – – – – 932 – 932 505 Profit for the year – – – – – 663 663 507 Dividends paid and proposed – – – – – (782) (782) (666) Capitalised on exercise of share options – 7 – – – (7) – –
At 31 December 967 2,835 5 11 4,408 209 8,435 7,529
Equity interests 7,759 6,880 Non-equity interests 676 649
At 31 December 8,435 7,529
*Comparative restated (see note 54 on page 118).
41. Consolidated Cash Flow Statement (a) Reconciliation between operating profit before taxation and net cash inflow from operating activities 2004 2003*
$million $million
Operating profit 2,158 1,550 Items not involving cash flow:
Amortisation of goodwill 181 134 Depreciation and amortisation of premises and equipment 239 247 Gain on disposal of tangible fixed assets (4) (14) Gain on disposal of investment securities (164) (62) Amortisation of investments (41) (107) Charge for bad and doubtful debts and contingent liabilities 214 536 Amounts written off fixed asset investments 1 11 Debts written off, net of recoveries (504) (807) Increase in accruals and deferred income 59 201 (Increase)/decrease in prepayments and accrued income (165) 80
Adjustments for items shown separately: Net increase in mark-to-market adjustment** (259) (403)
Interest paid on subordinated loan capital 338 298
Net cash inflow from trading activities 2,053 1,664 Net increase in cheques in the course of collection (45) (27) Net increase in treasury bills and other eligible bills (78) (76) Net (increase)/decrease in loans and advances to banks and customers (16,216) 2,398 Net increase in deposits from banks, customer accounts and debt securities in issue 14,927 2,128 Net increase in dealing securities (1,174) (1,550) Net increase/(decrease) in other accounts*** 3,036 (789)
Net cash inflow from operating activities 2,503 3,748
*Comparative restated (see note 54 on page 118).
**Mark-to-market adjustments are being reclassified from the reconciliation to ‘Net cash inflow from operating activities’, to the reconciliation to ‘Net cash inflow from trading activities’ as this better reflects their impact on cash flows.
***This includes the effects of foreign exchange translation in the local books of subsidiaries and branches.
106 Standard Chartered Annual Report and Accounts 2004

41. Consolidated Cash Flow Statement continued (b) Analysis of changes in cash
Balance at 1 January Exchange translation differences Net cash (outflow)/inflow
Balance at 31 December
2004 $million
5,661 56
(1,366)
4,351
2003* $million
3,496 (7)
2,172
5,661
(c) Analysis of cash
Cash and balances at central banks Demand loans and advances to banks
2004 $million
2,079 2,272
4,351
2003 $million
1,835 3,826
5,661
(d) Analysis of changes in financing during the year
Share Share capital premium
$million $million
At 1 January 939 2,813 Exchange translation differences 26 – Share capital issued, net of expenses 2 15 Repurchase of preferences shares – – Capitalised on exercise of share options – 7 Issue of subordinated loan capital,
net of expenses – – Repayment of subordinated liabilities – –
Balance at 31 December 967 2,835
Capital Capital redemption reserve reserve $million $million
5 11 – – – – – – – –
– – – –
5 11
2004
Loan capital
$million
5,967 291
– – –
499 (25)
6,732
Capital Share Share Capital redemption
capital premium reserve reserve $million $million $million $million
909 2,764 5 3 35 – – –
3 46 – – (8) – – 8 – 3 – –
– – – – – – – –
939 2,813 5 11
2003*
Loan capital
$million
5,455 512
– – –
– –
5,967
*Comparative restated (see note 54 on page 118).
Annual Report and Accounts 2004 Standard Chartered 107

Notes to the Accounts
42. Segmental Information By Geographic Segment The following tables set out profit and loss information, average loans and advances to customers, net interest margin and selected balance sheet information by geographic segment for the years ended 31 December 2004 and 2003:
2004 Asia Pacific MESA
Hong Kong
$million Singapore
$million Malaysia $million
Other Asia Pacific
$million India
$million UAE
$million
Other Middle East & Other
South Asia $million
Africa $million
Americas, UK & Group Head Office
$million Total
$million
Interest receivable 1,389 720 343 798 541 204 324 536 1,463 6,318 Interest payable (461) (408) (159) (320) (254) (53) (109) (185) (1,201) (3,150)
Net interest income 928 312 184 478 287 151 215 351 262 3,168 Other finance income 4 1 – – – – – 4 1 10 Fees and commissions receivable, net 324 114 51 197 111 87 116 153 181 1,334 Dealing profits and exchange 99 81 30 121 67 33 42 74 101 648 Other operating income 53 5 5 19 1 – 4 2 118 207
Net revenue 1,408 513 270 815 466 271 377 584 663 5,367
Costs (654) (226) (144) (510) (251) (99) (169) (357) (405) (2,815) Amortisation of goodwill (181) (181)
Total operating expenses (654) (226) (144) (510) (251) (99) (169) (357) (586) (2,996)
Operating profit before provisions 754 287 126 305 215 172 208 227 77 2,371 (Charge) for/release of debts (125) (33) (2) (40) (22) (1) (1) (12) 22 (214) Amounts written off fixed asset investments – – – – 2 – – – (3) (1) Income from joint venture – – – 2 – – – – – 2
Operating profit before taxation 629 254 124 267 195 171 207 215 96 2,158
Loans and advances to customers – average 21,608 10,414 5,272 7,932 3,779 2,582 3,718 1,834 7,421 64,560
Net interest margin (%) 2.2 1.6 2.4 2.5 3.6 2.6 3.5 7.6 0.6 2.7
Loans and advances to customers – period end 21,744 11,765 6,374 9,274 4,610 3,132 3,840 2,013 8,844 71,596
Loans and advances to banks – period end 2,852 2,399 480 3,554 325 535 932 510 7,335 18,922
Total assets employed 48,459 20,419 7,130 21,424 8,528 6,371 6,493 6,407 52,821 178,052
Total risk weighted assets and contingents 20,337 13,892 4,411 13,344 6,413 4,150 4,611 2,749 24,895 94,802
Total interest receivable and total interest payable include intra-group interest of $1,086 million. Total assets employed include intra-group items of $28,801 million and balances of $7,563 million which are netted in the Consolidated Balance Sheet. Total risk weighted assets and contingents include $2,678 million of balances which are netted in the note on Capital ratios on page 42 in accordance with regulatory guidelines.
In 2004 other operating income includes profits and losses arising from corporate decisions to dispose of investments in KorAm Bank ($95 million in Americas, UK & Group Head Office) and BOC Hong Kong (Holdings) Limited ($36 million in Hong Kong) and the premium on repurchase of surplus subordinated debt ($23 million in India). Costs include $18 million related to the
incorporation of the Hong Kong business (Hong Kong) and the $5 million donation to the Tsunami relief effort (Malaysia, India, Other APR and Other MESA). These decisions resulted in non-recurring gains and charges of $85 million. They are included in the Geographical segmental information, but are not allocated to business in the business segmental information shown on page 110.
Group central expenses have been distributed between segments in proportion to their direct costs, and the benefit of the Group’s capital has been distributed between segments in proportion to their risk weighted assets. Assets held at the centre have been distributed between geographic segments in proportion to their total assets employed.
108 Standard Chartered Annual Report and Accounts 2004

42. Segmental Information continued By Geographic Segment Business acquisitions have been made as part of the Group’s growth strategy. These activities are a result of corporate decisions made at the centre and the amortisation of purchased goodwill is included in the Americas, UK and Group Head Office segment. The geographic segment is based on the location of the office.
Asia Pacific MESA 2003*
Hong Kong
$million Singapore
$million Malaysia $million
Other Asia Pacific
$million India
$million
Other Middle East & Other
UAE South Asia $million $million
Africa $million
Americas, UK & Group Head Office
$million Total
$million
Interest receivable 1,473 621 318 700 513 215 291 409 1,182 5,722 Interest payable (531) (287) (145) (300) (258) (71) (94) (161) (907) (2,754)
Net interest income 942 334 173 400 255 144 197 248 275 2,968 Other finance income (3) (2) (1) (1) (2) – – – (4) (13) Fees and commissions receivable, net 313 118 47 160 88 66 82 118 164 1,156 Dealing profits and exchange 96 43 12 109 60 24 33 65 83 525 Other operating income 7 (7) 4 13 65 – 3 12 7 104
Net revenue 1,355 486 235 681 466 234 315 443 525 4,740
Costs (618) (210) (136) (429) (212) (91) (145) (282) (386) (2,509) Amortisation of goodwill (134) (134)
Total operating expenses (618) (210) (136) (429) (212) (91) (145) (282) (520) (2,643)
Operating profit before provisions 737 276 99 252 254 143 170 161 5 2,097 (Charge) for/release of debts (305) (33) 2 (99) (60) (2) 4 (9) (34) (536) Amounts written off
fixed asset investments – – – – (4) – – – (7) (11)
Operating profit/(loss) before taxation 432 243 101 153 190 141 174 152 (36) 1,550
Loans and advances to customers – average 21,428 8,624 4,329 6,675 2,811 1,929 3,328 1,416 7,249 57,789
Net interest margin (%) 2.4 1.8 2.5 2.4 4.0 3.4 3.8 6.7 0.8 2.8
Loans and advances to customers – period end 20,845 9,781 5,009 7,124 3,106 2,110 3,484 1,739 6,546 59,744
Loans and advances to banks – period end 2,113 1,045 204 2,784 239 605 889 308 5,167 13,354
Total assets employed 39,390 15,747 6,676 16,756 7,590 4,962 5,465 4,557 38,292 139,435
Total risk weighted assets and contingents 19,438 12,423 4,018 8,569 4,560 3,234 4,138 2,115 22,019 80,514
*Comparative restated (see note 54 on page 118).
Total interest receivable and total interest payable include intra-group interest of $932 million. Total assets employed include intra-group items of $11,726 million and balances of $7,507 million which are netted in the Consolidated Balance Sheet. Total risk weighted assets and contingents include $2,352 million of balances which are netted in the note on Capital ratios on page 42 in accordance with regulatory guidelines.
Group central expenses and other overhead costs have been distributed between segments in proportion to their direct costs, and the benefit of the Group’s capital has been distributed
between segments in proportion to their risk weighted assets. Assets held at the centre have been distributed between geographic segments in proportion to their total assets employed.
Business acquisitions have been made as part of the Group’s growth strategy. These activities are a result of corporate decisions made at the centre and the amortisation of purchased goodwill is included in the Americas, UK and Group Head Office segment.
The geographic segment is based on the location of the office.
Annual Report and Accounts 2004 Standard Chartered 109

Notes to the Accounts
42. Segmental Information continued By Class of Business 2004 2003*
Corporate Corporate Consumer Wholesale items not Consumer Wholesale items not
Banking Banking allocated Total Banking Banking allocated Total $million $million $million $million $million $million $million $million
Net interest income 1,952 1,216 – 3,168 1,830 1,138 – 2,968 Other finance income 3 7 – 10 (4) (9) – (13) Other income 738 1,343 108 2,189 662 1,123 – 1,785
Net revenue 2,693 2,566 108 5,367 2,488 2,252 – 4,740
Costs (1,388) (1,404) (23) (2,815) (1,259) (1,250) – (2,509) Amortisation of goodwill – – (181) (181) – – (134) (134)
Total operating expenses (1,388) (1,404) (204) (2,996) (1,259) (1,250) (134) (2,643)
Operating profit before provisions 1,305 1,162 (96) 2,371 1,229 1,002 (134) 2,097 Charge for debts (242) 28 – (214) (478) (58) – (536) Amount written off fixed asset investments – (1) – (1) – (11) – (11) Income from joint venture 1 1 – 2
Operating profit/(loss) before taxation 1,064 1,190 (96) 2,158 751 933 (134) 1,550
Total assets employed 37,047 104,641 – 141,688 33,890 86,312 – 120,202
Total risk weighted assets and contingents 28,069 64,055 – 92,124 24,253 53,909 – 78,162
* Prior period has been restated to net down intra group items. Please also refer to note 54 on page 118.
For the segmental information given above, Group central expenses and other overhead costs have been distributed between classes of business in proportion to their direct costs and the benefit of the Group’s capital has been distributed between classes of business in proportion to their risk weighted assets. Assets held at the centre have been distributed between classes of businesses in proportion to their total assets employed.
43. Secured Liabilities 2004 2003
$million $million
Notes in circulation (note 27 and note 32) 2,532 2,249
The notes in circulation were secured by the deposit of funds of $2,532 million (2003: $2,249 million) in respect of which Hong Kong SAR Government certificates of indebtedness are held (note 27 and note 32).
44. Capital Commitments Capital expenditure approved by the directors but not provided for in these accounts amounted to:
2004 2003 $million $million
Contracted 6 4 Not contracted 2 5
110 Standard Chartered Annual Report and Accounts 2004

45. Assets and Liabilities in Currencies other than US Dollar 2004 2003*
$million $million
Total assets denominated in: US dollar 33,872 33,668 Other currencies 107,816 86,534
141,688 120,202
Total liabilities denominated in: US dollar 44,070 41,331 Other currencies 97,618 78,871
141,688 120,202
*Comparative restated (see note 54 on page 118).
46. Contingent Liabilities and Commitments The table below shows the contract or underlying principal amounts, credit equivalent amounts and risk weighted amounts of unmatured off-balance sheet transactions at the balance sheet date. The contract or underlying principal amounts indicate the volume of business outstanding and do not represent amounts at risk. The credit equivalent and risk weighted amounts have been calculated in accordance with the Financial Services Authority’s guidelines implementing the Basel Accord on capital adequacy, after taking account of collateral and guarantees received.
2004 2003 Contract or Contract or underlying Credit Risk underlying Credit Risk
principal equivalent weighted principal equivalent weighted amount amount amount amount amount amount $million $million $million $million $million $million
Contingent liabilities Acceptances and endorsements Guarantees and irrevocable letters of credit Other contingent liabilities
976 976 842 716 716 535 15,942 9,976 8,146 12,350 8,480 5,773
3,139 2,414 1,221 4,802 3,364 2,132
20,057 13,366 10,209 17,868 12,560 8,440
Commitments Documentary credits and short
term trade-related transactions Forward asset purchases and
forward deposits placed Undrawn formal standby facilities, credit lines
and other commitments to lend: One year and over Less than one year
Unconditionally cancellable
2,924 585 494 2,157 431 394
54 54 11 26 26 5
9,140 4,570 4,133 7,182 3,591 3,259 8,903 – – 5,203 – –
25,933 – – 26,589 – –
46,954 5,209 4,638 41,157 4,048 3,658
Under the Basel Accord, credit equivalent amounts, obtained by applying credit conversion factors to the contract amount, are risk weighted according to the nature of the counterparty. Undrawn loan commitments which are unconditionally cancellable at any time or which have a maturity of less than one year have a risk weighting of zero.
Annual Report and Accounts 2004 Standard Chartered 111

Notes to the Accounts
47. Fair Values These tables analyse the notional principal amounts and the positive and negative fair values of the Group’s derivative financial instruments. Positive and negative fair values are the mark-to-market values of the derivative contracts adjusted for any amounts recognised in the Consolidated Profit and Loss Account for non-trading items. Notional principal amounts are the amount of principal underlying the contract at the reporting date.
Fair values at the period end are representative of the Group’s typical position during the period.
Trading activities are defined as positions held in financial instruments with the intention of benefiting from short term rates or price movements.
The risk section of the Financial Review on pages 31 to 41 explains the Group’s risk management of derivative contracts.
2004 2003 Notional Notional principal Positive Negative principal Positive Negative amounts fair value fair value amounts fair value fair value $million $million $million $million $million $million
Trading book Forward foreign exchange contracts 409,003 6,789 6,500 405,983 8,936 8,535
Foreign exchange derivative contracts Currency swaps and options 116,734 2,592 2,532 124,138 1,875 1,931 Exchange traded futures and options 238 – – 327 – –
Total 116,972 2,592 2,532 124,465 1,875 1,931
Interest rate derivative contracts Swaps 409,418 3,359 3,125 253,359 2,834 2,941 Forward rate agreements and options 57,475 101 127 61,506 89 81 Exchange traded futures and options 96,282 54 54 108,995 24 27
Total 563,175 3,514 3,306 423,860 2,947 3,049
Total trading book derivative financial instruments 1,089,150 12,895 12,338 954,308 13,758 13,515 Effect of netting (7,563) (7,563) (7,507) (7,507)
5,332 4,775 6,251 6,008
Non-trading activities are defined as positions held with respect to management of the Group’s assets and liabilities and related hedges.
2004 2003 Notional Notional principal Positive Negative principal Positive Negative amounts fair value fair value amounts fair value fair value $million $million $million $million $million $million
Non-trading book
Interest rate derivative contracts Swaps 2,304 17 4 28 – 2 Forward rate agreements and options 495 – – 92 – – Exchange traded futures and options – – – 2,634 2 1
Total 2,799 17 4 2,754 2 3
Commodity derivative contracts* 6,030 33 33 866 1 1
Total non-trading book derivative financial instruments 8,829 50 37 3,620 3 4 *The increase in commodity derivative contracts relates to oil options entered into on a back-in-back basis to meet customer requirements.
112 Standard Chartered Annual Report and Accounts 2004

47. Fair Values continued 2004 2003 Book Market Book Market value value value value
$million $million $million $million
Listed and publicly traded securities: Financial assets 16,627 16,689 17,542 17,548
Preference shares 676 856 649 768 Other financial liabilities 12,013 11,833 10,760 10,965
Financial liabilities 12,689 12,689 11,409 11,733
Financial assets include treasury bills, debt securities and equity shares. Other financial liabilities include debt securities in issue and subordinated loan capital.
48. Credit Exposures in respect of Derivative Contracts The residual maturity analysis of the notional principal amounts of derivative contracts, excluding exchange traded futures and options, held at 31 December 2004 and 2003 for trading and non-trading purposes is set out below:
2004 2003 Under One to Over Under One to Over
one year five years five years Total one year five years five years Total $million $million $million $million $million $million $million $million
Forward foreign exchange and foreign exchange derivative contracts
Notional principal amount Net replacement cost Interest rate derivative contracts
479,468 7,640
41,409 1,504
4,860 237
525,737 9,381
488,667 9,581
37,075 1,091
4,379 139
530,121 10,811
Notional principal amount Net replacement cost Commodity derivative contracts Notional principal amount Net replacement cost
243,369 519
1,094 3
189,548 1,782
4,348 23
36,775 1,176
588 7
469,692 3,477
6,030 33
166,138 474
445 –
119,008 1,520
421 1
29,839 929
– –
314,985 2,923
866 1
Counterparty risk Financial institutions Non financial institutions
11,532 1,359
12,901 834
Total replacement cost 12,891 13,735
The risk section of the Financial Review on pages 31 to 41 explains the Group’s risk management of derivative contracts.
Annual Report and Accounts 2004 Standard Chartered 113
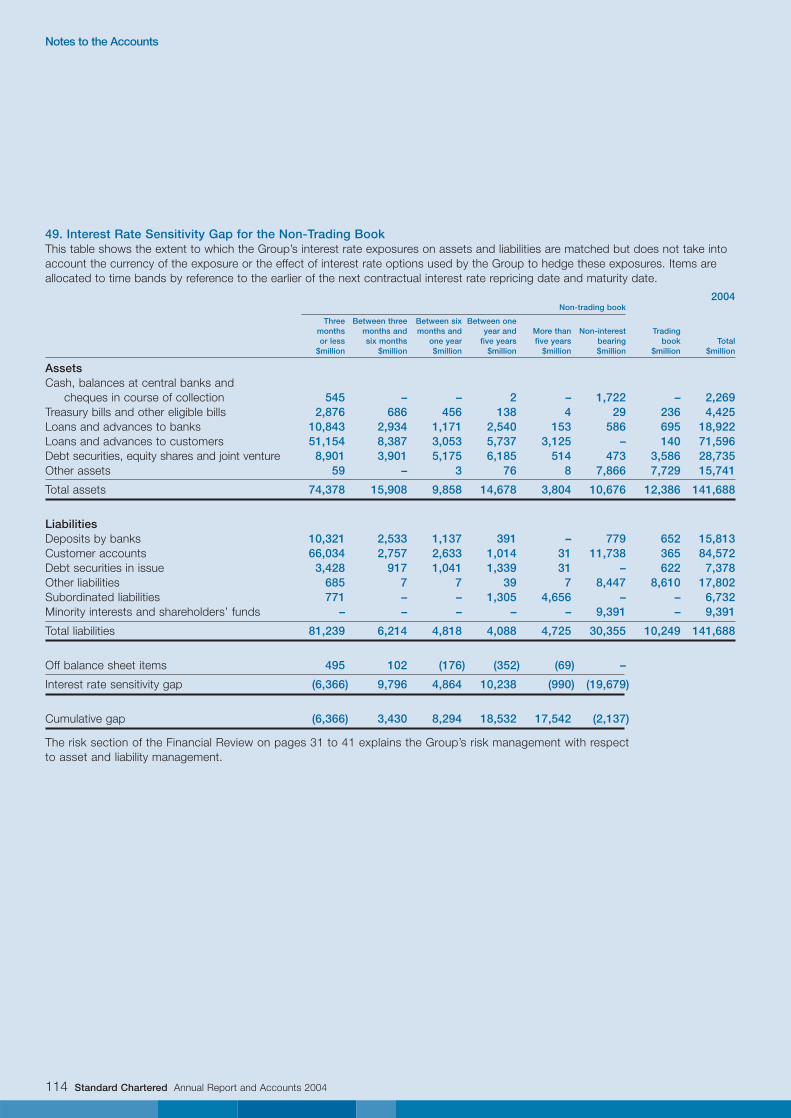
Notes to the Accounts
49. Interest Rate Sensitivity Gap for the Non-Trading Book This table shows the extent to which the Group’s interest rate exposures on assets and liabilities are matched but does not take into account the currency of the exposure or the effect of interest rate options used by the Group to hedge these exposures. Items are allocated to time bands by reference to the earlier of the next contractual interest rate repricing date and maturity date.
2004 Non-trading book
Three Between three Between six Between one months months and months and year and More than Non-interest Trading or less six months one year five years five years bearing book Total
$million $million $million $million $million $million $million $million
Assets Cash, balances at central banks and
cheques in course of collection 545 – – 2 – 1,722 – 2,269 Treasury bills and other eligible bills 2,876 686 456 138 4 29 236 4,425 Loans and advances to banks 10,843 2,934 1,171 2,540 153 586 695 18,922 Loans and advances to customers 51,154 8,387 3,053 5,737 3,125 – 140 71,596 Debt securities, equity shares and joint venture 8,901 3,901 5,175 6,185 514 473 3,586 28,735 Other assets 59 – 3 76 8 7,866 7,729 15,741
Total assets 74,378 15,908 9,858 14,678 3,804 10,676 12,386 141,688
Liabilities Deposits by banks 10,321 2,533 1,137 391 – 779 652 15,813 Customer accounts 66,034 2,757 2,633 1,014 31 11,738 365 84,572 Debt securities in issue 3,428 917 1,041 1,339 31 – 622 7,378 Other liabilities 685 7 7 39 7 8,447 8,610 17,802 Subordinated liabilities 771 – – 1,305 4,656 – – 6,732 Minority interests and shareholders’ funds – – – – – 9,391 – 9,391
Total liabilities 81,239 6,214 4,818 4,088 4,725 30,355 10,249 141,688
Off balance sheet items 495 102 (176) (352) (69) –
Interest rate sensitivity gap (6,366) 9,796 4,864 10,238 (990) (19,679)
Cumulative gap (6,366) 3,430 8,294 18,532 17,542 (2,137)
The risk section of the Financial Review on pages 31 to 41 explains the Group’s risk management with respect to asset and liability management.
114 Standard Chartered Annual Report and Accounts 2004

49. Interest Rate Sensitivity Gap for the Non-Trading Book continued 2003*
Non-trading book
Three Between three Between six Between one months months and months and year and More than Non-interest Trading or less six months one year five years five years bearing book Total
$million $million $million $million $million $million $million $million
Assets Cash, balances at central banks and
cheques in course of collection 380 – – – – 1,602 – 1,982 Treasury bills and other eligible bills 3,350 1,311 589 283 – – 156 5,689 Loans and advances to banks 8,312 2,124 1,285 459 199 631 344 13,354 Loans and advances to customers 44,713 5,684 2,065 4,827 2,220 – 235 59,744 Debt securities and equity shares 7,233 3,026 3,522 6,188 795 396 2,340 23,500 Other assets 21 – 170 241 8 7,317 8,176 15,933
Total assets 64,009 12,145 7,631 11,998 3,222 9,946 11,251 120,202
Liabilities Deposits by banks 7,258 752 801 450 19 1,535 109 10,924 Customer accounts 58,229 3,072 2,640 758 2 9,045 21 73,767 Debt securities in issue 2,264 562 1,070 1,782 99 – 285 6,062 Other liabilities 184 11 167 247 6 7,201 7,523 15,339 Subordinated liabilities – – – 337 5,677 (47)† – 5,967 Minority interests and shareholders’ funds – – – – – 8,143 – 8,143
Total liabilities 67,935 4,397 4,678 3,574 5,803 25,877 7,938 120,202
Off balance sheet items 2,184 (464) (1,523) (197) – –
Interest rate sensitivity gap (1,742) 7,284 1,430 8,227 (2,581) (15,931)
Cumulative gap (1,742) 5,542 6,972 15,199 12,618 (3,313) † Unamortised discounts on the issue of subordinated loan capital.
*Comparative restated (see note 54 on page 118).
50. Non-Structural Currency Exposures The Group does not maintain material non-trading open currency positions other than the structural currency exposures arising from its investment in overseas operations and their related funding (see note 51).
The risk section of the Financial Review on page 41 explains risk management with respect to the Group’s hedging policies.
Annual Report and Accounts 2004 Standard Chartered 115

Notes to the Accounts
51. Structural Currency Exposures The Group’s structural currency exposures were as follows: 2004 2003
Borrowing Borrowing in the functional in the functional currency of the currency of the
units concerned units concerned hedging the net Structural hedging the net Structural
Net investments investment currency Net investments investment currency in overseas units in the units exposures in overseas units in the units exposures
$million $million $million $million $million $million
Functional currency of the business unit: Singapore Dollar 1,080 – 1,080 9 – 9 Indian Rupee 650 – 650 482 – 482 Hong Kong Dollar 2,920 – 2,920 (1) – (1) Malaysian Ringgit 509 – 509 428 – 428 Thai Baht 180 – 180 (1) – (1) UAE Dirham 271 – 271 241 – 241 Korean Won 117 – 117 88 – 88 Indonesian Rupiah 291 – 291 118 – 118 Sterling 952 (952) – 842 (832) 10 Other Non US Dollar 883 – 883 832 – 832
Total 7,853 (952) 6,901 3,038 (832) 2,206
Structural currency exposures for 2004 and 2003 relate to net balance sheet is affected by movements in the exchange rates investments in non US dollar units. between functional currencies and US dollars.
The Group’s main operations in non US dollar units were Asia, These currency exposures are referred to as structural. Translation Africa, India and the United Kingdom. The main operating (or gains and losses arising from these exposures are recognised ‘functional’) currencies of its overseas business units therefore in the Consolidated Statement of Total Recognised Gains include Hong Kong Dollar, Malaysian Ringgit, Singapore Dollar, and Losses. Indian Rupee and Sterling. The Group prepares its consolidated
The risk section of the Financial Review on page 41 explains thefinancial statements in US dollars, and the Group’s consolidated
risk management with respect to the Group’s hedging policies.
52. Market Risk 2004 2003*
Trading book 12 months to 31 December 31 December 12 months to 31 December 31 December
Average High Low Actual Average High Low Actual $million $million $million $million $million $million $million $million
Daily value at risk: Interest rate risk 3.3 4.4 2.2 3.4 2.7 4.0 1.8 2.9 Foreign exchange risk 2.4 4.5 1.2 3.0 1.6 3.8 0.9 1.3 Total 4.2 6.0 3.1 5.1 3.4 6.7 2.0 3.2
This note should be read in conjunction with the market risk section of the Financial Review on pages 31 to 41 which explains the Group’s market risk management.
116 Standard Chartered Annual Report and Accounts 2004
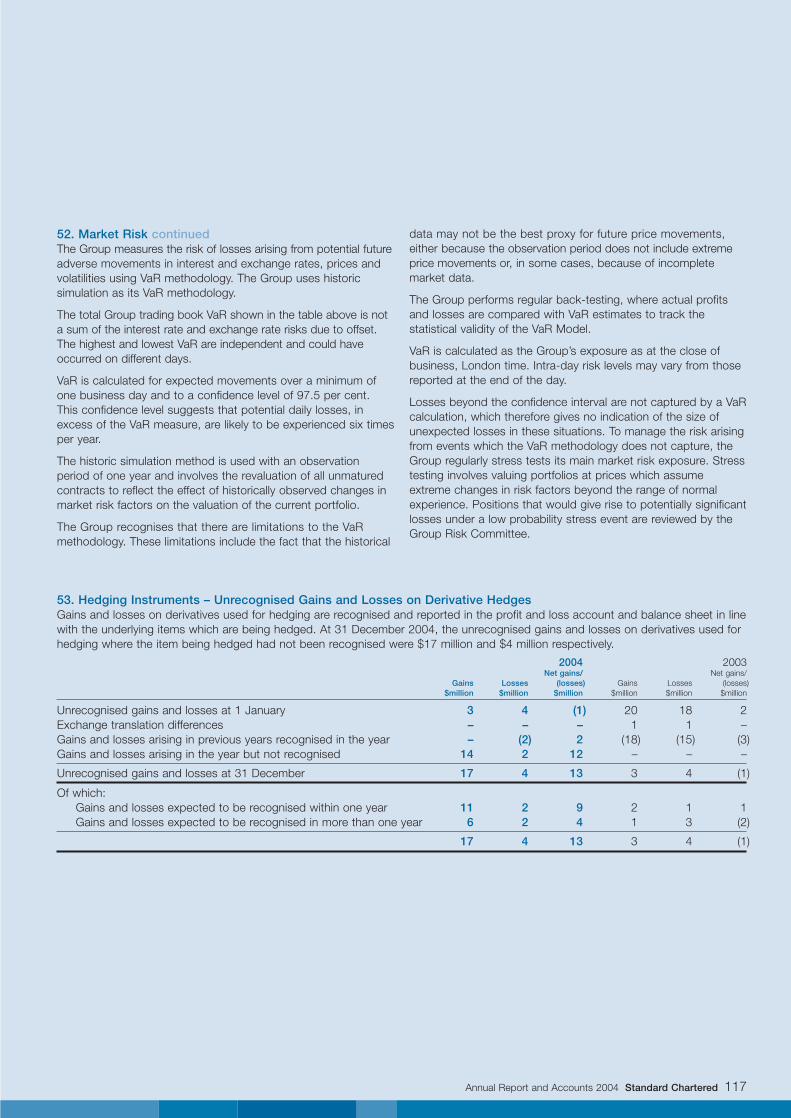
52. Market Risk continued The Group measures the risk of losses arising from potential future adverse movements in interest and exchange rates, prices and volatilities using VaR methodology. The Group uses historic simulation as its VaR methodology.
The total Group trading book VaR shown in the table above is not a sum of the interest rate and exchange rate risks due to offset. The highest and lowest VaR are independent and could have occurred on different days.
VaR is calculated for expected movements over a minimum of one business day and to a confidence level of 97.5 per cent. This confidence level suggests that potential daily losses, in excess of the VaR measure, are likely to be experienced six times per year.
The historic simulation method is used with an observation period of one year and involves the revaluation of all unmatured contracts to reflect the effect of historically observed changes in market risk factors on the valuation of the current portfolio.
The Group recognises that there are limitations to the VaR methodology. These limitations include the fact that the historical
data may not be the best proxy for future price movements, either because the observation period does not include extreme price movements or, in some cases, because of incomplete market data.
The Group performs regular back-testing, where actual profits and losses are compared with VaR estimates to track the statistical validity of the VaR Model.
VaR is calculated as the Group’s exposure as at the close of business, London time. Intra-day risk levels may vary from those reported at the end of the day.
Losses beyond the confidence interval are not captured by a VaR calculation, which therefore gives no indication of the size of unexpected losses in these situations. To manage the risk arising from events which the VaR methodology does not capture, the Group regularly stress tests its main market risk exposure. Stress testing involves valuing portfolios at prices which assume extreme changes in risk factors beyond the range of normal experience. Positions that would give rise to potentially significant losses under a low probability stress event are reviewed by the Group Risk Committee.
53. Hedging Instruments – Unrecognised Gains and Losses on Derivative Hedges Gains and losses on derivatives used for hedging are recognised and reported in the profit and loss account and balance sheet in line with the underlying items which are being hedged. At 31 December 2004, the unrecognised gains and losses on derivatives used for hedging where the item being hedged had not been recognised were $17 million and $4 million respectively.
2004 2003 Net gains/ Net gains/
Gains Losses (losses) Gains Losses (losses) $million $million $million $million $million $million
Unrecognised gains and losses at 1 January 3 4 (1) 20 18 Exchange translation differences – – – 1 1 – Gains and losses arising in previous years recognised in the year – (2) 2 (18) (15) (3) Gains and losses arising in the year but not recognised 14 2 12 – – –
Unrecognised gains and losses at 31 December 17 4 13 3 4 (1)
Of which: Gains and losses expected to be recognised within one year 11 2 9 2 1 1 Gains and losses expected to be recognised in more than one year 6 2 4 1 3 (2)
17 4 13 3 4 (1)
Annual Report and Accounts 2004 Standard Chartered 117
2

Notes to the Accounts
54. Restatement of Comparative Figures a) The Group has fully adopted the accounting requirements of
FRS17 – Retirement Benefits. FRS17 replaces Statement of Standard Accounting Practice (SSAP) 24 and Urgent Issue Task Force (UITF) Abstract 6 as the accounting standard dealing with post-retirement benefits. The standard is being introduced in the UK in stages, starting with disclosures in the notes to the accounts. The full requirements of the standard are not mandatory until reporting periods starting on or after 1 January 2005, however early adoption is encouraged. The Group has adopted the standard one year early as there is now more certainty that similar requirements will be incorporated within IFRS, under which the Group will report from 2005.
The new standard requires the Group to include the assets of its defined benefit schemes on its balance sheet together with the related liability net of deferred tax to make benefit payments. The profit and loss account includes a charge in respect of the cost of accruing benefits for current employees and any benefit improvements. The expected return on the schemes’ assets is included within other income less a charge in respect of the unwinding of the discount applied to the schemes’ liabilities.
Under SSAP24 the profit and loss account included a charge in respect of the cost of accruing benefits for the current employees offset by a credit in respect of the amortisation of the surplus in the Group’s defined benefit schemes. A net pension prepayment was included in the Group’s balance sheet.
A prior year adjustment has been made reducing shareholders’ funds at 31 December 2003 by $202 million to reflect the revised policy.
The effect of this change on the profit and loss account for the year ended 31 December 2004 has been to introduce other finance income of $10 million (2003: $13 million charge), and to decrease administrative expenses by $16 million (2003: $30 million decrease). Profit before tax has been increased by $26 million (2003: $17 million increase).
The effect on the Group’s balance sheet at 31 December 2004 has been to include a provision for defined benefit schemes of $110 million (2003: $124 million), to reduce prepayments and accrued income by $60 million (2003: $81 million) and reduce shareholders’ funds by $183 million (2003: $202 million).
b) The cost recognition policy for the Group has been revised for share schemes to reflect their usage as long term incentive plans, in accordance with the UITF17 (revised) Employee Share Schemes.
In previous years costs have been recognised on an up front basis. From 2004, the Group will spread the cost of share schemes over the performance/vesting period. The effect of this change on the profit and loss account for the year ended 31 December 2004 has been to decrease staff costs by $14 million before tax (2003: $9 million increase in staff costs). Shareholders’ funds have been increased by $10 million (2003: $16 million).
55. Related Party Transactions In accordance with FRS8, details of transactions with consolidated, subsidiary undertakings are not separately disclosed. The principal subsidiary undertakings of the Group are listed in note 22 of the accounts on pages 92 to 93.
Details of directors’ pay and benefits are disclosed in the directors’ remuneration report on pages 54 to 67. Details of other transactions with directors and related parties are disclosed in note 8 to the accounts, page 83.
During the year the group entered into a joint venture with PT Astra International Tbk to acquire a controlling interest in PT Bank Permata Tbk (‘Permata’). Banking services provided to the joint venture have been on normal, commercial terms. At year end, receivables with Permata totalling $34.7 million and deposits from Permata totalling $5.3 million were included within the Group’s consolidated balance sheet
56. Forward Looking Statements This document contains forward-looking statements, including such statements within the meaning of section 27A of the US Securities Act of 1933 and section 21E of the Securities Exchange Act of 1934. These statements concern or may affect future matters. These may include Standard Chartered’s future strategies, business plans and results and are based on the current expectations of the directors of Standard Chartered. They are subject to a number of risks and uncertainties that might cause actual results and outcomes to differ materially from expectations outlined in these forward-looking statements. These factors are not limited to regulatory developments but include stock markets, IT developments, competitive and general operating conditions.
118 Standard Chartered Annual Report and Accounts 2004

57. UK and Hong Kong Accounting Requirements The consolidated financial statements of the Group are prepared in accordance with UK GAAP which differs in certain significant respects from Hong Kong GAAP. There would be no material differences between the accounting conventions except as set out below:
Investments in Securities UK GAAP Securities, including equity shares and treasury bills, which are intended for use on a continuing basis are classified as investment securities. Investment securities are stated at cost less any provision for impairment. Where dated investment securities are purchased at a premium or a discount, these premiums or discounts are amortised through the profit and loss account. Securities other than investment securities are classified as dealing securities and are stated at market value.
Hong Kong GAAP Under Hong Kong Statement of Standard Accounting Practice 24 – Accounting for Investments in Securities (SSAP24), investment securities classified as held-to-maturity securities are stated at amortised cost less any provision for diminution in value. Other securities, not intended to be held until maturity, are accounted for under the ‘alternative’ treatment. Under the alternative treatment, securities are identified as either trading or non-trading. Trading securities are stated at fair value with changes in fair value recognised in the profit and loss account as they arise. Non-trading securities are stated at fair value with changes in fair value recognised in the revaluation reserve until disposal.
If the Group had prepared its financial statements under Hong Kong SSAP24 there would have been a net charge to the profit and loss account of $9 million, (2003: $5 million), an increase in the book amount of investment in securities of $46 million (2003: $30 million) and a credit to reserves of $32 million (2003: $21 million).
Tangible Fixed Assets UK GAAP Under Financial Reporting Standard 15 – Tangible Fixed Assets (FRS15), revaluation gains should be recognised in the profit and loss account only to the extent (after adjusting for subsequent depreciation) that they reverse revaluation losses on the same asset that were previously recognised in the profit and loss account. All other revaluation gains should be recognised in the statement of total recognised gains and losses.
All revaluation losses that are caused by a clear consumption of economic benefits should be recognised in the profit and loss account. Other revaluation losses should be recognised in the statement of total recognised gains and losses until the carrying amount reaches its depreciated historical cost; and thereafter, in the profit and loss account unless it can be demonstrated that the recoverable amount (the higher of net realisable value and value in use as defined in Financial Reporting Standard 11 – Impairment of fixed assets and goodwill) of the asset is greater than the revalued amount, in which case the loss should be recognised in the statement of recognised gains and losses to the extent that the recoverable amount of the asset is greater than its revalued amount.
Hong Kong GAAP Under Hong Kong SSAP17 – Property, Plant and Equipment, when an asset’s carrying amount is increased as a result of revaluation, the increase should be credited directly to equity under the heading of revaluation reserve. However, a revaluation increase should be recognised as income to the extent that it reverses a revaluation decrease of the same asset previously recognised as an expense.
When an asset’s carrying amount is decreased as a result of a revaluation, the decrease should be recognised as an expense. However, a revaluation decrease should be charged directly against any related revaluation reserve to the extent that the decrease does not exceed the amount held in the revaluation reserve in respect of that same asset. Any excess thereafter will be charged to the profit and loss account.
At 31 December 2004, the Group’s total properties comprised less than one per cent of the Group’s total assets. A formal revaluation of certain of the Group’s principal properties was performed at 31 August 2002, and at 30 September 2002 for all other properties, by independent valuers.
If the Group had prepared its financial statements under Hong Kong SSAP17 there would have been a net credit to the profit and loss account of $2 million (2003: $15 million charge) in respect of valuations below depreciated historical cost.
Dividends UK GAAP Dividends declared after the period end are recognised as a liability in the period to which they relate.
Hong Kong GAAP Under Hong Kong SSAP9 (revised) – Events after the balance sheet date, dividends are only recognised as a liability in the accounting period in which they are declared by the directors (in the case of interim dividends) or approved by the shareholders (in the case of final dividends).
Annual Report and Accounts 2004 Standard Chartered 119

Notes to the Accounts
57. UK and Hong Kong Accounting Requirements continued The retained profit for the year ended 31 December 2004 would rise by $95 million (2003: $44 million rise) had the Company adopted Hong Kong SSAP9 (revised), and there would have been an increase in reserves of $524 million (2003: $429 million).
Cash Flow Statement UK GAAP The Group prepares its cash flow statement in accordance with Financial Reporting Standard 1 – Cash flow statements (FRS1). FRS1 is based on cash, with no concept of cash equivalents. Cash is defined as cash in hand and deposits with qualifying financial institutions repayable on demand, less overdrafts from such institutions repayable on demand.
Hong Kong GAAP Under Hong Kong SSAP15 – Cash flow statements (Revised 2001) the statement is based on a wider concept of cash and cash equivalents. Cash includes cash on hand and demand deposits. Cash equivalents are short-term, highly liquid investments that are readily convertible to known amounts of cash and which are subject to an insignificant risk of changes in value.
Hong Kong SSAP15 also specifies that bank borrowings are generally considered to be financing activities. However, bank overdrafts repayable on demand, which form an integral part of an enterprise’s Cash Management, are included as a component of cash and cash equivalents.
In addition, Hong Kong SSAP15 is different from FRS1 in respect of the presentation/classification of the cash flow statement. Hong Kong SSAP15 classifies cash flows under three headings: (a) cash flows from operating activities; (b) cash flows from investing activities; and (c) cash flows from financing activities. FRS1 specifies a fuller analysis using eight headings: (a) cash flows from operating activities; (b) dividends from joint ventures and associates; (c) returns on investment and servicing of finance; (d) taxation; (e) capital expenditure and financial investment; (f) acquisitions and disposals; (g) equity dividends paid; and (h) financing.
Retirement Benefits UK GAAP Background Financial Reporting Standard 17 – Retirement Benefits (FRS17) has been adopted by the Group for the first time with effect from 1 January 2004.
FRS17 requires defined benefit pension scheme assets to be measured at fair value at each balance sheet date and liabilities to be measured on an actuarial basis using the projected unit method. Differences due to actuarial gains and losses are taken through the Statement of Total Recognised Gains and Losses. FRS17 requires that the asset or liability be shown separately on the balance sheet and net of attributable deferred tax.
Hong Kong GAAP Hong Kong Accounting Standard 19 Employee Benefits (HKAS19, formerly known as SSAP34) – was originally published by the Hong Kong Institute of Certified Public Accountants in December 2001 and was effective for periods beginning on or after 1 January 2002. Subsequent updates mean that HKAS19 is now essentially the same as IAS19 as issued by the International Accounting Standards Board.
Accordingly the only material difference between HKAS19 and FRS17 is in respect of the treatment of actuarial gains and losses. HKAS19 requires these to be recognised in the profit and loss account rather than in the Statement of Total Recognised Gains and Losses.
On 16 December 2004, the International Accounting Standards Board announced that it will allow the FRS17 treatment of actuarial gains and losses under IAS19. It is therefore assumed that the Hong Kong Institute of Certified Public Accountants will, in due course, adopt a similar approach in order to maintain the consistency of HKAS19 with IAS19.
In the light of this the pension disclosures have not been reworked to reflect what seems likely to be only a short term difference between FRS17 and HKAS19.
Deferred taxation UK GAAP Under Financial Reporting Standard 19 – Deferred tax, deferred taxation is provided in full, subject to the recoverability of deferred tax assets, on timing differences at the rates of taxation anticipated to apply when the differences crystallise, arising from the inclusion of income and expenditure in taxation computations in periods different from those in which they are included in the financial statements.
Hong Kong GAAP Under Statement of Standard Accounting Practice 12 (revised) – Accounting for deferred tax, all deferred tax liabilities, and all deferred tax assets to the extent that it is probable that future taxable profits will be available against which the asset can be utilised, on temporary differences between the carrying amounts of assets and liabilities for financial reporting purposes and the tax basis are recognised. The amount of deferred tax provided is based on the expected manner of realisation or settlement of the carrying amount of the assets and liabilities, using tax rates enacted or substantively enacted at the balance sheet date.
The deferred tax asset balance would be decreased by $28 million at 31 December 2004 (2003: $24 million) and the deferred tax liability balance would be increased by $nil at 31 December 2004 (2003: $nil). The profit and loss reserves balance would be decreased by $7 million (2003: $8 million) and the premises revaluation reserve would be decreased by $22 million at 31 December 2004 (2003: $16 million).
120 Standard Chartered Annual Report and Accounts 2004

Supplementary Financial Information
Average Balance Sheets and Yield The following tables set out the average balances and yields for Standard Chartered’s assets and liabilities for the years ended 31 December 2004 and 31 December 2003. For the purpose of the following table, average balances have generally been determined on the basis of daily balances, except for certain categories, for which balances have been determined less frequently. The Company does not believe that the information presented in this table would be significantly different had such balances been determined on a daily basis.
2004 Average
non interest Average interest
earning balance $million
earning balance $million
Interest income $million
Gross yield
%
Assets Cash, balances at central banks and cheques in course of collection 1,899 211 3 1.4 Treasury bills and other eligible bills – 5,296 254 4.8 Gross loans and advances to banks 1,167 18,882 488 2.6 Gross loans and advances to customers 484 66,529 3,550 5.3 Provisions against loans and advances to banks and customers (1,875) (579) – – Debt securities 266 26,961 937 3.5 Equity shares 173 Premises and equipment 812 Prepayments, accrued income and other assets 10,083
Total average assets 13,009 117,300 5,232 4.5
2003 Average Average
non interest interest earning earning Interest Gross balance balance income yield $million $million $million %
Assets Cash, balances at central banks and cheques in course of collection 1,374 233 3 1.3 Treasury bills and other eligible bills 884 5,346 222 4.2 Gross loans and advances to banks 1,178 16,946 373 2.2 Gross loans and advances to customers 183 60,281 3,341 5.5 Provisions against loans and advances to banks and customers (2,105) (650) – – Debt securities 238 24,783 851 3.4 Equity shares 296 Premises and equipment 850 Prepayments, accrued income and other assets 12,175
Total average assets 15,073 106,939 4,790 4.5
Annual Report and Accounts 2004 Standard Chartered 121

Supplementary Financial Information
Average Balance Sheets and Yield continued 2004 Average Average
non-interest interest bearing bearing Interest balance balance expense Rate paid $million $million $million %
Liabilities Non-interest bearing current and demand accounts Interest bearing current and demand accounts Savings deposits Time deposits Other deposits Debt securities in issue Accruals, deferred income and other liabilities Subordinated liabilities:
10,876 –
121 243 288
– 9,361
26,149 5,607
53,596 2,758 7,037
–
184 68
1,205 123 120
–
0.7 1.2 2.2 4.5 1.7
–
Undated loan capital Dated loan capital
Minority interests Shareholders’ funds
– 4,431
8 8,257
1,577 4,431
36 328
2.3 7.4
Total average liabilities and shareholders’ funds 33,585 101,155 2,064 2.0
Net yield 2.4
Net interest margin 2.7
Average non-interest
bearing balance $million
Average interest bearing balance $million
Interest expense $million
2003
Rate paid %
Liabilities Non-interest bearing current and demand accounts Interest bearing current and demand accounts Savings deposits Time deposits Other deposits Debt securities in issue Accruals, deferred income and other liabilities Subordinated liabilities:
7,938 –
104 254 142
69 13,612
23,622 4,453
50,386 1,847 6,537
–
195 68
1,018 114 133
–
0.8 1.5 2.0 6.2 2.0
–
Undated loan capital Dated loan capital
Minority interests Shareholders’ funds
– –
366 7,687
1,541 3,454
28 266
1.8 7.7
Total average liabilities and shareholders’ funds 30,172 91,840 1,822 2.0
Net yield 2.5
Net interest margin 2.8
122 Standard Chartered Annual Report and Accounts 2004

Volume and Price Variances The following table analyses the estimated change in Standard Chartered’s net interest income attributable to changes in the average volume of interest-earning assets and interest-bearing liabilities and changes in their respective interest rates for the periods presented. Volume and rate variances have been determined based on movements in average balances and average exchange rates over the period and changes in interest rates on average interest-earning assets and average interest-bearing liabilities. Variances caused by changes in both volume and rate have been allocated to changes in volume.
2004 versus 2003 Net
increase/ Increase/(decrease) in interest due to (decrease)
Volume Rate in interest $million $million $million
Interest earning assets Cash and unrestricted balances at central banks – – – Treasury bills and other eligible bills (2) 34 32 Loans and advances to banks 50 65 115 Loans and advances to customers 340 (131) 209 Debt securities and equity shares 76 10 86
Total interest earning assets 464 (22) 442
Interest bearing liabilities Dated subordinated loan capital 72 (10) 62 Undated subordinated loan capital 1 7 8 Interest bearing current and demand accounts 18 (29) (11) Savings deposits 14 (14) – Time deposits 72 115 187 Other deposits 41 (32) 9 Debt securities in issue 9 (22) (13)
Total interest bearing liabilities 227 15 242
2003 versus 2002 Net
increase/ Increase/(decrease) in interest due to (decrease)
Volume Rate in interest $million $million $million
Interest earning assets Cash and unrestricted balances at central banks 1 (1) – Treasury bills and other eligible bills 14 (48) (34) Loans and advances to banks (63) (296) (359) Loans and advances to customers 188 (383) (195) Debt securities and equity shares 220 (130) 90
Total interest earning assets 360 (858) (498)
Interest bearing liabilities Dated subordinated loan capital (30) 54 24 Undated subordinated loan capital (5) (28) (33) Interest bearing current and demand accounts 44 (43) 1 Savings deposits (5) (34) (39) Time deposits 2 (387) (385) Other deposits (90) 111 21 Debt securities in issue 49 (41) 8
Total interest bearing liabilities (35) (368) (403)
Annual Report and Accounts 2004 Standard Chartered 123

Supplementary Financial Information
Five Year Summary
Operating profit before provisions Provisions for bad and doubtful debts,
and contingent liabilities and commitments Amounts written off fixed asset investments Income from joint venture Operating profit including joint venture before taxation Profit before taxation Profit attributable to shareholders
2004 2003* 2002 2001 2000 $million $million $million $million $million
2,371 2,097 1,982 1,820 1,347
(214) (536) (712) (731) (470) (1) (11) (8) – – 2 – – – –
2,158 1,550 1,262 1,089 877 2,158 1,550 1,262 1,089 1,409 1,479 1,024 844 699 1,026
Loans and advances to banks Loans and advances to customers Total assets
18,922 13,354 16,001 19,578 23,759 71,596 59,744 57,009 53,005 51,882
141,688 120,202 112,953 107,535 102,435
Deposits by banks Customer accounts
15,813 10,924 10,850 11,688 11,103 84,572 73,767 71,626 67,855 65,037
Shareholders’ funds Total capital resources1
Information per ordinary share Basic earnings per share Normalised earning per share2
Dividends per share Net asset value per share
Ratios Post-tax return on ordinary shareholders’ funds-normalised basis2
Basic cost-income ratio Cost-income ratio – normalised basis2
Capital ratios: Tier 1 capital Total capital
8,435 7,529 7,270 7,538 6,508 16,123 14,110 12,974 12,959 11,117
121.2c 82.0c 57.6c 55.9c 92.2c 125.9c 90.1c 74.9c 66.3c 71.1c
57.5c 52.0c 47.0c 41.92c 38.105c 658.3c 588.0c 569.8c 555.3c 551.1c
20.1% 15.7% 13.4% 12.0% 13.4% 55.8% 55.8% 56.3% 58.9% 66.8% 53.5% 53.6% 53.6% 55.8% 57.3%
8.6% 8.6% 8.3% 9.0% 7.2% 15.0% 14.5% 14.2% 16.2% 14.3%
*Comparative restated (see note 54 on page 118).
1 Shareholders’ funds, minority interests and subordinated loan capital.
2 Results on a normalised basis reflect the Group’s results, excluding profits and losses of a capital nature, charges for restructuring and profits and losses on repurchase of share capital.
124 Standard Chartered Annual Report and Accounts 2004

Principal Group Addresses
Head Office Standard Chartered PLC 1 Aldermanbury Square, London EC2V 7SB Telephone: +44 (0)20 7280 7500
Afghanistan Standard Chartered Bank House No. 10, Street 10B Wazir Akbar Khan Kabul, Afghanistan Tel: +93 20 210 3900 Country Chief Executive Officer: Joseph Silvanus
Australia Standard Chartered Bank Level 1, 345 George Street, Sydney, New South Wales 2000 (Postal address: GPO Box 7042, Sydney, NSW2001), Australia Telephone: +61 (02) 9232 9333 Country Chief Executive Officer: Eugene Ellis
Bahrain Standard Chartered Bank Government Road, PO Box 29, Manama, Bahrain Telephone: +973 1722 3636 Country Chief Executive Officer Designate: Martin Fish
Bangladesh Standard Chartered Bank GPO Box 502 Hadi Mansion 2 Dilkusha C/A, Dhaka – 1000, Bangladesh Telephone: +880 (02) 955 0181 Country Chief Executive Officer: Osman Morad
Botswana Standard Chartered Bank Botswana Limited PO Box 496, 5th Floor, Standard House, The Mall, Gaborone, Botswana Telephone: +267 360 1500 Country Chief Executive Officer: Nigel Jones
Brunei Standard Chartered Bank 51–55 Jalan Sultan, Bandar Seri Begawan BS8811, (Postal address: PO Box 186, BS8670), Brunei Darussalam Telephone: +673 236 6000 Country Chief Executive Officer: Shalini Warrier
Cameroon Standard Chartered Bank Cameroon S.A. Boulevard de la Liberté, BP 1784, Douala, Cameroon Telephone: +237 343 5200 Country Chief Executive Officer: George Mortimer
China Standard Chartered Bank 35/F China Merchants Tower, 161 East LuJiaZui Road, Pudong District, Shanghai 200120, China Telephone: +86 (021) 5887 1230
Extn 7338 Country Chief Executive Officer Designate: Katherine Tsang
Hong Kong SAR Standard Chartered Bank (Hong Kong) Limited Standard Chartered Bank Building, 4–4A Des Voeux Road Central, (Postal address: GPO Box 21), Hong Kong Telephone: +852 2820 3333 Executive Director and Chief Executive Officer Standard Chartered Bank (Hong Kong) Limited: Peter Sullivan
Falkland Islands Standard Chartered Bank PO Box 597, Ross Road, Stanley, Falkland Islands Telephone: +500 22220/21352 Country Chief Executive Officer: Nick Hutton
The Gambia Standard Chartered Bank Gambia PLC Box 259, 8 Ecowas Avenue, Banjul, The Gambia Telephone: +220 227744 Country Chief Executive Officer: Onesimo Jacob Mukumba
Ghana Standard Chartered Bank Ghana Limited Head Office, High Street Building, Accra, PO Box 768, Accra, Ghana Telephone: +233 (021) 664 591–8 Country Chief Executive Officer and Area General Manager, Central and West Africa: Ebenezer Essoka
India Standard Chartered Bank 90 Mahatma Gandhi Road, PO Box 725, Mumbai 400 001, India Telephone: +91 (022) 2267 0162 Regional General Manager, South Asia: Jaspal Bindra
Indonesia Standard Chartered Bank Wisma Standard Chartered Bank, Jl. Jend. Sudirman Kav. 33–A, Jakarta 10220, (Postal address: PO Box 57 JKWK Jakarta 10350), Indonesia Telephone: +62 (021) 251 3333 Country Chief Executive Officer: Stewart Hall
Ivory Coast Standard Chartered Bank Côte d’lvoire SA 23 Boulevard de la République, 17 BP 1141, Abidjan 17, Côte d’lvoire Telephone: +225 20 30 32 00 Country Chief Executive Officer: Serge Philippe Bailly
Japan Standard Chartered Bank 21st Floor, Sanno Park Tower, 2–11–1, Nagatacho, Chiyoda Ku Tokyo, 100–6155 Japan Telephone: +81 3 5511 1200 Country Chief Executive Officer: Mark Devadason
Jersey Standard Chartered Grindlays (Jersey) Limited 13–15 Castle Street, St. Helier, Jersey JE4 8PT Telephone: +44 (01534) 704 000 Country Chief Executive Officer: Paul Walkden
Jordan Standard Chartered Bank Culture Ave. Shemesani PO Box 9997, Amman 11191, Jordan Telephone: +962 (06) 5607 201 Chief Executive Officer, The Levant: Christopher Knight
Kenya Standard Chartered Bank Kenya Limited Moi Avenue, Box 30003–00100 GPO, Nairobi, Kenya Telephone: +254 (020) 3209 3000 Country Chief Executive Officer and General Manager, East Africa: Michael C Hart
Lebanon Standard Chartered Bank s.a.l. Dbaye 509 Building, Dbaye Highway, PO Box 70216, Antelias, Lebanon Telephone: +961 (04) 542474 Country Chief Executive Officer: Aamir Hussain
Malaysia Standard Chartered Bank Malaysia Berhad Menera Standard Chartered No 30 Jalan Sultan Ismail, 50250 Kuala Lumpur, (Postal address: PO Box 11001, 50732 Kuala Lumpur), Malaysia Telephone: +60 (03) 2117 7777 Country Chief Executive Officer: Shayne K Nelson
Mauritius Standard Chartered Bank (Mauritius) Limited 8/F Happy World House 37 Sir William Newton Street Port Louis, Mauritius Telephone: +230 213 9000 Country Chief Executive Officer: Geoffrey Buchanan
Nepal Standard Chartered Bank Nepal Limited GPO Box 3990, Naya Baneshwar, Kathmandu, Nepal Telephone: +977 14783 753/ 4782 333 Country Chief Executive Officer: Sujit Mundal
Nigeria Standard Chartered Bank Nigeria Limited Plot 105b, Ajose Adeogun Street, Victoria Island, Lagos, Nigeria Telephone: +234 (01) 320 2000/ 262 6801–5/270 0025 Country Chief Executive Officer: Simon J Millett
Oman Standard Chartered Bank PO Box 2353, Postal Code 112, Ruwi, Sultanate of Oman, Oman Telephone: +968 703 999 Country Chief Executive Officer: Murtadha Mohamed Ali Kukoor
Pakistan Standard Chartered Bank PO Box 5556, I. I. Chundrigar Road, Karachi 74000, Pakistan Telephone: +92 (21) 241 2671 Country Chief Executive Officer: Badar Kazmi
Philippines Standard Chartered Bank 6788 Ayala Avenue, Makati City, Philippines 1226 Telephone: +63 (02) 886 7888 Country Chief Executive Officer: Simon Morris
Annual Report and Accounts 2004 Standard Chartered 125

Principal Group Addresses
Qatar Standard Chartered Bank 5 Abdullah Bin Jasim Street, PO Box 29, Doha, State of Qatar Telephone: +974 441 4248 Country Chief Executive Officer: Kris Babici
Republic of Korea (South Korea) Standard Chartered Bank 22nd Floor, Seoul Finance Center Building, 84, Taepyeongro 1–ga, Jung-gu, Seoul 100–101, Republic of Korea Telephone: +82 (02) 750 6114 Country Chief Executive Officer: Thomas J McCabe
Sierra Leone Standard Chartered Bank Sierra Leone Limited Head Office 9 & 11, Lightfoot Boston Street, PO Box 1155, Freetown, Sierra Leone Telephone: +232 (0) 22 226220/ 225021 Country Chief Executive Officer: Lamin K Manjang
Singapore Standard Chartered Bank 6 Battery Road, Singapore 049909 (Postal address: PO Box 1901, Singapore 903801) Telephone: +65 6 225 8888 Country Chief Executive Officer: Euleen Goh
South Africa Standard Chartered Bank 3rd Floor, 2 Merchant Place Fredman Drive, Sandown 2196 PO Box 782080 Sandton 2146 Gauteng, South Africa Telephone: +27 (0) 11 217 6600 Country Chief Executive Officer: John Kivits
Sri Lanka Standard Chartered Bank 37 York Street, PO Box 112, Colombo 1, Sri Lanka Telephone: +94 (11) 2480 000 Country Chief Executive Officer: Vishnu Mohan
Taiwan Standard Chartered Bank 168 Tun Hwa North Road, Taipei 10549, Taiwan Telephone: +886 (02) 2716 6261/ 2717 2866 Country Chief Executive Officer: Roland Teo
Tanzania Standard Chartered Bank Tanzania Limited 1st Floor, International House, Shaaban Robert Street and Garden Avenue, PO Box 9011, Dar es Salaam, Tanzania Telephone: +255 (22) 2122 160 Country Chief Executive Officer: Hemen Shah
Thailand Standard Chartered Bank – Thailand 100 Sathornakom Tower, North Sathorn Road, Silom, Bangrak, Bangkok 10500, Thailand Standard Chartered Nakornthon Bank Public Company Limited 90 North Sathorn Road, Silom, Bangrak, Bangkok 10500, Thailand Telephone: +66 (02) 724 4000 Country Chief Executive Officer: Annemarie Durbin
Uganda Standard Chartered Bank Uganda Limited 5 Speke Road, Kampala, (Postal address: PO Box 7111, Kampala), Uganda Telephone: +256 41 258 211/7 Country Chief Executive Officer: David D Cutting
United Arab Emirates Standard Chartered Bank PO Box 999, Al Mankhool Road, Dubai, United Arab Emirates Telephone:+971 4 352 0455 Country Chief Executive Officer: Ray Ferguson
United Kingdom Standard Chartered Bank 1 Aldermanbury Square, London EC2V 7SB Telephone: +44 (0)20 7280 7500 Country Chief Executive Officer: David Proctor
United States of America Standard Chartered Bank One Madison Avenue, New York, NY 10010, USA Telephone: +1 (212) 667 0700 Country Chief Executive Officer: James F McCabe
Vietnam Standard Chartered Bank Hanoi Towers, Unit 8–01, 49 Hai Ba Trung Street, Hanoi, Vietnam Telephone: +84 (04) 825 8970 Country Chief Executive Officer: Bill Gemmel
Zambia Standard Chartered Bank Zambia PLC Standard Chartered House, PO Box 32238, Cairo Road, Lusaka10101, Zambia Telephone: +260 (01) 229 242–50 Country Chief Executive Officer: Tom Aaker
Zimbabwe Standard Chartered Bank Zimbabwe Limited Old Mutual Centre, Cnr. 3rd Street/Jason Moyo Avenue, PO Box 373, Harare Zimbabwe Telephone: +263 (4) 752852/9, 753212/5, 253801/9 Country Chief Executive Officer: Washington Matsaira
Representatives offices Argentina Telephone: +54 114875 0500
Bahamas (Contact the New York office) Telephone: +1 212 667 0700
Brazil Telephone: +55 11 3371 0150
Cambodia Telephone: +855 23 216
685/212 729
Colombia Telephone: +571 326 4030
Iran Telephone: +98 21888 1090
Laos Telephone: +856 2141 4422
Mexico Telephone: +52 55 5387 1300
Peru Telephone: +51 1 411 7000
Turkey Telephone: +90 212 283 4031
Venezuela Telephone: +58 212 993 0522
Standard Chartered branches/offices: Afghanistan 1 Argentina 1 Australia 1 Bahamas 1 Bahrain 6 Bangladesh 18 Botswana 18 Brazil 1 Brunei 7 Cambodia 1 Cameroon 2 China 14 Hong Kong SAR 72 Colombia 1 Falkland Islands 1 The Gambia 5 Ghana 22 India 75 Indonesia 14 Iran 1 Ivory Coast 4 Japan 1 Jersey 1 Jordan 7 Kenya 29 Laos 1 Lebanon 5 Malaysia 30 Mauritius 1 Mexico 1 Nepal 7 Nigeria 5 Oman 1 Pakistan 29 Peru 1 Philippines 7 Qatar 2 Republic of Korea (South Korea) 2 Sierra Leone 3 Singapore 20 South Africa 2 Sri Lanka 9 Taiwan 3 Tanzania 6 Thailand 41 Turkey 1 Uganda 5 United Arab Emirates 9 United Kingdom 5 United States of America 2 Venezuela 1 Vietnam 2 Zambia 15 Zimbabwe 32
126 Standard Chartered Annual Report and Accounts 2004

Shareholder Information
Dividend and Interest Payment Dates Interim dividend
Ordinary shares Final dividend (provisional only)
Results and dividend announced 16 February 2005 8 August 2005 Ex dividend date 23 February 2005 17 August 2005 Record date for dividend 25 February 2005 19 August 2005 Last date to elect for share dividend or to change standing instructions 15 April 2005 21 September 2005 Dividend payment date 13 May 2005 14 October 2005
Preference shares 1st half yearly dividend 2nd half yearly dividend
73/8 per cent Non-Cumulative Irredeemable preference shares of £1 each 1 April 2005 1 October 2005 81/4 per cent Non-Cumulative Irredeemable preference shares of £1 each 1 April 2005 1 October 2005
8.9 per cent Non-Cumulative preference shares of $5 each: dividends paid on the 1st of each calendar quarter.
Annual General Meeting The Annual General Meeting will be held at 12 noon on 5 May 2005 at Merchant Taylors’ Hall, 30 Threadneedle Street, London EC2R 8JB.
Interim Results The interim results will be announced to the London Stock Exchange, the Stock Exchange of Hong Kong and put on our website: www.standardchartered.com.
ShareCare ShareCare is available to shareholders on the United Kingdom register and allows you to hold your Standard Chartered shares in a nominee account. Your shares can be held in electronic form so you will no longer have to worry about keeping your share certificates safe. If you join ShareCare you will still be invited to attend the Company’s AGM and you will still receive your dividend at the same time as everyone else. ShareCare is free to join and there are no annual fees to pay. If you would like to receive more information please contact the shareholder helpline on 0870 702 0138.
Previous Dividend Payments Dividend per Cost of one new ordinary share
Dividend and financial year Payment date ordinary share under share dividend scheme
Interim 1998 16 October 1998 6.25p 587.2p Final 1998 28 May 1999 14.50p 889.5p Interim 1999 15 October 1999 6.75p 860.8p Final 1999 26 May 2000 16.10p 797.9p Interim 2000 13 October 2000 7.425p 974.3p Final 2000 25 May 2001 17.71p No offer Interim 2001 12 October 2001 12.82¢/8.6856p No offer Final 2001 17 May 2002 29.10¢/19.91p £8.43/$12.32 Interim 2002 15 October 2002 14.10¢/9.023p £6.537/$10.215 Final 2002 13 May 2003 32.9¢/20.692p/HK$2.566 £6.884/$10.946 Interim 2003 10 October 2003 15.51¢/9.3625p/HK$1.205 £8.597/$14.242 Final 2003 14 May 2004 36.49¢/20.5277p/HK$2.8448 £8.905/$15.830 Interim 2004 8 October 2004 17.06¢/9.4851p/HK$1.3303 £9.546/$17.16958
Annual Report and Accounts 2004 Standard Chartered 127

Shareholder Information
Bankers’ Automated Clearing System (BACS) Dividends can be paid straight into your bank or building society account. Please contact our registrar for a mandate form.
Registrars and Shareholder Enquiries If you have any enquiries relating to your shareholding and you hold your shares on the United Kingdom register, please contact our registrar Computershare Investor Services PLC, at PO Box 82, The Pavilions, Bridgwater Road, Bristol, BS99 7NH. There is a shareholder helpline on 0870 702 0138. If you hold your shares on the Hong Kong branch register please contact Computershare Hong Kong Investor Services Limited at Shops 1712-1716, 17th Floor, Hopewell Centre, 183 Queens Road East, Hong Kong. You can check your shareholding at: www.computershare.com.
Chinese Translation If you would like a Chinese version of this Report and Accounts please contact:
Computershare Hong Kong Investor Services Limited at 46th Floor, Hopewell Centre, 183 Queen’s Road East, Hong Kong.
Shareholders on the Hong Kong branch register who have asked to receive the report and accounts in either Chinese or English can change this election by contacting Computershare.
If there is a dispute between any translation and the English version of this Report and Accounts, the English text shall prevail.
Taxation Information on taxation applying to dividends paid to you if you are a shareholder in the United Kingdom, Hong Kong or the United States will be sent to you with your dividend documents.
Electronic Communications If you hold your shares on the United Kingdom register and in future you would like to receive the Report and Accounts electronically rather than by post, please register online at: www.standardchartered.com/investors. Then click on Update Shareholder Details and follow the instructions. You will need to have your Shareholder or ShareCare Reference number when you log on. You can find this on your share certificate or ShareCare statement.
128 Standard Chartered Annual Report and Accounts 2004

rageous
Disciplineof growth sts and risks
ulatorsplarynance andwherever
e
eaks the tapeChartered
sonal best timeered Hong Kongd a record 24,000rnational sportingrs from all corners
rategic intent. It isake our strategic
each country andermines whate Strategic Intent.
35153 StanChart R&A 2004 C copy 8/3/05 10:01 AM Page 2
Designed and produced by Rare Corporate Design, London.
Printed in the UK by Park Communications on totally chlorine free stock, 75% of which is produced from 100% de-inked post consumer waste, and 25% produced from mill broke and virgin fibres, with biodegradable matt laminate. This document is fully recyclable.
Major Awards
The Asset Triple A Awards Best Asian Currency Bond House, Best Debt House in India 2004, Best Debt House in Thailand 2004, Best Local Currency Bond and Best LBO Financing in 2004 These prestigious awards reflect our growing dominance in the Asian Capital Markets. We were also presented with two country awards: Best Debt House in India 2004, for displaying leadership in fixed income and launching innovative deals; and Best Debt House in Thailand 2004, for our strong track record in debt financing.
Global Finance Best Foreign Exchange Bank in Africa 2004, World’s Best Trade Finance Provider in UK and World’s Best Sub-custodian Bank in Thailand Our well trained sales specialists and modern systems as well as the strength of our international network were our winning factors in Africa. It is also a testimony to the quality of the overall sales force, product group and operational team that we have. The UK award recognised us as the leading Trade contender against the backdrop of our usual competitors in the UK – a great performance.
Global Investor Best Regional Custodian Bank in Asia Pacific 2004 Winning for the third consecutive year, Standard Chartered was voted number one in Bangladesh, China, Hong Kong, India, Indonesia, Japan, Malaysia, Pakistan, Philippines, Singapore, South Korea, Sri Lanka, Taiwan and Thailand. Global custodians were asked to rate their agent banks’ performance in ten service categories. We made a clean sweep, emerging with top scores in all the markets where the Bank operates. The Bank beat its own 2003 record where we led the pack in ten out of 16 markets. Our exemplary performance in Japan, Singapore, Sri Lanka and Thailand pulled us ahead this year.
Euromoney Awards for Excellence 2004 Best Debt House in Singapore and India and Best at Cash Management in Middle East Winning the Best Debt House in India award for the third year running, we were praised for our comprehensive local market presence, which enabled us to be the leading bookrunner of domestic local currency bonds. For the second year, our Cash Management capabilities were deemed number one the Middle East. In winning this award, we were singled out for our highly rated technology platform for cash management, and our web-based electronic payment systems, as well as top rated customer service.
The Banker Magazine Best Bank 2004 in Ghana, Tanzania, Sierra Leone and Zambia Standard Chartered has been present in Africa since 1863, and our commitment to the region is reflected in these awards. We were also awarded the Best Bank 2004 in Kenya by business and finance journal The Market Intelligence. These awards recognise our range of quality services, technical innovation, expansion and commitment to the African continent.
International Lafferty Award 2004 Best Retail Bank in the Middle East The Lafferty Retail Banking Awards are an industry standard recognising excellence, innovation and achievement, and the 2004 awards were presented to the industry’s best performers across the world at a gala ceremony in December. Standard Chartered received the Best Retail Bank in the Middle East Award in acknowledgement of its achievements, market leadership and commitment to the Middle East.
Global Custodian Best Minor Markets Agent Bank in Asia, Best Domestic Agent Bank in Bangladesh, Best Agent Bank in Bangladesh, China, Indonesia, Korea, Malaysia and Pakistan The annual surveys conducted by Global Custodian magazine measure the quality of service that sub-custodians across the world provide their clients. Standard Chartered performed extremely well in 2004, claiming the top spot in six countries. Key to Standard Chartered’s top-rated status is the Bank’s strong client focus and emphasis on service quality.

Stand
ard C
hartered A
nnual Report and A
ccounts 2004
Ann
Lint
35153 StanChart R&A 2004 C copy 8/3/05 9:59 AM Page 1
We have a vision Seeing isBelieving
Seeingis Believing
© Standard Chartered PLC March 2005
Registered Office: 1 Aldermanbury Square London EC2V 7SB Telephone +44 (0)20 7280 7500 www.standardchartered.com
Principal Place of Business in Hong Kong: 32nd Floor, 4-4A Des Voeux Road, Central, Hong Kong
Registered in England number: 966425
Standard Chartered aims to raise funds for one million sight restorations. There are 37 million blind people in the world today, but a staggering 75 per cent of this blindness is avoidable or can be cured. Through Seeing is Believing, we aim to raise enough funds for one million sight restorations.
In partnership with Sight Savers International and VISION 2020 – the international body for the elimination of avoidable blindness – Standard Chartered has identified 12 flagship projects in 10 countries.
The funds collected will go towards cataract operations, training of eye care doctors, building of training facilities and vision centres.
Together, with your support, we believe that we can make a significant difference.
Give someone the power of sight. Join us today to make a difference.
If you would like to support Seeing is Believing, please contact: Jerry Ngo, Public Affairs Manager [email protected] Telephone: +44 (0)20 7280 7184
www.standardchartered.com