stand your ground laws, homicides, and injuries national … · 2012-10-24 · stand your ground...
TRANSCRIPT
NBER WORKING PAPER SERIES
STAND YOUR GROUND LAWS, HOMICIDES, AND INJURIES
Chandler B. McClellanErdal Tekin
Working Paper 18187http://www.nber.org/papers/w18187
NATIONAL BUREAU OF ECONOMIC RESEARCH1050 Massachusetts Avenue
Cambridge, MA 02138June 2012
This paper previously circulated as "Stand Your Ground Laws and Homicides." We would like tothank Chris Herbst, Mark Hoekstra, Dinand Webbink, and participants at the 4th Transatlantic Workshopon the Economics of Crime in the Netherlands for their comments and suggestions. The views expressedherein are those of the authors and do not necessarily reflect the views of the National Bureau of EconomicResearch.
NBER working papers are circulated for discussion and comment purposes. They have not been peer-reviewed or been subject to the review by the NBER Board of Directors that accompanies officialNBER publications.
© 2012 by Chandler B. McClellan and Erdal Tekin. All rights reserved. Short sections of text, notto exceed two paragraphs, may be quoted without explicit permission provided that full credit, including© notice, is given to the source.
Stand Your Ground Laws, Homicides, and InjuriesChandler B. McClellan and Erdal TekinNBER Working Paper No. 18187June 2012, Revised October 2012JEL No. I1,K14,K42
ABSTRACT
The controversies surrounding gun control policies have recently moved to the forefront of public’sattention in the United States and elsewhere. Since 2005, eighteen states in the United States havepassed laws extending the right to self-defense with no duty to retreat to any place a person has a legalright to be, and several additional states are debating the adoption of similar legislation. Despite theimplications that these laws may have for public safety, there has been little empirical investigationof their impact on crime and victimization. In this paper, we use monthly data from the U.S. VitalStatistics to examine how Stand Your Ground laws affect homicides and firearm injuries. We identifythe impact of these laws by exploiting variation in the effective date of these laws across states overtime. Our results indicate that Stand Your Ground laws are associated with a significant increase inthe number of homicides among whites, especially white males. According to our estimates, between28 and 33 additional white males are killed each month as a result of these laws. We find no consistentevidence to suggest that these laws increase homicides among blacks. Auxiliary analysis using datafrom the Supplemental Homicide Reports indicates that our results are not driven by the killings ofassailants. We also find that the stand your ground laws are not related to non-homicide deaths, whichshould not respond to gun laws. Finally, we analyze data from the Health Care Utilization Projectto show that these laws are also associated with a significant increase in emergency room visits andhospital discharges related to firearm inflicted injuries. Taken together, these findings raise seriousdoubts against the argument that Stand Your Ground laws make public safer.
Chandler B. McClellanDepartment of EconomicsAndrew Young School of Policy StudiesGeorgia State UniversityP.O. Box 3992Atlanta, GA [email protected]
Erdal TekinDepartment of EconomicsAndrew Young School of Policy StudiesGeorgia State UniversityP.O. Box 3992Atlanta, GA 30302-3992and [email protected]
3
I. Introduction
A number of shooting tragedies have reignited the debate on gun rights and gun
control policies in the United States and Europe recently. One particular incident
occurred on February 26, 2012 when a seventeen year old was fatally shot by a
community watch coordinator for a gated community in Sanford, Florida in the United
States.1 Based on preliminary physical evidence and the testimony provided by the
teenager’s shooter that he had acted in self-defense, the police department did not pursue
criminal prosecution against him, at least initially, under the Florida’s statute on
justifiable use of force.2 The circumstances that triggered the shooting and the initial
decision not to charge Zimmerman have prompted tremendous media coverage and
public attention and moved a wave of self-defense statutes recently introduced by states
to the forefront of jurisprudence and policy debates. These new statutes, which are also
known as Stand Your Ground (SYG) laws, allow individuals to use force, including lethal
force, in self-defense when there is reasonable belief of a threat, without having any duty
to retreat first. 3
Historically, the right to defend one’s home against intruders without a duty to
retreat is well-protected by the principle of “Castle Doctrine” in the United States.
1 Other high profile recent examples include the massacre at the Virginia Polytechnic Institute and State University in the U.S. in 2007 that killed 32 people, the Norway massacre in 2011 that claimed 77 lives, and most recently, the movie theatre shooting in Colorado, United States in 2012, which killed 12 individuals.
2 Although many of the facts surrounding the case are still unknown to the public, at the time of his death Trayvon did not have a weapon, but instead he was carrying a bag of candy and an iced tea back home. George Zimmerman was eventually arrested and charged with second-degree murder and is currently awaiting trial. 3 According to Statute 776.013, which took effect on October 1, 2005, “(3) A person who is not engaged in an unlawful activity and who is attacked in any other place where he or she has a right to be has no duty to retreat and has the right to stand his or her ground and meet force with force, including deadly force if he or she reasonably believes it is necessary to do so to prevent death or great bodily harm to himself or herself or another or to prevent the commission of a forcible felony.” See http://www.leg.state.fl.us/statutes/index.cfm?App_mode=Display_Statute&Search_String=&URL=0700-0799/0776/Sections/0776.013.html.
4
Rooted in the notion that “a man’s home is his castle”, this principle, recognized by
common law, held an exception to the duty to retreat first when an individual faced an
attack in his home.4 The key difference in this new wave of laws is that they have
extended the Castle Doctrine to apply to places outside the home, such as a vehicle,
workplace, or anywhere else an individual has a legal right to be, and thus have
diminished or eliminated the long-standing duty to retreat. Since Florida introduced its
SYG law in 2005, another seventeen states have passed some version of a SYG law that
contains language granting immunity from criminal prosecution to individuals using
defensive or deadly force to venues beyond homes.5
With a strong backing by the National Rifle Association (NRA), proponents of the
SYG laws argue that they would have a deterrent effect on crime. They also contend that
law-abiding citizens must be able to protect themselves from intruders and attackers
without having to worry about criminal or civil penalties before taking action in self-
defense. Reflected in this argument is a diminished sense of confidence in the criminal
justice system’s ability to protect victims and the perceived discrepancy in the judicial
system that emphasizes the due process rights of defendants over the rights of victims
(Jansen and Nugent-Borakove, 2007).6 It has also been suggested that increased concerns
about public safety in the aftermath of the terrorist attacks in the U.S. in September 2001
4 See Levin (2010) and Catalfamo (2007) for a summary of the historical origins of the Castle Doctrine. 5These states include Alabama, Arizona, Florida, Georgia, Indiana, Kansas, Kentucky, Louisiana, Michigan, Mississippi, Montana, New Hampshire, Oklahoma, South Carolina, South Dakota, Tennessee, Texas, and West Virginia. See Table 1 for more information. 6 Following the passage of Florida’s law, the Institute for Legislative Action (ILA) - the lobbying arm of the NRA - wrote “Without doubt, Florida's recently enacted "Castle Doctrine" law is good law, casting a common-sense light onto the debate over the right of self-defense. It reverses the pendulum that for too long has swung in the direction of protecting the rights of criminals over the rights of their victims.” (NRA-ILA, 2006).
5
and Hurricane Katrina in 2005 have played a role in the spread of SYG laws (Jansen and
Nugent-Borakove, 2007).
Opponents, on the other hand, claim that these laws give too much freedom to
private citizens to use deadly force, almost making them a license to kill rather than a
protective measure (Megale, 2010; Kleindienst, 2005). It has been argued that these laws
are open to abuses by those engaged in illegal activities or those with criminal records
and may lead to an increased number of people carrying guns and willing to use them
(Formby, 2006; Weaver, 2008; Jansen and Nugent-Borakove, 2007). Along similar lines,
it has been suggested that these laws could embolden individuals to stand their ground
rather than simply walk away and could lead to individuals resorting to the use of deadly
weapons even during situations posing no imminent danger (Weaver, 2008; Florida Stand
Your Ground Task Force, 2012). Another concern raised by critics over the expansion of
the “no duty to retreat” to public areas is the amplified risk to innocent bystanders and
public safety personnel and the possibility of increased violence due to retaliation (Jansen
and Nugent-Borakove, 2007; Rios, 2012).
In the wake of recent attention received by the SYG laws, a number of state
legislatures have reacted by introducing bills to limit the application of these laws, while
others are keeping alive bills to pass similar laws. Therefore, there is an immediate need
to provide credible evidence on the overall impact of these laws on public safety in order
to better inform the current and upcoming legislative debates as well as the public
opinion. Our analysis constitutes a significant attempt towards this goal.
6
Another motivating factor for the need for such analysis is a rise in the number of
justified homicides nationally since 2005 (Federal Bureau of Investigation, 2010).7
According to data from the Uniform Crime Reports, the total number of justifiable
homicides has steadily increased from 196 in 2005 to 278 in 2010.8 This is in contrast to
the total number of overall killings, which has continued to decline during the same
period. However, it is not straightforward how to interpret the rise in justifiable
homicides. On the one hand, it might be that more civilians are killing each other and
claiming self-defense (Palazzolo and Barry, 2012). In other words, the increase in
justifiable homicide might reflect deaths that would not have occurred otherwise. This
might support the concerns raised by the critics over the SYG laws. On the other hand, it
might also be a mechanical shift as the new laws now result in more deaths being labeled
as justifiable homicides. Nevertheless, the coincidence in trend for justifiable homicides
and the expansion of the new SYG laws is suggestive of a possible causal link, which
deserves closer investigation. Unfortunately, the official data sources from the Federal
Bureau of Investigation do not allow detailed information on the nature of circumstance
in each incident. While the Supplemental Homicide Reports provide a breakdown of
justifiable and non-justifiable homicides, these data have been shown to be problematic
due to underreporting and differences in interpretation and administrative practices in the
timing of reporting across jurisdictions (Kleck, 1998). Despite these problems, we will
7 According to the Federal Bureau of Investigation, justifiable homicide is defined as and limited to the killing of a felon by a peace officer in the line of duty or the killing of a felon during commission of a felony by a private citizen. 8 The corresponding figures are 238 for 2006, 257 for 2007, 265 for 2008, and 266 for 2009. It is notable that this upward trend is solely due to an increase in the homicides committed with firearms and not accounted for by other dangerous weapons and knives or cutting instruments.
7
show results from auxiliary analyses that examine the extent to which the SYG law is
associated with justifiable versus non-justifiable homicides.
In this paper, we examine the impact of the recently introduced SYG laws on
homicides due to firearm assaults using data from the U.S. Vital Statistics. In order to
identify the causal impact of these laws, we employ a difference-in-difference
methodology by exploiting the variation across states over time in the effective date of
these laws. It is important to note that our focus is on states that have passed SYG laws
with an explicit language extending the right to self-defense with no duty to retreat to any
place where a person has a legal right to be.9 Since the majority of these new laws were
passed in a window of a three year period between 2005 and 2007, it is difficult to
leverage variation with annual data to identify the law’s impact. Because we use data
from the Vital Statistics, which provides data on the date, location, and cause of all deaths
in the U.S., we are able to conduct our analysis at the monthly level to leverage additional
variation. These data are considered to be the most reliable source of information on
homicides. We find that the SYG laws increase firearm related homicides among whites,
especially white males. Our results indicate that between 28 and 33 additional white
males are killed each month as a result of these laws, accounting for about 8 to 9 percent
of all the white male murder victims in 2010. We find no evidence to indicate that these
laws cause an increase in homicides among blacks. We also show that the SYG laws are
9 There have been a few states that passed versions of SYG laws that did not extend the no duty to retreat principle to apply to public places. These are not included in our treatment states. In our opinion, it is the provision of “no duty to retreat at any place a person has a legal right to be” that is the controversial aspect of these laws and also the one that has received much of the attention recently. In fact, the other provisions like no duty to retreat at home, also known as the Castle Doctrine, have been part of the common law for decades almost everywhere and individuals have rarely been prosecuted for using deadly force in self-defense in their homes. Nevertheless, we conducted a robustness analysis to determine whether any of our results are confounded by the impact of these other provisions. As discussed later in the paper, our results are not influenced by these other provisions.
8
associated with an increase in emergency room visits and hospitalizations due to firearm
related injuries. Our results further indicate that it is indeed the most controversial aspect
of these laws, i.e., the provision that extends no duty to retreat to any place a person has a
legal right to be, that causes the increase in homicides. Our results are also robust to a
number of specifications and unlikely to be driven entirely by the killings of assailants.
Overall, these findings raise serious doubts about the claim that SYG laws make America
safer.
The remainder of the paper is organized as follows. Section II provides
information on the publicity generated by SYG laws and reviews the existing evidence on
the impact of these laws. Section III discusses the data used in the analyses. Section IV
describes our empirical approach. Section V presents our main results along with a
discussion of robustness analyses, and Section VI offers a set of conclusions.
II. Background
Despite the tremendous publicity generated by the SYG laws and the significant
ramifications that these laws may have on public health and safety, to date there has been
little investigation of the potential impact of these laws on outcomes, such as crime rates
and victimization. Most of what is currently known on the potential consequences of
these laws are descriptive and come from media reports. For example, according to the
Tampa Bay Times, “justifiable homicides” in Florida steadily increased from an annual
average of 34 during the first half of the 2000s to 105 in 2009 (Montgomery and Jenkins,
2010).10 In fact, the Tampa Bay Times has identified about 200 SYG cases and their
outcomes through media reports, court records and interviews with prosecutors and 10 The figures stood at 31, 43, 33, 102, 93, and 105 in years from 2004 to 2009, respectively.
9
defense attorneys in Florida (Hundley et al., 2012). The newspaper’s report of the
investigation of these cases indicates that in about 70 percent of the cases where the SYG
law was invoked to avoid prosecution, individuals have gone free. The report also cites
numerous examples which support the perception that these laws encourage individuals
to be aggressive even in situations where retreat is possible.11 Furthermore, an
independent review panel, which examined Florida’s SYG law, cites documentation of
the law’s application to excuse killings in neighborhoods, bar brawls, gang shootouts, and
road-rage incidents (Florida Stand Your Ground Task Force, 2012).
Contrary to these concerns, there are also others who argue that the colorful
examples highlighted in the media draw a misleading picture of the actual impact of these
laws and that the laws have largely been successful in protecting citizens against
wrongful attacks and intrusions.12
While there is an abundance of anecdotal evidence on the impact of the SYG law
on crime, there is very little credible investigation of the subject to determine whether
these laws represent good policy for public safety.13 One exception is a recent working
paper by Cheng and Hoekstra (2012), which examines the impact of the recent wave of
11 For example, the report states that “During an argument at a 2009 party in Fort Myers, Omar Bonilla fired his gun into the ground and beat Demarro Battle, then went inside and gave the gun to a friend. If Battle feared for his life, he had time to flee. Instead, he got a gun from his car and returned to shoot Bonilla three times, including once in the back. Battle was not charged in the slaying.” 12 There have also been examples cited in support of the desirable impact of these laws. For example, a woman with a known history of prostitution killed a client with his own gun when he had threatened to kill her. The murder charge against the woman, who could have been prosecuted under the old law, was dropped because of Florida’s newly enacted SYG law (Lake, 2006). 13 Although there has been little empirical investigation of the SYG laws, there is a wealth of research examining the effects of prevalence of gun ownership and gun laws on crime and victimization. The findings from this research are mixed. On the one hand, a large number of studies find evidence to support that gun prevalence to increase crime and victimization (Cook and Ludwig, 2003, 2006; Duggan, 2001; Mocan and Tekin, 2006; Wells and Horney, 2002; MacDonald and Parker, 2001). On the other hand, there are also a number of studies documenting that gun ownership and less restrictive regulations lead to less crime and victimization through deterrence (Lott and Mustard, 1997; Lott, 2000; Lott and Whitley, 2001; and Mustard, 2001).
10
self-defense laws on crime and homicides using data from the FBI Uniform Crime
Reports (UCR). The study finds no evidence that these laws have any deterrence effect on
crimes such as burglary, robbery, and aggravated assault, but increase murder. While
Cheng and Hoekstra (2012) is a useful attempt to shed light into the impact of self-
defense laws on crime and victimization, our study differs from that in a number of
important ways. First, we focus on the impact of SYG laws that extended the right to
self-defense with no-duty to retreat in venues outside homes, while the primary focus of
Cheng and Hoekstra (2012) is the self-defense laws with a broader scope. Second, we
examine the impact of the SYG laws separately by gender and race. On the one hand,
there is evidence to suggest that the application of these laws may have a
disproportionally larger impact on minorities (Hundley et al, 2012; Jansen and Nugent-
Borakove, 2007). On the other hand, the proportion of whites owning guns is
substantially larger than those of blacks, suggesting that the laws may also have a larger
impact on whites (Project America, 2008). As it turns out, race and gender specific
heterogeneity in the impact of SYG laws is in fact highly important and ignoring it would
produce an incomplete picture of the consequences of the SYG laws. Third, we use data
on firearm related homicides from the U.S. Vital Statistics in our main analysis, while
Cheng and Hoekstra (2012) use data from the UCR. The discrepancies in homicides
between the UCR and the Vital Statistics are well-documented (Harris et al., 2002; Loftin
et al., 2008; Wiersema et al. 2000; Decker and Pyrooz, 2010). For example, Loftin et al.
(2008) find large differences between the UCR data and Vital Statistics data, with
substantial undercount in the UCR estimates of the number of homicides. Note that
undercounting may particularly be an important issue if the extent of it differs between
11
states with SYG laws and those that do not have these laws. Vital Statistics is often
considered the gold standard of U.S. mortality measurement (Harris et al., 2002). Fourth,
we employ data on hospitalizations and emergency room visits to consider the effect of
the SYG law on injuries. This analysis is highly complementary to the analysis of
homicides because for every homicide, there are many more injuries that show up in
emergency rooms and result in hospitalizations. Fifth, we focus on monthly homicides
while Cheng and Hoekstra (2012) use annual data in their analysis. It makes sense that
Cheng and Hoekstra (2012) conduct their analyses with annual data since the monthly
data from the UCR records are particularly problematic. For example, incomplete
reporting is a major problem with the UCR at the monthly level. A large fraction of
jurisdictions does not reliably provide data on a monthly basis, but rather most
jurisdictions provide aggregates in one particular month, typically December. The
records of justifiable killings provided by the UCR may also be problematic. Kleck
(1988) discusses a number of reasons why the FBI’s total counts of justifiable homicides
represent only a minority of all civilian defensive homicides. For instance, there are
examples of cases labeled by police as justifiable homicides, but they are not reported as
such to the FBI because of the unwillingness by the police to spend much time recording
homicides where the prosecution of the murderer was not expected to be pursued.14
An analysis with annual data is not the most ideal in this case because, with the
exception of three states, all Castle Doctrine laws were passed in a period of three years
between 2006 and 2008. In particular, 12 states passed these laws in 2006 and two states
14 Another limitation of the UCR data is that federal law enforcement agencies in certain jurisdictions do not participate in the UCR program. Thus, homicides occurring in places like prisons, national parks and Indian reservations, which are not reported by state or local law enforcement agencies, will not show up in the UCR system (Rokaw et al., 1990), but will appear in the Vital Statistics.
12
passed them in 2007. The number of states that passed a SYG law in 2005 and 2008 is
only one. Clustering of laws around such a narrow time window would reduce variation
over time in the spread of these laws, which can be important for identification in a
difference-in-difference framework. Given monthly frequency of our data, we are able to
utilize variation in homicides across months within a year. This also helps us capture
seasonality in the homicides.
III. Data
Our primary data source is firearm related homicide victimization between 2000
and 2010 drawn from the U.S. Vital Statistics. These data are made available from the
National Center for Health Statistics (NCHS) through a contractual agreement. The Vital
Statistics records each instance of death based on information from death certificates filed
with the vital statistics offices of each state and the District of Columbia. Each record
contains pertinent demographic information as well as the locality, date, and cause of
death. The cause of death is then recoded by the NCHS based on the Tenth Revision of
the International Classification of Disease (ICD-10). For our purposes, we focus on
firearm related homicides committed by private citizens.15 The individual records are
aggregated to the state and month in which they occur. In order to construct homicide
rates, we obtained population data from the U.S. Census' Intercensus County Population
Estimates for each state and each year.
Our main explanatory variable is SYG defined as a binary variable that takes on
the value of one if a state has a SYG law in effect in a particular month of the year and
15 We exclude justifiable killings committed by police or other law enforcement officers and suicides by firearms from our analysis.
13
zero otherwise. The month the SYG law has become effective is determined by
information provided by the state legislature of each state in which a SYG law has been
enacted.16 In the month the law became effective, we coded the SYG as the proportion of
days within the particular month in which the law was in effect as the treatment
variable.17 The first state to pass a SYG law that has extended the right to self-defense
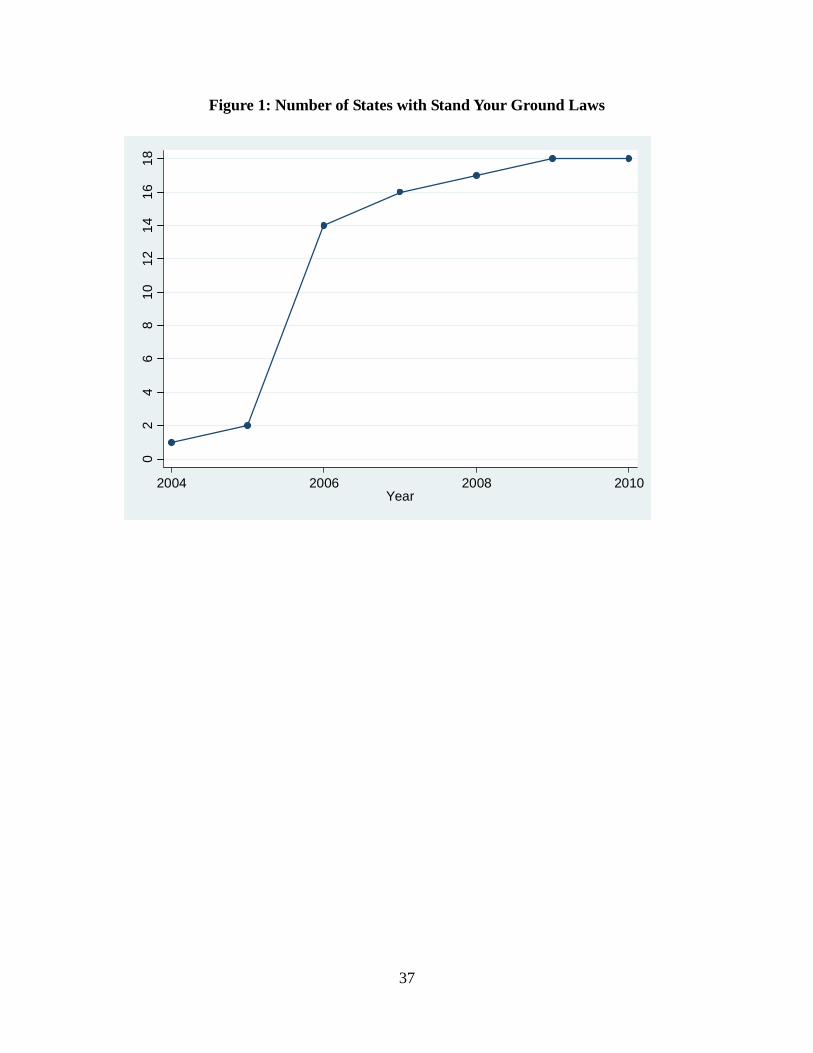
with no-duty to retreat in venues outside homes is Florida. By the end of 2010, a total of
18 states had similar laws in their criminal code. Figure 1 displays the rapid increase in
the spread of these laws during the second half of the 2000s.18 A complete list of these
states and the exact dates that their SYG laws have become effective are listed in Table
1.19 Note that a number of states have expanded their Castle Doctrine laws without
extending the no duty to retreat to public places.20 These states are listed in column 3 of
Table 1. In our interpretation, the expansion of no duty to retreat in public venues is the
most dramatic aspect of these laws with the most significant ramifications. However, we
also recognize that these other provisions may confound our findings if they have
significant impacts on homicides. In the results section, we present evidence from a
16 For some states, the effective date is the day the legislation is signed into law by the governor, while for others, it is stipulated in the text of the legislation or set as a specific day of the year on which all passed laws become effective. 17 We tested the robustness of our results to alternative ways of constructing the treatment variable. For example, we coded SYG as 1 and then 0 in the month it became effective and our results remained the same in each case. 18 Utah had a law that allowed the right of self-defense outside the home since 1994. 19 We interpret Indiana’s SYG law as one that removes duty to retreat in any place someone has a legal right to be. Note that this differs from the interpretation in Cheng and Hoekstra (2012). Indiana’s law states that “if the person reasonably believes that force is necessary to prevent serious bodily injury to the person or a third person or the commission of a forcible felony. No person in this state shall be placed in legal jeopardy of any kind whatsoever for protecting the person or a third person by reasonable means necessary.” (see http://www.in.gov/legislative/bills/2006/PDF/HE/HE1028.1.pdf). There are no limits as to where the forcible felony should occur and presumably can be construed to mean anywhere. Given the uncertainty about the language in Indiana's law, we estimated our models after recodifying Indiana as a non-SYG state. Our results remained very similar. These results are available from the authors upon request. 20 These expansions typically curtail civil liabilities for justified killings or establish a presumption of reasonableness.
14
robustness analysis, which indicates that our results are not influenced by the presence of
these other provisions and in fact it is the SYG provision that is driving our findings.
We control for several characteristics of states in our analysis. These include the
racial composition of state (i.e., percentage black, white, and Hispanic), the age
distribution of state population (i.e., percentage aged 15-19, 20-24, 25-34), and the
proportion of state population living in urban areas. Data on age distribution of state
population, racial and ethnic composition, and urbanization are obtained from the Bureau
of the Census. Next, we supplement our models with data on the number of law
enforcement agencies and the number of state prisoners obtained from the annual Justice
Expenditure and Employment Abstract of the Bureau of Justice statistics. Finally, we
control for the state’s unemployment rate, the poverty rate, and the political party that
controls the governorship in the state. These measures are compiled from the University
of Kentucky’s Center for Poverty Research.
Table 2 shows the means and standard deviations for our control variables. The
first column shows the descriptive statistics for the full sample. The descriptive statistics
for the subsample of states that has never passed a SYG law are shown in column 2 and
for those states that have passed a SYG law at some point during the analysis period are
shown in column 3. Finally, columns 4 and 5 show descriptive statistics for all state-
month-year observations without a SYG law and with a SYG law in effect, respectively.
The average monthly homicide counts are 16.8 in non-SYG states and 24.2 in SYG
states. The homicide rate is also higher among SYG states with 0.375 deaths per month
per 100,000 residents deaths compared to non-SYG states, which have an average
homicide rate of 0.292 per month per 100,000 residents. Of the 6,732 state-month-year
15
observations, 729 (10.8 percent) are zeros due to no homicides committed during those
months. The largest homicide count is observed in California, a non-SYG state, with 198
deaths in September 2002. The largest number of homicides among our SYG states was
observed in Texas in May 2009 with 106 homicides. If we consider homicide rates per
population rather than homicide counts, then the largest homicide rate was observed in
District of Columbia, again a non-SYG state, in July 2002 with 2.27 homicides per
100,000 residents. Among the SYG states, the largest homicide rate was in Louisiana in
July 2009 with 0.66 homicides per 100,000 residents. Table 2 also shows that SYG and
non-SYG states differ in several observable characteristics. In particular, SYG states have
a higher percentage of black population, more likely to have a Republican governor, a
higher incarceration rate and a larger number of law enforcement agents. These states
also tend to be more urban, and have a higher poverty rate.21
IV. Empirical Strategy
We are interested in examining the impact of the SYG law on homicides due to
gun assaults. The key empirical challenge in answering this question stems from the fact
there may be a myriad of other factors that might be correlated with the passage of these
laws and independently affect homicides due to gun assaults. Therefore, a simple before-
and-after approach would fail to identify the effect of SYG laws unless the spread of
these laws across states was effectively random with respect to both observable and
unobservable characteristics of those states. However, this assumption is unlikely. For
example, if the law enforcement officers anticipate that these laws may lead to a rise in
21 A similar picture is obtained if we rather focus on the differences between state-month-year observations with SYG law in effect and without a SYG law as presented in columns 4 and 5 of Table 2.

16
gun prevalence and escalation of violent conflicts, then they may react by intensifying
their policing efforts. Alternatively, if the new laws result in an increase in the number of
regular citizens taking up arms, for example, to serve as community watch volunteers,
then the law enforcement officers may actually reduce their patrolling activities in some
neighborhoods. Furthermore, the states that pass the SYG laws are different than other
states in many ways. For example, in a study examining the evolution of these laws,
Boots et al. (2009) show Republicans are more likely to initiate and sign a SYG bill into
law than Democrats. With respect to the geographic representation, as indicated by Table
1, southern states are more likely to have a SYG law. These also tend to be the states
with widespread support for gun rights and a strong presence of pro-gun organizations
like the NRA. If cultural or socio-economic differences across states are correlated with
both the passage of these laws and homicides, then failing to control for them would lead
to a bias in the estimated impact of SYG laws on homicides.
To address these problems, we employ a difference-in-difference strategy,
exploiting the variation in the timing of these laws across states. A key identification
assumption in this strategy is that, in the absence of the SYG laws, homicide rates would
have trended similarly between states which had enacted these laws and those which had
not. One potential threat to this is that the decision to pass a SYG law may reflect policy
endogeneity. While pro-gun activists have intensified their campaigns both at the
legislative and grassroots levels in the last decade, it is not exactly clear what specifically
prompted these particular states to extend the Castle Doctrine in such a controversial way.
As Jansen and Nugent-Borakove (2007) point out, there are many unanswered questions
about the impact of these Castle Doctrine expansion policies, particularly because there is
17
no evidence to determine why these specific expansions were proposed in the first
place.22 However, one thing that is clear is that these laws could not have been introduced
as a reaction to a wave of crime epidemic in the states that have passed these laws. On
the contrary, crime rates have been on the decline virtually everywhere in the U.S. during
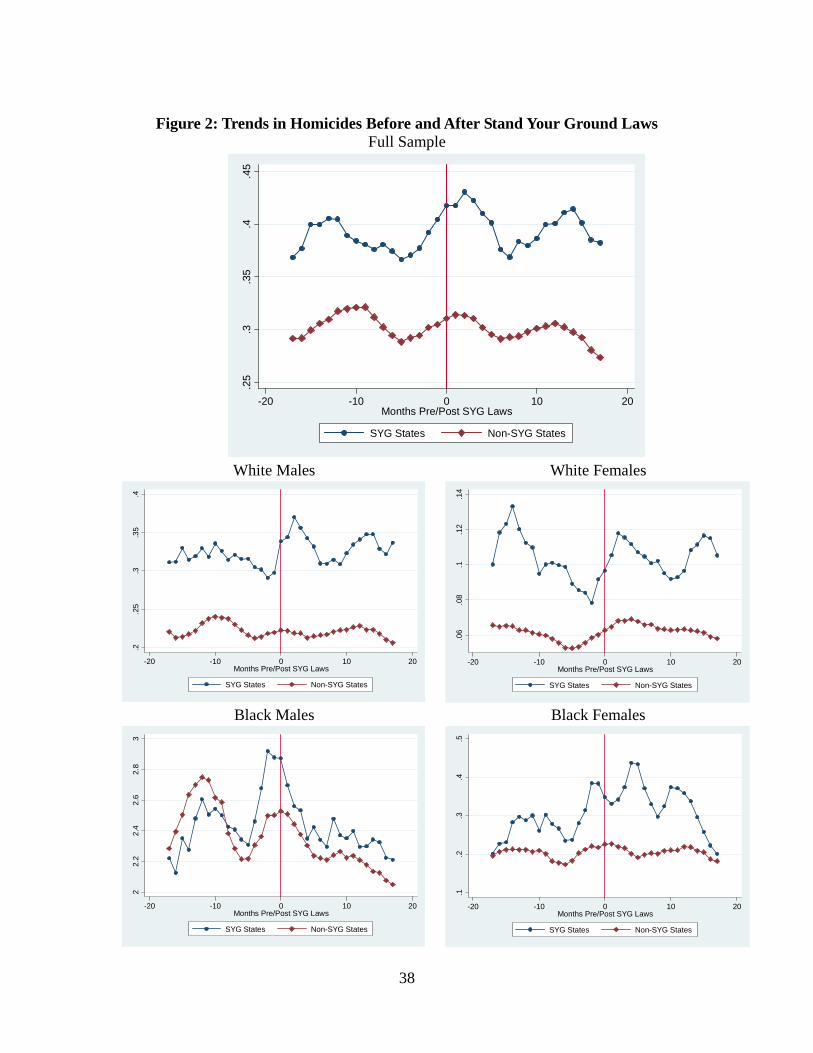
this period. Furthermore, as illustrated in Figure 2, trends in homicide rates are fairly
similar across states that passed SYG laws and those that did not prior to passage of these
laws. The line with solid circles reflects the smoothed average homicide rate in a given
month and a year among the treatment states, i.e., the states that passed a SYG law since
2005. The vertical line presents the month and the year in which the SYG law became
effective in each of the treatment states. Since these laws became effective at different
points in time, the graph is centered in the month and year the SYG law became effective
in each of the SYG states (time 0) and tracks homicide rates in the months leading up to
and after this period for 18 months (e.g., time 0 is 10/2005 for Florida and 6/2006 for
Georgia). The line with solid diamonds in Figure 2 displays the smoothed average
homicide rate across states that fall into the control group, i.e., those states that did not
pass a SYG law.23
As shown in Figure 2, the homicide rates are higher in treatment states than the
control states prior to the effective dates of SYG laws. Note that the differences in levels
of homicide between the two types of states are not a concern for our identification
22 Some suggest that increased concerns about public safety in the aftermath of the terrorist attacks in 2001 and Hurricane Katrina in 2005 have played a role in the spread of SYG laws (Jansen and Nugent-Borakove, 2007). 23 To illustrate, assume we have three states with the SYG laws, which became effective on 10/2005, 6/2006, and 12/2007, and three control states (X, Y, and Z) that did not pass a SYG law during the analysis period. Then the average homicide rate among the control states in time 0 is based on the homicide rates in states X, Y, and Z in 10/2005, 6/2006, and 12/2007. Similarly, the homicide rates in control states in time 1 is constructed as the average of homicide rates in states X, Y, and Z in 11/2005, 7/2006, and 1/2008. The average homicide rates for the months prior to time 0 are constructed in a similar fashion.
18
because we condition on state and month*year fixed effects. However, the SYG and non-
SYG states follow a generally similar trend in homicide rate prior to the SYG laws,
suggesting little evidence of systematic differences between the two groups of states
other than differences in levels. Note that when we focus on the combinations of gender
and race, the picture becomes more blurred, especially for the homicides among the
treatment states, because of volatility in the monthly rates of homicides.24 Following the
enactment of SYG laws, the homicide rates start trending upwards in the treatment states,
especially for white males. Control states, on the other hand, exhibit no such trend in an
apparent way. Moreover, we control for state specific trends in our analysis, which
allows the homicide rate to trend differently between the SYG and non-SYS states. This
picture provides suggestive evidence that in the absence of SYG laws, the treatment
states might have followed a similarly flat or downward trend. The difference-in-
difference method can be formalized in a regression framework as follows:
Hsmy = α SYGsmy + Xsmyβ + μs + λmy + εsmy, (1)
where Hsmy is the rate of homicides in state s in month m in calendar year y. SYGsmy is
our key explanatory variable, which equals one if state s has a SYG law effective in
month m in calendar year y, and 0 otherwise. The Xsmy is a vector of exogenous
determinants of crime described above. The μs are state fixed effects and would capture
any time invariant, state specific factors, which may influence homicides. The λmy are
month*year fixed effects that would account any seasonality-related trends as well as
24 Note that the volatility in homicides in SYG states is particularly higher because the number of states with a SYG law in effect decreases as one moves away from time 0. In other words, the homicide rate is averaged over a decreasing number of states as one deviate from time 0.
19
national changes in homicides that are common to all states. The εsmy is the usual error
term. Note that our unit of observation is by state, year, and month. The coefficient of
interest is α, the impact of SYG laws on homicides. The standard errors are clustered at
the state level to account for serial correlation (Bertrand et al., 2004).
Although the evidence illustrated in Figure 2 suggests that there is little evidence
of policy endogeneity or systematic pre-existing trends that differ between the treatment
and control states, we extend our baseline specification in equation (1) by including state-
specific linear trends in addition to state and month*year fixed effects. These additional
controls would account for any unobserved factors that trend over time within a state and
are correlated with homicides.25
We begin our empirical analysis with OLS models estimated in the logarithm of
homicide rates per 100,000 state residents.26 However, estimating a proportional effects
model is not straightforward in our case because of zero homicides observed in some
states in certain months. To overcome this complication, we replaced zeros with ones,
and estimated log-linear models with the resulting data.27 Next, we present results from
fixed-effects Poisson models.28 These models are particularly well-suited for our purpose
given the count nature of our data and the fact that homicides are rare events, especially
25 We also experiment with specifications that control for state-specific quadratic trends as well as region*year fixed effects. These results did not cause any appreciable changes to the results presented here. 26 The regressions are weighted by state population for the relevant demographic group. Our results are similar when we estimate these models using rates of homicide instead. These results are presented in Appendix Table 1. For example, the effect of 0.049 additional deaths per 100,000 white males reported Appendix Table 1 is very close to the corresponding figure of 0.062 obtained from Table 3A. 27 Our results do not change when we only use the non-zero observations. These results are available from the authors upon request. 28 One advantage of Poisson models is that, observed homicide rates of zero present no problem since Poisson regression does not require taking the logarithm of the dependent variable. However, one limitation of these models is the assumption that variance equals the mean. We use the robust option to obtain robust standard errors as recommended by Cameron and Trivedi (2010), which should mitigate concerns over the equivariance assumption. The violation of the equivariance assumption still produces consistent estimates but standard errors could be biased towards zero. Using Poisson regression also allows us to cluster standard errors at the state level.
20
at the monthly level and in some smaller states, and are widely used in the crime
literature (e.g., Sampson, Raudenbush, and Earls, 1997; Osgood, 2000; Weiner, Lutz, and
Ludwig, 2009).29 In fixed effects Poisson models, we control for the logarithm of state
population for the relevant race and gender group.30
V. Results
Table 3A presents OLS estimates of the impact of the SYG laws on logarithm of
the homicides per 100,000 residents. Each cell in the table presents the coefficient on the
indicator for SYG law and its standard error (adjusted for clustering at the state level).
We present results for the full sample in Panel A, and then separately by race and by
combinations of race and gender in Panels B through G. In each panel, column (1) shows
the SYG estimates from a specification expressed in equation (1) that controls for state,
month, and year fixed effects; column (2) displays the estimates from the specification
that adds state specific annual time trends.
As shown in Panel A of Table 3A, the estimates are positive and significant in
both specifications, suggesting that SYG laws increase the rate of homicides. The
estimate in the second column indicates that having a SYG law is associated with a 6.8
percent increase in the homicide rate. When we consider the impact of SYG laws on
homicides separately by race, an interesting picture emerges, suggesting that the positive
impact of these laws only applies to whites, while the estimates for blacks are negative
but not statistically significant. The point estimate on the specification in column (2)
29 In addition to fixed effects Poisson models, we estimated fixed effects Negative Binomial models to account for potential overdispersion in the data. The Negative Binomial results are not appreciably different from the Poisson or OLS results presented here and are available from the authors upon request. 30 By adding the logarithm of state population, Poisson regression becomes an analysis of rates of homicides per population, rather than an analysis of counts of homicides.
21
indicates that the SYG law increases firearm related homicide rate among whites by 11.6
percent. Given that the SYG states had an average of 0.21 white homicides per 100,000
persons in the month prior to SYG law, the estimate implies that these laws result in
about 0.024 additional white individuals per 100,000 getting killed in each state each
month. With a white population of 91.5 million in the SYG states, this is equal to an
additional 22 deaths per month.
Next, we turn our attention to the SYG estimates separately by race and gender.
These results, presented in Panels D through G of Table 3A, reveal that the positive effect
of SYG laws among whites is primarily driven by homicides of white males, while the
impact among white females is not significant. With an average homicide rate of 0.425
per 100,000 for white males in the month prior to the SYG laws, the SYG estimate of
0.147 translates into an approximately 0.062 additional homicides per 100,000 per month
among white males. Given a white male population of 45.4 million in these states, this
would indicate an additional 28 deaths per month among this demographic group. The
fact that this figure is close to the estimate in Panel B is not surprising given the smaller
and imprecisely estimated coefficient for white females as well as the lower homicide
rate among white females. Consistent with the results presented in Panel C, the estimates
on blacks are small in size and statistically insignificant for both males and females.
The results from the fixed effects Poisson models are presented in Table 3B and
are largely consistent with those from the OLS. The point estimate in column (2) of Panel
D is 0.158 indicating that the SYG laws result in an increase in the homicide rate among
white males by 17.1 percent (e0.158 – 1). This translates into an additional 0.07 homicides
per 100,000 residents per month per state among this group or 33 homicides per month.

22
Focusing on the estimates for blacks displayed in Panels F and G, we see that the
estimates are again small in magnitude and imprecisely estimated, indicating that the
SYG laws are not causing any effect in homicides among blacks.
The results presented so far refer to the impact of SYG laws that have explicit
language extending no duty to retreat to places an individual has a legal right to be.
However, some states have passed narrower versions of self-defense laws that limit the
no duty to treat only to an individual’s home, business, or vehicle, include provisions that
create a presumption of reasonableness, or remove civil liability for individuals using
deadly force in self-defense. Note that it is the provision of “no duty to retreat in any
place an individual has a legal right to be” that is the most controversial aspect of the new
SYG laws and it has been this provision that has been at the center of recent debates. In
fact, the other provision providing “no duty to retreat at one’s home” has been the part of
common law for many decades and individuals have rarely been prosecuted for using
force, including deadly force, against intruders. Nevertheless, we conducted a robustness
analysis to determine the extent to which our results are confounded by these other
provisions. To do this, we created an additional indicator to reflect whether a state has
passed some type of Castle Doctrine law during the analysis period, but one without
removing duty to retreat in any place a person has a legal right to be. We call this
indicator “Other Self-Defense Provisions.” Then we estimate all our models with these
two variables. The omitted category in our models is states that did not pass any self-
defense laws during this period.
As shown in Table 4A, the OLS results from this analysis barely change from the
results reported in Table 3A. The estimates on SYG indicator continue to point to a
23
robust impact of SYG laws on homicides among white males. In particular, the estimate
of 0.141 for white males translates into about 27 (0.141*0.425*45.4 million/100,000)
additional deaths per month, which is similar to the one in Table 3A. Moreover, the
estimates on blacks are still negative in sign, small in size, and statistically insignificant.
Regarding the coefficients on the indicator for other self-defense provisions, they are
estimated with precision only significant for white males. Surprisingly, however, the
estimates are opposite in sign, suggesting that these other provisions are associated with a
decrease in the homicide rate among this group.
The estimates from the fixed effects Poisson results are presented in Table 4B.
Similarly, these results are nearly indistinguishable from those shown in Table 3B. We
interpret this as strong evidence to confirm that the estimated SYG law impacts obtained
earlier are not confounded by these other provisions. Focusing on gender and race
specific estimates in Panels B through G, we see that the impact of SYG laws on the
homicide rate among white males is 16.5 percent, almost identical to the estimate in
Table 3B. Furthermore, all of the SYG estimates on blacks are small in size and none are
statistically significant. Regarding the estimates on the indicator for other self-defense
provisions, we obtain negative and statistically significant impacts for white males, while
the estimate on white females is positive and significant.31
In sum, the results presented in Tables 3A, 3B, 4A, and 4B provide no evidence,
unlike the advocates of these laws have argued, that the SYG laws would result in a
31 It is not surprising that the estimates on the other self-defense provisions are not consistent across specifications and demographic groups. This is likely because there is a wide variation in the scope of these other provisions across states. For example, some states only created a presumption of reasonableness for those using deadly force in self-defense situations, while others only removed civil liability for those justified under the self-defense law. Thus, bundling multiple laws into one single category like the one implemented here may fail to capture their overall impact properly.
24
reduced number of deaths among citizens in the states that have introduced such laws.
On the contrary, these results indicate that the number of firearm related homicides
among white males increase significantly as a result of these laws.
Justifiable versus Non-Justifiable Homicides
It may be argued that the increase in homicides might largely be driven by killings
that are justified by the SYG laws, i.e., deaths that occur while law-abiding citizens are
protecting themselves from intruders or attackers, and that this should not be viewed as a
negative outcome.32 It is indeed possible that additional homicides associated with the
SYG law may partly be driven by the killings of assailants. However, note that the net
rise in homicides cannot be accounted by a one-to-one substitution between the killings
of assailants and the killings of victims unless multiple assailants are killed in some
instances (Cheng and Hoekstra, 2012). If at least some of the additional homicides are
due to individuals resorting to the use of deadly force against each other in situations
where the threat of death or serious bodily injury is not imminent to either party, this
could indicate that these laws impose serious costs not only on criminals both also private
citizens as well. It is also possible that potential intruders and attackers, who, in the
absence of SYG laws, could have committed their crimes without killing anyone, are now
being killed as a result of these laws. Whether or not these killings should be considered
justifiable in this case is beyond the purpose of this paper. However, it cannot be argued
in that case that the SYG laws are saving the lives of innocent people as these individuals
would not have been killed in the first place.
32 Note that justifiable killings by police or other law enforcement officers are already excluded from our analyses.
25
While the U.S. Vital Statistics is the most reliable source of information on
homicides, it does not provide any information about whether the deaths fall under the
category of justifiable or non-justifiable homicides. In fact, the only nationally
representative source of information on justifiable and non-justifiable homicides comes
from the FBI’s Supplemental Homicide Reports (SHR). Despite the previously
mentioned problems related to the reliability of the SHR data, especially with its
breakdown of justifiable and non-justifiable homicides, we believe that an analysis with
the SHR still has the potential to provide useful insights into the relationship between
SYG laws and justifiable versus non-justifiable homicides.
To implement this analysis, we gathered data from the SHR between 2000 and
2009. The means for homicide counts in SHR are shown in Appendix Table 2.
Consistent with the earlier discussion, the homicide numbers in the SHR data are an
undercount of the total number of homicides.33 As expected, the overwhelming majority
of homicides are classified as non-justifiable. For example, there are only 4.1 justifiable
homicides compared to 201.1 non-justifiable homicides in our full sample. The number
of justifiable homicides is 2.6 for the non-SYG states and 6.6 and for the SYG states,
while the corresponding figures for non-justifiable homicides are 171.5 and 251.
Next, we run separate regressions for non-justifiable and justifiable homicides
aggregated at the annual level using data from the SHR between 2000 and 2009.34 In
Tables 5A and 5B, we report the SYG estimates for the models of justifiable homicides
33 Note that we excluded fatal shootings committed by police officers from the count of justifiable homicides.
34 We conducted the analysis with the SHR data both at the annual and monthly levels. To economize on space, we only present results from the annual level analysis. Furthermore, the monthly counts are especially noisy because of the reasons mentioned previously. Despite these problems, the results from the analyses conducted at the monthly and the annual levels point to a similar conclusion. These results from the monthly analysis are available from the authors upon request.
26
with OLS and fixed effects Poisson regressions, respectively.35 Similar to the earlier
tables, we present estimates from a specification that includes state and year fixed effects
along with time-varying state characteristics in the first column. The estimates shown in
the second column add to this list state-specific linear time trends. As shown in Table
5A, once we control for state specific time trends, the only two groups with a statistically
significant estimate on SYG are whites and white males. In fact, the point estimate
implies that the SYG law is associated with a 47 percent increase in justifiable homicides
for white males. Such a large effect is consistent with the voluminous anecdotal and
descriptive evidence pointing to a sharp rise in the number of justifiable homicides
following SYG laws. As explained above however, this may represent a rather
mechanical shift and does not necessarily indicate an increase crime, if incidents, which
could have been categorized as non-justifiable homicides before the SYG laws, now fall
under the umbrella of justifiable homicides. The results from the fixed effects Poisson
regressions are presented in Table 5B and point to a substantial increase in justifiable
homicides among white males associated with the SYG laws. In fact, the marginal effect
indicates that the SYG law almost doubles the number of justifiable homicides.
The results for the non-justifiable homicides are reported in Tables 6A and 6B.
The OLS estimates shown in Table 6A suggest that the SYG law has a large and
statistically significant positive effect in the non-justified homicides among white males.
The point estimate in column 2 indicates a 23 percent increase in these homicides
associated with the SYG laws. The results from the fixed effects Poisson regressions
35 Given that the justifiable homicide figures for white females and black females are so low and coupled with the already mentioned problems associated with justifiable homicide records, we believe that the estimates for females are not reliable, so are not presented in the tables. For example, there are 0.04 deaths per state per year among white females that are classified as justifiable. The corresponding figure for black females is 0.02. Nevertheless, they are available from the authors upon request.
27
shown in Table 6B suggest that the SYG law is associated with a significant increase in
the non-justifiable homicides of not only white males, but also white females, while no
other statistically significant effect is detected for other groups. The marginal effects
indicate that the SYG law increases non-justifiable homicides by 46.5 (e0.382 – 1) percent
among white males and 31.9 (e0.277 – 1) percent among white females.
Despite the previously mentioned concerns about the reliability of the SHR data,
the pattern obtained from the results in Tables 6A and 6B is supportive of the earlier
finding that SYG laws do in fact cause an increase in the total homicides including those
that fall under the non-justifiable category. Also, if these laws do not increase overall
homicides, but simply result in a substitution away from non-justifiable homicides
towards justifiable homicides, then we should have seen a clear reduction in non-
justifiable homicides. If anything, the evidence from Tables 6A and 6B shows strong
evidence that the opposite is true.
Robustness Analyses and Placebo Test
According to data from the Uniform Crime Reports, 67.5 percent of all homicides
are committed by firearms in the U.S. in 2010. Majority of the anecdotal evidence on the
consequences of SYG laws refer to cases which involve the use of firearms.
Nevertheless, the law is not weapon-specific, and thus can apply to any homicide
regardless of the weapon used. To assess the sensitivity of our results to the type of
weapon, we estimated all of our models using homicides committed with all types of
weapons including firearms and non-firearms. This analysis produced results that are
28
remarkably similar to those presented in Tables 3A and 3B.36 In particular, the marginal
effects for white males are 0.142 for the OLS model and 0.102 for the fixed effects
Poisson model and are both statistically significant. Consistent with our earlier results,
none of the estimates for other race and gender categories are estimated with statistical
precision.
Next we conducted a placebo analysis. To do this, we grouped all non-homicide
and non-suicide related deaths together and estimated our models using this measure as
the outcome. These deaths primarily include those caused by cardiovascular events,
cancer, and motor vehicle accidents, which arguably should not be affected by gun laws.
The results from this placebo analysis are presented in Table 7. As expected, the
estimates are imprecisely estimated for most of the categories and small in magnitude in
all cases. This suggests that the SYG laws do not exhibit any meaningful association
with the type of deaths that they should not be associated with.
Emergency Room Visits and Hospital Discharges
If the SYG laws are causing an increase in homicides, it is plausible to think that
it should cause even a larger increase in emergency room (ER) visits and hospitalizations
due to firearm related injuries. According to data from the National Center for Health
Statistics, in 2009, for each death by injury, there were about 11 times as many
hospitalizations and 182 times as many ER visits. Therefore, one attractive way to assess
the reliability of our findings is to examine whether the SYG laws are also related to
firearm related injuries that show up in emergency rooms and result in hospitalizations
36 Full results from these analyses are not shown to economize on space. However, they are available from the authors upon request.
29
To accomplish this goal, we utilized information from two databases collected by
the Healthcare Cost and Utilization Project (HCUP), which services a family of health
care databases developed through a Federal-State-Industry partnership and sponsored by
the U.S. Agency for Healthcare Research and Quality (AHRQ). Specifically, for ER
department visits, we use the State Emergency Department Databases (SEDD), which
provides discharge information on all emergency department visits that do not result in
admission to a hospital. For hospital discharges, we rely upon the State Inpatient Databases
(SID), which hold the universe of inpatient discharge abstracts from individual states. In
order for a discharge record to exist, the patient must have been admitted to hospital.
Thus, the SID typically contains records of patients who require more intensive treatment
or for whom treatment cannot be provided on an out-patient basis. Note that our SEDD
and SID data cover the states of California, Florida, Hawaii, Iowa, Maryland, New
Jersey, and Wisconsin and for the period between 2005 and 2009.37 There are a few
reasons for limiting the ER and hospitalizations analysis to these states. First, individual
states voluntarily subscribe to the HCUP project, so not every state provides these data.38
Second, some states do not provide information on patient race, which is crucial for our
analyses. Third, there is a financial cost, which makes it prohibitively expensive to
acquire data for all available states for all years. Note that among our states, Florida is
the only one which has passed a SYG law during the analysis period.
37 Note that we have data from California for only between 2005 and 2008. Our results are not sensitive to Hawaii. 38 For example, only 17 states provided the SEDD data and 27 states provided the SID data in 2009. Since we use the sum of ER visits and hospital discharges in our analyses, we cannot have more than 17 states represented in our analyses. For a full list of states with SEDD and SID data, please visit http://www.hcup-us.ahrq.gov/databases.jsp.
30
The injury categories in the HCUP data are based on ICD-9 codes and we focus
on external injuries that are inflicted purposefully, excluding firearm injuries that are
inflicted accidently or by police officers. We identified the firearm related injuries in the
SEDD and SID databases for each of our sample states and aggregated the counts at the
quarterly level. Then we summed up the quarterly total counts of ER visits (from SEDD)
and hospital discharges (from SID) to generate our outcome measure.39 To our
knowledge, this is the first study to consider the effect of SYG laws on firearm related
injuries. The descriptive statistics for the ER visits and hospital discharges are presented
in Appendix Table 3. Both the ER visits and hospitalizations are higher, both in levels
and in rates per 100,000 persons, among SYG states than non-SYG states. This is
suggestive that the SYG law may indeed play a role in increasing injuries in these states.
The estimation results from the analysis of the effect of SYG laws on ER visits
and hospital discharges are presented in Tables 8A and 8B for OLS and the fixed effects
Poisson regressions, respectively. Focusing on the estimates in column 2, which control
for state specific linear time trends in addition to state level time-varying variables, state
fixed effects and year and quarter fixed effects, we see from the OLS estimates in Table
8A that the SYG laws are associated with an increase in the firearm related injuries that
result in ER visits and hospitalizations among white males in the order of approximately
20 percent and among black females in the order of almost 60 percent.40 The estimates
from the fixed effects Poisson regressions shown in Table 8B are consistent with those
from the OLS, indicating that the SYG law is associated with significant increases in
39 Since the SEDD records include cases that did not result in a hospital admission, summing counts from SEDD and SID does not result in double-counting. 40 The large estimate on black females is consistent with the hypothesis that the SYG laws are associated with an increase in firearm related injuries for this demographic group. However, this finding is not supported with our earlier analysis on homicides and therefore, deserves further investigation.
31
firearm related injuries among white males and black females. Remarkably, the marginal
effect of the SYG estimate among white males is 20 percent (e0.188 – 1), which is identical
to the corresponding figure from the OLS. Taken together, the results presented in Tables
8A and 8B are generally in line with those from the mortality analysis, indicating that the
SYG laws are not only associated with increased homicides, but also increased firearm
injuries.
VI. Conclusions
The controversies surrounding a recent wave of self-defense laws introduced by
an increasing number states in the United States have captured the nation’s attention
recently. Since 2005, a total of 18 states have passed legislation that has extended the no
duty to retreat rule to apply to public places and a number of states are debating the
adoption of similar legislation. Despite significant implications of these new laws for
public safety, there has been little empirical investigation of their impacts. In this paper,
we show that SYG laws that extend the right to self-defense to areas outside the home are
associated with a significant increase in the number of homicides. Our gender and race
specific analyses indicate that the rise in homicides is primarily driven by the deaths
among whites, especially white males, while we generally find no effect on blacks. .
According to our estimates, between 28 and 33 additional white males are killed each
month as a result of these laws, , accounting for about 8 to 9 percent of the 4,234
homicides committed against white males in 2010.
Our analysis using data on emergency room visits and hospital discharges from a
number of states including Florida indicate that the SYG laws also cause a substantial
32
increase in number of individuals who are taken to emergency rooms and hospitals for
firearm related injuries.
We also find evidence to suggest that the SYG laws are associated with increases
in both justifiable and non-justifiable homicides, using data from the Supplemental
Homicide Reports. We find no evidence that these laws are related to non-homicide
deaths, which makes sense given that one would expect no association between gun laws
and these types of deaths.
Our results suggest that it is indeed the most controversial aspect of these laws,
i.e., the provision that extends no duty to retreat to any place a person has a legal right to
be, that causes the increase in homicides. In particular, we show strong evidence to
indicate that our results are not driven by other self-defense provisions adopted by states.
Taken together, our findings raise serious doubts against the argument that the stand your
ground laws serve as a deterrent for crime. On the contrary, we show consistent evidence
that these laws are associated with an increase in crime, at least measured by homicides,
especially among white males.
There are a number of possible explanations for the finding that the SYG laws are
significantly associated with the homicides among white males, but not with other
demographic groups. For example, it has been suggested that the SYG laws may be
associated with an increase in gun ownership (Jansen and Nugent-Borakove, 2007). In
fact, there has been some mentioning in the media of a sharp increase in the applications
for concealed weapon permits following the passage of these laws in Florida.41 Given that
the overwhelming majority of concealed guns are owned and carried by white males in
41 http://www.tampabay.com/news/politics/stateroundup/stand-your-ground-laws-impact-needs-more-study-task-force-told/1251191.

33
the United States, it is plausible to expect the SYG impact to be more pronounced for this
group. Furthermore, it has been argued that the SYG laws may embolden individuals to
stand their ground rather than simply walk away and may lead to individuals resorting to
the use of deadly weapons even in incidents with no real threat to people’s lives.
However, in order for these behaviors to be associated with the SYG laws, people must
have knowledge of these laws. In other words, these laws should only have an effect on
the behavior of individuals who have heard about these laws. Then it is plausible to think
that white males, who are more likely to own and carry guns and who constitute the vast
majority of the membership for pro-gun organizations like the NRA, are the ones who
have more interest in following the legislative activity related to guns. Finally, our results
are also consistent with the bystander story, i.e., given that the no-duty to retreat applies
to any public place in the SYG states, these laws may pose an increased risk to
bystanders. If gun owners, who are more likely to be white males, are also more likely to
be surrounded by whites and especially white males, then this may suggest that the SYG
law should have a stronger impact on this group. However, the explanations offered here
should only be interpreted as suggestive and seen as an important avenue of future
research.
34
References Azrael, D., P.J. Cook, and J. Miller (2004). "State and local prevalence of firearms ownership measurement, structure, and trends." Journal of Quantitative Criminology 20(1): 43-62. Bedard, K. and H. Frech III (2009). "Prison health care: is contracting out healthy?" Health Economics 18(11): 1248-1260. Bertrand, M., E. Duflo, and S. Mullainathan (2004). How much should we trust differences-in-differences estimates? Quarterly Journal of Economics, 119:1. Boots, D. P., J. Bihari, and E. Elliott (2009). "The State of the Castle An Overview of Recent Trends in State Castle Doctrine Legislation and Public Policy." Criminal Justice Review 34(4): 515-535. Cameron, A. C. and P. K. Trivedi (2005). Microeconometrics: Methods and Applications, Cambridge University Press. Catalfamo, C. (2006). "Stand Your Ground: Florida's Castle Doctrine for the Twenty-First Century." Rutgers Journal of Law & Public Policy 4: 504. Cheng, C. and M. Hoekstra (2012). “Does Strengthening Self-Defense Law Deter Crime or Escalate Violence? Evidence from Castle Doctrine.” Working Paper, Department of Economics, Texas A&M University. Cook, P. and J. Ludwig (2003). "Evaluating Gun Policy. Washington DC, Brookings Institution Press. Cook, P. and J. Ludwig (2006). “The social costs of gun ownership.” Journal of Public Economics, 90(1-2), 379-391. Cook, P., J. Ludwig, and A. Samaha (2009). “Gun Control after Heller: Litigating against Regulation.” National Bureau of Economic Research Working Paper No. 15431, October. Decker, S. H. and D. C. Pyrooz (2010). "On the Validity and Reliability of Gang Homicide: A Comparison of Disparate Sources." Homicide Studies 14(4): 359-376. Duggan, M. (2001). "More Guns, More Crime." Journal of Political Economy 109(5). Federal Bureau of Investigation (2010). Uniform Crime Reports: Crime in the United States. Florida Stand Your Ground Taskforce (2012). Final Report to Governor's Task Force. Formby, B. (2006). Bill to seek “castle doctrine” crime protection. Dallas Morning News.
35
Harris, A. R., S. H. Thomas, G.A., Fisher, and D.J. Hirsch (2002). "Murder and Medicine: The Lethality of Criminal Assault 1960-1999." Homicide Studies 6(2): 128-166. Hundley, K., S. T. Martin, et al. (2012). Florida ‘Stand Your Ground’ Yields Some Shocking Outcomes Depending on How Law is Applied. Tampa Bay Times. Accessed on June 3, 2012 at http://www.tampabay.com/news/publicsafety/crime/article1233133.ece. Jansen, S. and M. E. Nugent-Borakove (2007). Expansions to the Castle Doctrine: Implications for Policy and Practice, Association of Prosecuting Attorneys. Kleck, G. (1988). "Crime control through the private use of armed force." Social Problems 35: 1. Kleck, G. (2004). "Measures of gun ownership levels for macro-level crime and violence research." Journal of Research in Crime and Delinquency 41(1): 3-36. Kleindienst, L. (2005). Welcome to Florida, But Look Out: Groups Alert Guests to Law, Deadly Force. Sun Sentinel. Accessed on May 20, 2012 at http://articles.sun-sentinel.com/2005-09-26/news/0509250378_1_deadly-force-law-seals-prosecutors-and-courts. Lake, T. (2006). Thanks to New Law, No Case in Shooting. Tampa Bay Times. Accessed on May 20, 2012 at http://www.sptimes.com/2006/07/22/Pasco/Thanks_to_new_law__no.shtml. Levin, B. (2011). "A Defensible Defense?: Reexamining Castle Doctrine Statutes." Harvard Journal on Legislation, Vol. 47, No. 2, p. 52. Loftin, C., D. McDowall, and M.D. Fetzer (2008). "A Comparison of SHR and Vital Statistics Homicide Estimates for US Cities." Journal of Contemporary Criminal Justice 24(1): 4-17. Lott, J., J.R. and D. B. Mustard (1997). "Crime, deterrence, and right-to-carry concealed handguns." The Journal of Legal Studies 26(1): 1-68. Lott, J. J.R. (2001). More guns, less crime: understanding crime and gun-control laws, University of Chicago Press. MacDonald, J. M. and K. F. Parker (2001). "The Structural Determinants of Justifiable Homicide Assessing the Theoretical and Political Considerations." Homicide Studies 5(3): 187-205. Megale, E.B. (2010). “Making Murder Legal: How Laws Expanding Self-Defense Allow Criminals to “Get Away with Murder.”” Working Paper. Retrieved May 20, 2012 from http://works.bepress.com/elizabeth_megale/1.
36
Mocan, H. N. and E. Tekin (2006). "Guns and Juvenile Crime." Journal of Law and Economics 49(2): 507-531. Montgomery, B. and C. Jenkins (2010). Five Years Since Florida Enacted “Stand-Your-Ground” Law, Justifiable Homicides are Up. Tampa Bay Times. Accessed on May 15, 2012 at http://www.tampabay.com/news/publicsafety/crime/article1128317.ece. Mustard, D. B. (2001). "The Impact of Gun Laws on Police Deaths." Journal of Law and Economics 44(S2): 635-657. NRA-ILA (2006). "Fortifying the Right to Self-Defense." News & Issues. February 6. Accessed on May 12, 201 at http://nraila.org/news-issues/fact-sheets/2006/fortifying-the-right-to-self-defense.aspx. . Osgood, D. W. (2000). "Poisson-based regression analysis of aggregate crime rates." Journal of Quantitative Criminology 16(1): 21-43. Sampson, R. J., Raudenbush, S. W. and Earls, F. (1997). ‘Neighbourhoods and Violent Crime: A Multilevel Study of Collective Efficacy’, Science 277, 918–24. Palazzolo, J. and R. Barry (2012). More Killings Called Self Defense. Wall Street Journal. New York City. Project America (2008). Firearms: Ownership: Race. Accessed on May 20, 2012 at http://www.project.org/info.php?recordID=272. Rios, V. (2012). “Gunfire as Conflict Resolution.” The Opinion Pages. The New York Times. March 21. Rokaw, W. M., J. A. Mercy, et al. (1990). "Comparing death certificate data with FBI crime reporting statistics on US homicides." Public Health Reports 105(5): 447. Weaver, Z. L. (2008). "Florida's Stand Your Ground Law: The Actual Effects and the Need for Clarification." Miami Law Review, 63(1), 395-430. Weiner, D. A., B. F. Lutz, and J. Ludwig (2009). “The Effects of School Desegregation on Crime.” National Bureau of Economic Research Working Paper No. 15380, September. Wells, W. and J. Horney (2002). "Weapon Effects And Individual Intent To Do Harm: Influences On The Escalation Of Violence." Criminology 40(2): 265-296. Wiersema, B., C. Loftin, and D. McDowall (2000). "A comparison of supplementary homicide reports and national vital statistics system homicide estimates for US counties." Homicide Studies 4(4): 317-340.
37
Figure 1: Number of States with Stand Your Ground Laws
02
46
810
1214
1618
2004 2006 2008 2010Year
38
Figure 2: Trends in Homicides Before and After Stand Your Ground Laws
Full Sample
.25
.3.3
5.4
.45
-20 -10 0 10 20Months Pre/Post SYG Laws
SYG States Non-SYG States
White Males White Females
.2.2
5.3
.35
.4
-20 -10 0 10 20Months Pre/Post SYG Laws
SYG States Non-SYG States
.06
.08
.1.1
2.1
4
-20 -10 0 10 20Months Pre/Post SYG Laws
SYG States Non-SYG States
Black Males Black Females
22.
22.
42.
62.
83
-20 -10 0 10 20Months Pre/Post SYG Laws
SYG States Non-SYG States
.1.2
.3.4
.5
-20 -10 0 10 20Months Pre/Post SYG Laws
SYG States Non-SYG States

39
Table 1: States with Stand Your Ground Laws
State
No Duty to Retreat in any place someone has a legal right to be
Any Castle Doctrine Expansion
Effective Date for SYG Law
Notes/Sources
Alabama 1 1 6/1/2006 a Alaska 0 1 9/13/2006 b Arizona 1 1 4/24/2006 b Arkansas 0 0 California 0 0 Colorado 0 0 Connecticut 0 0 Delaware 0 0 District of Columbia 0 0 Florida 1 1 10/1/2005 a Georgia 1 1 7/1/2006 b Hawaii 0 0 Idaho 0 1 7/1/2006 b Illinois 0 1 7/28/2004 b Indiana 1 1 7/1/2006 b Iowa 0 0 Kansas 1 1 7/1/2006 b Kentucky 1 1 7/12/2006 b Louisiana 1 1 8/15/2006 c Maine 0 0 Maryland 0 0 Massachusetts 0 0 Michigan 1 1 10/1/2006 a Minnesota 0 0 Mississippi 1 1 7/1/2006 b Missouri 0 1 8/28/2007 b Montana 1 1 4/27/2009 a Nebraska 0 0 Nevada 0 0 New Hampshire 1 1 11/13/2011 b New Jersey 0 0 New Mexico 0 0 New York 0 0 North Carolina 0 0 North Dakota 0 1 8/1/2007 b Ohio 0 1 9/9/2008 b Oklahoma 1 1 11/1/2006 a Oregon 0 0 Pennsylvania 0 0 Rhode Island 0 0 South Carolina 1 1 6/9/2006 b South Dakota 1 1 7/1/2006 b Tennessee 1 1 5/22/2007 b Texas 1 1 9/1/2007 d Utah 1 1 3/2/1994 d Vermont 0 0 Virginia 0 0
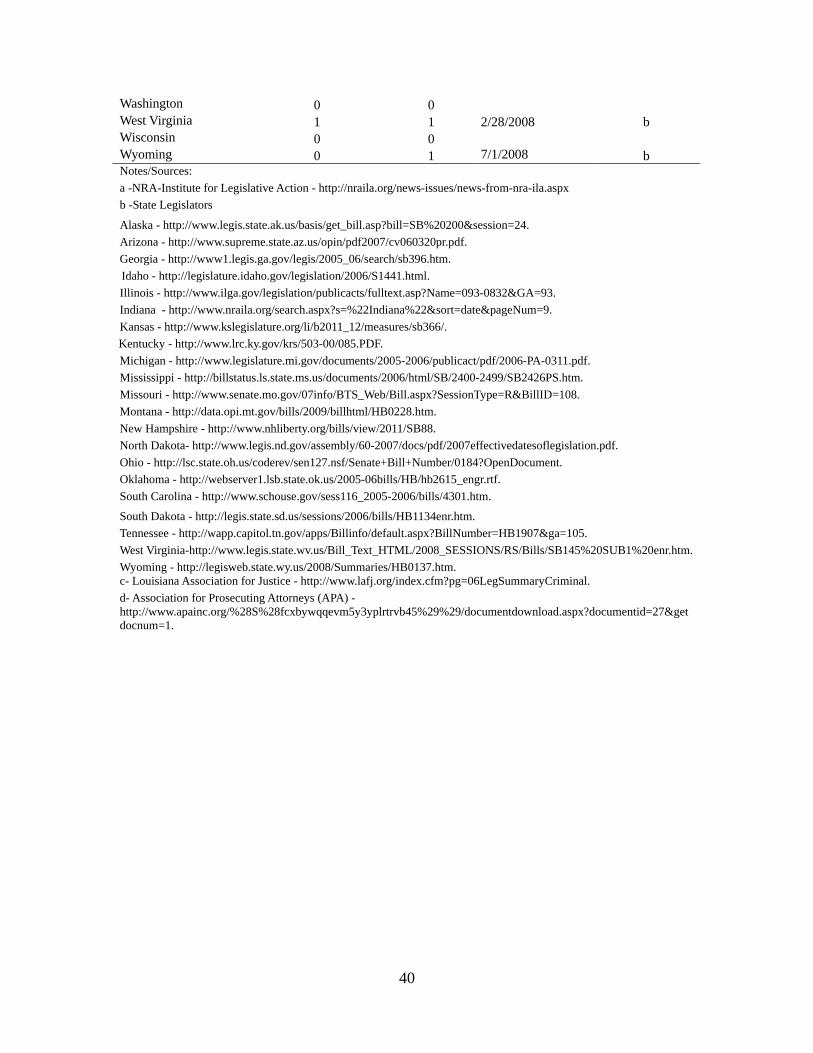
40
Washington 0 0 West Virginia 1 1 2/28/2008 b Wisconsin 0 0 Wyoming 0 1 7/1/2008 b Notes/Sources: a -NRA-Institute for Legislative Action - http://nraila.org/news-issues/news-from-nra-ila.aspx b -State Legislators Alaska - http://www.legis.state.ak.us/basis/get_bill.asp?bill=SB%20200&session=24. Arizona - http://www.supreme.state.az.us/opin/pdf2007/cv060320pr.pdf. Georgia - http://www1.legis.ga.gov/legis/2005_06/search/sb396.htm.
Idaho - http://legislature.idaho.gov/legislation/2006/S1441.html.
Illinois - http://www.ilga.gov/legislation/publicacts/fulltext.asp?Name=093-0832&GA=93. Indiana - http://www.nraila.org/search.aspx?s=%22Indiana%22&sort=date&pageNum=9. Kansas - http://www.kslegislature.org/li/b2011_12/measures/sb366/.
Kentucky - http://www.lrc.ky.gov/krs/503-00/085.PDF.
Michigan - http://www.legislature.mi.gov/documents/2005-2006/publicact/pdf/2006-PA-0311.pdf. Mississippi - http://billstatus.ls.state.ms.us/documents/2006/html/SB/2400-2499/SB2426PS.htm. Missouri - http://www.senate.mo.gov/07info/BTS_Web/Bill.aspx?SessionType=R&BillID=108. Montana - http://data.opi.mt.gov/bills/2009/billhtml/HB0228.htm. New Hampshire - http://www.nhliberty.org/bills/view/2011/SB88. North Dakota- http://www.legis.nd.gov/assembly/60-2007/docs/pdf/2007effectivedatesoflegislation.pdf. Ohio - http://lsc.state.oh.us/coderev/sen127.nsf/Senate+Bill+Number/0184?OpenDocument. Oklahoma - http://webserver1.lsb.state.ok.us/2005-06bills/HB/hb2615_engr.rtf. South Carolina - http://www.schouse.gov/sess116_2005-2006/bills/4301.htm.
South Dakota - http://legis.state.sd.us/sessions/2006/bills/HB1134enr.htm. Tennessee - http://wapp.capitol.tn.gov/apps/Billinfo/default.aspx?BillNumber=HB1907&ga=105. West Virginia-http://www.legis.state.wv.us/Bill_Text_HTML/2008_SESSIONS/RS/Bills/SB145%20SUB1%20enr.htm. Wyoming - http://legisweb.state.wy.us/2008/Summaries/HB0137.htm. c- Louisiana Association for Justice - http://www.lafj.org/index.cfm?pg=06LegSummaryCriminal. d- Association for Prosecuting Attorneys (APA) - http://www.apainc.org/%28S%28fcxbywqqevm5y3yplrtrvb45%29%29/documentdownload.aspx?documentid=27&getdocnum=1.
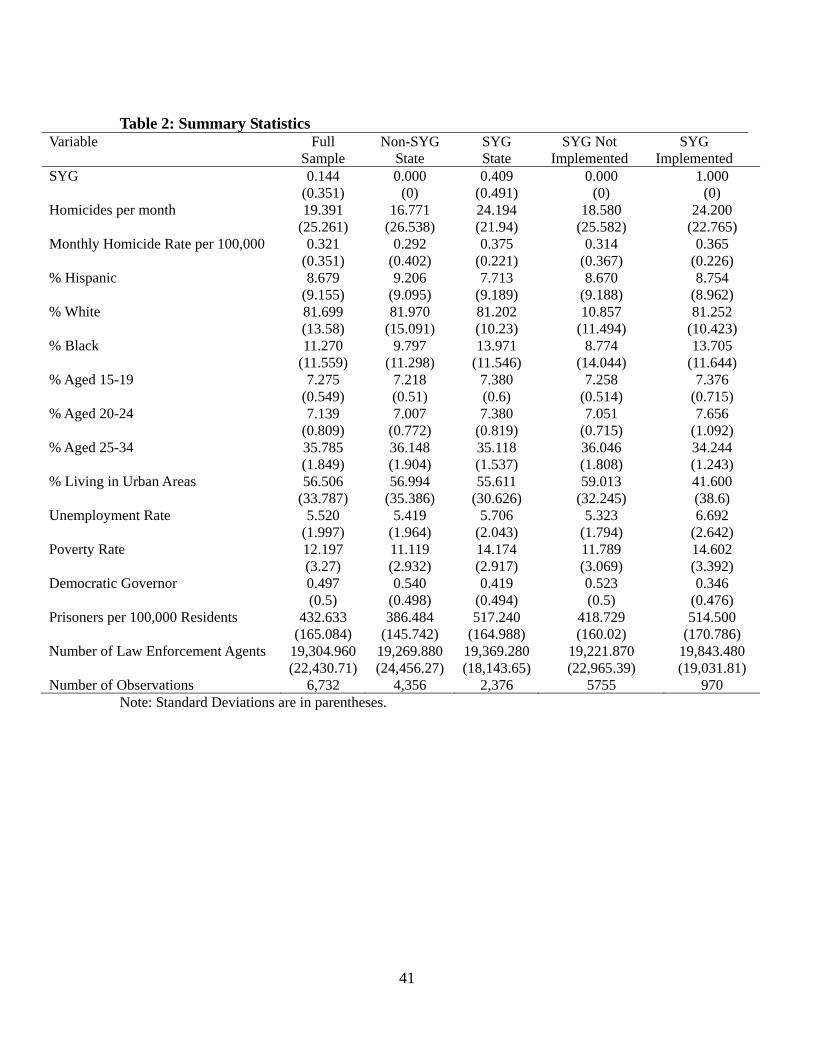
41
Table 2: Summary Statistics
Variable Full Sample
Non-SYG State
SYG State
SYG Not Implemented
SYG Implemented
SYG 0.144 0.000 0.409 0.000 1.000 (0.351) (0) (0.491) (0) (0) Homicides per month 19.391 16.771 24.194 18.580 24.200 (25.261) (26.538) (21.94) (25.582) (22.765) Monthly Homicide Rate per 100,000 0.321 0.292 0.375 0.314 0.365 (0.351) (0.402) (0.221) (0.367) (0.226) % Hispanic 8.679 9.206 7.713 8.670 8.754 (9.155) (9.095) (9.189) (9.188) (8.962) % White 81.699 81.970 81.202 10.857 81.252 (13.58) (15.091) (10.23) (11.494) (10.423) % Black 11.270 9.797 13.971 8.774 13.705 (11.559) (11.298) (11.546) (14.044) (11.644) % Aged 15-19 7.275 7.218 7.380 7.258 7.376 (0.549) (0.51) (0.6) (0.514) (0.715) % Aged 20-24 7.139 7.007 7.380 7.051 7.656 (0.809) (0.772) (0.819) (0.715) (1.092) % Aged 25-34 35.785 36.148 35.118 36.046 34.244 (1.849) (1.904) (1.537) (1.808) (1.243) % Living in Urban Areas 56.506 56.994 55.611 59.013 41.600 (33.787) (35.386) (30.626) (32.245) (38.6) Unemployment Rate 5.520 5.419 5.706 5.323 6.692 (1.997) (1.964) (2.043) (1.794) (2.642) Poverty Rate 12.197 11.119 14.174 11.789 14.602 (3.27) (2.932) (2.917) (3.069) (3.392) Democratic Governor 0.497 0.540 0.419 0.523 0.346 (0.5) (0.498) (0.494) (0.5) (0.476) Prisoners per 100,000 Residents 432.633 386.484 517.240 418.729 514.500 (165.084) (145.742) (164.988) (160.02) (170.786) Number of Law Enforcement Agents 19,304.960 19,269.880 19,369.280 19,221.870 19,843.480 (22,430.71) (24,456.27) (18,143.65) (22,965.39) (19,031.81) Number of Observations 6,732 4,356 2,376 5755 970
Note: Standard Deviations are in parentheses.
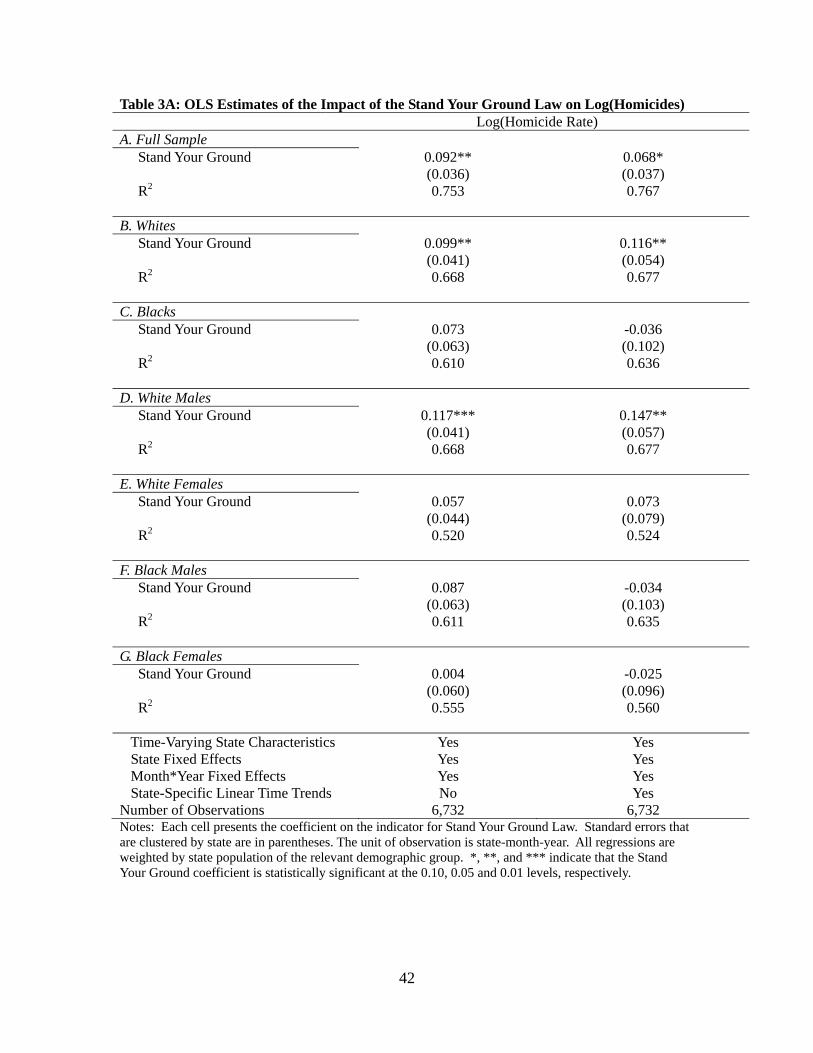
42
Table 3A: OLS Estimates of the Impact of the Stand Your Ground Law on Log(Homicides) Log(Homicide Rate) A. Full Sample Stand Your Ground 0.092** 0.068* (0.036) (0.037) R2 0.753 0.767 B. Whites Stand Your Ground 0.099** 0.116** (0.041) (0.054) R2 0.668 0.677 C. Blacks Stand Your Ground 0.073 -0.036 (0.063) (0.102) R2 0.610 0.636 D. White Males Stand Your Ground 0.117*** 0.147** (0.041) (0.057) R2 0.668 0.677 E. White Females Stand Your Ground 0.057 0.073 (0.044) (0.079) R2 0.520 0.524 F. Black Males Stand Your Ground 0.087 -0.034 (0.063) (0.103) R2 0.611 0.635 G. Black Females Stand Your Ground 0.004 -0.025 (0.060) (0.096) R2 0.555 0.560 Time-Varying State Characteristics Yes Yes State Fixed Effects Yes Yes Month*Year Fixed Effects Yes Yes State-Specific Linear Time Trends No Yes Number of Observations 6,732 6,732 Notes: Each cell presents the coefficient on the indicator for Stand Your Ground Law. Standard errors that are clustered by state are in parentheses. The unit of observation is state-month-year. All regressions are weighted by state population of the relevant demographic group. *, **, and *** indicate that the Stand Your Ground coefficient is statistically significant at the 0.10, 0.05 and 0.01 levels, respectively.
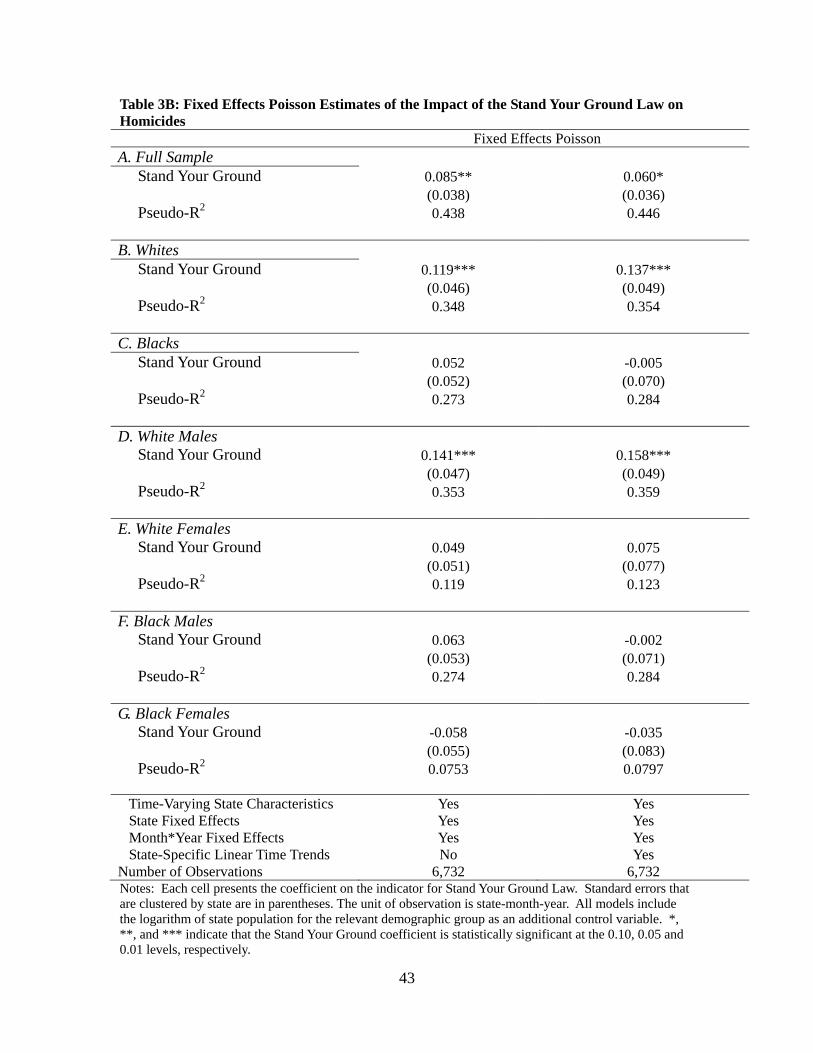
43
Table 3B: Fixed Effects Poisson Estimates of the Impact of the Stand Your Ground Law on Homicides
Fixed Effects Poisson A. Full Sample Stand Your Ground 0.085** 0.060* (0.038) (0.036) Pseudo-R2 0.438 0.446 B. Whites Stand Your Ground 0.119*** 0.137*** (0.046) (0.049) Pseudo-R2 0.348 0.354 C. Blacks Stand Your Ground 0.052 -0.005 (0.052) (0.070) Pseudo-R2 0.273 0.284 D. White Males Stand Your Ground 0.141*** 0.158*** (0.047) (0.049) Pseudo-R2 0.353 0.359 E. White Females Stand Your Ground 0.049 0.075 (0.051) (0.077) Pseudo-R2 0.119 0.123 F. Black Males Stand Your Ground 0.063 -0.002 (0.053) (0.071) Pseudo-R2 0.274 0.284 G. Black Females Stand Your Ground -0.058 -0.035 (0.055) (0.083) Pseudo-R2 0.0753 0.0797 Time-Varying State Characteristics Yes Yes State Fixed Effects Yes Yes Month*Year Fixed Effects Yes Yes State-Specific Linear Time Trends No Yes Number of Observations 6,732 6,732 Notes: Each cell presents the coefficient on the indicator for Stand Your Ground Law. Standard errors that are clustered by state are in parentheses. The unit of observation is state-month-year. All models include the logarithm of state population for the relevant demographic group as an additional control variable. *, **, and *** indicate that the Stand Your Ground coefficient is statistically significant at the 0.10, 0.05 and 0.01 levels, respectively.

44
Table 4A: OLS Estimates of the Impact of the Stand Your Ground and Other Self-Defense Laws on Homicides Log(Homicide Rate) A. Full Sample Stand Your Ground 0.094** 0.066* (0.036) (0.038) Other Self-Defense Provisions 0.015 -0.057 (0.097) (0.080) R2 0.753 0.767 B. White Stand Your Ground 0.093** 0.114** (0.041) (0.055) Any Self-Defense Law -0.044 -0.043 (0.108) (0.056) R2 0.668 0.677 C. Blacks Stand Your Ground 0.074 -0.040 (0.066) (0.102) Other Self-Defense Provisions 0.010 -0.121 (0.103) (0.104) R2 0.610 0.637 D. White Males Stand Your Ground 0.105** 0.141** (0.043) (0.059) Other Self-Defense Provisions -0.083 -0.120*** (0.101) (0.033) R2 0.668 0.677 E. White Females Stand Your Ground 0.074* 0.082 (0.041) (0.077) Other Self-Defense Provisions 0.121 0.187 (0.102) (0.146) R2 0.520 0.525 F. Black Males Stand Your Ground 0.088 -0.038 (0.067) (0.103) Other Self-Defense Provisions 0.004 -0.134 (0.106) (0.103) R2 0.611 0.636 G. Black Females Stand Your Ground 0.013 -0.028 (0.063) (0.096) Other Self-Defense Provisions 0.051 -0.086 (0.050) (0.081) R2 0.555 0.560 Time-Varying State Characteristics Yes Yes State Fixed Effects Yes Yes Month*Year Fixed Effects Yes Yes State-Specific Linear Time Trends No Yes Notes: Standard errors that are clustered by state are in parentheses. *, **, and *** indicate that the Stand Your Ground coefficient is statistically significant at the 0.10, 0.05 and 0.01 levels, respectively.

45
Table 4B: Fixed Effects Poisson of the Impact of the Stand Your Ground and Any Self-Defense Laws on Homicides Log(Homicide) A. Full Sample Stand Your Ground 0.085** 0.058 (0.038) (0.036) Other Self-Defense Provisions 0.001 -0.059 (0.105) (0.095) Pseudo-R2 0.438 0.446 B. White Stand Your Ground 0.111** 0.135*** (0.045) (0.050) Any Self-Defense Law -0.065 -0.032 (0.124) (0.065) Pseudo-R2 0.348 0.354 C. Blacks Stand Your Ground 0.058 -0.007 (0.055) (0.069) Other Self-Defense Provisions 0.031 -0.074 (0.102) (0.119) Pseudo-R2 0.273 0.284 D. White Males Stand Your Ground 0.125*** 0.153*** (0.047) (0.050) Other Self-Defense Provisions -0.137 -0.123*** (0.116) (0.042) Pseudo-R2 0.353 0.359 E. White Females Stand Your Ground 0.069 0.086 (0.049) (0.075) Other Self-Defense Provisions 0.154 0.261** (0.104) (0.128) Pseudo-R2 0.119 0.123 F. Black Males Stand Your Ground 0.068 -0.005 (0.056) (0.071) Other Self-Defense Provisions 0.025 -0.087 (0.105) (0.115) Pseudo-R2 0.274 0.284 G. Black Females Stand Your Ground -0.044 -0.034 (0.057) (0.081) Other Self-Defense Provisions 0.079 0.043 (0.075) (0.184) 0.0753 0.0797 Time-Varying State Characteristics Yes Yes State Fixed Effects Yes Yes Month*Year Fixed Effects Yes Yes State-Specific Linear Time Trends No Yes Notes: Standard errors that are clustered by state are in parentheses. *, **, and *** indicate that the Stand Your Ground coefficient is statistically significant at the 0.10, 0.05 and 0.01 levels, respectively
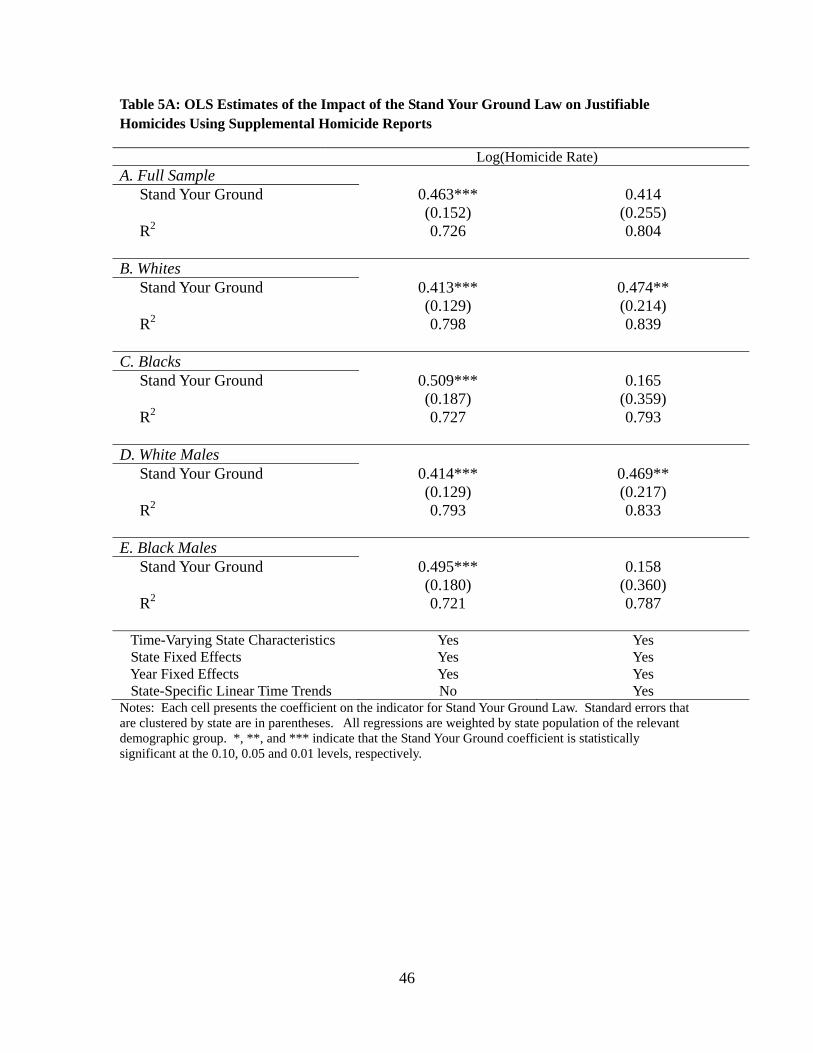
46
Table 5A: OLS Estimates of the Impact of the Stand Your Ground Law on Justifiable Homicides Using Supplemental Homicide Reports
Log(Homicide Rate) A. Full Sample Stand Your Ground 0.463*** 0.414 (0.152) (0.255) R2 0.726 0.804 B. Whites Stand Your Ground 0.413*** 0.474** (0.129) (0.214) R2 0.798 0.839 C. Blacks Stand Your Ground 0.509*** 0.165 (0.187) (0.359) R2 0.727 0.793 D. White Males Stand Your Ground 0.414*** 0.469** (0.129) (0.217) R2 0.793 0.833 E. Black Males Stand Your Ground 0.495*** 0.158 (0.180) (0.360) R2 0.721 0.787 Time-Varying State Characteristics Yes Yes State Fixed Effects Yes Yes Year Fixed Effects Yes Yes State-Specific Linear Time Trends No Yes Notes: Each cell presents the coefficient on the indicator for Stand Your Ground Law. Standard errors that are clustered by state are in parentheses. All regressions are weighted by state population of the relevant demographic group. *, **, and *** indicate that the Stand Your Ground coefficient is statistically significant at the 0.10, 0.05 and 0.01 levels, respectively.
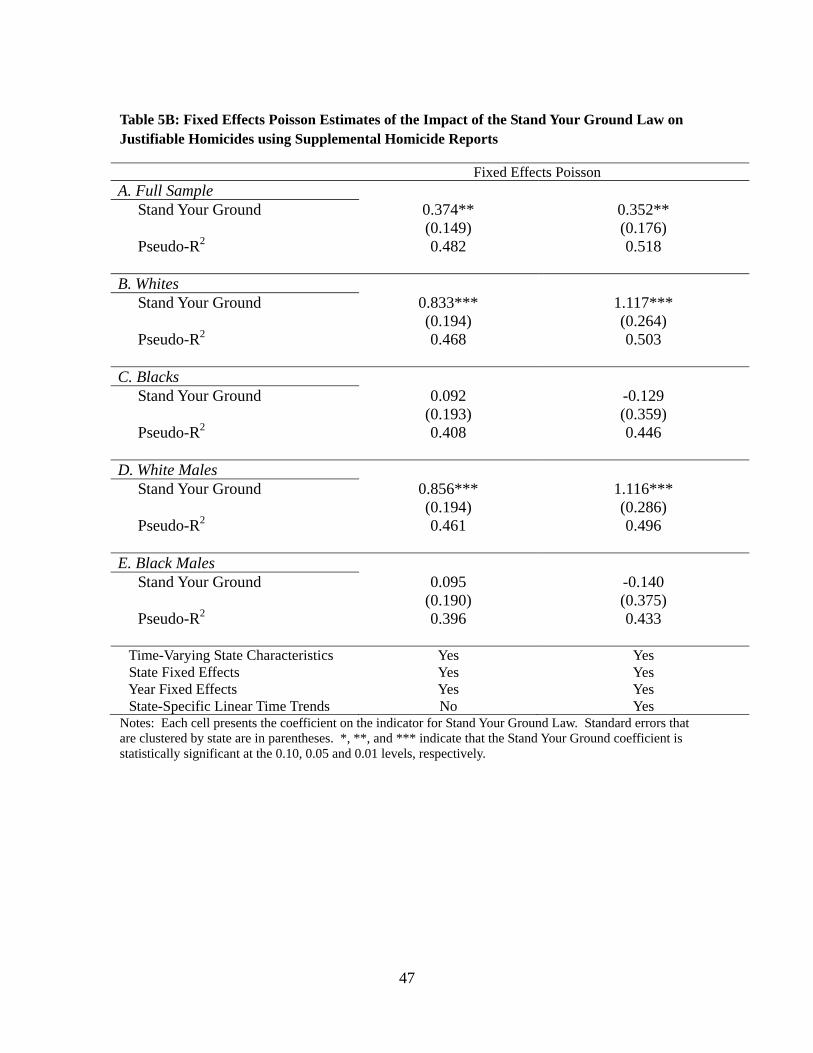
47
Table 5B: Fixed Effects Poisson Estimates of the Impact of the Stand Your Ground Law on Justifiable Homicides using Supplemental Homicide Reports
Fixed Effects Poisson A. Full Sample Stand Your Ground 0.374** 0.352** (0.149) (0.176) Pseudo-R2 0.482 0.518 B. Whites Stand Your Ground 0.833*** 1.117*** (0.194) (0.264) Pseudo-R2 0.468 0.503 C. Blacks Stand Your Ground 0.092 -0.129 (0.193) (0.359) Pseudo-R2 0.408 0.446 D. White Males Stand Your Ground 0.856*** 1.116*** (0.194) (0.286) Pseudo-R2 0.461 0.496 E. Black Males Stand Your Ground 0.095 -0.140 (0.190) (0.375) Pseudo-R2 0.396 0.433 Time-Varying State Characteristics Yes Yes State Fixed Effects Yes Yes Year Fixed Effects Yes Yes State-Specific Linear Time Trends No Yes Notes: Each cell presents the coefficient on the indicator for Stand Your Ground Law. Standard errors that are clustered by state are in parentheses. *, **, and *** indicate that the Stand Your Ground coefficient is statistically significant at the 0.10, 0.05 and 0.01 levels, respectively.

48
Table 6A: OLS Estimates of the Impact of the Stand Your Ground Law on Non-Justifiable Homicides Using Supplemental Homicide Reports
Log(Homicide Rate) A. Full Sample Stand Your Ground 0.126** 0.100 (0.054) (0.078) R2 0.919 0.940 B. Whites Stand Your Ground 0.136** 0.180 (0.056) (0.112) R2 0.919 0.938 C. Blacks Stand Your Ground 0.092 0.079 (0.065) (0.091) R2 0.841 0.880 D. White Males Stand Your Ground 0.189*** 0.233* (0.066) (0.117) R2 0.913 0.937 E. White Females Stand Your Ground 0.051 0.097 (0.057) (0.133) R2 0.842 0.867 F. Black Males Stand Your Ground 0.109 0.087 (0.066) (0.095) R2 0.841 0.879 G. Black Females Stand Your Ground -0.059 -0.006 (0.072) (0.115) R2 0.712 0.768 Time-Varying State Characteristics Yes Yes State Fixed Effects Yes Yes Year Fixed Effects Yes Yes State-Specific Linear Time Trends No Yes Notes: Each cell presents the coefficient on the indicator for Stand Your Ground Law. Standard errors that are clustered by state are in parentheses. *, **, and *** indicate that the Stand Your Ground coefficient is statistically significant at the 0.10, 0.05 and 0.01 levels, respectively.
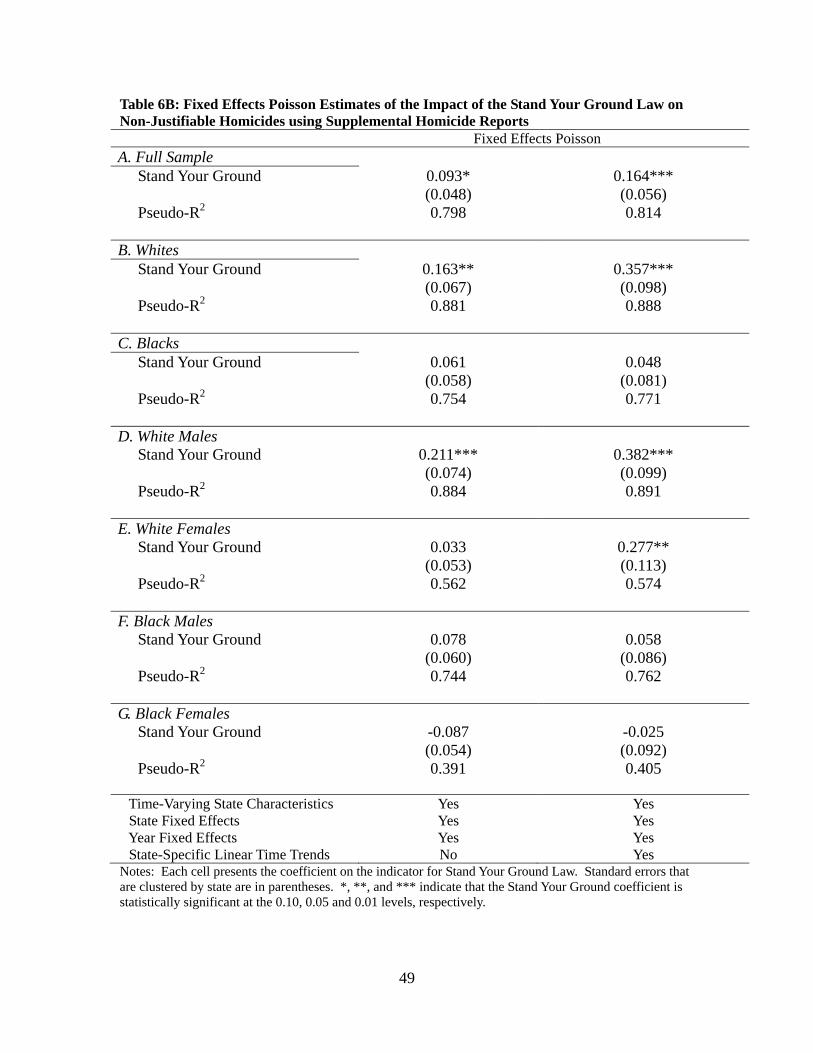
49
Table 6B: Fixed Effects Poisson Estimates of the Impact of the Stand Your Ground Law on Non-Justifiable Homicides using Supplemental Homicide Reports
Fixed Effects Poisson A. Full Sample Stand Your Ground 0.093* 0.164*** (0.048) (0.056) Pseudo-R2 0.798 0.814 B. Whites Stand Your Ground 0.163** 0.357*** (0.067) (0.098) Pseudo-R2 0.881 0.888 C. Blacks Stand Your Ground 0.061 0.048 (0.058) (0.081) Pseudo-R2 0.754 0.771 D. White Males Stand Your Ground 0.211*** 0.382*** (0.074) (0.099) Pseudo-R2 0.884 0.891 E. White Females Stand Your Ground 0.033 0.277** (0.053) (0.113) Pseudo-R2 0.562 0.574 F. Black Males Stand Your Ground 0.078 0.058 (0.060) (0.086) Pseudo-R2 0.744 0.762 G. Black Females Stand Your Ground -0.087 -0.025 (0.054) (0.092) Pseudo-R2 0.391 0.405 Time-Varying State Characteristics Yes Yes State Fixed Effects Yes Yes Year Fixed Effects Yes Yes State-Specific Linear Time Trends No Yes Notes: Each cell presents the coefficient on the indicator for Stand Your Ground Law. Standard errors that are clustered by state are in parentheses. *, **, and *** indicate that the Stand Your Ground coefficient is statistically significant at the 0.10, 0.05 and 0.01 levels, respectively.
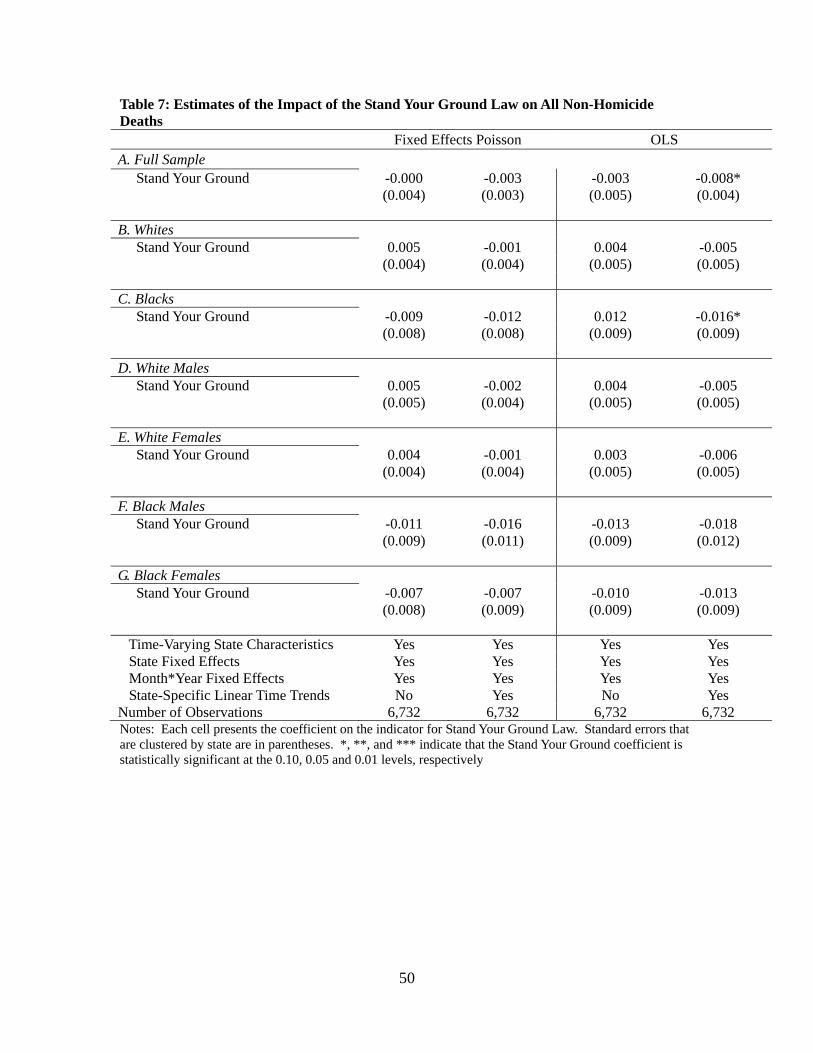
50
Table 7: Estimates of the Impact of the Stand Your Ground Law on All Non-Homicide Deaths Fixed Effects Poisson OLS A. Full Sample Stand Your Ground -0.000 -0.003 -0.003 -0.008* (0.004) (0.003) (0.005) (0.004) B. Whites Stand Your Ground 0.005 -0.001 0.004 -0.005 (0.004) (0.004) (0.005) (0.005) C. Blacks Stand Your Ground -0.009 -0.012 0.012 -0.016* (0.008) (0.008) (0.009) (0.009) D. White Males Stand Your Ground 0.005 -0.002 0.004 -0.005 (0.005) (0.004) (0.005) (0.005) E. White Females Stand Your Ground 0.004 -0.001 0.003 -0.006 (0.004) (0.004) (0.005) (0.005) F. Black Males Stand Your Ground -0.011 -0.016 -0.013 -0.018 (0.009) (0.011) (0.009) (0.012) G. Black Females Stand Your Ground -0.007 -0.007 -0.010 -0.013 (0.008) (0.009) (0.009) (0.009) Time-Varying State Characteristics Yes Yes Yes Yes State Fixed Effects Yes Yes Yes Yes Month*Year Fixed Effects Yes Yes Yes Yes State-Specific Linear Time Trends No Yes No Yes Number of Observations 6,732 6,732 6,732 6,732 Notes: Each cell presents the coefficient on the indicator for Stand Your Ground Law. Standard errors that are clustered by state are in parentheses. *, **, and *** indicate that the Stand Your Ground coefficient is statistically significant at the 0.10, 0.05 and 0.01 levels, respectively
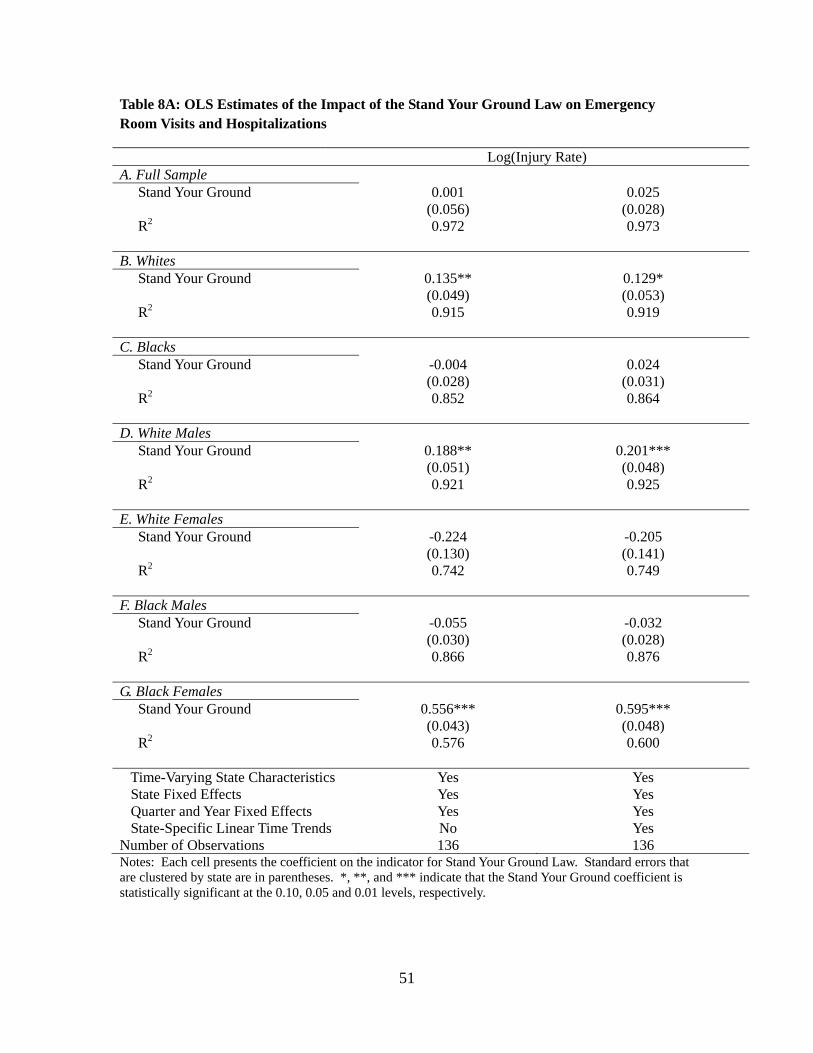
51
Table 8A: OLS Estimates of the Impact of the Stand Your Ground Law on Emergency Room Visits and Hospitalizations
Log(Injury Rate) A. Full Sample Stand Your Ground 0.001 0.025 (0.056) (0.028) R2 0.972 0.973 B. Whites Stand Your Ground 0.135** 0.129* (0.049) (0.053) R2 0.915 0.919 C. Blacks Stand Your Ground -0.004 0.024 (0.028) (0.031) R2 0.852 0.864 D. White Males Stand Your Ground 0.188** 0.201*** (0.051) (0.048) R2 0.921 0.925 E. White Females Stand Your Ground -0.224 -0.205 (0.130) (0.141) R2 0.742 0.749 F. Black Males Stand Your Ground -0.055 -0.032 (0.030) (0.028) R2 0.866 0.876 G. Black Females Stand Your Ground 0.556*** 0.595*** (0.043) (0.048) R2 0.576 0.600 Time-Varying State Characteristics Yes Yes State Fixed Effects Yes Yes Quarter and Year Fixed Effects Yes Yes State-Specific Linear Time Trends No Yes Number of Observations 136 136 Notes: Each cell presents the coefficient on the indicator for Stand Your Ground Law. Standard errors that are clustered by state are in parentheses. *, **, and *** indicate that the Stand Your Ground coefficient is statistically significant at the 0.10, 0.05 and 0.01 levels, respectively.
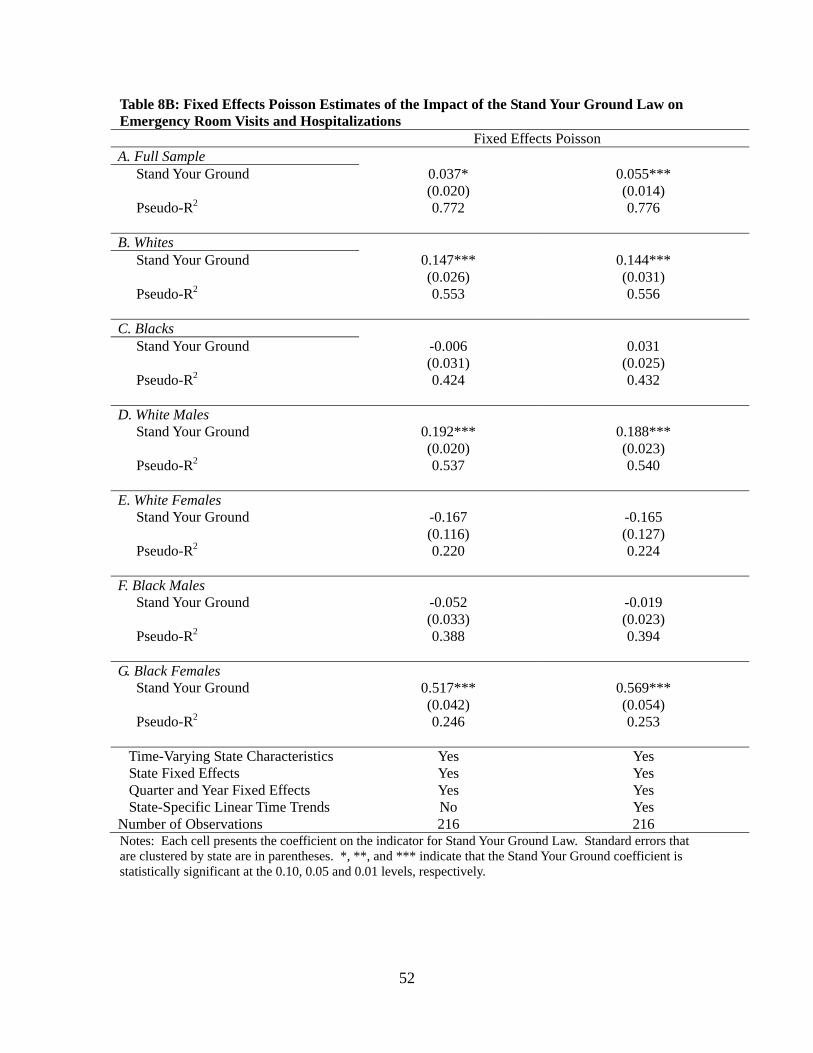
52
Table 8B: Fixed Effects Poisson Estimates of the Impact of the Stand Your Ground Law on Emergency Room Visits and Hospitalizations
Fixed Effects Poisson A. Full Sample Stand Your Ground 0.037* 0.055*** (0.020) (0.014) Pseudo-R2 0.772 0.776 B. Whites Stand Your Ground 0.147*** 0.144*** (0.026) (0.031) Pseudo-R2 0.553 0.556 C. Blacks Stand Your Ground -0.006 0.031 (0.031) (0.025) Pseudo-R2 0.424 0.432 D. White Males Stand Your Ground 0.192*** 0.188*** (0.020) (0.023) Pseudo-R2 0.537 0.540 E. White Females Stand Your Ground -0.167 -0.165 (0.116) (0.127) Pseudo-R2 0.220 0.224 F. Black Males Stand Your Ground -0.052 -0.019 (0.033) (0.023) Pseudo-R2 0.388 0.394 G. Black Females Stand Your Ground 0.517*** 0.569*** (0.042) (0.054) Pseudo-R2 0.246 0.253 Time-Varying State Characteristics Yes Yes State Fixed Effects Yes Yes Quarter and Year Fixed Effects Yes Yes State-Specific Linear Time Trends No Yes Number of Observations 216 216 Notes: Each cell presents the coefficient on the indicator for Stand Your Ground Law. Standard errors that are clustered by state are in parentheses. *, **, and *** indicate that the Stand Your Ground coefficient is statistically significant at the 0.10, 0.05 and 0.01 levels, respectively.
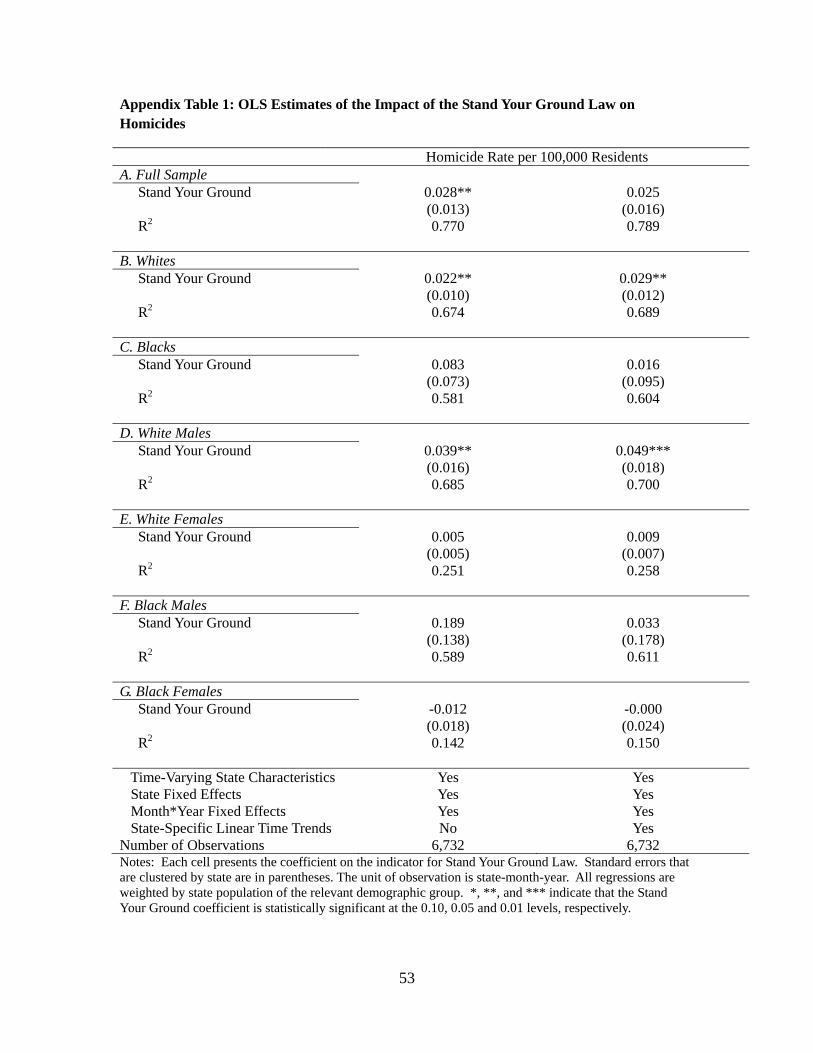
53
Appendix Table 1: OLS Estimates of the Impact of the Stand Your Ground Law on Homicides
Homicide Rate per 100,000 Residents A. Full Sample Stand Your Ground 0.028** 0.025 (0.013) (0.016) R2 0.770 0.789 B. Whites Stand Your Ground 0.022** 0.029** (0.010) (0.012) R2 0.674 0.689 C. Blacks Stand Your Ground 0.083 0.016 (0.073) (0.095) R2 0.581 0.604 D. White Males Stand Your Ground 0.039** 0.049*** (0.016) (0.018) R2 0.685 0.700 E. White Females Stand Your Ground 0.005 0.009 (0.005) (0.007) R2 0.251 0.258 F. Black Males Stand Your Ground 0.189 0.033 (0.138) (0.178) R2 0.589 0.611 G. Black Females Stand Your Ground -0.012 -0.000 (0.018) (0.024) R2 0.142 0.150 Time-Varying State Characteristics Yes Yes State Fixed Effects Yes Yes Month*Year Fixed Effects Yes Yes State-Specific Linear Time Trends No Yes Number of Observations 6,732 6,732 Notes: Each cell presents the coefficient on the indicator for Stand Your Ground Law. Standard errors that are clustered by state are in parentheses. The unit of observation is state-month-year. All regressions are weighted by state population of the relevant demographic group. *, **, and *** indicate that the Stand Your Ground coefficient is statistically significant at the 0.10, 0.05 and 0.01 levels, respectively.
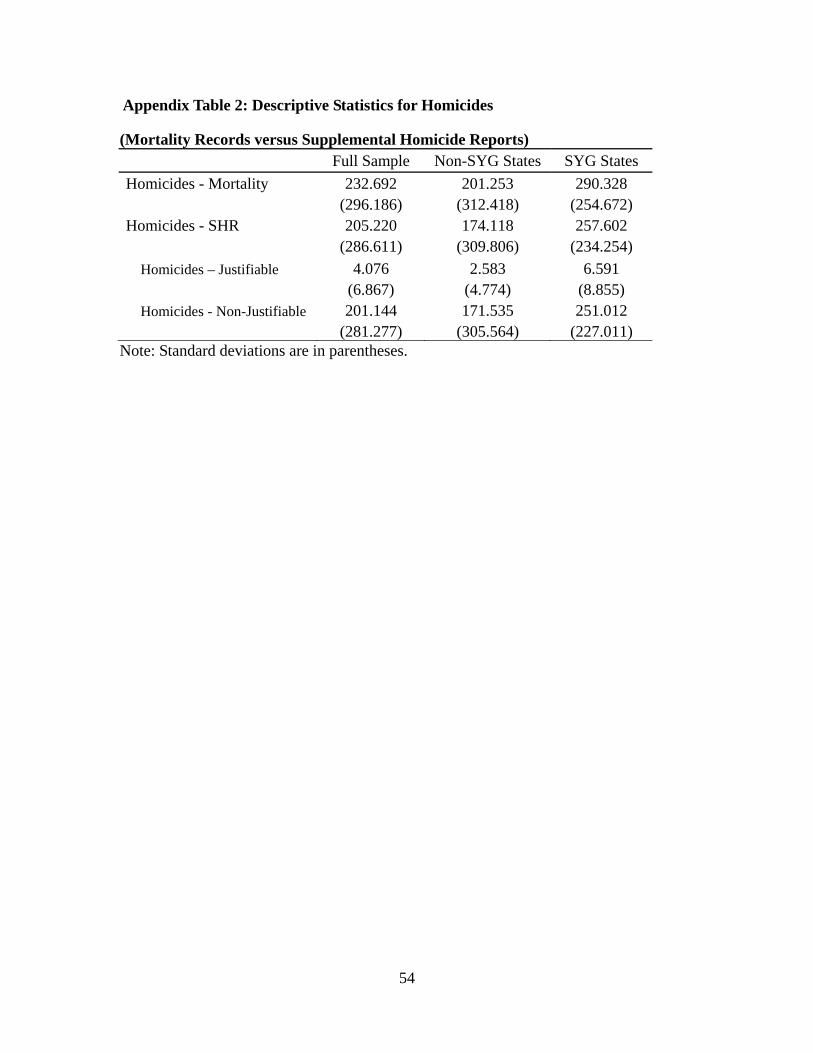
54
Appendix Table 2: Descriptive Statistics for Homicides
(Mortality Records versus Supplemental Homicide Reports) Full Sample Non-SYG States SYG States Homicides - Mortality 232.692 201.253 290.328
(296.186) (312.418) (254.672) Homicides - SHR 205.220 174.118 257.602
(286.611) (309.806) (234.254) Homicides – Justifiable 4.076 2.583 6.591
(6.867) (4.774) (8.855) Homicides - Non-Justifiable 201.144 171.535 251.012
(281.277) (305.564) (227.011) Note: Standard deviations are in parentheses.
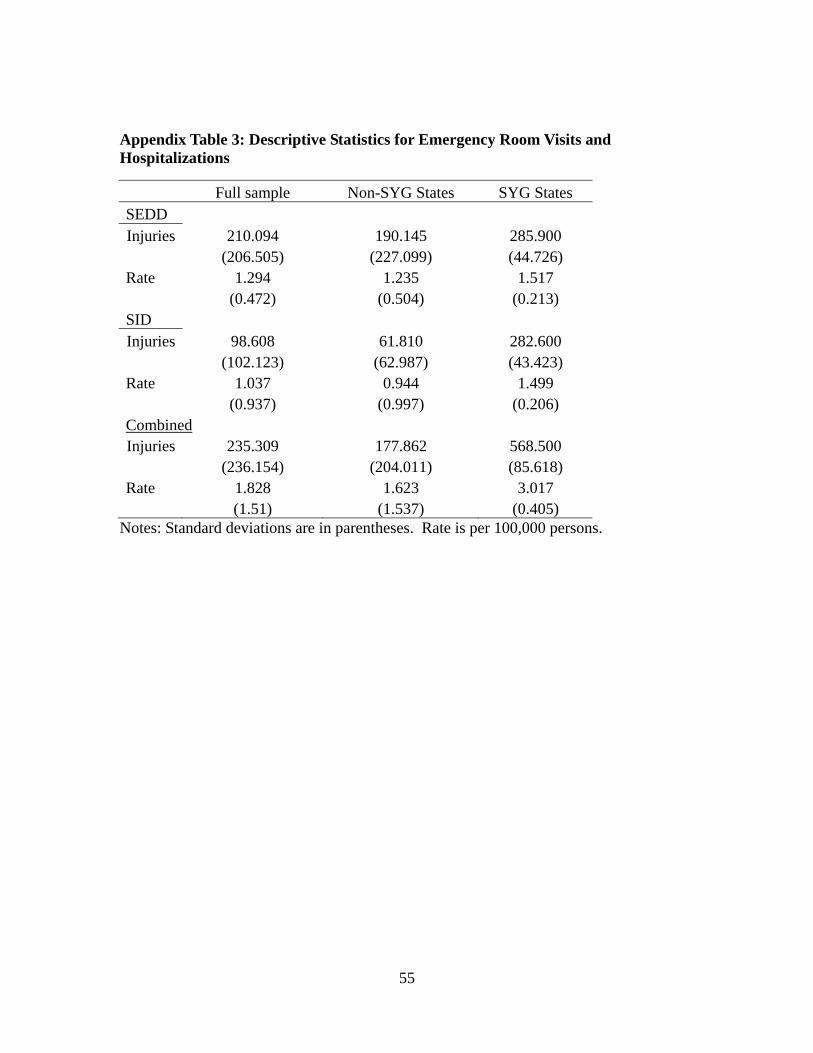
55
Appendix Table 3: Descriptive Statistics for Emergency Room Visits and Hospitalizations
Full sample Non-SYG States SYG States SEDD Injuries 210.094 190.145 285.900
(206.505) (227.099) (44.726) Rate 1.294 1.235 1.517
(0.472) (0.504) (0.213) SID Injuries 98.608 61.810 282.600
(102.123) (62.987) (43.423) Rate 1.037 0.944 1.499
(0.937) (0.997) (0.206) Combined Injuries 235.309 177.862 568.500
(236.154) (204.011) (85.618) Rate 1.828 1.623 3.017 (1.51) (1.537) (0.405)
Notes: Standard deviations are in parentheses. Rate is per 100,000 persons.